UNITED STATES
SECURITIES AND EXCHANGE COMMISSION
Washington, D.C. 20549
FORM N-CSR
CERTIFIED SHAREHOLDER REPORT OF
REGISTERED MANAGEMENT INVESTMENT COMPANIES
Investment Company Act file number 811-04096
MFS MUNICIPAL SERIES TRUST
(Exact name of registrant as specified in charter)
111 Huntington Avenue, Boston, Massachusetts 02199
(Address of principal executive offices) (Zip code)
Christopher R. Bohane
Massachusetts Financial Services Company
111 Huntington Avenue, Boston, Massachusetts 02199
(Name and address of agents for service)
Registrant’s telephone number, including area code: (617) 954-5000
Date of fiscal year end: March 31
Date of reporting period: March 31, 2021*
| * | This Form N-CSR pertains to the following series of the Registrant: MFS Alabama Municipal Bond Fund, MFS Arkansas Municipal Bond Fund, MFS California Municipal Bond Fund, MFS Georgia Municipal Bond Fund, MFS Maryland Municipal Bond Fund, MFS Massachusetts Municipal Bond Fund, MFS Mississippi Municipal Bond Fund, MFS Municipal Income Fund, MFS New York Municipal Bond Fund, MFS North Carolina Municipal Bond Fund, MFS Pennsylvania Municipal Bond Fund, MFS South Carolina Municipal Bond Fund, MFS Tennessee Municipal Bond Fund, MFS Virginia Municipal Bond Fund, and MFS West Virginia Municipal Bond Fund. MFS Municipal Intermediate Fund, a series of the Registrant with a fiscal year end of March 31, had not commenced operations as of the reporting period end. |
| ITEM 1. | REPORTS TO STOCKHOLDERS. |
1(a):


| 1 | |
| 2 | |
| 8 | |
| 10 | |
| 17 | |
| 20 | |
| 71 | |
| 75 | |
| 77 | |
| 79 | |
| 97 | |
| 109 | |
| 110 | |
| 113 | |
| 113 | |
| 113 | |
| 113 | |
| 113 | |
| 114 |
| back cover |


| Universities - Colleges | 21.6% |
| General Obligations - General Purpose | 17.4% |
| Sales & Excise Tax Revenue | 12.5% |
| Water & Sewer Utility Revenue | 11.5% |
| Healthcare Revenue - Hospitals | 8.8% |
| AAA | 3.6% |
| AA | 45.0% |
| A | 31.5% |
| BBB | 8.0% |
| BB | 1.3% |
| CC | 0.2% |
| C | 1.8% |
| D | 1.5% |
| Not Rated | 5.7% |
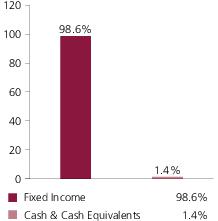
| Cash & Cash Equivalents | 1.4% |
| Average Duration (d) | 6.4 |
| Average Effective Maturity (m) | 14.1 yrs. |
| Alabama | 82.6% |
| Puerto Rico | 6.1% |
| New York | 1.4% |
| California | 1.3% |
| Maryland | 1.2% |
| Illinois | 1.1% |
| South Carolina | 0.7% |
| Guam | 0.6% |
| New Jersey | 0.6% |
| Tennessee | 0.5% |
| Pennsylvania | 0.5% |
| Colorado | 0.4% |
| Virginia | 0.4% |
| Connecticut | 0.3% |
| Ohio | 0.2% |
| Texas | 0.2% |
| Iowa | 0.1% |
| Wisconsin | 0.1% |
| Michigan | 0.1% |
| Indiana | 0.1% |
| Minnesota | 0.1% |
| (a) | For all securities other than those specifically described below, ratings are assigned to underlying securities utilizing ratings from Moody’s, Fitch, and Standard & Poor’s rating agencies and applying the following hierarchy: If all three agencies provide a rating, the middle rating (after dropping the highest and lowest ratings) is assigned; if two of the three agencies rate a security, the lower of the two is assigned. If none of the 3 rating agencies above assign a rating, but the security is rated by DBRS Morningstar, then the DBRS Morningstar rating is assigned. Ratings are shown in the S&P and Fitch scale (e.g., AAA). Securities rated BBB or higher are considered investment grade. All ratings are subject to change. Not Rated includes fixed income securities and fixed income derivatives that have not been rated by any rating agency. The fund may or may not have held all of these instruments on this date. The fund is not rated by these agencies. |
| (d) | Duration is a measure of how much a bond’s price is likely to fluctuate with general changes in interest rates, e.g., if rates rise 1.00%, a bond with a 5-year duration is likely to lose about 5.00% of its value due to the interest rate move. |
| (i) | For purposes of this presentation, the components include the value of securities, and reflect the impact of the equivalent exposure of derivative positions, if any. These amounts may be negative from time to time. Equivalent exposure is a calculated amount that translates the derivative position into a reasonable approximation of the amount of the underlying asset that the portfolio would have to hold at a given point in time to have the same price sensitivity that results from the portfolio’s ownership of the derivative contract. When dealing with derivatives, equivalent exposure is a more representative measure of the potential impact of a position on portfolio performance than value. The bond component will include any accrued interest amounts. |
| (m) | In determining each instrument’s effective maturity for purposes of calculating the fund’s dollar-weighted average effective maturity, MFS uses the instrument’s stated maturity or, if applicable, an earlier date on which MFS believes it is probable that a maturity-shortening device (such as a put, pre-refunding or prepayment) will cause the instrument to be repaid. Such an earlier date can be substantially shorter than the instrument’s stated maturity. |

| Sales & Excise Tax Revenue | 16.5% |
| Universities - Colleges | 16.1% |
| Water & Sewer Utility Revenue | 12.9% |
| Healthcare Revenue - Hospitals | 10.1% |
| State & Local Agencies | 6.8% |
| AAA | 3.0% |
| AA | 45.1% |
| A | 27.5% |
| BBB | 12.0% |
| BB | 1.4% |
| C | 1.9% |
| D | 1.7% |
| Not Rated | 6.8% |
| Cash & Cash Equivalents | 0.6% |
| Average Duration (d) | 5.9 |
| Average Effective Maturity (m) | 14.6 yrs. |
| Arkansas | 72.2% |
| Puerto Rico | 7.4% |
| New Jersey | 3.4% |
| Guam | 2.9% |
| California | 2.0% |
| New York | 1.5% |
| Illinois | 1.4% |
| Texas | 1.0% |
| Maryland | 0.9% |
| Ohio | 0.9% |
| Pennsylvania | 0.8% |
| Massachusetts | 0.8% |
| North Carolina | 0.7% |
| Colorado | 0.6% |
| Iowa | 0.5% |
| Michigan | 0.4% |
| Alabama | 0.4% |
| Connecticut | 0.4% |
| South Carolina | 0.3% |
| Tennessee | 0.3% |
| Wisconsin | 0.2% |
| Washington DC | 0.2% |
| Virginia | 0.1% |
| Indiana | 0.1% |
| (a) | For all securities other than those specifically described below, ratings are assigned to underlying securities utilizing ratings from Moody’s, Fitch, and Standard & Poor’s rating agencies and applying the following hierarchy: If all three agencies provide a rating, the middle rating (after dropping the highest and lowest ratings) is assigned; if two of the three agencies rate a security, the lower of the two is assigned. If none of the 3 rating agencies above assign a rating, but the security is rated by DBRS Morningstar, then the DBRS Morningstar rating is assigned. Ratings are shown in the S&P and Fitch scale (e.g., AAA). Securities rated BBB or higher are considered investment grade. All ratings are subject to change. Not Rated includes fixed income securities and fixed income derivatives that have not been rated by any rating agency. The fund may or may not have held all of these instruments on this date. The fund is not rated by these agencies. |
| (d) | Duration is a measure of how much a bond’s price is likely to fluctuate with general changes in interest rates, e.g., if rates rise 1.00%, a bond with a 5-year duration is likely to lose about 5.00% of its value due to the interest rate move. |
| (i) | For purposes of this presentation, the components include the value of securities, and reflect the impact of the equivalent exposure of derivative positions, if any. These amounts may be negative from time to time. Equivalent exposure is a calculated amount that translates the derivative position into a reasonable approximation of the amount of the underlying asset that the portfolio would have to hold at a given point in time to have the same price sensitivity that results from the portfolio’s ownership of the derivative contract. When dealing with derivatives, equivalent exposure is a more representative measure of the potential impact of a position on portfolio performance than value. The bond component will include any accrued interest amounts. |
| (m) | In determining each instrument’s effective maturity for purposes of calculating the fund’s dollar-weighted average effective maturity, MFS uses the instrument’s stated maturity or, if applicable, an earlier date on which MFS believes it is probable that a maturity-shortening device (such as a put, pre-refunding or prepayment) will cause the instrument to be repaid. Such an earlier date can be substantially shorter than the instrument’s stated maturity. |
| General Obligations - Schools | 17.8% |
| Healthcare Revenue - Hospitals | 12.2% |
| Airports | 7.9% |
| Universities - Colleges | 6.2% |
| Tax Assessment | 5.8% |
| AAA | 2.6% |
| AA | 32.8% |
| A | 29.1% |
| BBB | 18.2% |
| BB | 3.2% |
| CC | 0.1% |
| C | 1.5% |
| D | 1.8% |
| Not Rated | 12.7% |
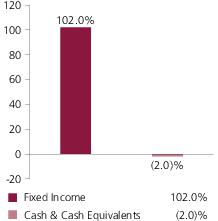
| Cash & Cash Equivalents | (2.0)% |
| Average Duration (d) | 7.4 |
| Average Effective Maturity (m) | 17.3 yrs. |
| California | 91.3% |
| Puerto Rico | 5.9% |
| Illinois | 0.9% |
| New York | 0.6% |
| Guam | 0.4% |
| Tennessee | 0.4% |
| Maryland | 0.4% |
| Pennsylvania | 0.4% |
| Texas | 0.4% |
| New Jersey | 0.3% |
| Alabama | 0.3% |
| Ohio | 0.2% |
| Wisconsin | 0.2% |
| Virginia | 0.2% |
| Minnesota | 0.1% |
| (a) | For all securities other than those specifically described below, ratings are assigned to underlying securities utilizing ratings from Moody’s, Fitch, and Standard & Poor’s rating agencies and applying the following hierarchy: If all three agencies provide a rating, the middle rating (after dropping the highest and lowest ratings) is assigned; if two of the three agencies rate a security, the lower of the two is assigned. If none of the 3 rating agencies above assign a rating, but the security is rated by DBRS Morningstar, then the DBRS Morningstar rating is assigned. Ratings are shown in the S&P and Fitch scale (e.g., AAA). Securities rated BBB or higher are considered investment grade. All ratings are subject to change. Not Rated includes fixed income securities and fixed income derivatives that have not been rated by any rating agency. The fund may or may not have held all of these instruments on this date. The fund is not rated by these agencies. |
| (d) | Duration is a measure of how much a bond’s price is likely to fluctuate with general changes in interest rates, e.g., if rates rise 1.00%, a bond with a 5-year duration is likely to lose about 5.00% of its value due to the interest rate move. |
| (i) | For purposes of this presentation, the components include the value of securities, and reflect the impact of the equivalent exposure of derivative positions, if any. These amounts may be negative from time to time. Equivalent exposure is a calculated amount that translates the derivative position into a reasonable approximation of the amount of the underlying asset that the portfolio would have to hold at a given point in time to have the same price sensitivity that results from the portfolio’s ownership of the derivative contract. When dealing with derivatives, equivalent exposure is a more representative measure of the potential impact of a position on portfolio performance than value. The bond component will include any accrued interest amounts. |
| (m) | In determining each instrument’s effective maturity for purposes of calculating the fund’s dollar-weighted average effective maturity, MFS uses the instrument’s stated maturity or, if applicable, an earlier date on which MFS believes it is probable that a maturity-shortening device (such as a put, pre-refunding or prepayment) will cause the instrument to be repaid. Such an earlier date can be substantially shorter than the instrument’s stated maturity. |

| Universities - Colleges | 17.5% |
| Healthcare Revenue - Hospitals | 13.1% |
| General Obligations - Schools | 13.0% |
| General Obligations - General Purpose | 9.7% |
| Water & Sewer Utility Revenue | 8.8% |
| AAA | 12.9% |
| AA | 36.8% |
| A | 30.9% |
| BBB | 7.3% |
| BB | 1.1% |
| CC | 0.2% |
| C | 1.2% |
| D | 1.5% |
| Not Rated | 6.4% |
| Cash & Cash Equivalents | 1.7% |
| Average Duration (d) | 6.4 |
| Average Effective Maturity (m) | 14.4 yrs. |
| Georgia | 80.3% |
| Puerto Rico | 5.4% |
| Illinois | 1.9% |
| California | 1.6% |
| Maryland | 1.2% |
| Pennsylvania | 0.9% |
| Virginia | 0.9% |
| New York | 0.7% |
| Guam | 0.7% |
| New Jersey | 0.7% |
| Connecticut | 0.6% |
| Iowa | 0.5% |
| South Carolina | 0.4% |
| Tennessee | 0.4% |
| Massachusetts | 0.4% |
| Texas | 0.3% |
| Ohio | 0.2% |
| Alabama | 0.2% |
| Washington DC | 0.2% |
| Wisconsin | 0.2% |
| Michigan | 0.2% |
| Louisiana | 0.1% |
| Minnesota | 0.1% |
| Indiana | 0.1% |
| Florida | 0.1% |
| Colorado (o) | 0.0% |
| (a) | For all securities other than those specifically described below, ratings are assigned to underlying securities utilizing ratings from Moody’s, Fitch, and Standard & Poor’s rating agencies and applying the following hierarchy: If all three agencies provide a rating, the middle rating (after dropping the highest and lowest ratings) is assigned; if two of the three agencies rate a security, the lower of the two is assigned. If none of the 3 rating agencies above assign a rating, but the security is rated by DBRS Morningstar, then the DBRS Morningstar rating is assigned. Ratings are shown in the S&P and Fitch scale (e.g., AAA). Securities rated BBB or higher are considered investment grade. All ratings are subject to change. Not Rated includes fixed income securities and fixed income derivatives that have not been rated by any rating agency. The fund may or may not have held all of these instruments on this date. The fund is not rated by these agencies. |
| (d) | Duration is a measure of how much a bond’s price is likely to fluctuate with general changes in interest rates, e.g., if rates rise 1.00%, a bond with a 5-year duration is likely to lose about 5.00% of its value due to the interest rate move. |
| (i) | For purposes of this presentation, the components include the value of securities, and reflect the impact of the equivalent exposure of derivative positions, if any. These amounts may be negative from time to time. Equivalent exposure is a calculated amount that translates the derivative position into a reasonable approximation of the amount of the underlying asset that the portfolio would have to hold at a given point in time to have the same price sensitivity that results from the portfolio’s ownership of the derivative contract. When dealing with derivatives, equivalent exposure is a more representative measure of the potential impact of a position on portfolio performance than value. The bond component will include any accrued interest amounts. |
| (m) | In determining each instrument’s effective maturity for purposes of calculating the fund’s dollar-weighted average effective maturity, MFS uses the instrument’s stated maturity or, if applicable, an earlier date on which MFS believes it is probable that a maturity-shortening device (such as a put, pre-refunding or prepayment) will cause the instrument to be repaid. Such an earlier date can be substantially shorter than the instrument’s stated maturity. |
| (o) | Less than 0.1%. |

| General Obligations - General Purpose | 24.8% |
| Healthcare Revenue - Hospitals | 17.2% |
| Universities - Colleges | 8.0% |
| Multi-Family Housing Revenue | 6.6% |
| State & Local Agencies | 5.8% |
| AAA | 24.4% |
| AA | 26.4% |
| A | 17.7% |
| BBB | 16.9% |
| BB | 1.4% |
| B | 0.4% |
| CC | 0.1% |
| C | 1.5% |
| D | 1.7% |
| Not Rated | 9.5% |
| Cash & Cash Equivalents (o) | (0.0)% |
| Average Duration (d) | 6.7 |
| Average Effective Maturity (m) | 13.8 yrs. |
| Maryland | 82.2% |
| Puerto Rico | 5.4% |
| Washington DC | 2.4% |
| California | 1.1% |
| Pennsylvania | 1.0% |
| Illinois | 1.0% |
| New York | 1.0% |
| Tennessee | 0.9% |
| Guam | 0.9% |
| South Carolina | 0.6% |
| New Jersey | 0.6% |
| Iowa | 0.5% |
| Colorado | 0.5% |
| Connecticut | 0.4% |
| Alabama | 0.3% |
| Ohio | 0.3% |
| Wisconsin | 0.2% |
| Virginia | 0.2% |
| Indiana | 0.2% |
| U.S. Virgin Islands | 0.1% |
| Michigan | 0.1% |
| Mississippi | 0.1% |
| (a) | For all securities other than those specifically described below, ratings are assigned to underlying securities utilizing ratings from Moody’s, Fitch, and Standard & Poor’s rating agencies and applying the following hierarchy: If all three agencies provide a rating, the middle rating (after dropping the highest and lowest ratings) is assigned; if two of the three agencies rate a security, the lower of the two is assigned. If none of the 3 rating agencies above assign a rating, but the security is rated by DBRS Morningstar, then the DBRS Morningstar rating is assigned. Ratings are shown in the S&P and Fitch scale (e.g., AAA). Securities rated BBB or higher are considered investment grade. All ratings are subject to change. Not Rated includes fixed income securities and fixed income derivatives that have not been rated by any rating agency. The fund may or may not have held all of these instruments on this date. The fund is not rated by these agencies. |
| (d) | Duration is a measure of how much a bond’s price is likely to fluctuate with general changes in interest rates, e.g., if rates rise 1.00%, a bond with a 5-year duration is likely to lose about 5.00% of its value due to the interest rate move. |
| (i) | For purposes of this presentation, the components include the value of securities, and reflect the impact of the equivalent exposure of derivative positions, if any. These amounts may be negative from time to time. Equivalent exposure is a calculated amount that translates the derivative position into a reasonable approximation of the amount of the underlying asset that the portfolio would have to hold at a given point in time to have the same price sensitivity that results from the portfolio’s ownership of the derivative contract. When dealing with derivatives, equivalent exposure is a more representative measure of the potential impact of a position on portfolio performance than value. The bond component will include any accrued interest amounts. |
| (m) | In determining each instrument’s effective maturity for purposes of calculating the fund’s dollar-weighted average effective maturity, MFS uses the instrument’s stated maturity or, if applicable, an earlier date on which MFS believes it is probable that a maturity-shortening device (such as a put, pre-refunding or prepayment) will cause the instrument to be repaid. Such an earlier date can be substantially shorter than the instrument’s stated maturity. |
| (o) | Less than 0.1%. |
| Universities - Colleges | 20.5% |
| Healthcare Revenue - Hospitals | 13.0% |
| General Obligations - General Purpose | 12.3% |
| Sales & Excise Tax Revenue | 6.7% |
| Water & Sewer Utility Revenue | 6.5% |
| AAA | 5.2% |
| AA | 48.0% |
| A | 16.5% |
| BBB | 17.8% |
| BB | 2.2% |
| CC | 0.2% |
| C | 1.6% |
| D | 1.7% |
| Not Rated | 6.4% |
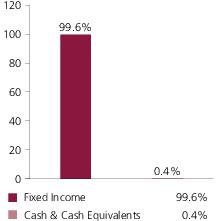
| Cash & Cash Equivalents | 0.4% |
| Average Duration (d) | 6.3 |
| Average Effective Maturity (m) | 14.6 yrs. |
| Massachusetts | 83.9% |
| Puerto Rico | 5.7% |
| Illinois | 2.0% |
| Maryland | 1.2% |
| New York | 0.9% |
| Pennsylvania | 0.8% |
| New Jersey | 0.8% |
| California | 0.8% |
| Tennessee | 0.6% |
| Guam | 0.5% |
| Colorado | 0.4% |
| Connecticut | 0.3% |
| Alabama | 0.3% |
| Texas | 0.3% |
| Ohio | 0.3% |
| Wisconsin | 0.2% |
| Louisiana | 0.2% |
| Florida | 0.1% |
| Virginia | 0.1% |
| Washington DC | 0.1% |
| Minnesota | 0.1% |
| (a) | For all securities other than those specifically described below, ratings are assigned to underlying securities utilizing ratings from Moody’s, Fitch, and Standard & Poor’s rating agencies and applying the following hierarchy: If all three agencies provide a rating, the middle rating (after dropping the highest and lowest ratings) is assigned; if two of the three agencies rate a security, the lower of the two is assigned. If none of the 3 rating agencies above assign a rating, but the security is rated by DBRS Morningstar, then the DBRS Morningstar rating is assigned. Ratings are shown in the S&P and Fitch scale (e.g., AAA). Securities rated BBB or higher are considered investment grade. All ratings are subject to change. Not Rated includes fixed income securities and fixed income derivatives that have not been rated by any rating agency. The fund may or may not have held all of these instruments on this date. The fund is not rated by these agencies. |
| (d) | Duration is a measure of how much a bond’s price is likely to fluctuate with general changes in interest rates, e.g., if rates rise 1.00%, a bond with a 5-year duration is likely to lose about 5.00% of its value due to the interest rate move. |
| (i) | For purposes of this presentation, the components include the value of securities, and reflect the impact of the equivalent exposure of derivative positions, if any. These amounts may be negative from time to time. Equivalent exposure is a calculated amount that translates the derivative position into a reasonable approximation of the amount of the underlying asset that the portfolio would have to hold at a given point in time to have the same price sensitivity that results from the portfolio’s ownership of the derivative contract. When dealing with derivatives, equivalent exposure is a more representative measure of the potential impact of a position on portfolio performance than value. The bond component will include any accrued interest amounts. |
| (m) | In determining each instrument’s effective maturity for purposes of calculating the fund’s dollar-weighted average effective maturity, MFS uses the instrument’s stated maturity or, if applicable, an earlier date on which MFS believes it is probable that a maturity-shortening device (such as a put, pre-refunding or prepayment) will cause the instrument to be repaid. Such an earlier date can be substantially shorter than the instrument’s stated maturity. |
| (d) | Duration is a measure of how much a bond’s price is likely to fluctuate with general changes in interest rates, e.g., if rates rise 1.00%, a bond with a 5-year duration is likely to lose about 5.00% of its value due to the interest rate move. |
| (r) | Bonds rated “BBB”, “Baa”, or higher are considered investment grade; bonds rated “BB”, “Ba”, or below are considered non-investment grade. The source for bond quality ratings is Moody's Investors Service, Standard & Poor's, and Fitch, Inc. and are applied using the following hierarchy: If all three agencies provide a rating, the middle rating (after dropping the highest and lowest ratings) is assigned; if two of the three agencies rate a security, the lower of the two is assigned. If none of the 3 Rating Agencies above assign a rating, but the security is rated by DBRS Morningstar, then the DBRS Morningstar rating is assigned. Ratings are shown in the S&P and Fitch scale (e.g., AAA). For securities that are not rated by any of the rating agencies, the security is considered Not Rated. |
| (y) | A yield curve graphically depicts the yields of different maturity bonds of the same credit quality and type; a normal yield curve is upward sloping, with short-term rates lower than long-term rates. |
| Share Class | Class Inception Date | 1-yr | 5-yr | 10-yr | Life (t) |
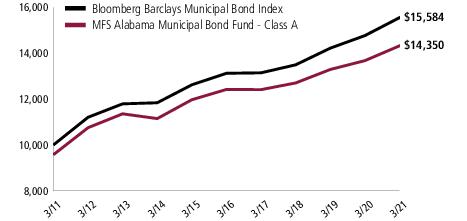
| A | 2/01/90 | 4.91% | 2.93% | 4.13% | N/A |
| B | 9/07/93 | 4.24% | 2.18% | 3.36% | N/A |
| I | 4/01/16 | 5.21% | 3.17% | N/A | 3.17% |
| R6 | 8/01/17 | 5.28% | N/A | N/A | 3.71% |
| Bloomberg Barclays Municipal Bond Index (f) | 5.51% | 3.49% | 4.54% | N/A |
| A With Initial Sales Charge (4.25%) | 0.46% | 2.04% | 3.68% | N/A |
| B With CDSC (Declining over six years from 4% to 0%) (v) | 0.24% | 1.82% | 3.36% | N/A |
| (f) | Source: FactSet Research Systems Inc. |
| (t) | For the period from the class inception date through the stated period end (for those share classes with less than 10 years of performance history). No comparative benchmark performance information is provided for “life” periods. (See Notes to Performance Summary.) |
| (v) | Assuming redemption at the end of the applicable period. |
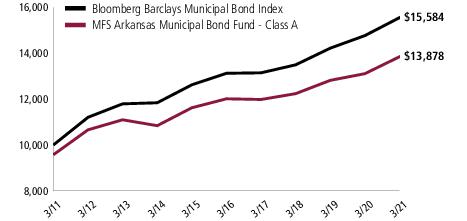
| Share Class | Class Inception Date | 1-yr | 5-yr | 10-yr | Life (t) |
| A | 2/03/92 | 5.85% | 2.93% | 3.78% | N/A |
| B | 9/07/93 | 5.07% | 2.16% | 3.00% | N/A |
| I | 4/01/16 | 5.88% | 3.01% | N/A | 3.01% |
| R6 | 8/01/17 | 5.95% | N/A | N/A | 3.61% |
| Bloomberg Barclays Municipal Bond Index (f) | 5.51% | 3.49% | 4.54% | N/A |
| A With Initial Sales Charge (4.25%) | 1.36% | 2.04% | 3.33% | N/A |
| B With CDSC (Declining over six years from 4% to 0%) (v) | 1.07% | 1.79% | 3.00% | N/A |
| (f) | Source: FactSet Research Systems Inc. |
| (t) | For the period from the class inception date through the stated period end (for those share classes with less than 10 years of performance history). No comparative benchmark performance information is provided for “life” periods. (See Notes to Performance Summary.) |
| (v) | Assuming redemption at the end of the applicable period. |
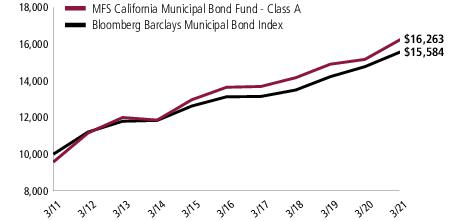
| Share Class | Class Inception Date | 1-yr | 5-yr | 10-yr | Life (t) |
| A | 6/18/85 | 7.24% | 3.57% | 5.44% | N/A |
| B | 9/07/93 | 6.45% | 2.80% | 4.64% | N/A |
| C | 1/03/94 | 6.27% | 2.65% | 4.48% | N/A |
| I | 4/01/16 | 7.46% | 3.64% | N/A | 3.64% |
| R6 | 8/01/17 | 7.54% | N/A | N/A | 4.19% |
| Bloomberg Barclays Municipal Bond Index (f) | 5.51% | 3.49% | 4.54% | N/A |
| A With Initial Sales Charge (4.25%) | 2.69% | 2.68% | 4.98% | N/A |
| B With CDSC (Declining over six years from 4% to 0%) (v) | 2.45% | 2.44% | 4.64% | N/A |
| C With CDSC (1% for 12 months) (v) | 5.27% | 2.65% | 4.48% | N/A |
| (f) | Source: FactSet Research Systems Inc. |
| (t) | For the period from the class inception date through the stated period end (for those share classes with less than 10 years of performance history). No comparative benchmark performance information is provided for “life” periods. (See Notes to Performance Summary.) |
| (v) | Assuming redemption at the end of the applicable period. |
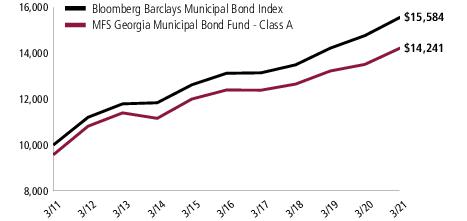
| Share Class | Class Inception Date | 1-yr | 5-yr | 10-yr | Life (t) |
| A | 6/06/88 | 5.38% | 2.81% | 4.05% | N/A |
| B | 9/07/93 | 4.61% | 2.06% | 3.27% | N/A |
| I | 4/01/16 | 5.68% | 3.05% | N/A | 3.05% |
| R6 | 8/01/17 | 5.72% | N/A | N/A | 3.49% |
| Bloomberg Barclays Municipal Bond Index (f) | 5.51% | 3.49% | 4.54% | N/A |
| A With Initial Sales Charge (4.25%) | 0.90% | 1.92% | 3.60% | N/A |
| B With CDSC (Declining over six years from 4% to 0%) (v) | 0.61% | 1.69% | 3.27% | N/A |
| (f) | Source: FactSet Research Systems Inc. |
| (t) | For the period from the class inception date through the stated period end (for those share classes with less than 10 years of performance history). No comparative benchmark performance information is provided for “life” periods. (See Notes to Performance Summary.) |
| (v) | Assuming redemption at the end of the applicable period. |

| Share Class | Class Inception Date | 1-yr | 5-yr | 10-yr | Life (t) |
| A | 10/31/84 | 6.51% | 3.05% | 3.99% | N/A |
| B | 9/07/93 | 5.71% | 2.30% | 3.21% | N/A |
| I | 4/01/16 | 6.78% | 3.31% | N/A | 3.31% |
| R6 | 8/01/17 | 6.84% | N/A | N/A | 3.74% |
| Bloomberg Barclays Municipal Bond Index (f) | 5.51% | 3.49% | 4.54% | N/A |
| A With Initial Sales Charge (4.25%) | 1.98% | 2.16% | 3.54% | N/A |
| B With CDSC (Declining over six years from 4% to 0%) (v) | 1.71% | 1.93% | 3.21% | N/A |
| (f) | Source: FactSet Research Systems Inc. |
| (t) | For the period from the class inception date through the stated period end (for those share classes with less than 10 years of performance history). No comparative benchmark performance information is provided for “life” periods. (See Notes to Performance Summary.) |
| (v) | Assuming redemption at the end of the applicable period. |

| Share Class | Class Inception Date | 1-yr | 5-yr | 10-yr | Life (t) |
| A | 4/09/85 | 6.16% | 2.99% | 4.28% | N/A |
| B | 9/07/93 | 5.36% | 2.21% | 3.48% | N/A |
| I | 4/01/16 | 6.41% | 3.24% | N/A | 3.24% |
| R6 | 8/01/17 | 6.48% | N/A | N/A | 3.74% |
| Bloomberg Barclays Municipal Bond Index (f) | 5.51% | 3.49% | 4.54% | N/A |
| A With Initial Sales Charge (4.25%) | 1.65% | 2.10% | 3.83% | N/A |
| B With CDSC (Declining over six years from 4% to 0%) (v) | 1.36% | 1.84% | 3.48% | N/A |
| (f) | Source: FactSet Research Systems Inc. |
| (t) | For the period from the class inception date through the stated period end (for those share classes with less than 10 years of performance history). No comparative benchmark performance information is provided for “life” periods. (See Notes to Performance Summary.) |
| (v) | Assuming redemption at the end of the applicable period. |
| (a) | BLOOMBERG ® is a trademark and service mark of Bloomberg Finance L.P. and its affiliates (collectively “Bloomberg”). BARCLAYS® is a trademark and service mark of Barclays Bank Plc (collectively with its affiliates, “Barclays”), used under license. Bloomberg or Bloomberg's licensors, including Barclays, own all proprietary rights in the Bloomberg Barclays Indices. Neither Bloomberg nor Barclays approves or endorses this material, or guarantees the accuracy or completeness of any information herein, or makes any warranty, express or implied, as to the results to be obtained therefrom, and, to the maximum extent allowed by law, neither shall have any liability or responsibility for injury or damages arising in connection therewith. |
| Share Class | Annualized Expense Ratio | Beginning Account Value 10/01/20 | Ending Account Value 3/31/21 | Expenses Paid During Period (p) 10/01/20-3/31/21 | |
| A | Actual | 0.90% | $1,000.00 | $1,017.92 | $4.53 |
| Hypothetical(h) | 0.90% | $1,000.00 | $1,020.44 | $4.53 | |
| B | Actual | 1.65% | $1,000.00 | $1,015.08 | $8.29 |
| Hypothetical(h) | 1.65% | $1,000.00 | $1,016.70 | $8.30 | |
| I | Actual | 0.65% | $1,000.00 | $1,019.61 | $3.27 |
| Hypothetical(h) | 0.65% | $1,000.00 | $1,021.69 | $3.28 | |
| R6 | Actual | 0.58% | $1,000.00 | $1,019.94 | $2.92 |
| Hypothetical(h) | 0.58% | $1,000.00 | $1,022.04 | $2.92 |
| (h) | 5% class return per year before expenses. |
| (p) | “Expenses Paid During Period” are equal to each class’s annualized expense ratio, as shown above, multiplied by the average account value over the period, multiplied by 182/365 (to reflect the one-half year period). Expenses paid do not include any applicable sales charges (loads). If these transaction costs had been included, your costs would have been higher. |
| Share Class | Annualized Expense Ratio | Beginning Account Value 10/01/20 | Ending Account Value 3/31/21 | Expenses Paid During Period (p) 10/01/20-3/31/21 | |
| A | Actual | 0.74% | $1,000.00 | $1,022.81 | $3.73 |
| Hypothetical (h) | 0.74% | $1,000.00 | $1,021.24 | $3.73 | |
| B | Actual | 1.49% | $1,000.00 | $1,019.02 | $7.50 |
| Hypothetical (h) | 1.49% | $1,000.00 | $1,017.50 | $7.49 | |
| I | Actual | 0.64% | $1,000.00 | $1,022.37 | $3.23 |
| Hypothetical (h) | 0.64% | $1,000.00 | $1,021.74 | $3.23 | |
| R6 | Actual | 0.57% | $1,000.00 | $1,022.69 | $2.87 |
| Hypothetical (h) | 0.57% | $1,000.00 | $1,022.09 | $2.87 |
| Share Class | Annualized Expense Ratio | Beginning Account Value 10/01/20 | Ending Account Value 3/31/21 | Expenses Paid During Period (p) 10/01/20-3/31/21 | |
| A | Actual | 0.68% | $1,000.00 | $1,028.79 | $3.44 |
| Hypothetical (h) | 0.68% | $1,000.00 | $1,021.54 | $3.43 | |
| B | Actual | 1.43% | $1,000.00 | $1,023.33 | $7.21 |
| Hypothetical (h) | 1.43% | $1,000.00 | $1,017.80 | $7.19 | |
| C | Actual | 1.58% | $1,000.00 | $1,022.49 | $7.97 |
| Hypothetical (h) | 1.58% | $1,000.00 | $1,017.05 | $7.95 | |
| I | Actual | 0.58% | $1,000.00 | $1,029.00 | $2.93 |
| Hypothetical (h) | 0.58% | $1,000.00 | $1,022.04 | $2.92 | |
| R6 | Actual | 0.51% | $1,000.00 | $1,029.37 | $2.58 |
| Hypothetical (h) | 0.51% | $1,000.00 | $1,022.39 | $2.57 |
| Share Class | Annualized Expense Ratio | Beginning Account Value | Ending Account Value 3/31/21 | Expenses Paid During Period (p) 10/01/20-3/31/21 | |
| A | Actual | 0.90% | $1,000.00 | $1,021.61 | $4.54 |
| Hypothetical (h) | 0.90% | $1,000.00 | $1,020.44 | $4.53 | |
| B | Actual | 1.64% | $1,000.00 | $1,017.78 | $8.25 |
| Hypothetical (h) | 1.64% | $1,000.00 | $1,016.75 | $8.25 | |
| I | Actual | 0.65% | $1,000.00 | $1,023.18 | $3.28 |
| Hypothetical (h) | 0.65% | $1,000.00 | $1,021.69 | $3.28 | |
| R6 | Actual | 0.60% | $1,000.00 | $1,022.36 | $3.03 |
| Hypothetical (h) | 0.60% | $1,000.00 | $1,021.94 | $3.02 |
| (h) | 5% class return per year before expenses. |
| (p) | “Expenses Paid During Period” are equal to each class’s annualized expense ratio, as shown above, multiplied by the average account value over the period, multiplied by 182/365 (to reflect the one-half year period). Expenses paid do not include any applicable sales charges (loads). If these transaction costs had been included, your costs would have been higher. |
| Share Class | Annualized Expense Ratio | Beginning Account Value 10/01/20 | Ending Account Value 3/31/21 | Expenses Paid During Period (p) 10/01/20-3/31/21 | |
| A | Actual | 0.83% | $1,000.00 | $1,026.26 | $4.19 |
| Hypothetical (h) | 0.83% | $1,000.00 | $1,020.79 | $4.18 | |
| B | Actual | 1.58% | $1,000.00 | $1,023.40 | $7.97 |
| Hypothetical (h) | 1.58% | $1,000.00 | $1,017.05 | $7.95 | |
| I | Actual | 0.58% | $1,000.00 | $1,028.10 | $2.93 |
| Hypothetical (h) | 0.58% | $1,000.00 | $1,022.04 | $2.92 | |
| R6 | Actual | 0.51% | $1,000.00 | $1,028.38 | $2.58 |
| Hypothetical (h) | 0.51% | $1,000.00 | $1,022.39 | $2.57 |
| Share Class | Annualized Expense Ratio | Beginning Account Value 10/01/20 | Ending Account Value 3/31/21 | Expenses Paid During Period (p) 10/01/20-3/31/21 | |
| A | Actual | 0.85% | $1,000.00 | $1,022.86 | $4.29 |
| Hypothetical (h) | 0.85% | $1,000.00 | $1,020.69 | $4.28 | |
| B | Actual | 1.60% | $1,000.00 | $1,019.95 | $8.06 |
| Hypothetical (h) | 1.60% | $1,000.00 | $1,016.95 | $8.05 | |
| I | Actual | 0.60% | $1,000.00 | $1,024.77 | $3.03 |
| Hypothetical (h) | 0.60% | $1,000.00 | $1,021.94 | $3.02 | |
| R6 | Actual | 0.52% | $1,000.00 | $1,025.12 | $2.63 |
| Hypothetical (h) | 0.52% | $1,000.00 | $1,022.34 | $2.62 |
| (h) | 5% class return per year before expenses. |
| (p) | “Expenses Paid During Period” are equal to each class’s annualized expense ratio, as shown above, multiplied by the average account value over the period, multiplied by 182/365 (to reflect the one-half year period). Expenses paid do not include any applicable sales charges (loads). If these transaction costs had been included, your costs would have been higher. |
| Issuer | Shares/Par | Value ($) | ||
| Municipal Bonds – 97.4% | ||||
| Airport Revenue – 1.4% | ||||
| Birmingham, AL, Airport Authority Rev., BAM, 5%, 7/01/2031 | $ | 325,000 | $ 417,979 | |
| Birmingham, AL, Airport Authority Rev., BAM, 5%, 7/01/2032 | 325,000 | 415,853 | ||
| Birmingham, AL, Airport Authority Rev., BAM, 5%, 7/01/2033 | 325,000 | 414,077 | ||
| Dallas and Fort Worth, TX, International Airport Rev., “B”, 5%, 11/01/2044 | 70,000 | 74,773 | ||
| Dallas and Fort Worth, TX, International Airport Rev., “C”, 5%, 11/01/2045 | 45,000 | 46,180 | ||
| $ 1,368,862 | ||||
| General Obligations - General Purpose – 17.3% | ||||
| Birmingham, AL, General Obligation Warrants, “A”, 5%, 6/01/2028 | $ | 1,000,000 | $ 1,279,583 | |
| Birmingham, AL, General Obligation Warrants, “B”, 5%, 12/01/2043 | 245,000 | 302,059 | ||
| Bridgeview, IL, Stadium and Redevelopment Projects, AAC, 5.14%, 12/01/2036 | 160,000 | 156,405 | ||
| Chicago, IL, General Obligation, “A”, 5.5%, 1/01/2033 | 55,000 | 61,772 | ||
| Chicago, IL, General Obligation, “A”, 5.5%, 1/01/2035 | 40,000 | 49,182 | ||
| Chicago, IL, General Obligation, “D”, 5.5%, 1/01/2040 | 15,000 | 16,680 | ||
| Chicago, IL, General Obligation, “F”, 5.5%, 1/01/2042 | 110,000 | 122,003 | ||
| Commonwealth of Puerto Rico, General Obligation, “A”, 8%, 7/01/2035 (a)(d) | 850,000 | 667,250 | ||
| Commonwealth of Puerto Rico, Public Improvement, “A”, AGM, 5%, 7/01/2035 | 110,000 | 113,707 | ||
| Commonwealth of Puerto Rico, Public Improvement, “A-4”, AGM, 5.25%, 7/01/2030 | 20,000 | 20,700 | ||
| Commonwealth of Puerto Rico, Public Improvement, “A-4”, AGM, 5%, 7/01/2031 | 40,000 | 41,296 | ||
| Fort Payne, AL, General Obligation Warrants, “A”, AGM, 5%, 5/01/2047 | 750,000 | 896,742 | ||
| Jasper, AL, General Obligation Warrants, 5%, 3/01/2032 (Prerefunded 3/01/2024) | 500,000 | 568,400 | ||
| Mobile County, AL, General Obligation Improvement Warrants, 5%, 2/01/2038 | 250,000 | 312,666 | ||
| Mobile County, AL, General Obligation Improvement Warrants, 5%, 2/01/2039 | 250,000 | 311,846 | ||
| Mobile County, AL, General Obligation Refunding, “A”, 5%, 8/01/2032 | 1,110,000 | 1,466,067 | ||
| Mobile County, AL, General Obligation Warrants, 5%, 8/01/2036 | 500,000 | 612,401 | ||
| Montevallo, AL, American Village Public Educational Building Authority Refunding Rev. (Alabama Veterans Living Legacy Project), 4%, 12/01/2033 | 420,000 | 471,426 | ||
| Issuer | Shares/Par | Value ($) | ||
| General Obligations - General Purpose – continued | ||||
| Montevallo, AL, American Village Public Educational Building Authority Refunding Rev. (Alabama Veterans Living Legacy Project), 4%, 12/01/2034 | $ | 655,000 | $ 733,075 | |
| Montevallo, AL, American Village Public Educational Building Authority Refunding Rev. (Alabama Veterans Living Legacy Project), 4%, 12/01/2035 | 250,000 | 278,931 | ||
| Montgomery County, AL, General Obligation Refunding Warrants, “A”, 4%, 3/01/2027 | 1,000,000 | 1,182,002 | ||
| Montgomery, AL, General Obligation, “A”, 5%, 12/01/2028 | 450,000 | 579,458 | ||
| Montgomery, AL, General Obligation, “A”, 5%, 12/01/2030 | 625,000 | 832,821 | ||
| Orange Beach, AL, General Obligation, 4%, 8/01/2028 | 700,000 | 849,497 | ||
| Puerto Rico Public Buildings Authority Government Facilities Rev., “M-2”, AAC, 10%, 7/01/2035 | 115,000 | 120,854 | ||
| State Alabama, AL, General Obligation Refunding, “C”, 5%, 8/01/2025 | 1,000,000 | 1,191,767 | ||
| State of Illinois, 5%, 6/01/2021 | 475,000 | 478,330 | ||
| State of Illinois, General Obligation, 5.5%, 5/01/2039 | 120,000 | 147,634 | ||
| Trussville, AL, General Obligation Warrants, “A”, 4%, 8/01/2041 | 750,000 | 862,236 | ||
| Vestavia Hills, AL, 4%, 8/01/2048 | 500,000 | 570,251 | ||
| Vestavia Hills, AL, General Obligation Warrants, 4%, 8/01/2038 | 1,000,000 | 1,172,731 | ||
| $ 16,469,772 | ||||
| General Obligations - Schools – 3.6% | ||||
| Downey, CA, Unified School District (Election of 2014), “B”, 4%, 8/01/2040 | $ | 445,000 | $ 515,876 | |
| Huntsville, AL, “A”, 5%, 5/01/2039 | 1,000,000 | 1,254,884 | ||
| Huntsville, AL, School Warrants, “C”, 5%, 11/01/2029 (Prerefunded 11/01/2023) | 200,000 | 224,727 | ||
| Huntsville, AL, School Warrants, “C”, 5%, 11/01/2030 (Prerefunded 11/01/2023) | 1,000,000 | 1,123,638 | ||
| Montebello, CA, Unified School District (Election of 2016), “A”, 4%, 8/01/2046 | 270,000 | 293,337 | ||
| $ 3,412,462 | ||||
| Healthcare Revenue - Hospitals – 8.7% | ||||
| Alabama Special Care Facilities Financing Authority Rev. (Ascension Health), “C”, 5%, 11/15/2046 | $ | 500,000 | $ 593,073 | |
| Alabama Special Care Facilities Financing Authority Rev. (Daughters of Charity), ETM, AAC, 5%, 11/01/2025 | 675,000 | 719,324 | ||
| Issuer | Shares/Par | Value ($) | ||
| Municipal Bonds – continued | ||||
| Healthcare Revenue - Hospitals – continued | ||||
| Birmingham, AL, Special Care Facilities Financing Authority Health Care Rev. (Children's Hospital), 5%, 6/01/2031 | $ | 750,000 | $ 869,066 | |
| California Statewide Communities Development Authority Rev. (Loma Linda University Medical Center), “B”, 6%, 12/01/2024 | 320,000 | 357,280 | ||
| Chattanooga, TN, Health, Educational & Housing Facility Board Rev. (CommonSpirit Health), “A-1”, 4%, 8/01/2044 | 5,000 | 5,548 | ||
| Chattanooga, TN, Health, Educational & Housing Facility Board Rev. (CommonSpirit Health), “A-2”, 5%, 8/01/2044 | 5,000 | 6,063 | ||
| Chattanooga, TN, Health, Educational & Housing Facility Board Rev. (CommonSpirit Health), “A-2”, 5%, 8/01/2049 | 5,000 | 6,018 | ||
| Colorado Health Facilities Authority Rev. (CommonSpirit Health), “A-2”, 4%, 8/01/2044 | 40,000 | 44,382 | ||
| DCH Health Care Authority, AL, Health Care Facilities Rev., 5%, 6/01/2033 | 500,000 | 563,937 | ||
| East Alabama Health Care Authority, Health Care Facilities Rev., “A”, 4%, 9/01/2048 | 500,000 | 546,821 | ||
| Huntsville, AL, Health Care Authority, “B”, 5%, 6/01/2035 | 500,000 | 638,819 | ||
| Huntsville, AL, Health Care Authority, “B”, 5%, 6/01/2036 | 500,000 | 636,522 | ||
| Knox County, TN, Health, Educational & Housing Facility Board Rev. (University Health Systems, Inc.), “A”, 5%, 9/01/2030 | 360,000 | 444,977 | ||
| New Jersey Health Care Facilities, Financing Authority Rev. (University Hospital), “A”, AGM, 5%, 7/01/2046 | 50,000 | 56,482 | ||
| Spartanburg County, SC, Regional Health Services District Hospital Rev., “A”, 4%, 4/15/2043 | 425,000 | 466,771 | ||
| UAB Medicine Finance Authority Rev., “B”, 5%, 9/01/2035 | 1,000,000 | 1,182,063 | ||
| UAB Medicine Finance Authority Rev., “B2”, 5%, 9/01/2041 | 1,000,000 | 1,166,194 | ||
| $ 8,303,340 | ||||
| Healthcare Revenue - Long Term Care – 1.4% | ||||
| Birmingham, AL, Special Care Facilities Financing Authority Rev. (Methodist Home for the Aging), 5.75%, 6/01/2045 | $ | 250,000 | $ 258,525 | |
| Pell City, AL, Special Care Facilities Financing Authority Rev. (Noland Health Services, Inc.), 5%, 12/01/2039 | 1,050,000 | 1,073,055 | ||
| $ 1,331,580 | ||||
| Industrial Revenue - Environmental Services – 0.3% | ||||
| Muscle Shoals, Sheffield, and Tuscumbia, AL, Solid Water Disposal Authority Rev. (Cherokee Industrial Landfill Project), “A”, 6%, 5/01/2040 (n) | $ | 300,000 | $ 312,981 | |
| Issuer | Shares/Par | Value ($) | ||
| Industrial Revenue - Other – 1.0% | ||||
| Mobile County, AL, Limited Obligation Warrants (Gomesa Project), 4%, 11/01/2045 (n) | $ | 500,000 | $ 501,069 | |
| Port Beaumont, TX, Navigation District Facility Rev. (Jefferson Gulf Coast Energy Project), “A”, 3.625%, 1/01/2035 (n) | 100,000 | 102,191 | ||
| Tuscaloosa County, AL, Industrial Development Authority, Gulf Opportunity Zone (Hunt Refining Project), “A”, 5.25%, 5/01/2044 (n) | 305,000 | 346,607 | ||
| $ 949,867 | ||||
| Industrial Revenue - Paper – 0.3% | ||||
| Selma, AL, Industrial Development Board Rev., Gulf Opportunity Zone (International Paper Co.), “A”, 5.375%, 12/01/2035 | $ | 300,000 | $ 308,430 | |
| Miscellaneous Revenue - Other – 0.9% | ||||
| Indiana Finance Authority Rev. (Ohio River Bridges East End Crossing Project), “A”, 5%, 7/01/2040 | $ | 65,000 | $ 70,220 | |
| New York Liberty Development Corp., Liberty Rev. (3 World Trade Center Project), “1”, 5%, 11/15/2044 (n) | 260,000 | 283,714 | ||
| New York Liberty Development Corp., Liberty Rev. (7 World Trade Center Project), 5%, 9/15/2040 | 495,000 | 514,968 | ||
| $ 868,902 | ||||
| Port Revenue – 1.2% | ||||
| Alabama Port Authority Docks Facilities Refunding Rev., “A”, AGM, 5%, 10/01/2035 | $ | 1,000,000 | $ 1,180,621 | |
| Sales & Excise Tax Revenue – 12.4% | ||||
| Baldwin County, AL, Board of Education, School Warrants, 5%, 6/01/2022 | $ | 1,090,000 | $ 1,151,011 | |
| Baldwin County, AL, Board of Education, School Warrants, 5%, 6/01/2022 | 1,450,000 | 1,531,161 | ||
| Cherokee County, AL, Board of Education Special Tax School Warrants (Sales Tax), 5%, 12/01/2048 | 1,000,000 | 1,204,986 | ||
| Elmore County, AL, Board of Education School Tax Warrants, 4%, 8/01/2038 | 745,000 | 868,630 | ||
| Houston County, AL, Board of Education, School Warrants, BAM, 4%, 12/01/2031 | 765,000 | 921,654 | ||
| Houston County, AL, Board of Education, School Warrants, BAM, 4%, 12/01/2032 | 500,000 | 594,720 | ||
| Jefferson County, AL, Board of Education, 4%, 2/01/2042 | 805,000 | 905,621 | ||
| Jefferson County, AL, Limited Obligation Warrants, 5%, 9/15/2021 | 1,000,000 | 1,021,176 | ||
| Jefferson County, AL, Limited Obligation Warrants, 5%, 9/15/2033 | 500,000 | 599,421 | ||
| Puerto Rico Sales Tax Financing Corp., Restructured Sales Tax Rev., “2019A-1”, 4.55%, 7/01/2040 | 16,000 | 17,341 | ||
| Issuer | Shares/Par | Value ($) | ||
| Municipal Bonds – continued | ||||
| Sales & Excise Tax Revenue – continued | ||||
| Puerto Rico Sales Tax Financing Corp., Restructured Sales Tax Rev., “2019A-1”, 5%, 7/01/2058 | $ | 650,000 | $ 715,767 | |
| Puerto Rico Sales Tax Financing Corp., Restructured Sales Tax Rev., “2019A-2”, 4.329%, 7/01/2040 | 164,000 | 175,434 | ||
| Puerto Rico Sales Tax Financing Corp., Restructured Sales Tax Rev., “2019A-2”, 4.329%, 7/01/2040 | 58,000 | 62,044 | ||
| Puerto Rico Sales Tax Financing Corp., Restructured Sales Tax Rev., “2019A-2”, 4.784%, 7/01/2058 | 25,000 | 27,053 | ||
| Puerto Rico Sales Tax Financing Corp., Restructured Sales Tax Rev., Capital Appreciation, “2019A-1”, 0%, 7/01/2024 | 1,000 | 939 | ||
| Puerto Rico Sales Tax Financing Corp., Restructured Sales Tax Rev., Capital Appreciation, “2019A-1”, 0%, 7/01/2027 | 26,000 | 22,778 | ||
| Puerto Rico Sales Tax Financing Corp., Restructured Sales Tax Rev., Capital Appreciation, “2019A-1”, 0%, 7/01/2029 | 4,000 | 3,294 | ||
| Puerto Rico Sales Tax Financing Corp., Restructured Sales Tax Rev., Capital Appreciation, “2019A-1”, 0%, 7/01/2031 | 247,000 | 189,039 | ||
| Puerto Rico Sales Tax Financing Corp., Restructured Sales Tax Rev., Capital Appreciation, “2019A-1”, 0%, 7/01/2033 | 237,000 | 168,228 | ||
| Puerto Rico Sales Tax Financing Corp., Restructured Sales Tax Rev., Capital Appreciation, “2019A-1”, 0%, 7/01/2046 | 1,837,000 | 560,597 | ||
| Tuscaloosa County, AL, Board of Education, School Tax Warrants, 5%, 2/01/2037 | 750,000 | 894,876 | ||
| Wisconsin Public Finance Authority Limited Obligation Grant Rev. (American Dream at Meadowlands Project), “A”, 6.25%, 8/01/2027 (n) | 100,000 | 108,670 | ||
| $ 11,744,440 | ||||
| Single Family Housing - Local – 0.5% | ||||
| Montgomery County, MD, Housing Opportunities Commission Program Rev., “A”, 4%, 7/01/2049 | $ | 380,000 | $ 424,504 | |
| Single Family Housing - State – 0.6% | ||||
| Connecticut Housing Finance Authority Rev. (Housing Mortgage Finance Program), “C-1”, 4%, 11/15/2047 | $ | 240,000 | $ 259,100 | |
| Maryland Community Development Administration, Department of Housing & Community Development Housing Rev., “A”, 4.25%, 9/01/2049 | 310,000 | 346,527 | ||
| $ 605,627 | ||||
| Issuer | Shares/Par | Value ($) | ||
| State & Local Agencies – 2.8% | ||||
| Alabama Public Health Care Authority Lease Rev. (Department of Public Health Facilities), 5%, 9/01/2030 | $ | 280,000 | $ 324,726 | |
| Bessemer, AL, Public Educational Building Authority Rev. (DHR Building Project), “A”, AGM, 5%, 7/01/2030 | 210,000 | 210,684 | ||
| Colorado State University Board of Governors, System Enterprise Refunding Rev., “E”, 4%, 3/01/2043 | 315,000 | 357,748 | ||
| Golden State, CA, Tobacco Securitization Corp., Tobacco Settlement Rev., “A”, 5%, 6/01/2030 | 35,000 | 38,226 | ||
| Huntsville, AL, Public Building Authority Lease Refunding Rev., 5%, 10/01/2033 | 500,000 | 614,620 | ||
| Maryland Stadium Authority Rev., Baltimore City Public Schools Construction and Revitalization Program, “A”, 5%, 5/01/2047 (Prerefunded 5/01/2028) | 75,000 | 95,846 | ||
| Maryland Stadium Authority Rev., Baltimore City Public Schools Construction and Revitalization Program, “A”, 5%, 5/01/2047 | 155,000 | 184,315 | ||
| New Jersey Building Authority Rev., Unrefunded Balance, “A”, BAM, 5%, 6/15/2029 | 10,000 | 11,878 | ||
| New Jersey Economic Development Authority Rev. (School Facilities Construction), 5%, 6/15/2032 | 5,000 | 6,336 | ||
| New Jersey Economic Development Authority Rev. (School Facilities Construction), 4%, 6/15/2034 | 5,000 | 5,758 | ||
| New Jersey Economic Development Authority Rev. (School Facilities Construction), 4%, 6/15/2035 | 10,000 | 11,483 | ||
| New Jersey Economic Development Authority Rev. (School Facilities Construction), 4%, 6/15/2036 | 10,000 | 11,439 | ||
| New Jersey Economic Development Authority Rev. (School Facilities Construction), 4%, 6/15/2037 | 5,000 | 5,698 | ||
| New Jersey Economic Development Authority Rev. (School Facilities Construction), 4%, 6/15/2038 | 10,000 | 11,360 | ||
| New Jersey Economic Development Authority Rev. (School Facilities Construction), 4%, 6/15/2039 | 10,000 | 11,335 | ||
| New Jersey Economic Development Authority Rev. (School Facilities Construction), 4%, 6/15/2040 | 15,000 | 16,973 | ||
| New Jersey Economic Development Authority Rev. (School Facilities Construction), 4%, 6/15/2041 | 10,000 | 11,281 | ||
| New Jersey Economic Development Authority Rev. (School Facilities Construction), “AAA”, 5%, 6/15/2026 | 75,000 | 90,060 | ||
| Orangeburg County, SC, Facilities Corp. Installment Purchase Rev. (Detention Center Project), 4%, 12/01/2042 | 185,000 | 202,077 | ||
| Issuer | Shares/Par | Value ($) | ||
| Municipal Bonds – continued | ||||
| State & Local Agencies – continued | ||||
| Pennsylvania Public School Building Authority, School Lease Rev. (School District of Philadelphia Project), “A”, AGM, 5%, 6/01/2033 | $ | 350,000 | $ 423,693 | |
| $ 2,645,536 | ||||
| Student Loan Revenue – 0.2% | ||||
| Iowa Student Loan Liquidity Corp. Rev., “B”, 3%, 12/01/2039 | $ | 35,000 | $ 34,574 | |
| Iowa Student Loan Liquidity Corp. Rev., “B”, 3.5%, 12/01/2044 | 90,000 | 90,578 | ||
| Minnesota Office of Higher Education Supplemental Student Loan Program Rev., 2.65%, 11/01/2038 | 60,000 | 59,417 | ||
| $ 184,569 | ||||
| Tax - Other – 7.6% | ||||
| Alabama Public School & College Authority Rev., “A”, 5%, 11/01/2027 | $ | 1,000,000 | $ 1,272,619 | |
| Alabama Public School & College Authority Rev., “B”, 5%, 6/01/2025 (Prerefunded 6/01/2023) | 800,000 | 882,186 | ||
| Birmingham-Jefferson, AL, Civic Center Authority, “A”, 4%, 7/01/2043 | 750,000 | 822,751 | ||
| Birmingham-Jefferson, AL, Civic Center Authority, “B”, 5%, 7/01/2043 | 500,000 | 588,988 | ||
| Guam Government Ltd. Obligation Rev., “A”, 5%, 12/01/2035 | 55,000 | 62,381 | ||
| Guam Government Ltd. Obligation Rev., “A”, 5%, 12/01/2036 | 30,000 | 33,945 | ||
| Guam Government Ltd. Obligation Rev., “A”, 5%, 12/01/2046 | 85,000 | 94,614 | ||
| Lauderdale County, AL, Agriculture Center Authority Special Tax Rev., 5%, 7/01/2049 | 1,000,000 | 1,092,034 | ||
| Mountain Brook, AL, Board of Education, School Warrants, “A”, 4%, 3/01/2027 (w) | 200,000 | 237,144 | ||
| Mountain Brook, AL, Board of Education, School Warrants, “A”, 4%, 3/01/2030 (w) | 325,000 | 402,477 | ||
| Puerto Rico Convention Center District Authority, Hotel Occupancy Tax Rev., “A”, AAC, 5%, 7/01/2031 | 70,000 | 71,621 | ||
| Puerto Rico Infrastructure Financing Authority Special Tax Rev., “C”, AAC, 5.5%, 7/01/2024 | 105,000 | 113,032 | ||
| Puerto Rico Infrastructure Financing Authority Special Tax Rev., “C”, AAC, 5.5%, 7/01/2026 | 265,000 | 291,439 | ||
| Tuscaloosa, AL, Board of Education, School Tax Warrants, 5%, 8/01/2036 (Prerefunded 8/01/2026) | 1,000,000 | 1,231,901 | ||
| $ 7,197,132 | ||||
| Tobacco – 0.2% | ||||
| Buckeye, OH, Tobacco Settlement Financing Authority Senior Asset-Backed Refunding, 2020A-2, “1”, 5%, 6/01/2036 | $ | 55,000 | $ 68,882 | |
| Issuer | Shares/Par | Value ($) | ||
| Tobacco – continued | ||||
| Buckeye, OH, Tobacco Settlement Financing Authority Senior Asset-Backed Refunding, 2020B-3, Capital Appreciation, “2”, 0%, 6/01/2057 | $ | 1,040,000 | $ 157,257 | |
| $ 226,139 | ||||
| Toll Roads – 0.3% | ||||
| Virginia Small Business Financing Authority Rev. (Elizabeth River Crossings Opco LLC Project), 6%, 1/01/2037 | $ | 90,000 | $ 95,171 | |
| Virginia Small Business Financing Authority Rev. (Elizabeth River Crossings Opco LLC Project), 5.5%, 1/01/2042 | 180,000 | 188,181 | ||
| $ 283,352 | ||||
| Transportation - Special Tax – 2.7% | ||||
| Alabama Federal Aid Highway Finance Authority Special Obligation, “A”, 5%, 9/01/2035 | $ | 500,000 | $ 601,405 | |
| Commonwealth of Puerto Rico Highway & Transportation Authority Rev., “D”, AGM, 5%, 7/01/2032 | 125,000 | 129,051 | ||
| Commonwealth of Puerto Rico Highway & Transportation Authority Rev., “L”, AAC, 5.25%, 7/01/2038 | 325,000 | 365,852 | ||
| Commonwealth of Puerto Rico Highway & Transportation Authority Rev., “N”, AAC, 5.5%, 7/01/2029 | 330,000 | 366,545 | ||
| Commonwealth of Puerto Rico Highway & Transportation Authority Rev., “N”, AAC, 5.25%, 7/01/2031 | 240,000 | 264,461 | ||
| Commonwealth of Puerto Rico Highway & Transportation Authority Rev., “N”, NPFG, 5.25%, 7/01/2032 | 35,000 | 38,819 | ||
| Metropolitan Transportation Authority Rev., NY, Anticipation Note, “B-2”, 5%, 5/15/2021 | 265,000 | 266,273 | ||
| Metropolitan Transportation Authority Rev., NY, Anticipation Note, “D-1”, 5%, 9/01/2022 | 200,000 | 211,944 | ||
| New Jersey Transportation Trust Fund Authority, “AA”, 5%, 6/15/2045 | 50,000 | 60,697 | ||
| New Jersey Transportation Trust Fund Authority, Federal Highway Reimbursement Rev., “A-1”, 5%, 6/15/2027 | 105,000 | 125,485 | ||
| New Jersey Transportation Trust Fund Authority, Transportation System, “A”, 5%, 12/15/2039 | 45,000 | 54,483 | ||
| New Jersey Transportation Trust Fund Authority, Transportation System, “BB”, 5%, 6/15/2044 | 50,000 | 59,461 | ||
| $ 2,544,476 | ||||
| Universities - Colleges – 21.3% | ||||
| Alabama Community College System Board of Trustees Rev. (Bishop State Community College), BAM, 4%, 1/01/2044 | $ | 300,000 | $ 333,899 | |
| Issuer | Shares/Par | Value ($) | ||
| Municipal Bonds – continued | ||||
| Universities - Colleges – continued | ||||
| Alabama Community College System Board of Trustees Rev. (Bishop State Community College), BAM, 4%, 1/01/2049 | $ | 1,000,000 | $ 1,105,680 | |
| Alabama Community College System Board of Trustees Rev. (Coastal Community College), BAM, 4%, 10/01/2027 | 615,000 | 729,313 | ||
| Alabama Community College System Board of Trustees Rev. (Snead State Community College), BAM, 4%, 9/01/2038 | 680,000 | 773,475 | ||
| Auburn University, General Fee Rev., “A”, 5%, 6/01/2025 | 885,000 | 1,049,285 | ||
| Auburn University, General Fee Rev., “A”, 5%, 6/01/2025 | 1,270,000 | 1,505,753 | ||
| Auburn University, General Fee Rev., “A”, 5%, 6/01/2038 | 500,000 | 592,958 | ||
| Auburn University, General Fee Rev., “A”, 5%, 6/01/2048 | 1,500,000 | 1,822,029 | ||
| Homewood, AL, Educational Building Authority Facilities Rev. (Samford University), “A”, 5%, 12/01/2034 | 500,000 | 591,474 | ||
| Jacksonville State University, AL, Tuition and Fee Rev., 4%, 12/01/2027 | 1,000,000 | 1,179,760 | ||
| Jacksonville State University, AL, Tuition and Fee Rev., 4%, 12/01/2040 | 750,000 | 859,234 | ||
| Jacksonville, AL, Public Educational Building Authority Higher Education Facilities Rev. (Jacksonville State University Foundation), “A”, 5%, 7/01/2036 | 580,000 | 677,412 | ||
| Puerto Rico Industrial, Tourist, Educational, Medical & Environmental Control Facilities Financing Authority, Educational Facilities Rev. (University Plaza Project), NPFG, 5%, 7/01/2033 | 65,000 | 65,853 | ||
| Troy University, Facilities Rev., “A”, BAM, 5%, 11/01/2028 | 500,000 | 577,355 | ||
| University of Alabama at Birmingham, Rev., “B”, 4%, 10/01/2037 | 1,000,000 | 1,164,974 | ||
| University of Alabama in Huntsville, General Fee Rev., “B2”, 5%, 9/01/2035 | 755,000 | 935,226 | ||
| University of Alabama in Huntsville, General Fee Rev., “B2”, 5%, 9/01/2036 | 475,000 | 586,606 | ||
| University of North Alabama, General Fee Rev., “B”, BAM, 5%, 11/01/2026 | 445,000 | 545,453 | ||
| University of North Alabama, General Fee Rev., “B”, BAM, 5%, 11/01/2039 | 1,000,000 | 1,242,501 | ||
| University of North Alabama, General Fee Rev., “C”, BAM, 4%, 11/01/2038 | 500,000 | 584,854 | ||
| University of South Alabama, Facilities Rev., BAM, 5%, 10/01/2036 | 500,000 | 605,269 | ||
| University of South Alabama, Facilities Rev., “A”, BAM, 5%, 4/01/2049 | 750,000 | 913,876 | ||
| University of West Alabama, General Fee Rev., AGM, 4%, 1/01/2036 | 355,000 | 408,032 | ||
| University of West Alabama, General Fee Rev., AGM, 4%, 1/01/2038 | 500,000 | 570,876 | ||
| Issuer | Shares/Par | Value ($) | ||
| Universities - Colleges – continued | ||||
| University of West Alabama, General Fee Rev., AGM, 4%, 1/01/2040 | $ | 770,000 | $ 874,476 | |
| $ 20,295,623 | ||||
| Universities - Dormitories – 0.1% | ||||
| Maryland Economic Development Corp., Student Housing Rev. (Morgan State University Project), 5%, 7/01/2056 | $ | 40,000 | $ 46,976 | |
| Utilities - Cogeneration – 0.2% | ||||
| Puerto Rico Industrial, Tourist, Educational, Medical & Environmental Control Facilities Financing Authority Rev. (Cogeneration Facilities - AES Puerto Rico Project), 9.12%, 6/01/2022 | $ | 185,000 | $ 189,625 | |
| Utilities - Municipal Owned – 1.0% | ||||
| Puerto Rico Electric Power Authority Rev., “A”, 5%, 7/01/2029 (a)(d) | $ | 180,000 | $ 162,900 | |
| Puerto Rico Electric Power Authority Rev., “A”, 5%, 7/01/2042 (a)(d) | 30,000 | 27,150 | ||
| Puerto Rico Electric Power Authority Rev., “AAA”, 5.25%, 7/01/2021 (a)(d) | 15,000 | 13,613 | ||
| Puerto Rico Electric Power Authority Rev., “AAA”, 5.25%, 7/01/2030 (a)(d) | 5,000 | 4,538 | ||
| Puerto Rico Electric Power Authority Rev., “CCC”, 5.25%, 7/01/2027 (a)(d) | 65,000 | 58,987 | ||
| Puerto Rico Electric Power Authority Rev., “DDD”, 5%, 7/01/2020 (a)(d) | 5,000 | 4,513 | ||
| Puerto Rico Electric Power Authority Rev., “DDD”, 5%, 7/01/2021 (a)(d) | 70,000 | 63,350 | ||
| Puerto Rico Electric Power Authority Rev., “DDD”, 5%, 7/01/2022 (a)(d) | 115,000 | 104,075 | ||
| Puerto Rico Electric Power Authority Rev., “DDD”, AGM, 3.625%, 7/01/2023 | 10,000 | 10,018 | ||
| Puerto Rico Electric Power Authority Rev., “DDD”, AGM, 3.65%, 7/01/2024 | 50,000 | 50,092 | ||
| Puerto Rico Electric Power Authority Rev., “EEE”, 6.05%, 7/01/2032 (a)(d) | 40,000 | 35,450 | ||
| Puerto Rico Electric Power Authority Rev., “SS”, AGM, 4.375%, 7/01/2030 | 10,000 | 10,024 | ||
| Puerto Rico Electric Power Authority Rev., “TT”, 5%, 7/01/2021 (a)(d) | 40,000 | 36,200 | ||
| Puerto Rico Electric Power Authority Rev., “TT”, 5%, 7/01/2023 (a)(d) | 30,000 | 27,150 | ||
| Puerto Rico Electric Power Authority Rev., “TT”, 5%, 7/01/2027 (a)(d) | 5,000 | 4,525 | ||
| Puerto Rico Electric Power Authority Rev., “TT”, 5%, 7/01/2037 (a)(d) | 95,000 | 85,975 | ||
| Puerto Rico Electric Power Authority Rev., “UU”, AGM, 4.25%, 7/01/2027 | 70,000 | 70,160 | ||
| Puerto Rico Electric Power Authority Rev., “V”, NPFG, 5.25%, 7/01/2033 | 35,000 | 38,782 | ||
| Puerto Rico Electric Power Authority Rev., “VV”, NPFG, 5.25%, 7/01/2034 | 15,000 | 16,597 | ||
| Puerto Rico Electric Power Authority Rev., “WW”, 5.375%, 7/01/2022 (a)(d) | 5,000 | 4,544 | ||
| Issuer | Shares/Par | Value ($) | ||
| Municipal Bonds – continued | ||||
| Utilities - Municipal Owned – continued | ||||
| Puerto Rico Electric Power Authority Rev., “WW”, 5.25%, 7/01/2025 (a)(d) | $ | 15,000 | $ 13,612 | |
| Puerto Rico Electric Power Authority Rev., “ZZ”, 5%, 7/01/2018 (a)(d) | 40,000 | 35,650 | ||
| Puerto Rico Electric Power Authority Rev., “ZZ”, 5.25%, 7/01/2023 (a)(d) | 50,000 | 45,375 | ||
| Puerto Rico Electric Power Authority Rev., “ZZ”, 5.25%, 7/01/2024 (a)(d) | 15,000 | 13,612 | ||
| Puerto Rico Electric Power Authority Rev., “ZZ”, 5.25%, 7/01/2026 (a)(d) | 55,000 | 49,912 | ||
| $ 986,804 | ||||
| Water & Sewer Utility Revenue – 11.4% | ||||
| Auburn, AL, Waterworks Board Water Rev., 5%, 9/01/2036 (Prerefunded 9/01/2025) | $ | 1,000,000 | $ 1,182,876 | |
| Birmingham, AL, Waterworks Board Water Rev., 5%, 1/01/2036 | 750,000 | 922,056 | ||
| Birmingham, AL, Waterworks Board Water Rev., “A”, 5%, 1/01/2030 (Prerefunded 1/01/2025) | 500,000 | 583,845 | ||
| Birmingham, AL, Waterworks Board Water Rev., “A”, 5%, 1/01/2031 | 500,000 | 608,572 | ||
| Cullman, AL, Utilities Board Water Rev., “A”, AGM, 5%, 9/01/2035 | 1,000,000 | 1,129,194 | ||
| Gadsden, AL, Waterworks and Sewer Rev., AGM, 4%, 6/01/2033 | 1,000,000 | 1,152,556 | ||
| Guam Waterworks Authority Rev. (Water and Wastewater System), 5%, 7/01/2036 | 45,000 | 51,268 | ||
| Guam Waterworks Authority Rev. (Water and Wastewater System), 5%, 1/01/2046 | 120,000 | 134,470 | ||
| Guam Waterworks Authority Rev. (Water and Wastewater System), “A”, 5%, 7/01/2029 | 45,000 | 49,794 | ||
| Guam Waterworks Authority Rev. (Water and Wastewater System), “A”, 5%, 7/01/2035 | 45,000 | 49,235 | ||
| Guam Waterworks Authority Rev. (Water and Wastewater System), “A”, 5%, 1/01/2050 | 95,000 | 114,178 | ||
| Jefferson County, AL, Senior Lien Sewer Rev., Current Interest Warrants, “A”, AGM, 5%, 10/01/2044 | 750,000 | 833,697 | ||
| Jefferson County, AL, Sewer Rev. Warrants, Subordinate Lien, “D”, 5%, 10/01/2021 | 300,000 | 307,263 | ||
| Michigan Finance Authority Local Government Loan Program Rev. (Detroit Water and Sewerage Department Sewage Disposal System Rev. Refunding Second Lien Local Project), “C-7”, NPFG, 5%, 7/01/2032 | 15,000 | 17,053 | ||
| Michigan Finance Authority Local Government Loan Program Rev. (Detroit Water and Sewerage Department Water Supply System Rev. Refunding Second Lien Local Project), “D-6”, NPFG, 5%, 7/01/2036 | 20,000 | 22,655 | ||
| Issuer | Shares/Par | Value ($) | ||
| Water & Sewer Utility Revenue – continued | ||||
| Michigan Finance Authority Local Government Loan Program Rev. (Detroit Water and Sewerage Department Water Supply System Rev. Refunding Senior Lien Local Project), “D-1”, AGM, 5%, 7/01/2035 | $ | 10,000 | $ 11,355 | |
| Michigan Finance Authority Local Government Loan Program Rev. (Detroit Water and Sewerage Department Water Supply System Rev. Refunding Senior Lien Local Project), “D-1”, AGM, 5%, 7/01/2037 | 20,000 | 22,662 | ||
| Opelika, AL, Board of Utility Rev., “A”, BAM, 4%, 6/01/2027 | 200,000 | 236,161 | ||
| Opelika, AL, Board of Utility Rev., “A”, BAM, 4%, 6/01/2028 | 250,000 | 299,770 | ||
| Prichard, AL, Water Works & Sewer Board Rev., 4%, 11/01/2044 | 700,000 | 763,593 | ||
| Scottsboro, AL, Board of Waterworks, Sewer & Gas Rev., “B”, BAM, 4%, 8/01/2039 | 350,000 | 411,333 | ||
| Scottsboro, AL, Waterworks Sewer & Gas Board Rev., 5%, 8/01/2032 (Prerefunded 8/01/2022) | 500,000 | 531,950 | ||
| Warrior River, AL, Water Authority Rev., BAM, 4%, 8/01/2039 | 1,180,000 | 1,358,498 | ||
| $ 10,794,034 | ||||
| Total Municipal Bonds (Identified Cost, $87,994,617) | $92,675,654 | |||
| Bonds – 0.2% | ||||
| Consumer Services – 0.2% | ||||
| Toll Road Investors Partnership II LP, Capital Appreciation, NPFG, 0%, 2/15/2025 (n) | $ | 136,000 | $ 118,770 | |
| Toll Road Investors Partnership II LP, Capital Appreciation, NPFG, 0%, 2/15/2043 (n) | 200,000 | 56,961 | ||
| Total Bonds (Identified Cost, $186,344) | $ 175,731 | |||
| Investment Companies (h) – 1.9% | ||||
| Money Market Funds – 1.9% | ||||
| MFS Institutional Money Market Portfolio, 0.05% (v) (Identified Cost, $1,877,346) | 1,877,374 | $ 1,877,374 | ||
| Other Assets, Less Liabilities – 0.5% | 429,940 | |||
| Net Assets – 100.0% | $95,158,699 | |||
| Issuer | Shares/Par | Value ($) | ||
| Municipal Bonds – 98.0% | ||||
| Airport Revenue – 0.5% | ||||
| Dallas and Fort Worth, TX, International Airport Rev., “B”, 5%, 11/01/2044 | $ | 235,000 | $ 251,025 | |
| Dallas and Fort Worth, TX, International Airport Rev., “C”, 5%, 11/01/2045 | 160,000 | 164,196 | ||
| Wayne County, MI, Airport Authority Rev. (Detroit Metropolitan Wayne County Airport), “B”, 5%, 12/01/2044 | 95,000 | 108,872 | ||
| Wayne County, MI, Airport Authority Rev. (Detroit Metropolitan Wayne County Airport), “B”, BAM, 5%, 12/01/2039 | 105,000 | 120,332 | ||
| Wayne County, MI, Airport Authority Rev. (Detroit Metropolitan Wayne County Airport), “C”, 5%, 12/01/2039 | 80,000 | 91,062 | ||
| Wayne County, MI, Airport Authority Rev. (Detroit Metropolitan Wayne County Airport), “C”, 5%, 12/01/2044 | 125,000 | 142,284 | ||
| $ 877,771 | ||||
| General Obligations - General Purpose – 4.0% | ||||
| Arkansas Higher Education, 4%, 6/01/2029 | $ | 2,000,000 | $ 2,212,256 | |
| Bridgeview, IL, Stadium and Redevelopment Projects, AAC, 5.14%, 12/01/2036 | 375,000 | 366,574 | ||
| Chicago, IL, General Obligation (Neighborhood Alive 21 Program), “B”, 5.5%, 1/01/2037 | 70,000 | 78,135 | ||
| Chicago, IL, General Obligation Refunding Project, “A”, 5.25%, 1/01/2030 | 50,000 | 54,381 | ||
| Chicago, IL, General Obligation, “A”, 5.5%, 1/01/2033 | 110,000 | 123,544 | ||
| Chicago, IL, General Obligation, “A”, 5.5%, 1/01/2035 | 80,000 | 98,364 | ||
| Chicago, IL, General Obligation, “D”, 5.5%, 1/01/2040 | 30,000 | 33,361 | ||
| Chicago, IL, General Obligation, “F”, 5.5%, 1/01/2042 | 225,000 | 249,552 | ||
| Commonwealth of Puerto Rico, General Obligation, “A”, 8%, 7/01/2035 (a)(d) | 1,620,000 | 1,271,700 | ||
| Commonwealth of Puerto Rico, Public Improvement, “A”, AGM, 5%, 7/01/2035 | 320,000 | 330,785 | ||
| Commonwealth of Puerto Rico, Public Improvement, “A-4”, AGM, 5.25%, 7/01/2030 | 60,000 | 62,099 | ||
| Commonwealth of Puerto Rico, Public Improvement, “A-4”, AGM, 5%, 7/01/2031 | 130,000 | 134,213 | ||
| State of Illinois, General Obligation, 5.5%, 5/01/2039 | 120,000 | 147,634 | ||
| State of Illinois, General Obligation, 5.75%, 5/01/2045 | 115,000 | 143,054 | ||
| State of Illinois, General Obligation, “A”, 5%, 3/01/2028 | 150,000 | 180,560 | ||
| Issuer | Shares/Par | Value ($) | ||
| General Obligations - General Purpose – continued | ||||
| State of Illinois, General Obligation, “A”, 5%, 3/01/2029 | $ | 225,000 | $ 274,565 | |
| State of Illinois, General Obligation, “A”, 5%, 3/01/2030 | 205,000 | 252,860 | ||
| State of Illinois, General Obligation, “A”, 5%, 3/01/2031 | 295,000 | 367,908 | ||
| State of New Jersey, COVID-19 General Obligation, “A”, 4%, 6/01/2032 | 425,000 | 522,473 | ||
| $ 6,904,018 | ||||
| General Obligations - Schools – 6.5% | ||||
| Bentonville, AR, School District No. 6 Construction Refunding, “B”, 4%, 6/01/2037 | $ | 1,500,000 | $ 1,690,542 | |
| Bentonville, AR, School District No. 6 Construction Refunding, “B”, 4%, 6/01/2047 | 1,000,000 | 1,121,555 | ||
| Berks County, PA, Reading School District, AGM, 5%, 3/01/2036 | 40,000 | 48,295 | ||
| Crittenden County, AR, Community College District, 4.6%, 2/01/2035 | 285,000 | 285,407 | ||
| Crittenden County, AR, Community College District, 4.7%, 2/01/2040 | 625,000 | 626,306 | ||
| Crittenden County, AR, Earle Special School District Refunding and Construction, 4%, 2/01/2048 | 2,060,000 | 2,156,184 | ||
| North Little Rock, AR, School District No. 1 (Pulaski County), 5%, 2/01/2026 | 1,000,000 | 1,202,656 | ||
| North Little Rock, AR, School District No. 1 (Pulaski County), 2%, 2/01/2027 | 2,000,000 | 2,097,580 | ||
| Pulaski County, AR, Special School District Construction, 4%, 2/01/2041 | 2,000,000 | 2,078,094 | ||
| $ 11,306,619 | ||||
| Healthcare Revenue - Hospitals – 10.0% | ||||
| Arkansas Development Finance Authority, Health Care Rev. (Baptist Health), 5%, 12/01/2047 | $ | 2,000,000 | $ 2,426,219 | |
| Arkansas Development Finance Authority, Health Care Rev. (Baptist Health), “A”, 5%, 12/01/2029 | 1,000,000 | 1,151,901 | ||
| Arkansas Development Finance Authority, Health Care Rev. (Baptist Memorial Health Care Corp.), “B-1”, 5%, 9/01/2034 | 740,000 | 931,334 | ||
| Arkansas Development Finance Authority, Health Care Rev. (Baptist Memorial Health Care Corp.), “B-1”, 5%, 9/01/2044 | 1,000,000 | 1,222,014 | ||
| Arkansas Development Finance Authority, Hospital Rev. (Washington Regional Medical Center), 5%, 2/01/2038 | 1,900,000 | 2,231,251 | ||
| Arkansas Development Finance Authority, Hospital Rev. (Washington Regional Medical Center), 4%, 2/01/2042 | 990,000 | 1,094,771 | ||
| Issuer | Shares/Par | Value ($) | ||
| Municipal Bonds – continued | ||||
| Healthcare Revenue - Hospitals – continued | ||||
| Arkansas Development Finance Authority, Hospital Rev. (Washington Regional Medical Center), “A”, 5%, 2/01/2033 | $ | 1,645,000 | $ 1,825,177 | |
| Batesville, AK, Public Facilities Board, Hospital Rev. (White River Health System, Inc.), 5%, 6/01/2027 | 500,000 | 555,296 | ||
| Chattanooga, TN, Health, Educational & Housing Facility Board Rev. (CommonSpirit Health), “A-1”, 4%, 8/01/2044 | 10,000 | 11,095 | ||
| Chattanooga, TN, Health, Educational & Housing Facility Board Rev. (CommonSpirit Health), “A-2”, 5%, 8/01/2044 | 10,000 | 12,126 | ||
| Chattanooga, TN, Health, Educational & Housing Facility Board Rev. (CommonSpirit Health), “A-2”, 5%, 8/01/2049 | 5,000 | 6,018 | ||
| Colorado Health Facilities Authority Rev. (CommonSpirit Health), “A-2”, 4%, 8/01/2044 | 90,000 | 99,859 | ||
| Conway, AR, Hospital Rev. (Conway Regional Medical Center), 4.45%, 8/01/2032 | 540,000 | 558,461 | ||
| Conway, AR, Hospital Rev. (Conway Regional Medical Center), “A”, 4%, 8/01/2038 | 1,000,000 | 1,084,153 | ||
| Doylestown, PA, Hospital Rev., “A”, 4%, 7/01/2045 | 20,000 | 20,784 | ||
| Pulaski County, AR, Public Facilities Board, Healthcare Rev., 5.5%, 7/01/2043 (Prerefunded 7/01/2023) | 750,000 | 835,702 | ||
| Springdale, AR, Public Facilities Board Hospital Rev. (Children's Northwest Project), 5%, 3/01/2040 | 2,820,000 | 3,241,471 | ||
| $ 17,307,632 | ||||
| Industrial Revenue - Other – 0.6% | ||||
| Port Beaumont, TX, Navigation District Facility Rev. (Jefferson Gulf Coast Energy Project), “A”, 4%, 1/01/2050 (n) | $ | 390,000 | $ 399,790 | |
| Tuscaloosa County, AL, Industrial Development Authority, Gulf Opportunity Zone (Hunt Refining Project), “A”, 4.5%, 5/01/2032 (n) | 225,000 | 250,055 | ||
| Tuscaloosa County, AL, Industrial Development Authority, Gulf Opportunity Zone (Hunt Refining Project), “A”, 5.25%, 5/01/2044 (n) | 330,000 | 375,017 | ||
| $ 1,024,862 | ||||
| Industrial Revenue - Paper – 0.1% | ||||
| Valparaiso, IN, Exempt Facilities Rev. (Pratt Paper LLC Project), 7%, 1/01/2044 | $ | 100,000 | $ 111,977 | |
| Miscellaneous Revenue - Other – 5.0% | ||||
| Arkansas Development Finance Authority Rev., Public Safety Charges (Emergency Management Project), 4%, 6/01/2031 | $ | 1,070,000 | $ 1,254,064 | |
| Issuer | Shares/Par | Value ($) | ||
| Miscellaneous Revenue - Other – continued | ||||
| Arkansas Development Finance Authority, Public Safety Charges (Arkansas Division of Emergency Management Project), 4%, 6/01/2045 | $ | 2,955,000 | $ 3,353,510 | |
| Fayetteville, AR, Hotel, Motel and Restaurant Rev., BAM, 5%, 11/01/2034 | 2,000,000 | 2,299,847 | ||
| New York Liberty Development Corp., Liberty Rev. (7 World Trade Center Project), 5%, 9/15/2040 | 1,615,000 | 1,680,146 | ||
| $ 8,587,567 | ||||
| Sales & Excise Tax Revenue – 16.3% | ||||
| Bentonville, AR, Sales & Use Tax, 4%, 11/01/2026 | $ | 440,000 | $ 441,226 | |
| Cabot, AR, Sales & Use Tax, 5%, 6/01/2026 | 700,000 | 769,442 | ||
| Cabot, AR, Sales & Use Tax, 5%, 6/01/2027 | 1,300,000 | 1,427,189 | ||
| Conway, AR, Sales & Use Tax Rev., Capital Improvement, 4.5%, 5/01/2030 | 850,000 | 919,664 | ||
| Conway, AR, Sales & Use Tax Rev., Capital Improvement, 4.5%, 5/01/2035 | 1,150,000 | 1,240,317 | ||
| Fort Smith, AR, Sales & Use Tax, 5%, 5/01/2023 | 380,000 | 412,946 | ||
| Fort Smith, AR, Sales & Use Tax, 5%, 5/01/2024 | 2,040,000 | 2,143,678 | ||
| Guam Government Business Privilege Tax Rev., “D”, 5%, 11/15/2031 | 415,000 | 466,654 | ||
| Massachusetts Bay Transportation Authority, Sales Tax Rev., “A-1”, 5.25%, 7/01/2029 | 1,000,000 | 1,331,579 | ||
| Mississippi County, AR, 4%, 6/01/2036 | 650,000 | 711,311 | ||
| Mississippi County, AR, 4%, 6/01/2038 | 1,095,000 | 1,192,729 | ||
| Mountain View, AK, Sales and Use Tax Rev. , BAM, 4%, 11/01/2027 | 335,000 | 393,131 | ||
| Mountain View, AK, Sales and Use Tax Rev. , BAM, 3%, 11/01/2031 | 335,000 | 356,865 | ||
| Mountain View, AK, Sales and Use Tax Rev. , BAM, 3%, 11/01/2032 | 395,000 | 417,865 | ||
| Mountain View, AK, Sales and Use Tax Rev. , BAM, 3%, 11/01/2033 | 405,000 | 426,281 | ||
| Mountain View, AK, Sales and Use Tax Rev. , BAM, 3%, 11/01/2034 | 415,000 | 434,185 | ||
| Mountain View, AK, Sales and Use Tax Rev. , BAM, 3%, 11/01/2035 | 425,000 | 442,511 | ||
| Phillips County, AR, Sales & Use Tax, BAM, 3.75%, 9/01/2038 | 1,170,000 | 1,233,856 | ||
| Puerto Rico Sales Tax Financing Corp., Restructured Sales Tax Rev., “2019A-1”, 4.55%, 7/01/2040 | 36,000 | 39,017 | ||
| Puerto Rico Sales Tax Financing Corp., Restructured Sales Tax Rev., “2019A-1”, 5%, 7/01/2058 | 2,108,000 | 2,321,287 | ||
| Puerto Rico Sales Tax Financing Corp., Restructured Sales Tax Rev., “2019A-2”, 4.329%, 7/01/2040 | 355,000 | 379,751 | ||
| Puerto Rico Sales Tax Financing Corp., Restructured Sales Tax Rev., “2019A-2”, 4.329%, 7/01/2040 | 120,000 | 128,366 | ||
| Issuer | Shares/Par | Value ($) | ||
| Municipal Bonds – continued | ||||
| Sales & Excise Tax Revenue – continued | ||||
| Puerto Rico Sales Tax Financing Corp., Restructured Sales Tax Rev., “2019A-2”, 4.536%, 7/01/2053 | $ | 2,000 | $ 2,145 | |
| Puerto Rico Sales Tax Financing Corp., Restructured Sales Tax Rev., “2019A-2”, 4.784%, 7/01/2058 | 62,000 | 67,090 | ||
| Puerto Rico Sales Tax Financing Corp., Restructured Sales Tax Rev., Capital Appreciation, “2019A-1”, 0%, 7/01/2024 | 7,000 | 6,570 | ||
| Puerto Rico Sales Tax Financing Corp., Restructured Sales Tax Rev., Capital Appreciation, “2019A-1”, 0%, 7/01/2027 | 66,000 | 57,821 | ||
| Puerto Rico Sales Tax Financing Corp., Restructured Sales Tax Rev., Capital Appreciation, “2019A-1”, 0%, 7/01/2029 | 12,000 | 9,883 | ||
| Puerto Rico Sales Tax Financing Corp., Restructured Sales Tax Rev., Capital Appreciation, “2019A-1”, 0%, 7/01/2031 | 593,000 | 453,847 | ||
| Puerto Rico Sales Tax Financing Corp., Restructured Sales Tax Rev., Capital Appreciation, “2019A-1”, 0%, 7/01/2033 | 568,000 | 403,180 | ||
| Puerto Rico Sales Tax Financing Corp., Restructured Sales Tax Rev., Capital Appreciation, “2019A-1”, 0%, 7/01/2046 | 2,189,000 | 668,017 | ||
| Rogers, AR, Sales & Use Tax Rev., “B”, 5%, 11/01/2036 | 2,000,000 | 2,427,906 | ||
| Springdale, AR, Sales & Use Tax Rev., 5%, 11/01/2028 (Prerefunded 11/01/2022) | 1,000,000 | 1,074,979 | ||
| Springdale, AR, Sales & Use Tax Rev., BAM, 5%, 4/01/2037 | 1,000,000 | 1,122,273 | ||
| Springdale, AR, Sales & Use Tax Rev., BAM, 3.6%, 4/01/2041 | 2,000,000 | 2,068,522 | ||
| Stuttgart, AR, Sales & Use Tax Rev., AGM, 5%, 6/01/2032 | 1,840,000 | 1,845,967 | ||
| Wisconsin Public Finance Authority Limited Obligation Grant Rev. (American Dream at Meadowlands Project), “A”, 6.25%, 8/01/2027 (n) | 180,000 | 195,605 | ||
| Wisconsin Public Finance Authority Limited Obligation Grant Rev. (American Dream at Meadowlands Project), ”A“, 5.625%, 8/01/2024 (n) | 100,000 | 103,866 | ||
| $ 28,137,521 | ||||
| Secondary Schools – 0.6% | ||||
| Arkansas Development Finance Authority, Charter School Capital Improvement Rev. (LISA Academy Project), 4.5%, 7/01/2039 | $ | 750,000 | $ 772,182 | |
| District of Columbia Rev. (Rocketship D.C.), “A”, 5%, 6/01/2039 (n) | 250,000 | 278,796 | ||
| $ 1,050,978 | ||||
| Issuer | Shares/Par | Value ($) | ||
| Single Family Housing - State – 1.1% | ||||
| Connecticut Housing Finance Authority Rev. (Housing Mortgage Finance Program), “D-1”, GNMA, 4%, 11/15/2047 | $ | 545,000 | $ 589,043 | |
| Iowa Finance Authority, Single Family Mortgage Rev., “A”, GNMA, 4%, 7/01/2047 | 600,000 | 647,894 | ||
| Maryland Community Development Administration, Department of Housing & Community Development Housing Rev., “A”, 4.25%, 9/01/2049 | 640,000 | 715,410 | ||
| $ 1,952,347 | ||||
| State & Local Agencies – 6.7% | ||||
| Arkansas Development Finance Authority Rev. (Donaghey Plaza Project), 5%, 6/01/2034 | $ | 2,605,000 | $ 2,743,119 | |
| Arkansas Development Finance Authority State Agencies Facilities Revenue Refunding and Construction (Justice Building Project), 4%, 12/01/2050 | 2,570,000 | 2,813,930 | ||
| Colorado State University Board of Governors, System Enterprise Refunding Rev., “E”, 4%, 3/01/2043 | 840,000 | 953,994 | ||
| Delaware Valley, PA, Regional Finance Authority, “C”, FLR, 0.878% (LIBOR - 3mo. + 0.75%), 6/01/2037 | 1,315,000 | 1,288,972 | ||
| Maryland Stadium Authority Rev., Baltimore City Public Schools Construction and Revitalization Program, “A”, 5%, 5/01/2047 (Prerefunded 5/01/2028) | 200,000 | 255,589 | ||
| Maryland Stadium Authority Rev., Baltimore City Public Schools Construction and Revitalization Program, “A”, 5%, 5/01/2047 | 385,000 | 457,814 | ||
| New Jersey Economic Development Authority Rev. (School Facilities Construction), “AAA”, 5%, 6/15/2026 | 150,000 | 180,120 | ||
| New Jersey Economic Development Authority Rev. (School Facilities Construction), “LLL”, 5%, 6/15/2039 | 345,000 | 418,135 | ||
| New Jersey Economic Development Authority Rev., School Facilities Construction, “LLL”, 5%, 6/15/2044 | 580,000 | 694,225 | ||
| North Carolina Turnpike Authority, Triangle Expressway System Appropriation Rev., Capital Appreciation, 0%, 1/01/2044 | 2,360,000 | 1,222,740 | ||
| Orangeburg County, SC, Facilities Corp. Installment Purchase Rev. (Detention Center Project), 4%, 12/01/2042 | 525,000 | 573,462 | ||
| $ 11,602,100 | ||||
| Student Loan Revenue – 0.1% | ||||
| Iowa Student Loan Liquidity Corp. Rev., “B”, 3%, 12/01/2039 | $ | 70,000 | $ 69,149 | |
| Iowa Student Loan Liquidity Corp. Rev., “B”, 3.5%, 12/01/2044 | 185,000 | 186,188 | ||
| $ 255,337 | ||||
| Issuer | Shares/Par | Value ($) | ||
| Municipal Bonds – continued | ||||
| Tax - Other – 4.0% | ||||
| Fayetteville, AR, Liberty Improvement Bonds, 4%, 1/01/2037 | $ | 2,000,000 | $ 2,211,663 | |
| Little Rock, AR, Hotel & Restaurant Gross Receipts Tax Rev., 5%, 7/01/2034 | 3,000,000 | 3,408,350 | ||
| Puerto Rico Convention Center District Authority, Hotel Occupancy Tax Rev., “A”, AAC, 5%, 7/01/2031 | 210,000 | 214,864 | ||
| Puerto Rico Infrastructure Financing Authority Special Tax Rev., “C”, AAC, 5.5%, 7/01/2026 | 890,000 | 978,794 | ||
| Wisconsin Public Finance Authority Limited Obligation PILOT Rev. (American Dream at Meadowlands Project), 7%, 12/01/2050 | 100,000 | 115,476 | ||
| $ 6,929,147 | ||||
| Tax Assessment – 0.0% | ||||
| Brunswick, MD, Special Obligation Refunding (Brunswick Crossing Special Taxing District), 4%, 7/01/2029 | $ | 15,000 | $ 17,280 | |
| Brunswick, MD, Special Obligation Refunding (Brunswick Crossing Special Taxing District), 5%, 7/01/2036 | 15,000 | 17,693 | ||
| $ 34,973 | ||||
| Tobacco – 2.4% | ||||
| Arkansas Development Finance Authority, Tobacco Settlement Rev. (Cancer Research Center Project), Capital Appreciation, AAC, 0%, 7/01/2027 | $ | 2,470,000 | $ 2,279,844 | |
| Arkansas Development Finance Authority, Tobacco Settlement Rev. (Cancer Research Center Project), Capital Appreciation, AAC, 0%, 7/01/2028 | 500,000 | 449,697 | ||
| Buckeye, OH, Tobacco Settlement Financing Authority Senior Asset-Backed Refunding, 2020A-2, “1”, 5%, 6/01/2036 | 105,000 | 131,503 | ||
| Buckeye, OH, Tobacco Settlement Financing Authority Senior Asset-Backed Refunding, 2020A-2, “1”, 4%, 6/01/2048 | 185,000 | 206,295 | ||
| Buckeye, OH, Tobacco Settlement Financing Authority Senior Asset-Backed Refunding, 2020B-2, “2”, 5%, 6/01/2055 | 750,000 | 844,957 | ||
| Buckeye, OH, Tobacco Settlement Financing Authority Senior Asset-Backed Refunding, 2020B-3, Capital Appreciation, “2”, 0%, 6/01/2057 | 2,010,000 | 303,930 | ||
| $ 4,216,226 | ||||
| Toll Roads – 0.3% | ||||
| Texas Private Activity Surface Transportation Corp., Senior Lien Rev. (NTE Mobility Partners Segments 3 LLC Segments 3A & 3B Facility), 7%, 12/31/2038 | $ | 230,000 | $ 262,420 | |
| Issuer | Shares/Par | Value ($) | ||
| Toll Roads – continued | ||||
| Texas Private Activity Surface Transportation Corp., Senior Lien Rev. (NTE Mobility Partners Segments 3 LLC Segments 3A & 3B Facility), 6.75%, 6/30/2043 | $ | 180,000 | $ 204,076 | |
| $ 466,496 | ||||
| Transportation - Special Tax – 4.3% | ||||
| Commonwealth of Puerto Rico Highway & Transportation Authority Rev., “J”, NPFG, 5%, 7/01/2029 | $ | 20,000 | $ 20,510 | |
| Commonwealth of Puerto Rico Highway & Transportation Authority Rev., “L”, AAC, 5.25%, 7/01/2038 | 760,000 | 855,532 | ||
| Commonwealth of Puerto Rico Highway & Transportation Authority Rev., “N”, AAC, 5.25%, 7/01/2031 | 715,000 | 787,873 | ||
| Commonwealth of Puerto Rico Highway & Transportation Authority Rev., “N”, NPFG, 5.25%, 7/01/2032 | 380,000 | 421,469 | ||
| Commonwealth of Puerto Rico Highway & Transportation Authority Rev., “N”, NPFG, 5.25%, 7/01/2033 | 445,000 | 493,089 | ||
| Metropolitan Transportation Authority Rev., NY, Anticipation Note, “B-2”, 5%, 5/15/2021 | 535,000 | 537,570 | ||
| Metropolitan Transportation Authority Rev., NY, Anticipation Note, “D-1”, 5%, 9/01/2022 | 395,000 | 418,588 | ||
| New Jersey Economic Development Authority Rev. (NJ Transit Transportation Project), 4%, 11/01/2044 | 1,015,000 | 1,123,715 | ||
| New Jersey Transportation Trust Fund Authority, “AA”, 5%, 6/15/2045 | 95,000 | 115,324 | ||
| New Jersey Transportation Trust Fund Authority, “AA”, 5%, 6/15/2050 | 65,000 | 78,450 | ||
| New Jersey Transportation Trust Fund Authority, Federal Highway Reimbursement Rev., “A-1”, 5%, 6/15/2027 | 310,000 | 370,480 | ||
| New Jersey Transportation Trust Fund Authority, Transportation Program, “BB” , 4%, 6/15/2044 | 1,775,000 | 1,957,666 | ||
| New Jersey Transportation Trust Fund Authority, Transportation System, “A”, 5%, 12/15/2039 | 125,000 | 151,341 | ||
| New Jersey Transportation Trust Fund Authority, Transportation System, “BB”, 5%, 6/15/2044 | 125,000 | 148,654 | ||
| $ 7,480,261 | ||||
| Universities - Colleges – 15.9% | ||||
| Arkansas State University, Housing System Rev. (Jonesboro Campus), 4.5%, 3/01/2031 | $ | 2,500,000 | $ 2,628,328 | |
| Arkansas State University, Student Fee Rev. (Jonesboro Campus), “C”, AGM, 4.5%, 3/01/2027 | 545,000 | 565,050 | ||
| Board of Trustees of the University of Arkansas Various Facilities Refunding Rev., “A”, 5%, 12/01/2030 | 410,000 | 539,688 | ||
| Issuer | Shares/Par | Value ($) | ||
| Municipal Bonds – continued | ||||
| Universities - Colleges – continued | ||||
| Board of Trustees of the University of Arkansas Various Facilities Refunding Rev., “A”, 5%, 12/01/2031 | $ | 430,000 | $ 563,351 | |
| Board of Trustees of the University of Arkansas Various Facilities Refunding Rev., “A”, 5%, 12/01/2032 | 450,000 | 587,014 | ||
| Board of Trustees of the University of Arkansas Various Facilities Refunding Rev., “A”, 5%, 12/01/2033 | 475,000 | 613,754 | ||
| Board of Trustees of the University of Arkansas Various Facilities Refunding Rev., “A”, 4%, 12/01/2035 | 410,000 | 484,518 | ||
| Puerto Rico Industrial, Tourist, Educational, Medical & Environmental Control Facilities Financing Authority, Higher Education Rev. (Ana G. Mendez University System Project), 5.125%, 4/01/2032 | 85,000 | 86,127 | ||
| Puerto Rico Industrial, Tourist, Educational, Medical & Environmental Control Facilities Financing Authority, Higher Education Rev. (Ana G. Mendez University System Project), 5.375%, 4/01/2042 | 140,000 | 142,100 | ||
| Puerto Rico Industrial, Tourist, Educational, Medical & Environmental Control Facilities Financing Authority, Higher Education Rev. (University of Sacred Heart), 4.375%, 10/01/2031 | 60,000 | 60,394 | ||
| Puerto Rico Industrial, Tourist, Educational, Medical & Environmental Control Facilities Financing Authority, Higher Education Rev. (University of Sacred Heart), 5%, 10/01/2042 | 65,000 | 65,975 | ||
| Pulaski, AR, Student Tuition & Fee Rev. (Technical College), AGM, 4%, 4/01/2024 (Prerefunded 10/01/2021) | 1,000,000 | 1,018,858 | ||
| Pulaski, AR, Student Tuition & Fee Rev. (Technical College), AGM, 5%, 4/01/2041 (Prerefunded 10/01/2021) | 1,000,000 | 1,023,743 | ||
| Pulaski, AR, Student Tuition & Fee Rev. (Technical College), BAM, 5%, 9/01/2030 | 1,000,000 | 1,159,663 | ||
| Red River, TX, Education Finance Corp., Higher Education Rev. (Houston Baptist University Project), 5.5%, 10/01/2046 | 340,000 | 388,843 | ||
| University of Arkansas Auxiliary Enterprises Rev., 5%, 12/01/2029 (Prerefunded 12/01/2022) | 605,000 | 653,815 | ||
| University of Arkansas Auxiliary Enterprises Rev. (UALR Campus), “A”, 5%, 5/01/2029 (Prerefunded 5/01/2022) | 200,000 | 210,477 | ||
| University of Arkansas Facilities Rev. (Fayetteville Campus), 5%, 11/01/2047 | 1,500,000 | 1,815,639 | ||
| University of Arkansas Facilities Rev. (Fayetteville Campus), “A”, 5%, 11/01/2021 | 1,310,000 | 1,346,479 | ||
| Issuer | Shares/Par | Value ($) | ||
| Universities - Colleges – continued | ||||
| University of Arkansas Facilities Rev. (Fayetteville Campus), “A”, 5%, 11/01/2026 (Prerefunded 11/01/2021) | $ | 1,000,000 | $ 1,028,082 | |
| University of Arkansas Facilities Rev. (Fayetteville Campus), “A”, 5%, 11/01/2032 | 1,000,000 | 1,117,045 | ||
| University of Arkansas Facilities Rev. (Fayetteville Campus), “A”, 5%, 11/01/2043 | 1,500,000 | 1,834,069 | ||
| University of Arkansas Facilities Rev. (UAMS Campus), 5%, 11/01/2023 | 520,000 | 581,898 | ||
| University of Arkansas Facilities Rev. (UAMS Campus), 5%, 10/01/2025 | 780,000 | 865,541 | ||
| University of Arkansas Facilities Rev. (UAMS Campus), 5%, 11/01/2025 | 2,000,000 | 2,226,045 | ||
| University of Arkansas Facilities Rev. (UAMS Campus), “A”, 5%, 3/01/2031 | 915,000 | 1,170,251 | ||
| University of Arkansas Student Fee Rev. (Fort Smith Campus), 4%, 12/01/2023 (Prerefunded 12/01/2021) | 250,000 | 256,405 | ||
| University of Arkansas Student Fee Rev. (Fort Smith Campus), 4%, 12/01/2024 (Prerefunded 12/01/2021) | 250,000 | 256,405 | ||
| University of Arkansas Student Fee Rev. (Fort Smith Campus), 4%, 12/01/2025 (Prerefunded 12/01/2021) | 500,000 | 512,809 | ||
| University of Arkansas Student Fee Rev. (Fort Smith Campus), 4%, 12/01/2026 (Prerefunded 12/01/2021) | 305,000 | 312,813 | ||
| University of California Regents, Limited Project Rev., “Q”, 4%, 5/15/2051 | 1,800,000 | 2,108,212 | ||
| University of Central Arkansas Student Fee Rev., “A”, AGM, 5%, 11/01/2038 | 500,000 | 580,914 | ||
| University of Central Arkansas Student Fee Rev., “A”, AGM, 4%, 11/01/2048 | 550,000 | 603,165 | ||
| $ 27,407,470 | ||||
| Universities - Dormitories – 0.8% | ||||
| California Municipal Finance Authority, Student Housing Rev. (CHF-Davis I LLC - West Village Student Housing Project), BAM, 5%, 5/15/2051 | $ | 1,130,000 | $ 1,344,461 | |
| Maryland Economic Development Corp., Student Housing Rev. (Morgan State University Project), 5%, 7/01/2056 | 75,000 | 88,080 | ||
| $ 1,432,541 | ||||
| Utilities - Cogeneration – 0.2% | ||||
| Puerto Rico Industrial, Tourist, Educational, Medical & Environmental Control Facilities Financing Authority Rev. (Cogeneration Facilities - AES Puerto Rico Project), 9.12%, 6/01/2022 | $ | 355,000 | $ 363,875 | |
| Utilities - Municipal Owned – 5.6% | ||||
| Benton, AR, Public Utility Rev., AGM, 5%, 9/01/2030 | $ | 1,000,000 | $ 1,182,760 | |
| Benton, AR, Public Utility Rev., AGM, 5%, 9/01/2032 (Prerefunded 9/01/2022) | 1,130,000 | 1,206,754 | ||
| Issuer | Shares/Par | Value ($) | ||
| Municipal Bonds – continued | ||||
| Utilities - Municipal Owned – continued | ||||
| Benton, AR, Public Utility Rev., AGM, 5%, 9/01/2035 | $ | 1,000,000 | $ 1,176,580 | |
| Benton, AR, Public Utility Rev., AGM, 5%, 9/01/2036 (Prerefunded 9/01/2022) | 1,165,000 | 1,244,131 | ||
| Guam Power Authority Rev., “A”, AGM, 5%, 10/01/2030 | 2,805,000 | 2,969,179 | ||
| Puerto Rico Electric Power Authority Rev., “A”, 5%, 7/01/2029 (a)(d) | 410,000 | 371,050 | ||
| Puerto Rico Electric Power Authority Rev., “A”, 5%, 7/01/2042 (a)(d) | 65,000 | 58,825 | ||
| Puerto Rico Electric Power Authority Rev., “AAA”, 5.25%, 7/01/2021 (a)(d) | 30,000 | 27,225 | ||
| Puerto Rico Electric Power Authority Rev., “AAA”, 5.25%, 7/01/2030 (a)(d) | 15,000 | 13,612 | ||
| Puerto Rico Electric Power Authority Rev., “CCC”, 5.25%, 7/01/2027 (a)(d) | 145,000 | 131,587 | ||
| Puerto Rico Electric Power Authority Rev., “DDD”, 5%, 7/01/2020 (a)(d) | 15,000 | 13,538 | ||
| Puerto Rico Electric Power Authority Rev., “DDD”, 5%, 7/01/2021 (a)(d) | 155,000 | 140,275 | ||
| Puerto Rico Electric Power Authority Rev., “DDD”, 5%, 7/01/2022 (a)(d) | 260,000 | 235,300 | ||
| Puerto Rico Electric Power Authority Rev., “DDD”, AGM, 5%, 7/01/2023 | 135,000 | 139,371 | ||
| Puerto Rico Electric Power Authority Rev., “EEE”, 6.05%, 7/01/2032 (a)(d) | 80,000 | 70,900 | ||
| Puerto Rico Electric Power Authority Rev., “TT”, 5%, 7/01/2021 (a)(d) | 60,000 | 54,300 | ||
| Puerto Rico Electric Power Authority Rev., “TT”, 5%, 7/01/2023 (a)(d) | 70,000 | 63,350 | ||
| Puerto Rico Electric Power Authority Rev., “TT”, 5%, 7/01/2027 (a)(d) | 10,000 | 9,050 | ||
| Puerto Rico Electric Power Authority Rev., “TT”, 5%, 7/01/2037 (a)(d) | 210,000 | 190,050 | ||
| Puerto Rico Electric Power Authority Rev., “VV”, NPFG, 5.25%, 7/01/2034 | 15,000 | 16,597 | ||
| Puerto Rico Electric Power Authority Rev., “WW”, 5.375%, 7/01/2022 (a)(d) | 10,000 | 9,088 | ||
| Puerto Rico Electric Power Authority Rev., “WW”, 5.25%, 7/01/2025 (a)(d) | 25,000 | 22,687 | ||
| Puerto Rico Electric Power Authority Rev., “ZZ”, 5%, 7/01/2018 (a)(d) | 95,000 | 84,669 | ||
| Puerto Rico Electric Power Authority Rev., “ZZ”, 5.25%, 7/01/2023 (a)(d) | 110,000 | 99,825 | ||
| Puerto Rico Electric Power Authority Rev., “ZZ”, 5.25%, 7/01/2024 (a)(d) | 35,000 | 31,762 | ||
| Puerto Rico Electric Power Authority Rev., “ZZ”, 5.25%, 7/01/2026 (a)(d) | 95,000 | 86,212 | ||
| $ 9,648,677 | ||||
| Utilities - Other – 0.3% | ||||
| Tennessee Energy Acquisition Corp., Gas Rev., “A”, 5.25%, 9/01/2021 | $ | 300,000 | $ 306,067 | |
| Issuer | Shares/Par | Value ($) | ||
| Utilities - Other – continued | ||||
| Tennessee Energy Acquisition Corp., Gas Rev., “A”, 5.25%, 9/01/2022 | $ | 155,000 | $ 165,557 | |
| $ 471,624 | ||||
| Water & Sewer Utility Revenue – 12.7% | ||||
| Arkansas Community Public Water Systems Authority Rev., 5%, 10/01/2032 | $ | 1,020,000 | $ 1,089,754 | |
| Arkansas Development Finance Authority, Capital Improvement Rev., Revolving Fund Loan, “C”, 5%, 6/01/2023 | 795,000 | 800,794 | ||
| Arkansas Development Finance Authority, Capital Improvement Rev., Revolving Fund Loan, “C”, 5%, 6/01/2025 | 1,500,000 | 1,510,861 | ||
| Conway, AR, Wastewater Improvement Rev., “A”, 4%, 10/01/2039 | 525,000 | 603,019 | ||
| Fort Smith, AR, Water and Sewer and Construction Rev., 5%, 10/01/2035 | 3,850,000 | 4,814,638 | ||
| Fort Smith, AR, Water and Sewer Rev., AGM, 4.5%, 10/01/2021 | 1,545,000 | 1,577,524 | ||
| Fort Smith, AR, Water and Sewer Rev., AGM, 4.5%, 10/01/2022 | 455,000 | 464,215 | ||
| Fort Smith, AR, Water and Sewer Rev., BAM, 3%, 10/01/2029 | 325,000 | 360,121 | ||
| Fort Smith, AR, Water and Sewer Rev., BAM, 5%, 10/01/2029 | 1,000,000 | 1,216,654 | ||
| Guam Waterworks Authority Rev. (Water and Wastewater System), 5%, 7/01/2036 | 85,000 | 96,840 | ||
| Guam Waterworks Authority Rev. (Water and Wastewater System), 5%, 1/01/2046 | 500,000 | 560,291 | ||
| Guam Waterworks Authority Rev. (Water and Wastewater System), “A”, 5%, 7/01/2029 | 245,000 | 271,104 | ||
| Guam Waterworks Authority Rev. (Water and Wastewater System), “A”, 5%, 7/01/2035 | 245,000 | 268,057 | ||
| Guam Waterworks Authority Rev. (Water and Wastewater System), “A”, 5%, 1/01/2050 | 200,000 | 240,374 | ||
| Hot Springs, AR, Construction Wastewater Rev., “B”, BAM, 2.75%, 12/01/2047 | 1,000,000 | 1,000,511 | ||
| Hot Springs, AR, Construction Wastewater Rev., “B”, BAM, 2.75%, 12/01/2050 | 1,000,000 | 992,828 | ||
| Hot Springs, AR, Waterworks Rev., BAM, 4%, 10/01/2035 | 1,125,000 | 1,375,518 | ||
| Hot Springs, AR, Waterworks Rev., BAM, 4%, 10/01/2039 | 1,000,000 | 1,214,323 | ||
| Hot Springs, AR, Waterworks Rev., BAM, 4%, 10/01/2041 | 500,000 | 603,537 | ||
| Hot Springs, AR, Waterworks Rev., BAM, 3.75%, 10/01/2043 | 1,750,000 | 1,875,933 | ||
| Malvern, AR, Water and Sewer Refunding and Construction Rev., BAM, 3.7%, 8/01/2043 | 750,000 | 771,058 | ||
| Michigan Finance Authority Local Government Loan Program Rev. (Detroit Water and Sewerage Department Sewage Disposal System Rev. Refunding Second Lien Local Project), “C-7”, NPFG, 5%, 7/01/2032 | 50,000 | 56,844 | ||
| Issuer | Shares/Par | Value ($) | ||
| Municipal Bonds – continued | ||||
| Water & Sewer Utility Revenue – continued | ||||
| Michigan Finance Authority Local Government Loan Program Rev. (Detroit Water and Sewerage Department Water Supply System Rev. Refunding Second Lien Local Project), “D-6”, NPFG, 5%, 7/01/2036 | $ | 65,000 | $ 73,628 | |
| Michigan Finance Authority Local Government Loan Program Rev. (Detroit Water and Sewerage Department Water Supply System Rev. Refunding Senior Lien Local Project), “D-1”, AGM, 5%, 7/01/2035 | 30,000 | 34,065 | ||
| Michigan Finance Authority Local Government Loan Program Rev. (Detroit Water and Sewerage Department Water Supply System Rev. Refunding Senior Lien Local Project), “D-1”, AGM, 5%, 7/01/2037 | 75,000 | 84,981 | ||
| $ 21,957,472 | ||||
| Total Municipal Bonds (Identified Cost, $160,213,132) | $169,527,491 | |||
| Issuer | Shares/Par | Value ($) | ||
| Bonds – 0.2% | ||||
| Consumer Services – 0.2% | ||||
| Toll Road Investors Partnership II LP, Capital Appreciation, NPFG, 0%, 2/15/2025 (n) | $ | 245,000 | $ 213,961 | |
| Toll Road Investors Partnership II LP, Capital Appreciation, NPFG, 0%, 2/15/2043 (n) | 500,000 | 142,402 | ||
| Total Bonds (Identified Cost, $381,403) | $ 356,363 | |||
| Investment Companies (h) – 0.9% | ||||
| Money Market Funds – 0.9% | ||||
| MFS Institutional Money Market Portfolio, 0.05% (v) (Identified Cost, $1,447,457) | 1,447,457 | $ 1,447,457 | ||
| Other Assets, Less Liabilities – 0.9% | 1,605,612 | |||
| Net Assets – 100.0% | $172,936,923 | |||
| Issuer | Shares/Par | Value ($) | ||
| Municipal Bonds – 100.8% | ||||
| Airport Revenue – 7.8% | ||||
| California Municipal Finance Authority Rev. (LINXS APM Project), “A”, 5%, 12/31/2043 | $ | 2,190,000 | $ 2,586,575 | |
| Los Angeles, CA, Department of Airports Refunding Rev. (Los Angeles International), “A”, 5%, 5/15/2030 | 1,790,000 | 2,323,177 | ||
| Los Angeles, CA, Department of Airports Rev. (Los Angeles International), “C”, 5%, 5/15/2038 | 1,935,000 | 2,324,389 | ||
| Los Angeles, CA, Department of Airports Rev. (Los Angeles International), “D”, 5%, 5/15/2037 | 1,305,000 | 1,610,720 | ||
| Los Angeles, CA, Department of Airports Rev. (Los Angeles International), “D”, 5%, 5/15/2038 | 1,305,000 | 1,606,452 | ||
| Sacramento County, CA, Airport System Rev., “B”, 5%, 7/01/2038 | 2,000,000 | 2,402,917 | ||
| Sacramento County, CA, Airport System Rev., “C”, 5%, 7/01/2039 | 1,000,000 | 1,198,702 | ||
| San Diego County, CA, Regional Airport Authority Rev., “B”, 5%, 7/01/2036 | 750,000 | 925,746 | ||
| San Diego County, CA, Regional Airport Authority Rev., “B”, 5%, 7/01/2037 | 1,400,000 | 1,722,551 | ||
| San Diego County, CA, Regional Airport Authority Rev., “B”, 5%, 7/01/2038 | 1,000,000 | 1,227,083 | ||
| San Diego County, CA, Regional Airport Authority Rev., “B”, 5%, 7/01/2039 | 1,000,000 | 1,223,938 | ||
| San Diego County, CA, Regional Airport Authority Rev., “B”, 5%, 7/01/2042 | 665,000 | 787,314 | ||
| San Diego County, CA, Regional Airport Authority Rev., “B”, 5%, 7/01/2047 | 665,000 | 784,053 | ||
| San Diego County, CA, Regional Airport Authority Rev., “C”, 5%, 7/01/2031 | 1,030,000 | 1,319,591 | ||
| San Francisco, CA, City & County Airports Commission, International Airport Rev., “A”, 5%, 5/01/2031 | 850,000 | 890,279 | ||
| San Francisco, CA, City & County Airports Commission, International Airport Rev., “A”, 5%, 5/01/2044 | 7,605,000 | 9,170,219 | ||
| San Francisco, CA, City & County Airports Commission, International Airport Rev., “B”, 5%, 5/01/2046 | 3,000,000 | 3,469,220 | ||
| San Francisco, CA, City & County Airports Commission, International Airport Rev., “D”, 5%, 5/01/2025 (Prerefunded 5/03/2021) | 570,000 | 572,167 | ||
| San Francisco, CA, City & County Airports Commission, International Airport Rev., “A”, 5%, 5/01/2039 | 3,420,000 | 4,184,466 | ||
| San Francisco, CA, City & County Airports Commission, International Airport Rev., Unrefunded Balance, “D”, 5%, 5/01/2025 | 1,430,000 | 1,434,966 | ||
| Issuer | Shares/Par | Value ($) | ||
| Airport Revenue – continued | ||||
| San Jose, CA, Airport Rev., “A”, 5%, 3/01/2035 | $ | 1,000,000 | $ 1,189,602 | |
| San Jose, CA, Airport Rev., “A”, 5%, 3/01/2047 | 2,000,000 | 2,342,920 | ||
| San Jose, CA, Airport Rev., “A-2”, 5.25%, 3/01/2034 | 3,000,000 | 3,000,856 | ||
| $ 48,297,903 | ||||
| General Obligations - General Purpose – 5.5% | ||||
| Bridgeview, IL, Stadium and Redevelopment Projects, AAC, 5.14%, 12/01/2036 | $ | 1,080,000 | $ 1,055,735 | |
| Chicago, IL, General Obligation, “A”, 5%, 1/01/2025 | 810,000 | 914,989 | ||
| Chicago, IL, General Obligation, “A”, 5%, 1/01/2026 | 225,000 | 260,155 | ||
| Chicago, IL, General Obligation, “A”, 5%, 1/01/2027 | 255,000 | 300,843 | ||
| Commonwealth of Puerto Rico, General Obligation, “A”, 8%, 7/01/2035 (a)(d) | 5,930,000 | 4,655,050 | ||
| Commonwealth of Puerto Rico, Public Improvement, “A”, AGM, 5%, 7/01/2035 | 60,000 | 62,022 | ||
| Marin County, CA, Healthcare District (Election of 2013), “A”, 4%, 8/01/2047 | 3,000,000 | 3,398,445 | ||
| Puerto Rico Public Buildings Authority Government Facilities Rev., “M-2”, AAC, 10%, 7/01/2035 | 430,000 | 451,890 | ||
| State of California, General Obligation, 5%, 12/01/2031 | 1,500,000 | 2,053,764 | ||
| State of California, Various Purpose General Obligation, 5.25%, 4/01/2035 | 2,545,000 | 2,669,646 | ||
| State of California, Various Purpose General Obligation, 5%, 4/01/2045 | 7,000,000 | 8,698,131 | ||
| State of California, Various Purpose General Obligation Refunding, 5%, 12/01/2030 | 3,500,000 | 4,705,142 | ||
| State of California, Various Purpose General Obligation Refunding, 4%, 8/01/2037 | 1,700,000 | 1,982,058 | ||
| State of Illinois, General Obligation, 5.5%, 5/01/2039 | 440,000 | 541,323 | ||
| State of Illinois, General Obligation, 5.75%, 5/01/2045 | 410,000 | 510,018 | ||
| Tulare County, CA, Tulare Local Health Care District, BAM, 4%, 8/01/2039 | 1,500,000 | 1,743,406 | ||
| $ 34,002,617 | ||||
| General Obligations - Schools – 17.7% | ||||
| Beverly Hills, CA, Unified School District (Election of 2008), Capital Appreciation, 0%, 8/01/2029 | $ | 4,335,000 | $ 3,898,222 | |
| Contra Costa County, CA, Schools Pooled Cross Fiscal Year Tax and Rev., “A”, 2%, 12/01/2021 | 4,500,000 | 4,547,274 | ||
| Issuer | Shares/Par | Value ($) | ||
| Municipal Bonds – continued | ||||
| General Obligations - Schools – continued | ||||
| Downey, CA, Unified School District (Election of 2014), “B”, 4%, 8/01/2040 | $ | 2,785,000 | $ 3,228,574 | |
| Dublin, CA, Unified School District (Election of 2016), “B”, 4%, 8/01/2043 | 1,945,000 | 2,203,601 | ||
| Folsom Cordova, CA, Unified School District (Election of 2007), “D”, AGM, 4%, 10/01/2038 | 4,000,000 | 4,480,943 | ||
| Folsom Cordova, CA, Unified School District (Election of 2007), “D”, AGM, 4%, 10/01/2039 | 4,000,000 | 4,473,259 | ||
| Folsom Cordova, CA, Unified School District (Election of 2012), “A”, 5%, 10/01/2038 (Prerefunded 10/01/2023) | 2,465,000 | 2,761,886 | ||
| Garvey, CA, School District (Election of 2004), Capital Appreciation, AGM, 0%, 8/01/2031 | 2,120,000 | 1,727,512 | ||
| Grossmont, CA, Union High School District (Election of 2008), “I-2”, 4%, 8/01/2044 | 5,190,000 | 6,007,222 | ||
| Imperial County, CA, Community College District Rev., BAM, 4%, 8/01/2040 | 465,000 | 527,084 | ||
| Imperial County, CA, Community College District Rev., Capital Appreciation, “C”, BAM, 0%, 8/01/2034 | 500,000 | 330,246 | ||
| Kern County, CA, Sierra Sands Unified School District (Election of 2006), Capital Appreciation, AGM, 0%, 11/01/2033 | 1,260,000 | 905,198 | ||
| Lake Tahoe, CA, Unified School District (Election of 2008), Convertible Capital Appreciation, AGM, 0% to 8/01/2032, 6.375% to 8/01/2045 | 1,590,000 | 1,589,715 | ||
| Los Angeles County, CA, Mt. San Antonio Community College District (Election of 2018), “A”, 4%, 8/01/2049 | 875,000 | 1,012,244 | ||
| Los Angeles County, CA, Palmdale School District (Election of 2016), 4%, 8/01/2044 | 2,395,000 | 2,699,090 | ||
| Los Angeles, CA, Unified School District, General Obligation, “RYO”, 5%, 7/01/2035 | 3,000,000 | 3,919,341 | ||
| Marin County, CA, Community College District (Election of 2016), “B”, 4%, 8/01/2039 | 2,000,000 | 2,286,592 | ||
| Marin County, CA, Community College District (Election of 2016), “B”, 4%, 8/01/2040 | 1,000,000 | 1,141,325 | ||
| Marin County, CA, San Rafael City Elementary School District Rev., “B”, 4%, 8/01/2047 | 2,595,000 | 2,969,652 | ||
| Mendocino Lake, CA, Community College District Rev. (Election of 2006), Capital Appreciation, “B”, AGM, 0%, 8/01/2032 | 1,570,000 | 1,261,776 | ||
| Montebello, CA, Unified School District (Election of 2016), “A”, 4%, 8/01/2046 | 1,570,000 | 1,705,698 | ||
| Moorpark, CA, Unified School District (Election of 2008), Capital Appreciation, “A”, AGM, 0%, 8/01/2033 | 500,000 | 382,997 | ||
| Issuer | Shares/Par | Value ($) | ||
| General Obligations - Schools – continued | ||||
| Moreland, CA, School District (Election of 2002), Capital Appreciation, “B”, FGIC, 0%, 8/01/2028 | $ | 1,440,000 | $ 1,300,055 | |
| Mount Diablo, CA, Unified School District (Election of 2010), Convertible Capital Appreciation, “A”, AGM, 0% to 8/01/2019, 6% to 8/01/2030 | 3,000,000 | 3,301,910 | ||
| Mount San Antonio, CA, Community College District Rev. (Election of 2008), Convertible Capital Appreciation, “A”, 0% to 8/01/2028, 6.25% to 8/01/2043 | 5,000,000 | 5,496,294 | ||
| Napa Valley, CA, Unified School District (Election of 2006), Capital Appreciation, “A”, 0%, 8/01/2029 | 3,385,000 | 2,949,864 | ||
| Oakland, CA, Unified School District Rev., AGM, 5%, 8/01/2028 | 830,000 | 978,916 | ||
| Oakland, CA, Unified School District Rev., AGM, 5%, 8/01/2030 | 830,000 | 973,300 | ||
| Oakland, CA, Unified School District Rev. (Election of 2012), “A”, AGM, 4%, 8/01/2034 | 1,000,000 | 1,148,840 | ||
| Oakland, CA, Unified School District Rev. (Election of 2012), “A”, AGM, 4%, 8/01/2035 | 1,000,000 | 1,146,435 | ||
| Orange County, CA, Garden Grove Unified School District, 4%, 8/01/2046 | 3,000,000 | 3,459,244 | ||
| Oxnard, CA, School District (Ventura County), “A”, BAM, 5%, 8/01/2045 | 2,590,000 | 3,166,178 | ||
| Placer & Nevada Counties, CA, Tahoe-Trukee Unified School District (Election of 2014) (School Facilities Improvement District No. 1), “B”, 5%, 8/01/2033 | 500,000 | 606,480 | ||
| Placer & Nevada Counties, CA, Tahoe-Trukee Unified School District (Election of 2014) (School Facilities Improvement District No. 1), “B”, 5%, 8/01/2034 | 1,400,000 | 1,694,899 | ||
| Placer & Nevada Counties, CA, Tahoe-Trukee Unified School District (Election of 2014) (School Facilities Improvement District No. 1), “B”, 5%, 8/01/2035 | 1,105,000 | 1,335,204 | ||
| Placer and Sacramento Counties, CA, Roseville Joint Union High School District (School Facilities Improvement District No. 1), 4%, 8/01/2046 | 1,515,000 | 1,688,972 | ||
| San Bernardino, CA, City Unified School District, “A”, AGM, 5%, 8/01/2023 | 600,000 | 663,792 | ||
| San Diego, CA, Community College District (Election of 2002), Convertible Capital Appreciation, 6% to 8/01/2019, 6% to 8/01/2033 | 2,000,000 | 2,617,552 | ||
| San Diego, CA, Unified School District (Election of 2008), Capital Appreciation, “G”, 0%, 7/01/2034 (Prerefunded 1/01/2024) | 1,235,000 | 698,886 | ||
| San Diego, CA, Unified School District (Election of 2012), “I”, 4%, 7/01/2047 | 2,145,000 | 2,453,715 | ||
| San Jose, CA, Evergreen Community College District (Election of 2010), “A”, 5%, 8/01/2041 (Prerefunded 8/01/2022) | 1,235,000 | 1,315,281 | ||
| Issuer | Shares/Par | Value ($) | ||
| Municipal Bonds – continued | ||||
| General Obligations - Schools – continued | ||||
| San Mateo County, CA, Community College District (Election of 2001), Capital Appreciation, “A”, NPFG, 0%, 9/01/2021 | $ | 4,300,000 | $ 4,297,613 | |
| Santa Barbara and San Luis Obispo Counties, CA, Santa Maria-Bonita School District, 4%, 8/01/2042 | 1,000,000 | 1,131,169 | ||
| Santa Barbara and San Luis Obispo Counties, CA, Santa Maria-Bonita School District, 4%, 8/01/2044 | 1,250,000 | 1,408,711 | ||
| Santa Clara and Santa Cruz Counties, CA, West Valley-Mission Community College District (Election of 2018), “A”, 4%, 8/01/2044 | 2,650,000 | 3,084,974 | ||
| Santa Clara County, CA, Gilroy Unified School District, General Obligation, “2016”, 4%, 8/01/2025 | 100,000 | 115,232 | ||
| Santa Clara County, CA, Gilroy Unified School District, General Obligation, “2016”, 4%, 8/01/2026 | 125,000 | 147,490 | ||
| Santa Clara County, CA, Gilroy Unified School District, General Obligation, “2016”, 4%, 8/01/2027 | 275,000 | 330,852 | ||
| South Monterey County, CA, Joint Union High School District (Election of 2018), “A-1”, AGM, 4%, 8/01/2049 | 2,480,000 | 2,818,239 | ||
| Stanislaus County, CA, CERES Unified School District, Capital Appreciation, BAM, 0%, 8/01/2046 | 2,775,000 | 1,090,037 | ||
| Stanislaus County, CA, CERES Unified School District, Capital Appreciation, BAM, 0%, 8/01/2047 | 3,035,000 | 1,140,933 | ||
| Sweetwater, CA, Union High School District, “C”, 4%, 8/01/2043 | 2,000,000 | 2,195,655 | ||
| $ 108,816,173 | ||||
| Healthcare Revenue - Hospitals – 12.0% | ||||
| California Health Facilities Financing Authority Rev. (Children's Hospital Los Angeles), “A”, 5%, 8/15/2042 | $ | 2,550,000 | $ 2,980,363 | |
| California Health Facilities Financing Authority Rev. (City of Hope), 5%, 11/15/2049 | 4,000,000 | 4,752,278 | ||
| California Health Facilities Financing Authority Rev. (El Camino Hospital), 5%, 2/01/2037 | 1,000,000 | 1,185,813 | ||
| California Health Facilities Financing Authority Rev. (Marshall Medical Center), 5%, 11/01/2033 | 750,000 | 853,635 | ||
| California Health Facilities Financing Authority Rev. (Sutter Health), “A”, 5%, 11/15/2038 | 1,000,000 | 1,216,571 | ||
| California Health Facilities Financing Authority Rev. (Sutter Health), “A”, 5%, 11/15/2048 | 3,500,000 | 4,147,703 | ||
| Issuer | Shares/Par | Value ($) | ||
| Healthcare Revenue - Hospitals – continued | ||||
| California Health Facilities Financing Authority Rev. (Sutter Health), “B”, 5%, 11/15/2046 (Prerefunded 11/15/2026) | $ | 1,300,000 | $ 1,610,277 | |
| California Health Facilities Financing Authority Rev. (Sutter Health), “B”, 5%, 11/15/2046 | 1,880,000 | 2,191,942 | ||
| California Municipal Finance Authority Rev. (Community Health Centers of the Central Coast, Inc.), “A”, 5%, 12/01/2036 (n) | 175,000 | 198,149 | ||
| California Municipal Finance Authority Rev. (Community Health Centers of the Central Coast, Inc.), “A”, 5%, 12/01/2046 (n) | 750,000 | 822,683 | ||
| California Municipal Finance Authority Rev. (Community Medical Centers), “A”, 5%, 2/01/2036 | 1,275,000 | 1,481,002 | ||
| California Municipal Finance Authority Rev. (Community Medical Centers), “A”, 5%, 2/01/2037 | 850,000 | 984,896 | ||
| California Municipal Finance Authority Rev. (Community Medical Centers), “A”, 5%, 2/01/2042 | 425,000 | 487,719 | ||
| California Municipal Finance Authority Rev. (Eisenhower Medical Center), “A”, 5%, 7/01/2042 | 2,000,000 | 2,325,613 | ||
| California Municipal Finance Authority Rev. (Eisenhower Medical Center), “A”, 5%, 7/01/2047 | 1,000,000 | 1,154,857 | ||
| California Municipal Finance Authority Rev. (Eisenhower Medical Center), “B”, 4%, 7/01/2047 | 1,685,000 | 1,778,294 | ||
| California Municipal Finance Authority Rev. (NorthBay Healthcare Group), 5%, 11/01/2028 | 205,000 | 226,590 | ||
| California Municipal Finance Authority Rev. (NorthBay Healthcare Group), 5%, 11/01/2029 | 165,000 | 181,615 | ||
| California Municipal Finance Authority Rev. (NorthBay Healthcare Group), 5%, 11/01/2030 | 85,000 | 93,272 | ||
| California Municipal Finance Authority Rev. (NorthBay Healthcare Group), 5%, 11/01/2035 | 315,000 | 342,756 | ||
| California Municipal Finance Authority Rev. (NorthBay Healthcare Group), 5%, 11/01/2044 | 415,000 | 448,018 | ||
| California Municipal Finance Authority Rev. (NorthBay Healthcare Group), “A”, 5.25%, 11/01/2047 | 1,500,000 | 1,696,410 | ||
| California Public Finance Authority Rev. (Henry Mayo Newhall Hospital), 5%, 10/15/2047 | 2,545,000 | 2,875,482 | ||
| California Statewide Communities Development Authority Hospital Rev. (Methodist Hospital of Southern California), 5%, 1/01/2038 | 1,500,000 | 1,774,325 | ||
| Issuer | Shares/Par | Value ($) | ||
| Municipal Bonds – continued | ||||
| Healthcare Revenue - Hospitals – continued | ||||
| California Statewide Communities Development Authority Rev. (Adventist Health System/West), “A”, 5%, 3/01/2042 | $ | 4,000,000 | $ 4,804,080 | |
| California Statewide Communities Development Authority Rev. (Community Hospital of the Monterey Peninsula), “A”, 6%, 6/01/2033 (Prerefunded 6/01/2021) | 1,250,000 | 1,261,306 | ||
| California Statewide Communities Development Authority Rev. (Emante Health), “A”, 4%, 4/01/2039 | 1,600,000 | 1,851,200 | ||
| California Statewide Communities Development Authority Rev. (Emante Health), “A”, 4%, 4/01/2040 | 650,000 | 750,342 | ||
| California Statewide Communities Development Authority Rev. (Emante Health), “A”, 4%, 4/01/2045 | 2,000,000 | 2,277,297 | ||
| California Statewide Communities Development Authority Rev. (John Muir Health), “A”, 5%, 12/01/2053 | 1,000,000 | 1,172,731 | ||
| California Statewide Communities Development Authority Rev. (John Muir Health), “A”, 5%, 12/01/2057 | 2,000,000 | 2,342,315 | ||
| California Statewide Communities Development Authority Rev. (Loma Linda University Medical Center), “A”, 5%, 12/01/2046 (n) | 200,000 | 222,897 | ||
| California Statewide Communities Development Authority Rev. (Loma Linda University Medical Center), “A”, 5.5%, 12/01/2054 | 1,650,000 | 1,833,700 | ||
| California Statewide Communities Development Authority Rev. (Loma Linda University Medical Center), “A”, 5.25%, 12/01/2056 (n) | 1,000,000 | 1,119,926 | ||
| California Statewide Communities Development Authority Rev. (Loma Linda University Medical Center), “B”, 6%, 12/01/2024 | 2,150,000 | 2,400,473 | ||
| California Statewide Communities Development Authority Rev. (Marin General Hospital), “A”, 5%, 8/01/2036 | 635,000 | 751,636 | ||
| California Statewide Communities Development Authority Rev. (Marin General Hospital), “A”, 5%, 8/01/2037 | 455,000 | 537,143 | ||
| California Statewide Communities Development Authority Rev. (Marin General Hospital), “A”, 5%, 8/01/2038 | 430,000 | 506,469 | ||
| California Statewide Communities Development Authority Rev. (Redlands Community Hospital), 5%, 10/01/2046 | 1,925,000 | 2,190,621 | ||
| California Statewide Communities Development Authority Rev. (Sutter Health), “A”, 5%, 8/15/2032 (Prerefunded 8/15/2022) | 390,000 | 416,097 | ||
| Issuer | Shares/Par | Value ($) | ||
| Healthcare Revenue - Hospitals – continued | ||||
| California Statewide Communities Development Authority Rev. (Trinity Health Corp.), 5%, 12/01/2041 (Prerefunded 12/01/2021) | $ | 2,550,000 | $ 2,632,550 | |
| Doylestown, PA, Hospital Rev., “A”, 5%, 7/01/2049 | 70,000 | 78,158 | ||
| Palomar Health, CA, Refunding Rev., AGM, 5%, 11/01/2047 | 2,000,000 | 2,416,692 | ||
| San Buenaventura, CA, Rev. (Community Memorial Health System), 7.5%, 12/01/2041 | 1,000,000 | 1,037,270 | ||
| Tulare County, CA, Sierra View Local Health Care District Rev., 4%, 7/01/2021 | 225,000 | 226,772 | ||
| Tulare County, CA, Sierra View Local Health Care District Rev., 4%, 7/01/2022 | 230,000 | 239,228 | ||
| Tulare County, CA, Sierra View Local Health Care District Rev., 4%, 7/01/2023 | 260,000 | 278,091 | ||
| Tulare County, CA, Sierra View Local Health Care District Rev., 4%, 7/01/2024 | 235,000 | 257,277 | ||
| Tulare County, CA, Sierra View Local Health Care District Rev., 4%, 7/01/2025 | 290,000 | 323,833 | ||
| Tulare County, CA, Sierra View Local Health Care District Rev., 4%, 7/01/2026 | 300,000 | 340,997 | ||
| Tulare County, CA, Sierra View Local Health Care District Rev., 5%, 7/01/2028 | 665,000 | 826,135 | ||
| Tulare County, CA, Sierra View Local Health Care District Rev., 5%, 7/01/2029 | 635,000 | 801,580 | ||
| Upland, CA (San Antonio Regional Hospital), COP, 4%, 1/01/2042 | 1,000,000 | 1,067,798 | ||
| Upland, CA (San Antonio Regional Hospital), COP, 5%, 1/01/2047 | 1,000,000 | 1,124,886 | ||
| Washington Township, CA, Health Care District Rev., “A”, 5%, 7/01/2031 | 325,000 | 405,045 | ||
| Washington Township, CA, Health Care District Rev., “A”, 4%, 7/01/2033 | 550,000 | 626,392 | ||
| Washington Township, CA, Health Care District Rev., “A”, 5%, 7/01/2042 | 1,000,000 | 1,139,025 | ||
| $ 74,070,225 | ||||
| Healthcare Revenue - Long Term Care – 3.1% | ||||
| ABAG Finance Authority for Non-Profit Corps., CA, Rev. (Episcopal Senior Communities), 6.125%, 7/01/2041 | $ | 850,000 | $ 858,344 | |
| ABAG Finance Authority for Non-Profit Corps., CA, Rev. (Eskaton Properties, Inc.), 5%, 11/15/2035 | 1,270,000 | 1,339,186 | ||
| California Health Facilities Financing Authority Rev. (Northern California Presbyterian Homes and Services, Inc.), 5%, 7/01/2034 | 700,000 | 809,953 | ||
| California Health Facilities Financing Authority Rev. (Northern California Presbyterian Homes and Services, Inc.), 5%, 7/01/2039 | 1,000,000 | 1,147,918 | ||
| California Health Facilities Financing Authority Rev. (ON LOK Senior Health Services), 5%, 8/01/2040 | 650,000 | 795,320 | ||
| Issuer | Shares/Par | Value ($) | ||
| Municipal Bonds – continued | ||||
| Healthcare Revenue - Long Term Care – continued | ||||
| California Health Facilities Financing Authority Rev. (ON LOK Senior Health Services), 5%, 8/01/2050 | $ | 1,000,000 | $ 1,202,831 | |
| California Health Facilities Financing Authority Rev. (ON LOK Senior Health Services), 5%, 8/01/2055 | 1,000,000 | 1,193,636 | ||
| California Municipal Finance Authority Rev. (Channing House Project), “B”, 5%, 5/15/2047 | 2,000,000 | 2,365,322 | ||
| California Statewide Communities Development Authority Insured Rev. (Viamonte Senior Living 1 Project), “A”, 4%, 7/01/2038 | 435,000 | 497,235 | ||
| California Statewide Communities Development Authority Insured Rev. (Viamonte Senior Living 1 Project), “A”, 4%, 7/01/2039 | 430,000 | 490,364 | ||
| California Statewide Communities Development Authority Insured Rev. (Viamonte Senior Living 1 Project), “A”, 4%, 7/01/2040 | 435,000 | 492,857 | ||
| California Statewide Communities Development Authority Insured Rev. (Viamonte Senior Living 1 Project), “A”, 4%, 7/01/2043 | 980,000 | 1,102,667 | ||
| California Statewide Communities Development Authority Rev. (899 Charleston Project), “A”, 5.25%, 11/01/2044 (n) | 1,405,000 | 1,452,477 | ||
| California Statewide Communities Development Authority Rev. (Episcopal Communities & Services for Seniors Obligated Group), 5%, 5/15/2047 | 1,785,000 | 1,840,166 | ||
| California Statewide Communities Development Authority Rev. (Front Port Communities and Services), “A”, 4%, 4/01/2042 | 735,000 | 781,018 | ||
| California Statewide Communities Development Authority Rev. (Front Port Communities and Services), “A”, 5%, 4/01/2047 | 1,835,000 | 2,057,624 | ||
| California Statewide Communities Development Authority Rev. (Terraces at San Joaquin Gardens), “A”, 6%, 10/01/2042 (Prerefunded 10/01/2022) | 750,000 | 814,402 | ||
| $ 19,241,320 | ||||
| Industrial Revenue - Environmental Services – 1.1% | ||||
| California Municipal Finance Authority Solid Waste Disposal Rev. (Waste Management, Inc. Project), 0.2%, 10/01/2045 (Put Date 6/01/2021) | $ | 3,000,000 | $ 2,998,974 | |
| California Municipal Finance Authority, Solid Waste Disposal Rev. (Waste Management, Inc. Project), “A”, 2.4%, 10/01/2044 (Put Date 10/01/2029) | 3,000,000 | 3,259,623 | ||
| Issuer | Shares/Par | Value ($) | ||
| Industrial Revenue - Environmental Services – continued | ||||
| California Pollution Control Financing Authority, Solid Waste Disposal Rev. (CalPlant I Project), 7.5%, 12/01/2039 (a)(d) | $ | 2,000,000 | $ 610,000 | |
| $ 6,868,597 | ||||
| Industrial Revenue - Other – 0.4% | ||||
| Port Beaumont, TX, Navigation District Facility Rev. (Jefferson Gulf Coast Energy Project), “A”, 3.625%, 1/01/2035 (n) | $ | 500,000 | $ 510,958 | |
| Tuscaloosa County, AL, Industrial Development Authority, Gulf Opportunity Zone (Hunt Refining Project), “A”, 4.5%, 5/01/2032 (n) | 640,000 | 711,268 | ||
| Tuscaloosa County, AL, Industrial Development Authority, Gulf Opportunity Zone (Hunt Refining Project), “A”, 5.25%, 5/01/2044 (n) | 885,000 | 1,005,728 | ||
| $ 2,227,954 | ||||
| Miscellaneous Revenue - Other – 0.9% | ||||
| California Infrastructure & Economic Development Bank Rev. (Academy of Motion Picture Arts and Sciences Obligated Group), “A”, 5%, 11/01/2034 | $ | 830,000 | $ 925,619 | |
| California Infrastructure & Economic Development Bank Rev. (Academy of Motion Picture Arts and Sciences Obligated Group), “A”, 5%, 11/01/2035 | 830,000 | 924,714 | ||
| Long Beach, CA, Marina Rev. (Alamitos Bay Marina Project), 5%, 5/15/2031 | 1,335,000 | 1,501,188 | ||
| San Francisco, CA, City & County Airports Commission, International Airport Rev., Special Facilities Lease Rev. (SFO Fuel Co. LLC), 5%, 1/01/2040 | 1,510,000 | 1,831,019 | ||
| $ 5,182,540 | ||||
| Multi-Family Housing Revenue – 2.6% | ||||
| California Community Housing Agency, Essential Housing Rev. (Glendale Properties), “A-1”, 4%, 8/01/2047 (n) | $ | 3,000,000 | $ 3,102,521 | |
| California Housing Finance Agency Municipal Certificates, “A”, 4%, 3/20/2033 | 2,942,947 | 3,411,144 | ||
| California Statewide Communities Development Authority, Essential Housing Rev. (Jefferson-Anaheim), “A-2”, 3.125%, 8/01/2056 (n) | 3,000,000 | 2,769,293 | ||
| CSCDA Community Improvement Authority, California Essential Housing Rev. (Oceanaire-Long Beach), “A-2”, 4%, 9/01/2056 (n) | 3,000,000 | 3,164,544 | ||
| CSCDA Community Improvement Authority, California Essential Housing Rev. (Renaissance at City Center), “A”, 5%, 7/01/2051 (n) | 3,000,000 | 3,459,622 | ||
| $ 15,907,124 | ||||
| Issuer | Shares/Par | Value ($) | ||
| Municipal Bonds – continued | ||||
| Parking – 0.3% | ||||
| Stockton, CA, Public Financing Authority Parking Rev., 5%, 3/01/2047 | $ | 1,625,000 | $ 1,908,494 | |
| Port Revenue – 1.8% | ||||
| Alameda, CA, Corridor Transportation Authority Second Subordinate Lien Rev., “B”, AGM, 5%, 10/01/2036 | $ | 1,710,000 | $ 2,029,760 | |
| Port of Oakland, CA, Intermediate Lien Refunding Rev., “H”, 5%, 5/01/2028 | 1,250,000 | 1,555,968 | ||
| Port of Oakland, CA, Intermediate Lien Refunding Rev., “H”, 5%, 5/01/2029 | 3,875,000 | 4,895,947 | ||
| Port of Oakland, CA, Intermediate Lien Refunding Rev., “H”, 5%, 11/01/2029 | 2,125,000 | 2,705,268 | ||
| $ 11,186,943 | ||||
| Sales & Excise Tax Revenue – 2.4% | ||||
| Puerto Rico Sales Tax Financing Corp., Restructured Sales Tax Rev., “2019A-1”, 4.55%, 7/01/2040 | $ | 114,000 | $ 123,554 | |
| Puerto Rico Sales Tax Financing Corp., Restructured Sales Tax Rev., “2019A-1”, 5%, 7/01/2058 | 4,615,000 | 5,081,946 | ||
| Puerto Rico Sales Tax Financing Corp., Restructured Sales Tax Rev., “2019A-2”, 4.329%, 7/01/2040 | 1,100,000 | 1,176,692 | ||
| Puerto Rico Sales Tax Financing Corp., Restructured Sales Tax Rev., “2019A-2”, 4.329%, 7/01/2040 | 385,000 | 411,842 | ||
| Puerto Rico Sales Tax Financing Corp., Restructured Sales Tax Rev., “2019A-2”, 4.536%, 7/01/2053 | 9,000 | 9,650 | ||
| Puerto Rico Sales Tax Financing Corp., Restructured Sales Tax Rev., “2019A-2”, 4.784%, 7/01/2058 | 186,000 | 201,272 | ||
| Puerto Rico Sales Tax Financing Corp., Restructured Sales Tax Rev., Capital Appreciation, “2019A-1”, 0%, 7/01/2024 | 16,000 | 15,017 | ||
| Puerto Rico Sales Tax Financing Corp., Restructured Sales Tax Rev., Capital Appreciation, “2019A-1”, 0%, 7/01/2027 | 171,000 | 149,809 | ||
| Puerto Rico Sales Tax Financing Corp., Restructured Sales Tax Rev., Capital Appreciation, “2019A-1”, 0%, 7/01/2029 | 31,000 | 25,531 | ||
| Puerto Rico Sales Tax Financing Corp., Restructured Sales Tax Rev., Capital Appreciation, “2019A-1”, 0%, 7/01/2031 | 1,566,000 | 1,198,523 | ||
| Puerto Rico Sales Tax Financing Corp., Restructured Sales Tax Rev., Capital Appreciation, “2019A-1”, 0%, 7/01/2033 | 1,524,000 | 1,081,771 | ||
| Puerto Rico Sales Tax Financing Corp., Restructured Sales Tax Rev., Capital Appreciation, “2019A-1”, 0%, 7/01/2046 | 13,175,000 | 4,020,615 | ||
| Issuer | Shares/Par | Value ($) | ||
| Sales & Excise Tax Revenue – continued | ||||
| Wisconsin Public Finance Authority Limited Obligation Grant Rev. (American Dream at Meadowlands Project), “A”, 6.25%, 8/01/2027 (n) | $ | 745,000 | $ 809,588 | |
| Wisconsin Public Finance Authority Limited Obligation Grant Rev. (American Dream at Meadowlands Project), ”A“, 5.625%, 8/01/2024 (n) | 210,000 | 218,119 | ||
| $ 14,523,929 | ||||
| Secondary Schools – 3.8% | ||||
| California Infrastructure & Economic Development Bank Charter School Rev. (Alliance for College-Ready Public Schools), “B”, 5%, 11/01/2039 | $ | 300,000 | $ 366,160 | |
| California Infrastructure & Economic Development Bank Charter School Rev. (Alliance for College-Ready Public Schools), “B”, 5%, 11/01/2044 | 350,000 | 422,607 | ||
| California Infrastructure & Economic Development Bank Rev. (Colburn School), 1.75%, 8/01/2055 (Put Date 8/01/2026) | 1,000,000 | 1,015,009 | ||
| California Infrastructure and Economic Development Bank, 4%, 11/01/2050 | 500,000 | 572,895 | ||
| California Municipal Finance Authority Rev. (Partnerships to Uplift Communities Project), “A”, 5%, 8/01/2032 | 825,000 | 845,334 | ||
| California Municipal Finance Authority, Charter School Lease Rev. (Palmdale Aerospace Academy Project), “A”, 5%, 7/01/2038 (n) | 970,000 | 1,100,072 | ||
| California Municipal Finance Authority, Education Rev. (American Heritage Education Foundation Project), “A”, 5%, 6/01/2046 | 750,000 | 826,631 | ||
| California School Finance Authority, Charter School Rev. (Aspire Public Schools - Obligated Group), 5%, 8/01/2040 (n) | 415,000 | 466,863 | ||
| California School Finance Authority, Charter School Rev. (Aspire Public Schools - Obligated Group), 5%, 8/01/2041 (n) | 500,000 | 561,394 | ||
| California School Finance Authority, Charter School Rev. (Aspire Public Schools - Obligated Group), 5%, 8/01/2045 (n) | 415,000 | 463,730 | ||
| California School Finance Authority, Charter School Rev. (Aspire Public Schools - Obligated Group), “A”, 5%, 8/01/2040 (n) | 525,000 | 625,111 | ||
| California School Finance Authority, Charter School Rev. (Aspire Public Schools - Obligated Group), “A”, 5%, 8/01/2050 (n) | 1,000,000 | 1,175,653 | ||
| California School Finance Authority, Charter School Rev. (Downtown Prep), 5%, 6/01/2046 (n) | 1,000,000 | 1,074,547 | ||
| California School Finance Authority, Charter School Rev. (Social Bonds - Fenton Charter Public Schools Obligated Group), “A”, 5%, 7/01/2040 (n) | 1,125,000 | 1,254,815 | ||
| Issuer | Shares/Par | Value ($) | ||
| Municipal Bonds – continued | ||||
| Secondary Schools – continued | ||||
| California School Finance Authority, Charter School Rev. (Social Bonds - Fenton Charter Public Schools Obligated Group), “A”, 5%, 7/01/2058 (n) | $ | 625,000 | $ 685,915 | |
| California School Finance Authority, Educational Facilities Rev. (New Designs Charter School Adams Campus Project), “A”, 5%, 6/01/2030 (n) | 1,190,000 | 1,346,386 | ||
| California School Finance Authority, Educational Facilities Rev. (New Designs Charter School Adams Campus Project), “A”, 5%, 6/01/2040 (n) | 750,000 | 823,097 | ||
| California School Finance Authority, Educational Facilities Rev. (New Designs Charter School Adams Campus Project), “A”, 5%, 6/01/2050 (n) | 1,060,000 | 1,150,372 | ||
| California School Finance Authority, School Facility Rev. (Alliance for College-Ready Public Schools Projects), “A”, 5%, 7/01/2030 (n) | 1,245,000 | 1,421,609 | ||
| California School Finance Authority, School Facility Rev. (Green Dot Public Schools California Projects), “A”, 5%, 8/01/2038 (n) | 870,000 | 1,019,122 | ||
| California School Finance Authority, School Facility Rev. (Green Dot Public Schools California Projects), “A”, 5%, 8/01/2048 (n) | 870,000 | 999,449 | ||
| California School Finance Authority, School Facility Rev. (Kipp LA Projects), “A”, 5%, 7/01/2034 | 530,000 | 585,073 | ||
| California School Finance Authority, School Facility Rev. (Kipp LA Projects), “A”, 5%, 7/01/2037 (n) | 505,000 | 594,794 | ||
| California School Finance Authority, School Facility Rev. (Kipp LA Projects), “A”, 5.125%, 7/01/2044 | 470,000 | 515,538 | ||
| California School Finance Authority, School Facility Rev. (Kipp LA Projects), “A”, 5%, 7/01/2047 (n) | 745,000 | 863,183 | ||
| California School Finance Authority, School Facility Rev. (Kipp SoCal), “A”, 5%, 7/01/2049 (n) | 1,050,000 | 1,263,587 | ||
| California Statewide Communities Development Authority, School Facility Rev. (Alliance for College-Ready Public Schools), “A”, 6.375%, 7/01/2047 | 1,270,000 | 1,281,533 | ||
| $ 23,320,479 | ||||
| Single Family Housing - State – 1.1% | ||||
| Maryland Community Development Administration, Department of Housing & Community Development Housing Rev., “A”, 4.25%, 9/01/2049 | $ | 2,250,000 | $ 2,515,113 | |
| Tennessee Housing Development Agency, Residential Finance Program Rev., “1”, 4.25%, 1/01/2050 | 2,380,000 | 2,642,253 | ||
| Issuer | Shares/Par | Value ($) | ||
| Single Family Housing - State – continued | ||||
| Texas Department of Housing & Community Affairs Residential Mortgage Rev., “A”, FNMA, 4.75%, 1/01/2049 | $ | 1,520,000 | $ 1,709,390 | |
| $ 6,866,756 | ||||
| State & Local Agencies – 4.3% | ||||
| California Infrastructure & Economic Development Bank Lease Rev. (California State Teachers' Retirement System Headquarters Expansion Green Bonds - Climate Bond Certified), 5%, 8/01/2044 | $ | 1,500,000 | $ 1,845,760 | |
| California Municipal Finance Authority, Lease Rev. (Orange County Civic Center Infrastructure Improvement Program - Phase II), “A”, 5%, 6/01/2043 | 4,505,000 | 5,484,866 | ||
| California Public Works Board Lease Rev. (Judicial Council Projects), “A”, 5%, 3/01/2028 | 2,120,000 | 2,304,108 | ||
| California Public Works Board Lease Rev. (Various Capital Projects), “A”, 5%, 8/01/2029 (w) | 3,000,000 | 3,687,808 | ||
| Delaware Valley, PA, Regional Finance Authority, “C”, FLR, 0.878% (LIBOR - 3mo. + 0.75%), 6/01/2037 | 2,360,000 | 2,313,289 | ||
| Fresno, CA, Joint Powers Financing Authority Rev., Lease Revenue Refunding Rev. (Master Lease Projects), “A”, AGM, 5%, 4/01/2034 | 1,000,000 | 1,195,904 | ||
| Fresno, CA, Joint Powers Financing Authority Rev., Lease Revenue Refunding Rev. (Master Lease Projects), “A”, AGM, 5%, 4/01/2037 | 800,000 | 950,306 | ||
| Los Angeles, CA, Tax and Rev. Anticipation Notes, 4%, 6/24/2021 | 4,000,000 | 4,035,854 | ||
| New Jersey Economic Development Authority Rev. (School Facilities Construction), “AAA”, 5%, 6/15/2026 | 540,000 | 648,433 | ||
| Ontario Public Finance Authority Lease Rev., AGM, 5%, 11/01/2042 | 1,025,000 | 1,270,912 | ||
| Sacramento, CA, City Financing Authority Rev. (Master Lease Program Facilities), BAM, 5%, 12/01/2030 | 500,000 | 596,012 | ||
| Sacramento, CA, City Financing Authority Rev. (Master Lease Program Facilities), BAM, 5%, 12/01/2031 | 1,000,000 | 1,187,487 | ||
| Sacramento, CA, City Financing Authority Rev. (Master Lease Program Facilities), BAM, 5%, 12/01/2032 | 550,000 | 652,288 | ||
| $ 26,173,027 | ||||
| Student Loan Revenue – 0.1% | ||||
| Minnesota Office of Higher Education Supplemental Student Loan Program Rev., 2.65%, 11/01/2038 | $ | 425,000 | $ 420,869 | |
| Tax - Other – 0.8% | ||||
| Guam Government Ltd. Obligation Rev., “A”, 5%, 12/01/2035 | $ | 315,000 | $ 357,274 | |
| Issuer | Shares/Par | Value ($) | ||
| Municipal Bonds – continued | ||||
| Tax - Other – continued | ||||
| Guam Government Ltd. Obligation Rev., “A”, 5%, 12/01/2036 | $ | 170,000 | $ 192,354 | |
| Guam Government Ltd. Obligation Rev., “A”, 5%, 12/01/2046 | 500,000 | 556,556 | ||
| Puerto Rico Convention Center District Authority, Hotel Occupancy Tax Rev., “A”, AAC, 5%, 7/01/2031 | 635,000 | 649,708 | ||
| Puerto Rico Infrastructure Financing Authority Special Tax Rev., “C”, AAC, 5.5%, 7/01/2024 | 665,000 | 715,871 | ||
| Puerto Rico Infrastructure Financing Authority Special Tax Rev., “C”, AAC, 5.5%, 7/01/2026 | 2,010,000 | 2,210,535 | ||
| Wisconsin Public Finance Authority Limited Obligation PILOT Rev. (American Dream at Meadowlands Project), 6.5%, 12/01/2037 (n) | 100,000 | 113,974 | ||
| Wisconsin Public Finance Authority Limited Obligation PILOT Rev. (American Dream at Meadowlands Project), 7%, 12/01/2050 | 305,000 | 352,202 | ||
| $ 5,148,474 | ||||
| Tax Assessment – 5.7% | ||||
| California Statewide Communities Development Authority Rev. (Infrastructure Program), “B”, 5%, 9/02/2039 | $ | 1,000,000 | $ 1,188,605 | |
| California Statewide Communities Development Authority Rev. (Infrastructure Program), “B”, 5%, 9/02/2044 | 1,000,000 | 1,174,035 | ||
| California Statewide Communities Development Authority Rev., “A”, 5%, 9/02/2048 | 940,000 | 1,104,407 | ||
| California Statewide Communities Development Authority, Statewide Community Infrastructure Program Rev., “C”, 4%, 9/02/2040 | 2,000,000 | 2,214,278 | ||
| California Statewide Communities Development Authority, Statewide Community Infrastructure Program Rev., “C”, 5%, 9/02/2044 | 500,000 | 587,018 | ||
| California Statewide Communities Development Authority, Statewide Community Infrastructure Program Rev., “C”, 5%, 9/02/2049 | 500,000 | 583,514 | ||
| California Statewide Communities Development Infrastructure Program, “B”, 4%, 9/02/2050 | 1,000,000 | 1,088,009 | ||
| Huntington Beach, CA, Community Facilities District Special Tax (Grand Coast Resort), 5.125%, 9/01/2031 | 1,000,000 | 1,085,120 | ||
| Jurupa, CA, Community Facilities Services District, Special Tax (Eastvale Area District No. 31), “A”, 5%, 9/01/2037 | 1,000,000 | 1,051,006 | ||
| Jurupa, CA, Public Financing Authority, Special Tax Refunding Rev., “A”, AGM, 4%, 9/01/2043 | 1,745,000 | 1,952,060 | ||
| Issuer | Shares/Par | Value ($) | ||
| Tax Assessment – continued | ||||
| Lake Elsinore, CA, Public Financing Authority Rev., 5%, 9/01/2035 | $ | 920,000 | $ 1,037,376 | |
| Lee Lake, CA, Public Financing Authority, Senior Lien Rev., “A”, 5.125%, 9/01/2035 | 1,000,000 | 1,089,479 | ||
| Los Angeles County, CA, Redevelopment Refunding Authority Tax Allocation Rev., “D”, AGM, 5%, 9/01/2022 | 340,000 | 361,352 | ||
| Los Angeles County, CA, Redevelopment Refunding Authority Tax Allocation Rev., “D”, AGM, 5%, 9/01/2023 | 340,000 | 376,396 | ||
| North Natomas, CA, Community Facilities District Special Tax, “4-E”, 5.25%, 9/01/2033 | 840,000 | 919,167 | ||
| Pittsburg, CA, Redevelopment Successor Agency, Tax Allocation (Los Medanos Community Development Project), AGM, 5%, 8/01/2028 | 650,000 | 734,032 | ||
| Pittsburg, CA, Redevelopment Successor Agency, Tax Allocation (Los Medanos Community Development Project), AGM, 5%, 8/01/2029 | 1,350,000 | 1,522,681 | ||
| Rancho Cucamonga, CA, Community Facilities District Special Tax, 5.25%, 9/01/2033 | 1,000,000 | 1,083,074 | ||
| Rancho Cucamonga, CA, Redevelopment Agency, Tax Allocation Refunding (Successor Agency to the Rancho Redevelopment Project Area), AGM, 5%, 9/01/2032 | 2,625,000 | 2,966,777 | ||
| Riverside County, CA, Jurupa Valley Redevelopment Project Rev., “B”, AGM, 5%, 10/01/2030 | 890,000 | 1,039,555 | ||
| Riverside County, CA, Jurupa Valley Redevelopment Project Rev., “B”, AGM, 5%, 10/01/2031 | 1,095,000 | 1,276,692 | ||
| Riverside County, CA, Redevelopment Agency, Tax Allocation, “A”, AGM, 5%, 10/01/2034 | 1,385,000 | 1,566,493 | ||
| San Francisco, CA, City & County Redevelopment Successor Agency, Tax Allocation (Mission Bay South Redevelopment Project), “A”, 5%, 8/01/2043 | 750,000 | 828,890 | ||
| San Francisco, CA, City & County Redevelopment Successor Agency, Tax Allocation (Mission Bay South Redevelopment Project), “B”, NPFG, 5%, 8/01/2043 | 1,100,000 | 1,252,812 | ||
| Santa Cruz County, CA, Redevelopment Agency Tax Allocation Rev., 5%, 9/01/2023 | 1,000,000 | 1,108,575 | ||
| Transbay Joint Powers Authority, CA, Senior Tax Allocation, “A”, 5%, 10/01/2034 | 1,200,000 | 1,513,199 | ||
| Transbay Joint Powers Authority, CA, Senior Tax Allocation, “A”, 5%, 10/01/2036 | 1,600,000 | 2,004,456 | ||
| Transbay Joint Powers Authority, CA, Senior Tax Allocation, “A”, 5%, 10/01/2037 | 700,000 | 874,102 | ||
| Transbay Joint Powers Authority, CA, Senior Tax Allocation, “B”, 5%, 10/01/2033 | 300,000 | 361,273 | ||
| Issuer | Shares/Par | Value ($) | ||
| Municipal Bonds – continued | ||||
| Tax Assessment – continued | ||||
| Transbay Joint Powers Authority, CA, Senior Tax Allocation, “B”, 5%, 10/01/2034 | $ | 300,000 | $ 360,129 | |
| Transbay Joint Powers Authority, CA, Senior Tax Allocation, “B”, 5%, 10/01/2035 | 250,000 | 299,228 | ||
| Transbay Joint Powers Authority, CA, Senior Tax Allocation, “B”, 5%, 10/01/2038 | 600,000 | 711,245 | ||
| $ 35,315,035 | ||||
| Tobacco – 4.7% | ||||
| Buckeye, OH, Tobacco Settlement Financing Authority Senior Asset-Backed Refunding, 2020A-2, “1”, 5%, 6/01/2036 | $ | 370,000 | $ 463,390 | |
| Buckeye, OH, Tobacco Settlement Financing Authority Senior Asset-Backed Refunding, 2020B-3, Capital Appreciation, “2”, 0%, 6/01/2057 | 7,375,000 | 1,115,165 | ||
| California County Tobacco Securitization Agency Settlement (Los Angeles County Securitization Corp.), “A”, 4%, 6/01/2049 | 1,500,000 | 1,721,415 | ||
| California County Tobacco Securitization Agency Settlement (Los Angeles County Securitization Corp.), “A”, 5%, 6/01/2049 | 1,000,000 | 1,209,156 | ||
| California County Tobacco Securitization Agency Settlement (Sonoma County Securitization Corp.), “A”, 4%, 6/01/2049 | 1,000,000 | 1,154,849 | ||
| California County Tobacco Securitization Agency Settlement (Sonoma County Securitization Corp.), “B-1”, 1.375%, 6/01/2030 | 250,000 | 250,929 | ||
| California County Tobacco Securitization Agency Settlement (Sonoma County Securitization Corp.), “B-1”, 5%, 6/01/2049 | 750,000 | 914,684 | ||
| California County Tobacco Securitization Agency Settlement (Sonoma County Securitization Corp.), Capital Appreciation, “B-2”, 0%, 6/01/2055 | 10,000,000 | 2,417,235 | ||
| California County Tobacco Securitization Agency Settlement (Gold Country Settlement Funding Corp.), “A”, 4%, 6/01/2049 | 1,000,000 | 1,158,618 | ||
| California County Tobacco Securitization Agency Settlement (Gold Country Settlement Funding Corp.), “B-1”, 1.1%, 6/01/2030 | 200,000 | 200,131 | ||
| California County Tobacco Securitization Agency Settlement (Gold Country Settlement Funding Corp.), “B-1”, 4%, 6/01/2049 | 325,000 | 361,341 | ||
| California County Tobacco Securitization Agency Settlement (Gold Country Settlement Funding Corp.), Capital Appreciation, “B-2”, 0%, 6/01/2055 | 5,000,000 | 1,270,052 | ||
| Golden State, CA, Tobacco Securitization Corp., Tobacco Settlement Rev., “A-1”, 5%, 6/01/2029 | 2,000,000 | 2,424,571 | ||
| Illinois Railsplitter Tobacco Settlement Authority Rev., 6%, 6/01/2028 (Prerefunded 6/01/2021) | 1,800,000 | 1,816,483 | ||
| Issuer | Shares/Par | Value ($) | ||
| Tobacco – continued | ||||
| Sacramento County, CA, Tobacco Securitization Corp. Authority, “2021A-1”, 0.45%, 6/01/2030 | $ | 750,000 | $ 739,215 | |
| Sacramento County, CA, Tobacco Securitization Corp. Authority, “2021A-1”, 4%, 6/01/2049 | 2,500,000 | 2,882,424 | ||
| Sacramento County, CA, Tobacco Securitization Corp. Authority, “2021A-1”, 4%, 6/01/2049 | 1,000,000 | 1,127,031 | ||
| Tobacco Securitization Authority of Southern California (San Diego County Tobacco Asset Securitization Corp.), “A”, 5%, 6/01/2036 | 250,000 | 317,862 | ||
| Tobacco Securitization Authority of Southern California (San Diego County Tobacco Asset Securitization Corp.), “A”, 5%, 6/01/2037 | 1,000,000 | 1,267,011 | ||
| Tobacco Securitization Authority of Southern California (San Diego County Tobacco Asset Securitization Corp.), “A”, 5%, 6/01/2038 | 750,000 | 947,480 | ||
| Tobacco Securitization Authority of Southern California (San Diego County Tobacco Asset Securitization Corp.), “A”, 5%, 6/01/2048 | 4,250,000 | 5,198,106 | ||
| $ 28,957,148 | ||||
| Toll Roads – 2.0% | ||||
| Bay Area Toll Authority, California Toll Bridge Rev., “A”, 2%, 4/01/2056 (Put Date 4/01/2028) | $ | 4,000,000 | $ 4,258,185 | |
| Bay Area Toll Authority, California Toll Bridge Rev., “S-7”, 4%, 4/01/2033 | 2,985,000 | 3,467,101 | ||
| Bay Area Toll Authority, California Toll Bridge Rev., “S-7”, 4%, 4/01/2034 | 855,000 | 990,755 | ||
| California Foothill/Eastern Transportation Corridor Agency, Toll Road Rev., “C”, 5%, 1/15/2027 | 200,000 | 243,676 | ||
| California Foothill/Eastern Transportation Corridor Agency, Toll Road Rev., “C”, 5%, 1/15/2028 | 200,000 | 248,011 | ||
| California Foothill/Eastern Transportation Corridor Agency, Toll Road Rev., “C”, 5%, 1/15/2031 | 300,000 | 387,908 | ||
| California Foothill/Eastern Transportation Corridor Agency, Toll Road Rev., “C”, 4%, 1/15/2032 | 350,000 | 417,740 | ||
| California Foothill/Eastern Transportation Corridor Agency, Toll Road Rev., “C”, 4%, 1/15/2033 | 250,000 | 296,751 | ||
| Riverside County, CA, Transportation Commission, Toll Rev., “A”, 5.75%, 6/01/2044 | 1,680,000 | 1,829,138 | ||
| $ 12,139,265 | ||||
| Transportation - Special Tax – 1.9% | ||||
| Commonwealth of Puerto Rico Highway & Transportation Authority Rev., “D”, AGM, 5%, 7/01/2032 | $ | 470,000 | $ 485,231 | |
| Issuer | Shares/Par | Value ($) | ||
| Municipal Bonds – continued | ||||
| Transportation - Special Tax – continued | ||||
| Commonwealth of Puerto Rico Highway & Transportation Authority Rev., “J”, NPFG, 5%, 7/01/2029 | $ | 65,000 | $ 66,656 | |
| Commonwealth of Puerto Rico Highway & Transportation Authority Rev., “L”, AAC, 5.25%, 7/01/2038 | 2,060,000 | 2,318,941 | ||
| Commonwealth of Puerto Rico Highway & Transportation Authority Rev., “N”, AAC, 5.25%, 7/01/2030 | 225,000 | 247,027 | ||
| Commonwealth of Puerto Rico Highway & Transportation Authority Rev., “N”, AAC, 5.25%, 7/01/2031 | 1,530,000 | 1,685,939 | ||
| Commonwealth of Puerto Rico Highway & Transportation Authority Rev., “N”, NPFG, 5.25%, 7/01/2032 | 285,000 | 316,102 | ||
| Commonwealth of Puerto Rico Highway & Transportation Authority Rev., “N”, NPFG, 5.25%, 7/01/2033 | 195,000 | 216,073 | ||
| Commonwealth of Puerto Rico Highway & Transportation Authority Rev., Unrefunded Balance, “A”, NPFG, 5%, 7/01/2038 | 75,000 | 76,911 | ||
| Lancaster, CA, Financing Authority Rev. (Measure M&R Structure Improvement Project), BAM, 4%, 6/01/2039 | 1,365,000 | 1,588,298 | ||
| Metropolitan Transportation Authority Rev., NY, Anticipation Note, “B-2”, 5%, 5/15/2021 | 1,915,000 | 1,924,200 | ||
| Metropolitan Transportation Authority Rev., NY, Anticipation Note, “D-1”, 5%, 9/01/2022 | 1,400,000 | 1,483,604 | ||
| New Jersey Transportation Trust Fund Authority, Transportation System, “A”, 5%, 12/15/2039 | 500,000 | 605,363 | ||
| New Jersey Transportation Trust Fund Authority, Transportation System, “BB”, 5%, 6/15/2044 | 500,000 | 594,614 | ||
| $ 11,608,959 | ||||
| Universities - Colleges – 6.1% | ||||
| California Educational Facilities Authority Rev. (Art Center College of Design), “A”, 5%, 12/01/2036 | $ | 2,060,000 | $ 2,486,504 | |
| California Educational Facilities Authority Rev. (Chapman University), “B”, 4%, 4/01/2047 | 1,000,000 | 1,118,560 | ||
| California Educational Facilities Authority Rev. (Loma Linda University), “A”, 5%, 4/01/2036 | 425,000 | 504,275 | ||
| California Educational Facilities Authority Rev. (Loma Linda University), “A”, 5%, 4/01/2037 | 1,265,000 | 1,497,132 | ||
| California Educational Facilities Authority Rev. (Loyola Marymount University), “B”, 5%, 10/01/2038 | 630,000 | 772,799 | ||
| California Educational Facilities Authority Rev. (University of Redlands), “A”, 5%, 10/01/2036 | 1,000,000 | 1,165,845 | ||
| Issuer | Shares/Par | Value ($) | ||
| Universities - Colleges – continued | ||||
| California Educational Facilities Authority Rev. (University of Redlands), “A”, 5%, 10/01/2037 | $ | 1,000,000 | $ 1,163,574 | |
| California Educational Facilities Authority Rev. (University of Redlands), “A”, 5%, 10/01/2038 | 500,000 | 580,770 | ||
| California Educational Facilities Authority Rev. (University of San Francisco), 6.125%, 10/01/2030 (Prerefunded 10/01/2021) | 860,000 | 884,757 | ||
| California Educational Facilities Authority Rev. (University of San Francisco), 6.125%, 10/01/2030 (Prerefunded 10/01/2021) | 900,000 | 926,134 | ||
| California Educational Facilities Authority Rev. (University of San Francisco), “A”, 5%, 10/01/2038 | 1,000,000 | 1,226,665 | ||
| California Municipal Finance Authority Rev. (Biola University), 5%, 10/01/2033 | 625,000 | 743,423 | ||
| California Municipal Finance Authority Rev. (Biola University), 5%, 10/01/2035 | 1,195,000 | 1,415,631 | ||
| California Municipal Finance Authority Rev. (Biola University), 5%, 10/01/2039 | 1,000,000 | 1,173,001 | ||
| California Municipal Finance Authority Rev. (Emerson College), “B”, 5%, 1/01/2042 | 4,310,000 | 5,051,503 | ||
| California Municipal Finance Authority Rev. (University of La Verne), “A”, 5%, 6/01/2043 | 1,500,000 | 1,795,651 | ||
| California Municipal Finance Authority Rev. (University of The Pacific), “A”, 5%, 11/01/2029 (w) | 500,000 | 632,080 | ||
| California Municipal Finance Authority Rev. (University of The Pacific), “A”, 5%, 11/01/2030 (w) | 520,000 | 665,981 | ||
| California Municipal Finance Authority Rev. (University of The Pacific), “A”, 4%, 11/01/2042 (w) | 1,600,000 | 1,799,733 | ||
| California Municipal Finance Authority Rev. (William Jessup University), 5%, 8/01/2039 | 500,000 | 551,820 | ||
| California Municipal Finance Authority Rev. (William Jessup University), 5%, 8/01/2048 | 2,500,000 | 2,712,197 | ||
| California Public Works Board Lease Rev. (Regents of the University of California), “G”, 5%, 12/01/2028 (Prerefunded 12/01/2021) | 2,125,000 | 2,193,791 | ||
| California State University Rev., “A”, 5%, 11/01/2024 (Prerefunded 11/01/2021) | 550,000 | 565,380 | ||
| California State University Rev., “A”, 5%, 11/01/2024 (Prerefunded 11/01/2021) | 1,580,000 | 1,624,648 | ||
| University of California, Limited Project Rev., “S”, 5%, 5/15/2025 (w) | 2,000,000 | 2,255,965 | ||
| University of California, Limited Project Rev., “S”, 5%, 5/15/2026 (w) | 2,000,000 | 2,321,348 | ||
| $ 37,829,167 | ||||
| Issuer | Shares/Par | Value ($) | ||
| Municipal Bonds – continued | ||||
| Universities - Dormitories – 3.8% | ||||
| California Enterprise Development Authority, Student Housing Rev. (Provident Group - SDSU Properties LLC - M@College Project), “A”, 5%, 8/01/2035 | $ | 450,000 | $ 556,945 | |
| California Enterprise Development Authority, Student Housing Rev. (Provident Group - SDSU Properties LLC - M@College Project), “A”, 5%, 8/01/2040 | 600,000 | 732,396 | ||
| California Enterprise Development Authority, Student Housing Rev. (Provident Group - SDSU Properties LLC - M@College Project), “A”, 5%, 8/01/2045 | 600,000 | 722,365 | ||
| California Enterprise Development Authority, Student Housing Rev. (Provident Group - SDSU Properties LLC - M@College Project), “A”, 5%, 8/01/2050 | 650,000 | 779,575 | ||
| California Enterprise Development Authority, Student Housing Rev. (Provident Group - SDSU Properties LLC - M@College Project), “A”, 5%, 8/01/2055 | 825,000 | 981,929 | ||
| California Enterprise Development Authority, Student Housing Rev. (Provident Group - SDSU Properties LLC - M@College Project), “A”, 5%, 8/01/2057 | 450,000 | 533,558 | ||
| California Municipal Finance Authority, Student Housing Rev. (Bowles Hall Foundation), “A”, 5%, 6/01/2035 | 225,000 | 245,669 | ||
| California Municipal Finance Authority, Student Housing Rev. (CHF-Davis I LLC - West Village Student Housing Project), 5%, 5/15/2037 | 2,605,000 | 3,101,473 | ||
| California Municipal Finance Authority, Student Housing Rev. (CHF-Davis I LLC - West Village Student Housing Project), BAM, 5%, 5/15/2051 | 3,065,000 | 3,646,701 | ||
| California Statewide Communities Development Authority Rev. (Lancer Educational Student Housing Project), “A”, 5%, 6/01/2034 (n) | 375,000 | 432,110 | ||
| California Statewide Communities Development Authority Rev. (Lancer Educational Student Housing Project), “A”, 5%, 6/01/2039 (n) | 475,000 | 539,945 | ||
| California Statewide Communities Development Authority Rev. (Lancer Educational Student Housing Project), “A”, 5%, 6/01/2051 (n) | 1,440,000 | 1,606,097 | ||
| California Statewide Communities Development Authority Rev. (Lancer Plaza Project), 5.875%, 11/01/2043 | 1,500,000 | 1,612,121 | ||
| California Statewide Communities Development Authority Rev. (University of California, Irvine East Campus Apartments), 5%, 5/15/2034 | 1,000,000 | 1,150,295 | ||
| Issuer | Shares/Par | Value ($) | ||
| Universities - Dormitories – continued | ||||
| California Statewide Communities Development Authority, College Housing Rev. (NCCD-Hooper Street LLC College of the Arts Project), 5.25%, 7/01/2039 (n) | $ | 1,740,000 | $ 1,803,383 | |
| Hastings Campus Housing Finance Authority Rev., Convertible Capital Appreciation, “B”, 0% to 7/01/2035, 6.75% to 7/01/2061 (n) | 3,250,000 | 1,741,413 | ||
| San Francisco, CA, Hastings Campus Housing Finance Authority, Campus Housing Rev., “A”, 5%, 7/01/2045 (n) | 3,000,000 | 3,433,960 | ||
| $ 23,619,935 | ||||
| Utilities - Cogeneration – 0.7% | ||||
| California Pollution Control Financing Authority, Water Furnishing Refunding Rev. (San Diego County Water Authority Desalination Project Pipeline), 5%, 7/01/2039 (n) | $ | 1,000,000 | $ 1,200,577 | |
| California Pollution Control Financing Authority, Water Furnishing Refunding Rev. (San Diego County Water Authority Desalination Project Pipeline), 5%, 11/21/2045 (n) | 1,610,000 | 1,907,729 | ||
| Puerto Rico Industrial, Tourist, Educational, Medical & Environmental Control Facilities Financing Authority Rev. (Cogeneration Facilities - AES Puerto Rico Project), 9.12%, 6/01/2022 | 1,300,000 | 1,332,500 | ||
| $ 4,440,806 | ||||
| Utilities - Municipal Owned – 4.8% | ||||
| Guam Power Authority Rev., “A”, AGM, 5%, 10/01/2039 | $ | 280,000 | $ 310,557 | |
| Guam Power Authority Rev., “A”, AGM, 5%, 10/01/2044 | 315,000 | 347,955 | ||
| Los Angeles, CA, Department of Water & Power Water System Rev., “A”, 5%, 7/01/2022 | 10,845,000 | 10,971,352 | ||
| Los Angeles, CA, Department of Water & Power Water System Rev., “A”, 5%, 7/01/2041 | 3,000,000 | 3,537,439 | ||
| Puerto Rico Electric Power Authority Rev., “A”, 5%, 7/01/2029 (a)(d) | 1,200,000 | 1,086,000 | ||
| Puerto Rico Electric Power Authority Rev., “A”, 5%, 7/01/2042 (a)(d) | 180,000 | 162,900 | ||
| Puerto Rico Electric Power Authority Rev., “AAA”, 5.25%, 7/01/2021 (a)(d) | 100,000 | 90,750 | ||
| Puerto Rico Electric Power Authority Rev., “AAA”, 5.25%, 7/01/2030 (a)(d) | 50,000 | 45,375 | ||
| Puerto Rico Electric Power Authority Rev., “CCC”, 5.25%, 7/01/2027 (a)(d) | 455,000 | 412,912 | ||
| Puerto Rico Electric Power Authority Rev., “DDD”, 5%, 7/01/2020 (a)(d) | 50,000 | 45,125 | ||
| Puerto Rico Electric Power Authority Rev., “DDD”, 5%, 7/01/2021 (a)(d) | 475,000 | 429,875 | ||
| Issuer | Shares/Par | Value ($) | ||
| Municipal Bonds – continued | ||||
| Utilities - Municipal Owned – continued | ||||
| Puerto Rico Electric Power Authority Rev., “DDD”, 5%, 7/01/2022 (a)(d) | $ | 765,000 | $ 692,325 | |
| Puerto Rico Electric Power Authority Rev., “DDD”, AGM, 3.625%, 7/01/2023 | 10,000 | 10,018 | ||
| Puerto Rico Electric Power Authority Rev., “EEE”, 6.05%, 7/01/2032 (a)(d) | 280,000 | 248,150 | ||
| Puerto Rico Electric Power Authority Rev., “RR”, NPFG, 5%, 7/01/2022 | 1,315,000 | 1,333,276 | ||
| Puerto Rico Electric Power Authority Rev., “TT”, 5%, 7/01/2021 (a)(d) | 235,000 | 212,675 | ||
| Puerto Rico Electric Power Authority Rev., “TT”, 5%, 7/01/2023 (a)(d) | 200,000 | 181,000 | ||
| Puerto Rico Electric Power Authority Rev., “TT”, 5%, 7/01/2027 (a)(d) | 40,000 | 36,200 | ||
| Puerto Rico Electric Power Authority Rev., “TT”, 5%, 7/01/2037 (a)(d) | 620,000 | 561,100 | ||
| Puerto Rico Electric Power Authority Rev., “V”, NPFG, 5.25%, 7/01/2033 | 260,000 | 288,097 | ||
| Puerto Rico Electric Power Authority Rev., “VV”, NPFG, 5.25%, 7/01/2034 | 55,000 | 60,854 | ||
| Puerto Rico Electric Power Authority Rev., “WW”, 5.375%, 7/01/2022 (a)(d) | 45,000 | 40,894 | ||
| Puerto Rico Electric Power Authority Rev., “WW”, 5.25%, 7/01/2025 (a)(d) | 95,000 | 86,213 | ||
| Puerto Rico Electric Power Authority Rev., “ZZ”, 5%, 7/01/2018 (a)(d) | 290,000 | 258,462 | ||
| Puerto Rico Electric Power Authority Rev., “ZZ”, 5.25%, 7/01/2023 (a)(d) | 325,000 | 294,937 | ||
| Puerto Rico Electric Power Authority Rev., “ZZ”, 5.25%, 7/01/2024 (a)(d) | 115,000 | 104,363 | ||
| Puerto Rico Electric Power Authority Rev., “ZZ”, 5.25%, 7/01/2026 (a)(d) | 355,000 | 322,162 | ||
| Sacramento, CA, Municipal Utility District Electric Rev., “X”, 5%, 8/15/2025 (Prerefunded 8/15/2021) | 545,000 | 554,518 | ||
| Sacramento, CA, Municipal Utility District Electric Rev., Unrefunded Balance, “X”, 5%, 8/15/2025 | 1,585,000 | 1,612,873 | ||
| Southern California Public Power Authority Rev. (Milford Wind Corridor Phase II Project), “2021-1”, 5%, 7/01/2025 (w) | 800,000 | 952,071 | ||
| Southern California Public Power Authority Rev. (Milford Wind Corridor Phase II Project), “2021-1”, 5%, 7/01/2027 (w) | 1,800,000 | 2,271,486 | ||
| Vernon, CA, Electric System Rev., “A”, 5.5%, 8/01/2041 | 2,130,000 | 2,215,113 | ||
| $ 29,777,027 | ||||
| Utilities - Other – 1.2% | ||||
| California M-S-R Energy Authority Gas Rev., “A”, 7%, 11/01/2034 | $ | 1,750,000 | $ 2,720,335 | |
| Long Beach, CA, Bond Finance Authority Natural Gas Purchase Rev., “A”, 5.25%, 11/15/2022 | 2,210,000 | 2,386,962 | ||
| Issuer | Shares/Par | Value ($) | ||
| Utilities - Other – continued | ||||
| Southern California Public Power Authority (Natural Gas Project No. 1), “A”, 5%, 11/01/2033 | $ | 1,655,000 | $ 2,215,693 | |
| $ 7,322,990 | ||||
| Water & Sewer Utility Revenue – 4.2% | ||||
| Belmont, CA, Joint Powers Financing Authority, Sewer Rev., 5%, 8/01/2047 | $ | 1,885,000 | $ 2,321,397 | |
| Carpinteria Valley, CA, Water District Refunding Rev., “A”, 5%, 7/01/2033 | 450,000 | 589,441 | ||
| Carpinteria Valley, CA, Water District Refunding Rev., “A”, 5%, 7/01/2035 | 600,000 | 776,656 | ||
| Fillmore, CA, Wastewater Refunding Rev., AGM, 5%, 5/01/2047 | 3,000,000 | 3,486,591 | ||
| Guam Waterworks Authority Rev. (Water and Wastewater System), “A”, 5%, 1/01/2050 | 720,000 | 865,346 | ||
| Oxnard, CA, Financing Authority, Wastewater Rev., AGM, 5%, 6/01/2030 | 1,660,000 | 1,873,231 | ||
| Oxnard, CA, Financing Authority, Wastewater Rev., AGM, 5%, 6/01/2031 | 415,000 | 467,622 | ||
| Porterville, CA, Water Rev. Certificates of Participation (Water System Financing Project), AGM, 4%, 8/15/2037 | 175,000 | 208,814 | ||
| Porterville, CA, Water Rev. Certificates of Participation (Water System Financing Project), AGM, 4%, 8/15/2038 | 225,000 | 267,644 | ||
| Porterville, CA, Water Rev. Certificates of Participation (Water System Financing Project), AGM, 4%, 8/15/2039 | 270,000 | 320,258 | ||
| San Mateo-Foster City, CA, Public Financing Authority, Wastewater Rev. (Clean Water Program), 4%, 8/01/2044 | 2,205,000 | 2,554,037 | ||
| Santa Barbara County, CA, Solid Waste System Rev., COP, “B”, 5%, 12/01/2036 | 2,000,000 | 2,423,541 | ||
| Silicon Valley Clean Water, CA, Wastewater Rev., 4%, 8/01/2044 | 3,250,000 | 3,688,812 | ||
| Soquel Creek, CA, Water District, COP, 5%, 3/01/2043 (Prerefunded 3/01/2023) | 1,715,000 | 1,872,521 | ||
| South Placer, CA, Wastewater Authority Refunding Rev., 5%, 11/01/2034 | 500,000 | 689,028 | ||
| South Placer, CA, Wastewater Authority Refunding Rev., 5%, 11/01/2035 | 500,000 | 694,143 | ||
| Tulare, CA, Sewer Rev., AGM, 5%, 11/15/2031 | 1,700,000 | 2,019,479 | ||
| Tulare, CA, Sewer Rev., AGM, 5%, 11/15/2035 | 830,000 | 981,025 | ||
| $ 26,099,586 | ||||
| Total Municipal Bonds (Identified Cost, $582,341,928) | $621,273,342 | |||
| Bonds – 0.2% | ||||
| Consumer Services – 0.2% | ||||
| Toll Road Investors Partnership II LP, Capital Appreciation, NPFG, 0%, 2/15/2025 (n) | $ | 902,000 | $ 787,726 | |
| Issuer | Shares/Par | Value ($) | ||
| Bonds – continued | ||||
| Consumer Services – continued | ||||
| Toll Road Investors Partnership II LP, Capital Appreciation, NPFG, 0%, 2/15/2043 (n) | $ | 1,900,000 | $ 541,127 | |
| Total Bonds (Identified Cost, $1,423,411) | $ 1,328,853 | |||
| Issuer | Shares/Par | Value ($) | ||
| Investment Companies (h) – 0.5% | ||||
| Money Market Funds – 0.5% | ||||
| MFS Institutional Money Market Portfolio, 0.05% (v) (Identified Cost, $2,970,527) | 2,970,539 | $ 2,970,539 | ||
| Other Assets, Less Liabilities – (1.5)% | (8,970,605) | |||
| Net Assets – 100.0% | $616,602,129 | |||
| Issuer | Shares/Par | Value ($) | ||
| Municipal Bonds – 97.2% | ||||
| Airport Revenue – 3.3% | ||||
| Atlanta, GA, Airport General Refunding Rev., “E”, 5%, 7/01/2032 | $ | 250,000 | $ 319,240 | |
| Atlanta, GA, Airport Passenger Facility Charge and Subordinate Lien Rev., “D”, 4%, 7/01/2037 | 1,000,000 | 1,142,388 | ||
| Atlanta, GA, Airport Passenger Facility Charge and Subordinate Lien Rev., “D”, 4%, 7/01/2039 | 205,000 | 232,931 | ||
| Atlanta, GA, Airport Rev., “B”, 5%, 1/01/2033 | 1,000,000 | 1,115,030 | ||
| Atlanta, GA, Airport Rev., “B”, 5%, 7/01/2044 | 1,000,000 | 1,213,380 | ||
| Dallas and Fort Worth, TX, International Airport Rev., “B”, 5%, 11/01/2044 | 75,000 | 80,114 | ||
| Dallas and Fort Worth, TX, International Airport Rev., “C”, 5%, 11/01/2045 | 55,000 | 56,442 | ||
| San Francisco, CA, City & County Airports Commission, International Airport Rev., “B”, 5%, 5/01/2046 | 265,000 | 306,448 | ||
| Wayne County, MI, Airport Authority Rev. (Detroit Metropolitan Wayne County Airport), “B”, 5%, 12/01/2044 | 30,000 | 34,381 | ||
| Wayne County, MI, Airport Authority Rev. (Detroit Metropolitan Wayne County Airport), “B”, BAM, 5%, 12/01/2039 | 35,000 | 40,111 | ||
| Wayne County, MI, Airport Authority Rev. (Detroit Metropolitan Wayne County Airport), “C”, 5%, 12/01/2039 | 25,000 | 28,457 | ||
| Wayne County, MI, Airport Authority Rev. (Detroit Metropolitan Wayne County Airport), “C”, 5%, 12/01/2044 | 40,000 | 45,531 | ||
| $ 4,614,453 | ||||
| General Obligations - General Purpose – 9.6% | ||||
| Atlanta, GA, Public Improvement Rev., 4.875%, 12/01/2026 | $ | 1,000,000 | $ 1,159,547 | |
| Bridgeview, IL, Stadium and Redevelopment Projects, AAC, 5.14%, 12/01/2036 | 220,000 | 215,057 | ||
| Chicago, IL, General Obligation (Neighborhood Alive 21 Program), “B”, 5.5%, 1/01/2037 | 55,000 | 61,392 | ||
| Chicago, IL, General Obligation Refunding Project, “A”, 5.25%, 1/01/2030 | 35,000 | 38,067 | ||
| Chicago, IL, General Obligation, “A”, 5.5%, 1/01/2033 | 75,000 | 84,235 | ||
| Chicago, IL, General Obligation, “A”, 5.5%, 1/01/2035 | 60,000 | 73,773 | ||
| Chicago, IL, General Obligation, “D”, 5.5%, 1/01/2040 | 20,000 | 22,240 | ||
| Chicago, IL, General Obligation, “F”, 5.5%, 1/01/2042 | 165,000 | 183,005 | ||
| Issuer | Shares/Par | Value ($) | ||
| General Obligations - General Purpose – continued | ||||
| Commonwealth of Puerto Rico, General Obligation, “A”, 8%, 7/01/2035 (a)(d) | $ | 1,250,000 | $ 981,250 | |
| Commonwealth of Puerto Rico, Public Improvement, “A”, AGM, 5%, 7/01/2035 | 120,000 | 124,044 | ||
| Commonwealth of Puerto Rico, Public Improvement, “A-4”, AGM, 5%, 7/01/2031 | 50,000 | 51,620 | ||
| Forsyth County, GA, 5%, 9/01/2021 | 2,435,000 | 2,483,263 | ||
| Gwinnett County, GA, School District General Obligation, 5%, 2/01/2033 | 1,000,000 | 1,344,724 | ||
| Gwinnett County, GA, School District General Obligation, 5%, 2/01/2034 | 1,000,000 | 1,338,819 | ||
| Puerto Rico Public Buildings Authority Government Facilities Rev., “M-2”, AAC, 10%, 7/01/2035 | 130,000 | 136,618 | ||
| State of Georgia, General Obligation Refunding, “C”, 5%, 7/01/2024 | 635,000 | 730,968 | ||
| State of Georgia, General Obligation, “A”, 5%, 8/01/2029 | 1,095,000 | 1,447,988 | ||
| State of Illinois, 5%, 6/01/2021 | 710,000 | 714,977 | ||
| State of Illinois, General Obligation, 5.5%, 5/01/2039 | 180,000 | 221,450 | ||
| State of Illinois, General Obligation, “A”, 5%, 3/01/2028 | 120,000 | 144,448 | ||
| State of Illinois, General Obligation, “A”, 5%, 3/01/2029 | 180,000 | 219,652 | ||
| State of Illinois, General Obligation, “A”, 5%, 3/01/2030 | 165,000 | 203,521 | ||
| State of Illinois, General Obligation, “A”, 5%, 3/01/2031 | 245,000 | 305,551 | ||
| Valdosta & Lowndes County, GA, Hospital Authority Rev. Anticipation Certificate, “A”, 5%, 10/01/2036 | 1,000,000 | 1,257,663 | ||
| $ 13,543,872 | ||||
| General Obligations - Schools – 12.9% | ||||
| Ben Hill County, GA, School District Rev., 4%, 4/01/2037 | $ | 750,000 | $ 885,822 | |
| Bryan County, GA, School District General Obligation, 4%, 8/01/2032 | 500,000 | 577,561 | ||
| Carroll County, GA, School District General Obligation, 5%, 4/01/2028 | 500,000 | 639,446 | ||
| Cherokee County, GA, School System General Obligation, “A”, 5%, 8/01/2022 | 1,180,000 | 1,255,565 | ||
| Cobb County, GA, School District Short Term Construction Notes, 1.5%, 12/15/2021 | 3,000,000 | 3,029,401 | ||
| Dalton, GA, General Obligation, 5%, 2/01/2036 | 500,000 | 622,534 | ||
| Downey, CA, Unified School District (Election of 2014), “B”, 4%, 8/01/2040 | 585,000 | 678,174 | ||
| Evans County, GA, School District, 4%, 6/01/2035 | 660,000 | 786,727 | ||
| Issuer | Shares/Par | Value ($) | ||
| Municipal Bonds – continued | ||||
| General Obligations - Schools – continued | ||||
| Forsyth County, GA, General Obligation, 5%, 2/01/2032 | $ | 1,000,000 | $ 1,317,047 | |
| Gainesville, GA, School District General Obligation, 4%, 11/01/2039 | 1,000,000 | 1,203,010 | ||
| Gwinnett County, GA, School District, 5%, 2/01/2029 | 1,000,000 | 1,169,645 | ||
| Gwinnett County, GA, School District, 5%, 2/01/2039 | 1,500,000 | 1,896,239 | ||
| Jackson County, GA, School District, 5%, 3/01/2032 | 1,000,000 | 1,280,035 | ||
| Lumpkin County, GA, School District General Obligation, 5%, 12/01/2031 | 500,000 | 668,313 | ||
| Lumpkin County, GA, School District General Obligation, 5%, 12/01/2032 | 500,000 | 665,297 | ||
| Madison County, GA, School District COP (Capital Improvement Project), 4%, 5/01/2026 | 915,000 | 1,056,161 | ||
| Paulding County School District, GA, 5%, 8/01/2026 | 450,000 | 553,198 | ||
| $ 18,284,175 | ||||
| Healthcare Revenue - Hospitals – 12.9% | ||||
| Allegheny County, PA, Hospital Development Authority Rev. (Allegheny Health Network Obligated Group), “A”, 4%, 4/01/2044 | $ | 210,000 | $ 230,087 | |
| Augusta, GA, Development Authority Rev. (AU Health System, Inc. Project), 5%, 7/01/2036 | 500,000 | 569,991 | ||
| California Statewide Communities Development Authority Rev. (Loma Linda University Medical Center), “B”, 6%, 12/01/2024 | 485,000 | 541,502 | ||
| Cedartown Polk County, GA, Hospital Authority Rev., Anticipation Certificates (Polk Medical Center Project), 5%, 7/01/2039 | 500,000 | 570,931 | ||
| Chattanooga, TN, Health, Educational & Housing Facility Board Rev. (CommonSpirit Health), “A-1”, 4%, 8/01/2044 | 10,000 | 11,095 | ||
| Chattanooga, TN, Health, Educational & Housing Facility Board Rev. (CommonSpirit Health), “A-2”, 5%, 8/01/2044 | 10,000 | 12,126 | ||
| Chattanooga, TN, Health, Educational & Housing Facility Board Rev. (CommonSpirit Health), “A-2”, 5%, 8/01/2049 | 5,000 | 6,018 | ||
| Clarke County, GA, Hospital Authority Rev. (Athens Regional Medical Center Project), 5%, 1/01/2032 (Prerefunded 1/01/2022) | 1,000,000 | 1,036,258 | ||
| Cobb County, GA, Kennestone Hospital Authority Rev. (WellStar Health System, Inc. Project), “B”, 5%, 4/01/2040 | 205,000 | 257,171 | ||
| Cobb County, GA, Kennestone Hospital Authority Rev. (WellStar Health System, Inc. Project), “B”, 4%, 4/01/2041 | 485,000 | 561,628 | ||
| Issuer | Shares/Par | Value ($) | ||
| Healthcare Revenue - Hospitals – continued | ||||
| Colorado Health Facilities Authority Rev. (CommonSpirit Health), “A-2”, 4%, 8/01/2044 | $ | 55,000 | $ 61,025 | |
| Dalton, GA, Development Authority Rev. (Hamilton Health Care System), 5%, 8/15/2028 | 500,000 | 525,260 | ||
| Dalton-Whitfield County, GA, Joint Development Authority Rev. (Hamilton Health Care System), 4%, 8/15/2048 | 250,000 | 275,271 | ||
| Doylestown, PA, Hospital Rev., “A”, 5%, 7/01/2049 | 15,000 | 16,748 | ||
| Fulton County, GA, Development Authority Hospital Rev. (Piedmont Healthcare, Inc. Project), “A”, 4%, 7/01/2039 | 500,000 | 580,805 | ||
| Fulton County, GA, Development Authority Hospital Rev. (Piedmont Healthcare, Inc. Project), “A”, 4%, 7/01/2049 | 1,000,000 | 1,139,164 | ||
| Fulton County, GA, Development Authority Hospital Rev. (WellStar Health System, Inc. Project), 5%, 4/01/2034 | 1,000,000 | 1,197,801 | ||
| Fulton County, GA, Development Authority Hospital Rev. (WellStar Health System, Inc. Project), “A”, 5%, 4/01/2042 | 750,000 | 884,504 | ||
| Fulton County, GA, Development Authority Rev. (Piedmont Healthcare, Inc. Project), “A”, 5%, 7/01/2032 | 500,000 | 591,859 | ||
| Fulton County, GA, Development Authority Rev. (Piedmont Healthcare, Inc. Project), “A”, 4%, 7/01/2035 | 500,000 | 558,074 | ||
| Glynn-Brunswick, GA, Memorial Hospital Authority Rev. (Southeast Georgia Health System Project), 5%, 8/01/2028 | 500,000 | 580,449 | ||
| Hall County and Gainesville, GA, Hospital Authority Rev. (Northeast Georgia Health System, Inc. Project), “A”, 5%, 2/15/2029 | 670,000 | 857,377 | ||
| Hall County and Gainesville, GA, Hospital Authority Rev. (Northeast Georgia Health System, Inc. Project), “A”, 5%, 2/15/2042 | 1,000,000 | 1,175,381 | ||
| Hall County and Gainesville, GA, Hospital Authority Rev. (Northeast Georgia Health System, Inc. Project), “A”, 5.25%, 8/15/2049 | 1,595,000 | 1,830,915 | ||
| Jefferson Parish, LA, Hospital Service District No. 2 Hospital Rev. (East Jefferson General Hospital), 6.25%, 7/01/2031 (Prerefunded 7/01/2021) | 45,000 | 45,654 | ||
| Jefferson Parish, LA, Hospital Service District No. 2 Hospital Rev. (East Jefferson General Hospital), 6.375%, 7/01/2041 (Prerefunded 7/01/2021) | 65,000 | 65,964 | ||
| Massachusetts Development Finance Agency Rev. (Partners Healthcare), “S”, 4%, 7/01/2041 | 465,000 | 531,698 | ||
| Miami-Dade County, FL, Health Facilities Authority Hospital Rev., Unrefunded Balance, 6%, 8/01/2030 | 10,000 | 10,039 | ||
| Issuer | Shares/Par | Value ($) | ||
| Municipal Bonds – continued | ||||
| Healthcare Revenue - Hospitals – continued | ||||
| New Jersey Health Care Facilities, Financing Authority Rev. (University Hospital), “A”, AGM, 5%, 7/01/2046 | $ | 55,000 | $ 62,130 | |
| Richmond County, GA, Hospital Authority Rev., Anticipation Certificates (University Health Services, Inc. Project), 4%, 1/01/2036 | 1,000,000 | 1,120,763 | ||
| Savannah, GA, Hospital Authority Rev. (St. Joseph's/Candler Health System, Inc.), “A”, 4%, 7/01/2043 | 1,000,000 | 1,120,926 | ||
| Spartanburg County, SC, Regional Health Services District Hospital Rev., “A”, 4%, 4/15/2043 | 570,000 | 626,022 | ||
| Virginia Small Business Financing Authority Health Facilities Rev. (Bon Secours Mercy Health, Inc.), “A”, 4%, 12/01/2049 | 550,000 | 626,601 | ||
| $ 18,281,237 | ||||
| Healthcare Revenue - Long Term Care – 1.3% | ||||
| Fulton County, GA, Residential Care Facilities, Elderly Authority Rev. (Lenbrook Square Foundation, Inc. Project), “A, 5%, 7/01/2036 | $ | 500,000 | $ 535,962 | |
| Hall County and Gainesville, GA, Development Authority Retirement Community Rev. (ACTS Retirement - Life Communities, Inc. Obligated Group), 5%, 11/15/2033 | 500,000 | 584,147 | ||
| Richmond County, GA, Development Authority Rev., Capital Appreciation, ”C“, ETM, 0%, 12/01/2021 | 225,000 | 224,794 | ||
| Savannah, GA, Economic Development Authority Rev., Capital Appreciation, ”C“, ETM, 0%, 12/01/2021 | 500,000 | 499,378 | ||
| $ 1,844,281 | ||||
| Healthcare Revenue - Other – 1.2% | ||||
| Carroll City-County, GA, Hospital Authority Rev. (Tanner Medical Center), 5%, 7/01/2028 | $ | 500,000 | $ 608,670 | |
| Floyd County, GA, Hospital Authority Rev. Anticipation Certificates (Floyd Medical Center Project), ”B“, 5%, 7/01/2032 | 1,000,000 | 1,054,625 | ||
| $ 1,663,295 | ||||
| Industrial Revenue - Other – 0.2% | ||||
| Tuscaloosa County, AL, Industrial Development Authority, Gulf Opportunity Zone (Hunt Refining Project), ”A“, 5.25%, 5/01/2044 (n) | $ | 285,000 | $ 323,879 | |
| Industrial Revenue - Paper – 0.1% | ||||
| Rockdale County, GA, Development Authority Refunding Rev. (Pratt Paper LLC Project), 4%, 1/01/2038 (n) | $ | 150,000 | $ 164,749 | |
| Issuer | Shares/Par | Value ($) | ||
| Miscellaneous Revenue - Other – 4.6% | ||||
| Atlanta, GA, Geo. L. Smith II World Congress Center Authority Convention Center Hotel Rev., ”A“, 4%, 1/01/2054 (w) | $ | 1,250,000 | $ 1,386,120 | |
| Atlanta, GA, Geo. L. Smith II World Congress Center Authority Convention Center Hotel Rev., ”B“, 5%, 1/01/2054 (n)(w) | 1,000,000 | 1,090,156 | ||
| Douglas County, GA, Development Authority, Industrial Development Rev. (Pandosia LLC Project), ”A“, VRDN, 0.08%, 12/01/2027 | 470,000 | 470,000 | ||
| Downtown Savannah, GA, Authority Rev. (Chatham County Judicial Complex Project), 5%, 6/01/2032 | 1,000,000 | 1,201,596 | ||
| Fulton County, GA, Development Authority Rev. (Robert W. Woodruff Arts Center, Inc. Project), ”A“, 5%, 3/15/2036 | 500,000 | 579,268 | ||
| Fulton County, GA, Development Authority Rev. (Robert W. Woodruff Arts Center, Inc. Project), ”A“, 5%, 3/15/2044 | 660,000 | 778,295 | ||
| Fulton County, GA, Development Authority Rev. (Robert W. Woodruff Arts Center, Inc. Project), ”A“, 5%, 3/15/2034 | 500,000 | 604,828 | ||
| Indiana Finance Authority Rev. (Ohio River Bridges East End Crossing Project), ”A“, 5%, 7/01/2040 | 75,000 | 81,023 | ||
| New York, NY, Industrial Development Agency, Airport Facilities Rev. (Transportation Infrastructure Properties LLC), 5%, 7/01/2028 | 310,000 | 324,162 | ||
| $ 6,515,448 | ||||
| Sales & Excise Tax Revenue – 3.1% | ||||
| Guam Government Business Privilege Tax Rev., ”A“, 5.25%, 1/01/2036 | $ | 170,000 | $ 175,421 | |
| Metropolitan Atlanta Rapid Transit Authority, GA, Sales Tax Rev. (Third Indenture Series) ”C“, 4%, 7/01/2036 | 750,000 | 867,941 | ||
| Metropolitan Atlanta Rapid Transit Authority, GA, Sales Tax Rev. (Third Indenture Series), ”A“, 5%, 7/01/2044 | 1,000,000 | 1,166,108 | ||
| Puerto Rico Sales Tax Financing Corp., Restructured Sales Tax Rev., ”2019A-1“, 4.55%, 7/01/2040 | 24,000 | 26,011 | ||
| Puerto Rico Sales Tax Financing Corp., Restructured Sales Tax Rev., ”2019A-1“, 5%, 7/01/2058 | 234,000 | 257,676 | ||
| Puerto Rico Sales Tax Financing Corp., Restructured Sales Tax Rev., ”2019A-2“, 4.329%, 7/01/2040 | 237,000 | 253,524 | ||
| Puerto Rico Sales Tax Financing Corp., Restructured Sales Tax Rev., ”2019A-2“, 4.329%, 7/01/2040 | 83,000 | 88,787 | ||
| Puerto Rico Sales Tax Financing Corp., Restructured Sales Tax Rev., ”2019A-2“, 4.784%, 7/01/2058 | 38,000 | 41,120 | ||
| Issuer | Shares/Par | Value ($) | ||
| Municipal Bonds – continued | ||||
| Sales & Excise Tax Revenue – continued | ||||
| Puerto Rico Sales Tax Financing Corp., Restructured Sales Tax Rev., Capital Appreciation, ”2019A-1“, 0%, 7/01/2024 | $ | 1,000 | $ 938 | |
| Puerto Rico Sales Tax Financing Corp., Restructured Sales Tax Rev., Capital Appreciation, ”2019A-1“, 0%, 7/01/2027 | 35,000 | 30,663 | ||
| Puerto Rico Sales Tax Financing Corp., Restructured Sales Tax Rev., Capital Appreciation, ”2019A-1“, 0%, 7/01/2029 | 6,000 | 4,941 | ||
| Puerto Rico Sales Tax Financing Corp., Restructured Sales Tax Rev., Capital Appreciation, ”2019A-1“, 0%, 7/01/2031 | 326,000 | 249,501 | ||
| Puerto Rico Sales Tax Financing Corp., Restructured Sales Tax Rev., Capital Appreciation, ”2019A-1“, 0%, 7/01/2033 | 316,000 | 224,304 | ||
| Puerto Rico Sales Tax Financing Corp., Restructured Sales Tax Rev., Capital Appreciation, ”2019A-1“, 0%, 7/01/2046 | 2,899,000 | 884,688 | ||
| Wisconsin Public Finance Authority Limited Obligation Grant Rev. (American Dream at Meadowlands Project), ”A“, 6.25%, 8/01/2027 (n) | 145,000 | 157,571 | ||
| $ 4,429,194 | ||||
| Secondary Schools – 0.3% | ||||
| District of Columbia Rev. (Rocketship D.C.), ”A“, 5%, 6/01/2049 (n) | $ | 250,000 | $ 275,098 | |
| North Texas Education Finance Corp., Education Rev. (Uplift Education), ”A“, 5.125%, 12/01/2042 (Prerefunded 6/01/2022) | 75,000 | 79,252 | ||
| $ 354,350 | ||||
| Single Family Housing - Local – 0.5% | ||||
| Montgomery County, MD, Housing Opportunities Commission Program Rev., ”A“, 4%, 7/01/2049 | $ | 565,000 | $ 631,171 | |
| Single Family Housing - State – 5.2% | ||||
| Connecticut Housing Finance Authority Rev. (Housing Mortgage Finance Program), ”C-1“, 4%, 11/15/2047 | $ | 360,000 | $ 388,650 | |
| Connecticut Housing Finance Authority Rev. (Housing Mortgage Finance Program), ”D-1“, GNMA, 4%, 11/15/2047 | 425,000 | 459,345 | ||
| Georgia Housing & Finance Authority Rev., Single Family Mortgage, ”A“, 3.6%, 12/01/2044 | 1,000,000 | 1,064,666 | ||
| Georgia Housing & Finance Authority Rev., Single Family Mortgage, ”A“, 3.5%, 6/01/2045 | 230,000 | 240,910 | ||
| Georgia Housing & Finance Authority Rev., Single Family Mortgage, ”A“, 4%, 12/01/2048 | 405,000 | 425,292 | ||
| Issuer | Shares/Par | Value ($) | ||
| Single Family Housing - State – continued | ||||
| Georgia Housing & Finance Authority Rev., Single Family Mortgage, ”A“, 4%, 6/01/2050 | $ | 970,000 | $ 1,091,155 | |
| Georgia Housing & Finance Authority Rev., Single Family Mortgage, ”B-2“, 2.35%, 6/01/2025 | 1,400,000 | 1,491,922 | ||
| Iowa Finance Authority, Single Family Mortgage Rev., ”A“, GNMA, 4%, 7/01/2047 | 465,000 | 502,118 | ||
| Maryland Community Development Administration, Department of Housing & Community Development Housing Rev., ”A“, 4.25%, 9/01/2049 | 480,000 | 536,557 | ||
| Pennsylvania Housing Finance Agency, Single Family Mortgage Rev., “125A”, 3.7%, 10/01/2037 | 510,000 | 547,735 | ||
| Tennessee Housing Development Agency, Residential Finance Program Rev., ”1“, 4.25%, 1/01/2050 | 505,000 | 560,646 | ||
| $ 7,308,996 | ||||
| State & Local Agencies – 1.3% | ||||
| Delaware Valley, PA, Regional Finance Authority, ”C“, FLR, 0.878% (LIBOR - 3mo. + 0.75%), 6/01/2037 | $ | 460,000 | $ 450,895 | |
| Maryland Stadium Authority Rev., Baltimore City Public Schools Construction and Revitalization Program, ”A“, 5%, 5/01/2047 (Prerefunded 5/01/2028) | 110,000 | 140,574 | ||
| Maryland Stadium Authority Rev., Baltimore City Public Schools Construction and Revitalization Program, ”A“, 5%, 5/01/2047 | 200,000 | 237,826 | ||
| New Jersey Building Authority Rev., Unrefunded Balance, “A”, BAM, 5%, 6/15/2029 | 10,000 | 11,878 | ||
| New Jersey Economic Development Authority Rev. (School Facilities Construction), ”AAA“, 5%, 6/15/2026 | 110,000 | 132,088 | ||
| New Jersey Economic Development Authority Rev. (School Facilities Construction), ”LLL“, 5%, 6/15/2039 | 255,000 | 309,056 | ||
| Villa Rica, GA, Public Facilities Authority Rev. (Water and Sewerage Project), 5%, 3/01/2039 | 500,000 | 571,475 | ||
| $ 1,853,792 | ||||
| Student Loan Revenue – 0.2% | ||||
| Iowa Student Loan Liquidity Corp. Rev., ”B“, 3%, 12/01/2039 | $ | 50,000 | $ 49,392 | |
| Iowa Student Loan Liquidity Corp. Rev., ”B“, 3.5%, 12/01/2044 | 130,000 | 130,835 | ||
| Minnesota Office of Higher Education Supplemental Student Loan Program Rev., 2.65%, 11/01/2038 | 90,000 | 89,125 | ||
| $ 269,352 | ||||
| Issuer | Shares/Par | Value ($) | ||
| Municipal Bonds – continued | ||||
| Tax - Other – 1.5% | ||||
| Atlanta & Fulton County, GA, Recreation Authority Park Improvement, ”A“, 5%, 12/01/2032 | $ | 500,000 | $ 575,935 | |
| Atlanta, GA, Development Authority Rev. (New Downtown Atlanta Stadium Project), ”A-1“, 5%, 7/01/2033 | 740,000 | 850,877 | ||
| Guam Government Ltd. Obligation Rev., ”A“, 5%, 12/01/2035 | 65,000 | 73,723 | ||
| Guam Government Ltd. Obligation Rev., ”A“, 5%, 12/01/2036 | 35,000 | 39,602 | ||
| Guam Government Ltd. Obligation Rev., ”A“, 5%, 12/01/2046 | 100,000 | 111,311 | ||
| Puerto Rico Convention Center District Authority, Hotel Occupancy Tax Rev., ”A“, AAC, 5%, 7/01/2031 | 95,000 | 97,200 | ||
| Puerto Rico Infrastructure Financing Authority Special Tax Rev., ”C“, AAC, 5.5%, 7/01/2024 | 125,000 | 134,562 | ||
| Puerto Rico Infrastructure Financing Authority Special Tax Rev., ”C“, AAC, 5.5%, 7/01/2026 | 145,000 | 159,467 | ||
| Wisconsin Public Finance Authority Limited Obligation PILOT Rev. (American Dream at Meadowlands Project), 7%, 12/01/2050 | 100,000 | 115,476 | ||
| $ 2,158,153 | ||||
| Tax Assessment – 1.2% | ||||
| Atlanta, GA, Tax Allocation (Beltline Project), ”B“, 5%, 1/01/2030 | $ | 1,000,000 | $ 1,203,853 | |
| Atlanta, GA, Tax Allocation (Eastside Project), 5%, 1/01/2030 (Prerefunded 1/01/2026) | 410,000 | 494,157 | ||
| Brunswick, MD, Special Obligation Refunding (Brunswick Crossing Special Taxing District), 4%, 7/01/2029 | 10,000 | 11,520 | ||
| Brunswick, MD, Special Obligation Refunding (Brunswick Crossing Special Taxing District), 5%, 7/01/2036 | 10,000 | 11,795 | ||
| $ 1,721,325 | ||||
| Tobacco – 0.4% | ||||
| Buckeye, OH, Tobacco Settlement Financing Authority Senior Asset-Backed Refunding, 2020A-2, ”1“, 5%, 6/01/2036 | $ | 75,000 | $ 93,930 | |
| Buckeye, OH, Tobacco Settlement Financing Authority Senior Asset-Backed Refunding, 2020B-3, Capital Appreciation, ”2“, 0%, 6/01/2057 | 1,555,000 | 235,130 | ||
| Illinois Railsplitter Tobacco Settlement Authority Rev., 6%, 6/01/2028 (Prerefunded 6/01/2021) | 235,000 | 237,152 | ||
| $ 566,212 | ||||
| Issuer | Shares/Par | Value ($) | ||
| Toll Roads – 0.3% | ||||
| Texas Private Activity Surface Transportation Corp., Senior Lien Rev. (NTE Mobility Partners Segments 3 LLC Segments 3A & 3B Facility), 7%, 12/31/2038 | $ | 80,000 | $ 91,277 | |
| Texas Private Activity Surface Transportation Corp., Senior Lien Rev. (NTE Mobility Partners Segments 3 LLC Segments 3A & 3B Facility), 6.75%, 6/30/2043 | 60,000 | 68,025 | ||
| Virginia Small Business Financing Authority Rev. (Elizabeth River Crossings Opco LLC Project), 6%, 1/01/2037 | 95,000 | 100,458 | ||
| Virginia Small Business Financing Authority Rev. (Elizabeth River Crossings Opco LLC Project), 5.5%, 1/01/2042 | 190,000 | 198,636 | ||
| $ 458,396 | ||||
| Transportation - Special Tax – 2.0% | ||||
| Commonwealth of Puerto Rico Highway & Transportation Authority Rev., ”A“, NPFG, 4.75%, 7/01/2038 | $ | 140,000 | $ 141,615 | |
| Commonwealth of Puerto Rico Highway & Transportation Authority Rev., ”D“, AGM, 5%, 7/01/2032 | 70,000 | 72,268 | ||
| Commonwealth of Puerto Rico Highway & Transportation Authority Rev., ”J“, NPFG, 5%, 7/01/2029 | 10,000 | 10,255 | ||
| Commonwealth of Puerto Rico Highway & Transportation Authority Rev., ”L“, AAC, 5.25%, 7/01/2038 | 625,000 | 703,562 | ||
| Commonwealth of Puerto Rico Highway & Transportation Authority Rev., ”N“, AAC, 5.25%, 7/01/2031 | 330,000 | 363,634 | ||
| Commonwealth of Puerto Rico Highway & Transportation Authority Rev., ”N“, NPFG, 5.25%, 7/01/2032 | 160,000 | 177,460 | ||
| Commonwealth of Puerto Rico Highway & Transportation Authority Rev., ”N“, NPFG, 5.25%, 7/01/2033 | 135,000 | 149,589 | ||
| Metropolitan Transportation Authority Rev., NY, Anticipation Note, ”B-2“, 5%, 5/15/2021 | 400,000 | 401,922 | ||
| Metropolitan Transportation Authority Rev., NY, Anticipation Note, ”D-1“, 5%, 9/01/2022 | 290,000 | 307,318 | ||
| New Jersey Transportation Trust Fund Authority, ”AA“, 5%, 6/15/2045 | 75,000 | 91,046 | ||
| New Jersey Transportation Trust Fund Authority, Federal Highway Reimbursement Rev., ”A-1“, 5%, 6/15/2027 | 120,000 | 143,411 | ||
| New Jersey Transportation Trust Fund Authority, Transportation System, ”A“, 5.25%, 12/15/2021 | 65,000 | 67,253 | ||
| New Jersey Transportation Trust Fund Authority, Transportation System, ”A“, 5%, 12/15/2039 | 70,000 | 84,751 | ||
| Issuer | Shares/Par | Value ($) | ||
| Municipal Bonds – continued | ||||
| Transportation - Special Tax – continued | ||||
| New Jersey Transportation Trust Fund Authority, Transportation System, ”BB“, 5%, 6/15/2044 | $ | 65,000 | $ 77,300 | |
| $ 2,791,384 | ||||
| Universities - Colleges – 17.3% | ||||
| Albany-Dougherty County, GA, Inner City Authority Refunding Rev. (USG Real Estate Foundation X LLC Project), 4%, 6/01/2034 | $ | 1,430,000 | $ 1,609,106 | |
| Americus-Sumter Payroll Development Authority Rev. (USG Real Estate Foundation VII LLC Project), ”A“, 3.5%, 6/01/2035 | 500,000 | 547,991 | ||
| Barnesville-Lamar County, GA, Industrial Development Authority Refunding Rev. (USG Real Estate Foundation VI LLC Project), 5%, 6/01/2038 | 600,000 | 735,421 | ||
| Bibb County, GA, Development Authority Rev. (USG Real Estate Foundation IX LLC Project), 4%, 6/01/2037 | 560,000 | 636,895 | ||
| Bibb County, GA, Development Authority Rev. (USG Real Estate Foundation IX LLC Project), 4%, 6/01/2044 | 1,000,000 | 1,117,402 | ||
| Bleckley-Dodge County, GA, Joint Development Authority Refunding Rev. (USG Real Estate Foundation VII LLC Project), 5%, 7/01/2038 | 815,000 | 985,295 | ||
| Bulloch County, GA, Development Authority Rev. (Georgia Southern University Housing Foundation Four, LLC Project), 5%, 7/01/2038 (Prerefunded 7/01/2027) | 200,000 | 250,465 | ||
| Bulloch County, GA, Development Authority Rev. (Georgia Southern University Housing Foundation Four, LLC Project), 5%, 7/01/2038 | 800,000 | 962,098 | ||
| Carrollton, GA, Payroll Development Authority Refunding Rev. (UWG Housing, LLC Project), 5%, 7/01/2038 | 750,000 | 926,730 | ||
| Cobb County, GA, Development Authority, Parking & Dining Hall Refunding Lease Rev. (Kennesaw State University Real Estate Foundations Projects), 5%, 7/15/2034 | 500,000 | 601,800 | ||
| Dahlonega, GA, Downtown Development Authority Refunding Rev. (North Georgia MAC LLC), 5%, 7/01/2036 | 1,000,000 | 1,208,220 | ||
| Fulton County, GA, Development Authority Rev. (Georgia Tech Facilities, Inc.), 5%, 3/01/2034 | 300,000 | 373,834 | ||
| Fulton County, GA, Development Authority Rev. (Georgia Tech Facilities, Inc.), 5%, 6/15/2044 | 1,000,000 | 1,237,853 | ||
| Fulton County, GA, Development Authority Rev. (Georgia Tech Facilities, Inc.), 4%, 6/15/2049 | 500,000 | 571,282 | ||
| Issuer | Shares/Par | Value ($) | ||
| Universities - Colleges – continued | ||||
| Fulton County, GA, Development Authority Rev. (Georgia Tech Facilities, Inc.), 5%, 6/15/2052 | $ | 1,000,000 | $ 1,227,274 | |
| Fulton County, GA, Development Authority Rev. (Georgia Tech Facilities, Inc.) ”A“, 5%, 10/01/2028 | 840,000 | 1,045,292 | ||
| Fulton County, GA, Development Authority Rev. (Georgia Tech Facilities, Inc.) ”A“, 5%, 6/01/2039 | 1,000,000 | 1,251,919 | ||
| Fulton County, GA, Development Authority Rev. (Spelman College), 5%, 6/01/2028 | 500,000 | 577,905 | ||
| Georgia Higher Education Facilities Authority Refunding Rev. (USG Real Estate Foundation II LLC Project), 4%, 6/15/2036 | 750,000 | 868,364 | ||
| Georgia Private Colleges & Universities Authority Rev. (Emory University), ”B“, 4%, 9/01/2036 | 1,000,000 | 1,208,777 | ||
| Georgia Private Colleges & Universities Authority Rev. (Emory University), ”B“, 4%, 9/01/2037 | 1,000,000 | 1,204,489 | ||
| Georgia Private Colleges & Universities Authority Rev. (Emory University), ”B“, 4%, 9/01/2040 | 500,000 | 597,059 | ||
| Georgia Private Colleges & Universities Authority Rev. (Mercer University Project), 5%, 10/01/2040 | 350,000 | 385,286 | ||
| Georgia Private Colleges & Universities Authority Rev. (Mercer University Project), ”C“, 5.25%, 10/01/2027 | 350,000 | 368,715 | ||
| Gwinnett County, GA, Development Authority Rev. (Georgia Gwinnet County Student Housing), ”A“, 5%, 7/01/2040 | 1,000,000 | 1,177,310 | ||
| Moultrie-Colquitt County, GA, Development Authority Rev. (Philadelphia College of Osteopathic Medicine), 5%, 12/01/2048 | 870,000 | 1,057,260 | ||
| Pinellas County, FL, Educational Facilities Authority Rev. (Barry University), 6%, 10/01/2041 | 65,000 | 66,271 | ||
| Puerto Rico Industrial, Tourist, Educational, Medical & Environmental Control Facilities Financing Authority, Educational Facilities Rev. (University Plaza Project), NPFG, 5%, 7/01/2033 | 80,000 | 81,050 | ||
| Puerto Rico Industrial, Tourist, Educational, Medical & Environmental Control Facilities Financing Authority, Higher Education Rev. (Ana G. Mendez University System Project), 5.125%, 4/01/2032 | 25,000 | 25,331 | ||
| Puerto Rico Industrial, Tourist, Educational, Medical & Environmental Control Facilities Financing Authority, Higher Education Rev. (Ana G. Mendez University System Project), 5.375%, 4/01/2042 | 45,000 | 45,675 | ||
| Issuer | Shares/Par | Value ($) | ||
| Municipal Bonds – continued | ||||
| Universities - Colleges – continued | ||||
| Puerto Rico Industrial, Tourist, Educational, Medical & Environmental Control Facilities Financing Authority, Higher Education Rev. (International American University of Puerto Rico Project), 5%, 10/01/2031 | $ | 55,000 | $ 56,995 | |
| Richmond County, GA, Development Authority Rev. (Georgia Regents University Academic Research Center Project), AGM, 5%, 12/15/2032 | 325,000 | 369,610 | ||
| Savannah, GA, Economic Development Authority Rev. (SSU Community Development I LLC Project), AGM, 5.5%, 6/15/2035 | 500,000 | 501,828 | ||
| South Regional, GA, Joint Development Authority Rev. (VSU Parking and Student Service Center Project), ”A“, 5%, 8/01/2035 | 500,000 | 590,351 | ||
| $ 24,471,153 | ||||
| Universities - Dormitories – 0.9% | ||||
| California Municipal Finance Authority, Student Housing Rev. (CHF-Davis I LLC - West Village Student Housing Project), BAM, 5%, 5/15/2051 | $ | 635,000 | $ 755,516 | |
| Cobb County, GA, Development Authority, Student Housing Rev. (Kennesaw State University Real Estate Foundations), ”C“, 5%, 7/15/2030 | 400,000 | 443,058 | ||
| Maryland Economic Development Corp., Student Housing Rev. (Morgan State University Project), 5%, 7/01/2056 | 60,000 | 70,464 | ||
| $ 1,269,038 | ||||
| Utilities - Cogeneration – 0.2% | ||||
| Puerto Rico Industrial, Tourist, Educational, Medical & Environmental Control Facilities Financing Authority Rev. (Cogeneration Facilities - AES Puerto Rico Project), 9.12%, 6/01/2022 | $ | 270,000 | $ 276,750 | |
| Utilities - Municipal Owned – 7.3% | ||||
| Buford, GA, Combined Utility System Rev., AGM, 4%, 7/01/2034 | $ | 300,000 | $ 349,351 | |
| Buford, GA, Combined Utility System Rev., AGM, 4%, 7/01/2039 | 400,000 | 458,722 | ||
| Buford, GA, Combined Utility System Rev., AGM, 4%, 7/01/2040 | 400,000 | 458,330 | ||
| Dalton, GA, Combined Utilities Rev., 5%, 3/01/2029 | 1,195,000 | 1,449,478 | ||
| Dalton, GA, Combined Utilities Rev., 5%, 3/01/2032 | 1,000,000 | 1,280,558 | ||
| Dalton, GA, Combined Utilities Rev., 4%, 3/01/2035 | 500,000 | 565,848 | ||
| Dalton, GA, Combined Utilities Rev., 4%, 3/01/2036 | 500,000 | 564,471 | ||
| Issuer | Shares/Par | Value ($) | ||
| Utilities - Municipal Owned – continued | ||||
| Georgia Municipal Electric Authority (Plant Vogtle Units 3 & 4 Project), ”A“, 5%, 1/01/2039 | $ | 750,000 | $ 905,601 | |
| Georgia Municipal Electric Authority (Project One), ”A“, 5%, 1/01/2037 | 1,000,000 | 1,270,716 | ||
| Georgia Municipal Electric Authority (Project One), ”A“, 5%, 1/01/2038 | 125,000 | 152,087 | ||
| Georgia Municipal Gas Authority Rev. (Gas Portfolio III Project), ”S“, 5%, 10/01/2025 | 500,000 | 533,144 | ||
| Georgia Municipal Gas Authority Rev. (Gas Portfolio III Project), ”S“, 5%, 10/01/2026 | 500,000 | 532,684 | ||
| Guam Power Authority Rev., ”A“, AGM, 5%, 10/01/2039 | 50,000 | 55,457 | ||
| Guam Power Authority Rev., ”A“, AGM, 5%, 10/01/2044 | 60,000 | 66,277 | ||
| Puerto Rico Electric Power Authority Rev., ”A“, 5%, 7/01/2029 (a)(d) | 245,000 | 221,725 | ||
| Puerto Rico Electric Power Authority Rev., ”A“, 5%, 7/01/2042 (a)(d) | 40,000 | 36,200 | ||
| Puerto Rico Electric Power Authority Rev., ”AAA“, 5.25%, 7/01/2021 (a)(d) | 20,000 | 18,150 | ||
| Puerto Rico Electric Power Authority Rev., ”AAA“, 5.25%, 7/01/2030 (a)(d) | 10,000 | 9,075 | ||
| Puerto Rico Electric Power Authority Rev., ”CCC“, 5.25%, 7/01/2027 (a)(d) | 95,000 | 86,212 | ||
| Puerto Rico Electric Power Authority Rev., ”DDD“, 5%, 7/01/2020 (a)(d) | 10,000 | 9,025 | ||
| Puerto Rico Electric Power Authority Rev., ”DDD“, 5%, 7/01/2021 (a)(d) | 100,000 | 90,500 | ||
| Puerto Rico Electric Power Authority Rev., ”DDD“, 5%, 7/01/2022 (a)(d) | 155,000 | 140,275 | ||
| Puerto Rico Electric Power Authority Rev., ”EEE“, 6.05%, 7/01/2032 (a)(d) | 60,000 | 53,175 | ||
| Puerto Rico Electric Power Authority Rev., ”RR“, AGM, 5%, 7/01/2028 | 490,000 | 505,879 | ||
| Puerto Rico Electric Power Authority Rev., ”TT“, 5%, 7/01/2021 (a)(d) | 45,000 | 40,725 | ||
| Puerto Rico Electric Power Authority Rev., ”TT“, 5%, 7/01/2023 (a)(d) | 45,000 | 40,725 | ||
| Puerto Rico Electric Power Authority Rev., ”TT“, 5%, 7/01/2027 (a)(d) | 10,000 | 9,050 | ||
| Puerto Rico Electric Power Authority Rev., ”TT“, 5%, 7/01/2037 (a)(d) | 125,000 | 113,125 | ||
| Puerto Rico Electric Power Authority Rev., ”VV“, NPFG, 5.25%, 7/01/2030 | 70,000 | 77,546 | ||
| Puerto Rico Electric Power Authority Rev., ”VV“, NPFG, 5.25%, 7/01/2034 | 10,000 | 11,064 | ||
| Puerto Rico Electric Power Authority Rev., ”WW“, 5.375%, 7/01/2022 (a)(d) | 10,000 | 9,088 | ||
| Puerto Rico Electric Power Authority Rev., ”WW“, 5.25%, 7/01/2025 (a)(d) | 20,000 | 18,150 | ||
| Puerto Rico Electric Power Authority Rev., ”ZZ“, 5%, 7/01/2018 (a)(d) | 60,000 | 53,475 | ||
| Puerto Rico Electric Power Authority Rev., ”ZZ“, 5.25%, 7/01/2023 (a)(d) | 70,000 | 63,525 | ||
| Issuer | Shares/Par | Value ($) | ||
| Municipal Bonds – continued | ||||
| Utilities - Municipal Owned – continued | ||||
| Puerto Rico Electric Power Authority Rev., ”ZZ“, 5.25%, 7/01/2024 (a)(d) | $ | 25,000 | $ 22,688 | |
| Puerto Rico Electric Power Authority Rev., ”ZZ“, 5.25%, 7/01/2026 (a)(d) | 75,000 | 68,062 | ||
| $ 10,340,163 | ||||
| Utilities - Other – 0.7% | ||||
| Georgia Main Street Natural Gas, Inc., Gas Project Rev., ”A“, 5%, 3/15/2022 | $ | 910,000 | $ 948,917 | |
| Water & Sewer Utility Revenue – 8.7% | ||||
| Atlanta, GA, Water & Wastewater Refunding Rev., 5%, 11/01/2036 | $ | 750,000 | $ 928,084 | |
| Atlanta, GA, Water & Wastewater Refunding Rev., ”A“, 5%, 11/01/2037 | 1,000,000 | 1,234,413 | ||
| Atlanta, GA, Water & Wastewater Refunding Rev., ”A“, 5%, 11/01/2038 | 1,000,000 | 1,232,350 | ||
| Atlanta, GA, Water & Wastewater Refunding Rev., ”B“, 4%, 11/01/2038 | 500,000 | 582,721 | ||
| Cartersville, GA, Development Authority Waste & Water Facilities Rev., 4%, 6/01/2038 | 500,000 | 586,599 | ||
| Cherokee County, GA, Water & Sewer Authority Rev., 5%, 8/01/2021 | 385,000 | 390,974 | ||
| Columbia County, GA, Water and Sewerage Rev., 5%, 6/01/2033 | 655,000 | 861,806 | ||
| Columbus, GA, Water and Sewerage Rev., 5%, 5/01/2035 | 350,000 | 416,647 | ||
| Columbus, GA, Water and Sewerage Rev., 5%, 5/01/2036 | 150,000 | 178,586 | ||
| DeKalb County, GA, Water & Sewer Rev., ”A“, 5.25%, 10/01/2031 | 1,000,000 | 1,024,079 | ||
| DeKalb County, GA, Water & Sewer Rev., ”B“, 5.25%, 10/01/2025 | 1,000,000 | 1,208,381 | ||
| Gainesville, GA, Water and Sewerage Refunding Rev., 5%, 11/15/2024 | 500,000 | 581,949 | ||
| Guam Waterworks Authority Rev. (Water and Wastewater System), 5%, 7/01/2036 | 30,000 | 34,179 | ||
| Guam Waterworks Authority Rev. (Water and Wastewater System), 5%, 1/01/2046 | 125,000 | 140,073 | ||
| Guam Waterworks Authority Rev. (Water and Wastewater System), ”A“, 5%, 7/01/2029 | 45,000 | 49,795 | ||
| Guam Waterworks Authority Rev. (Water and Wastewater System), ”A“, 5%, 7/01/2035 | 45,000 | 49,235 | ||
| Guam Waterworks Authority Rev. (Water and Wastewater System), ”A“, 5%, 1/01/2050 | 155,000 | 186,290 | ||
| Henry County, GA, Water & Sewer Authority Rev., BHAC, 5.25%, 2/01/2027 | 1,000,000 | 1,257,520 | ||
| Issuer | Shares/Par | Value ($) | ||
| Water & Sewer Utility Revenue – continued | ||||
| Michigan Finance Authority Local Government Loan Program Rev. (Detroit Water and Sewerage Department Sewage Disposal System Rev. Refunding Second Lien Local Project), ”C-7“, NPFG, 5%, 7/01/2032 | $ | 15,000 | $ 17,053 | |
| Michigan Finance Authority Local Government Loan Program Rev. (Detroit Water and Sewerage Department Water Supply System Rev. Refunding Second Lien Local Project), ”D-6“, NPFG, 5%, 7/01/2036 | 20,000 | 22,655 | ||
| Michigan Finance Authority Local Government Loan Program Rev. (Detroit Water and Sewerage Department Water Supply System Rev. Refunding Senior Lien Local Project), ”D-1“, AGM, 5%, 7/01/2035 | 10,000 | 11,355 | ||
| Michigan Finance Authority Local Government Loan Program Rev. (Detroit Water and Sewerage Department Water Supply System Rev. Refunding Senior Lien Local Project), ”D-1“, AGM, 5%, 7/01/2037 | 20,000 | 22,662 | ||
| Oconee County, GA, Water & Sewerage Rev., ”A“, 5%, 9/01/2033 | 555,000 | 675,492 | ||
| Walton County, GA, Water & Sewer Authority Rev. (Walton-Hard Labor Creek Project), 5%, 2/01/2038 | 500,000 | 591,578 | ||
| $ 12,284,476 | ||||
| Total Municipal Bonds (Identified Cost, $130,770,327) | $137,368,211 | |||
| Bonds – 0.2% | ||||
| Consumer Services – 0.2% | ||||
| Toll Road Investors Partnership II LP, Capital Appreciation, NPFG, 0%, 2/15/2025 (n) | $ | 204,000 | $ 178,156 | |
| Toll Road Investors Partnership II LP, Capital Appreciation, NPFG, 0%, 2/15/2043 (n) | 400,000 | 113,921 | ||
| Total Bonds (Identified Cost, $312,145) | $ 292,077 | |||
| Investment Companies (h) – 3.3% | ||||
| Money Market Funds – 3.3% | ||||
| MFS Institutional Money Market Portfolio, 0.05% (v) (Identified Cost, $4,694,126) | 4,694,126 | $ 4,694,126 | ||
| Other Assets, Less Liabilities – (0.7)% | (975,275) | |||
| Net Assets – 100.0% | $141,379,139 | |||
| Issuer | Shares/Par | Value ($) | ||
| Municipal Bonds – 98.8% | ||||
| General Obligations - General Purpose – 24.7% | ||||
| Anne Arundel County, MD, Consolidated Water & Sewer, 5%, 10/01/2040 | $ | 400,000 | $ 509,534 | |
| Anne Arundel County, MD, General Obligation Consolidated Improvement Refunding, 5%, 4/01/2027 | 1,000,000 | 1,253,421 | ||
| Anne Arundel County, MD, General Obligation Consolidated Improvement Refunding, 5%, 4/01/2028 | 1,000,000 | 1,284,361 | ||
| Baltimore County, MD, Metropolitan District (80th Issue), 5%, 3/01/2033 | 1,250,000 | 1,567,396 | ||
| Baltimore County, MD, Public Improvement, 5%, 2/01/2028 | 2,000,000 | 2,080,691 | ||
| Baltimore County, MD, Public Improvement, 4%, 3/01/2037 | 1,750,000 | 2,075,801 | ||
| Bridgeview, IL, Stadium and Redevelopment Projects, AAC, 5.14%, 12/01/2036 | 225,000 | 219,945 | ||
| Commonwealth of Puerto Rico, General Obligation, ”A“, 8%, 7/01/2035 (a)(d) | 1,120,000 | 879,200 | ||
| Commonwealth of Puerto Rico, Public Improvement, ”A-4“, AGM, 5%, 7/01/2031 | 65,000 | 67,106 | ||
| Harford County, MD, Consolidated General Obligation Public Improvement, 4%, 10/01/2023 | 1,745,000 | 1,908,772 | ||
| Harford County, MD, Consolidated Public Improvement, ”A“, 5%, 10/01/2030 | 1,025,000 | 1,347,312 | ||
| Howard County, MD, Consolidated Public Improvement Project, ”A“, 5%, 8/15/2022 | 1,000,000 | 1,065,920 | ||
| Howard County, MD, Consolidated Public Improvement Project, ”A“, 5%, 8/15/2023 | 1,000,000 | 1,112,985 | ||
| Howard County, MD, Consolidated Public Improvement Project, ”A“, 5%, 8/15/2028 | 1,000,000 | 1,294,973 | ||
| Howard County, MD, Metropolitan District Project, ”C“, 4%, 2/15/2048 | 1,500,000 | 1,709,411 | ||
| Maryland State & Local Facilities Loan, General Obligation, First Series ”A“, 5%, 3/15/2027 | 1,000,000 | 1,251,924 | ||
| Maryland State & Local Facilities Loan, Tax-Exempt Refunding, Second Series ”A“, 5%, 8/01/2035 | 1,000,000 | 1,315,772 | ||
| Montgomery County, MD, Consolidated Public Improvement, ”A“, 5%, 11/01/2026 (Prerefunded 11/01/2024) | 500,000 | 583,047 | ||
| Prince George's County, MD, Consolidated Public Improvement, ”A“, 5%, 9/15/2030 (Prerefunded 9/15/2021) | 1,500,000 | 1,532,718 | ||
| Prince George's County, MD, Consolidated Public Improvement, ”A“, 5%, 7/15/2033 | 1,000,000 | 1,265,413 | ||
| Prince George's County, MD, General Obligation Consolidated Public Improvement, ”A“, 5%, 7/15/2023 | 2,500,000 | 2,773,155 | ||
| Issuer | Shares/Par | Value ($) | ||
| General Obligations - General Purpose – continued | ||||
| Puerto Rico Public Buildings Authority Rev., Guaranteed, ”D“, AAC, 5.45%, 7/01/2030 | $ | 115,000 | $ 118,462 | |
| State of Illinois, General Obligation, 5.5%, 5/01/2039 | 160,000 | 196,845 | ||
| Washington Suburban Sanitary District, MD, Consolidated Public Improvement Refunding, 5%, 6/01/2024 | 1,000,000 | 1,147,336 | ||
| $ 28,561,500 | ||||
| General Obligations - Schools – 0.0% | ||||
| Berks County, PA, Reading School District, AGM, 5%, 3/01/2036 | $ | 20,000 | $ 24,148 | |
| Healthcare Revenue - Hospitals – 17.0% | ||||
| California Statewide Communities Development Authority Rev. (Loma Linda University Medical Center), ”B“, 6%, 12/01/2024 | $ | 395,000 | $ 441,017 | |
| Chattanooga, TN, Health, Educational & Housing Facility Board Rev. (CommonSpirit Health), ”A-1“, 4%, 8/01/2044 | 5,000 | 5,548 | ||
| Chattanooga, TN, Health, Educational & Housing Facility Board Rev. (CommonSpirit Health), ”A-2“, 5%, 8/01/2044 | 10,000 | 12,125 | ||
| Chattanooga, TN, Health, Educational & Housing Facility Board Rev. (CommonSpirit Health), ”A-2“, 5%, 8/01/2049 | 5,000 | 6,017 | ||
| Colorado Health Facilities Authority Rev. (CommonSpirit Health), ”A-2“, 4%, 8/01/2044 | 55,000 | 61,025 | ||
| Doylestown, PA, Hospital Rev., ”A“, 4%, 7/01/2045 | 15,000 | 15,588 | ||
| Knox County, TN, Health, Educational & Housing Facility Board Rev. (University Health Systems, Inc.), ”A“, 5%, 9/01/2030 | 490,000 | 605,663 | ||
| Maryland Health & Higher Education Facility Authority Rev., Adventist Healthcare Issue, 5%, 1/01/2036 (w) | 750,000 | 901,961 | ||
| Maryland Health & Higher Educational Facilities Authority Rev. (Carroll Hospital), ”A“, 5%, 7/01/2037 (Prerefunded 7/01/2022) | 1,000,000 | 1,059,876 | ||
| Maryland Health & Higher Educational Facilities Authority Rev. (Doctors Community Hospital), ”A“, 5%, 7/01/2034 | 750,000 | 859,584 | ||
| Maryland Health & Higher Educational Facilities Authority Rev. (Frederick Health System), 4%, 7/01/2045 | 1,000,000 | 1,127,510 | ||
| Maryland Health & Higher Educational Facilities Authority Rev. (Johns Hopkins Health System), ”A“, 5%, 5/15/2026 (Prerefunded 5/15/2021) | 250,000 | 251,349 | ||
| Issuer | Shares/Par | Value ($) | ||
| Municipal Bonds – continued | ||||
| Healthcare Revenue - Hospitals – continued | ||||
| Maryland Health & Higher Educational Facilities Authority Rev. (LifeBridge Health), 5%, 7/01/2028 | $ | 750,000 | $ 872,820 | |
| Maryland Health & Higher Educational Facilities Authority Rev. (LifeBridge Health), 5%, 7/01/2033 | 400,000 | 470,038 | ||
| Maryland Health & Higher Educational Facilities Authority Rev. (LifeBridge Health), 4%, 7/01/2042 | 1,000,000 | 1,098,065 | ||
| Maryland Health & Higher Educational Facilities Authority Rev. (Medlantic/Helix Parent, Inc.), ”A“, AGM, 5.25%, 8/15/2038 | 1,155,000 | 1,545,262 | ||
| Maryland Health & Higher Educational Facilities Authority Rev. (MedStar Health), ”A“, 5%, 8/15/2041 | 505,000 | 550,142 | ||
| Maryland Health & Higher Educational Facilities Authority Rev. (MedStar Health), ”A“, 5%, 5/15/2042 | 750,000 | 897,445 | ||
| Maryland Health & Higher Educational Facilities Authority Rev. (Mercy Medical Center), ”A“, 5%, 7/01/2032 | 600,000 | 701,290 | ||
| Maryland Health & Higher Educational Facilities Authority Rev. (Meritus Medical Center), 5%, 7/01/2027 | 500,000 | 579,901 | ||
| Maryland Health & Higher Educational Facilities Authority Rev. (Peninsula Regional Health System), ”A“, 5%, 7/01/2035 | 500,000 | 637,340 | ||
| Maryland Health & Higher Educational Facilities Authority Rev. (Trinity Health Credit Group), ”MD“, 5%, 12/01/2046 | 1,000,000 | 1,190,691 | ||
| Maryland Health & Higher Educational Facilities Authority Rev. (University of Maryland Medical System), ”B“, 5%, 7/01/2034 | 1,000,000 | 1,198,539 | ||
| Maryland Health & Higher Educational Facilities Authority Rev. (University of Maryland Medical System), ”D“, 4%, 7/01/2048 | 1,250,000 | 1,362,246 | ||
| Maryland Health & Higher Educational Facilities Authority Rev. (Western Maryland Health System), 5.25%, 7/01/2034 (Prerefunded 7/01/2024) | 1,000,000 | 1,154,160 | ||
| Maryland Industrial Development Authority, Economic Development Rev., RIBS, AGM, 11.382%, 8/26/2022 (p) | 300,000 | 329,458 | ||
| Montgomery County, MD, Rev. (Trinity Health Corp.), 5%, 12/01/2040 (Prerefunded 12/01/2021) | 1,000,000 | 1,032,170 | ||
| Spartanburg County, SC, Regional Health Services District Hospital Rev., ”A“, 4%, 4/15/2043 | 635,000 | 697,411 | ||
| $ 19,664,241 | ||||
| Issuer | Shares/Par | Value ($) | ||
| Healthcare Revenue - Long Term Care – 3.6% | ||||
| Baltimore County, MD, Rev. (Oak Crest Village, Inc.), 4%, 1/01/2045 | $ | 1,000,000 | $ 1,100,808 | |
| Baltimore County, MD, Rev. (Riderwood Village, Inc.), 4%, 1/01/2038 | 450,000 | 499,186 | ||
| Howard County, MD, Retirement Community Rev. (Vantage House Facility), 5%, 4/01/2036 | 500,000 | 500,253 | ||
| Maryland Health & Higher Educational Facilities Authority Rev. (Charlestown Community Project), ”A“, 5%, 1/01/2045 | 500,000 | 563,459 | ||
| Rockville, MD, Mayor & Council Economic Development Rev. (Ingleside at King Farm Project), ”B“, 5%, 11/01/2042 | 350,000 | 362,670 | ||
| Washington County, MD, County Commissioners Rev. (Diakon Lutheran Social Ministries Project), ”B“, 5%, 1/01/2032 | 575,000 | 695,799 | ||
| Westminster, MD, Refunding Rev. (Carroll Lutheran Village, Inc.), 5.125%, 7/01/2040 | 400,000 | 413,764 | ||
| $ 4,135,939 | ||||
| Healthcare Revenue - Other – 0.4% | ||||
| Maryland Economic Development Corp., Economic Development Rev. (Lutheran World Relief Refugee), 5.25%, 4/01/2029 | $ | 470,000 | $ 470,961 | |
| Industrial Revenue - Other – 0.3% | ||||
| Tuscaloosa County, AL, Industrial Development Authority, Gulf Opportunity Zone (Hunt Refining Project), ”A“, 5.25%, 5/01/2044 (n) | $ | 295,000 | $ 335,243 | |
| Industrial Revenue - Paper – 0.1% | ||||
| Valparaiso, IN, Exempt Facilities Rev. (Pratt Paper LLC Project), 7%, 1/01/2044 | $ | 100,000 | $ 111,977 | |
| Miscellaneous Revenue - Other – 2.4% | ||||
| Baltimore, MD, Convention Center Hotel Rev., 5%, 9/01/2046 | $ | 45,000 | $ 45,371 | |
| Indiana Finance Authority Rev. (Ohio River Bridges East End Crossing Project), ”A“, 5%, 7/01/2040 | 105,000 | 113,432 | ||
| Maryland Economic Development Corp., Air Cargo Obligated Group Rev. (AFCO Airport Real Estate Group), 5%, 7/01/2028 | 90,000 | 111,250 | ||
| Maryland Economic Development Corp., Air Cargo Obligated Group Rev. (AFCO Airport Real Estate Group), 5%, 7/01/2029 | 210,000 | 263,431 | ||
| Maryland Economic Development Corp., Air Cargo Obligated Group Rev. (AFCO Airport Real Estate Group), 4%, 7/01/2039 | 1,100,000 | 1,248,099 | ||
| Montgomery County, MD, Transportation Fund Lease Authority Rev., ”A“, 5%, 11/01/2036 | 415,000 | 481,378 | ||
| Issuer | Shares/Par | Value ($) | ||
| Municipal Bonds – continued | ||||
| Miscellaneous Revenue - Other – continued | ||||
| New York, NY, Industrial Development Agency, Airport Facilities Rev. (Transportation Infrastructure Properties LLC), 5%, 7/01/2028 | $ | 450,000 | $ 470,558 | |
| $ 2,733,519 | ||||
| Multi-Family Housing Revenue – 6.5% | ||||
| Howard County, MD, Housing Commission Rev. (Columbia Commons Apartments), ”A“, 5%, 6/01/2044 | $ | 500,000 | $ 546,348 | |
| Howard County, MD, Housing Commission Rev. (Woodfield Oxford Square Apartments), 5%, 12/01/2037 | 750,000 | 874,585 | ||
| Maryland Community Development Administration, Department of Housing & Community Development Housing Rev., ”A“, FHA, 4%, 7/01/2048 | 500,000 | 542,961 | ||
| Maryland Community Development Administration, Department of Housing & Community Development Housing Rev., ”B“, 3.65%, 7/01/2049 | 505,000 | 540,883 | ||
| Maryland Community Development Administration, Department of Housing & Community Development Housing Rev., ”D“, 3.35%, 7/01/2049 | 1,765,000 | 1,877,706 | ||
| Montgomery County, MD, Housing Opportunities Commission, Multi-Family Housing Development Rev., ”A-1“, FHA, 3.05%, 7/01/2044 | 1,000,000 | 1,054,426 | ||
| Montgomery County, MD, Housing Opportunities Commission, Multi-Family Housing Development Rev., ”C“, 5.125%, 7/01/2037 | 1,000,000 | 1,007,592 | ||
| Montgomery County, MD, Housing Opportunities Commission, Multi-Family Housing Development Rev., “C”, 3.1%, 7/01/2036 | 1,065,000 | 1,097,403 | ||
| $ 7,541,904 | ||||
| Parking – 1.2% | ||||
| Maryland Health & Higher Educational Facilities Authority Rev. (Johns Hopkins Medical Institutions), AAC, 5%, 7/01/2034 | $ | 1,385,000 | $ 1,396,762 | |
| Port Revenue – 1.4% | ||||
| Maryland Economic Development Corp. Rev. (Terminal Project), ”A“, 5%, 6/01/2044 | $ | 500,000 | $ 554,824 | |
| Maryland Economic Development Corp. Rev. (Terminal Project), ”A“, 5%, 6/01/2049 | 250,000 | 276,088 | ||
| Maryland Economic Development Corp. Rev. (Transportation Facilities Project), ”A“, 5%, 6/01/2031 | 650,000 | 753,358 | ||
| $ 1,584,270 | ||||
| Issuer | Shares/Par | Value ($) | ||
| Sales & Excise Tax Revenue – 2.2% | ||||
| Guam Government Business Privilege Tax Rev., ”A“, 5.25%, 1/01/2036 | $ | 260,000 | $ 268,291 | |
| Illinois Sales Tax Securitization Corp., Second Lien, ”A“, 5%, 1/01/2026 | 40,000 | 47,186 | ||
| Illinois Sales Tax Securitization Corp., Second Lien, ”A“, 5%, 1/01/2027 | 90,000 | 108,718 | ||
| Illinois Sales Tax Securitization Corp., Second Lien, ”A“, 5%, 1/01/2028 | 80,000 | 98,607 | ||
| Illinois Sales Tax Securitization Corp., Second Lien, ”A“, 5%, 1/01/2029 | 15,000 | 18,790 | ||
| Illinois Sales Tax Securitization Corp., Second Lien, ”A“, 5%, 1/01/2030 | 40,000 | 50,856 | ||
| Illinois Sales Tax Securitization Corp., Second Lien, ”A“, 5%, 1/01/2036 | 35,000 | 43,322 | ||
| Illinois Sales Tax Securitization Corp., Second Lien, ”A“, 5%, 1/01/2037 | 50,000 | 62,033 | ||
| Illinois Sales Tax Securitization Corp., Second Lien, ”A“, 4%, 1/01/2038 | 40,000 | 45,602 | ||
| Illinois Sales Tax Securitization Corp., Second Lien, ”A“, 4%, 1/01/2040 | 25,000 | 28,456 | ||
| Puerto Rico Sales Tax Financing Corp., Restructured Sales Tax Rev., ”2019A-1“, 4.55%, 7/01/2040 | 21,000 | 22,760 | ||
| Puerto Rico Sales Tax Financing Corp., Restructured Sales Tax Rev., ”2019A-1“, 5%, 7/01/2058 | 31,000 | 34,136 | ||
| Puerto Rico Sales Tax Financing Corp., Restructured Sales Tax Rev., ”2019A-2“, 4.329%, 7/01/2040 | 241,000 | 257,802 | ||
| Puerto Rico Sales Tax Financing Corp., Restructured Sales Tax Rev., ”2019A-2“, 4.329%, 7/01/2040 | 75,000 | 80,229 | ||
| Puerto Rico Sales Tax Financing Corp., Restructured Sales Tax Rev., ”2019A-2“, 4.784%, 7/01/2058 | 46,000 | 49,777 | ||
| Puerto Rico Sales Tax Financing Corp., Restructured Sales Tax Rev., Capital Appreciation, ”2019A-1“, 0%, 7/01/2024 | 3,000 | 2,816 | ||
| Puerto Rico Sales Tax Financing Corp., Restructured Sales Tax Rev., Capital Appreciation, ”2019A-1“, 0%, 7/01/2027 | 36,000 | 31,539 | ||
| Puerto Rico Sales Tax Financing Corp., Restructured Sales Tax Rev., Capital Appreciation, ”2019A-1“, 0%, 7/01/2029 | 6,000 | 4,941 | ||
| Puerto Rico Sales Tax Financing Corp., Restructured Sales Tax Rev., Capital Appreciation, ”2019A-1“, 0%, 7/01/2031 | 338,000 | 258,685 | ||
| Puerto Rico Sales Tax Financing Corp., Restructured Sales Tax Rev., Capital Appreciation, ”2019A-1“, 0%, 7/01/2033 | 332,000 | 235,661 | ||
| Puerto Rico Sales Tax Financing Corp., Restructured Sales Tax Rev., Capital Appreciation, ”2019A-1“, 0%, 7/01/2046 | 2,229,000 | 680,224 | ||
| Issuer | Shares/Par | Value ($) | ||
| Municipal Bonds – continued | ||||
| Sales & Excise Tax Revenue – continued | ||||
| Wisconsin Public Finance Authority Limited Obligation Grant Rev. (American Dream at Meadowlands Project), ”A“, 6.25%, 8/01/2027 (n) | $ | 120,000 | $ 130,403 | |
| $ 2,560,834 | ||||
| Secondary Schools – 0.2% | ||||
| District of Columbia Rev. (Rocketship D.C.), ”A“, 5%, 6/01/2039 (n) | $ | 250,000 | $ 278,796 | |
| Single Family Housing - Local – 0.7% | ||||
| Montgomery County, MD, Housing Opportunities Commission Program Rev., ”A“, 4%, 7/01/2049 | $ | 510,000 | $ 569,729 | |
| Montgomery County, MD, Housing Opportunities Commission, Single Family Mortgage Rev., ”A“, FHA, 3.85%, 1/01/2042 | 200,000 | 214,842 | ||
| $ 784,571 | ||||
| Single Family Housing - State – 4.1% | ||||
| Connecticut Housing Finance Authority Rev. (Housing Mortgage Finance Program), ”D-1“, GNMA, 4%, 11/15/2047 | $ | 380,000 | $ 410,709 | |
| Iowa Finance Authority, Single Family Mortgage Rev., ”A“, GNMA, 4%, 7/01/2047 | 415,000 | 448,127 | ||
| Maryland Community Development Administration, Department of Housing & Community Development Housing Rev., ”A“, 3.75%, 9/01/2039 | 450,000 | 483,340 | ||
| Maryland Community Development Administration, Department of Housing & Community Development Housing Rev., ”A“, 4.25%, 9/01/2049 | 420,000 | 469,488 | ||
| Maryland Community Development Administration, Department of Housing & Community Development Residential Rev., “C”, 5%, 3/01/2031 | 1,150,000 | 1,453,041 | ||
| Maryland Community Development Administration, Department of Housing & Community Development Residential Rev., “C”, 3%, 9/01/2039 | 1,000,000 | 1,043,792 | ||
| Pennsylvania Housing Finance Agency, Single Family Mortgage Rev., “125A”, 3.7%, 10/01/2037 | 455,000 | 488,665 | ||
| $ 4,797,162 | ||||
| State & Local Agencies – 5.7% | ||||
| Colorado State University Board of Governors, System Enterprise Refunding Rev., ”E“, 4%, 3/01/2043 | $ | 455,000 | $ 516,747 | |
| Delaware Valley, PA, Regional Finance Authority, ”C“, FLR, 0.878% (LIBOR - 3mo. + 0.75%), 6/01/2037 | 665,000 | 651,838 | ||
| Issuer | Shares/Par | Value ($) | ||
| State & Local Agencies – continued | ||||
| Maryland Stadium Authority Rev., Baltimore City Public Schools Construction and Revitalization Program, 5%, 5/01/2041 (Prerefunded 5/01/2026) | $ | 500,000 | $ 609,184 | |
| Maryland Stadium Authority Rev., Baltimore City Public Schools Construction and Revitalization Program, ”A“, 5%, 5/01/2038 | 500,000 | 603,578 | ||
| Maryland Stadium Authority Rev., Baltimore City Public Schools Construction and Revitalization Program, ”A“, 5%, 5/01/2047 (Prerefunded 5/01/2028) | 110,000 | 140,574 | ||
| Maryland Stadium Authority Rev., Baltimore City Public Schools Construction and Revitalization Program, ”A“, 5%, 5/01/2047 | 225,000 | 267,553 | ||
| Montgomery County, MD, COP (Master Lease Refunding), ”B“, 4%, 4/01/2021 | 1,000,000 | 1,000,000 | ||
| New Jersey Economic Development Authority Rev. (School Facilities Construction), 5%, 6/15/2032 | 5,000 | 6,336 | ||
| New Jersey Economic Development Authority Rev. (School Facilities Construction), 4%, 6/15/2034 | 5,000 | 5,758 | ||
| New Jersey Economic Development Authority Rev. (School Facilities Construction), 4%, 6/15/2035 | 20,000 | 22,967 | ||
| New Jersey Economic Development Authority Rev. (School Facilities Construction), 4%, 6/15/2036 | 10,000 | 11,439 | ||
| New Jersey Economic Development Authority Rev. (School Facilities Construction), 4%, 6/15/2037 | 10,000 | 11,396 | ||
| New Jersey Economic Development Authority Rev. (School Facilities Construction), 4%, 6/15/2038 | 15,000 | 17,040 | ||
| New Jersey Economic Development Authority Rev. (School Facilities Construction), 4%, 6/15/2039 | 15,000 | 17,003 | ||
| New Jersey Economic Development Authority Rev. (School Facilities Construction), 4%, 6/15/2040 | 20,000 | 22,630 | ||
| New Jersey Economic Development Authority Rev. (School Facilities Construction), 4%, 6/15/2041 | 10,000 | 11,281 | ||
| New Jersey Economic Development Authority Rev. (School Facilities Construction), ”AAA“, 5%, 6/15/2026 | 100,000 | 120,080 | ||
| New Jersey Economic Development Authority Rev. (School Facilities Construction), ”LLL“, 5%, 6/15/2039 | 230,000 | 278,757 | ||
| Prince George's County, MD, COP (Suitland Public Infrastructure), 3%, 10/01/2038 | 1,000,000 | 1,066,601 | ||
| Prince George's County, MD, COP (University of Maryland Capital Region Medical Center), 5%, 10/01/2037 | 1,000,000 | 1,250,458 | ||
| $ 6,631,220 | ||||
| Issuer | Shares/Par | Value ($) | ||
| Municipal Bonds – continued | ||||
| Student Loan Revenue – 0.1% | ||||
| Iowa Student Loan Liquidity Corp. Rev., ”B“, 3%, 12/01/2039 | $ | 45,000 | $ 44,453 | |
| Iowa Student Loan Liquidity Corp. Rev., ”B“, 3.5%, 12/01/2044 | 115,000 | 115,738 | ||
| $ 160,191 | ||||
| Tax - Other – 0.3% | ||||
| Puerto Rico Convention Center District Authority, Hotel Occupancy Tax Rev., ”A“, AAC, 5%, 7/01/2031 | $ | 110,000 | $ 112,548 | |
| Virgin Islands Public Finance Authority Rev., Matching Fund Loan Note, ”B“, AGM, 5%, 10/01/2025 | 150,000 | 154,418 | ||
| Wisconsin Public Finance Authority Limited Obligation PILOT Rev. (American Dream at Meadowlands Project), 7%, 12/01/2050 | 100,000 | 115,476 | ||
| $ 382,442 | ||||
| Tax Assessment – 4.6% | ||||
| Baltimore, MD, Special Obligation (East Baltimore Research Park Project), ”A“, 5%, 9/01/2038 | $ | 500,000 | $ 540,304 | |
| Baltimore, MD, Special Obligation Rev. (Harbor Point Project), ”B“, 3.875%, 6/01/2046 (n) | 300,000 | 301,933 | ||
| Brunswick, MD, Special Obligation Refunding (Brunswick Crossing Special Taxing District), 5%, 7/01/2036 | 500,000 | 589,752 | ||
| Frederick County, MD, Limited Obligation (Jefferson Technology Park Project), ”B“, 4.625%, 7/01/2043 (n) | 250,000 | 285,918 | ||
| Frederick County, MD, Limited Obligation (Oakdale-Lake Linganore Project), 3.75%, 7/01/2039 | 500,000 | 517,192 | ||
| Frederick County, MD, Senior Special Obligation (Urbana Community Development Authority), ”A“, 4%, 7/01/2035 | 500,000 | 587,899 | ||
| Frederick County, MD, Senior Special Obligation (Urbana Community Development Authority), ”B“, 4%, 7/01/2040 | 210,000 | 231,811 | ||
| Frederick County, MD, Special Tax Limited Obligation Refunding (Jefferson Technology Park Project), ”A“, 5%, 7/01/2043 (n) | 250,000 | 283,639 | ||
| Howard County, MD, Special Obligation (Annapolis Junction Town Center Project), 6.1%, 2/15/2044 | 230,000 | 227,187 | ||
| Howard County, MD, Special Obligation (Downtown Columbia Project), ”A“, 4.5%, 2/15/2047 (n) | 300,000 | 312,477 | ||
| Maryland Economic Development Corp., Special Obligation (Port Covington Project), 4%, 9/01/2050 (n) | 500,000 | 538,999 | ||
| Prince George's County, MD, Special Obligation (National Harbor Project), 5.2%, 7/01/2034 | 414,000 | 417,087 | ||
| Issuer | Shares/Par | Value ($) | ||
| Tax Assessment – continued | ||||
| Prince George's County, MD, Special Obligation (Westphalia Town Center Project), 5.25%, 7/01/2048 (n) | $ | 400,000 | $ 438,583 | |
| $ 5,272,781 | ||||
| Tobacco – 0.5% | ||||
| Buckeye, OH, Tobacco Settlement Financing Authority Senior Asset-Backed Refunding, 2020A-2, ”1“, 5%, 6/01/2036 | $ | 75,000 | $ 93,930 | |
| Buckeye, OH, Tobacco Settlement Financing Authority Senior Asset-Backed Refunding, 2020B-3, Capital Appreciation, ”2“, 0%, 6/01/2057 | 1,400,000 | 211,692 | ||
| Illinois Railsplitter Tobacco Settlement Authority Rev., 6%, 6/01/2028 (Prerefunded 6/01/2021) | 215,000 | 216,969 | ||
| $ 522,591 | ||||
| Transportation - Special Tax – 5.2% | ||||
| Commonwealth of Puerto Rico Highway & Transportation Authority Rev., ”L“, AAC, 5.25%, 7/01/2038 | $ | 510,000 | $ 574,107 | |
| Commonwealth of Puerto Rico Highway & Transportation Authority Rev., ”N“, AAC, 5.5%, 7/01/2029 | 355,000 | 394,313 | ||
| Commonwealth of Puerto Rico Highway & Transportation Authority Rev., ”N“, AAC, 5.25%, 7/01/2031 | 360,000 | 396,691 | ||
| Commonwealth of Puerto Rico Highway & Transportation Authority Rev., ”N“, NPFG, 5.25%, 7/01/2032 | 200,000 | 221,826 | ||
| Commonwealth of Puerto Rico Highway & Transportation Authority Rev., ”N“, NPFG, 5.25%, 7/01/2033 | 165,000 | 182,831 | ||
| Maryland Transportation Authority Facilities Projects Rev., ”A“, 5%, 7/01/2029 (w) | 750,000 | 981,008 | ||
| Metropolitan Transportation Authority Rev., NY, Anticipation Note, ”B-2“, 5%, 5/15/2021 | 365,000 | 366,754 | ||
| Metropolitan Transportation Authority Rev., NY, Anticipation Note, ”D-1“, 5%, 9/01/2022 | 265,000 | 280,825 | ||
| New Jersey Transportation Trust Fund Authority, ”AA“, 5%, 6/15/2045 | 60,000 | 72,836 | ||
| New Jersey Transportation Trust Fund Authority, Transportation System, ”A“, 5.25%, 12/15/2021 | 60,000 | 62,080 | ||
| Washington, D.C., Metropolitan Area Transit Authority Gross Rev., 5%, 7/01/2037 | 440,000 | 532,319 | ||
| Washington, D.C., Metropolitan Area Transit Authority Gross Rev., 5%, 7/01/2038 | 440,000 | 531,188 | ||
| Washington, D.C., Metropolitan Area Transit Authority Gross Rev., ”B“, 5%, 7/01/2042 | 1,140,000 | 1,366,020 | ||
| $ 5,962,798 | ||||
| Issuer | Shares/Par | Value ($) | ||
| Municipal Bonds – continued | ||||
| Universities - Colleges – 7.9% | ||||
| Maryland Health & Higher Educational Facilities Authority Rev. (Goucher College), ”A“, 5%, 7/01/2034 | $ | 500,000 | $ 523,357 | |
| Maryland Health & Higher Educational Facilities Authority Rev. (Goucher College), ”A“, 5%, 7/01/2044 | 500,000 | 579,015 | ||
| Maryland Health & Higher Educational Facilities Authority Rev. (Johns Hopkins University), ”A“, 5%, 7/01/2037 (Prerefunded 7/01/2022) | 1,500,000 | 1,590,783 | ||
| Maryland Health & Higher Educational Facilities Authority Rev. (Loyola University Maryland), 5%, 10/01/2032 | 500,000 | 566,581 | ||
| Maryland Health & Higher Educational Facilities Authority Rev. (Loyola University Maryland), “A”, 5%, 10/01/2049 | 1,000,000 | 1,215,621 | ||
| Maryland Health & Higher Educational Facilities Authority Rev. (Maryland Institute College of Art Issue), 5%, 6/01/2033 | 450,000 | 510,700 | ||
| Maryland Health & Higher Educational Facilities Authority Rev. (Notre Dame College), 5%, 10/01/2035 | 1,000,000 | 1,001,064 | ||
| Maryland Health & Higher Educational Facilities Authority Rev. (Stevenson University), “A”, 4%, 6/01/2046 | 750,000 | 828,082 | ||
| Maryland Health & Higher Educational Facilities Authority Rev. (Stevenson University), “A”, 4%, 6/01/2051 | 250,000 | 275,172 | ||
| Morgan State University, Academic & Auxiliary Facilities Fees Rev., 5%, 7/01/2030 (Prerefunded 7/01/2022) | 150,000 | 158,982 | ||
| Morgan State University, Academic & Auxiliary Facilities Fees Rev., 5%, 7/01/2032 (Prerefunded 7/01/2022) | 440,000 | 466,346 | ||
| Puerto Rico Industrial, Tourist, Educational, Medical & Environmental Control Facilities Financing Authority, Higher Education Rev. (Ana G. Mendez University System Project), 5.125%, 4/01/2032 | 30,000 | 30,398 | ||
| Puerto Rico Industrial, Tourist, Educational, Medical & Environmental Control Facilities Financing Authority, Higher Education Rev. (Ana G. Mendez University System Project), 5.375%, 4/01/2042 | 135,000 | 137,025 | ||
| Puerto Rico Industrial, Tourist, Educational, Medical & Environmental Control Facilities Financing Authority, Higher Education Rev. (International American University of Puerto Rico Project), 5%, 10/01/2031 | 85,000 | 88,083 | ||
| University System of Maryland, Auxiliary Facility & Tuition Rev., ”D“, 5%, 10/01/2022 | 1,000,000 | 1,072,415 | ||
| Issuer | Shares/Par | Value ($) | ||
| Universities - Colleges – continued | ||||
| Virginia College Building Authority, Educational Facilities Rev. (Marymount University Project), ”B“, 5.25%, 7/01/2035 (n) | $ | 110,000 | $ 117,070 | |
| $ 9,160,694 | ||||
| Universities - Dormitories – 3.6% | ||||
| California Municipal Finance Authority, Student Housing Rev. (CHF-Davis I LLC - West Village Student Housing Project), BAM, 5%, 5/15/2051 | $ | 660,000 | $ 785,260 | |
| Maryland Economic Development Corp., Senior Student Housing Rev. (University of Maryland, College Park Projects), AGM, 5%, 6/01/2035 | 750,000 | 871,227 | ||
| Maryland Economic Development Corp., Student Housing Rev. (Bowie State University Project), 4%, 7/01/2040 | 500,000 | 552,331 | ||
| Maryland Economic Development Corp., Student Housing Rev. (Morgan State University Project), 5%, 7/01/2050 | 1,000,000 | 1,179,745 | ||
| Maryland Economic Development Corp., Student Housing Rev. (Salisbury University Project), 5%, 6/01/2027 | 500,000 | 521,554 | ||
| Maryland Economic Development Corp., Student Housing Rev. (Salisbury University Project), 5%, 6/01/2030 | 300,000 | 311,556 | ||
| $ 4,221,673 | ||||
| Utilities - Cogeneration – 0.2% | ||||
| Puerto Rico Industrial, Tourist, Educational, Medical & Environmental Control Facilities Financing Authority Rev. (Cogeneration Facilities - AES Puerto Rico Project), 9.12%, 6/01/2022 | $ | 245,000 | $ 251,125 | |
| Utilities - Municipal Owned – 0.9% | ||||
| Puerto Rico Electric Power Authority Rev., ”A“, 5%, 7/01/2029 (a)(d) | $ | 250,000 | $ 226,250 | |
| Puerto Rico Electric Power Authority Rev., ”A“, 5%, 7/01/2042 (a)(d) | 40,000 | 36,200 | ||
| Puerto Rico Electric Power Authority Rev., ”AAA“, 5.25%, 7/01/2021 (a)(d) | 20,000 | 18,150 | ||
| Puerto Rico Electric Power Authority Rev., ”AAA“, 5.25%, 7/01/2030 (a)(d) | 10,000 | 9,075 | ||
| Puerto Rico Electric Power Authority Rev., ”CCC“, 5.25%, 7/01/2027 (a)(d) | 95,000 | 86,212 | ||
| Puerto Rico Electric Power Authority Rev., ”DDD“, 5%, 7/01/2020 (a)(d) | 10,000 | 9,025 | ||
| Puerto Rico Electric Power Authority Rev., ”DDD“, 5%, 7/01/2021 (a)(d) | 100,000 | 90,500 | ||
| Puerto Rico Electric Power Authority Rev., ”DDD“, 5%, 7/01/2022 (a)(d) | 160,000 | 144,800 | ||
| Puerto Rico Electric Power Authority Rev., ”EEE“, 6.05%, 7/01/2032 (a)(d) | 50,000 | 44,313 | ||
| Puerto Rico Electric Power Authority Rev., ”TT“, 5%, 7/01/2021 (a)(d) | 45,000 | 40,725 | ||
| Issuer | Shares/Par | Value ($) | ||
| Municipal Bonds – continued | ||||
| Utilities - Municipal Owned – continued | ||||
| Puerto Rico Electric Power Authority Rev., ”TT“, 5%, 7/01/2023 (a)(d) | $ | 40,000 | $ 36,200 | |
| Puerto Rico Electric Power Authority Rev., ”TT“, 5%, 7/01/2027 (a)(d) | 10,000 | 9,050 | ||
| Puerto Rico Electric Power Authority Rev., ”TT“, 5%, 7/01/2037 (a)(d) | 125,000 | 113,125 | ||
| Puerto Rico Electric Power Authority Rev., ”VV“, NPFG, 5.25%, 7/01/2034 | 10,000 | 11,064 | ||
| Puerto Rico Electric Power Authority Rev., ”WW“, 5.375%, 7/01/2022 (a)(d) | 10,000 | 9,088 | ||
| Puerto Rico Electric Power Authority Rev., ”WW“, 5.25%, 7/01/2025 (a)(d) | 20,000 | 18,150 | ||
| Puerto Rico Electric Power Authority Rev., ”ZZ“, 5%, 7/01/2018 (a)(d) | 60,000 | 53,475 | ||
| Puerto Rico Electric Power Authority Rev., ”ZZ“, 5.25%, 7/01/2023 (a)(d) | 65,000 | 58,987 | ||
| Puerto Rico Electric Power Authority Rev., ”ZZ“, 5.25%, 7/01/2024 (a)(d) | 20,000 | 18,150 | ||
| Puerto Rico Electric Power Authority Rev., ”ZZ“, 5.25%, 7/01/2026 (a)(d) | 65,000 | 58,988 | ||
| $ 1,091,527 | ||||
| Utilities - Other – 0.4% | ||||
| Tennessee Energy Acquisition Corp., Gas Rev., ”A“, 5.25%, 9/01/2021 | $ | 195,000 | $ 198,944 | |
| Tennessee Energy Acquisition Corp., Gas Rev., ”A“, 5.25%, 9/01/2022 | 100,000 | 106,811 | ||
| Tennessee Energy Acquisition Corp., Gas Rev., ”A“, 5.25%, 9/01/2023 | 140,000 | 155,608 | ||
| $ 461,363 | ||||
| Water & Sewer Utility Revenue – 4.6% | ||||
| Baltimore, MD, Project Rev. (Mayor and City Council of Baltimore Water Projects), ”A“, 5%, 7/01/2032 | $ | 410,000 | $ 543,542 | |
| Baltimore, MD, Project Rev. (Mayor and City Council of Baltimore Water Projects), ”A“, 5%, 7/01/2033 | 305,000 | 402,605 | ||
| Baltimore, MD, Project Rev. (Mayor and City Council of Baltimore Water Projects), ”A“, 5%, 7/01/2034 | 600,000 | 789,072 | ||
| Baltimore, MD, Refunding Rev. (Mayor and City Council of Baltimore Water Projects), ”B“, 5%, 7/01/2042 (Prerefunded 1/01/2024) | 1,320,000 | 1,490,642 | ||
| Guam Waterworks Authority Rev. (Water and Wastewater System), 5%, 7/01/2036 | 20,000 | 22,786 | ||
| Guam Waterworks Authority Rev. (Water and Wastewater System), 5%, 1/01/2046 | 105,000 | 117,661 | ||
| Guam Waterworks Authority Rev. (Water and Wastewater System), ”A“, 5%, 7/01/2029 | 205,000 | 226,842 | ||
| Issuer | Shares/Par | Value ($) | ||
| Water & Sewer Utility Revenue – continued | ||||
| Guam Waterworks Authority Rev. (Water and Wastewater System), ”A“, 5%, 7/01/2035 | $ | 205,000 | $ 224,293 | |
| Guam Waterworks Authority Rev. (Water and Wastewater System), ”A“, 5%, 1/01/2050 | 130,000 | 156,243 | ||
| Michigan Finance Authority Local Government Loan Program Rev. (Detroit Water and Sewerage Department Sewage Disposal System Rev. Refunding Second Lien Local Project), ”C-7“, NPFG, 5%, 7/01/2032 | 25,000 | 28,422 | ||
| Michigan Finance Authority Local Government Loan Program Rev. (Detroit Water and Sewerage Department Water Supply System Rev. Refunding Second Lien Local Project), ”D-6“, NPFG, 5%, 7/01/2036 | 30,000 | 33,982 | ||
| Michigan Finance Authority Local Government Loan Program Rev. (Detroit Water and Sewerage Department Water Supply System Rev. Refunding Senior Lien Local Project), ”D-1“, AGM, 5%, 7/01/2035 | 15,000 | 17,032 | ||
| Michigan Finance Authority Local Government Loan Program Rev. (Detroit Water and Sewerage Department Water Supply System Rev. Refunding Senior Lien Local Project), ”D-1“, AGM, 5%, 7/01/2037 | 35,000 | 39,658 | ||
| Mississippi Development Bank Special Obligation (Jackson Water and Sewer System Rev. Bond Project), AGM, 6.875%, 12/01/2040 | 50,000 | 57,567 | ||
| Montgomery County, MD, Water Quality Protection Charge Rev., ”A“, 5%, 4/01/2032 | 1,125,000 | 1,128,707 | ||
| $ 5,279,054 | ||||
| Total Municipal Bonds (Identified Cost, $109,047,498) | $114,379,286 | |||
| Bonds – 0.2% | ||||
| Consumer Services – 0.2% | ||||
| Toll Road Investors Partnership II LP, Capital Appreciation, NPFG, 0%, 2/15/2025 (n) | $ | 165,000 | $ 144,096 | |
| Toll Road Investors Partnership II LP, Capital Appreciation, NPFG, 0%, 2/15/2043 (n) | 400,000 | 113,922 | ||
| Total Bonds (Identified Cost, $277,422) | $ 258,018 | |||
| Investment Companies (h) – 1.5% | ||||
| Money Market Funds – 1.5% | ||||
| MFS Institutional Money Market Portfolio, 0.05% (v) (Identified Cost, $1,711,689) | 1,711,689 | $ 1,711,689 | ||
| Other Assets, Less Liabilities – (0.5)% | (570,197) | |||
| Net Assets – 100.0% | $115,778,796 | |||
| Issuer | Shares/Par | Value ($) | ||
| Municipal Bonds – 98.4% | ||||
| Airport Revenue – 6.1% | ||||
| Massachusetts Port Authority Rev., ”A“, 5%, 7/01/2038 | $ | 2,000,000 | $ 2,478,163 | |
| Massachusetts Port Authority Rev., ”A“, 5%, 7/01/2040 | 2,755,000 | 3,397,333 | ||
| Massachusetts Port Authority Rev., ”A“, 5%, 7/01/2042 | 3,000,000 | 3,565,408 | ||
| Massachusetts Port Authority Rev., ”A“, 5%, 7/01/2047 | 1,500,000 | 1,775,314 | ||
| Massachusetts Port Authority Rev., ”B“, 5%, 7/01/2043 | 3,625,000 | 4,217,161 | ||
| Massachusetts Port Authority Rev., ”C“, 5%, 7/01/2044 | 3,000,000 | 3,662,929 | ||
| Massachusetts Port Authority Rev., ”E“, 5%, 7/01/2029 | 620,000 | 796,998 | ||
| Massachusetts Port Authority Rev., ”E“, 5%, 7/01/2030 | 500,000 | 651,423 | ||
| Massachusetts Port Authority Rev., ”E“, 5%, 7/01/2031 | 1,000,000 | 1,325,606 | ||
| Massachusetts Port Authority Rev., ”E“, 5%, 7/01/2032 | 1,590,000 | 2,097,771 | ||
| $ 23,968,106 | ||||
| General Obligations - General Purpose – 12.2% | ||||
| Barnstable, MA, General Obligation, 5%, 3/15/2026 | $ | 500,000 | $ 609,787 | |
| Barnstable, MA, General Obligation, 5%, 3/15/2027 | 665,000 | 834,735 | ||
| Barnstable, MA, General Obligation, 5%, 3/15/2029 | 685,000 | 900,880 | ||
| Beverly, MA, General Obligation, 5%, 3/15/2027 | 1,200,000 | 1,503,899 | ||
| Beverly, MA, General Obligation, 5%, 3/15/2028 | 1,330,000 | 1,707,480 | ||
| Beverly, MA, General Obligation, 5%, 3/15/2029 | 455,000 | 595,953 | ||
| Bridgeview, IL, Stadium and Redevelopment Projects, AAC, 5.14%, 12/01/2036 | 705,000 | 689,160 | ||
| Chicago, IL, General Obligation, ”A“, 5%, 1/01/2025 | 535,000 | 604,344 | ||
| Chicago, IL, General Obligation, ”A“, 5%, 1/01/2026 | 145,000 | 167,656 | ||
| Chicago, IL, General Obligation, ”A“, 5%, 1/01/2027 | 170,000 | 200,562 | ||
| Commonwealth of Massachusetts, ”B“, 5.25%, 8/01/2023 | 1,000,000 | 1,116,796 | ||
| Commonwealth of Massachusetts, ”B“, 5.25%, 8/01/2028 | 2,225,000 | 2,914,642 | ||
| Commonwealth of Massachusetts, General Obligation Consolidated Loan, ”D“, 4%, 2/01/2044 | 2,000,000 | 2,254,609 | ||
| Issuer | Shares/Par | Value ($) | ||
| General Obligations - General Purpose – continued | ||||
| Commonwealth of Massachusetts, General Obligation Consolidated Loan, ”D“, 4%, 2/01/2046 | $ | 2,600,000 | $ 2,922,636 | |
| Commonwealth of Massachusetts, General Obligation Consolidated Loan, ”E“, 5%, 11/01/2032 | 2,250,000 | 2,991,334 | ||
| Commonwealth of Massachusetts, General Obligation Consolidated Loan, ”E“, 5%, 11/01/2033 | 1,740,000 | 2,299,581 | ||
| Commonwealth of Massachusetts, General Obligation Consolidated Loan, ”E“, 4.5%, 8/01/2042 (Prerefunded 8/01/2021) | 5,000,000 | 5,071,018 | ||
| Commonwealth of Massachusetts, General Obligation Consolidated Loan, ”F“, 5%, 11/01/2042 | 3,000,000 | 3,728,318 | ||
| Commonwealth of Massachusetts, General Obligation Consolidated Loan, ”I“, 5%, 12/01/2034 | 1,000,000 | 1,224,199 | ||
| Commonwealth of Puerto Rico, General Obligation, ”A“, 8%, 7/01/2035 (a)(d) | 3,880,000 | 3,045,800 | ||
| Commonwealth of Puerto Rico, Public Improvement, ”A“, AGM, 5%, 7/01/2035 | 445,000 | 459,998 | ||
| Dennis-Yarmouth, MA, Regional School District, 2%, 10/06/2021 | 5,000,000 | 5,047,498 | ||
| Hanover, MA, General Obligation, 1%, 2/24/2022 | 1,581,783 | 1,592,835 | ||
| Longmeadow, MA, General Obligation, 5%, 5/15/2025 | 810,000 | 960,013 | ||
| Massachusetts Turnpike Authority, Metropolitan Highway System Rev., Capital Appreciation, ”A“, NPFG, 0%, 1/01/2029 | 1,560,000 | 1,387,911 | ||
| Puerto Rico Public Buildings Authority Government Facilities Rev., ”M-2“, AAC, 10%, 7/01/2035 | 510,000 | 535,962 | ||
| State of Illinois, 5%, 6/01/2021 | 2,175,000 | 2,190,245 | ||
| State of Illinois, General Obligation, 5.5%, 5/01/2039 | 280,000 | 344,478 | ||
| State of Illinois, General Obligation, 5.75%, 5/01/2045 | 255,000 | 317,206 | ||
| $ 48,219,535 | ||||
| General Obligations - Schools – 0.4% | ||||
| San Marcos, CA, Unified School District (Election of 2010), Capital Appreciation, ”C“, 0%, 8/01/2038 (Prerefunded 2/15/2024) | $ | 3,375,000 | $ 1,565,089 | |
| Healthcare Revenue - Hospitals – 12.8% | ||||
| California Statewide Communities Development Authority Rev. (Loma Linda University Medical Center), ”B“, 6%, 12/01/2024 | $ | 1,385,000 | $ 1,546,351 | |
| Issuer | Shares/Par | Value ($) | ||
| Municipal Bonds – continued | ||||
| Healthcare Revenue - Hospitals – continued | ||||
| Jefferson Parish, LA, Hospital Service District No. 2 Hospital Rev. (East Jefferson General Hospital), 6.25%, 7/01/2031 (Prerefunded 7/01/2021) | $ | 235,000 | $ 238,416 | |
| Jefferson Parish, LA, Hospital Service District No. 2 Hospital Rev. (East Jefferson General Hospital), 6.375%, 7/01/2041 (Prerefunded 7/01/2021) | 345,000 | 350,118 | ||
| Massachusetts Development Finance Agency Rev. (Atrius Health Issue), ”A“, 4%, 6/01/2049 | 1,500,000 | 1,667,790 | ||
| Massachusetts Development Finance Agency Rev. (Baystate Medical Center), ”N“, 5%, 7/01/2044 | 2,000,000 | 2,232,775 | ||
| Massachusetts Development Finance Agency Rev. (Beth Israel Lahey Health), ”K“, 5%, 7/01/2036 | 635,000 | 793,678 | ||
| Massachusetts Development Finance Agency Rev. (Beth Israel Lahey Health), ”K“, 5%, 7/01/2037 | 850,000 | 1,059,010 | ||
| Massachusetts Development Finance Agency Rev. (Beth Israel Lahey Health), ”K“, 5%, 7/01/2038 | 700,000 | 869,774 | ||
| Massachusetts Development Finance Agency Rev. (CareGroup), ”I“, 5%, 7/01/2037 | 1,000,000 | 1,186,337 | ||
| Massachusetts Development Finance Agency Rev. (CareGroup), ”J-2“, 5%, 7/01/2036 | 1,000,000 | 1,227,519 | ||
| Massachusetts Development Finance Agency Rev. (CareGroup), ”J-2“, 5%, 7/01/2037 | 1,000,000 | 1,224,008 | ||
| Massachusetts Development Finance Agency Rev. (Children's Hospital), ”P“, 5%, 10/01/2032 | 1,000,000 | 1,135,578 | ||
| Massachusetts Development Finance Agency Rev. (Dana-Farber Cancer Institute), ”N“, 5%, 12/01/2041 | 1,690,000 | 1,992,288 | ||
| Massachusetts Development Finance Agency Rev. (Dana-Farber Cancer Institute), ”O“, 5%, 12/01/2029 | 100,000 | 128,953 | ||
| Massachusetts Development Finance Agency Rev. (Dana-Farber Cancer Institute), ”O“, 5%, 12/01/2030 | 100,000 | 127,559 | ||
| Massachusetts Development Finance Agency Rev. (Dana-Farber Cancer Institute), ”O“, 5%, 12/01/2031 | 125,000 | 158,736 | ||
| Massachusetts Development Finance Agency Rev. (Dana-Farber Cancer Institute), ”O“, 5%, 12/01/2032 | 175,000 | 221,320 | ||
| Massachusetts Development Finance Agency Rev. (Dana-Farber Cancer Institute), ”O“, 5%, 12/01/2033 | 150,000 | 188,953 | ||
| Massachusetts Development Finance Agency Rev. (Dana-Farber Cancer Institute), ”O“, 5%, 12/01/2034 | 400,000 | 502,444 | ||
| Issuer | Shares/Par | Value ($) | ||
| Healthcare Revenue - Hospitals – continued | ||||
| Massachusetts Development Finance Agency Rev. (Lahey Health System Obligated Group), ”F“, 5%, 8/15/2030 | $ | 2,000,000 | $ 2,344,048 | |
| Massachusetts Development Finance Agency Rev. (Milford Regional Medical Center), ”F“, 5.75%, 7/15/2043 | 1,000,000 | 1,061,507 | ||
| Massachusetts Development Finance Agency Rev. (Milford Regional Medical Center), ”G“, 5%, 7/15/2046 (n) | 1,000,000 | 1,136,083 | ||
| Massachusetts Development Finance Agency Rev. (Partners Healthcare), ”Q“, 5%, 7/01/2041 | 1,500,000 | 1,793,183 | ||
| Massachusetts Development Finance Agency Rev. (Partners Healthcare), ”Q“, 5%, 7/01/2047 | 1,500,000 | 1,784,440 | ||
| Massachusetts Development Finance Agency Rev. (Partners Healthcare), ”S“, 4%, 7/01/2041 | 3,500,000 | 4,002,027 | ||
| Massachusetts Development Finance Agency Rev. (Partners Healthcare), ”S-4“, 5%, 7/01/2034 | 700,000 | 866,129 | ||
| Massachusetts Development Finance Agency Rev. (South Shore Hospital), ”I“, 5%, 7/01/2041 | 2,300,000 | 2,655,729 | ||
| Massachusetts Development Finance Agency Rev. (Southcoast Health System Obligated Group), ”G“, 5%, 7/01/2034 | 300,000 | 387,483 | ||
| Massachusetts Development Finance Agency Rev. (Southcoast Health System Obligated Group), ”G“, 5%, 7/01/2035 | 200,000 | 257,122 | ||
| Massachusetts Development Finance Agency Rev. (Southcoast Health System Obligated Group), ”G“, 5%, 7/01/2036 | 200,000 | 256,107 | ||
| Massachusetts Development Finance Agency Rev. (Southcoast Health System Obligated Group), ”G“, 5%, 7/01/2037 | 350,000 | 446,473 | ||
| Massachusetts Development Finance Agency Rev. (Southcoast Health System Obligated Group), ”G“, 5%, 7/01/2038 | 350,000 | 445,033 | ||
| Massachusetts Development Finance Agency Rev. (Southcoast Health System Obligated Group), ”G“, 5%, 7/01/2039 | 350,000 | 443,665 | ||
| Massachusetts Development Finance Agency Rev. (UMass Memorial Health Care Obligated Group), ”I“, 5%, 7/01/2041 | 1,850,000 | 2,185,754 | ||
| Massachusetts Development Finance Agency Rev. (UMass Memorial Health Care Obligated Group), ”K“, 5%, 7/01/2038 | 2,000,000 | 2,383,893 | ||
| Massachusetts Development Finance Agency Rev. (UMass Memorial Health Care Obligated Group), ”L“, 5%, 7/01/2044 | 1,000,000 | 1,199,867 | ||
| Massachusetts Development Finance Agency Rev. (Wellforce, Inc.), ”A“, 4%, 7/01/2044 | 2,080,000 | 2,304,626 | ||
| Massachusetts Development Finance Agency Rev. (Wellforce, Inc.), ”A“, 5%, 7/01/2044 | 2,000,000 | 2,395,075 | ||
| Issuer | Shares/Par | Value ($) | ||
| Municipal Bonds – continued | ||||
| Healthcare Revenue - Hospitals – continued | ||||
| Massachusetts Development Finance Agency Rev. (Wellforce, Inc.), ”C“, AGM, 5%, 10/01/2034 | $ | 450,000 | $ 572,535 | |
| Massachusetts Development Finance Agency Rev. (Wellforce, Inc.), ”C“, AGM, 4%, 10/01/2045 | 2,500,000 | 2,834,640 | ||
| Massachusetts Development Finance Agency Rev., ”J-2“, 5%, 7/01/2048 | 1,610,000 | 1,920,646 | ||
| Miami-Dade County, FL, Health Facilities Authority Hospital Rev., Unrefunded Balance, 6%, 8/01/2030 | 120,000 | 120,473 | ||
| $ 50,648,145 | ||||
| Healthcare Revenue - Long Term Care – 1.4% | ||||
| Massachusetts Development Finance Agency First Mortgage Rev. (Berkshire Retirement Community), 5%, 7/01/2031 | $ | 1,000,000 | $ 1,137,963 | |
| Massachusetts Development Finance Agency Rev. (Adventcare), ”A“, 6.75%, 10/15/2037 (a)(d) | 500,000 | 225,000 | ||
| Massachusetts Development Finance Agency Rev. (Carleton-Willard Village), 4%, 12/01/2042 | 485,000 | 515,340 | ||
| Massachusetts Development Finance Agency Rev. (Carleton-Willard Village), 5%, 12/01/2042 | 525,000 | 591,969 | ||
| Massachusetts Development Finance Agency Rev. (Linden Ponds, Inc.), Capital Appreciation, ”B“, 0%, 11/15/2056 | 78,679 | 13,621 | ||
| Massachusetts Development Finance Agency Rev. (Loomis Community), ETM, 6%, 1/01/2033 (Prerefunded 7/01/2023) | 250,000 | 281,712 | ||
| Massachusetts Development Finance Agency Rev. (Loomis Community), Unrefunded Balance, 6%, 1/01/2033 | 250,000 | 268,020 | ||
| Massachusetts Development Finance Agency Rev. (Newbridge on the Charles, Inc.), 5%, 10/01/2037 (n) | 1,250,000 | 1,371,730 | ||
| Massachusetts Development Finance Agency Rev. (North Hill Communities), ”A“, 6.5%, 11/15/2043 (Prerefunded 11/15/2023) (n) | 1,000,000 | 1,162,273 | ||
| $ 5,567,628 | ||||
| Industrial Revenue - Other – 0.4% | ||||
| Port Beaumont, TX, Navigation District Facility Rev. (Jefferson Gulf Coast Energy Project), ”A“, 3.625%, 1/01/2035 (n) | $ | 500,000 | $ 510,958 | |
| Tuscaloosa County, AL, Industrial Development Authority, Gulf Opportunity Zone (Hunt Refining Project), ”A“, 4.5%, 5/01/2032 (n) | 420,000 | 466,769 | ||
| Issuer | Shares/Par | Value ($) | ||
| Industrial Revenue - Other – continued | ||||
| Tuscaloosa County, AL, Industrial Development Authority, Gulf Opportunity Zone (Hunt Refining Project), ”A“, 5.25%, 5/01/2044 (n) | $ | 575,000 | $ 653,440 | |
| $ 1,631,167 | ||||
| Miscellaneous Revenue - Other – 2.9% | ||||
| Massachusetts Development Finance Agency Rev. (Woods Hole Oceanographic Institution), 5%, 6/01/2037 | $ | 1,000,000 | $ 1,224,848 | |
| Massachusetts Development Finance Agency Rev. (Woods Hole Oceanographic Institution), 5%, 6/01/2038 | 1,000,000 | 1,221,925 | ||
| Massachusetts Development Finance Agency Rev. (Woods Hole Oceanographic Institution), 5%, 6/01/2043 | 1,000,000 | 1,208,535 | ||
| Massachusetts Port Authority Special Facilities Rev. (BOSFuel Project), ”A“, 5%, 7/01/2038 | 1,000,000 | 1,218,597 | ||
| Massachusetts Port Authority Special Facilities Rev. (BOSFuel Project), ”A“, 5%, 7/01/2039 | 2,000,000 | 2,430,953 | ||
| Massachusetts Port Authority Special Facilities Rev. (ConRAC Project), ”A“, 5.125%, 7/01/2041 (Prerefunded 7/01/2021) | 3,000,000 | 3,035,340 | ||
| New York Liberty Development Corp., Liberty Rev. (7 World Trade Center Project), 5%, 9/15/2040 | 1,095,000 | 1,139,170 | ||
| $ 11,479,368 | ||||
| Multi-Family Housing Revenue – 3.5% | ||||
| Boston, MA, Housing Authority Capital Program Rev., ”B“, 5%, 4/01/2028 | $ | 1,000,000 | $ 1,262,644 | |
| Massachusetts Development Finance Agency Rev. (Credit Housing-Chelsea Homes), ”I-A“, LOC, 5%, 12/15/2024 | 965,000 | 968,317 | ||
| Massachusetts Development Finance Agency Rev. (Morville House Apartments), ”A“, LOC, 4.95%, 12/15/2023 | 1,995,000 | 2,002,918 | ||
| Massachusetts Housing Finance Agency Rev., ”A“, FHA, 5.25%, 12/01/2035 | 705,000 | 709,906 | ||
| Massachusetts Housing Finance Agency Rev., ”C“, 5.35%, 12/01/2049 | 1,035,000 | 1,036,168 | ||
| Massachusetts Housing Finance Agency, ”A“, 3.7%, 12/01/2038 | 1,000,000 | 1,085,102 | ||
| Massachusetts Housing Finance Agency, ”A“, 3.8%, 12/01/2043 | 1,000,000 | 1,074,976 | ||
| Massachusetts Housing Finance Agency, “C-1”, 2.9%, 12/01/2039 | 1,000,000 | 1,052,951 | ||
| Massachusetts Housing Finance Agency, “C-1”, 3.1%, 12/01/2044 | 2,000,000 | 2,094,015 | ||
| Massachusetts Housing Finance Agency, Multi-Family Housing, ”A“, FHA, 4.75%, 12/01/2030 | 1,425,000 | 1,433,126 | ||
| Issuer | Shares/Par | Value ($) | ||
| Municipal Bonds – continued | ||||
| Multi-Family Housing Revenue – continued | ||||
| Massachusetts Housing Finance Agency, Multi-Family Housing, ”A“, FHA, 4.875%, 12/01/2032 | $ | 1,190,000 | $ 1,196,983 | |
| $ 13,917,106 | ||||
| Parking – 0.8% | ||||
| Boston, MA, Metropolitan Transit Parking Corp., Systemwide Parking Rev., 5.25%, 7/01/2036 | $ | 3,000,000 | $ 3,029,907 | |
| Port Revenue – 0.8% | ||||
| Martha's Vineyard, MA, Woods Hole Steamship Authority, ”A“, 4%, 3/01/2028 | $ | 2,660,000 | $ 2,995,815 | |
| Sales & Excise Tax Revenue – 6.7% | ||||
| Illinois Sales Tax Securitization Corp., Second Lien, ”A“, 5%, 1/01/2026 | $ | 140,000 | $ 165,151 | |
| Illinois Sales Tax Securitization Corp., Second Lien, ”A“, 5%, 1/01/2027 | 310,000 | 374,473 | ||
| Illinois Sales Tax Securitization Corp., Second Lien, ”A“, 5%, 1/01/2028 | 275,000 | 338,961 | ||
| Illinois Sales Tax Securitization Corp., Second Lien, ”A“, 5%, 1/01/2029 | 60,000 | 75,159 | ||
| Illinois Sales Tax Securitization Corp., Second Lien, ”A“, 5%, 1/01/2030 | 140,000 | 177,997 | ||
| Illinois Sales Tax Securitization Corp., Second Lien, ”A“, 5%, 1/01/2036 | 125,000 | 154,721 | ||
| Illinois Sales Tax Securitization Corp., Second Lien, ”A“, 5%, 1/01/2037 | 175,000 | 217,115 | ||
| Illinois Sales Tax Securitization Corp., Second Lien, ”A“, 4%, 1/01/2038 | 80,000 | 91,204 | ||
| Illinois Sales Tax Securitization Corp., Second Lien, ”A“, 4%, 1/01/2039 | 55,000 | 62,519 | ||
| Illinois Sales Tax Securitization Corp., Second Lien, ”A“, 4%, 1/01/2040 | 85,000 | 96,750 | ||
| Massachusetts Bay Transportation Authority, Sales Tax Rev., 4%, 12/01/2021 | 500,000 | 512,775 | ||
| Massachusetts Bay Transportation Authority, Sales Tax Rev., ”A“, 5%, 7/01/2024 | 1,590,000 | 1,829,184 | ||
| Massachusetts Bay Transportation Authority, Sales Tax Rev., ”A-1“, 5.25%, 7/01/2029 | 1,850,000 | 2,463,422 | ||
| Massachusetts Bay Transportation Authority, Sales Tax Rev., ”A-1“, 5.25%, 7/01/2031 | 2,000,000 | 2,755,338 | ||
| Massachusetts Bay Transportation Authority, Sales Tax Rev., ”A-2“, VRDN, 0.04%, 7/01/2026 | 2,280,000 | 2,280,000 | ||
| Massachusetts School Building Authority, Senior Dedicated Sales Tax Rev., ”A“, 5%, 2/15/2044 | 4,000,000 | 4,925,806 | ||
| Massachusetts School Building Authority, Senior Dedicated Sales Tax Rev., ”B“, 4%, 11/15/2046 | 3,000,000 | 3,342,084 | ||
| Puerto Rico Sales Tax Financing Corp., Restructured Sales Tax Rev., ”2019A-1“, 4.55%, 7/01/2040 | 73,000 | 79,118 | ||
| Issuer | Shares/Par | Value ($) | ||
| Sales & Excise Tax Revenue – continued | ||||
| Puerto Rico Sales Tax Financing Corp., Restructured Sales Tax Rev., ”2019A-1“, 5%, 7/01/2058 | $ | 215,000 | $ 236,754 | |
| Puerto Rico Sales Tax Financing Corp., Restructured Sales Tax Rev., ”2019A-2“, 4.329%, 7/01/2040 | 671,000 | 717,782 | ||
| Puerto Rico Sales Tax Financing Corp., Restructured Sales Tax Rev., ”2019A-2“, 4.329%, 7/01/2040 | 256,000 | 273,848 | ||
| Puerto Rico Sales Tax Financing Corp., Restructured Sales Tax Rev., ”2019A-2“, 4.536%, 7/01/2053 | 5,000 | 5,361 | ||
| Puerto Rico Sales Tax Financing Corp., Restructured Sales Tax Rev., ”2019A-2“, 4.784%, 7/01/2058 | 101,000 | 109,293 | ||
| Puerto Rico Sales Tax Financing Corp., Restructured Sales Tax Rev., Capital Appreciation, ”2019A-1“, 0%, 7/01/2024 | 12,000 | 11,263 | ||
| Puerto Rico Sales Tax Financing Corp., Restructured Sales Tax Rev., Capital Appreciation, ”2019A-1“, 0%, 7/01/2027 | 117,000 | 102,501 | ||
| Puerto Rico Sales Tax Financing Corp., Restructured Sales Tax Rev., Capital Appreciation, ”2019A-1“, 0%, 7/01/2029 | 22,000 | 18,119 | ||
| Puerto Rico Sales Tax Financing Corp., Restructured Sales Tax Rev., Capital Appreciation, ”2019A-1“, 0%, 7/01/2031 | 1,059,000 | 810,495 | ||
| Puerto Rico Sales Tax Financing Corp., Restructured Sales Tax Rev., Capital Appreciation, ”2019A-1“, 0%, 7/01/2033 | 1,011,000 | 717,632 | ||
| Puerto Rico Sales Tax Financing Corp., Restructured Sales Tax Rev., Capital Appreciation, ”2019A-1“, 0%, 7/01/2046 | 9,313,000 | 2,842,048 | ||
| Wisconsin Public Finance Authority Limited Obligation Grant Rev. (American Dream at Meadowlands Project), ”A“, 6.25%, 8/01/2027 (n) | 410,000 | 445,545 | ||
| Wisconsin Public Finance Authority Limited Obligation Grant Rev. (American Dream at Meadowlands Project), ”A“, 5.625%, 8/01/2024 (n) | 140,000 | 145,413 | ||
| $ 26,377,831 | ||||
| Secondary Schools – 1.9% | ||||
| District of Columbia Rev. (Rocketship D.C.), ”A“, 5%, 6/01/2056 (n) | $ | 290,000 | $ 317,925 | |
| Lowell, MA, Collegiate Charter School Rev., 5%, 6/15/2039 | 1,000,000 | 1,094,487 | ||
| Lowell, MA, Collegiate Charter School Rev., 5%, 6/15/2054 | 1,000,000 | 1,079,504 | ||
| Massachusetts Development Finance Agency Rev. (Dexter Southfield), 5%, 5/01/2030 | 500,000 | 572,319 | ||
| Massachusetts Development Finance Agency Rev. (Dexter Southfield), 5%, 5/01/2031 | 1,015,000 | 1,159,603 | ||
| Issuer | Shares/Par | Value ($) | ||
| Municipal Bonds – continued | ||||
| Secondary Schools – continued | ||||
| Massachusetts Development Finance Agency Rev. (Foxborough Regional Charter School), ”B“, 5%, 7/01/2037 | $ | 1,000,000 | $ 1,125,828 | |
| Massachusetts Development Finance Agency Rev. (Sabis International Charter School Issue), 5%, 4/15/2033 | 2,000,000 | 2,178,456 | ||
| $ 7,528,122 | ||||
| Single Family Housing - Local – 0.5% | ||||
| Montgomery County, MD, Housing Opportunities Commission Program Rev., ”A“, 4%, 7/01/2049 | $ | 1,715,000 | $ 1,915,854 | |
| Single Family Housing - State – 4.2% | ||||
| Connecticut Housing Finance Authority Rev. (Housing Mortgage Finance Program), ”C-1“, 4%, 11/15/2047 | $ | 1,130,000 | $ 1,219,930 | |
| Maryland Community Development Administration, Department of Housing & Community Development Housing Rev., ”A“, 4.25%, 9/01/2049 | 1,435,000 | 1,604,084 | ||
| Massachusetts Housing Finance Agency, Single Family Housing Rev., ”186“, 4%, 6/01/2039 (n) | 1,210,000 | 1,288,848 | ||
| Massachusetts Housing Finance Agency, Single Family Housing Rev., ”206“, 3.3%, 6/01/2034 | 365,000 | 388,468 | ||
| Massachusetts Housing Finance Agency, Single Family Housing Rev., ”206“, 3.45%, 12/01/2036 | 485,000 | 517,533 | ||
| Massachusetts Housing Finance Agency, Single Family Housing Rev., ”215“, GNMA, 4%, 12/01/2050 | 3,280,000 | 3,699,824 | ||
| Massachusetts Housing Finance Agency, Single Family Housing Rev., ”220“, GNMA, 5%, 6/01/2026 | 120,000 | 145,315 | ||
| Massachusetts Housing Finance Agency, Single Family Housing Rev., ”220“, GNMA, 5%, 12/01/2026 | 100,000 | 122,716 | ||
| Massachusetts Housing Finance Agency, Single Family Housing Rev., ”220“, GNMA, 5%, 6/01/2027 | 110,000 | 136,372 | ||
| Massachusetts Housing Finance Agency, Single Family Housing Rev., ”220“, GNMA, 5%, 12/01/2027 | 100,000 | 125,449 | ||
| Massachusetts Housing Finance Agency, Single Family Housing Rev., ”220“, GNMA, 5%, 6/01/2028 | 100,000 | 126,378 | ||
| Massachusetts Housing Finance Agency, Single Family Housing Rev., ”220“, GNMA, 5%, 12/01/2028 | 100,000 | 127,168 | ||
| Massachusetts Housing Finance Agency, Single Family Housing Rev., ”220“, GNMA, 5%, 6/01/2029 | 100,000 | 127,922 | ||
| Issuer | Shares/Par | Value ($) | ||
| Single Family Housing - State – continued | ||||
| Massachusetts Housing Finance Agency, Single Family Housing Rev., ”220“, GNMA, 1.35%, 12/01/2029 | $ | 400,000 | $ 395,101 | |
| Massachusetts Housing Finance Agency, Single Family Housing Rev., “214”, GNMA, 2.95%, 12/01/2044 | 3,000,000 | 3,093,774 | ||
| Pennsylvania Housing Finance Agency, Single Family Mortgage Rev., “125A”, 3.7%, 10/01/2037 | 1,535,000 | 1,648,574 | ||
| Tennessee Housing Development Agency, Residential Finance Program Rev., ”1“, 4.25%, 1/01/2050 | 1,520,000 | 1,687,489 | ||
| $ 16,454,945 | ||||
| State & Local Agencies – 3.9% | ||||
| Colorado State University Board of Governors, System Enterprise Refunding Rev., ”E“, 4%, 3/01/2043 | $ | 1,245,000 | $ 1,413,955 | |
| Commonwealth of Pennsylvania, Tobacco Master Settlement Financing Authority Rev., 5%, 6/01/2032 | 75,000 | 92,287 | ||
| Commonwealth of Pennsylvania, Tobacco Master Settlement Financing Authority Rev., 5%, 6/01/2033 | 60,000 | 73,484 | ||
| Commonwealth of Pennsylvania, Tobacco Master Settlement Financing Authority Rev., 5%, 6/01/2034 | 30,000 | 36,606 | ||
| Delaware Valley, PA, Regional Finance Authority, ”C“, FLR, 0.878% (LIBOR - 3mo. + 0.75%), 6/01/2037 | 1,400,000 | 1,372,290 | ||
| Maryland Stadium Authority Rev., Baltimore City Public Schools Construction and Revitalization Program, ”A“, 5%, 5/01/2047 (Prerefunded 5/01/2028) | 350,000 | 447,281 | ||
| Maryland Stadium Authority Rev., Baltimore City Public Schools Construction and Revitalization Program, ”A“, 5%, 5/01/2047 | 665,000 | 790,769 | ||
| Massachusetts College Building Authority Project Rev., ”A“, 5%, 5/01/2031 (Prerefunded 5/01/2023) | 275,000 | 302,464 | ||
| Massachusetts College Building Authority Project Rev., ”A“, 5%, 5/01/2032 (Prerefunded 5/01/2023) | 760,000 | 835,900 | ||
| Massachusetts College Building Authority Project Rev., Capital Appreciation, ”A“, SYNCORA, 0%, 5/01/2022 | 8,310,000 | 8,274,423 | ||
| New Jersey Building Authority Rev., Unrefunded Balance, “A”, BAM, 5%, 6/15/2029 | 45,000 | 53,452 | ||
| New Jersey Economic Development Authority Rev. (School Facilities Construction), 5%, 6/15/2032 | 25,000 | 31,680 | ||
| New Jersey Economic Development Authority Rev. (School Facilities Construction), 5%, 6/15/2033 | 15,000 | 18,883 | ||
| Issuer | Shares/Par | Value ($) | ||
| Municipal Bonds – continued | ||||
| State & Local Agencies – continued | ||||
| New Jersey Economic Development Authority Rev. (School Facilities Construction), 4%, 6/15/2034 | $ | 65,000 | $ 74,860 | |
| New Jersey Economic Development Authority Rev. (School Facilities Construction), 4%, 6/15/2035 | 55,000 | 63,158 | ||
| New Jersey Economic Development Authority Rev. (School Facilities Construction), 4%, 6/15/2036 | 40,000 | 45,756 | ||
| New Jersey Economic Development Authority Rev. (School Facilities Construction), 4%, 6/15/2037 | 35,000 | 39,885 | ||
| New Jersey Economic Development Authority Rev. (School Facilities Construction), 4%, 6/15/2038 | 55,000 | 62,479 | ||
| New Jersey Economic Development Authority Rev. (School Facilities Construction), 4%, 6/15/2039 | 45,000 | 51,009 | ||
| New Jersey Economic Development Authority Rev. (School Facilities Construction), 4%, 6/15/2040 | 55,000 | 62,234 | ||
| New Jersey Economic Development Authority Rev. (School Facilities Construction), 4%, 6/15/2041 | 35,000 | 39,482 | ||
| New Jersey Economic Development Authority Rev. (School Facilities Construction), ”AAA“, 5%, 6/15/2026 | 345,000 | 414,277 | ||
| New Jersey Economic Development Authority Rev. (School Facilities Construction), ”LLL“, 5%, 6/15/2039 | 765,000 | 927,169 | ||
| $ 15,523,783 | ||||
| Student Loan Revenue – 3.8% | ||||
| Massachusetts Educational Financing Authority, Education Loan Rev., ”B“, 5%, 7/01/2029 | $ | 1,400,000 | $ 1,748,877 | |
| Massachusetts Educational Financing Authority, Education Loan Rev., ”B“, 5%, 7/01/2030 | 1,300,000 | 1,639,914 | ||
| Massachusetts Educational Financing Authority, Education Loan Rev., ”C“, 4.125%, 7/01/2046 | 2,000,000 | 2,085,066 | ||
| Massachusetts Educational Financing Authority, Education Loan Rev., ”C“, 3.75%, 7/01/2047 | 4,000,000 | 4,079,782 | ||
| Massachusetts Educational Financing Authority, Education Loan Rev., ”I“, 6%, 1/01/2028 | 105,000 | 106,288 | ||
| Massachusetts Educational Financing Authority, Education Loan Rev., ”I-A“, 5.5%, 1/01/2022 | 3,000,000 | 3,006,507 | ||
| Massachusetts Educational Financing Authority, Education Loan Rev., ”I-A“, 5.15%, 1/01/2026 | 125,000 | 125,537 | ||
| Issuer | Shares/Par | Value ($) | ||
| Student Loan Revenue – continued | ||||
| Massachusetts Educational Financing Authority, Education Loan Rev., ”I-A“, 5.2%, 1/01/2027 | $ | 60,000 | $ 60,258 | |
| Massachusetts Educational Financing Authority, Education Loan Rev., ”J“, 5.625%, 7/01/2029 | 560,000 | 566,112 | ||
| Massachusetts Educational Financing Authority, Education Loan Rev., ”J“, 3.5%, 7/01/2033 | 575,000 | 585,741 | ||
| Massachusetts Educational Financing Authority, Education Loan Rev., ”K“, 4.5%, 7/01/2024 | 545,000 | 570,796 | ||
| Minnesota Office of Higher Education Supplemental Student Loan Program Rev., 2.65%, 11/01/2038 | 280,000 | 277,278 | ||
| $ 14,852,156 | ||||
| Tax - Other – 1.1% | ||||
| Guam Government Ltd. Obligation Rev., ”A“, 5%, 12/01/2035 | $ | 225,000 | $ 255,196 | |
| Guam Government Ltd. Obligation Rev., ”A“, 5%, 12/01/2036 | 120,000 | 135,779 | ||
| Guam Government Ltd. Obligation Rev., ”A“, 5%, 12/01/2046 | 370,000 | 411,851 | ||
| Illinois Sports Facilities Authority, State Tax Supported Refunding Rev., BAM, 5%, 6/15/2029 | 210,000 | 265,274 | ||
| Massachusetts Special Obligation Dedicated Tax Rev., NPFG, 5.5%, 1/01/2023 | 1,585,000 | 1,725,216 | ||
| Puerto Rico Convention Center District Authority, Hotel Occupancy Tax Rev., ”A“, AAC, 5%, 7/01/2031 | 305,000 | 312,065 | ||
| Puerto Rico Infrastructure Financing Authority Special Tax Rev., ”C“, AAC, 5.5%, 7/01/2026 | 995,000 | 1,094,270 | ||
| Wisconsin Public Finance Authority Limited Obligation PILOT Rev. (American Dream at Meadowlands Project), 7%, 12/01/2050 | 225,000 | 259,821 | ||
| $ 4,459,472 | ||||
| Tax Assessment – 0.0% | ||||
| Brunswick, MD, Special Obligation Refunding (Brunswick Crossing Special Taxing District), 4%, 7/01/2029 | $ | 25,000 | $ 28,800 | |
| Brunswick, MD, Special Obligation Refunding (Brunswick Crossing Special Taxing District), 5%, 7/01/2036 | 35,000 | 41,283 | ||
| $ 70,083 | ||||
| Tobacco – 0.6% | ||||
| Buckeye, OH, Tobacco Settlement Financing Authority Senior Asset-Backed Refunding, 2020A-2, ”1“, 5%, 6/01/2036 | $ | 250,000 | $ 313,101 | |
| Issuer | Shares/Par | Value ($) | ||
| Municipal Bonds – continued | ||||
| Tobacco – continued | ||||
| Buckeye, OH, Tobacco Settlement Financing Authority Senior Asset-Backed Refunding, 2020B-3, Capital Appreciation, ”2“, 0%, 6/01/2057 | $ | 4,885,000 | $ 738,655 | |
| Illinois Railsplitter Tobacco Settlement Authority Rev., 6%, 6/01/2028 (Prerefunded 6/01/2021) | 1,335,000 | 1,347,225 | ||
| $ 2,398,981 | ||||
| Toll Roads – 1.3% | ||||
| Massachusetts Department of Transportation, Metropolitan Highway System Refunding Rev., Subordinated Contract Assistance, 5%, 1/01/2037 | $ | 1,000,000 | $ 1,257,617 | |
| Massachusetts Department of Transportation, Metropolitan Highway System Rev., “C”, 5%, 1/01/2035 | 3,000,000 | 3,795,769 | ||
| $ 5,053,386 | ||||
| Transportation - Special Tax – 5.0% | ||||
| Commonwealth of Massachusetts Transportation Fund Rev. (Rail Enhancement & Accelerated Bridge Programs), ”A“, 5%, 6/01/2036 | $ | 2,850,000 | $ 3,412,219 | |
| Commonwealth of Massachusetts Transportation Fund Rev. (Rail Enhancement & Accelerated Bridge Programs), ”A“, 5%, 6/01/2042 | 3,000,000 | 3,711,147 | ||
| Commonwealth of Puerto Rico Highway & Transportation Authority Rev., ”A“, NPFG, 4.75%, 7/01/2038 | 465,000 | 470,364 | ||
| Commonwealth of Puerto Rico Highway & Transportation Authority Rev., ”AA-1“, AGM, 4.95%, 7/01/2026 | 275,000 | 280,709 | ||
| Commonwealth of Puerto Rico Highway & Transportation Authority Rev., ”D“, AGM, 5%, 7/01/2032 | 280,000 | 289,074 | ||
| Commonwealth of Puerto Rico Highway & Transportation Authority Rev., ”L“, AAC, 5.25%, 7/01/2038 | 1,765,000 | 1,986,860 | ||
| Commonwealth of Puerto Rico Highway & Transportation Authority Rev., ”N“, AAC, 5.5%, 7/01/2029 | 520,000 | 577,586 | ||
| Commonwealth of Puerto Rico Highway & Transportation Authority Rev., ”N“, AAC, 5.25%, 7/01/2031 | 1,055,000 | 1,162,526 | ||
| Commonwealth of Puerto Rico Highway & Transportation Authority Rev., ”N“, NPFG, 5.25%, 7/01/2033 | 300,000 | 332,419 | ||
| Commonwealth of Puerto Rico Highway & Transportation Authority Rev., Unrefunded Balance, ”A“, NPFG, 5%, 7/01/2038 | 45,000 | 46,146 | ||
| Massachusetts Bay Transportation Authority, Sales Tax Rev., ”B-1“, 5%, 7/01/2033 | 3,000,000 | 3,920,523 | ||
| Issuer | Shares/Par | Value ($) | ||
| Transportation - Special Tax – continued | ||||
| Metropolitan Transportation Authority Rev., NY, Anticipation Note, ”B-2“, 5%, 5/15/2021 | $ | 1,225,000 | $ 1,230,885 | |
| Metropolitan Transportation Authority Rev., NY, Anticipation Note, ”D-1“, 5%, 9/01/2022 | 890,000 | 943,149 | ||
| New Jersey Transportation Trust Fund Authority, ”AA“, 5%, 6/15/2045 | 210,000 | 254,928 | ||
| New Jersey Transportation Trust Fund Authority, Federal Highway Reimbursement Rev., ”A-1“, 5%, 6/15/2027 | 420,000 | 501,941 | ||
| New Jersey Transportation Trust Fund Authority, Transportation System, ”A“, 5%, 12/15/2039 | 225,000 | 272,413 | ||
| New Jersey Transportation Trust Fund Authority, Transportation System, ”BB“, 5%, 6/15/2044 | 220,000 | 261,630 | ||
| $ 19,654,519 | ||||
| Universities - Colleges – 20.2% | ||||
| Massachusetts Development Finance Agency Refunding Rev. (Brandeis University), ”S-1“, 5%, 10/01/2038 | $ | 605,000 | $ 743,074 | |
| Massachusetts Development Finance Agency Refunding Rev. (Brandeis University), ”S-1“, 5%, 10/01/2040 | 2,665,000 | 3,257,980 | ||
| Massachusetts Development Finance Agency Refunding Rev. (Suffolk University), 5%, 7/01/2035 | 970,000 | 1,192,101 | ||
| Massachusetts Development Finance Agency Refunding Rev. (Suffolk University), 5%, 7/01/2036 | 850,000 | 1,003,105 | ||
| Massachusetts Development Finance Agency Refunding Rev. (Suffolk University), 5%, 7/01/2037 | 625,000 | 763,146 | ||
| Massachusetts Development Finance Agency Refunding Rev. (Suffolk University), 5%, 7/01/2038 | 340,000 | 413,749 | ||
| Massachusetts Development Finance Agency Refunding Rev. (Suffolk University), 4%, 7/01/2039 | 3,055,000 | 3,334,034 | ||
| Massachusetts Development Finance Agency Rev. (Bentley University), 5%, 7/01/2040 | 1,500,000 | 1,745,784 | ||
| Massachusetts Development Finance Agency Rev. (Brandeis University), ”R“, 5%, 10/01/2038 | 835,000 | 1,020,987 | ||
| Massachusetts Development Finance Agency Rev. (Brandeis University), ”S-1“, 5%, 10/01/2039 | 2,660,000 | 3,259,445 | ||
| Massachusetts Development Finance Agency Rev. (Emerson College), 5%, 1/01/2043 | 725,000 | 847,083 | ||
| Massachusetts Development Finance Agency Rev. (Emerson College), 5%, 1/01/2048 | 250,000 | 290,310 | ||
| Massachusetts Development Finance Agency Rev. (Emerson College), ”A“, 5.25%, 1/01/2042 | 2,000,000 | 2,323,001 | ||
| Issuer | Shares/Par | Value ($) | ||
| Municipal Bonds – continued | ||||
| Universities - Colleges – continued | ||||
| Massachusetts Development Finance Agency Rev. (Emmanuel College), ”A“, 5%, 10/01/2043 | $ | 2,000,000 | $ 2,274,390 | |
| Massachusetts Development Finance Agency Rev. (Emmanuel College), “A”, 4%, 10/01/2046 | 1,375,000 | 1,470,046 | ||
| Massachusetts Development Finance Agency Rev. (Harvard University), ”A“, 5%, 10/15/2029 | 3,000,000 | 3,982,669 | ||
| Massachusetts Development Finance Agency Rev. (Lesley University), ”A“, 5%, 7/01/2044 | 2,250,000 | 2,674,029 | ||
| Massachusetts Development Finance Agency Rev. (Merrimack College), 5%, 7/01/2047 | 1,000,000 | 1,133,037 | ||
| Massachusetts Development Finance Agency Rev. (Northeastern University), ”A“, 5%, 10/01/2031 | 2,330,000 | 3,079,523 | ||
| Massachusetts Development Finance Agency Rev. (Northeastern University), ”A“, 5%, 10/01/2033 | 900,000 | 1,177,254 | ||
| Massachusetts Development Finance Agency Rev. (Northeastern University), ”A“, 5%, 10/01/2034 | 500,000 | 651,833 | ||
| Massachusetts Development Finance Agency Rev. (Northeastern University), ”A“, 5%, 10/01/2035 | 1,555,000 | 2,020,900 | ||
| Massachusetts Development Finance Agency Rev. (Simmons University), ”L“, 5%, 10/01/2035 | 2,000,000 | 2,415,937 | ||
| Massachusetts Development Finance Agency Rev. (Simmons Unversity), ”H“, SYNCORA, 5.25%, 10/01/2026 | 2,250,000 | 2,582,982 | ||
| Massachusetts Development Finance Agency Rev. (Wentworth Institute of Technology Issue), 5%, 10/01/2046 | 2,000,000 | 2,261,649 | ||
| Massachusetts Development Finance Agency Rev. (Western New England University), 5%, 9/01/2031 | 1,110,000 | 1,265,945 | ||
| Massachusetts Development Finance Agency Rev. (Western New England University), AGM, 5%, 9/01/2038 | 2,550,000 | 3,073,449 | ||
| Massachusetts Development Finance Agency Rev. (Worcester Polytechnic Institute), 5%, 9/01/2038 | 865,000 | 1,064,595 | ||
| Massachusetts Development Finance Agency Rev. (Worcester Polytechnic Institute), 5%, 9/01/2039 | 950,000 | 1,166,295 | ||
| Massachusetts Development Finance Agency Rev. (Worcester Polytechnic Institute), 5%, 9/01/2047 | 1,395,000 | 1,652,712 | ||
| Massachusetts Development Finance Agency Rev. (Worcester Polytechnic Institute), 4%, 9/01/2049 | 3,000,000 | 3,082,702 | ||
| Massachusetts Health & Educational Facilities Authority Rev. (Boston College), 5.5%, 6/01/2027 | 1,735,000 | 2,226,564 | ||
| Issuer | Shares/Par | Value ($) | ||
| Universities - Colleges – continued | ||||
| Massachusetts Health & Educational Facilities Authority Rev. (Massachusetts Institute of Technology), ”I-1“, 5.2%, 1/01/2028 | $ | 1,000,000 | $ 1,293,848 | |
| Massachusetts Health & Educational Facilities Authority Rev. (Williams College), ”I“, 0.7%, 7/01/2033 (Put Date 7/01/2025) (w) | 3,000,000 | 3,004,344 | ||
| Pinellas County, FL, Educational Facilities Authority Rev. (Barry University), 6%, 10/01/2041 | 295,000 | 300,769 | ||
| Puerto Rico Industrial, Tourist, Educational, Medical & Environmental Control Facilities Financing Authority, Educational Facilities Rev. (University Plaza Project), NPFG, 5%, 7/01/2033 | 310,000 | 314,067 | ||
| Puerto Rico Industrial, Tourist, Educational, Medical & Environmental Control Facilities Financing Authority, Higher Education Rev. (Ana G. Mendez University System Project), 5.125%, 4/01/2032 | 110,000 | 111,458 | ||
| Puerto Rico Industrial, Tourist, Educational, Medical & Environmental Control Facilities Financing Authority, Higher Education Rev. (Ana G. Mendez University System Project), 5.375%, 4/01/2042 | 370,000 | 375,550 | ||
| Puerto Rico Industrial, Tourist, Educational, Medical & Environmental Control Facilities Financing Authority, Higher Education Rev. (University of Sacred Heart), 4.375%, 10/01/2031 | 75,000 | 75,493 | ||
| Puerto Rico Industrial, Tourist, Educational, Medical & Environmental Control Facilities Financing Authority, Higher Education Rev. (University of Sacred Heart), 5%, 10/01/2042 | 90,000 | 91,350 | ||
| Red River, TX, Education Finance Corp., Higher Education Rev. (Houston Baptist University Project), 5.5%, 10/01/2046 | 470,000 | 537,519 | ||
| University of Massachusetts Building Authority Project Senior Rev., ”1“, 5%, 11/01/2037 | 1,000,000 | 1,276,775 | ||
| University of Massachusetts Building Authority Project Senior Rev., ”1“, 5%, 11/01/2039 (Prerefunded 11/01/2022) | 3,000,000 | 3,229,885 | ||
| University of Massachusetts Building Authority Project Senior Rev., ”1“, 5%, 11/01/2040 | 2,500,000 | 2,936,177 | ||
| University of Massachusetts Building Authority Senior Refunding Rev., ”2019-1“, 5%, 5/01/2039 | 3,000,000 | 3,769,816 | ||
| University of Massachusetts Building Authority Senior Refunding Rev., ”2021-1“, 5%, 11/01/2029 | 2,250,000 | 2,976,507 | ||
| $ 79,743,868 | ||||
| Issuer | Shares/Par | Value ($) | ||
| Municipal Bonds – continued | ||||
| Utilities - Cogeneration – 0.2% | ||||
| Puerto Rico Industrial, Tourist, Educational, Medical & Environmental Control Facilities Financing Authority Rev. (Cogeneration Facilities - AES Puerto Rico Project), 9.12%, 6/01/2022 | $ | 850,000 | $ 871,250 | |
| Utilities - Municipal Owned – 1.1% | ||||
| Guam Power Authority Rev., ”A“, AGM, 5%, 10/01/2039 | $ | 200,000 | $ 221,827 | |
| Guam Power Authority Rev., ”A“, AGM, 5%, 10/01/2044 | 235,000 | 259,585 | ||
| Puerto Rico Electric Power Authority Rev., ”A“, 5%, 7/01/2029 (a)(d) | 800,000 | 724,000 | ||
| Puerto Rico Electric Power Authority Rev., ”A“, 5%, 7/01/2042 (a)(d) | 125,000 | 113,125 | ||
| Puerto Rico Electric Power Authority Rev., ”AAA“, 5.25%, 7/01/2021 (a)(d) | 65,000 | 58,988 | ||
| Puerto Rico Electric Power Authority Rev., ”AAA“, 5.25%, 7/01/2030 (a)(d) | 30,000 | 27,225 | ||
| Puerto Rico Electric Power Authority Rev., ”CCC“, 5.25%, 7/01/2027 (a)(d) | 300,000 | 272,250 | ||
| Puerto Rico Electric Power Authority Rev., ”DDD“, 5%, 7/01/2020 (a)(d) | 35,000 | 31,588 | ||
| Puerto Rico Electric Power Authority Rev., ”DDD“, 5%, 7/01/2021 (a)(d) | 315,000 | 285,075 | ||
| Puerto Rico Electric Power Authority Rev., ”DDD“, 5%, 7/01/2022 (a)(d) | 510,000 | 461,550 | ||
| Puerto Rico Electric Power Authority Rev., ”EEE“, 6.05%, 7/01/2032 (a)(d) | 190,000 | 168,387 | ||
| Puerto Rico Electric Power Authority Rev., ”TT“, 5%, 7/01/2021 (a)(d) | 150,000 | 135,750 | ||
| Puerto Rico Electric Power Authority Rev., ”TT“, 5%, 7/01/2023 (a)(d) | 135,000 | 122,175 | ||
| Puerto Rico Electric Power Authority Rev., ”TT“, 5%, 7/01/2027 (a)(d) | 25,000 | 22,625 | ||
| Puerto Rico Electric Power Authority Rev., ”TT“, 5%, 7/01/2037 (a)(d) | 415,000 | 375,575 | ||
| Puerto Rico Electric Power Authority Rev., ”V“, NPFG, 5.25%, 7/01/2033 | 160,000 | 177,290 | ||
| Puerto Rico Electric Power Authority Rev., ”VV“, NPFG, 5.25%, 7/01/2029 | 220,000 | 243,789 | ||
| Puerto Rico Electric Power Authority Rev., ”VV“, NPFG, 5.25%, 7/01/2034 | 35,000 | 38,725 | ||
| Puerto Rico Electric Power Authority Rev., ”WW“, 5.375%, 7/01/2022 (a)(d) | 30,000 | 27,263 | ||
| Puerto Rico Electric Power Authority Rev., ”WW“, 5.25%, 7/01/2025 (a)(d) | 65,000 | 58,987 | ||
| Puerto Rico Electric Power Authority Rev., ”ZZ“, 5%, 7/01/2018 (a)(d) | 195,000 | 173,794 | ||
| Puerto Rico Electric Power Authority Rev., ”ZZ“, 5.25%, 7/01/2023 (a)(d) | 220,000 | 199,650 | ||
| Puerto Rico Electric Power Authority Rev., ”ZZ“, 5.25%, 7/01/2024 (a)(d) | 75,000 | 68,062 | ||
| Issuer | Shares/Par | Value ($) | ||
| Utilities - Municipal Owned – continued | ||||
| Puerto Rico Electric Power Authority Rev., ”ZZ“, 5.25%, 7/01/2026 (a)(d) | $ | 230,000 | $ 208,725 | |
| $ 4,476,010 | ||||
| Utilities - Other – 0.2% | ||||
| Tennessee Energy Acquisition Corp., Gas Rev., ”A“, 5.25%, 9/01/2021 | $ | 405,000 | $ 413,191 | |
| Tennessee Energy Acquisition Corp., Gas Rev., ”A“, 5.25%, 9/01/2022 | 210,000 | 224,303 | ||
| $ 637,494 | ||||
| Water & Sewer Utility Revenue – 6.4% | ||||
| Guam Waterworks Authority Rev. (Water and Wastewater System), ”A“, 5%, 1/01/2050 | $ | 455,000 | $ 546,850 | |
| Massachusetts Clean Water Trust, State Revolving Fund, 5%, 8/01/2038 | 1,255,000 | 1,592,930 | ||
| Massachusetts Clean Water Trust, State Revolving Fund, 5%, 8/01/2039 | 545,000 | 689,992 | ||
| Massachusetts Water Pollution Abatement Trust, 5.25%, 8/01/2027 | 1,280,000 | 1,638,711 | ||
| Massachusetts Water Pollution Abatement Trust, 5.25%, 8/01/2033 | 2,000,000 | 2,856,071 | ||
| Massachusetts Water Pollution Abatement Trust (MWRA Program), ”A“, 5%, 8/01/2032 | 75,000 | 75,253 | ||
| Massachusetts Water Resources Authority, General Refunding Rev. (Green Bonds), ”C“, 4%, 8/01/2040 | 2,910,000 | 3,261,908 | ||
| Massachusetts Water Resources Authority, General Rev., ”B“, 5%, 8/01/2040 | 4,000,000 | 5,169,765 | ||
| Massachusetts Water Resources Authority, General Rev., ”B“, AGM, 5.25%, 8/01/2029 | 595,000 | 796,427 | ||
| Massachusetts Water Resources Authority, General Rev., ”B“, AGM, 5.25%, 8/01/2031 | 1,625,000 | 2,263,400 | ||
| Massachusetts Water Resources Authority, Multi-Modal Subordinated General Rev., ”C-2“, VRDN, 0.07%, 11/01/2026 | 6,470,000 | 6,470,000 | ||
| $ 25,361,307 | ||||
| Total Municipal Bonds (Identified Cost, $365,976,157) | $388,400,927 | |||
| Bonds – 0.2% | ||||
| Consumer Services – 0.2% | ||||
| Toll Road Investors Partnership II LP, Capital Appreciation, NPFG, 0%, 2/15/2025 (n) | $ | 581,000 | $ 507,394 | |
| Toll Road Investors Partnership II LP, Capital Appreciation, NPFG, 0%, 2/15/2043 (n) | 1,200,000 | 341,764 | ||
| Total Bonds (Identified Cost, $909,084) | $ 849,158 | |||
| Issuer | Shares/Par | Value ($) | ||
| Investment Companies (h) – 0.6% | ||||
| Money Market Funds – 0.6% | ||||
| MFS Institutional Money Market Portfolio, 0.05% (v) (Identified Cost, $2,485,220) | 2,485,262 | $ 2,485,262 | ||
| Other Assets, Less Liabilities – 0.8% | 3,187,631 | |||
| Net Assets – 100.0% | $394,922,978 | |||
| (a) | Non-income producing security. |
| (d) | In default. |
| (h) | An affiliated issuer, which may be considered one in which the fund owns 5% or more of the outstanding voting securities, or a company which is under common control. At period end, the aggregate values of each fund’s investments in affiliated issuers and in unaffiliated issuers were as follows: |
| Affiliated Issuers | Unaffiliated Issuers | |
| Alabama Fund | $1,877,374 | $ 92,851,385 |
| Arkansas Fund | 1,447,457 | 169,883,854 |
| California Fund | 2,970,539 | 622,602,195 |
| Georgia Fund | 4,694,126 | 137,660,288 |
| Maryland Fund | 1,711,689 | 114,637,304 |
| Massachusetts Fund | 2,485,262 | 389,250,085 |
| (n) | Securities exempt from registration under Rule 144A of the Securities Act of 1933. These securities may be sold in the ordinary course of business in transactions exempt from registration, normally to qualified institutional buyers. At period end, the aggregate value of these securities and percentage of net assets for each fund is as follows: |
| Value | Percent of net assets | |
| Alabama Fund | $ 1,830,963 | 1.9% |
| Arkansas Fund | 1,959,492 | 1.1% |
| California Fund | 50,565,513 | 8.2% |
| Georgia Fund | 2,303,530 | 1.6% |
| Maryland Fund | 3,281,079 | 2.8% |
| Massachusetts Fund | 8,348,142 | 2.1% |
| (p) | Primary market inverse floater. |
| (v) | Affiliated issuer that is available only to investment companies managed by MFS. The rate quoted for the MFS Institutional Money Market Portfolio is the annualized seven-day yield of the fund at period end. |
| (w) | When-issued security. |
| The following abbreviations are used in this report and are defined: | |
| AAC | Ambac Assurance Corp. |
| AGM | Assured Guaranty Municipal |
| BAM | Build America Mutual |
| BHAC | Berkshire Hathaway Assurance Corp. |
| COP | Certificate of Participation |
| ETM | Escrowed to Maturity |
| FGIC | Financial Guaranty Insurance Co. |
| FHA | Federal Housing Administration |
| FLR | Floating Rate. Interest rate resets periodically based on the parenthetically disclosed reference rate plus a spread (if any). The period-end rate reported may not be the current rate. All reference rates are USD unless otherwise noted. |
| FNMA | Federal National Mortgage Assn. |
| GNMA | Government National Mortgage Assn. |
| LIBOR | London Interbank Offered Rate |
| LOC | Letter of Credit |
| NPFG | National Public Finance Guarantee Corp. |
| RIBS | Residual Interest Bonds |
| SYNCORA | Syncora Guarantee Inc. |
| VRDN | Variable rate demand note that may be puttable to the issuer at the option of the holder. The stated interest rate, which generally resets either daily or weekly, represents the rate in effect at period end and may not be the current rate. |
| Alabama Fund | Arkansas Fund | California Fund | |
| Assets | |||
| Investments in unaffiliated issuers, at value (identified cost, $88,180,961, $160,594,535, and $583,765,339, respectively) | $92,851,385 | $169,883,854 | $622,602,195 |
| Investments in affiliated issuers, at value (identified cost, $1,877,346, $1,447,457, and $2,970,527, respectively) | 1,877,374 | 1,447,457 | 2,970,539 |
| Receivables for | |||
| Fund shares sold | 215,897 | 79,099 | 488,362 |
| Interest | 997,377 | 2,019,794 | 6,393,572 |
| Receivable from investment adviser | 6,231 | — | — |
| Other assets | 470 | 744 | 1,889 |
| Total assets | $95,948,734 | $173,430,948 | $632,456,557 |
| Liabilities | |||
| Payables for | |||
| Distributions | $18,896 | $19,078 | $162,698 |
| Fund shares reacquired | 37,332 | 351,804 | 904,237 |
| When-issued investments purchased | 642,817 | — | 14,503,517 |
| Payable to affiliates | |||
| Investment adviser | — | 4,157 | 14,827 |
| Administrative services fee | 128 | 184 | 499 |
| Shareholder servicing costs | 22,019 | 48,234 | 171,224 |
| Distribution and service fees | 842 | 761 | 3,374 |
| Payable for independent Trustees' compensation | 1 | 10 | 4,918 |
| Accrued expenses and other liabilities | 68,000 | 69,797 | 89,134 |
| Total liabilities | $790,035 | $494,025 | $15,854,428 |
| Net assets | $95,158,699 | $172,936,923 | $616,602,129 |
| Net assets consist of | |||
| Paid-in capital | $91,649,517 | $168,903,460 | $582,732,362 |
| Total distributable earnings (loss) | 3,509,182 | 4,033,463 | 33,869,767 |
| Net assets | $95,158,699 | $172,936,923 | $616,602,129 |
| Alabama Fund | Arkansas Fund | California Fund | |
| Net assets | |||
| Class A | $61,256,757 | $133,753,643 | $396,643,033 |
| Class B | 64,253 | 609,938 | 627,039 |
| Class C | — | — | 21,409,762 |
| Class I | 29,971,143 | 34,602,834 | 157,365,922 |
| Class R6 | 3,866,546 | 3,970,508 | 40,556,373 |
| Total net assets | $95,158,699 | $172,936,923 | $616,602,129 |
| Shares of beneficial interest outstanding | |||
| Class A | 5,854,588 | 13,287,806 | 63,540,308 |
| Class B | 6,139 | 60,539 | 100,411 |
| Class C | — | — | 3,418,477 |
| Class I | 3,005,664 | 3,463,278 | 15,486,072 |
| Class R6 | 387,743 | 397,310 | 3,993,600 |
| Total shares of beneficial interest outstanding | 9,254,134 | 17,208,933 | 86,538,868 |
| Class A shares | |||
| Net asset value per share (net assets / shares of beneficial interest outstanding) | $10.46 | $10.07 | $6.24 |
| Offering price per share (100 / 95.75 x net asset value per share) | $10.92 | $10.52 | $6.52 |
| Class B shares | |||
| Net asset value and offering price per share (net assets / shares of beneficial interest outstanding) | $10.47 | $10.08 | $6.24 |
| Class C shares | |||
| Net asset value and offering price per share (net assets / shares of beneficial interest outstanding) | $— | $— | $6.26 |
| Class I shares | |||
| Net asset value, offering price, and redemption price per share (net assets / shares of beneficial interest outstanding) | $9.97 | $9.99 | $10.16 |
| Class R6 shares | |||
| Net asset value, offering price, and redemption price per share (net assets / shares of beneficial interest outstanding) | $9.97 | $9.99 | $10.16 |
| On sales of $100,000 or more, the maximum offering price of Class A shares is reduced. A contingent deferred sales charge may be imposed on redemptions of Class A, Class B, and Class C shares. | |||
| At 3/31/21 | Georgia Fund | Maryland Fund | Massachusetts Fund |
| Assets | |||
| Investments in unaffiliated issuers, at value (identified cost, $131,082,472, $109,324,920, and $366,885,241, respectively) | $137,660,288 | $114,637,304 | $389,250,085 |
| Investments in affiliated issuers, at value (identified cost, $4,694,126, $1,711,689, and $2,485,220, respectively) | 4,694,126 | 1,711,689 | 2,485,262 |
| Cash | — | 3,267 | — |
| Receivables for | |||
| Investments sold | 35,000 | 80,000 | 2,457,663 |
| Fund shares sold | 274,598 | 306,089 | 222,562 |
| Interest | 1,356,172 | 1,155,433 | 4,001,871 |
| Receivable from investment adviser | — | 12,932 | — |
| Other assets | 621 | 564 | 1,294 |
| Total assets | $144,020,805 | $117,907,278 | $398,418,737 |
| Liabilities | |||
| Payables for | |||
| Distributions | $16,255 | $41,634 | $100,289 |
| Fund shares reacquired | 107,061 | 105,141 | 177,970 |
| When-issued investments purchased | 2,421,670 | 1,882,185 | 3,000,000 |
| Payable to affiliates | |||
| Investment adviser | 1,295 | — | 10,247 |
| Administrative services fee | 161 | 143 | 341 |
| Shareholder servicing costs | 22,156 | 26,934 | 121,413 |
| Distribution and service fees | 1,485 | 1,108 | 2,909 |
| Payable for independent Trustees' compensation | 4 | 2,947 | 2,943 |
| Accrued expenses and other liabilities | 71,579 | 68,390 | 79,647 |
| Total liabilities | $2,641,666 | $2,128,482 | $3,495,759 |
| Net assets | $141,379,139 | $115,778,796 | $394,922,978 |
| Net assets consist of | |||
| Paid-in capital | $136,735,246 | $112,658,897 | $379,218,534 |
| Total distributable earnings (loss) | 4,643,893 | 3,119,899 | 15,704,444 |
| Net assets | $141,379,139 | $115,778,796 | $394,922,978 |
| Georgia Fund | Maryland Fund | Massachusetts Fund | |
| Net assets | |||
| Class A | $108,345,525 | $82,725,316 | $216,177,448 |
| Class B | 65,837 | 655,991 | 470,390 |
| Class I | 15,011,710 | 26,242,928 | 168,647,454 |
| Class R6 | 17,956,067 | 6,154,561 | 9,627,686 |
| Total net assets | $141,379,139 | $115,778,796 | $394,922,978 |
| Shares of beneficial interest outstanding | |||
| Class A | 9,798,836 | 7,492,795 | 19,130,954 |
| Class B | 5,933 | 59,446 | 41,557 |
| Class I | 1,497,377 | 2,634,880 | 17,052,251 |
| Class R6 | 1,790,105 | 617,858 | 972,865 |
| Total shares of beneficial interest outstanding | 13,092,251 | 10,804,979 | 37,197,627 |
| Class A shares | |||
| Net asset value per share (net assets / shares of beneficial interest outstanding) | $11.06 | $11.04 | $11.30 |
| Offering price per share (100 / 95.75 x net asset value per share) | $11.55 | $11.53 | $11.80 |
| Class B shares | |||
| Net asset value and offering price per share (net assets / shares of beneficial interest outstanding) | $11.10 | $11.04 | $11.32 |
| Class I shares | |||
| Net asset value, offering price, and redemption price per share (net assets / shares of beneficial interest outstanding) | $10.03 | $9.96 | $9.89 |
| Class R6 shares | |||
| Net asset value, offering price, and redemption price per share (net assets / shares of beneficial interest outstanding) | $10.03 | $9.96 | $9.90 |
| On sales of $100,000 or more, the maximum offering price of Class A shares is reduced. A contingent deferred sales charge may be imposed on redemptions of Class A and Class B shares. | |||
| Alabama Fund | Arkansas Fund | California Fund | |
| Net investment income (loss) | |||
| Interest | $2,549,042 | $5,285,897 | $18,882,247 |
| Dividends from affiliated issuers | 4,714 | 4,338 | 14,714 |
| Other | — | 34 | — |
| Total investment income | $2,553,756 | $5,290,269 | $18,896,961 |
| Expenses | |||
| Management fee | $386,910 | $738,789 | $2,668,377 |
| Distribution and service fees | 142,818 | 332,230 | 1,211,229 |
| Shareholder servicing costs | 65,078 | 123,260 | 447,305 |
| Administrative services fee | 22,151 | 32,333 | 88,038 |
| Independent Trustees' compensation | 2,639 | 4,229 | 13,944 |
| Custodian fee | 20,339 | 24,805 | 72,602 |
| Shareholder communications | 7,888 | 10,597 | 19,077 |
| Audit and tax fees | 57,203 | 57,223 | 57,327 |
| Legal fees | 7,556 | 3,689 | 15,573 |
| Registration fees | 57,256 | 59,017 | 80,461 |
| Miscellaneous | 29,054 | 30,179 | 38,393 |
| Total expenses | $798,892 | $1,416,351 | $4,712,326 |
| Fees paid indirectly | (25) | (32) | (534) |
| Reduction of expenses by investment adviser and distributor | (98,375) | (213,773) | (648,668) |
| Net expenses | $700,492 | $1,202,546 | $4,063,124 |
| Net investment income (loss) | $1,853,264 | $4,087,723 | $14,833,837 |
| Realized and unrealized gain (loss) | |||
| Realized gain (loss) (identified cost basis) | |||
| Unaffiliated issuers | $27,245 | $324,397 | $908,876 |
| Affiliated issuers | (454) | (165) | (1,254) |
| Futures contracts | (27,647) | — | (502,708) |
| Net realized gain (loss) | $(856) | $324,232 | $404,914 |
| Change in unrealized appreciation or depreciation | |||
| Unaffiliated issuers | $2,045,914 | $4,739,218 | $25,514,826 |
| Affiliated issuers | 43 | 65 | (560) |
| Futures contracts | 156,454 | — | 601,747 |
| Net unrealized gain (loss) | $2,202,411 | $4,739,283 | $26,116,013 |
| Net realized and unrealized gain (loss) | $2,201,555 | $5,063,515 | $26,520,927 |
| Change in net assets from operations | $4,054,819 | $9,151,238 | $41,354,764 |
| Year ended 3/31/21 | Georgia Fund | Maryland Fund | Massachusetts Fund |
| Net investment income (loss) | |||
| Interest | $3,706,676 | $3,545,526 | $12,159,500 |
| Dividends from affiliated issuers | 5,810 | 3,503 | 14,761 |
| Total investment income | $3,712,486 | $3,549,029 | $12,174,261 |
| Expenses | |||
| Management fee | $590,093 | $492,778 | $1,700,659 |
| Distribution and service fees | 260,129 | 214,022 | 552,417 |
| Shareholder servicing costs | 61,003 | 83,096 | 305,107 |
| Administrative services fee | 28,015 | 25,231 | 60,093 |
| Independent Trustees' compensation | 4,128 | 4,289 | 8,530 |
| Custodian fee | 28,595 | 23,812 | 45,784 |
| Shareholder communications | 8,903 | 8,916 | 15,862 |
| Audit and tax fees | 57,213 | 57,210 | 57,275 |
| Legal fees | 10,363 | 11,043 | 23,001 |
| Registration fees | 58,630 | 60,557 | 59,176 |
| Miscellaneous | 30,341 | 29,928 | 33,722 |
| Total expenses | $1,137,413 | $1,010,882 | $2,861,626 |
| Fees paid indirectly | (37) | (14) | (17) |
| Reduction of expenses by investment adviser and distributor | (35,541) | (165,800) | (55,368) |
| Net expenses | $1,101,835 | $845,068 | $2,806,241 |
| Net investment income (loss) | $2,610,651 | $2,703,961 | $9,368,020 |
| Realized and unrealized gain (loss) | |||
| Realized gain (loss) (identified cost basis) | |||
| Unaffiliated issuers | $362,017 | $649,545 | $1,448,797 |
| Affiliated issuers | (738) | (472) | (951) |
| Futures contracts | (20,068) | (55,434) | (200,728) |
| Net realized gain (loss) | $341,211 | $593,639 | $1,247,118 |
| Change in unrealized appreciation or depreciation | |||
| Unaffiliated issuers | $3,692,402 | $3,296,475 | $11,371,058 |
| Affiliated issuers | 183 | 148 | (231) |
| Futures contracts | 168,489 | 228,664 | 481,397 |
| Net unrealized gain (loss) | $3,861,074 | $3,525,287 | $11,852,224 |
| Net realized and unrealized gain (loss) | $4,202,285 | $4,118,926 | $13,099,342 |
| Change in net assets from operations | $6,812,936 | $6,822,887 | $22,467,362 |
| Year ended 3/31/21 | Alabama Fund | Arkansas Fund | California Fund |
| Change in net assets | |||
| From operations | |||
| Net investment income (loss) | $1,853,264 | $4,087,723 | $14,833,837 |
| Net realized gain (loss) | (856) | 324,232 | 404,914 |
| Net unrealized gain (loss) | 2,202,411 | 4,739,283 | 26,116,013 |
| Change in net assets from operations | $4,054,819 | $9,151,238 | $41,354,764 |
| Total distributions to shareholders | $(1,850,090) | $(4,066,917) | $(15,216,613) |
| Change in net assets from fund share transactions | $14,561,263 | $11,671,244 | $31,627,332 |
| Total change in net assets | $16,765,992 | $16,755,565 | $57,765,483 |
| Net assets | |||
| At beginning of period | 78,392,707 | 156,181,358 | 558,836,646 |
| At end of period | $95,158,699 | $172,936,923 | $616,602,129 |
| Year ended 3/31/21 | Georgia Fund | Maryland Fund | Massachusetts Fund |
| Change in net assets | |||
| From operations | |||
| Net investment income (loss) | $2,610,651 | $2,703,961 | $9,368,020 |
| Net realized gain (loss) | 341,211 | 593,639 | 1,247,118 |
| Net unrealized gain (loss) | 3,861,074 | 3,525,287 | 11,852,224 |
| Change in net assets from operations | $6,812,936 | $6,822,887 | $22,467,362 |
| Total distributions to shareholders | $(2,591,351) | $(2,715,439) | $(9,339,543) |
| Change in net assets from fund share transactions | $21,176,870 | $5,802,071 | $22,731,107 |
| Total change in net assets | $25,398,455 | $9,909,519 | $35,858,926 |
| Net assets | |||
| At beginning of period | 115,980,684 | 105,869,277 | 359,064,052 |
| At end of period | $141,379,139 | $115,778,796 | $394,922,978 |
| Year ended 3/31/20 | Alabama Fund | Arkansas Fund | California Fund |
| Change in net assets | |||
| From operations | |||
| Net investment income (loss) | $1,986,357 | $4,355,322 | $15,218,983 |
| Net realized gain (loss) | (179,628) | 153,607 | (1,474,076) |
| Net unrealized gain (loss) | 23,365 | (1,176,525) | (9,618,323) |
| Change in net assets from operations | $1,830,094 | $3,332,404 | $4,126,584 |
| Total distributions to shareholders | $(1,981,863) | $(4,341,088) | $(14,951,745) |
| Change in net assets from fund share transactions | $14,281,691 | $5,285,713 | $153,438,096 |
| Total change in net assets | $14,129,922 | $4,277,029 | $142,612,935 |
| Net assets | |||
| At beginning of period | 64,262,785 | 151,904,329 | 416,223,711 |
| At end of period | $78,392,707 | $156,181,358 | $558,836,646 |
| Year ended 3/31/20 | Georgia Fund | Maryland Fund | Massachusetts Fund |
| Change in net assets | |||
| From operations | |||
| Net investment income (loss) | $2,691,910 | $2,918,905 | $10,121,738 |
| Net realized gain (loss) | (836,345) | (285,767) | (4,109,644) |
| Net unrealized gain (loss) | (269,162) | (1,556,583) | (3,491,049) |
| Change in net assets from operations | $1,586,403 | $1,076,555 | $2,521,045 |
| Total distributions to shareholders | $(2,708,728) | $(2,932,004) | $(9,982,094) |
| Change in net assets from fund share transactions | $31,043,555 | $18,146,839 | $85,452,067 |
| Total change in net assets | $29,921,230 | $16,291,390 | $77,991,018 |
| Net assets | |||
| At beginning of period | 86,059,454 | 89,577,887 | 281,073,034 |
| At end of period | $115,980,684 | $105,869,277 | $359,064,052 |
| Year ended | |||||
| Class A | 3/31/21 | 3/31/20 | 3/31/19 | 3/31/18 | 3/31/17 |
| Net asset value, beginning of period | $10.18 | $10.15 | $10.02 | $10.12 | $10.49 |
| Income (loss) from investment operations | |||||
| Net investment income (loss) (d) | $0.22 | $0.27 | $0.36 | $0.34 | $0.37(c) |
| Net realized and unrealized gain (loss) | 0.28 | 0.02 | 0.09 | (0.10) | (0.37) |
| Total from investment operations | $0.50 | $0.29 | $0.45 | $0.24 | $0.00(w) |
| Less distributions declared to shareholders | |||||
| From net investment income | $(0.22) | $(0.26) | $(0.32) | $(0.34) | $(0.37) |
| Net asset value, end of period (x) | $10.46 | $10.18 | $10.15 | $10.02 | $10.12 |
| Total return (%) (r)(s)(t)(x) | 4.91 | 2.89 | 4.63 | 2.35 | (0.07)(c) |
| Ratios (%) (to average net assets) and Supplemental data: | |||||
| Expenses before expense reductions (f) | 1.01 | 1.04 | 1.09 | 1.10 | 1.07(c) |
| Expenses after expense reductions (f) | 0.90 | 0.90 | 0.90 | 0.90 | 0.89(c) |
| Net investment income (loss) | 2.07 | 2.56 | 3.60 | 3.37 | 3.61(c) |
| Portfolio turnover | 25 | 30 | 19 | 17 | 15 |
| Net assets at end of period (000 omitted) | $61,257 | $53,321 | $51,280 | $50,914 | $53,883 |
| Year ended | |||||
| Class B | 3/31/21 | 3/31/20 | 3/31/19 | 3/31/18 | 3/31/17 |
| Net asset value, beginning of period | $10.18 | $10.15 | $10.02 | $10.12 | $10.49 |
| Income (loss) from investment operations | |||||
| Net investment income (loss) (d) | $0.15 | $0.19 | $0.28 | $0.27 | $0.30(c) |
| Net realized and unrealized gain (loss) | 0.28 | 0.03 | 0.10 | (0.11) | (0.38) |
| Total from investment operations | $0.43 | $0.22 | $0.38 | $0.16 | $(0.08) |
| Less distributions declared to shareholders | |||||
| From net investment income | $(0.14) | $(0.19) | $(0.25) | $(0.26) | $(0.29) |
| Net asset value, end of period (x) | $10.47 | $10.18 | $10.15 | $10.02 | $10.12 |
| Total return (%) (r)(s)(t)(x) | 4.24 | 2.13 | 3.85 | 1.59 | (0.81)(c) |
| Ratios (%) (to average net assets) and Supplemental data: | |||||
| Expenses before expense reductions (f) | 1.77 | 1.80 | 1.84 | 1.84 | 1.82(c) |
| Expenses after expense reductions (f) | 1.65 | 1.65 | 1.65 | 1.65 | 1.65(c) |
| Net investment income (loss) | 1.44 | 1.86 | 2.85 | 2.63 | 2.86(c) |
| Portfolio turnover | 25 | 30 | 19 | 17 | 15 |
| Net assets at end of period (000 omitted) | $64 | $176 | $250 | $303 | $467 |
| Year ended | |||||
| Class I | 3/31/21 | 3/31/20 | 3/31/19 | 3/31/18 | 3/31/17(i) |
| Net asset value, beginning of period | $9.70 | $9.67 | $9.55 | $9.65 | $10.00 |
| Income (loss) from investment operations | |||||
| Net investment income (loss) (d) | $0.23 | $0.27 | $0.37 | $0.35 | $0.38(c) |
| Net realized and unrealized gain (loss) | 0.27 | 0.04 | 0.08 | (0.11) | (0.36) |
| Total from investment operations | $0.50 | $0.31 | $0.45 | $0.24 | $0.02 |
| Less distributions declared to shareholders | |||||
| From net investment income | $(0.23) | $(0.28) | $(0.33) | $(0.34) | $(0.37) |
| Net asset value, end of period (x) | $9.97 | $9.70 | $9.67 | $9.55 | $9.65 |
| Total return (%) (r)(s)(t)(x) | 5.21 | 3.15 | 4.83 | 2.55 | 0.21(c) |
| Ratios (%) (to average net assets) and Supplemental data: | |||||
| Expenses before expense reductions (f) | 0.76 | 0.79 | 0.84 | 0.85 | 0.86(c) |
| Expenses after expense reductions (f) | 0.65 | 0.65 | 0.65 | 0.65 | 0.64(c) |
| Net investment income (loss) | 2.31 | 2.77 | 3.85 | 3.62 | 3.84(c) |
| Portfolio turnover | 25 | 30 | 19 | 17 | 15 |
| Net assets at end of period (000 omitted) | $29,971 | $22,796 | $11,490 | $6,898 | $5,876 |
| Year ended | ||||
| Class R6 | 3/31/21 | 3/31/20 | 3/31/19 | 3/31/18(i) |
| Net asset value, beginning of period | $9.70 | $9.67 | $9.55 | $9.76 |
| Income (loss) from investment operations | ||||
| Net investment income (loss) (d) | $0.23 | $0.28 | $0.37 | $0.24 |
| Net realized and unrealized gain (loss) | 0.28 | 0.03 | 0.09 | (0.22) |
| Total from investment operations | $0.51 | $0.31 | $0.46 | $0.02 |
| Less distributions declared to shareholders | ||||
| From net investment income | $(0.24) | $(0.28) | $(0.34) | $(0.23) |
| Net asset value, end of period (x) | $9.97 | $9.70 | $9.67 | $9.55 |
| Total return (%) (r)(s)(t)(x) | 5.28 | 3.23 | 4.92 | 0.25(n) |
| Ratios (%) (to average net assets) and Supplemental data: | ||||
| Expenses before expense reductions (f) | 0.69 | 0.71 | 0.77 | 0.84(a) |
| Expenses after expense reductions (f) | 0.58 | 0.57 | 0.58 | 0.58(a) |
| Net investment income (loss) | 2.35 | 2.85 | 3.92 | 3.70(a) |
| Portfolio turnover | 25 | 30 | 19 | 17 |
| Net assets at end of period (000 omitted) | $3,867 | $2,100 | $1,242 | $1,274 |
| (a) | Annualized. |
| (c) | Amount reflects a one-time reimbursement of expenses by the custodian (or former custodian) without which net investment income and performance would be lower and expenses would be higher. |
| (d) | Per share data is based on average shares outstanding. |
| (f) | Ratios do not reflect reductions from fees paid indirectly, if applicable. |
| (i) | For Class I and Class R6, the period is from the class inception, April 1, 2016 (Class I) and August 1, 2017 (Class R6), through the stated period end. |
| (n) | Not annualized. |
| (r) | Certain expenses have been reduced without which performance would have been lower. |
| (s) | From time to time the fund may receive proceeds from litigation settlements, without which performance would be lower. |
| (t) | Total returns do not include any applicable sales charges. |
| (w) | Per share amount was less than $0.01. |
| (x) | The net asset values and total returns have been calculated on net assets which include adjustments made in accordance with U.S. generally accepted accounting principles required at period end for financial reporting purposes. |
| Year ended | |||||
| Class A | 3/31/21 | 3/31/20 | 3/31/19 | 3/31/18 | 3/31/17 |
| Net asset value, beginning of period | $9.75 | $9.80 | $9.64 | $9.73 | $10.07 |
| Income (loss) from investment operations | |||||
| Net investment income (loss) (d) | $0.25 | $0.27 | $0.33 | $0.30 | $0.33(c) |
| Net realized and unrealized gain (loss) | 0.32 | (0.05) | 0.12 | (0.09) | (0.35) |
| Total from investment operations | $0.57 | $0.22 | $0.45 | $0.21 | $(0.02) |
| Less distributions declared to shareholders | |||||
| From net investment income | $(0.25) | $(0.27) | $(0.29) | $(0.30) | $(0.32) |
| Net asset value, end of period (x) | $10.07 | $9.75 | $9.80 | $9.64 | $9.73 |
| Total return (%) (r)(s)(t)(x) | 5.85 | 2.27 | 4.74 | 2.12 | (0.25)(c) |
| Ratios (%) (to average net assets) and Supplemental data: | |||||
| Expenses before expense reductions (f) | 0.91 | 0.92 | 0.93 | 0.92 | 0.92(c) |
| Expenses after expense reductions (f) | 0.75 | 0.76 | 0.77 | 0.77 | 0.76(c) |
| Net investment income (loss) | 2.47 | 2.77 | 3.40 | 3.06 | 3.33(c) |
| Portfolio turnover | 22 | 20 | 14 | 17 | 17 |
| Net assets at end of period (000 omitted) | $133,754 | $123,979 | $121,888 | $141,605 | $145,392 |
| Year ended | |||||
| Class B | 3/31/21 | 3/31/20 | 3/31/19 | 3/31/18 | 3/31/17 |
| Net asset value, beginning of period | $9.76 | $9.81 | $9.65 | $9.73 | $10.08 |
| Income (loss) from investment operations | |||||
| Net investment income (loss) (d) | $0.18 | $0.20 | $0.25 | $0.23 | $0.26(c) |
| Net realized and unrealized gain (loss) | 0.31 | (0.05) | 0.13 | (0.09) | (0.37) |
| Total from investment operations | $0.49 | $0.15 | $0.38 | $0.14 | $(0.11) |
| Less distributions declared to shareholders | |||||
| From net investment income | $(0.17) | $(0.20) | $(0.22) | $(0.22) | $(0.24) |
| Net asset value, end of period (x) | $10.08 | $9.76 | $9.81 | $9.65 | $9.73 |
| Total return (%) (r)(s)(t)(x) | 5.07 | 1.51 | 3.97 | 1.47 | (1.10)(c) |
| Ratios (%) (to average net assets) and Supplemental data: | |||||
| Expenses before expense reductions (f) | 1.66 | 1.67 | 1.68 | 1.68 | 1.66(c) |
| Expenses after expense reductions (f) | 1.50 | 1.51 | 1.52 | 1.52 | 1.52(c) |
| Net investment income (loss) | 1.79 | 2.03 | 2.64 | 2.31 | 2.57(c) |
| Portfolio turnover | 22 | 20 | 14 | 17 | 17 |
| Net assets at end of period (000 omitted) | $610 | $1,587 | $2,477 | $4,209 | $5,882 |
| Year ended | |||||
| Class I | 3/31/21 | 3/31/20 | 3/31/19 | 3/31/18 | 3/31/17(i) |
| Net asset value, beginning of period | $9.68 | $9.73 | $9.57 | $9.65 | $10.00 |
| Income (loss) from investment operations | |||||
| Net investment income (loss) (d) | $0.25 | $0.28 | $0.33 | $0.31 | $0.34(c) |
| Net realized and unrealized gain (loss) | 0.31 | (0.05) | 0.13 | (0.09) | (0.37) |
| Total from investment operations | $0.56 | $0.23 | $0.46 | $0.22 | $(0.03) |
| Less distributions declared to shareholders | |||||
| From net investment income | $(0.25) | $(0.28) | $(0.30) | $(0.30) | $(0.32) |
| Net asset value, end of period (x) | $9.99 | $9.68 | $9.73 | $9.57 | $9.65 |
| Total return (%) (r)(s)(t)(x) | 5.88 | 2.36 | 4.86 | 2.32 | (0.28)(c) |
| Ratios (%) (to average net assets) and Supplemental data: | |||||
| Expenses before expense reductions (f) | 0.66 | 0.67 | 0.68 | 0.67 | 0.68(c) |
| Expenses after expense reductions (f) | 0.65 | 0.66 | 0.67 | 0.67 | 0.67(c) |
| Net investment income (loss) | 2.56 | 2.86 | 3.49 | 3.16 | 3.43(c) |
| Portfolio turnover | 22 | 20 | 14 | 17 | 17 |
| Net assets at end of period (000 omitted) | $34,603 | $29,078 | $26,586 | $13,733 | $10,733 |
| Year ended | ||||
| Class R6 | 3/31/21 | 3/31/20 | 3/31/19 | 3/31/18(i) |
| Net asset value, beginning of period | $9.68 | $9.73 | $9.58 | $9.78 |
| Income (loss) from investment operations | ||||
| Net investment income (loss) (d) | $0.26 | $0.29 | $0.34 | $0.20 |
| Net realized and unrealized gain (loss) | 0.31 | (0.05) | 0.11 | (0.19) |
| Total from investment operations | $0.57 | $0.24 | $0.45 | $0.01 |
| Less distributions declared to shareholders | ||||
| From net investment income | $(0.26) | $(0.29) | $(0.30) | $(0.21) |
| Net asset value, end of period (x) | $9.99 | $9.68 | $9.73 | $9.58 |
| Total return (%) (r)(s)(t)(x) | 5.95 | 2.44 | 4.83 | 0.09(n) |
| Ratios (%) (to average net assets) and Supplemental data: | ||||
| Expenses before expense reductions (f) | 0.58 | 0.59 | 0.60 | 0.61(a) |
| Expenses after expense reductions (f) | 0.57 | 0.58 | 0.59 | 0.61(a) |
| Net investment income (loss) | 2.58 | 2.92 | 3.58 | 3.19(a) |
| Portfolio turnover | 22 | 20 | 14 | 17 |
| Net assets at end of period (000 omitted) | $3,971 | $1,538 | $954 | $766 |
| (a) | Annualized. |
| (c) | Amount reflects a one-time reimbursement of expenses by the custodian (or former custodian) without which net investment income and performance would be lower and expenses would be higher. |
| (d) | Per share data is based on average shares outstanding. |
| (f) | Ratios do not reflect reductions from fees paid indirectly, if applicable. |
| (i) | For Class I and Class R6, the period is from the class inception, April 1, 2016 (Class I) and August 1, 2017 (Class R6), through the stated period end. |
| (n) | Not annualized. |
| (r) | Certain expenses have been reduced without which performance would have been lower. |
| (s) | From time to time the fund may receive proceeds from litigation settlements, without which performance would be lower. |
| (t) | Total returns do not include any applicable sales charges. |
| (x) | The net asset values and total returns have been calculated on net assets which include adjustments made in accordance with U.S. generally accepted accounting principles required at period end for financial reporting purposes. |
| Year ended | |||||
| Class A | 3/31/21 | 3/31/20 | 3/31/19 | 3/31/18 | 3/31/17 |
| Net asset value, beginning of period | $5.97 | $6.04 | $5.94 | $5.95 | $6.14 |
| Income (loss) from investment operations | |||||
| Net investment income (loss) (d) | $0.15 | $0.18 | $0.22 | $0.23 | $0.23(c) |
| Net realized and unrealized gain (loss) | 0.28 | (0.07) | 0.08 | (0.02) | (0.21) |
| Total from investment operations | $0.43 | $0.11 | $0.30 | $0.21 | $0.02 |
| Less distributions declared to shareholders | |||||
| From net investment income | $(0.16) | $(0.18) | $(0.20) | $(0.22) | $(0.21) |
| Net asset value, end of period (x) | $6.24 | $5.97 | $6.04 | $5.94 | $5.95 |
| Total return (%) (r)(s)(t)(x) | 7.24 | 1.76 | 5.21 | 3.47 | 0.33(c) |
| Ratios (%) (to average net assets) and Supplemental data: | |||||
| Expenses before expense reductions (f) | 0.84 | 0.86 | 0.87 | 0.88 | 0.88(c) |
| Expenses after expense reductions (f) | 0.68 | 0.70 | 0.71 | 0.72 | 0.72(c) |
| Net investment income (loss) | 2.50 | 2.94 | 3.76 | 3.75 | 3.72(c) |
| Portfolio turnover | 31 | 22 | 15 | 15 | 17 |
| Net assets at end of period (000 omitted) | $396,643 | $374,941 | $299,882 | $272,958 | $251,271 |
| Year ended | |||||
| Class B | 3/31/21 | 3/31/20 | 3/31/19 | 3/31/18 | 3/31/17 |
| Net asset value, beginning of period | $5.97 | $6.04 | $5.94 | $5.95 | $6.14 |
| Income (loss) from investment operations | |||||
| Net investment income (loss) (d) | $0.11 | $0.14 | $0.18 | $0.18 | $0.18(c) |
| Net realized and unrealized gain (loss) | 0.27 | (0.08) | 0.08 | (0.02) | (0.20) |
| Total from investment operations | $0.38 | $0.06 | $0.26 | $0.16 | $(0.02) |
| Less distributions declared to shareholders | |||||
| From net investment income | $(0.11) | $(0.13) | $(0.16) | $(0.17) | $(0.17) |
| Net asset value, end of period (x) | $6.24 | $5.97 | $6.04 | $5.94 | $5.95 |
| Total return (%) (r)(s)(t)(x) | 6.45 | 1.00 | 4.43 | 2.69 | (0.43)(c) |
| Ratios (%) (to average net assets) and Supplemental data: | |||||
| Expenses before expense reductions (f) | 1.59 | 1.61 | 1.62 | 1.63 | 1.63(c) |
| Expenses after expense reductions (f) | 1.43 | 1.45 | 1.46 | 1.48 | 1.49(c) |
| Net investment income (loss) | 1.78 | 2.22 | 3.01 | 3.02 | 2.95(c) |
| Portfolio turnover | 31 | 22 | 15 | 15 | 17 |
| Net assets at end of period (000 omitted) | $627 | $1,033 | $1,506 | $1,913 | $2,672 |
| Year ended | |||||
| Class C | 3/31/21 | 3/31/20 | 3/31/19 | 3/31/18 | 3/31/17 |
| Net asset value, beginning of period | $5.99 | $6.06 | $5.96 | $5.97 | $6.16 |
| Income (loss) from investment operations | |||||
| Net investment income (loss) (d) | $0.10 | $0.13 | $0.17 | $0.17 | $0.17(c) |
| Net realized and unrealized gain (loss) | 0.27 | (0.08) | 0.08 | (0.02) | (0.20) |
| Total from investment operations | $0.37 | $0.05 | $0.25 | $0.15 | $(0.03) |
| Less distributions declared to shareholders | |||||
| From net investment income | $(0.10) | $(0.12) | $(0.15) | $(0.16) | $(0.16) |
| Net asset value, end of period (x) | $6.26 | $5.99 | $6.06 | $5.96 | $5.97 |
| Total return (%) (r)(s)(t)(x) | 6.27 | 0.85 | 4.26 | 2.54 | (0.55)(c) |
| Ratios (%) (to average net assets) and Supplemental data: | |||||
| Expenses before expense reductions (f) | 1.59 | 1.61 | 1.62 | 1.63 | 1.63(c) |
| Expenses after expense reductions (f) | 1.58 | 1.60 | 1.61 | 1.62 | 1.62(c) |
| Net investment income (loss) | 1.62 | 2.05 | 2.86 | 2.86 | 2.82(c) |
| Portfolio turnover | 31 | 22 | 15 | 15 | 17 |
| Net assets at end of period (000 omitted) | $21,410 | $25,552 | $22,786 | $31,800 | $33,950 |
| Year ended | |||||
| Class I | 3/31/21 | 3/31/20 | 3/31/19 | 3/31/18 | 3/31/17(i) |
| Net asset value, beginning of period | $9.71 | $9.83 | $9.67 | $9.68 | $10.00 |
| Income (loss) from investment operations | |||||
| Net investment income (loss) (d) | $0.26 | $0.31 | $0.37 | $0.37 | $0.38(c) |
| Net realized and unrealized gain (loss) | 0.46 | (0.13) | 0.13 | (0.02) | (0.36) |
| Total from investment operations | $0.72 | $0.18 | $0.50 | $0.35 | $0.02 |
| Less distributions declared to shareholders | |||||
| From net investment income | $(0.27) | $(0.30) | $(0.34) | $(0.36) | $(0.34) |
| Net asset value, end of period (x) | $10.16 | $9.71 | $9.83 | $9.67 | $9.68 |
| Total return (%) (r)(s)(t)(x) | 7.46 | 1.79 | 5.27 | 3.63 | 0.20(c) |
| Ratios (%) (to average net assets) and Supplemental data: | |||||
| Expenses before expense reductions (f) | 0.59 | 0.61 | 0.62 | 0.62 | 0.63(c) |
| Expenses after expense reductions (f) | 0.58 | 0.60 | 0.61 | 0.61 | 0.63(c) |
| Net investment income (loss) | 2.60 | 3.04 | 3.85 | 3.83 | 3.83(c) |
| Portfolio turnover | 31 | 22 | 15 | 15 | 17 |
| Net assets at end of period (000 omitted) | $157,366 | $128,914 | $79,276 | $56,553 | $42,369 |
| Year ended | ||||
| Class R6 | 3/31/21 | 3/31/20 | 3/31/19 | 3/31/18(i) |
| Net asset value, beginning of period | $9.71 | $9.82 | $9.66 | $9.84 |
| Income (loss) from investment operations | ||||
| Net investment income (loss) (d) | $0.27 | $0.31 | $0.38 | $0.24 |
| Net realized and unrealized gain (loss) | 0.45 | (0.11) | 0.12 | (0.18) |
| Total from investment operations | $0.72 | $0.20 | $0.50 | $0.06 |
| Less distributions declared to shareholders | ||||
| From net investment income | $(0.27) | $(0.31) | $(0.34) | $(0.24) |
| Net asset value, end of period (x) | $10.16 | $9.71 | $9.82 | $9.66 |
| Total return (%) (r)(s)(t)(x) | 7.54 | 1.97 | 5.36 | 0.61(n) |
| Ratios (%) (to average net assets) and Supplemental data: | ||||
| Expenses before expense reductions (f) | 0.52 | 0.53 | 0.54 | 0.56(a) |
| Expenses after expense reductions (f) | 0.51 | 0.52 | 0.53 | 0.55(a) |
| Net investment income (loss) | 2.66 | 3.10 | 3.92 | 3.78(a) |
| Portfolio turnover | 31 | 22 | 15 | 15 |
| Net assets at end of period (000 omitted) | $40,556 | $28,396 | $12,773 | $5,995 |
| (a) | Annualized. |
| (c) | Amount reflects a one-time reimbursement of expenses by the custodian (or former custodian) without which net investment income and performance would be lower and expenses would be higher. |
| (d) | Per share data is based on average shares outstanding. |
| (f) | Ratios do not reflect reductions from fees paid indirectly, if applicable. |
| (i) | For Class I and Class R6, the period is from the class inception, April 1, 2016 (Class I) and August 1, 2017 (Class R6), through the stated period end. |
| (n) | Not annualized. |
| (r) | Certain expenses have been reduced without which performance would have been lower. |
| (s) | From time to time the fund may receive proceeds from litigation settlements, without which performance would be lower. |
| (t) | Total returns do not include any applicable sales charges. |
| (x) | The net asset values and total returns have been calculated on net assets which include adjustments made in accordance with U.S. generally accepted accounting principles required at period end for financial reporting purposes. |
| Year ended | |||||
| Class A | 3/31/21 | 3/31/20 | 3/31/19 | 3/31/18 | 3/31/17 |
| Net asset value, beginning of period | $10.70 | $10.73 | $10.58 | $10.68 | $11.02 |
| Income (loss) from investment operations | |||||
| Net investment income (loss) (d) | $0.21 | $0.26 | $0.36 | $0.35 | $0.36(c) |
| Net realized and unrealized gain (loss) | 0.36 | (0.02) | 0.11 | (0.12) | (0.36) |
| Total from investment operations | $0.57 | $0.24 | $0.47 | $0.23 | $0.00(w) |
| Less distributions declared to shareholders | |||||
| From net investment income | $(0.21) | $(0.27) | $(0.32) | $(0.33) | $(0.34) |
| Net asset value, end of period (x) | $11.06 | $10.70 | $10.73 | $10.58 | $10.68 |
| Total return (%) (r)(s)(t)(x) | 5.38 | 2.17 | 4.51 | 2.15 | (0.06)(c) |
| Ratios (%) (to average net assets) and Supplemental data: | |||||
| Expenses before expense reductions (f) | 0.92 | 0.95 | 1.02 | 1.04 | 1.03(c) |
| Expenses after expense reductions (f) | 0.90 | 0.90 | 0.90 | 0.90 | 0.90(c) |
| Net investment income (loss) | 1.94 | 2.39 | 3.41 | 3.26 | 3.26(c) |
| Portfolio turnover | 22 | 28 | 14 | 12 | 8 |
| Net assets at end of period (000 omitted) | $108,346 | $95,352 | $70,456 | $65,922 | $61,229 |
| Year ended | |||||
| Class B | 3/31/21 | 3/31/20 | 3/31/19 | 3/31/18 | 3/31/17 |
| Net asset value, beginning of period | $10.74 | $10.77 | $10.62 | $10.72 | $11.06 |
| Income (loss) from investment operations | |||||
| Net investment income (loss) (d) | $0.14 | $0.19 | $0.28 | $0.27 | $0.28(c) |
| Net realized and unrealized gain (loss) | 0.35 | (0.03) | 0.11 | (0.12) | (0.36) |
| Total from investment operations | $0.49 | $0.16 | $0.39 | $0.15 | $(0.08) |
| Less distributions declared to shareholders | |||||
| From net investment income | $(0.13) | $(0.19) | $(0.24) | $(0.25) | $(0.26) |
| Net asset value, end of period (x) | $11.10 | $10.74 | $10.77 | $10.62 | $10.72 |
| Total return (%) (r)(s)(t)(x) | 4.61 | 1.44 | 3.73 | 1.40 | (0.79)(c) |
| Ratios (%) (to average net assets) and Supplemental data: | |||||
| Expenses before expense reductions (f) | 1.68 | 1.71 | 1.77 | 1.79 | 1.78(c) |
| Expenses after expense reductions (f) | 1.63 | 1.63 | 1.65 | 1.65 | 1.66(c) |
| Net investment income (loss) | 1.29 | 1.72 | 2.67 | 2.54 | 2.52(c) |
| Portfolio turnover | 22 | 28 | 14 | 12 | 8 |
| Net assets at end of period (000 omitted) | $66 | $261 | $399 | $563 | $1,105 |
| Year ended | |||||
| Class I | 3/31/21 | 3/31/20 | 3/31/19 | 3/31/18 | 3/31/17(i) |
| Net asset value, beginning of period | $9.70 | $9.73 | $9.60 | $9.69 | $10.00 |
| Income (loss) from investment operations | |||||
| Net investment income (loss) (d) | $0.21 | $0.26 | $0.35 | $0.34 | $0.35(c) |
| Net realized and unrealized gain (loss) | 0.34 | (0.02) | 0.09 | (0.11) | (0.33) |
| Total from investment operations | $0.55 | $0.24 | $0.44 | $0.23 | $0.02 |
| Less distributions declared to shareholders | |||||
| From net investment income | $(0.22) | $(0.27) | $(0.31) | $(0.32) | $(0.33) |
| Net asset value, end of period (x) | $10.03 | $9.70 | $9.73 | $9.60 | $9.69 |
| Total return (%) (r)(s)(t)(x) | 5.68 | 2.39 | 4.70 | 2.40 | 0.19(c) |
| Ratios (%) (to average net assets) and Supplemental data: | |||||
| Expenses before expense reductions (f) | 0.67 | 0.70 | 0.77 | 0.79 | 0.80(c) |
| Expenses after expense reductions (f) | 0.65 | 0.65 | 0.65 | 0.65 | 0.64(c) |
| Net investment income (loss) | 2.16 | 2.64 | 3.65 | 3.49 | 3.52(c) |
| Portfolio turnover | 22 | 28 | 14 | 12 | 8 |
| Net assets at end of period (000 omitted) | $15,012 | $9,345 | $7,834 | $6,817 | $7,451 |
| Year ended | ||||
| Class R6 | 3/31/21 | 3/31/20 | 3/31/19 | 3/31/18(i) |
| Net asset value, beginning of period | $9.70 | $9.73 | $9.60 | $9.82 |
| Income (loss) from investment operations | ||||
| Net investment income (loss) (d) | $0.22 | $0.27 | $0.36 | $0.23 |
| Net realized and unrealized gain (loss) | 0.33 | (0.03) | 0.09 | (0.23) |
| Total from investment operations | $0.55 | $0.24 | $0.45 | $0.00(w) |
| Less distributions declared to shareholders | ||||
| From net investment income | $(0.22) | $(0.27) | $(0.32) | $(0.22) |
| Net asset value, end of period (x) | $10.03 | $9.70 | $9.73 | $9.60 |
| Total return (%) (r)(s)(t)(x) | 5.72 | 2.44 | 4.77 | (0.05)(n) |
| Ratios (%) (to average net assets) and Supplemental data: | ||||
| Expenses before expense reductions (f) | 0.62 | 0.65 | 0.70 | 0.82(a) |
| Expenses after expense reductions (f) | 0.60 | 0.60 | 0.59 | 0.59(a) |
| Net investment income (loss) | 2.20 | 2.68 | 3.72 | 3.56(a) |
| Portfolio turnover | 22 | 28 | 14 | 12 |
| Net assets at end of period (000 omitted) | $17,956 | $11,022 | $7,371 | $5,988 |
| (a) | Annualized. |
| (c) | Amount reflects a one-time reimbursement of expenses by the custodian (or former custodian) without which net investment income and performance would be lower and expenses would be higher. |
| (d) | Per share data is based on average shares outstanding. |
| (f) | Ratios do not reflect reductions from fees paid indirectly, if applicable. |
| (i) | For Class I and Class R6, the period is from the class inception, April 1, 2016 (Class I) and August 1, 2017 (Class R6), through the stated period end. |
| (n) | Not annualized. |
| (r) | Certain expenses have been reduced without which performance would have been lower. |
| (s) | From time to time the fund may receive proceeds from litigation settlements, without which performance would be lower. |
| (t) | Total returns do not include any applicable sales charges. |
| (w) | Per share amount was less than $0.01. |
| (x) | The net asset values and total returns have been calculated on net assets which include adjustments made in accordance with U.S. generally accepted accounting principles required at period end for financial reporting purposes. |
| Year ended | |||||
| Class A | 3/31/21 | 3/31/20 | 3/31/19 | 3/31/18 | 3/31/17 |
| Net asset value, beginning of period | $10.62 | $10.76 | $10.65 | $10.76 | $11.09 |
| Income (loss) from investment operations | |||||
| Net investment income (loss) (d) | $0.26 | $0.31 | $0.40 | $0.38 | $0.40(c) |
| Net realized and unrealized gain (loss) | 0.42 | (0.14) | 0.06 | (0.12) | (0.35) |
| Total from investment operations | $0.68 | $0.17 | $0.46 | $0.26 | $0.05 |
| Less distributions declared to shareholders | |||||
| From net investment income | $(0.26) | $(0.31) | $(0.35) | $(0.37) | $(0.38) |
| Net asset value, end of period (x) | $11.04 | $10.62 | $10.76 | $10.65 | $10.76 |
| Total return (%) (r)(s)(t)(x) | 6.51 | 1.57 | 4.46 | 2.39 | 0.43(c) |
| Ratios (%) (to average net assets) and Supplemental data: | |||||
| Expenses before expense reductions (f) | 0.98 | 0.99 | 1.01 | 1.02 | 0.99(c) |
| Expenses after expense reductions (f) | 0.83 | 0.82 | 0.82 | 0.82 | 0.82(c) |
| Net investment income (loss) | 2.42 | 2.85 | 3.77 | 3.48 | 3.68(c) |
| Portfolio turnover | 27 | 27 | 14 | 23 | 17 |
| Net assets at end of period (000 omitted) | $82,725 | $83,852 | $75,215 | $76,993 | $80,456 |
| Year ended | |||||
| Class B | 3/31/21 | 3/31/20 | 3/31/19 | 3/31/18 | 3/31/17 |
| Net asset value, beginning of period | $10.62 | $10.75 | $10.65 | $10.76 | $11.08 |
| Income (loss) from investment operations | |||||
| Net investment income (loss) (d) | $0.18 | $0.23 | $0.32 | $0.29 | $0.32(c) |
| Net realized and unrealized gain (loss) | 0.42 | (0.13) | 0.05 | (0.11) | (0.34) |
| Total from investment operations | $0.60 | $0.10 | $0.37 | $0.18 | $(0.02) |
| Less distributions declared to shareholders | |||||
| From net investment income | $(0.18) | $(0.23) | $(0.27) | $(0.29) | $(0.30) |
| Net asset value, end of period (x) | $11.04 | $10.62 | $10.75 | $10.65 | $10.76 |
| Total return (%) (r)(s)(t)(x) | 5.71 | 0.91 | 3.58 | 1.62 | (0.23)(c) |
| Ratios (%) (to average net assets) and Supplemental data: | |||||
| Expenses before expense reductions (f) | 1.73 | 1.74 | 1.76 | 1.77 | 1.74(c) |
| Expenses after expense reductions (f) | 1.58 | 1.58 | 1.58 | 1.58 | 1.57(c) |
| Net investment income (loss) | 1.69 | 2.12 | 3.01 | 2.73 | 2.94(c) |
| Portfolio turnover | 27 | 27 | 14 | 23 | 17 |
| Net assets at end of period (000 omitted) | $656 | $1,040 | $1,217 | $1,331 | $1,605 |
| Year ended | |||||
| Class I | 3/31/21 | 3/31/20 | 3/31/19 | 3/31/18 | 3/31/17(i) |
| Net asset value, beginning of period | $9.58 | $9.70 | $9.61 | $9.71 | $10.00 |
| Income (loss) from investment operations | |||||
| Net investment income (loss) (d) | $0.26 | $0.30 | $0.38 | $0.36 | $0.38(c) |
| Net realized and unrealized gain (loss) | 0.38 | (0.11) | 0.05 | (0.11) | (0.30) |
| Total from investment operations | $0.64 | $0.19 | $0.43 | $0.25 | $0.08 |
| Less distributions declared to shareholders | |||||
| From net investment income | $(0.26) | $(0.31) | $(0.34) | $(0.35) | $(0.37) |
| Net asset value, end of period (x) | $9.96 | $9.58 | $9.70 | $9.61 | $9.71 |
| Total return (%) (r)(s)(t)(x) | 6.78 | 1.88 | 4.61 | 2.62 | 0.78(c) |
| Ratios (%) (to average net assets) and Supplemental data: | |||||
| Expenses before expense reductions (f) | 0.73 | 0.74 | 0.76 | 0.77 | 0.78(c) |
| Expenses after expense reductions (f) | 0.58 | 0.58 | 0.58 | 0.58 | 0.57(c) |
| Net investment income (loss) | 2.64 | 3.07 | 4.01 | 3.72 | 3.85(c) |
| Portfolio turnover | 27 | 27 | 14 | 23 | 17 |
| Net assets at end of period (000 omitted) | $26,243 | $18,140 | $11,831 | $9,261 | $6,437 |
| Year ended | ||||
| Class R6 | 3/31/21 | 3/31/20 | 3/31/19 | 3/31/18(i) |
| Net asset value, beginning of period | $9.58 | $9.70 | $9.61 | $9.81 |
| Income (loss) from investment operations | ||||
| Net investment income (loss) (d) | $0.26 | $0.30 | $0.39 | $0.24 |
| Net realized and unrealized gain (loss) | 0.39 | (0.11) | 0.05 | (0.21) |
| Total from investment operations | $0.65 | $0.19 | $0.44 | $0.03 |
| Less distributions declared to shareholders | ||||
| From net investment income | $(0.27) | $(0.31) | $(0.35) | $(0.23) |
| Net asset value, end of period (x) | $9.96 | $9.58 | $9.70 | $9.61 |
| Total return (%) (r)(s)(t)(x) | 6.84 | 1.93 | 4.67 | 0.35(n) |
| Ratios (%) (to average net assets) and Supplemental data: | ||||
| Expenses before expense reductions (f) | 0.66 | 0.68 | 0.70 | 0.76(a) |
| Expenses after expense reductions (f) | 0.52 | 0.52 | 0.52 | 0.52(a) |
| Net investment income (loss) | 2.67 | 3.10 | 4.07 | 3.79(a) |
| Portfolio turnover | 27 | 27 | 14 | 23 |
| Net assets at end of period (000 omitted) | $6,155 | $2,837 | $1,315 | $961 |
| (a) | Annualized. |
| (c) | Amount reflects a one-time reimbursement of expenses by the custodian (or former custodian) without which net investment income and performance would be lower and expenses would be higher. |
| (d) | Per share data is based on average shares outstanding. |
| (f) | Ratios do not reflect reductions from fees paid indirectly, if applicable. |
| (i) | For Class I and Class R6, the period is from the class inception, April 1, 2016 (Class I) and August 1, 2017 (Class R6), through the stated period end. |
| (n) | Not annualized. |
| (r) | Certain expenses have been reduced without which performance would have been lower. |
| (s) | From time to time the fund may receive proceeds from litigation settlements, without which performance would be lower. |
| (t) | Total returns do not include any applicable sales charges. |
| (x) | The net asset values and total returns have been calculated on net assets which include adjustments made in accordance with U.S. generally accepted accounting principles required at period end for financial reporting purposes. |
| Year ended | |||||
| Class A | 3/31/21 | 3/31/20 | 3/31/19 | 3/31/18 | 3/31/17 |
| Net asset value, beginning of period | $10.90 | $11.04 | $10.90 | $11.02 | $11.43 |
| Income (loss) from investment operations | |||||
| Net investment income (loss) (d) | $0.27 | $0.33 | $0.41 | $0.42 | $0.46(c) |
| Net realized and unrealized gain (loss) | 0.39 | (0.15) | 0.09 | (0.13) | (0.46) |
| Total from investment operations | $0.66 | $0.18 | $0.50 | $0.29 | $0.00(w) |
| Less distributions declared to shareholders | |||||
| From net investment income | $(0.26) | $(0.32) | $(0.36) | $(0.41) | $(0.41) |
| Net asset value, end of period (x) | $11.30 | $10.90 | $11.04 | $10.90 | $11.02 |
| Total return (%) (r)(s)(t)(x) | 6.16 | 1.61 | 4.74 | 2.60 | (0.04)(c) |
| Ratios (%) (to average net assets) and Supplemental data: | |||||
| Expenses before expense reductions (f) | 0.86 | 0.87 | 0.88 | 0.89 | 0.88(c) |
| Expenses after expense reductions (f) | 0.84 | 0.83 | 0.85 | 0.86 | 0.85(c) |
| Net investment income (loss) | 2.39 | 2.91 | 3.75 | 3.82 | 4.06(c) |
| Portfolio turnover | 26 | 29 | 13 | 19 | 15 |
| Net assets at end of period (000 omitted) | $216,177 | $226,471 | $207,565 | $202,967 | $207,001 |
| Year ended | |||||
| Class B | 3/31/21 | 3/31/20 | 3/31/19 | 3/31/18 | 3/31/17 |
| Net asset value, beginning of period | $10.92 | $11.06 | $10.92 | $11.04 | $11.45 |
| Income (loss) from investment operations | |||||
| Net investment income (loss) (d) | $0.19 | $0.25 | $0.32 | $0.34 | $0.37(c) |
| Net realized and unrealized gain (loss) | 0.39 | (0.15) | 0.10 | (0.14) | (0.46) |
| Total from investment operations | $0.58 | $0.10 | $0.42 | $0.20 | $(0.09) |
| Less distributions declared to shareholders | |||||
| From net investment income | $(0.18) | $(0.24) | $(0.28) | $(0.32) | $(0.32) |
| Net asset value, end of period (x) | $11.32 | $10.92 | $11.06 | $10.92 | $11.04 |
| Total return (%) (r)(s)(t)(x) | 5.36 | 0.84 | 3.94 | 1.81 | (0.80)(c) |
| Ratios (%) (to average net assets) and Supplemental data: | |||||
| Expenses before expense reductions (f) | 1.61 | 1.62 | 1.63 | 1.64 | 1.63(c) |
| Expenses after expense reductions (f) | 1.60 | 1.60 | 1.62 | 1.63 | 1.62(c) |
| Net investment income (loss) | 1.67 | 2.19 | 2.98 | 3.06 | 3.29(c) |
| Portfolio turnover | 26 | 29 | 13 | 19 | 15 |
| Net assets at end of period (000 omitted) | $470 | $1,081 | $1,664 | $1,858 | $2,509 |
| Year ended | |||||
| Class I | 3/31/21 | 3/31/20 | 3/31/19 | 3/31/18 | 3/31/17(i) |
| Net asset value, beginning of period | $9.54 | $9.66 | $9.54 | $9.65 | $10.00 |
| Income (loss) from investment operations | |||||
| Net investment income (loss) (d) | $0.25 | $0.30 | $0.38 | $0.39 | $0.42(c) |
| Net realized and unrealized gain (loss) | 0.36 | (0.12) | 0.08 | (0.12) | (0.39) |
| Total from investment operations | $0.61 | $0.18 | $0.46 | $0.27 | $0.03 |
| Less distributions declared to shareholders | |||||
| From net investment income | $(0.26) | $(0.30) | $(0.34) | $(0.38) | $(0.38) |
| Net asset value, end of period (x) | $9.89 | $9.54 | $9.66 | $9.54 | $9.65 |
| Total return (%) (r)(s)(t)(x) | 6.41 | 1.86 | 4.95 | 2.76 | 0.30(c) |
| Ratios (%) (to average net assets) and Supplemental data: | |||||
| Expenses before expense reductions (f) | 0.61 | 0.62 | 0.63 | 0.64 | 0.64(c) |
| Expenses after expense reductions (f) | 0.60 | 0.60 | 0.62 | 0.63 | 0.63(c) |
| Net investment income (loss) | 2.60 | 3.10 | 3.98 | 4.00 | 4.30(c) |
| Portfolio turnover | 26 | 29 | 13 | 19 | 15 |
| Net assets at end of period (000 omitted) | $168,647 | $124,875 | $68,669 | $49,523 | $23,470 |
| Year ended | ||||
| Class R6 | 3/31/21 | 3/31/20 | 3/31/19 | 3/31/18(i) |
| Net asset value, beginning of period | $9.55 | $9.67 | $9.54 | $9.77 |
| Income (loss) from investment operations | ||||
| Net investment income (loss) (d) | $0.26 | $0.31 | $0.38 | $0.24 |
| Net realized and unrealized gain (loss) | 0.35 | (0.12) | 0.10 | (0.21) |
| Total from investment operations | $0.61 | $0.19 | $0.48 | $0.03 |
| Less distributions declared to shareholders | ||||
| From net investment income | $(0.26) | $(0.31) | $(0.35) | $(0.26) |
| Net asset value, end of period (x) | $9.90 | $9.55 | $9.67 | $9.54 |
| Total return (%) (r)(s)(t)(x) | 6.48 | 1.93 | 5.13 | 0.26(n) |
| Ratios (%) (to average net assets) and Supplemental data: | ||||
| Expenses before expense reductions (f) | 0.54 | 0.55 | 0.56 | 0.58(a) |
| Expenses after expense reductions (f) | 0.53 | 0.53 | 0.55 | 0.57(a) |
| Net investment income (loss) | 2.67 | 3.15 | 4.05 | 3.85(a) |
| Portfolio turnover | 26 | 29 | 13 | 19 |
| Net assets at end of period (000 omitted) | $9,628 | $6,636 | $3,176 | $1,983 |
| (a) | Annualized. |
| (c) | Amount reflects a one-time reimbursement of expenses by the custodian (or former custodian) without which net investment income and performance would be lower and expenses would be higher. |
| (d) | Per share data is based on average shares outstanding. |
| (f) | Ratios do not reflect reductions from fees paid indirectly, if applicable. |
| (i) | For Class I and Class R6, the period is from the class inception, April 1, 2016 (Class I) and August 1, 2017 (Class R6), through the stated period end. |
| (n) | Not annualized. |
| (r) | Certain expenses have been reduced without which performance would have been lower. |
| (s) | From time to time the fund may receive proceeds from litigation settlements, without which performance would be lower. |
| (t) | Total returns do not include any applicable sales charges. |
| (w) | Per share amount was less than $0.01. |
| (x) | The net asset values and total returns have been calculated on net assets which include adjustments made in accordance with U.S. generally accepted accounting principles required at period end for financial reporting purposes. |
| Level 1 | Level 2 | Level 3 | Total | |
| Alabama Fund | ||||
| Financial Instruments | ||||
| Municipal Bonds | $— | $92,675,654 | $— | $92,675,654 |
| U.S. Corporate Bonds | — | 175,731 | — | 175,731 |
| Mutual Funds | 1,877,374 | — | — | 1,877,374 |
| Total | $1,877,374 | $92,851,385 | $— | $94,728,759 |
| Arkansas Fund | ||||
| Financial Instruments | ||||
| Municipal Bonds | $— | $169,527,491 | $— | $169,527,491 |
| U.S. Corporate Bonds | — | 356,363 | — | 356,363 |
| Mutual Funds | 1,447,457 | — | — | 1,447,457 |
| Total | $1,447,457 | $169,883,854 | $— | $171,331,311 |
| California Fund | ||||
| Financial Instruments | ||||
| Municipal Bonds | $— | $621,273,342 | $— | $621,273,342 |
| U.S. Corporate Bonds | — | 1,328,853 | — | 1,328,853 |
| Mutual Funds | 2,970,539 | — | — | 2,970,539 |
| Total | $2,970,539 | $622,602,195 | $— | $625,572,734 |
| Georgia Fund | ||||
| Financial Instruments | ||||
| Municipal Bonds | $— | $137,368,211 | $— | $137,368,211 |
| U.S. Corporate Bonds | — | 292,077 | — | 292,077 |
| Mutual Funds | 4,694,126 | — | — | 4,694,126 |
| Total | $4,694,126 | $137,660,288 | $— | $142,354,414 |
| Level 1 | Level 2 | Level 3 | Total | |
| Maryland Fund | ||||
| Financial Instruments | ||||
| Municipal Bonds | $— | $114,379,286 | $— | $114,379,286 |
| U.S. Corporate Bonds | — | 258,018 | — | 258,018 |
| Mutual Funds | 1,711,689 | — | — | 1,711,689 |
| Total | $1,711,689 | $114,637,304 | $— | $116,348,993 |
| Massachusetts Fund | ||||
| Financial Instruments | ||||
| Municipal Bonds | $— | $388,400,927 | $— | $388,400,927 |
| U.S. Corporate Bonds | — | 849,158 | — | 849,158 |
| Mutual Funds | 2,485,262 | — | — | 2,485,262 |
| Total | $2,485,262 | $389,250,085 | $— | $391,735,347 |
| Fund | Risk | Futures Contracts |
| Alabama Fund | Interest Rate | $(27,647) |
| California Fund | Interest Rate | (502,708) |
| Georgia Fund | Interest Rate | (20,068) |
| Maryland Fund | Interest Rate | (55,434) |
| Massachusetts Fund | Interest Rate | (200,728) |
| Fund | Risk | Futures Contracts |
| Alabama Fund | Interest Rate | $156,454 |
| California Fund | Interest Rate | 601,747 |
| Georgia Fund | Interest Rate | 168,489 |
| Maryland Fund | Interest Rate | 228,664 |
| Massachusetts Fund | Interest Rate | 481,397 |
| Year ended 3/31/21 | Alabama Fund | Arkansas Fund | California Fund | Georgia Fund | Maryland Fund | Massachusetts Fund |
| Ordinary income (including any short-term capital gains) | $31,321 | $39,472 | $398,949 | $70,772 | $27,758 | $226,239 |
| Tax-exempt income | 1,818,769 | 4,027,445 | 14,817,664 | 2,520,579 | 2,687,681 | 9,113,304 |
| Total distributions | $1,850,090 | $4,066,917 | $15,216,613 | $2,591,351 | $2,715,439 | $9,339,543 |
| Year ended 3/31/20 | Alabama Fund | Arkansas Fund | California Fund | Georgia Fund | Maryland Fund | Massachusetts Fund |
| Ordinary income (including any short-term capital gains) | $14,525 | $35,222 | $195,824 | $34,341 | $61,301 | $46,879 |
| Tax-exempt income | 1,967,338 | 4,305,866 | 14,755,921 | 2,674,387 | 2,870,703 | 9,935,215 |
| Total distributions | $1,981,863 | $4,341,088 | $14,951,745 | $2,708,728 | $2,932,004 | $9,982,094 |
| As of 3/31/21 | Alabama Fund | Arkansas Fund | California Fund | Georgia Fund | Maryland Fund | Massachusetts Fund |
| Cost of investments | $90,187,047 | $162,215,604 | $587,427,296 | $135,922,098 | $111,161,843 | $369,186,992 |
| Gross appreciation | 4,692,683 | 9,324,248 | 40,286,088 | 6,593,768 | 5,361,745 | 23,472,781 |
| Gross depreciation | (150,971) | (208,541) | (2,140,650) | (161,452) | (174,595) | (924,426) |
| Net unrealized appreciation (depreciation) | $4,541,712 | $9,115,707 | $38,145,438 | $6,432,316 | $5,187,150 | $22,548,355 |
| Undistributed ordinary income | 20,985 | 33,360 | 170,586 | 29,620 | 39,438 | 146,143 |
| Undistributed tax-exempt income | 322,065 | 739,324 | 2,333,703 | 414,014 | 639,653 | 1,409,657 |
| Capital loss carryforwards | (1,237,868) | (5,519,582) | (5,539,684) | (2,034,212) | (2,527,637) | (7,644,537) |
| Other temporary differences | (137,712) | (335,346) | (1,240,276) | (197,845) | (218,705) | (755,174) |
| Total distributable earnings (loss) | $3,509,182 | $4,033,463 | $33,869,767 | $4,643,893 | $3,119,899 | $15,704,444 |
| Alabama Fund | Arkansas Fund | California Fund | Georgia Fund | Maryland Fund | Massachusetts Fund | |
| Short-Term | $(952,670) | $(2,404,476) | $(5,222,088) | $(1,752,906) | $(1,694,827) | $(7,644,537) |
| Long-Term | (285,198) | (3,115,106) | (317,596) | (281,306) | (832,810) | — |
| Total | $(1,237,868) | $(5,519,582) | $(5,539,684) | $(2,034,212) | $(2,527,637) | $(7,644,537) |
| Alabama Fund | Arkansas Fund | California Fund | |||||||||
| Year Ended 3/31/21 | Year Ended 3/31/20 | Year Ended 3/31/21 | Year Ended 3/31/20 | Year Ended 3/31/21 | Year Ended 3/31/20 | ||||||
| Class A | $1,175,867 | $1,383,808 | $3,182,641 | $3,454,854 | $9,948,878 | $10,321,915 | |||||
| Class B | 1,456 | 3,904 | 16,800 | 43,361 | 15,381 | 29,998 | |||||
| Class C | — | — | — | — | 399,949 | 517,209 | |||||
| Class I | 606,811 | 545,211 | 799,726 | 808,049 | 3,890,859 | 3,470,554 | |||||
| Class R6 | 65,956 | 48,940 | 67,750 | 34,824 | 961,546 | 612,069 | |||||
| Total | $1,850,090 | $1,981,863 | $4,066,917 | $4,341,088 | $15,216,613 | $14,951,745 | |||||
| Georgia Fund | Maryland Fund | Massachusetts Fund | |||||||||
| Year Ended 3/31/21 | Year Ended 3/31/20 | Year Ended 3/31/21 | Year Ended 3/31/20 | Year Ended 3/31/21 | Year Ended 3/31/20 | ||||||
| Class A | $1,997,208 | $2,191,274 | $2,000,293 | $2,341,193 | $5,195,000 | $6,483,058 | |||||
| Class B | 1,718 | 6,083 | 14,724 | 26,983 | 12,486 | 31,262 | |||||
| Class I | 265,241 | 251,523 | 590,621 | 488,867 | 3,922,584 | 3,308,614 | |||||
| Class R6 | 327,184 | 259,848 | 109,801 | 74,961 | 209,473 | 159,160 | |||||
| Total | $2,591,351 | $2,708,728 | $2,715,439 | $2,932,004 | $9,339,543 | $9,982,094 | |||||
| Alabama Fund | Arkansas Fund | California Fund | Georgia Fund | Maryland Fund | Massachusetts Fund |
| $9,596 | $18,329 | $66,200 | $14,637 | $12,226 | $42,190 |
| Alabama Fund | Georgia Fund | Maryland Fund | Massachusetts Fund | |
| Class A | 0.90% | 0.90% | 0.83% | 0.85% |
| Class B | 1.65% | 1.65% | 1.58% | 1.60% |
| Class I | 0.65% | 0.65% | 0.58% | 0.60% |
| Class R6 | 0.59% | 0.60% | 0.53% | 0.53% |
| Alabama Fund | Arkansas Fund | California Fund | Georgia Fund | Maryland Fund | Massachusetts Fund |
| $5,063 | $20,570 | $10,603 | $6,841 | $6,142 | $8,890 |
| Class A | |||||
| Distribution Fee Rate (d) | Service Fee Rate (d) | Total Distribution Plan (d) | Annual Effective Rate (e) | Distribution and Service Fee | |
| Alabama Fund | — | 0.25% | 0.25% | 0.25% | $141,809 |
| Arkansas Fund | — | 0.25% | 0.25% | 0.10% | 322,765 |
| California Fund | — | 0.25% | 0.25% | 0.10% | 965,930 |
| Georgia Fund | — | 0.25% | 0.25% | 0.25% | 258,784 |
| Maryland Fund | — | 0.25% | 0.25% | 0.25% | 205,380 |
| Massachusetts Fund | — | 0.25% | 0.25% | 0.24% | 544,912 |
| Class B | |||||
| Distribution Fee Rate (d) | Service Fee Rate (d) | Total Distribution Plan (d) | Annual Effective Rate (e) | Distribution and Service Fee | |
| Alabama Fund | 0.75% | 0.25% | 1.00% | 1.00% | $1,009 |
| Arkansas Fund | 0.75% | 0.25% | 1.00% | 0.85% | 9,465 |
| California Fund | 0.75% | 0.25% | 1.00% | 0.85% | 8,282 |
| Georgia Fund | 0.75% | 0.25% | 1.00% | 0.98% | 1,345 |
| Maryland Fund | 0.75% | 0.25% | 1.00% | 1.00% | 8,642 |
| Massachusetts Fund | 0.75% | 0.25% | 1.00% | 1.00% | 7,505 |
| Class C | |||||
| Distribution Fee Rate (d) | Service Fee Rate (d) | Total Distribution Plan (d) | Annual Effective Rate (e) | Distribution and Service Fee | |
| California Fund | 0.75% | 0.25% | 1.00% | 1.00% | $237,017 |
| Alabama Fund | Arkansas Fund | California Fund | Georgia Fund | Maryland Fund | Massachusetts Fund | |
| Total Distribution and Service Fees | $142,818 | $332,230 | $1,211,229 | $260,129 | $214,022 | $552,417 |
| (d) | In accordance with the distribution plan for certain classes, each fund pays distribution and/or service fees equal to these annual percentage rates of each class’s average daily net assets. The distribution and service fee rates disclosed by class represent the current rates in effect at the end of the reporting period. Any rate changes, if applicable, are detailed below. |
| (e) | The annual effective rates represent actual fees incurred under the distribution plan for the year ended March 31, 2021 based on each class's average daily net assets. MFD has voluntarily agreed to rebate a portion of each class’s 0.25% service fee attributable to accounts for which there is no financial intermediary specified on the account except for accounts attributable to MFS or its affiliates’ seed money. For the year ended March 31, 2021, these rebates amounted to the following and are included in the reduction of total expenses in the Statements of Operations: |
| Alabama Fund | Arkansas Fund | California Fund | Georgia Fund | Maryland Fund | Massachusetts Fund | |
| Class A | $259 | $366 | $1,665 | $864 | $2,477 | $12,262 |
| Class B | — | — | — | 21 | — | 9 |
| CDSC Imposed | Alabama Fund | Arkansas Fund | California Fund | Georgia Fund | Maryland Fund | Massachusetts Fund |
| Class A | $642 | $16,815 | $46,565 | $7,205 | $4,676 | $54,225 |
| Class B | 489 | — | 1,863 | 199 | 419 | 899 |
| Class C | N/A | N/A | 6,445 | N/A | N/A | N/A |
| Alabama Fund | Arkansas Fund | California Fund | Georgia Fund | Maryland Fund | Massachusetts Fund | |
| Expenses paid | $3,240 | $4,835 | $21,533 | $4,417 | $11,356 | $22,527 |
| Percentage of average daily net assets | 0.0038% | 0.0029% | 0.0036% | 0.0034% | 0.0104% | 0.0060% |
| Alabama Fund | Arkansas Fund | California Fund | Georgia Fund | Maryland Fund | Massachusetts Fund |
| $61,838 | $118,425 | $425,772 | $56,586 | $71,740 | $282,580 |
| Alabama Fund | Arkansas Fund | California Fund | Georgia Fund | Maryland Fund | Massachusetts Fund | |
| Percentage of average daily net assets | 0.0257% | 0.0197% | 0.0148% | 0.0213% | 0.0230% | 0.0159% |
| California Fund | Maryland Fund | Massachusetts Fund |
| $364 | $232 | $234 |
| California Fund | Maryland Fund | Massachusetts Fund |
| $4,880 | $2,940 | $2,926 |
| Alabama Fund | Arkansas Fund | California Fund | Georgia Fund | Maryland Fund | Massachusetts Fund | |
| Purchases | $36,334,481 | $50,575,692 | $222,565,433 | $49,902,448 | $36,541,973 | $126,115,753 |
| Sales | $20,328,066 | $36,011,608 | $178,139,719 | $27,835,883 | $28,770,703 | $94,904,752 |
| Alabama Fund | Arkansas Fund | ||||||||||
| Year ended 3/31/21 | Year ended 3/31/20 | Year ended 3/31/21 | Year ended 3/31/20 | ||||||||
| Shares | Amount | Shares | Amount | Shares | Amount | Shares | Amount | ||||
| Shares sold | |||||||||||
| Class A | 1,386,777 | $14,436,917 | 934,632 | $9,666,873 | 2,202,300 | $21,992,710 | 1,833,663 | $18,196,899 | |||
| Class B | 56 | 590 | 82 | 847 | 1 | 5 | 2,719 | 27,391 | |||
| Class I | 1,034,729 | 10,258,753 | 1,747,498 | 17,227,312 | 1,128,787 | 11,192,820 | 885,818 | 8,733,330 | |||
| Class R6 | 200,628 | 1,992,286 | 110,728 | 1,092,431 | 257,515 | 2,554,782 | 81,884 | 807,905 | |||
| 2,622,190 | $26,688,546 | 2,792,940 | $27,987,463 | 3,588,603 | $35,740,317 | 2,804,084 | $27,765,525 | ||||
| Shares issued to shareholders in reinvestment of distributions | |||||||||||
| Class A | 99,752 | $1,035,281 | 118,172 | $1,223,757 | 298,767 | $2,977,251 | 321,051 | $3,189,040 | |||
| Class B | 76 | 783 | 297 | 3,069 | 1,686 | 16,745 | 4,363 | 43,361 | |||
| Class I | 40,408 | 400,558 | 33,840 | 334,414 | 75,042 | 742,490 | 74,226 | 732,002 | |||
| Class R6 | 6,657 | 65,956 | 4,954 | 48,926 | 6,829 | 67,750 | 3,530 | 34,824 | |||
| 146,893 | $1,502,578 | 157,263 | $1,610,166 | 382,324 | $3,804,236 | 403,170 | $3,999,227 | ||||
| Shares reacquired | |||||||||||
| Class A | (869,474) | $(9,008,758) | (869,315) | $(8,948,909) | (1,928,654) | $(19,235,698) | (1,874,713) | $(18,568,920) | |||
| Class B | (11,250) | (115,944) | (7,764) | (80,654) | (103,732) | (1,030,570) | (96,960) | (948,997) | |||
| Class I | (419,004) | (4,149,079) | (619,915) | (6,016,316) | (744,965) | (7,349,930) | (688,030) | (6,723,372) | |||
| Class R6 | (36,012) | (356,080) | (27,665) | (270,059) | (25,887) | (257,111) | (24,556) | (237,750) | |||
| (1,335,740) | $(13,629,861) | (1,524,659) | $(15,315,938) | (2,803,238) | $(27,873,309) | (2,684,259) | $(26,479,039) | ||||
| Net change | |||||||||||
| Class A | 617,055 | $6,463,440 | 183,489 | $1,941,721 | 572,413 | $5,734,263 | 280,001 | $2,817,019 | |||
| Class B | (11,118) | (114,571) | (7,385) | (76,738) | (102,045) | (1,013,820) | (89,878) | (878,245) | |||
| Class I | 656,133 | 6,510,232 | 1,161,423 | 11,545,410 | 458,864 | 4,585,380 | 272,014 | 2,741,960 | |||
| Class R6 | 171,273 | 1,702,162 | 88,017 | 871,298 | 238,457 | 2,365,421 | 60,858 | 604,979 | |||
| 1,433,343 | $14,561,263 | 1,425,544 | $14,281,691 | 1,167,689 | $11,671,244 | 522,995 | $5,285,713 | ||||
| California Fund | Georgia Fund | ||||||||||
| Year ended 3/31/21 | Year ended 3/31/20 | Year ended 3/31/21 | Year ended 3/31/20 | ||||||||
| Shares | Amount | Shares | Amount | Shares | Amount | Shares | Amount | ||||
| Shares sold | |||||||||||
| Class A | 9,263,597 | $56,858,716 | 21,682,795 | $133,751,600 | 2,153,288 | $23,431,274 | 3,588,416 | $39,152,664 | |||
| Class B | 6,109 | 36,322 | 5,239 | 31,939 | 1,720 | 19,028 | 2,105 | 22,865 | |||
| Class C | 331,823 | 2,043,410 | 1,790,349 | 11,063,365 | — | — | — | — | |||
| Class I | 5,015,906 | 50,096,437 | 7,523,674 | 75,138,059 | 893,306 | 8,869,763 | 446,342 | 4,423,409 | |||
| Class R6 | 2,046,990 | 20,388,849 | 1,996,232 | 20,070,657 | 946,198 | 9,391,379 | 573,041 | 5,692,331 | |||
| 16,664,425 | $129,423,734 | 32,998,289 | $240,055,620 | 3,994,512 | $41,711,444 | 4,609,904 | $49,291,269 | ||||
| Shares issued to shareholders in reinvestment of distributions | |||||||||||
| Class A | 1,454,022 | $8,939,165 | 1,470,511 | $9,095,146 | 172,056 | $1,879,358 | 186,038 | $2,036,227 | |||
| Class B | 2,385 | 14,609 | 4,793 | 29,616 | 106 | 1,158 | 379 | 4,157 | |||
| Class C | 56,823 | 349,870 | 71,952 | 446,218 | — | — | — | — | |||
| Class I | 288,947 | 2,893,639 | 242,123 | 2,438,153 | 18,536 | 183,875 | 18,480 | 183,409 | |||
| Class R6 | 95,889 | 960,117 | 60,792 | 611,771 | 32,960 | 327,184 | 26,165 | 259,848 | |||
| 1,898,066 | $13,157,400 | 1,850,171 | $12,620,904 | 223,658 | $2,391,575 | 231,062 | $2,483,641 | ||||
| Shares reacquired | |||||||||||
| Class A | (10,014,959) | $(61,231,526) | (10,000,799) | $(60,676,740) | (1,439,636) | $(15,729,981) | (1,429,577) | $(15,378,751) | |||
| Class B | (81,102) | (496,959) | (86,383) | (530,112) | (20,236) | (220,870) | (15,172) | (167,309) | |||
| Class C | (1,238,317) | (7,676,240) | (1,356,632) | (8,346,672) | — | — | — | — | |||
| Class I | (3,091,054) | (30,841,866) | (2,561,525) | (25,415,024) | (377,938) | (3,758,413) | (306,845) | (3,001,216) | |||
| Class R6 | (1,074,648) | (10,707,211) | (432,454) | (4,269,880) | (324,825) | (3,216,885) | (220,912) | (2,184,079) | |||
| (15,500,080) | $(110,953,802) | (14,437,793) | $(99,238,428) | (2,162,635) | $(22,926,149) | (1,972,506) | $(20,731,355) | ||||
| Net change | |||||||||||
| Class A | 702,660 | $4,566,355 | 13,152,507 | $82,170,006 | 885,708 | $9,580,651 | 2,344,877 | $25,810,140 | |||
| Class B | (72,608) | (446,028) | (76,351) | (468,557) | (18,410) | (200,684) | (12,688) | (140,287) | |||
| Class C | (849,671) | (5,282,960) | 505,669 | 3,162,911 | — | — | — | — | |||
| Class I | 2,213,799 | 22,148,210 | 5,204,272 | 52,161,188 | 533,904 | 5,295,225 | 157,977 | 1,605,602 | |||
| Class R6 | 1,068,231 | 10,641,755 | 1,624,570 | 16,412,548 | 654,333 | 6,501,678 | 378,294 | 3,768,100 | |||
| 3,062,411 | $31,627,332 | 20,410,667 | $153,438,096 | 2,055,535 | $21,176,870 | 2,868,460 | $31,043,555 | ||||
| Maryland Fund | Massachusetts Fund | ||||||||||
| Year ended 3/31/21 | Year ended 3/31/20 | Year ended 3/31/21 | Year ended 3/31/20 | ||||||||
| Shares | Amount | Shares | Amount | Shares | Amount | Shares | Amount | ||||
| Shares sold | |||||||||||
| Class A | 748,726 | $8,176,687 | 1,779,229 | $19,474,987 | 2,828,491 | $31,436,735 | 5,375,306 | $60,294,523 | |||
| Class B | — | — | 13,122 | 141,270 | 2 | 16 | 189 | 2,100 | |||
| Class I | 1,182,143 | 11,649,152 | 898,148 | 8,831,357 | 6,985,927 | 68,377,630 | 8,201,325 | 80,663,060 | |||
| Class R6 | 381,559 | 3,767,559 | 196,150 | 1,931,715 | 374,212 | 3,686,546 | 437,534 | 4,297,124 | |||
| 2,312,428 | $23,593,398 | 2,886,649 | $30,379,329 | 10,188,632 | $103,500,927 | 14,014,354 | $145,256,807 | ||||
| Shares issued to shareholders in reinvestment of distributions | |||||||||||
| Class A | 147,949 | $1,608,759 | 172,011 | $1,878,639 | 418,434 | $4,665,522 | 510,733 | $5,745,240 | |||
| Class B | 1,339 | 14,519 | 2,028 | 22,136 | 1,106 | 12,309 | 2,678 | 30,149 | |||
| Class I | 46,751 | 459,454 | 37,355 | 368,269 | 334,898 | 3,273,998 | 293,672 | 2,893,008 | |||
| Class R6 | 11,143 | 109,801 | 7,600 | 74,961 | 21,410 | 209,473 | 16,143 | 159,160 | |||
| 207,182 | $2,192,533 | 218,994 | $2,344,005 | 775,848 | $8,161,302 | 823,226 | $8,827,557 | ||||
| Maryland Fund − continued | Massachusetts Fund − continued | ||||||||||
| Year ended 3/31/21 | Year ended 3/31/20 | Year ended 3/31/21 | Year ended 3/31/20 | ||||||||
| Shares | Amount | Shares | Amount | Shares | Amount | Shares | Amount | ||||
| Shares reacquired | |||||||||||
| Class A | (1,297,078) | $(14,071,079) | (1,049,647) | $(11,285,559) | (4,890,636) | $(54,442,822) | (3,917,200) | $(42,998,175) | |||
| Class B | (39,879) | (434,264) | (30,330) | (333,959) | (58,521) | (652,728) | (54,366) | (609,183) | |||
| Class I | (486,840) | (4,781,146) | (261,793) | (2,546,598) | (3,356,896) | (32,679,010) | (2,515,254) | (24,191,702) | |||
| Class R6 | (70,852) | (697,371) | (43,223) | (410,379) | (117,876) | (1,156,562) | (87,124) | (833,237) | |||
| (1,894,649) | $(19,983,860) | (1,384,993) | $(14,576,495) | (8,423,929) | $(88,931,122) | (6,573,944) | $(68,632,297) | ||||
| Net change | |||||||||||
| Class A | (400,403) | $(4,285,633) | 901,593 | $10,068,067 | (1,643,711) | $(18,340,565) | 1,968,839 | $23,041,588 | |||
| Class B | (38,540) | (419,745) | (15,180) | (170,553) | (57,413) | (640,403) | (51,499) | (576,934) | |||
| Class I | 742,054 | 7,327,460 | 673,710 | 6,653,028 | 3,963,929 | 38,972,618 | 5,979,743 | 59,364,366 | |||
| Class R6 | 321,850 | 3,179,989 | 160,527 | 1,596,297 | 277,746 | 2,739,457 | 366,553 | 3,623,047 | |||
| 624,961 | $5,802,071 | 1,720,650 | $18,146,839 | 2,540,551 | $22,731,107 | 8,263,636 | $85,452,067 | ||||
| Alabama Fund | Arkansas Fund | California Fund | Georgia Fund | Maryland Fund | Massachusetts Fund | |
| Commitment Fee | $409 | $770 | $2,869 | $607 | $523 | $1,850 |
| Interest Expense | — | — | — | — | — | — |
| Affiliated Issuer - MFS Institutional Money Market Portfolio | ||||||
| Beginning Value | Purchases | Sales Proceeds | Realized Gain (Loss) | Change in Unrealized Appreciation or Depreciation | Ending Value | |
| Alabama Fund | $2,877,210 | $33,388,540 | $34,387,965 | $(454) | $43 | $1,877,374 |
| Arkansas Fund | 3,037,713 | 47,679,892 | 49,270,048 | (165) | 65 | 1,447,457 |
| California Fund | 3,337,616 | 170,340,368 | 170,705,631 | (1,254) | (560) | 2,970,539 |
| Georgia Fund | 1,835,929 | 53,727,811 | 50,869,059 | (738) | 183 | 4,694,126 |
| Maryland Fund | 1,796,671 | 37,963,808 | 38,048,466 | (472) | 148 | 1,711,689 |
| Massachusetts Fund | 9,124,769 | 119,919,070 | 126,557,395 | (951) | (231) | 2,485,262 |
| Dividend Income | Capital Gain Distributions | |
| Alabama Fund | $4,714 | $— |
| Arkansas Fund | 4,338 | — |
| California Fund | 14,714 | — |
| Georgia Fund | 5,810 | — |
| Maryland Fund | 3,503 | — |
| Massachusetts Fund | 14,761 | — |
May 14, 2021
| Name, Age | Position(s) Held with Fund | Trustee/Officer Since(h) | Number of MFS Funds overseen by the Trustee | Principal Occupations During the Past Five Years | Other Directorships During the Past Five Years (j) | |||||
| INTERESTED TRUSTEES | ||||||||||
| Robert J. Manning (k) (age 57) | Trustee | February 2004 | 135 | Massachusetts Financial Services Company, Non-Executive Chairman (since January 2021); Director; Chairman of the Board; Executive Chairman (January 2017-2020); Co-Chief Executive Officer (2015-2016) | N/A | |||||
| Michael W. Roberge (k) (age 54) | Trustee | January 2021 | 135 | Massachusetts Financial Services Company, Chairman (since January 2021); Chief Executive Officer (since January 2017); Director; President (until December 2018); Chief Investment Officer (until December 2018); Co-Chief Executive Officer (until December 2016) | N/A | |||||
| INDEPENDENT TRUSTEES | ||||||||||
| John P. Kavanaugh (age 66) | Trustee and Chair of Trustees | January 2009 | 135 | Private investor | N/A | |||||
| Steven E. Buller (age 69) | Trustee | February 2014 | 135 | Private investor | N/A | |||||
| John A. Caroselli (age 66) | Trustee | March 2017 | 135 | Private investor; JC Global Advisors, LLC (management consulting), President (since 2015) | N/A | |||||
| Maureen R. Goldfarb (age 66) | Trustee | January 2009 | 135 | Private investor | N/A | |||||
| Peter D. Jones (age 65) | Trustee | January 2019 | 135 | Private investor | N/A | |||||
| James W. Kilman, Jr. (age 59) | Trustee | January 2019 | 135 | Burford Capital Limited (finance and investment management), Chief Financial Officer (since 2019); KielStrand Capital LLC (family office), Chief Executive Officer (since 2016); Morgan Stanley & Co. (financial services), Vice Chairman of Investment Banking, Co-Head of Diversified Financials Coverage – Financial Institutions Investment Banking Group (until 2016) | Alpha-En Corporation, Director (2016-2019) | |||||
| Clarence Otis, Jr. (age 65) | Trustee | March 2017 | 135 | Private investor | VF Corporation, Director; Verizon Communications, Inc., Director; The Travelers Companies, Director | |||||
| Maryanne L. Roepke (age 65) | Trustee | May 2014 | 135 | Private investor | N/A | |||||
| Name, Age | Position(s) Held with Fund | Trustee/Officer Since(h) | Number of MFS Funds overseen by the Trustee | Principal Occupations During the Past Five Years | Other Directorships During the Past Five Years (j) | |||||
| Laurie J. Thomsen (age 63) | Trustee | March 2005 | 135 | Private investor | The Travelers Companies, Director; Dycom Industries, Inc., Director |
| Name, Age | Position(s) Held with Fund | Trustee/Officer Since(h) | Number of MFS Funds for which the Person is an Officer | Principal Occupations During the Past Five Years | ||||
| OFFICERS | ||||||||
| Christopher R. Bohane (k) (age 47) | Assistant Secretary and Assistant Clerk | July 2005 | 135 | Massachusetts Financial Services Company, Senior Vice President and Associate General Counsel | ||||
| Kino Clark (k) (age 52) | Assistant Treasurer | January 2012 | 135 | Massachusetts Financial Services Company, Vice President | ||||
| John W. Clark, Jr. (k) (age 54) | Assistant Treasurer | April 2017 | 135 | Massachusetts Financial Services Company, Vice President (since March 2017); Deutsche Bank (financial services), Department Head - Treasurer's Office (until February 2017) | ||||
| Thomas H. Connors (k) (age 61) | Assistant Secretary and Assistant Clerk | September 2012 | 135 | Massachusetts Financial Services Company, Vice President and Senior Counsel | ||||
| David L. DiLorenzo (k) (age 52) | President | July 2005 | 135 | Massachusetts Financial Services Company, Senior Vice President | ||||
| Heidi W. Hardin (k) (age 53) | Secretary and Clerk | April 2017 | 135 | Massachusetts Financial Services Company, Executive Vice President and General Counsel (since March 2017); Harris Associates (investment management), General Counsel (until January 2017) | ||||
| Brian E. Langenfeld (k) (age 48) | Assistant Secretary and Assistant Clerk | June 2006 | 135 | Massachusetts Financial Services Company, Vice President and Senior Counsel | ||||
| Amanda S. Mooradian (k) (age 42) | Assistant Secretary and Assistant Clerk | September 2018 | 135 | Massachusetts Financial Services Company, Assistant Vice President and Senior Counsel | ||||
| Susan A. Pereira (k) (age 50) | Assistant Secretary and Assistant Clerk | July 2005 | 135 | Massachusetts Financial Services Company, Vice President and Assistant General Counsel | ||||
| Kasey L. Phillips (k) (age 50) | Assistant Treasurer | September 2012 | 135 | Massachusetts Financial Services Company, Vice President | ||||
| Matthew A. Stowe (k) (age 46) | Assistant Secretary and Assistant Clerk | October 2014 | 135 | Massachusetts Financial Services Company, Vice President and Assistant General Counsel | ||||
| Martin J. Wolin (k) (age 53) | Chief Compliance Officer | July 2015 | 135 | Massachusetts Financial Services Company, Senior Vice President and Chief Compliance Officer | ||||
| James O. Yost (k) (age 60) | Treasurer | September 1990 | 135 | Massachusetts Financial Services Company, Senior Vice President |
| (h) | Date first appointed to serve as Trustee/Officer of an MFS Fund. Each Trustee has served continuously since appointment unless indicated otherwise. For the period from December 15, 2004 until February 22, 2005, Mr. Manning served as Advisory Trustee. From January 2012 through December 2016, Messrs. DiLorenzo and Yost served as Treasurer and Deputy Treasurer of the Funds, respectively. |
| (j) | Directorships or trusteeships of companies required to report to the Securities and Exchange Commission (i.e., “public companies”). |
| (k) | “Interested person” of the Trust within the meaning of the Investment Company Act of 1940 (referred to as the 1940 Act), which is the principal federal law governing investment companies like the fund, as a result of a position with MFS. The address of MFS is 111 Huntington Avenue, Boston, Massachusetts 02199-7618. |
| Investment Adviser | Custodian |
| Massachusetts Financial Services Company 111 Huntington Avenue Boston, MA 02199-7618 | JPMorgan Chase Bank, NA 4 Metrotech Center New York, NY 11245 |
| Distributor | Independent Registered Public Accounting Firm |
| MFS Fund Distributors, Inc. 111 Huntington Avenue Boston, MA 02199-7618 | Deloitte & Touche LLP 200 Berkeley Street Boston, MA 02116 |
| Portfolio Manager(s) | |
| Michael Dawson |
| Exempt Interest Dividends | |
| Alabama Fund | 98.31% |
| Arkansas Fund | 99.03% |
| California Fund | 97.38% |
| Georgia Fund | 97.27% |
| Maryland Fund | 98.98% |
| Massachusetts Fund | 97.58% |
| FACTS | WHAT DOES MFS DO WITH YOUR PERSONAL INFORMATION? |
| Why? | Financial companies choose how they share your personal information. Federal law gives consumers the right to limit some but not all sharing. Federal law also requires us to tell you how we collect, share, and protect your personal information. Please read this notice carefully to understand what we do. |
| What? | The types of personal information we collect and share depend on the product or service you have with us. This information can include: |
| • Social Security number and account balances | |
| • Account transactions and transaction history | |
| • Checking account information and wire transfer instructions | |
| When you are no longer our customer, we continue to share your information as described in this notice. |
| How? | All financial companies need to share customers' personal information to run their everyday business. In the section below, we list the reasons financial companies can share their customers' personal information; the reasons MFS chooses to share; and whether you can limit this sharing. |
| Reasons we can share your personal information | Does MFS share? | Can you limit this sharing? |
| For our everyday business purposes – such as to process your transactions, maintain your account(s), respond to court orders and legal investigations, or report to credit bureaus | Yes | No |
| For our marketing purposes – to offer our products and services to you | No | We don't share |
| For joint marketing with other financial companies | No | We don't share |
| For our affiliates' everyday business purposes – information about your transactions and experiences | No | We don't share |
| For our affiliates' everyday business purposes – information about your creditworthiness | No | We don't share |
| For nonaffiliates to market to you | No | We don't share |
| Questions? | Call 800-225-2606 or go to mfs.com. |

| Who we are | |
| Who is providing this notice? | MFS Funds, MFS Investment Management, MFS Institutional Advisors, Inc., and MFS Heritage Trust Company. |
| What we do | |
| How does MFS protect my personal information? | To protect your personal information from unauthorized access and use, we use security measures that comply with federal law. These measures include procedural, electronic, and physical safeguards for the protection of the personal information we collect about you. |
| How does MFS collect my personal information? | We collect your personal information, for example, when you |
| • open an account or provide account information | |
| • direct us to buy securities or direct us to sell your securities | |
| • make a wire transfer | |
| We also collect your personal information from others, such as credit bureaus, affiliates, or other companies. | |
| Why can't I limit all sharing? | Federal law gives you the right to limit only |
| • sharing for affiliates' everyday business purposes – information about your creditworthiness | |
| • affiliates from using your information to market to you | |
| • sharing for nonaffiliates to market to you | |
| State laws and individual companies may give you additional rights to limit sharing. | |
| Definitions | |
| Affiliates | Companies related by common ownership or control. They can be financial and nonfinancial companies. |
| • MFS does not share personal information with affiliates, except for everyday business purposes as described on page one of this notice. | |
| Nonaffiliates | Companies not related by common ownership or control. They can be financial and nonfinancial companies. |
| • MFS does not share with nonaffiliates so they can market to you. | |
| Joint marketing | A formal agreement between nonaffiliated financial companies that together market financial products or services to you. |
| • MFS doesn't jointly market. | |
| Other important information |
| If you own an MFS product or receive an MFS service in the name of a third party such as a bank or broker-dealer, their privacy policy may apply to you instead of ours. |


| 1 | |
| 2 | |
| 10 | |
| 12 | |
| 21 | |
| 25 | |
| 89 | |
| 93 | |
| 95 | |
| 97 | |
| 122 | |
| 138 | |
| 139 | |
| 142 | |
| 142 | |
| 142 | |
| 142 | |
| 142 | |
| 143 |
| back cover |


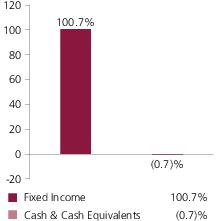
| General Obligations - General Purpose | 23.7% |
| General Obligations - Schools | 12.1% |
| Universities - Colleges | 11.9% |
| Water & Sewer Utility Revenue | 9.8% |
| State & Local Agencies | 9.0% |
| AAA | 4.3% |
| AA | 52.4% |
| A | 23.6% |
| BBB | 10.4% |
| BB | 1.8% |
| CC | 0.1% |
| C | 2.2% |
| D | 1.8% |
| Not Rated | 4.1% |
| Cash & Cash Equivalents | (0.7)% |
| Average Duration (d) | 6.3 |
| Average Effective Maturity (m) | 13.4 yrs. |
| Mississippi | 78.1% |
| Puerto Rico | 7.2% |
| Massachusetts | 2.6% |
| Illinois | 2.2% |
| Guam | 1.4% |
| Tennessee | 1.3% |
| South Carolina | 1.0% |
| Maryland | 0.9% |
| Alabama | 0.8% |
| California | 0.7% |
| New Jersey | 0.7% |
| New York | 0.6% |
| Virginia | 0.5% |
| Iowa | 0.5% |
| Pennsylvania | 0.5% |
| Michigan | 0.5% |
| Texas | 0.4% |
| Connecticut | 0.4% |
| Ohio | 0.3% |
| Wisconsin | 0.1% |
| Colorado (o) | 0.0% |
| Florida (o) | 0.0% |
| (a) | For all securities other than those specifically described below, ratings are assigned to underlying securities utilizing ratings from Moody’s, Fitch, and Standard & Poor’s rating agencies and applying the following hierarchy: If all three agencies provide a rating, the middle rating (after dropping the highest and lowest ratings) is assigned; if two of the three agencies rate a security, the lower of the two is assigned. If none of the 3 rating agencies above assign a rating, but the security is rated by DBRS Morningstar, then the DBRS Morningstar rating is assigned. Ratings are shown in the S&P and Fitch scale (e.g., AAA). Securities rated BBB or higher are considered investment grade. All ratings are subject to change. Not Rated includes fixed income securities and fixed income derivatives that have not been rated by any rating agency. The fund may or may not have held all of these instruments on this date. The fund is not rated by these agencies. |
| (d) | Duration is a measure of how much a bond’s price is likely to fluctuate with general changes in interest rates, e.g., if rates rise 1.00%, a bond with a 5-year duration is likely to lose about 5.00% of its value due to the interest rate move. |
| (i) | For purposes of this presentation, the components include the value of securities, and reflect the impact of the equivalent exposure of derivative positions, if any. These amounts may be negative from time to time. Equivalent exposure is a calculated amount that translates the derivative position into a reasonable approximation of the amount of the underlying asset that the portfolio would have to hold at a given point in time to have the same price sensitivity that results from the portfolio’s ownership of the derivative contract. When dealing with derivatives, equivalent exposure is a more representative measure of the potential impact of a position on portfolio performance than value. The bond component will include any accrued interest amounts. |
| (m) | In determining each instrument’s effective maturity for purposes of calculating the fund’s dollar-weighted average effective maturity, MFS uses the instrument’s stated maturity or, if applicable, an earlier date on which MFS believes it is probable that a maturity-shortening device (such as a put, pre-refunding or prepayment) will cause the instrument to be repaid. Such an earlier date can be substantially shorter than the instrument’s stated maturity. |
| (o) | Less than 0.1%. |
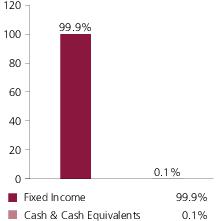
| General Obligations - General Purpose | 12.7% |
| Universities - Colleges | 12.0% |
| Healthcare Revenue - Hospitals | 8.2% |
| Tax - Other | 8.2% |
| Water & Sewer Utility Revenue | 6.6% |
| AAA | 8.2% |
| AA | 30.7% |
| A | 27.2% |
| BBB | 17.6% |
| BB | 3.2% |
| B | 1.8% |
| CC | 0.1% |
| C | 2.0% |
| D | 2.1% |
| Not Rated | 7.0% |
| Cash & Cash Equivalents | 0.1% |
| Average Duration (d) | 7.0 |
| Average Effective Maturity (m) | 17.1 yrs. |
| New York | 82.2% |
| Puerto Rico | 7.2% |
| Illinois | 2.2% |
| Guam | 1.3% |
| Tennessee | 1.0% |
| New Jersey | 0.8% |
| Texas | 0.7% |
| Michigan | 0.6% |
| Florida | 0.6% |
| Colorado | 0.6% |
| Ohio | 0.6% |
| Pennsylvania | 0.5% |
| Maryland | 0.4% |
| Alabama | 0.4% |
| Wisconsin | 0.3% |
| Louisiana | 0.2% |
| Virginia | 0.1% |
| Indiana | 0.1% |
| Mississippi | 0.1% |
| (a) | For all securities other than those specifically described below, ratings are assigned to underlying securities utilizing ratings from Moody’s, Fitch, and Standard & Poor’s rating agencies and applying the following hierarchy: If all three agencies provide a rating, the middle rating (after dropping the highest and lowest ratings) is assigned; if two of the three agencies rate a security, the lower of the two is assigned. If none of the 3 rating agencies above assign a rating, but the security is rated by DBRS Morningstar, then the DBRS Morningstar rating is assigned. Ratings are shown in the S&P and Fitch scale (e.g., AAA). Securities rated BBB or higher are considered investment grade. All ratings are subject to change. Not Rated includes fixed income securities and fixed income derivatives that have not been rated by any rating agency. The fund may or may not have held all of these instruments on this date. The fund is not rated by these agencies. |
| (d) | Duration is a measure of how much a bond’s price is likely to fluctuate with general changes in interest rates, e.g., if rates rise 1.00%, a bond with a 5-year duration is likely to lose about 5.00% of its value due to the interest rate move. |
| (i) | For purposes of this presentation, the components include the value of securities, and reflect the impact of the equivalent exposure of derivative positions, if any. These amounts may be negative from time to time. Equivalent exposure is a calculated amount that translates the derivative position into a reasonable approximation of the amount of the underlying asset that the portfolio would have to hold at a given point in time to have the same price sensitivity that results from the portfolio’s ownership of the derivative contract. When dealing with derivatives, equivalent exposure is a more representative measure of the potential impact of a position on portfolio performance than value. The bond component will include any accrued interest amounts. |
| (m) | In determining each instrument’s effective maturity for purposes of calculating the fund’s dollar-weighted average effective maturity, MFS uses the instrument’s stated maturity or, if applicable, an earlier date on which MFS believes it is probable that a maturity-shortening device (such as a put, pre-refunding or prepayment) will cause the instrument to be repaid. Such an earlier date can be substantially shorter than the instrument’s stated maturity. |

| State & Local Agencies | 20.0% |
| Universities - Colleges | 18.7% |
| Healthcare Revenue - Hospitals | 10.8% |
| Water & Sewer Utility Revenue | 10.2% |
| Toll Roads | 7.8% |
| AAA | 9.6% |
| AA | 46.0% |
| A | 21.5% |
| BBB | 10.5% |
| BB | 1.5% |
| CC | 0.1% |
| C | 1.7% |
| D | 1.8% |
| Not Rated | 9.2% |
| Cash & Cash Equivalents | (1.9)% |
| Average Duration (d) | 6.6 |
| Average Effective Maturity (m) | 14.1 yrs. |
| North Carolina | 82.1% |
| Puerto Rico | 5.5% |
| Illinois | 2.7% |
| Pennsylvania | 1.6% |
| California | 1.4% |
| Guam | 1.3% |
| Maryland | 1.2% |
| New York | 1.2% |
| Virginia | 1.0% |
| Texas | 0.6% |
| New Jersey | 0.6% |
| Ohio | 0.5% |
| South Carolina | 0.3% |
| Tennessee | 0.3% |
| Alabama | 0.3% |
| Connecticut | 0.3% |
| Michigan | 0.2% |
| Wisconsin | 0.2% |
| Louisiana | 0.2% |
| Florida | 0.1% |
| Washington DC | 0.1% |
| Indiana | 0.1% |
| Colorado | 0.1% |
| (a) | For all securities other than those specifically described below, ratings are assigned to underlying securities utilizing ratings from Moody’s, Fitch, and Standard & Poor’s rating agencies and applying the following hierarchy: If all three agencies provide a rating, the middle rating (after dropping the highest and lowest ratings) is assigned; if two of the three agencies rate a security, the lower of the two is assigned. If none of the 3 rating agencies above assign a rating, but the security is rated by DBRS Morningstar, then the DBRS Morningstar rating is assigned. Ratings are shown in the S&P and Fitch scale (e.g., AAA). Securities rated BBB or higher are considered investment grade. All ratings are subject to change. Not Rated includes fixed income securities and fixed income derivatives that have not been rated by any rating agency. The fund may or may not have held all of these instruments on this date. The fund is not rated by these agencies. |
| (d) | Duration is a measure of how much a bond’s price is likely to fluctuate with general changes in interest rates, e.g., if rates rise 1.00%, a bond with a 5-year duration is likely to lose about 5.00% of its value due to the interest rate move. |
| (i) | For purposes of this presentation, the components include the value of securities, and reflect the impact of the equivalent exposure of derivative positions, if any. These amounts may be negative from time to time. Equivalent exposure is a calculated amount that translates the derivative position into a reasonable approximation of the amount of the underlying asset that the portfolio would have to hold at a given point in time to have the same price sensitivity that results from the portfolio’s ownership of the derivative contract. When dealing with derivatives, equivalent exposure is a more representative measure of the potential impact of a position on portfolio performance than value. The bond component will include any accrued interest amounts. |
| (m) | In determining each instrument’s effective maturity for purposes of calculating the fund’s dollar-weighted average effective maturity, MFS uses the instrument’s stated maturity or, if applicable, an earlier date on which MFS believes it is probable that a maturity-shortening device (such as a put, pre-refunding or prepayment) will cause the instrument to be repaid. Such an earlier date can be substantially shorter than the instrument’s stated maturity. |

| Healthcare Revenue - Hospitals | 17.1% |
| Water & Sewer Utility Revenue | 12.2% |
| General Obligations - Schools | 11.1% |
| General Obligations - General Purpose | 8.8% |
| Universities - Colleges | 8.4% |
| AAA | 1.5% |
| AA | 28.2% |
| A | 43.0% |
| BBB | 11.3% |
| BB | 5.4% |
| B | 1.1% |
| CC | 0.1% |
| C | 1.7% |
| D | 1.6% |
| Not Rated | 5.0% |
| Cash & Cash Equivalents | 1.1% |
| Average Duration (d) | 6.7 |
| Average Effective Maturity (m) | 15.4 yrs. |
| Pennsylvania | 83.7% |
| Puerto Rico | 5.4% |
| Illinois | 2.2% |
| California | 1.4% |
| Maryland | 0.9% |
| New Jersey | 0.8% |
| Michigan | 0.6% |
| Colorado | 0.6% |
| Tennessee | 0.6% |
| Guam | 0.5% |
| New York | 0.5% |
| Texas | 0.4% |
| Alabama | 0.3% |
| Ohio | 0.3% |
| Wisconsin | 0.2% |
| Virginia | 0.2% |
| Louisiana | 0.2% |
| Indiana | 0.1% |
| Florida (o) | 0.0% |
| (a) | For all securities other than those specifically described below, ratings are assigned to underlying securities utilizing ratings from Moody’s, Fitch, and Standard & Poor’s rating agencies and applying the following hierarchy: If all three agencies provide a rating, the middle rating (after dropping the highest and lowest ratings) is assigned; if two of the three agencies rate a security, the lower of the two is assigned. If none of the 3 rating agencies above assign a rating, but the security is rated by DBRS Morningstar, then the DBRS Morningstar rating is assigned. Ratings are shown in the S&P and Fitch scale (e.g., AAA). Securities rated BBB or higher are considered investment grade. All ratings are subject to change. Not Rated includes fixed income securities and fixed income derivatives that have not been rated by any rating agency. The fund may or may not have held all of these instruments on this date. The fund is not rated by these agencies. |
| (d) | Duration is a measure of how much a bond’s price is likely to fluctuate with general changes in interest rates, e.g., if rates rise 1.00%, a bond with a 5-year duration is likely to lose about 5.00% of its value due to the interest rate move. |
| (i) | For purposes of this presentation, the components include the value of securities, and reflect the impact of the equivalent exposure of derivative positions, if any. These amounts may be negative from time to time. Equivalent exposure is a calculated amount that translates the derivative position into a reasonable approximation of the amount of the underlying asset that the portfolio would have to hold at a given point in time to have the same price sensitivity that results from the portfolio’s ownership of the derivative contract. When dealing with derivatives, equivalent exposure is a more representative measure of the potential impact of a position on portfolio performance than value. The bond component will include any accrued interest amounts. |
| (m) | In determining each instrument’s effective maturity for purposes of calculating the fund’s dollar-weighted average effective maturity, MFS uses the instrument’s stated maturity or, if applicable, an earlier date on which MFS believes it is probable that a maturity-shortening device (such as a put, pre-refunding or prepayment) will cause the instrument to be repaid. Such an earlier date can be substantially shorter than the instrument’s stated maturity. |
| (o) | Less than 0.1%. |

| General Obligations - Schools | 14.5% |
| State & Local Agencies | 12.8% |
| Healthcare Revenue - Hospitals | 12.6% |
| Water & Sewer Utility Revenue | 10.4% |
| Transportation - Special Tax | 7.9% |
| AAA | 5.1% |
| AA | 32.8% |
| A | 38.6% |
| BBB | 6.5% |
| BB | 1.6% |
| CC (o) | 0.0% |
| C | 2.3% |
| D | 1.5% |
| Not Rated | 9.9% |
| Cash & Cash Equivalents | 1.7% |
| Average Duration (d) | 6.1 |
| Average Effective Maturity (m) | 13.8 yrs. |
| South Carolina | 78.1% |
| Puerto Rico | 6.9% |
| Illinois | 2.6% |
| Pennsylvania | 1.5% |
| Tennessee | 1.3% |
| New York | 1.2% |
| New Jersey | 1.2% |
| Maryland | 0.7% |
| Texas | 0.7% |
| Guam | 0.7% |
| Alabama | 0.7% |
| California | 0.5% |
| Virginia | 0.4% |
| Ohio | 0.3% |
| Nebraska | 0.3% |
| Connecticut | 0.3% |
| Wisconsin | 0.3% |
| Michigan | 0.2% |
| Louisiana | 0.1% |
| Colorado | 0.1% |
| Washington DC | 0.1% |
| Florida | 0.1% |
| Indiana (o) | 0.0% |
| (a) | For all securities other than those specifically described below, ratings are assigned to underlying securities utilizing ratings from Moody’s, Fitch, and Standard & Poor’s rating agencies and applying the following hierarchy: If all three agencies provide a rating, the middle rating (after dropping the highest and lowest ratings) is assigned; if two of the three agencies rate a security, the lower of the two is assigned. If none of the 3 rating agencies above assign a rating, but the security is rated by DBRS Morningstar, then the DBRS Morningstar rating is assigned. Ratings are shown in the S&P and Fitch scale (e.g., AAA). Securities rated BBB or higher are considered investment grade. All ratings are subject to change. Not Rated includes fixed income securities and fixed income derivatives that have not been rated by any rating agency. The fund may or may not have held all of these instruments on this date. The fund is not rated by these agencies. |
| (d) | Duration is a measure of how much a bond’s price is likely to fluctuate with general changes in interest rates, e.g., if rates rise 1.00%, a bond with a 5-year duration is likely to lose about 5.00% of its value due to the interest rate move. |
| (i) | For purposes of this presentation, the components include the value of securities, and reflect the impact of the equivalent exposure of derivative positions, if any. These amounts may be negative from time to time. Equivalent exposure is a calculated amount that translates the derivative position into a reasonable approximation of the amount of the underlying asset that the portfolio would have to hold at a given point in time to have the same price sensitivity that results from the portfolio’s ownership of the derivative contract. When dealing with derivatives, equivalent exposure is a more representative measure of the potential impact of a position on portfolio performance than value. The bond component will include any accrued interest amounts. |
| (m) | In determining each instrument’s effective maturity for purposes of calculating the fund’s dollar-weighted average effective maturity, MFS uses the instrument’s stated maturity or, if applicable, an earlier date on which MFS believes it is probable that a maturity-shortening device (such as a put, pre-refunding or prepayment) will cause the instrument to be repaid. Such an earlier date can be substantially shorter than the instrument’s stated maturity. |
| (o) | Less than 0.1%. |
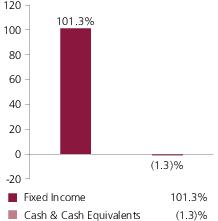
| Healthcare Revenue - Hospitals | 16.5% |
| General Obligations - General Purpose | 14.4% |
| Water & Sewer Utility Revenue | 11.6% |
| Airport Revenue | 8.4% |
| Universities - Colleges | 8.0% |
| AAA | 4.3% |
| AA | 36.0% |
| A | 31.2% |
| BBB | 19.0% |
| BB | 1.6% |
| CC | 0.2% |
| C | 2.6% |
| D | 1.9% |
| Not Rated | 4.5% |
| Cash & Cash Equivalents | (1.3)% |
| Average Duration (d) | 6.6 |
| Average Effective Maturity (m) | 14.7 yrs. |
| Tennessee | 79.4% |
| Puerto Rico | 6.8% |
| Guam | 2.3% |
| Illinois | 2.3% |
| New York | 1.6% |
| Pennsylvania | 1.6% |
| Maryland | 1.5% |
| New Jersey | 1.0% |
| Alabama | 1.0% |
| South Carolina | 0.8% |
| Virginia | 0.6% |
| Iowa | 0.6% |
| Connecticut | 0.4% |
| U.S. Virgin Islands | 0.3% |
| Washington DC | 0.3% |
| Florida | 0.2% |
| Michigan | 0.2% |
| Texas | 0.1% |
| Wisconsin | 0.1% |
| Ohio | 0.1% |
| Mississippi | 0.1% |
| (a) | For all securities other than those specifically described below, ratings are assigned to underlying securities utilizing ratings from Moody’s, Fitch, and Standard & Poor’s rating agencies and applying the following hierarchy: If all three agencies provide a rating, the middle rating (after dropping the highest and lowest ratings) is assigned; if two of the three agencies rate a security, the lower of the two is assigned. If none of the 3 rating agencies above assign a rating, but the security is rated by DBRS Morningstar, then the DBRS Morningstar rating is assigned. Ratings are shown in the S&P and Fitch scale (e.g., AAA). Securities rated BBB or higher are considered investment grade. All ratings are subject to change. Not Rated includes fixed income securities and fixed income derivatives that have not been rated by any rating agency. The fund may or may not have held all of these instruments on this date. The fund is not rated by these agencies. |
| (d) | Duration is a measure of how much a bond’s price is likely to fluctuate with general changes in interest rates, e.g., if rates rise 1.00%, a bond with a 5-year duration is likely to lose about 5.00% of its value due to the interest rate move. |
| (i) | For purposes of this presentation, the components include the value of securities, and reflect the impact of the equivalent exposure of derivative positions, if any. These amounts may be negative from time to time. Equivalent exposure is a calculated amount that translates the derivative position into a reasonable approximation of the amount of the underlying asset that the portfolio would have to hold at a given point in time to have the same price sensitivity that results from the portfolio’s ownership of the derivative contract. When dealing with derivatives, equivalent exposure is a more representative measure of the potential impact of a position on portfolio performance than value. The bond component will include any accrued interest amounts. |
| (m) | In determining each instrument’s effective maturity for purposes of calculating the fund’s dollar-weighted average effective maturity, MFS uses the instrument’s stated maturity or, if applicable, an earlier date on which MFS believes it is probable that a maturity-shortening device (such as a put, pre-refunding or prepayment) will cause the instrument to be repaid. Such an earlier date can be substantially shorter than the instrument’s stated maturity. |
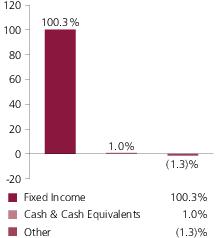
| Healthcare Revenue - Hospitals | 15.8% |
| State & Local Agencies | 13.7% |
| Universities - Colleges | 11.1% |
| Water & Sewer Utility Revenue | 10.2% |
| General Obligations - General Purpose | 9.8% |
| AAA | 14.7% |
| AA | 45.9% |
| A | 14.2% |
| BBB | 10.6% |
| BB | 1.7% |
| B | 0.3% |
| CC | 0.3% |
| C | 2.1% |
| D | 1.7% |
| Not Rated | 8.8% |
| Cash & Cash Equivalents | 1.0% |
| Other | (1.3)% |
| Average Duration (d) | 6.3 |
| Average Effective Maturity (m) | 13.8 yrs. |
| Virginia | 76.1% |
| Puerto Rico | 7.7% |
| Washington DC | 5.9% |
| Illinois | 1.8% |
| Tennessee | 1.5% |
| North Carolina | 1.0% |
| Pennsylvania | 1.0% |
| Maryland | 0.8% |
| Guam | 0.7% |
| New York | 0.6% |
| Texas | 0.5% |
| Colorado | 0.5% |
| New Jersey | 0.4% |
| California | 0.4% |
| Alabama | 0.3% |
| Wisconsin | 0.3% |
| Ohio | 0.3% |
| Louisiana | 0.2% |
| Iowa | 0.1% |
| Michigan | 0.1% |
| Indiana | 0.1% |
| (a) | For all securities other than those specifically described below, ratings are assigned to underlying securities utilizing ratings from Moody’s, Fitch, and Standard & Poor’s rating agencies and applying the following hierarchy: If all three agencies provide a rating, the middle rating (after dropping the highest and lowest ratings) is assigned; if two of the three agencies rate a security, the lower of the two is assigned. If none of the 3 rating agencies above assign a rating, but the security is rated by DBRS Morningstar, then the DBRS Morningstar rating is assigned. Ratings are shown in the S&P and Fitch scale (e.g., AAA). Securities rated BBB or higher are considered investment grade. All ratings are subject to change. Not Rated includes fixed income securities and fixed income derivatives that have not been rated by any rating agency. The fund may or may not have held all of these instruments on this date. The fund is not rated by these agencies. |
| (d) | Duration is a measure of how much a bond’s price is likely to fluctuate with general changes in interest rates, e.g., if rates rise 1.00%, a bond with a 5-year duration is likely to lose about 5.00% of its value due to the interest rate move. |
| (i) | For purposes of this presentation, the components include the value of securities, and reflect the impact of the equivalent exposure of derivative positions, if any. These amounts may be negative from time to time. Equivalent exposure is a calculated amount that translates the derivative position into a reasonable approximation of the amount of the underlying asset that the portfolio would have to hold at a given point in time to have the same price sensitivity that results from the portfolio’s ownership of the derivative contract. When dealing with derivatives, equivalent exposure is a more representative measure of the potential impact of a position on portfolio performance than value. The bond component will include any accrued interest amounts. |
| (m) | In determining each instrument’s effective maturity for purposes of calculating the fund’s dollar-weighted average effective maturity, MFS uses the instrument’s stated maturity or, if applicable, an earlier date on which MFS believes it is probable that a maturity-shortening device (such as a put, pre-refunding or prepayment) will cause the instrument to be repaid. Such an earlier date can be substantially shorter than the instrument’s stated maturity. |
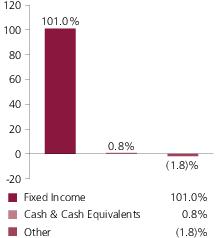
| Healthcare Revenue - Hospitals | 15.6% |
| Universities - Colleges | 14.3% |
| Water & Sewer Utility Revenue | 13.6% |
| General Obligations - General Purpose | 8.5% |
| State & Local Agencies | 7.6% |
| AAA | 2.7% |
| AA | 28.7% |
| A | 40.9% |
| BBB | 10.2% |
| BB | 1.6% |
| CC | 1.1% |
| C | 3.2% |
| D | 1.9% |
| Not Rated | 10.7% |
| Cash & Cash Equivalents | 0.8% |
| Other | (1.8)% |
| Average Duration (d) | 6.0 |
| Average Effective Maturity (m) | 14.6 yrs. |
| West Virginia | 71.4% |
| Puerto Rico | 9.4% |
| New Jersey | 2.9% |
| New York | 1.9% |
| Guam | 1.9% |
| U.S. Treasury Securities (j) | 1.8% |
| Illinois | 1.6% |
| California | 1.2% |
| U.S. Virgin Islands | 0.9% |
| Ohio | 0.9% |
| Alabama | 0.9% |
| Maryland | 0.9% |
| Tennessee | 0.8% |
| South Carolina | 0.8% |
| North Carolina | 0.7% |
| Virginia | 0.7% |
| Texas | 0.7% |
| Massachusetts | 0.6% |
| Michigan | 0.4% |
| Wisconsin | 0.2% |
| Pennsylvania | 0.2% |
| Indiana | 0.1% |
| Mississippi | 0.1% |
| (a) | For all securities other than those specifically described below, ratings are assigned to underlying securities utilizing ratings from Moody’s, Fitch, and Standard & Poor’s rating agencies and applying the following hierarchy: If all three agencies provide a rating, the middle rating (after dropping the highest and lowest ratings) is assigned; if two of the three agencies rate a security, the lower of the two is assigned. If none of the 3 rating agencies above assign a rating, but the security is rated by DBRS Morningstar, then the DBRS Morningstar rating is assigned. Ratings are shown in the S&P and Fitch scale (e.g., AAA). Securities rated BBB or higher are considered investment grade. All ratings are subject to change. Not Rated includes fixed income securities and fixed income derivatives that have not been rated by any rating agency. The fund may or may not have held all of these instruments on this date. The fund is not rated by these agencies. |
| (d) | Duration is a measure of how much a bond’s price is likely to fluctuate with general changes in interest rates, e.g., if rates rise 1.00%, a bond with a 5-year duration is likely to lose about 5.00% of its value due to the interest rate move. |
| (i) | For purposes of this presentation, the components include the value of securities, and reflect the impact of the equivalent exposure of derivative positions, if any. These amounts may be negative from time to time. Equivalent exposure is a calculated amount that translates the derivative position into a reasonable approximation of the amount of the underlying asset that the portfolio would have to hold at a given point in time to have the same price sensitivity that results from the portfolio’s ownership of the derivative contract. When dealing with derivatives, equivalent exposure is a more representative measure of the potential impact of a position on portfolio performance than value. The bond component will include any accrued interest amounts. |
| (j) | For the purpose of managing the fund’s duration, the fund holds treasury futures with a bond equivalent exposure of 1.8%, which reduce the fund’s interest rate exposure but not its credit exposure. |
| (m) | In determining each instrument’s effective maturity for purposes of calculating the fund’s dollar-weighted average effective maturity, MFS uses the instrument’s stated maturity or, if applicable, an earlier date on which MFS believes it is probable that a maturity-shortening device (such as a put, pre-refunding or prepayment) will cause the instrument to be repaid. Such an earlier date can be substantially shorter than the instrument’s stated maturity. |
| (d) | Duration is a measure of how much a bond’s price is likely to fluctuate with general changes in interest rates, e.g., if rates rise 1.00%, a bond with a 5-year duration is likely to lose about 5.00% of its value due to the interest rate move. |
| (r) | Bonds rated “BBB”, “Baa”, or higher are considered investment grade; bonds rated “BB”, “Ba”, or below are considered non-investment grade. The source for bond quality ratings is Moody's Investors Service, Standard & Poor's, and Fitch, Inc. and are applied using the following hierarchy: If all three agencies provide a rating, the middle rating (after dropping the highest and lowest ratings) is assigned; if two of the three agencies rate a security, the lower of the two is assigned. If none of the 3 Rating Agencies above assign a rating, but the security is rated by DBRS Morningstar, then the DBRS Morningstar rating is assigned. Ratings are shown in the S&P and Fitch scale (e.g., AAA). For securities that are not rated by any of the rating agencies, the security is considered Not Rated. |
| (y) | A yield curve graphically depicts the yields of different maturity bonds of the same credit quality and type; a normal yield curve is upward sloping, with short-term rates lower than long-term rates. |

| Share Class | Class Inception Date | 1-yr | 5-yr | 10-yr | Life (t) |
| A | 8/06/92 | 5.20% | 2.79% | 4.00% | N/A |
| B | 9/07/93 | 4.63% | 2.14% | 3.31% | N/A |
| I | 4/01/16 | 5.41% | 2.90% | N/A | 2.90% |
| R6 | 8/01/17 | 5.48% | N/A | N/A | 3.44% |
| Bloomberg Barclays Municipal Bond Index (f) | 5.51% | 3.49% | 4.54% | N/A |
| A With Initial Sales Charge (4.25%) | 0.73% | 1.90% | 3.55% | N/A |
| B With CDSC (Declining over six years from 4% to 0%) (v) | 0.63% | 1.77% | 3.31% | N/A |
| (f) | Source: FactSet Research Systems Inc. |
| (t) | For the period from the class inception date through the stated period end (for those share classes with less than 10 years of performance history). No comparative benchmark performance information is provided for “life” periods. (See Notes to Performance Summary.) |
| (v) | Assuming redemption at the end of the applicable period. |
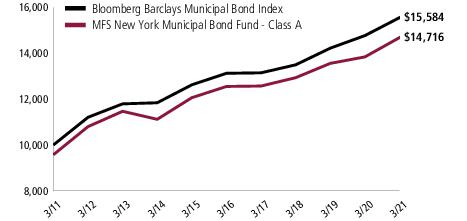
| Share Class | Class Inception Date | 1-yr | 5-yr | 10-yr | Life (t) |
| A | 6/06/88 | 6.32% | 3.23% | 4.39% | N/A |
| B | 9/07/93 | 5.63% | 2.48% | 3.63% | N/A |
| C | 12/11/00 | 5.63% | 2.46% | 3.61% | N/A |
| I | 4/01/16 | 6.65% | 3.50% | N/A | 3.50% |
| R6 | 8/01/17 | 6.72% | N/A | N/A | 3.88% |
| Bloomberg Barclays Municipal Bond Index (f) | 5.51% | 3.49% | 4.54% | N/A |
| A With Initial Sales Charge (4.25%) | 1.80% | 2.34% | 3.94% | N/A |
| B With CDSC (Declining over six years from 4% to 0%) (v) | 1.63% | 2.12% | 3.63% | N/A |
| C With CDSC (1% for 12 months) (v) | 4.63% | 2.46% | 3.61% | N/A |
| (f) | Source: FactSet Research Systems Inc. |
| (t) | For the period from the class inception date through the stated period end (for those share classes with less than 10 years of performance history). No comparative benchmark performance information is provided for “life” periods. (See Notes to Performance Summary.) |
| (v) | Assuming redemption at the end of the applicable period. |
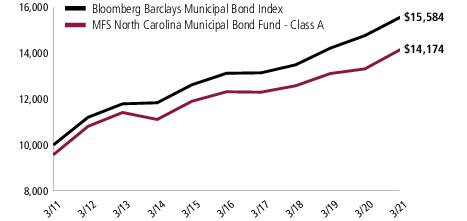
| Share Class | Class Inception Date | 1-yr | 5-yr | 10-yr | Life (t) |
| A | 10/31/84 | 6.42% | 2.84% | 4.00% | N/A |
| B | 9/07/93 | 5.64% | 2.10% | 3.23% | N/A |
| C | 1/03/94 | 5.63% | 2.09% | 3.23% | N/A |
| I | 4/01/16 | 6.64% | 3.13% | N/A | 3.13% |
| R6 | 8/01/17 | 6.71% | N/A | N/A | 3.61% |
| Bloomberg Barclays Municipal Bond Index (f) | 5.51% | 3.49% | 4.54% | N/A |
| A With Initial Sales Charge (4.25%) | 1.90% | 1.95% | 3.55% | N/A |
| B With CDSC (Declining over six years from 4% to 0%) (v) | 1.64% | 1.73% | 3.23% | N/A |
| C With CDSC (1% for 12 months) (v) | 4.63% | 2.09% | 3.23% | N/A |
| (f) | Source: FactSet Research Systems Inc. |
| (t) | For the period from the class inception date through the stated period end (for those share classes with less than 10 years of performance history). No comparative benchmark performance information is provided for “life” periods. (See Notes to Performance Summary.) |
| (v) | Assuming redemption at the end of the applicable period. |
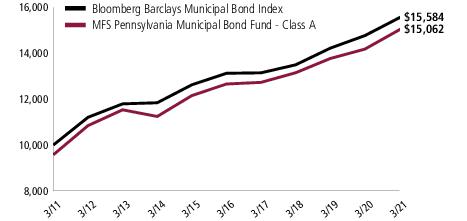
| Share Class | Class Inception Date | 1-yr | 5-yr | 10-yr | Life (t) |
| A | 2/01/93 | 6.21% | 3.54% | 4.63% | N/A |
| B | 9/07/93 | 5.32% | 2.77% | 3.84% | N/A |
| I | 4/01/16 | 6.18% | 3.63% | N/A | 3.63% |
| R6 | 8/01/17 | 6.35% | N/A | N/A | 4.13% |
| Bloomberg Barclays Municipal Bond Index (f) | 5.51% | 3.49% | 4.54% | N/A |
| A With Initial Sales Charge (4.25%) | 1.70% | 2.64% | 4.18% | N/A |
| B With CDSC (Declining over six years from 4% to 0%) (v) | 1.32% | 2.40% | 3.84% | N/A |
| (f) | Source: FactSet Research Systems Inc. |
| (t) | For the period from the class inception date through the stated period end (for those share classes with less than 10 years of performance history). No comparative benchmark performance information is provided for “life” periods. (See Notes to Performance Summary.) |
| (v) | Assuming redemption at the end of the applicable period. |
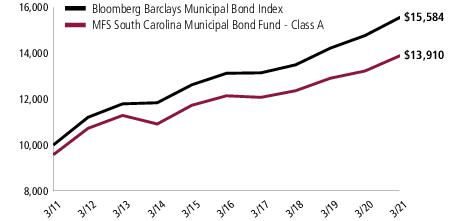
| Share Class | Class Inception Date | 1-yr | 5-yr | 10-yr | Life (t) |
| A | 10/31/84 | 5.18% | 2.75% | 3.80% | N/A |
| B | 9/07/93 | 4.50% | 2.01% | 3.04% | N/A |
| I | 4/01/16 | 5.53% | 3.03% | N/A | 3.03% |
| R6 | 8/01/17 | 5.59% | N/A | N/A | 3.56% |
| Bloomberg Barclays Municipal Bond Index (f) | 5.51% | 3.49% | 4.54% | N/A |
| A With Initial Sales Charge (4.25%) | 0.71% | 1.86% | 3.36% | N/A |
| B With CDSC (Declining over six years from 4% to 0%) (v) | 0.50% | 1.64% | 3.04% | N/A |
| (f) | Source: FactSet Research Systems Inc. |
| (t) | For the period from the class inception date through the stated period end (for those share classes with less than 10 years of performance history). No comparative benchmark performance information is provided for “life” periods. (See Notes to Performance Summary.) |
| (v) | Assuming redemption at the end of the applicable period. |

| Share Class | Class Inception Date | 1-yr | 5-yr | 10-yr | Life (t) |
| A | 8/12/88 | 6.38% | 2.76% | 3.80% | N/A |
| B | 9/07/93 | 5.49% | 2.00% | 3.02% | N/A |
| I | 4/01/16 | 6.59% | 3.01% | N/A | 3.01% |
| R6 | 8/01/17 | 6.67% | N/A | N/A | 3.47% |
| Bloomberg Barclays Municipal Bond Index (f) | 5.51% | 3.49% | 4.54% | N/A |
| A With Initial Sales Charge (4.25%) | 1.86% | 1.87% | 3.35% | N/A |
| B With CDSC (Declining over six years from 4% to 0%) (v) | 1.49% | 1.63% | 3.02% | N/A |
| (f) | Source: FactSet Research Systems Inc. |
| (t) | For the period from the class inception date through the stated period end (for those share classes with less than 10 years of performance history). No comparative benchmark performance information is provided for “life” periods. (See Notes to Performance Summary.) |
| (v) | Assuming redemption at the end of the applicable period. |
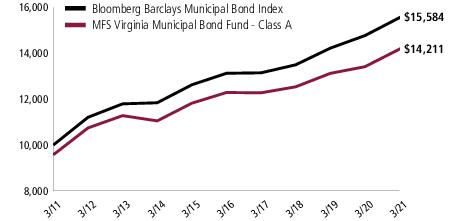
| Share Class | Class Inception Date | 1-yr | 5-yr | 10-yr | Life (t) |
| A | 10/31/84 | 5.94% | 2.95% | 4.03% | N/A |
| B | 9/07/93 | 5.16% | 2.18% | 3.25% | N/A |
| C | 1/03/94 | 5.25% | 2.18% | 3.25% | N/A |
| I | 4/01/16 | 6.26% | 3.22% | N/A | 3.22% |
| R6 | 8/01/17 | 6.23% | N/A | N/A | 3.75% |
| Bloomberg Barclays Municipal Bond Index (f) | 5.51% | 3.49% | 4.54% | N/A |
| A With Initial Sales Charge (4.25%) | 1.44% | 2.06% | 3.58% | N/A |
| B With CDSC (Declining over six years from 4% to 0%) (v) | 1.16% | 1.81% | 3.25% | N/A |
| C With CDSC (1% for 12 months) (v) | 4.25% | 2.18% | 3.25% | N/A |
| (f) | Source: FactSet Research Systems Inc. |
| (t) | For the period from the class inception date through the stated period end (for those share classes with less than 10 years of performance history). No comparative benchmark performance information is provided for “life” periods. (See Notes to Performance Summary.) |
| (v) | Assuming redemption at the end of the applicable period. |
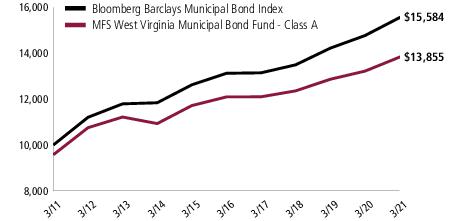
| Share Class | Class Inception Date | 1-yr | 5-yr | 10-yr | Life (t) |
| A | 10/31/84 | 4.81% | 2.75% | 3.76% | N/A |
| B | 9/07/93 | 3.93% | 1.96% | 2.98% | N/A |
| I | 4/01/16 | 4.94% | 3.00% | N/A | 3.00% |
| R6 | 8/01/17 | 5.13% | N/A | N/A | 3.47% |
| Bloomberg Barclays Municipal Bond Index (f) | 5.51% | 3.49% | 4.54% | N/A |
| A With Initial Sales Charge (4.25%) | 0.35% | 1.86% | 3.31% | N/A |
| B With CDSC (Declining over six years from 4% to 0%) (v) | (0.07)% | 1.59% | 2.98% | N/A |
| (f) | Source: FactSet Research Systems Inc. |
| (t) | For the period from the class inception date through the stated period end (for those share classes with less than 10 years of performance history). No comparative benchmark performance information is provided for “life” periods. (See Notes to Performance Summary.) |
| (v) | Assuming redemption at the end of the applicable period. |
| (a) | BLOOMBERG ® is a trademark and service mark of Bloomberg Finance L.P. and its affiliates (collectively “Bloomberg”). BARCLAYS® is a trademark and service mark of Barclays Bank Plc (collectively with its affiliates, “Barclays”), used under license. Bloomberg or Bloomberg's licensors, including Barclays, own all proprietary rights in the Bloomberg Barclays Indices. Neither Bloomberg nor Barclays approves or endorses this material, or guarantees the accuracy or completeness of any information herein, or makes any warranty, express or implied, as to the results to be obtained therefrom, and, to the maximum extent allowed by law, neither shall have any liability or responsibility for injury or damages arising in connection therewith. |
| Share Class | Annualized Expense Ratio | Beginning Account Value 10/01/20 | Ending Account Value 3/31/21 | Expenses Paid During Period (p) 10/01/20-3/31/21 | |
| A | Actual | 0.80% | $1,000.00 | $1,017.83 | $4.02 |
| Hypothetical (h) | 0.80% | $1,000.00 | $1,020.94 | $4.03 | |
| B | Actual | 1.45% | $1,000.00 | $1,014.54 | $7.28 |
| Hypothetical (h) | 1.45% | $1,000.00 | $1,017.70 | $7.29 | |
| I | Actual | 0.70% | $1,000.00 | $1,018.33 | $3.52 |
| Hypothetical (h) | 0.70% | $1,000.00 | $1,021.44 | $3.53 | |
| R6 | Actual | 0.64% | $1,000.00 | $1,018.64 | $3.22 |
| Hypothetical (h) | 0.64% | $1,000.00 | $1,021.74 | $3.23 |
| (h) | 5% class return per year before expenses. |
| (p) | “Expenses Paid During Period” are equal to each class’s annualized expense ratio, as shown above, multiplied by the average account value over the period, multiplied by 182/365 (to reflect the one-half year period). Expenses paid do not include any applicable sales charges (loads). If these transaction costs had been included, your costs would have been higher. |
| Share Class | Annualized Expense Ratio | Beginning Account Value 10/01/20 | Ending Account Value 3/31/21 | Expenses Paid During Period (p) 10/01/20-3/31/21 | |
| A | Actual | 0.83% | $1,000.00 | $1,033.22 | $4.21 |
| Hypothetical (h) | 0.83% | $1,000.00 | $1,020.79 | $4.18 | |
| B | Actual | 1.58% | $1,000.00 | $1,029.43 | $7.99 |
| Hypothetical (h) | 1.58% | $1,000.00 | $1,017.05 | $7.95 | |
| C | Actual | 1.58% | $1,000.00 | $1,029.40 | $7.99 |
| Hypothetical (h) | 1.58% | $1,000.00 | $1,017.05 | $7.95 | |
| I | Actual | 0.58% | $1,000.00 | $1,034.15 | $2.94 |
| Hypothetical (h) | 0.58% | $1,000.00 | $1,022.04 | $2.92 | |
| R6 | Actual | 0.52% | $1,000.00 | $1,034.45 | $2.64 |
| Hypothetical (h) | 0.52% | $1,000.00 | $1,022.34 | $2.62 |
| Share Class | Annualized Expense Ratio | Beginning Account Value 10/01/20 | Ending Account Value 3/31/21 | Expenses Paid During Period (p) 10/01/20-3/31/21 | |
| A | Actual | 0.83% | $1,000.00 | $1,022.78 | $4.19 |
| Hypothetical (h) | 0.83% | $1,000.00 | $1,020.79 | $4.18 | |
| B | Actual | 1.58% | $1,000.00 | $1,019.00 | $7.95 |
| Hypothetical (h) | 1.58% | $1,000.00 | $1,017.05 | $7.95 | |
| C | Actual | 1.58% | $1,000.00 | $1,018.98 | $7.95 |
| Hypothetical (h) | 1.58% | $1,000.00 | $1,017.05 | $7.95 | |
| I | Actual | 0.58% | $1,000.00 | $1,024.38 | $2.93 |
| Hypothetical (h) | 0.58% | $1,000.00 | $1,022.04 | $2.92 | |
| R6 | Actual | 0.51% | $1,000.00 | $1,024.73 | $2.57 |
| Hypothetical (h) | 0.51% | $1,000.00 | $1,022.39 | $2.57 |
| (h) | 5% class return per year before expenses. |
| (p) | “Expenses Paid During Period” are equal to each class’s annualized expense ratio, as shown above, multiplied by the average account value over the period, multiplied by 182/365 (to reflect the one-half year period). Expenses paid do not include any applicable sales charges (loads). If these transaction costs had been included, your costs would have been higher. |
| Share Class | Annualized Expense Ratio | Beginning Account Value 10/01/20 | Ending Account Value 3/31/21 | Expenses Paid During Period (p) 10/01/20-3/31/21 | |
| A | Actual | 0.76% | $1,000.00 | $1,025.29 | $3.84 |
| Hypothetical (h) | 0.76% | $1,000.00 | $1,021.14 | $3.83 | |
| B | Actual | 1.51% | $1,000.00 | $1,020.50 | $7.61 |
| Hypothetical (h) | 1.51% | $1,000.00 | $1,017.40 | $7.59 | |
| I | Actual | 0.66% | $1,000.00 | $1,025.44 | $3.33 |
| Hypothetical (h) | 0.66% | $1,000.00 | $1,021.64 | $3.33 | |
| R6 | Actual | 0.59% | $1,000.00 | $1,025.78 | $2.98 |
| Hypothetical (h) | 0.59% | $1,000.00 | $1,021.99 | $2.97 |
| Share Class | Annualized Expense Ratio | Beginning Account Value 10/01/20 | Ending Account Value 3/31/21 | Expenses Paid During Period (p) 10/01/20-3/31/21 | |
| A | Actual | 0.84% | $1,000.00 | $1,017.73 | $4.23 |
| Hypothetical (h) | 0.84% | $1,000.00 | $1,020.74 | $4.23 | |
| B | Actual | 1.60% | $1,000.00 | $1,013.97 | $8.03 |
| Hypothetical (h) | 1.60% | $1,000.00 | $1,016.95 | $8.05 | |
| I | Actual | 0.59% | $1,000.00 | $1,018.88 | $2.97 |
| Hypothetical (h) | 0.59% | $1,000.00 | $1,021.99 | $2.97 | |
| R6 | Actual | 0.52% | $1,000.00 | $1,019.17 | $2.62 |
| Hypothetical (h) | 0.52% | $1,000.00 | $1,022.34 | $2.62 |
| Share Class | Annualized Expense Ratio | Beginning Account Value 10/01/20 | Ending Account Value 3/31/21 | Expenses Paid During Period (p) 10/01/20-3/31/21 | |
| A | Actual | 0.86% | $1,000.00 | $1,024.96 | $4.34 |
| Hypothetical (h) | 0.86% | $1,000.00 | $1,020.64 | $4.33 | |
| B | Actual | 1.61% | $1,000.00 | $1,020.20 | $8.11 |
| Hypothetical (h) | 1.61% | $1,000.00 | $1,016.90 | $8.10 | |
| I | Actual | 0.61% | $1,000.00 | $1,026.14 | $3.08 |
| Hypothetical (h) | 0.61% | $1,000.00 | $1,021.89 | $3.07 | |
| R6 | Actual | 0.54% | $1,000.00 | $1,026.52 | $2.73 |
| Hypothetical (h) | 0.54% | $1,000.00 | $1,022.24 | $2.72 |
| (h) | 5% class return per year before expenses. |
| (p) | “Expenses Paid During Period” are equal to each class’s annualized expense ratio, as shown above, multiplied by the average account value over the period, multiplied by 182/365 (to reflect the one-half year period). Expenses paid do not include any applicable sales charges (loads). If these transaction costs had been included, your costs would have been higher. |
| Share Class | Annualized Expense Ratio | Beginning Account Value 10/01/20 | Ending Account Value 3/31/21 | Expenses Paid During Period (p) 10/01/20-3/31/21 | |
| A | Actual | 0.82% | $1,000.00 | $1,017.82 | $4.13 |
| Hypothetical (h) | 0.82% | $1,000.00 | $1,020.84 | $4.13 | |
| B | Actual | 1.57% | $1,000.00 | $1,014.05 | $7.88 |
| Hypothetical (h) | 1.57% | $1,000.00 | $1,017.10 | $7.90 | |
| C | Actual | 1.57% | $1,000.00 | $1,014.93 | $7.89 |
| Hypothetical (h) | 1.57% | $1,000.00 | $1,017.10 | $7.90 | |
| I | Actual | 0.57% | $1,000.00 | $1,019.87 | $2.87 |
| Hypothetical (h) | 0.57% | $1,000.00 | $1,022.09 | $2.87 | |
| R6 | Actual | 0.49% | $1,000.00 | $1,019.21 | $2.47 |
| Hypothetical (h) | 0.49% | $1,000.00 | $1,022.49 | $2.47 |
| Share Class | Annualized Expense Ratio | Beginning Account Value 10/01/20 | Ending Account Value 3/31/21 | Expenses Paid During Period (p) 10/01/20-3/31/21 | |
| A | Actual | 0.87% | $1,000.00 | $1,015.83 | $4.37 |
| Hypothetical (h) | 0.87% | $1,000.00 | $1,020.59 | $4.38 | |
| B | Actual | 1.62% | $1,000.00 | $1,011.17 | $8.12 |
| Hypothetical (h) | 1.62% | $1,000.00 | $1,016.85 | $8.15 | |
| I | Actual | 0.62% | $1,000.00 | $1,016.55 | $3.12 |
| Hypothetical (h) | 0.62% | $1,000.00 | $1,021.84 | $3.13 | |
| R6 | Actual | 0.54% | $1,000.00 | $1,016.96 | $2.72 |
| Hypothetical (h) | 0.54% | $1,000.00 | $1,022.24 | $2.72 |
| (h) | 5% class return per year before expenses. |
| (p) | “Expenses Paid During Period” are equal to each class’s annualized expense ratio, as shown above, multiplied by the average account value over the period, multiplied by 182/365 (to reflect the one-half year period). Expenses paid do not include any applicable sales charges (loads). If these transaction costs had been included, your costs would have been higher. |
| Issuer | Shares/Par | Value ($) | ||
| Municipal Bonds – 99.5% | ||||
| Airport Revenue – 0.6% | ||||
| Dallas and Fort Worth, TX, International Airport Rev., “B”, 5%, 11/01/2044 | $ | 115,000 | $ 122,842 | |
| Dallas and Fort Worth, TX, International Airport Rev., “C”, 5%, 11/01/2045 | 75,000 | 76,967 | ||
| Wayne County, MI, Airport Authority Rev. (Detroit Metropolitan Wayne County Airport), “B”, 5%, 12/01/2044 | 45,000 | 51,571 | ||
| Wayne County, MI, Airport Authority Rev. (Detroit Metropolitan Wayne County Airport), “B”, BAM, 5%, 12/01/2039 | 230,000 | 263,584 | ||
| Wayne County, MI, Airport Authority Rev. (Detroit Metropolitan Wayne County Airport), “C”, 5%, 12/01/2039 | 35,000 | 39,840 | ||
| Wayne County, MI, Airport Authority Rev. (Detroit Metropolitan Wayne County Airport), “C”, 5%, 12/01/2044 | 60,000 | 68,296 | ||
| $ 623,100 | ||||
| General Obligations - General Purpose – 23.4% | ||||
| Biloxi, MS, Development Bank Special Obligation, 4%, 3/01/2037 | $ | 500,000 | $ 580,941 | |
| Bridgeview, IL, Stadium and Redevelopment Projects, AAC, 5.14%, 12/01/2036 | 220,000 | 215,057 | ||
| Canton, MS, Mississippi Development Bank Special Obligation, “A”, AGM, 5.75%, 10/01/2031 (Prerefunded 10/01/2021) | 625,000 | 642,130 | ||
| Chicago, IL, General Obligation (Neighborhood Alive 21 Program), “B”, 5.5%, 1/01/2037 | 45,000 | 50,229 | ||
| Chicago, IL, General Obligation Refunding Project, “A”, 5.25%, 1/01/2030 | 30,000 | 32,629 | ||
| Chicago, IL, General Obligation, “A”, 5.5%, 1/01/2033 | 65,000 | 73,003 | ||
| Chicago, IL, General Obligation, “A”, 5.5%, 1/01/2035 | 50,000 | 61,478 | ||
| Chicago, IL, General Obligation, “D”, 5.5%, 1/01/2040 | 20,000 | 22,240 | ||
| Chicago, IL, General Obligation, “F”, 5.5%, 1/01/2042 | 135,000 | 149,731 | ||
| Commonwealth of Puerto Rico, General Obligation, “A”, 8%, 7/01/2035 (a)(d) | 1,025,000 | 804,625 | ||
| Hattiesburg, MS, Development Bank Special Obligation, 5.25%, 2/01/2049 | 750,000 | 921,329 | ||
| Jackson, MS, General Obligation Refunding, 5%, 3/01/2027 | 700,000 | 854,109 | ||
| Jackson, MS, General Obligation Refunding, 5%, 3/01/2028 | 550,000 | 683,729 | ||
| Issuer | Shares/Par | Value ($) | ||
| General Obligations - General Purpose – continued | ||||
| Mississippi Development Bank Special Obligation (City of Jackson, Mississippi General Obligation Capital City Convention Center Refunding Project), 5%, 3/01/2025 | $ | 1,000,000 | $ 1,153,062 | |
| Mississippi Development Bank Special Obligation (Harrison County Coliseum), “A”, 5.25%, 1/01/2034 | 1,000,000 | 1,351,062 | ||
| Mississippi Development Bank Special Obligation (Hattiesburg General Obligation Project), 4%, 2/01/2045 | 500,000 | 577,039 | ||
| Mississippi Development Bank Special Obligation (Hattiesburg, Mississippi General Obligation Bond Project), 4%, 2/01/2044 | 115,000 | 131,179 | ||
| Mississippi Development Bank Special Obligation (Hinds County), 5%, 11/01/2032 | 500,000 | 610,049 | ||
| Mississippi Development Bank Special Obligation (Hinds County), 4%, 11/01/2042 | 500,000 | 567,109 | ||
| Mississippi Development Bank Special Obligation (Lauderdale County, Mississippi General Obligation Bond Project), 5%, 3/01/2028 (w) | 300,000 | 377,137 | ||
| Mississippi Development Bank Special Obligation (Lauderdale County, Mississippi General Obligation Bond Project), 5%, 3/01/2029 (w) | 200,000 | 249,441 | ||
| Mississippi Development Bank Special Obligation (Lauderdale County, Mississippi General Obligation Bond Project), 5%, 3/01/2031 (w) | 200,000 | 246,903 | ||
| Mississippi Development Bank Special Obligation (Rankin County), 5%, 3/01/2031 | 1,000,000 | 1,216,100 | ||
| Mississippi Development Bank Special Obligation (Rankin County), 5%, 3/01/2032 | 1,000,000 | 1,213,709 | ||
| Mississippi Development Bank Special Obligation (Vicksburg, Mississippi Sports Complex General Obligation Bond Project), BAM, 5%, 7/01/2048 | 1,000,000 | 1,215,402 | ||
| Mississippi General Obligation, “A”, 5%, 6/01/2031 | 1,000,000 | 1,322,035 | ||
| Mississippi General Obligation, “B”, 3%, 10/01/2035 | 875,000 | 972,876 | ||
| Puerto Rico Public Buildings Authority Government Facilities Rev., “M-2”, AAC, 10%, 7/01/2035 | 150,000 | 157,636 | ||
| State of Illinois, General Obligation, 5.5%, 5/01/2039 | 150,000 | 184,542 | ||
| State of Illinois, General Obligation, “A”, 5%, 3/01/2028 | 95,000 | 114,355 | ||
| State of Illinois, General Obligation, “A”, 5%, 3/01/2029 | 140,000 | 170,841 | ||
| State of Illinois, General Obligation, “A”, 5%, 3/01/2030 | 130,000 | 160,350 | ||
| Issuer | Shares/Par | Value ($) | ||
| Municipal Bonds – continued | ||||
| General Obligations - General Purpose – continued | ||||
| State of Illinois, General Obligation, “A”, 5%, 3/01/2031 | $ | 190,000 | $ 236,958 | |
| State of Mississippi, “A”, 5%, 10/01/2033 | 1,000,000 | 1,236,955 | ||
| State of Mississippi, “A”, 5%, 11/01/2036 | 1,000,000 | 1,210,936 | ||
| State of Mississippi, “B”, 5%, 12/01/2033 | 1,000,000 | 1,214,915 | ||
| State of Mississippi, “B”, 4%, 10/01/2036 | 1,000,000 | 1,199,087 | ||
| State of Mississippi, “B”, 4%, 10/01/2038 | 1,000,000 | 1,186,602 | ||
| State of Mississippi, “D”, 4%, 12/01/2030 | 1,000,000 | 1,179,948 | ||
| State of Mississippi, Capital Improvement Projects, “A”, 5%, 10/01/2030 (Prerefunded 10/01/2021) | 1,000,000 | 1,023,994 | ||
| $ 25,571,452 | ||||
| General Obligations - Schools – 12.0% | ||||
| Berks County, PA, Reading School District, AGM, 5%, 3/01/2036 | $ | 20,000 | $ 24,148 | |
| Lamar County, MS, School District, 5%, 9/01/2031 (Prerefunded 9/01/2023) | 1,095,000 | 1,220,225 | ||
| Mississippi Development Bank Special Obligation (Canton Public School District), AGM, 5%, 12/01/2031 | 1,000,000 | 1,171,937 | ||
| Mississippi Development Bank Special Obligation (Clinton Public School District), 4%, 4/01/2036 | 500,000 | 583,539 | ||
| Mississippi Development Bank Special Obligation (Clinton Public School District), 4%, 4/01/2037 | 500,000 | 581,579 | ||
| Mississippi Development Bank Special Obligation (Gulfport School District), BAM, 5%, 4/01/2031 | 500,000 | 554,768 | ||
| Mississippi Development Bank Special Obligation (Gulfport School District), BAM, 5%, 4/01/2032 | 500,000 | 553,892 | ||
| Mississippi Development Bank Special Obligation (Hinds County School District), 5%, 3/01/2043 | 450,000 | 544,277 | ||
| Mississippi Development Bank Special Obligation (Jackson Public School District), BAM, 5.25%, 10/01/2037 | 1,000,000 | 1,263,275 | ||
| Mississippi Development Bank Special Obligation (Vicksburg Warren School District General Obligation Project), BAM, 5%, 3/01/2048 | 1,500,000 | 1,850,213 | ||
| Mississippi Development Bank Special Obligation Lafayette County School District General Obligation Bond Project), BAM, 5%, 4/01/2030 | 100,000 | 129,021 | ||
| Mississippi Development Bank Special Obligation, (Mississippi Gulf Coast Community College District Facilities Construction and Refinancing Project), 5%, 12/01/2026 | 515,000 | 632,624 | ||
| Natchez-Adams, MS, School District Trust Certificates, 5%, 2/01/2025 | 470,000 | 542,195 | ||
| Issuer | Shares/Par | Value ($) | ||
| General Obligations - Schools – continued | ||||
| Natchez-Adams, MS, School District Trust Certificates, 5%, 2/01/2026 | $ | 145,000 | $ 172,186 | |
| Natchez-Adams, MS, School District Trust Certificates, 5%, 2/01/2030 | 1,245,000 | 1,596,458 | ||
| Rankin County, MS, Development Bank Special Obligation (School District General Obligation Project), 4%, 6/01/2043 | 750,000 | 847,488 | ||
| San Diego, CA, Unified School District (Election of 2008), Capital Appreciation, “C”, 0%, 7/01/2035 | 1,020,000 | 771,067 | ||
| $ 13,038,892 | ||||
| Healthcare Revenue - Hospitals – 7.9% | ||||
| Chattanooga, TN, Health, Educational & Housing Facility Board Rev. (CommonSpirit Health), “A-1”, 4%, 8/01/2044 | $ | 5,000 | $ 5,548 | |
| Chattanooga, TN, Health, Educational & Housing Facility Board Rev. (CommonSpirit Health), “A-2”, 5%, 8/01/2044 | 10,000 | 12,126 | ||
| Chattanooga, TN, Health, Educational & Housing Facility Board Rev. (CommonSpirit Health), “A-2”, 5%, 8/01/2049 | 5,000 | 6,018 | ||
| Colorado Health Facilities Authority Rev. (CommonSpirit Health), “A-2”, 4%, 8/01/2044 | 50,000 | 55,477 | ||
| Gulfport, MS, Hospital Facilities Rev. (Memorial Hospital at Gulfport Project), 5%, 7/01/2027 | 500,000 | 581,588 | ||
| Knox County, TN, Health, Educational & Housing Facility Board Rev. (University Health Systems, Inc.), “A”, 5%, 9/01/2030 | 465,000 | 574,762 | ||
| Massachusetts Development Finance Agency Rev. (Partners Healthcare), “S”, 4%, 7/01/2041 | 535,000 | 611,738 | ||
| Miami-Dade County, FL, Health Facilities Authority Hospital Rev., Unrefunded Balance, 6%, 8/01/2030 | 20,000 | 20,079 | ||
| Mississippi Hospital Equipment & Facilities Authority Refunding Rev. (Forrest County General Hospital Refunding Project), “A”, 5%, 1/01/2028 | 575,000 | 709,569 | ||
| Mississippi Hospital Equipment & Facilities Authority Rev. (Baptist Memorial Healthcare), “A”, 5%, 9/01/2022 | 1,000,000 | 1,054,959 | ||
| Mississippi Hospital Equipment & Facilities Authority Rev. (Baptist Memorial Healthcare), “A”, 5%, 9/01/2044 (Put Date 9/01/2025) | 500,000 | 571,978 | ||
| Mississippi Hospital Equipment & Facilities Authority Rev. (Forrest County General Hospital Refunding Project), “A”, 4%, 1/01/2040 | 1,000,000 | 1,133,141 | ||
| Mississippi Hospital Equipment & Facilities Authority Rev. (North Mississippi Health Services), “I”, 5%, 10/01/2026 | 585,000 | 711,281 | ||
| Issuer | Shares/Par | Value ($) | ||
| Municipal Bonds – continued | ||||
| Healthcare Revenue - Hospitals – continued | ||||
| Mississippi Hospital Equipment & Facilities Authority Rev. (North Mississippi Health Services), “IV”, 5%, 10/01/2037 | $ | 1,500,000 | $ 1,857,972 | |
| Spartanburg County, SC, Regional Health Services District Hospital Rev., “A”, 4%, 4/15/2043 | 655,000 | 719,376 | ||
| $ 8,625,612 | ||||
| Industrial Revenue - Other – 0.3% | ||||
| Tuscaloosa County, AL, Industrial Development Authority, Gulf Opportunity Zone (Hunt Refining Project), “A”, 5.25%, 5/01/2044 (n) | $ | 290,000 | $ 329,561 | |
| Industrial Revenue - Paper – 1.7% | ||||
| Lowndes County, MS, Solid Waste Disposal & Pollution Control Rev. (Weyerhaeuser Co.), 6.8%, 4/01/2022 | $ | 750,000 | $ 794,774 | |
| Warren County, MS, Environmental Improvement Rev. (International Paper Co. Project), “B”, 1.6%, 8/01/2027 (Put Date 6/16/2025) | 1,000,000 | 1,030,019 | ||
| $ 1,824,793 | ||||
| Miscellaneous Revenue - Other – 1.2% | ||||
| Mississippi Development Bank Special Obligation (Itwamba Community College Capital Improvement Project), 5%, 10/01/2029 | $ | 280,000 | $ 362,469 | |
| Mississippi Development Bank Special Obligation (Itwamba Community College Capital Improvement Project), 5%, 10/01/2030 | 720,000 | 940,738 | ||
| $ 1,303,207 | ||||
| Sales & Excise Tax Revenue – 6.3% | ||||
| Guam Government Business Privilege Tax Rev., “A”, 5.25%, 1/01/2036 | $ | 295,000 | $ 304,407 | |
| Guam Government Business Privilege Tax Rev., “D”, 5%, 11/15/2031 | 270,000 | 303,606 | ||
| Illinois Sales Tax Securitization Corp., Second Lien, “A”, 5%, 1/01/2026 | 40,000 | 47,186 | ||
| Illinois Sales Tax Securitization Corp., Second Lien, “A”, 5%, 1/01/2027 | 80,000 | 96,638 | ||
| Illinois Sales Tax Securitization Corp., Second Lien, “A”, 5%, 1/01/2028 | 80,000 | 98,607 | ||
| Illinois Sales Tax Securitization Corp., Second Lien, “A”, 5%, 1/01/2029 | 15,000 | 18,790 | ||
| Illinois Sales Tax Securitization Corp., Second Lien, “A”, 5%, 1/01/2030 | 35,000 | 44,499 | ||
| Illinois Sales Tax Securitization Corp., Second Lien, “A”, 5%, 1/01/2036 | 35,000 | 43,322 | ||
| Illinois Sales Tax Securitization Corp., Second Lien, “A”, 5%, 1/01/2037 | 45,000 | 55,830 | ||
| Issuer | Shares/Par | Value ($) | ||
| Sales & Excise Tax Revenue – continued | ||||
| Illinois Sales Tax Securitization Corp., Second Lien, “A”, 4%, 1/01/2038 | $ | 35,000 | $ 39,902 | |
| Illinois Sales Tax Securitization Corp., Second Lien, “A”, 4%, 1/01/2039 | 30,000 | 34,101 | ||
| Massachusetts Bay Transportation Authority, Sales Tax Rev., “A-1”, 5.25%, 7/01/2029 | 750,000 | 998,685 | ||
| Mississippi Development Bank Special Obligation (Jackson Sales Tax Rev. Infrastructure Project), 5%, 9/01/2030 | 1,650,000 | 2,135,959 | ||
| Puerto Rico Sales Tax Financing Corp., Restructured Sales Tax Rev., “2019A-1”, 4.55%, 7/01/2040 | 20,000 | 21,676 | ||
| Puerto Rico Sales Tax Financing Corp., Restructured Sales Tax Rev., “2019A-1”, 5%, 7/01/2058 | 929,000 | 1,022,996 | ||
| Puerto Rico Sales Tax Financing Corp., Restructured Sales Tax Rev., “2019A-2”, 4.329%, 7/01/2040 | 203,000 | 217,153 | ||
| Puerto Rico Sales Tax Financing Corp., Restructured Sales Tax Rev., “2019A-2”, 4.329%, 7/01/2040 | 71,000 | 75,950 | ||
| Puerto Rico Sales Tax Financing Corp., Restructured Sales Tax Rev., “2019A-2”, 4.536%, 7/01/2053 | 1,000 | 1,072 | ||
| Puerto Rico Sales Tax Financing Corp., Restructured Sales Tax Rev., “2019A-2”, 4.784%, 7/01/2058 | 33,000 | 35,709 | ||
| Puerto Rico Sales Tax Financing Corp., Restructured Sales Tax Rev., Capital Appreciation, “2019A-1”, 0%, 7/01/2024 | 2,000 | 1,877 | ||
| Puerto Rico Sales Tax Financing Corp., Restructured Sales Tax Rev., Capital Appreciation, “2019A-1”, 0%, 7/01/2027 | 38,000 | 33,291 | ||
| Puerto Rico Sales Tax Financing Corp., Restructured Sales Tax Rev., Capital Appreciation, “2019A-1”, 0%, 7/01/2029 | 7,000 | 5,765 | ||
| Puerto Rico Sales Tax Financing Corp., Restructured Sales Tax Rev., Capital Appreciation, “2019A-1”, 0%, 7/01/2031 | 346,000 | 264,808 | ||
| Puerto Rico Sales Tax Financing Corp., Restructured Sales Tax Rev., Capital Appreciation, “2019A-1”, 0%, 7/01/2033 | 330,000 | 234,242 | ||
| Puerto Rico Sales Tax Financing Corp., Restructured Sales Tax Rev., Capital Appreciation, “2019A-1”, 0%, 7/01/2046 | 1,891,000 | 577,076 | ||
| Wisconsin Public Finance Authority Limited Obligation Grant Rev. (American Dream at Meadowlands Project), “A”, 6.25%, 8/01/2027 (n) | 115,000 | 124,970 | ||
| $ 6,838,117 | ||||
| Single Family Housing - State – 4.5% | ||||
| Connecticut Housing Finance Authority Rev. (Housing Mortgage Finance Program), “D-1”, GNMA, 4%, 11/15/2047 | $ | 350,000 | $ 378,284 | |
| Issuer | Shares/Par | Value ($) | ||
| Municipal Bonds – continued | ||||
| Single Family Housing - State – continued | ||||
| Iowa Finance Authority, Single Family Mortgage Rev., “A”, GNMA, 4%, 7/01/2047 | $ | 380,000 | $ 410,333 | |
| Maryland Community Development Administration, Department of Housing & Community Development Housing Rev., “A”, 4.25%, 9/01/2049 | 405,000 | 452,720 | ||
| Mississippi Home Corp., Single Family Mortgage Rev., “A”, 3.75%, 12/01/2035 | 750,000 | 830,695 | ||
| Mississippi Home Corp., Single Family Mortgage Rev., “A”, FNMA, 3.875%, 12/01/2043 | 280,000 | 302,999 | ||
| Mississippi Home Corp., Single Family Mortgage Rev., “A”, GNMA, 3%, 12/01/2050 | 500,000 | 547,843 | ||
| Mississippi Home Corp., Single Family Mortgage Rev., “B”, GNMA, 2.875%, 12/01/2043 | 1,000,000 | 1,037,371 | ||
| Pennsylvania Housing Finance Agency, Single Family Mortgage Rev., “125A”, 3.7%, 10/01/2037 | 415,000 | 445,706 | ||
| Tennessee Housing Development Agency, Residential Finance Program Rev., “1”, 4.25%, 1/01/2050 | 430,000 | 477,382 | ||
| $ 4,883,333 | ||||
| State & Local Agencies – 8.9% | ||||
| Commonwealth of Pennsylvania, Tobacco Master Settlement Financing Authority Rev., 5%, 6/01/2032 | $ | 25,000 | $ 30,762 | |
| Commonwealth of Pennsylvania, Tobacco Master Settlement Financing Authority Rev., 5%, 6/01/2033 | 25,000 | 30,618 | ||
| Commonwealth of Pennsylvania, Tobacco Master Settlement Financing Authority Rev., 5%, 6/01/2034 | 10,000 | 12,202 | ||
| Maryland Stadium Authority Rev., Baltimore City Public Schools Construction and Revitalization Program, “A”, 5%, 5/01/2047 (Prerefunded 5/01/2028) | 115,000 | 146,964 | ||
| Maryland Stadium Authority Rev., Baltimore City Public Schools Construction and Revitalization Program, “A”, 5%, 5/01/2047 | 225,000 | 267,554 | ||
| Mississippi Development Bank Special Obligation (Department of Rehabilitation Services Capital Improvement Project), AGM, 5%, 7/01/2023 (Prerefunded 7/01/2021) | 345,000 | 349,003 | ||
| Mississippi Development Bank Special Obligation (Department of Rehabilitation Services Capital Improvement Project), AGM, 5%, 7/01/2024 (Prerefunded 7/01/2021) | 360,000 | 364,177 | ||
| Mississippi Development Bank Special Obligation (Department of Rehabilitation Services Capital Improvement Project), AGM, 5%, 7/01/2025 (Prerefunded 7/01/2021) | 380,000 | 384,409 | ||
| Issuer | Shares/Par | Value ($) | ||
| State & Local Agencies – continued | ||||
| Mississippi Development Bank Special Obligation (Desoto County Mississippi Highway Construction Project), 5%, 1/01/2029 (Prerefunded 1/01/2023) | $ | 500,000 | $ 542,188 | |
| Mississippi Development Bank Special Obligation (Desoto County Mississippi Highway Construction Project), 5%, 1/01/2030 (Prerefunded 1/01/2023) | 500,000 | 542,188 | ||
| Mississippi Development Bank Special Obligation (Desoto County Mississippi Highway Construction Project), ETM, 5%, 1/01/2026 (Prerefunded 1/01/2023) | 2,105,000 | 2,282,610 | ||
| Mississippi Development Bank Special Obligation (Jackson County), AGM, 5%, 7/01/2022 (Prerefunded 7/01/2021) | 500,000 | 505,862 | ||
| Mississippi Development Bank Special Obligation (Laurel Highway Refunding Project), “B”, 4%, 1/01/2022 | 735,000 | 755,221 | ||
| Mississippi Development Bank Special Obligation (Montfort Jones Memorial Hospital Project), 5.75%, 5/01/2036 | 500,000 | 501,591 | ||
| Mississippi Development Bank Special Obligation (Singing River Health System), AGM, 5.375%, 7/01/2036 (Prerefunded 7/01/2021) | 500,000 | 506,310 | ||
| Mississippi Development Bank Special Obligation (Tupelo Public Improvement Rev. Project), 5%, 7/01/2049 | 1,500,000 | 1,843,063 | ||
| New Jersey Economic Development Authority Rev. (School Facilities Construction), “AAA”, 5%, 6/15/2026 | 100,000 | 120,080 | ||
| New Jersey Economic Development Authority Rev. (School Facilities Construction), “LLL”, 5%, 6/15/2039 | 210,000 | 254,517 | ||
| Orangeburg County, SC, Facilities Corp. Installment Purchase Rev. (Detention Center Project), 4%, 12/01/2042 | 280,000 | 305,846 | ||
| $ 9,745,165 | ||||
| Student Loan Revenue – 0.1% | ||||
| Iowa Student Loan Liquidity Corp. Rev., “B”, 3%, 12/01/2039 | $ | 45,000 | $ 44,453 | |
| Iowa Student Loan Liquidity Corp. Rev., “B”, 3.5%, 12/01/2044 | 110,000 | 110,706 | ||
| $ 155,159 | ||||
| Tax - Other – 4.1% | ||||
| Birmingham-Jefferson, AL, Civic Center Authority, “B”, 5%, 7/01/2043 | $ | 455,000 | $ 535,979 | |
| Mississippi Development Bank Special Obligation (Jackson Public School District Limited Tax Refunding Note Project), “B”, 5%, 10/01/2023 | 785,000 | 836,955 | ||
| Puerto Rico Convention Center District Authority, Hotel Occupancy Tax Rev., “A”, AAC, 5%, 7/01/2031 | 510,000 | 521,813 | ||
| Issuer | Shares/Par | Value ($) | ||
| Municipal Bonds – continued | ||||
| Tax - Other – continued | ||||
| State of Mississippi, Gaming Tax Rev., “A”, 4%, 10/15/2038 | $ | 1,000,000 | $ 1,121,426 | |
| State of Mississippi, Gaming Tax Rev., “E”, 5%, 10/15/2030 | 1,305,000 | 1,498,574 | ||
| $ 4,514,747 | ||||
| Tobacco – 0.6% | ||||
| Buckeye, OH, Tobacco Settlement Financing Authority Senior Asset-Backed Refunding, 2020A-2, “1”, 5%, 6/01/2036 | $ | 70,000 | $ 87,669 | |
| Buckeye, OH, Tobacco Settlement Financing Authority Senior Asset-Backed Refunding, 2020B-3, Capital Appreciation, “2”, 0%, 6/01/2057 | 1,285,000 | 194,303 | ||
| Illinois Railsplitter Tobacco Settlement Authority Rev., 6%, 6/01/2028 (Prerefunded 6/01/2021) | 420,000 | 423,846 | ||
| $ 705,818 | ||||
| Toll Roads – 0.7% | ||||
| Texas Private Activity Surface Transportation Corp., Senior Lien Rev. (NTE Mobility Partners Segments 3 LLC Segments 3A & 3B Facility), 7%, 12/31/2038 | $ | 110,000 | $ 125,506 | |
| Texas Private Activity Surface Transportation Corp., Senior Lien Rev. (NTE Mobility Partners Segments 3 LLC Segments 3A & 3B Facility), 6.75%, 6/30/2043 | 85,000 | 96,369 | ||
| Virginia Small Business Financing Authority Rev. (Elizabeth River Crossings Opco LLC Project), 6%, 1/01/2037 | 160,000 | 169,192 | ||
| Virginia Small Business Financing Authority Rev. (Elizabeth River Crossings Opco LLC Project), 5.5%, 1/01/2042 | 310,000 | 324,091 | ||
| $ 715,158 | ||||
| Transportation - Special Tax – 2.4% | ||||
| Commonwealth of Puerto Rico Highway & Transportation Authority Rev., “J”, NPFG, 5%, 7/01/2029 | $ | 10,000 | $ 10,255 | |
| Commonwealth of Puerto Rico Highway & Transportation Authority Rev., “L”, AAC, 5.25%, 7/01/2038 | 910,000 | 1,024,387 | ||
| Commonwealth of Puerto Rico Highway & Transportation Authority Rev., “N”, AAC, 5.5%, 7/01/2029 | 555,000 | 616,462 | ||
| Metropolitan Transportation Authority Rev., NY, Anticipation Note, “B-2”, 5%, 5/15/2021 | 350,000 | 351,681 | ||
| Metropolitan Transportation Authority Rev., NY, Anticipation Note, “D-1”, 5%, 9/01/2022 | 255,000 | 270,228 | ||
| New Jersey Transportation Trust Fund Authority, “AA”, 5%, 6/15/2045 | 60,000 | 72,836 | ||
| New Jersey Transportation Trust Fund Authority, “AA”, 5%, 6/15/2050 | 40,000 | 48,277 | ||
| Issuer | Shares/Par | Value ($) | ||
| Transportation - Special Tax – continued | ||||
| New Jersey Transportation Trust Fund Authority, Federal Highway Reimbursement Rev., “A-1”, 5%, 6/15/2027 | $ | 165,000 | $ 197,191 | |
| New Jersey Transportation Trust Fund Authority, Transportation System, “A”, 5.25%, 12/15/2021 | 55,000 | 56,907 | ||
| $ 2,648,224 | ||||
| Universities - Colleges – 11.7% | ||||
| Massachusetts Health & Educational Facilities Authority Rev. (Massachusetts Institute of Technology), “I-1”, 5.2%, 1/01/2028 | $ | 920,000 | $ 1,190,341 | |
| Medical Center, Educational Building Corp. Rev. (University of Mississippi Medical Center), “B”, AAC, 5.5%, 12/01/2023 | 470,000 | 509,884 | ||
| Mississippi State University, Educational Building Corp. Refunding Rev. (Mississippi State University Facilities Refinancing), “A”, 4%, 8/01/2043 | 600,000 | 679,390 | ||
| Mississippi State University, Educational Building Corp. Rev. (Campus Improvement Project), 5%, 11/01/2031 | 500,000 | 582,406 | ||
| Mississippi State University, Educational Building Corp. Rev. (Mississippi State University Refunding and Improvements Project), 5.25%, 8/01/2038 (Prerefunded 8/01/2023) | 1,000,000 | 1,117,436 | ||
| Mississippi State University, Educational Building Corp. Rev. (Residence Hall Construction and Refunding Project), 5%, 8/01/2036 (Prerefunded 8/01/2021) | 1,585,000 | 1,610,065 | ||
| University of Mississippi Medical Center, Educational Building Corp. Rev. (New Facilities & Refinancing Project), “A”, 4%, 6/01/2047 | 1,000,000 | 1,104,398 | ||
| University of Mississippi Medical Center, Educational Building Corp. Rev. (New Facilities & Refinancing Project), “A”, 5%, 6/01/2047 | 1,250,000 | 1,474,221 | ||
| University of Mississippi, Educational Building Corp. Rev. (Facilities Refinancing Project), “A”, 5%, 10/01/2028 | 115,000 | 147,412 | ||
| University of Southern Mississippi, Educational Building Corp. Rev. (Facilities Refinancing Project), 5%, 9/01/2034 | 1,480,000 | 1,750,153 | ||
| University of Southern Mississippi, Educational Building Corp. Rev. (Facilities Refinancing Project), “A”, 5%, 3/01/2028 | 745,000 | 858,974 | ||
| University of Southern Mississippi, Educational Building Corp. Rev. (Facilities Refinancing Project), “A”, 5%, 9/01/2035 | 1,515,000 | 1,791,690 | ||
| $ 12,816,370 | ||||
| Issuer | Shares/Par | Value ($) | ||
| Municipal Bonds – continued | ||||
| Universities - Dormitories – 0.1% | ||||
| Maryland Economic Development Corp., Student Housing Rev. (Morgan State University Project), 5%, 7/01/2056 | $ | 50,000 | $ 58,720 | |
| Utilities - Cogeneration – 0.2% | ||||
| Puerto Rico Industrial, Tourist, Educational, Medical & Environmental Control Facilities Financing Authority Rev. (Cogeneration Facilities - AES Puerto Rico Project), 9.12%, 6/01/2022 | $ | 220,000 | $ 225,500 | |
| Utilities - Municipal Owned – 2.8% | ||||
| Guam Power Authority Rev., “A”, AGM, 5%, 10/01/2033 | $ | 315,000 | $ 351,609 | |
| Guam Power Authority Rev., “A”, AGM, 5%, 10/01/2039 | 75,000 | 83,185 | ||
| Guam Power Authority Rev., “A”, AGM, 5%, 10/01/2044 | 85,000 | 93,892 | ||
| Mississippi Development Bank Special Obligation (Municipal Energy Agency Power Supply Project), AGM, 5%, 3/01/2035 | 500,000 | 581,170 | ||
| Puerto Rico Electric Power Authority Rev., “A”, 5%, 7/01/2029 (a)(d) | 240,000 | 217,200 | ||
| Puerto Rico Electric Power Authority Rev., “A”, 5%, 7/01/2042 (a)(d) | 35,000 | 31,675 | ||
| Puerto Rico Electric Power Authority Rev., “AAA”, 5.25%, 7/01/2021 (a)(d) | 20,000 | 18,150 | ||
| Puerto Rico Electric Power Authority Rev., “AAA”, 5.25%, 7/01/2030 (a)(d) | 10,000 | 9,075 | ||
| Puerto Rico Electric Power Authority Rev., “CCC”, 5.25%, 7/01/2027 (a)(d) | 90,000 | 81,675 | ||
| Puerto Rico Electric Power Authority Rev., “DDD”, 5%, 7/01/2020 (a)(d) | 10,000 | 9,025 | ||
| Puerto Rico Electric Power Authority Rev., “DDD”, 5%, 7/01/2021 (a)(d) | 90,000 | 81,450 | ||
| Puerto Rico Electric Power Authority Rev., “DDD”, 5%, 7/01/2022 (a)(d) | 150,000 | 135,750 | ||
| Puerto Rico Electric Power Authority Rev., “DDD”, AGM, 3.625%, 7/01/2023 | 15,000 | 15,027 | ||
| Puerto Rico Electric Power Authority Rev., “DDD”, AGM, 3.65%, 7/01/2024 | 80,000 | 80,147 | ||
| Puerto Rico Electric Power Authority Rev., “EEE”, 6.05%, 7/01/2032 (a)(d) | 50,000 | 44,313 | ||
| Puerto Rico Electric Power Authority Rev., “SS”, AGM, 4.375%, 7/01/2030 | 10,000 | 10,024 | ||
| Puerto Rico Electric Power Authority Rev., “TT”, 5%, 7/01/2021 (a)(d) | 40,000 | 36,200 | ||
| Puerto Rico Electric Power Authority Rev., “TT”, 5%, 7/01/2023 (a)(d) | 40,000 | 36,200 | ||
| Puerto Rico Electric Power Authority Rev., “TT”, 5%, 7/01/2027 (a)(d) | 5,000 | 4,525 | ||
| Puerto Rico Electric Power Authority Rev., “TT”, 5%, 7/01/2037 (a)(d) | 120,000 | 108,600 | ||
| Puerto Rico Electric Power Authority Rev., “UU”, AGM, 5%, 7/01/2024 | 500,000 | 524,028 | ||
| Issuer | Shares/Par | Value ($) | ||
| Utilities - Municipal Owned – continued | ||||
| Puerto Rico Electric Power Authority Rev., “UU”, AGM, 4.25%, 7/01/2027 | $ | 60,000 | $ 60,137 | |
| Puerto Rico Electric Power Authority Rev., “V”, NPFG, 5.25%, 7/01/2033 | 55,000 | 60,944 | ||
| Puerto Rico Electric Power Authority Rev., “VV”, NPFG, 5.25%, 7/01/2030 | 105,000 | 116,319 | ||
| Puerto Rico Electric Power Authority Rev., “VV”, NPFG, 5.25%, 7/01/2034 | 10,000 | 11,064 | ||
| Puerto Rico Electric Power Authority Rev., “WW”, 5.375%, 7/01/2022 (a)(d) | 10,000 | 9,088 | ||
| Puerto Rico Electric Power Authority Rev., “WW”, 5.25%, 7/01/2025 (a)(d) | 15,000 | 13,613 | ||
| Puerto Rico Electric Power Authority Rev., “ZZ”, 5%, 7/01/2018 (a)(d) | 60,000 | 53,475 | ||
| Puerto Rico Electric Power Authority Rev., “ZZ”, 5.25%, 7/01/2023 (a)(d) | 65,000 | 58,987 | ||
| Puerto Rico Electric Power Authority Rev., “ZZ”, 5.25%, 7/01/2024 (a)(d) | 20,000 | 18,150 | ||
| Puerto Rico Electric Power Authority Rev., “ZZ”, 5.25%, 7/01/2026 (a)(d) | 60,000 | 54,450 | ||
| $ 3,009,147 | ||||
| Utilities - Other – 0.3% | ||||
| Tennessee Energy Acquisition Corp., Gas Rev., “A”, 5.25%, 9/01/2021 | $ | 185,000 | $ 188,741 | |
| Tennessee Energy Acquisition Corp., Gas Rev., “A”, 5.25%, 9/01/2022 | 95,000 | 101,471 | ||
| $ 290,212 | ||||
| Water & Sewer Utility Revenue – 9.7% | ||||
| Guam Waterworks Authority Rev. (Water and Wastewater System), 5%, 7/01/2036 | $ | 30,000 | $ 34,179 | |
| Guam Waterworks Authority Rev. (Water and Wastewater System), 5%, 1/01/2046 | 145,000 | 162,484 | ||
| Guam Waterworks Authority Rev. (Water and Wastewater System), “A”, 5%, 7/01/2029 | 30,000 | 33,196 | ||
| Guam Waterworks Authority Rev. (Water and Wastewater System), “A”, 5%, 7/01/2035 | 30,000 | 32,823 | ||
| Guam Waterworks Authority Rev. (Water and Wastewater System), “A”, 5%, 1/01/2050 | 120,000 | 144,224 | ||
| Jackson County, MS, Utility Authority Rev. (Water and Wastewater Treatment System), AGM, 5%, 9/01/2040 | 2,000,000 | 2,236,344 | ||
| Michigan Finance Authority Local Government Loan Program Rev. (Detroit Water and Sewerage Department Sewage Disposal System Rev. Refunding Second Lien Local Project), “C-7”, NPFG, 5%, 7/01/2032 | 25,000 | 28,422 | ||
| Michigan Finance Authority Local Government Loan Program Rev. (Detroit Water and Sewerage Department Water Supply System Rev. Refunding Second Lien Local Project), “D-6”, NPFG, 5%, 7/01/2036 | 30,000 | 33,982 | ||
| Issuer | Shares/Par | Value ($) | ||
| Municipal Bonds – continued | ||||
| Water & Sewer Utility Revenue – continued | ||||
| Michigan Finance Authority Local Government Loan Program Rev. (Detroit Water and Sewerage Department Water Supply System Rev. Refunding Senior Lien Local Project), “D-1”, AGM, 5%, 7/01/2035 | $ | 15,000 | $ 17,032 | |
| Michigan Finance Authority Local Government Loan Program Rev. (Detroit Water and Sewerage Department Water Supply System Rev. Refunding Senior Lien Local Project), “D-1”, AGM, 5%, 7/01/2037 | 35,000 | 39,658 | ||
| Mississippi Development Bank Special Obligation (Jackson Water and Sewer System Rev. Bond Project), AGM, 6.875%, 12/01/2040 | 750,000 | 863,503 | ||
| Mississippi Development Bank Special Obligation (Jackson Water and Sewer System Rev. Bond Project), “A”, AGM, 5%, 9/01/2023 | 1,220,000 | 1,242,429 | ||
| Mississippi Development Bank Special Obligation (Meridian Combined Water and Sewer Rev. Project), BAM, 4%, 7/01/2045 | 1,305,000 | 1,519,466 | ||
| Mississippi Development Bank Special Obligation (Meridian Combined Water and Sewer Rev. Project), BAM, 4%, 7/01/2050 | 1,500,000 | 1,736,642 | ||
| West Rankin, MS, Utility Authority Rev., AGM, 5%, 1/01/2043 | 1,000,000 | 1,217,875 | ||
| Issuer | Shares/Par | Value ($) | ||
| Water & Sewer Utility Revenue – continued | ||||
| West Rankin, MS, Utility Authority Rev., AGM, 5%, 1/01/2048 | $ | 1,000,000 | $ 1,209,659 | |
| $ 10,551,918 | ||||
| Total Municipal Bonds (Identified Cost, $102,074,601) | $108,474,205 | |||
| Bonds – 0.2% | ||||
| Consumer Services – 0.2% | ||||
| Toll Road Investors Partnership II LP, Capital Appreciation, NPFG, 0%, 2/15/2025 (n) | $ | 161,000 | $ 140,603 | |
| Toll Road Investors Partnership II LP, Capital Appreciation, NPFG, 0%, 2/15/2043 (n) | 300,000 | 85,441 | ||
| Total Bonds (Identified Cost, $241,356) | $ 226,044 | |||
| Investment Companies (h) – 0.0% | ||||
| Money Market Funds – 0.0% | ||||
| MFS Institutional Money Market Portfolio, 0.05% (v) (Identified Cost, $38,650) | 38,650 | $ 38,650 | ||
| Other Assets, Less Liabilities – 0.3% | 317,757 | |||
| Net Assets – 100.0% | $109,056,656 | |||
| Issuer | Shares/Par | Value ($) | ||
| Municipal Bonds – 98.7% | ||||
| Airport Revenue – 2.8% | ||||
| Albany County, NY, Airport Authority Rev., “A”, 5%, 12/15/2043 | $ | 1,500,000 | $ 1,791,060 | |
| Dallas and Fort Worth, TX, International Airport Rev., “B”, 5%, 11/01/2044 | 245,000 | 261,707 | ||
| Dallas and Fort Worth, TX, International Airport Rev., “C”, 5%, 11/01/2045 | 170,000 | 174,458 | ||
| New York Transportation Development Corp., Special Facilities Rev. (Terminal 4 John F. Kennedy International Airport Project), “A”, 4%, 12/01/2040 | 1,500,000 | 1,668,499 | ||
| Niagara, NY, Frontier Transportation Authority Rev. (Buffalo-Niagara International Airport), “A”, 5%, 4/01/2028 | 650,000 | 723,310 | ||
| Niagara, NY, Frontier Transportation Authority Rev. (Buffalo-Niagara International Airport), “A”, 5%, 4/01/2029 | 500,000 | 555,612 | ||
| Niagara, NY, Frontier Transportation Authority Rev. (Buffalo-Niagara International Airport), “A”, 5%, 4/01/2035 | 1,000,000 | 1,207,945 | ||
| Niagara, NY, Frontier Transportation Authority Rev. (Buffalo-Niagara International Airport), “A”, 5%, 4/01/2038 | 1,000,000 | 1,197,075 | ||
| Wayne County, MI, Airport Authority Rev. (Detroit Metropolitan Wayne County Airport), “B”, 5%, 12/01/2044 | 90,000 | 103,142 | ||
| Wayne County, MI, Airport Authority Rev. (Detroit Metropolitan Wayne County Airport), “B”, BAM, 5%, 12/01/2039 | 15,000 | 17,190 | ||
| Wayne County, MI, Airport Authority Rev. (Detroit Metropolitan Wayne County Airport), “C”, 5%, 12/01/2039 | 80,000 | 91,062 | ||
| Wayne County, MI, Airport Authority Rev. (Detroit Metropolitan Wayne County Airport), “C”, 5%, 12/01/2044 | 130,000 | 147,976 | ||
| $ 7,939,036 | ||||
| General Obligations - General Purpose – 12.6% | ||||
| Bridgeview, IL, Stadium and Redevelopment Projects, AAC, 5.14%, 12/01/2036 | $ | 615,000 | $ 601,182 | |
| Commonwealth of Puerto Rico, “A”, AGM, 5.375%, 7/01/2025 | 45,000 | 45,785 | ||
| Commonwealth of Puerto Rico, General Obligation, “A”, 8%, 7/01/2035 (a)(d) | 2,935,000 | 2,303,975 | ||
| Commonwealth of Puerto Rico, Public Improvement, “A-4”, AGM, 5%, 7/01/2031 | 165,000 | 170,347 | ||
| Nassau County, NY, General Improvement, “B”, 5%, 4/01/2023 | 1,820,000 | 1,989,496 | ||
| Nassau County, NY, General Improvement, “B”, AGM, 5%, 7/01/2035 | 2,175,000 | 2,696,210 | ||
| Nassau County, NY, General Improvement, “B”, AGM, 5%, 7/01/2037 | 3,000,000 | 3,701,920 | ||
| Issuer | Shares/Par | Value ($) | ||
| General Obligations - General Purpose – continued | ||||
| New York, NY, “B-1”, 5%, 12/01/2041 | $ | 3,000,000 | $ 3,580,830 | |
| New York, NY, “D-1”, 5%, 12/01/2038 | 2,000,000 | 2,469,720 | ||
| New York, NY, “J”, FGIC, 5.5%, 2/15/2026 | 5,000 | 5,020 | ||
| New York, NY, General Obligation, “A”, 3%, 3/15/2035 | 3,000,000 | 3,407,902 | ||
| New York, NY, General Obligation, “F-1”, 5%, 4/01/2043 | 3,000,000 | 3,624,153 | ||
| Oyster Bay, NY, Public Improvement Rev., AGM, 4%, 3/01/2026 | 350,000 | 405,697 | ||
| Oyster Bay, NY, Public Improvement Rev., AGM, 4%, 3/01/2027 | 2,550,000 | 3,014,106 | ||
| Oyster Bay, NY, Public Improvement Rev., AGM, 4%, 3/01/2028 | 850,000 | 1,021,230 | ||
| Poughkeepsie, NY, Dutchess County Public Improvement, 5%, 6/01/2031 | 635,000 | 704,704 | ||
| Puerto Rico Public Buildings Authority Government Facilities Rev., “M-2”, AAC, 10%, 7/01/2035 | 115,000 | 120,854 | ||
| Puerto Rico Public Buildings Authority Rev., Guaranteed, “D”, AAC, 5.45%, 7/01/2030 | 270,000 | 278,128 | ||
| State of Illinois, 5%, 6/01/2021 | 1,705,000 | 1,716,951 | ||
| State of Illinois, General Obligation, 5.5%, 5/01/2039 | 215,000 | 264,510 | ||
| State of Illinois, General Obligation, 5.75%, 5/01/2045 | 200,000 | 248,789 | ||
| State of Illinois, General Obligation, “A”, 5%, 3/01/2028 | 245,000 | 294,915 | ||
| State of Illinois, General Obligation, “A”, 5%, 3/01/2029 | 365,000 | 445,406 | ||
| State of Illinois, General Obligation, “A”, 5%, 3/01/2030 | 335,000 | 413,210 | ||
| State of Illinois, General Obligation, “A”, 5%, 3/01/2031 | 490,000 | 611,101 | ||
| Yonkers, NY, General Obligation, “A”, AGM, 5%, 2/15/2033 | 300,000 | 393,648 | ||
| Yonkers, NY, General Obligation, “A”, AGM, 5%, 2/15/2034 | 300,000 | 391,289 | ||
| Yonkers, NY, School District, “B”, AGM, 5%, 2/15/2033 | 360,000 | 472,377 | ||
| Yonkers, NY, School District, “B”, AGM, 5%, 2/15/2034 | 380,000 | 496,036 | ||
| $ 35,889,491 | ||||
| Healthcare Revenue - Hospitals – 8.1% | ||||
| Broome County, NY, Local Development Corp. Rev. (United Health Services Hospitals, Inc.), AGM, 4%, 4/01/2050 | $ | 2,000,000 | $ 2,223,395 | |
| Buffalo & Erie County, NY, Industrial Land Development Corp. Rev. (Catholic Health System, Inc. Project), 5%, 7/01/2026 | 450,000 | 521,805 | ||
| Issuer | Shares/Par | Value ($) | ||
| Municipal Bonds – continued | ||||
| Healthcare Revenue - Hospitals – continued | ||||
| Buffalo & Erie County, NY, Industrial Land Development Corp. Rev. (Catholic Health System, Inc. Project), 5%, 7/01/2027 | $ | 300,000 | $ 347,266 | |
| Buffalo & Erie County, NY, Industrial Land Development Corp. Rev. (Catholic Health System, Inc. Project), 5%, 7/01/2029 | 590,000 | 676,060 | ||
| Dutchess County, NY, Local Development Corp. Rev. (Health Quest Systems, Inc. Project), 4%, 7/01/2041 | 1,500,000 | 1,620,894 | ||
| Dutchess County, NY, Local Development Corp. Rev. (Health Quest Systems, Inc. Project), “A”, 5%, 7/01/2044 (Prerefunded 7/01/2024) | 1,000,000 | 1,148,224 | ||
| Jefferson County, NY, Civic Development Corp. Rev. (Samaritan Medical Center), “A”, 5%, 11/01/2037 | 2,000,000 | 2,318,241 | ||
| Jefferson Parish, LA, Hospital Service District No. 2 Hospital Rev. (East Jefferson General Hospital), 6.25%, 7/01/2031 (Prerefunded 7/01/2021) | 215,000 | 218,125 | ||
| Jefferson Parish, LA, Hospital Service District No. 2 Hospital Rev. (East Jefferson General Hospital), 6.375%, 7/01/2041 (Prerefunded 7/01/2021) | 245,000 | 248,635 | ||
| Knox County, TN, Health, Educational & Housing Facility Board Rev. (University Health Systems, Inc.), “A”, 5%, 9/01/2030 | 1,250,000 | 1,545,060 | ||
| Miami-Dade County, FL, Health Facilities Authority Hospital Rev., Unrefunded Balance, 6%, 8/01/2030 | 40,000 | 40,158 | ||
| Monroe County, NY, Industrial Development Corp. Rev. (Rochester General Hospital Project), 5%, 12/01/2046 | 2,000,000 | 2,294,906 | ||
| Nassau County, NY, Local Economic Assistance Corp. Rev. (Catholic Health Services of Long Island Obligated Group Project), 5%, 7/01/2032 | 1,000,000 | 1,117,739 | ||
| New Jersey Health Care Facilities, Financing Authority Rev. (University Hospital), “A”, AGM, 5%, 7/01/2046 | 170,000 | 192,038 | ||
| New York Dormitory Authority Rev. (Maimonides Medical Center), FHA, 4%, 8/01/2043 | 1,000,000 | 1,136,162 | ||
| New York Dormitory Authority Rev. (Montefiore Obligated Group), “A”, 4%, 9/01/2045 | 1,500,000 | 1,683,476 | ||
| New York Dormitory Authority Rev., Non-State Supported Debt (Orange Regional Medical Center Obligated Group Rev.), 5%, 12/01/2035 (n) | 800,000 | 916,658 | ||
| Oneida County, NY, Local Development Corp. Rev. (Mohawk Valley Health System Project), “A”, AGM, 4%, 12/01/2037 | 1,000,000 | 1,136,578 | ||
| Issuer | Shares/Par | Value ($) | ||
| Healthcare Revenue - Hospitals – continued | ||||
| Oneida County, NY, Local Development Corp. Rev. (Mohawk Valley Health System Project), “A”, AGM, 4%, 12/01/2038 | $ | 1,000,000 | $ 1,133,284 | |
| Royal Oak, MI, Hospital Finance Authority Rev. (William Beaumont Hospital), 5%, 9/01/2039 | 1,290,000 | 1,438,585 | ||
| Suffolk County, NY, Economic Development Corp. Rev. (Catholic Health Services of Long Island), 5%, 7/01/2028 (Prerefunded 7/01/2021) | 145,000 | 146,650 | ||
| Suffolk County, NY, Economic Development Corp. Rev. (Catholic Health Services of Long Island), 5%, 7/01/2028 | 855,000 | 864,194 | ||
| Westchester County, NY, Health Care Corp. Rev., “B”, “C-2”, 6%, 11/01/2030 | 130,000 | 130,466 | ||
| $ 23,098,599 | ||||
| Healthcare Revenue - Long Term Care – 1.9% | ||||
| Brookhaven, NY, Local Development Corp. Rev. (Active Retirement Community, Inc. d/b/a/ Jefferson's Ferry Project), 5.25%, 11/01/2036 | $ | 1,000,000 | $ 1,143,873 | |
| Brookhaven, NY, Local Development Corp. Rev. (Active Retirement Community, Inc. d/b/a/ Jefferson's Ferry Project), “A”, 4%, 11/01/2045 | 2,000,000 | 2,095,329 | ||
| Buffalo & Erie County, NY, Industrial Land Development Corp. Rev. (Orchard Park CCRC, Inc. Project), 5%, 11/15/2037 | 750,000 | 814,124 | ||
| Tompkins County, NY, Development Corp. Continuing Care Retirement Community Rev. (Kendal at Ithaca, Inc. Project), “A”, 5%, 7/01/2044 | 915,000 | 982,461 | ||
| Ulster County, NY, Capital Resource Corp. Rev. (Woodland Pond at New Paltz Project), 4%, 9/15/2025 | 355,000 | 345,267 | ||
| $ 5,381,054 | ||||
| Industrial Revenue - Airlines – 2.6% | ||||
| New York Transportation Development Corp., Special Facilities Rev. (American Airlines, Inc. John F. Kennedy International Airport Project), 5%, 8/01/2031 | $ | 1,000,000 | $ 1,013,180 | |
| New York Transportation Development Corp., Special Facilities Rev. (American Airlines, Inc. John F. Kennedy International Airport Project), 5.375%, 8/01/2036 | 1,000,000 | 1,199,953 | ||
| New York Transportation Development Corp., Special Facilities Rev. (Delta Airlines, Inc. LaGuardia Airport Terminals C&D Redevelopment Project), 5%, 1/01/2034 | 1,000,000 | 1,189,342 | ||
| New York Transportation Development Corp., Special Facilities Rev. (Delta Airlines, Inc. LaGuardia Airport Terminals C&D Redevelopment Project), 5%, 1/01/2036 | 2,000,000 | 2,367,274 | ||
| Issuer | Shares/Par | Value ($) | ||
| Municipal Bonds – continued | ||||
| Industrial Revenue - Airlines – continued | ||||
| New York Transportation Development Corp., Special Facilities Rev. (Delta Airlines, Inc. LaGuardia Airport Terminals C&D Redevelopment Project), 4.375%, 10/01/2045 | $ | 1,500,000 | $ 1,711,774 | |
| $ 7,481,523 | ||||
| Industrial Revenue - Environmental Services – 0.4% | ||||
| New York Environmental Facilities Corp. Rev., Solid Waste Disposal (Casella Waste Management, Inc. Project), 2.75%, 9/01/2050 (Put Date 9/02/2025) (n) | $ | 1,000,000 | $ 1,029,402 | |
| Industrial Revenue - Other – 0.8% | ||||
| Onandaga County, NY, Industrial Development Agency Sewer Facilities Rev. (Bristol-Meyers Squibb Co. Project), 5.75%, 3/01/2024 | $ | 1,000,000 | $ 1,145,000 | |
| Port Beaumont, TX, Navigation District Facility Rev. (Jefferson Gulf Coast Energy Project), “A”, 3.625%, 1/01/2035 (n) | 200,000 | 204,383 | ||
| Tuscaloosa County, AL, Industrial Development Authority, Gulf Opportunity Zone (Hunt Refining Project), “A”, 4.5%, 5/01/2032 (n) | 365,000 | 405,645 | ||
| Tuscaloosa County, AL, Industrial Development Authority, Gulf Opportunity Zone (Hunt Refining Project), “A”, 5.25%, 5/01/2044 (n) | 495,000 | 562,526 | ||
| $ 2,317,554 | ||||
| Industrial Revenue - Paper – 0.4% | ||||
| Build NYC Resource Corp. Solid Waste Disposal Rev. (Pratt Paper, Inc. Project), 4.5%, 1/01/2025 (n) | $ | 985,000 | $ 1,049,880 | |
| Miscellaneous Revenue - Other – 5.7% | ||||
| Indiana Finance Authority Rev. (Ohio River Bridges East End Crossing Project), “A”, 5%, 7/01/2040 | $ | 205,000 | $ 221,463 | |
| New York City Convention Center Development Corp., Capital Appreciation, “B”, AGM, 0%, 11/15/2043 | 680,000 | 366,909 | ||
| New York Liberty Development Corp., Liberty Rev. (3 World Trade Center Project), “1”, 5%, 11/15/2044 (n) | 1,940,000 | 2,116,945 | ||
| New York Liberty Development Corp., Liberty Rev. (3 World Trade Center Project), “2”, 5.375%, 11/15/2040 (n) | 1,500,000 | 1,669,942 | ||
| New York Liberty Development Corp., Liberty Rev. (4 World Trade Center Project), 5%, 11/15/2044 | 1,000,000 | 1,026,625 | ||
| New York Liberty Development Corp., Liberty Rev. (7 World Trade Center Project), 5%, 9/15/2040 | 1,665,000 | 1,732,163 | ||
| Issuer | Shares/Par | Value ($) | ||
| Miscellaneous Revenue - Other – continued | ||||
| New York, NY, Industrial Development Agency Pilot Refunding Rev., (Queens Stadium Project), “A”, AGM, 5%, 1/01/2029 | $ | 1,250,000 | $ 1,597,250 | |
| New York, NY, Industrial Development Agency Pilot Refunding Rev., (Queens Stadium Project), “A”, AGM, 5%, 1/01/2030 | 1,500,000 | 1,942,454 | ||
| New York, NY, Industrial Development Agency, Airport Facilities Rev. (Transportation Infrastructure Properties LLC), 5%, 7/01/2028 | 3,000,000 | 3,137,050 | ||
| New York, NY, Trust for Cultural Resources Refunding Rev. (Carnegie Hall), 5%, 12/01/2038 | 250,000 | 305,039 | ||
| New York, NY, Trust for Cultural Resources Refunding Rev. (Carnegie Hall), 5%, 12/01/2039 | 250,000 | 304,316 | ||
| Syracuse, NY, Industrial Development Agency PILOT Rev. (Carousel Center Project), “A”, 5%, 1/01/2034 | 750,000 | 751,824 | ||
| Syracuse, NY, Industrial Development Agency PILOT Rev. (Carousel Center Project), “A”, 5%, 1/01/2036 | 1,000,000 | 1,000,341 | ||
| $ 16,172,321 | ||||
| Multi-Family Housing Revenue – 3.1% | ||||
| New York Housing Finance Agency Affordable Housing Rev. (Climate Bond), “B”, 3.7%, 11/01/2038 | $ | 1,450,000 | $ 1,567,845 | |
| New York Housing Finance Agency Affordable Housing Rev. (Climate Bond), “I”, 4%, 11/01/2043 | 1,015,000 | 1,110,857 | ||
| New York, NY, City Housing Development Corp., Multi-Family Housing Rev. (8 Spruce Street), “E”, 3.5%, 2/15/2048 | 106,740 | 108,214 | ||
| New York, NY, City Housing Development Corp., Multi-Family Housing Rev. (8 Spruce Street), “F”, 4.5%, 2/15/2048 | 750,000 | 780,325 | ||
| New York, NY, Housing Development Corp., Multi-Family Housing Rev. (Sustainable Neighborhood Bonds), “A-3-A”, 3.8%, 11/01/2039 | 2,000,000 | 2,164,420 | ||
| New York, NY, Housing Development Corp., Multi-Family Housing Rev. (Sustainable Neighborhood Bonds), “C-1-A”, 3.95%, 11/01/2048 | 2,810,000 | 2,997,831 | ||
| $ 8,729,492 | ||||
| Port Revenue – 4.0% | ||||
| Port Authority of NY & NJ (205th Series), 5%, 11/15/2042 | $ | 2,000,000 | $ 2,428,474 | |
| Port Authority of NY & NJ (211th Series), 4%, 9/01/2043 | 2,000,000 | 2,285,801 | ||
| Port Authority of NY & NJ (220th Series), 5%, 11/01/2044 | 3,000,000 | 3,639,792 | ||
| Port Authority of NY & NJ (221st Series), 4%, 7/15/2045 | 2,000,000 | 2,259,404 | ||
| Issuer | Shares/Par | Value ($) | ||
| Municipal Bonds – continued | ||||
| Port Revenue – continued | ||||
| Port Authority of NY & NJ (226th Series), 5%, 10/15/2032 (w) | $ | 500,000 | $ 644,018 | |
| $ 11,257,489 | ||||
| Sales & Excise Tax Revenue – 3.3% | ||||
| Guam Government Business Privilege Tax Rev., “D”, 5%, 11/15/2031 | $ | 750,000 | $ 843,350 | |
| Illinois Sales Tax Securitization Corp., Second Lien, “A”, 5%, 1/01/2026 | 110,000 | 129,762 | ||
| Illinois Sales Tax Securitization Corp., Second Lien, “A”, 5%, 1/01/2027 | 235,000 | 283,875 | ||
| Illinois Sales Tax Securitization Corp., Second Lien, “A”, 5%, 1/01/2028 | 210,000 | 258,843 | ||
| Illinois Sales Tax Securitization Corp., Second Lien, “A”, 5%, 1/01/2029 | 45,000 | 56,369 | ||
| Illinois Sales Tax Securitization Corp., Second Lien, “A”, 5%, 1/01/2030 | 105,000 | 133,498 | ||
| Illinois Sales Tax Securitization Corp., Second Lien, “A”, 5%, 1/01/2036 | 95,000 | 117,588 | ||
| Illinois Sales Tax Securitization Corp., Second Lien, “A”, 5%, 1/01/2037 | 130,000 | 161,286 | ||
| Illinois Sales Tax Securitization Corp., Second Lien, “A”, 4%, 1/01/2038 | 55,000 | 62,702 | ||
| Illinois Sales Tax Securitization Corp., Second Lien, “A”, 4%, 1/01/2039 | 40,000 | 45,468 | ||
| Illinois Sales Tax Securitization Corp., Second Lien, “A”, 4%, 1/01/2040 | 60,000 | 68,294 | ||
| Puerto Rico Sales Tax Financing Corp., Restructured Sales Tax Rev., “2019A-1”, 4.55%, 7/01/2040 | 63,000 | 68,280 | ||
| Puerto Rico Sales Tax Financing Corp., Restructured Sales Tax Rev., “2019A-1”, 5%, 7/01/2058 | 2,186,000 | 2,407,180 | ||
| Puerto Rico Sales Tax Financing Corp., Restructured Sales Tax Rev., “2019A-2”, 4.329%, 7/01/2040 | 567,000 | 606,531 | ||
| Puerto Rico Sales Tax Financing Corp., Restructured Sales Tax Rev., “2019A-2”, 4.329%, 7/01/2040 | 210,000 | 224,641 | ||
| Puerto Rico Sales Tax Financing Corp., Restructured Sales Tax Rev., “2019A-2”, 4.536%, 7/01/2053 | 4,000 | 4,289 | ||
| Puerto Rico Sales Tax Financing Corp., Restructured Sales Tax Rev., “2019A-2”, 4.784%, 7/01/2058 | 90,000 | 97,389 | ||
| Puerto Rico Sales Tax Financing Corp., Restructured Sales Tax Rev., Capital Appreciation, “2019A-1”, 0%, 7/01/2024 | 8,000 | 7,508 | ||
| Puerto Rico Sales Tax Financing Corp., Restructured Sales Tax Rev., Capital Appreciation, “2019A-1”, 0%, 7/01/2027 | 103,000 | 90,236 | ||
| Puerto Rico Sales Tax Financing Corp., Restructured Sales Tax Rev., Capital Appreciation, “2019A-1”, 0%, 7/01/2029 | 17,000 | 14,001 | ||
| Issuer | Shares/Par | Value ($) | ||
| Sales & Excise Tax Revenue – continued | ||||
| Puerto Rico Sales Tax Financing Corp., Restructured Sales Tax Rev., Capital Appreciation, “2019A-1”, 0%, 7/01/2031 | $ | 942,000 | $ 720,950 | |
| Puerto Rico Sales Tax Financing Corp., Restructured Sales Tax Rev., Capital Appreciation, “2019A-1”, 0%, 7/01/2033 | 904,000 | 641,681 | ||
| Puerto Rico Sales Tax Financing Corp., Restructured Sales Tax Rev., Capital Appreciation, “2019A-1”, 0%, 7/01/2046 | 5,509,000 | 1,681,182 | ||
| Wisconsin Public Finance Authority Limited Obligation Grant Rev. (American Dream at Meadowlands Project), “A”, 6.25%, 8/01/2027 (n) | 440,000 | 478,146 | ||
| Wisconsin Public Finance Authority Limited Obligation Grant Rev. (American Dream at Meadowlands Project), ”A“, 5.625%, 8/01/2024 (n) | 100,000 | 103,866 | ||
| $ 9,306,915 | ||||
| Secondary Schools – 1.5% | ||||
| Buffalo & Erie County, NY, Industrial Land Development Corp. Rev. (Charter School for Applied Technologies Project), “A”, 5%, 6/01/2035 | $ | 1,000,000 | $ 1,100,178 | |
| Build NYC Resource Corp. Rev. (International Leadership Charter School Project), 6%, 7/01/2043 | 750,000 | 775,099 | ||
| Build NYC Resource Corp. Rev. (Packer Collegiate Institute Project), 5%, 6/01/2040 | 675,000 | 747,594 | ||
| Rensselaer County, NY, Industrial Development Agency, Civic Facility Rev. (Emma Willard School Refunding Project), 5%, 1/01/2034 | 450,000 | 499,976 | ||
| Rensselaer County, NY, Industrial Development Agency, Civic Facility Rev. (Emma Willard School Refunding Project), 5%, 1/01/2035 | 500,000 | 554,816 | ||
| Rensselaer County, NY, Industrial Development Agency, Civic Facility Rev. (Emma Willard School Refunding Project), 5%, 1/01/2036 | 645,000 | 714,647 | ||
| $ 4,392,310 | ||||
| Single Family Housing - State – 3.2% | ||||
| Maryland Community Development Administration, Department of Housing & Community Development Housing Rev., “A”, 4.25%, 9/01/2049 | $ | 1,090,000 | $ 1,218,433 | |
| New York Mortgage Agency Homeowner Mortgage Rev., 4%, 10/01/2037 | 2,410,000 | 2,605,995 | ||
| New York Mortgage Agency Rev., “212”, AMT, 3.7%, 10/01/2033 | 2,000,000 | 2,134,545 | ||
| New York Mortgage Agency Rev., “217”, 3.625%, 4/01/2039 | 955,000 | 1,035,858 | ||
| Issuer | Shares/Par | Value ($) | ||
| Municipal Bonds – continued | ||||
| Single Family Housing - State – continued | ||||
| Tennessee Housing Development Agency, Residential Finance Program Rev., “1”, 4.25%, 1/01/2050 | $ | 1,160,000 | $ 1,287,820 | |
| Texas Department of Housing & Community Affairs Residential Mortgage Rev., “A”, FNMA, 4.75%, 1/01/2049 | 735,000 | 826,580 | ||
| $ 9,109,231 | ||||
| State & Local Agencies – 6.1% | ||||
| Delaware Valley, PA, Regional Finance Authority, “C”, FLR, 0.878% (LIBOR - 3mo. + 0.75%), 6/01/2037 | $ | 1,430,000 | $ 1,401,696 | |
| New Jersey Building Authority Rev., Unrefunded Balance, “A”, BAM, 5%, 6/15/2029 | 30,000 | 35,635 | ||
| New Jersey Economic Development Authority Rev. (School Facilities Construction), 5%, 6/15/2032 | 15,000 | 19,008 | ||
| New Jersey Economic Development Authority Rev. (School Facilities Construction), 5%, 6/15/2033 | 10,000 | 12,588 | ||
| New Jersey Economic Development Authority Rev. (School Facilities Construction), 4%, 6/15/2034 | 10,000 | 11,517 | ||
| New Jersey Economic Development Authority Rev. (School Facilities Construction), 4%, 6/15/2035 | 35,000 | 40,192 | ||
| New Jersey Economic Development Authority Rev. (School Facilities Construction), 4%, 6/15/2036 | 30,000 | 34,317 | ||
| New Jersey Economic Development Authority Rev. (School Facilities Construction), 4%, 6/15/2037 | 30,000 | 34,187 | ||
| New Jersey Economic Development Authority Rev. (School Facilities Construction), 4%, 6/15/2038 | 45,000 | 51,119 | ||
| New Jersey Economic Development Authority Rev. (School Facilities Construction), 4%, 6/15/2039 | 35,000 | 39,674 | ||
| New Jersey Economic Development Authority Rev. (School Facilities Construction), 4%, 6/15/2040 | 40,000 | 45,261 | ||
| New Jersey Economic Development Authority Rev. (School Facilities Construction), 4%, 6/15/2041 | 25,000 | 28,202 | ||
| New Jersey Economic Development Authority Rev. (School Facilities Construction), “AAA”, 5%, 6/15/2026 | 265,000 | 318,212 | ||
| New Jersey Economic Development Authority Rev. (School Facilities Construction), “LLL”, 5%, 6/15/2039 | 615,000 | 745,371 | ||
| New York Dormitory Authority Rev., State Personal Income Tax, “A”, 3%, 3/15/2042 | 2,500,000 | 2,616,693 | ||
| Issuer | Shares/Par | Value ($) | ||
| State & Local Agencies – continued | ||||
| New York Dormitory Authority Rev., State Personal Income Tax, “A” (Group C), 5%, 2/15/2037 | $ | 1,000,000 | $ 1,202,569 | |
| New York Dormitory Authority Rev., State Personal Income Tax, “D”, 5%, 2/15/2040 | 830,000 | 861,192 | ||
| New York Urban Development Corp., State Personal Income Tax Rev., “C”, 5%, 3/15/2034 | 2,000,000 | 2,459,001 | ||
| New York, NY, City Transitional Finance Authority Building Aid Rev., “S-2A”, 5%, 7/15/2040 | 2,000,000 | 2,024,554 | ||
| New York, NY, City Transitional Finance Authority Building Aid Rev., “S-3”, 5%, 7/15/2043 | 3,000,000 | 3,659,731 | ||
| New York, NY, Educational Construction Fund Rev., “A”, 5.75%, 4/01/2033 | 1,860,000 | 1,864,985 | ||
| $ 17,505,704 | ||||
| Tax - Other – 8.1% | ||||
| Glen Cove, NY, Local Economic Assistance Corp. (Garvies Point Public Improvement Project), Capital Appreciation, “B”, 0%, 1/01/2045 | $ | 2,000,000 | $ 772,076 | |
| Guam Government Ltd. Obligation Rev., “A”, 5%, 12/01/2035 | 190,000 | 215,499 | ||
| Guam Government Ltd. Obligation Rev., “A”, 5%, 12/01/2036 | 100,000 | 113,149 | ||
| Guam Government Ltd. Obligation Rev., “A”, 5%, 12/01/2046 | 300,000 | 333,933 | ||
| Hudson Yards, NY, Infrastructure Corp. Rev., “A”, 5%, 2/15/2042 | 2,000,000 | 2,343,480 | ||
| Hudson Yards, NY, Infrastructure Corp. Rev., “A”, Unrefunded Balance, 5.75%, 2/15/2047 | 1,120,000 | 1,124,321 | ||
| New York, NY, City Transitional Finance Authority Rev., “A-3”, 4%, 8/01/2043 | 3,000,000 | 3,402,713 | ||
| New York, NY, City Transitional Finance Authority Rev., “B-1”, 5%, 8/01/2038 | 1,175,000 | 1,445,414 | ||
| New York, NY, City Transitional Finance Authority Rev., “B-1”, 4%, 8/01/2042 | 2,000,000 | 2,258,508 | ||
| New York, NY, City Transitional Finance Authority Rev., “D”, 5%, 2/01/2027 | 3,000,000 | 3,013,115 | ||
| New York, NY, City Transitional Finance Authority Rev., “E-1”, 5%, 2/01/2035 | 2,300,000 | 2,780,323 | ||
| New York, NY, City Transitional Finance Authority Rev., “E-1”, 5%, 2/01/2043 | 2,500,000 | 2,981,210 | ||
| Puerto Rico Convention Center District Authority, Hotel Occupancy Tax Rev., “A”, AAC, 5%, 7/01/2031 | 350,000 | 358,107 | ||
| Puerto Rico Infrastructure Financing Authority Special Tax Rev., “C”, AAC, 5.5%, 7/01/2024 | 425,000 | 457,512 | ||
| Puerto Rico Infrastructure Financing Authority Special Tax Rev., “C”, AAC, 5.5%, 7/01/2026 | 1,215,000 | 1,336,219 | ||
| Issuer | Shares/Par | Value ($) | ||
| Municipal Bonds – continued | ||||
| Tax - Other – continued | ||||
| Wisconsin Public Finance Authority Limited Obligation PILOT Rev. (American Dream at Meadowlands Project), 7%, 12/01/2050 | $ | 165,000 | $ 190,535 | |
| $ 23,126,114 | ||||
| Tobacco – 1.8% | ||||
| Buckeye, OH, Tobacco Settlement Financing Authority Rev., “A-3”, 6.25%, 6/01/2037 (Prerefunded 6/01/2022) | $ | 765,000 | $ 818,948 | |
| Buckeye, OH, Tobacco Settlement Financing Authority Senior Asset-Backed Refunding, 2020A-2, “1”, 5%, 6/01/2036 | 180,000 | 225,433 | ||
| Buckeye, OH, Tobacco Settlement Financing Authority Senior Asset-Backed Refunding, 2020B-3, Capital Appreciation, “2”, 0%, 6/01/2057 | 3,650,000 | 551,912 | ||
| Illinois Railsplitter Tobacco Settlement Authority Rev., 6%, 6/01/2028 (Prerefunded 6/01/2021) | 355,000 | 358,251 | ||
| New York Counties Tobacco Trust II, 5.625%, 6/01/2035 | 55,000 | 55,214 | ||
| Suffolk, NY, Tobacco Asset Securitization Corp., Tobacco Settlement, “B”, 5%, 6/01/2032 | 750,000 | 773,026 | ||
| Tobacco Settlement Asset Securitization Corp., NY, “A”, 5%, 6/01/2035 | 1,000,000 | 1,204,477 | ||
| Tobacco Settlement Asset Securitization Corp., NY, “A”, 5%, 6/01/2036 | 1,000,000 | 1,200,522 | ||
| $ 5,187,783 | ||||
| Toll Roads – 3.0% | ||||
| Buffalo & Fort Erie, NY, Public Bridge Authority Toll System Rev., 5%, 1/01/2042 | $ | 1,000,000 | $ 1,167,461 | |
| Buffalo & Fort Erie, NY, Public Bridge Authority Toll System Rev., 5%, 1/01/2047 | 1,000,000 | 1,159,938 | ||
| New York Thruway Authority General Rev., Junior Indebtedness Obligations, “A”, 5.25%, 1/01/2056 | 2,000,000 | 2,347,140 | ||
| Texas Private Activity Surface Transportation Corp., Senior Lien Rev. (NTE Mobility Partners Segments 3 LLC Segments 3A & 3B Facility), 7%, 12/31/2038 | 205,000 | 233,897 | ||
| Texas Private Activity Surface Transportation Corp., Senior Lien Rev. (NTE Mobility Partners Segments 3 LLC Segments 3A & 3B Facility), 6.75%, 6/30/2043 | 170,000 | 192,738 | ||
| Triborough Bridge & Tunnel Authority Rev., NY, “A”, 5%, 1/01/2028 (Prerefunded 1/01/2022) | 1,000,000 | 1,036,334 | ||
| Triborough Bridge & Tunnel Authority Rev., NY, “A”, 4%, 11/15/2054 | 2,000,000 | 2,282,384 | ||
| $ 8,419,892 | ||||
| Issuer | Shares/Par | Value ($) | ||
| Transportation - Special Tax – 5.8% | ||||
| Commonwealth of Puerto Rico Highway & Transportation Authority Rev., “A”, NPFG, 4.75%, 7/01/2038 | $ | 395,000 | $ 399,556 | |
| Commonwealth of Puerto Rico Highway & Transportation Authority Rev., “D”, AGM, 5%, 7/01/2032 | 275,000 | 283,912 | ||
| Commonwealth of Puerto Rico Highway & Transportation Authority Rev., “J”, NPFG, 5%, 7/01/2029 | 25,000 | 25,637 | ||
| Commonwealth of Puerto Rico Highway & Transportation Authority Rev., “L”, AAC, 5.25%, 7/01/2038 | 1,290,000 | 1,452,153 | ||
| Commonwealth of Puerto Rico Highway & Transportation Authority Rev., “N”, AAC, 5.5%, 7/01/2029 | 1,255,000 | 1,393,981 | ||
| Commonwealth of Puerto Rico Highway & Transportation Authority Rev., “N”, NPFG, 5.25%, 7/01/2032 | 150,000 | 166,369 | ||
| Commonwealth of Puerto Rico Highway & Transportation Authority Rev., “N”, NPFG, 5.25%, 7/01/2033 | 105,000 | 116,347 | ||
| Commonwealth of Puerto Rico Highway & Transportation Authority Rev., Unrefunded Balance, “A”, NPFG, 5%, 7/01/2038 | 40,000 | 41,019 | ||
| Metropolitan Transportation Authority Refunding Rev., NY (Climate Bond Certified), “A-2”, AGM, 5%, 11/15/2044 | 3,000,000 | 3,613,628 | ||
| Metropolitan Transportation Authority Refunding Rev., NY (Climate Bond Certified), “C-1”, 4%, 11/15/2037 | 1,000,000 | 1,106,074 | ||
| Metropolitan Transportation Authority Refunding Rev., NY (Climate Bond Certified), “E”, 5%, 11/15/2033 | 2,000,000 | 2,541,876 | ||
| Metropolitan Transportation Authority, NY, Transportation Rev., “A-2”, 0.807%, 11/01/2032 (Put Date 4/01/2026) | 1,500,000 | 1,501,394 | ||
| New Jersey Transportation Trust Fund Authority, “AA”, 5%, 6/15/2045 | 155,000 | 188,161 | ||
| New Jersey Transportation Trust Fund Authority, “AA”, 5%, 6/15/2050 | 105,000 | 126,728 | ||
| New Jersey Transportation Trust Fund Authority, Transportation System, “A”, 5%, 12/15/2039 | 185,000 | 223,984 | ||
| New Jersey Transportation Trust Fund Authority, Transportation System, “BB”, 5%, 6/15/2044 | 185,000 | 220,007 | ||
| New York Transportation Development Corp., Exempt Facility Rev. (State Thruway Service Areas Project), 4%, 4/30/2053 | 2,750,000 | 3,055,473 | ||
| $ 16,456,299 | ||||
| Universities - Colleges – 11.8% | ||||
| Albany, NY, Capital Resource Corp. Rev. (Albany College of Pharmacy Project), “A”, 5%, 12/01/2033 | $ | 125,000 | $ 137,535 | |
| Issuer | Shares/Par | Value ($) | ||
| Municipal Bonds – continued | ||||
| Universities - Colleges – continued | ||||
| Build NYC Resource Corp. Rev. (Albert Einstein School of Medicine, Inc.), 5.5%, 9/01/2045 (n) | $ | 1,080,000 | $ 1,190,143 | |
| Build NYC Resource Corp. Rev. (Manhattan College Project), 5%, 8/01/2047 | 2,000,000 | 2,299,494 | ||
| Dobbs Ferry, NY, Local Development Corp. (Mercy College Project), 5%, 7/01/2039 | 1,000,000 | 1,094,140 | ||
| Dutchess County, NY, Local Development Corp. Rev. (Vassar College Project), 5%, 7/01/2042 | 1,500,000 | 1,804,299 | ||
| Hempstead, NY, Local Development Corp. Rev. (Hofstra University Project), 5%, 7/01/2028 | 1,000,000 | 1,009,258 | ||
| Hempstead, NY, Local Development Corp. Rev. (Hofstra University Project), 5%, 7/01/2047 | 2,000,000 | 2,374,861 | ||
| Hempstead, NY, Local Development Corp. Rev. (Molloy College Project), 5%, 7/01/2036 | 675,000 | 783,657 | ||
| Hempstead, NY, Local Development Corp. Rev. (Molloy College Project), 5%, 7/01/2038 | 480,000 | 554,099 | ||
| Miami-Dade County, FL, Educational Facilities Authority Rev. (University of Miami), “B”, 5.25%, 4/01/2029 | 1,325,000 | 1,702,480 | ||
| Monroe County, NY, Industrial Development Corp. Rev. (University of Rochester Project), “A”, 5%, 7/01/2023 (Prerefunded 7/01/2021) | 500,000 | 505,874 | ||
| Monroe County, NY, Industrial Development Corp. Rev. (University of Rochester Project), “A”, 5%, 7/01/2024 (Prerefunded 7/01/2021) | 1,000,000 | 1,011,749 | ||
| Monroe County, NY, Industrial Development Corp. Rev. (University of Rochester Project), “A”, 5%, 7/01/2030 | 1,000,000 | 1,163,311 | ||
| Monroe County, NY, Industrial Development Corp. Rev. (University of Rochester Project), “A”, 5%, 7/01/2037 | 1,000,000 | 1,202,543 | ||
| Monroe County, NY, Industrial Development Corp. Rev. (University of Rochester Project), “A”, 4%, 7/01/2050 | 2,000,000 | 2,284,848 | ||
| New York Dormitory Authority Rev. (Columbia University), “B”, 5%, 10/01/2038 | 1,000,000 | 1,242,905 | ||
| New York Dormitory Authority Rev. (New York University), “A”, 4%, 7/01/2041 | 1,500,000 | 1,716,966 | ||
| New York Dormitory Authority Rev., Non-State Supported Debt, “A”, 5%, 7/01/2037 (Prerefunded 7/01/2022) | 3,000,000 | 3,181,954 | ||
| New York Dormitory Authority Rev., Non-State Supported Debt, “A”, 5%, 7/01/2039 | 2,000,000 | 2,509,951 | ||
| Oneida County, NY, Local Development Corp. Rev. (Hamilton College Project), 5%, 7/01/2051 | 750,000 | 1,129,082 | ||
| Issuer | Shares/Par | Value ($) | ||
| Universities - Colleges – continued | ||||
| Puerto Rico Industrial, Tourist, Educational, Medical & Environmental Control Facilities Financing Authority, Higher Education Rev. (Ana G. Mendez University System Project), 5.125%, 4/01/2032 | $ | 80,000 | $ 81,060 | |
| Puerto Rico Industrial, Tourist, Educational, Medical & Environmental Control Facilities Financing Authority, Higher Education Rev. (Ana G. Mendez University System Project), 5.375%, 4/01/2042 | 135,000 | 137,025 | ||
| Schenectady County, NY, Capital Resource Corp. Tax-Exempt Rev. (Union College Project), 5%, 1/01/2047 | 2,000,000 | 2,383,172 | ||
| Tompkins County, NY, Development Corp. Continuing Care Retirement Community Rev. (Ithaca College Project), “A”, 5%, 7/01/2041 | 1,000,000 | 1,186,486 | ||
| Troy, NY, Industrial Development Authority, Civic Facility Rev. (Rensselaer Polytechnic Institute), “E”, 5%, 9/01/2031 | 1,000,000 | 1,013,965 | ||
| $ 33,700,857 | ||||
| Universities - Dormitories – 2.4% | ||||
| Amherst, NY, Development Corporation, Student Housing Facility Refunding Rev. (UBF Facility/Student Housing Corp./Greiner and Hadley Projects at SUNY Buffalo), “A”, AGM, 5%, 10/01/2045 | $ | 1,000,000 | $ 1,155,811 | |
| New York Dormitory Authority Rev. (State University Dormitory Facilities), “A”, 5%, 7/01/2037 | 3,000,000 | 3,181,954 | ||
| Onondaga County, NY, Trust for Cultural Resources Rev. (Abby Lane Housing Corp. Project), 5%, 5/01/2040 | 1,000,000 | 1,125,613 | ||
| Westchester County, NY, Local Development Corp. Rev. (Purchase Housing Corp. II Project), 5%, 6/01/2042 | 1,250,000 | 1,381,376 | ||
| $ 6,844,754 | ||||
| Utilities - Cogeneration – 0.2% | ||||
| Puerto Rico Industrial, Tourist, Educational, Medical & Environmental Control Facilities Financing Authority Rev. (Cogeneration Facilities - AES Puerto Rico Project), 9.12%, 6/01/2022 | $ | 645,000 | $ 661,125 | |
| Utilities - Municipal Owned – 2.0% | ||||
| Guam Power Authority Rev., “A”, AGM, 5%, 10/01/2039 | $ | 155,000 | $ 171,916 | |
| Guam Power Authority Rev., “A”, AGM, 5%, 10/01/2044 | 180,000 | 198,831 | ||
| Long Island, NY, Power Authority, Electric System General Rev., 5%, 9/01/2035 | 1,000,000 | 1,225,141 | ||
| Puerto Rico Electric Power Authority Rev., “A”, 5%, 7/01/2029 (a)(d) | 675,000 | 610,875 | ||
| Puerto Rico Electric Power Authority Rev., “A”, 5%, 7/01/2042 (a)(d) | 100,000 | 90,500 | ||
| Issuer | Shares/Par | Value ($) | ||
| Municipal Bonds – continued | ||||
| Utilities - Municipal Owned – continued | ||||
| Puerto Rico Electric Power Authority Rev., “AAA”, 5.25%, 7/01/2021 (a)(d) | $ | 50,000 | $ 45,375 | |
| Puerto Rico Electric Power Authority Rev., “AAA”, 5.25%, 7/01/2030 (a)(d) | 25,000 | 22,688 | ||
| Puerto Rico Electric Power Authority Rev., “CCC”, 5.25%, 7/01/2027 (a)(d) | 250,000 | 226,875 | ||
| Puerto Rico Electric Power Authority Rev., “DDD”, 5%, 7/01/2020 (a)(d) | 25,000 | 22,563 | ||
| Puerto Rico Electric Power Authority Rev., “DDD”, 5%, 7/01/2021 (a)(d) | 265,000 | 239,825 | ||
| Puerto Rico Electric Power Authority Rev., “DDD”, 5%, 7/01/2022 (a)(d) | 430,000 | 389,150 | ||
| Puerto Rico Electric Power Authority Rev., “EEE”, 6.05%, 7/01/2032 (a)(d) | 140,000 | 124,075 | ||
| Puerto Rico Electric Power Authority Rev., “RR”, NPFG, 5%, 7/01/2022 | 885,000 | 897,300 | ||
| Puerto Rico Electric Power Authority Rev., “TT”, 5%, 7/01/2021 (a)(d) | 115,000 | 104,075 | ||
| Puerto Rico Electric Power Authority Rev., “TT”, 5%, 7/01/2023 (a)(d) | 110,000 | 99,550 | ||
| Puerto Rico Electric Power Authority Rev., “TT”, 5%, 7/01/2027 (a)(d) | 20,000 | 18,100 | ||
| Puerto Rico Electric Power Authority Rev., “TT”, 5%, 7/01/2037 (a)(d) | 345,000 | 312,225 | ||
| Puerto Rico Electric Power Authority Rev., “V”, NPFG, 5.25%, 7/01/2033 | 140,000 | 155,129 | ||
| Puerto Rico Electric Power Authority Rev., “VV”, NPFG, 5.25%, 7/01/2034 | 30,000 | 33,193 | ||
| Puerto Rico Electric Power Authority Rev., “WW”, 5.375%, 7/01/2022 (a)(d) | 20,000 | 18,175 | ||
| Puerto Rico Electric Power Authority Rev., “WW”, 5.25%, 7/01/2025 (a)(d) | 50,000 | 45,375 | ||
| Puerto Rico Electric Power Authority Rev., “ZZ”, 5%, 7/01/2018 (a)(d) | 170,000 | 151,512 | ||
| Puerto Rico Electric Power Authority Rev., “ZZ”, 5.25%, 7/01/2023 (a)(d) | 180,000 | 163,350 | ||
| Puerto Rico Electric Power Authority Rev., “ZZ”, 5.25%, 7/01/2024 (a)(d) | 55,000 | 49,912 | ||
| Puerto Rico Electric Power Authority Rev., “ZZ”, 5.25%, 7/01/2026 (a)(d) | 170,000 | 154,275 | ||
| $ 5,569,985 | ||||
| Utilities - Other – 0.6% | ||||
| Public Authority for Colorado Energy Natural Gas Purchase Rev., 6.5%, 11/15/2038 | $ | 1,085,000 | $ 1,665,478 | |
| Water & Sewer Utility Revenue – 6.5% | ||||
| Guam Waterworks Authority Rev. (Water and Wastewater System), 5%, 7/01/2036 | $ | 215,000 | $ 249,609 | |
| Guam Waterworks Authority Rev. (Water and Wastewater System), 5%, 7/01/2037 | 270,000 | 312,680 | ||
| Issuer | Shares/Par | Value ($) | ||
| Water & Sewer Utility Revenue – continued | ||||
| Guam Waterworks Authority Rev. (Water and Wastewater System), 5%, 7/01/2040 | $ | 750,000 | $ 863,476 | |
| Guam Waterworks Authority Rev. (Water and Wastewater System), “A”, 5%, 1/01/2050 | 345,000 | 414,645 | ||
| Mississippi Development Bank Special Obligation (Jackson Water and Sewer System Rev. Bond Project), AGM, 6.875%, 12/01/2040 | 100,000 | 115,134 | ||
| New York Environmental Facilities Corp., Clean Water & Drinking Water Rev. (New York City Municipal Water Finance Authority Project), “B”, 5%, 6/15/2043 | 3,500,000 | 4,320,700 | ||
| New York, NY, Municipal Water Finance Authority, Water & Sewer System Rev., 4%, 6/15/2041 | 3,000,000 | 3,480,005 | ||
| New York, NY, Municipal Water Finance Authority, Water & Sewer System Rev., “BB”, 5%, 6/15/2046 | 1,000,000 | 1,201,391 | ||
| New York, NY, Municipal Water Finance Authority, Water & Sewer System Rev., “DD”, 5%, 6/15/2029 | 1,325,000 | 1,731,894 | ||
| New York, NY, Municipal Water Finance Authority, Water & Sewer System Rev., “DD”, 5%, 6/15/2034 | 2,000,000 | 2,198,480 | ||
| New York, NY, Municipal Water Finance Authority, Water & Sewer System Rev., “DD”, 5%, 6/15/2037 | 3,000,000 | 3,712,026 | ||
| $ 18,600,040 | ||||
| Total Municipal Bonds (Identified Cost, $263,403,760) | $280,892,328 | |||
| Bonds – 0.2% | ||||
| Consumer Services – 0.2% | ||||
| Toll Road Investors Partnership II LP, Capital Appreciation, NPFG, 0%, 2/15/2025 (n) | $ | 415,000 | $ 362,424 | |
| Toll Road Investors Partnership II LP, Capital Appreciation, NPFG, 0%, 2/15/2043 (n) | 1,000,000 | 284,803 | ||
| Total Bonds (Identified Cost, $696,030) | $ 647,227 | |||
| Investment Companies (h) – 0.8% | ||||
| Money Market Funds – 0.8% | ||||
| MFS Institutional Money Market Portfolio, 0.05% (v) (Identified Cost, $2,328,184) | 2,328,184 | $ 2,328,184 | ||
| Other Assets, Less Liabilities – 0.3% | 926,019 | |||
| Net Assets – 100.0% | $284,793,758 | |||
| Issuer | Shares/Par | Value ($) | ||
| Municipal Bonds – 100.3% | ||||
| Airport Revenue – 4.9% | ||||
| Charlotte, NC, Airport Rev. (Charlotte/Douglas International Airport), “A”, 4.75%, 7/01/2028 | $ | 1,250,000 | $ 1,253,967 | |
| Charlotte, NC, Airport Rev. (Charlotte/Douglas International Airport), “A”, 5%, 7/01/2032 | 1,245,000 | 1,408,978 | ||
| Charlotte, NC, Airport Rev. (Charlotte/Douglas International Airport), “A”, 5%, 7/01/2036 | 3,000,000 | 3,033,212 | ||
| Charlotte, NC, Airport Rev. (Charlotte/Douglas International Airport), “A”, 5%, 7/01/2039 | 1,000,000 | 1,247,130 | ||
| Charlotte, NC, Airport Rev. (Charlotte/Douglas International Airport), “B”, 4%, 7/01/2038 | 1,155,000 | 1,296,341 | ||
| Charlotte, NC, Airport Rev. (Charlotte/Douglas International Airport), “B”, 5%, 7/01/2042 | 1,000,000 | 1,172,993 | ||
| Charlotte, NC, Airport Rev. (Charlotte/Douglas International Airport), “B”, 5%, 7/01/2047 | 2,000,000 | 2,329,925 | ||
| Charlotte, NC, Airport Rev. (Charlotte/Douglas International Airport), “B”, 5%, 7/01/2049 | 2,500,000 | 2,996,079 | ||
| Dallas and Fort Worth, TX, International Airport Rev., “B”, 5%, 11/01/2044 | 440,000 | 470,005 | ||
| Dallas and Fort Worth, TX, International Airport Rev., “C”, 5%, 11/01/2045 | 305,000 | 312,998 | ||
| Raleigh-Durham, NC, Airport Authority Refunding Rev., “A”, 5%, 5/01/2034 | 1,150,000 | 1,470,739 | ||
| Raleigh-Durham, NC, Airport Authority Refunding Rev., “A”, 5%, 5/01/2035 | 1,000,000 | 1,275,689 | ||
| Raleigh-Durham, NC, Airport Authority Refunding Rev., “A”, 5%, 5/01/2036 | 1,000,000 | 1,271,148 | ||
| Raleigh-Durham, NC, Airport Authority Rev., “A”, 5%, 5/01/2036 | 2,000,000 | 2,385,087 | ||
| Raleigh-Durham, NC, Airport Authority Rev., “A”, 5%, 5/01/2037 | 2,000,000 | 2,379,030 | ||
| San Francisco, CA, City & County Airports Commission, International Airport Rev., “B”, 5%, 5/01/2046 | 1,445,000 | 1,671,008 | ||
| Wayne County, MI, Airport Authority Rev. (Detroit Metropolitan Wayne County Airport), “B”, 5%, 12/01/2044 | 175,000 | 200,553 | ||
| Wayne County, MI, Airport Authority Rev. (Detroit Metropolitan Wayne County Airport), “B”, BAM, 5%, 12/01/2039 | 195,000 | 223,474 | ||
| Wayne County, MI, Airport Authority Rev. (Detroit Metropolitan Wayne County Airport), “C”, 5%, 12/01/2039 | 150,000 | 170,741 | ||
| Issuer | Shares/Par | Value ($) | ||
| Airport Revenue – continued | ||||
| Wayne County, MI, Airport Authority Rev. (Detroit Metropolitan Wayne County Airport), “C”, 5%, 12/01/2044 | $ | 240,000 | $ 273,186 | |
| $ 26,842,283 | ||||
| General Obligations - General Purpose – 10.1% | ||||
| Bridgeview, IL, Stadium and Redevelopment Projects, AAC, 5.14%, 12/01/2036 | $ | 1,030,000 | $ 1,006,858 | |
| Charlotte, NC, General Obligation, “A”, 5%, 6/01/2026 | 8,000,000 | 9,814,775 | ||
| Chicago, IL, General Obligation, “A”, 5.5%, 1/01/2033 | 315,000 | 353,786 | ||
| Chicago, IL, General Obligation, “A”, 5.5%, 1/01/2035 | 235,000 | 288,945 | ||
| Chicago, IL, General Obligation, “D”, 5.5%, 1/01/2040 | 85,000 | 94,522 | ||
| Chicago, IL, General Obligation, “F”, 5.5%, 1/01/2042 | 665,000 | 737,566 | ||
| Commonwealth of Puerto Rico, General Obligation, “A”, 8%, 7/01/2035 (a)(d) | 5,015,000 | 3,936,775 | ||
| Commonwealth of Puerto Rico, Public Improvement, “A”, AGM, 5%, 7/01/2035 | 675,000 | 697,750 | ||
| Durham County, NC, General Obligation Refunding, 4%, 6/01/2036 | 500,000 | 595,697 | ||
| Durham County, NC, General Obligation Refunding, 4%, 6/01/2037 | 450,000 | 534,351 | ||
| Durham County, NC, General Obligation Refunding, 4%, 6/01/2039 | 650,000 | 767,664 | ||
| Gaston County, NC, Rev., 5%, 4/01/2033 | 675,000 | 853,559 | ||
| Gaston County, NC, Rev., 5%, 4/01/2035 | 610,000 | 766,890 | ||
| Granville County, NC, 5%, 10/01/2034 | 675,000 | 853,394 | ||
| Granville County, NC, 5%, 10/01/2035 | 690,000 | 870,137 | ||
| Lee County, NC, Limited Obligation, 3.25%, 5/01/2035 | 1,000,000 | 1,095,405 | ||
| Lee County, NC, Limited Obligation, 4%, 5/01/2036 | 500,000 | 585,260 | ||
| Lee County, NC, Limited Obligation, 4%, 5/01/2037 | 855,000 | 997,817 | ||
| North Carolina General Obligation Refunding, “A”, 5%, 6/01/2023 | 1,000,000 | 1,103,999 | ||
| North Carolina Public Improvement General Obligation (Connect NC), “A”, 5%, 6/01/2021 | 10,000,000 | 10,076,821 | ||
| North Carolina Public Improvement General Obligation (Connect NC), “A”, 5%, 6/01/2030 | 4,790,000 | 6,435,260 | ||
| North Carolina Public Improvement General Obligation (Connect NC), “B”, 5%, 6/01/2030 | 1,625,000 | 2,124,767 | ||
| Puerto Rico Public Buildings Authority Government Facilities Rev., “M-2”, AAC, 10%, 7/01/2035 | 625,000 | 656,816 | ||
| Issuer | Shares/Par | Value ($) | ||
| Municipal Bonds – continued | ||||
| General Obligations - General Purpose – continued | ||||
| Randolph County, NC, 4%, 10/01/2037 | $ | 1,045,000 | $ 1,228,144 | |
| Randolph County, NC, 4%, 10/01/2038 | 500,000 | 585,951 | ||
| Randolph County, NC, 4%, 10/01/2039 | 500,000 | 584,472 | ||
| State of Illinois, 5%, 6/01/2021 | 2,935,000 | 2,955,573 | ||
| State of Illinois, General Obligation, 5.5%, 5/01/2039 | 375,000 | 461,355 | ||
| State of Illinois, General Obligation, 5.75%, 5/01/2045 | 350,000 | 435,381 | ||
| State of Illinois, General Obligation, “A”, 5%, 3/01/2028 | 465,000 | 559,736 | ||
| State of Illinois, General Obligation, “A”, 5%, 3/01/2029 | 705,000 | 860,305 | ||
| State of Illinois, General Obligation, “A”, 5%, 3/01/2030 | 645,000 | 795,583 | ||
| State of Illinois, General Obligation, “A”, 5%, 3/01/2031 | 935,000 | 1,166,081 | ||
| $ 54,881,395 | ||||
| Healthcare Revenue - Hospitals – 10.6% | ||||
| Allegheny County, PA, Hospital Development Authority Rev. (Allegheny Health Network Obligated Group), “A”, 4%, 4/01/2044 | $ | 555,000 | $ 608,086 | |
| California Statewide Communities Development Authority Rev. (Loma Linda University Medical Center), “B”, 6%, 12/01/2024 | 1,870,000 | 2,087,853 | ||
| Charlotte-Mecklenburg, NC, Hospital Authority Health Care System Rev. (Carolinas Health Care System), “A”, 5%, 1/15/2036 | 3,000,000 | 3,718,332 | ||
| Charlotte-Mecklenburg, NC, Hospital Authority Health Care System Rev. (Carolinas Health Care System), “A”, 5%, 1/15/2040 | 3,000,000 | 3,473,338 | ||
| Chattanooga, TN, Health, Educational & Housing Facility Board Rev. (CommonSpirit Health), “A-1”, 4%, 8/01/2044 | 25,000 | 27,739 | ||
| Chattanooga, TN, Health, Educational & Housing Facility Board Rev. (CommonSpirit Health), “A-2”, 5%, 8/01/2044 | 40,000 | 48,502 | ||
| Chattanooga, TN, Health, Educational & Housing Facility Board Rev. (CommonSpirit Health), “A-2”, 5%, 8/01/2049 | 20,000 | 24,070 | ||
| Colorado Health Facilities Authority Rev. (CommonSpirit Health), “A-2”, 4%, 8/01/2044 | 255,000 | 282,934 | ||
| Jefferson Parish, LA, Hospital Service District No. 2 Hospital Rev. (East Jefferson General Hospital), 6.25%, 7/01/2031 (Prerefunded 7/01/2021) | 360,000 | 365,233 | ||
| Jefferson Parish, LA, Hospital Service District No. 2 Hospital Rev. (East Jefferson General Hospital), 6.375%, 7/01/2041 (Prerefunded 7/01/2021) | 525,000 | 532,788 | ||
| Miami-Dade County, FL, Health Facilities Authority Hospital Rev., Unrefunded Balance, 6%, 8/01/2030 | 85,000 | 85,335 | ||
| Issuer | Shares/Par | Value ($) | ||
| Healthcare Revenue - Hospitals – continued | ||||
| New Hanover County, NC, Hospital Rev. (New Hanover Regional Medical Center), 5%, 10/01/2036 (Prerefunded 10/01/2027) | $ | 1,500,000 | $ 1,886,791 | |
| New Hanover County, NC, Hospital Rev. (New Hanover Regional Medical Center), 5%, 10/01/2047 (Prerefunded 10/01/2027) | 2,425,000 | 3,050,313 | ||
| New Jersey Health Care Facilities, Financing Authority Rev. (University Hospital), “A”, AGM, 5%, 7/01/2046 | 320,000 | 361,484 | ||
| North Carolina Medical Care Commission Hospital Rev. (Caromont Health/Gaston Healthcare), “B”, 5%, 2/01/2051 (Put Date 2/01/2026) | 2,500,000 | 3,014,555 | ||
| North Carolina Medical Care Commission, Health Care Facilities First Mortgage Rev. (Appalachian Regional Healthcare System, Inc.), “A”, 6.375%, 7/01/2026 (Prerefunded 7/01/2021) | 2,000,000 | 2,029,660 | ||
| North Carolina Medical Care Commission, Health Care Facilities First Mortgage Rev. (Appalachian Regional Healthcare System, Inc.), “A”, 6.5%, 7/01/2031 (Prerefunded 7/01/2021) | 1,000,000 | 1,015,110 | ||
| North Carolina Medical Care Commission, Health Care Facilities Rev. (Duke University Health System), “A”, 5%, 6/01/2042 (Prerefunded 6/01/2022) | 2,420,000 | 2,556,618 | ||
| North Carolina Medical Care Commission, Health Care Facilities Rev. (Rex Healthcare), “A”, 5%, 7/01/2032 | 600,000 | 772,803 | ||
| North Carolina Medical Care Commission, Health Care Facilities Rev. (Rex Healthcare), “A”, 5%, 7/01/2033 | 255,000 | 327,099 | ||
| North Carolina Medical Care Commission, Health Care Facilities Rev. (Vidant Health), 5%, 6/01/2031 | 2,800,000 | 3,316,269 | ||
| North Carolina Medical Care Commission, Health Care Facilities Rev. (Vidant Health), 5%, 6/01/2033 | 3,000,000 | 3,553,145 | ||
| North Carolina Medical Care Commission, Health Care Facilities Rev. (Vidant Health), 5%, 6/01/2045 | 2,500,000 | 2,820,755 | ||
| North Carolina Medical Care Commission, Health Care Facilities Rev. (Wake Forest Baptist Obligated Group), “A”, 5%, 12/01/2033 | 1,000,000 | 1,239,729 | ||
| North Carolina Medical Care Commission, Health Care Facilities Rev. (WakeMed), “A”, 5%, 10/01/2031 | 4,355,000 | 4,589,848 | ||
| North Carolina Medical Care Commission, Health Care Facilities Rev. (WakeMed), “A”, 5%, 10/01/2038 | 1,825,000 | 1,923,415 | ||
| Spartanburg County, SC, Regional Health Services District Hospital Rev., “A”, 4%, 4/15/2043 | 1,580,000 | 1,735,290 | ||
| Issuer | Shares/Par | Value ($) | ||
| Municipal Bonds – continued | ||||
| Healthcare Revenue - Hospitals – continued | ||||
| Surry County, NC, Northern Hospital District, Health Care Facilities Rev., 5%, 10/01/2027 | $ | 150,000 | $ 171,742 | |
| Surry County, NC, Northern Hospital District, Health Care Facilities Rev., 5%, 10/01/2035 | 1,515,000 | 1,674,918 | ||
| Surry County, NC, Northern Hospital District, Health Care Facilities Rev., 5%, 10/01/2038 | 1,065,000 | 1,168,894 | ||
| University of North Carolina, Hospitals at Chapel Hill Rev., 4%, 2/01/2037 | 405,000 | 467,169 | ||
| University of North Carolina, Hospitals at Chapel Hill Rev., 4%, 2/01/2038 | 1,040,000 | 1,192,297 | ||
| University of North Carolina, Hospitals at Chapel Hill Rev., 5%, 2/01/2046 | 6,500,000 | 7,551,456 | ||
| $ 57,673,570 | ||||
| Healthcare Revenue - Long Term Care – 5.5% | ||||
| North Carolina Medical Care Commission, Health Care Facilities First Mortgage Rev. (Deerfield Episcopal Retirement Community), 5%, 11/01/2037 | $ | 2,750,000 | $ 3,170,267 | |
| North Carolina Medical Care Commission, Health Care Facilities First Mortgage Rev. (Pennybyrn at Maryfield), 5%, 10/01/2035 | 1,500,000 | 1,582,876 | ||
| North Carolina Medical Care Commission, Health Care Facilities First Mortgage Rev. (Presbyterian Homes Obligated Group), 5%, 10/01/2031 | 1,000,000 | 1,132,375 | ||
| North Carolina Medical Care Commission, Health Care Facilities First Mortgage Rev. (Presbyterian Homes Obligated Group), 5%, 10/01/2036 | 800,000 | 895,705 | ||
| North Carolina Medical Care Commission, Health Care Facilities First Mortgage Rev. (Presbyterian Homes Obligated Group), “A”, 5%, 10/01/2050 | 2,000,000 | 2,355,476 | ||
| North Carolina Medical Care Commission, Retirement Facilities First Mortgage Rev. (Aldersgate), 5%, 7/01/2045 | 1,000,000 | 1,014,407 | ||
| North Carolina Medical Care Commission, Retirement Facilities First Mortgage Rev. (Aldersgate), “A”, 5%, 7/01/2047 | 1,000,000 | 1,018,695 | ||
| North Carolina Medical Care Commission, Retirement Facilities First Mortgage Rev. (Carolina Village Project), “B”, 5%, 4/01/2047 | 2,000,000 | 2,005,115 | ||
| North Carolina Medical Care Commission, Retirement Facilities First Mortgage Rev. (Friends Homes, Inc.), “A”, 4%, 9/01/2040 | 2,000,000 | 2,130,132 | ||
| North Carolina Medical Care Commission, Retirement Facilities First Mortgage Rev. (Galloway Ridge), “A”, 5%, 1/01/2039 | 1,225,000 | 1,363,464 | ||
| North Carolina Medical Care Commission, Retirement Facilities First Mortgage Rev. (Pennybyrn at Maryfield Project), “A”, 5%, 10/01/2050 | 1,500,000 | 1,639,721 | ||
| Issuer | Shares/Par | Value ($) | ||
| Healthcare Revenue - Long Term Care – continued | ||||
| North Carolina Medical Care Commission, Retirement Facilities First Mortgage Rev. (Salemtowne Project), 5.25%, 10/01/2037 | $ | 1,500,000 | $ 1,604,948 | |
| North Carolina Medical Care Commission, Retirement Facilities First Mortgage Rev. (Sharon Towers), “A”, 5%, 7/01/2049 | 2,000,000 | 2,199,504 | ||
| North Carolina Medical Care Commission, Retirement Facilities First Mortgage Rev. (Southminster), 5%, 10/01/2031 | 800,000 | 861,776 | ||
| North Carolina Medical Care Commission, Retirement Facilities First Mortgage Rev. (Southminster), 5%, 10/01/2037 | 2,200,000 | 2,341,224 | ||
| North Carolina Medical Care Commission, Retirement Facilities First Mortgage Rev. (United Church Homes and Services), “A”, 5%, 9/01/2037 | 1,500,000 | 1,541,486 | ||
| North Carolina Medical Care Commission, Retirement Facilities First Mortgage Rev. (United Methodist Retirement Homes), “A”, 5%, 10/01/2033 | 1,590,000 | 1,684,151 | ||
| North Carolina Medical Care Commission, Retirement Facilities First Mortgage Rev. (United Methodist Retirement Homes), “A”, 5%, 10/01/2035 | 1,000,000 | 1,120,395 | ||
| $ 29,661,717 | ||||
| Human Services – 0.2% | ||||
| North Carolina Capital Facilities Finance Agency Rev. (Arc of North Carolina Projects), “A”, 5%, 10/01/2034 | $ | 1,000,000 | $ 1,153,419 | |
| Industrial Revenue - Other – 0.4% | ||||
| Port Beaumont, TX, Navigation District Facility Rev. (Jefferson Gulf Coast Energy Project), “A”, 3.625%, 1/01/2035 (n) | $ | 600,000 | $ 613,150 | |
| Tuscaloosa County, AL, Industrial Development Authority, Gulf Opportunity Zone (Hunt Refining Project), “A”, 4.5%, 5/01/2032 (n) | 615,000 | 683,484 | ||
| Tuscaloosa County, AL, Industrial Development Authority, Gulf Opportunity Zone (Hunt Refining Project), “A”, 5.25%, 5/01/2044 (n) | 830,000 | 943,225 | ||
| $ 2,239,859 | ||||
| Miscellaneous Revenue - Other – 0.9% | ||||
| Durham County, NC, Industrial Facilities & Pollution Control Financing Authority Rev. (Research Triangle Institute), 5%, 2/01/2025 | $ | 1,000,000 | $ 1,163,445 | |
| Indiana Finance Authority Rev. (Ohio River Bridges East End Crossing Project), “A”, 5%, 7/01/2040 | 420,000 | 453,730 | ||
| New York Liberty Development Corp., Liberty Rev. (7 World Trade Center Project), 5%, 9/15/2040 | 3,145,000 | 3,271,863 | ||
| Issuer | Shares/Par | Value ($) | ||
| Municipal Bonds – continued | ||||
| Miscellaneous Revenue - Other – continued | ||||
| Summit County, OH, Port Authority Building Rev. (Flats East Development Recovery Zone Facility Bonds), 6.875%, 5/15/2040 | $ | 85,000 | $ 85,260 | |
| $ 4,974,298 | ||||
| Multi-Family Housing Revenue – 0.0% | ||||
| Mecklenburg County, NC (Little Rock Apartments), FNMA, 5.15%, 1/01/2022 | $ | 135,000 | $ 136,118 | |
| Sales & Excise Tax Revenue – 2.6% | ||||
| Guam Government Business Privilege Tax Rev., “A”, 5.25%, 1/01/2036 | $ | 1,140,000 | $ 1,176,352 | |
| Guam Government Business Privilege Tax Rev., “D”, 5%, 11/15/2031 | 1,295,000 | 1,456,185 | ||
| Illinois Sales Tax Securitization Corp., Second Lien, “A”, 5%, 1/01/2026 | 185,000 | 218,236 | ||
| Illinois Sales Tax Securitization Corp., Second Lien, “A”, 5%, 1/01/2027 | 400,000 | 483,191 | ||
| Illinois Sales Tax Securitization Corp., Second Lien, “A”, 5%, 1/01/2028 | 375,000 | 462,219 | ||
| Illinois Sales Tax Securitization Corp., Second Lien, “A”, 5%, 1/01/2029 | 75,000 | 93,948 | ||
| Illinois Sales Tax Securitization Corp., Second Lien, “A”, 5%, 1/01/2030 | 175,000 | 222,496 | ||
| Illinois Sales Tax Securitization Corp., Second Lien, “A”, 5%, 1/01/2036 | 165,000 | 204,232 | ||
| Illinois Sales Tax Securitization Corp., Second Lien, “A”, 5%, 1/01/2037 | 220,000 | 272,945 | ||
| Illinois Sales Tax Securitization Corp., Second Lien, “A”, 4%, 1/01/2038 | 100,000 | 114,004 | ||
| Illinois Sales Tax Securitization Corp., Second Lien, “A”, 4%, 1/01/2039 | 65,000 | 73,886 | ||
| Illinois Sales Tax Securitization Corp., Second Lien, “A”, 4%, 1/01/2040 | 105,000 | 119,514 | ||
| Puerto Rico Sales Tax Financing Corp., Restructured Sales Tax Rev., “2019A-1”, 4.55%, 7/01/2040 | 105,000 | 113,799 | ||
| Puerto Rico Sales Tax Financing Corp., Restructured Sales Tax Rev., “2019A-1”, 5%, 7/01/2058 | 1,056,000 | 1,162,846 | ||
| Puerto Rico Sales Tax Financing Corp., Restructured Sales Tax Rev., “2019A-2”, 4.329%, 7/01/2040 | 957,000 | 1,023,722 | ||
| Puerto Rico Sales Tax Financing Corp., Restructured Sales Tax Rev., “2019A-2”, 4.329%, 7/01/2040 | 348,000 | 372,263 | ||
| Puerto Rico Sales Tax Financing Corp., Restructured Sales Tax Rev., “2019A-2”, 4.536%, 7/01/2053 | 9,000 | 9,650 | ||
| Puerto Rico Sales Tax Financing Corp., Restructured Sales Tax Rev., “2019A-2”, 4.784%, 7/01/2058 | 154,000 | 166,644 | ||
| Puerto Rico Sales Tax Financing Corp., Restructured Sales Tax Rev., Capital Appreciation, “2019A-1”, 0%, 7/01/2024 | 16,000 | 15,017 | ||
| Issuer | Shares/Par | Value ($) | ||
| Sales & Excise Tax Revenue – continued | ||||
| Puerto Rico Sales Tax Financing Corp., Restructured Sales Tax Rev., Capital Appreciation, “2019A-1”, 0%, 7/01/2027 | $ | 174,000 | $ 152,438 | |
| Puerto Rico Sales Tax Financing Corp., Restructured Sales Tax Rev., Capital Appreciation, “2019A-1”, 0%, 7/01/2029 | 31,000 | 25,531 | ||
| Puerto Rico Sales Tax Financing Corp., Restructured Sales Tax Rev., Capital Appreciation, “2019A-1”, 0%, 7/01/2031 | 1,584,000 | 1,212,299 | ||
| Puerto Rico Sales Tax Financing Corp., Restructured Sales Tax Rev., Capital Appreciation, “2019A-1”, 0%, 7/01/2033 | 1,515,000 | 1,075,383 | ||
| Puerto Rico Sales Tax Financing Corp., Restructured Sales Tax Rev., Capital Appreciation, “2019A-1”, 0%, 7/01/2046 | 9,954,000 | 3,037,662 | ||
| Wisconsin Public Finance Authority Limited Obligation Grant Rev. (American Dream at Meadowlands Project), “A”, 6.25%, 8/01/2027 (n) | 670,000 | 728,086 | ||
| Wisconsin Public Finance Authority Limited Obligation Grant Rev. (American Dream at Meadowlands Project), ”A“, 5.625%, 8/01/2024 (n) | 185,000 | 192,153 | ||
| $ 14,184,701 | ||||
| Secondary Schools – 0.1% | ||||
| District of Columbia Rev. (Rocketship D.C.), “A”, 5%, 6/01/2056 (n) | $ | 430,000 | $ 471,406 | |
| Single Family Housing - Local – 0.5% | ||||
| Montgomery County, MD, Housing Opportunities Commission Program Rev., “A”, 4%, 7/01/2049 | $ | 2,325,000 | $ 2,597,295 | |
| Single Family Housing - State – 3.8% | ||||
| Connecticut Housing Finance Authority Rev. (Housing Mortgage Finance Program), “C-1”, 4%, 11/15/2047 | $ | 1,460,000 | $ 1,576,193 | |
| Maryland Community Development Administration, Department of Housing & Community Development Housing Rev., “A”, 4.25%, 9/01/2049 | 1,940,000 | 2,168,587 | ||
| North Carolina Housing Finance Agency, Home Ownership Refunding Rev., “45”, GNMA, 3%, 7/01/2051 | 2,885,000 | 3,148,406 | ||
| North Carolina Housing Finance Agency, Home Ownership Rev., “41”, FNMA, 3.55%, 7/01/2044 | 1,925,000 | 2,039,867 | ||
| North Carolina Housing Finance Agency, Home Ownership Rev., “43”, GNMA, 2.95%, 7/01/2043 | 3,500,000 | 3,656,590 | ||
| North Carolina Housing Finance Agency, Home Ownership Rev., “44”, 4%, 7/01/2050 | 5,000,000 | 5,628,064 | ||
| Pennsylvania Housing Finance Agency, Single Family Mortgage Rev., “125A”, 3.7%, 10/01/2037 | 2,055,000 | 2,207,048 | ||
| $ 20,424,755 | ||||
| Issuer | Shares/Par | Value ($) | ||
| Municipal Bonds – continued | ||||
| State & Local Agencies – 19.7% | ||||
| Asheville, NC, Limited Obligation, 5%, 4/01/2028 (Prerefunded 4/01/2022) | $ | 400,000 | $ 419,368 | |
| Buncombe County, NC, Limited Obligation, 4%, 6/01/2034 | 1,700,000 | 1,996,618 | ||
| Buncombe County, NC, Limited Obligation, 4%, 6/01/2035 | 1,465,000 | 1,716,861 | ||
| Buncombe County, NC, Limited Obligation, “A”, 5%, 6/01/2027 | 125,000 | 156,751 | ||
| Buncombe County, NC, Limited Obligation, “A”, 5%, 6/01/2028 | 200,000 | 256,714 | ||
| Buncombe County, NC, Limited Obligation, “A”, 5%, 6/01/2029 | 275,000 | 358,945 | ||
| Buncombe County, NC, Limited Obligation, “A”, 5%, 6/01/2030 | 250,000 | 332,276 | ||
| Cabarrus County, NC, Limited Obligation, 4%, 6/01/2034 | 1,000,000 | 1,154,337 | ||
| Charlotte, NC, Convention Facility Projects, COP, “A”, 4%, 6/01/2037 | 1,320,000 | 1,562,988 | ||
| Charlotte, NC, Convention Facility Projects, COP, “A”, 4%, 6/01/2049 | 2,500,000 | 2,865,075 | ||
| Charlotte, NC, COP, 5%, 12/01/2034 | 1,000,000 | 1,261,113 | ||
| Charlotte, NC, COP, 5%, 12/01/2035 | 2,000,000 | 2,515,275 | ||
| Charlotte, NC, Cultural Arts Facilities, COP, “B”, 4%, 6/01/2038 | 2,015,000 | 2,367,611 | ||
| Charlotte, NC, Cultural Arts Facilities, COP, “B”, 4%, 6/01/2039 | 1,250,000 | 1,459,640 | ||
| Charlotte, NC, NASCAR Hall of Fame Public Facilities, COP, “C”, 4%, 6/01/2038 | 4,500,000 | 5,287,469 | ||
| Charlotte, NC, NASCAR Hall of Fame Public Facilities, COP, “C”, 3%, 6/01/2039 | 3,000,000 | 3,264,466 | ||
| Charlotte, NC, Transit Projects, COP, 5%, 6/01/2033 | 3,000,000 | 3,010,107 | ||
| Charlotte, NC, Transit Projects/Phase II, COP, “B”, 5%, 6/01/2026 | 1,250,000 | 1,475,770 | ||
| Chatham County, NC, Limited Obligation, 4%, 11/01/2037 | 1,750,000 | 2,048,277 | ||
| Commonwealth of Pennsylvania, Tobacco Master Settlement Financing Authority Rev., 5%, 6/01/2032 | 115,000 | 141,507 | ||
| Commonwealth of Pennsylvania, Tobacco Master Settlement Financing Authority Rev., 5%, 6/01/2033 | 100,000 | 122,473 | ||
| Commonwealth of Pennsylvania, Tobacco Master Settlement Financing Authority Rev., 5%, 6/01/2034 | 45,000 | 54,910 | ||
| Dare County, NC, Limited Obligation, “A”, 4%, 6/01/2025 | 175,000 | 200,061 | ||
| Dare County, NC, Limited Obligation, “A”, 4%, 6/01/2026 | 275,000 | 322,193 | ||
| Dare County, NC, Limited Obligation, “A”, 4%, 6/01/2027 | 300,000 | 358,599 | ||
| Dare County, NC, Limited Obligation, “A”, 4%, 6/01/2028 | 300,000 | 364,558 | ||
| Dare County, NC, Limited Obligation, “A”, 4%, 6/01/2029 | 200,000 | 246,531 | ||
| Issuer | Shares/Par | Value ($) | ||
| State & Local Agencies – continued | ||||
| Dare County, NC, Limited Obligation, “A”, 4%, 6/01/2030 | $ | 200,000 | $ 249,507 | |
| Dare County, NC, Limited Obligation, “A”, 4%, 6/01/2031 | 275,000 | 341,197 | ||
| Delaware Valley, PA, Regional Finance Authority, “C”, FLR, 0.878% (LIBOR - 3mo. + 0.75%), 6/01/2037 | 2,310,000 | 2,264,278 | ||
| Durham County, NC, Financing Corp. Limited Obligation, 4%, 10/01/2034 | 2,000,000 | 2,362,739 | ||
| Durham County, NC, Financing Corp. Limited Obligation, 4%, 10/01/2035 | 1,240,000 | 1,461,087 | ||
| Durham County, NC, Financing Corp. Limited Obligation, 4%, 10/01/2036 | 1,375,000 | 1,615,072 | ||
| Durham County, NC, Limited Obligation, 4%, 4/01/2035 | 1,270,000 | 1,484,244 | ||
| Durham County, NC, Limited Obligation, 4%, 4/01/2037 | 3,000,000 | 3,478,959 | ||
| Harnett County, NC, Limited Obligation Refunding, 5%, 12/01/2026 | 750,000 | 927,371 | ||
| Harnett County, NC, Limited Obligation Refunding, 5%, 12/01/2027 | 910,000 | 1,149,607 | ||
| Harnett County, NC, Limited Obligation Refunding, 4%, 12/01/2028 | 250,000 | 303,392 | ||
| Henderson County, NC, Limited Obligation, 4%, 6/01/2024 | 290,000 | 323,142 | ||
| Henderson County, NC, Limited Obligation, 4%, 6/01/2026 | 150,000 | 175,908 | ||
| Henderson County, NC, Limited Obligation, 4%, 6/01/2027 | 425,000 | 509,147 | ||
| Henderson County, NC, Limited Obligation, 4%, 6/01/2029 | 300,000 | 370,325 | ||
| Henderson County, NC, Limited Obligation, 4%, 6/01/2031 | 320,000 | 404,937 | ||
| Johnston County, NC, Finance Corp. Limited Obligation, “A”, 5%, 4/01/2033 | 550,000 | 719,542 | ||
| Johnston County, NC, Finance Corp. Limited Obligation, “A”, 4%, 4/01/2034 | 500,000 | 607,051 | ||
| Johnston County, NC, Finance Corp. Limited Obligation, “A”, 4%, 4/01/2036 | 800,000 | 960,162 | ||
| Johnston County, NC, Finance Corp. Limited Obligation, “A”, 4%, 4/01/2037 | 500,000 | 597,864 | ||
| Maryland Stadium Authority Rev., Baltimore City Public Schools Construction and Revitalization Program, “A”, 5%, 5/01/2047 (Prerefunded 5/01/2028) | 520,000 | 664,532 | ||
| Maryland Stadium Authority Rev., Baltimore City Public Schools Construction and Revitalization Program, “A”, 5%, 5/01/2047 | 1,010,000 | 1,201,018 | ||
| Mooresville, NC, Limited Obligation, “A”, 4%, 10/01/2026 | 300,000 | 354,034 | ||
| Mooresville, NC, Limited Obligation, “A”, 4%, 10/01/2027 | 350,000 | 420,900 | ||
| Mooresville, NC, Limited Obligation, “A”, 4%, 10/01/2028 | 300,000 | 366,400 | ||
| Mooresville, NC, Limited Obligation, “A”, 4%, 10/01/2029 | 280,000 | 346,640 | ||
| Issuer | Shares/Par | Value ($) | ||
| Municipal Bonds – continued | ||||
| State & Local Agencies – continued | ||||
| Mooresville, NC, Limited Obligation, “A”, 4%, 10/01/2030 | $ | 200,000 | $ 250,724 | |
| Mooresville, NC, Limited Obligation, “A”, 4%, 10/01/2031 | 140,000 | 174,593 | ||
| Mooresville, NC, Limited Obligation, “A”, 4%, 10/01/2032 | 125,000 | 154,797 | ||
| Mooresville, NC, Limited Obligation, “A”, 4%, 10/01/2033 | 150,000 | 184,929 | ||
| Mooresville, NC, Limited Obligation, “A”, 4%, 10/01/2034 | 130,000 | 159,072 | ||
| Mooresville, NC, Limited Obligation, “A”, 3%, 10/01/2036 | 350,000 | 389,908 | ||
| New Jersey Economic Development Authority Rev. (School Facilities Construction), “AAA”, 5%, 6/15/2026 | 465,000 | 558,373 | ||
| New Jersey Economic Development Authority Rev. (School Facilities Construction), “LLL”, 5%, 6/15/2039 | 1,030,000 | 1,248,345 | ||
| North Carolina Capital Improvement General Obligation, “C”, 5%, 5/01/2029 (Prerefunded 5/01/2021) | 10,000,000 | 10,035,445 | ||
| North Carolina Limited Obligation (Build, Inc.), “A”, 5%, 5/01/2029 | 1,625,000 | 2,127,956 | ||
| North Carolina Turnpike Authority Refunding Rev., (Monroe Expressway System), 5%, 7/01/2038 (w) | 1,250,000 | 1,640,576 | ||
| North Carolina Turnpike Authority Refunding Rev., (Monroe Expressway System), 5%, 7/01/2041 (w) | 1,795,000 | 2,332,640 | ||
| North Carolina Turnpike Authority, Monroe Connector System State Appropriation Rev., 5%, 7/01/2036 | 3,000,000 | 3,034,805 | ||
| North Carolina Turnpike Authority, State Appropriation Refunding Rev. (Monroe Expressway System), 5%, 7/01/2031 (w) | 835,000 | 1,130,326 | ||
| North Carolina Turnpike Authority, Triangle Expressway System Appropriation Refunding Rev., “A”, 4%, 1/01/2034 | 2,555,000 | 2,979,392 | ||
| North Carolina Turnpike Authority, Triangle Expressway System Appropriation Rev., Capital Appreciation, 0%, 1/01/2043 | 3,500,000 | 1,881,432 | ||
| Orange County, NC, Public Facilities Co., Limited Obligation, 5%, 10/01/2024 (Prerefunded 10/01/2021) | 750,000 | 767,995 | ||
| Pennsylvania Public School Building Authority, School Lease Rev. (School District of Philadelphia Project), “A”, AGM, 5%, 6/01/2033 | 2,530,000 | 3,062,697 | ||
| Pitt County, NC, Limited Obligation, “B”, 5%, 4/01/2022 (w) | 245,000 | 256,687 | ||
| Pitt County, NC, Limited Obligation, “B”, 5%, 4/01/2023 (w) | 225,000 | 246,332 | ||
| Pitt County, NC, Limited Obligation, “B”, 5%, 4/01/2025 (w) | 425,000 | 500,505 | ||
| Issuer | Shares/Par | Value ($) | ||
| State & Local Agencies – continued | ||||
| Pitt County, NC, Limited Obligation, “B”, 5%, 4/01/2027 (w) | $ | 400,000 | $ 500,036 | |
| Pitt County, NC, Limited Obligation, “B”, 5%, 4/01/2029 (w) | 300,000 | 391,674 | ||
| Pitt County, NC, Limited Obligation, “B”, 5%, 4/01/2031 (w) | 245,000 | 330,899 | ||
| Scotland County, NC, Limited Obligation, 5%, 12/01/2033 | 210,000 | 256,961 | ||
| Scotland County, NC, Limited Obligation, 5%, 12/01/2034 | 1,000,000 | 1,220,501 | ||
| Wake County, NC, Limited Obligation, 5%, 3/01/2025 | 1,045,000 | 1,229,564 | ||
| Wake County, NC, Limited Obligation, 5%, 3/01/2026 | 1,000,000 | 1,214,827 | ||
| Wake County, NC, Limited Obligation, 5%, 3/01/2027 | 4,240,000 | 5,297,102 | ||
| Wake County, NC, Limited Obligation, “A”, 5%, 8/01/2027 | 920,000 | 1,161,680 | ||
| Wake County, NC, Limited Obligation, “A”, 4%, 8/01/2037 | 3,000,000 | 3,515,665 | ||
| $ 107,215,986 | ||||
| Student Loan Revenue – 1.0% | ||||
| North Carolina Education Assistance Authority, Tax-Exempt Student Loan Rev., “A”, 5%, 6/01/2027 | $ | 550,000 | $ 655,029 | |
| North Carolina Education Assistance Authority, Tax-Exempt Student Loan Rev., “A”, 5%, 6/01/2028 | 1,000,000 | 1,206,527 | ||
| North Carolina Education Assistance Authority, Tax-Exempt Student Loan Rev., “A”, 5%, 6/01/2029 | 700,000 | 852,603 | ||
| North Carolina Education Assistance Authority, Tax-Exempt Student Loan Rev., “A”, 3.125%, 6/01/2039 | 2,750,000 | 2,752,969 | ||
| $ 5,467,128 | ||||
| Tax - Other – 0.7% | ||||
| Illinois Sports Facilities Authority, State Tax Supported Refunding Rev., BAM, 5%, 6/15/2029 | $ | 290,000 | $ 366,331 | |
| Puerto Rico Convention Center District Authority, Hotel Occupancy Tax Rev., “A”, AAC, 5%, 7/01/2031 | 2,415,000 | 2,470,937 | ||
| Puerto Rico Infrastructure Financing Authority Special Tax Rev., “C”, AAC, 5.5%, 7/01/2024 | 760,000 | 818,139 | ||
| Wisconsin Public Finance Authority Limited Obligation PILOT Rev. (American Dream at Meadowlands Project), 7%, 12/01/2050 | 305,000 | 352,202 | ||
| $ 4,007,609 | ||||
| Tax Assessment – 0.2% | ||||
| Mooresville, NC, Special Assessment Rev., 5.375%, 3/01/2040 (n) | $ | 1,000,000 | $ 1,026,957 | |
| Issuer | Shares/Par | Value ($) | ||
| Municipal Bonds – continued | ||||
| Tobacco – 0.9% | ||||
| Buckeye, OH, Tobacco Settlement Financing Authority Rev., “A-3”, 6.25%, 6/01/2037 (Prerefunded 6/01/2022) | $ | 1,295,000 | $ 1,386,324 | |
| Buckeye, OH, Tobacco Settlement Financing Authority Senior Asset-Backed Refunding, 2020A-2, “1”, 5%, 6/01/2036 | 325,000 | 407,032 | ||
| Buckeye, OH, Tobacco Settlement Financing Authority Senior Asset-Backed Refunding, 2020B-3, Capital Appreciation, “2”, 0%, 6/01/2057 | 6,270,000 | 948,079 | ||
| Illinois Railsplitter Tobacco Settlement Authority Rev., 6%, 6/01/2028 (Prerefunded 6/01/2021) | 1,975,000 | 1,993,085 | ||
| $ 4,734,520 | ||||
| Toll Roads – 6.5% | ||||
| North Carolina Turnpike Authority, Monroe Expressway Toll Rev., “A”, 5%, 7/01/2047 | $ | 2,000,000 | $ 2,253,540 | |
| North Carolina Turnpike Authority, State Appropriation Refunding Rev. (Monroe Expressway System), 5%, 7/01/2027 (w) | 1,930,000 | 2,418,351 | ||
| North Carolina Turnpike Authority, State Appropriation Refunding Rev. (Monroe Expressway System), 5%, 7/01/2028 (w) | 1,000,000 | 1,280,932 | ||
| North Carolina Turnpike Authority, State Appropriation Refunding Rev. (Monroe Expressway System), 5%, 7/01/2029 (w) | 1,230,000 | 1,604,465 | ||
| North Carolina Turnpike Authority, State Appropriation Refunding Rev. (Monroe Expressway System), 5%, 7/01/2030 (w) | 2,215,000 | 2,941,825 | ||
| North Carolina Turnpike Authority, State Appropriation Refunding Rev. (Monroe Expressway System), 5%, 7/01/2032 (w) | 1,500,000 | 2,019,213 | ||
| North Carolina Turnpike Authority, Triangle Expressway System Rev., 5%, 1/01/2040 | 2,000,000 | 2,398,239 | ||
| North Carolina Turnpike Authority, Triangle Expressway System Rev., AGM, 5%, 1/01/2031 | 500,000 | 600,857 | ||
| North Carolina Turnpike Authority, Triangle Expressway System Rev., AGM, 5%, 1/01/2038 | 3,000,000 | 3,696,086 | ||
| North Carolina Turnpike Authority, Triangle Expressway System Senior Lien Refunding Rev., AGM, 5%, 1/01/2036 | 1,975,000 | 2,447,610 | ||
| North Carolina Turnpike Authority, Triangle Expressway System Senior Lien Rev., 5%, 2/01/2024 | 6,000,000 | 6,755,815 | ||
| North Carolina Turnpike Authority, Triangle Expressway System Senior Lien Rev., 5%, 1/01/2032 | 1,150,000 | 1,363,778 | ||
| North Carolina Turnpike Authority, Triangle Expressway System Senior Lien Rev., AGM, 5%, 1/01/2039 | 2,600,000 | 3,064,620 | ||
| Issuer | Shares/Par | Value ($) | ||
| Toll Roads – continued | ||||
| Texas Private Activity Surface Transportation Corp., Senior Lien Rev. (NTE Mobility Partners Segments 3 LLC Segments 3A & 3B Facility), 7%, 12/31/2038 | $ | 435,000 | $ 496,317 | |
| Texas Private Activity Surface Transportation Corp., Senior Lien Rev. (NTE Mobility Partners Segments 3 LLC Segments 3A & 3B Facility), 6.75%, 6/30/2043 | 350,000 | 396,814 | ||
| Virginia Small Business Financing Authority Rev. (Elizabeth River Crossings Opco LLC Project), 6%, 1/01/2037 | 595,000 | 629,184 | ||
| Virginia Small Business Financing Authority Rev. (Elizabeth River Crossings Opco LLC Project), 5.5%, 1/01/2042 | 1,160,000 | 1,212,727 | ||
| $ 35,580,373 | ||||
| Transportation - Special Tax – 3.2% | ||||
| Commonwealth of Puerto Rico Highway & Transportation Authority Rev., “D”, AGM, 5%, 7/01/2032 | $ | 435,000 | $ 449,097 | |
| Commonwealth of Puerto Rico Highway & Transportation Authority Rev., “J”, NPFG, 5%, 7/01/2029 | 65,000 | 66,656 | ||
| Commonwealth of Puerto Rico Highway & Transportation Authority Rev., “L”, AAC, 5.25%, 7/01/2038 | 2,400,000 | 2,701,679 | ||
| Commonwealth of Puerto Rico Highway & Transportation Authority Rev., “N”, AAC, 5.25%, 7/01/2031 | 1,640,000 | 1,807,150 | ||
| Metropolitan Transportation Authority Rev., NY, Anticipation Note, “B-2”, 5%, 5/15/2021 | 1,650,000 | 1,657,927 | ||
| Metropolitan Transportation Authority Rev., NY, Anticipation Note, “D-1”, 5%, 9/01/2022 | 1,210,000 | 1,282,258 | ||
| New Jersey Transportation Trust Fund Authority, “AA”, 5%, 6/15/2045 | 290,000 | 352,043 | ||
| New Jersey Transportation Trust Fund Authority, Transportation System, “A”, 5%, 12/15/2039 | 260,000 | 314,789 | ||
| New Jersey Transportation Trust Fund Authority, Transportation System, “BB”, 5%, 6/15/2044 | 260,000 | 309,199 | ||
| North Carolina Grant Anticipation Rev., 5%, 3/01/2027 | 7,000,000 | 8,736,023 | ||
| $ 17,676,821 | ||||
| Universities - Colleges – 18.4% | ||||
| Appalachian State University Rev., 4%, 10/01/2048 | $ | 1,415,000 | $ 1,593,092 | |
| Appalachian State University, Millennial Campus Rev. (End Zone Project), 5%, 5/01/2044 | 3,000,000 | 3,616,486 | ||
| East Carolina University, NC, General Rev., “A”, 4%, 10/01/2045 | 2,195,000 | 2,368,506 | ||
| Elizabeth City State University Rev., AGM, 5%, 4/01/2040 | 3,155,000 | 3,823,155 | ||
| Issuer | Shares/Par | Value ($) | ||
| Municipal Bonds – continued | ||||
| Universities - Colleges – continued | ||||
| North Carolina Agricultural & Technical University Rev., “A”, 5%, 10/01/2035 | $ | 3,075,000 | $ 3,572,992 | |
| North Carolina Capital Facilities Finance Agency Refunding Rev. (Duke University), “B”, 4%, 10/01/2039 | 3,265,000 | 3,658,568 | ||
| North Carolina Capital Facilities Finance Agency Refunding Rev. (Duke University), “B”, 5%, 10/01/2044 | 4,955,000 | 5,986,273 | ||
| North Carolina Capital Facilities Finance Agency Rev. (Davidson College), 5%, 3/01/2045 | 1,500,000 | 1,559,415 | ||
| North Carolina Capital Facilities Finance Agency Rev. (Wake Forest University), 4%, 1/01/2048 | 3,000,000 | 3,341,532 | ||
| North Carolina Capital Facilities Finance Agency, Education Facilities Refunding Rev. (High Point University), 3%, 5/01/2022 | 220,000 | 226,161 | ||
| North Carolina Capital Facilities Finance Agency, Education Facilities Refunding Rev. (High Point University), 4%, 5/01/2023 | 265,000 | 284,930 | ||
| North Carolina Capital Facilities Finance Agency, Education Facilities Refunding Rev. (High Point University), 4%, 5/01/2024 | 190,000 | 209,987 | ||
| North Carolina Capital Facilities Finance Agency, Education Facilities Refunding Rev. (High Point University), 5%, 5/01/2025 | 255,000 | 298,559 | ||
| North Carolina Capital Facilities Finance Agency, Education Facilities Refunding Rev. (High Point University), 5%, 5/01/2026 | 275,000 | 330,885 | ||
| North Carolina Capital Facilities Finance Agency, Education Facilities Refunding Rev. (High Point University), 5%, 5/01/2027 | 400,000 | 491,751 | ||
| North Carolina Capital Facilities Finance Agency, Educational Facilities Rev. (Meredith College), 4%, 6/01/2034 | 1,370,000 | 1,471,800 | ||
| North Carolina Central University Rev., 5%, 4/01/2044 | 3,265,000 | 3,915,584 | ||
| North Carolina State University, Raleigh General Rev., “A”, 5%, 10/01/2029 (Prerefunded 10/01/2023) | 5,000,000 | 5,591,550 | ||
| North Carolina State University, Raleigh General Rev., “A”, 5%, 10/01/2033 | 500,000 | 655,274 | ||
| North Carolina State University, Raleigh General Rev., “A”, 5%, 10/01/2034 | 1,000,000 | 1,306,333 | ||
| North Carolina State University, Raleigh General Rev., “A”, 5%, 10/01/2035 | 1,180,000 | 1,536,886 | ||
| Pinellas County, FL, Educational Facilities Authority Rev. (Barry University), 6%, 10/01/2041 | 450,000 | 458,801 | ||
| Puerto Rico Industrial, Tourist, Educational, Medical & Environmental Control Facilities Financing Authority, Higher Education Rev. (Ana G. Mendez University System Project), 5.125%, 4/01/2032 | 170,000 | 172,253 | ||
| Issuer | Shares/Par | Value ($) | ||
| Universities - Colleges – continued | ||||
| Puerto Rico Industrial, Tourist, Educational, Medical & Environmental Control Facilities Financing Authority, Higher Education Rev. (Ana G. Mendez University System Project), 5.375%, 4/01/2042 | $ | 275,000 | $ 279,125 | |
| Puerto Rico Industrial, Tourist, Educational, Medical & Environmental Control Facilities Financing Authority, Higher Education Rev. (University of Sacred Heart), 4.375%, 10/01/2031 | 115,000 | 115,756 | ||
| Puerto Rico Industrial, Tourist, Educational, Medical & Environmental Control Facilities Financing Authority, Higher Education Rev. (University of Sacred Heart), 5%, 10/01/2042 | 140,000 | 142,100 | ||
| Red River, TX, Education Finance Corp., Higher Education Rev. (Houston Baptist University Project), 5.5%, 10/01/2046 | 735,000 | 840,588 | ||
| University of North Carolina Board of Governors Rev., 4%, 4/01/2049 | 5,000,000 | 5,596,157 | ||
| University of North Carolina, Ashville, Rev., 4%, 6/01/2039 | 1,450,000 | 1,657,671 | ||
| University of North Carolina, Charlotte, Rev., 5%, 4/01/2043 (Prerefunded 4/01/2024) | 1,715,000 | 1,953,009 | ||
| University of North Carolina, Charlotte, Rev., “A”, 5%, 10/01/2038 | 1,110,000 | 1,387,805 | ||
| University of North Carolina, Charlotte, Rev., “A”, 4%, 10/01/2040 | 6,310,000 | 7,076,236 | ||
| University of North Carolina, Greensboro, Refunding Rev., 4%, 4/01/2036 | 1,750,000 | 2,001,785 | ||
| University of North Carolina, Greensboro, Rev., 4%, 4/01/2034 | 1,000,000 | 1,149,476 | ||
| University of North Carolina, Greensboro, Rev., 4%, 4/01/2035 | 1,000,000 | 1,147,205 | ||
| University of North Carolina, Greensboro, Rev., 5%, 4/01/2039 | 2,000,000 | 2,242,521 | ||
| University of North Carolina, School of Art General Rev., 4%, 2/01/2040 | 1,000,000 | 1,143,517 | ||
| University of North Carolina, School of Art General Rev., 4%, 2/01/2045 | 2,825,000 | 3,175,414 | ||
| University of North Carolina, Wilmington, Limited Obligation (Student Housing Projects), 5%, 6/01/2028 | 3,045,000 | 3,512,744 | ||
| University of North Carolina, Wilmington, Limited Obligation (Student Housing Projects), 4%, 6/01/2032 | 500,000 | 562,572 | ||
| University of North Carolina, Wilmington, Limited Obligation (Student Housing Projects), 4%, 6/01/2033 | 400,000 | 448,874 | ||
| University of North Carolina, Wilmington, Limited Obligation (Student Housing Projects), 4%, 6/01/2034 | 500,000 | 559,776 | ||
| University of North Carolina, Wilmington, Rev., “B”, 4%, 10/01/2039 | 1,000,000 | 1,152,811 | ||
| University of North Carolina, Wilmington, Rev., “B”, 4%, 10/01/2044 | 1,405,000 | 1,598,990 | ||
| Issuer | Shares/Par | Value ($) | ||
| Municipal Bonds – continued | ||||
| Universities - Colleges – continued | ||||
| Virginia College Building Authority, Educational Facilities Rev. (Marymount University Project), “B”, 5.25%, 7/01/2035 (n) | $ | 195,000 | $ 207,533 | |
| Western Carolina University, NC, General Obligation Rev., 5%, 10/01/2043 | 3,700,000 | 4,451,864 | ||
| Western Carolina University, NC, General Rev., “B”, 5%, 4/01/2032 | 2,420,000 | 3,148,480 | ||
| Western Carolina University, NC, General Rev., “B”, 5%, 4/01/2033 | 500,000 | 647,754 | ||
| Western Carolina University, NC, General Rev., “B”, 5%, 4/01/2034 | 1,300,000 | 1,677,388 | ||
| Winston-Salem State University, NC, General Rev., 5%, 4/01/2033 | 1,000,000 | 1,032,050 | ||
| Winston-Salem State University, NC, General Rev., AGM, 5%, 10/01/2042 | 2,470,000 | 2,926,937 | ||
| Winston-Salem State University, NC, Student Housing Project Rev., 5%, 6/01/2029 | 1,550,000 | 1,642,612 | ||
| $ 99,949,523 | ||||
| Universities - Dormitories – 0.7% | ||||
| California Municipal Finance Authority, Student Housing Rev. (CHF-Davis I LLC - West Village Student Housing Project), BAM, 5%, 5/15/2051 | $ | 3,045,000 | $ 3,622,905 | |
| Utilities - Cogeneration – 0.2% | ||||
| Puerto Rico Industrial, Tourist, Educational, Medical & Environmental Control Facilities Financing Authority Rev. (Cogeneration Facilities - AES Puerto Rico Project), 9.12%, 6/01/2022 | $ | 1,100,000 | $ 1,127,500 | |
| Utilities - Municipal Owned – 1.2% | ||||
| Greenville, NC, Greenville Utilities Commission Combined Enterprise System Rev., 5%, 8/01/2044 | $ | 300,000 | $ 372,271 | |
| Puerto Rico Electric Power Authority Rev., “A”, 5%, 7/01/2029 (a)(d) | 1,125,000 | 1,018,125 | ||
| Puerto Rico Electric Power Authority Rev., “A”, 5%, 7/01/2042 (a)(d) | 175,000 | 158,375 | ||
| Puerto Rico Electric Power Authority Rev., “AAA”, 5.25%, 7/01/2021 (a)(d) | 85,000 | 77,138 | ||
| Puerto Rico Electric Power Authority Rev., “AAA”, 5.25%, 7/01/2030 (a)(d) | 40,000 | 36,300 | ||
| Puerto Rico Electric Power Authority Rev., “CCC”, 5.25%, 7/01/2027 (a)(d) | 415,000 | 376,612 | ||
| Puerto Rico Electric Power Authority Rev., “DDD”, 5%, 7/01/2020 (a)(d) | 40,000 | 36,100 | ||
| Puerto Rico Electric Power Authority Rev., “DDD”, 5%, 7/01/2021 (a)(d) | 440,000 | 398,200 | ||
| Puerto Rico Electric Power Authority Rev., “DDD”, 5%, 7/01/2022 (a)(d) | 720,000 | 651,600 | ||
| Puerto Rico Electric Power Authority Rev., “EEE”, 6.05%, 7/01/2032 (a)(d) | 240,000 | 212,700 | ||
| Issuer | Shares/Par | Value ($) | ||
| Utilities - Municipal Owned – continued | ||||
| Puerto Rico Electric Power Authority Rev., “TT”, 5%, 7/01/2021 (a)(d) | $ | 195,000 | $ 176,475 | |
| Puerto Rico Electric Power Authority Rev., “TT”, 5%, 7/01/2023 (a)(d) | 190,000 | 171,950 | ||
| Puerto Rico Electric Power Authority Rev., “TT”, 5%, 7/01/2027 (a)(d) | 35,000 | 31,675 | ||
| Puerto Rico Electric Power Authority Rev., “TT”, 5%, 7/01/2037 (a)(d) | 585,000 | 529,425 | ||
| Puerto Rico Electric Power Authority Rev., “V”, NPFG, 5.25%, 7/01/2033 | 240,000 | 265,936 | ||
| Puerto Rico Electric Power Authority Rev., “VV”, NPFG, 5.25%, 7/01/2029 | 340,000 | 376,765 | ||
| Puerto Rico Electric Power Authority Rev., “VV”, NPFG, 5.25%, 7/01/2030 | 420,000 | 465,275 | ||
| Puerto Rico Electric Power Authority Rev., “VV”, NPFG, 5.25%, 7/01/2034 | 50,000 | 55,322 | ||
| Puerto Rico Electric Power Authority Rev., “WW”, 5.375%, 7/01/2022 (a)(d) | 35,000 | 31,806 | ||
| Puerto Rico Electric Power Authority Rev., “WW”, 5.25%, 7/01/2025 (a)(d) | 80,000 | 72,600 | ||
| Puerto Rico Electric Power Authority Rev., “ZZ”, 5%, 7/01/2018 (a)(d) | 265,000 | 236,181 | ||
| Puerto Rico Electric Power Authority Rev., “ZZ”, 5.25%, 7/01/2023 (a)(d) | 305,000 | 276,787 | ||
| Puerto Rico Electric Power Authority Rev., “ZZ”, 5.25%, 7/01/2024 (a)(d) | 95,000 | 86,213 | ||
| Puerto Rico Electric Power Authority Rev., “ZZ”, 5.25%, 7/01/2026 (a)(d) | 300,000 | 272,250 | ||
| $ 6,386,081 | ||||
| Utilities - Other – 0.3% | ||||
| Tennessee Energy Acquisition Corp., Gas Rev., “A”, 5.25%, 9/01/2026 | $ | 1,290,000 | $ 1,566,124 | |
| Water & Sewer Utility Revenue – 7.7% | ||||
| Cape Fear Public Utility Authority, Water & Sewer System Rev., 5%, 8/01/2036 (Prerefunded 8/01/2021) | $ | 4,410,000 | $ 4,479,012 | |
| Cape Fear Public Utility Authority, Water & Sewer System Rev., 5%, 6/01/2040 (Prerefunded 6/01/2024) | 1,250,000 | 1,434,798 | ||
| Charlotte, NC, Water & Sewer System Refunding Rev., 5%, 7/01/2030 | 2,000,000 | 2,691,650 | ||
| Charlotte, NC, Water & Sewer System Refunding Rev., 5%, 7/01/2033 | 1,750,000 | 2,318,970 | ||
| Charlotte, NC, Water & Sewer Systems Rev., 4%, 7/01/2047 | 4,000,000 | 4,639,118 | ||
| Durham County, NC, Enterprise Systems Rev., 5%, 6/01/2029 (Prerefunded 6/01/2021) | 1,590,000 | 1,602,138 | ||
| Greensboro, NC, Enterprise Systems Rev., “A”, 4%, 6/01/2047 | 2,000,000 | 2,272,974 | ||
| Guam Waterworks Authority Rev. (Water and Wastewater System), 5%, 7/01/2036 | 220,000 | 250,644 | ||
| Guam Waterworks Authority Rev. (Water and Wastewater System), 5%, 7/01/2036 | 380,000 | 441,170 | ||
| Guam Waterworks Authority Rev. (Water and Wastewater System), 5%, 7/01/2037 | 480,000 | 555,875 | ||
| Issuer | Shares/Par | Value ($) | ||
| Municipal Bonds – continued | ||||
| Water & Sewer Utility Revenue – continued | ||||
| Guam Waterworks Authority Rev. (Water and Wastewater System), 5%, 7/01/2040 | $ | 1,325,000 | $ 1,525,474 | |
| Guam Waterworks Authority Rev. (Water and Wastewater System), 5%, 1/01/2046 | 1,000,000 | 1,120,582 | ||
| Guam Waterworks Authority Rev. (Water and Wastewater System), “A”, 5%, 1/01/2050 | 605,000 | 727,131 | ||
| Jacksonville, NC, Enterprise Systems Refunding Rev., “A”, 5%, 5/01/2024 (w) | 500,000 | 570,595 | ||
| Jacksonville, NC, Enterprise Systems Refunding Rev., “A”, 5%, 5/01/2025 (w) | 485,000 | 572,512 | ||
| Jacksonville, NC, Enterprise Systems Refunding Rev., “A”, 5%, 5/01/2026 (w) | 450,000 | 547,768 | ||
| Jacksonville, NC, Enterprise Systems Refunding Rev., “A”, 5%, 5/01/2027 (w) | 550,000 | 687,405 | ||
| Jacksonville, NC, Enterprise Systems Refunding Rev., “A”, 5%, 5/01/2028 (w) | 425,000 | 543,163 | ||
| Lincoln County, NC, Enterprise System Rev., 3%, 8/01/2034 | 175,000 | 193,873 | ||
| Michigan Finance Authority Local Government Loan Program Rev. (Detroit Water and Sewerage Department Sewage Disposal System Rev. Refunding Second Lien Local Project), “C-7”, NPFG, 5%, 7/01/2032 | 95,000 | 108,003 | ||
| Michigan Finance Authority Local Government Loan Program Rev. (Detroit Water and Sewerage Department Water Supply System Rev. Refunding Second Lien Local Project), “D-6”, NPFG, 5%, 7/01/2036 | 115,000 | 130,265 | ||
| Michigan Finance Authority Local Government Loan Program Rev. (Detroit Water and Sewerage Department Water Supply System Rev. Refunding Senior Lien Local Project), “D-1”, AGM, 5%, 7/01/2035 | 60,000 | 68,130 | ||
| Michigan Finance Authority Local Government Loan Program Rev. (Detroit Water and Sewerage Department Water Supply System Rev. Refunding Senior Lien Local Project), “D-1”, AGM, 5%, 7/01/2037 | 140,000 | 158,632 | ||
| Oak Island, NC, Enterprise System Rev., AGM, 5%, 6/01/2025 | 2,010,000 | 2,364,047 | ||
| Issuer | Shares/Par | Value ($) | ||
| Water & Sewer Utility Revenue – continued | ||||
| Oak Island, NC, Enterprise System Rev., AGM, 5%, 6/01/2028 | $ | 500,000 | $ 613,768 | |
| Oak Island, NC, Enterprise System Rev., AGM, 5%, 6/01/2029 | 1,400,000 | 1,622,432 | ||
| Oak Island, NC, Enterprise System Rev., AGM, 5%, 6/01/2031 | 1,600,000 | 1,841,229 | ||
| Raleigh, NC, Combined Enterprise Systems Rev., “A”, 5%, 3/01/2029 (Prerefunded 3/01/2023) | 3,145,000 | 3,435,131 | ||
| Union County, NC, Enterprise System Rev., 5%, 6/01/2026 | 750,000 | 919,278 | ||
| Union County, NC, Enterprise System Rev., 5%, 6/01/2027 | 800,000 | 1,006,497 | ||
| Union County, NC, Enterprise System Rev., 5%, 6/01/2028 | 750,000 | 965,677 | ||
| Winston-Salem, NC, Water & Sewer Systems Rev., 4%, 6/01/2034 | 700,000 | 812,521 | ||
| Winston-Salem, NC, Water & Sewer Systems Rev., 4%, 6/01/2035 | 500,000 | 579,264 | ||
| $ 41,799,726 | ||||
| Total Municipal Bonds (Identified Cost, $517,384,510) | $545,402,069 | |||
| Bonds – 0.2% | ||||
| Consumer Services – 0.2% | ||||
| Toll Road Investors Partnership II LP, Capital Appreciation, NPFG, 0%, 2/15/2025 (n) | $ | 786,000 | $ 686,422 | |
| Toll Road Investors Partnership II LP, Capital Appreciation, NPFG, 0%, 2/15/2043 (n) | 1,700,000 | 484,166 | ||
| Total Bonds (Identified Cost, $1,254,873) | $ 1,170,588 | |||
| Investment Companies (h) – 1.5% | ||||
| Money Market Funds – 1.5% | ||||
| MFS Institutional Money Market Portfolio, 0.05% (v) (Identified Cost, $8,059,642) | 8,059,699 | $ 8,059,699 | ||
| Other Assets, Less Liabilities – (2.0)% | (11,111,853) | |||
| Net Assets – 100.0% | $543,520,503 | |||
| Issuer | Shares/Par | Value ($) | ||
| Municipal Bonds – 97.6% | ||||
| Airport Revenue – 3.4% | ||||
| Chicago, IL, O'Hare International Airport Rev., Senior Lien, “B”, 5%, 1/01/2030 | $ | 215,000 | $ 248,367 | |
| Philadelphia, PA, Airport Rev., “B”, 5%, 7/01/2034 | 750,000 | 890,582 | ||
| Philadelphia, PA, Airport Rev., “C-1”, VRDN, 0.09%,��6/15/2025 | 5,000,000 | 5,000,000 | ||
| Wayne County, MI, Airport Authority Rev. (Detroit Metropolitan Wayne County Airport), “B”, 5%, 12/01/2044 | 55,000 | 63,031 | ||
| Wayne County, MI, Airport Authority Rev. (Detroit Metropolitan Wayne County Airport), “B”, BAM, 5%, 12/01/2039 | 65,000 | 74,491 | ||
| Wayne County, MI, Airport Authority Rev. (Detroit Metropolitan Wayne County Airport), “C”, 5%, 12/01/2039 | 45,000 | 51,223 | ||
| Wayne County, MI, Airport Authority Rev. (Detroit Metropolitan Wayne County Airport), “C”, 5%, 12/01/2044 | 80,000 | 91,062 | ||
| $ 6,418,756 | ||||
| General Obligations - General Purpose – 8.7% | ||||
| Bridgeview, IL, Stadium and Redevelopment Projects, AAC, 5.14%, 12/01/2036 | $ | 350,000 | $ 342,136 | |
| Bucks County, PA, Northampton Township, General Obligation, 4%, 5/15/2043 | 1,000,000 | 1,075,736 | ||
| Chester County, PA, General Obligation, 4%, 7/15/2038 | 500,000 | 587,889 | ||
| Chester County, PA, General Obligation, 4%, 7/15/2039 | 510,000 | 597,344 | ||
| Chester County, PA, General Obligation, 4%, 7/15/2040 | 500,000 | 584,740 | ||
| Chicago, IL, General Obligation, “A”, 5%, 1/01/2025 | 220,000 | 248,515 | ||
| Chicago, IL, General Obligation, “A”, 5%, 1/01/2026 | 65,000 | 75,156 | ||
| Chicago, IL, General Obligation, “A”, 5%, 1/01/2027 | 70,000 | 82,584 | ||
| Commonwealth of Puerto Rico, General Obligation, “A”, 8%, 7/01/2035 (a)(d) | 1,650,000 | 1,295,250 | ||
| Commonwealth of Puerto Rico, Public Improvement, “A”, AGM, 5%, 7/01/2035 | 235,000 | 242,920 | ||
| Commonwealth of Puerto Rico, Public Improvement, “A-4”, AGM, 5%, 7/01/2031 | 100,000 | 103,241 | ||
| Lackawanna County, PA, General Obligations, “A”, BAM, 4%, 3/15/2031 | 1,205,000 | 1,406,297 | ||
| Lackawanna County, PA, General Obligations, “A”, BAM, 4%, 3/15/2034 | 955,000 | 1,099,067 | ||
| Lackawanna County, PA, General Obligations, “A”, BAM, 4%, 3/15/2035 | 500,000 | 573,561 | ||
| Penn Hills, PA, Capital Appreciation, “D”, 0%, 12/01/2032 | 595,000 | 463,812 | ||
| Issuer | Shares/Par | Value ($) | ||
| General Obligations - General Purpose – continued | ||||
| Pennsylvania General Obligation, AGM, 5%, 9/15/2026 | $ | 425,000 | $ 525,560 | |
| Pennsylvania General Obligation Refunding, 5%, 1/15/2023 | 1,415,000 | 1,535,733 | ||
| Philadelphia, PA, “B”, 5%, 2/01/2035 | 1,000,000 | 1,269,494 | ||
| Puerto Rico Public Buildings Authority Government Facilities Rev., “I”, AGM, 5%, 7/01/2036 | 25,000 | 25,810 | ||
| Puerto Rico Public Buildings Authority Rev., Guaranteed, “D”, AAC, 5.45%, 7/01/2030 | 165,000 | 169,967 | ||
| Reading, Berks County, PA, General Obligation, BAM, 5%, 11/01/2030 | 1,000,000 | 1,247,005 | ||
| Reading, Berks County, PA, General Obligation, BAM, 5%, 11/01/2031 | 1,000,000 | 1,243,212 | ||
| State of Illinois, General Obligation, 5.5%, 5/01/2039 | 125,000 | 153,785 | ||
| State of Illinois, General Obligation, 5.75%, 5/01/2045 | 115,000 | 143,054 | ||
| State of Illinois, General Obligation, “A”, 5%, 3/01/2028 | 160,000 | 192,597 | ||
| State of Illinois, General Obligation, “A”, 5%, 3/01/2029 | 240,000 | 292,870 | ||
| State of Illinois, General Obligation, “A”, 5%, 3/01/2030 | 220,000 | 271,362 | ||
| State of Illinois, General Obligation, “A”, 5%, 3/01/2031 | 320,000 | 399,087 | ||
| $ 16,247,784 | ||||
| General Obligations - Schools – 11.0% | ||||
| Allegheny County, PA, Pine-Richland School District, General Obligation, “B”, 4%, 3/01/2036 | $ | 400,000 | $ 469,550 | |
| Allegheny County, PA, Pine-Richland School District, General Obligation, “B”, 4%, 3/01/2037 | 600,000 | 701,612 | ||
| Beaver County, PA, Aliquippa School District, General Obligation, BAM, 4%, 12/01/2041 | 1,000,000 | 1,117,018 | ||
| Berks County, PA, Reading School District, AGM, 5%, 3/01/2038 | 1,000,000 | 1,202,496 | ||
| Carlisle, PA, School District, 5%, 9/01/2026 (Prerefunded 3/01/2022) | 1,000,000 | 1,044,340 | ||
| Conneaut, PA, School District, Capital Appreciation, “B”, AGM, 0%, 11/01/2031 | 1,150,000 | 935,971 | ||
| Erie, PA, City School District General Obligation, “A”, AGM, 4%, 4/01/2033 | 1,150,000 | 1,318,370 | ||
| Luzerne County, PA, Wilkes-Barre Area School District, General Obligation, BAM, 4%, 4/15/2054 | 765,000 | 858,070 | ||
| Luzerne County, PA, Wilkes-Barre Area School District, General Obligation, BAM, 5%, 4/15/2059 | 1,500,000 | 1,811,308 | ||
| Issuer | Shares/Par | Value ($) | ||
| Municipal Bonds – continued | ||||
| General Obligations - Schools – continued | ||||
| Montebello, CA, Unified School District (Election of 2016), “A”, 4%, 8/01/2046 | $ | 545,000 | $ 592,105 | |
| Montgomery County, PA, Springfield Township School District, General Obligation, 4%, 11/15/2037 | 1,500,000 | 1,692,708 | ||
| Northampton County, PA, Area School District, “A”, 5%, 10/01/2033 | 1,000,000 | 1,068,528 | ||
| Pequea Valley, PA, School District Lancaster Country General Obligation, 4%, 5/15/2027 (w) | 125,000 | 147,651 | ||
| Philadelphia, PA, School District, “A”, 5%, 9/01/2044 | 1,500,000 | 1,793,413 | ||
| Philadelphia, PA, School District, “F”, 5%, 9/01/2038 | 1,500,000 | 1,789,323 | ||
| Scranton, PA, School District General Obligation, 4%, 12/01/2040 | 1,500,000 | 1,698,048 | ||
| Scranton, PA, School District, “E”, BAM, 5%, 12/01/2034 | 1,000,000 | 1,211,566 | ||
| Upper St. Clair Township, PA, School District General Obligation, “B”, 3.625%, 10/01/2039 | 1,000,000 | 1,085,099 | ||
| $ 20,537,176 | ||||
| Healthcare Revenue - Hospitals – 16.9% | ||||
| Allegheny County, PA, Hospital Development Authority Rev. (University of Pittsburgh Medical Center), “B”, 5%, 10/15/2029 (w) | $ | 1,000,000 | $ 1,271,373 | |
| Allegheny County, PA, Mt. Lebanon Hospital Authority Rev. (St. Clair Memorial Hospital), 5%, 7/01/2038 | 1,000,000 | 1,213,472 | ||
| Berks County, PA, Industrial Development Authority Health System Rev. (Tower Health Project), 4%, 11/01/2038 | 500,000 | 484,027 | ||
| Berks County, PA, Municipal Authority Rev. (Reading Hospital & Medical Center), “A”, 5%, 11/01/2040 | 1,500,000 | 1,503,529 | ||
| Bucks County, PA, Industrial Development Authority, Hospital Rev. (St. Luke's University Health Network Project), 4%, 8/15/2044 | 1,000,000 | 1,106,427 | ||
| Bucks County, PA, St. Mary Hospital Authority Refunding Rev. (Trinity Health Credit Group), 5%, 12/01/2048 | 1,000,000 | 1,220,805 | ||
| California Statewide Communities Development Authority Rev. (Loma Linda University Medical Center), “B”, 6%, 12/01/2024 | 645,000 | 720,142 | ||
| Centre County, PA, Hospital Authority Rev. (Mount Nittany Medical Center), 5%, 11/15/2041 | 850,000 | 974,833 | ||
| Centre County, PA, Hospital Authority Rev. (Mount Nittany Medical Center), 6.25%, 11/15/2041 (Prerefunded 11/15/2021) | 500,000 | 518,749 | ||
| Issuer | Shares/Par | Value ($) | ||
| Healthcare Revenue - Hospitals – continued | ||||
| Chester County, PA, Health & Education Facilities Authority Health System Rev. (Main Line Health System), “A”, 5%, 10/01/2052 | $ | 1,750,000 | $ 2,081,583 | |
| Doylestown, PA, Hospital Rev., “A”, 5%, 7/01/2049 | 1,000,000 | 1,116,540 | ||
| Dubois, PA Hospital Authority Rev. (Penn Highlands Healthcare), 5%, 7/15/2039 | 500,000 | 585,775 | ||
| Dubois, PA Hospital Authority Rev. (Penn Highlands Healthcare), 5%, 7/15/2040 | 1,000,000 | 1,169,194 | ||
| DuBois, PA, Hospital Authority Rev. (Penn Highlands Healthcare), 5%, 7/15/2043 | 1,000,000 | 1,151,155 | ||
| Fulton County, PA, Industrial Development Authority Hospital Rev. (Medical Center Project), 5%, 7/01/2040 | 500,000 | 535,696 | ||
| Jefferson Parish, LA, Hospital Service District No. 2 Hospital Rev. (East Jefferson General Hospital), 6.25%, 7/01/2031 (Prerefunded 7/01/2021) | 165,000 | 167,399 | ||
| Jefferson Parish, LA, Hospital Service District No. 2 Hospital Rev. (East Jefferson General Hospital), 6.375%, 7/01/2041 (Prerefunded 7/01/2021) | 150,000 | 152,225 | ||
| Knox County, TN, Health, Educational & Housing Facility Board Rev. (University Health Systems, Inc.), “A”, 5%, 9/01/2030 | 735,000 | 908,495 | ||
| Lancaster County, PA, Hospital Authority Rev. (University of Pennsylvania Health System), “A”, 5%, 8/15/2036 | 1,000,000 | 1,196,837 | ||
| Lehigh County, PA, Hospital Authority, General Purpose Refunding Rev. (Health Network), “A”, 4%, 7/01/2039 | 1,000,000 | 1,161,610 | ||
| Miami-Dade County, FL, Health Facilities Authority Hospital Rev., Unrefunded Balance, 6%, 8/01/2030 | 25,000 | 25,099 | ||
| Montour County, PA, Geisinger Authority Health System Rev., “A”, 4%, 4/01/2039 | 1,000,000 | 1,169,506 | ||
| Montour County, PA, Geisinger Authority Health System Rev., “A-1”, 5%, 2/15/2045 | 1,000,000 | 1,179,009 | ||
| Northampton County, PA, General Purpose Authority Hospital Rev. (St. Luke's Hospital), “A”, 5%, 8/15/2048 | 500,000 | 591,545 | ||
| Philadelphia, PA, Authority for Industrial Development Rev. (Thomas Jefferson University), “A”, 5%, 9/01/2036 | 1,000,000 | 1,192,714 | ||
| Philadelphia, PA, Authority for Industrial Development Rev. (Thomas Jefferson University), “A”, 5%, 9/01/2042 | 1,000,000 | 1,178,609 | ||
| Philadelphia, PA, Hospitals and Higher Education Facilities Authority Rev. (Children's Hospital of Philadelphia), “C”, 5%, 7/01/2025 | 1,000,000 | 1,014,381 | ||
| Philadelphia, PA, Hospitals and Higher Education Facilities Authority Rev. (Temple University Health System Obligated Group), “A”, 5%, 7/01/2034 | 500,000 | 577,121 | ||
| Issuer | Shares/Par | Value ($) | ||
| Municipal Bonds – continued | ||||
| Healthcare Revenue - Hospitals – continued | ||||
| Royal Oak, MI, Hospital Finance Authority Rev. (William Beaumont Hospital), 5%, 9/01/2039 | $ | 810,000 | $ 903,298 | |
| Southcentral, PA, General Authority Rev. (WellSpan Health Obligated Group), 4%, 6/01/2044 | 1,000,000 | 1,131,642 | ||
| Southcentral, PA, General Authority Rev. (WellSpan Health Obligated Group), “A”, 5%, 6/01/2044 (Prerefunded 6/01/2024) | 1,000,000 | 1,146,135 | ||
| West Shore, PA, Hospital Authority Rev. (Holy Spirit Hospital), “B”, 5.625%, 1/01/2032 (Prerefunded 1/01/2022) | 500,000 | 520,245 | ||
| Westmoreland County, PA, Industrial Development Authority, Health System Rev. (Excela Health Project), “A”, 5%, 7/01/2029 | 100,000 | 123,194 | ||
| Westmoreland County, PA, Industrial Development Authority, Health System Rev. (Excela Health Project), “A”, 4%, 7/01/2037 | 1,400,000 | 1,585,929 | ||
| $ 31,578,293 | ||||
| Healthcare Revenue - Long Term Care – 3.6% | ||||
| Chester County, PA, Health & Education Facilities Authority Rev. (Simpson Senior Services Project), “A”, 5.25%, 12/01/2045 | $ | 500,000 | $ 507,588 | |
| Cumberland County, PA, Municipal Authority Rev. (Diakon Lutheran Social Ministries Project), “A”, 5%, 1/01/2039 | 1,000,000 | 1,170,277 | ||
| East Hempfield Township, PA, Industrial Development Authority Rev. (Willow Valley Communities Project), 5%, 12/01/2039 | 750,000 | 847,174 | ||
| Lancaster County, PA, Hospital Authority Health Center Rev. (Landis Homes Retirement Community Project), “A”, 5%, 7/01/2045 | 500,000 | 533,547 | ||
| Lancaster County, PA, Hospital Authority Health Center Rev. (Masonic Villages Project), 5%, 11/01/2035 | 500,000 | 548,504 | ||
| Lancaster County, PA, Hospital Authority Health Center Rev. (Masonic Villages Project), 5%, 11/01/2036 | 260,000 | 298,687 | ||
| Lancaster County, PA, Hospital Authority Health Center Rev. (Masonic Villages Project), 5%, 11/01/2037 | 250,000 | 286,666 | ||
| Lancaster County, PA, Hospital Authority Rev. (Brethren Village Project), 5.125%, 7/01/2037 | 500,000 | 543,989 | ||
| Lancaster County, PA, Hospital Authority Rev. (Saint Anne's Retirement Community, Inc. Project), 5%, 3/01/2040 | 500,000 | 544,746 | ||
| Lancaster County, PA, Hospital Authority Rev. (Saint Anne's Retirement Community, Inc. Project), 5%, 3/01/2045 | 500,000 | 539,738 | ||
| Montgomery County, PA, Industrial Development Authority Rev. (Whitemarsh Continuing Care Retirement Community Project), 5.375%, 1/01/2050 | 400,000 | 416,500 | ||
| Issuer | Shares/Par | Value ($) | ||
| Healthcare Revenue - Long Term Care – continued | ||||
| Philadelphia, PA, Authority for Industrial Development, Senior Living Facilities Rev. (Wesley Enhanced Living Obligated Group), “A”, 5%, 7/01/2049 | $ | 500,000 | $ 514,804 | |
| $ 6,752,220 | ||||
| Industrial Revenue - Environmental Services – 0.2% | ||||
| Blythe Township, PA, Solid Waste Authority Rev., 7.75%, 12/01/2037 | $ | 250,000 | $ 285,304 | |
| Industrial Revenue - Other – 1.0% | ||||
| Pennsylvania Economic Development Financing Authority, Solid Waste Disposal Rev. (Procter & Gamble), 5.375%, 3/01/2031 | $ | 1,000,000 | $ 1,311,498 | |
| Tuscaloosa County, AL, Industrial Development Authority, Gulf Opportunity Zone (Hunt Refining Project), “A”, 4.5%, 5/01/2032 (n) | 115,000 | 127,806 | ||
| Tuscaloosa County, AL, Industrial Development Authority, Gulf Opportunity Zone (Hunt Refining Project), “A”, 5.25%, 5/01/2044 (n) | 400,000 | 454,566 | ||
| $ 1,893,870 | ||||
| Miscellaneous Revenue - Other – 0.6% | ||||
| Indiana Finance Authority Rev. (Ohio River Bridges East End Crossing Project), “A”, 5%, 7/01/2040 | $ | 145,000 | $ 156,644 | |
| Pennsylvania Economic Development Financing Authority Private Activity Rev. (Pennsylvania Rapid Bridge Replacement Project), 5%, 12/31/2034 | 750,000 | 873,685 | ||
| $ 1,030,329 | ||||
| Multi-Family Housing Revenue – 1.3% | ||||
| Pennsylvania Housing Finance Agency, Special Limited Obligation, Multi-Family Housing Development Rev. (Country Commons Apartments), FNMA, 3.6%, 8/01/2035 | $ | 971,112 | $ 1,066,534 | |
| Philadelphia, PA, Authority for Industrial Development, Multi-Family Housing Rev. (University Square Apartment Project-Section 8), “I”, 5%, 12/01/2058 | 1,250,000 | 1,424,494 | ||
| $ 2,491,028 | ||||
| Sales & Excise Tax Revenue – 1.9% | ||||
| Illinois Sales Tax Securitization Corp., Second Lien, “A”, 5%, 1/01/2026 | $ | 60,000 | $ 70,779 | |
| Illinois Sales Tax Securitization Corp., Second Lien, “A”, 5%, 1/01/2027 | 130,000 | 157,037 | ||
| Illinois Sales Tax Securitization Corp., Second Lien, “A”, 5%, 1/01/2028 | 125,000 | 154,073 | ||
| Illinois Sales Tax Securitization Corp., Second Lien, “A”, 5%, 1/01/2029 | 25,000 | 31,316 | ||
| Illinois Sales Tax Securitization Corp., Second Lien, “A”, 5%, 1/01/2030 | 60,000 | 76,285 | ||
| Issuer | Shares/Par | Value ($) | ||
| Municipal Bonds – continued | ||||
| Sales & Excise Tax Revenue – continued | ||||
| Illinois Sales Tax Securitization Corp., Second Lien, “A”, 5%, 1/01/2036 | $ | 55,000 | $ 68,078 | |
| Illinois Sales Tax Securitization Corp., Second Lien, “A”, 5%, 1/01/2037 | 70,000 | 86,846 | ||
| Illinois Sales Tax Securitization Corp., Second Lien, “A”, 4%, 1/01/2038 | 55,000 | 62,703 | ||
| Illinois Sales Tax Securitization Corp., Second Lien, “A”, 4%, 1/01/2040 | 35,000 | 39,838 | ||
| Puerto Rico Sales Tax Financing Corp., Restructured Sales Tax Rev., “2019A-1”, 4.55%, 7/01/2040 | 35,000 | 37,933 | ||
| Puerto Rico Sales Tax Financing Corp., Restructured Sales Tax Rev., “2019A-1”, 5%, 7/01/2058 | 188,000 | 207,022 | ||
| Puerto Rico Sales Tax Financing Corp., Restructured Sales Tax Rev., “2019A-2”, 4.329%, 7/01/2040 | 367,000 | 392,587 | ||
| Puerto Rico Sales Tax Financing Corp., Restructured Sales Tax Rev., “2019A-2”, 4.329%, 7/01/2040 | 116,000 | 124,088 | ||
| Puerto Rico Sales Tax Financing Corp., Restructured Sales Tax Rev., “2019A-2”, 4.536%, 7/01/2053 | 1,000 | 1,072 | ||
| Puerto Rico Sales Tax Financing Corp., Restructured Sales Tax Rev., “2019A-2”, 4.784%, 7/01/2058 | 69,000 | 74,665 | ||
| Puerto Rico Sales Tax Financing Corp., Restructured Sales Tax Rev., Capital Appreciation, “2019A-1”, 0%, 7/01/2024 | 6,000 | 5,631 | ||
| Puerto Rico Sales Tax Financing Corp., Restructured Sales Tax Rev., Capital Appreciation, “2019A-1”, 0%, 7/01/2027 | 55,000 | 48,184 | ||
| Puerto Rico Sales Tax Financing Corp., Restructured Sales Tax Rev., Capital Appreciation, “2019A-1”, 0%, 7/01/2029 | 9,000 | 7,412 | ||
| Puerto Rico Sales Tax Financing Corp., Restructured Sales Tax Rev., Capital Appreciation, “2019A-1”, 0%, 7/01/2031 | 524,000 | 401,038 | ||
| Puerto Rico Sales Tax Financing Corp., Restructured Sales Tax Rev., Capital Appreciation, “2019A-1”, 0%, 7/01/2033 | 509,000 | 361,300 | ||
| Puerto Rico Sales Tax Financing Corp., Restructured Sales Tax Rev., Capital Appreciation, “2019A-1”, 0%, 7/01/2046 | 2,990,000 | 912,458 | ||
| Wisconsin Public Finance Authority Limited Obligation Grant Rev. (American Dream at Meadowlands Project), “A”, 6.25%, 8/01/2027 (n) | 195,000 | 211,906 | ||
| Wisconsin Public Finance Authority Limited Obligation Grant Rev. (American Dream at Meadowlands Project), ”A“, 5.625%, 8/01/2024 (n) | 100,000 | 103,867 | ||
| $ 3,636,118 | ||||
| Issuer | Shares/Par | Value ($) | ||
| Secondary Schools – 2.9% | ||||
| Bucks County, PA, Industrial Development Authority Rev. (School Lane Charter School Project), “A”, 5.125%, 3/15/2046 | $ | 500,000 | $ 555,126 | |
| Chester County, PA, Industrial Development Authority Educational Facilities Rev. (Avon Grove Charter School), “A”, 5%, 12/15/2047 | 500,000 | 556,251 | ||
| Montgomery County, PA, Industrial Development Authority Rev. (Haverford School Project), 4%, 3/01/2049 | 1,000,000 | 1,101,694 | ||
| Philadelphia, PA, Authority for Industrial Development Rev. (A String Theory Charter School Project), 5%, 6/15/2040 (n) | 900,000 | 1,038,950 | ||
| Philadelphia, PA, Authority for Industrial Development Rev. (Discovery Charter School Project), 6.25%, 4/01/2037 | 500,000 | 515,666 | ||
| Philadelphia, PA, Authority for Industrial Development Rev. (MaST Charter School Project), “B”, 6%, 8/01/2051 | 500,000 | 555,830 | ||
| Philadelphia, PA, Authority for Industrial Development Rev. (MaST Community Charter School II Project), 5%, 8/01/2050 | 500,000 | 575,854 | ||
| Philadelphia, PA, Authority for Industrial Development Rev. (Tacony Academy Charter School Project), “A-1”, 7%, 6/15/2043 | 400,000 | 440,260 | ||
| $ 5,339,631 | ||||
| Single Family Housing - Local – 0.5% | ||||
| Montgomery County, MD, Housing Opportunities Commission Program Rev., “A”, 4%, 7/01/2049 | $ | 765,000 | $ 854,594 | |
| Single Family Housing - State – 4.4% | ||||
| Maryland Community Development Administration, Department of Housing & Community Development Housing Rev., “A”, 4.25%, 9/01/2049 | $ | 635,000 | $ 709,821 | |
| Pennsylvania Housing Finance Agency, Single Family Mortgage Rev., “128A”, 3.65%, 10/01/2032 | 1,000,000 | 1,070,404 | ||
| Pennsylvania Housing Finance Agency, Single Family Mortgage Rev., “A”, 4%, 4/01/2039 | 480,000 | 510,478 | ||
| Pennsylvania Housing Finance Agency, Single Family Mortgage Rev., “125A”, 3.7%, 10/01/2037 | 1,075,000 | 1,154,538 | ||
| Pennsylvania Housing Finance Agency, Single Family Mortgage Rev., “134B”, 5%, 4/01/2023 | 510,000 | 556,390 | ||
| Pennsylvania Housing Finance Agency, Single Family Mortgage Rev., “134B”, 5%, 10/01/2023 | 760,000 | 844,149 | ||
| Pennsylvania Housing Finance Agency, Single Family Mortgage Rev., “134B”, 5%, 4/01/2024 | 850,000 | 960,342 | ||
| Pennsylvania Housing Finance Agency, Single Family Mortgage Rev., “134B”, 5%, 10/01/2024 | 845,000 | 970,539 | ||
| Issuer | Shares/Par | Value ($) | ||
| Municipal Bonds – continued | ||||
| Single Family Housing - State – continued | ||||
| Pennsylvania Housing Finance Agency, Single Family Mortgage Rev., “134B”, 5%, 4/01/2025 | $ | 500,000 | $ 583,217 | |
| Pennsylvania Housing Finance Agency, Single Family Mortgage Rev., “134B”, 5%, 10/01/2025 | 300,000 | 354,799 | ||
| Texas Department of Housing & Community Affairs Residential Mortgage Rev., “A”, FNMA, 4.75%, 1/01/2049 | 430,000 | 483,577 | ||
| $ 8,198,254 | ||||
| State & Local Agencies – 6.9% | ||||
| Colorado State University Board of Governors, System Enterprise Refunding Rev., “E”, 4%, 3/01/2043 | $ | 655,000 | $ 743,888 | |
| Commonwealth Financing Authority Rev., “A-2”, 5%, 6/01/2036 (Prerefunded 6/01/2022) | 1,500,000 | 1,584,681 | ||
| Commonwealth of Pennsylvania, Tobacco Master Settlement Financing Authority Rev., 5%, 6/01/2034 | 1,000,000 | 1,220,212 | ||
| Delaware Valley, PA, Regional Finance Authority, “C”, FLR, 0.878% (LIBOR - 3mo. + 0.75%), 6/01/2037 | 745,000 | 730,254 | ||
| New Jersey Economic Development Authority Rev. (School Facilities Construction), 5%, 6/15/2032 | 10,000 | 12,672 | ||
| New Jersey Economic Development Authority Rev. (School Facilities Construction), 5%, 6/15/2033 | 10,000 | 12,588 | ||
| New Jersey Economic Development Authority Rev. (School Facilities Construction), 4%, 6/15/2034 | 5,000 | 5,759 | ||
| New Jersey Economic Development Authority Rev. (School Facilities Construction), 4%, 6/15/2035 | 25,000 | 28,708 | ||
| New Jersey Economic Development Authority Rev. (School Facilities Construction), 4%, 6/15/2036 | 15,000 | 17,158 | ||
| New Jersey Economic Development Authority Rev. (School Facilities Construction), 4%, 6/15/2037 | 20,000 | 22,792 | ||
| New Jersey Economic Development Authority Rev. (School Facilities Construction), 4%, 6/15/2038 | 25,000 | 28,399 | ||
| New Jersey Economic Development Authority Rev. (School Facilities Construction), 4%, 6/15/2039 | 20,000 | 22,671 | ||
| New Jersey Economic Development Authority Rev. (School Facilities Construction), 4%, 6/15/2040 | 30,000 | 33,946 | ||
| New Jersey Economic Development Authority Rev. (School Facilities Construction), 4%, 6/15/2041 | 15,000 | 16,921 | ||
| Issuer | Shares/Par | Value ($) | ||
| State & Local Agencies – continued | ||||
| New Jersey Economic Development Authority Rev. (School Facilities Construction), “AAA”, 5%, 6/15/2026 | $ | 155,000 | $ 186,124 | |
| New Jersey Economic Development Authority Rev. (School Facilities Construction), “LLL”, 5%, 6/15/2039 | 340,000 | 412,075 | ||
| Pennsylvania Public School Building Authority, School Lease Rev. (School District of Philadelphia Project), “A”, AGM, 5%, 6/01/2033 | 1,255,000 | 1,519,243 | ||
| Philadelphia, PA, Authority for Industrial Development Rev. (Rebuild Project), 5%, 5/01/2037 | 250,000 | 306,031 | ||
| Philadelphia, PA, Authority for Industrial Development Rev. (Rebuild Project), 5%, 5/01/2038 | 1,000,000 | 1,221,237 | ||
| Philadelphia, PA, Redevelopment Authority City Agreement Rev., “A”, 5%, 4/15/2028 | 1,000,000 | 1,166,557 | ||
| Philadelphia, PA, Redevelopment Authority City Service Agreement Refunding Rev., “B”, 5%, 4/15/2027 | 2,165,000 | 2,494,877 | ||
| Philadelphia, PA, Redevelopment Authority Refunding Rev. (Neighborhood Transformation Initiative), BAM, 5%, 4/15/2024 | 1,000,000 | 1,047,890 | ||
| $ 12,834,683 | ||||
| Student Loan Revenue – 0.2% | ||||
| Pennsylvania Higher Educational Assistance Agency, Education Loan Rev., “A”, 5%, 6/01/2029 | $ | 325,000 | $ 391,793 | |
| Tax - Other – 1.7% | ||||
| Allentown, PA, Neighborhood Improvement Zone Development Authority Tax Rev. (City Center Project), 5.375%, 5/01/2042 (n) | $ | 300,000 | $ 348,619 | |
| Allentown, PA, Neighborhood Improvement Zone Development Authority Tax Rev. (City Center Refunding Project), 5%, 5/01/2042 (n) | 500,000 | 573,041 | ||
| Allentown, PA, Neighborhood Improvement Zone Development Authority Tax Rev., “A”, 5%, 5/01/2035 | 750,000 | 778,080 | ||
| Guam Government Ltd. Obligation Rev., “A”, 5%, 12/01/2035 | 115,000 | 130,433 | ||
| Guam Government Ltd. Obligation Rev., “A”, 5%, 12/01/2036 | 60,000 | 67,890 | ||
| Guam Government Ltd. Obligation Rev., “A”, 5%, 12/01/2046 | 185,000 | 205,926 | ||
| Puerto Rico Convention Center District Authority, Hotel Occupancy Tax Rev., “A”, AAC, 5%, 7/01/2031 | 155,000 | 158,590 | ||
| Puerto Rico Infrastructure Financing Authority Special Tax Rev., “C”, AAC, 5.5%, 7/01/2026 | 655,000 | 720,348 | ||
| Issuer | Shares/Par | Value ($) | ||
| Municipal Bonds – continued | ||||
| Tax - Other – continued | ||||
| Wisconsin Public Finance Authority Limited Obligation PILOT Rev. (American Dream at Meadowlands Project), 7%, 12/01/2050 | $ | 105,000 | $ 121,250 | |
| $ 3,104,177 | ||||
| Tax Assessment – 0.3% | ||||
| Washington County, PA, Redevelopment Authority Refunding Rev. (Victory Centre Tax Increment Financing Project), 5%, 7/01/2035 | $ | 500,000 | $ 540,596 | |
| Tobacco – 0.6% | ||||
| Buckeye, OH, Tobacco Settlement Financing Authority Senior Asset-Backed Refunding, 2020A-2, “1”, 5%, 6/01/2036 | $ | 110,000 | $ 137,764 | |
| Buckeye, OH, Tobacco Settlement Financing Authority Senior Asset-Backed Refunding, 2020B-3, Capital Appreciation, “2”, 0%, 6/01/2057 | 2,055,000 | 310,734 | ||
| Illinois Railsplitter Tobacco Settlement Authority Rev., 6%, 6/01/2028 (Prerefunded 6/01/2021) | 755,000 | 761,914 | ||
| $ 1,210,412 | ||||
| Toll Roads – 3.6% | ||||
| Delaware River Port Authority Rev., 5%, 1/01/2029 | $ | 1,145,000 | $ 1,286,359 | |
| Pennsylvania Turnpike Commission Rev., ”A“, 4%, 12/01/2050 | 3,000,000 | 3,434,903 | ||
| Pennsylvania Turnpike Commission Subordinate Rev., “A”, AGM, 4%, 12/01/2049 | 1,500,000 | 1,715,046 | ||
| Texas Private Activity Surface Transportation Corp., Senior Lien Rev. (NTE Mobility Partners Segments 3 LLC Segments 3A & 3B Facility), 7%, 12/31/2038 | 140,000 | 159,734 | ||
| Texas Private Activity Surface Transportation Corp., Senior Lien Rev. (NTE Mobility Partners Segments 3 LLC Segments 3A & 3B Facility), 6.75%, 6/30/2043 | 110,000 | 124,713 | ||
| $ 6,720,755 | ||||
| Transportation - Special Tax – 4.0% | ||||
| Commonwealth of Puerto Rico Highway & Transportation Authority Rev., “AA-1”, AGM, 4.95%, 7/01/2026 | $ | 145,000 | $ 148,010 | |
| Commonwealth of Puerto Rico Highway & Transportation Authority Rev., “D”, AGM, 5%, 7/01/2032 | 270,000 | 278,750 | ||
| Commonwealth of Puerto Rico Highway & Transportation Authority Rev., “L”, AAC, 5.25%, 7/01/2038 | 765,000 | 861,160 | ||
| Commonwealth of Puerto Rico Highway & Transportation Authority Rev., “N”, AAC, 5.5%, 7/01/2029 | 755,000 | 838,610 | ||
| Issuer | Shares/Par | Value ($) | ||
| Transportation - Special Tax – continued | ||||
| Commonwealth of Puerto Rico Highway & Transportation Authority Rev., “N”, AAC, 5.25%, 7/01/2030 | $ | 75,000 | $ 82,342 | |
| Commonwealth of Puerto Rico Highway & Transportation Authority Rev., “N”, NPFG, 5.25%, 7/01/2032 | 90,000 | 99,822 | ||
| Commonwealth of Puerto Rico Highway & Transportation Authority Rev., “N”, NPFG, 5.25%, 7/01/2033 | 55,000 | 60,944 | ||
| Commonwealth of Puerto Rico Highway & Transportation Authority Rev., Unrefunded Balance, “A”, NPFG, 5%, 7/01/2038 | 20,000 | 20,510 | ||
| Metropolitan Transportation Authority Rev., NY, Anticipation Note, “B-2”, 5%, 5/15/2021 | 545,000 | 547,618 | ||
| Metropolitan Transportation Authority Rev., NY, Anticipation Note, “D-1”, 5%, 9/01/2022 | 395,000 | 418,588 | ||
| New Jersey Transportation Trust Fund Authority, “AA”, 5%, 6/15/2045 | 100,000 | 121,394 | ||
| New Jersey Transportation Trust Fund Authority, Federal Highway Reimbursement Rev., “A-1”, 5%, 6/15/2027 | 215,000 | 256,946 | ||
| New Jersey Transportation Trust Fund Authority, Transportation System, “A”, 5%, 12/15/2039 | 85,000 | 102,912 | ||
| New Jersey Transportation Trust Fund Authority, Transportation System, “BB”, 5%, 6/15/2044 | 85,000 | 101,084 | ||
| Pennsylvania Turnpike Commission (Motor License Fund), “B”, 5%, 12/01/2030 (Prerefunded 12/01/2021) | 1,000,000 | 1,032,170 | ||
| Southeastern, PA, Transportation Authority Capital Grant Receipts Refunding (Federal Transit Administration Section 5337 State of Good Repair Formula Program Funds), 5%, 6/01/2022 | 2,365,000 | 2,497,376 | ||
| $ 7,468,236 | ||||
| Universities - Colleges – 8.3% | ||||
| Adams County, PA, General Obligation (Gettysburg College), 5%, 8/15/2033 | $ | 2,100,000 | $ 2,679,133 | |
| Allegheny County, PA, Higher Education Building Authority Rev. (Duquesne University), “A”, 5%, 3/01/2032 (Prerefunded 3/01/2025) | 500,000 | 586,276 | ||
| Dallas, PA, Municipal Authority, University Rev. (Misericordia University Project), 5%, 5/01/2039 | 1,200,000 | 1,381,113 | ||
| Erie, PA, Higher Education Building Authority Rev. (Gannon University), “A”, 5.5%, 5/01/2040 | 1,000,000 | 1,002,069 | ||
| Northampton County, PA, General Purpose Authority College Rev. (Lafayette College), 4%, 11/01/2038 | 1,000,000 | 1,127,893 | ||
| Northeastern, PA, Hospital & Education Authority College Rev. (King's College Project), 5%, 5/01/2049 | 1,000,000 | 1,142,679 | ||
| Issuer | Shares/Par | Value ($) | ||
| Municipal Bonds – continued | ||||
| Universities - Colleges – continued | ||||
| Pennsylvania Higher Educational Facilities Authority Rev. (Drexel University), “A”, AGM, 5%, 5/01/2027 | $ | 600,000 | $ 744,798 | |
| Pennsylvania Higher Educational Facilities Authority Rev. (Drexel University), “A”, AGM, 5%, 5/01/2046 | 1,750,000 | 2,140,867 | ||
| Pennsylvania Higher Educational Facilities Authority Rev. (Duquesne University), “A”, 4%, 3/01/2037 | 750,000 | 856,560 | ||
| Pennsylvania Higher Educational Facilities Authority Rev. (Duquesne University), “A”, 5%, 3/01/2039 | 750,000 | 912,348 | ||
| Pennsylvania Higher Educational Facilities Authority Rev. (Saint Francis University Project), “JJ2”, 6.25%, 11/01/2041 (Prerefunded 11/01/2021) | 500,000 | 517,408 | ||
| Pennsylvania Public School Building Authority Rev. (Montgomery County Community College), 5%, 5/01/2033 | 1,000,000 | 1,149,209 | ||
| Puerto Rico Industrial, Tourist, Educational, Medical & Environmental Control Facilities Financing Authority, Higher Education Rev. (Ana G. Mendez University System Project), 5.375%, 4/01/2042 | 95,000 | 96,425 | ||
| University of Puerto Rico Rev., “P”, NPFG, 5%, 6/01/2025 | 25,000 | 25,637 | ||
| Wilkes-Barre, PA, Finance Authority Rev. (University of Scranton), “A”, 5%, 11/01/2026 | 1,000,000 | 1,174,695 | ||
| $ 15,537,110 | ||||
| Universities - Dormitories – 1.5% | ||||
| California Municipal Finance Authority, Student Housing Rev. (CHF-Davis I LLC - West Village Student Housing Project), BAM, 5%, 5/15/2051 | $ | 1,025,000 | $ 1,219,533 | |
| East Hempfield Township, PA, Industrial Development Authority Rev. (Student Services, Inc., Student Housing Project at Millersville University of Pennsylvania), 5%, 7/01/2046 | 1,000,000 | 1,019,071 | ||
| Maryland Economic Development Corp., Student Housing Rev. (Morgan State University Project), 5%, 7/01/2056 | 80,000 | 93,952 | ||
| Pennsylvania Higher Educational Facilities Authority Rev. (Shippensburg University Student Services, Inc. Housing Project), 6.25%, 10/01/2043 (Prerefunded 10/01/2021) | 500,000 | 514,875 | ||
| $ 2,847,431 | ||||
| Issuer | Shares/Par | Value ($) | ||
| Utilities - Cogeneration – 0.2% | ||||
| Puerto Rico Industrial, Tourist, Educational, Medical & Environmental Control Facilities Financing Authority Rev. (Cogeneration Facilities - AES Puerto Rico Project), 9.12%, 6/01/2022 | $ | 365,000 | $ 374,125 | |
| Utilities - Municipal Owned – 1.4% | ||||
| Guam Power Authority Rev., “A”, AGM, 5%, 10/01/2039 | $ | 95,000 | $ 105,368 | |
| Guam Power Authority Rev., “A”, AGM, 5%, 10/01/2044 | 105,000 | 115,985 | ||
| Philadelphia, PA, Gas Works Rev., 5%, 8/01/2031 | 500,000 | 580,739 | ||
| Puerto Rico Electric Power Authority Rev., “A”, 5%, 7/01/2029 (a)(d) | 390,000 | 352,950 | ||
| Puerto Rico Electric Power Authority Rev., “A”, 5%, 7/01/2042 (a)(d) | 55,000 | 49,775 | ||
| Puerto Rico Electric Power Authority Rev., “AAA”, 5.25%, 7/01/2021 (a)(d) | 25,000 | 22,687 | ||
| Puerto Rico Electric Power Authority Rev., “AAA”, 5.25%, 7/01/2030 (a)(d) | 15,000 | 13,612 | ||
| Puerto Rico Electric Power Authority Rev., “CCC”, 5.25%, 7/01/2027 (a)(d) | 140,000 | 127,050 | ||
| Puerto Rico Electric Power Authority Rev., “DDD”, 5%, 7/01/2020 (a)(d) | 15,000 | 13,537 | ||
| Puerto Rico Electric Power Authority Rev., “DDD”, 5%, 7/01/2021 (a)(d) | 150,000 | 135,750 | ||
| Puerto Rico Electric Power Authority Rev., “DDD”, 5%, 7/01/2022 (a)(d) | 245,000 | 221,725 | ||
| Puerto Rico Electric Power Authority Rev., “EEE”, 6.05%, 7/01/2032 (a)(d) | 80,000 | 70,900 | ||
| Puerto Rico Electric Power Authority Rev., “TT”, 5%, 7/01/2021 (a)(d) | 65,000 | 58,825 | ||
| Puerto Rico Electric Power Authority Rev., “TT”, 5%, 7/01/2023 (a)(d) | 65,000 | 58,825 | ||
| Puerto Rico Electric Power Authority Rev., “TT”, 5%, 7/01/2027 (a)(d) | 10,000 | 9,050 | ||
| Puerto Rico Electric Power Authority Rev., “TT”, 5%, 7/01/2037 (a)(d) | 200,000 | 181,000 | ||
| Puerto Rico Electric Power Authority Rev., “V”, NPFG, 5.25%, 7/01/2033 | 75,000 | 83,105 | ||
| Puerto Rico Electric Power Authority Rev., “VV”, NPFG, 5.25%, 7/01/2034 | 15,000 | 16,597 | ||
| Puerto Rico Electric Power Authority Rev., “WW”, 5.375%, 7/01/2022 (a)(d) | 10,000 | 9,088 | ||
| Puerto Rico Electric Power Authority Rev., “WW”, 5.25%, 7/01/2025 (a)(d) | 30,000 | 27,225 | ||
| Puerto Rico Electric Power Authority Rev., “ZZ”, 5%, 7/01/2018 (a)(d) | 95,000 | 84,669 | ||
| Puerto Rico Electric Power Authority Rev., “ZZ”, 5.25%, 7/01/2023 (a)(d) | 105,000 | 95,287 | ||
| Puerto Rico Electric Power Authority Rev., “ZZ”, 5.25%, 7/01/2024 (a)(d) | 30,000 | 27,225 | ||
| Puerto Rico Electric Power Authority Rev., “ZZ”, 5.25%, 7/01/2026 (a)(d) | 95,000 | 86,212 | ||
| $ 2,547,186 | ||||
| Issuer | Shares/Par | Value ($) | ||
| Municipal Bonds – continued | ||||
| Utilities - Other – 0.4% | ||||
| Public Authority for Colorado Energy Natural Gas Purchase Rev., 6.5%, 11/15/2038 | $ | 280,000 | $ 429,801 | |
| Tennessee Energy Acquisition Corp., Gas Rev., “A”, 5.25%, 9/01/2022 | 235,000 | 251,006 | ||
| $ 680,807 | ||||
| Water & Sewer Utility Revenue – 12.1% | ||||
| Allegheny County, PA, Sanitation Authority Sewer Rev., BAM, 5%, 12/01/2030 | $ | 500,000 | $ 596,771 | |
| Allegheny County, PA, Sanitation Authority Sewer Rev., “A”, 5%, 6/01/2032 | 300,000 | 394,989 | ||
| Allegheny County, PA, Sanitation Authority Sewer Rev., “A”, 4%, 6/01/2033 | 250,000 | 303,572 | ||
| Allegheny County, PA, Sanitation Authority Sewer Rev., “B”, 5%, 6/01/2032 | 550,000 | 724,146 | ||
| Bucks County, PA, Water & Sewer Authority, Water System Rev., 5%, 12/01/2033 (Prerefunded 12/01/2021) | 1,000,000 | 1,032,170 | ||
| Cambria County, PA, Greater Johnstown Water Authority Rev., AGM, 4%, 8/15/2041 | 2,000,000 | 2,275,419 | ||
| Canonsburg-Houston, PA, Joint Authority Sewer Rev., “A”, 5%, 12/01/2040 | 1,000,000 | 1,172,009 | ||
| Capital Region Water Sewer System Rev., 5%, 7/15/2042 | 1,000,000 | 1,210,639 | ||
| Clairton, PA, Municipal Authority Sewer Rev., “B”, 5%, 12/01/2042 | 500,000 | 525,248 | ||
| Erie, PA, Water Authority Rev., “A”, AGM, 5%, 12/01/2043 | 1,000,000 | 1,219,180 | ||
| Erie, PA, Water Authority Rev., “A”, AGM, 4%, 12/01/2050 | 995,000 | 1,123,104 | ||
| Erie, PA, Water Authority Rev., “D”, BAM, 4%, 12/01/2041 | 1,500,000 | 1,719,755 | ||
| Guam Waterworks Authority Rev. (Water and Wastewater System), 5.25%, 7/01/2021 | 120,000 | 121,353 | ||
| Guam Waterworks Authority Rev. (Water and Wastewater System), “A”, 5%, 1/01/2050 | 205,000 | 246,383 | ||
| Pennsylvania Economic Development Financing Authority Sewage Sludge Disposal Refunding Rev. (Philadelphia Biosolids Facility Project), 4%, 1/01/2031 | 1,000,000 | 1,164,950 | ||
| Issuer | Shares/Par | Value ($) | ||
| Water & Sewer Utility Revenue – continued | ||||
| Pennsylvania Economic Development Financing Authority Sewage Sludge Disposal Refunding Rev. (Philadelphia Biosolids Facility Project), 4%, 1/01/2032 | $ | 500,000 | $ 584,777 | |
| Philadelphia, PA, Water and Wastewater Rev., “A”, 5%, 10/01/2037 | 1,000,000 | 1,230,394 | ||
| Philadelphia, PA, Water and Wastewater Rev., “A”, 5%, 10/01/2038 | 1,000,000 | 1,247,323 | ||
| Pittsburgh, PA, Water & Sewer Authority Rev., “B”, AGM, 5%, 9/01/2033 | 675,000 | 875,360 | ||
| Pittsburgh, PA, Water & Sewer Authority Rev., “B”, AGM, 5%, 9/01/2034 | 500,000 | 646,164 | ||
| Pittsburgh, PA, Water and Sewer System Authority Subordinate Refunding Rev., “B”, AGM, 4%, 9/01/2034 | 2,500,000 | 2,986,559 | ||
| Williamsport, PA, Sanitary Authority Sewer Rev., BAM, 5%, 1/01/2030 | 870,000 | 1,118,684 | ||
| $ 22,518,949 | ||||
| Total Municipal Bonds (Identified Cost, $171,575,545) | $182,039,617 | |||
| Bonds – 0.2% | ||||
| Consumer Services – 0.2% | ||||
| Toll Road Investors Partnership II LP, Capital Appreciation, NPFG, 0%, 2/15/2025 (n) | $ | 270,000 | $ 235,794 | |
| Toll Road Investors Partnership II LP, Capital Appreciation, NPFG, 0%, 2/15/2043 (n) | 500,000 | 142,402 | ||
| Total Bonds (Identified Cost, $403,661) | $ 378,196 | |||
| Investment Companies (h) – 1.8% | ||||
| Money Market Funds – 1.8% | ||||
| MFS Institutional Money Market Portfolio, 0.05% (v) (Identified Cost, $3,316,601) | 3,316,601 | $ 3,316,601 | ||
| Other Assets, Less Liabilities – 0.4% | 774,821 | |||
| Net Assets – 100.0% | $186,509,235 | |||
| Issuer | Shares/Par | Value ($) | ||
| Municipal Bonds – 96.9% | ||||
| Airport Revenue – 3.6% | ||||
| Charleston County, SC, Airport District Rev., 5%, 7/01/2037 | $ | 505,000 | $ 619,195 | |
| Charleston County, SC, Airport District Rev., 5%, 7/01/2038 | 750,000 | 917,124 | ||
| Charleston County, SC, Airport District Rev., 5%, 7/01/2039 | 450,000 | 548,864 | ||
| Charleston County, SC, Airport District Rev., 5%, 7/01/2043 | 1,250,000 | 1,509,773 | ||
| Charleston County, SC, Airport District Rev., 5%, 7/01/2048 | 1,500,000 | 1,800,941 | ||
| Charleston County, SC, Airport District Rev., “A”, 5.25%, 7/01/2021 | 2,000,000 | 2,023,075 | ||
| Dallas and Fort Worth, TX, International Airport Rev., “B”, 5%, 11/01/2044 | 220,000 | 235,002 | ||
| Dallas and Fort Worth, TX, International Airport Rev., “C”, 5%, 11/01/2045 | 155,000 | 159,064 | ||
| Horry County, SC, Airport Rev. (Myrtle Beach International Airport), “A”, 5%, 7/01/2040 | 2,250,000 | 2,257,414 | ||
| Wayne County, MI, Airport Authority Rev. (Detroit Metropolitan Wayne County Airport), “B”, 5%, 12/01/2044 | 90,000 | 103,142 | ||
| Wayne County, MI, Airport Authority Rev. (Detroit Metropolitan Wayne County Airport), “B”, BAM, 5%, 12/01/2039 | 10,000 | 11,460 | ||
| Wayne County, MI, Airport Authority Rev. (Detroit Metropolitan Wayne County Airport), “C”, 5%, 12/01/2039 | 75,000 | 85,371 | ||
| Wayne County, MI, Airport Authority Rev. (Detroit Metropolitan Wayne County Airport), “C”, 5%, 12/01/2044 | 120,000 | 136,593 | ||
| $ 10,407,018 | ||||
| General Obligations - General Purpose – 7.1% | ||||
| Aiken County, SC, County Administration Building Project, 5%, 3/01/2025 (Prerefunded 3/01/2022) | $ | 910,000 | $ 949,923 | |
| Bridgeview, IL, Stadium and Redevelopment Projects, AAC, 5.14%, 12/01/2036 | 475,000 | 464,328 | ||
| Charleston County, SC, General Obligation Park & Recreation District, 4%, 2/01/2023 | 1,210,000 | 1,294,279 | ||
| Charleston County, SC, General Obligation Park & Recreation District, 4%, 2/01/2024 | 1,030,000 | 1,137,657 | ||
| Charleston County, SC, General Obligation Park & Recreation District, 4%, 2/01/2025 | 800,000 | 907,429 | ||
| Charleston County, SC, General Obligation Park & Recreation District, 4%, 2/01/2028 | 1,335,000 | 1,616,574 | ||
| Charleston County, SC, General Obligation Park & Recreation District, 4%, 2/01/2030 | 620,000 | 770,654 | ||
| Charleston County, SC, General Obligation, “C”, 5%, 11/01/2026 | 2,055,000 | 2,463,816 | ||
| Issuer | Shares/Par | Value ($) | ||
| General Obligations - General Purpose – continued | ||||
| Chicago, IL, General Obligation (Neighborhood Alive 21 Program), “B”, 5.5%, 1/01/2037 | $ | 105,000 | $ 117,202 | |
| Chicago, IL, General Obligation Refunding Project, “A”, 5.25%, 1/01/2030 | 70,000 | 76,134 | ||
| Chicago, IL, General Obligation, “A”, 5%, 1/01/2025 | 325,000 | 367,125 | ||
| Chicago, IL, General Obligation, “A”, 5%, 1/01/2026 | 95,000 | 109,843 | ||
| Chicago, IL, General Obligation, “A”, 5%, 1/01/2027 | 105,000 | 123,876 | ||
| Chicago, IL, General Obligation, “A”, 5.25%, 1/01/2033 | 405,000 | 439,718 | ||
| Commonwealth of Puerto Rico, General Obligation, “A”, 8%, 7/01/2035 (a)(d) | 2,435,000 | 1,911,475 | ||
| Commonwealth of Puerto Rico, Public Improvement, “A”, AGM, 5%, 7/01/2035 | 35,000 | 36,180 | ||
| Commonwealth of Puerto Rico, Public Improvement, “A-4”, AGM, 5.25%, 7/01/2030 | 65,000 | 67,274 | ||
| Commonwealth of Puerto Rico, Public Improvement, “A-4”, AGM, 5%, 7/01/2031 | 145,000 | 149,699 | ||
| Lancaster County, SC, General Obligation Refunding, 3%, 3/01/2039 | 725,000 | 787,550 | ||
| North Charleston, SC, General Obligation, 5%, 12/01/2024 | 675,000 | 786,551 | ||
| Puerto Rico Public Buildings Authority Government Facilities Rev., “M-2”, AAC, 10%, 7/01/2035 | 105,000 | 110,345 | ||
| South Carolina General Obligation State Institution Bonds, “A”, 5%, 4/01/2034 | 1,810,000 | 2,437,281 | ||
| South Carolina General Obligation State Institution Bonds, “D”, 5%, 4/01/2034 | 850,000 | 1,144,579 | ||
| State of Illinois, General Obligation, 5.5%, 5/01/2039 | 190,000 | 233,753 | ||
| State of Illinois, General Obligation, 5.75%, 5/01/2045 | 175,000 | 217,691 | ||
| State of Illinois, General Obligation, “A”, 5%, 3/01/2028 | 250,000 | 300,933 | ||
| State of Illinois, General Obligation, “A”, 5%, 3/01/2029 | 370,000 | 451,508 | ||
| State of Illinois, General Obligation, “A”, 5%, 3/01/2030 | 340,000 | 419,377 | ||
| State of Illinois, General Obligation, “A”, 5%, 3/01/2031 | 495,000 | 617,337 | ||
| $ 20,510,091 | ||||
| General Obligations - Schools – 14.4% | ||||
| Aiken County, SC, Consolidated School District Special Obligation, 4%, 6/01/2035 | $ | 275,000 | $ 325,024 | |
| Issuer | Shares/Par | Value ($) | ||
| Municipal Bonds – continued | ||||
| General Obligations - Schools – continued | ||||
| Aiken County, SC, Consolidated School District Special Obligation, 3.125%, 6/01/2041 | $ | 1,400,000 | $ 1,512,284 | |
| Aiken County, SC, Consolidated School District Special Obligation, “A”, 4%, 4/01/2036 | 2,000,000 | 2,370,172 | ||
| Anderson County, SC, School District, “A”, 5%, 3/01/2026 | 1,240,000 | 1,507,057 | ||
| Beaufort County, SC, School District Tax Anticipation Notes, 3%, 6/30/2021 | 6,700,000 | 6,748,179 | ||
| Charleston County, SC, School District General Obligation (Sales Tax Projects - Phase IV), “B”, 5%, 5/12/2021 | 3,000,000 | 3,016,593 | ||
| Chesterfield County, SC, School District, 5%, 3/01/2025 | 1,000,000 | 1,042,594 | ||
| Darlington County, SC, General Obligation School District, 5%, 3/01/2026 | 4,025,000 | 4,891,859 | ||
| Downey, CA, Unified School District (Election of 2014), “B”, 4%, 8/01/2040 | 1,295,000 | 1,501,258 | ||
| Lexington County, SC, School District No. 1, “A”, 5%, 3/01/2023 | 1,030,000 | 1,124,190 | ||
| Richland County, SC, School District No. 1, “A”, 5%, 3/01/2025 (Prerefunded 9/01/2021) | 2,000,000 | 2,039,808 | ||
| Richland County, SC, School District No. 1, “A”, 5%, 3/01/2029 (Prerefunded 9/01/2021) | 3,000,000 | 3,059,711 | ||
| Richland County, SC, School District No. 1, General Obligation Refunding, “D”, 5%, 3/01/2024 | 1,850,000 | 2,102,517 | ||
| Richland County, SC, School District No. 2, General Obligation Refunding, 5%, 3/01/2023 | 2,825,000 | 3,082,199 | ||
| Spartanburg County, SC, School District No. 2 General Obligation, 5%, 3/01/2028 | 1,030,000 | 1,281,314 | ||
| Spartanburg County, SC, School District No. 7, General Obligation, “B”, 5%, 3/01/2048 | 2,000,000 | 2,458,682 | ||
| Spartanburg County, SC, School District No. 7, General Obligation, “D”, 5%, 3/01/2042 | 3,000,000 | 3,723,922 | ||
| $ 41,787,363 | ||||
| Healthcare Revenue - Hospitals – 12.4% | ||||
| Allegheny County, PA, Hospital Development Authority Rev. (Allegheny Health Network Obligated Group), “A”, 4%, 4/01/2044 | $ | 255,000 | $ 279,391 | |
| Chattanooga, TN, Health, Educational & Housing Facility Board Rev. (CommonSpirit Health), “A-1”, 4%, 8/01/2044 | 15,000 | 16,643 | ||
| Chattanooga, TN, Health, Educational & Housing Facility Board Rev. (CommonSpirit Health), “A-2”, 5%, 8/01/2044 | 20,000 | 24,251 | ||
| Chattanooga, TN, Health, Educational & Housing Facility Board Rev. (CommonSpirit Health), “A-2”, 5%, 8/01/2049 | 10,000 | 12,035 | ||
| Issuer | Shares/Par | Value ($) | ||
| Healthcare Revenue - Hospitals – continued | ||||
| Colorado Health Facilities Authority Rev. (CommonSpirit Health), “A-2”, 4%, 8/01/2044 | $ | 120,000 | $ 133,145 | |
| Doylestown, PA, Hospital Rev., “A”, 4%, 7/01/2045 | 30,000 | 31,175 | ||
| Greenwood County, SC, Hospital Facilities Refunding Rev. (Self Regional Healthcare), 4%, 10/01/2036 | 1,500,000 | 1,681,313 | ||
| Greenwood County, SC, Hospital Facilities Refunding Rev. (Self Regional Healthcare), “B”, 5%, 10/01/2031 | 1,950,000 | 2,024,263 | ||
| Jefferson Parish, LA, Hospital Service District No. 2 Hospital Rev. (East Jefferson General Hospital), 6.25%, 7/01/2031 (Prerefunded 7/01/2021) | 155,000 | 157,253 | ||
| Jefferson Parish, LA, Hospital Service District No. 2 Hospital Rev. (East Jefferson General Hospital), 6.375%, 7/01/2041 (Prerefunded 7/01/2021) | 180,000 | 182,670 | ||
| Knox County, TN, Health, Educational & Housing Facility Board Rev. (University Health Systems, Inc.), “A”, 5%, 9/01/2030 | 1,115,000 | 1,378,194 | ||
| Lexington County, SC, Health Services District, Inc., Hospital Rev., 5%, 11/01/2026 (Prerefunded 11/01/2021) | 175,000 | 179,812 | ||
| Lexington County, SC, Health Services District, Inc., Hospital Rev., 5%, 11/01/2026 | 325,000 | 332,649 | ||
| Lexington County, SC, Health Services District, Inc., Hospital Rev., 4%, 11/01/2031 | 1,000,000 | 1,139,945 | ||
| Lexington County, SC, Health Services District, Inc., Hospital Rev., 4%, 11/01/2032 | 1,000,000 | 1,136,192 | ||
| Lexington County, SC, Health Services District, Inc., Hospital Rev., 5%, 11/01/2035 | 1,000,000 | 1,162,335 | ||
| Lexington County, SC, Health Services District, Inc., Hospital Rev., 5%, 11/01/2036 | 1,000,000 | 1,158,751 | ||
| South Carolina Jobs & Economic Development Authority, Hospital Facilities Rev. (Bon Secours Mercy Health, Inc.), “A”, 5%, 12/01/2046 | 2,000,000 | 2,488,023 | ||
| South Carolina Jobs & Economic Development Authority, Hospital Rev. (Anmed Health), 5%, 2/01/2038 | 1,500,000 | 1,706,551 | ||
| South Carolina Jobs & Economic Development Authority, Hospital Rev. (Conway Hospital, Inc.), 5%, 7/01/2037 (Prerefunded 7/01/2022) | 1,250,000 | 1,324,845 | ||
| South Carolina Jobs & Economic Development Authority, Hospital Rev. (Conway Hospital, Inc.), 5.25%, 7/01/2047 | 2,000,000 | 2,281,179 | ||
| South Carolina Jobs & Economic Development Authority, Hospital Rev. (Hampton Regional Medical Center Project), 5%, 11/01/2037 | 500,000 | 555,617 | ||
| South Carolina Jobs & Economic Development Authority, Hospital Rev. (McLeod Health Projects), 4%, 11/01/2048 | 2,000,000 | 2,200,568 | ||
| Issuer | Shares/Par | Value ($) | ||
| Municipal Bonds – continued | ||||
| Healthcare Revenue - Hospitals – continued | ||||
| South Carolina Jobs & Economic Development Authority, Hospital Rev. (Palmetto Health), “A”, 5.25%, 8/01/2030 (Prerefunded 8/01/2023) | $ | 1,000,000 | $ 1,116,195 | |
| South Carolina Jobs & Economic Development Authority, Hospital Rev. (Palmetto Health), “A”, AGM, 6.5%, 8/01/2039 (Prerefunded 8/01/2021) | 2,000,000 | 2,040,758 | ||
| South Carolina Jobs & Economic Development Authority, Hospital Rev. (Prisma Health Obligated Group), 5%, 5/01/2037 | 2,000,000 | 2,412,642 | ||
| Spartanburg County, SC, Regional Health Services District Hospital Rev., “A”, 5%, 4/15/2037 (Prerefunded 4/15/2022) | 30,000 | 31,446 | ||
| Spartanburg County, SC, Regional Health Services District Hospital Rev., “A”, 5%, 4/15/2037 | 1,970,000 | 2,054,753 | ||
| Spartanburg County, SC, Regional Health Services District Hospital Rev., “A”, 4%, 4/15/2043 | 3,340,000 | 3,668,270 | ||
| Spartanburg County, SC, Regional Health Services District Hospital Rev., “A”, AGM, 5%, 4/15/2034 | 1,000,000 | 1,260,578 | ||
| Spartanburg County, SC, Regional Health Services District Hospital Rev., “A”, AGM, 4%, 4/15/2036 | 450,000 | 520,301 | ||
| Spartanburg County, SC, Regional Health Services District Hospital Rev., “A”, AGM, 4%, 4/15/2037 | 550,000 | 633,578 | ||
| Spartanburg County, SC, Regional Health Services District, Inc. Hospital Rev., “A”, AGM, 5%, 4/15/2027 | 580,000 | 707,386 | ||
| $ 36,032,707 | ||||
| Healthcare Revenue - Long Term Care – 1.8% | ||||
| South Carolina Jobs & Economic Development Authority Rev. (Bishop Gadsden Episcopal Retirement Community), “A”, 5%, 4/01/2049 | $ | 1,250,000 | $ 1,377,634 | |
| South Carolina Jobs & Economic Development Authority, Health Facilities Rev. (Lutheran Homes of South Carolina, Inc.), 5%, 5/01/2043 | 750,000 | 757,463 | ||
| South Carolina Jobs & Economic Development Authority, Health Facilities Rev. (Lutheran Homes of South Carolina, Inc.), 5.125%, 5/01/2048 | 250,000 | 252,656 | ||
| South Carolina Jobs & Economic Development Authority, Health Facilities Rev. (Lutheran Homes of South Carolina, Inc.), “B”, 5%, 5/01/2042 | 750,000 | 771,312 | ||
| South Carolina Jobs & Economic Development Authority, Health Facilities Rev. (Wesley Commons), 5%, 10/01/2036 (n) | 1,000,000 | 1,044,331 | ||
| Issuer | Shares/Par | Value ($) | ||
| Healthcare Revenue - Long Term Care – continued | ||||
| South Carolina Jobs & Economic Development Authority, Residential Care Facilities Rev. (South Carolina Episcopal Home at Still Hopes), 5%, 4/01/2047 | $ | 1,000,000 | $ 1,066,230 | |
| $ 5,269,626 | ||||
| Industrial Revenue - Other – 0.3% | ||||
| Port Beaumont, TX, Navigation District Facility Rev. (Jefferson Gulf Coast Energy Project), “A”, 3.625%, 1/01/2035 (n) | $ | 100,000 | $ 102,192 | |
| Tuscaloosa County, AL, Industrial Development Authority, Gulf Opportunity Zone (Hunt Refining Project), “A”, 4.5%, 5/01/2032 (n) | 285,000 | 316,736 | ||
| Tuscaloosa County, AL, Industrial Development Authority, Gulf Opportunity Zone (Hunt Refining Project), “A”, 5.25%, 5/01/2044 (n) | 395,000 | 448,884 | ||
| $ 867,812 | ||||
| Industrial Revenue - Paper – 0.4% | ||||
| Richland County, SC, Environmental Improvement Rev. (International Paper), “A”, 3.875%, 4/01/2023 | $ | 1,000,000 | $ 1,061,781 | |
| Valparaiso, IN, Exempt Facilities Rev. (Pratt Paper LLC Project), 7%, 1/01/2044 | 100,000 | 111,977 | ||
| $ 1,173,758 | ||||
| Miscellaneous Revenue - Other – 0.0% | ||||
| Summit County, OH, Port Authority Building Rev. (Flats East Development Recovery Zone Facility Bonds), 6.875%, 5/15/2040 | $ | 45,000 | $ 45,138 | |
| Port Revenue – 4.5% | ||||
| Port Authority of NY & NJ (221st Series), 4%, 7/15/2045 | $ | 1,820,000 | $ 2,056,058 | |
| South Carolina Port Authority Rev., 5%, 7/01/2028 | 300,000 | 347,644 | ||
| South Carolina Port Authority Rev., 5%, 7/01/2029 | 450,000 | 521,471 | ||
| South Carolina Port Authority Rev., 5%, 7/01/2033 (Prerefunded 7/01/2025) | 500,000 | 591,478 | ||
| South Carolina Port Authority Rev., 5%, 7/01/2036 | 3,000,000 | 3,687,153 | ||
| South Carolina Port Authority Rev., 4%, 7/01/2055 | 2,000,000 | 2,225,251 | ||
| South Carolina Ports Authority Rev. (tax-exempt), “B”, 5%, 7/01/2044 | 3,000,000 | 3,637,618 | ||
| $ 13,066,673 | ||||
| Sales & Excise Tax Revenue – 3.1% | ||||
| Illinois Sales Tax Securitization Corp., Second Lien, “A”, 5%, 1/01/2026 | $ | 95,000 | $ 112,067 | |
| Illinois Sales Tax Securitization Corp., Second Lien, “A”, 5%, 1/01/2027 | 185,000 | 223,476 | ||
| Illinois Sales Tax Securitization Corp., Second Lien, “A”, 5%, 1/01/2028 | 185,000 | 228,028 | ||
| Issuer | Shares/Par | Value ($) | ||
| Municipal Bonds – continued | ||||
| Sales & Excise Tax Revenue – continued | ||||
| Illinois Sales Tax Securitization Corp., Second Lien, “A”, 5%, 1/01/2029 | $ | 35,000 | $ 43,842 | |
| Illinois Sales Tax Securitization Corp., Second Lien, “A”, 5%, 1/01/2030 | 85,000 | 108,070 | ||
| Illinois Sales Tax Securitization Corp., Second Lien, “A”, 5%, 1/01/2036 | 80,000 | 99,022 | ||
| Illinois Sales Tax Securitization Corp., Second Lien, “A”, 5%, 1/01/2037 | 105,000 | 130,269 | ||
| Illinois Sales Tax Securitization Corp., Second Lien, “A”, 4%, 1/01/2038 | 40,000 | 45,602 | ||
| Illinois Sales Tax Securitization Corp., Second Lien, “A”, 4%, 1/01/2039 | 45,000 | 51,152 | ||
| Illinois Sales Tax Securitization Corp., Second Lien, “A”, 4%, 1/01/2040 | 50,000 | 56,912 | ||
| Puerto Rico Sales Tax Financing Corp., Restructured Sales Tax Rev., “2019A-1”, 4.55%, 7/01/2040 | 49,000 | 53,106 | ||
| Puerto Rico Sales Tax Financing Corp., Restructured Sales Tax Rev., “2019A-1”, 5%, 7/01/2058 | 3,610,000 | 3,975,260 | ||
| Puerto Rico Sales Tax Financing Corp., Restructured Sales Tax Rev., “2019A-2”, 4.329%, 7/01/2040 | 450,000 | 481,374 | ||
| Puerto Rico Sales Tax Financing Corp., Restructured Sales Tax Rev., “2019A-2”, 4.329%, 7/01/2040 | 163,000 | 174,364 | ||
| Puerto Rico Sales Tax Financing Corp., Restructured Sales Tax Rev., “2019A-2”, 4.536%, 7/01/2053 | 4,000 | 4,289 | ||
| Puerto Rico Sales Tax Financing Corp., Restructured Sales Tax Rev., “2019A-2”, 4.784%, 7/01/2058 | 71,000 | 76,829 | ||
| Puerto Rico Sales Tax Financing Corp., Restructured Sales Tax Rev., Capital Appreciation, “2019A-1”, 0%, 7/01/2024 | 7,000 | 6,570 | ||
| Puerto Rico Sales Tax Financing Corp., Restructured Sales Tax Rev., Capital Appreciation, “2019A-1”, 0%, 7/01/2027 | 79,000 | 69,210 | ||
| Puerto Rico Sales Tax Financing Corp., Restructured Sales Tax Rev., Capital Appreciation, “2019A-1”, 0%, 7/01/2029 | 14,000 | 11,530 | ||
| Puerto Rico Sales Tax Financing Corp., Restructured Sales Tax Rev., Capital Appreciation, “2019A-1”, 0%, 7/01/2031 | 725,000 | 554,872 | ||
| Puerto Rico Sales Tax Financing Corp., Restructured Sales Tax Rev., Capital Appreciation, “2019A-1”, 0%, 7/01/2033 | 695,000 | 493,327 | ||
| Puerto Rico Sales Tax Financing Corp., Restructured Sales Tax Rev., Capital Appreciation, “2019A-1”, 0%, 7/01/2046 | 5,158,000 | 1,574,067 | ||
| Wisconsin Public Finance Authority Limited Obligation Grant Rev. (American Dream at Meadowlands Project), “A”, 6.25%, 8/01/2027 (n) | 405,000 | 440,112 | ||
| Issuer | Shares/Par | Value ($) | ||
| Sales & Excise Tax Revenue – continued | ||||
| Wisconsin Public Finance Authority Limited Obligation Grant Rev. (American Dream at Meadowlands Project), ”A“, 5.625%, 8/01/2024 (n) | $ | 100,000 | $ 103,866 | |
| $ 9,117,216 | ||||
| Secondary Schools – 0.2% | ||||
| District of Columbia Rev. (Rocketship D.C.), “A”, 5%, 6/01/2049 (n) | $ | 250,000 | $ 275,098 | |
| North Texas Education Finance Corp., Education Rev. (Uplift Education), “A”, 5.125%, 12/01/2042 (Prerefunded 6/01/2022) | 220,000 | 232,473 | ||
| $ 507,571 | ||||
| Single Family Housing - State – 4.4% | ||||
| Connecticut Housing Finance Authority Rev. (Housing Mortgage Finance Program), “C-1”, 4%, 11/15/2047 | $ | 695,000 | $ 750,311 | |
| Maryland Community Development Administration, Department of Housing & Community Development Housing Rev., “A”, 4.25%, 9/01/2049 | 965,000 | 1,078,704 | ||
| Pennsylvania Housing Finance Agency, Single Family Mortgage Rev., “125A”, 3.7%, 10/01/2037 | 975,000 | 1,047,140 | ||
| South Carolina Housing Finance & Development Authority Mortgage Rev., “A”, 4%, 7/01/2050 | 2,920,000 | 3,305,335 | ||
| South Carolina Housing Finance & Development Authority Mortgage Rev., “B”, 3.25%, 1/01/2052 | 3,000,000 | 3,304,858 | ||
| South Carolina Housing, Finance & Development Authority Rev., “A”, 3.75%, 7/01/2043 | 635,000 | 676,602 | ||
| South Carolina Housing, Finance & Development Authority Rev., “A”, 3.8%, 1/01/2049 | 635,000 | 674,098 | ||
| Tennessee Housing Development Agency, Residential Finance Program Rev., “1”, 4.25%, 1/01/2050 | 1,030,000 | 1,143,496 | ||
| Texas Department of Housing & Community Affairs Residential Mortgage Rev., “A”, FNMA, 4.75%, 1/01/2049 | 660,000 | 742,235 | ||
| $ 12,722,779 | ||||
| State & Local Agencies – 12.7% | ||||
| Berkeley County, SC, School District Special Obligation, 5%, 12/01/2021 | $ | 1,000,000 | $ 1,031,832 | |
| Charleston County, SC, Special Source Rev., “C”, 5%, 12/01/2021 | 1,000,000 | 1,032,035 | ||
| Charleston, SC, Educational Excellence Finance Corp. Rev. (Charleston County School District Project), “B”, 5%, 12/01/2030 (Prerefunded 12/01/2023) | 3,595,000 | 4,047,697 | ||
| Issuer | Shares/Par | Value ($) | ||
| Municipal Bonds – continued | ||||
| State & Local Agencies – continued | ||||
| Commonwealth of Pennsylvania, Tobacco Master Settlement Financing Authority Rev., 5%, 6/01/2032 | $ | 55,000 | $ 67,677 | |
| Commonwealth of Pennsylvania, Tobacco Master Settlement Financing Authority Rev., 5%, 6/01/2033 | 45,000 | 55,113 | ||
| Commonwealth of Pennsylvania, Tobacco Master Settlement Financing Authority Rev., 5%, 6/01/2034 | 25,000 | 30,505 | ||
| Delaware Valley, PA, Regional Finance Authority, “C”, FLR, 0.878% (LIBOR - 3mo. + 0.75%), 6/01/2037 | 1,330,000 | 1,303,675 | ||
| Dillon County, SC, School Facilities Corp., 5%, 12/01/2028 | 590,000 | 745,379 | ||
| Dillon County, SC, School Facilities Corp., 5%, 12/01/2032 | 1,625,000 | 2,040,242 | ||
| Dillon County, SC, School Facilities Corp., 5%, 12/01/2033 | 1,705,000 | 2,132,227 | ||
| Florence, SC, Public Facilities Corp., Installment Purchase Rev., “B”, 4%, 11/01/2030 | 1,035,000 | 1,272,733 | ||
| Florence, SC, Public Facilities Corp., Installment Purchase Rev., “B”, 4%, 11/01/2031 | 500,000 | 609,208 | ||
| Florence, SC, Public Facilities Corp., Installment Purchase Rev., “B”, 4%, 11/01/2032 | 500,000 | 603,948 | ||
| Greenwood, SC, Fifty School Facilities, Inc., Installment Purchase Rev. (Greenwood School District No. 50), BAM, 5%, 12/01/2028 | 3,000,000 | 3,624,125 | ||
| Laurens County, SC, School District No. 55, 5%, 12/01/2021 | 515,000 | 531,220 | ||
| Maryland Stadium Authority Rev., Baltimore City Public Schools Construction and Revitalization Program, “A”, 5%, 5/01/2047 (Prerefunded 5/01/2028) | 240,000 | 306,707 | ||
| Maryland Stadium Authority Rev., Baltimore City Public Schools Construction and Revitalization Program, “A”, 5%, 5/01/2047 | 465,000 | 552,944 | ||
| New Jersey Building Authority Rev., Unrefunded Balance, “A”, BAM, 5%, 6/15/2029 | 35,000 | 41,574 | ||
| New Jersey Economic Development Authority Rev. (School Facilities Construction), 5%, 6/15/2032 | 20,000 | 25,344 | ||
| New Jersey Economic Development Authority Rev. (School Facilities Construction), 5%, 6/15/2033 | 10,000 | 12,588 | ||
| New Jersey Economic Development Authority Rev. (School Facilities Construction), 4%, 6/15/2034 | 10,000 | 11,517 | ||
| New Jersey Economic Development Authority Rev. (School Facilities Construction), 4%, 6/15/2035 | 35,000 | 40,192 | ||
| Issuer | Shares/Par | Value ($) | ||
| State & Local Agencies – continued | ||||
| New Jersey Economic Development Authority Rev. (School Facilities Construction), 4%, 6/15/2036 | $ | 30,000 | $ 34,317 | |
| New Jersey Economic Development Authority Rev. (School Facilities Construction), 4%, 6/15/2037 | 30,000 | 34,187 | ||
| New Jersey Economic Development Authority Rev. (School Facilities Construction), 4%, 6/15/2038 | 45,000 | 51,119 | ||
| New Jersey Economic Development Authority Rev. (School Facilities Construction), 4%, 6/15/2039 | 35,000 | 39,674 | ||
| New Jersey Economic Development Authority Rev. (School Facilities Construction), 4%, 6/15/2040 | 40,000 | 45,261 | ||
| New Jersey Economic Development Authority Rev. (School Facilities Construction), 4%, 6/15/2041 | 25,000 | 28,202 | ||
| New Jersey Economic Development Authority Rev. (School Facilities Construction), “AAA”, 5%, 6/15/2026 | 230,000 | 276,185 | ||
| New Jersey Economic Development Authority Rev. (School Facilities Construction), “LLL”, 5%, 6/15/2039 | 490,000 | 593,873 | ||
| New Jersey Economic Development Authority Rev., School Facilities Construction, “LLL”, 5%, 6/15/2044 | 815,000 | 975,506 | ||
| Orangeburg County, SC, Facilities Corp. Installment Purchase Rev. (Detention Center Project), 4%, 12/01/2042 | 2,000,000 | 2,184,617 | ||
| Pennsylvania Public School Building Authority, School Lease Rev. (School District of Philadelphia Project), “A”, AGM, 5%, 6/01/2033 | 1,115,000 | 1,349,766 | ||
| Scago, SC, Educational Facilities Installment Purchase Rev. (School District of Pickens County Project), 5%, 12/01/2028 | 2,000,000 | 2,336,814 | ||
| Square County, SC, Redevelopment Corp. Installment Purchase Rev. (Greenville County, South Carolina Project), 4%, 4/01/2026 | 400,000 | 466,256 | ||
| Square County, SC, Redevelopment Corp. Installment Purchase Rev. (Greenville County, South Carolina Project), 5%, 4/01/2027 | 655,000 | 818,373 | ||
| Square County, SC, Redevelopment Corp. Installment Purchase Rev. (Greenville County, South Carolina Project), 5%, 4/01/2028 | 400,000 | 510,933 | ||
| Square County, SC, Redevelopment Corp. Installment Purchase Rev. (Greenville County, South Carolina Project), 5%, 4/01/2030 | 300,000 | 397,995 | ||
| Square County, SC, Redevelopment Corp. Installment Purchase Rev. (Greenville County, South Carolina Project), 5%, 4/01/2031 | 400,000 | 539,351 | ||
| Square County, SC, Redevelopment Corp. Installment Purchase Rev. (Greenville County, South Carolina Project), 4%, 4/01/2032 | 350,000 | 435,628 | ||
| Issuer | Shares/Par | Value ($) | ||
| Municipal Bonds – continued | ||||
| State & Local Agencies – continued | ||||
| Square County, SC, Redevelopment Corp. Installment Purchase Rev. (Greenville County, South Carolina Project), 4%, 4/01/2033 | $ | 600,000 | $ 741,342 | |
| Sumter, SC, School Facilities, Inc., Installment Purchase Rev. (Sumter Two School Facilities, Inc.), BAM, 5%, 12/01/2026 | 1,000,000 | 1,173,806 | ||
| Sumter, SC, School Facilities, Inc., Installment Purchase Rev. (Sumter Two School Facilities, Inc.), BAM, 5%, 12/01/2027 | 1,195,000 | 1,395,083 | ||
| Williamsburg County, SC, Public Facilities Corp. Installment Purchase Refunding Rev. (Williamsburg County Project), BAM, 4%, 6/01/2027 | 890,000 | 1,053,837 | ||
| Williamsburg County, SC, Public Facilities Corp. Installment Purchase Refunding Rev. (Williamsburg County Project), BAM, 4%, 6/01/2029 | 535,000 | 649,673 | ||
| Williamsburg County, SC, Public Facilities Corp. Installment Purchase Refunding Rev. (Williamsburg County Project), BAM, 4%, 6/01/2031 | 500,000 | 605,891 | ||
| $ 36,856,171 | ||||
| Tax - Other – 3.5% | ||||
| Birmingham-Jefferson, AL, Civic Center Authority, “B”, 5%, 7/01/2043 | $ | 940,000 | $ 1,107,298 | |
| Guam Government Ltd. Obligation Rev., “A”, 5%, 12/01/2035 | 180,000 | 204,157 | ||
| Guam Government Ltd. Obligation Rev., “A”, 5%, 12/01/2036 | 95,000 | 107,492 | ||
| Guam Government Ltd. Obligation Rev., “A”, 5%, 12/01/2046 | 285,000 | 317,237 | ||
| Illinois Sports Facilities Authority Refunding Rev., BAM, 5%, 6/15/2029 | 1,260,000 | 1,591,646 | ||
| Myrtle Beach, SC, Tax Increment Refunding Bonds Rev. (Myrtle Beach Air Force Base Redevelopment Project Area), 5%, 10/01/2030 | 1,000,000 | 1,188,485 | ||
| North Charleston, SC, Limited Obligation Bond (Hospitality Fee Pledge), “A”, 5%, 10/01/2040 | 2,000,000 | 2,364,555 | ||
| North Charleston, SC, Limited Obligation Bond (Tax Increment Pledge), 4%, 10/01/2032 | 685,000 | 836,676 | ||
| Puerto Rico Convention Center District Authority, Hotel Occupancy Tax Rev., “A”, AAC, 5%, 7/01/2031 | 405,000 | 414,381 | ||
| Puerto Rico Infrastructure Financing Authority Special Tax Rev., “C”, AAC, 5.5%, 7/01/2024 | 440,000 | 473,659 | ||
| Puerto Rico Infrastructure Financing Authority Special Tax Rev., “C”, AAC, 5.5%, 7/01/2025 | 50,000 | 54,507 | ||
| Issuer | Shares/Par | Value ($) | ||
| Tax - Other – continued | ||||
| Puerto Rico Infrastructure Financing Authority Special Tax Rev., “C”, AAC, 5.5%, 7/01/2026 | $ | 1,245,000 | $ 1,369,212 | |
| Wisconsin Public Finance Authority Limited Obligation PILOT Rev. (American Dream at Meadowlands Project), 7%, 12/01/2050 | 165,000 | 190,535 | ||
| $ 10,219,840 | ||||
| Tax Assessment – 0.4% | ||||
| Berkeley County, SC, Assessment Rev. (Nexton Improvement District), 4.375%, 11/01/2049 (n) | $ | 1,000,000 | $ 1,099,266 | |
| Brunswick, MD, Special Obligation Refunding (Brunswick Crossing Special Taxing District), 4%, 7/01/2029 | 20,000 | 23,040 | ||
| Brunswick, MD, Special Obligation Refunding (Brunswick Crossing Special Taxing District), 5%, 7/01/2036 | 20,000 | 23,590 | ||
| $ 1,145,896 | ||||
| Tobacco – 0.6% | ||||
| Buckeye, OH, Tobacco Settlement Financing Authority Senior Asset-Backed Refunding, 2020A-2, “1”, 5%, 6/01/2036 | $ | 150,000 | $ 187,861 | |
| Buckeye, OH, Tobacco Settlement Financing Authority Senior Asset-Backed Refunding, 2020A-2, “1”, 4%, 6/01/2048 | 280,000 | 312,231 | ||
| Buckeye, OH, Tobacco Settlement Financing Authority Senior Asset-Backed Refunding, 2020B-3, Capital Appreciation, “2”, 0%, 6/01/2057 | 3,020,000 | 456,651 | ||
| Illinois Railsplitter Tobacco Settlement Authority Rev., 6%, 6/01/2028 (Prerefunded 6/01/2021) | 850,000 | 857,783 | ||
| $ 1,814,526 | ||||
| Toll Roads – 0.3% | ||||
| Virginia Small Business Financing Authority Rev. (Elizabeth River Crossings Opco LLC Project), 6%, 1/01/2037 | $ | 275,000 | $ 290,799 | |
| Virginia Small Business Financing Authority Rev. (Elizabeth River Crossings Opco LLC Project), 5.5%, 1/01/2042 | 535,000 | 559,318 | ||
| $ 850,117 | ||||
| Transportation - Special Tax – 7.8% | ||||
| Commonwealth of Puerto Rico Highway & Transportation Authority Rev., “AA-1”, AGM, 4.95%, 7/01/2026 | $ | 755,000 | $ 770,673 | |
| Commonwealth of Puerto Rico Highway & Transportation Authority Rev., “J”, NPFG, 5%, 7/01/2029 | 20,000 | 20,509 | ||
| Commonwealth of Puerto Rico Highway & Transportation Authority Rev., “L”, AAC, 5.25%, 7/01/2038 | 1,340,000 | 1,508,437 | ||
| Issuer | Shares/Par | Value ($) | ||
| Municipal Bonds – continued | ||||
| Transportation - Special Tax – continued | ||||
| Commonwealth of Puerto Rico Highway & Transportation Authority Rev., “N”, AAC, 5.5%, 7/01/2029 | $ | 1,125,000 | $ 1,249,585 | |
| Commonwealth of Puerto Rico Highway & Transportation Authority Rev., “N”, AAC, 5.25%, 7/01/2031 | 90,000 | 99,173 | ||
| Commonwealth of Puerto Rico Highway & Transportation Authority Rev., “N”, NPFG, 5.25%, 7/01/2032 | 435,000 | 482,471 | ||
| Commonwealth of Puerto Rico Highway & Transportation Authority Rev., “N”, NPFG, 5.25%, 7/01/2033 | 350,000 | 387,823 | ||
| Metropolitan Transportation Authority Rev., NY, Anticipation Note, “B-2”, 5%, 5/15/2021 | 820,000 | 823,940 | ||
| Metropolitan Transportation Authority Rev., NY, Anticipation Note, “D-1”, 5%, 9/01/2022 | 600,000 | 635,830 | ||
| New Jersey Transportation Trust Fund Authority, “AA”, 5%, 6/15/2045 | 150,000 | 182,091 | ||
| New Jersey Transportation Trust Fund Authority, “AA”, 5%, 6/15/2050 | 105,000 | 126,728 | ||
| New Jersey Transportation Trust Fund Authority, Federal Highway Reimbursement Rev., “A-1”, 5%, 6/15/2027 | 350,000 | 418,284 | ||
| New Jersey Transportation Trust Fund Authority, Transportation System, “A”, 5.25%, 12/15/2021 | 130,000 | 134,507 | ||
| New Jersey Transportation Trust Fund Authority, Transportation System, “A”, 5%, 12/15/2039 | 125,000 | 151,341 | ||
| New Jersey Transportation Trust Fund Authority, Transportation System, “BB”, 5%, 6/15/2044 | 125,000 | 148,653 | ||
| South Carolina Transportation Infrastructure Bank Refunding Rev., “A”, 5%, 10/01/2036 | 1,205,000 | 1,468,664 | ||
| South Carolina Transportation Infrastructure Bank Refunding Rev., “A”, 5%, 10/01/2037 | 1,500,000 | 1,823,707 | ||
| South Carolina Transportation Infrastructure Bank Refunding Rev., “A”, AGM, 5%, 10/01/2035 | 2,000,000 | 2,437,304 | ||
| South Carolina Transportation Infrastructure Bank Refunding Rev., “B”, 0.527%, 10/01/2031 (Put Date 10/01/2022) | 4,975,000 | 4,978,015 | ||
| South Carolina Transportation Infrastructure Bank Rev., “A”, 5%, 10/01/2030 | 2,000,000 | 2,523,421 | ||
| South Carolina Transportation Infrastructure Bank Rev., “A”, 5%, 10/01/2040 | 2,000,000 | 2,416,771 | ||
| $ 22,787,927 | ||||
| Universities - Colleges – 3.3% | ||||
| College of Charleston, SC, Academic & Administrative Facilities Refunding Rev., “A”, 5%, 4/01/2028 | $ | 1,030,000 | $ 1,311,652 | |
| College of Charleston, SC, Academic & Administrative Facilities Rev., “B”, 5%, 4/01/2022 | 1,205,000 | 1,261,866 | ||
| Issuer | Shares/Par | Value ($) | ||
| Universities - Colleges – continued | ||||
| Pinellas County, FL, Educational Facilities Authority Rev. (Barry University), 6%, 10/01/2041 | $ | 200,000 | $ 203,911 | |
| Puerto Rico Industrial, Tourist, Educational, Medical & Environmental Control Facilities Financing Authority, Higher Education Rev. (Ana G. Mendez University System Project), 5.125%, 4/01/2032 | 75,000 | 75,994 | ||
| Puerto Rico Industrial, Tourist, Educational, Medical & Environmental Control Facilities Financing Authority, Higher Education Rev. (Ana G. Mendez University System Project), 5.375%, 4/01/2042 | 125,000 | 126,875 | ||
| Puerto Rico Industrial, Tourist, Educational, Medical & Environmental Control Facilities Financing Authority, Higher Education Rev. (University of Sacred Heart), 4.375%, 10/01/2031 | 55,000 | 55,362 | ||
| Puerto Rico Industrial, Tourist, Educational, Medical & Environmental Control Facilities Financing Authority, Higher Education Rev. (University of Sacred Heart), 5%, 10/01/2042 | 70,000 | 71,050 | ||
| Red River, TX, Education Finance Corp., Higher Education Rev. (Houston Baptist University Project), 5.5%, 10/01/2046 | 390,000 | 446,026 | ||
| South Carolina Jobs & Economic Development Authority (Furman University), 5%, 10/01/2028 | 700,000 | 816,136 | ||
| South Carolina Jobs & Economic Development Authority (Wofford College), 5%, 4/01/2035 | 1,565,000 | 1,772,326 | ||
| South Carolina Jobs & Economic Development Authority (Wofford College), 5%, 4/01/2049 | 2,000,000 | 2,337,328 | ||
| University of Puerto Rico Rev., “P”, NPFG, 5%, 6/01/2025 | 30,000 | 30,764 | ||
| University of South Carolina, Athletic Facilities Rev., “A”, 5%, 5/01/2035 | 170,000 | 170,549 | ||
| University of South Carolina, Athletic Facilities Rev., “A”, 5%, 5/01/2040 | 335,000 | 336,081 | ||
| University of South Carolina, Higher Education Facilities Refunding Rev., “A”, 5%, 5/01/2040 | 575,000 | 689,194 | ||
| $ 9,705,114 | ||||
| Universities - Dormitories – 0.0% | ||||
| Maryland Economic Development Corp., Student Housing Rev. (Morgan State University Project), 5%, 7/01/2056 | $ | 125,000 | $ 146,800 | |
| Utilities - Cogeneration – 0.2% | ||||
| Puerto Rico Industrial, Tourist, Educational, Medical & Environmental Control Facilities Financing Authority Rev. (Cogeneration Facilities - AES Puerto Rico Project), 9.12%, 6/01/2022 | $ | 535,000 | $ 548,375 | |
| Issuer | Shares/Par | Value ($) | ||
| Municipal Bonds – continued | ||||
| Utilities - Municipal Owned – 4.8% | ||||
| Guam Power Authority Rev., “A”, AGM, 5%, 10/01/2039 | $ | 145,000 | $ 160,824 | |
| Guam Power Authority Rev., “A”, AGM, 5%, 10/01/2044 | 170,000 | 187,785 | ||
| Newberry, SC, Combined Public Utility System Refunding Rev., “A”, AGM, 4%, 9/01/2022 | 325,000 | 341,711 | ||
| Newberry, SC, Combined Public Utility System Refunding Rev., “A”, AGM, 4%, 9/01/2023 | 285,000 | 309,420 | ||
| Newberry, SC, Combined Public Utility System Refunding Rev., “A”, AGM, 4%, 9/01/2024 | 255,000 | 284,262 | ||
| Newberry, SC, Combined Public Utility System Refunding Rev., “A”, AGM, 4%, 9/01/2025 | 375,000 | 427,602 | ||
| Newberry, SC, Combined Public Utility System Refunding Rev., “A”, AGM, 4%, 9/01/2026 | 640,000 | 744,674 | ||
| Newberry, SC, Combined Public Utility System Refunding Rev., “A”, AGM, 4%, 9/01/2027 | 200,000 | 236,725 | ||
| Newberry, SC, Combined Public Utility System Refunding Rev., “A”, AGM, 5%, 9/01/2028 | 275,000 | 351,474 | ||
| Newberry, SC, Combined Public Utility System Refunding Rev., “A”, AGM, 5%, 9/01/2030 | 275,000 | 364,449 | ||
| Piedmont, SC, Municipal Power Agency, “C”, AGM, 5%, 1/01/2030 | 1,000,000 | 1,009,985 | ||
| Puerto Rico Electric Power Authority Rev., “A”, 5%, 7/01/2029 (a)(d) | 525,000 | 475,125 | ||
| Puerto Rico Electric Power Authority Rev., “A”, 5%, 7/01/2042 (a)(d) | 80,000 | 72,400 | ||
| Puerto Rico Electric Power Authority Rev., “AAA”, 5.25%, 7/01/2021 (a)(d) | 40,000 | 36,300 | ||
| Puerto Rico Electric Power Authority Rev., “AAA”, 5.25%, 7/01/2030 (a)(d) | 20,000 | 18,150 | ||
| Puerto Rico Electric Power Authority Rev., “CCC”, 5.25%, 7/01/2027 (a)(d) | 190,000 | 172,425 | ||
| Puerto Rico Electric Power Authority Rev., “DDD”, 5%, 7/01/2020 (a)(d) | 20,000 | 18,050 | ||
| Puerto Rico Electric Power Authority Rev., “DDD”, 5%, 7/01/2021 (a)(d) | 205,000 | 185,525 | ||
| Puerto Rico Electric Power Authority Rev., “DDD”, 5%, 7/01/2022 (a)(d) | 330,000 | 298,650 | ||
| Puerto Rico Electric Power Authority Rev., “EEE”, 6.05%, 7/01/2032 (a)(d) | 115,000 | 101,919 | ||
| Puerto Rico Electric Power Authority Rev., “TT”, 5%, 7/01/2021 (a)(d) | 100,000 | 90,500 | ||
| Puerto Rico Electric Power Authority Rev., “TT”, 5%, 7/01/2023 (a)(d) | 90,000 | 81,450 | ||
| Puerto Rico Electric Power Authority Rev., “TT”, 5%, 7/01/2027 (a)(d) | 15,000 | 13,575 | ||
| Issuer | Shares/Par | Value ($) | ||
| Utilities - Municipal Owned – continued | ||||
| Puerto Rico Electric Power Authority Rev., “TT”, 5%, 7/01/2037 (a)(d) | $ | 270,000 | $ 244,350 | |
| Puerto Rico Electric Power Authority Rev., “V”, NPFG, 5.25%, 7/01/2033 | 115,000 | 127,427 | ||
| Puerto Rico Electric Power Authority Rev., “VV”, NPFG, 5.25%, 7/01/2034 | 25,000 | 27,661 | ||
| Puerto Rico Electric Power Authority Rev., “WW”, 5.375%, 7/01/2022 (a)(d) | 15,000 | 13,631 | ||
| Puerto Rico Electric Power Authority Rev., “WW”, 5.25%, 7/01/2025 (a)(d) | 40,000 | 36,300 | ||
| Puerto Rico Electric Power Authority Rev., “ZZ”, 5%, 7/01/2018 (a)(d) | 120,000 | 106,950 | ||
| Puerto Rico Electric Power Authority Rev., “ZZ”, 5.25%, 7/01/2023 (a)(d) | 140,000 | 127,050 | ||
| Puerto Rico Electric Power Authority Rev., “ZZ”, 5.25%, 7/01/2024 (a)(d) | 45,000 | 40,838 | ||
| Puerto Rico Electric Power Authority Rev., “ZZ”, 5.25%, 7/01/2026 (a)(d) | 145,000 | 131,588 | ||
| Rock Hill, SC, Combined Utility System Rev., “A”, 4%, 1/01/2049 | 650,000 | 740,774 | ||
| Rock Hill, SC, Utility Systems Rev., 5%, 1/01/2041 | 1,000,000 | 1,153,791 | ||
| South Carolina Public Service Authority Refunding Rev., “A”, 4%, 12/01/2040 | 3,000,000 | 3,503,731 | ||
| South Carolina Public Service Authority Refunding Rev., “B”, 5%, 12/01/2038 | 500,000 | 554,182 | ||
| South Carolina Public Service Authority Rev., “A”, 5%, 12/01/2032 | 1,000,000 | 1,309,466 | ||
| $ 14,100,719 | ||||
| Utilities - Other – 0.8% | ||||
| Nebraska Central Plains Energy Project, Gas Project Rev., “3”, 5%, 9/01/2042 | $ | 790,000 | $ 838,805 | |
| Public Authority for Colorado Energy Natural Gas Purchase Rev., 6.25%, 11/15/2028 | 130,000 | 162,656 | ||
| Tennessee Energy Acquisition Corp., Gas Rev., “A”, 5.25%, 9/01/2021 | 270,000 | 275,460 | ||
| Tennessee Energy Acquisition Corp., Gas Rev., “A”, 5.25%, 9/01/2022 | 290,000 | 309,752 | ||
| Tennessee Energy Acquisition Corp., Gas Rev., “A”, 5.25%, 9/01/2026 | 570,000 | 692,008 | ||
| $ 2,278,681 | ||||
| Water & Sewer Utility Revenue – 10.3% | ||||
| Columbia, SC, Stormwater System Rev. (City Improvements), 5%, 2/01/2038 | $ | 755,000 | $ 929,566 | |
| Columbia, SC, Waterworks & Sewer System Rev., 4%, 2/01/2043 | 2,000,000 | 2,272,804 | ||
| Columbia, SC, Waterworks & Sewer System Rev., “A”, 4%, 2/01/2044 | 3,990,000 | 4,582,449 | ||
| Guam Waterworks Authority Rev. (Water and Wastewater System), 5%, 7/01/2036 | 90,000 | 102,536 | ||
| Guam Waterworks Authority Rev. (Water and Wastewater System), 5%, 1/01/2046 | 410,000 | 459,439 | ||
| Guam Waterworks Authority Rev. (Water and Wastewater System), “A”, 5%, 1/01/2050 | 300,000 | 360,561 | ||
| Issuer | Shares/Par | Value ($) | ||
| Municipal Bonds – continued | ||||
| Water & Sewer Utility Revenue – continued | ||||
| Kershaw County, SC, Waterworks System Rev. (Lugoff Water District), “B”, 5%, 7/01/2030 | $ | 500,000 | $ 600,398 | |
| Kershaw County, SC, Waterworks System Rev. (Lugoff Water District), “B”, 5%, 7/01/2035 | 500,000 | 592,983 | ||
| Lexington County, SC, Joint Municipal Water & Sewer Commission and Improvement Refunding Rev., “A”, 4%, 6/01/2040 | 1,235,000 | 1,438,941 | ||
| Lexington County, SC, Joint Municipal Water & Sewer Commission and Improvement Refunding Rev., “A”, 4%, 6/01/2043 | 1,260,000 | 1,456,727 | ||
| Lexington, SC, Waterworks & Sewer Systems Rev., 4%, 6/01/2041 | 2,000,000 | 2,315,697 | ||
| Michigan Finance Authority Local Government Loan Program Rev. (Detroit Water and Sewerage Department Sewage Disposal System Rev. Refunding Second Lien Local Project), “C-7”, NPFG, 5%, 7/01/2032 | 50,000 | 56,844 | ||
| Michigan Finance Authority Local Government Loan Program Rev. (Detroit Water and Sewerage Department Water Supply System Rev. Refunding Second Lien Local Project), “D-6”, NPFG, 5%, 7/01/2036 | 60,000 | 67,964 | ||
| Michigan Finance Authority Local Government Loan Program Rev. (Detroit Water and Sewerage Department Water Supply System Rev. Refunding Senior Lien Local Project), “D-1”, AGM, 5%, 7/01/2035 | 30,000 | 34,065 | ||
| Michigan Finance Authority Local Government Loan Program Rev. (Detroit Water and Sewerage Department Water Supply System Rev. Refunding Senior Lien Local Project), “D-1”, AGM, 5%, 7/01/2037 | 70,000 | 79,316 | ||
| Mount Pleasant, SC, Waterworks & Sewer System Rev., “A”, 5%, 6/01/2036 | 1,000,000 | 1,220,304 | ||
| Issuer | Shares/Par | Value ($) | ||
| Water & Sewer Utility Revenue – continued | ||||
| Mount Pleasant, SC, Waterworks & Sewer System Rev., “A”, 5%, 6/01/2037 | $ | 1,000,000 | $ 1,220,518 | |
| North Charleston, SC, Sewer District, 5%, 7/01/2039 | 3,425,000 | 3,891,425 | ||
| Spartanburg, SC, Sanitary Sewer District Convertible Rev., “B”, 5%, 3/01/2033 (Prerefunded 3/01/2023) | 1,000,000 | 1,092,252 | ||
| Spartanburg, SC, Sanitary Sewer District Convertible Rev., “B”, 5%, 3/01/2034 | 2,000,000 | 2,289,399 | ||
| Spartanburg, SC, Water System Refunding & Improvement Rev., “B”, 5%, 6/01/2039 | 4,000,000 | 4,885,651 | ||
| $ 29,949,839 | ||||
| Total Municipal Bonds (Identified Cost, $269,560,440) | $281,911,757 | |||
| Bonds – 0.2% | ||||
| Consumer Services – 0.2% | ||||
| Toll Road Investors Partnership II LP, Capital Appreciation, NPFG, 0%, 2/15/2025 (n) | $ | 420,000 | $ 366,790 | |
| Toll Road Investors Partnership II LP, Capital Appreciation, NPFG, 0%, 2/15/2043 (n) | 800,000 | 227,843 | ||
| Total Bonds (Identified Cost, $635,223) | $ 594,633 | |||
| Investment Companies (h) – 1.4% | ||||
| Money Market Funds – 1.4% | ||||
| MFS Institutional Money Market Portfolio, 0.05% (v) (Identified Cost, $3,938,050) | 3,938,050 | $ 3,938,050 | ||
| Other Assets, Less Liabilities – 1.5% | 4,344,875 | |||
| Net Assets – 100.0% | $290,789,315 | |||
| Issuer | Shares/Par | Value ($) | ||
| Municipal Bonds – 99.8% | ||||
| Airport Revenue – 8.3% | ||||
| Memphis-Shelby County, TN, Airport Authority Facilities Rev., 5%, 7/01/2037 | $ | 1,000,000 | $ 1,200,622 | |
| Memphis-Shelby County, TN, Airport Authority Facilities Rev., “A”, 4%, 7/01/2038 | 1,000,000 | 1,159,989 | ||
| Memphis-Shelby County, TN, Airport Authority Facilities Rev., “D”, 5%, 7/01/2025 | 1,000,000 | 1,011,602 | ||
| Memphis-Shelby County, TN, Airport Authority Rev., “A”, 5%, 7/01/2030 (w) | 750,000 | 965,114 | ||
| Memphis-Shelby County, TN, Airport Authority Rev., “A”, 5%, 7/01/2031 (w) | 250,000 | 325,329 | ||
| Metropolitan Government of Nashville, TN, Airport Authority Improvement Rev., “B”, 5%, 7/01/2035 | 1,100,000 | 1,267,282 | ||
| Metropolitan Nashville Airport Authority, TN, Airport Rev., “B”, 5%, 7/01/2049 | 1,000,000 | 1,212,630 | ||
| Metropolitan Nashville Airport Authority, TN, Airport Rev., “B”, 5%, 7/01/2054 | 1,000,000 | 1,207,665 | ||
| $ 8,350,233 | ||||
| General Obligations - General Purpose – 14.1% | ||||
| Bedford County, TN, General Obligation Refunding Rev., BAM, 5%, 4/01/2023 | $ | 1,190,000 | $ 1,301,823 | |
| Bridgeview, IL, Stadium and Redevelopment Projects, AAC, 5.14%, 12/01/2036 | 245,000 | 239,495 | ||
| Chicago, IL, General Obligation (Neighborhood Alive 21 Program), “B”, 5.5%, 1/01/2037 | 45,000 | 50,229 | ||
| Chicago, IL, General Obligation Refunding Project, “A”, 5.25%, 1/01/2030 | 30,000 | 32,629 | ||
| Chicago, IL, General Obligation, “A”, 5%, 1/01/2025 | 145,000 | 163,794 | ||
| Chicago, IL, General Obligation, “A”, 5%, 1/01/2026 | 40,000 | 46,250 | ||
| Chicago, IL, General Obligation, “A”, 5%, 1/01/2027 | 45,000 | 53,090 | ||
| Chicago, IL, General Obligation, “A”, 5.25%, 1/01/2033 | 175,000 | 190,002 | ||
| Commonwealth of Puerto Rico, General Obligation, “A”, 8%, 7/01/2035 (a)(d) | 1,045,000 | 820,325 | ||
| Commonwealth of Puerto Rico, Public Improvement, “A-4”, AGM, 5%, 7/01/2031 | 90,000 | 92,917 | ||
| Jackson, TN, General Obligation, 5%, 6/01/2031 | 1,000,000 | 1,275,297 | ||
| Memphis, TN, General Improvement, 4%, 6/01/2041 | 1,000,000 | 1,126,124 | ||
| Memphis, TN, General Improvement, “B”, 5%, 4/01/2031 | 1,000,000 | 1,128,860 | ||
| Memphis, TN, General Improvement, “B”, 5%, 4/01/2034 | 1,025,000 | 1,155,779 | ||
| Issuer | Shares/Par | Value ($) | ||
| General Obligations - General Purpose – continued | ||||
| Metropolitan Government of Nashville & Davidson County, TN, General Obligation, “C”, 5%, 1/01/2024 | $ | 1,500,000 | $ 1,693,532 | |
| Pigeon Forge, TN, Industrial Development Board, Public Facilities, 5%, 6/01/2034 | 1,000,000 | 1,005,715 | ||
| Puerto Rico Public Buildings Authority Government Facilities Rev., “M-2”, AAC, 10%, 7/01/2035 | 190,000 | 199,672 | ||
| State of Illinois, General Obligation, 5.5%, 5/01/2039 | 150,000 | 184,542 | ||
| State of Illinois, General Obligation, “A”, 5%, 3/01/2028 | 90,000 | 108,336 | ||
| State of Illinois, General Obligation, “A”, 5%, 3/01/2029 | 130,000 | 158,638 | ||
| State of Illinois, General Obligation, “A”, 5%, 3/01/2030 | 120,000 | 148,015 | ||
| State of Illinois, General Obligation, “A”, 5%, 3/01/2031 | 175,000 | 218,250 | ||
| State of Tennessee, “A”, 5%, 10/01/2029 (Prerefunded 10/01/2021) | 1,500,000 | 1,535,615 | ||
| Sullivan County, TN, General Obligation, 5%, 5/01/2027 | 1,000,000 | 1,253,421 | ||
| $ 14,182,350 | ||||
| General Obligations - Schools – 2.7% | ||||
| Berks County, PA, Reading School District, AGM, 5%, 3/01/2036 | $ | 25,000 | $ 30,185 | |
| Williamson County, TN, School District, 5%, 4/01/2026 | 740,000 | 901,717 | ||
| Wilson County, TN, Tenth Special School District, Limited Obligation, 4%, 4/01/2037 | 460,000 | 542,548 | ||
| Wilson County, TN, Tenth Special School District, Limited Obligation, 4%, 4/01/2038 | 460,000 | 539,214 | ||
| Wilson County, TN, Tenth Special School District, Limited Obligation, 4%, 4/01/2039 | 605,000 | 707,241 | ||
| $ 2,720,905 | ||||
| Healthcare Revenue - Hospitals – 16.3% | ||||
| Chattanooga, TN, Health, Educational & Housing Facility Board Rev. (Catholic Health Initiatives), “A”, 5%, 10/01/2044 | $ | 1,000,000 | $ 1,078,948 | |
| Chattanooga, TN, Health, Educational & Housing Facility Board Rev. (Catholic Health Initiatives), “A”, 5.25%, 1/01/2045 (Prerefunded 1/01/2023) | 500,000 | 542,980 | ||
| Chattanooga, TN, Health, Educational & Housing Facility Board Rev. (CommonSpirit Health), “A-2”, 5%, 8/01/2044 | 500,000 | 606,280 | ||
| Chattanooga, TN, Health, Educational & Housing Facility Board Rev. (CommonSpirit Health), “A-2”, 5%, 8/01/2049 | 1,000,000 | 1,203,506 | ||
| Issuer | Shares/Par | Value ($) | ||
| Municipal Bonds – continued | ||||
| Healthcare Revenue - Hospitals – continued | ||||
| Doylestown, PA, Hospital Rev., “A”, 4%, 7/01/2045 | $ | 10,000 | $ 10,392 | |
| Greenville, TN, Health and Educational Facilities Board Hospital Rev. (Ballad Health), “A”, 4%, 7/01/2040 | 1,000,000 | 1,104,610 | ||
| Jackson, TN, Hospital Refunding Rev. (Jackson-Madison County General Hospital), 4%, 4/01/2041 | 425,000 | 451,467 | ||
| Jackson, TN, Hospital Rev. (Jackson-Madison County General Hospital), 5%, 4/01/2028 | 1,500,000 | 1,709,637 | ||
| Jackson, TN, Hospital Rev. (Jackson-Madison County General Hospital), “A”, 5%, 4/01/2041 | 1,000,000 | 1,204,211 | ||
| Knox County, TN, Health, Educational & Housing Facility Board Hospital Rev. (Covenant Health), “A”, 5%, 1/01/2033 | 1,000,000 | 1,182,496 | ||
| Knox County, TN, Health, Educational & Housing Facility Board Hospital Rev. (East Tennessee Children's Hospital), 5%, 11/15/2038 | 1,000,000 | 1,207,383 | ||
| Knox County, TN, Health, Educational & Housing Facility Board Rev. (University Health Systems, Inc.), 5%, 4/01/2036 | 750,000 | 870,430 | ||
| Knox County, TN, Health, Educational & Housing Facility Board Rev. (University Health Systems, Inc.), 5%, 9/01/2036 | 1,000,000 | 1,147,437 | ||
| Metropolitan Government of Nashville & Davidson County, TN, Health & Educational Facilities Board Rev. (Vanderbilt University Medical Center), “A”, 4%, 7/01/2047 | 1,500,000 | 1,661,262 | ||
| Miami-Dade County, FL, Health Facilities Authority Hospital Rev., Unrefunded Balance, 6%, 8/01/2030 | 25,000 | 25,099 | ||
| New Jersey Health Care Facilities, Financing Authority Rev. (University Hospital), “A”, AGM, 5%, 7/01/2046 | 100,000 | 112,964 | ||
| Shelby County, TN, Health, Educational & Housing Facility Board Rev. (Methodist Healthcare), “A”, 5%, 5/01/2035 | 1,500,000 | 1,774,273 | ||
| Spartanburg County, SC, Regional Health Services District Hospital Rev., “A”, 4%, 4/15/2043 | 420,000 | 461,279 | ||
| $ 16,354,654 | ||||
| Healthcare Revenue - Long Term Care – 2.7% | ||||
| Metropolitan Government of Nashville & Davidson County, TN, Health & Educational Facilities Board Rev. (Blakeford at Green Hills), 5%, 7/01/2037 (Prerefunded 7/01/2022) | $ | 1,000,000 | $ 1,056,656 | |
| Metropolitan Government of Nashville & Davidson County, TN, Health & Educational Facilities Board Rev. (Blakeford at Green Hills), “A”, 4%, 11/01/2045 | 1,000,000 | 1,039,237 | ||
| Issuer | Shares/Par | Value ($) | ||
| Healthcare Revenue - Long Term Care – continued | ||||
| Shelby County, TN, Health, Educational & Housing Facility Board, Residential Care Facility Mortgage Rev. (Village at Germantown), 5.25%, 12/01/2049 | $ | 550,000 | $ 585,648 | |
| $ 2,681,541 | ||||
| Industrial Revenue - Other – 0.4% | ||||
| Tuscaloosa County, AL, Industrial Development Authority, Gulf Opportunity Zone (Hunt Refining Project), “A”, 5.25%, 5/01/2044 (n) | $ | 310,000 | $ 352,289 | |
| Miscellaneous Revenue - Other – 2.9% | ||||
| Metropolitan Government of Nashville & Davidson County, TN, Sports Authority Rev., Public Improvement, “A”, 5%, 8/01/2023 | $ | 1,205,000 | $ 1,328,678 | |
| Metropolitan Nashville Airport Authority, Special Facilities Rev. (Aero Nashville LLC Project), 5.2%, 7/01/2026 | 535,000 | 535,380 | ||
| New York Liberty Development Corp., Liberty Rev. (7 World Trade Center Project), 5%, 9/15/2040 | 980,000 | 1,019,531 | ||
| $ 2,883,589 | ||||
| Sales & Excise Tax Revenue – 2.9% | ||||
| Guam Government Business Privilege Tax Rev., “A”, 5.25%, 1/01/2036 | $ | 300,000 | $ 309,566 | |
| Guam Government Business Privilege Tax Rev., “D”, 5%, 11/15/2031 | 270,000 | 303,606 | ||
| Illinois Sales Tax Securitization Corp., Second Lien, “A”, 5%, 1/01/2026 | 40,000 | 47,186 | ||
| Illinois Sales Tax Securitization Corp., Second Lien, “A”, 5%, 1/01/2027 | 80,000 | 96,638 | ||
| Illinois Sales Tax Securitization Corp., Second Lien, “A”, 5%, 1/01/2028 | 75,000 | 92,444 | ||
| Illinois Sales Tax Securitization Corp., Second Lien, “A”, 5%, 1/01/2029 | 20,000 | 25,053 | ||
| Illinois Sales Tax Securitization Corp., Second Lien, “A”, 5%, 1/01/2030 | 35,000 | 44,499 | ||
| Illinois Sales Tax Securitization Corp., Second Lien, “A”, 5%, 1/01/2036 | 35,000 | 43,322 | ||
| Illinois Sales Tax Securitization Corp., Second Lien, “A”, 5%, 1/01/2037 | 50,000 | 62,033 | ||
| Illinois Sales Tax Securitization Corp., Second Lien, “A”, 4%, 1/01/2040 | 50,000 | 56,912 | ||
| Puerto Rico Sales Tax Financing Corp., Restructured Sales Tax Rev., “2019A-1”, 4.55%, 7/01/2040 | 23,000 | 24,927 | ||
| Puerto Rico Sales Tax Financing Corp., Restructured Sales Tax Rev., “2019A-1”, 5%, 7/01/2058 | 164,000 | 180,594 | ||
| Puerto Rico Sales Tax Financing Corp., Restructured Sales Tax Rev., “2019A-2”, 4.329%, 7/01/2040 | 226,000 | 241,757 | ||
| Puerto Rico Sales Tax Financing Corp., Restructured Sales Tax Rev., “2019A-2”, 4.329%, 7/01/2040 | 76,000 | 81,299 | ||
| Issuer | Shares/Par | Value ($) | ||
| Municipal Bonds – continued | ||||
| Sales & Excise Tax Revenue – continued | ||||
| Puerto Rico Sales Tax Financing Corp., Restructured Sales Tax Rev., “2019A-2”, 4.536%, 7/01/2053 | $ | 1,000 | $ 1,072 | |
| Puerto Rico Sales Tax Financing Corp., Restructured Sales Tax Rev., “2019A-2”, 4.784%, 7/01/2058 | 39,000 | 42,202 | ||
| Puerto Rico Sales Tax Financing Corp., Restructured Sales Tax Rev., Capital Appreciation, “2019A-1”, 0%, 7/01/2024 | 3,000 | 2,816 | ||
| Puerto Rico Sales Tax Financing Corp., Restructured Sales Tax Rev., Capital Appreciation, “2019A-1”, 0%, 7/01/2027 | 41,000 | 35,919 | ||
| Puerto Rico Sales Tax Financing Corp., Restructured Sales Tax Rev., Capital Appreciation, “2019A-1”, 0%, 7/01/2029 | 7,000 | 5,765 | ||
| Puerto Rico Sales Tax Financing Corp., Restructured Sales Tax Rev., Capital Appreciation, “2019A-1”, 0%, 7/01/2031 | 380,000 | 290,829 | ||
| Puerto Rico Sales Tax Financing Corp., Restructured Sales Tax Rev., Capital Appreciation, “2019A-1”, 0%, 7/01/2033 | 363,000 | 257,666 | ||
| Puerto Rico Sales Tax Financing Corp., Restructured Sales Tax Rev., Capital Appreciation, “2019A-1”, 0%, 7/01/2046 | 1,787,000 | 545,339 | ||
| Wisconsin Public Finance Authority Limited Obligation Grant Rev. (American Dream at Meadowlands Project), “A”, 6.25%, 8/01/2027 (n) | 105,000 | 114,103 | ||
| $ 2,905,547 | ||||
| Secondary Schools – 0.4% | ||||
| District of Columbia Rev. (Rocketship D.C.), “A”, 5%, 6/01/2049 (n) | $ | 250,000 | $ 275,099 | |
| North Texas Education Finance Corp., Education Rev. (Uplift Education), “A”, 5.125%, 12/01/2042 (Prerefunded 6/01/2022) | 130,000 | 137,370 | ||
| $ 412,469 | ||||
| Single Family Housing - Local – 0.5% | ||||
| Montgomery County, MD, Housing Opportunities Commission Program Rev., “A”, 4%, 7/01/2049 | $ | 480,000 | $ 536,216 | |
| Single Family Housing - State – 7.1% | ||||
| Connecticut Housing Finance Authority Rev. (Housing Mortgage Finance Program), “D-1”, GNMA, 4%, 11/15/2047 | $ | 345,000 | $ 372,881 | |
| Iowa Finance Authority, Single Family Mortgage Rev., “A”, GNMA, 4%, 7/01/2047 | 390,000 | 421,131 | ||
| Maryland Community Development Administration, Department of Housing & Community Development Housing Rev., “A”, 4.25%, 9/01/2049 | 400,000 | 447,131 | ||
| Issuer | Shares/Par | Value ($) | ||
| Single Family Housing - State – continued | ||||
| Tennessee Housing Development Agency, Residential Finance Program Rev., “1”, 3.75%, 7/01/2039 | $ | 1,440,000 | $ 1,567,065 | |
| Tennessee Housing Development Agency, Residential Finance Program Rev., “1”, 4.25%, 1/01/2050 | 115,000 | 127,672 | ||
| Tennessee Housing Development Agency, Residential Finance Program Rev., “1”, 3%, 7/01/2051 (w) | 500,000 | 548,080 | ||
| Tennessee Housing Development Agency, Residential Finance Program Rev., “3”, 3.85%, 7/01/2043 | 915,000 | 976,376 | ||
| Tennessee Housing Development Agency, Residential Finance Program Rev., “3”, 3.75%, 1/01/2050 | 940,000 | 1,048,515 | ||
| Tennessee Housing Development Agency, Residential Finance Program Rev., “4”, 2.9%, 7/01/2039 | 220,000 | 231,161 | ||
| Tennessee Housing Development Agency, Residential Finance Program Rev., “4”, 4%, 7/01/2043 | 1,060,000 | 1,157,676 | ||
| Tennessee Housing Development Agency, Residential Finance Program Rev., “4”, 3.05%, 7/01/2044 | 240,000 | 251,323 | ||
| $ 7,149,011 | ||||
| State & Local Agencies – 5.1% | ||||
| Delaware Valley, PA, Regional Finance Authority, “C”, FLR, 0.878% (LIBOR - 3mo. + 0.75%), 6/01/2037 | $ | 795,000 | $ 779,265 | |
| Maryland Stadium Authority Rev., Baltimore City Public Schools Construction and Revitalization Program, “A”, 5%, 5/01/2047 (Prerefunded 5/01/2028) | 135,000 | 172,523 | ||
| Maryland Stadium Authority Rev., Baltimore City Public Schools Construction and Revitalization Program, “A”, 5%, 5/01/2047 | 250,000 | 297,282 | ||
| New Jersey Economic Development Authority Rev. (School Facilities Construction), “AAA”, 5%, 6/15/2026 | 95,000 | 114,076 | ||
| New Jersey Economic Development Authority Rev. (School Facilities Construction), “LLL”, 5%, 6/15/2039 | 220,000 | 266,637 | ||
| Orangeburg County, SC, Facilities Corp. Installment Purchase Rev. (Detention Center Project), 4%, 12/01/2042 | 335,000 | 365,923 | ||
| Pennsylvania Public School Building Authority, School Lease Rev. (School District of Philadelphia Project), “A”, AGM, 5%, 6/01/2033 | 665,000 | 805,017 | ||
| Tennessee School Board Authority, Higher Education Facilities Second Program, “A”, 5%, 11/01/2043 (Prerefunded 11/01/2022) | 1,000,000 | 1,075,803 | ||
| Issuer | Shares/Par | Value ($) | ||
| Municipal Bonds – continued | ||||
| State & Local Agencies – continued | ||||
| Tennessee School Board Authority, Higher Education Facilities Second Program, “A”, 5%, 11/01/2045 | $ | 1,000,000 | $ 1,254,524 | |
| $ 5,131,050 | ||||
| Student Loan Revenue – 0.2% | ||||
| Iowa Student Loan Liquidity Corp. Rev., “B”, 3%, 12/01/2039 | $ | 45,000 | $ 44,453 | |
| Iowa Student Loan Liquidity Corp. Rev., “B”, 3.5%, 12/01/2044 | 115,000 | 115,738 | ||
| $ 160,191 | ||||
| Tax - Other – 2.4% | ||||
| Birmingham-Jefferson, AL, Civic Center Authority, “B”, 5%, 7/01/2043 | $ | 495,000 | $ 583,098 | |
| Guam Government Ltd. Obligation Rev., “A”, 5%, 12/01/2035 | 105,000 | 119,091 | ||
| Guam Government Ltd. Obligation Rev., “A”, 5%, 12/01/2036 | 60,000 | 67,890 | ||
| Guam Government Ltd. Obligation Rev., “A”, 5%, 12/01/2046 | 175,000 | 194,795 | ||
| Memphis-Shelby County, TN, Economic Development Growth Engine Industrial Development Board, Senior Tax Rev. (Graceland Project), “A”, 4.75%, 7/01/2027 | 300,000 | 296,917 | ||
| Memphis-Shelby County, TN, Economic Development Growth Engine Industrial Development Board, Senior Tax Rev. (Graceland Project), “A”, 5.5%, 7/01/2037 | 100,000 | 99,349 | ||
| Puerto Rico Convention Center District Authority, Hotel Occupancy Tax Rev., “A”, AAC, 5%, 7/01/2031 | 230,000 | 235,327 | ||
| Puerto Rico Infrastructure Financing Authority Special Tax Rev., “C”, AAC, 5.5%, 7/01/2024 | 260,000 | 279,889 | ||
| Puerto Rico Infrastructure Financing Authority Special Tax Rev., “C”, AAC, 5.5%, 7/01/2025 | 25,000 | 27,254 | ||
| Puerto Rico Infrastructure Financing Authority Special Tax Rev., “C”, AAC, 5.5%, 7/01/2026 | 415,000 | 456,404 | ||
| $ 2,360,014 | ||||
| Tax Assessment – 0.6% | ||||
| Nashville, TN, Metropolitan Development and Housing Agency Rev. (Fifth + Broadway Development), 5.125%, 6/01/2036 (n) | $ | 500,000 | $ 565,195 | |
| Tobacco – 0.6% | ||||
| Buckeye, OH, Tobacco Settlement Financing Authority Senior Asset-Backed Refunding, 2020A-2, “1”, 5%, 6/01/2036 | $ | 70,000 | $ 87,668 | |
| Illinois Railsplitter Tobacco Settlement Authority Rev., 6%, 6/01/2028 (Prerefunded 6/01/2021) | 200,000 | 201,832 | ||
| Issuer | Shares/Par | Value ($) | ||
| Tobacco – continued | ||||
| Virgin Islands Tobacco Settlement Financing Corp., 5%, 5/15/2031 | $ | 320,000 | $ 320,737 | |
| $ 610,237 | ||||
| Toll Roads – 0.5% | ||||
| Virginia Small Business Financing Authority Rev. (Elizabeth River Crossings Opco LLC Project), 6%, 1/01/2037 | $ | 165,000 | $ 174,480 | |
| Virginia Small Business Financing Authority Rev. (Elizabeth River Crossings Opco LLC Project), 5.5%, 1/01/2042 | 320,000 | 334,545 | ||
| $ 509,025 | ||||
| Transportation - Special Tax – 2.6% | ||||
| Commonwealth of Puerto Rico Highway & Transportation Authority Rev., “J”, NPFG, 5%, 7/01/2029 | $ | 15,000 | $ 15,382 | |
| Commonwealth of Puerto Rico Highway & Transportation Authority Rev., “L”, AAC, 5.25%, 7/01/2038 | 450,000 | 506,565 | ||
| Commonwealth of Puerto Rico Highway & Transportation Authority Rev., “N”, AAC, 5.5%, 7/01/2029 | 665,000 | 738,644 | ||
| Commonwealth of Puerto Rico Highway & Transportation Authority Rev., “N”, AAC, 5.25%, 7/01/2031 | 45,000 | 49,586 | ||
| Commonwealth of Puerto Rico Highway & Transportation Authority Rev., “N”, NPFG, 5.25%, 7/01/2032 | 70,000 | 77,639 | ||
| Commonwealth of Puerto Rico Highway & Transportation Authority Rev., “N”, NPFG, 5.25%, 7/01/2033 | 90,000 | 99,726 | ||
| Metropolitan Transportation Authority Rev., NY, Anticipation Note, “B-2”, 5%, 5/15/2021 | 340,000 | 341,634 | ||
| Metropolitan Transportation Authority Rev., NY, Anticipation Note, “D-1”, 5%, 9/01/2022 | 250,000 | 264,929 | ||
| New Jersey Transportation Trust Fund Authority, Federal Highway Reimbursement Rev., “A-1”, 5%, 6/15/2027 | 200,000 | 239,019 | ||
| New Jersey Transportation Trust Fund Authority, Transportation System, “A”, 5.25%, 12/15/2021 | 55,000 | 56,907 | ||
| New Jersey Transportation Trust Fund Authority, Transportation System, “A”, 5%, 12/15/2039 | 65,000 | 78,697 | ||
| New Jersey Transportation Trust Fund Authority, Transportation System, “BB”, 5%, 6/15/2044 | 70,000 | 83,246 | ||
| $ 2,551,974 | ||||
| Universities - Colleges – 7.9% | ||||
| Franklin County, TN, Health & Educational Facilities Board Rev. (University of the South), 5%, 9/01/2030 | $ | 375,000 | $ 399,009 | |
| Issuer | Shares/Par | Value ($) | ||
| Municipal Bonds – continued | ||||
| Universities - Colleges – continued | ||||
| Metropolitan Government of Nashville & Davidson County, TN, Health & Educational Facilities Board Rev. (Lipscomb University Project), “A”, 5%, 10/01/2041 | $ | 1,000,000 | $ 1,102,908 | |
| Metropolitan Government of Nashville & Davidson County, TN, Health & Educational Facilities Board Rev. (Lipscomb University Project), “A”, 4%, 10/01/2049 | 1,000,000 | 1,042,320 | ||
| Metropolitan Government of Nashville & Davidson County, TN, Health & Educational Facilities Board Rev., Refunding & Improvement (Trevecca Nazarene University Project), 5%, 10/01/2039 | 200,000 | 230,104 | ||
| Metropolitan Government of Nashville & Davidson County, TN, Health & Educational Facilities Board Rev., Refunding & Improvement (Trevecca Nazarene University Project), 5%, 10/01/2048 | 1,800,000 | 2,032,044 | ||
| Pinellas County, FL, Educational Facilities Authority Rev. (Barry University), 6%, 10/01/2041 | 120,000 | 122,347 | ||
| Puerto Rico Industrial, Tourist, Educational, Medical & Environmental Control Facilities Financing Authority, Higher Education Rev. (Ana G. Mendez University System Project), 5.375%, 12/01/2021 | 5,000 | 4,995 | ||
| Shelby County, TN, Health, Educational & Housing Facility Board, Educational Facilities Rev. (Rhodes College), 4%, 8/01/2035 | 605,000 | 681,032 | ||
| Shelby County, TN, Health, Educational & Housing Facility Board, Educational Facilities Rev. (Rhodes College), 4%, 8/01/2040 | 1,120,000 | 1,245,613 | ||
| Shelby County, TN, Health, Educational & Housing Facility Board, Educational Facilities Rev. (Rhodes College), 5.5%, 8/01/2040 (Prerefunded 8/01/2021) | 1,000,000 | 1,017,424 | ||
| University of Puerto Rico Rev., “P”, NPFG, 5%, 6/01/2025 | 15,000 | 15,382 | ||
| $ 7,893,178 | ||||
| Universities - Dormitories – 0.5% | ||||
| Chattanooga, TN, Health, Educational & Housing Facility Board Rev. (CDFI Phase I LLC, University of Tennessee at Chattanooga), 5%, 10/01/2035 | $ | 500,000 | $ 540,176 | |
| Utilities - Cogeneration – 0.2% | ||||
| Puerto Rico Industrial, Tourist, Educational, Medical & Environmental Control Facilities Financing Authority Rev. (Cogeneration Facilities - AES Puerto Rico Project), 9.12%, 6/01/2022 | $ | 225,000 | $ 230,625 | |
| Utilities - Municipal Owned – 7.5% | ||||
| Memphis, TN, Electric Systems Rev., 5%, 12/01/2034 (Prerefunded 12/01/2024) | $ | 1,000,000 | $ 1,167,954 | |
| Issuer | Shares/Par | Value ($) | ||
| Utilities - Municipal Owned – continued | ||||
| Memphis, TN, Electric Systems Rev., “A”, 5%, 12/01/2032 | $ | 1,000,000 | $ 1,331,662 | |
| Memphis, TN, Electric Systems Rev., “A”, 5%, 12/01/2033 | 1,000,000 | 1,325,854 | ||
| Metropolitan Government of Nashville & Davidson County, TN, Electric System Rev., “A”, 5%, 5/15/2029 | 1,000,000 | 1,309,579 | ||
| Metropolitan Government of Nashville & Davidson County, TN, Electric System Rev., “A”, 5%, 5/15/2037 | 1,000,000 | 1,213,197 | ||
| Puerto Rico Electric Power Authority Rev., “A”, 5%, 7/01/2029 (a)(d) | 260,000 | 235,300 | ||
| Puerto Rico Electric Power Authority Rev., “A”, 5%, 7/01/2042 (a)(d) | 40,000 | 36,200 | ||
| Puerto Rico Electric Power Authority Rev., “AAA”, 5.25%, 7/01/2021 (a)(d) | 20,000 | 18,150 | ||
| Puerto Rico Electric Power Authority Rev., “AAA”, 5.25%, 7/01/2030 (a)(d) | 10,000 | 9,075 | ||
| Puerto Rico Electric Power Authority Rev., “CCC”, 5.25%, 7/01/2027 (a)(d) | 90,000 | 81,675 | ||
| Puerto Rico Electric Power Authority Rev., “DDD”, 5%, 7/01/2020 (a)(d) | 10,000 | 9,025 | ||
| Puerto Rico Electric Power Authority Rev., “DDD”, 5%, 7/01/2021 (a)(d) | 100,000 | 90,500 | ||
| Puerto Rico Electric Power Authority Rev., “DDD”, 5%, 7/01/2022 (a)(d) | 165,000 | 149,325 | ||
| Puerto Rico Electric Power Authority Rev., “EEE”, 6.05%, 7/01/2032 (a)(d) | 50,000 | 44,313 | ||
| Puerto Rico Electric Power Authority Rev., “TT”, 5%, 7/01/2021 (a)(d) | 40,000 | 36,200 | ||
| Puerto Rico Electric Power Authority Rev., “TT”, 5%, 7/01/2023 (a)(d) | 40,000 | 36,200 | ||
| Puerto Rico Electric Power Authority Rev., “TT”, 5%, 7/01/2027 (a)(d) | 10,000 | 9,050 | ||
| Puerto Rico Electric Power Authority Rev., “TT”, 5%, 7/01/2037 (a)(d) | 130,000 | 117,650 | ||
| Puerto Rico Electric Power Authority Rev., “V”, NPFG, 5.25%, 7/01/2033 | 65,000 | 72,024 | ||
| Puerto Rico Electric Power Authority Rev., “VV”, NPFG, 5.25%, 7/01/2034 | 10,000 | 11,064 | ||
| Puerto Rico Electric Power Authority Rev., “WW”, 5.375%, 7/01/2022 (a)(d) | 10,000 | 9,088 | ||
| Puerto Rico Electric Power Authority Rev., “WW”, 5.25%, 7/01/2025 (a)(d) | 15,000 | 13,613 | ||
| Puerto Rico Electric Power Authority Rev., “ZZ”, 5%, 7/01/2018 (a)(d) | 65,000 | 57,931 | ||
| Puerto Rico Electric Power Authority Rev., “ZZ”, 5.25%, 7/01/2023 (a)(d) | 70,000 | 63,525 | ||
| Puerto Rico Electric Power Authority Rev., “ZZ”, 5.25%, 7/01/2024 (a)(d) | 20,000 | 18,150 | ||
| Puerto Rico Electric Power Authority Rev., “ZZ”, 5.25%, 7/01/2026 (a)(d) | 60,000 | 54,450 | ||
| $ 7,520,754 | ||||
| Issuer | Shares/Par | Value ($) | ||
| Municipal Bonds – continued | ||||
| Utilities - Other – 1.9% | ||||
| Tennessee Energy Acquisition Corp., Gas Rev., “A”, 5.25%, 9/01/2021 | $ | 225,000 | $ 229,550 | |
| Tennessee Energy Acquisition Corp., Gas Rev., “A”, 5.25%, 9/01/2022 | 115,000 | 122,833 | ||
| Tennessee Energy Acquisition Corp., Gas Rev., “A”, 5.25%, 9/01/2023 | 110,000 | 122,263 | ||
| Tennessee Energy Acquisition Corp., Gas Rev., “A”, 5.25%, 9/01/2026 | 1,200,000 | 1,456,860 | ||
| $ 1,931,506 | ||||
| Water & Sewer Utility Revenue – 11.5% | ||||
| Clarksville, TN, Water, Sewer & Gas Rev., 5%, 2/01/2029 (Prerefunded 2/01/2023) | $ | 1,000,000 | $ 1,087,453 | |
| Clarksville, TN, Water, Sewer & Gas Rev., 4%, 2/01/2038 | 500,000 | 579,694 | ||
| Guam Waterworks Authority Rev. (Water and Wastewater System), 5%, 7/01/2036 | 65,000 | 74,054 | ||
| Guam Waterworks Authority Rev. (Water and Wastewater System), 5%, 7/01/2036 | 110,000 | 127,707 | ||
| Guam Waterworks Authority Rev. (Water and Wastewater System), 5%, 7/01/2037 | 135,000 | 156,340 | ||
| Guam Waterworks Authority Rev. (Water and Wastewater System), 5%, 7/01/2040 | 380,000 | 437,495 | ||
| Guam Waterworks Authority Rev. (Water and Wastewater System), 5%, 1/01/2046 | 300,000 | 336,175 | ||
| Guam Waterworks Authority Rev. (Water and Wastewater System), “A”, 5%, 1/01/2050 | 120,000 | 144,224 | ||
| Knox County, TN, Hallsdale-Powell Utility District, Waterworks & Sewer Rev., 4%, 4/01/2035 | 1,000,000 | 1,179,079 | ||
| Memphis, TN, Sanitary Sewerage Systems Rev., “B”, 5%, 10/01/2039 | 1,000,000 | 1,296,067 | ||
| Memphis, TN, Sanitary Sewerage Systems Rev., “B”, 5%, 10/01/2040 | 1,000,000 | 1,292,566 | ||
| Memphis, TN, Storm Water System Rev., 5%, 10/01/2039 | 1,410,000 | 1,732,537 | ||
| Metropolitan Government of Nashville & Davidson County, TN, Water & Sewer Rev., 5%, 7/01/2032 | 2,000,000 | 2,196,092 | ||
| Michigan Finance Authority Local Government Loan Program Rev. (Detroit Water and Sewerage Department Sewage Disposal System Rev. Refunding Second Lien Local Project), “C-7”, NPFG, 5%, 7/01/2032 | 30,000 | 34,106 | ||
| Issuer | Shares/Par | Value ($) | ||
| Water & Sewer Utility Revenue – continued | ||||
| Michigan Finance Authority Local Government Loan Program Rev. (Detroit Water and Sewerage Department Water Supply System Rev. Refunding Second Lien Local Project), “D-6”, NPFG, 5%, 7/01/2036 | $ | 35,000 | $ 39,646 | |
| Michigan Finance Authority Local Government Loan Program Rev. (Detroit Water and Sewerage Department Water Supply System Rev. Refunding Senior Lien Local Project), “D-1”, AGM, 5%, 7/01/2035 | 20,000 | 22,710 | ||
| Michigan Finance Authority Local Government Loan Program Rev. (Detroit Water and Sewerage Department Water Supply System Rev. Refunding Senior Lien Local Project), “D-1”, AGM, 5%, 7/01/2037 | 45,000 | 50,989 | ||
| Mississippi Development Bank Special Obligation (Jackson Water and Sewer System Rev. Bond Project), AGM, 6.875%, 12/01/2040 | 65,000 | 74,837 | ||
| Wilson County, TN, West Wilson Utility District Waterworks Rev., 5%, 6/01/2030 | 550,000 | 645,643 | ||
| $ 11,507,414 | ||||
| Total Municipal Bonds (Identified Cost, $94,748,175) | $100,040,143 | |||
| Bonds – 0.2% | ||||
| Consumer Services – 0.2% | ||||
| Toll Road Investors Partnership II LP, Capital Appreciation, NPFG, 0%, 2/15/2025 (n) | $ | 149,000 | $ 130,123 | |
| Toll Road Investors Partnership II LP, Capital Appreciation, NPFG, 0%, 2/15/2043 (n) | 400,000 | 113,922 | ||
| Total Bonds (Identified Cost, $263,177) | $ 244,045 | |||
| Investment Companies (h) – 0.6% | ||||
| Money Market Funds – 0.6% | ||||
| MFS Institutional Money Market Portfolio, 0.05% (v) (Identified Cost, $621,186) | 621,191 | $ 621,190 | ||
| Other Assets, Less Liabilities – (0.6)% | (628,610) | |||
| Net Assets – 100.0% | $100,276,768 | |||
| Issuer | Shares/Par | Value ($) | ||
| Municipal Bonds – 98.9% | ||||
| Airport Revenue – 2.7% | ||||
| Chicago, IL, O'Hare International Airport Rev., Senior Lien, “B”, 5%, 1/01/2030 | $ | 510,000 | $ 589,148 | |
| Metropolitan Washington, D.C., Airport Authority Refunding Rev., “A”, 5%, 10/01/2037 | 1,000,000 | 1,221,878 | ||
| Metropolitan Washington, D.C., Airport Authority Refunding Rev., “A”, 5%, 10/01/2038 | 1,000,000 | 1,218,826 | ||
| Metropolitan Washington, D.C., Airport Authority Rev., “B”, 5%, 10/01/2027 | 980,000 | 1,160,911 | ||
| Metropolitan Washington, D.C., Airport Authority Rev., “B”, 5%, 10/01/2028 | 1,000,000 | 1,183,147 | ||
| Norfolk, VA, Airport Authority Rev., 5%, 7/01/2029 | 525,000 | 667,368 | ||
| Norfolk, VA, Airport Authority Rev., AGM, 5%, 7/01/2023 | 2,000,000 | 2,021,995 | ||
| Norfolk, VA, Airport Authority Rev., AGM, 5%, 7/01/2024 | 1,000,000 | 1,010,949 | ||
| San Francisco, CA, City & County Airports Commission, International Airport Rev., “B”, 5%, 5/01/2046 | 1,160,000 | 1,341,432 | ||
| $ 10,415,654 | ||||
| General Obligations - General Purpose – 9.7% | ||||
| Bridgeview, IL, Stadium and Redevelopment Projects, AAC, 5.14%, 12/01/2036 | $ | 775,000 | $ 757,587 | |
| Chesapeake, VA, “B”, 5%, 6/01/2023 (Prerefunded 6/01/2021) | 1,930,000 | 1,944,734 | ||
| Chesterfield County, VA, Public Improvement, “A”, 4%, 1/01/2036 | 1,570,000 | 1,809,977 | ||
| Chicago, IL, General Obligation, “A”, 5.5%, 1/01/2033 | 400,000 | 449,252 | ||
| Chicago, IL, General Obligation, “D”, 5.5%, 1/01/2040 | 65,000 | 72,282 | ||
| Chicago, IL, General Obligation, “F”, 5.5%, 1/01/2042 | 475,000 | 526,833 | ||
| Commonwealth of Puerto Rico, General Obligation, “A”, 8%, 7/01/2035 (a)(d) | 3,605,000 | 2,829,925 | ||
| Commonwealth of Puerto Rico, Public Improvement, “A-4”, AGM, 5%, 7/01/2031 | 240,000 | 247,777 | ||
| Fairfax County, VA, Public Improvement, “A”, 5%, 10/01/2037 | 2,000,000 | 2,553,239 | ||
| Loudoun County, VA, General Obligation Public Improvement, “A”, 5%, 12/01/2022 | 3,000,000 | 3,241,011 | ||
| Lynchburg, VA, Public Improvement, 5%, 6/01/2026 | 1,000,000 | 1,143,934 | ||
| Newport News, VA, General Obligation Improvement, “A”, 4%, 2/01/2038 | 1,425,000 | 1,677,735 | ||
| Norfolk, VA, General Obligation Capital Improvement, 5%, 8/01/2043 (Prerefunded 8/01/2028) | 2,615,000 | 3,366,644 | ||
| Issuer | Shares/Par | Value ($) | ||
| General Obligations - General Purpose – continued | ||||
| Portsmouth, VA, General Obligation Public Improvement, “A”, 5%, 2/01/2032 (Prerefunded 2/01/2023) | $ | 440,000 | $ 478,479 | |
| Portsmouth, VA, General Obligation Public Improvement, “A”, 5%, 2/01/2032 | 60,000 | 65,022 | ||
| Prince George County, VA, General Obligation, 5%, 8/01/2027 | 1,580,000 | 1,996,174 | ||
| Prince George County, VA, General Obligation, 5%, 8/01/2028 | 1,865,000 | 2,411,588 | ||
| Prince George County, VA, General Obligation, 5%, 8/01/2029 | 2,260,000 | 2,980,076 | ||
| Puerto Rico Public Buildings Authority Government Facilities Rev., “M-2”, AAC, 10%, 7/01/2035 | 170,000 | 178,654 | ||
| Puerto Rico Public Buildings Authority Rev., Guaranteed, “D”, AAC, 5.45%, 7/01/2030 | 380,000 | 391,439 | ||
| Richmond, VA, Public Improvement, “A”, 5%, 3/01/2028 (Prerefunded 3/01/2023) | 220,000 | 240,295 | ||
| State of Illinois, General Obligation, 5.5%, 5/01/2039 | 270,000 | 332,176 | ||
| State of Illinois, General Obligation, 5.75%, 5/01/2045 | 245,000 | 304,767 | ||
| State of Illinois, General Obligation, “A”, 5%, 3/01/2028 | 330,000 | 397,232 | ||
| State of Illinois, General Obligation, “A”, 5%, 3/01/2029 | 495,000 | 604,044 | ||
| State of Illinois, General Obligation, “A”, 5%, 3/01/2030 | 455,000 | 561,225 | ||
| State of Illinois, General Obligation, “A”, 5%, 3/01/2031 | 660,000 | 823,116 | ||
| Suffolk, VA, General Obligation, 5%, 12/01/2022 | 2,480,000 | 2,678,804 | ||
| Virginia Beach, VA, Public Improvement, “B”, 5%, 4/01/2022 | 2,000,000 | 2,095,815 | ||
| $ 37,159,836 | ||||
| General Obligations - Schools – 1.6% | ||||
| Berks County, PA, Reading School District, AGM, 5%, 3/01/2036 | $ | 70,000 | $ 84,517 | |
| Virginia Public School Authority, Special Obligation School Refunding (Montgomery County), 5%, 2/01/2025 | 5,330,000 | 6,236,417 | ||
| $ 6,320,934 | ||||
| Healthcare Revenue - Hospitals – 15.6% | ||||
| Arlington County, VA, Industrial Development Authority, Hospital Rev. (Virginia Hospital Center), 5%, 7/01/2037 | $ | 2,800,000 | $ 3,570,929 | |
| Chattanooga, TN, Health, Educational & Housing Facility Board Rev. (CommonSpirit Health), “A-1”, 4%, 8/01/2044 | 20,000 | 22,191 | ||
| Issuer | Shares/Par | Value ($) | ||
| Municipal Bonds – continued | ||||
| Healthcare Revenue - Hospitals – continued | ||||
| Chattanooga, TN, Health, Educational & Housing Facility Board Rev. (CommonSpirit Health), “A-2”, 5%, 8/01/2044 | $ | 30,000 | $ 36,377 | |
| Chattanooga, TN, Health, Educational & Housing Facility Board Rev. (CommonSpirit Health), “A-2”, 5%, 8/01/2049 | 15,000 | 18,053 | ||
| Chesapeake, VA, Hospital Authority Facility Rev. (Chesapeake Regional Medical Center), 5%, 7/01/2033 | 2,000,000 | 2,505,233 | ||
| Chesapeake, VA, Hospital Authority Facility Rev. (Chesapeake Regional Medical Center), 5%, 7/01/2034 | 1,475,000 | 1,841,423 | ||
| Colorado Health Facilities Authority Rev. (CommonSpirit Health), “A-2”, 4%, 8/01/2044 | 180,000 | 199,718 | ||
| Commonwealth of Virginia, University Health System General Rev., “A”, 4%, 7/01/2040 | 2,000,000 | 2,236,494 | ||
| Doylestown, PA, Hospital Rev., “A”, 4%, 7/01/2045 | 45,000 | 46,763 | ||
| Fairfax County, VA, Industrial Development Authority Health Care Rev. (Inova Health System Project), “A”, 5%, 5/15/2044 | 2,000,000 | 2,245,191 | ||
| Fairfax County, VA, Industrial Development Authority Health Care Rev. (Inova Health System Project), “A”, 4%, 5/15/2048 | 4,000,000 | 4,516,719 | ||
| Fairfax County, VA, Industrial Development Authority Rev. (Inova Health System Project), “B”, 5%, 5/15/2022 | 5,000,000 | 5,271,420 | ||
| Fredericksburg, VA, Economic Development Authority, Hospital Facilities Rev. (Mary Washington Healthcare Obligated Group), 5%, 6/15/2031 | 750,000 | 827,831 | ||
| Fredericksburg, VA, Economic Development Authority, Hospital Facilities Rev. (Mary Washington Healthcare Obligated Group), 5%, 6/15/2033 | 1,000,000 | 1,103,446 | ||
| Jefferson Parish, LA, Hospital Service District No. 2 Hospital Rev. (East Jefferson General Hospital), 6.25%, 7/01/2031 (Prerefunded 7/01/2021) | 375,000 | 380,451 | ||
| Jefferson Parish, LA, Hospital Service District No. 2 Hospital Rev. (East Jefferson General Hospital), 6.375%, 7/01/2041 (Prerefunded 7/01/2021) | 395,000 | 400,860 | ||
| Knox County, TN, Health, Educational & Housing Facility Board Rev. (University Health Systems, Inc.), “A”, 5%, 9/01/2030 | 1,585,000 | 1,959,136 | ||
| Lynchburg, VA, Economic Development Authority Rev. (Centra Health), “A”, 5%, 1/01/2047 | 3,000,000 | 3,469,253 | ||
| Norfolk, VA, Economic Development Authority Health Care Facilities Rev. (Sentara Healthcare), “B”, 5%, 11/01/2036 | 2,875,000 | 3,075,753 | ||
| Issuer | Shares/Par | Value ($) | ||
| Healthcare Revenue - Hospitals – continued | ||||
| Norfolk, VA, Economic Development Authority Hospital Facilities Refunding Rev. (Sentara Healthcare), “B”, 4%, 11/01/2048 | $ | 3,000,000 | $ 3,357,641 | |
| Roanoke, VA, Economic Development Authority, Hospital Rev. (Carilion Medical Center), “A”, 5%, 7/01/2047 | 1,625,000 | 2,399,593 | ||
| Virginia Small Business Financing Authority Health Facilities Rev. (Bon Secours Mercy Health, Inc.), “A”, 4%, 12/01/2049 | 3,445,000 | 3,924,802 | ||
| Virginia Small Business Financing Authority Hospital Rev. (Carilion Clinic Obligated Group), “B”, VRDN, 0.05%, 7/01/2042 | 5,000,000 | 5,000,000 | ||
| Virginia Small Business Financing Authority Rev. (Sentara Healthcare), 4%, 11/01/2039 | 3,750,000 | 4,327,368 | ||
| Virginia Small Business Financing Authority Rev. (Sentara Healthcare), 3%, 11/01/2040 | 3,370,000 | 3,542,147 | ||
| Winchester, VA, Economic Development Authority Hospital Rev. (Valley Health System Obligated Group), 5%, 1/01/2028 | 600,000 | 704,589 | ||
| Winchester, VA, Economic Development Authority Hospital Rev. (Valley Health System Obligated Group), 5%, 1/01/2030 | 400,000 | 466,161 | ||
| Winchester, VA, Economic Development Authority Hospital Rev. (Valley Health System Obligated Group), “A”, 5%, 1/01/2044 (Prerefunded 1/01/2024) | 2,000,000 | 2,252,682 | ||
| $ 59,702,224 | ||||
| Healthcare Revenue - Long Term Care – 3.6% | ||||
| Albemarle County, VA, Economic Development Authority, Residential Care Facilities Rev. (Westminster-Canterbury Blue Ridge), “A”, 5%, 1/01/2042 | $ | 1,000,000 | $ 1,012,881 | |
| Alexandria, VA, Industrial Development Authority, Residential Care Facilities Mortgage Rev. (Goodwin House, Inc.), 5%, 10/01/2030 | 1,000,000 | 1,146,236 | ||
| Fairfax County, VA, Economic Development Authority Residential Care Facilities Rev. (Goodwin House, Inc.), 5%, 10/01/2036 | 1,000,000 | 1,121,441 | ||
| Henrico County, VA, Economic Development Authority Rev., Residential Care Facility (Lifespire of Virginia.), “C”, 5%, 12/01/2037 | 765,000 | 879,544 | ||
| Henrico County, VA, Economic Development Authority Rev., Residential Care Facility (Virginia United Methodist Homes, Inc.), 5%, 6/01/2024 | 395,000 | 408,966 | ||
| Henrico County, VA, Economic Development Authority Rev., Residential Care Facility (Virginia United Methodist Homes, Inc.), 5%, 6/01/2025 | 385,000 | 398,343 | ||
| Henrico County, VA, Economic Development Authority Rev., Residential Care Facility (Westminster-Canterbury of Richmond), 4%, 10/01/2040 | 500,000 | 550,090 | ||
| Issuer | Shares/Par | Value ($) | ||
| Municipal Bonds – continued | ||||
| Healthcare Revenue - Long Term Care – continued | ||||
| Henrico County, VA, Economic Development Authority Rev., Residential Care Facility (Westminster-Canterbury of Richmond), 4%, 10/01/2045 | $ | 720,000 | $ 786,360 | |
| James City County, VA, Economic Development Authority, Residential Care Facilities Rev. (Virginia United Methodist Homes of Williamsburg), “A”, 2%, 10/01/2048 | 200,800 | 17,570 | ||
| Lexington, VA, Industrial Development Authority Residential Care Facilities Rev. (Kendal at Lexington), 4%, 1/01/2037 | 1,000,000 | 1,027,847 | ||
| Lexington, VA, Industrial Development Authority Residential Care Facilities Rev. (Kendal at Lexington), “A”, 5%, 1/01/2042 | 1,000,000 | 1,065,627 | ||
| Prince William County, VA, Industrial Development Authority, Residential Care Facilities Rev. (Westminster at Lake Ridge), 5%, 1/01/2037 | 1,000,000 | 1,033,145 | ||
| Suffolk, VA, Economic Development Facilities First Mortgage Rev. (Lake Prince Center, Inc.), 5%, 9/01/2031 | 1,000,000 | 1,054,894 | ||
| Virginia Small Business Financing Authority Rev. (Obligated Group of National Senior Campuses, Inc.), “A”, 5%, 1/01/2033 | 1,750,000 | 2,123,275 | ||
| Virginia Small Business Financing Authority, Residential Care Facility Rev. (Pinnacle Living), “C”, 5%, 6/01/2042 | 1,000,000 | 1,050,939 | ||
| $ 13,677,158 | ||||
| Industrial Revenue - Environmental Services – 0.3% | ||||
| Virginia Small Business Financing Authority Rev., Solid Waste Disposal (Covanta Project), 5%, 1/01/2048 (Put Date 7/01/2038) (n) | $ | 1,000,000 | $ 1,043,834 | |
| Industrial Revenue - Other – 0.4% | ||||
| Port Beaumont, TX, Navigation District Facility Rev. (Jefferson Gulf Coast Energy Project), “A”, 3.625%, 1/01/2035 (n) | $ | 300,000 | $ 306,575 | |
| Tuscaloosa County, AL, Industrial Development Authority, Gulf Opportunity Zone (Hunt Refining Project), “A”, 4.5%, 5/01/2032 (n) | 465,000 | 516,780 | ||
| Tuscaloosa County, AL, Industrial Development Authority, Gulf Opportunity Zone (Hunt Refining Project), “A”, 5.25%, 5/01/2044 (n) | 635,000 | 721,624 | ||
| $ 1,544,979 | ||||
| Industrial Revenue - Paper – 0.1% | ||||
| Valparaiso, IN, Exempt Facilities Rev. (Pratt Paper LLC Project), 6.75%, 1/01/2034 | $ | 100,000 | $ 112,509 | |
| Valparaiso, IN, Exempt Facilities Rev. (Pratt Paper LLC Project), 7%, 1/01/2044 | 130,000 | 145,570 | ||
| Issuer | Shares/Par | Value ($) | ||
| Industrial Revenue - Paper – continued | ||||
| West Point, VA, Industrial Development Authority, Solid Waste Disposal Rev. (Chesapeake Corp.), “A”, 6.375%, 3/01/2019 (a)(d) | $ | 1,683,272 | $ 168 | |
| $ 258,247 | ||||
| Miscellaneous Revenue - Other – 1.5% | ||||
| Loudoun County, VA, Economic Development Authority Rev. (Howard Hughes Medical Institute), Capital Appreciation, “A”, 0%, 7/01/2049 | $ | 7,500,000 | $ 3,142,219 | |
| Rappahannock, VA, Regional Jail Authority Rev., 5%, 10/01/2033 (Prerefunded 10/01/2025) | 2,220,000 | 2,660,709 | ||
| Summit County, OH, Port Authority Building Rev. (Flats East Development Recovery Zone Facility Bonds), 6.875%, 5/15/2040 | 75,000 | 75,230 | ||
| $ 5,878,158 | ||||
| Multi-Family Housing Revenue – 1.4% | ||||
| Virginia Housing Development Authority Rev., Rental Housing, “A”, 3.8%, 9/01/2044 | $ | 2,000,000 | $ 2,169,947 | |
| Virginia Housing Development Authority Rev., Rental Housing, “D”, 3.7%, 10/01/2038 | 3,000,000 | 3,309,565 | ||
| $ 5,479,512 | ||||
| Parking – 1.0% | ||||
| Fairfax County, VA, Economic Development Authority Metrorail Parking System Project Rev., 5%, 4/01/2035 | $ | 1,250,000 | $ 1,525,084 | |
| Fairfax County, VA, Economic Development Authority Metrorail Parking System Project Rev., 5%, 4/01/2036 | 1,000,000 | 1,217,029 | ||
| Fairfax County, VA, Economic Development Authority Metrorail Parking System Project Rev., 5%, 4/01/2037 | 750,000 | 910,434 | ||
| $ 3,652,547 | ||||
| Port Revenue – 1.4% | ||||
| Virginia Port Authority Facilities Refunding Rev., “B”, 5%, 7/01/2027 | $ | 1,500,000 | $ 1,792,484 | |
| Virginia Port Authority Facilities Rev, “A”, 5%, 7/01/2031 (Prerefunded 7/01/2025) | 3,000,000 | 3,541,960 | ||
| $ 5,334,444 | ||||
| Sales & Excise Tax Revenue – 3.0% | ||||
| Puerto Rico Sales Tax Financing Corp., Restructured Sales Tax Rev., “2019A-1”, 4.55%, 7/01/2040 | $ | 77,000 | $ 83,453 | |
| Puerto Rico Sales Tax Financing Corp., Restructured Sales Tax Rev., “2019A-1”, 5%, 7/01/2058 | 4,818,000 | 5,305,485 | ||
| Puerto Rico Sales Tax Financing Corp., Restructured Sales Tax Rev., “2019A-2”, 4.329%, 7/01/2040 | 717,000 | 766,989 | ||
| Issuer | Shares/Par | Value ($) | ||
| Municipal Bonds – continued | ||||
| Sales & Excise Tax Revenue – continued | ||||
| Puerto Rico Sales Tax Financing Corp., Restructured Sales Tax Rev., “2019A-2”, 4.329%, 7/01/2040 | $ | 251,000 | $ 268,500 | |
| Puerto Rico Sales Tax Financing Corp., Restructured Sales Tax Rev., “2019A-2”, 4.536%, 7/01/2053 | 6,000 | 6,434 | ||
| Puerto Rico Sales Tax Financing Corp., Restructured Sales Tax Rev., “2019A-2”, 4.784%, 7/01/2058 | 122,000 | 132,017 | ||
| Puerto Rico Sales Tax Financing Corp., Restructured Sales Tax Rev., Capital Appreciation, “2019A-1”, 0%, 7/01/2024 | 13,000 | 12,201 | ||
| Puerto Rico Sales Tax Financing Corp., Restructured Sales Tax Rev., Capital Appreciation, “2019A-1”, 0%, 7/01/2027 | 135,000 | 118,271 | ||
| Puerto Rico Sales Tax Financing Corp., Restructured Sales Tax Rev., Capital Appreciation, “2019A-1”, 0%, 7/01/2029 | 26,000 | 21,413 | ||
| Puerto Rico Sales Tax Financing Corp., Restructured Sales Tax Rev., Capital Appreciation, “2019A-1”, 0%, 7/01/2031 | 1,212,000 | 927,592 | ||
| Puerto Rico Sales Tax Financing Corp., Restructured Sales Tax Rev., Capital Appreciation, “2019A-1”, 0%, 7/01/2033 | 1,160,000 | 823,396 | ||
| Puerto Rico Sales Tax Financing Corp., Restructured Sales Tax Rev., Capital Appreciation, “2019A-1”, 0%, 7/01/2046 | 7,149,000 | 2,181,660 | ||
| Wisconsin Public Finance Authority Limited Obligation Grant Rev. (American Dream at Meadowlands Project), “A”, 6.25%, 8/01/2027 (n) | 640,000 | 695,485 | ||
| Wisconsin Public Finance Authority Limited Obligation Grant Rev. (American Dream at Meadowlands Project), ”A“, 5.625%, 8/01/2024 (n) | 130,000 | 135,026 | ||
| $ 11,477,922 | ||||
| Secondary Schools – 0.1% | ||||
| District of Columbia Rev. (Rocketship D.C.), “A”, 5%, 6/01/2056 (n) | $ | 325,000 | $ 356,296 | |
| Single Family Housing - State – 1.5% | ||||
| Maryland Community Development Administration, Department of Housing & Community Development Housing Rev., “A”, 4.25%, 9/01/2049 | $ | 1,380,000 | $ 1,542,603 | |
| Pennsylvania Housing Finance Agency, Single Family Mortgage Rev., “125A”, 3.7%, 10/01/2037 | 1,535,000 | 1,648,573 | ||
| Tennessee Housing Development Agency, Residential Finance Program Rev., “1”, 4.25%, 1/01/2050 | 1,465,000 | 1,626,428 | ||
| Issuer | Shares/Par | Value ($) | ||
| Single Family Housing - State – continued | ||||
| Texas Department of Housing & Community Affairs Residential Mortgage Rev., “A”, FNMA, 4.75%, 1/01/2049 | $ | 930,000 | $ 1,045,877 | |
| $ 5,863,481 | ||||
| State & Local Agencies –���13.5% | ||||
| Campbell County, VA, Industrial Development Authority, 4%, 6/01/2039 | $ | 1,000,000 | $ 1,167,344 | |
| Campbell County, VA, Industrial Development Authority, 4%, 6/01/2040 | 1,000,000 | 1,164,504 | ||
| Colorado State University Board of Governors, System Enterprise Refunding Rev., “E”, 4%, 3/01/2043 | 1,555,000 | 1,766,024 | ||
| Delaware Valley, PA, Regional Finance Authority, “C”, FLR, 0.878% (LIBOR - 3mo. + 0.75%), 6/01/2037 | 1,955,000 | 1,916,305 | ||
| Fairfax County, VA, Economic Development Authority Facilities Rev. (County Facilities Projects), “A”, 5%, 10/01/2033 | 500,000 | 575,780 | ||
| Fairfax County, VA, Economic Development Authority Facilities Rev. (County Facilities Projects), “A”, 5%, 10/01/2034 | 1,000,000 | 1,149,688 | ||
| Fairfax County, VA, Redevelopment and Housing Authority Refunding Rev. (Wedgewood Affordable Housing Acquisition), 5%, 10/01/2039 | 3,265,000 | 4,023,058 | ||
| Franklin County, VA, Industrial Development Authority, 3%, 10/15/2036 | 1,000,000 | 1,074,118 | ||
| Franklin County, VA, Industrial Development Authority, 3%, 10/15/2037 | 580,000 | 620,761 | ||
| Henry County, VA, Industrial Development Authority, Public Facility Leave Rev., 4%, 11/01/2045 | 3,000,000 | 3,344,899 | ||
| Loudoun County, VA, Economic Development Authority Rev. (Louduon County Public Facilities Project), “A”, 3%, 12/01/2037 | 2,000,000 | 2,217,943 | ||
| Maryland Stadium Authority Rev., Baltimore City Public Schools Construction and Revitalization Program, “A”, 5%, 5/01/2047 (Prerefunded 5/01/2028) | 395,000 | 504,789 | ||
| Maryland Stadium Authority Rev., Baltimore City Public Schools Construction and Revitalization Program, “A”, 5%, 5/01/2047 | 770,000 | 915,628 | ||
| New Jersey Economic Development Authority Rev. (School Facilities Construction), 5%, 6/15/2032 | 25,000 | 31,680 | ||
| New Jersey Economic Development Authority Rev. (School Facilities Construction), 5%, 6/15/2033 | 10,000 | 12,588 | ||
| New Jersey Economic Development Authority Rev. (School Facilities Construction), 4%, 6/15/2034 | 65,000 | 74,860 | ||
| New Jersey Economic Development Authority Rev. (School Facilities Construction), 4%, 6/15/2035 | 55,000 | 63,158 | ||
| Issuer | Shares/Par | Value ($) | ||
| Municipal Bonds – continued | ||||
| State & Local Agencies – continued | ||||
| New Jersey Economic Development Authority Rev. (School Facilities Construction), 4%, 6/15/2036 | $ | 35,000 | $ 40,036 | |
| New Jersey Economic Development Authority Rev. (School Facilities Construction), 4%, 6/15/2037 | 35,000 | 39,885 | ||
| New Jersey Economic Development Authority Rev. (School Facilities Construction), 4%, 6/15/2038 | 50,000 | 56,799 | ||
| New Jersey Economic Development Authority Rev. (School Facilities Construction), 4%, 6/15/2039 | 40,000 | 45,341 | ||
| New Jersey Economic Development Authority Rev. (School Facilities Construction), 4%, 6/15/2040 | 55,000 | 62,234 | ||
| New Jersey Economic Development Authority Rev. (School Facilities Construction), 4%, 6/15/2041 | 25,000 | 28,202 | ||
| New Jersey Economic Development Authority Rev. (School Facilities Construction), “AAA”, 5%, 6/15/2026 | 340,000 | 408,273 | ||
| New River Valley, VA, Regional Jail Authority Rev., 5%, 10/01/2036 | 3,205,000 | 3,883,471 | ||
| Powhatan County, VA, Economic Development Authority Rev., 5%, 10/15/2021 | 1,000,000 | 1,025,739 | ||
| Southampton County, VA, Industrial Development Authority Rev., 5%, 12/01/2021 | 1,245,000 | 1,284,379 | ||
| Virginia College Building Authority, Educational Facilities Rev. (21st Century College and Equipment Programs), “E-1”, 5%, 2/01/2023 | 2,140,000 | 2,328,384 | ||
| Virginia Port Authority, Port Fund Rev., “B”, 5%, 7/01/2027 | 2,510,000 | 3,100,649 | ||
| Virginia Public Building Authority, Facilities Rev., “A”, 4%, 8/01/2039 | 4,500,000 | 5,335,943 | ||
| Virginia Public Building Authority, Public Facilities Rev., “A”, 4%, 8/01/2028 (Prerefunded 8/01/2021) | 8,420,000 | 8,526,035 | ||
| Virginia Public Building Authority, Public Facilities Rev., “B-3”, 4%, 8/01/2021 | 1,000,000 | 1,012,626 | ||
| Virginia Resources Authority, Infrastructure Rev., Pooled Financing Program, “C”, 4%, 11/01/2036 | 3,450,000 | 4,046,800 | ||
| $ 51,847,923 | ||||
| Student Loan Revenue – 0.1% | ||||
| Iowa Student Loan Liquidity Corp. Rev., “B”, 3%, 12/01/2039 | $ | 150,000 | $ 148,176 | |
| Iowa Student Loan Liquidity Corp. Rev., “B”, 3.5%, 12/01/2044 | 385,000 | 387,472 | ||
| $ 535,648 | ||||
| Issuer | Shares/Par | Value ($) | ||
| Tax - Other – 1.0% | ||||
| Puerto Rico Convention Center District Authority, Hotel Occupancy Tax Rev., “A”, AAC, 5%, 7/01/2031 | $ | 375,000 | $ 383,686 | |
| Puerto Rico Infrastructure Financing Authority Special Tax Rev., “C”, AAC, 5.5%, 7/01/2024 | 700,000 | 753,548 | ||
| Puerto Rico Infrastructure Financing Authority Special Tax Rev., “C”, AAC, 5.5%, 7/01/2025 | 85,000 | 92,663 | ||
| Puerto Rico Infrastructure Financing Authority Special Tax Rev., “C”, AAC, 5.5%, 7/01/2026 | 2,030,000 | 2,232,530 | ||
| Wisconsin Public Finance Authority Limited Obligation PILOT Rev. (American Dream at Meadowlands Project), 7%, 12/01/2050 | 220,000 | 254,047 | ||
| $ 3,716,474 | ||||
| Tax Assessment – 0.6% | ||||
| Embrey Mill Community Development Authority, VA, Special Assessment Rev., 7.25%, 3/01/2043 | $ | 745,000 | $ 779,334 | |
| Peninsula Town Center Community Development Authority, VA, Special Obligation Refunding, 5%, 9/01/2045 (n) | 1,000,000 | 1,077,618 | ||
| Prince William County, VA, Cherry Hill Community Development Authority Rev. (Potomac Shores Project), 5.15%, 3/01/2035 (n) | 500,000 | 520,398 | ||
| $ 2,377,350 | ||||
| Tobacco – 0.7% | ||||
| Buckeye, OH, Tobacco Settlement Financing Authority Senior Asset-Backed Refunding, 2020A-2, “1”, 5%, 6/01/2036 | $ | 225,000 | $ 281,791 | |
| Buckeye, OH, Tobacco Settlement Financing Authority Senior Asset-Backed Refunding, 2020B-3, Capital Appreciation, “2”, 0%, 6/01/2057 | 4,495,000 | 679,684 | ||
| Illinois Railsplitter Tobacco Settlement Authority Rev., 6%, 6/01/2028 (Prerefunded 6/01/2021) | 1,575,000 | 1,589,422 | ||
| $ 2,550,897 | ||||
| Toll Roads – 4.9% | ||||
| Chesapeake Bay Bridge & Tunnel District First Tier General Resolution Rev., 5%, 7/01/2051 | $ | 3,000,000 | $ 3,433,929 | |
| Metropolitan Washington, D.C., Airport Authority Rev. Senior Lien (Dulles Toll Road), 5%, 10/01/2053 | 2,000,000 | 2,067,368 | ||
| Metropolitan Washington, D.C., Airport Authority, Toll Road Subordinate Lien Refunding Rev. (Dulles Metrorail and Capital Improvement Project), “B”, 4%, 10/01/2044 | 3,000,000 | 3,386,955 | ||
| Issuer | Shares/Par | Value ($) | ||
| Municipal Bonds – continued | ||||
| Toll Roads – continued | ||||
| Metropolitan Washington, D.C., Airport Authority, Toll Road Subordinate Lien Refunding Rev. (Dulles Metrorail and Capital Improvement Project), “B”, AGM, 4%, 10/01/2053 | $ | 2,830,000 | $ 3,209,794 | |
| Virginia Small Business Financing Authority Rev. (95 Express Lanes LLC Project), 5%, 7/01/2034 | 2,500,000 | 2,575,470 | ||
| Virginia Small Business Financing Authority Rev. (Elizabeth River Crossings Opco LLC Project), 6%, 1/01/2037 | 465,000 | 491,715 | ||
| Virginia Small Business Financing Authority Rev. (Elizabeth River Crossings Opco LLC Project), 5.5%, 1/01/2042 | 905,000 | 946,136 | ||
| Virginia Small Business Financing Authority Senior Lien Rev. (95 Express Lanes LLC Project), 5%, 1/01/2044 | 1,500,000 | 1,544,489 | ||
| Virginia Small Business Financing Authority, Senior Lien Private Activity Rev. (Transform 66 P3 Project), 5%, 12/31/2049 | 1,000,000 | 1,161,032 | ||
| $ 18,816,888 | ||||
| Transportation - Special Tax – 9.3% | ||||
| Commonwealth of Puerto Rico Highway & Transportation Authority Rev., “J”, NPFG, 5%, 7/01/2029 | $ | 50,000 | $ 51,274 | |
| Commonwealth of Puerto Rico Highway & Transportation Authority Rev., “L”, AAC, 5.25%, 7/01/2038 | 1,695,000 | 1,908,061 | ||
| Commonwealth of Puerto Rico Highway & Transportation Authority Rev., “N”, AAC, 5.5%, 7/01/2029 | 1,715,000 | 1,904,923 | ||
| Commonwealth of Puerto Rico Highway & Transportation Authority Rev., “N”, NPFG, 5.25%, 7/01/2032 | 685,000 | 759,753 | ||
| Commonwealth of Puerto Rico Highway & Transportation Authority Rev., “N”, NPFG, 5.25%, 7/01/2033 | 570,000 | 631,597 | ||
| Commonwealth of Virginia, Transportation Board Grant Anticipation Rev., 5%, 9/15/2033 | 3,360,000 | 4,425,934 | ||
| Commonwealth of Virginia, Transportation Board Rev., Capital Projects, 4%, 5/15/2042 | 3,000,000 | 3,387,870 | ||
| Commonwealth of Virginia, Transportation Board Rev., Capital Projects, “A”, 4%, 5/15/2035 | 2,750,000 | 3,185,137 | ||
| Hampton Roads, VA, Transportation Accountability Commission, “A”, 5%, 7/01/2029 | 1,000,000 | 1,318,359 | ||
| Hampton Roads, VA, Transportation Accountability Commission, “A”, 5%, 7/01/2030 | 1,000,000 | 1,343,741 | ||
| Metropolitan Transportation Authority Rev., NY, Anticipation Note, “B-2”, 5%, 5/15/2021 | 1,220,000 | 1,225,861 | ||
| Issuer | Shares/Par | Value ($) | ||
| Transportation - Special Tax – continued | ||||
| Metropolitan Transportation Authority Rev., NY, Anticipation Note, “D-1”, 5%, 9/01/2022 | $ | 850,000 | $ 900,760 | |
| New Jersey Transportation Trust Fund Authority, Transportation System, “A”, 5.25%, 12/15/2021 | 185,000 | 191,413 | ||
| New Jersey Transportation Trust Fund Authority, Transportation System, “A”, 5%, 12/15/2039 | 190,000 | 230,038 | ||
| New Jersey Transportation Trust Fund Authority, Transportation System, “BB”, 5%, 6/15/2044 | 190,000 | 225,953 | ||
| North Carolina Grant Anticipation Rev., 5%, 3/01/2027 | 3,000,000 | 3,744,010 | ||
| Virginia Port Authority Rev., 5%, 7/01/2030 (Prerefunded 7/01/2025) | 1,000,000 | 1,185,263 | ||
| Virginia Port Authority Rev., 5%, 7/01/2031 (Prerefunded 7/01/2025) | 500,000 | 592,632 | ||
| Washington, D.C., Metropolitan Area Transit Authority Gross Rev., 5%, 7/01/2037 | 1,560,000 | 1,887,311 | ||
| Washington, D.C., Metropolitan Area Transit Authority Gross Rev., 5%, 7/01/2038 | 1,560,000 | 1,883,302 | ||
| Washington, D.C., Metropolitan Area Transit Authority Gross Rev., “B”, 5%, 7/01/2042 | 3,860,000 | 4,625,296 | ||
| $ 35,608,488 | ||||
| Universities - Colleges – 11.0% | ||||
| Amherst, VA, Industrial Development Authority Rev. (Educational Facilities Sweet Briar), 5%, 9/01/2026 | $ | 1,390,000 | $ 1,379,557 | |
| Commonwealth of Virginia, University General Pledge Refunding Rev., “A”, 4%, 11/01/2037 | 745,000 | 860,485 | ||
| Commonwealth of Virginia, University General Pledge Refunding Rev., “A”, 4%, 5/01/2048 | 2,475,000 | 2,801,054 | ||
| Lexington, VA, Industrial Development Authority Educational Facilities Rev. (Washington and Lee Universities), “A”, 5%, 1/01/2043 | 1,000,000 | 1,209,341 | ||
| Montgomery County, VA, Economic Development Authority Rev., Tax-Exempt (Virginia Tech Foundation), “A”, 4%, 6/01/2037 | 1,000,000 | 1,165,772 | ||
| Montgomery County, VA, Economic Development Authority Rev., Tax-Exempt (Virginia Tech Foundation), “A”, 4%, 6/01/2038 | 1,750,000 | 2,034,523 | ||
| Prince William County, VA, Industrial Development Authority Rev. (George Mason University Foundation Prince William Life Sciences Lab), 5.5%, 9/01/2034 (Prerefunded 9/01/2021) | 1,000,000 | 1,021,931 | ||
| Issuer | Shares/Par | Value ($) | ||
| Municipal Bonds – continued | ||||
| Universities - Colleges – continued | ||||
| Puerto Rico Industrial, Tourist, Educational, Medical & Environmental Control Facilities Financing Authority, Educational Facilities Rev. (University Plaza Project), NPFG, 5%, 7/01/2033 | $ | 445,000 | $ 450,839 | |
| Puerto Rico Industrial, Tourist, Educational, Medical & Environmental Control Facilities Financing Authority, Higher Education Rev. (Ana G. Mendez University System Project), 5.375%, 4/01/2042 | 230,000 | 233,450 | ||
| Red River, TX, Education Finance Corp., Higher Education Rev. (Houston Baptist University Project), 5.5%, 10/01/2046 | 595,000 | 680,476 | ||
| Roanoke, VA, Economic Development Authority, Educational Facilities Rev. (Lynchburg College), “A”, 5%, 9/01/2034 | 1,000,000 | 1,166,257 | ||
| Salem, VA, Economic Development Authority, Educational Facilities (Roanoke College), 4%, 4/01/2038 | 250,000 | 272,721 | ||
| Salem, VA, Economic Development Authority, Educational Facilities (Roanoke College), 4%, 4/01/2039 | 225,000 | 244,158 | ||
| Salem, VA, Economic Development Authority, Educational Facilities (Roanoke College), 4%, 4/01/2040 | 250,000 | 270,883 | ||
| Salem, VA, Economic Development Authority, Educational Facilities (Roanoke College), 5%, 4/01/2049 | 900,000 | 1,044,434 | ||
| University of Virginia, General Rev. Pledge Refunding, 5%, 9/01/2025 (Prerefunded 9/01/2021) | 3,760,000 | 3,834,838 | ||
| University of Virginia, General Rev. Pledge Refunding, “A”, 5%, 6/01/2043 (Prerefunded 6/01/2023) | 685,000 | 756,155 | ||
| University of Virginia, General Rev. Pledge Refunding, “B”, 5%, 4/01/2046 | 2,500,000 | 3,008,692 | ||
| University of Virginia, Rector and Visitors General Pledge Rev. (Multi-Year Capital Project), “A”, 4%, 8/01/2048 | 2,000,000 | 2,269,310 | ||
| Virginia College Building Authority, Educational Facilities Rev. (Marymount University Project), “A”, 5%, 7/01/2035 (n) | 1,000,000 | 1,054,529 | ||
| Virginia College Building Authority, Educational Facilities Rev. (Marymount University Project), “B”, 5.25%, 7/01/2035 (n) | 1,000,000 | 1,064,274 | ||
| Virginia College Building Authority, Educational Facilities Rev. (Public Higher Education Financing), “A”, 5%, 9/01/2027 (Prerefunded 9/01/2021) | 3,000,000 | 3,057,843 | ||
| Virginia College Building Authority, Educational Facilities Rev. (Randolph-Macon College), 4%, 1/15/2041 | 1,600,000 | 1,755,337 | ||
| Issuer | Shares/Par | Value ($) | ||
| Universities - Colleges – continued | ||||
| Virginia College Building Authority, Educational Facilities Rev. (Washington & Lee University), NPFG, 5.25%, 1/01/2031 | $ | 1,000,000 | $ 1,290,410 | |
| Virginia College Building Authority, Educational Facilities Rev. (Washington & Lee University), “A”, 5%, 1/01/2040 | 1,000,000 | 1,138,572 | ||
| Virginia Commonwealth University, General Rev., “A”, 5%, 11/01/2033 | 4,000,000 | 5,170,261 | ||
| Virginia Small Business Financing Authority Rev. (Hampton University), 5.25%, 10/01/2029 | 2,500,000 | 2,892,928 | ||
| $ 42,129,030 | ||||
| Utilities - Cogeneration – 0.2% | ||||
| Puerto Rico Industrial, Tourist, Educational, Medical & Environmental Control Facilities Financing Authority Rev. (Cogeneration Facilities - AES Puerto Rico Project), 9.12%, 6/01/2022 | $ | 795,000 | $ 814,875 | |
| Utilities - Municipal Owned – 3.1% | ||||
| Puerto Rico Electric Power Authority Rev., “A”, 5%, 7/01/2029 (a)(d) | $ | 835,000 | $ 755,675 | |
| Puerto Rico Electric Power Authority Rev., “A”, 5%, 7/01/2042 (a)(d) | 130,000 | 117,650 | ||
| Puerto Rico Electric Power Authority Rev., “AAA”, 5.25%, 7/01/2021 (a)(d) | 60,000 | 54,450 | ||
| Puerto Rico Electric Power Authority Rev., “AAA”, 5.25%, 7/01/2030 (a)(d) | 30,000 | 27,225 | ||
| Puerto Rico Electric Power Authority Rev., “CCC”, 5.25%, 7/01/2027 (a)(d) | 305,000 | 276,787 | ||
| Puerto Rico Electric Power Authority Rev., “DDD”, 5%, 7/01/2020 (a)(d) | 30,000 | 27,075 | ||
| Puerto Rico Electric Power Authority Rev., “DDD”, 5%, 7/01/2021 (a)(d) | 320,000 | 289,600 | ||
| Puerto Rico Electric Power Authority Rev., “DDD”, 5%, 7/01/2022 (a)(d) | 535,000 | 484,175 | ||
| Puerto Rico Electric Power Authority Rev., “DDD”, AGM, 3.625%, 7/01/2023 | 60,000 | 60,110 | ||
| Puerto Rico Electric Power Authority Rev., “DDD”, AGM, 3.65%, 7/01/2024 | 315,000 | 315,578 | ||
| Puerto Rico Electric Power Authority Rev., “EEE”, 6.05%, 7/01/2032 (a)(d) | 175,000 | 155,094 | ||
| Puerto Rico Electric Power Authority Rev., “PP”, NPFG, 5%, 7/01/2024 | 25,000 | 25,521 | ||
| Puerto Rico Electric Power Authority Rev., “SS”, AGM, 4.375%, 7/01/2030 | 30,000 | 30,071 | ||
| Puerto Rico Electric Power Authority Rev., “TT”, 5%, 7/01/2021 (a)(d) | 145,000 | 131,225 | ||
| Puerto Rico Electric Power Authority Rev., “TT”, 5%, 7/01/2023 (a)(d) | 140,000 | 126,700 | ||
| Puerto Rico Electric Power Authority Rev., “TT”, 5%, 7/01/2027 (a)(d) | 25,000 | 22,625 | ||
| Puerto Rico Electric Power Authority Rev., “TT”, 5%, 7/01/2037 (a)(d) | 430,000 | 389,150 | ||
| Puerto Rico Electric Power Authority Rev., “UU”, AGM, 4.25%, 7/01/2027 | 185,000 | 185,422 | ||
| Issuer | Shares/Par | Value ($) | ||
| Municipal Bonds – continued | ||||
| Utilities - Municipal Owned – continued | ||||
| Puerto Rico Electric Power Authority Rev., “VV”, NPFG, 5.25%, 7/01/2030 | $ | 340,000 | $ 376,651 | |
| Puerto Rico Electric Power Authority Rev., “VV”, NPFG, 5.25%, 7/01/2034 | 35,000 | 38,725 | ||
| Puerto Rico Electric Power Authority Rev., “WW”, 5.375%, 7/01/2022 (a)(d) | 25,000 | 22,719 | ||
| Puerto Rico Electric Power Authority Rev., “WW”, 5.25%, 7/01/2025 (a)(d) | 60,000 | 54,450 | ||
| Puerto Rico Electric Power Authority Rev., “ZZ”, 5%, 7/01/2018 (a)(d) | 205,000 | 182,706 | ||
| Puerto Rico Electric Power Authority Rev., “ZZ”, 5.25%, 7/01/2023 (a)(d) | 225,000 | 204,188 | ||
| Puerto Rico Electric Power Authority Rev., “ZZ”, 5.25%, 7/01/2024 (a)(d) | 70,000 | 63,525 | ||
| Puerto Rico Electric Power Authority Rev., “ZZ”, 5.25%, 7/01/2026 (a)(d) | 215,000 | 195,113 | ||
| Richmond, VA, Public Utility Rev., “A”, 5%, 1/15/2027 (Prerefunded 1/15/2023) | 2,555,000 | 2,775,395 | ||
| Richmond, VA, Public Utility Rev., “A”, 5%, 1/15/2035 | 2,000,000 | 2,396,861 | ||
| Richmond, VA, Public Utility Rev., “A”, 5%, 1/15/2038 (Prerefunded 1/15/2023) | 2,000,000 | 2,172,521 | ||
| $ 11,956,987 | ||||
| Utilities - Other – 0.6% | ||||
| Tennessee Energy Acquisition Corp., Gas Rev., “A”, 5.25%, 9/01/2021 | $ | 555,000 | $ 566,224 | |
| Tennessee Energy Acquisition Corp., Gas Rev., “A”, 5.25%, 9/01/2022 | 290,000 | 309,752 | ||
| Tennessee Energy Acquisition Corp., Gas Rev., “A”, 5.25%, 9/01/2026 | 1,140,000 | 1,384,017 | ||
| $ 2,259,993 | ||||
| Water & Sewer Utility Revenue – 10.0% | ||||
| Fairfax County, VA, Water Authority Rev., 5%, 4/01/2028 (Prerefunded 4/01/2022) | $ | 1,000,000 | $ 1,048,419 | |
| Fairfax County, VA, Water Authority Rev., 5%, 4/01/2041 | 3,000,000 | 3,646,217 | ||
| Guam Waterworks Authority Rev. (Water and Wastewater System), 5.25%, 7/01/2021 | 175,000 | 176,973 | ||
| Guam Waterworks Authority Rev. (Water and Wastewater System), 5%, 7/01/2036 | 295,000 | 342,487 | ||
| Guam Waterworks Authority Rev. (Water and Wastewater System), 5%, 7/01/2037 | 375,000 | 434,277 | ||
| Guam Waterworks Authority Rev. (Water and Wastewater System), 5%, 7/01/2040 | 1,045,000 | 1,203,110 | ||
| Guam Waterworks Authority Rev. (Water and Wastewater System), “A”, 5%, 1/01/2050 | 430,000 | 516,804 | ||
| Hampton Roads, VA, Sanitation District Wastewater Rev., “A”, 5%, 10/01/2035 (Prerefunded 10/01/2027) | 660,000 | 837,330 | ||
| Hampton Roads, VA, Sanitation District Wastewater Rev., “A”, 4%, 10/01/2037 | 1,350,000 | 1,533,107 | ||
| Hampton Roads, VA, Sanitation District Wastewater Rev., “A”, 4%, 10/01/2038 | 1,265,000 | 1,433,343 | ||
| Issuer | Shares/Par | Value ($) | ||
| Water & Sewer Utility Revenue – continued | ||||
| Henrico County, VA, Water and Sewer System Rev., 4%, 5/01/2046 | $ | 1,435,000 | $ 1,646,554 | |
| Michigan Finance Authority Local Government Loan Program Rev. (Detroit Water and Sewerage Department Sewage Disposal System Rev. Refunding Second Lien Local Project), “C-7”, NPFG, 5%, 7/01/2032 | 80,000 | 90,950 | ||
| Michigan Finance Authority Local Government Loan Program Rev. (Detroit Water and Sewerage Department Water Supply System Rev. Refunding Second Lien Local Project), “D-6”, NPFG, 5%, 7/01/2036 | 100,000 | 113,274 | ||
| Michigan Finance Authority Local Government Loan Program Rev. (Detroit Water and Sewerage Department Water Supply System Rev. Refunding Senior Lien Local Project), “D-1”, AGM, 5%, 7/01/2035 | 50,000 | 56,775 | ||
| Michigan Finance Authority Local Government Loan Program Rev. (Detroit Water and Sewerage Department Water Supply System Rev. Refunding Senior Lien Local Project), “D-1”, AGM, 5%, 7/01/2037 | 110,000 | 124,639 | ||
| Norfolk, VA, Water Rev., 5%, 11/01/2028 (Prerefunded 5/01/2022) | 985,000 | 1,036,600 | ||
| Norfolk, VA, Water Rev., 5%, 11/01/2028 | 15,000 | 15,759 | ||
| Upper Occoquan, VA, Sewage Authority Regional Sewage Rev., 3%, 7/01/2044 | 2,065,000 | 2,231,117 | ||
| Virginia Beach, VA, Water & Sewer System Rev., 5%, 10/01/2022 | 1,310,000 | 1,403,639 | ||
| Virginia Resources Authority, Infrastructure Rev., Pooled Financing Program, 5%, 11/01/2025 (Prerefunded 11/01/2021) | 1,540,000 | 1,583,246 | ||
| Virginia Resources Authority, Infrastructure Rev., Pooled Financing Program, “B”, 5%, 11/01/2025 (Prerefunded 11/01/2021) (u) | 1,090,000 | 1,120,607 | ||
| Virginia Resources Authority, Infrastructure Rev., Pooled Financing Program, “B”, 5%, 11/01/2025 (u) | 155,000 | 159,346 | ||
| Virginia Resources Authority, Infrastructure Rev., Pooled Financing Program, “B”, 5%, 11/01/2027 (Prerefunded 11/01/2021) (u) | 5,590,000 | 5,746,967 | ||
| Virginia Resources Authority, Infrastructure Rev., Pooled Financing Program, “B”, 5%, 11/01/2027 (u) | 165,000 | 169,589 | ||
| Virginia Resources Authority, Infrastructure Rev., Pooled Financing Program, “B”, 5%, 11/01/2028 (Prerefunded 11/01/2021) (u) | 2,900,000 | 2,980,591 | ||
| Virginia Resources Authority, Infrastructure Rev., Pooled Financing Program, “B”, 5%, 11/01/2028 (u) | 100,000 | 102,781 | ||
| Virginia Resources Authority, Infrastructure Rev., Unrefunded Balance, 5%, 11/01/2025 | 55,000 | 56,542 | ||
| Issuer | Shares/Par | Value ($) | ||
| Municipal Bonds – continued | ||||
| Water & Sewer Utility Revenue – continued | ||||
| Virginia Resources Authority, Infrastructure Rev., Virginia Pooled Financing Program, “C”, 4%, 11/01/2044 | $ | 3,235,000 | $ 3,764,375 | |
| Virginia Resources Authority, Water & Sewer Systems Rev. (Tuckahoe Creek Project), Capital Appreciation, 0%, 11/01/2033 (Prerefunded 11/01/2022) | 2,245,000 | 1,479,186 | ||
| Virginia Resources Authority, Water & Sewer Systems Rev. (Tuckahoe Creek Project), Capital Appreciation, 0%, 11/01/2034 (Prerefunded 11/01/2022) | 2,250,000 | 1,415,993 | ||
| Virginia Resources Authority, Water & Sewer Systems Rev. (Tuckahoe Creek Project), Capital Appreciation, 0%, 11/01/2035 (Prerefunded 11/01/2022) | 1,950,000 | 1,170,546 | ||
| Virginia Resources Authority, Water & Sewer Systems Rev. (Tuckahoe Creek Project), Capital Appreciation, 0%, 11/01/2036 (Prerefunded 11/01/2022) | 1,250,000 | 714,738 | ||
| $ 38,355,881 | ||||
| Total Municipal Bonds (Identified Cost, $361,569,292) | $379,135,660 | |||
| Issuer | Shares/Par | Value ($) | ||
| Bonds – 0.2% | ||||
| Consumer Services – 0.2% | ||||
| Toll Road Investors Partnership II LP, Capital Appreciation, NPFG, 0%, 2/15/2025 (n) | $ | 557,000 | $ 486,434 | |
| Toll Road Investors Partnership II LP, Capital Appreciation, NPFG, 0%, 2/15/2043 (n) | 1,200,000 | 341,764 | ||
| Total Bonds (Identified Cost, $887,716) | $ 828,198 | |||
| Investment Companies (h) – 1.2% | ||||
| Money Market Funds – 1.2% | ||||
| MFS Institutional Money Market Portfolio, 0.05% (v) (Identified Cost, $4,569,195) | 4,569,228 | $ 4,569,228 | ||
| Other Assets, Less Liabilities – (0.3)% | (1,164,565) | |||
| Net Assets – 100.0% | $383,368,521 | |||
| Issuer | Shares/Par | Value ($) | ||
| Municipal Bonds – 97.8% | ||||
| Airport Revenue – 0.5% | ||||
| Dallas and Fort Worth, TX, International Airport Rev., “B”, 5%, 11/01/2044 | $ | 155,000 | $ 165,570 | |
| Dallas and Fort Worth, TX, International Airport Rev., “C”, 5%, 11/01/2045 | 110,000 | 112,885 | ||
| Wayne County, MI, Airport Authority Rev. (Detroit Metropolitan Wayne County Airport), “B”, 5%, 12/01/2044 | 60,000 | 68,761 | ||
| Wayne County, MI, Airport Authority Rev. (Detroit Metropolitan Wayne County Airport), “B”, BAM, 5%, 12/01/2039 | 70,000 | 80,221 | ||
| Wayne County, MI, Airport Authority Rev. (Detroit Metropolitan Wayne County Airport), “C”, 5%, 12/01/2039 | 55,000 | 62,605 | ||
| Wayne County, MI, Airport Authority Rev. (Detroit Metropolitan Wayne County Airport), “C”, 5%, 12/01/2044 | 85,000 | 96,753 | ||
| $ 586,795 | ||||
| General Obligations - General Purpose – 8.4% | ||||
| Bridgeview, IL, Stadium and Redevelopment Projects, AAC, 5.14%, 12/01/2036 | $ | 260,000 | $ 254,158 | |
| Commonwealth of Puerto Rico, General Obligation, “A”, 8%, 7/01/2035 (a)(d) | 1,100,000 | 863,500 | ||
| Commonwealth of Puerto Rico, Public Improvement, “A-4”, AGM, 5%, 7/01/2031 | 95,000 | 98,079 | ||
| State of Illinois, General Obligation, 5.5%, 5/01/2039 | 165,000 | 202,996 | ||
| State of Illinois, General Obligation, “A”, 5%, 3/01/2028 | 95,000 | 114,355 | ||
| State of Illinois, General Obligation, “A”, 5%, 3/01/2029 | 150,000 | 183,044 | ||
| State of Illinois, General Obligation, “A”, 5%, 3/01/2030 | 135,000 | 166,517 | ||
| State of Illinois, General Obligation, “A”, 5%, 3/01/2031 | 195,000 | 243,193 | ||
| State of New Jersey, COVID-19 General Obligation, “A”, 4%, 6/01/2032 | 280,000 | 344,218 | ||
| State of West Virginia, General Obligation Road Bonds, “A”, 5%, 6/01/2027 | 720,000 | 903,873 | ||
| State of West Virginia, General Obligation Road Bonds, “A”, 5%, 12/01/2035 | 1,000,000 | 1,282,367 | ||
| State of West Virginia, General Obligation Road Bonds, “A”, 5%, 6/01/2044 | 3,000,000 | 3,754,605 | ||
| State of West Virginia, General Obligation Road Bonds, “B”, 4%, 12/01/2042 | 1,000,000 | 1,157,529 | ||
| $ 9,568,434 | ||||
| General Obligations - Schools – 5.0% | ||||
| Cabell County, WV, Board of Education, AGM, 1.5%, 6/01/2023 | $ | 475,000 | $ 486,879 | |
| Issuer | Shares/Par | Value ($) | ||
| General Obligations - Schools – continued | ||||
| Greenbrier County, WV, Board of Education, 4%, 5/01/2024 | $ | 590,000 | $ 651,303 | |
| Hancock County, WV, Board of Education, Public School General Obligation, 4.5%, 5/01/2032 (Prerefunded 5/01/2021) | 1,405,000 | 1,409,426 | ||
| Monongalia County, WV, Board of Education, 5%, 5/01/2031 (Prerefunded 5/01/2022) | 2,000,000 | 2,103,658 | ||
| Putnam County, WV, Board of Education, 4%, 5/01/2025 | 1,000,000 | 1,002,786 | ||
| $ 5,654,052 | ||||
| Healthcare Revenue - Hospitals – 15.5% | ||||
| Allegheny County, PA, Hospital Development Authority Rev. (Allegheny Health Network Obligated Group), “A”, 4%, 4/01/2044 | $ | 155,000 | $ 169,826 | |
| Doylestown, PA, Hospital Rev., “A”, 4%, 7/01/2045 | 15,000 | 15,588 | ||
| Monongalia County, WV, Building Commission Hospital Rev. (Monongalia General Hospital), 6.5%, 7/01/2041 | 1,100,000 | 1,111,049 | ||
| Spartanburg County, SC, Regional Health Services District Hospital Rev., “A”, 4%, 4/15/2043 | 780,000 | 856,662 | ||
| Virginia Small Business Financing Authority Health Facilities Rev. (Bon Secours Mercy Health, Inc.), “A”, 4%, 12/01/2049 | 490,000 | 558,245 | ||
| West Virginia Hospital Finance Authority Hospital Improvement Rev. (Cabell Huntington Hospital Obligated Group), 4%, 1/01/2038 | 230,000 | 253,668 | ||
| West Virginia Hospital Finance Authority Hospital Improvement Rev. (Charleston Area Medical Center, Inc.), “A”, 5%, 9/01/2028 | 1,000,000 | 1,119,936 | ||
| West Virginia Hospital Finance Authority Hospital Improvement Rev. (Charleston Area Medical Center, Inc.), “A”, 5%, 9/01/2039 | 1,500,000 | 1,809,352 | ||
| West Virginia Hospital Finance Authority Hospital Rev. (Cabell Huntington Hospital Obligated Group), “A”, 4.125%, 1/01/2047 | 1,245,000 | 1,366,958 | ||
| West Virginia Hospital Finance Authority Hospital Rev. (Charleston Area Medical Center, Inc.), “A”, ETM, 6.5%, 9/01/2023 | 965,000 | 1,040,625 | ||
| West Virginia Hospital Finance Authority Hospital Rev. (Valley Health System Obligation Group), 5%, 1/01/2044 (Prerefunded 1/01/2024) | 1,000,000 | 1,127,807 | ||
| West Virginia Hospital Finance Authority Hospital Rev. (Valley Health System Obligation Group), 5%, 1/01/2044 | 1,000,000 | 1,142,188 | ||
| Issuer | Shares/Par | Value ($) | ||
| Municipal Bonds – continued | ||||
| Healthcare Revenue - Hospitals – continued | ||||
| West Virginia Hospital Finance Authority Hospital Rev. (West Virginia United Health System Obligated Group), “A”, 5%, 6/01/2027 | $ | 200,000 | $ 240,130 | |
| West Virginia Hospital Finance Authority Hospital Rev. (West Virginia United Health System Obligated Group), “A”, 4%, 6/01/2035 | 1,500,000 | 1,651,595 | ||
| West Virginia Hospital Finance Authority Hospital Rev. (West Virginia United Health System Obligated Group), “A”, 5.5%, 6/01/2044 (Prerefunded 6/01/2023) | 1,460,000 | 1,624,000 | ||
| West Virginia Hospital Finance Authority Hospital Rev. (West Virginia United Health System Obligated Group), “A”, AGM, 4%, 6/01/2051 | 2,000,000 | 2,200,796 | ||
| West Virginia Hospital Finance Authority Hospital Rev. (West Virginia University Health System Obligated Group), “A”, 5%, 6/01/2042 | 1,000,000 | 1,169,731 | ||
| West Virginia Hospital Finance Authority Hospital Rev. (West Virginia University Health System Obligated Group), “A”, 4%, 6/01/2051 | 220,000 | 240,426 | ||
| $ 17,698,582 | ||||
| Industrial Revenue - Other – 1.0% | ||||
| New York Liberty Development Corp. Rev. (Goldman Sachs Headquarters), 5.25%, 10/01/2035 | $ | 420,000 | $ 590,549 | |
| Port Beaumont, TX, Navigation District Facility Rev. (Jefferson Gulf Coast Energy Project), “A”, 4%, 1/01/2050 (n) | 200,000 | 205,020 | ||
| Tuscaloosa County, AL, Industrial Development Authority, Gulf Opportunity Zone (Hunt Refining Project), “A”, 5.25%, 5/01/2044 (n) | 325,000 | 369,335 | ||
| $ 1,164,904 | ||||
| Miscellaneous Revenue - Other – 7.3% | ||||
| Indiana Finance Authority Rev. (Ohio River Bridges East End Crossing Project), “A”, 5%, 7/01/2040 | $ | 140,000 | $ 151,243 | |
| New York Liberty Development Corp., Liberty Rev. (3 World Trade Center Project), “1”, 5%, 11/15/2044 (n) | 580,000 | 632,901 | ||
| New York Liberty Development Corp., Liberty Rev. (7 World Trade Center Project), 5%, 9/15/2040 | 545,000 | 566,984 | ||
| West Virginia Economic Development Authority, Excess Lottery Rev., 5%, 6/15/2022 | 250,000 | 263,441 | ||
| West Virginia Economic Development Authority, Excess Lottery Rev., “A”, 5%, 7/01/2038 | 1,000,000 | 1,239,473 | ||
| Issuer | Shares/Par | Value ($) | ||
| Miscellaneous Revenue - Other – continued | ||||
| West Virginia School Building Authority, “A”, 5%, 7/01/2028 | $ | 590,000 | $ 695,488 | |
| West Virginia School Building Authority, “A”, 3%, 7/01/2033 | 2,000,000 | 2,153,620 | ||
| West Virginia School Building Authority, Excess Lottery Rev., “B”, 5%, 7/01/2030 | 1,000,000 | 1,003,317 | ||
| West Virginia School Building Authority, Lottery Capital Improvement Rev., “A”, 5%, 7/01/2028 | 1,500,000 | 1,652,736 | ||
| $ 8,359,203 | ||||
| Sales & Excise Tax Revenue – 4.8% | ||||
| Guam Government Business Privilege Tax Rev., “A”, 5.25%, 1/01/2036 | $ | 335,000 | $ 345,682 | |
| Guam Government Business Privilege Tax Rev., “A”, 5.125%, 1/01/2042 | 790,000 | 814,483 | ||
| Massachusetts Bay Transportation Authority, Sales Tax Rev., “A”, 5%, 7/01/2031 | 500,000 | 676,887 | ||
| Ohio County, WV, Commission Special District Excise Tax Improvement Refunding Rev. (Fort Henry Economic Opportunity Development District - The Highlands Project), “B”, 2.75%, 3/01/2041 | 290,000 | 271,225 | ||
| Puerto Rico Sales Tax Financing Corp., Restructured Sales Tax Rev., “2019A-1”, 4.55%, 7/01/2040 | 25,000 | 27,095 | ||
| Puerto Rico Sales Tax Financing Corp., Restructured Sales Tax Rev., “2019A-1”, 5%, 7/01/2058 | 1,537,000 | 1,692,514 | ||
| Puerto Rico Sales Tax Financing Corp., Restructured Sales Tax Rev., “2019A-2”, 4.329%, 7/01/2040 | 238,000 | 254,593 | ||
| Puerto Rico Sales Tax Financing Corp., Restructured Sales Tax Rev., “2019A-2”, 4.329%, 7/01/2040 | 83,000 | 88,787 | ||
| Puerto Rico Sales Tax Financing Corp., Restructured Sales Tax Rev., “2019A-2”, 4.536%, 7/01/2053 | 1,000 | 1,072 | ||
| Puerto Rico Sales Tax Financing Corp., Restructured Sales Tax Rev., “2019A-2”, 4.784%, 7/01/2058 | 39,000 | 42,202 | ||
| Puerto Rico Sales Tax Financing Corp., Restructured Sales Tax Rev., Capital Appreciation, “2019A-1”, 0%, 7/01/2024 | 3,000 | 2,816 | ||
| Puerto Rico Sales Tax Financing Corp., Restructured Sales Tax Rev., Capital Appreciation, “2019A-1”, 0%, 7/01/2027 | 45,000 | 39,424 | ||
| Puerto Rico Sales Tax Financing Corp., Restructured Sales Tax Rev., Capital Appreciation, “2019A-1”, 0%, 7/01/2029 | 7,000 | 5,765 | ||
| Puerto Rico Sales Tax Financing Corp., Restructured Sales Tax Rev., Capital Appreciation, “2019A-1”, 0%, 7/01/2031 | 412,000 | 315,320 | ||
| Puerto Rico Sales Tax Financing Corp., Restructured Sales Tax Rev., Capital Appreciation, “2019A-1”, 0%, 7/01/2033 | 396,000 | 281,090 | ||
| Issuer | Shares/Par | Value ($) | ||
| Municipal Bonds – continued | ||||
| Sales & Excise Tax Revenue – continued | ||||
| Puerto Rico Sales Tax Financing Corp., Restructured Sales Tax Rev., Capital Appreciation, “2019A-1”, 0%, 7/01/2046 | $ | 1,503,000 | $ 458,671 | |
| Wisconsin Public Finance Authority Limited Obligation Grant Rev. (American Dream at Meadowlands Project), “A”, 6.25%, 8/01/2027 (n) | 120,000 | 130,404 | ||
| $ 5,448,030 | ||||
| Single Family Housing - State – 3.0% | ||||
| Maryland Community Development Administration, Department of Housing & Community Development Housing Rev., “A”, 4.25%, 9/01/2049 | $ | 435,000 | $ 486,255 | |
| Tennessee Housing Development Agency, Residential Finance Program Rev., “1”, 4.25%, 1/01/2050 | 455,000 | 505,136 | ||
| West Virginia Housing Development Fund, “A”, 3.875%, 11/01/2044 | 1,500,000 | 1,608,239 | ||
| West Virginia Housing Development Fund, “A”, FHA, 3.9%, 11/01/2048 | 350,000 | 350,958 | ||
| West Virginia Housing Development Fund, “B”, 1.8%, 5/01/2026 | 485,000 | 505,783 | ||
| $ 3,456,371 | ||||
| State & Local Agencies – 7.5% | ||||
| Maryland Stadium Authority Rev., Baltimore City Public Schools Construction and Revitalization Program, “A”, 5%, 5/01/2047 (Prerefunded 5/01/2028) | $ | 140,000 | $ 178,912 | |
| Maryland Stadium Authority Rev., Baltimore City Public Schools Construction and Revitalization Program, “A”, 5%, 5/01/2047 | 260,000 | 309,173 | ||
| New Jersey Economic Development Authority Rev. (School Facilities Construction), 5%, 6/15/2032 | 5,000 | 6,336 | ||
| New Jersey Economic Development Authority Rev. (School Facilities Construction), 4%, 6/15/2034 | 5,000 | 5,758 | ||
| New Jersey Economic Development Authority Rev. (School Facilities Construction), 4%, 6/15/2035 | 20,000 | 22,967 | ||
| New Jersey Economic Development Authority Rev. (School Facilities Construction), 4%, 6/15/2036 | 15,000 | 17,158 | ||
| New Jersey Economic Development Authority Rev. (School Facilities Construction), 4%, 6/15/2037 | 10,000 | 11,396 | ||
| New Jersey Economic Development Authority Rev. (School Facilities Construction), 4%, 6/15/2038 | 15,000 | 17,040 | ||
| New Jersey Economic Development Authority Rev. (School Facilities Construction), 4%, 6/15/2039 | 15,000 | 17,003 | ||
| Issuer | Shares/Par | Value ($) | ||
| State & Local Agencies – continued | ||||
| New Jersey Economic Development Authority Rev. (School Facilities Construction), 4%, 6/15/2040 | $ | 15,000 | $ 16,973 | |
| New Jersey Economic Development Authority Rev. (School Facilities Construction), 4%, 6/15/2041 | 10,000 | 11,281 | ||
| New Jersey Economic Development Authority Rev. (School Facilities Construction), “AAA”, 5%, 6/15/2026 | 105,000 | 126,084 | ||
| North Carolina Turnpike Authority, Triangle Expressway System Appropriation Rev., Capital Appreciation, 0%, 1/01/2044 | 1,640,000 | 849,700 | ||
| West Virginia Economic Development Authority, Auto Lease Rev., 5.2%, 5/01/2033 | 1,000,000 | 1,001,549 | ||
| West Virginia Economic Development Authority, Lease Rev. (Correctional Juvenile Public Safety Facilities), AGM, 5%, 6/01/2022 | 1,000,000 | 1,007,204 | ||
| West Virginia Economic Development Authority, Lease Rev. (Correctional Juvenile Public Safety Facilities), “A”, 5%, 6/01/2029 | 2,000,000 | 2,103,213 | ||
| West Virginia Economic Development Authority, Lease Rev. (Correctional, Juvenile, and Public Safety Facilities), “A”, 5%, 6/01/2025 | 255,000 | 268,709 | ||
| West Virginia Economic Development Authority, Lease Rev. (State Office Building), “B”, NPFG, 5.25%, 1/01/2025 | 410,000 | 411,516 | ||
| West Virginia Economic Development Authority, Lease Rev. (State Office Building), “B”, NPFG, 5.25%, 1/01/2030 | 1,355,000 | 1,360,010 | ||
| West Virginia Hospital Finance Authority Hospital Rev. (Veterans Nursing Home), 5.5%, 3/01/2034 | 795,000 | 796,688 | ||
| $ 8,538,670 | ||||
| Tax - Other – 2.5% | ||||
| Birmingham-Jefferson, AL, Civic Center Authority, “B”, 5%, 7/01/2043 | $ | 535,000 | $ 630,218 | |
| Puerto Rico Convention Center District Authority, Hotel Occupancy Tax Rev., “A”, AAC, 5%, 7/01/2031 | 945,000 | 966,888 | ||
| Puerto Rico Infrastructure Financing Authority Special Tax Rev., “C”, AAC, 5.5%, 7/01/2026 | 95,000 | 104,478 | ||
| Virgin Islands Public Finance Authority Rev. (Gross Receipts), AGM, 5%, 10/01/2032 | 1,000,000 | 1,051,659 | ||
| Wisconsin Public Finance Authority Limited Obligation PILOT Rev. (American Dream at Meadowlands Project), 7%, 12/01/2050 | 100,000 | 115,476 | ||
| $ 2,868,719 | ||||
| Tax Assessment – 1.3% | ||||
| Morgantown, WV, Tax Increment Rev., Parking Garage Project, “A”, 5%, 6/01/2033 | $ | 455,000 | $ 455,203 | |
| Issuer | Shares/Par | Value ($) | ||
| Municipal Bonds – continued | ||||
| Tax Assessment – continued | ||||
| Ohio County, WV, Commission Tax Increment Rev. (Fort Henry Centre), 4%, 6/01/2034 | $ | 1,000,000 | $ 1,004,224 | |
| $ 1,459,427 | ||||
| Tobacco – 1.4% | ||||
| Buckeye, OH, Tobacco Settlement Financing Authority Senior Asset-Backed Refunding, 2020A-2, “1”, 5%, 6/01/2036 | $ | 75,000 | $ 93,930 | |
| Buckeye, OH, Tobacco Settlement Financing Authority Senior Asset-Backed Refunding, 2020A-2, “1”, 4%, 6/01/2048 | 125,000 | 139,389 | ||
| Buckeye, OH, Tobacco Settlement Financing Authority Senior Asset-Backed Refunding, 2020B-2, “2”, 5%, 6/01/2055 | 500,000 | 563,305 | ||
| Buckeye, OH, Tobacco Settlement Financing Authority Senior Asset-Backed Refunding, 2020B-3, Capital Appreciation, “2”, 0%, 6/01/2057 | 1,360,000 | 205,644 | ||
| Illinois Railsplitter Tobacco Settlement Authority Rev., 6%, 6/01/2028 (Prerefunded 6/01/2021) | 620,000 | 625,678 | ||
| $ 1,627,946 | ||||
| Toll Roads – 1.8% | ||||
| Texas Private Activity Surface Transportation Corp., Senior Lien Rev. (NTE Mobility Partners Segments 3 LLC Segments 3A & 3B Facility), 7%, 12/31/2038 | $ | 155,000 | $ 176,849 | |
| Texas Private Activity Surface Transportation Corp., Senior Lien Rev. (NTE Mobility Partners Segments 3 LLC Segments 3A & 3B Facility), 6.75%, 6/30/2043 | 120,000 | 136,050 | ||
| West Virginia Parkways Authority, Turnpike Toll Rev., 5%, 6/01/2023 | 580,000 | 639,523 | ||
| West Virginia Parkways Authority, Turnpike Toll Rev., 4%, 6/01/2047 | 1,000,000 | 1,131,412 | ||
| $ 2,083,834 | ||||
| Transportation - Special Tax – 6.8% | ||||
| Commonwealth of Puerto Rico Highway & Transportation Authority Rev., “AA-1”, AGM, 4.95%, 7/01/2026 | $ | 575,000 | $ 586,936 | |
| Commonwealth of Puerto Rico Highway & Transportation Authority Rev., “L”, AAC, 5.25%, 7/01/2038 | 755,000 | 849,903 | ||
| Commonwealth of Puerto Rico Highway & Transportation Authority Rev., “N”, AAC, 5.5%, 7/01/2029 | 760,000 | 844,164 | ||
| Commonwealth of Puerto Rico Highway & Transportation Authority Rev., “N”, NPFG, 5.25%, 7/01/2032 | 115,000 | 127,550 | ||
| Metropolitan Transportation Authority Rev., NY, Anticipation Note, “B-2”, 5%, 5/15/2021 | 370,000 | 371,778 | ||
| New Jersey Transportation Trust Fund Authority, “AA”, 4%, 6/15/2050 | 1,000,000 | 1,110,734 | ||
| Issuer | Shares/Par | Value ($) | ||
| Transportation - Special Tax – continued | ||||
| New Jersey Transportation Trust Fund Authority, Federal Highway Reimbursement Rev., “A-1”, 5%, 6/15/2027 | $ | 220,000 | $ 262,921 | |
| New Jersey Transportation Trust Fund Authority, Transportation Program, “BB” , 4%, 6/15/2044 | 1,225,000 | 1,351,065 | ||
| West Virginia, Surface Transportation Improvements Special Obligation, “A”, 5%, 9/01/2025 | 1,900,000 | 2,261,423 | ||
| $ 7,766,474 | ||||
| Universities - Colleges – 14.0% | ||||
| Fairmont State University, WV, Board of Governors Rev., “A”, 5%, 6/01/2032 | $ | 4,035,000 | $ 4,057,586 | |
| Marshall University, WV, Board of Governors Rev., “A”, AGM, 5%, 5/01/2030 | 860,000 | 1,115,392 | ||
| Marshall University, WV, Board of Governors Rev., “A”, AGM, 3%, 5/01/2046 | 1,000,000 | 1,038,479 | ||
| Marshall University, WV, Board of Governors Rev., “A”, AGM, 4%, 5/01/2050 | 1,500,000 | 1,697,282 | ||
| Marshall University, WV, University Rev., 5%, 5/01/2041 (Prerefunded 5/03/2021) | 1,000,000 | 1,003,817 | ||
| Puerto Rico Industrial, Tourist, Educational, Medical & Environmental Control Facilities Financing Authority, Educational Facilities Rev. (University Plaza), “A”, NPFG, 5%, 7/01/2021 | 1,270,000 | 1,276,810 | ||
| Puerto Rico Industrial, Tourist, Educational, Medical & Environmental Control Facilities Financing Authority, Higher Education Rev. (International American University of Puerto Rico Project), 5%, 10/01/2031 | 110,000 | 113,990 | ||
| University of California Regents, Limited Project Rev., “Q”, 4%, 5/15/2051 | 1,200,000 | 1,405,475 | ||
| West Virginia University, Board of Governors Improvement Rev. (West Virginia University Project), “A”, 5%, 10/01/2049 | 1,000,000 | 1,227,782 | ||
| West Virginia University, University Systems Rev., “A”, NPFG, 5.25%, 4/01/2028 | 2,720,000 | 3,123,890 | ||
| $ 16,060,503 | ||||
| Utilities - Cogeneration – 0.2% | ||||
| Puerto Rico Industrial, Tourist, Educational, Medical & Environmental Control Facilities Financing Authority Rev. (Cogeneration Facilities - AES Puerto Rico Project), 9.12%, 6/01/2022 | $ | 240,000 | $ 246,000 | |
| Utilities - Investor Owned – 1.5% | ||||
| West Virginia Economic Development Authority, Solid Waste Disposal Rev. (Appalachian Power Company-Amos Project), “A”, 0.625%, 12/01/2038 (Put Date 12/15/2025) | $ | 750,000 | $ 741,456 | |
| Issuer | Shares/Par | Value ($) | ||
| Municipal Bonds – continued | ||||
| Utilities - Investor Owned – continued | ||||
| West Virginia Economic Development Authority, Solid Waste Disposal Rev. (Appalachian Power Company-Amos Project), “A”, 1%, 1/01/2041 (Put Date 9/01/2025) | $ | 1,000,000 | $ 1,001,923 | |
| $ 1,743,379 | ||||
| Utilities - Municipal Owned – 1.6% | ||||
| Guam Power Authority Rev., “A”, AGM, 5%, 10/01/2033 | $ | 435,000 | $ 485,555 | |
| Puerto Rico Electric Power Authority Rev., “A”, 5%, 7/01/2029 (a)(d) | 285,000 | 257,925 | ||
| Puerto Rico Electric Power Authority Rev., “A”, 5%, 7/01/2042 (a)(d) | 45,000 | 40,725 | ||
| Puerto Rico Electric Power Authority Rev., “AAA”, 5.25%, 7/01/2021 (a)(d) | 20,000 | 18,150 | ||
| Puerto Rico Electric Power Authority Rev., “AAA”, 5.25%, 7/01/2030 (a)(d) | 10,000 | 9,075 | ||
| Puerto Rico Electric Power Authority Rev., “CCC”, 5.25%, 7/01/2027 (a)(d) | 100,000 | 90,750 | ||
| Puerto Rico Electric Power Authority Rev., “DDD”, 5%, 7/01/2020 (a)(d) | 10,000 | 9,025 | ||
| Puerto Rico Electric Power Authority Rev., “DDD”, 5%, 7/01/2021 (a)(d) | 110,000 | 99,550 | ||
| Puerto Rico Electric Power Authority Rev., “DDD”, 5%, 7/01/2022 (a)(d) | 180,000 | 162,900 | ||
| Puerto Rico Electric Power Authority Rev., “EEE”, 6.05%, 7/01/2032 (a)(d) | 50,000 | 44,313 | ||
| Puerto Rico Electric Power Authority Rev., “TT”, 5%, 7/01/2021 (a)(d) | 40,000 | 36,200 | ||
| Puerto Rico Electric Power Authority Rev., “TT”, 5%, 7/01/2023 (a)(d) | 50,000 | 45,250 | ||
| Puerto Rico Electric Power Authority Rev., “TT”, 5%, 7/01/2027 (a)(d) | 10,000 | 9,050 | ||
| Puerto Rico Electric Power Authority Rev., “TT”, 5%, 7/01/2037 (a)(d) | 145,000 | 131,225 | ||
| Puerto Rico Electric Power Authority Rev., “VV”, NPFG, 5.25%, 7/01/2030 | 135,000 | 149,553 | ||
| Puerto Rico Electric Power Authority Rev., “VV”, NPFG, 5.25%, 7/01/2034 | 10,000 | 11,064 | ||
| Puerto Rico Electric Power Authority Rev., “WW”, 5.375%, 7/01/2022 (a)(d) | 10,000 | 9,088 | ||
| Puerto Rico Electric Power Authority Rev., “WW”, 5.25%, 7/01/2025 (a)(d) | 20,000 | 18,150 | ||
| Puerto Rico Electric Power Authority Rev., “ZZ”, 5%, 7/01/2018 (a)(d) | 70,000 | 62,387 | ||
| Puerto Rico Electric Power Authority Rev., “ZZ”, 5.25%, 7/01/2023 (a)(d) | 75,000 | 68,062 | ||
| Puerto Rico Electric Power Authority Rev., “ZZ”, 5.25%, 7/01/2024 (a)(d) | 20,000 | 18,150 | ||
| Puerto Rico Electric Power Authority Rev., “ZZ”, 5.25%, 7/01/2026 (a)(d) | 65,000 | 58,988 | ||
| $ 1,835,135 | ||||
| Issuer | Shares/Par | Value ($) | ||
| Utilities - Other – 0.3% | ||||
| Tennessee Energy Acquisition Corp., Gas Rev., “A”, 5.25%, 9/01/2021 | $ | 245,000 | $ 249,955 | |
| Tennessee Energy Acquisition Corp., Gas Rev., “A”, 5.25%, 9/01/2022 | 125,000 | 133,514 | ||
| $ 383,469 | ||||
| Water & Sewer Utility Revenue – 13.4% | ||||
| Berkeley County, WV, Public Service Sewer District, “A”, BAM, 5%, 6/01/2036 | $ | 1,700,000 | $ 2,020,756 | |
| Fairmont, WV, Waterworks Rev., AAC, 5.25%, 7/01/2022 | 140,000 | 144,757 | ||
| Fairmont, WV, Waterworks Rev., “A”, BAM, 4%, 7/01/2027 | 200,000 | 228,795 | ||
| Fairmont, WV, Waterworks Rev., “A”, BAM, 4%, 7/01/2028 | 200,000 | 230,612 | ||
| Fairmont, WV, Waterworks Rev., “A”, BAM, 4%, 7/01/2029 | 300,000 | 348,577 | ||
| Guam Waterworks Authority Rev. (Water and Wastewater System), 5%, 7/01/2036 | 40,000 | 45,572 | ||
| Guam Waterworks Authority Rev. (Water and Wastewater System), 5%, 1/01/2046 | 180,000 | 201,705 | ||
| Guam Waterworks Authority Rev. (Water and Wastewater System), “A”, 5%, 7/01/2029 | 20,000 | 22,131 | ||
| Guam Waterworks Authority Rev. (Water and Wastewater System), “A”, 5%, 7/01/2035 | 20,000 | 21,882 | ||
| Guam Waterworks Authority Rev. (Water and Wastewater System), “A”, 5%, 1/01/2050 | 135,000 | 162,252 | ||
| Michigan Finance Authority Local Government Loan Program Rev. (Detroit Water and Sewerage Department Sewage Disposal System Rev. Refunding Second Lien Local Project), “C-7”, NPFG, 5%, 7/01/2032 | 35,000 | 39,791 | ||
| Michigan Finance Authority Local Government Loan Program Rev. (Detroit Water and Sewerage Department Water Supply System Rev. Refunding Second Lien Local Project), “D-6”, NPFG, 5%, 7/01/2036 | 40,000 | 45,310 | ||
| Michigan Finance Authority Local Government Loan Program Rev. (Detroit Water and Sewerage Department Water Supply System Rev. Refunding Senior Lien Local Project), “D-1”, AGM, 5%, 7/01/2035 | 20,000 | 22,710 | ||
| Michigan Finance Authority Local Government Loan Program Rev. (Detroit Water and Sewerage Department Water Supply System Rev. Refunding Senior Lien Local Project), “D-1”, AGM, 5%, 7/01/2037 | 50,000 | 56,654 | ||
| Mississippi Development Bank Special Obligation (Jackson Water and Sewer System Rev. Bond Project), AGM, 6.875%, 12/01/2040 | 75,000 | 86,350 | ||
| Morgantown, WV, Combined Utility System Rev., “A”, AGM, 5%, 12/01/2041 | 1,000,000 | 1,206,290 | ||
| Morgantown, WV, Combined Utility System Rev., “A”, BAM, 4%, 12/01/2033 | 400,000 | 476,768 | ||
| Issuer | Shares/Par | Value ($) | ||
| Municipal Bonds – continued | ||||
| Water & Sewer Utility Revenue – continued | ||||
| Morgantown, WV, Combined Utility System Rev., “B”, 5%, 12/01/2043 | $ | 2,000,000 | $ 2,428,029 | |
| West Virginia Water Development Authority Rev. (Loan Program II), “A”, 5%, 11/01/2026 | 650,000 | 724,528 | ||
| West Virginia Water Development Authority Rev. (Loan Program II), “A-II”, 5%, 11/01/2033 | 1,475,000 | 1,803,463 | ||
| West Virginia Water Development Authority Rev. (Loan Program IV), “A-IV”, 5%, 11/01/2038 | 500,000 | 615,113 | ||
| Wheeling, WV, Combined Waterworks and Sewerage System Rev., 5%, 6/01/2038 | 3,000,000 | 3,274,482 | ||
| Wheeling, WV, Combined Waterworks and Sewerage System Rev., 5%, 6/01/2043 | 1,000,000 | 1,087,889 | ||
| $ 15,294,416 | ||||
| Total Municipal Bonds (Identified Cost, $106,026,936) | $111,844,343 | |||
| Issuer | Shares/Par | Value ($) | ||
| Bonds – 0.2% | ||||
| Consumer Services – 0.2% | ||||
| Toll Road Investors Partnership II LP, Capital Appreciation, NPFG, 0%, 2/15/2025 (n) | $ | 167,000 | $ 145,843 | |
| Toll Road Investors Partnership II LP, Capital Appreciation, NPFG, 0%, 2/15/2043 (n) | 400,000 | 113,921 | ||
| Total Bonds (Identified Cost, $279,203) | $ 259,764 | |||
| Investment Companies (h) – 0.5% | ||||
| Money Market Funds – 0.5% | ||||
| MFS Institutional Money Market Portfolio, 0.05% (v) (Identified Cost, $588,119) | 588,118 | $ 588,118 | ||
| Other Assets, Less Liabilities – 1.5% | 1,672,678 | |||
| Net Assets – 100.0% | $114,364,903 | |||
| Derivative Contracts at 3/31/21 | ||||||
| Futures Contracts | ||||||
| Description | Long/ Short | Currency | Contracts | Notional Amount | Expiration Date | Value/Unrealized Appreciation (Depreciation) |
| Liability Derivatives | ||||||
| Interest Rate Futures | ||||||
| U.S. Treasury Bond | Long | USD | 13 | $2,009,719 | June – 2021 | $(79,267) |
| (a) | Non-income producing security. |
| (d) | In default. |
| (h) | An affiliated issuer, which may be considered one in which the fund owns 5% or more of the outstanding voting securities, or a company which is under common control. At period end, the aggregate values of each fund’s investments in affiliated issuers and in unaffiliated issuers were as follows: |
| Affiliated Issuers | Unaffiliated Issuers | |
| Mississippi Fund | $ 38,650 | $108,700,249 |
| New York Fund | 2,328,184 | 281,539,555 |
| North Carolina Fund | 8,059,699 | 546,572,657 |
| Pennsylvania Fund | 3,316,601 | 182,417,813 |
| South Carolina Fund | 3,938,050 | 282,506,390 |
| Tennessee Fund | 621,190 | 100,284,188 |
| Virginia Fund | 4,569,228 | 379,963,858 |
| West Virginia Fund | 588,118 | 112,104,107 |
| (n) | Securities exempt from registration under Rule 144A of the Securities Act of 1933. These securities may be sold in the ordinary course of business in transactions exempt from registration, normally to qualified institutional buyers. At period end, the aggregate value of these securities and percentage of net assets for each fund is as follows: |
| Value | Percent of net assets | |
| Mississippi Fund | $ 680,575 | 0.6% |
| New York Fund | 10,374,763 | 3.6% |
| North Carolina Fund | 6,036,582 | 1.1% |
| Pennsylvania Fund | 3,236,951 | 1.7% |
| South Carolina Fund | 4,425,118 | 1.5% |
| Tennessee Fund | 1,550,731 | 1.5% |
| Virginia Fund | 8,320,637 | 2.2% |
| West Virginia Fund | 1,597,424 | 1.4% |
| (u) | Underlying security deposited into special purpose trust upon creation of self-deposited inverse floaters. |
| (v) | Affiliated issuer that is available only to investment companies managed by MFS. The rate quoted for the MFS Institutional Money Market Portfolio is the annualized seven-day yield of the fund at period end. |
| (w) | When-issued security. |
| The following abbreviations are used in this report and are defined: | |
| AAC | Ambac Assurance Corp. |
| AGM | Assured Guaranty Municipal |
| BAM | Build America Mutual |
| COP | Certificate of Participation |
| ETM | Escrowed to Maturity |
| FGIC | Financial Guaranty Insurance Co. |
| FHA | Federal Housing Administration |
| FLR | Floating Rate. Interest rate resets periodically based on the parenthetically disclosed reference rate plus a spread (if any). The period-end rate reported may not be the current rate. All reference rates are USD unless otherwise noted. |
| FNMA | Federal National Mortgage Assn. |
| GNMA | Government National Mortgage Assn. |
| LIBOR | London Interbank Offered Rate |
| NPFG | National Public Finance Guarantee Corp. |
| VRDN | Variable rate demand note that may be puttable to the issuer at the option of the holder. The stated interest rate, which generally resets either daily or weekly, represents the rate in effect at period end and may not be the current rate. |
| Mississippi Fund | New York Fund | North Carolina Fund | Pennsylvania Fund | |
| Assets | ||||
| Investments in unaffiliated issuers, at value (identified cost, $102,315,957, $264,099,790, $518,639,383, and $171,979,206, respectively) | $108,700,249 | $281,539,555 | $546,572,657 | $182,417,813 |
| Investments in affiliated issuers, at value (identified cost, $38,650, $2,328,184, $8,059,642, and $3,316,601, respectively) | 38,650 | 2,328,184 | 8,059,699 | 3,316,601 |
| Cash | 125,658 | 311 | — | — |
| Receivables for | ||||
| Investments sold | 30,000 | 585,000 | 3,295,611 | 75,000 |
| Fund shares sold | 65,976 | 54,296 | 966,848 | 759,339 |
| When-issued investments sold | — | 3,223,675 | — | — |
| Interest | 1,153,933 | 3,084,930 | 7,012,521 | 1,950,251 |
| Receivable from investment adviser | — | 1,527 | — | — |
| Other assets | 567 | 1,072 | 1,772 | 1,085 |
| Total assets | $110,115,033 | $290,818,550 | $565,909,108 | $188,520,089 |
| Liabilities | ||||
| Payable to custodian | $— | $— | $— | $1,324 |
| Payables for | ||||
| Distributions | 9,608 | 71,240 | 70,513 | 46,337 |
| Investments purchased | — | 1,500,000 | — | — |
| Fund shares reacquired | 77,578 | 330,659 | 1,202,689 | 416,588 |
| When-issued investments purchased | 876,411 | 3,967,775 | 20,855,340 | 1,419,094 |
| Payable to affiliates | ||||
| Investment adviser | 2,622 | — | 13,073 | 4,481 |
| Administrative services fee | 138 | 263 | 448 | 193 |
| Shareholder servicing costs | 24,020 | 77,311 | 149,547 | 48,278 |
| Distribution and service fees | 511 | 3,067 | 6,897 | 750 |
| Payable for independent Trustees' compensation | 5 | 20 | 2,956 | 5 |
| Accrued expenses and other liabilities | 67,484 | 74,457 | 87,142 | 73,804 |
| Total liabilities | $1,058,377 | $6,024,792 | $22,388,605 | $2,010,854 |
| Net assets | $109,056,656 | $284,793,758 | $543,520,503 | $186,509,235 |
| Net assets consist of | ||||
| Paid-in capital | $105,493,678 | $270,497,744 | $527,296,518 | $178,177,922 |
| Total distributable earnings (loss) | 3,562,978 | 14,296,014 | 16,223,985 | 8,331,313 |
| Net assets | $109,056,656 | $284,793,758 | $543,520,503 | $186,509,235 |
| Mississippi Fund | New York Fund | North Carolina Fund | Pennsylvania Fund | |
| Net assets | ||||
| Class A | $92,395,420 | $170,723,130 | $359,286,479 | $137,726,584 |
| Class B | 115,422 | 1,063,370 | 415,702 | 850,600 |
| Class C | — | 12,259,848 | 35,315,326 | — |
| Class I | 13,877,553 | 95,881,727 | 113,800,357 | 32,102,528 |
| Class R6 | 2,668,261 | 4,865,683 | 34,702,639 | 15,829,523 |
| Total net assets | $109,056,656 | $284,793,758 | $543,520,503 | $186,509,235 |
| Shares of beneficial interest outstanding | ||||
| Class A | 9,332,000 | 15,063,412 | 30,159,843 | 12,998,713 |
| Class B | 11,637 | 94,061 | 34,940 | 80,074 |
| Class C | — | 1,083,034 | 2,966,225 | — |
| Class I | 1,403,838 | 9,564,903 | 11,459,869 | 3,180,779 |
| Class R6 | 269,921 | 485,484 | 3,494,510 | 1,567,810 |
| Total shares of beneficial interest outstanding | 11,017,396 | 26,290,894 | 48,115,387 | 17,827,376 |
| Class A shares | ||||
| Net asset value per share (net assets / shares of beneficial interest outstanding) | $9.90 | $11.33 | $11.91 | $10.60 |
| Offering price per share (100 / 95.75 x net asset value per share) | $10.34 | $11.83 | $12.44 | $11.07 |
| Class B shares | ||||
| Net asset value and offering price per share (net assets / shares of beneficial interest outstanding) | $9.92 | $11.31 | $11.90 | $10.62 |
| Class C shares | ||||
| Net asset value and offering price per share (net assets / shares of beneficial interest outstanding) | $— | $11.32 | $11.91 | $— |
| Class I shares | ||||
| Net asset value, offering price, and redemption price per share (net assets / shares of beneficial interest outstanding) | $9.89 | $10.02 | $9.93 | $10.09 |
| Class R6 shares | ||||
| Net asset value, offering price, and redemption price per share (net assets / shares of beneficial interest outstanding) | $9.89 | $10.02 | $9.93 | $10.10 |
| On sales of $100,000 or more, the maximum offering price of Class A shares is reduced. A contingent deferred sales charge may be imposed on redemptions of Class A, Class B, and Class C shares. | ||||
| At 3/31/21 | South Carolina Fund | Tennessee Fund | Virginia Fund | West Virginia Fund |
| Assets | ||||
| Investments in unaffiliated issuers, at value (identified cost, $270,195,663, $95,011,352, $362,457,008, and $106,306,139, respectively) | $282,506,390 | $100,284,188 | $379,963,858 | $112,104,107 |
| Investments in affiliated issuers, at value (identified cost, $3,938,050, $621,186, $4,569,195, and $588,119, respectively) | 3,938,050 | 621,190 | 4,569,228 | 588,118 |
| Deposits with brokers for futures contracts | — | — | — | 54,600 |
| Receivables for | ||||
| Investments sold | 1,236,769 | 40,385 | 105,000 | 315,000 |
| Fund shares sold | 448,182 | 72,636 | 391,786 | 106,562 |
| Interest | 3,274,095 | 1,270,841 | 4,479,133 | 1,419,982 |
| Receivable from investment adviser | 5,529 | 8,753 | 12,837 | 6,935 |
| Other assets | 1,901 | 561 | 2,107 | 587 |
| Total assets | $291,410,916 | $102,298,554 | $389,523,949 | $114,595,891 |
| Liabilities | ||||
| Payables for | ||||
| Distributions | $23,041 | $13,583 | $92,131 | $15,137 |
| Interest expense and fees | — | — | 17,509 | — |
| Fund shares reacquired | 446,944 | 77,600 | 844,929 | 101,397 |
| When-issued investments purchased | — | 1,833,593 | — | — |
| Net daily variation margin on open futures contracts | — | — | — | 5,686 |
| Payable to the holders of the floating rate certificates | — | — | 5,000,711 | — |
| Payable to affiliates | ||||
| Administrative services fee | 267 | 132 | 333 | 142 |
| Shareholder servicing costs | 68,592 | 29,066 | 111,363 | 37,430 |
| Distribution and service fees | 3,061 | 977 | 4,266 | 1,366 |
| Payable for independent Trustees' compensation | 2,959 | 13 | 2,958 | 2,960 |
| Accrued expenses and other liabilities | 76,737 | 66,822 | 81,228 | 66,870 |
| Total liabilities | $621,601 | $2,021,786 | $6,155,428 | $230,988 |
| Net assets | $290,789,315 | $100,276,768 | $383,368,521 | $114,364,903 |
| Net assets consist of | ||||
| Paid-in capital | $283,915,604 | $97,582,567 | $373,549,246 | $112,550,760 |
| Total distributable earnings (loss) | 6,873,711 | 2,694,201 | 9,819,275 | 1,814,143 |
| Net assets | $290,789,315 | $100,276,768 | $383,368,521 | $114,364,903 |
| South Carolina Fund | Tennessee Fund | Virginia Fund | West Virginia Fund | |
| Net assets | ||||
| Class A | $222,730,323 | $70,628,073 | $251,971,062 | $99,380,021 |
| Class B | 280,009 | 178,150 | 435,602 | 108,540 |
| Class C | — | — | 14,348,453 | — |
| Class I | 53,171,083 | 25,437,149 | 94,495,182 | 14,051,967 |
| Class R6 | 14,607,900 | 4,033,396 | 22,118,222 | 824,375 |
| Total net assets | $290,789,315 | $100,276,768 | $383,368,521 | $114,364,903 |
| Shares of beneficial interest outstanding | ||||
| Class A | 18,101,530 | 6,687,841 | 22,060,110 | 8,885,050 |
| Class B | 22,768 | 16,880 | 38,165 | 9,707 |
| Class C | — | — | 1,256,567 | — |
| Class I | 5,333,802 | 2,577,164 | 9,519,144 | 1,427,333 |
| Class R6 | 1,465,105 | 408,913 | 2,226,382 | 83,755 |
| Total shares of beneficial interest outstanding | 24,923,205 | 9,690,798 | 35,100,368 | 10,405,845 |
| Class A shares | ||||
| Net asset value per share (net assets / shares of beneficial interest outstanding) | $12.30 | $10.56 | $11.42 | $11.19 |
| Offering price per share (100 / 95.75 x net asset value per share) | $12.85 | $11.03 | $11.93 | $11.69 |
| Class B shares | ||||
| Net asset value and offering price per share (net assets / shares of beneficial interest outstanding) | $12.30 | $10.55 | $11.41 | $11.18 |
| Class C shares | ||||
| Net asset value and offering price per share (net assets / shares of beneficial interest outstanding) | $— | $— | $11.42 | $— |
| Class I shares | ||||
| Net asset value, offering price, and redemption price per share (net assets / shares of beneficial interest outstanding) | $9.97 | $9.87 | $9.93 | $9.84 |
| Class R6 shares | ||||
| Net asset value, offering price, and redemption price per share (net assets / shares of beneficial interest outstanding) | $9.97 | $9.86 | $9.93 | $9.84 |
| On sales of $100,000 or more, the maximum offering price of Class A shares is reduced. A contingent deferred sales charge may be imposed on redemptions of Class A, Class B, and Class C shares. | ||||
| Mississippi Fund | New York Fund | North Carolina Fund | Pennsylvania Fund | |
| Net investment income (loss) | ||||
| Interest | $3,279,401 | $9,450,633 | $15,970,974 | $5,700,424 |
| Dividends from affiliated issuers | 3,515 | 7,301 | 16,790 | 7,259 |
| Total investment income | $3,282,916 | $9,457,934 | $15,987,764 | $5,707,683 |
| Expenses | ||||
| Management fee | $471,772 | $1,245,995 | $2,304,664 | $775,731 |
| Distribution and service fees | 225,807 | 575,560 | 1,273,739 | 333,873 |
| Shareholder servicing costs | 67,857 | 205,127 | 379,048 | 134,393 |
| Administrative services fee | 24,620 | 47,049 | 77,521 | 33,373 |
| Independent Trustees' compensation | 2,698 | 7,972 | 8,967 | 4,259 |
| Custodian fee | 20,552 | 37,985 | 56,728 | 28,721 |
| Shareholder communications | 8,234 | 13,646 | 21,900 | 13,379 |
| Audit and tax fees | 57,208 | 57,253 | 57,305 | 57,223 |
| Legal fees | 8,626 | 12,102 | 8,246 | 11,366 |
| Registration fees | 59,044 | 71,448 | 76,921 | 60,683 |
| Miscellaneous | 29,358 | 32,915 | 35,687 | 30,970 |
| Total expenses | $975,776 | $2,307,052 | $4,300,726 | $1,483,971 |
| Fees paid indirectly | (72) | (40) | (40) | (21) |
| Reduction of expenses by investment adviser and distributor | (146,420) | (91,869) | (65,182) | (214,481) |
| Net expenses | $829,284 | $2,215,143 | $4,235,504 | $1,269,469 |
| Net investment income (loss) | $2,453,632 | $7,242,791 | $11,752,260 | $4,438,214 |
| Realized and unrealized gain (loss) | ||||
| Realized gain (loss) (identified cost basis) | ||||
| Unaffiliated issuers | $363,435 | $833,846 | $2,081,297 | $841,925 |
| Affiliated issuers | 72 | (742) | (1,273) | (744) |
| Futures contracts | (32,940) | (154,172) | (15,481) | (167,610) |
| Net realized gain (loss) | $330,567 | $678,932 | $2,064,543 | $673,571 |
| Change in unrealized appreciation or depreciation | ||||
| Unaffiliated issuers | $2,375,380 | $8,948,106 | $16,488,344 | $4,803,885 |
| Affiliated issuers | (390) | 103 | 475 | 311 |
| Futures contracts | 132,385 | 180,524 | 962,795 | 180,524 |
| Net unrealized gain (loss) | $2,507,375 | $9,128,733 | $17,451,614 | $4,984,720 |
| Net realized and unrealized gain (loss) | $2,837,942 | $9,807,665 | $19,516,157 | $5,658,291 |
| Change in net assets from operations | $5,291,574 | $17,050,456 | $31,268,417 | $10,096,505 |
| Year ended 3/31/21 | South Carolina Fund | Tennessee Fund | Virginia Fund | West Virginia Fund |
| Net investment income (loss) | ||||
| Interest | $7,656,768 | $3,336,990 | $12,232,223 | $3,732,122 |
| Dividends from affiliated issuers | 10,927 | 3,163 | 8,134 | 3,135 |
| Total investment income | $7,667,695 | $3,340,153 | $12,240,357 | $3,735,257 |
| Expenses | ||||
| Management fee | $1,184,134 | $455,588 | $1,625,719 | $497,892 |
| Distribution and service fees | 518,768 | 182,725 | 775,776 | 246,779 |
| Shareholder servicing costs | 175,597 | 77,836 | 297,173 | 99,006 |
| Administrative services fee | 45,135 | 24,164 | 57,927 | 25,385 |
| Independent Trustees' compensation | 8,155 | 4,033 | 8,481 | 4,288 |
| Custodian fee | 33,578 | 19,592 | 44,196 | 18,170 |
| Shareholder communications | 12,874 | 8,209 | 17,743 | 8,560 |
| Audit and tax fees | 57,243 | 57,208 | 57,520 | 57,210 |
| Legal fees | 9,710 | 4,619 | 7,436 | 3,072 |
| Registration fees | 61,443 | 56,717 | 73,498 | 57,371 |
| Interest expense and fees | — | — | 51,193 | — |
| Miscellaneous | 31,994 | 29,195 | 32,201 | 29,217 |
| Total expenses | $2,138,631 | $919,886 | $3,048,863 | $1,046,950 |
| Fees paid indirectly | (33) | (10) | (17) | (110) |
| Reduction of expenses by investment adviser and distributor | (73,081) | (122,136) | (217,337) | (117,250) |
| Net expenses | $2,065,517 | $797,740 | $2,831,509 | $929,590 |
| Net investment income (loss) | $5,602,178 | $2,542,413 | $9,408,848 | $2,805,667 |
| Realized and unrealized gain (loss) | ||||
| Realized gain (loss) (identified cost basis) | ||||
| Unaffiliated issuers | $476,165 | $329,501 | $590,057 | $(31,498) |
| Affiliated issuers | (1,908) | (534) | (578) | (315) |
| Futures contracts | 16,798 | (45,554) | (364,098) | (24,523) |
| Net realized gain (loss) | $491,055 | $283,413 | $225,381 | $(56,336) |
| Change in unrealized appreciation or depreciation | ||||
| Unaffiliated issuers | $7,018,187 | $3,332,560 | $10,187,976 | $2,642,853 |
| Affiliated issuers | 854 | 106 | (366) | 52 |
| Futures contracts | — | 120,349 | 722,096 | (251,558) |
| Net unrealized gain (loss) | $7,019,041 | $3,453,015 | $10,909,706 | $2,391,347 |
| Net realized and unrealized gain (loss) | $7,510,096 | $3,736,428 | $11,135,087 | $2,335,011 |
| Change in net assets from operations | $13,112,274 | $6,278,841 | $20,543,935 | $5,140,678 |
| Year ended 3/31/21 | Mississippi Fund | New York Fund | North Carolina Fund | Pennsylvania Fund |
| Change in net assets | ||||
| From operations | ||||
| Net investment income (loss) | $2,453,632 | $7,242,791 | $11,752,260 | $4,438,214 |
| Net realized gain (loss) | 330,567 | 678,932 | 2,064,543 | 673,571 |
| Net unrealized gain (loss) | 2,507,375 | 9,128,733 | 17,451,614 | 4,984,720 |
| Change in net assets from operations | $5,291,574 | $17,050,456 | $31,268,417 | $10,096,505 |
| Total distributions to shareholders | $(2,422,939) | $(7,154,905) | $(11,694,845) | $(4,456,885) |
| Change in net assets from fund share transactions | $5,469,528 | $(3,957,478) | $43,206,435 | $22,693,436 |
| Total change in net assets | $8,338,163 | $5,938,073 | $62,780,007 | $28,333,056 |
| Net assets | ||||
| At beginning of period | 100,718,493 | 278,855,685 | 480,740,496 | 158,176,179 |
| At end of period | $109,056,656 | $284,793,758 | $543,520,503 | $186,509,235 |
| Year ended 3/31/21 | South Carolina Fund | Tennessee Fund | Virginia Fund | West Virginia Fund |
| Change in net assets | ||||
| From operations | ||||
| Net investment income (loss) | $5,602,178 | $2,542,413 | $9,408,848 | $2,805,667 |
| Net realized gain (loss) | 491,055 | 283,413 | 225,381 | (56,336) |
| Net unrealized gain (loss) | 7,019,041 | 3,453,015 | 10,909,706 | 2,391,347 |
| Change in net assets from operations | $13,112,274 | $6,278,841 | $20,543,935 | $5,140,678 |
| Total distributions to shareholders | $(5,579,131) | $(2,524,171) | $(9,736,123) | $(2,825,621) |
| Change in net assets from fund share transactions | $45,917,088 | $(2,310,962) | $33,511,986 | $4,684,892 |
| Total change in net assets | $53,450,231 | $1,443,708 | $44,319,798 | $6,999,949 |
| Net assets | ||||
| At beginning of period | 237,339,084 | 98,833,060 | 339,048,723 | 107,364,954 |
| At end of period | $290,789,315 | $100,276,768 | $383,368,521 | $114,364,903 |
| Year ended 3/31/20 | Mississippi Fund | New York Fund | North Carolina Fund | Pennsylvania Fund |
| Change in net assets | ||||
| From operations | ||||
| Net investment income (loss) | $2,751,322 | $7,512,427 | $12,408,983 | $4,825,454 |
| Net realized gain (loss) | (175,534) | (1,199,819) | (2,213,669) | (145,128) |
| Net unrealized gain (loss) | (326,364) | (1,750,018) | (5,420,912) | (694,518) |
| Change in net assets from operations | $2,249,424 | $4,562,590 | $4,774,402 | $3,985,808 |
| Total distributions to shareholders | $(2,737,558) | $(7,428,830) | $(12,560,484) | $(4,829,636) |
| Change in net assets from fund share transactions | $11,818,604 | $36,761,020 | $78,111,036 | $19,881,006 |
| Total change in net assets | $11,330,470 | $33,894,780 | $70,324,954 | $19,037,178 |
| Net assets | ||||
| At beginning of period | 89,388,023 | 244,960,905 | 410,415,542 | 139,139,001 |
| At end of period | $100,718,493 | $278,855,685 | $480,740,496 | $158,176,179 |
| Year ended 3/31/20 | South Carolina Fund | Tennessee Fund | Virginia Fund | West Virginia Fund |
| Change in net assets | ||||
| From operations | ||||
| Net investment income (loss) | $5,912,828 | $3,059,314 | $9,646,085 | $3,277,005 |
| Net realized gain (loss) | (137,127) | (304,749) | 10,875 | 678,601 |
| Net unrealized gain (loss) | (1,672,618) | (1,693,171) | (4,012,113) | (1,077,903) |
| Change in net assets from operations | $4,103,083 | $1,061,394 | $5,644,847 | $2,877,703 |
| Total distributions to shareholders | $(5,861,320) | $(3,039,898) | $(9,466,489) | $(3,267,035) |
| Change in net assets from fund share transactions | $48,193,172 | $2,813,238 | $30,792,526 | $2,256,866 |
| Total change in net assets | $46,434,935 | $834,734 | $26,970,884 | $1,867,534 |
| Net assets | ||||
| At beginning of period | 190,904,149 | 97,998,326 | 312,077,839 | 105,497,420 |
| At end of period | $237,339,084 | $98,833,060 | $339,048,723 | $107,364,954 |
| Year ended | |||||
| Class A | 3/31/21 | 3/31/20 | 3/31/19 | 3/31/18 | 3/31/17 |
| Net asset value, beginning of period | $9.63 | $9.64 | $9.53 | $9.64 | $10.02 |
| Income (loss) from investment operations | |||||
| Net investment income (loss) (d) | $0.23 | $0.28 | $0.34 | $0.31 | $0.34(c) |
| Net realized and unrealized gain (loss) | 0.27 | (0.01) | 0.08 | (0.11) | (0.39) |
| Total from investment operations | $0.50 | $0.27 | $0.42 | $0.20 | $(0.05) |
| Less distributions declared to shareholders | |||||
| From net investment income | $(0.23) | $(0.28) | $(0.31) | $(0.31) | $(0.33) |
| Net asset value, end of period (x) | $9.90 | $9.63 | $9.64 | $9.53 | $9.64 |
| Total return (%) (r)(s)(t)(x) | 5.20 | 2.80 | 4.47 | 2.07 | (0.49)(c) |
| Ratios (%) (to average net assets) and Supplemental data: | |||||
| Expenses before expense reductions (f) | 0.97 | 0.98 | 1.00 | 1.00 | 0.98(c) |
| Expenses after expense reductions (f) | 0.81 | 0.82 | 0.83 | 0.83 | 0.81(c) |
| Net investment income (loss) | 2.33 | 2.88 | 3.53 | 3.21 | 3.41(c) |
| Portfolio turnover | 20 | 30 | 16 | 11 | 14 |
| Net assets at end of period (000 omitted) | $92,395 | $86,335 | $79,190 | $82,526 | $84,401 |
| Year ended | |||||
| Class B | 3/31/21 | 3/31/20 | 3/31/19 | 3/31/18 | 3/31/17 |
| Net asset value, beginning of period | $9.64 | $9.65 | $9.54 | $9.65 | $10.04 |
| Income (loss) from investment operations | |||||
| Net investment income (loss) (d) | $0.18 | $0.22 | $0.27 | $0.25 | $0.27(c) |
| Net realized and unrealized gain (loss) | 0.26 | (0.01) | 0.09 | (0.11) | (0.39) |
| Total from investment operations | $0.44 | $0.21 | $0.36 | $0.14 | $(0.12) |
| Less distributions declared to shareholders | |||||
| From net investment income | $(0.16) | $(0.22) | $(0.25) | $(0.25) | $(0.27) |
| Net asset value, end of period (x) | $9.92 | $9.64 | $9.65 | $9.54 | $9.65 |
| Total return (%) (r)(s)(t)(x) | 4.63 | 2.14 | 3.79 | 1.40 | (1.25)(c) |
| Ratios (%) (to average net assets) and Supplemental data: | |||||
| Expenses before expense reductions (f) | 1.72 | 1.73 | 1.75 | 1.75 | 1.72(c) |
| Expenses after expense reductions (f) | 1.46 | 1.47 | 1.49 | 1.50 | 1.48(c) |
| Net investment income (loss) | 1.79 | 2.24 | 2.87 | 2.55 | 2.74(c) |
| Portfolio turnover | 20 | 30 | 16 | 11 | 14 |
| Net assets at end of period (000 omitted) | $115 | $626 | $659 | $1,007 | $1,180 |
| Year ended | |||||
| Class I | 3/31/21 | 3/31/20 | 3/31/19 | 3/31/18 | 3/31/17(i) |
| Net asset value, beginning of period | $9.61 | $9.63 | $9.51 | $9.62 | $10.00 |
| Income (loss) from investment operations | |||||
| Net investment income (loss) (d) | $0.24 | $0.29 | $0.34 | $0.32 | $0.34(c) |
| Net realized and unrealized gain (loss) | 0.28 | (0.02) | 0.09 | (0.11) | (0.38) |
| Total from investment operations | $0.52 | $0.27 | $0.43 | $0.21 | $(0.04) |
| Less distributions declared to shareholders | |||||
| From net investment income | $(0.24) | $(0.29) | $(0.31) | $(0.32) | $(0.34) |
| Net asset value, end of period (x) | $9.89 | $9.61 | $9.63 | $9.51 | $9.62 |
| Total return (%) (r)(s)(t)(x) | 5.41 | 2.79 | 4.67 | 2.15 | (0.42)(c) |
| Ratios (%) (to average net assets) and Supplemental data: | |||||
| Expenses before expense reductions (f) | 0.72 | 0.72 | 0.75 | 0.74 | 0.75(c) |
| Expenses after expense reductions (f) | 0.70 | 0.71 | 0.74 | 0.74 | 0.75(c) |
| Net investment income (loss) | 2.42 | 2.96 | 3.63 | 3.29 | 3.44(c) |
| Portfolio turnover | 20 | 30 | 16 | 11 | 14 |
| Net assets at end of period (000 omitted) | $13,878 | $11,374 | $8,672 | $6,540 | $4,646 |
| Year ended | ||||
| Class R6 | 3/31/21 | 3/31/20 | 3/31/19 | 3/31/18(i) |
| Net asset value, beginning of period | $9.61 | $9.63 | $9.51 | $9.76 |
| Income (loss) from investment operations | ||||
| Net investment income (loss) (d) | $0.24 | $0.29 | $0.35 | $0.21 |
| Net realized and unrealized gain (loss) | 0.28 | (0.01) | 0.09 | (0.24) |
| Total from investment operations | $0.52 | $0.28 | $0.44 | $(0.03) |
| Less distributions declared to shareholders | ||||
| From net investment income | $(0.24) | $(0.30) | $(0.32) | $(0.22) |
| Net asset value, end of period (x) | $9.89 | $9.61 | $9.63 | $9.51 |
| Total return (%) (r)(s)(t)(x) | 5.48 | 2.85 | 4.74 | (0.36)(n) |
| Ratios (%) (to average net assets) and Supplemental data: | ||||
| Expenses before expense reductions (f) | 0.65 | 0.66 | 0.68 | 0.71(a) |
| Expenses after expense reductions (f) | 0.64 | 0.65 | 0.67 | 0.70(a) |
| Net investment income (loss) | 2.47 | 2.95 | 3.71 | 3.33(a) |
| Portfolio turnover | 20 | 30 | 16 | 11 |
| Net assets at end of period (000 omitted) | $2,668 | $2,384 | $867 | $560 |
| (a) | Annualized. |
| (c) | Amount reflects a one-time reimbursement of expenses by the custodian (or former custodian) without which net investment income and performance would be lower and expenses would be higher. |
| (d) | Per share data is based on average shares outstanding. |
| (f) | Ratios do not reflect reductions from fees paid indirectly, if applicable. |
| (i) | For Class I and Class R6, the period is from the class inception, April 1, 2016 (Class I) and August 1, 2017 (Class R6), through the stated period end. |
| (n) | Not annualized. |
| (r) | Certain expenses have been reduced without which performance would have been lower. |
| (s) | From time to time the fund may receive proceeds from litigation settlements, without which performance would be lower. |
| (t) | Total returns do not include any applicable sales charges. |
| (x) | The net asset values and total returns have been calculated on net assets which include adjustments made in accordance with U.S. generally accepted accounting principles required at period end for financial reporting purposes. |
| Year ended | |||||
| Class A | 3/31/21 | 3/31/20 | 3/31/19 | 3/31/18 | 3/31/17 |
| Net asset value, beginning of period | $10.93 | $11.00 | $10.87 | $10.93 | $11.31 |
| Income (loss) from investment operations | |||||
| Net investment income (loss) (d) | $0.29 | $0.31 | $0.40 | $0.40 | $0.41(c) |
| Net realized and unrealized gain (loss) | 0.39 | (0.08) | 0.11 | (0.08) | (0.39) |
| Total from investment operations | $0.68 | $0.23 | $0.51 | $0.32 | $0.02 |
| Less distributions declared to shareholders | |||||
| From net investment income | $(0.28) | $(0.30) | $(0.38) | $(0.38) | $(0.40) |
| Net asset value, end of period (x) | $11.33 | $10.93 | $11.00 | $10.87 | $10.93 |
| Total return (%) (r)(s)(t)(x) | 6.32 | 2.08 | 4.82 | 2.89 | 0.15(c) |
| Ratios (%) (to average net assets) and Supplemental data: | |||||
| Expenses before expense reductions (f) | 0.87 | 0.88 | 0.89 | 0.89 | 0.89(c) |
| Expenses after expense reductions (f) | 0.84 | 0.86 | 0.88 | 0.88 | 0.88(c) |
| Net investment income (loss) | 2.57 | 2.73 | 3.75 | 3.60 | 3.68(c) |
| Portfolio turnover | 45 | 25 | 17 | 23 | 28 |
| Net assets at end of period (000 omitted) | $170,723 | $174,514 | $154,803 | $143,689 | $124,890 |
| Year ended | |||||
| Class B | 3/31/21 | 3/31/20 | 3/31/19 | 3/31/18 | 3/31/17 |
| Net asset value, beginning of period | $10.90 | $10.97 | $10.84 | $10.90 | $11.28 |
| Income (loss) from investment operations | |||||
| Net investment income (loss) (d) | $0.20 | $0.22 | $0.32 | $0.32 | $0.33(c) |
| Net realized and unrealized gain (loss) | 0.41 | (0.07) | 0.11 | (0.09) | (0.40) |
| Total from investment operations | $0.61 | $0.15 | $0.43 | $0.23 | $(0.07) |
| Less distributions declared to shareholders | |||||
| From net investment income | $(0.20) | $(0.22) | $(0.30) | $(0.29) | $(0.31) |
| Net asset value, end of period (x) | $11.31 | $10.90 | $10.97 | $10.84 | $10.90 |
| Total return (%) (r)(s)(t)(x) | 5.63 | 1.32 | 4.05 | 2.12 | (0.60)(c) |
| Ratios (%) (to average net assets) and Supplemental data: | |||||
| Expenses before expense reductions (f) | 1.62 | 1.63 | 1.64 | 1.64 | 1.64(c) |
| Expenses after expense reductions (f) | 1.60 | 1.62 | 1.63 | 1.64 | 1.63(c) |
| Net investment income (loss) | 1.85 | 2.00 | 3.01 | 2.87 | 2.94(c) |
| Portfolio turnover | 45 | 25 | 17 | 23 | 28 |
| Net assets at end of period (000 omitted) | $1,063 | $2,193 | $2,876 | $3,980 | $5,032 |
| Year ended | |||||
| Class C | 3/31/21 | 3/31/20 | 3/31/19 | 3/31/18 | 3/31/17 |
| Net asset value, beginning of period | $10.91 | $10.98 | $10.86 | $10.92 | $11.30 |
| Income (loss) from investment operations | |||||
| Net investment income (loss) (d) | $0.20 | $0.22 | $0.32 | $0.31 | $0.33(c) |
| Net realized and unrealized gain (loss) | 0.41 | (0.07) | 0.10 | (0.08) | (0.39) |
| Total from investment operations | $0.61 | $0.15 | $0.42 | $0.23 | $(0.06) |
| Less distributions declared to shareholders | |||||
| From net investment income | $(0.20) | $(0.22) | $(0.30) | $(0.29) | $(0.32) |
| Net asset value, end of period (x) | $11.32 | $10.91 | $10.98 | $10.86 | $10.92 |
| Total return (%) (r)(s)(t)(x) | 5.63 | 1.32 | 3.95 | 2.12 | (0.60)(c) |
| Ratios (%) (to average net assets) and Supplemental data: | |||||
| Expenses before expense reductions (f) | 1.62 | 1.63 | 1.64 | 1.64 | 1.64(c) |
| Expenses after expense reductions (f) | 1.59 | 1.62 | 1.63 | 1.64 | 1.63(c) |
| Net investment income (loss) | 1.83 | 1.98 | 2.99 | 2.85 | 2.94(c) |
| Portfolio turnover | 45 | 25 | 17 | 23 | 28 |
| Net assets at end of period (000 omitted) | $12,260 | $15,471 | $16,953 | $22,932 | $25,246 |
| Year ended | |||||
| Class I | 3/31/21 | 3/31/20 | 3/31/19 | 3/31/18 | 3/31/17(i) |
| Net asset value, beginning of period | $9.66 | $9.73 | $9.61 | $9.67 | $10.00 |
| Income (loss) from investment operations | |||||
| Net investment income (loss) (d) | $0.28 | $0.30 | $0.38 | $0.38 | $0.39(c) |
| Net realized and unrealized gain (loss) | 0.35 | (0.08) | 0.10 | (0.08) | (0.34) |
| Total from investment operations | $0.63 | $0.22 | $0.48 | $0.30 | $0.05 |
| Less distributions declared to shareholders | |||||
| From net investment income | $(0.27) | $(0.29) | $(0.36) | $(0.36) | $(0.38) |
| Net asset value, end of period (x) | $10.02 | $9.66 | $9.73 | $9.61 | $9.67 |
| Total return (%) (r)(s)(t)(x) | 6.65 | 2.25 | 5.13 | 3.07 | 0.49(c) |
| Ratios (%) (to average net assets) and Supplemental data: | |||||
| Expenses before expense reductions (f) | 0.62 | 0.63 | 0.64 | 0.64 | 0.64(c) |
| Expenses after expense reductions (f) | 0.59 | 0.62 | 0.63 | 0.64 | 0.64(c) |
| Net investment income (loss) | 2.81 | 2.97 | 3.99 | 3.84 | 3.97(c) |
| Portfolio turnover | 45 | 25 | 17 | 23 | 28 |
| Net assets at end of period (000 omitted) | $95,882 | $83,586 | $68,415 | $57,349 | $50,414 |
| Year ended | ||||
| Class R6 | 3/31/21 | 3/31/20 | 3/31/19 | 3/31/18(i) |
| Net asset value, beginning of period | $9.66 | $9.73 | $9.61 | $9.83 |
| Income (loss) from investment operations | ||||
| Net investment income (loss) (d) | $0.28 | $0.30 | $0.39 | $0.24 |
| Net realized and unrealized gain (loss) | 0.36 | (0.07) | 0.10 | (0.23) |
| Total from investment operations | $0.64 | $0.23 | $0.49 | $0.01 |
| Less distributions declared to shareholders | ||||
| From net investment income | $(0.28) | $(0.30) | $(0.37) | $(0.23) |
| Net asset value, end of period (x) | $10.02 | $9.66 | $9.73 | $9.61 |
| Total return (%) (r)(s)(t)(x) | 6.72 | 2.31 | 5.19 | 0.11(n) |
| Ratios (%) (to average net assets) and Supplemental data: | ||||
| Expenses before expense reductions (f) | 0.56 | 0.56 | 0.57 | 0.60(a) |
| Expenses after expense reductions (f) | 0.53 | 0.55 | 0.57 | 0.59(a) |
| Net investment income (loss) | 2.86 | 3.01 | 4.04 | 3.80(a) |
| Portfolio turnover | 45 | 25 | 17 | 23 |
| Net assets at end of period (000 omitted) | $4,866 | $3,092 | $1,914 | $1,293 |
| (a) | Annualized. |
| (c) | Amount reflects a one-time reimbursement of expenses by the custodian (or former custodian) without which net investment income and performance would be lower and expenses would be higher. |
| (d) | Per share data is based on average shares outstanding. |
| (f) | Ratios do not reflect reductions from fees paid indirectly, if applicable. |
| (i) | For Class I and Class R6, the period is from the class inception, April 1, 2016 (Class I) and August 1, 2017 (Class R6), through the stated period end. |
| (n) | Not annualized. |
| (r) | Certain expenses have been reduced without which performance would have been lower. |
| (s) | From time to time the fund may receive proceeds from litigation settlements, without which performance would be lower. |
| (t) | Total returns do not include any applicable sales charges. |
| (x) | The net asset values and total returns have been calculated on net assets which include adjustments made in accordance with U.S. generally accepted accounting principles required at period end for financial reporting purposes. |
| Year ended | |||||
| Class A | 3/31/21 | 3/31/20 | 3/31/19 | 3/31/18 | 3/31/17 |
| Net asset value, beginning of period | $11.45 | $11.59 | $11.48 | $11.59 | $12.01 |
| Income (loss) from investment operations | |||||
| Net investment income (loss) (d) | $0.27 | $0.32 | $0.40 | $0.40 | $0.41(c) |
| Net realized and unrealized gain (loss) | 0.46 | (0.13) | 0.07 | (0.14) | (0.42) |
| Total from investment operations | $0.73 | $0.19 | $0.47 | $0.26 | $(0.01) |
| Less distributions declared to shareholders | |||||
| From net investment income | $(0.27) | $(0.33) | $(0.36) | $(0.37) | $(0.41) |
| Net asset value, end of period (x) | $11.91 | $11.45 | $11.59 | $11.48 | $11.59 |
| Total return (%) (r)(s)(t)(x) | 6.42 | 1.55 | 4.23 | 2.28 | (0.14)(c) |
| Ratios (%) (to average net assets) and Supplemental data: | |||||
| Expenses before expense reductions (f) | 0.84 | 0.85 | 0.86 | 0.87 | 0.87(c) |
| Expenses after expense reductions (f) | 0.83 | 0.83 | 0.85 | 0.86 | 0.86(c) |
| Net investment income (loss) | 2.29 | 2.72 | 3.53 | 3.39 | 3.48(c) |
| Portfolio turnover | 25 | 28 | 19 | 12 | 22 |
| Net assets at end of period (000 omitted) | $359,286 | $326,916 | $295,515 | $283,545 | $263,433 |
| Year ended | |||||
| Class B | 3/31/21 | 3/31/20 | 3/31/19 | 3/31/18 | 3/31/17 |
| Net asset value, beginning of period | $11.44 | $11.57 | $11.46 | $11.58 | $11.99 |
| Income (loss) from investment operations | |||||
| Net investment income (loss) (d) | $0.19 | $0.24 | $0.32 | $0.31 | $0.32(c) |
| Net realized and unrealized gain (loss) | 0.45 | (0.13) | 0.07 | (0.14) | (0.41) |
| Total from investment operations | $0.64 | $0.11 | $0.39 | $0.17 | $(0.09) |
| Less distributions declared to shareholders | |||||
| From net investment income | $(0.18) | $(0.24) | $(0.28) | $(0.29) | $(0.32) |
| Net asset value, end of period (x) | $11.90 | $11.44 | $11.57 | $11.46 | $11.58 |
| Total return (%) (r)(s)(t)(x) | 5.64 | 0.88 | 3.46 | 1.43 | (0.81)(c) |
| Ratios (%) (to average net assets) and Supplemental data: | |||||
| Expenses before expense reductions (f) | 1.59 | 1.61 | 1.62 | 1.62 | 1.62(c) |
| Expenses after expense reductions (f) | 1.58 | 1.59 | 1.61 | 1.62 | 1.61(c) |
| Net investment income (loss) | 1.60 | 2.01 | 2.78 | 2.65 | 2.73(c) |
| Portfolio turnover | 25 | 28 | 19 | 12 | 22 |
| Net assets at end of period (000 omitted) | $416 | $788 | $1,299 | $2,288 | $3,303 |
| Year ended | |||||
| Class C | 3/31/21 | 3/31/20 | 3/31/19 | 3/31/18 | 3/31/17 |
| Net asset value, beginning of period | $11.45 | $11.58 | $11.47 | $11.59 | $12.00 |
| Income (loss) from investment operations | |||||
| Net investment income (loss) (d) | $0.18 | $0.23 | $0.32 | $0.31 | $0.32(c) |
| Net realized and unrealized gain (loss) | 0.46 | (0.12) | 0.07 | (0.14) | (0.41) |
| Total from investment operations | $0.64 | $0.11 | $0.39 | $0.17 | $(0.09) |
| Less distributions declared to shareholders | |||||
| From net investment income | $(0.18) | $(0.24) | $(0.28) | $(0.29) | $(0.32) |
| Net asset value, end of period (x) | $11.91 | $11.45 | $11.58 | $11.47 | $11.59 |
| Total return (%) (r)(s)(t)(x) | 5.63 | 0.88 | 3.45 | 1.42 | (0.81)(c) |
| Ratios (%) (to average net assets) and Supplemental data: | |||||
| Expenses before expense reductions (f) | 1.59 | 1.61 | 1.62 | 1.62 | 1.62(c) |
| Expenses after expense reductions (f) | 1.58 | 1.59 | 1.61 | 1.62 | 1.61(c) |
| Net investment income (loss) | 1.56 | 1.96 | 2.78 | 2.64 | 2.73(c) |
| Portfolio turnover | 25 | 28 | 19 | 12 | 22 |
| Net assets at end of period (000 omitted) | $35,315 | $45,135 | $38,639 | $53,117 | $57,868 |
| Year ended | |||||
| Class I | 3/31/21 | 3/31/20 | 3/31/19 | 3/31/18 | 3/31/17(i) |
| Net asset value, beginning of period | $9.55 | $9.66 | $9.57 | $9.66 | $10.00 |
| Income (loss) from investment operations | |||||
| Net investment income (loss) (d) | $0.25 | $0.29 | $0.36 | $0.35 | $0.37(c) |
| Net realized and unrealized gain (loss) | 0.38 | (0.10) | 0.06 | (0.10) | (0.34) |
| Total from investment operations | $0.63 | $0.19 | $0.42 | $0.25 | $0.03 |
| Less distributions declared to shareholders | |||||
| From net investment income | $(0.25) | $(0.30) | $(0.33) | $(0.34) | $(0.37) |
| Net asset value, end of period (x) | $9.93 | $9.55 | $9.66 | $9.57 | $9.66 |
| Total return (%) (r)(s)(t)(x) | 6.64 | 1.87 | 4.46 | 2.54 | 0.23(c) |
| Ratios (%) (to average net assets) and Supplemental data: | |||||
| Expenses before expense reductions (f) | 0.59 | 0.60 | 0.61 | 0.62 | 0.62(c) |
| Expenses after expense reductions (f) | 0.58 | 0.59 | 0.60 | 0.61 | 0.62(c) |
| Net investment income (loss) | 2.52 | 2.95 | 3.77 | 3.62 | 3.71(c) |
| Portfolio turnover | 25 | 28 | 19 | 12 | 22 |
| Net assets at end of period (000 omitted) | $113,800 | $83,861 | $58,802 | $45,147 | $38,561 |
| Year ended | ||||
| Class R6 | 3/31/21 | 3/31/20 | 3/31/19 | 3/31/18(i) |
| Net asset value, beginning of period | $9.55 | $9.66 | $9.57 | $9.78 |
| Income (loss) from investment operations | ||||
| Net investment income (loss) (d) | $0.25 | $0.30 | $0.37 | $0.23 |
| Net realized and unrealized gain (loss) | 0.38 | (0.11) | 0.05 | (0.22) |
| Total from investment operations | $0.63 | $0.19 | $0.42 | $0.01 |
| Less distributions declared to shareholders | ||||
| From net investment income | $(0.25) | $(0.30) | $(0.33) | $(0.22) |
| Net asset value, end of period (x) | $9.93 | $9.55 | $9.66 | $9.57 |
| Total return (%) (r)(s)(t)(x) | 6.71 | 1.94 | 4.54 | 0.15(n) |
| Ratios (%) (to average net assets) and Supplemental data: | ||||
| Expenses before expense reductions (f) | 0.52 | 0.53 | 0.54 | 0.55(a) |
| Expenses after expense reductions (f) | 0.51 | 0.52 | 0.53 | 0.55(a) |
| Net investment income (loss) | 2.59 | 3.01 | 3.85 | 3.64(a) |
| Portfolio turnover | 25 | 28 | 19 | 12 |
| Net assets at end of period (000 omitted) | $34,703 | $24,040 | $16,161 | $13,198 |
| (a) | Annualized. |
| (c) | Amount reflects a one-time reimbursement of expenses by the custodian (or former custodian) without which net investment income and performance would be lower and expenses would be higher. |
| (d) | Per share data is based on average shares outstanding. |
| (f) | Ratios do not reflect reductions from fees paid indirectly, if applicable. |
| (i) | For Class I and Class R6, the period is from the class inception, April 1, 2016 (Class I) and August 1, 2017 (Class R6), through the stated period end. |
| (n) | Not annualized. |
| (r) | Certain expenses have been reduced without which performance would have been lower. |
| (s) | From time to time the fund may receive proceeds from litigation settlements, without which performance would be lower. |
| (t) | Total returns do not include any applicable sales charges. |
| (x) | The net asset values and total returns have been calculated on net assets which include adjustments made in accordance with U.S. generally accepted accounting principles required at period end for financial reporting purposes. |
| Year ended | |||||
| Class A | 3/31/21 | 3/31/20 | 3/31/19 | 3/31/18 | 3/31/17 |
| Net asset value, beginning of period | $10.24 | $10.26 | $10.15 | $10.19 | $10.50 |
| Income (loss) from investment operations | |||||
| Net investment income (loss) (d) | $0.27 | $0.33 | $0.40 | $0.40 | $0.38 |
| Net realized and unrealized gain (loss) | 0.36 | (0.02) | 0.07 | (0.07) | (0.32) |
| Total from investment operations | $0.63 | $0.31 | $0.47 | $0.33 | $0.06 |
| Less distributions declared to shareholders | |||||
| From net investment income | $(0.27) | $(0.33) | $(0.36) | $(0.37) | $(0.37) |
| Net asset value, end of period (x) | $10.60 | $10.24 | $10.26 | $10.15 | $10.19 |
| Total return (%) (r)(s)(t)(x) | 6.21 | 2.97 | 4.73 | 3.29 | 0.57 |
| Ratios (%) (to average net assets) and Supplemental data: | |||||
| Expenses before expense reductions (f) | 0.92 | 0.94 | 0.96 | 0.97 | 0.96 |
| Expenses after expense reductions (f) | 0.76 | 0.78 | 0.80 | 0.81 | 0.80 |
| Net investment income (loss) | 2.55 | 3.13 | 3.91 | 3.90 | 3.64 |
| Portfolio turnover | 28 | 17 | 16 | 16 | 15 |
| Net assets at end of period (000 omitted) | $137,727 | $117,575 | $105,777 | $99,319 | $98,907 |
| Year ended | |||||
| Class B | 3/31/21 | 3/31/20 | 3/31/19 | 3/31/18 | 3/31/17 |
| Net asset value, beginning of period | $10.27 | $10.29 | $10.18 | $10.21 | $10.52 |
| Income (loss) from investment operations | |||||
| Net investment income (loss) (d) | $0.19 | $0.25 | $0.32 | $0.32 | $0.30 |
| Net realized and unrealized gain (loss) | 0.35 | (0.02) | 0.07 | (0.05) | (0.32) |
| Total from investment operations | $0.54 | $0.23 | $0.39 | $0.27 | $(0.02) |
| Less distributions declared to shareholders | |||||
| From net investment income | $(0.19) | $(0.25) | $(0.28) | $(0.30) | $(0.29) |
| Net asset value, end of period (x) | $10.62 | $10.27 | $10.29 | $10.18 | $10.21 |
| Total return (%) (r)(s)(t)(x) | 5.32 | 2.21 | 3.95 | 2.62 | (0.19) |
| Ratios (%) (to average net assets) and Supplemental data: | |||||
| Expenses before expense reductions (f) | 1.67 | 1.69 | 1.71 | 1.72 | 1.71 |
| Expenses after expense reductions (f) | 1.51 | 1.53 | 1.55 | 1.56 | 1.56 |
| Net investment income (loss) | 1.86 | 2.40 | 3.15 | 3.15 | 2.87 |
| Portfolio turnover | 28 | 17 | 16 | 16 | 15 |
| Net assets at end of period (000 omitted) | $851 | $1,507 | $2,373 | $3,462 | $4,740 |
| Year ended | |||||
| Class I | 3/31/21 | 3/31/20 | 3/31/19 | 3/31/18 | 3/31/17(i) |
| Net asset value, beginning of period | $9.76 | $9.78 | $9.67 | $9.71 | $10.00 |
| Income (loss) from investment operations | |||||
| Net investment income (loss) (d) | $0.26 | $0.32 | $0.38 | $0.39 | $0.36 |
| Net realized and unrealized gain (loss) | 0.34 | (0.02) | 0.08 | (0.07) | (0.29) |
| Total from investment operations | $0.60 | $0.30 | $0.46 | $0.32 | $0.07 |
| Less distributions declared to shareholders | |||||
| From net investment income | $(0.27) | $(0.32) | $(0.35) | $(0.36) | $(0.36) |
| Net asset value, end of period (x) | $10.09 | $9.76 | $9.78 | $9.67 | $9.71 |
| Total return (%) (r)(s)(t)(x) | 6.18 | 3.06 | 4.88 | 3.37 | 0.73 |
| Ratios (%) (to average net assets) and Supplemental data: | |||||
| Expenses before expense reductions (f) | 0.67 | 0.69 | 0.71 | 0.71 | 0.74 |
| Expenses after expense reductions (f) | 0.66 | 0.68 | 0.70 | 0.71 | 0.73 |
| Net investment income (loss) | 2.64 | 3.21 | 4.00 | 3.99 | 3.69 |
| Portfolio turnover | 28 | 17 | 16 | 16 | 15 |
| Net assets at end of period (000 omitted) | $32,103 | $26,064 | $20,253 | $20,579 | $19,388 |
| Year ended | ||||
| Class R6 | 3/31/21 | 3/31/20 | 3/31/19 | 3/31/18(i) |
| Net asset value, beginning of period | $9.76 | $9.78 | $9.67 | $9.84 |
| Income (loss) from investment operations | ||||
| Net investment income (loss) (d) | $0.27 | $0.33 | $0.40 | $0.26 |
| Net realized and unrealized gain (loss) | 0.34 | (0.02) | 0.07 | (0.18) |
| Total from investment operations | $0.61 | $0.31 | $0.47 | $0.08 |
| Less distributions declared to shareholders | ||||
| From net investment income | $(0.27) | $(0.33) | $(0.36) | $(0.25) |
| Net asset value, end of period (x) | $10.10 | $9.76 | $9.78 | $9.67 |
| Total return (%) (r)(s)(t)(x) | 6.35 | 3.13 | 4.94 | 0.78(n) |
| Ratios (%) (to average net assets) and Supplemental data: | ||||
| Expenses before expense reductions (f) | 0.60 | 0.61 | 0.64 | 0.67(a) |
| Expenses after expense reductions (f) | 0.59 | 0.60 | 0.63 | 0.66(a) |
| Net investment income (loss) | 2.71 | 3.28 | 4.13 | 4.02(a) |
| Portfolio turnover | 28 | 17 | 16 | 16 |
| Net assets at end of period (000 omitted) | $15,830 | $13,031 | $10,736 | $1,205 |
| (a) | Annualized. |
| (d) | Per share data is based on average shares outstanding. |
| (f) | Ratios do not reflect reductions from fees paid indirectly, if applicable. |
| (i) | For Class I and Class R6, the period is from the class inception, April 1, 2016 (Class I) and August 1, 2017 (Class R6), through the stated period end. |
| (n) | Not annualized. |
| (r) | Certain expenses have been reduced without which performance would have been lower. |
| (s) | From time to time the fund may receive proceeds from litigation settlements, without which performance would be lower. |
| (t) | Total returns do not include any applicable sales charges. |
| (x) | The net asset values and total returns have been calculated on net assets which include adjustments made in accordance with U.S. generally accepted accounting principles required at period end for financial reporting purposes. |
| Year ended | |||||
| Class A | 3/31/21 | 3/31/20 | 3/31/19 | 3/31/18 | 3/31/17 |
| Net asset value, beginning of period | $11.94 | $11.97 | $11.83 | $11.91 | $12.35 |
| Income (loss) from investment operations | |||||
| Net investment income (loss) (d) | $0.25 | $0.33 | $0.41 | $0.38 | $0.39(c) |
| Net realized and unrealized gain (loss) | 0.36 | (0.04) | 0.10 | (0.09) | (0.46) |
| Total from investment operations | $0.61 | $0.29 | $0.51 | $0.29 | $(0.07) |
| Less distributions declared to shareholders | |||||
| From net investment income | $(0.25) | $(0.32) | $(0.37) | $(0.37) | $(0.37) |
| Net asset value, end of period (x) | $12.30 | $11.94 | $11.97 | $11.83 | $11.91 |
| Total return (%) (r)(s)(t)(x) | 5.18 | 2.44 | 4.39 | 2.41 | (0.56)(c) |
| Ratios (%) (to average net assets) and Supplemental data: | |||||
| Expenses before expense reductions (f) | 0.87 | 0.88 | 0.90 | 0.91 | 0.90(c) |
| Expenses after expense reductions (f) | 0.84 | 0.84 | 0.84 | 0.84 | 0.83(c) |
| Net investment income (loss) | 2.08 | 2.68 | 3.49 | 3.20 | 3.19(c) |
| Portfolio turnover | 23 | 22 | 14 | 15 | 19 |
| Net assets at end of period (000 omitted) | $222,730 | $192,059 | $156,427 | $159,257 | $169,953 |
| Year ended | |||||
| Class B | 3/31/21 | 3/31/20 | 3/31/19 | 3/31/18 | 3/31/17 |
| Net asset value, beginning of period | $11.93 | $11.97 | $11.82 | $11.90 | $12.34 |
| Income (loss) from investment operations | |||||
| Net investment income (loss) (d) | $0.18 | $0.24 | $0.32 | $0.29 | $0.30(c) |
| Net realized and unrealized gain (loss) | 0.35 | (0.05) | 0.11 | (0.09) | (0.46) |
| Total from investment operations | $0.53 | $0.19 | $0.43 | $0.20 | $(0.16) |
| Less distributions declared to shareholders | |||||
| From net investment income | $(0.16) | $(0.23) | $(0.28) | $(0.28) | $(0.28) |
| Net asset value, end of period (x) | $12.30 | $11.93 | $11.97 | $11.82 | $11.90 |
| Total return (%) (r)(s)(t)(x) | 4.50 | 1.59 | 3.70 | 1.64 | (1.31)(c) |
| Ratios (%) (to average net assets) and Supplemental data: | |||||
| Expenses before expense reductions (f) | 1.62 | 1.64 | 1.65 | 1.66 | 1.65(c) |
| Expenses after expense reductions (f) | 1.59 | 1.59 | 1.59 | 1.59 | 1.59(c) |
| Net investment income (loss) | 1.48 | 1.96 | 2.74 | 2.46 | 2.44(c) |
| Portfolio turnover | 23 | 22 | 14 | 15 | 19 |
| Net assets at end of period (000 omitted) | $280 | $1,200 | $1,955 | $2,718 | $3,777 |
| Year ended | |||||
| Class I | 3/31/21 | 3/31/20 | 3/31/19 | 3/31/18 | 3/31/17(i) |
| Net asset value, beginning of period | $9.67 | $9.70 | $9.58 | $9.65 | $10.00 |
| Income (loss) from investment operations | |||||
| Net investment income (loss) (d) | $0.23 | $0.29 | $0.36 | $0.33 | $0.34(c) |
| Net realized and unrealized gain (loss) | 0.30 | (0.03) | 0.08 | (0.08) | (0.36) |
| Total from investment operations | $0.53 | $0.26 | $0.44 | $0.25 | $(0.02) |
| Less distributions declared to shareholders | |||||
| From net investment income | $(0.23) | $(0.29) | $(0.32) | $(0.32) | $(0.33) |
| Net asset value, end of period (x) | $9.97 | $9.67 | $9.70 | $9.58 | $9.65 |
| Total return (%) (r)(s)(t)(x) | 5.53 | 2.63 | 4.71 | 2.60 | (0.21)(c) |
| Ratios (%) (to average net assets) and Supplemental data: | |||||
| Expenses before expense reductions (f) | 0.62 | 0.63 | 0.65 | 0.66 | 0.65(c) |
| Expenses after expense reductions (f) | 0.59 | 0.59 | 0.59 | 0.59 | 0.59(c) |
| Net investment income (loss) | 2.31 | 2.92 | 3.74 | 3.44 | 3.45(c) |
| Portfolio turnover | 23 | 22 | 14 | 15 | 19 |
| Net assets at end of period (000 omitted) | $53,171 | $35,189 | $28,182 | $21,954 | $12,140 |
| Year ended | ||||
| Class R6 | 3/31/21 | 3/31/20 | 3/31/19 | 3/31/18(i) |
| Net asset value, beginning of period | $9.67 | $9.70 | $9.58 | $9.79 |
| Income (loss) from investment operations | ||||
| Net investment income (loss) (d) | $0.23 | $0.29 | $0.36 | $0.23 |
| Net realized and unrealized gain (loss) | 0.31 | (0.03) | 0.09 | (0.22) |
| Total from investment operations | $0.54 | $0.26 | $0.45 | $0.01 |
| Less distributions declared to shareholders | ||||
| From net investment income | $(0.24) | $(0.29) | $(0.33) | $(0.22) |
| Net asset value, end of period (x) | $9.97 | $9.67 | $9.70 | $9.58 |
| Total return (%) (r)(s)(t)(x) | 5.59 | 2.68 | 4.77 | 0.08(n) |
| Ratios (%) (to average net assets) and Supplemental data: | ||||
| Expenses before expense reductions (f) | 0.55 | 0.57 | 0.58 | 0.60(a) |
| Expenses after expense reductions (f) | 0.53 | 0.53 | 0.52 | 0.52(a) |
| Net investment income (loss) | 2.36 | 2.95 | 3.81 | 3.53(a) |
| Portfolio turnover | 23 | 22 | 14 | 15 |
| Net assets at end of period (000 omitted) | $14,608 | $8,892 | $4,341 | $2,605 |
| (a) | Annualized. |
| (c) | Amount reflects a one-time reimbursement of expenses by the custodian (or former custodian) without which net investment income and performance would be lower and expenses would be higher. |
| (d) | Per share data is based on average shares outstanding. |
| (f) | Ratios do not reflect reductions from fees paid indirectly, if applicable. |
| (i) | For Class I and Class R6, the period is from the class inception, April 1, 2016 (Class I) and August 1, 2017 (Class R6), through the stated period end. |
| (n) | Not annualized. |
| (r) | Certain expenses have been reduced without which performance would have been lower. |
| (s) | From time to time the fund may receive proceeds from litigation settlements, without which performance would be lower. |
| (t) | Total returns do not include any applicable sales charges. |
| (x) | The net asset values and total returns have been calculated on net assets which include adjustments made in accordance with U.S. generally accepted accounting principles required at period end for financial reporting purposes. |
| Year ended | |||||
| Class A | 3/31/21 | 3/31/20 | 3/31/19 | 3/31/18 | 3/31/17 |
| Net asset value, beginning of period | $10.17 | $10.36 | $10.23 | $10.36 | $10.70 |
| Income (loss) from investment operations | |||||
| Net investment income (loss) (d) | $0.25 | $0.31 | $0.36 | $0.35 | $0.36(c) |
| Net realized and unrealized gain (loss) | 0.39 | (0.19) | 0.09 | (0.15) | (0.36) |
| Total from investment operations | $0.64 | $0.12 | $0.45 | $0.20 | $0.00(w) |
| Less distributions declared to shareholders | |||||
| From net investment income | $(0.25) | $(0.31) | $(0.32) | $(0.33) | $(0.34) |
| Net asset value, end of period (x) | $10.56 | $10.17 | $10.36 | $10.23 | $10.36 |
| Total return (%) (r)(s)(t)(x) | 6.38 | 1.13 | 4.52 | 1.92 | (0.01)(c) |
| Ratios (%) (to average net assets) and Supplemental data: | |||||
| Expenses before expense reductions (f) | 0.98 | 0.98 | 0.98 | 0.98 | 0.96(c) |
| Expenses after expense reductions (f) | 0.86 | 0.87 | 0.88 | 0.88 | 0.87(c) |
| Net investment income (loss) | 2.44 | 3.00 | 3.50 | 3.32 | 3.42(c) |
| Portfolio turnover | 23 | 34 | 13 | 18 | 11 |
| Net assets at end of period (000 omitted) | $70,628 | $71,672 | $70,930 | $84,131 | $90,616 |
| Year ended | |||||
| Class B | 3/31/21 | 3/31/20 | 3/31/19 | 3/31/18 | 3/31/17 |
| Net asset value, beginning of period | $10.17 | $10.35 | $10.22 | $10.35 | $10.69 |
| Income (loss) from investment operations | |||||
| Net investment income (loss) (d) | $0.18 | $0.24 | $0.28 | $0.27 | $0.28(c) |
| Net realized and unrealized gain (loss) | 0.37 | (0.18) | 0.10 | (0.15) | (0.36) |
| Total from investment operations | $0.55 | $0.06 | $0.38 | $0.12 | $(0.08) |
| Less distributions declared to shareholders | |||||
| From net investment income | $(0.17) | $(0.24) | $(0.25) | $(0.25) | $(0.26) |
| Net asset value, end of period (x) | $10.55 | $10.17 | $10.35 | $10.22 | $10.35 |
| Total return (%) (r)(s)(t)(x) | 5.49 | 0.48 | 3.75 | 1.16 | (0.76)(c) |
| Ratios (%) (to average net assets) and Supplemental data: | |||||
| Expenses before expense reductions (f) | 1.73 | 1.73 | 1.73 | 1.73 | 1.71(c) |
| Expenses after expense reductions (f) | 1.61 | 1.62 | 1.63 | 1.63 | 1.62(c) |
| Net investment income (loss) | 1.71 | 2.32 | 2.73 | 2.57 | 2.67(c) |
| Portfolio turnover | 23 | 34 | 13 | 18 | 11 |
| Net assets at end of period (000 omitted) | $178 | $228 | $677 | $1,230 | $1,418 |
| Year ended | |||||
| Class I | 3/31/21 | 3/31/20 | 3/31/19 | 3/31/18 | 3/31/17(i) |
| Net asset value, beginning of period | $9.51 | $9.68 | $9.56 | $9.68 | $10.00 |
| Income (loss) from investment operations | |||||
| Net investment income (loss) (d) | $0.26 | $0.32 | $0.36 | $0.35 | $0.36(c) |
| Net realized and unrealized gain (loss) | 0.36 | (0.17) | 0.08 | (0.14) | (0.34) |
| Total from investment operations | $0.62 | $0.15 | $0.44 | $0.21 | $0.02 |
| Less distributions declared to shareholders | |||||
| From net investment income | $(0.26) | $(0.32) | $(0.32) | $(0.33) | $(0.34) |
| Net asset value, end of period (x) | $9.87 | $9.51 | $9.68 | $9.56 | $9.68 |
| Total return (%) (r)(s)(t)(x) | 6.59 | 1.46 | 4.75 | 2.18 | 0.19(c) |
| Ratios (%) (to average net assets) and Supplemental data: | |||||
| Expenses before expense reductions (f) | 0.73 | 0.73 | 0.73 | 0.73 | 0.74(c) |
| Expenses after expense reductions (f) | 0.61 | 0.62 | 0.63 | 0.63 | 0.62(c) |
| Net investment income (loss) | 2.68 | 3.25 | 3.77 | 3.56 | 3.68(c) |
| Portfolio turnover | 23 | 34 | 13 | 18 | 11 |
| Net assets at end of period (000 omitted) | $25,437 | $23,156 | $23,310 | $17,243 | $18,416 |
| Year ended | ||||
| Class R6 | 3/31/21 | 3/31/20 | 3/31/19 | 3/31/18(i) |
| Net asset value, beginning of period | $9.50 | $9.67 | $9.55 | $9.79 |
| Income (loss) from investment operations | ||||
| Net investment income (loss) (d) | $0.27 | $0.32 | $0.36 | $0.23 |
| Net realized and unrealized gain (loss) | 0.36 | (0.17) | 0.09 | (0.25) |
| Total from investment operations | $0.63 | $0.15 | $0.45 | $(0.02) |
| Less distributions declared to shareholders | ||||
| From net investment income | $(0.27) | $(0.32) | $(0.33) | $(0.22) |
| Net asset value, end of period (x) | $9.86 | $9.50 | $9.67 | $9.55 |
| Total return (%) (r)(s)(t)(x) | 6.67 | 1.54 | 4.84 | (0.19)(n) |
| Ratios (%) (to average net assets) and Supplemental data: | ||||
| Expenses before expense reductions (f) | 0.66 | 0.65 | 0.65 | 0.69(a) |
| Expenses after expense reductions (f) | 0.54 | 0.54 | 0.55 | 0.55(a) |
| Net investment income (loss) | 2.75 | 3.30 | 3.83 | 3.65(a) |
| Portfolio turnover | 23 | 34 | 13 | 18 |
| Net assets at end of period (000 omitted) | $4,033 | $3,777 | $3,081 | $3,024 |
| (a) | Annualized. |
| (c) | Amount reflects a one-time reimbursement of expenses by the custodian (or former custodian) without which net investment income and performance would be lower and expenses would be higher. |
| (d) | Per share data is based on average shares outstanding. |
| (f) | Ratios do not reflect reductions from fees paid indirectly, if applicable. |
| (i) | For Class I and Class R6, the period is from the class inception, April 1, 2016 (Class I) and August 1, 2017 (Class R6), through the stated period end. |
| (n) | Not annualized. |
| (r) | Certain expenses have been reduced without which performance would have been lower. |
| (s) | From time to time the fund may receive proceeds from litigation settlements, without which performance would be lower. |
| (t) | Total returns do not include any applicable sales charges. |
| (w) | Per share amount was less than $0.01. |
| (x) | The net asset values and total returns have been calculated on net assets which include adjustments made in accordance with U.S. generally accepted accounting principles required at period end for financial reporting purposes. |
| Year ended | |||||
| Class A | 3/31/21 | 3/31/20 | 3/31/19 | 3/31/18 | 3/31/17 |
| Net asset value, beginning of period | $11.07 | $11.14 | $10.98 | $11.10 | $11.51 |
| Income (loss) from investment operations | |||||
| Net investment income (loss) (d) | $0.29 | $0.33 | $0.37 | $0.38 | $0.41(c) |
| Net realized and unrealized gain (loss) | 0.36 | (0.08) | 0.13 | (0.14) | (0.42) |
| Total from investment operations | $0.65 | $0.25 | $0.50 | $0.24 | $(0.01) |
| Less distributions declared to shareholders | |||||
| From net investment income | $(0.30) | $(0.32) | $(0.34) | $(0.36) | $(0.40) |
| Net asset value, end of period (x) | $11.42 | $11.07 | $11.14 | $10.98 | $11.10 |
| Total return (%) (r)(s)(t)(x) | 5.94 | 2.22 | 4.67 | 2.13 | (0.11)(c) |
| Ratios (%) (to average net assets) and Supplemental data: | |||||
| Expenses before expense reductions (f) | 0.88 | 0.91 | 0.92 | 0.92 | 0.91(c) |
| Expenses after expense reductions (f) | 0.82 | 0.84 | 0.84 | 0.83 | 0.83(c) |
| Net investment income (loss) | 2.57 | 2.88 | 3.37 | 3.36 | 3.60(c) |
| Portfolio turnover | 21 | 24 | 15 | 15 | 13 |
| Net assets at end of period (000 omitted) | $251,971 | $235,639 | $226,366 | $221,291 | $228,297 |
| Supplemental Ratios (%): | |||||
| Ratios of expenses to average net assets after expense reductions and excluding interest expense and fees (f)(l) | 0.81 | 0.81 | 0.81 | 0.81 | 0.81(c) |
| Year ended | |||||
| Class B | 3/31/21 | 3/31/20 | 3/31/19 | 3/31/18 | 3/31/17 |
| Net asset value, beginning of period | $11.06 | $11.13 | $10.98 | $11.10 | $11.50 |
| Income (loss) from investment operations | |||||
| Net investment income (loss) (d) | $0.21 | $0.24 | $0.29 | $0.29 | $0.32(c) |
| Net realized and unrealized gain (loss) | 0.36 | (0.07) | 0.12 | (0.14) | (0.41) |
| Total from investment operations | $0.57 | $0.17 | $0.41 | $0.15 | $(0.09) |
| Less distributions declared to shareholders | |||||
| From net investment income | $(0.22) | $(0.24) | $(0.26) | $(0.27) | $(0.31) |
| Net asset value, end of period (x) | $11.41 | $11.06 | $11.13 | $10.98 | $11.10 |
| Total return (%) (r)(s)(t)(x) | 5.16 | 1.46 | 3.80 | 1.37 | (0.77)(c) |
| Ratios (%) (to average net assets) and Supplemental data: | |||||
| Expenses before expense reductions (f) | 1.63 | 1.66 | 1.67 | 1.67 | 1.66(c) |
| Expenses after expense reductions (f) | 1.57 | 1.59 | 1.60 | 1.59 | 1.58(c) |
| Net investment income (loss) | 1.82 | 2.14 | 2.62 | 2.61 | 2.82(c) |
| Portfolio turnover | 21 | 24 | 15 | 15 | 13 |
| Net assets at end of period (000 omitted) | $436 | $581 | $755 | $914 | $1,118 |
| Supplemental Ratios (%): | |||||
| Ratios of expenses to average net assets after expense reductions and excluding interest expense and fees (f)(l) | 1.56 | 1.56 | 1.56 | 1.56 | 1.56(c) |
| Year ended | |||||
| Class C | 3/31/21 | 3/31/20 | 3/31/19 | 3/31/18 | 3/31/17 |
| Net asset value, beginning of period | $11.06 | $11.14 | $10.98 | $11.10 | $11.51 |
| Income (loss) from investment operations | |||||
| Net investment income (loss) (d) | $0.21 | $0.24 | $0.29 | $0.29 | $0.32(c) |
| Net realized and unrealized gain (loss) | 0.37 | (0.08) | 0.13 | (0.14) | (0.42) |
| Total from investment operations | $0.58 | $0.16 | $0.42 | $0.15 | $(0.10) |
| Less distributions declared to shareholders | |||||
| From net investment income | $(0.22) | $(0.24) | $(0.26) | $(0.27) | $(0.31) |
| Net asset value, end of period (x) | $11.42 | $11.06 | $11.14 | $10.98 | $11.10 |
| Total return (%) (r)(s)(t)(x) | 5.25 | 1.36 | 3.89 | 1.36 | (0.86)(c) |
| Ratios (%) (to average net assets) and Supplemental data: | |||||
| Expenses before expense reductions (f) | 1.63 | 1.66 | 1.67 | 1.67 | 1.66(c) |
| Expenses after expense reductions (f) | 1.57 | 1.59 | 1.60 | 1.59 | 1.58(c) |
| Net investment income (loss) | 1.82 | 2.13 | 2.62 | 2.61 | 2.85(c) |
| Portfolio turnover | 21 | 24 | 15 | 15 | 13 |
| Net assets at end of period (000 omitted) | $14,348 | $16,736 | $17,665 | $24,116 | $26,034 |
| Supplemental Ratios (%): | |||||
| Ratios of expenses to average net assets after expense reductions and excluding interest expense and fees (f)(l) | 1.56 | 1.56 | 1.56 | 1.56 | 1.56(c) |
| Year ended | |||||
| Class I | 3/31/21 | 3/31/20 | 3/31/19 | 3/31/18 | 3/31/17(i) |
| Net asset value, beginning of period | $9.62 | $9.68 | $9.55 | $9.65 | $10.00 |
| Income (loss) from investment operations | |||||
| Net investment income (loss) (d) | $0.28 | $0.31 | $0.34 | $0.35 | $0.38(c) |
| Net realized and unrealized gain (loss) | 0.32 | (0.07) | 0.11 | (0.12) | (0.36) |
| Total from investment operations | $0.60 | $0.24 | $0.45 | $0.23 | $0.02 |
| Less distributions declared to shareholders | |||||
| From net investment income | $(0.29) | $(0.30) | $(0.32) | $(0.33) | $(0.37) |
| Net asset value, end of period (x) | $9.93 | $9.62 | $9.68 | $9.55 | $9.65 |
| Total return (%) (r)(s)(t)(x) | 6.26 | 2.47 | 4.82 | 2.42 | 0.21(c) |
| Ratios (%) (to average net assets) and Supplemental data: | |||||
| Expenses before expense reductions (f) | 0.63 | 0.66 | 0.67 | 0.67 | 0.67(c) |
| Expenses after expense reductions (f) | 0.57 | 0.59 | 0.60 | 0.59 | 0.58(c) |
| Net investment income (loss) | 2.80 | 3.12 | 3.61 | 3.60 | 3.83(c) |
| Portfolio turnover | 21 | 24 | 15 | 15 | 13 |
| Net assets at end of period (000 omitted) | $94,495 | $71,807 | $57,139 | $43,832 | $39,856 |
| Supplemental Ratios (%): | |||||
| Ratios of expenses to average net assets after expense reductions and excluding interest expense and fees (f)(l) | 0.56 | 0.56 | 0.56 | 0.56 | 0.56(c) |
| Year ended | ||||
| Class R6 | 3/31/21 | 3/31/20 | 3/31/19 | 3/31/18(i) |
| Net asset value, beginning of period | $9.63 | $9.69 | $9.55 | $9.77 |
| Income (loss) from investment operations | ||||
| Net investment income (loss) (d) | $0.28 | $0.31 | $0.35 | $0.23 |
| Net realized and unrealized gain (loss) | 0.31 | (0.06) | 0.12 | (0.22) |
| Total from investment operations | $0.59 | $0.25 | $0.47 | $0.01 |
| Less distributions declared to shareholders | ||||
| From net investment income | $(0.29) | $(0.31) | $(0.33) | $(0.23) |
| Net asset value, end of period (x) | $9.93 | $9.63 | $9.69 | $9.55 |
| Total return (%) (r)(s)(t)(x) | 6.23 | 2.55 | 5.01 | 0.05(n) |
| Ratios (%) (to average net assets) and Supplemental data: | ||||
| Expenses before expense reductions (f) | 0.55 | 0.58 | 0.59 | 0.60(a) |
| Expenses after expense reductions (f) | 0.50 | 0.51 | 0.51 | 0.51(a) |
| Net investment income (loss) | 2.87 | 3.20 | 3.69 | 3.61(a) |
| Portfolio turnover | 21 | 24 | 15 | 15 |
| Net assets at end of period (000 omitted) | $22,118 | $14,286 | $10,153 | $6,196 |
| Supplemental Ratios (%): | ||||
| Ratios of expenses to average net assets after expense reductions and excluding interest expense and fees (f)(l) | 0.48 | 0.48 | 0.48 | 0.48(a) |
| (a) | Annualized. |
| (c) | Amount reflects a one-time reimbursement of expenses by the custodian (or former custodian) without which net investment income and performance would be lower and expenses would be higher. |
| (d) | Per share data is based on average shares outstanding. |
| (f) | Ratios do not reflect reductions from fees paid indirectly, if applicable. |
| (i) | For Class I and Class R6, the period is from the class inception, April 1, 2016 (Class I) and August 1, 2017 (Class R6), through the stated period end. |
| (l) | Interest expense and fees include payments made to the holders of the floating rate certificates. |
| (n) | Not annualized. |
| (r) | Certain expenses have been reduced without which performance would have been lower. |
| (s) | From time to time the fund may receive proceeds from litigation settlements, without which performance would be lower. |
| (t) | Total returns do not include any applicable sales charges. |
| (x) | The net asset values and total returns have been calculated on net assets which include adjustments made in accordance with U.S. generally accepted accounting principles required at period end for financial reporting purposes. |
| Year ended | |||||
| Class A | 3/31/21 | 3/31/20 | 3/31/19 | 3/31/18 | 3/31/17 |
| Net asset value, beginning of period | $10.95 | $10.98 | $10.89 | $11.01 | $11.37 |
| Income (loss) from investment operations | |||||
| Net investment income (loss) (d) | $0.28 | $0.33 | $0.38 | $0.37 | $0.38(c) |
| Net realized and unrealized gain (loss) | 0.24 | (0.03) | 0.06 | (0.13) | (0.38) |
| Total from investment operations | $0.52 | $0.30 | $0.44 | $0.24 | $0.00(w) |
| Less distributions declared to shareholders | |||||
| From net investment income | $(0.28) | $(0.33) | $(0.35) | $(0.36) | $(0.36) |
| Net asset value, end of period (x) | $11.19 | $10.95 | $10.98 | $10.89 | $11.01 |
| Total return (%) (r)(s)(t)(x) | 4.81 | 2.75 | 4.09 | 2.15 | 0.02(c) |
| Ratios (%) (to average net assets) and Supplemental data: | |||||
| Expenses before expense reductions (f) | 0.97 | 0.98 | 0.98 | 0.97 | 0.95(c) |
| Expenses after expense reductions (f) | 0.87 | 0.86 | 0.86 | 0.86 | 0.86(c) |
| Net investment income (loss) | 2.51 | 3.00 | 3.53 | 3.34 | 3.38(c) |
| Portfolio turnover | 23 | 19 | 17 | 11 | 18 |
| Net assets at end of period (000 omitted) | $99,380 | $98,950 | $98,510 | $101,013 | $111,179 |
| Year ended | |||||
| Class B | 3/31/21 | 3/31/20 | 3/31/19 | 3/31/18 | 3/31/17 |
| Net asset value, beginning of period | $10.95 | $10.98 | $10.88 | $11.00 | $11.37 |
| Income (loss) from investment operations | |||||
| Net investment income (loss) (d) | $0.20 | $0.25 | $0.30 | $0.29 | $0.30(c) |
| Net realized and unrealized gain (loss) | 0.23 | (0.03) | 0.06 | (0.14) | (0.39) |
| Total from investment operations | $0.43 | $0.22 | $0.36 | $0.15 | $(0.09) |
| Less distributions declared to shareholders | |||||
| From net investment income | $(0.20) | $(0.25) | $(0.26) | $(0.27) | $(0.28) |
| Net asset value, end of period (x) | $11.18 | $10.95 | $10.98 | $10.88 | $11.00 |
| Total return (%) (r)(s)(t)(x) | 3.93 | 1.98 | 3.40 | 1.38 | (0.81)(c) |
| Ratios (%) (to average net assets) and Supplemental data: | |||||
| Expenses before expense reductions (f) | 1.72 | 1.73 | 1.73 | 1.72 | 1.70(c) |
| Expenses after expense reductions (f) | 1.62 | 1.62 | 1.62 | 1.62 | 1.62(c) |
| Net investment income (loss) | 1.78 | 2.28 | 2.77 | 2.58 | 2.63(c) |
| Portfolio turnover | 23 | 19 | 17 | 11 | 18 |
| Net assets at end of period (000 omitted) | $109 | $155 | $494 | $613 | $866 |
| Year ended | |||||
| Class I | 3/31/21 | 3/31/20 | 3/31/19 | 3/31/18 | 3/31/17(i) |
| Net asset value, beginning of period | $9.64 | $9.67 | $9.58 | $9.69 | $10.00 |
| Income (loss) from investment operations | |||||
| Net investment income (loss) (d) | $0.27 | $0.32 | $0.36 | $0.35 | $0.35(c) |
| Net realized and unrealized gain (loss) | 0.20 | (0.03) | 0.06 | (0.12) | (0.31) |
| Total from investment operations | $0.47 | $0.29 | $0.42 | $0.23 | $0.04 |
| Less distributions declared to shareholders | |||||
| From net investment income | $(0.27) | $(0.32) | $(0.33) | $(0.34) | $(0.35) |
| Net asset value, end of period (x) | $9.84 | $9.64 | $9.67 | $9.58 | $9.69 |
| Total return (%) (r)(s)(t)(x) | 4.94 | 2.95 | 4.44 | 2.33 | 0.37(c) |
| Ratios (%) (to average net assets) and Supplemental data: | |||||
| Expenses before expense reductions (f) | 0.72 | 0.73 | 0.73 | 0.72 | 0.72(c) |
| Expenses after expense reductions (f) | 0.62 | 0.62 | 0.62 | 0.62 | 0.61(c) |
| Net investment income (loss) | 2.73 | 3.23 | 3.75 | 3.58 | 3.63(c) |
| Portfolio turnover | 23 | 19 | 17 | 11 | 18 |
| Net assets at end of period (000 omitted) | $14,052 | $7,545 | $6,248 | $7,038 | $4,820 |
| Year ended | ||||
| Class R6 | 3/31/21 | 3/31/20 | 3/31/19 | 3/31/18(i) |
| Net asset value, beginning of period | $9.63 | $9.66 | $9.58 | $9.79 |
| Income (loss) from investment operations | ||||
| Net investment income (loss) (d) | $0.28 | $0.32 | $0.37 | $0.24 |
| Net realized and unrealized gain (loss) | 0.21 | (0.03) | 0.04 | (0.22) |
| Total from investment operations | $0.49 | $0.29 | $0.41 | $0.02 |
| Less distributions declared to shareholders | ||||
| From net investment income | $(0.28) | $(0.32) | $(0.33) | $(0.23) |
| Net asset value, end of period (x) | $9.84 | $9.63 | $9.66 | $9.58 |
| Total return (%) (r)(s)(t)(x) | 5.13 | 3.02 | 4.42 | 0.18(n) |
| Ratios (%) (to average net assets) and Supplemental data: | ||||
| Expenses before expense reductions (f) | 0.64 | 0.64 | 0.64 | 0.65(a) |
| Expenses after expense reductions (f) | 0.54 | 0.54 | 0.53 | 0.54(a) |
| Net investment income (loss) | 2.83 | 3.27 | 3.87 | 3.67(a) |
| Portfolio turnover | 23 | 19 | 17 | 11 |
| Net assets at end of period (000 omitted) | $824 | $715 | $246 | $130 |
| (a) | Annualized. |
| (c) | Amount reflects a one-time reimbursement of expenses by the custodian (or former custodian) without which net investment income and performance would be lower and expenses would be higher. |
| (d) | Per share data is based on average shares outstanding. |
| (f) | Ratios do not reflect reductions from fees paid indirectly, if applicable. |
| (i) | For Class I and Class R6, the period is from the class inception, April 1, 2016 (Class I) and August 1, 2017 (Class R6), through the stated period end. |
| (n) | Not annualized. |
| (r) | Certain expenses have been reduced without which performance would have been lower. |
| (s) | From time to time the fund may receive proceeds from litigation settlements, without which performance would be lower. |
| (t) | Total returns do not include any applicable sales charges. |
| (w) | Per share amount was less than $0.01. |
| (x) | The net asset values and total returns have been calculated on net assets which include adjustments made in accordance with U.S. generally accepted accounting principles required at period end for financial reporting purposes. |
| Level 1 | Level 2 | Level 3 | Total | |
| Mississippi Fund | ||||
| Financial Instruments | ||||
| Municipal Bonds | $— | $108,474,205 | $— | $108,474,205 |
| U.S. Corporate Bonds | — | 226,044 | — | 226,044 |
| Mutual Funds | 38,650 | — | — | 38,650 |
| Total | $38,650 | $108,700,249 | $— | $108,738,899 |
| New York Fund | ||||
| Financial Instruments | ||||
| Municipal Bonds | $— | $280,892,328 | $— | $280,892,328 |
| U.S. Corporate Bonds | — | 647,227 | — | 647,227 |
| Mutual Funds | 2,328,184 | — | — | 2,328,184 |
| Total | $2,328,184 | $281,539,555 | $— | $283,867,739 |
| North Carolina Fund | ||||
| Financial Instruments | ||||
| Municipal Bonds | $— | $545,402,069 | $— | $545,402,069 |
| U.S. Corporate Bonds | — | 1,170,588 | — | 1,170,588 |
| Mutual Funds | 8,059,699 | — | — | 8,059,699 |
| Total | $8,059,699 | $546,572,657 | $— | $554,632,356 |
| Pennsylvania Fund | ||||
| Financial Instruments | ||||
| Municipal Bonds | $— | $182,039,617 | $— | $182,039,617 |
| U.S. Corporate Bonds | — | 378,196 | — | 378,196 |
| Mutual Funds | 3,316,601 | — | — | 3,316,601 |
| Total | $3,316,601 | $182,417,813 | $— | $185,734,414 |
| Level 1 | Level 2 | Level 3 | Total | |
| South Carolina Fund | ||||
| Financial Instruments | ||||
| Municipal Bonds | $— | $281,911,757 | $— | $281,911,757 |
| U.S. Corporate Bonds | — | 594,633 | — | 594,633 |
| Mutual Funds | 3,938,050 | — | — | 3,938,050 |
| Total | $3,938,050 | $282,506,390 | $— | $286,444,440 |
| Tennessee Fund | ||||
| Financial Instruments | ||||
| Municipal Bonds | $— | $100,040,143 | $— | $100,040,143 |
| U.S. Corporate Bonds | — | 244,045 | — | 244,045 |
| Mutual Funds | 621,190 | — | — | 621,190 |
| Total | $621,190 | $100,284,188 | $— | $100,905,378 |
| Virginia Fund | ||||
| Financial Instruments | ||||
| Municipal Bonds | $— | $379,135,660 | $— | $379,135,660 |
| U.S. Corporate Bonds | — | 828,198 | — | 828,198 |
| Mutual Funds | 4,569,228 | — | — | 4,569,228 |
| Total | $4,569,228 | $379,963,858 | $— | $384,533,086 |
| West Virginia Fund | ||||
| Financial Instruments | ||||
| Municipal Bonds | $— | $111,844,343 | $— | $111,844,343 |
| U.S. Corporate Bonds | — | 259,764 | — | 259,764 |
| Mutual Funds | 588,118 | — | — | 588,118 |
| Total | $588,118 | $112,104,107 | $— | $112,692,225 |
| Other Financial Instruments | ||||
| Futures Contracts – Liabilities | $(79,267) | $— | $— | $(79,267) |
| Fair Value (a) | ||||
| Fund | Risk | Derivative Contracts | Liability Derivatives | |
| West Virginia Fund | Interest Rate | Interest Rate Futures | $(79,267) |
| Fund | Risk | Futures Contracts |
| Mississippi Fund | Interest Rate | $(32,940) |
| New York Fund | Interest Rate | (154,172) |
| North Carolina Fund | Interest Rate | (15,481) |
| Pennsylvania Fund | Interest Rate | (167,610) |
| South Carolina Fund | Interest Rate | 16,798 |
| Tennessee Fund | Interest Rate | (45,554) |
| Virginia Fund | Interest Rate | (364,098) |
| West Virginia Fund | Interest Rate | (24,523) |
| Fund | Risk | Futures Contracts |
| Mississippi Fund | Interest Rate | $132,385 |
| New York Fund | Interest Rate | 180,524 |
| North Carolina Fund | Interest Rate | 962,795 |
| Pennsylvania Fund | Interest Rate | 180,524 |
| Tennessee Fund | Interest Rate | 120,349 |
| Virginia Fund | Interest Rate | 722,096 |
| West Virginia Fund | Interest Rate | (251,558) |
| Year ended 3/31/21 | Mississippi Fund | New York Fund | North Carolina Fund | Pennsylvania Fund | South Carolina Fund | Tennessee Fund | Virginia Fund | West Virginia Fund |
| Ordinary income (including any short-term capital gains) | $26,771 | $85,904 | $364,526 | $54,673 | $67,319 | $27,295 | $302,307 | $28,504 |
| Tax-exempt income | 2,396,168 | 7,069,001 | 11,330,319 | 4,402,212 | 5,511,812 | 2,496,876 | 9,433,816 | 2,797,117 |
| Total distributions | $2,422,939 | $7,154,905 | $11,694,845 | $4,456,885 | $5,579,131 | $2,524,171 | $9,736,123 | $2,825,621 |
| Year ended 3/31/20 | Mississippi Fund | New York Fund | North Carolina Fund | Pennsylvania Fund | South Carolina Fund | Tennessee Fund | Virginia Fund | West Virginia Fund |
| Ordinary income (including any short-term capital gains) | $8,988 | $135,659 | $208,491 | $80,724 | $48,199 | $27,122 | $190,368 | $12,404 |
| Tax-exempt income | 2,728,570 | 7,293,171 | 12,351,993 | 4,748,912 | 5,813,121 | 3,012,776 | 9,276,121 | 3,254,631 |
| Total distributions | $2,737,558 | $7,428,830 | $12,560,484 | $4,829,636 | $5,861,320 | $3,039,898 | $9,466,489 | $3,267,035 |
| As of 3/31/21 | Mississippi Fund | New York Fund | North Carolina Fund | Pennsylvania Fund |
| Cost of investments | $102,481,179 | $266,704,152 | $526,979,126 | $175,424,009 |
| Gross appreciation | 6,377,924 | 17,714,990 | 28,777,731 | 10,556,644 |
| Gross depreciation | (120,204) | (551,403) | (1,124,501) | (246,239) |
| Net unrealized appreciation (depreciation) | $6,257,720 | $17,163,587 | $27,653,230 | $10,310,405 |
| Undistributed ordinary income | 27,218 | 85,587 | 180,338 | 44,692 |
| Undistributed tax-exempt income | 452,995 | 1,074,461 | 1,915,380 | 724,661 |
| Capital loss carryforwards | (2,982,963) | (3,461,167) | (12,576,239) | (2,390,597) |
| Other temporary differences | (191,992) | (566,454) | (948,724) | (357,848) |
| Total distributable earnings (loss) | $3,562,978 | $14,296,014 | $16,223,985 | $8,331,313 |
| As of 3/31/21 | South Carolina Fund | Tennessee Fund | Virginia Fund | West Virginia Fund |
| Cost of investments | $274,305,345 | $95,719,180 | $361,975,769 | $106,960,479 |
| Gross appreciation | 12,753,960 | 5,303,708 | 20,262,087 | 5,755,612 |
| Gross depreciation | (614,865) | (117,510) | (2,705,481) | (103,133) |
| Net unrealized appreciation (depreciation) | $12,139,095 | $5,186,198 | $17,556,606 | $5,652,479 |
| Undistributed ordinary income | 75,955 | 9,618 | 109,923 | 52,427 |
| Undistributed tax-exempt income | 881,417 | 905,702 | 1,359,547 | 490,643 |
| Capital loss carryforwards | (5,765,325) | (3,216,688) | (8,434,271) | (4,128,696) |
| Other temporary differences | (457,431) | (190,629) | (772,530) | (252,710) |
| Total distributable earnings (loss) | $6,873,711 | $2,694,201 | $9,819,275 | $1,814,143 |
| Mississippi Fund | New York Fund | North Carolina Fund | Pennsylvania Fund | South Carolina Fund | Tennessee Fund | Virginia Fund | West Virginia Fund | |
| Short-Term | $(1,274,611) | $(3,461,167) | $(11,619,218) | $(2,390,597) | $(4,071,845) | $(2,411,985) | $(5,234,675) | $(1,627,402) |
| Long-Term | (1,708,352) | — | (957,021) | — | (1,693,480) | (804,703) | (3,199,596) | (2,501,294) |
| Total | $(2,982,963) | $(3,461,167) | $(12,576,239) | $(2,390,597) | $(5,765,325) | $(3,216,688) | $(8,434,271) | $(4,128,696) |
| Mississippi Fund | New York Fund | North Carolina Fund | Pennsylvania Fund | ||||||||||||
| Year Ended 3/31/21 | Year Ended 3/31/20 | Year Ended 3/31/21 | Year Ended 3/31/20 | Year Ended 3/31/21 | Year Ended 3/31/20 | Year Ended 3/31/21 | Year Ended 3/31/20 | ||||||||
| Class A | $2,055,799 | $2,389,980 | $4,260,533 | $4,661,295 | $7,895,170 | $8,874,823 | $3,301,867 | $3,595,955 | |||||||
| Class B | 4,318 | 14,406 | 29,344 | 50,871 | 9,137 | 22,162 | 22,490 | 49,173 | |||||||
| Class C | — | — | 253,482 | 343,835 | 626,025 | 849,632 | — | — | |||||||
| Class I | 294,859 | 293,990 | 2,498,450 | 2,291,148 | 2,442,306 | 2,168,796 | 759,458 | 772,775 | |||||||
| Class R6 | 67,963 | 39,182 | 113,096 | 81,681 | 722,207 | 645,071 | 373,070 | 411,733 | |||||||
| Total | $2,422,939 | $2,737,558 | $7,154,905 | $7,428,830 | $11,694,845 | $12,560,484 | $4,456,885 | $4,829,636 | |||||||
| South Carolina Fund | Tennessee Fund | Virginia Fund | West Virginia Fund | ||||||||||||
| Year Ended 3/31/21 | Year Ended 3/31/20 | Year Ended 3/31/21 | Year Ended 3/31/20 | Year Ended 3/31/21 | Year Ended 3/31/20 | Year Ended 3/31/21 | Year Ended 3/31/20 | ||||||||
| Class A | $4,250,603 | $4,684,189 | $1,753,273 | $2,141,360 | $6,549,795 | $6,697,032 | $2,488,264 | $3,006,955 | |||||||
| Class B | 8,828 | 33,930 | 3,528 | 10,808 | 10,591 | 13,397 | 2,229 | 6,765 | |||||||
| Class C | — | — | — | — | 300,167 | 354,559 | — | — | |||||||
| Class I | 1,051,444 | 933,765 | 660,204 | 771,032 | 2,341,558 | 2,013,065 | 313,431 | 237,273 | |||||||
| Class R6 | 268,256 | 209,436 | 107,166 | 116,698 | 534,012 | 388,436 | 21,697 | 16,042 | |||||||
| Total | $5,579,131 | $5,861,320 | $2,524,171 | $3,039,898 | $9,736,123 | $9,466,489 | $2,825,621 | $3,267,035 | |||||||
| Mississippi Fund | New York Fund | North Carolina Fund | Pennsylvania Fund | South Carolina Fund | Tennessee Fund | Virginia Fund | West Virginia Fund |
| $11,704 | $30,948 | $57,172 | $19,241 | $29,368 | $11,305 | $40,330 | $12,354 |
| North Carolina Fund | South Carolina Fund | Tennessee Fund | Virginia Fund | West Virginia Fund | |
| Class A | 0.84% | 0.84% | 0.86% | 0.81% | 0.87% |
| Class B | 1.59% | 1.59% | 1.61% | 1.56% | 1.62% |
| Class C | 1.59% | N/A | N/A | 1.56% | N/A |
| Class I | 0.59% | 0.59% | 0.61% | 0.56% | 0.62% |
| Class R6 | 0.52% | 0.53% | 0.54% | 0.49% | 0.55% |
| South Carolina Fund | Tennessee Fund | Virginia Fund | West Virginia Fund |
| $41,512 | $110,380 | $171,621 | $101,589 |
| New York Fund | |
| Class A | 0.90% |
| Class B | 1.65% |
| Class C | 1.65% |
| Class I | 0.65% |
| Class R6 | 0.60% |
| New York Fund | |
| Class A | 0.83% |
| Class B | 1.58% |
| Class C | 1.58% |
| Class I | 0.58% |
| Class R6 | 0.53% |
| Mississippi Fund | New York Fund | North Carolina Fund | Pennsylvania Fund | South Carolina Fund | Tennessee Fund | Virginia Fund | West Virginia Fund |
| $6,445 | $4,878 | $23,532 | $18,478 | $16,730 | $2,704 | $9,169 | $4,125 |
| Class A | |||||
| Distribution Fee Rate (d) | Service Fee Rate (d) | Total Distribution Plan (d) | Annual Effective Rate (e) | Distribution and Service Fee | |
| Mississippi Fund | — | 0.25% | 0.25% | 0.10% | $223,362 |
| New York Fund | — | 0.25% | 0.25% | 0.25% | 418,558 |
| North Carolina Fund | — | 0.25% | 0.25% | 0.25% | 864,157 |
| Pennsylvania Fund | — | 0.25% | 0.25% | 0.10% | 321,818 |
| South Carolina Fund | — | 0.25% | 0.25% | 0.25% | 512,785 |
| Tennessee Fund | — | 0.25% | 0.25% | 0.25% | 180,639 |
| Virginia Fund | — | 0.25% | 0.25% | 0.25% | 614,315 |
| West Virginia Fund | — | 0.25% | 0.25% | 0.25% | 245,542 |
| Class B | |||||
| Distribution Fee Rate (d) | Service Fee Rate (d) | Total Distribution Plan (d) | Annual Effective Rate (e) | Distribution and Service Fee | |
| Mississippi Fund | 0.75% | 0.25% | 1.00% | 0.75% | $2,445 |
| New York Fund | 0.75% | 0.25% | 1.00% | 1.00% | 16,138 |
| North Carolina Fund | 0.75% | 0.25% | 1.00% | 1.00% | 5,763 |
| Pennsylvania Fund | 0.75% | 0.25% | 1.00% | 0.85% | 12,055 |
| South Carolina Fund | 0.75% | 0.25% | 1.00% | 1.00% | 5,983 |
| Tennessee Fund | 0.75% | 0.25% | 1.00% | 1.00% | 2,086 |
| Virginia Fund | 0.75% | 0.25% | 1.00% | 1.00% | 5,501 |
| West Virginia Fund | 0.75% | 0.25% | 1.00% | 1.00% | 1,237 |
| Class C | |||||
| Distribution Fee Rate (d) | Service Fee Rate (d) | Total Distribution Plan (d) | Annual Effective Rate (e) | Distribution and Service Fee | |
| New York Fund | 0.75% | 0.25% | 1.00% | 1.00% | $140,864 |
| North Carolina Fund | 0.75% | 0.25% | 1.00% | 1.00% | 403,819 |
| Virginia Fund | 0.75% | 0.25% | 1.00% | 1.00% | 155,960 |
| Mississippi Fund | New York Fund | North Carolina Fund | Pennsylvania Fund | South Carolina Fund | Tennessee Fund | Virginia Fund | West Virginia Fund | |
| Total Distribution and Service Fees | $225,807 | $575,560 | $1,273,739 | $333,873 | $518,768 | $182,725 | $775,776 | $246,779 |
| (d) | In accordance with the distribution plan for certain classes, each fund pays distribution and/or service fees equal to these annual percentage rates of each class’s average daily net assets. The distribution and service fee rates disclosed by class represent the current rates in effect at the end of the reporting period. Any rate changes, if applicable, are detailed below. |
| (e) | The annual effective rates represent actual fees incurred under the distribution plan for the year ended March 31, 2021 based on each class's average daily net assets. MFD has voluntarily agreed to rebate a portion of each class’s 0.25% service fee attributable to accounts for which there is no financial intermediary specified on the account except for accounts attributable to MFS or its affiliates’ seed money. For the year ended March 31, 2021, these rebates amounted to the following and are included in the reduction of total expenses in the Statements of Operations: |
| Mississippi Fund | New York Fund | North Carolina Fund | Pennsylvania Fund | South Carolina Fund | Tennessee Fund | Virginia Fund | West Virginia Fund | |
| Class A | $88 | $3,071 | $7,996 | $341 | $2,201 | $451 | $5,308 | $3,307 |
| Class B | — | 1 | — | — | — | — | — | — |
| Class C | N/A | — | 14 | N/A | N/A | N/A | 78 | N/A |
| CDSC Imposed | Mississippi Fund | New York Fund | North Carolina Fund | Pennsylvania Fund | South Carolina Fund | Tennessee Fund | Virginia Fund | West Virginia Fund |
| Class A | $— | $29,000 | $35,651 | $1,096 | $12,206 | $1,651 | $21,046 | $— |
| Class B | 2 | 7,411 | — | 174 | 78 | — | — | 36 |
| Class C | N/A | 2,360 | 7,339 | N/A | N/A | N/A | 902 | N/A |
| Mississippi Fund | New York Fund | North Carolina Fund | Pennsylvania Fund | South Carolina Fund | Tennessee Fund | Virginia Fund | West Virginia Fund | |
| Expenses paid | $3,353 | $17,862 | $20,844 | $16,804 | $9,842 | $3,593 | $21,101 | $5,248 |
| Percentage of average daily net assets | 0.0032% | 0.0064% | 0.0041% | 0.0097% | 0.0037% | 0.0035% | 0.0058% | 0.0047% |
| Mississippi Fund | New York Fund | North Carolina Fund | Pennsylvania Fund | South Carolina Fund | Tennessee Fund | Virginia Fund | West Virginia Fund |
| $64,504 | $187,265 | $358,204 | $117,589 | $165,755 | $74,243 | $276,072 | $93,758 |
| Mississippi Fund | New York Fund | North Carolina Fund | Pennsylvania Fund | South Carolina Fund | Tennessee Fund | Virginia Fund | West Virginia Fund | |
| Percentage of average daily net assets | 0.0235% | 0.0170% | 0.0151% | 0.0193% | 0.0171% | 0.0238% | 0.0160% | 0.0229% |
| North Carolina Fund | South Carolina Fund | Virginia Fund | West Virginia Fund |
| $235 | $232 | $232 | $232 |
| North Carolina Fund | South Carolina Fund | Virginia Fund | West Virginia Fund |
| $2,918 | $2,953 | $2,937 | $2,952 |
| Mississippi Fund | New York Fund | North Carolina Fund | Pennsylvania Fund | South Carolina Fund | Tennessee Fund | Virginia Fund | West Virginia Fund | |
| Purchases | $30,148,062 | $126,393,711 | $188,884,428 | $71,861,010 | $100,695,621 | $23,568,436 | $104,260,984 | $31,346,882 |
| Sales | $20,432,701 | $120,728,127 | $125,499,543 | $47,265,508 | $58,847,604 | $22,257,323 | $74,271,861 | $24,720,514 |
| Mississippi Fund | New York Fund | ||||||||||
| Year ended 3/31/21 | Year ended 3/31/20 | Year ended 3/31/21 | Year ended 3/31/20 | ||||||||
| Shares | Amount | Shares | Amount | Shares | Amount | Shares | Amount | ||||
| Shares sold | |||||||||||
| Class A | 1,158,053 | $11,381,463 | 1,609,474 | $15,813,418 | 1,830,942 | $20,327,920 | 3,965,636 | $44,561,293 | |||
| Class B | 203 | 1,992 | 228 | 2,238 | 2,514 | 28,267 | 6,138 | 68,162 | |||
| Class C | — | — | — | — | 154,106 | 1,721,692 | 359,199 | 4,023,122 | |||
| Class I | 411,802 | 4,071,191 | 357,630 | 3,505,417 | 1,701,251 | 16,809,838 | 2,068,782 | 20,546,180 | |||
| Class R6 | 110,133 | 1,083,067 | 197,206 | 1,945,776 | 208,661 | 2,054,168 | 194,696 | 1,937,054 | |||
| 1,680,191 | $16,537,713 | 2,164,538 | $21,266,849 | 3,897,474 | $40,941,885 | 6,594,451 | $71,135,811 | ||||
| Shares issued to shareholders in reinvestment of distributions | |||||||||||
| Class A | 198,409 | $1,951,155 | 221,922 | $2,175,719 | 326,932 | $3,645,100 | 344,332 | $3,870,583 | |||
| Class B | 209 | 2,024 | 1,088 | 10,673 | 2,230 | 24,720 | 3,848 | 43,101 | |||
| Class C | — | — | — | — | 20,040 | 222,852 | 26,470 | 297,128 | |||
| Class I | 26,461 | 259,865 | 26,854 | 262,939 | 231,894 | 2,288,157 | 215,636 | 2,143,920 | |||
| Class R6 | 6,881 | 67,595 | 4,002 | 39,182 | 11,447 | 113,096 | 8,204 | 81,615 | |||
| 231,960 | $2,280,639 | 253,866 | $2,488,513 | 592,543 | $6,293,925 | 598,490 | $6,436,347 | ||||
| Shares reacquired | |||||||||||
| Class A | (994,086) | $(9,740,963) | (1,075,513) | $(10,496,129) | (3,065,195) | $(33,791,067) | (2,414,814) | $(26,976,784) | |||
| Class B | (53,748) | (523,669) | (4,559) | (44,687) | (111,918) | (1,247,029) | (70,948) | (791,554) | |||
| Class C | — | — | — | — | (508,585) | (5,680,181) | (511,488) | (5,702,333) | |||
| Class I | (217,925) | (2,145,712) | (101,916) | (989,172) | (1,016,702) | (9,938,837) | (669,227) | (6,565,350) | |||
| Class R6 | (95,165) | (938,480) | (43,200) | (406,770) | (54,612) | (536,174) | (79,743) | (775,117) | |||
| (1,360,924) | $(13,348,824) | (1,225,188) | $(11,936,758) | (4,757,012) | $(51,193,288) | (3,746,220) | $(40,811,138) | ||||
| Net change | |||||||||||
| Class A | 362,376 | $3,591,655 | 755,883 | $7,493,008 | (907,321) | $(9,818,047) | 1,895,154 | $21,455,092 | |||
| Class B | (53,336) | (519,653) | (3,243) | (31,776) | (107,174) | (1,194,042) | (60,962) | (680,291) | |||
| Class C | — | — | — | — | (334,439) | (3,735,637) | (125,819) | (1,382,083) | |||
| Class I | 220,338 | 2,185,344 | 282,568 | 2,779,184 | 916,443 | 9,159,158 | 1,615,191 | 16,124,750 | |||
| Class R6 | 21,849 | 212,182 | 158,008 | 1,578,188 | 165,496 | 1,631,090 | 123,157 | 1,243,552 | |||
| 551,227 | $5,469,528 | 1,193,216 | $11,818,604 | (266,995) | $(3,957,478) | 3,446,721 | $36,761,020 | ||||
| North Carolina Fund | Pennsylvania Fund | ||||||||||
| Year ended 3/31/21 | Year ended 3/31/20 | Year ended 3/31/21 | Year ended 3/31/20 | ||||||||
| Shares | Amount | Shares | Amount | Shares | Amount | Shares | Amount | ||||
| Shares sold | |||||||||||
| Class A | 6,602,432 | $77,721,228 | 6,788,880 | $80,032,695 | 2,474,008 | $25,928,595 | 2,172,639 | $22,734,481 | |||
| Class B | 1,276 | 14,396 | 4,245 | 49,839 | 38 | 388 | 382 | 3,963 | |||
| Class C | 504,123 | 5,910,821 | 1,584,590 | 18,705,421 | — | — | — | — | |||
| Class I | 4,368,095 | 42,924,803 | 3,852,801 | 37,917,683 | 915,677 | 9,163,074 | 1,030,330 | 10,303,616 | |||
| Class R6 | 1,385,236 | 13,674,485 | 1,261,947 | 12,392,720 | 583,182 | 5,829,247 | 544,560 | 5,436,073 | |||
| 12,861,162 | $140,245,733 | 13,492,463 | $149,098,358 | 3,972,905 | $40,921,304 | 3,747,911 | $38,478,133 | ||||
| North Carolina Fund − continued | Pennsylvania Fund − continued | ||||||||||
| Year ended 3/31/21 | Year ended 3/31/20 | Year ended 3/31/21 | Year ended 3/31/20 | ||||||||
| Shares | Amount | Shares | Amount | Shares | Amount | Shares | Amount | ||||
| Shares issued to shareholders in reinvestment of distributions | |||||||||||
| Class A | 627,631 | $7,378,536 | 694,690 | $8,197,079 | 294,973 | $3,085,376 | 319,269 | $3,344,338 | |||
| Class B | 726 | 8,481 | 1,810 | 21,317 | 2,040 | 21,320 | 4,474 | 46,954 | |||
| Class C | 50,553 | 592,825 | 66,234 | 781,059 | — | — | — | — | |||
| Class I | 214,421 | 2,103,354 | 187,525 | 1,845,285 | 63,165 | 629,313 | 62,461 | 623,485 | |||
| Class R6 | 71,308 | 699,567 | 63,649 | 626,385 | 12,015 | 120,001 | 7,580 | 75,696 | |||
| 964,639 | $10,782,763 | 1,013,908 | $11,471,125 | 372,193 | $3,856,010 | 393,784 | $4,090,473 | ||||
| Shares reacquired | |||||||||||
| Class A | (5,616,204) | $(66,037,402) | (4,439,963) | $(51,996,852) | (1,250,228) | $(13,104,888) | (1,319,609) | $(13,708,762) | |||
| Class B | (35,926) | (422,186) | (49,423) | (577,616) | (68,742) | (721,534) | (88,776) | (927,619) | |||
| Class C | (1,531,861) | (18,023,528) | (1,043,687) | (12,212,329) | — | — | — | — | |||
| Class I | (1,906,770) | (18,642,473) | (1,343,615) | (13,060,807) | (469,667) | (4,680,498) | (493,004) | (4,868,718) | |||
| Class R6 | (480,280) | (4,696,472) | (480,389) | (4,610,843) | (362,505) | (3,576,958) | (314,896) | (3,182,501) | |||
| (9,571,041) | $(107,822,061) | (7,357,077) | $(82,458,447) | (2,151,142) | $(22,083,878) | (2,216,285) | $(22,687,600) | ||||
| Net change | |||||||||||
| Class A | 1,613,859 | $19,062,362 | 3,043,607 | $36,232,922 | 1,518,753 | $15,909,083 | 1,172,299 | $12,370,057 | |||
| Class B | (33,924) | (399,309) | (43,368) | (506,460) | (66,664) | (699,826) | (83,920) | (876,702) | |||
| Class C | (977,185) | (11,519,882) | 607,137 | 7,274,151 | — | — | — | — | |||
| Class I | 2,675,746 | 26,385,684 | 2,696,711 | 26,702,161 | 509,175 | 5,111,889 | 599,787 | 6,058,383 | |||
| Class R6 | 976,264 | 9,677,580 | 845,207 | 8,408,262 | 232,692 | 2,372,290 | 237,244 | 2,329,268 | |||
| 4,254,760 | $43,206,435 | 7,149,294 | $78,111,036 | 2,193,956 | $22,693,436 | 1,925,410 | $19,881,006 | ||||
| South Carolina Fund | Tennessee Fund | ||||||||||
| Year ended 3/31/21 | Year ended 3/31/20 | Year ended 3/31/21 | Year ended 3/31/20 | ||||||||
| Shares | Amount | Shares | Amount | Shares | Amount | Shares | Amount | ||||
| Shares sold | |||||||||||
| Class A | 3,622,825 | $44,351,500 | 4,128,135 | $50,391,924 | 714,057 | $7,442,924 | 938,422 | $9,863,837 | |||
| Class B | 1,030 | 12,749 | 2,177 | 26,253 | 3 | 36 | — | — | |||
| Class I | 2,251,458 | 22,235,583 | 1,443,638 | 14,229,213 | 581,137 | 5,636,477 | 410,363 | 4,051,856 | |||
| Class R6 | 646,473 | 6,413,862 | 566,629 | 5,590,195 | 125,051 | 1,209,802 | 117,452 | 1,148,762 | |||
| 6,521,786 | $73,013,694 | 6,140,579 | $70,237,585 | 1,420,248 | $14,289,239 | 1,466,237 | $15,064,455 | ||||
| Shares issued to shareholders in reinvestment of distributions | |||||||||||
| Class A | 336,266 | $4,097,388 | 367,994 | $4,484,749 | 152,279 | $1,587,030 | 183,569 | $1,929,258 | |||
| Class B | 731 | 8,819 | 2,765 | 33,666 | 275 | 2,858 | 937 | 9,837 | |||
| Class I | 91,275 | 902,178 | 80,487 | 794,670 | 65,870 | 641,923 | 77,085 | 757,213 | |||
| Class R6 | 27,122 | 268,235 | 21,191 | 209,432 | 11,003 | 107,166 | 11,884 | 116,698 | |||
| 455,394 | $5,276,620 | 472,437 | $5,522,517 | 229,427 | $2,338,977 | 273,475 | $2,813,006 | ||||
| Shares reacquired | |||||||||||
| Class A | (1,944,801) | $(23,726,152) | (1,472,666) | $(17,860,081) | (1,222,879) | $(12,780,270) | (926,056) | $(9,683,865) | |||
| Class B | (79,566) | (968,002) | (67,685) | (829,366) | (5,861) | (61,580) | (43,946) | (455,480) | |||
| Class I | (647,031) | (6,417,783) | (791,073) | (7,749,279) | (504,967) | (4,895,965) | (460,291) | (4,435,877) | |||
| Class R6 | (127,656) | (1,261,289) | (116,057) | (1,128,204) | (124,547) | (1,201,363) | (50,437) | (489,001) | |||
| (2,799,054) | $(32,373,226) | (2,447,481) | $(27,566,930) | (1,858,254) | $(18,939,178) | (1,480,730) | $(15,064,223) | ||||
| South Carolina Fund − continued | Tennessee Fund − continued | ||||||||||
| Year ended 3/31/21 | Year ended 3/31/20 | Year ended 3/31/21 | Year ended 3/31/20 | ||||||||
| Shares | Amount | Shares | Amount | Shares | Amount | Shares | Amount | ||||
| Net change | |||||||||||
| Class A | 2,014,290 | $24,722,736 | 3,023,463 | $37,016,592 | (356,543) | $(3,750,316) | 195,935 | $2,109,230 | |||
| Class B | (77,805) | (946,434) | (62,743) | (769,447) | (5,583) | (58,686) | (43,009) | (445,643) | |||
| Class I | 1,695,702 | 16,719,978 | 733,052 | 7,274,604 | 142,040 | 1,382,435 | 27,157 | 373,192 | |||
| Class R6 | 545,939 | 5,420,808 | 471,763 | 4,671,423 | 11,507 | 115,605 | 78,899 | 776,459 | |||
| 4,178,126 | $45,917,088 | 4,165,535 | $48,193,172 | (208,579) | $(2,310,962) | 258,982 | $2,813,238 | ||||
| Virginia Fund | West Virginia Fund | ||||||||||
| Year ended 3/31/21 | Year ended 3/31/20 | Year ended 3/31/21 | Year ended 3/31/20 | ||||||||
| Shares | Amount | Shares | Amount | Shares | Amount | Shares | Amount | ||||
| Shares sold | |||||||||||
| Class A | 4,343,470 | $48,934,253 | 3,791,249 | $43,000,739 | 528,300 | $5,897,279 | 742,514 | $8,278,921 | |||
| Class B | 2,258 | 25,986 | 9,988 | 113,355 | 2,112 | 23,813 | 28 | 524 | |||
| Class C | 237,225 | 2,690,383 | 369,189 | 4,189,711 | — | — | — | — | |||
| Class I | 3,369,391 | 33,380,444 | 3,225,520 | 31,813,495 | 733,254 | 7,204,193 | 333,928 | 3,268,929 | |||
| Class R6 | 939,360 | 9,267,335 | 616,171 | 6,068,979 | 26,052 | 255,077 | 56,296 | 553,127 | |||
| 8,891,704 | $94,298,401 | 8,012,117 | $85,186,279 | 1,289,718 | $13,380,362 | 1,132,766 | $12,101,501 | ||||
| Shares issued to shareholders in reinvestment of distributions | |||||||||||
| Class A | 507,718 | $5,759,053 | 521,449 | $5,911,974 | 214,015 | $2,382,778 | 256,180 | $2,854,273 | |||
| Class B | 845 | 9,574 | 1,073 | 12,150 | 200 | 2,226 | 578 | 6,432 | |||
| Class C | 22,789 | 258,077 | 27,297 | 309,296 | — | — | — | — | |||
| Class I | 204,142 | 2,014,090 | 178,923 | 1,763,250 | 25,141 | 246,860 | 19,163 | 187,924 | |||
| Class R6 | 54,008 | 533,483 | 39,375 | 388,418 | 2,214 | 21,697 | 1,632 | 16,018 | |||
| 789,502 | $8,574,277 | 768,117 | $8,385,088 | 241,570 | $2,653,561 | 277,553 | $3,064,647 | ||||
| Shares reacquired | |||||||||||
| Class A | (4,084,717) | $(45,948,525) | (3,334,484) | $(37,436,033) | (895,511) | $(9,976,692) | (931,124) | $(10,357,477) | |||
| Class B | (17,450) | (198,890) | (26,350) | (297,271) | (6,777) | (75,812) | (31,443) | (351,000) | |||
| Class C | (516,194) | (5,859,010) | (469,551) | (5,274,047) | — | — | — | — | |||
| Class I | (1,520,352) | (14,892,809) | (1,838,521) | (17,649,504) | (114,007) | (1,114,581) | (216,501) | (2,110,913) | |||
| Class R6 | (251,195) | (2,461,458) | (218,932) | (2,121,986) | (18,727) | (181,946) | (9,139) | (89,892) | |||
| (6,389,908) | $(69,360,692) | (5,887,838) | $(62,778,841) | (1,035,022) | $(11,349,031) | (1,188,207) | $(12,909,282) | ||||
| Net change | |||||||||||
| Class A | 766,471 | $8,744,781 | 978,214 | $11,476,680 | (153,196) | $(1,696,635) | 67,570 | $775,717 | |||
| Class B | (14,347) | (163,330) | (15,289) | (171,766) | (4,465) | (49,773) | (30,837) | (344,044) | |||
| Class C | (256,180) | (2,910,550) | (73,065) | (775,040) | — | — | — | — | |||
| Class I | 2,053,181 | 20,501,725 | 1,565,922 | 15,927,241 | 644,388 | 6,336,472 | 136,590 | 1,345,940 | |||
| Class R6 | 742,173 | 7,339,360 | 436,614 | 4,335,411 | 9,539 | 94,828 | 48,789 | 479,253 | |||
| 3,291,298 | $33,511,986 | 2,892,396 | $30,792,526 | 496,266 | $4,684,892 | 222,112 | $2,256,866 | ||||
| Mississippi Fund | New York Fund | North Carolina Fund | Pennsylvania Fund | South Carolina Fund | Tennessee Fund | Virginia Fund | West Virginia Fund | |
| Commitment Fee | $506 | $1,352 | $2,462 | $810 | $1,296 | $481 | $1,672 | $530 |
| Interest Expense | — | — | — | — | — | — | — | — |
| Affiliated Issuer - MFS Institutional Money Market Portfolio | ||||||
| Beginning Value | Purchases | Sales Proceeds | Realized Gain (Loss) | Change in Unrealized Appreciation or Depreciation | Ending Value | |
| Mississippi Fund | $3,902,197 | $32,296,055 | $36,159,284 | $72 | $(390) | $38,650 |
| New York Fund | 5,289,871 | 105,311,898 | 108,272,946 | (742) | 103 | 2,328,184 |
| North Carolina Fund | 11,538,961 | 163,889,648 | 167,368,112 | (1,273) | 475 | 8,059,699 |
| Pennsylvania Fund | 2,584,086 | 59,547,881 | 58,814,933 | (744) | 311 | 3,316,601 |
| South Carolina Fund | 4,914,196 | 103,414,217 | 104,389,309 | (1,908) | 854 | 3,938,050 |
| Tennessee Fund | 1,471,518 | 29,072,564 | 29,922,464 | (534) | 106 | 621,190 |
| Virginia Fund | 1,936,190 | 120,270,000 | 117,636,018 | (578) | (366) | 4,569,228 |
| West Virginia Fund | 781,988 | 26,945,094 | 27,138,701 | (315) | 52 | 588,118 |
| Dividend Income | Capital Gain Distributions | |
| Mississippi Fund | $3,515 | $— |
| New York Fund | 7,301 | — |
| North Carolina Fund | 16,790 | — |
| Pennsylvania Fund | 7,259 | — |
| South Carolina Fund | 10,927 | — |
| Tennessee Fund | 3,163 | — |
| Virginia Fund | 8,134 | — |
| West Virginia Fund | 3,135 | — |
May 14, 2021
| Name, Age | Position(s) Held with Fund | Trustee/Officer Since(h) | Number of MFS Funds overseen by the Trustee | Principal Occupations During the Past Five Years | Other Directorships During the Past Five Years (j) | |||||
| INTERESTED TRUSTEES | ||||||||||
| Robert J. Manning (k) (age 57) | Trustee | February 2004 | 135 | Massachusetts Financial Services Company, Non-Executive Chairman (since January 2021); Director; Chairman of the Board; Executive Chairman (January 2017-2020); Co-Chief Executive Officer (2015-2016) | N/A | |||||
| Michael W. Roberge (k) (age 54) | Trustee | January 2021 | 135 | Massachusetts Financial Services Company, Chairman (since January 2021); Chief Executive Officer (since January 2017); Director; President (until December 2018); Chief Investment Officer (until December 2018); Co-Chief Executive Officer (until December 2016) | N/A | |||||
| INDEPENDENT TRUSTEES | ||||||||||
| John P. Kavanaugh (age 66) | Trustee and Chair of Trustees | January 2009 | 135 | Private investor | N/A | |||||
| Steven E. Buller (age 69) | Trustee | February 2014 | 135 | Private investor | N/A | |||||
| John A. Caroselli (age 66) | Trustee | March 2017 | 135 | Private investor; JC Global Advisors, LLC (management consulting), President (since 2015) | N/A | |||||
| Maureen R. Goldfarb (age 66) | Trustee | January 2009 | 135 | Private investor | N/A | |||||
| Peter D. Jones (age 65) | Trustee | January 2019 | 135 | Private investor | N/A | |||||
| James W. Kilman, Jr. (age 59) | Trustee | January 2019 | 135 | Burford Capital Limited (finance and investment management), Chief Financial Officer (since 2019); KielStrand Capital LLC (family office), Chief Executive Officer (since 2016); Morgan Stanley & Co. (financial services), Vice Chairman of Investment Banking, Co-Head of Diversified Financials Coverage – Financial Institutions Investment Banking Group (until 2016) | Alpha-En Corporation, Director (2016-2019) | |||||
| Clarence Otis, Jr. (age 65) | Trustee | March 2017 | 135 | Private investor | VF Corporation, Director; Verizon Communications, Inc., Director; The Travelers Companies, Director | |||||
| Maryanne L. Roepke (age 65) | Trustee | May 2014 | 135 | Private investor | N/A | |||||
| Name, Age | Position(s) Held with Fund | Trustee/Officer Since(h) | Number of MFS Funds overseen by the Trustee | Principal Occupations During the Past Five Years | Other Directorships During the Past Five Years (j) | |||||
| Laurie J. Thomsen (age 63) | Trustee | March 2005 | 135 | Private investor | The Travelers Companies, Director; Dycom Industries, Inc., Director |
| Name, Age | Position(s) Held with Fund | Trustee/Officer Since(h) | Number of MFS Funds for which the Person is an Officer | Principal Occupations During the Past Five Years | ||||
| OFFICERS | ||||||||
| Christopher R. Bohane (k) (age 47) | Assistant Secretary and Assistant Clerk | July 2005 | 135 | Massachusetts Financial Services Company, Senior Vice President and Associate General Counsel | ||||
| Kino Clark (k) (age 52) | Assistant Treasurer | January 2012 | 135 | Massachusetts Financial Services Company, Vice President | ||||
| John W. Clark, Jr. (k) (age 54) | Assistant Treasurer | April 2017 | 135 | Massachusetts Financial Services Company, Vice President (since March 2017); Deutsche Bank (financial services), Department Head - Treasurer's Office (until February 2017) | ||||
| Thomas H. Connors (k) (age 61) | Assistant Secretary and Assistant Clerk | September 2012 | 135 | Massachusetts Financial Services Company, Vice President and Senior Counsel | ||||
| David L. DiLorenzo (k) (age 52) | President | July 2005 | 135 | Massachusetts Financial Services Company, Senior Vice President | ||||
| Heidi W. Hardin (k) (age 53) | Secretary and Clerk | April 2017 | 135 | Massachusetts Financial Services Company, Executive Vice President and General Counsel (since March 2017); Harris Associates (investment management), General Counsel (until January 2017) | ||||
| Brian E. Langenfeld (k) (age 48) | Assistant Secretary and Assistant Clerk | June 2006 | 135 | Massachusetts Financial Services Company, Vice President and Senior Counsel | ||||
| Amanda S. Mooradian (k) (age 42) | Assistant Secretary and Assistant Clerk | September 2018 | 135 | Massachusetts Financial Services Company, Assistant Vice President and Senior Counsel | ||||
| Susan A. Pereira (k) (age 50) | Assistant Secretary and Assistant Clerk | July 2005 | 135 | Massachusetts Financial Services Company, Vice President and Assistant General Counsel | ||||
| Kasey L. Phillips (k) (age 50) | Assistant Treasurer | September 2012 | 135 | Massachusetts Financial Services Company, Vice President | ||||
| Matthew A. Stowe (k) (age 46) | Assistant Secretary and Assistant Clerk | October 2014 | 135 | Massachusetts Financial Services Company, Vice President and Assistant General Counsel | ||||
| Martin J. Wolin (k) (age 53) | Chief Compliance Officer | July 2015 | 135 | Massachusetts Financial Services Company, Senior Vice President and Chief Compliance Officer | ||||
| James O. Yost (k) (age 60) | Treasurer | September 1990 | 135 | Massachusetts Financial Services Company, Senior Vice President |
| (h) | Date first appointed to serve as Trustee/Officer of an MFS Fund. Each Trustee has served continuously since appointment unless indicated otherwise. For the period from December 15, 2004 until February 22, 2005, Mr. Manning served as Advisory Trustee. From January 2012 through December 2016, Messrs. DiLorenzo and Yost served as Treasurer and Deputy Treasurer of the Funds, respectively. |
| (j) | Directorships or trusteeships of companies required to report to the Securities and Exchange Commission (i.e., “public companies”). |
| (k) | “Interested person” of the Trust within the meaning of the Investment Company Act of 1940 (referred to as the 1940 Act), which is the principal federal law governing investment companies like the fund, as a result of a position with MFS. The address of MFS is 111 Huntington Avenue, Boston, Massachusetts 02199-7618. |
| Investment Adviser | Custodian |
| Massachusetts Financial Services Company 111 Huntington Avenue Boston, MA 02199-7618 | JPMorgan Chase Bank, NA 4 Metrotech Center New York, NY 11245 |
| Distributor | Independent Registered Public Accounting Firm |
| MFS Fund Distributors, Inc. 111 Huntington Avenue Boston, MA 02199-7618 | Deloitte & Touche LLP 200 Berkeley Street Boston, MA 02116 |
| Portfolio Manager(s) | |
| Michael Dawson |
| Exempt Interest Dividends | |
| Mississippi Fund | 98.90% |
| New York Fund | 98.80% |
| North Carolina Fund | 96.88% |
| Pennsylvania Fund | 98.77% |
| South Carolina Fund | 98.79% |
| Tennessee Fund | 98.92% |
| Virginia Fund | 96.89% |
| West Virginia Fund | 98.99% |
| FACTS | WHAT DOES MFS DO WITH YOUR PERSONAL INFORMATION? |
| Why? | Financial companies choose how they share your personal information. Federal law gives consumers the right to limit some but not all sharing. Federal law also requires us to tell you how we collect, share, and protect your personal information. Please read this notice carefully to understand what we do. |
| What? | The types of personal information we collect and share depend on the product or service you have with us. This information can include: |
| • Social Security number and account balances | |
| • Account transactions and transaction history | |
| • Checking account information and wire transfer instructions | |
| When you are no longer our customer, we continue to share your information as described in this notice. |
| How? | All financial companies need to share customers' personal information to run their everyday business. In the section below, we list the reasons financial companies can share their customers' personal information; the reasons MFS chooses to share; and whether you can limit this sharing. |
| Reasons we can share your personal information | Does MFS share? | Can you limit this sharing? |
| For our everyday business purposes – such as to process your transactions, maintain your account(s), respond to court orders and legal investigations, or report to credit bureaus | Yes | No |
| For our marketing purposes – to offer our products and services to you | No | We don't share |
| For joint marketing with other financial companies | No | We don't share |
| For our affiliates' everyday business purposes – information about your transactions and experiences | No | We don't share |
| For our affiliates' everyday business purposes – information about your creditworthiness | No | We don't share |
| For nonaffiliates to market to you | No | We don't share |
| Questions? | Call 800-225-2606 or go to mfs.com. |

| Who we are | |
| Who is providing this notice? | MFS Funds, MFS Investment Management, MFS Institutional Advisors, Inc., and MFS Heritage Trust Company. |
| What we do | |
| How does MFS protect my personal information? | To protect your personal information from unauthorized access and use, we use security measures that comply with federal law. These measures include procedural, electronic, and physical safeguards for the protection of the personal information we collect about you. |
| How does MFS collect my personal information? | We collect your personal information, for example, when you |
| • open an account or provide account information | |
| • direct us to buy securities or direct us to sell your securities | |
| • make a wire transfer | |
| We also collect your personal information from others, such as credit bureaus, affiliates, or other companies. | |
| Why can't I limit all sharing? | Federal law gives you the right to limit only |
| • sharing for affiliates' everyday business purposes – information about your creditworthiness | |
| • affiliates from using your information to market to you | |
| • sharing for nonaffiliates to market to you | |
| State laws and individual companies may give you additional rights to limit sharing. | |
| Definitions | |
| Affiliates | Companies related by common ownership or control. They can be financial and nonfinancial companies. |
| • MFS does not share personal information with affiliates, except for everyday business purposes as described on page one of this notice. | |
| Nonaffiliates | Companies not related by common ownership or control. They can be financial and nonfinancial companies. |
| • MFS does not share with nonaffiliates so they can market to you. | |
| Joint marketing | A formal agreement between nonaffiliated financial companies that together market financial products or services to you. |
| • MFS doesn't jointly market. | |
| Other important information |
| If you own an MFS product or receive an MFS service in the name of a third party such as a bank or broker-dealer, their privacy policy may apply to you instead of ours. |


| 1 | |
| 2 | |
| 4 | |
| 6 | |
| 9 | |
| 11 | |
| 125 | |
| 127 | |
| 128 | |
| 129 | |
| 136 | |
| 148 | |
| 150 | |
| 155 | |
| 155 | |
| 155 | |
| 155 | |
| 155 | |
| 157 |
| back cover |


| Healthcare Revenue - Hospitals | 16.3% |
| General Obligations - General Purpose | 9.0% |
| Housing - Single Family | 7.2% |
| Airport Revenue | 6.4% |
| State & Local Agencies | 5.1% |
| General Obligations - Schools | 5.0% |
| Universities - Colleges | 4.3% |
| Sales & Excise Tax Revenue | 4.2% |
| Miscellaneous Revenue - Other | 3.7% |
| Transportation – Special Tax | 3.5% |
| AAA | 3.1% |
| AA | 28.7% |
| A | 33.1% |
| BBB | 19.3% |
| BB | 5.6% |
| B | 2.0% |
| CCC | 0.2% |
| CC | 0.2% |
| C | 0.9% |
| D | 1.7% |
| Not Rated | 7.9% |
| Cash & Cash Equivalents | (0.7)% |
| Other | (2.0)% |
| Average Duration (d) | 7.4 |
| Average Effective Maturity (m) | 15.8 yrs. |
| (a) | For all securities other than those specifically described below, ratings are assigned to underlying securities utilizing ratings from Moody’s, Fitch, and Standard & Poor’s rating agencies and applying the following hierarchy: If all three agencies provide a rating, the middle rating (after dropping the highest and lowest ratings) is assigned; if two of the three agencies rate a security, the lower of the two is assigned. If none of the 3 rating agencies above assign a rating, but the security is rated by DBRS Morningstar, then the DBRS Morningstar rating is assigned. Ratings are shown in the S&P and Fitch scale (e.g., AAA). Securities rated BBB or higher are considered investment grade. All ratings are subject to change. Not Rated includes fixed income securities and fixed income derivatives that have not been rated by any rating agency. The fund may or may not have held all of these instruments on this date. The fund is not rated by these agencies. |
| (d) | Duration is a measure of how much a bond’s price is likely to fluctuate with general changes in interest rates, e.g., if rates rise 1.00%, a bond with a 5-year duration is likely to lose about 5.00% of its value due to the interest rate move. |
| (i) | For purposes of this presentation, the components include the value of securities, and reflect the impact of the equivalent exposure of derivative positions, if any. These amounts may be negative from time to time. Equivalent exposure is a calculated amount that translates the derivative position into a reasonable approximation of the amount of the underlying asset that the portfolio would have to hold at a given point in time to have the same price sensitivity that results from the portfolio’s ownership of the derivative contract. When dealing with derivatives, equivalent exposure is a more representative measure of the potential impact of a position on portfolio performance than value. The bond component will include any accrued interest amounts. |
| (m) | In determining each instrument’s effective maturity for purposes of calculating the fund’s dollar-weighted average effective maturity, MFS uses the instrument’s stated maturity or, if applicable, an earlier date on which MFS believes it is probable that a maturity-shortening device (such as a put, pre-refunding or prepayment) will cause the instrument to be repaid. Such an earlier date can be substantially shorter than the instrument’s stated maturity. |
Jason Kosty and Geoffrey Schechter
| (r) | Bonds rated “BBB”, “Baa”, or higher are considered investment grade; bonds rated “BB”, “Ba”, or below are considered non-investment grade. The source for bond quality ratings is Moody's Investors Service, Standard & Poor's, and Fitch, Inc. and are applied using the following hierarchy: If all three agencies provide a rating, the middle rating (after dropping the highest and lowest ratings) is assigned; if two of the three agencies rate a security, the lower of the two is assigned. If none of the 3 Rating Agencies above assign a rating, but the security is rated by DBRS Morningstar, then the DBRS Morningstar rating is assigned. Ratings are shown in the S&P and Fitch scale (e.g., AAA). For securities that are not rated by any of the rating agencies, the security is considered Not Rated. |
| (y) | A yield curve graphically depicts the yields of different maturity bonds of the same credit quality and type; a normal yield curve is upward sloping, with short-term rates lower than long-term rates. |
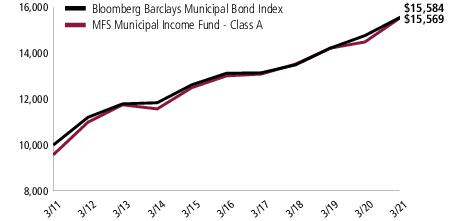
| Share Class | Class Inception Date | 1-yr | 5-yr | 10-yr | Life (t) |
| A | 9/07/93 | 7.43% | 3.65% | 4.98% | N/A |
| B | 12/29/86 | 6.63% | 2.88% | 4.20% | N/A |
| C | 1/03/94 | 6.62% | 2.88% | 4.19% | N/A |
| I | 8/01/11 | 7.70% | 3.91% | N/A | 4.80% |
| R6 | 8/01/17 | 7.78% | N/A | N/A | 4.39% |
| A1 | 6/25/07 | 7.70% | 3.91% | 5.24% | N/A |
| B1 | 6/25/07 | 6.90% | 3.13% | 4.45% | N/A |
| Bloomberg Barclays Municipal Bond Index (f) | 5.51% | 3.49% | 4.54% | N/A |
| A With Initial Sales Charge (4.25%) | 2.86% | 2.75% | 4.53% | N/A |
| B With CDSC (Declining over six years from 4% to 0%) (v) | 2.63% | 2.52% | 4.20% | N/A |
| C With CDSC (1% for 12 months) (v) | 5.62% | 2.88% | 4.19% | N/A |
| A1 With Initial Sales Charge (4.25%) | 3.12% | 3.01% | 4.79% | N/A |
| B1 With CDSC (Declining over six years from 4% to 0%) (v) | 2.90% | 2.78% | 4.45% | N/A |
| (f) | Source: FactSet Research Systems Inc. |
| (t) | For the period from the class inception date through the stated period end (for those share classes with less than 10 years of performance history). No comparative benchmark performance information is provided for “life” periods. (See Notes to Performance Summary.) |
| (v) | Assuming redemption at the end of the applicable period. |
| (a) | BLOOMBERG ® is a trademark and service mark of Bloomberg Finance L.P. and its affiliates (collectively “Bloomberg”). BARCLAYS® is a trademark and service mark of Barclays Bank Plc (collectively with its affiliates, “Barclays”), used under license. Bloomberg or Bloomberg's licensors, including Barclays, own all proprietary rights in the Bloomberg Barclays Indices. Neither Bloomberg nor Barclays approves or endorses this material, or guarantees the |
October 1, 2020 through March 31, 2021
| Share Class | Annualized Expense Ratio | Beginning Account Value 10/01/20 | Ending Account Value 3/31/21 | Expenses Paid During Period (p) 10/01/20-3/31/21 | |
| A | Actual | 0.74% | $1,000.00 | $1,031.50 | $3.75 |
| Hypothetical (h) | 0.74% | $1,000.00 | $1,021.24 | $3.73 | |
| B | Actual | 1.49% | $1,000.00 | $1,026.51 | $7.53 |
| Hypothetical (h) | 1.49% | $1,000.00 | $1,017.50 | $7.49 | |
| C | Actual | 1.49% | $1,000.00 | $1,027.62 | $7.53 |
| Hypothetical (h) | 1.49% | $1,000.00 | $1,017.50 | $7.49 | |
| I | Actual | 0.49% | $1,000.00 | $1,031.63 | $2.48 |
| Hypothetical (h) | 0.49% | $1,000.00 | $1,022.49 | $2.47 | |
| R6 | Actual | 0.41% | $1,000.00 | $1,033.19 | $2.08 |
| Hypothetical (h) | 0.41% | $1,000.00 | $1,022.89 | $2.07 | |
| A1 | Actual | 0.49% | $1,000.00 | $1,032.77 | $2.48 |
| Hypothetical (h) | 0.49% | $1,000.00 | $1,022.49 | $2.47 | |
| B1 | Actual | 1.23% | $1,000.00 | $1,027.79 | $6.22 |
| Hypothetical (h) | 1.23% | $1,000.00 | $1,018.80 | $6.19 |
| (h) | 5% class return per year before expenses. |
| (p) | “Expenses Paid During Period” are equal to each class’s annualized expense ratio, as shown above, multiplied by the average account value over the period, multiplied by 182/365 (to reflect the one-half year period). Expenses paid do not include any applicable sales charges (loads). If these transaction costs had been included, your costs would have been higher. |
| Issuer | Shares/Par | Value ($) | ||
| Municipal Bonds - 100.9% | ||||
| Alabama - 1.8% | ||||
| Birmingham, AL, Airport Authority Rev., BAM, 4%, 7/01/2035 | $ | 300,000 | $ 352,739 | |
| Birmingham, AL, Airport Authority Rev., BAM, 4%, 7/01/2036 | 1,070,000 | 1,248,500 | ||
| Birmingham, AL, Airport Authority Rev., BAM, 4%, 7/01/2037 | 240,000 | 277,934 | ||
| Birmingham, AL, Airport Authority Rev., BAM, 4%, 7/01/2038 | 1,580,000 | 1,818,451 | ||
| Birmingham, AL, Airport Authority Rev., BAM, 4%, 7/01/2039 | 310,000 | 355,751 | ||
| Birmingham, AL, Airport Authority Rev., BAM, 4%, 7/01/2040 | 155,000 | 177,430 | ||
| Birmingham, AL, Special Care Facilities Financing Authority Rev. (Methodist Home for the Aging), 5.25%, 6/01/2025 | 835,000 | 861,829 | ||
| Black Belt Energy Gas District, AL, Gas Prepay Rev., “A”, 4%, 12/01/2048 (Put Date 12/01/2023) | 6,570,000 | 7,134,578 | ||
| Black Belt Energy Gas District, AL, Gas Prepay Rev., “A-1”, 4%, 10/01/2049 (Put Date 10/01/2026) | 4,945,000 | 5,738,730 | ||
| Black Belt Energy Gas District, AL, Gas Prepay Rev., “B-1”, FLR, 0.977% (67% of LIBOR - 1mo. + 0.9%), 12/01/2048 (Put Date 12/01/2023) | 20,175,000 | 20,326,978 | ||
| DCH Health Care Authority, AL, Health Care Facilities Rev., 5%, 6/01/2033 | 785,000 | 885,381 | ||
| Jefferson County, AL, Sewer Rev. Warrants, Capital Appreciation, Senior Lien, “B”, AGM, 0%, 10/01/2026 | 1,175,000 | 1,005,424 | ||
| Jefferson County, AL, Sewer Rev. Warrants, Capital Appreciation, Senior Lien, “B”, AGM, 0%, 10/01/2029 | 1,655,000 | 1,162,029 | ||
| Jefferson County, AL, Sewer Rev. Warrants, Capital Appreciation, Senior Lien, “B”, AGM, 0%, 10/01/2034 | 2,370,000 | 1,171,013 | ||
| Jefferson County, AL, Sewer Rev. Warrants, Capital Appreciation, Senior Lien, “B”, AGM, 0%, 10/01/2035 | 4,495,000 | 2,079,292 | ||
| Jefferson County, AL, Sewer Rev. Warrants, Subordinate Lien, “D”, 5%, 10/01/2021 | 310,000 | 317,505 | ||
| Jefferson County, AL, Sewer Rev. Warrants, Subordinate Lien, “D”, 5%, 10/01/2023 | 455,000 | 509,838 | ||
| Mobile, AL, General Obligation Warrants, “A”, 5%, 2/15/2030 | 3,130,000 | 3,817,543 | ||
| Southeast Alabama Gas Supply District Rev. (Project No. 1), “A”, 4%, 4/01/2049 (Put Date 4/01/2024) | 14,580,000 | 15,950,209 | ||
| Tuscaloosa County, AL, Industrial Development Authority, Gulf Opportunity Zone (Hunt Refining Project), “A”, 4.5%, 5/01/2032 (n) | 7,460,000 | 8,290,710 | ||
| Tuscaloosa County, AL, Industrial Development Authority, Gulf Opportunity Zone (Hunt Refining Project), “A”, 5.25%, 5/01/2044 (n) | 14,090,000 | 16,012,104 | ||
| University of North Alabama, General Fee Rev., “B”, BAM, 5%, 11/01/2038 | 1,505,000 | 1,874,281 | ||
| Issuer | Shares/Par | Value ($) | ||
| Municipal Bonds - continued | ||||
| Alabama - continued | ||||
| University of North Alabama, General Fee Rev., “B”, BAM, 5%, 11/01/2039 | $ | 620,000 | $ 770,351 | |
| University of South Alabama, Facilities Rev., “A”, BAM, 5%, 4/01/2044 | 4,070,000 | 4,991,009 | ||
| University of South Alabama, Facilities Rev., “A”, BAM, 5%, 4/01/2049 | 2,480,000 | 3,021,884 | ||
| $100,151,493 | ||||
| Alaska - 0.2% | ||||
| Alaska Housing Finance Corp., Capital Project Bonds, “A”, 5%, 6/01/2027 (w) | $ | 620,000 | $ 771,713 | |
| Alaska Housing Finance Corp., Capital Project Bonds, “A”, 5%, 12/01/2027 (w) | 1,000,000 | 1,259,397 | ||
| Alaska Housing Finance Corp., Capital Project Bonds, “A”, 5%, 6/01/2028 (w) | 1,315,000 | 1,670,187 | ||
| Alaska Housing Finance Corp., Capital Project Bonds, “A”, 5%, 12/01/2028 (w) | 1,365,000 | 1,752,256 | ||
| Alaska Housing Finance Corp., Capital Project Bonds, “A”, 5%, 6/01/2029 (w) | 1,025,000 | 1,324,521 | ||
| Alaska Housing Finance Corp., Capital Project Bonds, “A”, 4%, 12/01/2029 (w) | 1,830,000 | 2,235,184 | ||
| Alaska Housing Finance Corp., Capital Project Bonds, “A”, 4%, 6/01/2030 (w) | 1,100,000 | 1,349,196 | ||
| $10,362,454 | ||||
| Arizona - 2.2% | ||||
| Arizona Industrial Development Authority Education Rev. (Academies of Math & Science), “A”, 5%, 7/01/2038 | $ | 370,000 | $ 435,642 | |
| Arizona Industrial Development Authority Education Rev. (Academies of Math & Science), “A”, 5%, 7/01/2048 | 990,000 | 1,144,496 | ||
| Arizona Industrial Development Authority Education Rev. (Academies of Math & Science), “A”, 5%, 7/01/2052 | 1,235,000 | 1,424,382 | ||
| Arizona Industrial Development Authority Education Rev. (Basis Schools Projects), “A”, 5.125%, 7/01/2037 (n) | 1,000,000 | 1,118,723 | ||
| Arizona Industrial Development Authority Education Rev. (Basis Schools Projects), “A”, 5.25%, 7/01/2047 (n) | 750,000 | 831,595 | ||
| Arizona Industrial Development Authority Education Rev. (Basis Schools Projects), “D”, 5%, 7/01/2037 (n) | 95,000 | 107,581 | ||
| Arizona Industrial Development Authority Education Rev. (Basis Schools Projects), “D”, 5%, 7/01/2047 (n) | 160,000 | 178,173 | ||
| Arizona Industrial Development Authority Education Rev. (Basis Schools Projects), “D”, 5%, 7/01/2051 (n) | 425,000 | 472,250 | ||
| Arizona Industrial Development Authority Education Rev. (Basis Schools Projects), “F”, 5%, 7/01/2037 | 1,000,000 | 1,166,938 | ||
| Issuer | Shares/Par | Value ($) | ||
| Municipal Bonds - continued | ||||
| Arizona - continued | ||||
| Arizona Industrial Development Authority Education Rev. (Basis Schools Projects), “F”, 5%, 7/01/2047 | $ | 2,350,000 | $ 2,688,947 | |
| Arizona Industrial Development Authority Education Rev. (Basis Schools Projects), “F”, 5%, 7/01/2052 | 1,870,000 | 2,134,772 | ||
| Arizona Industrial Development Authority Education Rev. (Basis Schools Projects), “G”, 5%, 7/01/2037 (n) | 165,000 | 186,852 | ||
| Arizona Industrial Development Authority Education Rev. (Basis Schools Projects), “G”, 5%, 7/01/2047 (n) | 165,000 | 183,741 | ||
| Arizona Industrial Development Authority Education Rev. (Basis Schools Projects), “G”, 5%, 7/01/2051 (n) | 310,000 | 344,465 | ||
| Arizona Industrial Development Authority Hospital Rev. (Phoenix Children's Hospital), “A”, 5%, 2/01/2031 | 400,000 | 520,167 | ||
| Arizona Industrial Development Authority Hospital Rev. (Phoenix Children's Hospital), “A”, 5%, 2/01/2032 | 300,000 | 388,424 | ||
| Arizona Industrial Development Authority Hospital Rev. (Phoenix Children's Hospital), “A”, 5%, 2/01/2033 | 250,000 | 322,336 | ||
| Arizona Industrial Development Authority Hospital Rev. (Phoenix Children's Hospital), “A”, 5%, 2/01/2035 | 1,395,000 | 1,786,745 | ||
| Arizona Industrial Development Authority Hospital Rev. (Phoenix Children's Hospital), “A”, 5%, 2/01/2040 | 290,000 | 365,894 | ||
| Arizona Industrial Development Authority National Charter School Revolving Loan Fund Rev., “A”, 4%, 11/01/2036 | 1,100,000 | 1,282,635 | ||
| Arizona Industrial Development Authority National Charter School Revolving Loan Fund Rev., “A”, 4%, 11/01/2038 | 600,000 | 695,006 | ||
| Arizona Industrial Development Authority National Charter School Revolving Loan Fund Rev., “A”, 4%, 11/01/2039 | 750,000 | 865,694 | ||
| Arizona Industrial Development Authority National Charter School Revolving Loan Fund Rev., “A”, 4%, 11/01/2040 | 800,000 | 920,040 | ||
| Arizona Industrial Development Authority National Charter School Revolving Loan Fund Rev., “A”, 4%, 11/01/2045 | 1,015,000 | 1,152,714 | ||
| Arizona Industrial Development Authority National Charter School Revolving Loan Fund Rev., “A”, 4%, 11/01/2050 | 1,385,000 | 1,567,833 | ||
| Arizona Industrial Development Authority Senior Living Rev. (Great Lakes Senior Living Facilities LLC, First Tier), “A”, 5%, 1/01/2043 | 1,875,000 | 1,888,708 | ||
| Arizona Industrial Development Authority Senior Living Rev. (Great Lakes Senior Living Facilities LLC, First Tier), “A”, 5%, 1/01/2054 | 3,070,000 | 2,978,365 | ||
| Coconino County, AZ, Pollution Control Corp., “A”, 1.875%, 9/01/2032 (Put Date 3/31/2023) | 2,605,000 | 2,673,254 | ||
| Glendale, AZ, Industrial Development Authority, Graduate & Professional Student Loan Program Rev. (Midwestern University Foundation), “A”, 3%, 7/01/2035 | 1,965,000 | 2,066,151 | ||
| Issuer | Shares/Par | Value ($) | ||
| Municipal Bonds - continued | ||||
| Arizona - continued | ||||
| Glendale, AZ, Industrial Development Authority, Senior Living Rev. (Sun Health Services), “A”, 5%, 11/15/2042 | $ | 3,000,000 | $ 3,467,659 | |
| Glendale, AZ, Industrial Development Authority, Senior Living Rev. (Sun Health Services), “A”, 5%, 11/15/2048 | 4,000,000 | 4,600,014 | ||
| La Paz County, AZ, Industrial Development Authority Education Facility Lease Rev. (Charter School Solutions-Harmony Public Schools Project), “A”, 5%, 2/15/2038 | 675,000 | 784,366 | ||
| La Paz County, AZ, Industrial Development Authority Education Facility Lease Rev. (Charter School Solutions-Harmony Public Schools Project), “A”, 5%, 2/15/2048 | 465,000 | 531,698 | ||
| Maricopa County, AZ, Industrial Development Authority Education Rev. (Legacy Traditional Schools Projects), “A”, 4%, 7/01/2034 | 170,000 | 190,370 | ||
| Maricopa County, AZ, Industrial Development Authority Education Rev. (Legacy Traditional Schools Projects), “A”, 5%, 7/01/2039 | 295,000 | 356,090 | ||
| Maricopa County, AZ, Industrial Development Authority Education Rev. (Legacy Traditional Schools Projects), “A”, 5%, 7/01/2039 (n) | 860,000 | 987,398 | ||
| Maricopa County, AZ, Industrial Development Authority Education Rev. (Legacy Traditional Schools Projects), “A”, 5%, 7/01/2049 (n) | 545,000 | 645,074 | ||
| Maricopa County, AZ, Industrial Development Authority Education Rev. (Legacy Traditional Schools Projects), “A”, 5%, 7/01/2049 (n) | 460,000 | 517,754 | ||
| Maricopa County, AZ, Industrial Development Authority Education Rev. (Legacy Traditional Schools Projects), “A”, 5%, 7/01/2054 | 690,000 | 814,789 | ||
| Maricopa County, AZ, Industrial Development Authority Education Rev. (Legacy Traditional Schools Projects), “A”, 5%, 7/01/2054 (n) | 2,050,000 | 2,299,511 | ||
| Maricopa County, AZ, Industrial Development Authority Rev. (Banner Health), “A”, 5%, 1/01/2038 | 3,000,000 | 3,564,847 | ||
| Phoenix, AZ, Civic Improvement Corp. Rental Car Facility Charge Rev., “A”, 5%, 7/01/2037 | 6,500,000 | 7,672,201 | ||
| Phoenix, AZ, Civic Improvement Corp. Rental Car Facility Charge Rev., “A”, 5%, 7/01/2045 | 10,000,000 | 11,577,123 | ||
| Phoenix, AZ, Industrial Development Authority, Education Facility Rev. (Basis Schools Projects), “A”, 5%, 7/01/2035 (n) | 470,000 | 514,979 | ||
| Phoenix, AZ, Industrial Development Authority, Education Facility Rev. (Basis Schools Projects), “A”, 5%, 7/01/2035 (n) | 140,000 | 153,398 | ||
| Phoenix, AZ, Industrial Development Authority, Education Facility Rev. (Basis Schools Projects), “A”, 5%, 7/01/2045 (n) | 570,000 | 615,742 | ||
| Issuer | Shares/Par | Value ($) | ||
| Municipal Bonds - continued | ||||
| Arizona - continued | ||||
| Phoenix, AZ, Industrial Development Authority, Education Facility Rev. (Basis Schools Projects), “A”, 5%, 7/01/2046 (n) | $ | 340,000 | $ 367,144 | |
| Phoenix, AZ, Industrial Development Authority, Education Facility Rev. (Great Hearts Academies Project), “A”, 5%, 7/01/2036 | 700,000 | 773,151 | ||
| Phoenix, AZ, Industrial Development Authority, Education Facility Rev. (Great Hearts Academies Project), “A”, 5%, 7/01/2041 | 560,000 | 613,708 | ||
| Phoenix, AZ, Industrial Development Authority, Education Facility Rev. (Great Hearts Academies Project), “A”, 5%, 7/01/2046 | 895,000 | 975,573 | ||
| Phoenix, AZ, Industrial Development Authority, Education Facility Rev. (Legacy Traditional Schools Project), 5%, 7/01/2035 (n) | 840,000 | 906,367 | ||
| Phoenix, AZ, Industrial Development Authority, Education Facility Rev. (Legacy Traditional Schools Project), 5%, 7/01/2045 (n) | 925,000 | 983,295 | ||
| Phoenix, AZ, Industrial Development Authority, Education Facility Rev. (Legacy Traditional Schools Project), 5%, 7/01/2046 (n) | 610,000 | 662,544 | ||
| Phoenix, AZ, Industrial Development Authority, Solid Waste Disposal Rev. (Republic Services, Inc. Project), 0.18%, 12/01/2035 (Put Date 5/03/2021) | 26,960,000 | 26,960,418 | ||
| Phoenix, AZ, Industrial Development Authority, Student Housing Refunding Rev. (Downtown Phoenix Student Housing II LLC-Arizona State University Project), “A”, 5%, 7/01/2044 | 420,000 | 474,676 | ||
| Phoenix, AZ, Industrial Development Authority, Student Housing Refunding Rev. (Downtown Phoenix Student Housing II LLC-Arizona State University Project), “A”, 5%, 7/01/2049 | 1,030,000 | 1,158,527 | ||
| Phoenix, AZ, Industrial Development Authority, Student Housing Refunding Rev. (Downtown Phoenix Student Housing II LLC-Arizona State University Project), “A”, 5%, 7/01/2059 | 840,000 | 938,384 | ||
| Phoenix, AZ, Industrial Development Authority, Student Housing Refunding Rev. (Downtown Phoenix Student Housing LLC-Arizona State University Project), “A”, 5%, 7/01/2030 | 150,000 | 174,577 | ||
| Phoenix, AZ, Industrial Development Authority, Student Housing Refunding Rev. (Downtown Phoenix Student Housing LLC-Arizona State University Project), “A”, 5%, 7/01/2031 | 530,000 | 614,177 | ||
| Issuer | Shares/Par | Value ($) | ||
| Municipal Bonds - continued | ||||
| Arizona - continued | ||||
| Phoenix, AZ, Industrial Development Authority, Student Housing Refunding Rev. (Downtown Phoenix Student Housing LLC-Arizona State University Project), “A”, 5%, 7/01/2033 | $ | 285,000 | $ 327,021 | |
| Phoenix, AZ, Industrial Development Authority, Student Housing Refunding Rev. (Downtown Phoenix Student Housing LLC-Arizona State University Project), “A”, 5%, 7/01/2037 | 500,000 | 567,396 | ||
| Phoenix, AZ, Industrial Development Authority, Student Housing Refunding Rev. (Downtown Phoenix Student Housing LLC-Arizona State University Project), “A”, 5%, 7/01/2042 | 605,000 | 678,149 | ||
| Pima County, AZ, Industrial Development Authority Education Facility Rev. (American Leadership Academy Project), 4.75%, 6/15/2037 (n) | 1,075,000 | 1,092,302 | ||
| Pima County, AZ, Industrial Development Authority Education Facility Rev. (American Leadership Academy Project), 5%, 6/15/2047 (n) | 1,020,000 | 1,036,735 | ||
| Pima County, AZ, Industrial Development Authority Education Facility Rev. (American Leadership Academy Project), 5%, 6/15/2052 (n) | 550,000 | 558,701 | ||
| Salt River, AZ, Agricultural Improvement & Power District, “A”, 5%, 1/01/2038 | 8,000,000 | 9,618,273 | ||
| Yavapai County, AZ, Industrial Development Authority Rev. (Waste Management, Inc.), “A-2”, 2.2%, 3/01/2028 (Put Date 6/03/2024) | 2,150,000 | 2,255,475 | ||
| $122,922,129 | ||||
| Arkansas - 0.6% | ||||
| Arkansas Development Finance Authority, Charter School Capital Improvement Rev. (LISA Academy Project), 4%, 7/01/2028 | $ | 215,000 | $ 221,878 | |
| Arkansas Development Finance Authority, Charter School Capital Improvement Rev. (LISA Academy Project), 4.5%, 7/01/2033 | 435,000 | 450,157 | ||
| Arkansas Development Finance Authority, Charter School Capital Improvement Rev. (LISA Academy Project), 4.5%, 7/01/2039 | 45,000 | 46,331 | ||
| Arkansas Development Finance Authority, Health Care Rev. (Baptist Health), 5%, 12/01/2047 | 905,000 | 1,097,864 | ||
| Arkansas Development Finance Authority, Health Care Rev. (Baptist Memorial Health Care Corp.), “B-1”, 5%, 9/01/2026 | 4,465,000 | 5,385,815 | ||
| Issuer | Shares/Par | Value ($) | ||
| Municipal Bonds - continued | ||||
| Arkansas - continued | ||||
| Arkansas Development Finance Authority, Health Care Rev. (Baptist Memorial Health Care Corp.), “B-1”, 5%, 9/01/2027 | $ | 4,690,000 | $ 5,788,807 | |
| Arkansas Development Finance Authority, Health Care Rev. (Baptist Memorial Health Care Corp.), “B-1”, 5%, 9/01/2028 | 2,025,000 | 2,548,730 | ||
| Arkansas Development Finance Authority, Health Care Rev. (Baptist Memorial Health Care Corp.), “B-1”, 5%, 9/01/2029 | 1,725,000 | 2,200,026 | ||
| Arkansas Development Finance Authority, Health Care Rev. (Baptist Memorial Health Care Corp.), “B-1”, 5%, 9/01/2036 | 870,000 | 1,087,667 | ||
| Arkansas Development Finance Authority, Health Care Rev. (Baptist Memorial Health Care Corp.), “B-1”, 5%, 9/01/2037 | 605,000 | 753,772 | ||
| Arkansas Development Finance Authority, Health Care Rev. (Baptist Memorial Health Care Corp.), “B-1”, 5%, 9/01/2038 | 1,320,000 | 1,639,636 | ||
| Arkansas Development Finance Authority, Health Care Rev. (Baptist Memorial Health Care Corp.), “B-1”, 5%, 9/01/2039 | 480,000 | 594,601 | ||
| Arkansas Development Finance Authority, Health Care Rev. (Baptist Memorial Health Care Corp.), “B-1”, 5%, 9/01/2040 | 530,000 | 654,832 | ||
| Arkansas Development Finance Authority, Health Care Rev. (Baptist Memorial Health Care Corp.), “B-1”, 5%, 9/01/2044 | 1,815,000 | 2,217,955 | ||
| Arkansas Development Finance Authority, Health Care Rev. (Baptist Memorial Health Care Corp.), “B-2”, 5%, 9/01/2044 (Put Date 9/01/2027) | 1,500,000 | 1,795,207 | ||
| Arkansas Development Finance Authority, Hospital Rev. (Washington Regional Medical Center), 5%, 2/01/2038 | 1,665,000 | 1,955,281 | ||
| Arkansas Development Finance Authority, Hospital Rev. (Washington Regional Medical Center), “A”, 5%, 2/01/2035 | 435,000 | 481,131 | ||
| Arkansas Development Finance Authority, Tobacco Settlement Rev. (Cancer Research Center Project), Capital Appreciation, AAC, 0%, 7/01/2046 | 4,995,000 | 2,236,388 | ||
| Pulaski County, AR, Public Facilities Board, Healthcare Rev. (Baptist Health), 5%, 12/01/2042 | 1,520,000 | 1,695,426 | ||
| $32,851,504 | ||||
| California - 9.0% | ||||
| San Diego County, CA, Regional Transportation Commission Sales Tax Rev., “A”, 5%, 10/01/2022 | $ | 8,335,000 | $ 8,929,490 | |
| Alameda, CA, Corridor Transportation Authority Senior Lien Rev., “A”, AGM, 5%, 10/01/2028 | 985,000 | 1,089,242 | ||
| California Community College Financing Authority Lease Rev. (West Valley Mission Community College), “C”, ETM, 5%, 6/01/2025 | 3,960,000 | 4,695,543 | ||
| California Community College Financing Authority Lease Rev. (West Valley Mission Community College), “C”, ETM, 5%, 6/01/2026 | 4,145,000 | 5,071,840 | ||
| Issuer | Shares/Par | Value ($) | ||
| Municipal Bonds - continued | ||||
| California - continued | ||||
| California County Tobacco Securitization Agency Settlement (Los Angeles County Securitization Corp.), “A”, 5%, 6/01/2032 | $ | 140,000 | $ 182,557 | |
| California County Tobacco Securitization Agency Settlement (Los Angeles County Securitization Corp.), “A”, 4%, 6/01/2035 | 190,000 | 228,604 | ||
| California County Tobacco Securitization Agency Settlement (Los Angeles County Securitization Corp.), “A”, 4%, 6/01/2037 | 305,000 | 363,864 | ||
| California County Tobacco Securitization Agency Settlement (Los Angeles County Securitization Corp.), “A”, 4%, 6/01/2038 | 130,000 | ��� 154,600 | ||
| California County Tobacco Securitization Agency Settlement (Los Angeles County Securitization Corp.), “A”, 4%, 6/01/2039 | 165,000 | 195,653 | ||
| California Health Facilities Financing Authority Rev. (Sutter Health), “A”, 5%, 11/15/2046 (Prerefunded 11/15/2025) | 2,530,000 | 3,048,316 | ||
| California Health Facilities Financing Authority Rev. (Sutter Health), “D”, 5.25%, 8/15/2031 (Prerefunded 8/15/2021) | 5,000,000 | 5,092,754 | ||
| California Housing Finance Agency Municipal Certificates, “A”, 4%, 3/20/2033 | 5,118,251 | 5,932,520 | ||
| California Housing Finance Agency Municipal Certificates, “X”, 0.796%, 11/20/2035 (i) | 70,739,495 | 4,851,675 | ||
| California Infrastructure & Economic Development Bank Refunding Rev. (Los Angeles County Museum of Art Project), “A”, 1.2%, 12/01/2050 (Put Date 6/01/2028) | 7,940,000 | 7,827,302 | ||
| California Infrastructure & Economic Development Bank Refunding Rev. (Los Angeles County Museum of Art Project), “B”, FLR, 0.75% (MUNIPSA + 0.70%), 12/01/2050 (Put Date 6/01/2026) | 2,500,000 | 2,521,106 | ||
| California M-S-R Energy Authority Gas Rev., “A”, 7%, 11/01/2034 | 595,000 | 924,914 | ||
| California Municipal Finance Authority Rev. (Channing House Project), “B”, 5%, 5/15/2047 | 1,500,000 | 1,773,991 | ||
| California Municipal Finance Authority Rev. (Community Medical Centers), “A”, 5%, 2/01/2042 | 1,750,000 | 2,008,255 | ||
| California Municipal Finance Authority Rev. (NorthBay Healthcare Group), “A”, 5.25%, 11/01/2036 | 1,510,000 | 1,736,737 | ||
| California Municipal Finance Authority Rev. (NorthBay Healthcare Group), “A”, 5.25%, 11/01/2041 | 4,890,000 | 5,572,102 | ||
| California Municipal Finance Authority Rev. (NorthBay Healthcare Group), “A”, 5.25%, 11/01/2047 | 235,000 | 265,771 | ||
| California Municipal Finance Authority Rev. (William Jessup University), 5%, 8/01/2039 | 2,150,000 | 2,372,827 | ||
| California Municipal Finance Authority, Solid Waste Disposal Rev. (Waste Management, Inc. Project), “A”, 2.4%, 10/01/2044 (Put Date 10/01/2029) | 4,280,000 | 4,650,396 | ||
| Issuer | Shares/Par | Value ($) | ||
| Municipal Bonds - continued | ||||
| California - continued | ||||
| California Municipal Finance Authority, Solid Waste Disposal Rev. (Waste Management, Inc. Project), “A”, 0.7%, 12/01/2044 (Put Date 12/01/2023) | $ | 3,000,000 | $ 3,025,339 | |
| California Pollution Control Financing Authority, Solid Waste Disposal Rev. (Republic Services, Inc. Project), “A-1”, 0.2%, 11/01/2042 (Put Date 4/15/2021) (n) | 3,875,000 | 3,875,075 | ||
| California Pollution Control Financing Authority, Solid Waste Disposal Rev. (Republic Services, Inc. Project), “A-2”, 0.2%, 11/01/2042 (Put Date 4/15/2021) (n) | 2,395,000 | 2,395,046 | ||
| California Pollution Control Financing Authority, Solid Waste Disposal Rev. (Waste Management, Inc.), “A”, 2.5%, 11/01/2038 (Put Date 5/01/2024) | 3,795,000 | 4,017,739 | ||
| California Public Finance Authority Rev. (Henry Mayo Newhall Hospital), 5%, 10/15/2033 | 260,000 | 301,418 | ||
| California Public Finance Authority Rev. (Henry Mayo Newhall Hospital), 5%, 10/15/2037 | 510,000 | 584,251 | ||
| California Public Finance Authority Rev. (Henry Mayo Newhall Hospital), 5%, 10/15/2047 | 510,000 | 576,226 | ||
| California Public Finance Authority Rev. (Henry Mayo Newhall Hospital), “A”, 4%, 10/15/2026 | 415,000 | 475,558 | ||
| California Public Finance Authority Rev. (Henry Mayo Newhall Hospital), “A”, 4%, 10/15/2027 | 400,000 | 464,215 | ||
| California Public Finance Authority Rev. (Henry Mayo Newhall Hospital), “A”, 4%, 10/15/2028 | 360,000 | 421,088 | ||
| California Public Works Board Lease Rev. (Various Capital Projects), “A”, 5%, 8/01/2029 (w) | 5,000,000 | 6,146,346 | ||
| California Public Works Board Lease Rev. (Various Capital Projects), “A”, 5%, 8/01/2030 (w) | 9,000,000 | 11,215,830 | ||
| California Public Works Board Lease Rev. (Various Capital Projects), “A”, 5%, 2/01/2031 (w) | 7,845,000 | 10,177,833 | ||
| California Public Works Board Lease Rev. (Various Capital Projects), “A”, 5%, 2/01/2032 (w) | 8,055,000 | 10,644,012 | ||
| California Public Works Board Lease Rev. (Various Capital Projects), “I”, 5%, 11/01/2038 | 9,180,000 | 10,227,555 | ||
| California Public Works Board Lease Rev., Department of Corrections and Rehabilitation (Various Correctional Facilities), “A”, 5%, 9/01/2033 | 9,250,000 | 10,585,743 | ||
| California School Finance Authority, School Facility Rev. (Alliance for College-Ready Public Schools Projects), “A”, 4%, 7/01/2024 (n) | 560,000 | 618,943 | ||
| California School Finance Authority, School Facility Rev. (Alliance for College-Ready Public Schools Projects), “A”, 4%, 7/01/2025 (n) | 585,000 | 659,719 | ||
| Issuer | Shares/Par | Value ($) | ||
| Municipal Bonds - continued | ||||
| California - continued | ||||
| California School Finance Authority, School Facility Rev. (Alliance for College-Ready Public Schools Projects), “A”, 5%, 7/01/2030 (n) | $ | 505,000 | $ 576,637 | |
| California School Finance Authority, School Facility Rev. (Alliance for College-Ready Public Schools Projects), “A”, 5%, 7/01/2045 (n) | 1,340,000 | 1,497,406 | ||
| California Statewide Communities Development Authority Insured Rev. (Viamonte Senior Living 1 Project), “A”, 3.5%, 7/01/2034 | 795,000 | 876,171 | ||
| California Statewide Communities Development Authority Rev. (Adventist Health System/West), “A”, 5%, 3/01/2034 | 1,000,000 | 1,223,889 | ||
| California Statewide Communities Development Authority Rev. (Adventist Health System/West), “A”, 5%, 3/01/2035 | 1,475,000 | 1,801,596 | ||
| California Statewide Communities Development Authority Rev. (California Baptist University), “A”, 3%, 11/01/2022 (n) | 725,000 | 736,843 | ||
| California Statewide Communities Development Authority Rev. (California Baptist University), “A”, 3.5%, 11/01/2027 (n) | 3,930,000 | 4,244,387 | ||
| California Statewide Communities Development Authority Rev. (California Baptist University), “A”, 5%, 11/01/2032 (n) | 485,000 | 562,519 | ||
| California Statewide Communities Development Authority Rev. (California Baptist University), “A”, 5%, 11/01/2041 (n) | 955,000 | 1,084,600 | ||
| California Statewide Communities Development Authority Rev. (Lancer Plaza Project), 5.125%, 11/01/2023 | 55,000 | 57,948 | ||
| California Statewide Communities Development Authority Rev. (Lancer Plaza Project), 5.625%, 11/01/2033 | 190,000 | 205,044 | ||
| California Statewide Communities Development Authority Rev. (Loma Linda University Medical Center), “A”, 5.25%, 12/01/2034 | 645,000 | 727,957 | ||
| California Statewide Communities Development Authority Rev. (Loma Linda University Medical Center), “A”, 5.25%, 12/01/2044 | 2,645,000 | 2,929,415 | ||
| California Statewide Communities Development Authority Rev. (Loma Linda University Medical Center), “A”, 5%, 12/01/2046 (n) | 5,455,000 | 6,079,506 | ||
| California Statewide Communities Development Authority Rev. (Loma Linda University Medical Center), “A”, 5.25%, 12/01/2056 (n) | 990,000 | 1,108,726 | ||
| California Statewide Communities Development Authority Rev. (Loma Linda University Medical Center), “A”, 5.5%, 12/01/2058 | 7,400,000 | 8,692,863 | ||
| California Statewide Communities Development Authority, College Housing Rev. (NCCD-Hooper Street LLC College of the Arts Project), 5%, 7/01/2029 (n) | 620,000 | 644,878 | ||
| Issuer | Shares/Par | Value ($) | ||
| Municipal Bonds - continued | ||||
| California - continued | ||||
| California Statewide Communities Development Authority, College Housing Rev. (NCCD-Hooper Street LLC College of the Arts Project), 5.25%, 7/01/2039 (n) | $ | 475,000 | $ 492,303 | |
| California Statewide Communities Development Authority, College Housing Rev. (NCCD-Hooper Street LLC College of the Arts Project), 5.25%, 7/01/2049 (n) | 1,795,000 | 1,838,372 | ||
| California Statewide Communities Development Authority, College Housing Rev. (NCCD-Hooper Street LLC College of the Arts Project), 5.25%, 7/01/2052 (n) | 780,000 | 798,847 | ||
| California Statewide Communities Development Authority, Essential Housing Rev. (Jefferson-Anaheim), “A-2”, 3.125%, 8/01/2056 (n) | 3,920,000 | 3,618,543 | ||
| CSCDA Community Improvement Authority, California Essential Housing Rev. (Renaissance at City Center), “A”, 5%, 7/01/2051 (n) | 2,297,637 | 2,649,652 | ||
| Escondido, CA, Union High School District (Election of 2008), Capital Appreciation, “A”, AGM, 0%, 8/01/2030 | 4,495,000 | 3,804,735 | ||
| Escondido, CA, Union High School District (Election of 2008), Capital Appreciation, “A”, AGM, 0%, 8/01/2031 | 4,015,000 | 3,298,544 | ||
| Escondido, CA, Union High School District (Election of 2008), Capital Appreciation, “A”, AGM, 0%, 8/01/2033 | 2,785,000 | 2,156,832 | ||
| Foothill-De Anza, CA, Community College District, Capital Appreciation, NPFG, 0%, 8/01/2034 | 21,410,000 | 16,464,044 | ||
| Golden State, CA, Tobacco Securitization Corp., Tobacco Settlement Rev., “A”, 5%, 6/01/2034 | 3,000,000 | 3,506,418 | ||
| Golden State, CA, Tobacco Securitization Corp., Tobacco Settlement Rev., “A”, 3.5%, 6/01/2036 | 2,070,000 | 2,107,374 | ||
| Golden State, CA, Tobacco Securitization Corp., Tobacco Settlement Rev., “A”, 5.25%, 6/01/2047 | 880,000 | 913,205 | ||
| Hastings Campus Housing Finance Authority Rev., “A”, 5%, 7/01/2061 (n) | 8,590,000 | 9,693,237 | ||
| Hastings Campus Housing Finance Authority Rev., Convertible Capital Appreciation, “B”, 0% to 7/01/2035, 6.75% to 7/01/2061 (n) | 12,210,000 | 6,542,354 | ||
| Inland Valley, CA, Development Successor Agency Tax Allocation, “A”, AGM, 5%, 9/01/2044 | 2,620,000 | 2,913,415 | ||
| La Verne, CA, Brethren Hillcrest Homes, COP, 5%, 5/15/2036 (Prerefunded 5/15/2022) | 640,000 | 680,612 | ||
| Long Beach, CA, Marina Rev. (Alamitos Bay Marina Project), 5%, 5/15/2035 | 480,000 | 535,371 | ||
| Los Angeles County, CA, Regional Financing Authority Rev. (Montecedro, Inc. Project), “A”, CALHF, 5%, 11/15/2034 | 480,000 | 509,801 | ||
| Issuer | Shares/Par | Value ($) | ||
| Municipal Bonds - continued | ||||
| California - continued | ||||
| Los Angeles County, CA, Regional Financing Authority Rev. (Montecedro, Inc. Project), “A”, CALHF, 5%, 11/15/2044 | $ | 820,000 | $ 866,559 | |
| Los Angeles, CA, Department of Airports Refunding Rev. (Los Angeles International), “A”, 5%, 5/15/2033 | 1,315,000 | 1,715,990 | ||
| Los Angeles, CA, Department of Airports Refunding Rev. (Los Angeles International), “A”, 5%, 5/15/2034 | 1,370,000 | 1,780,243 | ||
| Los Angeles, CA, Department of Airports Refunding Rev. (Los Angeles International), “A”, 5%, 5/15/2035 | 2,160,000 | 2,796,633 | ||
| Los Angeles, CA, Department of Airports Refunding Rev. (Los Angeles International), “A”, 5%, 5/15/2036 | 1,710,000 | 2,205,371 | ||
| Los Angeles, CA, Department of Airports Refunding Rev. (Los Angeles International), “A”, 5%, 5/15/2037 | 2,210,000 | 2,839,120 | ||
| Los Angeles, CA, Department of Airports Refunding Rev. (Los Angeles International), “A”, 5%, 5/15/2038 | 1,870,000 | 2,392,693 | ||
| Los Angeles, CA, Department of Airports Refunding Rev. (Los Angeles International), “A”, 5%, 5/15/2039 | 2,010,000 | 2,561,610 | ||
| Los Angeles, CA, Department of Airports Refunding Rev. (Los Angeles International), “A”, 5%, 5/15/2040 | 2,100,000 | 2,667,314 | ||
| Los Angeles, CA, Department of Airports Refunding Rev. (Los Angeles International), “A”, 5%, 5/15/2041 | 2,255,000 | 2,854,931 | ||
| Los Angeles, CA, Department of Airports Rev. (Los Angeles International), “A”, 5%, 5/15/2028 | 1,000,000 | 1,194,763 | ||
| Los Angeles, CA, Department of Airports Rev. (Los Angeles International), “A”, 5%, 5/15/2034 | 465,000 | 567,547 | ||
| Los Angeles, CA, Department of Airports Rev. (Los Angeles International), “A”, 5%, 5/15/2036 | 825,000 | 1,001,941 | ||
| Los Angeles, CA, Department of Airports Rev. (Los Angeles International), “A”, 5%, 5/15/2037 | 1,030,000 | 1,247,295 | ||
| Los Angeles, CA, Department of Airports Rev. (Los Angeles International), “A”, 5.25%, 5/15/2038 | 1,770,000 | 2,178,277 | ||
| Los Angeles, CA, Department of Airports Rev. (Los Angeles International), “A”, 5%, 5/15/2044 | 3,605,000 | 4,298,949 | ||
| Los Angeles, CA, Department of Water & Power Water System Rev., “A”, 5%, 7/01/2038 | 4,040,000 | 4,778,111 | ||
| Los Angeles, CA, Department of Water & Power Water System Rev., “A”, 5%, 7/01/2041 | 6,435,000 | 7,587,806 | ||
| Merced, CA, Union High School District, Capital Appreciation, “A”, AGM, 0%, 8/01/2030 | 580,000 | 492,751 | ||
| Montebello, CA, Public Financing Authority Lease Rev. (Montebello Home2 Suites by Hilton Hotel Project), “A”, 5%, 6/01/2041 | 6,500,000 | 7,006,303 | ||
| Issuer | Shares/Par | Value ($) | ||
| Municipal Bonds - continued | ||||
| California - continued | ||||
| Montebello, CA, Public Financing Authority Lease Rev. (Montebello Home2 Suites by Hilton Hotel Project), “A”, 5%, 6/01/2046 | $ | 2,000,000 | $ 2,145,776 | |
| Mount San Antonio, CA, Community College District Rev. (Election of 2008), Convertible Capital Appreciation, “A”, 0% to 8/01/2023, 5.875% to 8/01/2028 | 1,860,000 | 2,178,612 | ||
| Oceanside, CA, Unified School District, Capital Appreciation, AGM, 0%, 8/01/2030 | 4,335,000 | 3,703,372 | ||
| Oceanside, CA, Unified School District, Capital Appreciation, “A”, AGM, 0%, 8/01/2027 | 1,735,000 | 1,610,710 | ||
| Oceanside, CA, Unified School District, Capital Appreciation, “A”, AGM, 0%, 8/01/2029 | 3,520,000 | 3,098,052 | ||
| Oceanside, CA, Unified School District, Capital Appreciation, “A”, ETM, AGM, 0%, 8/01/2027 | 195,000 | 182,967 | ||
| Oceanside, CA, Unified School District, Capital Appreciation, “A”, ETM, AGM, 0%, 8/01/2029 | 395,000 | 354,034 | ||
| Oceanside, CA, Unified School District, Capital Appreciation, ETM, AGM, 0%, 8/01/2024 | 350,000 | 344,241 | ||
| Oxnard, CA, Financing Authority, Wastewater Rev., AGM, 5%, 6/01/2030 | 1,640,000 | 1,850,662 | ||
| Port of Oakland, CA, Intermediate Lien Refunding Rev., “H”, 5%, 5/01/2024 | 1,700,000 | 1,919,982 | ||
| Port of Oakland, CA, Intermediate Lien Refunding Rev., “H”, 5%, 5/01/2025 | 4,800,000 | 5,590,499 | ||
| Port of Oakland, CA, Intermediate Lien Refunding Rev., “H”, 5%, 5/01/2026 | 2,750,000 | 3,293,743 | ||
| Port of Oakland, CA, Intermediate Lien Refunding Rev., “H”, 5%, 5/01/2027 | 2,750,000 | 3,368,101 | ||
| Port of Oakland, CA, Intermediate Lien Refunding Rev., “H”, 5%, 5/01/2028 | 875,000 | 1,089,177 | ||
| Port of Oakland, CA, Rev., “P”, 5%, 5/01/2033 | 10,815,000 | 11,272,557 | ||
| Riverside County, CA, Transportation Commission Sales Tax Rev. (Limited Tax), “A”, 2%, 6/01/2029 | 2,015,000 | 2,053,456 | ||
| Riverside County, CA, Transportation Commission Sales Tax Rev. (Limited Tax), “A”, 5.25%, 6/01/2039 (Prerefunded 6/01/2023) | 4,655,000 | 5,161,435 | ||
| Sacramento County, CA, Airport System Rev., “A”, 5%, 7/01/2041 | 10,000,000 | 11,809,342 | ||
| Sacramento County, CA, Airport System Rev., “B”, 5%, 7/01/2041 | 6,000,000 | 7,085,605 | ||
| Sacramento, CA, Municipal Utility District Electric Rev., “X”, 5%, 8/15/2028 (Prerefunded 8/15/2021) | 835,000 | 849,582 | ||
| Issuer | Shares/Par | Value ($) | ||
| Municipal Bonds - continued | ||||
| California - continued | ||||
| Sacramento, CA, Municipal Utility District Electric Rev., “X”, 5%, 8/15/2028 | $ | 2,435,000 | $ 2,476,831 | |
| San Diego County, CA, Regional Airport Authority Rev., “B”, 5%, 7/01/2024 | 500,000 | 551,623 | ||
| San Diego County, CA, Regional Airport Authority Rev., “B”, 5%, 7/01/2025 | 1,500,000 | 1,653,447 | ||
| San Diego County, CA, Regional Transportation Commission Sales Tax Rev., “A”, 3%, 10/01/2022 | 8,335,000 | 8,681,785 | ||
| San Francisco, CA, City & County Airports Commission, International Airport Rev., “A”, 5%, 5/01/2028 | 6,000,000 | 6,299,607 | ||
| San Francisco, CA, City & County Airports Commission, International Airport Rev., “A”, 5%, 1/01/2047 | 1,230,000 | 1,467,753 | ||
| San Francisco, CA, City & County Airports Commission, International Airport Rev., “E”, 5%, 5/01/2038 | 4,300,000 | 5,278,659 | ||
| San Francisco, CA, City & County Airports Commission, International Airport Rev., “E”, 5%, 5/01/2039 | 4,900,000 | 5,995,288 | ||
| San Francisco, CA, City & County Airports Commission, International Airport Rev., “E”, 5%, 5/01/2040 | 2,285,000 | 2,788,061 | ||
| San Francisco, CA, City & County Redevelopment Successor Agency, Tax Allocation (Mission Bay South Redevelopment Project), “A”, 5%, 8/01/2043 | 340,000 | 375,764 | ||
| San Francisco, CA, Hastings Campus Housing Finance Authority, Campus Housing Rev., “A”, 5%, 7/01/2045 (n) | 6,795,000 | 7,777,920 | ||
| San Jose, CA, Airport Rev., “A-2”, 5.25%, 3/01/2034 | 7,570,000 | 7,572,161 | ||
| San Mateo County, CA, Community College District (Election of 2005), Capital Appreciation, “A”, NPFG, 0%, 9/01/2026 | 5,100,000 | 4,857,363 | ||
| State of California, AGM, 5.25%, 8/01/2032 | 9,160,000 | 12,732,078 | ||
| State of California, Various Purpose General Obligation, 5.25%, 10/01/2028 | 2,965,000 | 3,039,066 | ||
| State of California, Various Purpose General Obligation, 5%, 12/01/2028 | 10,000,000 | 12,979,116 | ||
| State of California, Various Purpose General Obligation, 5%, 12/01/2029 | 2,250,000 | 2,976,627 | ||
| State of California, Various Purpose General Obligation, 5%, 12/01/2031 | 45,000 | 54,569 | ||
| State of California, Various Purpose General Obligation, 5%, 12/01/2032 | 1,750,000 | 2,119,180 | ||
| State of California, Various Purpose General Obligation, 5%, 12/01/2034 | 1,345,000 | 1,618,931 | ||
| State of California, Various Purpose General Obligation, 5%, 4/01/2045 | 9,730,000 | 12,090,402 | ||
| State of California, Various Purpose General Obligation Refunding, 5%, 4/01/2024 | 4,365,000 | 4,571,139 | ||
| Issuer | Shares/Par | Value ($) | ||
| Municipal Bonds - continued | ||||
| California - continued | ||||
| State of California, Various Purpose General Obligation Refunding, 5%, 8/01/2029 | $ | 5,000,000 | $ 6,114,338 | |
| State of California, Various Purpose General Obligation Refunding, 5%, 12/01/2030 | 500,000 | 672,163 | ||
| State of California, Various Purpose General Obligation Refunding, 5%, 4/01/2031 | 3,180,000 | 4,298,476 | ||
| State of California, Various Purpose General Obligation Refunding, 5%, 9/01/2034 | 9,000,000 | 10,924,657 | ||
| Transbay Joint Powers Authority, CA, Senior Tax Allocation, “A”, 5%, 10/01/2045 | 950,000 | 1,162,126 | ||
| Transbay Joint Powers Authority, CA, Senior Tax Allocation, “A”, 5%, 10/01/2049 | 865,000 | 1,053,576 | ||
| University of California Regents, Limited Project Rev., “S”, 5%, 5/15/2029 (w) | 4,000,000 | 4,956,930 | ||
| University of California Regents, Limited Project Rev., “S”, 5%, 5/15/2030 (w) | 3,000,000 | 3,779,693 | ||
| University of California Regents, Limited Project Rev., “S”, 5%, 5/15/2031 (w) | 3,000,000 | 3,837,646 | ||
| West Contra Costa, CA, Unified School District (Election of 2005), Capital Appreciation, “C”, AGM, 0%, 8/01/2029 | 3,440,000 | 2,997,794 | ||
| $511,226,920 | ||||
| Colorado - 4.5% | ||||
| Arvada, CO, Vauxmont Metropolitan District Rev., AGM, 5%, 12/15/2027 | $ | 57,000 | $ 66,098 | |
| Arvada, CO, Vauxmont Metropolitan District Rev., AGM, 5%, 12/01/2028 | 92,000 | 115,090 | ||
| Arvada, CO, Vauxmont Metropolitan District Rev., AGM, 5%, 12/15/2028 | 55,000 | 63,490 | ||
| Arvada, CO, Vauxmont Metropolitan District Rev., AGM, 5%, 12/01/2029 | 92,000 | 116,836 | ||
| Arvada, CO, Vauxmont Metropolitan District Rev., AGM, 5%, 12/15/2029 | 55,000 | 63,216 | ||
| Arvada, CO, Vauxmont Metropolitan District Rev., AGM, 5%, 12/01/2030 | 96,000 | 121,128 | ||
| Arvada, CO, Vauxmont Metropolitan District Rev., AGM, 5%, 12/15/2030 | 13,000 | 14,897 | ||
| Arvada, CO, Vauxmont Metropolitan District Rev., AGM, 5%, 12/01/2031 | 101,000 | 126,868 | ||
| Arvada, CO, Vauxmont Metropolitan District Rev., AGM, 5%, 12/15/2031 | 59,000 | 67,470 | ||
| Arvada, CO, Vauxmont Metropolitan District Rev., AGM, 5%, 12/01/2032 | 110,000 | 137,608 | ||
| Issuer | Shares/Par | Value ($) | ||
| Municipal Bonds - continued | ||||
| Colorado - continued | ||||
| Arvada, CO, Vauxmont Metropolitan District Rev., AGM, 5%, 12/15/2032 | $ | 70,000 | $ 79,895 | |
| Arvada, CO, Vauxmont Metropolitan District Rev., AGM, 5%, 12/01/2033 | 110,000 | 137,065 | ||
| Arvada, CO, Vauxmont Metropolitan District Rev., AGM, 5%, 12/01/2034 | 125,000 | 155,315 | ||
| Arvada, CO, Vauxmont Metropolitan District Rev., AGM, 5%, 12/01/2035 | 44,000 | 54,505 | ||
| Arvada, CO, Vauxmont Metropolitan District Rev., AGM, 5%, 12/01/2050 | 527,000 | 630,515 | ||
| Colorado Eagle County School District RE50J, Garfield Routt Counties, General Obligation, 5%, 12/01/2034 | 2,535,000 | 3,098,299 | ||
| Colorado Eagle County School District RE50J, Garfield Routt Counties, General Obligation, 5%, 12/01/2035 | 5,000,000 | 6,095,643 | ||
| Colorado Educational & Cultural Facilities Authority Rev. (Classical Academy Project), 5%, 12/01/2031 | 1,725,000 | 1,934,231 | ||
| Colorado Educational & Cultural Facilities Authority Rev. (Classical Academy Project), “A”, 5%, 12/01/2038 | 1,020,000 | 1,131,392 | ||
| Colorado Educational & Cultural Facilities Authority Rev. (Liberty Common Project), 5%, 1/15/2029 | 195,000 | 213,042 | ||
| Colorado Educational & Cultural Facilities Authority Rev. (Liberty Common Project), 5%, 1/15/2039 | 740,000 | 794,930 | ||
| Colorado Educational & Cultural Facilities Authority Rev. (Liberty Common Project), 5%, 1/15/2044 | 605,000 | 646,788 | ||
| Colorado Educational & Cultural Facilities Authority Rev. (Montessori Charter School Project), 5%, 7/15/2037 | 545,000 | 568,547 | ||
| Colorado Educational & Cultural Facilities Authority Rev. (Peak to Peak Charter School Project), 5%, 8/15/2030 | 490,000 | 548,580 | ||
| Colorado Educational & Cultural Facilities Authority Rev. (Peak to Peak Charter School Project), 5%, 8/15/2034 | 495,000 | 550,318 | ||
| Colorado Educational & Cultural Facilities Authority Rev. (Pinnacle Charter School Building Corp.), 5%, 6/01/2029 | 910,000 | 982,346 | ||
| Colorado Educational & Cultural Facilities Authority Rev. (Stargate Charter School Project), “A”, 5%, 12/01/2038 | 1,335,000 | 1,614,449 | ||
| Colorado Educational & Cultural Facilities Authority Rev. (Stargate Charter School Project), “A”, 4%, 12/01/2048 | 3,440,000 | 3,805,413 | ||
| Colorado Educational & Cultural Facilities Authority Rev. (Twin Peaks Charter Academy Project), 5%, 11/15/2031 | 1,855,000 | 2,059,560 | ||
| Colorado Educational & Cultural Facilities Authority Rev. (Union Colony School Project), 5%, 4/01/2038 | 305,000 | 364,692 | ||
| Colorado Educational & Cultural Facilities Authority Rev. (Union Colony School Project), 5%, 4/01/2048 | 365,000 | 429,141 | ||
| Issuer | Shares/Par | Value ($) | ||
| Municipal Bonds - continued | ||||
| Colorado - continued | ||||
| Colorado Educational & Cultural Facilities Authority Rev. (Union Colony School Project), 5%, 4/01/2053 | $ | 385,000 | $ 451,239 | |
| Colorado Educational & Cultural Facilities Authority, Charter School Refunding and Improvement Rev. (American Academy Project), 5%, 12/01/2040 | 3,555,000 | 4,387,976 | ||
| Colorado Educational & Cultural Facilities Authority, Charter School Refunding and Improvement Rev. (American Academy Project), 5%, 12/01/2050 | 18,125,000 | 21,963,233 | ||
| Colorado Educational & Cultural Facilities Authority, Charter School Refunding and Improvement Rev. (American Academy Project), 5%, 12/01/2055 | 1,450,000 | 1,750,127 | ||
| Colorado Educational & Cultural Facilities Authority, Charter School Refunding and Improvement Rev. (Pinnacle Charter School, Inc. Project), “A”, 4%, 12/01/2036 | 1,370,000 | 1,609,186 | ||
| Colorado Educational & Cultural Facilities Authority, Charter School Refunding and Improvement Rev. (Pinnacle Charter School, Inc. Project), “A”, 4%, 12/01/2041 | 1,670,000 | 1,929,884 | ||
| Colorado Educational & Cultural Facilities Authority, Charter School Refunding and Improvement Rev. (Prospect Ridge Academy Project), “A”, 5%, 3/15/2040 | 1,750,000 | 2,170,782 | ||
| Colorado Educational & Cultural Facilities Authority, Charter School Refunding and Improvement Rev. (Prospect Ridge Academy Project), “A”, 5%, 3/15/2050 | 3,590,000 | 4,379,941 | ||
| Colorado Educational & Cultural Facilities Authority, Charter School Refunding and Improvement Rev. (Prospect Ridge Academy Project), “A”, 5%, 3/15/2055 | 5,295,000 | 6,435,848 | ||
| Colorado Educational & Cultural Facilities Authority, Charter School Refunding and Improvement Rev. (Thomas MacLaren State Charter School Project), “A”, 5%, 6/01/2035 | 530,000 | 666,410 | ||
| Colorado Educational & Cultural Facilities Authority, Charter School Refunding and Improvement Rev. (Thomas MacLaren State Charter School Project), “A”, 5%, 6/01/2040 | 785,000 | 971,303 | ||
| Colorado Educational & Cultural Facilities Authority, Charter School Refunding and Improvement Rev. (Thomas MacLaren State Charter School Project), “A”, 5%, 6/01/2050 | 3,225,000 | 3,928,099 | ||
| Colorado Educational & Cultural Facilities Authority, Charter School Refunding Rev. (Windsor Charter Academy Project), 4%, 9/01/2050 | 485,000 | 542,914 | ||
| Colorado Educational & Cultural Facilities Authority, Charter School Refunding Rev. (Windsor Charter Academy Project), 4%, 9/01/2055 | 875,000 | 975,586 | ||
| Colorado Health Facilities Authority Rev. (Adventist System/Sunbelt Obligated Group), “A”, 5%, 11/15/2041 | 10,000,000 | 11,651,311 | ||
| Issuer | Shares/Par | Value ($) | ||
| Municipal Bonds - continued | ||||
| Colorado - continued | ||||
| Colorado Health Facilities Authority Rev. (CommonSpirit Health), “A-2”, 5%, 8/01/2037 | $ | 2,375,000 | $ 2,938,966 | |
| Colorado Health Facilities Authority Rev. (Evangelical Lutheran Good Samaritan Society), 5.625%, 6/01/2043 (Prerefunded 6/01/2023) | 1,195,000 | 1,333,817 | ||
| Colorado Health Facilities Authority Rev. (Sanford Health), “A”, 5%, 11/01/2039 | 9,400,000 | 11,861,542 | ||
| Colorado Health Facilities Authority Rev. (SCL Health System), “A”, 4%, 1/01/2036 | 1,185,000 | 1,397,206 | ||
| Colorado Health Facilities Authority Rev. (SCL Health System), “A”, 4%, 1/01/2037 | 9,250,000 | 10,867,122 | ||
| Colorado Health Facilities Authority Rev. (SCL Health System), “A”, 5%, 1/01/2044 | 4,620,000 | 5,104,924 | ||
| Colorado Health Facilities Authority, Hospital Rev. (AdventHealth Obligated Group), “A”, 4%, 11/15/2038 | 3,200,000 | 3,750,425 | ||
| Colorado Health Facilities Authority, Hospital Rev. (AdventHealth Obligated Group), “A”, 4%, 11/15/2043 | 4,685,000 | 5,419,796 | ||
| Colorado Health Facilities Authority, Hospital Rev. (Boulder Community Health Project), 5%, 10/01/2032 | 1,015,000 | 1,298,263 | ||
| Colorado Health Facilities Authority, Hospital Rev. (Boulder Community Health Project), 5%, 10/01/2033 | 1,000,000 | 1,271,574 | ||
| Colorado Health Facilities Authority, Hospital Rev. (Boulder Community Health Project), 5%, 10/01/2034 | 1,040,000 | 1,315,954 | ||
| Colorado Health Facilities Authority, Hospital Rev. (Boulder Community Health Project), 4%, 10/01/2035 | 760,000 | 883,902 | ||
| Colorado Health Facilities Authority, Hospital Rev. (Boulder Community Health Project), 4%, 10/01/2037 | 450,000 | 519,544 | ||
| Colorado Health Facilities Authority, Hospital Rev. (Boulder Community Health Project), 4%, 10/01/2038 | 350,000 | 402,827 | ||
| Colorado Health Facilities Authority, Hospital Rev. (Boulder Community Health Project), 4%, 10/01/2039 | 350,000 | 401,713 | ||
| Colorado Health Facilities Authority, Hospital Rev. (Boulder Community Health Project), 4%, 10/01/2040 | 300,000 | 343,378 | ||
| Colorado Housing & Finance Authority Rev., “B-1”, GNMA, 4%, 11/01/2048 | 2,160,000 | 2,351,889 | ||
| Colorado Housing & Finance Authority Rev., Single Family Mortgage Class I, “C”, 4.75%, 5/01/2049 (u) | 5,255,000 | 5,887,987 | ||
| Colorado Housing & Finance Authority Rev., Single Family Mortgage Class III, “H”, 4.25%, 11/01/2049 | 6,365,000 | 7,125,805 | ||
| Colorado Housing and Finance Authority, Single Family Mortgage, “B”, GNMA, 3%, 5/01/2051 | 10,745,000 | 11,737,937 | ||
| Issuer | Shares/Par | Value ($) | ||
| Municipal Bonds - continued | ||||
| Colorado - continued | ||||
| Colorado Regional Transportation District, Private Activity Rev. (Denver Transit Partners Eagle P3 Project), “A-B”, 5%, 1/15/2030 | $ | 235,000 | $ 299,155 | |
| Colorado Regional Transportation District, Private Activity Rev. (Denver Transit Partners Eagle P3 Project), “A-B”, 5%, 7/15/2030 | 165,000 | 211,657 | ||
| Colorado Regional Transportation District, Private Activity Rev. (Denver Transit Partners Eagle P3 Project), “A-B”, 5%, 1/15/2031 | 285,000 | 368,512 | ||
| Colorado Regional Transportation District, Private Activity Rev. (Denver Transit Partners Eagle P3 Project), “A-B”, 5%, 7/15/2031 | 235,000 | 303,092 | ||
| Colorado Regional Transportation District, Private Activity Rev. (Denver Transit Partners Eagle P3 Project), “A-B”, 5%, 1/15/2032 | 380,000 | 488,997 | ||
| Colorado Regional Transportation District, Private Activity Rev. (Denver Transit Partners Eagle P3 Project), “A-B”, 5%, 7/15/2032 | 380,000 | 487,889 | ||
| Colorado Regional Transportation District, Private Activity Rev. (Denver Transit Partners Eagle P3 Project), “A-B”, 4%, 1/15/2033 | 355,000 | 423,133 | ||
| Colorado Regional Transportation District, Private Activity Rev. (Denver Transit Partners Eagle P3 Project), “A-B”, 4%, 7/15/2033 | 355,000 | 429,673 | ||
| Colorado Regional Transportation District, Private Activity Rev. (Denver Transit Partners Eagle P3 Project), “A-B”, 4%, 7/15/2034 | 710,000 | 841,058 | ||
| Colorado Regional Transportation District, Private Activity Rev. (Denver Transit Partners Eagle P3 Project), “A-B”, 4%, 7/15/2036 | 590,000 | 692,940 | ||
| Colorado Regional Transportation District, Private Activity Rev. (Denver Transit Partners Eagle P3 Project), “A-B”, 4%, 7/15/2038 | 425,000 | 495,282 | ||
| Colorado Regional Transportation District, Sales Tax Rev. (Fastracks Project), “A”, 5%, 11/01/2036 | 2,755,000 | 3,300,496 | ||
| Colorado Regional Transportation District, Sales Tax Rev. (Fastracks Project), “A”, 5%, 11/01/2040 | 10,000,000 | 11,891,171 | ||
| Colorado State University Board of Governors, System Enterprise Rev., “B”, 5%, 3/01/2025 | 3,000,000 | 3,509,487 | ||
| Colorado State University Board of Governors, System Enterprise Rev., “B”, 5%, 3/01/2041 | 1,500,000 | 1,792,646 | ||
| Denver, CO, City & County Airport Systems Rev., “A”, 5%, 11/15/2028 (Prerefunded 11/15/2022) | 1,930,000 | 2,076,653 | ||
| Issuer | Shares/Par | Value ($) | ||
| Municipal Bonds - continued | ||||
| Colorado - continued | ||||
| Denver, CO, City & County School District No. 1, 5%, 12/01/2024 (Prerefunded 12/01/2021) | $ | 10,000,000 | $ 10,321,698 | |
| Denver, CO, City & County School District No. 1, 5%, 12/01/2033 | 5,000,000 | 6,645,224 | ||
| Denver, CO, City & County School District No. 1, 5%, 12/01/2034 | 8,750,000 | 11,592,756 | ||
| Denver, CO, City & County School District No. 1, 4%, 12/01/2035 | 3,750,000 | 4,614,632 | ||
| Denver, CO, Convention Center Hotel Authority Rev., 5%, 12/01/2035 | 965,000 | 1,102,725 | ||
| Denver, CO, Convention Center Hotel Authority Rev., 5%, 12/01/2040 | 1,635,000 | 1,848,166 | ||
| Denver, CO, Health & Hospital Authority Rev., “A”, 4%, 12/01/2038 | 785,000 | 894,919 | ||
| Denver, CO, Health & Hospital Authority Rev., “A”, 5.25%, 12/01/2045 | 1,210,000 | 1,305,437 | ||
| E-470 Public Highway Authority Rev., CO, “A”, 5%, 9/01/2040 | 930,000 | 1,040,219 | ||
| Park Creek Metropolitan District, CO, Senior Limited Property Tax Supported Rev., “A”, NPFG, 5%, 12/01/2030 | 1,470,000 | 1,767,898 | ||
| Park Creek Metropolitan District, CO, Senior Limited Property Tax Supported Rev., “A”, NPFG, 5%, 12/01/2031 | 1,660,000 | 1,989,381 | ||
| Park Creek Metropolitan District, CO, Senior Limited Property Tax Supported Rev., “A”, NPFG, 5%, 12/01/2032 | 1,755,000 | 2,096,893 | ||
| Park Creek Metropolitan District, CO, Senior Limited Property Tax Supported Rev., “A”, NPFG, 5%, 12/01/2033 | 1,760,000 | 2,096,534 | ||
| Park Creek Metropolitan District, CO, Senior Limited Property Tax Supported Rev., “A”, NPFG, 5%, 12/01/2034 | 1,445,000 | 1,717,845 | ||
| Park Creek Metropolitan District, CO, Senior Limited Property Tax Supported Rev., “A”, NPFG, 5%, 12/01/2035 | 1,630,000 | 1,932,916 | ||
| Park Creek Metropolitan District, CO, Senior Limited Property Tax Supported Rev., “A”, NPFG, 5%, 12/01/2045 | 5,280,000 | 6,008,236 | ||
| Public Authority for Colorado Energy Natural Gas Purchase Rev., 6.25%, 11/15/2028 | 1,215,000 | 1,520,208 | ||
| University of Colorado, Enterprise Rev., 5%, 6/01/2029 (Prerefunded 6/01/2021) | 4,220,000 | 4,252,217 | ||
| $257,175,522 | ||||
| Issuer | Shares/Par | Value ($) | ||
| Municipal Bonds - continued | ||||
| Connecticut - 0.9% | ||||
| Connecticut Health & Educational Facilities Authority Rev. (Masonicare), “F”, 5%, 7/01/2025 | $ | 2,990,000 | $ 3,350,142 | |
| Connecticut Health & Educational Facilities Authority Rev. (Masonicare), “F”, 5%, 7/01/2043 | 4,230,000 | 4,624,248 | ||
| Connecticut Health & Educational Facilities Authority Rev. (McLean Issue), “B-2”, 2.75%, 1/01/2026 (n) | 310,000 | 312,522 | ||
| Connecticut Housing Finance Authority Rev. (Housing Mortgage Finance Program), “B-2”, 4%, 11/15/2032 | 335,000 | 340,732 | ||
| Connecticut Housing Finance Authority Rev. (Housing Mortgage Finance Program), “C-1”, 3.5%, 11/15/2045 | 1,230,000 | 1,289,685 | ||
| Connecticut Housing Finance Authority Rev. (Housing Mortgage Finance Program), “D-1”, 4%, 11/15/2044 | 420,000 | 429,799 | ||
| Hartford County, CT, Metropolitan District, “C”, AGM, 5%, 11/01/2028 | 4,290,000 | 5,227,068 | ||
| Hartford County, CT, Metropolitan District, “C”, AGM, 5%, 11/01/2029 | 2,375,000 | 2,875,109 | ||
| Hartford County, CT, Metropolitan District, “C”, AGM, 5%, 11/01/2030 | 2,355,000 | 2,838,167 | ||
| Hartford County, CT, Metropolitan District, “C”, AGM, 5%, 11/01/2031 | 2,015,000 | 2,419,977 | ||
| Mohegan Tribal Finance Authority, CT, Economic Development Bonds, 7%, 2/01/2045 (n) | 8,245,000 | 8,450,255 | ||
| New Haven, CT, General Obligation, “A”, AGM, 5%, 8/15/2032 | 1,000,000 | 1,180,842 | ||
| State of Connecticut, Special Tax Obligation Rev., “A”, 5%, 12/01/2028 | 4,595,000 | 4,734,866 | ||
| State of Connecticut, Special Tax Obligation Rev., “A”, 5%, 12/01/2029 | 4,595,000 | 4,733,629 | ||
| State of Connecticut, Special Tax Obligation Rev., “A”, 5%, 12/01/2030 | 4,615,000 | 4,753,611 | ||
| West Haven, CT, General Obligation , BAM, 4%, 3/15/2035 | 925,000 | 1,051,347 | ||
| West Haven, CT, General Obligation , BAM, 4%, 3/15/2040 | 750,000 | 839,364 | ||
| $49,451,363 | ||||
| Delaware - 0.1% | ||||
| Delaware Economic Development Authority Rev. (Newark Charter School, Inc.), “A”, 5%, 9/01/2036 | $ | 235,000 | $ 265,034 | |
| Delaware Economic Development Authority Rev. (Newark Charter School, Inc.), “A”, 5%, 9/01/2046 | 475,000 | 526,376 | ||
| Delaware Economic Development Authority, Exempt Facility Refunding Rev. (NRG Energy Project), “A”, 1.25%, 10/01/2045 (Put Date 10/01/2025) | 5,600,000 | 5,572,489 | ||
| $6,363,899 | ||||
| Issuer | Shares/Par | Value ($) | ||
| Municipal Bonds - continued | ||||
| District of Columbia - 0.2% | ||||
| District of Columbia Rev. (Kipp D.C. Charter School), “A”, 6%, 7/01/2043 (Prerefunded 7/01/2023) | $ | 1,450,000 | $ 1,635,674 | |
| District of Columbia Student Dormitory Rev. (Provident Group - Howard Properties LLC), 5%, 10/01/2030 | 3,435,000 | 3,441,805 | ||
| District of Columbia Student Dormitory Rev. (Provident Group - Howard Properties LLC), 5%, 10/01/2035 | 4,505,000 | 4,506,887 | ||
| District of Columbia University Rev. (Georgetown University), 5%, 4/01/2035 | 3,000,000 | 3,530,998 | ||
| $13,115,364 | ||||
| Florida - 2.8% | ||||
| Alachua County, FL, Health Facilities Authority, Health Facilities Rev. (Shands Teaching Hospital and Clinics, Inc. at the University of Florida), “B-1”, 5%, 12/01/2035 | $ | 1,005,000 | $ 1,260,372 | |
| Alachua County, FL, Health Facilities Authority, Health Facilities Rev. (Shands Teaching Hospital and Clinics, Inc. at the University of Florida), “B-1”, 5%, 12/01/2036 | 1,705,000 | 2,130,812 | ||
| Alachua County, FL, Health Facilities Authority, Health Facilities Rev. (Shands Teaching Hospital and Clinics, Inc. at the University of Florida), “B-1”, 5%, 12/01/2037 | 2,225,000 | 2,772,257 | ||
| Arborwood Community Development District, FL, Capital Improvement Rev., “A-1”, 6.9%, 5/01/2036 | 20,000 | 20,379 | ||
| Bellalago, FL, Educational Facilities Benefit District Capital Improvement Refunding Rev., 4.375%, 5/01/2030 | 1,045,000 | 1,160,561 | ||
| Bellalago, FL, Educational Facilities Benefit District Capital Improvement Refunding Rev., 4.5%, 5/01/2033 | 485,000 | 539,165 | ||
| Bellalago, FL, Educational Facilities Benefit District Capital Improvement Refunding Rev., 4.6%, 5/01/2034 | 1,405,000 | 1,563,818 | ||
| Broward County, FL, Airport System Rev., 5%, 10/01/2042 | 1,085,000 | 1,276,316 | ||
| Broward County, FL, Airport System Rev., “A”, 5%, 10/01/2038 | 3,000,000 | 3,663,673 | ||
| Broward County, FL, Airport System Rev., “A”, 5%, 10/01/2039 | 4,500,000 | 5,482,046 | ||
| Broward County, FL, Airport System Rev., “A”, 5%, 10/01/2044 | 3,500,000 | 4,216,763 | ||
| Capital Region Community Development District, FL, Capital Improvement Rev., “A-1”, 4.625%, 5/01/2028 | 100,000 | 106,505 | ||
| Capital Region Community Development District, FL, Capital Improvement Rev., “A-1”, 5.125%, 5/01/2039 | 625,000 | 674,912 | ||
| Capital Trust Agency, FL, Educational Facilities Rev. (Liza Jackson Preparatory School, Inc. Project), “A”, 4%, 8/01/2030 | 105,000 | 118,082 | ||
| Capital Trust Agency, FL, Educational Facilities Rev. (Liza Jackson Preparatory School, Inc. Project), “A”, 5%, 8/01/2040 | 155,000 | 183,096 | ||
| Capital Trust Agency, FL, Educational Facilities Rev. (Liza Jackson Preparatory School, Inc. Project), “A”, 5%, 8/01/2055 | 485,000 | 561,966 | ||
| Issuer | Shares/Par | Value ($) | ||
| Municipal Bonds - continued | ||||
| Florida - continued | ||||
| Capital Trust Agency, FL, Rev. (Aero Miami FX LLC), “A”, 5.35%, 7/01/2029 | $ | 8,235,000 | $ 8,262,670 | |
| Collier County, FL, Educational Facilities Authority Rev. (Ave Maria University, Inc. Project), “A”, 6.125%, 6/01/2043 | 4,125,000 | 4,411,574 | ||
| Collier County, FL, Industrial Development Authority, Continuing Care Community Rev. (Arlington of Naples Project), “A”, 6.25%, 5/15/2035 (a)(d)(z) | 100,000 | 61,000 | ||
| Collier County, FL, Industrial Development Authority, Continuing Care Community Rev. (Arlington of Naples Project), “A”, 7.75%, 5/15/2035 (a)(d)(z) | 835,000 | 509,350 | ||
| Collier County, FL, Industrial Development Authority, Continuing Care Community Rev. (Arlington of Naples Project), “A”, 8.125%, 5/15/2044 (a)(d)(z) | 1,265,000 | 771,650 | ||
| Collier County, FL, Industrial Development Authority, Continuing Care Community Rev. (Arlington of Naples Project), “A”, 6.5%, 5/15/2049 (a)(d)(z) | 180,000 | 109,800 | ||
| Daytona Beach, FL, Halifax Hospital Medical Center Rev., 5%, 6/01/2029 | 1,350,000 | 1,530,745 | ||
| Daytona Beach, FL, Halifax Hospital Medical Center Rev., 5%, 6/01/2030 | 1,420,000 | 1,603,406 | ||
| Daytona Beach, FL, Halifax Hospital Medical Center Rev., 5%, 6/01/2036 | 585,000 | 666,612 | ||
| Daytona Beach, FL, Halifax Hospital Medical Center Rev., 5%, 6/01/2046 | 2,270,000 | 2,588,637 | ||
| Florida Development Finance Corp. Educational Facilities Rev. (Renaissance Charter School), “C”, 4%, 9/15/2030 (n) | 220,000 | 235,197 | ||
| Florida Development Finance Corp. Educational Facilities Rev. (Renaissance Charter School), “C”, 5%, 9/15/2040 (n) | 500,000 | 552,027 | ||
| Florida Development Finance Corp. Educational Facilities Rev. (Renaissance Charter School), “C”, 5%, 9/15/2050 (n) | 985,000 | 1,073,716 | ||
| Florida Development Finance Corp. Educational Facilities Rev. (River City Science Academy Projects), “A”, 4%, 7/01/2035 | 150,000 | 164,242 | ||
| Florida Development Finance Corp. Educational Facilities Rev. (River City Science Academy Projects), “A”, 4%, 7/01/2045 | 280,000 | 298,481 | ||
| Florida Development Finance Corp. Educational Facilities Rev. (River City Science Academy Projects), “A”, 4%, 7/01/2055 | 395,000 | 417,573 | ||
| Florida Development Finance Corp. Educational Facilities Rev. (Southwest Charter Foundation, Inc. Project), “A”, 6%, 6/15/2037 (n) | 305,000 | 326,409 | ||
| Florida Development Finance Corp. Educational Facilities Rev. (Southwest Charter Foundation, Inc. Project), “A”, 6.125%, 6/15/2047 (n) | 1,180,000 | 1,250,511 | ||
| Issuer | Shares/Par | Value ($) | ||
| Municipal Bonds - continued | ||||
| Florida - continued | ||||
| Florida Higher Educational Facilities Financing Authority Rev. (Florida Institute of Technology), 5%, 10/01/2031 | $ | 935,000 | $ 1,144,819 | |
| Florida Higher Educational Facilities Financing Authority Rev. (Florida Institute of Technology), 5%, 10/01/2032 | 755,000 | 918,531 | ||
| Florida Higher Educational Facilities Financing Authority Rev. (Florida Institute of Technology), 5%, 10/01/2033 | 550,000 | 665,811 | ||
| Florida Higher Educational Facilities Financing Authority Rev. (Florida Institute of Technology), 5%, 10/01/2034 | 1,070,000 | 1,286,148 | ||
| Florida Higher Educational Facilities Financing Authority Rev. (Florida Institute of Technology), 5%, 10/01/2035 | 595,000 | 712,160 | ||
| Florida Higher Educational Facilities Financing Authority Rev. (Florida Institute of Technology), 5%, 10/01/2036 | 815,000 | 972,720 | ||
| Florida Higher Educational Facilities Financing Authority Rev. (Florida Institute of Technology), 4%, 10/01/2037 | 1,140,000 | 1,246,325 | ||
| Florida Higher Educational Facilities Financing Authority Rev. (Florida Institute of Technology), 4%, 10/01/2038 | 1,575,000 | 1,716,915 | ||
| Florida Higher Educational Facilities Financing Authority Rev. (Florida Institute of Technology), 4%, 10/01/2039 | 1,880,000 | 2,043,471 | ||
| Florida Higher Educational Facilities Financing Authority Rev. (Florida Institute of Technology), 4%, 10/01/2044 | 2,040,000 | 2,187,132 | ||
| Florida Higher Educational Facilities Financing Authority Rev. (Jacksonville University Project), “A”, 4.5%, 6/01/2033 (n) | 550,000 | 639,364 | ||
| Florida Higher Educational Facilities Financing Authority Rev. (Jacksonville University Project), “A”, 4.75%, 6/01/2038 (n) | 680,000 | 791,271 | ||
| Florida Higher Educational Facilities Financing Authority Rev. (Jacksonville University Project), “A”, 5%, 6/01/2048 (n) | 1,230,000 | 1,425,054 | ||
| Florida Housing Finance Corp., Homeowner Mortgage Rev. (Special Program), “B”, 3%, 7/01/2045 | 910,000 | 933,095 | ||
| Florida Housing Finance Corp., Homeowner Mortgage Rev., “1”, 4%, 7/01/2049 (u) | 4,520,000 | 4,925,046 | ||
| Florida Housing Finance Corp., Homeowner Mortgage Rev., “1”, GNMA, 3%, 1/01/2052 | 7,000,000 | 7,676,361 | ||
| Florida Mid-Bay Bridge Authority Rev., “A”, 5%, 10/01/2035 | 3,250,000 | 3,706,138 | ||
| Homestead 50, FL, Community Development District, Special Assessment, “A”, 6%, 5/01/2037 | 1,105,000 | 924,116 | ||
| Jacksonville, FL, Educational Facilities Rev. (Jacksonville University Project), “B”, 5%, 6/01/2053 (n) | 570,000 | 658,375 | ||
| Lakeland, FL, Hospital Rev. (Lakeland Regional Health Systems), 5%, 11/15/2034 | 1,935,000 | 2,188,808 | ||
| Lakewood Ranch Stewardship District, FL, Special Assessment Rev. (Lakewood Centre North Project), 4.25%, 5/01/2025 | 130,000 | 135,165 | ||
| Lakewood Ranch Stewardship District, FL, Special Assessment Rev. (Lakewood Centre North Project), 4.875%, 5/01/2035 | 120,000 | 128,027 | ||
| Issuer | Shares/Par | Value ($) | ||
| Municipal Bonds - continued | ||||
| Florida - continued | ||||
| Lakewood Ranch Stewardship District, FL, Special Assessment Rev. (Lakewood Centre North Project), 4.875%, 5/01/2045 | $ | 185,000 | $ 195,300 | |
| Lakewood Ranch Stewardship District, FL, Special Assessment Rev. (Lakewood National and Polo Run Projects), 5.375%, 5/01/2047 | 605,000 | 667,599 | ||
| Miami Beach, FL, Health Facilities Authority Hospital Rev. (Mount Sinai Medical Center of Florida), 5%, 11/15/2039 | 2,000,000 | 2,198,095 | ||
| Miami-Dade County, FL, Aviation Refunding Rev., “A”, 5%, 10/01/2030 | 240,000 | 314,074 | ||
| Miami-Dade County, FL, Aviation Refunding Rev., “A”, 5%, 10/01/2031 | 995,000 | 1,293,490 | ||
| Miami-Dade County, FL, Aviation Refunding Rev., “A”, 5%, 10/01/2032 | 420,000 | 543,152 | ||
| Miami-Dade County, FL, Aviation Refunding Rev., “A”, 5%, 10/01/2033 | 1,300,000 | 1,672,617 | ||
| Miami-Dade County, FL, Aviation Refunding Rev., “A”, 4%, 10/01/2034 | 760,000 | 904,747 | ||
| Miami-Dade County, FL, Aviation Refunding Rev., “A”, 4%, 10/01/2035 | 760,000 | 901,867 | ||
| Miami-Dade County, FL, Aviation Refunding Rev., “A”, 4%, 10/01/2036 | 945,000 | 1,117,094 | ||
| Miami-Dade County, FL, Aviation Refunding Rev., “A”, 4%, 10/01/2037 | 945,000 | 1,113,190 | ||
| Miami-Dade County, FL, Aviation Refunding Rev., “A”, 4%, 10/01/2038 | 1,065,000 | 1,250,614 | ||
| Miami-Dade County, FL, Aviation Refunding Rev., “A”, 4%, 10/01/2039 | 795,000 | 930,968 | ||
| Miami-Dade County, FL, Aviation Refunding Rev., “A”, 4%, 10/01/2041 | 710,000 | 826,496 | ||
| Miami-Dade County, FL, Health Facilities Authority Hospital Rev., Unrefunded Balance, 6.125%, 8/01/2042 | 595,000 | 597,054 | ||
| Miami-Dade County, FL, Housing Finance Authority Multi-Family Rev. (Cabana Club Apartments), 1.4%, 4/01/2023 (Put Date 4/01/2022) | 2,155,000 | 2,166,290 | ||
| Miami-Dade County, FL, Housing Finance Authority Multi-Family Rev. (Platform 3750), GNMA, 0.25%, 8/01/2024 (Put Date 8/01/2023) | 3,870,000 | 3,872,407 | ||
| Mid-Bay Bridge Authority Rev., FL, Springing Lien, “A”, 7.25%, 10/01/2040 (Prerefunded 10/01/2021) | 6,920,000 | 7,161,071 | ||
| Midtown Miami, FL, Community Development District Special Assessment (Infrastructure Project), “B”, 5%, 5/01/2029 | 280,000 | 292,986 | ||
| Midtown Miami, FL, Community Development District Special Assessment (Infrastructure Project), “B”, 5%, 5/01/2037 | 135,000 | 139,777 | ||
| Issuer | Shares/Par | Value ($) | ||
| Municipal Bonds - continued | ||||
| Florida - continued | ||||
| Midtown Miami, FL, Community Development District Special Assessment (Parking Garage Project), “A”, 5%, 5/01/2037 | $ | 230,000 | $ 238,138 | |
| North Broward, FL, Hospital District Rev. (Broward Health), “B”, 5%, 1/01/2042 | 5,785,000 | 6,748,756 | ||
| Orlando, FL, Senior Tourist Development Tax Refunding Rev. (6th Cent Contract Payments), “A”, AGM, 5%, 11/01/2034 | 495,000 | 611,432 | ||
| Osceola County, FL, Transportation Improvement and Refunding Rev. (Osceola Parkway), “A-1”, 5%, 10/01/2044 | 750,000 | 916,324 | ||
| Osceola County, FL, Transportation Improvement and Refunding Rev. (Osceola Parkway), “A-1”, 5%, 10/01/2049 | 1,040,000 | 1,262,668 | ||
| Osceola County, FL, Transportation Improvement and Refunding Rev. (Osceola Parkway), Capital Appreciation, “A-2”, 0%, 10/01/2035 | 550,000 | 361,225 | ||
| Osceola County, FL, Transportation Improvement and Refunding Rev. (Osceola Parkway), Capital Appreciation, “A-2”, 0%, 10/01/2036 | 660,000 | 416,483 | ||
| Osceola County, FL, Transportation Improvement and Refunding Rev. (Osceola Parkway), Capital Appreciation, “A-2”, 0%, 10/01/2037 | 250,000 | 151,599 | ||
| Osceola County, FL, Transportation Improvement and Refunding Rev. (Osceola Parkway), Capital Appreciation, “A-2”, 0%, 10/01/2038 | 770,000 | 448,838 | ||
| Osceola County, FL, Transportation Improvement and Refunding Rev. (Osceola Parkway), Capital Appreciation, “A-2”, 0%, 10/01/2039 | 920,000 | 515,276 | ||
| Osceola County, FL, Transportation Improvement and Refunding Rev. (Osceola Parkway), Capital Appreciation, “A-2”, 0%, 10/01/2040 | 985,000 | 528,946 | ||
| Osceola County, FL, Transportation Improvement and Refunding Rev. (Osceola Parkway), Capital Appreciation, “A-2”, 0%, 10/01/2041 | 1,095,000 | 564,002 | ||
| Osceola County, FL, Transportation Improvement and Refunding Rev. (Osceola Parkway), Capital Appreciation, “A-2”, 0%, 10/01/2042 | 880,000 | 434,472 | ||
| Palm Beach County, FL, Health Facilities Authority Hospital Rev. (Baptist Health South Florida Obligated Group), 4%, 8/15/2049 | 9,785,000 | 11,107,661 | ||
| Palm Beach County, FL, Health Facilities Authority Retirement Communities Rev. (Acts Retirement-Life Communities, Inc. Obligated Group), “B”, 5%, 11/15/2042 | 890,000 | 1,059,529 | ||
| Palm Beach County, FL, Health Facilities Authority Rev. (Sinai Residences of Boca Raton Project), 7.5%, 6/01/2049 | 430,000 | 462,055 | ||
| Issuer | Shares/Par | Value ($) | ||
| Municipal Bonds - continued | ||||
| Florida - continued | ||||
| Palm Beach County, FL, Health Facilities Authority Rev. (Toby & Leon Cooperman Sinai Residences of Boca Raton Expansion), “B-2”, 2.625%, 6/01/2025 | $ | 3,390,000 | $ 3,421,280 | |
| Pasco County, FL, Del Webb Bexley Community Development District, Special Assessment Rev., 5.3%, 5/01/2039 | 685,000 | 757,442 | ||
| Pasco County, FL, Del Webb Bexley Community Development District, Special Assessment Rev., 5.4%, 5/01/2049 | 885,000 | 976,843 | ||
| St. John's County, FL, Industrial Development Authority Rev. (Bayview Project), “A”, 5.2%, 10/01/2027 (a)(d) | 125,000 | 87,500 | ||
| Sterling Hill Community Development District, FL, Capital Improvement Rev., “B”, 5.5%, 11/01/2010 (d) | 52,264 | 31,358 | ||
| Sumter County, FL, Industrial Development Authority Hospital Rev. (Central Florida Health Alliance Projects), “A”, 5%, 7/01/2026 | 245,000 | 270,016 | ||
| Sumter County, FL, Industrial Development Authority Hospital Rev. (Central Florida Health Alliance Projects), “A”, 5%, 7/01/2029 | 225,000 | 245,423 | ||
| Sumter County, FL, Industrial Development Authority Hospital Rev. (Central Florida Health Alliance Projects), “A”, 5.125%, 7/01/2034 | 485,000 | 530,642 | ||
| Sumter County, FL, Industrial Development Authority Hospital Rev. (Central Florida Health Alliance Projects), “A”, 5.25%, 7/01/2044 | 1,455,000 | 1,596,779 | ||
| Tampa, FL, Capital Improvement Cigarette Tax Allocation (H. Lee Moffitt Cancer Center Project), Capital Appreciation, “A”, 0%, 9/01/2034 | 1,430,000 | 995,623 | ||
| Tampa, FL, Capital Improvement Cigarette Tax Allocation (H. Lee Moffitt Cancer Center Project), Capital Appreciation, “A”, 0%, 9/01/2035 | 785,000 | 523,817 | ||
| Tampa, FL, Capital Improvement Cigarette Tax Allocation (H. Lee Moffitt Cancer Center Project), Capital Appreciation, “A”, 0%, 9/01/2036 | 1,210,000 | 772,554 | ||
| Tampa, FL, Capital Improvement Cigarette Tax Allocation (H. Lee Moffitt Cancer Center Project), Capital Appreciation, “A”, 0%, 9/01/2037 | 570,000 | 347,678 | ||
| Tampa, FL, Capital Improvement Cigarette Tax Allocation (H. Lee Moffitt Cancer Center Project), Capital Appreciation, “A”, 0%, 9/01/2038 | 785,000 | 456,613 | ||
| Tampa, FL, Capital Improvement Cigarette Tax Allocation (H. Lee Moffitt Cancer Center Project), Capital Appreciation, “A”, 0%, 9/01/2039 | 785,000 | 435,369 | ||
| Issuer | Shares/Par | Value ($) | ||
| Municipal Bonds - continued | ||||
| Florida - continued | ||||
| Tampa, FL, Capital Improvement Cigarette Tax Allocation (H. Lee Moffitt Cancer Center Project), Capital Appreciation, “A”, 0%, 9/01/2040 | $ | 1,070,000 | $ 562,111 | |
| Tampa, FL, Capital Improvement Cigarette Tax Allocation (H. Lee Moffitt Cancer Center Project), Capital Appreciation, “A”, 0%, 9/01/2041 | 475,000 | 238,008 | ||
| Tampa, FL, Capital Improvement Cigarette Tax Allocation (H. Lee Moffitt Cancer Center Project), Capital Appreciation, “A”, 0%, 9/01/2042 | 475,000 | 226,901 | ||
| Tampa, FL, Hospital Rev. (H. Lee Moffitt Cancer Center Project), “B”, 4%, 7/01/2038 | 310,000 | 356,225 | ||
| Tampa, FL, Hospital Rev. (H. Lee Moffitt Cancer Center Project), “B”, 4%, 7/01/2039 | 310,000 | 355,194 | ||
| Tampa, FL, Hospital Rev. (H. Lee Moffitt Cancer Center Project), “B”, 5%, 7/01/2040 | 475,000 | 593,934 | ||
| Tampa, FL, Hospital Rev. (H. Lee Moffitt Cancer Center Project), “B”, 4%, 7/01/2045 | 1,665,000 | 1,877,304 | ||
| Tampa, FL, Hospital Rev. (H. Lee Moffitt Cancer Center Project), “B”, 5%, 7/01/2050 | 3,380,000 | 4,154,147 | ||
| $161,388,228 | ||||
| Georgia - 3.2% | ||||
| Atlanta, GA, Airport Passenger Facility Charge and Subordinate Lien Rev., “D”, 4%, 7/01/2035 | $ | 7,450,000 | $ 8,567,516 | |
| Atlanta, GA, Airport Passenger Facility Charge and Subordinate Lien Rev., “D”, 4%, 7/01/2037 | 4,000,000 | 4,569,550 | ||
| Atlanta, GA, Airport Passenger Facility Charge and Subordinate Lien Rev., “D”, 4%, 7/01/2039 | 5,000,000 | 5,681,247 | ||
| Atlanta, GA, Airport Passenger Facility Charge and Subordinate Lien Rev., “D”, 4%, 7/01/2040 | 2,250,000 | 2,550,750 | ||
| Atlanta, GA, Airport Rev., “B”, 5%, 1/01/2025 | 1,415,000 | 1,465,154 | ||
| Atlanta, GA, Airport Rev., “B”, 5%, 1/01/2026 | 800,000 | 828,356 | ||
| Atlanta, GA, Airport Rev., “B”, 5%, 7/01/2044 | 9,800,000 | 11,891,125 | ||
| Atlanta, GA, Geo. L. Smith II World Congress Center Authority Convention Center Hotel Rev., “A”, 4%, 1/01/2036 (w) | 395,000 | 451,737 | ||
| Atlanta, GA, Geo. L. Smith II World Congress Center Authority Convention Center Hotel Rev., “A”, 4%, 1/01/2054 (w) | 2,145,000 | 2,378,583 | ||
| Atlanta, GA, Geo. L. Smith II World Congress Center Authority Convention Center Hotel Rev., “B”, 3.625%, 1/01/2031 (n)(w) | 1,320,000 | 1,349,122 | ||
| Atlanta, GA, Geo. L. Smith II World Congress Center Authority Convention Center Hotel Rev., “B”, 5%, 1/01/2036 (n)(w) | 1,155,000 | 1,288,695 | ||
| Atlanta, GA, Geo. L. Smith II World Congress Center Authority Convention Center Hotel Rev., “B”, 5%, 1/01/2054 (n)(w) | 3,295,000 | 3,592,062 | ||
| Issuer | Shares/Par | Value ($) | ||
| Municipal Bonds - continued | ||||
| Georgia - continued | ||||
| Bibb County, GA, Development Authority Rev. (USG Real Estate Foundation IX LLC Project), 4%, 6/01/2044 | $ | 855,000 | $ 955,379 | |
| Burke County, GA, Development Authority Pollution Control Rev. (Georgia Power Co. Plant Vogtle Project), 2.25%, 10/01/2032 (Put Date 5/25/2023) | 5,115,000 | 5,304,898 | ||
| Burke County, GA, Development Authority Pollution Control Rev. (Georgia Power Co. Plant Vogtle Project), 1.5%, 1/01/2040 (Put Date 2/03/2025) | 5,045,000 | 5,144,550 | ||
| Clayton County, GA, Development Authority, Special Facilities Rev. (Delta Airlines, Inc.), “A”, 8.75%, 6/01/2029 | 1,208,713 | 1,216,242 | ||
| Cobb County, GA, Development Authority, Student Housing Rev. (Kennesaw State University Real Estate Foundations), “C”, 5%, 7/15/2030 | 650,000 | 719,970 | ||
| Cobb County, GA, Development Authority, Student Housing Rev. (Kennesaw State University Real Estate Foundations), “C”, 5%, 7/15/2033 | 1,140,000 | 1,251,015 | ||
| Cobb County, GA, Kennestone Hospital Authority Rev. (WellStar Health System, Inc. Project), “B”, 5%, 4/01/2031 | 300,000 | 387,856 | ||
| Cobb County, GA, Kennestone Hospital Authority Rev. (WellStar Health System, Inc. Project), “B”, 4%, 4/01/2032 | 335,000 | 399,565 | ||
| Cobb County, GA, Kennestone Hospital Authority Rev. (WellStar Health System, Inc. Project), “B”, 4%, 4/01/2033 | 190,000 | 225,635 | ||
| Cobb County, GA, Kennestone Hospital Authority Rev. (WellStar Health System, Inc. Project), “B”, 4%, 4/01/2034 | 345,000 | 408,020 | ||
| Cobb County, GA, Kennestone Hospital Authority Rev. (WellStar Health System, Inc. Project), “B”, 4%, 4/01/2036 | 310,000 | 364,403 | ||
| Cobb County, GA, Kennestone Hospital Authority Rev. (WellStar Health System, Inc. Project), “B”, 5%, 4/01/2037 | 325,000 | 411,009 | ||
| Cobb County, GA, Kennestone Hospital Authority Rev. (WellStar Health System, Inc. Project), “B”, 5%, 4/01/2038 | 335,000 | 422,433 | ||
| Cobb County, GA, Kennestone Hospital Authority Rev. (WellStar Health System, Inc. Project), “B”, 4%, 4/01/2039 | 300,000 | 349,238 | ||
| Cobb County, GA, Kennestone Hospital Authority Rev. (WellStar Health System, Inc. Project), “B”, 5%, 4/01/2040 | 205,000 | 257,170 | ||
| Coweta County, GA, Development Authority Rev. (Piedmont Healthcare, Inc. Project), “A”, 5%, 7/01/2044 | 9,425,000 | 11,676,815 | ||
| DeKalb County, GA, Water & Sewer Rev., “A”, 5.25%, 10/01/2028 | 5,285,000 | 5,412,258 | ||
| DeKalb County, GA, Water & Sewer Rev., “A”, 5.25%, 10/01/2029 | 1,415,000 | 1,449,072 | ||
| DeKalb County, GA, Water & Sewer Rev., “A”, 5.25%, 10/01/2030 | 4,345,000 | 4,449,624 | ||
| Issuer | Shares/Par | Value ($) | ||
| Municipal Bonds - continued | ||||
| Georgia - continued | ||||
| DeKalb County, GA, Water & Sewer Rev., “A”, 5.25%, 10/01/2041 | $ | 3,910,000 | $ 4,003,171 | |
| Fulton County, GA, Development Authority Hospital Rev. (WellStar Health System, Inc. Project), “A”, 4%, 4/01/2050 | 3,395,000 | 3,855,782 | ||
| Georgia Housing & Finance Authority Rev., Single Family Mortgage, “A”, 4%, 12/01/2047 | 2,090,000 | 2,248,160 | ||
| Georgia Housing & Finance Authority Rev., Single Family Mortgage, “A-1”, 4%, 6/01/2044 | 435,000 | 453,157 | ||
| Georgia Main Street Natural Gas, Inc., Gas Project Rev., “A”, 5%, 3/15/2022 | 4,545,000 | 4,739,370 | ||
| Georgia Main Street Natural Gas, Inc., Gas Project Rev., “A”, 5.5%, 9/15/2026 | 845,000 | 1,043,023 | ||
| Georgia Main Street Natural Gas, Inc., Gas Project Rev., “A”, 5.5%, 9/15/2028 | 1,740,000 | 2,233,077 | ||
| Georgia Main Street Natural Gas, Inc., Gas Project Rev., “A”, 5%, 5/15/2043 | 1,865,000 | 2,208,234 | ||
| Georgia Main Street Natural Gas, Inc., Gas Project Rev., “B”, FLR, 0.823% (67% of LIBOR - 1mo. + 0.75%), 4/01/2048 (Put Date 9/01/2023) | 10,315,000 | 10,370,493 | ||
| Georgia Main Street Natural Gas, Inc., Gas Supply Rev., “A”, 5%, 5/15/2031 | 5,760,000 | 7,154,224 | ||
| Georgia Main Street Natural Gas, Inc., Gas Supply Rev., “B”, 4%, 8/01/2049 (Put Date 12/02/2024) | 6,390,000 | 7,111,659 | ||
| Georgia Main Street Natural Gas, Inc., Gas Supply Rev., “C”, 4%, 3/01/2050 (Put Date 9/01/2026) | 20,295,000 | 23,390,193 | ||
| Georgia Municipal Electric Authority (Plant Vogtle Units 3 & 4 Project), “A”, 5%, 1/01/2056 | 1,940,000 | 2,290,704 | ||
| Georgia Municipal Electric Authority (Plant Vogtle Units 3 & 4 Project), “A”, 5%, 1/01/2063 | 1,945,000 | 2,290,575 | ||
| Georgia Municipal Electric Authority Power Rev., “GG”, 5%, 1/01/2026 | 3,065,000 | 3,292,434 | ||
| Glynn-Brunswick, GA, Memorial Hospital Authority Rev., Anticipation Certificates (Southeast Georgia Health System Project), 4%, 8/01/2035 | 305,000 | 347,766 | ||
| Glynn-Brunswick, GA, Memorial Hospital Authority Rev., Anticipation Certificates (Southeast Georgia Health System Project), 4%, 8/01/2036 | 335,000 | 380,543 | ||
| Glynn-Brunswick, GA, Memorial Hospital Authority Rev., Anticipation Certificates (Southeast Georgia Health System Project), 4%, 8/01/2037 | 230,000 | 259,930 | ||
| Hall County and Gainesville, GA, Hospital Authority Rev. (Northeast Georgia Health System, Inc. Project), “A”, 5%, 2/15/2042 | 4,000,000 | 4,701,522 | ||
| Issuer | Shares/Par | Value ($) | ||
| Municipal Bonds - continued | ||||
| Georgia - continued | ||||
| Hall County and Gainesville, GA, Hospital Authority Rev. (Northeast Georgia Health System, Inc. Project), “A”, 5%, 2/15/2045 | $ | 5,000,000 | $ 5,846,475 | |
| Hall County and Gainesville, GA, Hospital Authority Rev. (Northeast Georgia Health System, Inc. Project), “A”, 5.5%, 8/15/2054 | 4,215,000 | 4,821,447 | ||
| Monroe County, GA, Development Authority Pollution Control Rev. (Oglethorpe Power Corp. Scherer Project), “A”, 1.5%, 1/01/2039 (Put Date 2/03/2025) | 3,750,000 | 3,823,997 | ||
| $182,284,985 | ||||
| Guam - 0.1% | ||||
| Guam Government Business Privilege Tax Rev., “A”, 5.25%, 1/01/2036 | $ | 545,000 | $ 562,379 | |
| Guam Waterworks Authority Rev. (Water and Wastewater System), 5.25%, 7/01/2021 | 370,000 | 374,172 | ||
| Guam Waterworks Authority Rev. (Water and Wastewater System), “A”, 5%, 1/01/2050 | 6,060,000 | 7,283,326 | ||
| $8,219,877 | ||||
| Hawaii - 0.2% | ||||
| Hawaii Harbor System Rev., “A”, 4%, 7/01/2033 | $ | 475,000 | $ 559,997 | |
| Hawaii Harbor System Rev., “A”, 4%, 7/01/2034 | 415,000 | 487,410 | ||
| Hawaii Harbor System Rev., “A”, 4%, 7/01/2035 | 295,000 | 345,498 | ||
| Hawaii Harbor System Rev., “A”, 4%, 7/01/2036 | 30,000 | 35,005 | ||
| State of Hawaii, “DZ”, 5%, 12/01/2031 (Prerefunded 12/01/2021) | 1,380,000 | 1,423,929 | ||
| State of Hawaii, “DZ”, 5%, 12/01/2031 (Prerefunded 12/01/2021) | 850,000 | 877,344 | ||
| State of Hawaii, Highway Rev., “A”, 5%, 1/01/2030 (Prerefunded 1/01/2022) | 3,695,000 | 3,828,972 | ||
| State of Hawaii, Highway Rev., “A”, 5%, 1/01/2031 | 1,380,000 | 1,427,444 | ||
| State of Hawaii, Highway Rev., “A”, 5%, 1/01/2032 | 920,000 | 951,489 | ||
| $9,937,088 | ||||
| Illinois - 10.3% | ||||
| Bridgeview, IL, Stadium and Redevelopment Projects, AAC, 5.14%, 12/01/2036 | $ | 9,190,000 | $ 8,983,522 | |
| Chicago, IL, Board of Education, 5%, 12/01/2042 | 4,045,000 | 4,193,168 | ||
| Chicago, IL, Board of Education (School Reform), “A”, NPFG, 5.25%, 12/01/2023 | 6,805,000 | 7,387,503 | ||
| Chicago, IL, Board of Education (School Reform), Capital Appreciation, “A”, NPFG, 0%, 12/01/2022 | 1,405,000 | 1,385,688 | ||
| Issuer | Shares/Par | Value ($) | ||
| Municipal Bonds - continued | ||||
| Illinois - continued | ||||
| Chicago, IL, Board of Education (School Reform), Capital Appreciation, “A”, NPFG, 0%, 12/01/2023 | $ | 1,205,000 | $ 1,172,320 | |
| Chicago, IL, Board of Education (School Reform), Capital Appreciation, “A”, NPFG, 0%, 12/01/2028 | 9,895,000 | 8,429,307 | ||
| Chicago, IL, Board of Education (School Reform), Capital Appreciation, “A”, NPFG, 0%, 12/01/2029 | 3,290,000 | 2,703,486 | ||
| Chicago, IL, Board of Education (School Reform), Capital Appreciation, “A”, NPFG, 0%, 12/01/2030 | 1,430,000 | 1,133,562 | ||
| Chicago, IL, Board of Education (School Reform), Capital Appreciation, “B-1”, NPFG, 0%, 12/01/2022 | 3,410,000 | 3,363,130 | ||
| Chicago, IL, Board of Education (School Reform), Capital Appreciation, “B-1”, NPFG, 0%, 12/01/2023 | 14,590,000 | 14,194,316 | ||
| Chicago, IL, Board of Education (School Reform), Capital Appreciation, “B-1”, NPFG, 0%, 12/01/2026 | 3,405,000 | 3,096,842 | ||
| Chicago, IL, Board of Education (School Reform), Capital Appreciation, “B-1”, NPFG, 0%, 12/01/2028 | 3,895,000 | 3,318,055 | ||
| Chicago, IL, Board of Education, “A”, 5.5%, 12/01/2039 | 105,000 | 107,367 | ||
| Chicago, IL, Board of Education, Dedicated Capital Improvement Tax Bond, 5%, 4/01/2033 | 270,000 | 313,937 | ||
| Chicago, IL, Board of Education, Dedicated Capital Improvement Tax Bond, 5%, 4/01/2033 | 220,000 | 261,034 | ||
| Chicago, IL, Board of Education, Dedicated Capital Improvement Tax Bond, 5%, 4/01/2036 | 1,010,000 | 1,166,617 | ||
| Chicago, IL, Board of Education, Dedicated Capital Improvement Tax Bond, 5%, 4/01/2037 | 1,005,000 | 1,156,914 | ||
| Chicago, IL, Board of Education, Dedicated Capital Improvement Tax Bond, 5%, 4/01/2042 | 1,785,000 | 2,035,216 | ||
| Chicago, IL, Board of Education, Dedicated Capital Improvement Tax Bond, 5%, 4/01/2046 | 2,495,000 | 2,825,101 | ||
| Chicago, IL, Board of Education, Dedicated Capital Improvement Tax Bond, 6%, 4/01/2046 | 15,110,000 | 18,034,702 | ||
| Chicago, IL, Board of Education, Unlimited Tax General Obligation Dedicated Rev., “A”, AAC, 5.5%, 12/01/2025 | 2,505,000 | 2,994,952 | ||
| Chicago, IL, Board of Education, Unlimited Tax General Obligation Dedicated Rev., “A”, AAC, 5.5%, 12/01/2026 | 970,000 | 1,191,169 | ||
| Chicago, IL, Board of Education, Unlimited Tax General Obligation Dedicated Rev., “A”, AAC, 5.5%, 12/01/2027 | 2,455,000 | 3,086,579 | ||
| Chicago, IL, Board of Education, Unlimited Tax General Obligation Dedicated Rev., “A”, AAC, 5.5%, 12/01/2028 | 1,165,000 | 1,491,592 | ||
| Chicago, IL, Board of Education, Unlimited Tax General Obligation Dedicated Rev., “A”, AAC, 5.5%, 12/01/2029 | 775,000 | 1,007,369 | ||
| Chicago, IL, Board of Education, Unlimited Tax General Obligation Dedicated Rev., “A”, AAC, 5.5%, 12/01/2030 | 580,000 | 766,962 | ||
| Issuer | Shares/Par | Value ($) | ||
| Municipal Bonds - continued | ||||
| Illinois - continued | ||||
| Chicago, IL, Board of Education, Unlimited Tax General Obligation Dedicated Rev., “A”, AAC, 5.5%, 12/01/2031 | $ | 1,550,000 | $ 2,085,551 | |
| Chicago, IL, Board of Education, Unlimited Tax General Obligation Dedicated Rev., “C”, AGM, 5%, 12/01/2030 | 2,760,000 | 3,426,703 | ||
| Chicago, IL, Board of Education, Unlimited Tax General Obligation Dedicated Rev., “C”, AGM, 5%, 12/01/2031 | 5,300,000 | 6,532,396 | ||
| Chicago, IL, Board of Education, Unlimited Tax General Obligation Dedicated Rev., “C”, AGM, 5%, 12/01/2032 | 4,540,000 | 5,556,897 | ||
| Chicago, IL, Board of Education, Unlimited Tax General Obligation Refunding Dedicated Rev., “A”, AGM, 5%, 12/01/2029 | 310,000 | 384,610 | ||
| Chicago, IL, Board of Education, Unlimited Tax General Obligation Refunding Dedicated Rev., “A”, AGM, 5%, 12/01/2030 | 200,000 | 246,692 | ||
| Chicago, IL, Board of Education, Unlimited Tax General Obligation Refunding Dedicated Rev., “A”, AGM, 5%, 12/01/2031 | 200,000 | 245,701 | ||
| Chicago, IL, Board of Education, Unlimited Tax General Obligation Refunding Dedicated Rev., “A”, AGM, 5%, 12/01/2032 | 200,000 | 244,797 | ||
| Chicago, IL, Board of Education, Unlimited Tax General Obligation Refunding Dedicated Rev., “A”, AGM, 5%, 12/01/2033 | 180,000 | 219,534 | ||
| Chicago, IL, Board of Education, Unlimited Tax General Obligation Refunding Dedicated Rev., “A”, AGM, 5%, 12/01/2034 | 175,000 | 212,199 | ||
| Chicago, IL, Board of Education, Unlimited Tax General Obligation Refunding Dedicated Rev., “A”, AGM, 5%, 12/01/2035 | 130,000 | 157,202 | ||
| Chicago, IL, Board of Education, Unlimited Tax General Obligation Refunding Dedicated Rev., “G”, 5%, 12/01/2034 | 1,205,000 | 1,406,897 | ||
| Chicago, IL, Board of Education, Unlimited Tax General Obligation Refunding Dedicated Rev., “H”, 5%, 12/01/2036 | 3,245,000 | 3,769,300 | ||
| Chicago, IL, Board of Education, Unlimited Tax General Obligation Refunding Dedicated Rev., “H”, 5%, 12/01/2046 | 3,675,000 | 4,188,549 | ||
| Chicago, IL, Capital Appreciation “A”, NPFG, 0%, 1/01/2027 | 1,490,000 | 1,334,139 | ||
| Chicago, IL, City Colleges of Chicago Capital Improvement Project, Capital Appreciation, NPFG, 0%, 1/01/2026 | 9,690,000 | 8,914,230 | ||
| Chicago, IL, City Colleges of Chicago Capital Improvement Project, Capital Appreciation, NPFG, 0%, 1/01/2027 | 1,820,000 | 1,629,620 | ||
| Chicago, IL, General Obligation, “A”, 5%, 1/01/2025 | 745,000 | ��� 841,564 | ||
| Chicago, IL, General Obligation, “A”, 5%, 1/01/2026 | 3,885,000 | 4,492,016 | ||
| Chicago, IL, General Obligation, “A”, 5%, 1/01/2027 | 2,660,000 | 3,138,202 | ||
| Issuer | Shares/Par | Value ($) | ||
| Municipal Bonds - continued | ||||
| Illinois - continued | ||||
| Chicago, IL, General Obligation, “A”, 5%, 1/01/2028 | $ | 605,000 | $ 726,203 | |
| Chicago, IL, General Obligation, “A”, 5.25%, 1/01/2028 | 6,375,000 | 6,970,175 | ||
| Chicago, IL, General Obligation, “A”, 5%, 1/01/2029 | 7,090,000 | 8,632,062 | ||
| Chicago, IL, General Obligation, “A”, 5%, 1/01/2031 | 625,000 | 764,530 | ||
| Chicago, IL, General Obligation, “A”, 5%, 1/01/2032 | 265,000 | 322,867 | ||
| Chicago, IL, General Obligation, “A”, 5%, 1/01/2036 | 1,110,000 | 1,193,711 | ||
| Chicago, IL, General Obligation, “A”, 5%, 1/01/2039 | 1,820,000 | 2,136,801 | ||
| Chicago, IL, General Obligation, “A”, 5%, 1/01/2040 | 350,000 | 410,091 | ||
| Chicago, IL, General Obligation, “A”, 5%, 1/01/2044 | 6,715,000 | 7,794,403 | ||
| Chicago, IL, General Obligation, “A”, 5.5%, 1/01/2049 | 6,995,000 | 8,355,441 | ||
| Chicago, IL, General Obligation, “A”, AGM, 5.25%, 1/01/2031 | 1,000,000 | 1,080,146 | ||
| Chicago, IL, General Obligation, “C”, 5%, 1/01/2024 | 2,240,000 | 2,301,953 | ||
| Chicago, IL, General Obligation, “D”, 5.5%, 1/01/2033 | 935,000 | 1,050,126 | ||
| Chicago, IL, Greater Chicago Metropolitan Water Reclamation District, “C”, 5%, 12/01/2029 | 9,145,000 | 9,437,539 | ||
| Chicago, IL, Midway Airport Rev., Second Lien, “A”, BAM, 5%, 1/01/2031 | 1,525,000 | 1,690,750 | ||
| Chicago, IL, O’Hare International Airport Rev., Special Facilities, 5%, 7/01/2033 | 745,000 | 901,006 | ||
| Chicago, IL, O’Hare International Airport Rev., Special Facilities, 5%, 7/01/2038 | 1,850,000 | 2,177,665 | ||
| Chicago, IL, O’Hare International Airport Rev., Special Facilities, 5%, 7/01/2048 | 5,900,000 | 6,887,442 | ||
| Chicago, IL, O'Hare International Airport Rev., Customer Facility Charge, AGM, 5.25%, 1/01/2032 | 945,000 | 1,018,462 | ||
| Chicago, IL, O'Hare International Airport Rev., Customer Facility Charge, AGM, 5.25%, 1/01/2033 | 470,000 | 506,281 | ||
| Chicago, IL, O'Hare International Airport Rev., Customer Facility Charge, AGM, 5.5%, 1/01/2043 | 1,890,000 | 2,041,639 | ||
| Chicago, IL, O'Hare International Airport Rev., Senior Lien, “A”, 5%, 1/01/2048 | 3,315,000 | 3,914,084 | ||
| Chicago, IL, O'Hare International Airport Rev., Senior Lien, “B”, 5%, 1/01/2030 | 2,735,000 | 3,159,453 | ||
| Chicago, IL, Transit Authority Sales Tax Receipts Rev., 5.25%, 12/01/2029 (Prerefunded 12/01/2021) | 1,755,000 | 1,814,333 | ||
| Chicago, IL, Transit Authority Sales Tax Receipts Rev., 5.25%, 12/01/2031 (Prerefunded 12/01/2021) | 655,000 | 677,144 | ||
| Chicago, IL, Transit Authority Sales Tax Receipts Rev., 5.25%, 12/01/2040 (Prerefunded 12/01/2021) | 4,685,000 | 4,843,390 | ||
| Chicago, IL, Transit Authority Second Lien Sales Tax Rev., “A”, 5%, 12/01/2045 | 1,840,000 | 2,243,019 | ||
| Chicago, IL, Transit Authority Second Lien Sales Tax Rev., “A”, 5%, 12/01/2055 | 1,695,000 | 2,060,324 | ||
| Issuer | Shares/Par | Value ($) | ||
| Municipal Bonds - continued | ||||
| Illinois - continued | ||||
| Cook County, IL, Community College District No. 508 (City Colleges), BAM, 5%, 12/01/2047 | $ | 9,665,000 | $ 11,232,015 | |
| Cook County, IL, General Obligation Refunding, “A”, 5%, 11/15/2031 | 1,705,000 | 2,214,260 | ||
| Cook County, IL, General Obligation Refunding, “A”, 5%, 11/15/2032 | 1,120,000 | 1,449,174 | ||
| Cook County, IL, General Obligation Refunding, “A”, 5%, 11/15/2033 | 1,100,000 | 1,416,006 | ||
| Cook County, IL, General Obligation Refunding, “C”, AGM, 5%, 11/15/2025 | 3,000,000 | 3,219,538 | ||
| Cook County, IL, Sales Tax Rev., “A”, 5%, 11/15/2030 | 840,000 | 1,108,604 | ||
| Cook County, IL, Sales Tax Rev., “A”, 5%, 11/15/2031 | 1,050,000 | 1,381,097 | ||
| Cook County, IL, Sales Tax Rev., “A”, 5%, 11/15/2032 | 615,000 | 805,302 | ||
| Cook County, IL, Sales Tax Rev., “A”, 5%, 11/15/2035 | 780,000 | 1,010,361 | ||
| Cook County, IL, Sales Tax Rev., “A”, 5%, 11/15/2036 | 660,000 | 850,321 | ||
| Cook County, IL, Sales Tax Rev., “A”, 5%, 11/15/2037 | 805,000 | 1,032,025 | ||
| Cook County, IL, Sales Tax Rev., “A”, 5%, 11/15/2038 | 1,095,000 | 1,398,352 | ||
| Cook County, IL, Sales Tax Rev., “A”, 4%, 11/15/2039 | 1,400,000 | 1,637,723 | ||
| Cook County, IL, Sales Tax Rev., “A”, 4%, 11/15/2040 | 1,285,000 | 1,498,853 | ||
| Cook County, IL, Sales Tax Rev., “A”, 4%, 11/15/2041 | 1,015,000 | 1,180,102 | ||
| DuPage County, IL, Carol Stream Park District, “C”, BAM, 4%, 11/01/2027 | 200,000 | 234,981 | ||
| DuPage County, IL, Carol Stream Park District, “C”, BAM, 3%, 11/01/2032 | 1,250,000 | 1,365,140 | ||
| Granite City, IL, Solid Waste Disposal Rev. (Waste Management, Inc. Project), 2.45%, 5/01/2027 (Put Date 5/03/2021) | 1,475,000 | 1,477,544 | ||
| Illinois Finance Authority Rev. (Advocate Health Care Network), “A-1”, 4%, 11/01/2030 | 4,410,000 | 4,956,609 | ||
| Illinois Finance Authority Rev. (Advocate Health Care Network), “A-2”, 4%, 11/01/2030 | 4,410,000 | 4,955,768 | ||
| Illinois Finance Authority Rev. (Edward-Elmhurst Healthcare), “A”, 5%, 1/01/2034 | 2,310,000 | 2,724,037 | ||
| Illinois Finance Authority Rev. (Edward-Elmhurst Healthcare), “A”, 5%, 1/01/2035 | 2,315,000 | 2,724,762 | ||
| Illinois Finance Authority Rev. (Franciscan Communities), “A”, 4.75%, 5/15/2033 (Prerefunded 5/15/2023) | 275,000 | 300,611 | ||
| Illinois Finance Authority Rev. (Franciscan Communities), “A”, 4.75%, 5/15/2033 | 1,905,000 | 1,980,980 | ||
| Illinois Finance Authority Rev. (Franciscan Communities), “A”, 5.125%, 5/15/2043 (Prerefunded 5/15/2023) | 190,000 | 209,192 | ||
| Illinois Finance Authority Rev. (Franciscan Communities), “A”, 5.125%, 5/15/2043 | 1,310,000 | 1,364,035 | ||
| Issuer | Shares/Par | Value ($) | ||
| Municipal Bonds - continued | ||||
| Illinois - continued | ||||
| Illinois Finance Authority Rev. (McKinley Foundation), “A”, 5.125%, 11/01/2055 (n) | $ | 3,205,000 | $ 3,238,703 | |
| Illinois Finance Authority Rev. (McKinley Foundation), “B”, 7%, 11/01/2037 (n) | 990,000 | 988,373 | ||
| Illinois Finance Authority Rev. (Mercy Health Corp.), 5%, 12/01/2046 | 9,235,000 | 10,852,010 | ||
| Illinois Finance Authority Rev. (Presence Health Network), “C”, 5%, 2/15/2036 | 1,035,000 | 1,237,247 | ||
| Illinois Finance Authority Rev. (Presence Health Network), “C”, 5%, 2/15/2041 | 1,535,000 | 1,812,629 | ||
| Illinois Finance Authority Rev. (Rehabilitation Institute of Chicago), “A”, 6%, 7/01/2043 | 6,315,000 | 6,858,632 | ||
| Illinois Finance Authority Rev. (Rosalind Franklin University), “A”, 5%, 8/01/2042 | 510,000 | 580,736 | ||
| Illinois Finance Authority Rev. (Rosalind Franklin University), “A”, 5%, 8/01/2047 | 1,040,000 | 1,178,138 | ||
| Illinois Finance Authority Rev. (Rosalind Franklin University, Research Building Project), “C”, 5%, 8/01/2046 | 820,000 | 929,094 | ||
| Illinois Finance Authority Rev. (Rosalind Franklin University, Research Building Project), “C”, 5%, 8/01/2049 | 795,000 | 899,659 | ||
| Illinois Finance Authority Rev. (Southern Illinois Healthcare Enterprises, Inc.), “A”, 5%, 3/01/2047 | 10,000,000 | 11,563,392 | ||
| Illinois Finance Authority Rev. (Southern Illinois Healthcare Enterprises, Inc.), “C”, 5%, 3/01/2034 | 140,000 | 166,577 | ||
| Illinois Finance Authority Rev. (University of Chicago), “A”, 5%, 10/01/2028 (w) | 2,045,000 | 2,589,612 | ||
| Illinois Finance Authority Rev. (University of Chicago), “A”, 5%, 10/01/2031 (w) | 4,000,000 | 5,304,733 | ||
| Illinois Finance Authority, Academic Facilities Lease Rev. (Provident Group - UIUC Properties LLC - University of Illinois at Urbana-Champaign Project), “A”, 5%, 10/01/2044 | 420,000 | 506,371 | ||
| Illinois Finance Authority, Academic Facilities Lease Rev. (Provident Group - UIUC Properties LLC - University of Illinois at Urbana-Champaign Project), “A”, 5%, 10/01/2049 | 525,000 | 629,210 | ||
| Illinois Finance Authority, Academic Facilities Lease Rev. (Provident Group - UIUC Properties LLC - University of Illinois at Urbana-Champaign Project), “A”, 5%, 10/01/2051 | 420,000 | 502,555 | ||
| Illinois Finance Authority, Graduate & Professional Student Loan Program Rev. (Midwestern University Foundation), “A”, 3%, 7/01/2035 | 770,000 | 798,208 | ||
| Illinois Finance Authority, Health Services Facility Lease Rev. (Provident Group - UIC Surgery Center LLC - University of Illinois Health Services Facility Project), 4%, 10/01/2040 | 2,180,000 | 2,461,484 | ||
| Issuer | Shares/Par | Value ($) | ||
| Municipal Bonds - continued | ||||
| Illinois - continued | ||||
| Illinois Finance Authority, Student Housing and Academic Facility Rev. (CHF-Chicago LLC-University of Illinois at Chicago Project), “A”, 5%, 2/15/2037 | $ | 490,000 | $ 540,752 | |
| Illinois Finance Authority, Student Housing and Academic Facility Rev. (CHF-Chicago LLC-University of Illinois at Chicago Project), “A”, 5%, 2/15/2047 | 980,000 | 1,073,673 | ||
| Illinois Finance Authority, Student Housing and Academic Facility Rev. (CHF-Chicago LLC-University of Illinois at Chicago Project), “A”, 5%, 2/15/2050 | 490,000 | 535,954 | ||
| Illinois Finance Authority, Student Housing Rev. (Northern Illinois University Project), 6.625%, 10/01/2031 | 4,210,000 | 4,271,541 | ||
| Illinois Finance Authority, Water Facilities Refunding Rev. (American Water Capital Corp. Project), 2.45%, 10/01/2039 (Put Date 10/01/2029) | 7,000,000 | 7,418,433 | ||
| Illinois Finance Authority, Water Facilities Refunding Rev. (American Water Capital Corp. Project), 0.7%, 5/01/2040 (Put Date 9/01/2023) | 1,850,000 | 1,847,518 | ||
| Illinois Housing Development Authority Rev., “A”, 3.87%, 11/15/2035 (z) | 7,967,205 | 9,162,764 | ||
| Illinois Housing Development Authority Rev., “A”, 4.5%, 10/01/2048 | 6,270,000 | 7,052,632 | ||
| Illinois Housing Development Authority Rev., “A”, GNMA, 3%, 4/01/2051 | 3,735,000 | 4,092,533 | ||
| Illinois Housing Development Authority Rev., “B”, 3.87%, 11/15/2035 (z) | 3,249,208 | 3,736,784 | ||
| Illinois Housing Development Authority Rev., “C”, 3.87%, 11/15/2035 (z) | 3,242,283 | 3,728,820 | ||
| Illinois Housing Development Authority Rev., “D”, 3.87%, 11/15/2035 (z) | 2,958,577 | 3,402,541 | ||
| Illinois Housing Development Authority Rev., “E”, 3.87%, 11/15/2035 (z) | 2,036,058 | 2,341,589 | ||
| Illinois Housing Development Authority, Multi-Family Housing Rev. (Century Woods), FHLMC, 1.9%, 10/01/2022 (Put Date 10/01/2021) | 2,230,000 | 2,248,549 | ||
| Illinois Railsplitter Tobacco Settlement Authority Rev., 5.5%, 6/01/2023 (Prerefunded 6/01/2021) | 4,455,000 | 4,492,474 | ||
| Illinois Railsplitter Tobacco Settlement Authority Rev., 6%, 6/01/2028 (Prerefunded 6/01/2021) | 10,615,000 | 10,712,203 | ||
| Illinois Sales Tax Securitization Corp., “A”, 5%, 1/01/2029 | 120,000 | 146,855 | ||
| Illinois Sales Tax Securitization Corp., “A”, 5%, 1/01/2030 | 155,000 | 188,297 | ||
| Illinois Sales Tax Securitization Corp., Second Lien, “A”, 5%, 1/01/2026 | 1,800,000 | 2,123,376 | ||
| Issuer | Shares/Par | Value ($) | ||
| Municipal Bonds - continued | ||||
| Illinois - continued | ||||
| Illinois Sales Tax Securitization Corp., Second Lien, “A”, 5%, 1/01/2027 | $ | 3,995,000 | $ 4,825,871 | |
| Illinois Sales Tax Securitization Corp., Second Lien, “A”, 5%, 1/01/2028 | 3,720,000 | 4,585,214 | ||
| Illinois Sales Tax Securitization Corp., Second Lien, “A”, 5%, 1/01/2029 | 755,000 | 945,745 | ||
| Illinois Sales Tax Securitization Corp., Second Lien, “A”, 5%, 1/01/2030 | 1,750,000 | 2,224,963 | ||
| Illinois Sales Tax Securitization Corp., Second Lien, “A”, 5%, 1/01/2036 | 1,635,000 | 2,023,757 | ||
| Illinois Sales Tax Securitization Corp., Second Lien, “A”, 5%, 1/01/2037 | 2,185,000 | 2,710,838 | ||
| Illinois Sales Tax Securitization Corp., Second Lien, “A”, 4%, 1/01/2038 | 1,050,000 | 1,197,047 | ||
| Illinois Sales Tax Securitization Corp., Second Lien, “A”, 4%, 1/01/2039 | 615,000 | 699,074 | ||
| Illinois Sales Tax Securitization Corp., Second Lien, “A”, 4%, 1/01/2040 | 1,050,000 | 1,195,144 | ||
| Illinois Sports Facilities Authority, State Tax Supported Refunding Rev., AGM, 5%, 6/15/2027 | 1,770,000 | 1,980,094 | ||
| Illinois Sports Facilities Authority, State Tax Supported Refunding Rev., BAM, 5%, 6/15/2028 | 815,000 | 1,012,936 | ||
| Illinois Sports Facilities Authority, State Tax Supported Refunding Rev., BAM, 5%, 6/15/2029 | 1,020,000 | 1,288,476 | ||
| Illinois Sports Facilities Authority, State Tax Supported Refunding Rev., BAM, 5%, 6/15/2030 | 610,000 | 764,556 | ||
| Illinois Toll Highway Authority Rev., “A”, 5%, 12/01/2022 | 5,000,000 | 5,392,120 | ||
| Kane County, IL, East Aurora School District No. 131, “A”, AGM, 4%, 12/01/2033 | 250,000 | 291,634 | ||
| Kane County, IL, East Aurora School District No. 131, “A”, AGM, 4%, 12/01/2036 | 250,000 | 289,122 | ||
| Kane County, IL, East Aurora School District No. 131, “A”, AGM, 4%, 12/01/2039 | 820,000 | 941,125 | ||
| Macon County, IL, Decatur School District No. 61 General Obligation School Rev., “C”, AGM, 4%, 1/01/2035 | 1,875,000 | 2,088,645 | ||
| Macon County, IL, Decatur School District No. 61 General Obligation School Rev., “C”, AGM, 4%, 1/01/2040 | 1,210,000 | 1,333,759 | ||
| Macon County, IL, Decatur School District No. 61 General Obligation School Rev., “C”, AGM, 4%, 1/01/2045 | 1,515,000 | 1,653,859 | ||
| Madison County, IL, Edwardsville Community Unit School District No. 007, BAM, 5%, 12/01/2028 | 765,000 | 911,126 | ||
| Madison County, IL, Edwardsville Community Unit School District No. 007, BAM, 5%, 12/01/2029 | 785,000 | 934,946 | ||
| Issuer | Shares/Par | Value ($) | ||
| Municipal Bonds - continued | ||||
| Illinois - continued | ||||
| Metropolitan Pier & Exposition Authority Refunding Rev. (McCormick Place Expansion Project), Capital Appreciation, “B-1”, AGM, 0%, 6/15/2026 | $ | 2,400,000 | $ 2,254,422 | |
| Metropolitan Pier & Exposition Authority Rev. (McCormick Place Expansion Project), “A”, BAM, 5%, 6/15/2042 | 4,550,000 | 4,688,224 | ||
| Metropolitan Pier & Exposition Authority Rev. (McCormick Place Expansion Project), Capital Appreciation, “A”, AGM, 0%, 12/15/2056 | 5,110,000 | 1,645,990 | ||
| Metropolitan Pier & Exposition Authority, Dedicated State Tax Rev. (McCormick Place Expansion Project), NPFG, 5.5%, 6/15/2029 | 5,725,000 | 6,585,340 | ||
| Northern Illinois University, Auxiliary Facilities System Refunding Rev., “B”, BAM, 4%, 4/01/2036 | 620,000 | 706,776 | ||
| Northern Illinois University, Auxiliary Facilities System Refunding Rev., “B”, BAM, 4%, 4/01/2038 | 700,000 | 792,681 | ||
| Northern Illinois University, Auxiliary Facilities System Refunding Rev., “B”, BAM, 4%, 4/01/2040 | 665,000 | 749,082 | ||
| Northern Illinois University, Auxiliary Facilities System Refunding Rev., “B”, BAM, 4%, 4/01/2041 | 315,000 | 353,769 | ||
| Romeoville, IL, Rev. (Lewis University Project), “A”, 5%, 10/01/2042 | 1,690,000 | 1,828,012 | ||
| Romeoville, IL, Rev. (Lewis University Project), “B”, 5%, 10/01/2039 | 1,390,000 | 1,509,518 | ||
| Romeoville, IL, Rev. (Lewis University Project), “B”, 4.125%, 10/01/2041 | 1,130,000 | 1,175,937 | ||
| Romeoville, IL, Rev. (Lewis University Project), “B”, 4.125%, 10/01/2046 | 1,125,000 | 1,165,003 | ||
| State of Illinois, 5%, 2/01/2025 | 2,600,000 | 2,971,597 | ||
| State of Illinois, 5%, 1/01/2028 | 425,000 | 436,288 | ||
| State of Illinois, 5%, 5/01/2028 | 870,000 | 958,157 | ||
| State of Illinois, 5.25%, 7/01/2028 | 2,530,000 | 2,733,507 | ||
| State of Illinois, 5%, 11/01/2028 | 2,005,000 | 2,346,927 | ||
| State of Illinois, 5%, 2/01/2029 | 2,180,000 | 2,550,085 | ||
| State of Illinois, 4.125%, 11/01/2031 | 1,720,000 | 1,892,720 | ||
| State of Illinois, 4.5%, 11/01/2039 | 1,895,000 | 2,064,188 | ||
| State of Illinois, AGM, 5%, 4/01/2024 | 5,000,000 | 5,398,295 | ||
| State of Illinois, AGM, 5%, 2/01/2027 | 1,465,000 | 1,611,609 | ||
| State of Illinois, AGM, 4%, 2/01/2030 | 720,000 | 805,175 | ||
| State of Illinois, NPFG, 6%, 11/01/2026 | 7,230,000 | 8,741,125 | ||
| State of Illinois, “A”, 5%, 11/01/2027 | 9,820,000 | 11,780,013 | ||
| State of Illinois, “A”, 5%, 11/01/2028 | 13,010,000 | 15,808,882 | ||
| State of Illinois, “A”, 5%, 4/01/2036 | 1,705,000 | 1,797,060 | ||
| State of Illinois, “A”, 5%, 12/01/2024 | 425,000 | 483,694 | ||
| Issuer | Shares/Par | Value ($) | ||
| Municipal Bonds - continued | ||||
| Illinois - continued | ||||
| State of Illinois, “P“, ETM, 6.5%, 6/15/2022 | $ | 1,360,000 | $ 1,403,268 | |
| State of Illinois, General Obligation, 4.875%, 5/01/2021 | �� 845,000 | 847,680 | ||
| State of Illinois, General Obligation, 5.5%, 5/01/2039 | 1,660,000 | 2,042,265 | ||
| State of Illinois, General Obligation, 5.75%, 5/01/2045 | 1,545,000 | 1,921,895 | ||
| State of Illinois, General Obligation, ”A“, 5%, 3/01/2024 | 2,000,000 | 2,230,527 | ||
| State of Illinois, General Obligation, ”A“, 5%, 3/01/2025 | 2,500,000 | 2,862,705 | ||
| State of Illinois, General Obligation, ”A“, 5%, 3/01/2026 | 2,500,000 | 2,926,304 | ||
| State of Illinois, General Obligation, ”B“, 5%, 3/01/2024 | 3,500,000 | 3,903,423 | ||
| State of Illinois, General Obligation, ”B“, 5%, 3/01/2025 | 4,000,000 | 4,580,328 | ||
| State of Illinois, General Obligation, ”B“, 5%, 3/01/2026 | 3,250,000 | 3,804,195 | ||
| State of Illinois, General Obligation, ”C“, 4%, 3/01/2024 | 6,185,000 | 6,721,131 | ||
| State of Illinois, General Obligation, ”C“, 4%, 3/01/2025 | 1,500,000 | 1,660,546 | ||
| University of Illinois, Auxiliary Facilities System Rev., ”A“, BAM, 4%, 4/01/2032 | 2,210,000 | 2,609,667 | ||
| University of Illinois, Auxiliary Facilities System Rev., ”A“, BAM, 4%, 4/01/2035 | 2,950,000 | 3,427,181 | ||
| University of Illinois, Auxiliary Facilities System Rev., ”A“, BAM, 4%, 4/01/2036 | 1,510,000 | 1,747,929 | ||
| University of Illinois, Auxiliary Facilities System Rev., ”A“, BAM, 4%, 4/01/2038 | 1,930,000 | 2,219,256 | ||
| University of Illinois, Auxiliary Facilities System Rev., ”A“, BAM, 4%, 4/01/2039 | 1,705,000 | 1,954,619 | ||
| University of Illinois, Auxiliary Facilities System Rev., ”A“, BAM, 4%, 4/01/2044 | 1,000,000 | 1,131,281 | ||
| Western Illinois Economic Development Authority, Local Government Program Rev. (City of Quincy Project), ”B“, BAM, 4%, 12/01/2029 | 675,000 | 803,087 | ||
| Western Illinois Economic Development Authority, Local Government Program Rev. (City of Quincy Project), ”B“, BAM, 4%, 12/01/2030 | 850,000 | 1,002,360 | ||
| Western Illinois Economic Development Authority, Local Government Program Rev. (City of Quincy Project), ”B“, BAM, 4%, 12/01/2032 | 1,180,000 | 1,330,398 | ||
| Western Illinois Economic Development Authority, Local Government Program Rev. (City of Quincy Project), ”B“, BAM, 4%, 12/01/2034 | 1,755,000 | 1,956,206 | ||
| Western Illinois Economic Development Authority, Local Government Program Rev. (City of Quincy Project), ”B“, BAM, 4%, 12/01/2036 | 2,000,000 | 2,208,380 | ||
| $586,299,050 | ||||
| Issuer | Shares/Par | Value ($) | ||
| Municipal Bonds - continued | ||||
| Indiana - 1.3% | ||||
| Indiana Development Finance Authority Solid Water Disposal Rev. (Waste Management, Inc. Project), 2.95%, 10/01/2031 (Put Date 10/01/2021) | $ | 1,075,000 | $ 1,088,269 | |
| Indiana Finance Authority Environmental Facilities Refunding Rev. (Indianapolis Power & Light Co.), ”B“, 0.95%, 12/01/2038 (Put Date 4/01/2026) | 2,870,000 | 2,825,304 | ||
| Indiana Finance Authority Rev. (BHI Senior Living), ”A“, 6%, 11/15/2041 | 2,840,000 | 3,073,914 | ||
| Indiana Finance Authority Rev. (Marquette Project), ”A“, 5%, 3/01/2030 | 530,000 | 582,940 | ||
| Indiana Finance Authority Rev. (Marquette Project), ”A“, 5%, 3/01/2039 | 1,340,000 | 1,449,344 | ||
| Indiana Finance Authority Rev. (Ohio River Bridges East End Crossing Project), ”A“, 5%, 7/01/2035 | 2,190,000 | 2,370,488 | ||
| Indiana Finance Authority Rev. (State Revolving Fund Program), ”A“, 5%, 2/01/2029 (Prerefunded 2/01/2022) | 4,000,000 | 4,161,383 | ||
| Indiana Finance Authority, Health Facilities Rev. (Baptist Healthcare System Obligated Group), 5%, 8/15/2051 | 5,955,000 | 6,950,029 | ||
| Indiana Housing & Community Development Authority, Single Family Mortgage Rev., ”A“, GNMA, 4%, 7/01/2048 | 2,875,000 | 3,145,023 | ||
| Indiana Housing & Community Development Authority, Single Family Mortgage Rev., ”A“, GNMA, 3%, 7/01/2051 | 1,400,000 | 1,532,930 | ||
| Indiana Housing & Community Development Authority, Single Family Mortgage Rev., ”B-1“, GNMA, 3.25%, 7/01/2049 | 2,555,000 | 2,769,063 | ||
| Indianapolis, IN, Local Public Improvement (Indianapolis Airport Authority Project), ”D“, 5%, 1/01/2027 | 11,000,000 | 13,369,403 | ||
| Indianapolis, IN, Local Public Improvement (Indianapolis Airport Authority Project), ”I“, 5%, 1/01/2028 | 1,995,000 | 2,303,013 | ||
| Indianapolis, IN, Local Public Improvement, ”A“, 5%, 6/01/2027 | 7,000,000 | 8,565,705 | ||
| Indianapolis, IN, Water System First Lien Refunding Rev., ”A“, 5%, 10/01/2037 | 5,250,000 | 6,564,902 | ||
| Knox County, IN, Economic Development Rev. (Good Samaritan Hospital), ”A“, 5%, 4/01/2042 | 1,170,000 | 1,208,811 | ||
| Lake County, IN, Hammond Multi-School Building Corp., 5%, 7/15/2032 | 625,000 | 776,054 | ||
| Lake County, IN, Hammond Multi-School Building Corp., 5%, 7/15/2033 | 455,000 | 562,449 | ||
| Lake County, IN, Hammond Multi-School Building Corp., 5%, 7/15/2035 | 565,000 | 692,938 | ||
| Lake County, IN, Hammond Multi-School Building Corp., 5%, 7/15/2038 | 1,700,000 | 2,065,155 | ||
| Issuer | Shares/Par | Value ($) | ||
| Municipal Bonds - continued | ||||
| Indiana - continued | ||||
| Mount Vernon, IN, Environmental Improvement Rev. (Southern Indiana Gas and Electric Co. Project), 0.875%, 9/01/2055 (Put Date 9/01/2023) | $ | 3,965,000 | $ 3,964,868 | |
| St. Joseph County, IN, Educational Facilities Rev. (University of Notre Dame), 6.5%, 3/01/2026 | 1,000,000 | 1,282,843 | ||
| Valparaiso, IN, Exempt Facilities Rev. (Pratt Paper LLC Project), 6.75%, 1/01/2034 | 330,000 | 371,279 | ||
| Valparaiso, IN, Exempt Facilities Rev. (Pratt Paper LLC Project), 7%, 1/01/2044 | 755,000 | 845,426 | ||
| Warrick County, IN, Environmental Improvement Rev. (Southern Indiana Gas And Electric Co.), 0.875%, 9/01/2055 (Put Date 9/01/2023) | 2,510,000 | 2,509,916 | ||
| $75,031,449 | ||||
| Iowa - 0.5% | ||||
| Iowa Finance Authority Health Facilities Rev. (UnityPoint Health), ”A“, 5.25%, 2/15/2044 (Prerefunded 2/15/2023) | $ | 3,000,000 | $ 3,284,832 | |
| Iowa Finance Authority Health Facilities Rev. (UnityPoint Health), ”C“, 5%, 2/15/2030 | 1,200,000 | 1,335,593 | ||
| Iowa Finance Authority Health Facilities Rev. (UnityPoint Health), ”C“, 5%, 2/15/2031 | 2,230,000 | 2,458,003 | ||
| Iowa Finance Authority Health Facilities Rev. (UnityPoint Health), ”C“, 5%, 2/15/2032 | 1,085,000 | 1,205,320 | ||
| Iowa Finance Authority Senior Housing Rev. (Northcrest, Inc. Project), ”A“, 5%, 3/01/2033 | 745,000 | 807,297 | ||
| Iowa Finance Authority Senior Housing Rev. (Northcrest, Inc. Project), ”A“, 5%, 3/01/2038 | 615,000 | 662,647 | ||
| Iowa Finance Authority Senior Housing Rev. (Northcrest, Inc. Project), ”A“, 5%, 3/01/2048 | 1,125,000 | 1,200,740 | ||
| Iowa Finance Authority, Single Family Mortgage Rev., ”A“, FNMA, 4%, 7/01/2047 | 935,000 | 1,019,897 | ||
| Iowa Finance Authority, Single Family Mortgage Rev., ”A“, GNMA, 3%, 1/01/2047 | 4,305,000 | 4,716,759 | ||
| Iowa Student Loan Liquidity Corp. Rev., ”B“, 3%, 12/01/2039 | 1,965,000 | 1,941,110 | ||
| Iowa Student Loan Liquidity Corp. Rev., ”B“, 3.5%, 12/01/2044 | 5,865,000 | 5,902,659 | ||
| Iowa Tobacco Settlement Authority, Tobacco Settlement Rev., Asset-Backed, ”B“, 5.6%, 6/01/2034 | 3,070,000 | 3,111,970 | ||
| $27,646,827 | ||||
| Issuer | Shares/Par | Value ($) | ||
| Municipal Bonds - continued | ||||
| Kansas - 0.8% | ||||
| Coffeyville, KS, Electric Utility System Rev., ”B“, NPFG, 5%, 6/01/2038 (Prerefunded 6/01/2025) (n) | $ | 3,800,000 | $ 4,440,812 | |
| Coffeyville, KS, Electric Utility System Rev., ”B“, NPFG, 5%, 6/01/2042 (Prerefunded 6/01/2025) (n) | 1,500,000 | 1,752,952 | ||
| Hutchinson, KS, Hospital Facilities Rev. (Hutchinson Regional Medical Center, Inc.), 5%, 12/01/2036 | 1,295,000 | 1,427,894 | ||
| Hutchinson, KS, Hospital Facilities Rev. (Hutchinson Regional Medical Center, Inc.), 5%, 12/01/2041 | 680,000 | 739,101 | ||
| Lyon County, KS, School District No. 253 General Obligation, 4%, 9/01/2032 | 125,000 | 144,559 | ||
| Lyon County, KS, School District No. 253 General Obligation, 4%, 9/01/2033 | 520,000 | 599,465 | ||
| Lyon County, KS, School District No. 253 General Obligation, 4%, 9/01/2034 | 585,000 | 672,680 | ||
| Lyon County, KS, School District No. 253 General Obligation, 4%, 9/01/2039 | 3,000,000 | 3,380,422 | ||
| Overland Park, KS, Development Corp. Improvement and Refunding Rev. (Overland Park Convention Center Hotel), 5%, 3/01/2032 | 1,030,000 | 1,060,710 | ||
| Overland Park, KS, Development Corp. Improvement and Refunding Rev. (Overland Park Convention Center Hotel), 5%, 3/01/2033 | 1,085,000 | 1,118,336 | ||
| Overland Park, KS, Development Corp. Improvement and Refunding Rev. (Overland Park Convention Center Hotel), 5%, 3/01/2034 | 1,145,000 | 1,179,117 | ||
| Overland Park, KS, Development Corp. Improvement and Refunding Rev. (Overland Park Convention Center Hotel), 5%, 3/01/2036 | 1,260,000 | 1,296,740 | ||
| Overland Park, KS, Development Corp. Improvement and Refunding Rev. (Overland Park Convention Center Hotel), 5%, 3/01/2038 | 1,395,000 | 1,432,165 | ||
| Overland Park, KS, Development Corp. Improvement and Refunding Rev. (Overland Park Convention Center Hotel), 5%, 3/01/2044 | 1,510,000 | 1,535,864 | ||
| Overland Park, KS, Development Corp. Improvement and Refunding Rev. (Overland Park Convention Center Hotel), 5%, 3/01/2049 | 2,160,000 | 2,190,513 | ||
| Sedgwick County, KS, Unified School District No. 266 General Obligation, ”A“, 4%, 9/01/2031 | 1,145,000 | 1,343,015 | ||
| Sedgwick County, KS, Unified School District No. 266 General Obligation, ”A“, 4%, 9/01/2032 | 855,000 | 1,001,345 | ||
| University of Kansas Hospital Authority, Health Facilities Rev. (University of Kansas Health System), ”A“, 5%, 9/01/2048 | 13,460,000 | 16,165,589 | ||
| Issuer | Shares/Par | Value ($) | ||
| Municipal Bonds - continued | ||||
| Kansas - continued | ||||
| Wichita, KS, Health Care Facilities Rev. (Presbyterian Manors, Inc.), ”I“, 5%, 5/15/2033 | $ | 145,000 | $ 151,246 | |
| Wichita, KS, Health Care Facilities Rev. (Presbyterian Manors, Inc.), ”I“, 5%, 5/15/2038 | 175,000 | 180,052 | ||
| Wichita, KS, Health Care Facilities Rev. (Presbyterian Manors, Inc.), ”I“, 4.625%, 5/15/2041 | 145,000 | 143,775 | ||
| Wichita, KS, Health Care Facilities Rev. (Presbyterian Manors, Inc.), ”I“, 5%, 5/15/2047 | 720,000 | 727,688 | ||
| Wichita, KS, Sales Tax Special Obligations Rev. (K-96 Greenwich Star Bond Project), 4.2%, 9/01/2027 | 1,390,000 | 1,421,983 | ||
| Wyandotte County/Kansas City, KS, Unified Government Community Improvement District Sales Tax Rev. (Legends Apartments Garage & West Lawn Project), 4.5%, 6/01/2040 | 490,000 | 505,523 | ||
| $44,611,546 | ||||
| Kentucky - 1.8% | ||||
| Commonwealth of Kentucky State Property & Buildings Commission Rev. (Project No. 119), BAM, 5%, 5/01/2032 | $ | 810,000 | $ 1,010,905 | |
| Commonwealth of Kentucky State Property & Buildings Commission Rev. (Project No. 119), BAM, 5%, 5/01/2033 | 800,000 | 994,991 | ||
| Commonwealth of Kentucky State Property & Buildings Commission Rev. (Project No. 119), BAM, 5%, 5/01/2034 | 910,000 | 1,128,219 | ||
| Kentucky Economic Development Finance Authority Hospital Rev. (Baptist Healthcare System), 5.25%, 8/15/2046 (Put Date 8/15/2021) | 2,360,000 | 2,403,081 | ||
| Kentucky Economic Development Finance Authority Hospital Rev. (Baptist Healthcare System), ”B“, 5%, 8/15/2037 | 590,000 | 702,879 | ||
| Kentucky Economic Development Finance Authority Hospital Rev. (Baptist Healthcare System), ”B“, 5%, 8/15/2041 | 4,235,000 | 5,001,318 | ||
| Kentucky Economic Development Finance Authority Hospital Rev. (Baptist Healthcare System), ”B“, 5%, 8/15/2046 | 2,685,000 | 3,145,095 | ||
| Kentucky Economic Development Finance Authority Hospital Rev. (Owensboro Health, Inc.), ”A“, 5%, 6/01/2037 | 2,530,000 | 2,841,904 | ||
| Kentucky Economic Development Finance Authority Hospital Rev. (Owensboro Health, Inc.), ”A“, 5%, 6/01/2041 | 1,655,000 | 1,844,467 | ||
| Kentucky Economic Development Finance Authority Hospital Rev. (Owensboro Health, Inc.), ”A“, 5.25%, 6/01/2041 | 1,290,000 | 1,459,588 | ||
| Kentucky Economic Development Finance Authority Hospital Rev. (Owensboro Health, Inc.), ”A“, 5%, 6/01/2045 | 2,070,000 | 2,286,620 | ||
| Kentucky Economic Development Finance Authority Louisville Arena Project Rev. (Louisville Arena Authority, Inc.), ”A“, AGM, 5%, 12/01/2045 | 3,390,000 | 4,099,176 | ||
| Issuer | Shares/Par | Value ($) | ||
| Municipal Bonds - continued | ||||
| Kentucky - continued | ||||
| Kentucky Economic Development Finance Authority Louisville Arena Project Rev. (Louisville Arena Authority, Inc.), ”A“, AGM, 5%, 12/01/2047 | $ | 1,895,000 | $ 2,022,257 | |
| Kentucky Higher Education Student Loan Corp. Rev., Tax-Exempt, ”B-1“, 5%, 6/01/2036 | 6,475,000 | 7,356,321 | ||
| Kentucky Turnpike Authority, Economic Development Road Rev. (Revitalization Projects), ”A“, 5%, 7/01/2032 | 2,000,000 | 2,194,691 | ||
| Owen County, KY, Water Facilities Refunding Rev. (Kentucky-American Water Co. Project), 0.7%, 6/01/2040 (Put Date 9/01/2023) | 1,650,000 | 1,646,218 | ||
| Public Energy Authority of Kentucky, Gas Supply Rev., ”B“, 4%, 1/01/2049 (Put Date 1/01/2025) | 3,215,000 | 3,557,135 | ||
| Public Energy Authority of Kentucky, Gas Supply Rev., ”C“, 4%, 2/01/2050 (Put Date 2/01/2028) | 6,935,000 | 8,128,366 | ||
| Public Energy Authority of Kentucky, Gas Supply Rev., ”C-1“, 4%, 12/01/2049 (Put Date 6/01/2025) | 31,565,000 | 35,518,860 | ||
| Trimble, KY, Pollution Control Refunding Rev. (Louisville Gas & Electric Co. Project), ”A“, 1.3%, 9/01/2044 (Put Date 9/01/2027) | 12,500,000 | 12,367,120 | ||
| $99,709,211 | ||||
| Louisiana - 1.9% | ||||
| East Baton Rouge, LA, Sewerage Commission Multi-Modal Rev., ”A“, 1.3%, 2/01/2041 (Put Date 2/01/2028) | $ | 9,430,000 | $ 9,545,681 | |
| Jefferson Parish, LA, Hospital Service District No. 2 Hospital Rev. (East Jefferson General Hospital), 6.25%, 7/01/2031 (Prerefunded 7/01/2021) | 3,355,000 | 3,403,770 | ||
| Louisiana Citizens Property Insurance Corp. Rev., AGM, 5%, 6/01/2022 | 1,470,000 | 1,551,927 | ||
| Louisiana Local Government, Environmental Facilities & Community Development Authority Rev. (CDF Healthcare), ”A“, 5.625%, 6/01/2045 | 4,900,000 | 5,091,441 | ||
| Louisiana Local Government, Environmental Facilities & Community Development Authority Rev. (Ragin' Cajun Facilities, Inc. - Student Housing & Parking Project), AGM, 5%, 10/01/2043 | 590,000 | 693,943 | ||
| Louisiana Local Government, Environmental Facilities & Community Development Authority Rev. (Ragin' Cajun Facilities, Inc. - Student Housing & Parking Project), AGM, 5%, 10/01/2048 | 2,555,000 | 2,987,842 | ||
| Louisiana Local Government, Environmental Facilities & Community Development Authority Rev. (St. James Place of Baton Rouge Project), ”A“, 6%, 11/15/2035 | 580,000 | 631,432 | ||
| Issuer | Shares/Par | Value ($) | ||
| Municipal Bonds - continued | ||||
| Louisiana - continued | ||||
| Louisiana Local Government, Environmental Facilities & Community Development Authority Rev. (St. James Place of Baton Rouge Project), ”A“, 6.25%, 11/15/2045 | $ | 2,240,000 | $ 2,425,687 | |
| Louisiana Local Government, Environmental Facilities & Community Development Authority Student Housing Rev. (Provident Group - ULM Properties LLC - University of Louisiana at Monroe Project), ”A“, 5%, 7/01/2029 (n) | 480,000 | 508,457 | ||
| Louisiana Local Government, Environmental Facilities & Community Development Authority Student Housing Rev. (Provident Group - ULM Properties LLC - University of Louisiana at Monroe Project), ”A“, 5%, 7/01/2039 (n) | 1,200,000 | 1,216,901 | ||
| Louisiana Local Government, Environmental Facilities & Community Development Authority Student Housing Rev. (Provident Group - ULM Properties LLC - University of Louisiana at Monroe Project), ”A“, 5%, 7/01/2054 (n) | 1,925,000 | 1,910,958 | ||
| Louisiana Offshore Terminal Authority, Deepwater Port Rev. (Loop LLC Project), ”A“, 1.65%, 9/01/2027 (Put Date 12/01/2023) | 5,020,000 | 5,096,265 | ||
| Louisiana Offshore Terminal Authority, Deepwater Port Rev. (Loop LLC Project), ”A“, 1.65%, 9/01/2033 (Put Date 12/01/2023) | 4,075,000 | 4,136,908 | ||
| Louisiana Offshore Terminal Authority, Deepwater Port Rev. (Loop LLC Project), ”A“, 1.65%, 9/01/2034 (Put Date 12/01/2023) | 3,140,000 | 3,187,704 | ||
| Louisiana Public Facilities Authority Refunding Rev. (Tulane University Project), ”A“, 5%, 4/01/2045 | 4,910,000 | 6,041,490 | ||
| Louisiana Public Facilities Authority Rev. (Loyola University Project), Convertible Capital Appreciation, 0% to 10/01/2023, 5.25% to 10/01/2046 | 5,465,000 | 5,526,663 | ||
| Louisiana Public Facilities Authority Rev. (LSU Health Foundation, New Orleans Project), ”A-1“, 5.375%, 1/01/2040 (n) | 4,035,000 | 4,522,691 | ||
| Louisiana Public Facilities Authority Rev. (Provident Group - HSC Properties, Inc., LSU Health Foundation and New Orleans Project), ”A-1“, 5.5%, 1/01/2050 (n) | 2,765,000 | 3,078,949 | ||
| Louisiana Public Facilities Authority Rev. (Provident Group - HSC Properties, Inc., LSU Health Foundation and New Orleans Project), ”A-1“, 5.1%, 1/01/2057 (n) | 9,290,000 | 9,965,975 | ||
| Louisiana Stadium & Exposition District Rev., 5%, 7/03/2023 | 5,850,000 | 6,303,441 | ||
| Louisiana Stadium & Exposition District Rev., ”A“, 5%, 7/01/2023 | 1,325,000 | 1,458,977 | ||
| Louisiana Stadium & Exposition District Rev., ”A“, 5%, 7/01/2024 | 1,270,000 | 1,398,716 | ||
| Issuer | Shares/Par | Value ($) | ||
| Municipal Bonds - continued | ||||
| Louisiana - continued | ||||
| Louisiana Stadium & Exposition District Rev., ”A“, 5%, 7/01/2025 | $ | 1,000,000 | $ 1,100,169 | |
| New Orleans, LA, Aviation Board Special Facility Rev. (Parking Facilities Corp. Consolidated Garage System), ”A“, AGM, 5%, 10/01/2043 | 745,000 | 904,159 | ||
| New Orleans, LA, Aviation Board Special Facility Rev. (Parking Facilities Corp. Consolidated Garage System), ”A“, AGM, 5%, 10/01/2048 | 1,210,000 | 1,402,399 | ||
| New Orleans, LA, Regional Transit Authority Sale Tax Refunding Rev., ”A“, AGM, 5%, 1/01/2032 | 2,575,000 | 3,332,841 | ||
| New Orleans, LA, Regional Transit Authority Sale Tax Refunding Rev., ”A“, AGM, 5%, 1/01/2033 | 5,815,000 | 7,492,389 | ||
| New Orleans, LA, Regional Transit Authority Sale Tax Refunding Rev., ”A“, AGM, 5%, 1/01/2034 | 5,315,000 | 6,785,684 | ||
| New Orleans, LA, Sewerage Services Rev., 5%, 12/01/2040 (Prerefunded 12/01/2025) | 800,000 | 957,698 | ||
| Shreveport, LA, Water & Sewer Rev., ”B“, AGM, 4%, 12/01/2044 | 1,000,000 | 1,123,667 | ||
| Shreveport, LA, Water & Sewer Rev., ”B“, AGM, 4%, 12/01/2049 | 1,250,000 | 1,394,289 | ||
| St. Charles Parish, LA, Gulf Zone Opportunity Zone Rev. (Valero Energy Corp.), 4%, 12/01/2040 (Put Date 6/01/2022) | 2,000,000 | 2,081,151 | ||
| $107,260,264 | ||||
| Maine - 0.5% | ||||
| Maine Finance Authority Solid Waste Disposal Rev. (Casella Waste Systems, Inc.), ”R-2“, 4.375%, 8/01/2035 (Put Date 8/01/2025) (n) | $ | 1,140,000 | $ 1,251,051 | |
| Maine Finance Authority Solid Waste Disposal Rev. (Casella Waste Systems, Inc.), ”R-3“, 5.25%, 1/01/2025 (n) | 570,000 | 636,181 | ||
| Maine Health and Higher Educational Facilities Authority Rev. (MaineHealth), ”A“, 4%, 7/01/2036 | 1,475,000 | 1,741,501 | ||
| Maine Health and Higher Educational Facilities Authority Rev. (MaineHealth), ”A“, 4%, 7/01/2037 | 1,200,000 | 1,411,698 | ||
| Maine Health and Higher Educational Facilities Authority Rev. (MaineHealth), ”A“, 4%, 7/01/2038 | 1,250,000 | 1,462,579 | ||
| Maine Health and Higher Educational Facilities Authority Rev. (MaineHealth), ”A“, 4%, 7/01/2039 | 1,550,000 | 1,806,911 | ||
| Maine Health and Higher Educational Facilities Authority Rev. (MaineHealth), ”A“, 4%, 7/01/2040 | 2,200,000 | 2,556,191 | ||
| Maine Health and Higher Educational Facilities Authority Rev. (MaineHealth), ”A“, 4%, 7/01/2045 | 3,015,000 | 3,442,285 | ||
| Issuer | Shares/Par | Value ($) | ||
| Municipal Bonds - continued | ||||
| Maine - continued | ||||
| Maine Health and Higher Educational Facilities Authority Rev. (MaineHealth), ”A“, 4%, 7/01/2050 | $ | 5,375,000 | $ 6,102,174 | |
| Maine Housing Authority Mortgage, ”C“, 4%, 11/15/2050 | 3,485,000 | 3,917,303 | ||
| Maine Housing Authority Mortgage, ”C-1“, 3.5%, 11/15/2044 | 1,660,000 | 1,731,743 | ||
| $26,059,617 | ||||
| Maryland - 1.7% | ||||
| Baltimore, MD, Convention Center Hotel Rev., 5%, 9/01/2046 | $ | 2,180,000 | $ 2,198,000 | |
| Baltimore, MD, Project Rev. (Water Projects), ”A“, 4%, 7/01/2039 | 1,500,000 | 1,767,478 | ||
| Baltimore, MD, Special Obligation (East Baltimore Research Park Project), ”A“, 5%, 9/01/2038 | 1,565,000 | 1,691,153 | ||
| Baltimore, MD, Subordinate Project Rev. (Mayor and City Council of Baltimore Water Projects), ”A“, 5%, 7/01/2041 | 5,000,000 | 5,911,905 | ||
| Brunswick, MD, Special Obligation Refunding (Brunswick Crossing Special Taxing District), 4%, 7/01/2029 | 380,000 | 437,761 | ||
| Brunswick, MD, Special Obligation Refunding (Brunswick Crossing Special Taxing District), 5%, 7/01/2036 | 420,000 | 495,391 | ||
| Frederick County, MD, Limited Obligation (Jefferson Technology Park Project), ”B“, 4.625%, 7/01/2043 (n) | 970,000 | 1,109,364 | ||
| Howard County, MD, Special Obligation (Downtown Columbia Project), ”A“, 4.125%, 2/15/2034 (n) | 150,000 | 156,539 | ||
| Howard County, MD, Special Obligation (Downtown Columbia Project), ”A“, 4.375%, 2/15/2039 (n) | 155,000 | 162,280 | ||
| Howard County, MD, Special Obligation (Downtown Columbia Project), ”A“, 4.5%, 2/15/2047 (n) | 1,105,000 | 1,150,955 | ||
| Maryland Community Development Administration, Department of Housing & Community Development Housing Rev., ”A“, 4.5%, 9/01/2048 (u) | 8,745,000 | 9,894,180 | ||
| Maryland Community Development Administration, Department of Housing & Community Development Housing Rev., ”B“, 4.5%, 9/01/2048 (u) | 7,100,000 | 7,975,518 | ||
| Maryland Community Development Administration, Department of Housing & Community Development Housing Rev., ”C“, 4%, 9/01/2044 | 1,615,000 | 1,718,150 | ||
| Maryland Community Development Administration, Department of Housing & Community Development Residential Rev., ”A“, 3%, 9/01/2051 | 8,235,000 | 9,025,545 | ||
| Maryland Community Development Administration, Department of Housing & Community Development Residential Rev., ”C“, 5%, 9/01/2026 | 300,000 | 365,571 | ||
| Issuer | Shares/Par | Value ($) | ||
| Municipal Bonds - continued | ||||
| Maryland - continued | ||||
| Maryland Community Development Administration, Department of Housing & Community Development Residential Rev., ”C“, 5%, 9/01/2027 | $ | 455,000 | $ 567,323 | |
| Maryland Community Development Administration, Department of Housing & Community Development Residential Rev., ”C“, 5%, 9/01/2028 | 355,000 | 451,983 | ||
| Maryland Community Development Administration, Department of Housing & Community Development Residential Rev., ”D“, 3.25%, 9/01/2050 | 10,430,000 | 11,470,388 | ||
| Maryland Economic Development Corp. Rev. (Transportation Facilities Project), ”A“, 5%, 6/01/2030 | 180,000 | 209,640 | ||
| Maryland Economic Development Corp. Rev. (Transportation Facilities Project), ”A“, 5%, 6/01/2032 | 125,000 | 144,026 | ||
| Maryland Economic Development Corp. Rev. (Transportation Facilities Project), ”A“, 5%, 6/01/2035 | 225,000 | 257,191 | ||
| Maryland Economic Development Corp., Senior Student Housing Rev. (University of Maryland, College Park Projects), AGM, 5%, 6/01/2035 | 695,000 | 807,337 | ||
| Maryland Economic Development Corp., Special Obligation (Port Covington Project), 3.25%, 9/01/2030 (n) | 235,000 | 255,025 | ||
| Maryland Economic Development Corp., Special Obligation (Port Covington Project), 4%, 9/01/2040 (n) | 830,000 | 915,453 | ||
| Maryland Economic Development Corp., Special Obligation (Port Covington Project), 4%, 9/01/2050 (n) | 965,000 | 1,040,268 | ||
| Maryland Economic Development Corp., Student Housing Rev. (Morgan State University Project), 4%, 7/01/2040 | 910,000 | 1,002,217 | ||
| Maryland Economic Development Corp., Student Housing Rev. (Morgan State University Project), 4.25%, 7/01/2050 | 875,000 | 964,137 | ||
| Maryland Economic Development Corp., Student Housing Rev. (Morgan State University Project), 5%, 7/01/2050 | 575,000 | 678,353 | ||
| Maryland Economic Development Corp., Student Housing Rev. (Morgan State University Project), 5%, 7/01/2056 | 1,070,000 | 1,256,610 | ||
| Maryland Economic Development Corp., Subordinate Parking Facilities Rev. (Baltimore City Project), ”C“, 4%, 6/01/2038 | 180,000 | 170,344 | ||
| Maryland Economic Development Corp., Subordinate Parking Facilities Rev. (Baltimore City Project), ”C“, 4%, 6/01/2048 | 550,000 | 489,710 | ||
| Maryland Economic Development Corp., Subordinate Parking Facilities Rev. (Baltimore City Project), ”C“, 4%, 6/01/2058 | 1,610,000 | 1,382,687 | ||
| Maryland Health & Higher Education Facility Authority Rev., Adventist Healthcare Issue, 5%, 1/01/2036 (w) | 730,000 | 877,909 | ||
| Maryland Health & Higher Education Facility Authority Rev., Adventist Healthcare Issue, 4%, 1/01/2038 | 410,000 | 452,141 | ||
| Issuer | Shares/Par | Value ($) | ||
| Municipal Bonds - continued | ||||
| Maryland - continued | ||||
| Maryland Health & Higher Educational Facilities Authority Rev. (Adventist Healthcare Issue), ”A“, 5.5%, 1/01/2036 | $ | 5,090,000 | $ 6,018,432 | |
| Maryland Health & Higher Educational Facilities Authority Rev. (Doctors Community Hospital), ”A“, 5%, 7/01/2033 | 1,745,000 | 2,007,386 | ||
| Maryland Health & Higher Educational Facilities Authority Rev. (Doctors Community Hospital), ”A“, 5%, 7/01/2034 | 1,090,000 | 1,249,262 | ||
| Maryland Health & Higher Educational Facilities Authority Rev. (Doctors Community Hospital), ”A“, 5%, 7/01/2038 | 4,845,000 | 5,478,697 | ||
| Maryland Health & Higher Educational Facilities Authority Rev. (Medstar Health Issue), 5%, 8/15/2025 | 6,425,000 | 7,500,015 | ||
| Prince George's County, MD, Special Obligation (Westphalia Town Center Project), 5.125%, 7/01/2039 (n) | 555,000 | 609,225 | ||
| Prince George's County, MD, Special Obligation (Westphalia Town Center Project), 5.25%, 7/01/2048 (n) | 545,000 | 597,569 | ||
| Rockville, MD, Mayor & Council Economic Development Refunding Rev. (Ingleside at King Farm Project), ”A-1“, 5%, 11/01/2037 | 185,000 | 193,850 | ||
| Rockville, MD, Mayor & Council Economic Development Rev. (Ingleside at King Farm Project), ”B“, 5%, 11/01/2042 | 315,000 | 326,403 | ||
| Rockville, MD, Mayor & Council Economic Development Rev. (Ingleside at King Farm Project), ”B“, 5%, 11/01/2047 | 330,000 | 339,854 | ||
| State of Maryland, ”B“, 4%, 8/01/2027 | 2,570,000 | 2,687,011 | ||
| $94,460,236 | ||||
| Massachusetts - 3.4% | ||||
| Commonwealth of Massachusetts Transportation Fund Rev. (Accelerated Bridge Program), ”A“, 5%, 6/01/2023 | $ | 2,645,000 | $ 2,915,842 | |
| Commonwealth of Massachusetts Transportation Fund Rev., ”A“, 5%, 6/01/2043 | 9,290,000 | 11,360,390 | ||
| Commonwealth of Massachusetts, ”A“, AAC, 5.5%, 8/01/2030 | 5,000,000 | 6,809,657 | ||
| Commonwealth of Massachusetts, General Obligation Consolidated Loan, ”H“, 5%, 12/01/2026 | 10,000,000 | 12,421,379 | ||
| Massachusetts Bay Transportation Authority, Sales Tax Rev., ”A“, 5%, 7/01/2024 | 9,445,000 | 10,865,813 | ||
| Massachusetts College Building Authority Project Rev., ”A“, 5%, 5/01/2031 (Prerefunded 5/01/2023) | 2,395,000 | 2,634,185 | ||
| Massachusetts Development Finance Agency Lease Rev. (University of Massachusetts at Dartmouth, College of Visual & Performing Arts Project), 6%, 8/01/2021 | 275,000 | 280,198 | ||
| Massachusetts Development Finance Agency Rev. (Atrius Health Issue), ”A“, 5%, 6/01/2039 | 945,000 | 1,156,443 | ||
| Massachusetts Development Finance Agency Rev. (Beth Israel Health, Inc.), ”2018 I-2“, 5%, 7/01/2053 | 8,670,000 | 10,285,017 | ||
| Issuer | Shares/Par | Value ($) | ||
| Municipal Bonds - continued | ||||
| Massachusetts - continued | ||||
| Massachusetts Development Finance Agency Rev. (Beth Israel Lahey Health), ”K“, 5%, 7/01/2031 | $ | 1,130,000 | $ 1,439,575 | |
| Massachusetts Development Finance Agency Rev. (Beth Israel Lahey Health), ”K“, 5%, 7/01/2032 | 1,145,000 | 1,452,952 | ||
| Massachusetts Development Finance Agency Rev. (CareGroup), ”J-1“, 5%, 7/01/2048 | 3,000,000 | 3,578,844 | ||
| Massachusetts Development Finance Agency Rev. (Emerson College), 5%, 1/01/2029 | 1,550,000 | 1,749,753 | ||
| Massachusetts Development Finance Agency Rev. (Emerson College), 5%, 1/01/2030 | 3,225,000 | 3,621,126 | ||
| Massachusetts Development Finance Agency Rev. (Emerson College), 5%, 1/01/2031 | 895,000 | 1,000,615 | ||
| Massachusetts Development Finance Agency Rev. (Emerson College), ”A“, 5.25%, 1/01/2042 | 250,000 | 290,375 | ||
| Massachusetts Development Finance Agency Rev. (Emmanuel College), ”A“, 5%, 10/01/2043 | 3,515,000 | 3,997,241 | ||
| Massachusetts Development Finance Agency Rev. (Emmanuel College), “A”, 4%, 10/01/2046 | 790,000 | 844,608 | ||
| Massachusetts Development Finance Agency Rev. (Lahey Health System Obligated Group), ”F“, 5%, 8/15/2030 | 1,000,000 | 1,172,024 | ||
| Massachusetts Development Finance Agency Rev. (Milford Regional Medical Center), ”F“, 5.75%, 7/15/2043 | 460,000 | 488,293 | ||
| Massachusetts Development Finance Agency Rev. (Newbridge on the Charles, Inc.), 5%, 10/01/2037 (n) | 110,000 | 120,712 | ||
| Massachusetts Development Finance Agency Rev. (Newbridge on the Charles, Inc.), 5%, 10/01/2047 (n) | 1,530,000 | 1,672,471 | ||
| Massachusetts Development Finance Agency Rev. (Newbridge on the Charles, Inc.), 5%, 10/01/2057 (n) | 2,960,000 | 3,230,969 | ||
| Massachusetts Development Finance Agency Rev. (North Hill Communities), ”A“, 6.25%, 11/15/2033 (Prerefunded 11/15/2023) (n) | 275,000 | 318,150 | ||
| Massachusetts Development Finance Agency Rev. (North Hill Communities), ”A“, 6.5%, 11/15/2043 (Prerefunded 11/15/2023) (n) | 435,000 | 505,589 | ||
| Massachusetts Development Finance Agency Rev. (Partners Healthcare), ”L“, 5%, 7/01/2031 (Prerefunded 7/01/2021) | 1,430,000 | 1,446,416 | ||
| Massachusetts Development Finance Agency Rev. (Partners Healthcare), ”L“, 5%, 7/01/2036 (Prerefunded 7/01/2021) | 1,670,000 | 1,689,171 | ||
| Massachusetts Development Finance Agency Rev. (Partners Healthcare), ”S“, 5%, 7/01/2032 | 1,275,000 | 1,583,529 | ||
| Massachusetts Development Finance Agency Rev. (Partners Healthcare), Unrefunded Balance, ”L“, 5%, 7/01/2031 (Prerefunded 7/01/2021) | 1,350,000 | 1,365,662 | ||
| Issuer | Shares/Par | Value ($) | ||
| Municipal Bonds - continued | ||||
| Massachusetts - continued | ||||
| Massachusetts Development Finance Agency Rev. (Sabis International Charter School Issue), 5%, 4/15/2025 | $ | 305,000 | $ 322,909 | |
| Massachusetts Development Finance Agency Rev. (Suffolk University), 5%, 7/01/2033 | 605,000 | 719,509 | ||
| Massachusetts Development Finance Agency Rev. (Suffolk University), 5%, 7/01/2034 | 710,000 | 841,243 | ||
| Massachusetts Development Finance Agency Rev. (UMass Memorial Health Care Obligated Group), ”I“, 5%, 7/01/2036 | 1,440,000 | 1,706,395 | ||
| Massachusetts Development Finance Agency Rev. (UMass Memorial Health Care Obligated Group), ”K“, 5%, 7/01/2038 | 1,300,000 | 1,549,530 | ||
| Massachusetts Development Finance Agency Rev. (Wellforce Inc.), ”C“, AGM, 5%, 10/01/2032 | 850,000 | 1,090,634 | ||
| Massachusetts Development Finance Agency Rev. (Wellforce Inc.), ”C“, AGM, 5%, 10/01/2033 | 525,000 | 670,199 | ||
| Massachusetts Development Finance Agency Rev. (Wellforce, Inc.), ”A“, 4%, 7/01/2044 | 2,240,000 | 2,481,905 | ||
| Massachusetts Development Finance Agency Rev. (Wellforce, Inc.), ”A“, 5%, 7/01/2044 | 935,000 | 1,119,697 | ||
| Massachusetts Development Finance Agency Rev. (Wentworth Institute of Technology Issue), 5%, 10/01/2046 | 1,145,000 | 1,294,794 | ||
| Massachusetts Development Finance Agency, Solid Waste Disposal Rev. (Waste Management, Inc. Project), 2.45%, 5/01/2027 (Put Date 5/03/2021) (n) | 3,695,000 | 3,701,372 | ||
| Massachusetts Educational Financing Authority, Education Loan Rev., ”B“, 3%, 7/01/2035 | 4,210,000 | 4,299,938 | ||
| Massachusetts Educational Financing Authority, Education Loan Rev., ”C“, 2.625%, 7/01/2036 | 1,455,000 | 1,465,019 | ||
| Massachusetts Educational Financing Authority, Education Loan Rev., ”C“, 4.125%, 7/01/2046 | 6,960,000 | 7,256,031 | ||
| Massachusetts Educational Financing Authority, Education Loan Rev., ”C“, 3.75%, 7/01/2047 | 9,170,000 | 9,352,901 | ||
| Massachusetts Educational Financing Authority, Education Loan Rev., ”I-A“, 5.5%, 1/01/2022 | 225,000 | 225,488 | ||
| Massachusetts Educational Financing Authority, Education Loan Rev., ”J“, 5%, 7/01/2021 | 1,255,000 | 1,269,170 | ||
| Massachusetts Educational Financing Authority, Education Loan Rev., ”J“, 4.7%, 7/01/2026 | 725,000 | 731,260 | ||
| Massachusetts Educational Financing Authority, Education Loan Rev., ”J“, 4.9%, 7/01/2028 | 745,000 | 751,611 | ||
| Massachusetts Educational Financing Authority, Education Loan Rev., ”J“, 3.5%, 7/01/2033 (u) | 8,585,000 | 8,745,362 | ||
| Massachusetts Educational Financing Authority, Education Loan Rev., ”J“, 3.5%, 7/01/2033 | 2,930,000 | 2,984,730 | ||
| Issuer | Shares/Par | Value ($) | ||
| Municipal Bonds - continued | ||||
| Massachusetts - continued | ||||
| Massachusetts Educational Financing Authority, Education Loan Rev., ”K“, 5.25%, 7/01/2029 | $ | 1,690,000 | $ 1,772,171 | |
| Massachusetts Educational Financing Authority, Education Loan Rev., ”K“, 3.625%, 7/01/2032 | 6,060,000 | 6,214,540 | ||
| Massachusetts Port Authority Rev., ”A“, 5%, 7/01/2037 (Prerefunded 7/01/2022) | 470,000 | 497,536 | ||
| Massachusetts Port Authority Rev., ”A“, 5%, 7/01/2037 | 3,915,000 | 4,864,113 | ||
| Massachusetts Port Authority Rev., ”A“, 5%, 7/01/2038 | 4,915,000 | 6,090,086 | ||
| Massachusetts Port Authority Rev., ”A“, 5%, 7/01/2039 | 7,975,000 | 9,856,299 | ||
| Massachusetts Port Authority Special Facilities Rev. (BOSFuel Project), ”A“, 5%, 7/01/2035 | 500,000 | 614,912 | ||
| Massachusetts Port Authority Special Facilities Rev. (BOSFuel Project), ”A“, 5%, 7/01/2036 | 1,000,000 | 1,225,783 | ||
| Massachusetts Port Authority Special Facilities Rev. (BOSFuel Project), ”A“, 5%, 7/01/2037 | 1,435,000 | 1,753,399 | ||
| Massachusetts Port Authority Special Facilities Rev. (BOSFuel Project), ”A“, 5%, 7/01/2038 | 180,000 | 219,348 | ||
| Massachusetts Port Authority Special Facilities Rev. (ConRAC Project), ”A“, 5.125%, 7/01/2041 (Prerefunded 7/01/2021) | 465,000 | 470,478 | ||
| Massachusetts Water Resources Authority, General Rev., ”B“, AGM, 5.25%, 8/01/2029 | 4,215,000 | 5,641,914 | ||
| University of Massachusetts Building Authority Rev., ”2017-3“, 5%, 11/01/2036 | 8,895,000 | 10,975,463 | ||
| $193,072,738 | ||||
| Michigan - 1.7% | ||||
| Detroit, MI, Downtown Development Authority Tax Increment Rev. (Catalyst Development), ”A“, AGM, 5%, 7/01/2043 | $ | 1,565,000 | $ 1,762,554 | |
| Detroit, MI, Water & Sewerage Department, Senior Lien Sewage Disposal System Rev., ”A“, 5.25%, 7/01/2039 (Prerefunded 7/01/2022) | 5,920,000 | 6,296,608 | ||
| Detroit, MI, Water Supply System Rev., Senior Lien, ”A“, 5%, 7/01/2036 (Prerefunded 7/01/2021) | 295,000 | 298,459 | ||
| Detroit, MI, Water Supply System Rev., Senior Lien, ”C“, 5%, 7/01/2041 (Prerefunded 7/01/2021) | 410,000 | 414,807 | ||
| Downriver, MI, Utility Wastewater Authority, Sewer System Rev., AGM, 5%, 4/01/2036 | 505,000 | 625,263 | ||
| Downriver, MI, Utility Wastewater Authority, Sewer System Rev., AGM, 5%, 4/01/2038 | 460,000 | 566,553 | ||
| Downriver, MI, Utility Wastewater Authority, Sewer System Rev., AGM, 5%, 4/01/2043 | 815,000 | 985,156 | ||
| Great Lakes Water Authority, Michigan Water Supply System Rev., ”B“, BAM, 5%, 7/01/2046 | 5,745,000 | 6,794,578 | ||
| Issuer | Shares/Par | Value ($) | ||
| Municipal Bonds - continued | ||||
| Michigan - continued | ||||
| Great Lakes Water Authority, Michigan Water Supply System Rev., ”D“, 5%, 7/01/2036 | $ | 3,155,000 | $ 3,766,644 | |
| Great Lakes Water Authority, Michigan Water Supply System Rev., ”D“, AGM, 5%, 7/01/2034 | 3,710,000 | 4,479,578 | ||
| Michigan Building Authority Rev., ”I“, 4%, 10/15/2049 | 2,800,000 | 3,212,937 | ||
| Michigan Finance Authority (Detroit Financial Recovery Income Tax Rev.), ”F“, 3.875%, 10/01/2023 | 685,000 | 707,474 | ||
| Michigan Finance Authority (Detroit Financial Recovery Income Tax Rev.), ”F“, 4%, 10/01/2024 | 860,000 | 898,052 | ||
| Michigan Finance Authority Hospital Rev. (Trinity Health Credit Group), 5%, 12/01/2030 | 1,000,000 | 1,230,118 | ||
| Michigan Finance Authority Hospital Rev. (Trinity Health Credit Group), 5%, 12/01/2031 | 2,000,000 | 2,456,018 | ||
| Michigan Finance Authority Hospital Rev. (Trinity Health Credit Group), 5%, 12/01/2035 (Prerefunded 12/01/2021) | 3,195,000 | 3,297,783 | ||
| Michigan Finance Authority Hospital Rev. (Trinity Health Credit Group), 5%, 12/01/2048 | 3,690,000 | 4,504,772 | ||
| Michigan Finance Authority Hospital Rev. (Trinity Health Credit Group), ”2“, 4%, 12/01/2036 | 5,265,000 | 6,216,172 | ||
| Michigan Finance Authority Local Government Loan Program Rev. (Detroit Water and Sewerage Department Sewage Disposal System Rev. Refunding Second Lien Local Project), ”C“, 5%, 7/01/2033 | 800,000 | 937,546 | ||
| Michigan Finance Authority Local Government Loan Program Rev. (Detroit Water and Sewerage Department Sewage Disposal System Rev. Refunding Second Lien Local Project), ”C“, 5%, 7/01/2034 | 1,790,000 | 2,094,498 | ||
| Michigan Finance Authority Local Government Loan Program Rev. (Detroit Water and Sewerage Department Sewage Disposal System Rev. Refunding Second Lien Local Project), ”C“, 5%, 7/01/2035 | 1,155,000 | 1,349,377 | ||
| Michigan Finance Authority Local Government Loan Program Rev. (Detroit Water and Sewerage Department Sewage Disposal System Rev. Refunding Second Lien Local Project), ”C-7“, NPFG, 5%, 7/01/2032 | 580,000 | 659,386 | ||
| Michigan Finance Authority Local Government Loan Program Rev. (Detroit Water and Sewerage Department Sewage Disposal System Rev. Senior Lien Local Project), ”C-1“, 5%, 7/01/2044 (Prerefunded 7/01/2022) | 450,000 | 477,235 | ||
| Michigan Finance Authority Local Government Loan Program Rev. (Detroit Water and Sewerage Department Water Supply System Rev. Refunding Local Project), ”D-2“, 5%, 7/01/2034 | 800,000 | 936,088 | ||
| Issuer | Shares/Par | Value ($) | ||
| Municipal Bonds - continued | ||||
| Michigan - continued | ||||
| Michigan Finance Authority Local Government Loan Program Rev. (Detroit Water and Sewerage Department Water Supply System Rev. Refunding Second Lien Local Project), ”D-6“, NPFG, 5%, 7/01/2036 | $ | 485,000 | $ 549,379 | |
| Michigan Finance Authority Local Government Loan Program Rev. (Detroit Water and Sewerage Department Water Supply System Rev. Refunding Senior Lien Local Project), ”D-1“, AGM, 5%, 7/01/2035 | 240,000 | 272,518 | ||
| Michigan Finance Authority Local Government Loan Program Rev. (Detroit Water and Sewerage Department Water Supply System Rev. Refunding Senior Lien Local Project), ”D-1“, AGM, 5%, 7/01/2037 | 570,000 | 645,858 | ||
| Michigan Finance Authority Tobacco Settlement Asset-Backed Rev. (2007 Sold Tobacco Receipts), ”B-1“, 5%, 6/01/2049 | 1,205,000 | 1,455,047 | ||
| Michigan Housing Development Authority, ”A“, 4%, 6/01/2046 | 840,000 | 887,455 | ||
| Michigan Strategic Fund Ltd. Obligation Rev. (I-75 Improvement Project), 5%, 6/30/2048 | 5,000,000 | 5,931,932 | ||
| Wayne County, MI, Airport Authority Rev. (Detroit Metropolitan Wayne County Airport), ”B“, 5%, 12/01/2044 | 1,000,000 | 1,146,020 | ||
| Wayne County, MI, Airport Authority Rev. (Detroit Metropolitan Wayne County Airport), ”B“, BAM, 5%, 12/01/2039 | 610,000 | 699,072 | ||
| Wayne County, MI, Airport Authority Rev. (Detroit Metropolitan Wayne County Airport), ”C“, 5%, 12/01/2039 | 470,000 | 534,989 | ||
| Wayne County, MI, Airport Authority Rev. (Detroit Metropolitan Wayne County Airport), ”C“, 5%, 12/01/2044 | 1,020,000 | 1,161,041 | ||
| Wayne County, MI, Airport Authority Rev. (Detroit Metropolitan Wayne County Airport), ”D“, AGM, 5%, 12/01/2040 | 7,105,000 | 8,313,059 | ||
| Wayne County, MI, Airport Authority Rev. (Detroit Metropolitan Wayne County Airport), “D”, 5%, 12/01/2031 | 2,490,000 | 3,060,978 | ||
| Wayne County, MI, Airport Authority Rev. (Detroit Metropolitan Wayne County Airport), “D”, 5%, 12/01/2032 | 2,580,000 | 3,149,647 | ||
| Wayne County, MI, Detroit School District, ”A“, 5%, 5/01/2030 | 980,000 | 1,290,485 | ||
| Wayne County, MI, Detroit School District, ”A“, 5%, 5/01/2031 | 1,200,000 | 1,584,901 | ||
| Wayne County, MI, Detroit School District, ”A“, 5%, 5/01/2032 | 1,850,000 | 2,431,090 | ||
| Wayne County, MI, Detroit School District, ”A“, 5%, 5/01/2034 | 3,500,000 | 4,547,962 | ||
| Wayne County, MI, Detroit School District, ”A“, 5%, 5/01/2036 | 1,000,000 | 1,280,800 | ||
| Wayne County, MI, Detroit School District, ”A“, 5%, 5/01/2037 | 1,100,000 | 1,403,815 | ||
| Wayne County, MI, Detroit School District, ”A“, 5%, 5/01/2038 | 290,000 | 369,017 | ||
| $95,682,721 | ||||
| Issuer | Shares/Par | Value ($) | ||
| Municipal Bonds - continued | ||||
| Minnesota - 1.1% | ||||
| Duluth, MN, Economic Development Authority, Health Care Facilities Rev. (Essentia Health), ”A“, 4.25%, 2/15/2043 | $ | 2,275,000 | $ 2,545,413 | |
| Duluth, MN, Economic Development Authority, Health Care Facilities Rev. (Essentia Health), ”A“, 5%, 2/15/2043 | 2,550,000 | 3,017,877 | ||
| Duluth, MN, Economic Development Authority, Health Care Facilities Rev. (Essentia Health), ”A“, 4.25%, 2/15/2048 | 2,280,000 | 2,533,783 | ||
| Duluth, MN, Economic Development Authority, Health Care Facilities Rev. (Essentia Health), ”A“, 5%, 2/15/2048 | 2,015,000 | 2,368,840 | ||
| Duluth, MN, Independent School District No. 709, ”A“, COP, 5%, 2/01/2025 | 240,000 | 276,083 | ||
| Duluth, MN, Independent School District No. 709, ”A“, COP, 4%, 3/01/2032 | 1,145,000 | 1,202,721 | ||
| Duluth, MN, Independent School District No. 709, ”A“, COP, 4.2%, 3/01/2034 | 305,000 | 321,791 | ||
| Duluth, MN, Independent School District No. 709, ”B“, COP, 5%, 2/01/2026 | 765,000 | 905,263 | ||
| Duluth, MN, Independent School District No. 709, ”B“, COP, 5%, 2/01/2028 | 225,000 | 278,594 | ||
| Minneapolis & St. Paul, MN, Metropolitan Airports Commission Rev., ”C“, 5%, 1/01/2041 | 2,500,000 | 2,961,943 | ||
| Minneapolis & St. Paul, MN, Metropolitan Airports Commission Rev., ”C“, 5%, 1/01/2046 | 3,000,000 | 3,553,967 | ||
| Minnesota Housing Finance Agency, Residential Housing, ”A“, 4%, 1/01/2041 | 625,000 | 656,612 | ||
| Minnesota Housing Finance Agency, Residential Housing, ”A“, 4.25%, 7/01/2049 (u) | 19,060,000 | 21,314,676 | ||
| Minnesota Housing Finance Agency, Residential Housing, ”B“, GNMA, 3%, 7/01/2051 | 7,150,000 | 7,844,853 | ||
| Minnesota Office of Higher Education Supplemental Student Loan Program Rev., 4%, 11/01/2037 (u) | 5,895,000 | 6,364,692 | ||
| Minnesota Office of Higher Education Supplemental Student Loan Program Rev., 2.65%, 11/01/2038 | 3,570,000 | 3,535,297 | ||
| St. Paul, MN, Housing & Redevelopment Authority Charter School Lease Rev. (Great River School Project), ”A“, 5.5%, 7/01/2052 (n) | 240,000 | 265,688 | ||
| University of Minnesota, ”A“, 5%, 12/01/2025 (Prerefunded 12/01/2021) | 710,000 | 732,601 | ||
| $60,680,694 | ||||
| Issuer | Shares/Par | Value ($) | ||
| Municipal Bonds - continued | ||||
| Mississippi - 0.9% | ||||
| Lowndes County, MS, Solid Waste Disposal & Pollution Control Rev. (Weyerhaeuser Co.), 6.8%, 4/01/2022 | $ | 1,750,000 | $ 1,854,474 | |
| Mississippi Development Bank Special Obligation (Harrison County Coliseum), ”A“, 5.25%, 1/01/2034 | 2,455,000 | 3,316,858 | ||
| Mississippi Development Bank Special Obligation (Jackson Sales Tax Rev. Infrastructure Project), 5%, 9/01/2025 | 400,000 | 469,419 | ||
| Mississippi Development Bank Special Obligation (Jackson Sales Tax Rev. Infrastructure Project), 5%, 9/01/2026 | 1,000,000 | 1,205,646 | ||
| Mississippi Development Bank Special Obligation (Jackson Water and Sewer System Rev. Bond Project), AGM, 6.875%, 12/01/2040 | 495,000 | 569,912 | ||
| Mississippi Development Bank Special Obligation (Vicksburg Warren School District General Obligation Project), BAM, 5%, 3/01/2048 | 4,000,000 | 4,933,902 | ||
| Mississippi Home Corp. Single Family Mortgage Rev., ”A“, 4%, 12/01/2044 | 1,635,000 | 1,799,397 | ||
| Mississippi Home Corp., Single Family Mortgage Rev., ”A“, GNMA, 3%, 12/01/2050 | 1,635,000 | 1,791,446 | ||
| Mississippi Hospital Equipment & Facilities Authority Rev. (Baptist Memorial Healthcare), ”A“, 5%, 9/01/2022 | 1,445,000 | 1,524,415 | ||
| Mississippi Hospital Equipment & Facilities Authority Rev. (Baptist Memorial Healthcare), ”A“, 5%, 9/01/2023 | 3,560,000 | 3,926,635 | ||
| Mississippi Hospital Equipment & Facilities Authority Rev. (Baptist Memorial Healthcare), ”A“, 5%, 9/01/2046 | 1,905,000 | 2,149,741 | ||
| Mississippi Hospital Equipment & Facilities Authority Rev. (Forrest County General Hospital Refunding Project), ”A“, 4%, 1/01/2036 | 845,000 | 969,054 | ||
| Mississippi Hospital Equipment & Facilities Authority Rev. (Forrest County General Hospital Refunding Project), ”A“, 4%, 1/01/2037 | 760,000 | 868,445 | ||
| Mississippi Hospital Equipment & Facilities Authority Rev. (Forrest County General Hospital Refunding Project), ”A“, 4%, 1/01/2039 | 760,000 | 863,251 | ||
| Mississippi Hospital Equipment & Facilities Authority Rev. (Forrest County General Hospital Refunding Project), ”A“, 4%, 1/01/2040 | 425,000 | 481,585 | ||
| Mississippi Hospital Equipment & Facilities Authority Rev. (North Mississippi Health Services), ”IV“, 5%, 10/01/2033 | 350,000 | 439,554 | ||
| Mississippi Hospital Equipment & Facilities Authority Rev. (North Mississippi Health Services), ”IV“, 5%, 10/01/2035 | 1,200,000 | 1,496,077 | ||
| Mississippi Hospital Equipment & Facilities Authority Rev. (North Mississippi Health Services), ”IV“, 5%, 10/01/2039 | 850,000 | 1,047,350 | ||
| Issuer | Shares/Par | Value ($) | ||
| Municipal Bonds - continued | ||||
| Mississippi - continued | ||||
| Mississippi State University, Educational Building Corp. Rev. (Mississippi State University Refunding and Improvements Project), 5.25%, 8/01/2038 (Prerefunded 8/01/2023) | $ | 1,250,000 | $ 1,396,794 | |
| State of Mississippi, ”B“, 5%, 12/01/2025 | 585,000 | 704,473 | ||
| State of Mississippi, ”B“, 5%, 12/01/2032 | 2,500,000 | 3,039,515 | ||
| State of Mississippi, ”B“, 5%, 12/01/2033 | 2,500,000 | 3,037,286 | ||
| State of Mississippi, ”B“, 5%, 12/01/2034 | 5,000,000 | 6,065,660 | ||
| University of Southern Mississippi, Educational Building Corp. Rev. (Facilities Refinancing Project), ”A“, 5%, 3/01/2028 | 1,080,000 | 1,245,225 | ||
| West Rankin, MS, Utility Authority Rev., AGM, 5%, 1/01/2048 | 5,750,000 | 6,955,539 | ||
| $52,151,653 | ||||
| Missouri - 1.8% | ||||
| Brentwood & Maplewood, MO, Hanley Road Corridor Transportation Development District, Transportation Sales Tax Refunding Rev., 1.625%, 10/01/2033 | $ | 685,000 | $ 649,269 | |
| Brentwood & Maplewood, MO, Hanley Road Corridor Transportation Development District, Transportation Sales Tax Refunding Rev., 2%, 10/01/2039 | 850,000 | 787,720 | ||
| Kansas City, MO, Industrial Development Authority, Airport Rev. (Kansas City International Airport Terminal Modernization Project), ”B“, AGM, 5%, 3/01/2055 | 5,675,000 | 6,772,950 | ||
| Kansas City, MO, Industrial Development Authority, Airport Rev. (Kansas City International Airport Terminal Modernization Project), “B”, 5%, 3/01/2046 | 14,865,000 | 17,667,936 | ||
| Kansas City, MO, Land Clearance for Redevelopment Authority Rev. (Convention Center Hotel Project - TIF Financing), ”B“, 5%, 2/01/2040 (n) | 160,000 | 170,544 | ||
| Kansas City, MO, Land Clearance for Redevelopment Authority Rev. (Convention Center Hotel Project - TIF Financing), ”B“, 5%, 2/01/2050 (n) | 275,000 | 291,262 | ||
| Missouri Health & Educational Facilities Authority Rev. (A.T. Still University Health Services), 5%, 10/01/2039 (Prerefunded 10/01/2023) | 730,000 | 817,339 | ||
| Missouri Health & Educational Facilities Authority Rev. (BJC Health System), ”C“, 5%, 5/01/2052 (Put Date 5/01/2028) (w) | 11,820,000 | 14,968,272 | ||
| Missouri Health & Educational Facilities Authority Rev. (Mercy Health), ”A“, 5%, 6/01/2030 | 5,000,000 | 6,304,637 | ||
| Missouri Health & Educational Facilities Authority Rev. (Mercy Health), ”A“, 5%, 6/01/2031 | 3,165,000 | 3,972,671 | ||
| Missouri Health & Educational Facilities Authority Rev. (Mosaic Health System), ”A“, 4%, 2/15/2044 | 2,300,000 | 2,617,661 | ||
| Issuer | Shares/Par | Value ($) | ||
| Municipal Bonds - continued | ||||
| Missouri - continued | ||||
| Missouri Health & Educational Facilities Authority Rev. (Mosaic Health System), ”A“, 4%, 2/15/2049 | $ | 5,000,000 | $ 5,653,300 | |
| Missouri Health & Educational Facilities Authority Rev. (Mosaic Health System), ”A“, 4%, 2/15/2054 | 9,550,000 | 10,756,676 | ||
| Missouri Health & Educational Facilities Authority Rev. (SSM Health Care), ”A“, 5%, 6/01/2031 | 2,615,000 | 2,947,381 | ||
| Missouri Housing Development Commission, Single Family Mortgage Rev. (First Place Homeownership Loan Program), ”A“, 3.75%, 5/01/2038 | 535,000 | 568,311 | ||
| Missouri Housing Development Commission, Single Family Mortgage Rev. (First Place Homeownership Loan Program), ”A“, FHLMC, 3%, 5/01/2052 | 6,250,000 | 6,858,633 | ||
| Missouri Housing Development Commission, Single Family Mortgage Rev. (First Place Homeownership Loan Program), ”A“, FNMA, 4.25%, 5/01/2049 | 5,085,000 | 5,624,871 | ||
| Missouri Housing Development Commission, Single Family Mortgage Rev. (First Place Homeownership Loan Program), ”B“, FNMA, 4.75%, 5/01/2049 | 2,695,000 | 3,033,566 | ||
| St. Louis County, MO, Industrial Development Authority Health Facilities Rev. (Nazareth Living Center), ”A“, 5%, 8/15/2030 | 140,000 | 144,301 | ||
| St. Louis County, MO, Industrial Development Authority Health Facilities Rev. (Nazareth Living Center), ”A“, 5%, 8/15/2035 | 95,000 | 97,235 | ||
| St. Louis County, MO, Industrial Development Authority Health Facilities Rev. (Nazareth Living Center), ”A“, 5.125%, 8/15/2045 | 260,000 | 264,501 | ||
| St. Louis, MO, Industrial Development Authority Financing Rev. (Ballpark Village Development Project), ”A“, 3.875%, 11/15/2029 | 200,000 | 194,772 | ||
| St. Louis, MO, Industrial Development Authority Financing Rev. (Ballpark Village Development Project), ”A“, 4.375%, 11/15/2035 | 735,000 | 701,687 | ||
| St. Louis, MO, Industrial Development Authority Financing Rev. (Ballpark Village Development Project), ”A“, 4.75%, 11/15/2047 | 2,290,000 | 2,204,291 | ||
| St. Louis, MO, Municipal Finance Corp. Leasehold Rev. (Convention Center Expansion and Improvement Projects), AGM, 5%, 10/01/2040 | 840,000 | 1,054,709 | ||
| St. Louis, MO, Municipal Finance Corp. Leasehold Rev. (Convention Center Expansion and Improvement Projects), AGM, 5%, 10/01/2045 | 3,610,000 | 4,459,822 | ||
| $99,584,317 | ||||
| Issuer | Shares/Par | Value ($) | ||
| Municipal Bonds - continued | ||||
| Montana - 0.3% | ||||
| Montana Board of Housing Single Family Mortgage, ”B“, 4%, 12/01/2050 | $ | 4,760,000 | $ 5,358,533 | |
| Montana Board of Housing Single Family Program (Federally Insured or Guaranteed Mortgage Loans), ”A“, 4%, 6/01/2049 | 910,000 | 990,404 | ||
| Montana Board of Housing Single Family Program (Federally Insured or Guaranteed Mortgage Loans), ”A-2“, 3%, 12/01/2043 | 710,000 | 732,740 | ||
| Montana Board of Investments, 0.15%, 3/01/2032 (Put Date 3/01/2022) | 5,480,000 | 5,480,495 | ||
| Montana Board of Investments, 0.15%, 3/01/2042 (Put Date 3/01/2022) | 3,000,000 | 3,000,271 | ||
| $15,562,443 | ||||
| Nebraska - 0.4% | ||||
| Central Plains Energy Project, NE, Gas Project Rev. (Project No. 3), ”A“, 5%, 9/01/2034 | $ | 850,000 | $ 1,131,507 | |
| Nebraska Investment Finance Authority, Single Family Housing Rev., ”A“, 4%, 9/01/2044 | 895,000 | 951,758 | ||
| Nebraska Investment Finance Authority, Single Family Housing Rev., ”A“, GNMA, 3%, 9/01/2045 | 3,845,000 | 4,213,813 | ||
| Nebraska Investment Finance Authority, Single Family Housing Rev., ”C“, 4%, 9/01/2048 (u) | 4,195,000 | 4,619,273 | ||
| Nebraska Public Power District Rev., ”A“, 5%, 1/01/2027 (w) | 485,000 | 580,804 | ||
| Nebraska Public Power District Rev., ”A“, 5%, 1/01/2030 (w) | 570,000 | 722,870 | ||
| Nebraska Public Power District Rev., ”A“, 5%, 1/01/2031 (w) | 1,455,000 | 1,872,766 | ||
| Nebraska Public Power District Rev., ”A“, 5%, 1/01/2032 (w) | 1,550,000 | 1,984,305 | ||
| Nebraska Public Power District Rev., ”A“, 5%, 1/01/2033 (w) | 500,000 | 636,356 | ||
| Nebraska Public Power District Rev., ”B“, 5%, 1/01/2029 (w) | 1,015,000 | 1,267,402 | ||
| Nebraska Public Power District Rev., ”B“, 5%, 1/01/2030 (w) | 970,000 | 1,230,146 | ||
| Nebraska Public Power District Rev., ”B“, 5%, 1/01/2031 (w) | 750,000 | 965,343 | ||
| Nebraska Public Power District Rev., ”B“, 5%, 1/01/2032 (w) | 800,000 | 1,024,158 | ||
| Nebraska Public Power District Rev., ”B“, 5%, 1/01/2033 (w) | 785,000 | 999,079 | ||
| $22,199,580 | ||||
| Nevada - 0.4% | ||||
| Clark County, NV, School District General Obligation, ”A“, AGM, 4%, 6/15/2037 | $ | 900,000 | $ 1,058,208 | |
| Clark County, NV, School District General Obligation, ”A“, AGM, 4%, 6/15/2039 | 1,975,000 | 2,308,365 | ||
| Clark County, NV, School District General Obligation, ”A“, AGM, 4%, 6/15/2040 | 130,000 | 151,567 | ||
| Director of the State of Nevada, Department of Business and Industry, Charter School Lease Rev. (Somerset Academy), ”A“, 4.5%, 12/15/2029 (n) | 140,000 | 148,937 | ||
| Issuer | Shares/Par | Value ($) | ||
| Municipal Bonds - continued | ||||
| Nevada - continued | ||||
| Director of the State of Nevada, Department of Business and Industry, Charter School Lease Rev. (Somerset Academy), ”A“, 5%, 12/15/2035 (n) | $ | 630,000 | $ 671,394 | |
| Director of the State of Nevada, Department of Business and Industry, Charter School Lease Rev. (Somerset Academy), ”A“, 5%, 12/15/2038 (n) | 705,000 | 746,308 | ||
| Director of the State of Nevada, Department of Business and Industry, Charter School Lease Rev. (Somerset Academy), ”A“, 5.125%, 12/15/2045 (n) | 760,000 | 801,878 | ||
| Director of the State of Nevada, Department of Business and Industry, Charter School Lease Rev. (Somerset Academy), ”A“, 5%, 12/15/2048 (n) | 2,745,000 | 2,878,038 | ||
| Reno, NV, Sales Tax Rev. (Retrac-Reno Transportation Rail Access Corridor Project), ”B“, AGM, 5%, 6/01/2033 | 90,000 | 108,889 | ||
| Reno, NV, Sales Tax Rev. (Retrac-Reno Transportation Rail Access Corridor Project), ”B“, AGM, 5%, 6/01/2038 | 115,000 | 137,182 | ||
| Reno, NV, Sales Tax Rev. (Retrac-Reno Transportation Rail Access Corridor Project), ”B“, AGM, 4%, 6/01/2048 | 460,000 | 500,108 | ||
| Reno, NV, Sales Tax Rev. (Retrac-Reno Transportation Rail Access Corridor Project), ”B“, AGM, 4.125%, 6/01/2058 | 570,000 | 620,918 | ||
| Sparks, NV, Tourism Improvement District No. 1 Rev. (Legends at Sparks Marina), ”A“, 2.5%, 6/15/2024 (n) | 700,000 | 706,390 | ||
| Washoe County, NV, Water Facilities Rev. (Sierra Pacific Power Projects), ”F“, 2.05%, 3/01/2036 (Put Date 4/15/2022) | 10,250,000 | 10,412,659 | ||
| $21,250,841 | ||||
| New Hampshire - 0.4% | ||||
| National Finance Authority, New Hampshire Municipal Certificates, ”A“, 4.125%, 1/20/2034 | $ | 8,773,764 | $ 10,168,363 | |
| National Finance Authority, New Hampshire Resource Recovery Refunding Rev., ”A“, 3.625%, 7/01/2043 (Put Date 7/02/2040) (n) | 1,695,000 | 1,749,103 | ||
| National Finance Authority, New Hampshire Resource Recovery Refunding Rev., ”B“, 3.75%, 7/01/2045 (Put Date 7/02/2040) (n) | 2,910,000 | 3,005,546 | ||
| New Hampshire Health & Education Facilities Authority Rev. (Memorial Hospital), 5.5%, 6/01/2031 | 1,600,000 | 1,873,506 | ||
| New Hampshire Health & Education Facilities Authority Rev. (Memorial Hospital), 5.5%, 6/01/2036 | 1,595,000 | 1,846,965 | ||
| New Hampshire National Finance Authority, Senior Living Rev. (Springpoint Senior Living Project), 4%, 1/01/2041 | 1,050,000 | 1,152,431 | ||
| Issuer | Shares/Par | Value ($) | ||
| Municipal Bonds - continued | ||||
| New Hampshire - continued | ||||
| New Hampshire National Finance Authority, Senior Living Rev. (Springpoint Senior Living Project), 4%, 1/01/2051 | $ | 1,205,000 | $ 1,308,870 | |
| $21,104,784 | ||||
| New Jersey - 5.5% | ||||
| Atlantic City, NJ, Board of Education, AGM, 4%, 4/01/2029 (w) | $ | 200,000 | $ 235,550 | |
| Atlantic City, NJ, Board of Education, AGM, 4%, 4/01/2030 (w) | 165,000 | 191,468 | ||
| Atlantic City, NJ, Board of Education, AGM, 4%, 4/01/2031 (w) | 160,000 | 184,226 | ||
| Atlantic City, NJ, Board of Education, AGM, 4%, 4/01/2032 (w) | 285,000 | 326,872 | ||
| Atlantic City, NJ, Board of Education, AGM, 4%, 4/01/2034 (w) | 280,000 | 318,479 | ||
| Atlantic City, NJ, Tax Appeal Refunding Bonds (Qualified Pursuant to the Provisions of the Municipal Qualified Bond Act), ”A“, BAM, 5%, 3/01/2032 | 4,925,000 | 5,940,113 | ||
| Atlantic City, NJ, Tax Appeal Refunding Bonds (Qualified Pursuant to the Provisions of the Municipal Qualified Bond Act), ”A“, BAM, 5%, 3/01/2037 | 4,400,000 | 5,241,313 | ||
| Atlantic City, NJ, Tax Appeal Refunding Bonds (Qualified Pursuant to the Provisions of the Municipal Qualified Bond Act), ”A“, BAM, 5%, 3/01/2042 | 600,000 | 707,771 | ||
| Atlantic City, NJ, Tax Appeal Refunding Bonds (Qualified Pursuant to the Provisions of the Municipal Qualified Bond Act), ”B“, AGM, 5%, 3/01/2032 | 1,665,000 | 2,008,180 | ||
| Atlantic City, NJ, Tax Appeal Refunding Bonds (Qualified Pursuant to the Provisions of the Municipal Qualified Bond Act), ”B“, AGM, 5%, 3/01/2037 | 1,670,000 | 1,989,316 | ||
| New Jersey Building Authority Rev., Unrefunded Balance, “A”, BAM, 5%, 6/15/2029 | 355,000 | 421,680 | ||
| New Jersey Casino Reinvestment Development Authority, Luxury Tax Rev., AGM, 5%, 11/01/2029 | 555,000 | 616,558 | ||
| New Jersey Casino Reinvestment Development Authority, Luxury Tax Rev., AGM, 5%, 11/01/2030 | 850,000 | 941,370 | ||
| New Jersey Casino Reinvestment Development Authority, Luxury Tax Rev., AGM, 5%, 11/01/2031 | 555,000 | 613,385 | ||
| New Jersey Casino Reinvestment Development Authority, Luxury Tax Rev., AGM, 5%, 11/01/2032 | 555,000 | 612,245 | ||
| New Jersey Economic Development Authority Rev. (Goethals Bridge Replacement Project), 5.5%, 1/01/2027 | 470,000 | 528,292 | ||
| New Jersey Economic Development Authority Rev. (Goethals Bridge Replacement Project), 5%, 1/01/2028 | 470,000 | 520,795 | ||
| New Jersey Economic Development Authority Rev. (Goethals Bridge Replacement Project), AGM, 5%, 1/01/2031 | 1,415,000 | 1,580,990 | ||
| New Jersey Economic Development Authority Rev. (Goethals Bridge Replacement Project), AGM, 5.125%, 1/01/2039 | 870,000 | 963,984 | ||
| Issuer | Shares/Par | Value ($) | ||
| Municipal Bonds - continued | ||||
| New Jersey - continued | ||||
| New Jersey Economic Development Authority Rev. (Goethals Bridge Replacement Project), AGM, 5.125%, 7/01/2042 | $ | 435,000 | $ 480,611 | |
| New Jersey Economic Development Authority Rev. (Provident Group - Montclair Properties LLC - Montclair State University Student Housing Project), AGM, 5%, 6/01/2037 | 1,970,000 | 2,316,291 | ||
| New Jersey Economic Development Authority Rev. (Provident Group - Montclair Properties LLC - Montclair State University Student Housing Project), AGM, 5%, 6/01/2042 | 2,190,000 | 2,563,092 | ||
| New Jersey Economic Development Authority Rev. (Provident Group - Rowan Properties LLC - Rowan University Student Housing Project), ”A“, 5%, 1/01/2030 | 1,095,000 | 1,154,386 | ||
| New Jersey Economic Development Authority Rev. (Provident Group - Rowan Properties LLC - Rowan University Student Housing Project), ”A“, 5%, 1/01/2035 | 1,570,000 | 1,643,919 | ||
| New Jersey Economic Development Authority Rev. (School Facilities Construction), 5%, 6/15/2032 | 1,115,000 | 1,412,915 | ||
| New Jersey Economic Development Authority Rev. (School Facilities Construction), 5%, 6/15/2033 | 590,000 | 742,710 | ||
| New Jersey Economic Development Authority Rev. (School Facilities Construction), 4%, 6/15/2034 | 1,095,000 | 1,261,100 | ||
| New Jersey Economic Development Authority Rev. (School Facilities Construction), 4%, 6/15/2035 | 770,000 | 884,216 | ||
| New Jersey Economic Development Authority Rev. (School Facilities Construction), 4%, 6/15/2036 | 1,030,000 | 1,178,204 | ||
| New Jersey Economic Development Authority Rev. (School Facilities Construction), 4%, 6/15/2037 | 995,000 | 1,133,884 | ||
| New Jersey Economic Development Authority Rev. (School Facilities Construction), 4%, 6/15/2038 | 1,260,000 | 1,431,332 | ||
| New Jersey Economic Development Authority Rev. (School Facilities Construction), 4%, 6/15/2039 | 1,105,000 | 1,252,553 | ||
| New Jersey Economic Development Authority Rev. (School Facilities Construction), 4%, 6/15/2040 | 1,295,000 | 1,465,330 | ||
| New Jersey Economic Development Authority Rev. (School Facilities Construction), ”DDD“, 5%, 6/15/2034 | 610,000 | 721,169 | ||
| New Jersey Economic Development Authority Rev. (School Facilities Construction), ”DDD“, 5%, 6/15/2035 | 510,000 | 601,745 | ||
| New Jersey Economic Development Authority Rev. (School Facilities Construction), ”DDD“, 5%, 6/15/2042 | 2,855,000 | 3,316,405 | ||
| New Jersey Economic Development Authority Rev. (School Facilities Construction), ”NN“, 5%, 3/01/2027 | 4,135,000 | 4,459,241 | ||
| New Jersey Economic Development Authority Rev. (School Facilities Construction), ”XX“, 5%, 6/15/2021 | 1,850,000 | 1,867,065 | ||
| Issuer | Shares/Par | Value ($) | ||
| Municipal Bonds - continued | ||||
| New Jersey - continued | ||||
| New Jersey Economic Development Authority, Motor Vehicle Surcharges Subordinate Refunding Rev., ”A“, 3.125%, 7/01/2029 | $ | 850,000 | $ 857,306 | |
| New Jersey Economic Development Authority, Motor Vehicle Surcharges Subordinate Refunding Rev., ”A“, 3.125%, 7/01/2031 (u) | 8,400,000 | 8,991,870 | ||
| New Jersey Economic Development Authority, Motor Vehicle Surcharges Subordinate Refunding Rev., ”A“, 5%, 7/01/2033 | 485,000 | 561,537 | ||
| New Jersey Economic Development Authority, Motor Vehicle Surcharges Subordinate Refunding Rev., ”A“, BAM, 5%, 7/01/2027 | 1,105,000 | 1,365,800 | ||
| New Jersey Economic Development Authority, Motor Vehicle Surcharges Subordinate Refunding Rev., ”A“, BAM, 5%, 7/01/2028 | 9,240,000 | 11,302,472 | ||
| New Jersey Economic Development Authority, Special Facilities Rev. (Continental Airlines, Inc.), 5.25%, 9/15/2029 | 3,650,000 | 3,875,194 | ||
| New Jersey Economic Development Authority, Special Facilities Rev. (Continental Airlines, Inc.), ”A“, 5.625%, 11/15/2030 | 4,050,000 | 4,532,490 | ||
| New Jersey Economic Development Authority, State Lease Rev. (Juvenile Justice Commission Facilities Project), ”C“, 5%, 6/15/2042 | 3,385,000 | 3,973,083 | ||
| New Jersey Economic Development Authority, Water Facilities Rev. (American Water Co., Inc. Project), ”E“, 0.85%, 12/01/2025 | 1,965,000 | 1,944,474 | ||
| New Jersey Economic Development Authority, Water Facilities Rev. (Middlesex Water Co.), 5%, 8/01/2059 | 1,595,000 | 1,896,953 | ||
| New Jersey Health Care Facilities, Financing Authority Rev. (University Hospital), ”A“, AGM, 5%, 7/01/2046 | 5,485,000 | 6,196,056 | ||
| New Jersey Health Care Facilities, Financing Authority, State Contract Refunding Bonds (Hospital Asset Transformation Program), 5%, 10/01/2031 | 2,105,000 | 2,521,085 | ||
| New Jersey Health Care Facilities, Financing Authority, State Contract Refunding Bonds (Hospital Asset Transformation Program), 5%, 10/01/2032 | 2,100,000 | 2,498,215 | ||
| New Jersey Health Care Facilities, Financing Authority, State Contract Refunding Bonds (Hospital Asset Transformation Program), 5%, 10/01/2033 | 1,775,000 | 2,098,193 | ||
| New Jersey Health Care Facilities, Financing Authority, State Contract Refunding Bonds (Hospital Asset Transformation Program), 5%, 10/01/2034 | 1,785,000 | 2,098,340 | ||
| New Jersey Health Care Facilities, Financing Authority, State Contract Refunding Bonds (Hospital Asset Transformation Program), 5%, 10/01/2035 | 1,575,000 | 1,841,381 | ||
| Issuer | Shares/Par | Value ($) | ||
| Municipal Bonds - continued | ||||
| New Jersey - continued | ||||
| New Jersey Health Care Facilities, Financing Authority, State Contract Refunding Bonds (Hospital Asset Transformation Program), 5%, 10/01/2036 | $ | 1,835,000 | $ 2,139,135 | |
| New Jersey Health Care Facilities, Financing Authority, State Contract Refunding Bonds (Hospital Asset Transformation Program), 5%, 10/01/2037 | 3,040,000 | 3,534,645 | ||
| New Jersey Higher Education Student Assistance Authority, Senior Student Loan Rev., ”B“, 3.25%, 12/01/2039 | 5,690,000 | 5,795,819 | ||
| New Jersey Higher Education Student Assistance Authority, Senior Student Loan Rev., ”B“, 3.5%, 12/01/2039 | 7,865,000 | 8,117,238 | ||
| New Jersey Housing & Mortgage Finance Agency, Single Family Housing Rev., ”C“, 4.75%, 10/01/2050 (u) | 9,100,000 | 10,357,406 | ||
| New Jersey Housing & Mortgage Finance Agency, Single Family Housing Rev., ”E“, 3.5%, 4/01/2051 (u) | 11,415,000 | 12,712,886 | ||
| New Jersey Tobacco Settlement Financing Corp., ”A“, 5%, 6/01/2032 | 3,000,000 | 3,692,025 | ||
| New Jersey Tobacco Settlement Financing Corp., ”A“, 5%, 6/01/2033 | 3,000,000 | 3,676,956 | ||
| New Jersey Tobacco Settlement Financing Corp., ”A“, 5%, 6/01/2034 | 3,000,000 | 3,665,648 | ||
| New Jersey Tobacco Settlement Financing Corp., ”A“, 5%, 6/01/2035 | 2,950,000 | 3,594,543 | ||
| New Jersey Transportation Trust Fund Authority, ”AA“, 4%, 6/15/2035 | 235,000 | 269,858 | ||
| New Jersey Transportation Trust Fund Authority, ”AA“, 5%, 6/15/2035 | 1,065,000 | 1,331,162 | ||
| New Jersey Transportation Trust Fund Authority, ”AA“, 4%, 6/15/2036 | 1,185,000 | 1,355,506 | ||
| New Jersey Transportation Trust Fund Authority, ”AA“, 5%, 6/15/2036 | 1,420,000 | 1,768,144 | ||
| New Jersey Transportation Trust Fund Authority, ”AA“, 4%, 6/15/2037 | 1,065,000 | 1,213,654 | ||
| New Jersey Transportation Trust Fund Authority, ”AA“, 5%, 6/15/2037 | 1,420,000 | 1,761,672 | ||
| New Jersey Transportation Trust Fund Authority, ”AA“, 4%, 6/15/2038 | 1,420,000 | 1,613,088 | ||
| New Jersey Transportation Trust Fund Authority, ”AA“, 5%, 6/15/2038 | 1,520,000 | 1,879,925 | ||
| New Jersey Transportation Trust Fund Authority, ”AA“, 5%, 6/15/2039 | 1,420,000 | 1,751,150 | ||
| New Jersey Transportation Trust Fund Authority, ”AA“, 5%, 6/15/2040 | 1,065,000 | 1,310,093 | ||
| Issuer | Shares/Par | Value ($) | ||
| Municipal Bonds - continued | ||||
| New Jersey - continued | ||||
| New Jersey Transportation Trust Fund Authority, ”AA“, 5%, 6/15/2045 | $ | 2,895,000 | $ 3,514,360 | |
| New Jersey Transportation Trust Fund Authority, ”B“, AAC, 5.5%, 9/01/2026 | 3,525,000 | 4,347,948 | ||
| New Jersey Transportation Trust Fund Authority, Federal Highway Reimbursement Rev., ”A“, 5%, 6/15/2029 | 3,420,000 | 4,018,797 | ||
| New Jersey Transportation Trust Fund Authority, Federal Highway Reimbursement Rev., ”A“, 5%, 6/15/2031 | 2,275,000 | 2,639,773 | ||
| New Jersey Transportation Trust Fund Authority, Federal Highway Reimbursement Rev., ”A-1“, 5%, 6/15/2027 | 3,985,000 | 4,762,459 | ||
| New Jersey Transportation Trust Fund Authority, Transportation System, ”A“, 5.25%, 12/15/2021 | 2,520,000 | 2,607,360 | ||
| New Jersey Transportation Trust Fund Authority, Transportation System, ”B“, NPFG, 5.5%, 12/15/2021 | 5,000,000 | 5,182,000 | ||
| New Jersey Transportation Trust Fund Authority, Transportation System, ”C“, 5%, 6/15/2042 (Prerefunded 6/15/2021) | 2,360,000 | 2,382,286 | ||
| New Jersey Transportation Trust Fund Authority, Transportation System, Capital Appreciation, ”A“, 0%, 12/15/2037 | 25,000,000 | 15,779,288 | ||
| New Jersey Transportation Trust Fund Authority, Transportation System, Capital Appreciation, ”C“, AAC, 0%, 12/15/2028 | 12,120,000 | 10,631,372 | ||
| New Jersey Transportation Trust Fund Authority, Transportation System, Capital Appreciation, ”C“, AAC, 0%, 12/15/2035 | 3,725,000 | 2,609,761 | ||
| New Jersey Transportation Trust Fund Authority, Transportation System, Capital Appreciation, ”C“, AAC, 0%, 12/15/2036 | 9,720,000 | 6,567,061 | ||
| New Jersey Transportation Trust Fund Authority, Transportation System, Capital Appreciation, ”C“, AGM, 0%, 12/15/2029 | 15,690,000 | 13,582,009 | ||
| New Jersey Transportation Trust Fund Authority, Transportation System, Capital Appreciation, ”C“, AGM, 0%, 12/15/2032 | 3,345,000 | 2,650,245 | ||
| New Jersey Transportation Trust Fund Authority, Transportation System, Capital Appreciation, ”C“, NPFG, 0%, 12/15/2027 | 6,900,000 | 6,243,736 | ||
| New Jersey Transportation Trust Fund Authority, Transportation System, Capital Appreciation, ”C“, NPFG, 0%, 12/15/2031 | 5,000,000 | 3,988,635 | ||
| New Jersey Turnpike Authority, Turnpike Rev., ”A“, 4%, 1/01/2042 | 2,340,000 | 2,730,769 | ||
| New Jersey Turnpike Authority, Turnpike Rev., ”A“, 4%, 1/01/2051 | 1,955,000 | 2,249,623 | ||
| Newark, NJ, General Obligation Refunding, ”A“, AGM, 5%, 10/01/2024 | 750,000 | 856,956 | ||
| Newark, NJ, General Obligation Refunding, ”A“, AGM, 5%, 10/01/2026 | 925,000 | 1,115,874 | ||
| Newark, NJ, General Obligation Refunding, ”A“, AGM, 5%, 10/01/2028 | 570,000 | 712,048 | ||
| Issuer | Shares/Par | Value ($) | ||
| Municipal Bonds - continued | ||||
| New Jersey - continued | ||||
| Newark, NJ, General Obligation Refunding, ”B“, AGM, 5%, 10/01/2023 | $ | 1,000,000 | $ 1,106,254 | |
| Newark, NJ, General Obligation Refunding, ”B“, AGM, 5%, 10/01/2025 | 500,000 | 587,950 | ||
| South Jersey, NJ, Transportation Authority System Rev., ”A“, AGM, 5%, 11/01/2031 | 1,290,000 | 1,659,396 | ||
| South Jersey, NJ, Transportation Authority System Rev., ”A“, AGM, 5%, 11/01/2032 | 2,530,000 | 3,241,232 | ||
| South Jersey, NJ, Transportation Authority System Rev., ”A“, AGM, 5%, 11/01/2033 | 725,000 | 925,143 | ||
| State of New Jersey, COVID-19 General Obligation, ”A“, 4%, 6/01/2023 | 2,965,000 | 3,194,878 | ||
| State of New Jersey, COVID-19 General Obligation, ”A“, 5%, 6/01/2024 | 1,480,000 | 1,687,004 | ||
| State of New Jersey, COVID-19 General Obligation, ”A“, 5%, 6/01/2027 | 8,510,000 | 10,510,119 | ||
| State of New Jersey, COVID-19 General Obligation, ”A“, 4%, 6/01/2030 | 5,930,000 | 7,185,598 | ||
| State of New Jersey, COVID-19 General Obligation, ”A“, 4%, 6/01/2031 | 1,855,000 | 2,266,094 | ||
| $313,459,785 | ||||
| New Mexico - 0.2% | ||||
| Albuquerque, NM, Bernalillo County Water Utility Authority (Joint Water and Sewer System Improvement Rev.), 5%, 7/01/2033 | $ | 2,300,000 | $ 2,803,610 | |
| Los Ranchos de Albuquerque, NM, Education Facilities Rev. (Albuquerque Academy Project), 4%, 9/01/2040 | 520,000 | 581,665 | ||
| New Mexico Mortgage Finance Authority, Single Family Mortgage Program, ”A-1“, FNMA, 4%, 1/01/2049 | 1,385,000 | 1,530,934 | ||
| New Mexico Mortgage Finance Authority, Single Family Mortgage Program, ”C“, FNMA, 4%, 1/01/2049 | 2,830,000 | 3,120,579 | ||
| Santa Fe, NM, Retirement Facility Rev. (El Castillo Retirement Residences Project), ”A“, 5%, 5/15/2034 | 270,000 | 303,462 | ||
| Santa Fe, NM, Retirement Facility Rev. (El Castillo Retirement Residences Project), ”A“, 5%, 5/15/2039 | 205,000 | 228,321 | ||
| Santa Fe, NM, Retirement Facility Rev. (El Castillo Retirement Residences Project), ”A“, 5%, 5/15/2044 | 215,000 | 237,403 | ||
| Santa Fe, NM, Retirement Facility Rev. (El Castillo Retirement Residences Project), ”A“, 5%, 5/15/2049 | 565,000 | 619,926 | ||
| $9,425,900 | ||||
| Issuer | Shares/Par | Value ($) | ||
| Municipal Bonds - continued | ||||
| New York - 7.0% | ||||
| Broome County, NY, Local Development Corp. Rev. (United Health Services Hospitals, Inc.), AGM, 5%, 4/01/2031 | $ | 925,000 | $ 1,193,195 | |
| Broome County, NY, Local Development Corp. Rev. (United Health Services Hospitals, Inc.), AGM, 5%, 4/01/2032 | 1,000,000 | 1,280,634 | ||
| Broome County, NY, Local Development Corp. Rev. (United Health Services Hospitals, Inc.), AGM, 5%, 4/01/2033 | 1,050,000 | 1,338,979 | ||
| Broome County, NY, Local Development Corp. Rev. (United Health Services Hospitals, Inc.), AGM, 4%, 4/01/2034 | 1,000,000 | 1,168,199 | ||
| Broome County, NY, Local Development Corp. Rev. (United Health Services Hospitals, Inc.), AGM, 3%, 4/01/2035 | 2,000,000 | 2,120,978 | ||
| Broome County, NY, Local Development Corp. Rev. (United Health Services Hospitals, Inc.), AGM, 3%, 4/01/2036 | 1,800,000 | 1,901,807 | ||
| Broome County, NY, Local Development Corp. Rev. (United Health Services Hospitals, Inc.), AGM, 3%, 4/01/2037 | 1,500,000 | 1,578,799 | ||
| Broome County, NY, Local Development Corp. Rev. (United Health Services Hospitals, Inc.), AGM, 4%, 4/01/2038 | 1,250,000 | 1,440,652 | ||
| Broome County, NY, Local Development Corp. Rev. (United Health Services Hospitals, Inc.), AGM, 4%, 4/01/2039 | 1,350,000 | 1,551,207 | ||
| Broome County, NY, Local Development Corp. Rev. (United Health Services Hospitals, Inc.), AGM, 4%, 4/01/2050 | 385,000 | 428,004 | ||
| Build NYC Resource Corp. Rev. (Albert Einstein School of Medicine, Inc.), 5.5%, 9/01/2045 (n) | 7,025,000 | 7,741,442 | ||
| Glen Cove, NY, Local Economic Assistance Corp. (Garvies Point Public Improvement Project), Convertible Capital Appreciation, ”C“, 0% to 1/01/2024, 5.625% to 1/01/2055 | 1,610,000 | 1,728,282 | ||
| Hempstead, NY, Local Development Corp. Rev. (Hofstra University Project), 5%, 7/01/2025 | 1,450,000 | 1,464,695 | ||
| Hempstead, NY, Local Development Corp. Rev. (Hofstra University Project), 5%, 7/01/2026 | 1,080,000 | 1,090,674 | ||
| Hudson Yards, NY, Infrastructure Corp. Rev., ”A“, Unrefunded Balance, 5.75%, 2/15/2047 | 1,475,000 | 1,480,690 | ||
| Jefferson County, NY, Civic Development Corp. Rev. (Samaritan Medical Center), ”A“, 4%, 11/01/2032 | 480,000 | 529,695 | ||
| New York Dormitory Authority Rev. (Cornell University), ”D“, 5%, 7/01/2035 | 590,000 | 852,482 | ||
| New York Dormitory Authority Rev. (Rochester Institute of Technology), ”A“, 5%, 7/01/2032 | 520,000 | 663,555 | ||
| New York Dormitory Authority Rev. (Rochester Institute of Technology), ”A“, 5%, 7/01/2036 | 1,115,000 | 1,398,488 | ||
| New York Dormitory Authority Rev. (Rochester Institute of Technology), ”A“, 5%, 7/01/2040 | 1,265,000 | 1,566,458 | ||
| Issuer | Shares/Par | Value ($) | ||
| Municipal Bonds - continued | ||||
| New York - continued | ||||
| New York Dormitory Authority Rev., Non-State Supported Debt (Orange Regional Medical Center Obligated Group Rev.), 5%, 12/01/2033 (n) | $ | 100,000 | $ 115,455 | |
| New York Dormitory Authority Rev., Non-State Supported Debt (Orange Regional Medical Center Obligated Group Rev.), 5%, 12/01/2035 (n) | 200,000 | 229,165 | ||
| New York Dormitory Authority Rev., State Personal Income Tax, ”A“, 5%, 12/15/2025 | 5,000,000 | 5,400,455 | ||
| New York Environmental Facilities Corp. Rev., Solid Waste Disposal (Casella Waste Management, Inc. Project), 2.75%, 9/01/2050 (Put Date 9/02/2025) (n) | 580,000 | 597,053 | ||
| New York Environmental Facilities Corp., State Revolving Funds Rev., ”C“, 5%, 5/15/2041 | 2,745,000 | 2,759,102 | ||
| New York Liberty Development Corp., Liberty Rev. (3 World Trade Center Project), ”1“, 5%, 11/15/2044 (n) | 16,940,000 | 18,485,075 | ||
| New York Liberty Development Corp., Liberty Rev. (3 World Trade Center Project), ”2“, 5.375%, 11/15/2040 (n) | 3,190,000 | 3,551,411 | ||
| New York Liberty Development Corp., Liberty Rev. (4 World Trade Center Project), 5%, 11/15/2031 | 2,300,000 | 2,365,845 | ||
| New York Mortgage Agency Homeowner Mortgage Rev., ”213“, 3%, 4/01/2050 (u) | 28,575,000 | 31,647,670 | ||
| New York Transportation Development Corp., Exempt Facility Rev. (State Thruway Service Areas Project), 4%, 10/31/2034 | 240,000 | 277,863 | ||
| New York Transportation Development Corp., Exempt Facility Rev. (State Thruway Service Areas Project), 4%, 10/31/2041 | 960,000 | 1,085,564 | ||
| New York Transportation Development Corp., Exempt Facility Rev. (State Thruway Service Areas Project), 4%, 10/31/2046 | 1,435,000 | 1,602,734 | ||
| New York Transportation Development Corp., Exempt Facility Rev. (State Thruway Service Areas Project), 4%, 4/30/2053 | 2,320,000 | 2,577,708 | ||
| New York Transportation Development Corp., Special Facilities Rev. (American Airlines, Inc. John F. Kennedy International Airport Project), 5%, 8/01/2021 | 2,335,000 | 2,368,078 | ||
| New York Transportation Development Corp., Special Facilities Rev. (American Airlines, Inc. John F. Kennedy International Airport Project), 5%, 8/01/2026 | 1,490,000 | 1,509,981 | ||
| New York Transportation Development Corp., Special Facilities Rev. (American Airlines, Inc. John F. Kennedy International Airport Project), 5%, 8/01/2031 | 765,000 | 775,083 | ||
| New York Transportation Development Corp., Special Facilities Rev. (American Airlines, Inc. John F. Kennedy International Airport Project), 5.25%, 8/01/2031 | 1,635,000 | 1,983,950 | ||
| Issuer | Shares/Par | Value ($) | ||
| Municipal Bonds - continued | ||||
| New York - continued | ||||
| New York Transportation Development Corp., Special Facilities Rev. (American Airlines, Inc. John F. Kennedy International Airport Project), 5.375%, 8/01/2036 | $ | 2,400,000 | $ 2,879,888 | |
| New York Transportation Development Corp., Special Facilities Rev. (Delta Airlines, Inc. LaGuardia Airport Terminals C&D Redevelopment Project), 4%, 10/01/2030 | 9,835,000 | 11,398,294 | ||
| New York Transportation Development Corp., Special Facilities Rev. (Delta Airlines, Inc. LaGuardia Airport Terminals C&D Redevelopment Project), 5%, 1/01/2031 | 8,135,000 | 9,785,813 | ||
| New York Transportation Development Corp., Special Facilities Rev. (Delta Airlines, Inc. LaGuardia Airport Terminals C&D Redevelopment Project), 5%, 1/01/2032 | 2,330,000 | 2,791,638 | ||
| New York Transportation Development Corp., Special Facilities Rev. (Delta Airlines, Inc. LaGuardia Airport Terminals C&D Redevelopment Project), 5%, 10/01/2035 | 5,585,000 | 6,942,344 | ||
| New York Transportation Development Corp., Special Facilities Rev. (Delta Airlines, Inc. LaGuardia Airport Terminals C&D Redevelopment Project), 4%, 1/01/2036 | 1,315,000 | 1,442,977 | ||
| New York Transportation Development Corp., Special Facilities Rev. (Delta Airlines, Inc. LaGuardia Airport Terminals C&D Redevelopment Project), 5%, 10/01/2040 | 2,305,000 | 2,821,797 | ||
| New York Transportation Development Corp., Special Facilities Rev. (Terminal 4 John F. Kennedy International Airport Project), ”A“, 5%, 12/01/2030 | 355,000 | 446,644 | ||
| New York Transportation Development Corp., Special Facilities Rev. (Terminal 4 John F. Kennedy International Airport Project), ”A“, 5%, 12/01/2034 | 640,000 | 791,202 | ||
| New York Transportation Development Corp., Special Facilities Rev. (Terminal 4 John F. Kennedy International Airport Project), ”A“, 5%, 12/01/2035 | 315,000 | 389,049 | ||
| New York Transportation Development Corp., Special Facilities Rev. (Terminal 4 John F. Kennedy International Airport Project), ”A“, 5%, 12/01/2036 | 45,000 | 55,499 | ||
| New York Transportation Development Corp., Special Facilities Rev. (Terminal 4 John F. Kennedy International Airport Project), ”A“, 5%, 12/01/2037 | 510,000 | 627,414 | ||
| New York Transportation Development Corp., Special Facilities Rev. (Terminal 4 John F. Kennedy International Airport Project), ”A“, 4%, 12/01/2038 | 210,000 | 236,808 | ||
| New York Transportation Development Corp., Special Facilities Rev. (Terminal 4 John F. Kennedy International Airport Project), ”A“, 4%, 12/01/2039 | 505,000 | 567,951 | ||
| Issuer | Shares/Par | Value ($) | ||
| Municipal Bonds - continued | ||||
| New York - continued | ||||
| New York Transportation Development Corp., Special Facilities Rev. (Terminal 4 John F. Kennedy International Airport Project), ”A“, 4%, 12/01/2041 | $ | 855,000 | $ 947,988 | |
| New York Transportation Development Corp., Special Facilities Rev. (Terminal 4 John F. Kennedy International Airport Project), ”A“, 4%, 12/01/2042 | 290,000 | 320,908 | ||
| New York Transportation Development Corp., Special Facilities Rev. (Terminal 4 John F. Kennedy International Airport Project), ”C“, 5%, 12/01/2029 | 570,000 | 714,467 | ||
| New York Transportation Development Corp., Special Facilities Rev. (Terminal 4 John F. Kennedy International Airport Project), ”C“, 5%, 12/01/2030 | 475,000 | 602,865 | ||
| New York Transportation Development Corp., Special Facilities Rev. (Terminal 4 John F. Kennedy International Airport Project), ”C“, 5%, 12/01/2031 | 520,000 | 655,716 | ||
| New York Transportation Development Corp., Special Facilities Rev. (Terminal 4 John F. Kennedy International Airport Project), ”C“, 5%, 12/01/2033 | 1,515,000 | 1,883,195 | ||
| New York Transportation Development Corp., Special Facilities Rev. (Terminal 4 John F. Kennedy International Airport Project), ”C“, 5%, 12/01/2034 | 1,395,000 | 1,727,304 | ||
| New York Transportation Development Corp., Special Facilities Rev. (Terminal 4 John F. Kennedy International Airport Project), ”C“, 5%, 12/01/2035 | 520,000 | 645,295 | ||
| New York Transportation Development Corp., Special Facilities Rev. (Terminal 4 John F. Kennedy International Airport Project), ”C“, 5%, 12/01/2036 | 945,000 | 1,165,488 | ||
| New York Transportation Development Corp., Special Facilities Rev. (Terminal 4 John F. Kennedy International Airport Project), ”C“, 5%, 12/01/2037 | 1,135,000 | 1,397,407 | ||
| New York Transportation Development Corp., Special Facilities Rev. (Terminal 4 John F. Kennedy International Airport Project), ”C“, 5%, 12/01/2038 | 270,000 | 331,920 | ||
| New York Urban Development Corp., State Personal Income Tax Rev. (General Purpose), ”C“, 4%, 3/15/2042 | 10,000,000 | 11,496,592 | ||
| New York Urban Development Corp., State Personal Income Tax Rev. (General Purpose), ”C“, 4%, 3/15/2049 | 10,200,000 | 11,568,655 | ||
| New York Urban Development Corp., State Personal Income Tax Rev., ”A“, 4%, 3/15/2039 | 6,000,000 | 6,963,806 | ||
| New York Urban Development Corp., State Personal Income Tax Rev., ”C“, 5%, 3/15/2034 | 1,455,000 | 1,788,924 | ||
| New York, NY, ”B-1“, 5%, 12/01/2041 | 3,500,000 | 4,177,635 | ||
| Issuer | Shares/Par | Value ($) | ||
| Municipal Bonds - continued | ||||
| New York - continued | ||||
| New York, NY, City Housing Development Corp., Multi-Family Housing Rev. (8 Spruce Street), ”E“, 3.5%, 2/15/2048 | $ | 2,053,767 | $ 2,082,130 | |
| New York, NY, City Housing Development Corp., Multi-Family Housing Rev. (8 Spruce Street), ”F“, 4.5%, 2/15/2048 | 28,847,667 | 30,014,076 | ||
| New York, NY, City Transitional Finance Authority Building Aid Rev., ”S-3“, 5%, 7/15/2043 | 1,025,000 | 1,250,408 | ||
| New York, NY, General Obligation, ”F-1“, 5%, 3/01/2037 | 4,500,000 | 5,789,605 | ||
| New York, NY, General Obligation, ”F-1“, 5%, 3/01/2039 | 4,500,000 | 5,743,341 | ||
| New York, NY, Housing Development Corp. Multi-Family Housing Rev., ”I-2“, 0.7%, 11/01/2060 (Put Date 5/01/2025) | 7,315,000 | 7,324,857 | ||
| New York, NY, Housing Finance Agency Affordable Housing Rev., ”L-2“, 0.75%, 11/01/2025 | 1,800,000 | 1,800,228 | ||
| New York, NY, Industrial Development Agency Pilot Refunding Rev. (Yankee Stadium Project), ”A“, AGM, 4%, 3/01/2045 | 890,000 | 1,017,129 | ||
| New York, NY, Industrial Development Agency, Airport Facilities Rev. (Transportation Infrastructure Properties LLC), 5%, 7/01/2028 | 2,495,000 | 2,608,980 | ||
| New York, NY, Municipal Water Finance Authority, Water & Sewer System Rev., ”CC-1“, 5%, 6/15/2046 | 7,000,000 | 8,301,268 | ||
| New York, NY, Municipal Water Finance Authority, Water & Sewer System Rev., ”CC-1“, 5%, 6/15/2048 | 5,150,000 | 6,168,358 | ||
| New York, NY, Municipal Water Finance Authority, Water & Sewer System Rev., ”DD“, 5%, 6/15/2031 | 3,800,000 | 5,144,217 | ||
| New York, NY, Transitional Finance Authority Future Tax Secured Rev., ”A-4“, 4%, 11/01/2038 | 3,285,000 | 3,839,191 | ||
| New York, NY, Transitional Finance Authority Future Tax Secured Subordinate, ”A“, 4%, 11/01/2034 | 1,000,000 | 1,191,722 | ||
| New York, NY, Transitional Finance Authority Future Tax Secured Subordinate, ”A“, 4%, 11/01/2035 | 1,000,000 | 1,185,851 | ||
| New York, NY, Transitional Finance Authority Future Tax Secured Subordinate, ”E-1“, 5%, 2/01/2035 | 1,165,000 | 1,512,926 | ||
| New York, NY, Transitional Finance Authority Future Tax Secured Subordinate, ”E-1“, 5%, 2/01/2036 | 815,000 | 1,054,591 | ||
| New York, NY, Transitional Finance Authority Future Tax Secured Subordinate, ”E-1“, 5%, 2/01/2037 | 4,360,000 | 5,624,339 | ||
| New York, NY, Transitional Finance Authority Rev., ”C-1“, 4%, 5/01/2036 | 2,000,000 | 2,365,235 | ||
| New York, NY, Transitional Finance Authority Rev., ”C-1“, 4%, 5/01/2037 | 2,280,000 | 2,683,798 | ||
| New York, NY, Transitional Finance Authority Rev., ”C-1“, 4%, 5/01/2038 | 2,800,000 | 3,277,606 | ||
| New York, NY, Transitional Finance Authority Rev., ”C-1“, 4%, 5/01/2039 | 3,500,000 | 4,084,211 | ||
| Issuer | Shares/Par | Value ($) | ||
| Municipal Bonds - continued | ||||
| New York - continued | ||||
| New York, NY, Trust for Cultural Resources (Lincoln Center for the Performing Arts, Inc.), ”A“, 4%, 12/01/2035 | $ | 245,000 | $ 289,140 | |
| New York, NY, Trust for Cultural Resources Refunding Rev. (Lincoln Center for the Performing Arts, Inc.), ”A“, 5%, 12/01/2031 | 330,000 | 430,278 | ||
| New York, NY, Trust for Cultural Resources Refunding Rev. (Lincoln Center for the Performing Arts, Inc.), ”A“, 5%, 12/01/2032 | 1,090,000 | 1,412,579 | ||
| New York, NY, Trust for Cultural Resources Refunding Rev. (Lincoln Center for the Performing Arts, Inc.), ”A“, 4%, 12/01/2034 | 910,000 | 1,079,413 | ||
| Port Authority of NY & NJ (214th Series), 4%, 9/01/2037 | 2,220,000 | 2,548,158 | ||
| Port Authority of NY & NJ (214th Series), 4%, 9/01/2039 | 920,000 | 1,048,813 | ||
| Port Authority of NY & NJ (214th Series), 4%, 9/01/2043 | 1,485,000 | 1,675,657 | ||
| Port Authority of NY & NJ (221st Series), 4%, 7/15/2045 | 1,430,000 | 1,615,474 | ||
| Port Authority of NY & NJ (221st Series), 4%, 7/15/2050 | 3,570,000 | 4,016,648 | ||
| Port Authority of NY & NJ (221st Series), 4%, 7/15/2055 | 11,455,000 | 12,797,146 | ||
| Port Authority of NY & NJ (223th Series), 5%, 7/15/2033 | 900,000 | 1,169,809 | ||
| Port Authority of NY & NJ (223th Series), 4%, 7/15/2034 | 1,030,000 | 1,220,485 | ||
| Port Authority of NY & NJ (223th Series), 4%, 7/15/2035 | 1,050,000 | 1,237,095 | ||
| Port Authority of NY & NJ (223th Series), 4%, 7/15/2036 | 645,000 | 754,885 | ||
| Port Authority of NY & NJ (223th Series), 4%, 7/15/2037 | 1,405,000 | 1,635,131 | ||
| Port Authority of NY & NJ (223th Series), 4%, 7/15/2038 | 2,805,000 | 3,253,581 | ||
| Port Authority of NY & NJ (223th Series), 4%, 7/15/2039 | 1,870,000 | 2,160,405 | ||
| Port Authority of NY & NJ (223th Series), 4%, 7/15/2040 | 820,000 | 943,906 | ||
| Port Authority of NY & NJ (226th Series), 5%, 10/15/2030 (w) | 860,000 | 1,103,186 | ||
| Port Authority of NY & NJ (226th Series), 5%, 10/15/2032 (w) | 570,000 | 734,181 | ||
| Port Authority of NY & NJ (226th Series), 5%, 10/15/2033 (w) | 680,000 | 870,408 | ||
| Port Authority of NY & NJ (226th Series), 5%, 10/15/2034 (w) | 1,120,000 | 1,426,241 | ||
| Port Authority of NY & NJ (226th Series), 5%, 10/15/2035 (w) | 1,035,000 | 1,312,506 | ||
| Port Authority of NY & NJ (226th Series), 5%, 10/15/2036 (w) | 1,080,000 | 1,363,001 | ||
| Port Authority of NY & NJ (226th Series), 5%, 10/15/2037 (w) | 1,520,000 | 1,909,852 | ||
| Port Authority of NY & NJ (226th Series), 5%, 10/15/2038 (w) | 2,995,000 | 3,747,861 | ||
| Port Authority of NY & NJ (226th Series), 5%, 10/15/2039 (w) | 2,220,000 | 2,767,894 | ||
| Port Authority of NY & NJ (226th Series), 5%, 10/15/2040 (w) | 2,170,000 | 2,693,287 | ||
| Port Authority of NY & NJ (226th Series), 5%, 10/15/2041 (w) | 1,775,000 | 2,199,445 | ||
| Syracuse, NY, Industrial Development Agency PILOT Rev. (Carousel Center Project), ”A“, 5%, 1/01/2028 | 1,670,000 | 1,703,736 | ||
| Syracuse, NY, Industrial Development Agency PILOT Rev. (Carousel Center Project), ”A“, 5%, 1/01/2029 | 2,435,000 | 2,474,842 | ||
| Syracuse, NY, Industrial Development Agency PILOT Rev. (Carousel Center Project), ”A“, 5%, 1/01/2030 | 1,870,000 | 1,890,284 | ||
| Issuer | Shares/Par | Value ($) | ||
| Municipal Bonds - continued | ||||
| New York - continued | ||||
| Syracuse, NY, Industrial Development Agency PILOT Rev. (Carousel Center Project), ”A“, 5%, 1/01/2031 | $ | 2,315,000 | $ 2,329,372 | |
| Syracuse, NY, Industrial Development Agency PILOT Rev. (Carousel Center Project), ”A“, 5%, 1/01/2032 | 4,280,000 | 4,301,176 | ||
| Syracuse, NY, Industrial Development Agency PILOT Rev. (Carousel Center Project), ”A“, 5%, 1/01/2033 | 3,775,000 | 3,790,508 | ||
| Syracuse, NY, Industrial Development Agency PILOT Rev. (Carousel Center Project), ”A“, 5%, 1/01/2034 | 3,380,000 | 3,388,219 | ||
| Syracuse, NY, Industrial Development Agency PILOT Rev. (Carousel Center Project), ”A“, 5%, 1/01/2035 | 4,510,000 | 4,515,305 | ||
| Syracuse, NY, Industrial Development Agency PILOT Rev. (Carousel Center Project), ”A“, 5%, 1/01/2036 | 1,470,000 | 1,470,501 | ||
| Tobacco Settlement Asset Securitization Corp., NY, ”A“, 5%, 6/01/2034 | 950,000 | 1,147,898 | ||
| Tobacco Settlement Asset Securitization Corp., NY, ”A“, 5%, 6/01/2035 | 480,000 | 578,149 | ||
| Tobacco Settlement Asset Securitization Corp., NY, ”A“, 5%, 6/01/2041 | 2,710,000 | 3,137,768 | ||
| Triborough Bridge & Tunnel Authority Rev., NY, ”A“, 0.387%, 1/01/2032 (Put Date 2/01/2024) | 2,535,000 | 2,533,848 | ||
| $394,158,728 | ||||
| North Carolina - 1.5% | ||||
| Durham, SC, Multifamily Housing Authority Rev. (JJ Henderson Senior Apartment Project), 0.3%, 6/01/2024 (Put Date 6/01/2023) | $ | 1,905,000 | $ 1,907,686 | |
| North Carolina Capital Facilities Finance Agency, Education Facilities Refunding Rev. (High Point University), 5%, 5/01/2029 | 525,000 | 669,730 | ||
| North Carolina Capital Facilities Finance Agency, Education Facilities Refunding Rev. (High Point University), 5%, 5/01/2030 | 560,000 | 722,457 | ||
| North Carolina Capital Facilities Finance Agency, Education Facilities Refunding Rev. (High Point University), 5%, 5/01/2031 | 1,000,000 | 1,310,855 | ||
| North Carolina Capital Facilities Finance Agency, Education Facilities Refunding Rev. (High Point University), 4%, 5/01/2032 | 1,000,000 | 1,208,420 | ||
| North Carolina Housing Finance Agency, Home Ownership Rev., ”44“, 4%, 7/01/2050 | 1,700,000 | 1,913,542 | ||
| North Carolina Housing Finance Agency, Home Ownership Rev., ”46-A“, GNMA, 3%, 7/01/2051 (w) | 15,000,000 | 16,443,442 | ||
| North Carolina Medical Care Commission, Health Care Facilities First Mortgage Rev. (Pennybyrn at Maryfield), 5%, 10/01/2025 | 205,000 | 217,661 | ||
| Issuer | Shares/Par | Value ($) | ||
| Municipal Bonds - continued | ||||
| North Carolina - continued | ||||
| North Carolina Medical Care Commission, Health Care Facilities First Mortgage Rev. (Pennybyrn at Maryfield), 5%, 10/01/2030 | $ | 260,000 | $ 277,103 | |
| North Carolina Medical Care Commission, Health Care Facilities First Mortgage Rev. (Pennybyrn at Maryfield), 5%, 10/01/2035 | 285,000 | 300,746 | ||
| North Carolina Medical Care Commission, Health Care Facilities First Mortgage Rev. (Presbyterian Homes Obligated Group), ”A“, 5%, 10/01/2040 | 915,000 | 1,096,046 | ||
| North Carolina Medical Care Commission, Health Care Facilities First Mortgage Rev. (Presbyterian Homes Obligated Group), ”A“, 5%, 10/01/2045 | 875,000 | 1,036,352 | ||
| North Carolina Medical Care Commission, Health Care Facilities First Mortgage Rev. (Presbyterian Homes Obligated Group), ”A“, 5%, 10/01/2050 | 560,000 | 659,533 | ||
| North Carolina Medical Care Commission, Health Care Facilities Rev. (Novant Health Obligated Group), ”A“, 4%, 11/01/2052 | 6,130,000 | 6,959,491 | ||
| North Carolina Medical Care Commission, Retirement Facilities First Mortgage Rev. (United Church Homes and Services), ”A“, 5%, 9/01/2037 | 100,000 | 102,766 | ||
| North Carolina Medical Care Commission, Retirement Facilities First Mortgage Rev. (United Church Homes and Services), ”C“, 5%, 9/01/2041 | 370,000 | 382,540 | ||
| North Carolina Medical Care Commission, Retirement Facilities First Mortgage Rev. (United Church Homes and Services), ”C“, 5%, 9/01/2046 | 1,350,000 | 1,386,576 | ||
| North Carolina Turnpike Authority, Monroe Expressway Toll Rev., ”A“, 5%, 7/01/2042 | 610,000 | 691,700 | ||
| North Carolina Turnpike Authority, Monroe Expressway Toll Rev., ”A“, 5%, 7/01/2047 | 1,195,000 | 1,346,490 | ||
| North Carolina Turnpike Authority, Monroe Expressway Toll Rev., ”A“, 5%, 7/01/2051 | 2,440,000 | 2,742,594 | ||
| North Carolina Turnpike Authority, Monroe Expressway Toll Rev., ”A“, 5%, 7/01/2054 | 975,000 | 1,094,384 | ||
| North Carolina Turnpike Authority, Triangle Expressway System Rev., AGM, 5%, 1/01/2031 | 1,600,000 | 1,922,742 | ||
| North Carolina Turnpike Authority, Triangle Expressway System Senior Lien Refunding Rev., AGM, 5%, 1/01/2036 | 11,650,000 | 14,437,803 | ||
| North Carolina Turnpike Authority, Triangle Expressway System Senior Lien Rev., AGM, 5%, 1/01/2049 | 1,780,000 | 2,186,961 | ||
| Raleigh-Durham, NC, Airport Authority Rev., ”A“, 5%, 5/01/2027 | 1,400,000 | 1,734,128 | ||
| Issuer | Shares/Par | Value ($) | ||
| Municipal Bonds - continued | ||||
| North Carolina - continued | ||||
| Raleigh-Durham, NC, Airport Authority Rev., ”A“, 5%, 5/01/2028 | $ | 1,875,000 | $ 2,367,124 | |
| Raleigh-Durham, NC, Airport Authority Rev., ”A“, 5%, 5/01/2029 | 1,490,000 | 1,912,559 | ||
| Raleigh-Durham, NC, Airport Authority Rev., ”A“, 5%, 5/01/2030 | 1,250,000 | 1,628,608 | ||
| Raleigh-Durham, NC, Airport Authority Rev., ”A“, 5%, 5/01/2031 | 1,350,000 | 1,748,140 | ||
| Raleigh-Durham, NC, Airport Authority Rev., ”A“, 5%, 5/01/2032 | 1,000,000 | 1,289,400 | ||
| Raleigh-Durham, NC, Airport Authority Rev., ”A“, 5%, 5/01/2033 | 1,000,000 | 1,283,923 | ||
| Surry County, NC, Northern Hospital District, Health Care Facilities Rev., 5%, 10/01/2027 | 1,510,000 | 1,728,869 | ||
| Surry County, NC, Northern Hospital District, Health Care Facilities Rev., 5%, 10/01/2031 | 1,250,000 | 1,396,983 | ||
| Surry County, NC, Northern Hospital District, Health Care Facilities Rev., 5%, 10/01/2033 | 1,375,000 | 1,527,141 | ||
| University of North Carolina, Hospitals at Chapel Hill Rev., 5%, 2/01/2046 | 5,065,000 | 5,884,327 | ||
| $83,518,822 | ||||
| North Dakota - 0.6% | ||||
| North Dakota Housing Finance Agency Rev. (Home Mortgage Finance Program), ”A“, 4%, 7/01/2034 | $ | 330,000 | $ 345,701 | |
| North Dakota Housing Finance Agency Rev. (Home Mortgage Finance Program), ”A“, 4%, 1/01/2051 (u) | 12,115,000 | 13,632,495 | ||
| North Dakota Housing Finance Agency Rev. (Home Mortgage Finance Program), ”D“, 4.25%, 1/01/2049 (u) | 6,325,000 | 6,975,343 | ||
| North Dakota State Board of Higher Education, Housing and Auxiliary Facilities Rev. (University of North Dakota), ”A“, AGM, 4%, 4/01/2039 | 2,340,000 | 2,697,708 | ||
| Ward County, ND, Health Care Facilities Rev. (Trinity Obligated Group), ”C“, 5%, 6/01/2034 | 3,895,000 | 4,445,340 | ||
| Ward County, ND, Health Care Facilities Rev. (Trinity Obligated Group), ”C“, 5%, 6/01/2038 | 3,620,000 | 4,089,589 | ||
| Ward County, ND, Health Care Facilities Rev. (Trinity Obligated Group), ”C“, 5%, 6/01/2048 | 200,000 | 222,046 | ||
| Ward County, ND, Health Care Facilities Rev. (Trinity Obligated Group), ”C“, 5%, 6/01/2053 | 1,485,000 | 1,642,597 | ||
| $34,050,819 | ||||
| Issuer | Shares/Par | Value ($) | ||
| Municipal Bonds - continued | ||||
| Ohio - 3.3% | ||||
| Akron, Bath, & Copley, OH, Joint Township Hospital District, Hospital Facilities Rev. (Summa Health Obligated Group), 4%, 11/15/2034 | $ | 485,000 | $ 559,303 | |
| Akron, Bath, & Copley, OH, Joint Township Hospital District, Hospital Facilities Rev. (Summa Health Obligated Group), 4%, 11/15/2035 | 485,000 | 557,427 | ||
| Akron, Bath, & Copley, OH, Joint Township Hospital District, Hospital Facilities Rev. (Summa Health Obligated Group), 4%, 11/15/2036 | 485,000 | 556,167 | ||
| Akron, Bath, & Copley, OH, Joint Township Hospital District, Hospital Improvement Rev. (Children's Hospital Medical Center of Akron), 5%, 11/15/2038 | 3,005,000 | 3,267,387 | ||
| American Municipal Power, Inc. Rev. (AMP Fremont Energy Center Project), ”B“, 5%, 2/15/2024 (Prerefunded 2/15/2022) | 1,500,000 | 1,563,380 | ||
| Buckeye, OH, Tobacco Settlement Financing Authority Senior Asset-Backed Refunding, 2020A-2, ”1“, 5%, 6/01/2031 | 1,800,000 | 2,322,093 | ||
| Buckeye, OH, Tobacco Settlement Financing Authority Senior Asset-Backed Refunding, 2020A-2, ”1“, 5%, 6/01/2034 | 900,000 | 1,139,483 | ||
| Buckeye, OH, Tobacco Settlement Financing Authority Senior Asset-Backed Refunding, 2020A-2, ”1“, 5%, 6/01/2035 | 450,000 | 567,141 | ||
| Buckeye, OH, Tobacco Settlement Financing Authority Senior Asset-Backed Refunding, 2020A-2, ”1“, 5%, 6/01/2036 | 1,400,000 | 1,753,367 | ||
| Buckeye, OH, Tobacco Settlement Financing Authority Senior Asset-Backed Refunding, 2020A-2, ”1“, 4%, 6/01/2039 | 450,000 | 516,895 | ||
| Buckeye, OH, Tobacco Settlement Financing Authority Senior Asset-Backed Refunding, 2020A-2, ”1“, 4%, 6/01/2048 | 6,485,000 | 7,231,490 | ||
| Buckeye, OH, Tobacco Settlement Financing Authority Senior Asset-Backed Refunding, 2020B-2, ”2“, 5%, 6/01/2055 | 22,650,000 | 25,517,714 | ||
| Buckeye, OH, Tobacco Settlement Financing Authority Senior Asset-Backed Refunding, 2020B-3, Capital Appreciation, ”2“, 0%, 6/01/2057 | 62,655,000 | 9,473,987 | ||
| Cleveland-Cuyahoga County, OH, Port Authority Development Rev. (Flats East Development Project), ”B“, 7%, 5/15/2040 | 990,000 | 991,891 | ||
| Cuyahoga County, OH, Hospital Rev. (Metrohealth System), 4.75%, 2/15/2047 | 4,065,000 | 4,473,386 | ||
| Cuyahoga County, OH, Hospital Rev. (Metrohealth System), 5.5%, 2/15/2057 | 10,245,000 | 11,959,861 | ||
| Franklin County, OH, Hospital Facilities Rev. (OhioHealth Corp.), ”A“, 4%, 5/15/2047 | 4,140,000 | 4,576,947 | ||
| Lancaster, PA, Port Authority Gas Supply Rev., ”A“, 5%, 8/01/2049 (Put Date 2/01/2025) | 5,250,000 | 6,085,942 | ||
| Lucas County, OH, Hospital Rev. (Promedica Healthcare), ”A“, 5.25%, 11/15/2048 | 485,000 | 554,576 | ||
| Issuer | Shares/Par | Value ($) | ||
| Municipal Bonds - continued | ||||
| Ohio - continued | ||||
| Miami County, OH, Hospital Facilities Rev. (Kettering Health), ”A“, 5%, 8/01/2049 | $ | 9,845,000 | $ 11,788,694 | |
| Middleburg Heights, OH, Hospital Facilities Improvement Rev. (Southwest General Health Center Project), ”A“, 4%, 8/01/2041 (w) | 3,140,000 | 3,545,462 | ||
| Middleburg Heights, OH, Hospital Facilities Improvement Rev. (Southwest General Health Center Project), ”A“, 4%, 8/01/2047 | 1,740,000 | 1,952,731 | ||
| Montgomery County, OH, Hospital Facilities Improvement and Refunding Rev. (Kettering Health Network Obligated Group Project), 4%, 8/01/2041 | 345,000 | 402,616 | ||
| Montgomery County, OH, Hospital Facilities Rev. (Premier Health Partners Obligated Group), ”A“, 5%, 11/15/2034 | 1,000,000 | 1,235,247 | ||
| Montgomery County, OH, Hospital Facilities Rev. (Premier Health Partners Obligated Group), ”A“, 4%, 11/15/2038 | 4,380,000 | 4,881,935 | ||
| Montgomery County, OH, Hospital Facilities Rev. (Premier Health Partners Obligated Group), ”A“, 4%, 11/15/2042 | 1,425,000 | 1,571,659 | ||
| Northeast Ohio Medical University, General Receipts, ”A“, 4%, 12/01/2035 | 140,000 | 159,016 | ||
| Northeast Ohio Medical University, General Receipts, ”A“, 4%, 12/01/2045 | 105,000 | 115,444 | ||
| Ohio Air Quality Development Authority, Air Quality Rev. (American Electric Power Co.), ”B“, 2.6%, 6/01/2041 (Put Date 10/01/2029) | 4,615,000 | 4,872,155 | ||
| Ohio Air Quality Development Authority, Air Quality Rev. (American Electric Power Co.), ”C“, 2.1%, 12/01/2027 (Put Date 10/01/2024) | 8,400,000 | 8,735,674 | ||
| Ohio Air Quality Development Authority, Air Quality Rev. (American Electric Power Co.), ”C“, 2.1%, 4/01/2028 (Put Date 10/01/2024) | 3,925,000 | 4,081,299 | ||
| Ohio Air Quality Development Authority, Facilities Rev. (Pratt Paper LLC Project), 3.75%, 1/15/2028 (n) | 9,440,000 | 10,236,510 | ||
| Ohio Air Quality Development Authority, Facilities Rev. (Pratt Paper LLC Project), 4.25%, 1/15/2038 (n) | 250,000 | 276,128 | ||
| Ohio Air Quality Development Authority, Facilities Rev. (Pratt Paper LLC Project), 4.5%, 1/15/2048 (n) | 330,000 | 366,339 | ||
| Ohio Higher Educational Facility Commission Rev. (Franciscan University of Steubenville), 5%, 11/01/2041 | 3,000,000 | 3,443,549 | ||
| Ohio Higher Educational Facility Rev. (Kenyon College 2020 Project), 5%, 7/01/2035 | 1,130,000 | 1,429,381 | ||
| Ohio Higher Educational Facility Rev. (Kenyon College 2020 Project), 5%, 7/01/2038 | 1,075,000 | 1,346,120 | ||
| Issuer | Shares/Par | Value ($) | ||
| Municipal Bonds - continued | ||||
| Ohio - continued | ||||
| Ohio Higher Educational Facility Rev. (Kenyon College 2020 Project), 5%, 7/01/2039 | $ | 1,135,000 | $ 1,417,238 | |
| Ohio Higher Educational Facility Rev. (Kenyon College 2020 Project), 5%, 7/01/2042 | 1,950,000 | 2,410,960 | ||
| Ohio Housing Finance Agency Residential Mortgage Rev. (Mortgage-Backed Securities Program), ”A“, 4.5%, 9/01/2048 (u) | 4,045,000 | 4,524,341 | ||
| Ohio Housing Finance Agency Residential Mortgage Rev. (Mortgage-Backed Securities Program), ”A“, 4.5%, 9/01/2049 (u) | 8,085,000 | 9,083,312 | ||
| Ohio State Hospital Rev. (Premier Health Partners Obligated Group), 5%, 11/15/2034 | 865,000 | 1,089,067 | ||
| Ohio State Hospital Rev. (Premier Health Partners Obligated Group), 4%, 11/15/2036 | 635,000 | 725,235 | ||
| Ohio State Hospital Rev. (Premier Health Partners Obligated Group), 4%, 11/15/2038 | 620,000 | 694,980 | ||
| Ohio State Hospital Rev. (Premier Health Partners Obligated Group), 4%, 11/15/2040 | 590,000 | 657,687 | ||
| Ohio State University, Special Purpose Rev., ”A“, 5%, 6/01/2038 (u) | 3,355,000 | 3,664,993 | ||
| Ohio State University, Special Purpose Rev., ”A“, 5%, 6/01/2043 (u) | 8,150,000 | 8,903,038 | ||
| Ohio Tax Exempt Private Activity (Portsmouth Bypass Project), AGM, 5%, 12/31/2035 | 7,740,000 | 8,830,403 | ||
| Summit County, OH, Port Authority Building Rev. (Flats East Development Recovery Zone Facility Bonds), 6.875%, 5/15/2040 | 385,000 | 386,179 | ||
| $186,495,829 | ||||
| Oklahoma - 0.5% | ||||
| Catoosa, OK, Industrial Authority Sales Tax Rev., 4%, 10/01/2028 | $ | 235,000 | $ 238,507 | |
| Norman, OK, Regional Hospital Authority Rev., 5%, 9/01/2045 | 2,360,000 | 2,818,199 | ||
| Oklahoma Development Finance Authority, First Mortgage Rev. (Sommerset Project), 5%, 7/01/2042 | 1,495,000 | 1,615,592 | ||
| Oklahoma Development Finance Authority, Health System Rev. (OU Medicine Project), ”B“, 5%, 8/15/2029 | 150,000 | 184,634 | ||
| Oklahoma Development Finance Authority, Health System Rev. (OU Medicine Project), ”B“, 5%, 8/15/2033 | 810,000 | 979,407 | ||
| Oklahoma Development Finance Authority, Health System Rev. (OU Medicine Project), ”B“, 5%, 8/15/2038 | 1,135,000 | 1,353,975 | ||
| Oklahoma Development Finance Authority, Health System Rev. (OU Medicine Project), ”B“, 5.25%, 8/15/2043 | 395,000 | 475,587 | ||
| Issuer | Shares/Par | Value ($) | ||
| Municipal Bonds - continued | ||||
| Oklahoma - continued | ||||
| Oklahoma Development Finance Authority, Health System Rev. (OU Medicine Project), ”B“, 5.25%, 8/15/2048 | $ | 1,140,000 | $ 1,363,664 | |
| Oklahoma Development Finance Authority, Health System Rev. (OU Medicine Project), ”B“, 5.5%, 8/15/2052 | 9,880,000 | 11,992,379 | ||
| Oklahoma Development Finance Authority, Health System Rev. (OU Medicine Project), ”B“, 5.5%, 8/15/2057 | 2,630,000 | 3,185,127 | ||
| Oklahoma Housing Finance Agency, Single Family Mortgage Rev. (Homeownership Loan Project), ”A“, 4.75%, 9/01/2048 | 2,380,000 | 2,692,690 | ||
| Tulsa, OK, Airport Improvement Trust Rev., ”A“, 5%, 6/01/2045 | 755,000 | 840,962 | ||
| $27,740,723 | ||||
| Oregon - 0.9% | ||||
| Clackamas County, OR, Hospital Facility Authority Senior Living Rev. (Rose Villa Project), ”B-2“, 2.75%, 11/15/2025 (n) | $ | 950,000 | $ 956,203 | |
| Gilliam County, OR, Solid Waste Disposal Rev. (Waste Management, Inc. Project), ”A“, 2.4%, 8/01/2025 (Put Date 5/02/2022) | 1,275,000 | 1,276,837 | ||
| Gilliam County, OR, Solid Waste Disposal Rev. (Waste Management, Inc. Project), ”A“, 2.4%, 7/01/2038 (Put Date 5/01/2022) | 1,730,000 | 1,766,134 | ||
| Medford, OR, Hospital Facility Authority Rev. (Asante Projects), ”A“, 5%, 8/15/2045 | 2,140,000 | 2,679,095 | ||
| Medford, OR, Hospital Facility Authority Rev. (Asante Projects), ”A“, 4%, 8/15/2050 | 1,510,000 | 1,704,355 | ||
| Medford, OR, Hospital Facility Authority Rev. (Asante Projects), ”A“, 5%, 8/15/2050 | 1,425,000 | 1,778,277 | ||
| Medford, OR, Hospital Facility Authority Rev. (Asante Projects), ”A“, AGM, 4%, 8/15/2045 | 3,920,000 | 4,553,111 | ||
| Oregon Facilities Authority Rev. (Legacy Health), ”A“, 5%, 6/01/2046 | 10,100,000 | 11,687,540 | ||
| Oregon Facilities Authority Rev. (Samaritan Health Services Project), ”A“, 5%, 10/01/2040 | 750,000 | 925,666 | ||
| Oregon Health & Sciences University Rev., ”B“, 5%, 7/01/2034 | 7,500,000 | 8,838,845 | ||
| Oregon Housing & Community Services Department Mortgage Rev. (Single-Family Mortgage Program), ”D“, 4.75%, 1/01/2050 (u) | 7,585,000 | 8,481,340 | ||
| Port of Portland, OR, International Airport Rev., ”24B“, 5%, 7/01/2042 | 1,340,000 | 1,553,501 | ||
| Washington Clackamas & Yamhill Counties, OR, Sherwood School District No. 88J, General Obligation, ”B“, 5%, 6/15/2030 | 4,000,000 | 4,945,814 | ||
| Issuer | Shares/Par | Value ($) | ||
| Municipal Bonds - continued | ||||
| Oregon - continued | ||||
| Washington Clackamas & Yamhill Counties, OR, Sherwood School District No. 88J, General Obligation, ”B“, 5%, 6/15/2033 | $ | 1,750,000 | $ 2,142,487 | |
| $53,289,205 | ||||
| Pennsylvania - 6.8% | ||||
| Allegheny County, PA, Hospital Development Authority Rev. (Allegheny Health Network Obligated Group), ”A“, 4%, 4/01/2044 | $ | 11,910,000 | $ 13,049,196 | |
| Allentown, PA, City School District Rev., ”C“, BAM, 4%, 2/01/2035 | 1,150,000 | 1,320,986 | ||
| Allentown, PA, City School District Rev., ”C“, BAM, 4%, 2/01/2036 | 1,100,000 | 1,259,515 | ||
| Allentown, PA, Neighborhood Improvement Zone Development Authority Tax Rev. (City Center Project), 5%, 5/01/2028 (n) | 250,000 | 300,513 | ||
| Allentown, PA, Neighborhood Improvement Zone Development Authority Tax Rev. (City Center Project), 5%, 5/01/2033 (n) | 135,000 | 159,436 | ||
| Allentown, PA, Neighborhood Improvement Zone Development Authority Tax Rev. (City Center Project), 5%, 5/01/2042 (n) | 330,000 | 386,904 | ||
| Allentown, PA, Neighborhood Improvement Zone Development Authority Tax Rev. (City Center Refunding Project), 5%, 5/01/2027 (n) | 2,000,000 | 2,369,369 | ||
| Armstrong & Indiana Counties, PA, Armstrong School District, General Obligation, “A”, BAM, 4%, 3/15/2035 | 500,000 | 581,027 | ||
| Armstrong & Indiana Counties, PA, Armstrong School District, General Obligation, “A”, BAM, 4%, 3/15/2036 | 1,075,000 | 1,245,206 | ||
| Armstrong & Indiana Counties, PA, Armstrong School District, General Obligation, “A”, BAM, 4%, 3/15/2037 | 500,000 | 577,233 | ||
| Armstrong & Indiana Counties, PA, Armstrong School District, General Obligation, “A”, BAM, 4%, 3/15/2038 | 500,000 | 575,682 | ||
| Armstrong & Indiana Counties, PA, Armstrong School District, General Obligation, “A”, BAM, 4%, 3/15/2041 | 2,500,000 | 2,856,999 | ||
| Beaver County, PA, Economic Development Authority Rev., BAM, 4%, 11/15/2035 | 2,280,000 | 2,572,558 | ||
| Beaver County, PA, Economic Development Authority Rev., BAM, 4%, 11/15/2036 | 855,000 | 961,648 | ||
| Berks County, PA, Industrial Development Authority Health System Rev. (Tower Health Project), 5%, 11/01/2028 | 1,125,000 | 1,219,563 | ||
| Berks County, PA, Industrial Development Authority Health System Rev. (Tower Health Project), 5%, 11/01/2029 | 3,955,000 | 4,245,016 | ||
| Berks County, PA, Industrial Development Authority Health System Rev. (Tower Health Project), 5%, 11/01/2030 | 2,025,000 | 2,156,070 | ||
| Issuer | Shares/Par | Value ($) | ||
| Municipal Bonds - continued | ||||
| Pennsylvania - continued | ||||
| Berks County, PA, Industrial Development Authority Health System Rev. (Tower Health Project), 5%, 11/01/2037 | $ | 940,000 | $ 970,730 | |
| Berks County, PA, Industrial Development Authority Health System Rev. (Tower Health Project), 5%, 11/01/2047 | 1,460,000 | 1,463,793 | ||
| Berks County, PA, Municipal Authority Rev. (Reading Hospital & Medical Center), ”A“, 5%, 11/01/2044 | 7,670,000 | 7,676,811 | ||
| Berks County, PA, Municipal Authority Rev. (Tower Health Project), ”B“, 5%, 2/01/2040 (Put Date 2/01/2030) | 4,200,000 | 4,664,010 | ||
| Berks County, PA, Municipal Authority Rev. (Tower Health Project), ”B-1“, 5%, 2/01/2040 (Put Date 2/01/2025) | 9,885,000 | 10,600,546 | ||
| Berks County, PA, Reading School District, AGM, 5%, 3/01/2036 | 550,000 | 664,064 | ||
| Berks County, PA, Reading School District, BAM, 4%, 4/01/2044 | 945,000 | 1,072,939 | ||
| Bucks County, PA, Industrial Development Authority, Hospital Rev. (St. Luke's University Health Network Project), 4%, 8/15/2044 | 895,000 | 990,252 | ||
| Bucks County, PA, Industrial Development Authority, Hospital Rev. (St. Luke's University Health Network Project), 4%, 8/15/2050 | 4,485,000 | 4,930,697 | ||
| Cambria County, PA, General Obligation, ”B“, AGM, 4%, 8/01/2032 | 225,000 | 253,309 | ||
| Cambria County, PA, General Obligation, ”B“, AGM, 4%, 8/01/2033 | 270,000 | 302,679 | ||
| Cambria County, PA, General Obligation, ”B“, AGM, 4%, 8/01/2034 | 335,000 | 373,722 | ||
| Cambria County, PA, General Obligation, ”B“, AGM, 4%, 8/01/2035 | 325,000 | 361,200 | ||
| Cambria County, PA, General Obligation, ”B“, AGM, 4%, 8/01/2036 | 170,000 | 188,643 | ||
| Chester County, PA, Industrial Development Authority Educational Facilities Rev. (Avon Grove Charter School), ”A“, 4.75%, 12/15/2037 | 1,115,000 | 1,239,252 | ||
| Chester County, PA, Industrial Development Authority Educational Facilities Rev. (Avon Grove Charter School), ”A“, 5%, 12/15/2047 | 530,000 | 589,626 | ||
| Chester County, PA, Industrial Development Authority Educational Facilities Rev. (Avon Grove Charter School), ”A“, 5%, 12/15/2051 | 645,000 | 716,233 | ||
| Commonwealth of Pennsylvania, Tobacco Master Settlement Financing Authority Rev., 5%, 6/01/2032 | 1,475,000 | 1,814,978 | ||
| Commonwealth of Pennsylvania, Tobacco Master Settlement Financing Authority Rev., 5%, 6/01/2033 | 1,260,000 | 1,543,165 | ||
| Issuer | Shares/Par | Value ($) | ||
| Municipal Bonds - continued | ||||
| Pennsylvania - continued | ||||
| Commonwealth of Pennsylvania, Tobacco Master Settlement Financing Authority Rev., 5%, 6/01/2034 | $ | 630,000 | $ 768,734 | |
| Cumberland County, PA, Municipal Authority Rev. (Diakon Lutheran Social Ministries), 5%, 1/01/2022 | 1,105,000 | 1,134,697 | ||
| Cumberland County, PA, Municipal Authority Rev. (Diakon Lutheran Social Ministries), 5%, 1/01/2023 | 795,000 | 843,838 | ||
| Cumberland County, PA, Municipal Authority Rev. (Diakon Lutheran Social Ministries), 4%, 1/01/2033 (Prerefunded 1/01/2025) | 310,000 | 349,277 | ||
| Cumberland County, PA, Municipal Authority Rev. (Diakon Lutheran Social Ministries), 4%, 1/01/2033 | 1,845,000 | 1,941,794 | ||
| Cumberland County, PA, Municipal Authority Rev. (Diakon Lutheran Social Ministries), 5%, 1/01/2038 (Prerefunded 1/01/2025) | 30,000 | 34,909 | ||
| Cumberland County, PA, Municipal Authority Rev. (Diakon Lutheran Social Ministries), 5%, 1/01/2038 | 315,000 | 345,056 | ||
| Cumberland County, PA, Municipal Authority Rev. (Diakon Lutheran Social Ministries), ETM, 5%, 1/01/2022 | 170,000 | 175,970 | ||
| Cumberland County, PA, Municipal Authority Rev. (Diakon Lutheran Social Ministries), ETM, 5%, 1/01/2023 | 120,000 | 129,796 | ||
| Dallas, PA, Municipal Authority, University Rev. (Misericordia University Project), 5%, 5/01/2029 | 1,440,000 | 1,563,147 | ||
| Dallas, PA, Municipal Authority, University Rev. (Misericordia University Project), 5%, 5/01/2048 | 505,000 | 572,018 | ||
| Delaware Valley, PA, Regional Finance Authority, ”C“, FLR, 0.878% (LIBOR - 3mo. + 0.75%), 6/01/2037 | 7,315,000 | 7,170,215 | ||
| Doylestown, PA, Hospital Rev., ”A“, 4%, 7/01/2045 | 585,000 | 607,919 | ||
| Doylestown, PA, Hospital Rev., ”A“, 5%, 7/01/2049 | 590,000 | 658,759 | ||
| East Hempfield Township, PA, Industrial Development Authority Rev. (Student Services, Inc., Student Housing Project at Millersville University of Pennsylvania), 5%, 7/01/2030 | 365,000 | 377,210 | ||
| East Hempfield Township, PA, Industrial Development Authority Rev. (Student Services, Inc., Student Housing Project at Millersville University of Pennsylvania), 5%, 7/01/2035 | 470,000 | 483,879 | ||
| East Hempfield Township, PA, Industrial Development Authority Rev. (Student Services, Inc., Student Housing Project at Millersville University of Pennsylvania), 5%, 7/01/2039 | 485,000 | 494,984 | ||
| East Hempfield Township, PA, Industrial Development Authority Rev. (Student Services, Inc., Student Housing Project at Millersville University of Pennsylvania), 5%, 7/01/2046 | 265,000 | 270,054 | ||
| Erie, PA, City School District General Obligation, ”A“, AGM, 5%, 4/01/2034 | 820,000 | 1,029,641 | ||
| Issuer | Shares/Par | Value ($) | ||
| Municipal Bonds - continued | ||||
| Pennsylvania - continued | ||||
| Lehigh County, PA, Hospital Authority Rev. (Lehigh Valley Health Network), ”A“, 4%, 7/01/2049 | $ | 7,950,000 | $ 9,062,796 | |
| Lehigh County, PA, Water & Sewer Authority Rev. (Allentown Concession), Capital Appreciation, ”B“, 0%, 12/01/2036 | 12,095,000 | 7,969,911 | ||
| Lehigh County, PA, Water & Sewer Authority Rev., ”A“, 5%, 12/01/2043 | 4,445,000 | 4,923,591 | ||
| Lehigh County, PA, Water & Sewer Authority Rev., ”A“, 5%, 12/01/2043 (Prerefunded 12/01/2023) | 5,165,000 | 5,808,042 | ||
| Luzerne County, PA, ”A“, AGM, 5%, 12/15/2021 | 755,000 | 779,002 | ||
| Luzerne County, PA, ”A“, AGM, 5%, 12/15/2023 | 675,000 | 751,119 | ||
| Luzerne County, PA, ”A“, AGM, 5%, 12/15/2024 | 690,000 | 791,647 | ||
| Luzerne County, PA, ”A“, AGM, 5%, 12/15/2026 | 630,000 | 762,952 | ||
| Luzerne County, PA, ”A“, AGM, 5%, 11/15/2029 | 5,835,000 | 6,925,745 | ||
| Luzerne County, PA, ”A“, AGM, 5%, 12/15/2029 | 1,570,000 | 1,961,078 | ||
| Luzerne County, PA, Wilkes-Barre Area School District, General Obligation, BAM, 5%, 4/15/2059 | 940,000 | 1,135,086 | ||
| Montgomery County, PA, Higher Education & Health Authority Rev. (Thomas Jefferson University), 5%, 9/01/2031 | 680,000 | 856,397 | ||
| Montgomery County, PA, Higher Education & Health Authority Rev. (Thomas Jefferson University), 5%, 9/01/2032 | 2,625,000 | 3,218,297 | ||
| Montgomery County, PA, Higher Education & Health Authority Rev. (Thomas Jefferson University), 5%, 9/01/2033 | 2,000,000 | 2,443,444 | ||
| Montgomery County, PA, Higher Education & Health Authority Rev. (Thomas Jefferson University), 4%, 9/01/2044 | 1,970,000 | 2,206,300 | ||
| Montgomery County, PA, Higher Education & Health Authority Rev. (Thomas Jefferson University), 4%, 9/01/2049 | 1,880,000 | 2,091,041 | ||
| Montgomery County, PA, Higher Education & Health Authority Rev. (Thomas Jefferson University), 4%, 9/01/2051 | 3,785,000 | 4,202,861 | ||
| Montgomery County, PA, Industrial Development Authority Retirement Communities Rev. (Acts Retirement-Life Communities, Inc. Obligated Group), ”C“, 5%, 11/15/2045 | 1,380,000 | 1,633,463 | ||
| Montgomery County, PA, Industrial Development Authority Rev. (Whitemarsh Continuing Care Retirement Community Project), 5.375%, 1/01/2050 | 1,015,000 | 1,056,870 | ||
| Montour County, PA, Geisinger Authority Health System Rev., ”A“, 4%, 4/01/2039 | 3,320,000 | 3,882,760 | ||
| Northeastern, PA, Hospital & Education Authority College Rev. (King's College Project), 5%, 5/01/2032 | 450,000 | 534,908 | ||
| Northeastern, PA, Hospital & Education Authority College Rev. (King's College Project), 5%, 5/01/2033 | 600,000 | 707,178 | ||
| Northeastern, PA, Hospital & Education Authority College Rev. (King's College Project), 5%, 5/01/2044 | 1,310,000 | 1,502,283 | ||
| Issuer | Shares/Par | Value ($) | ||
| Municipal Bonds - continued | ||||
| Pennsylvania - continued | ||||
| Northeastern, PA, Hospital & Education Authority College Rev. (King's College Project), 5%, 5/01/2049 | $ | 800,000 | $ 914,143 | |
| Pennsylvania Economic Development Financing Authority Private Activity Rev. (Pennsylvania Rapid Bridge Replacement Project), 5%, 6/30/2021 | 3,270,000 | 3,305,363 | ||
| Pennsylvania Economic Development Financing Authority Private Activity Rev. (Pennsylvania Rapid Bridge Replacement Project), 5%, 12/31/2021 | 3,270,000 | 3,380,600 | ||
| Pennsylvania Economic Development Financing Authority Sewage Sludge Disposal Refunding Rev. (Philadelphia Biosolids Facility Project), 4%, 1/01/2026 | 1,110,000 | 1,251,724 | ||
| Pennsylvania Economic Development Financing Authority Sewage Sludge Disposal Refunding Rev. (Philadelphia Biosolids Facility Project), 4%, 1/01/2027 | 760,000 | 867,029 | ||
| Pennsylvania Economic Development Financing Authority Sewage Sludge Disposal Refunding Rev. (Philadelphia Biosolids Facility Project), 4%, 1/01/2028 | 795,000 | 913,445 | ||
| Pennsylvania Economic Development Financing Authority Sewage Sludge Disposal Refunding Rev. (Philadelphia Biosolids Facility Project), 4%, 1/01/2031 | 210,000 | 244,639 | ||
| Pennsylvania Economic Development Financing Authority, Solid Waste Disposal Rev. (Republic Services, Inc. Project), ”A“, 0.2%, 4/01/2034 (Put Date 4/15/2021) | 1,660,000 | 1,660,032 | ||
| Pennsylvania Economic Development Financing Authority, Solid Waste Disposal Rev. (Republic Services, Inc. Project), ”B“, 0.2%, 4/01/2049 (Put Date 4/15/2021) | 1,475,000 | 1,475,029 | ||
| Pennsylvania Economic Development Financing Authority, Solid Waste Disposal Rev. (Waste Management Project, Inc.), 2.15%, 7/01/2041 (Put Date 7/01/2024) | 8,000,000 | 8,389,218 | ||
| Pennsylvania Higher Educational Facilities Authority Rev. (Drexel University), ”A“, AGM, 4%, 5/01/2040 | 1,310,000 | 1,488,044 | ||
| Pennsylvania Higher Educational Facilities Authority Rev. (Duquesne University), ”A“, 5%, 3/01/2038 | 1,000,000 | 1,219,679 | ||
| Pennsylvania Higher Educational Facilities Authority Rev. (Duquesne University), ”A“, 5%, 3/01/2039 | 250,000 | 304,116 | ||
| Pennsylvania Higher Educational Facilities Authority Rev. (Shippensburg University Student Services, Inc. Housing Project), 6.25%, 10/01/2043 (Prerefunded 10/01/2021) | 2,305,000 | 2,373,574 | ||
| Pennsylvania Higher Educational Facilities Authority Rev. (Shippensburg University Student Services, Inc. Housing Project), 5%, 10/01/2044 (Prerefunded 10/01/2022) | 3,915,000 | 4,196,674 | ||
| Pennsylvania Housing Finance Agency, Single Family Mortgage Rev., ”128A“, 4.75%, 4/01/2033 (u) | 5,705,000 | 6,300,152 | ||
| Issuer | Shares/Par | Value ($) | ||
| Municipal Bonds - continued | ||||
| Pennsylvania - continued | ||||
| Pennsylvania Housing Finance Agency, Single Family Mortgage Rev., “134A”, 3%, 10/01/2049 | $ | 15,380,000 | $ 16,644,336 | |
| Pennsylvania Public School Building Authority, School Lease Rev. (School District of Philadelphia Project), 5%, 4/01/2028 (Prerefunded 4/01/2022) | 1,870,000 | 1,960,544 | ||
| Pennsylvania Public School Building Authority, School Lease Rev. (School District of Philadelphia Project), ”A“, AGM, 5%, 6/01/2030 | 2,000,000 | 2,427,214 | ||
| Pennsylvania Public School Building Authority, School Lease Rev. (School District of Philadelphia Project), ”A“, AGM, 5%, 6/01/2032 | 7,820,000 | 9,476,065 | ||
| Pennsylvania Public School Building Authority, School Lease Rev. (School District of Philadelphia Project), ”A“, AGM, 5%, 6/01/2033 | 22,255,000 | 26,940,839 | ||
| Pennsylvania Turnpike Commission Rev., ”A“, 5%, 12/01/2044 | 2,220,000 | 2,770,189 | ||
| Philadelphia, PA, ”B“, 5%, 2/01/2032 | 5,250,000 | 6,757,605 | ||
| Philadelphia, PA, ”B“, 5%, 2/01/2035 | 3,850,000 | 4,887,552 | ||
| Philadelphia, PA, Airport Refunding Rev., ”B“, 5%, 7/01/2047 | 5,000,000 | 5,796,328 | ||
| Philadelphia, PA, Airport Rev., ”B“, 5%, 7/01/2033 | 4,215,000 | 5,018,264 | ||
| Philadelphia, PA, Airport Rev., ”B“, 5%, 7/01/2034 | 250,000 | 296,861 | ||
| Philadelphia, PA, Airport Rev., ”B“, 5%, 7/01/2042 | 11,175,000 | 13,044,022 | ||
| Philadelphia, PA, Authority for Industrial Development Rev. (MaST Charter School Project), ”A“, 5.625%, 8/01/2036 | 315,000 | 350,464 | ||
| Philadelphia, PA, Authority for Industrial Development Rev. (MaST Charter School Project), ”A“, 5.75%, 8/01/2046 | 1,030,000 | 1,135,282 | ||
| Philadelphia, PA, Authority for Industrial Development Rev. (MaST Charter School Project), ”A“, 5.375%, 8/01/2051 | 1,530,000 | 1,697,721 | ||
| Philadelphia, PA, Authority for Industrial Development Rev. (MaST Charter School Project), ”B“, 6%, 8/01/2051 | 1,180,000 | 1,311,759 | ||
| Philadelphia, PA, Authority for Industrial Development Rev. (Tacony Academy Charter School Project), ”A-1“, 6.75%, 6/15/2033 | 150,000 | 165,524 | ||
| Philadelphia, PA, Authority for Industrial Development Rev. (Tacony Academy Charter School Project), ”A-1“, 7%, 6/15/2043 | 355,000 | 390,731 | ||
| Philadelphia, PA, Authority for Industrial Development Rev. (Thomas Jefferson University), ”A“, 5%, 9/01/2035 | 1,040,000 | 1,243,509 | ||
| Philadelphia, PA, Authority for Industrial Development Rev. (Thomas Jefferson University), ”A“, 5%, 9/01/2042 | 10,810,000 | 12,740,765 | ||
| Philadelphia, PA, Authority for Industrial Development, Multi-Family Housing Rev. (University Square Apartment Project-Section 8), ”I“, 5%, 12/01/2037 | 2,080,000 | 2,417,617 | ||
| Issuer | Shares/Par | Value ($) | ||
| Municipal Bonds - continued | ||||
| Pennsylvania - continued | ||||
| Philadelphia, PA, Authority for Industrial Development, Multi-Family Housing Rev. (University Square Apartment Project-Section 8), ”I“, 5%, 12/01/2058 | $ | 8,300,000 | $ 9,458,643 | |
| Philadelphia, PA, Authority for Industrial Development, Multi-Family Housing Rev. (University Square Apartment Project-Section 8), ”III“, 5.25%, 12/01/2047 (n) | 350,000 | 369,391 | ||
| Philadelphia, PA, Authority for Industrial Development, Multi-Family Housing Rev. (University Square Apartment Project-Section 8), ”III“, 5.5%, 12/01/2058 (n) | 505,000 | 535,360 | ||
| Philadelphia, PA, Authority for Industrial Development, Senior Living Facilities Rev. (Wesley Enhanced Living Obligated Group), ”A“, 5%, 7/01/2037 | 565,000 | 594,614 | ||
| Philadelphia, PA, Authority for Industrial Development, Senior Living Facilities Rev. (Wesley Enhanced Living Obligated Group), ”A“, 5%, 7/01/2042 | 1,940,000 | 2,019,959 | ||
| Philadelphia, PA, Authority for Industrial Development, Senior Living Facilities Rev. (Wesley Enhanced Living Obligated Group), ”A“, 5%, 7/01/2049 | 1,685,000 | 1,734,890 | ||
| Philadelphia, PA, Gas Works Rev. (1998 General Ordinance), ”15“, 5%, 8/01/2042 | 9,075,000 | 10,847,332 | ||
| Philadelphia, PA, Gas Works Rev., ”14“, AGM, 5%, 10/01/2033 | 2,910,000 | 3,513,927 | ||
| Philadelphia, PA, Redevelopment Authority Refunding Rev. (Neighborhood Transformation Initiative), BAM, 5%, 4/15/2024 | 1,900,000 | 1,990,991 | ||
| Philadelphia, PA, School District, ”A“, 5%, 9/01/2033 | 310,000 | 387,510 | ||
| Philadelphia, PA, School District, ”A“, 5%, 9/01/2035 | 1,160,000 | 1,438,734 | ||
| Philadelphia, PA, School District, ”A“, 4%, 9/01/2036 | 1,565,000 | 1,790,403 | ||
| Philadelphia, PA, School District, ”A“, 5%, 9/01/2036 | 385,000 | 475,460 | ||
| Philadelphia, PA, School District, ”A“, 4%, 9/01/2037 | 1,240,000 | 1,409,970 | ||
| Philadelphia, PA, School District, ”A“, 5%, 9/01/2037 | 385,000 | 473,520 | ||
| Philadelphia, PA, School District, ”A“, 4%, 9/01/2038 | 1,775,000 | 2,022,842 | ||
| Philadelphia, PA, School District, ”A“, 5%, 9/01/2038 | 385,000 | 472,950 | ||
| Philadelphia, PA, School District, ”A“, 4%, 9/01/2039 | 1,000,000 | 1,135,079 | ||
| Philadelphia, PA, School District, ”B“, 5%, 9/01/2043 | 1,160,000 | 1,397,485 | ||
| Philadelphia, PA, School District, ”F“, 5%, 9/01/2037 | 1,020,000 | 1,219,095 | ||
| Philadelphia, PA, School District, ”F“, 5%, 9/01/2038 | 255,000 | 304,185 | ||
| Philadelphia, PA, Water & Wastewater Refunding Rev., ”A“, 5%, 11/01/2045 | 6,500,000 | 8,318,351 | ||
| Pittsburgh, PA, Water & Sewer Authority Rev., ”A“, AGM, 5%, 9/01/2032 | 750,000 | 1,020,067 | ||
| Pittsburgh, PA, Water & Sewer Authority Rev., ”A“, AGM, 5%, 9/01/2033 | 565,000 | 780,392 | ||
| Pittsburgh, PA, Water & Sewer Authority Rev., ”A“, AGM, 4%, 9/01/2035 | 285,000 | 338,778 | ||
| Issuer | Shares/Par | Value ($) | ||
| Municipal Bonds - continued | ||||
| Pennsylvania - continued | ||||
| Pittsburgh, PA, Water & Sewer Authority Rev., ”A“, AGM, 5%, 9/01/2044 | $ | 1,875,000 | $ 2,305,828 | |
| Washington County, PA, Canon-McMillan School District, BAM, 4%, 6/01/2044 | 1,920,000 | 2,147,738 | ||
| Washington County, PA, Canon-McMillan School District, BAM, 4%, 6/01/2046 | 2,945,000 | 3,281,962 | ||
| Washington County, PA, Canon-McMillan School District, BAM, 4%, 6/01/2048 | 2,015,000 | 2,238,663 | ||
| Washington County, PA, Redevelopment Authority Refunding Rev. (Victory Centre Tax Increment Financing Project), 4%, 7/01/2023 | 90,000 | 91,688 | ||
| Washington County, PA, Redevelopment Authority Refunding Rev. (Victory Centre Tax Increment Financing Project), 5%, 7/01/2035 | 80,000 | 86,495 | ||
| West Shore, PA, Area Authority Rev. (Messiah Village Project), ”A“, 5%, 7/01/2030 | 445,000 | 487,399 | ||
| West Shore, PA, Area Authority Rev. (Messiah Village Project), ”A“, 5%, 7/01/2035 | 435,000 | 470,810 | ||
| Westmoreland County, PA, Industrial Development Authority, Health System Rev. (Excela Health Project), ”A“, 4%, 7/01/2025 | 350,000 | 388,074 | ||
| Westmoreland County, PA, Industrial Development Authority, Health System Rev. (Excela Health Project), ”A“, 5%, 7/01/2027 | 570,000 | 683,565 | ||
| Westmoreland County, PA, Industrial Development Authority, Health System Rev. (Excela Health Project), ”A“, 5%, 7/01/2029 | 640,000 | 788,439 | ||
| $383,189,479 | ||||
| Puerto Rico - 4.6% | ||||
| Commonwealth of Puerto Rico Highway & Transportation Authority Rev., ”A“, NPFG, 4.75%, 7/01/2038 | $ | 5,860,000 | $ 5,927,595 | |
| Commonwealth of Puerto Rico Highway & Transportation Authority Rev., ”D“, AGM, 5%, 7/01/2032 | 5,005,000 | 5,167,194 | ||
| Commonwealth of Puerto Rico Highway & Transportation Authority Rev., ”J“, NPFG, 5%, 7/01/2029 | 365,000 | 374,299 | ||
| Commonwealth of Puerto Rico Highway & Transportation Authority Rev., ”L“, AAC, 5.25%, 7/01/2038 | 13,075,000 | 14,718,522 | ||
| Commonwealth of Puerto Rico Highway & Transportation Authority Rev., ”M“, AGM, 5%, 7/01/2032 | 660,000 | 681,459 | ||
| Commonwealth of Puerto Rico Highway & Transportation Authority Rev., ”N“, AAC, 5.25%, 7/01/2030 | 5,350,000 | 5,873,745 | ||
| Issuer | Shares/Par | Value ($) | ||
| Municipal Bonds - continued | ||||
| Puerto Rico - continued | ||||
| Commonwealth of Puerto Rico Highway & Transportation Authority Rev., ”N“, AAC, 5.25%, 7/01/2031 | $ | 1,980,000 | $ 2,181,803 | |
| Commonwealth of Puerto Rico Highway & Transportation Authority Rev., ”N“, NPFG, 5.25%, 7/01/2032 | 1,515,000 | 1,680,330 | ||
| Commonwealth of Puerto Rico Highway & Transportation Authority Rev., ”N“, NPFG, 5.25%, 7/01/2033 | 3,330,000 | 3,689,856 | ||
| Commonwealth of Puerto Rico Highway & Transportation Authority Rev., ”Y“, AGM, 6.25%, 7/01/2021 | 2,445,000 | 2,472,802 | ||
| Commonwealth of Puerto Rico Highway & Transportation Authority Rev., Unrefunded Balance, ”A“, NPFG, 5%, 7/01/2038 | 570,000 | 584,522 | ||
| Commonwealth of Puerto Rico, General Obligation, ”A“, 8%, 7/01/2035 (a)(d) | 50,110,000 | 39,336,350 | ||
| Commonwealth of Puerto Rico, Public Improvement, AAC, 4.5%, 7/01/2023 | 210,000 | 210,301 | ||
| Commonwealth of Puerto Rico, Public Improvement, ”A“, AGM, 5%, 7/01/2035 | 7,435,000 | 7,685,581 | ||
| Commonwealth of Puerto Rico, Public Improvement, ”A“, NPFG, 5.5%, 7/01/2021 | 570,000 | 573,732 | ||
| Commonwealth of Puerto Rico, Public Improvement, ”A-4“, AGM, 5.25%, 7/01/2030 | 785,000 | 812,457 | ||
| Commonwealth of Puerto Rico, Public Improvement, ”C-7“, NPFG, 6%, 7/01/2027 | 2,560,000 | 2,640,631 | ||
| Puerto Rico Convention Center District Authority, Hotel Occupancy Tax Rev., ”A“, AAC, 5%, 7/01/2031 | 7,120,000 | 7,284,916 | ||
| Puerto Rico Electric Power Authority Rev., ”A“, 5%, 7/01/2029 (a)(d) | 10,160,000 | 9,194,800 | ||
| Puerto Rico Electric Power Authority Rev., ”A“, 5%, 7/01/2042 (a)(d) | 1,535,000 | 1,389,175 | ||
| Puerto Rico Electric Power Authority Rev., ”AAA“, 5.25%, 7/01/2021 (a)(d) | 850,000 | 771,375 | ||
| Puerto Rico Electric Power Authority Rev., ”AAA“, 5.25%, 7/01/2030 (a)(d) | 405,000 | 367,538 | ||
| Puerto Rico Electric Power Authority Rev., ”CCC“, 5.25%, 7/01/2027 (a)(d) | 3,815,000 | 3,462,112 | ||
| Puerto Rico Electric Power Authority Rev., ”DDD“, 5%, 7/01/2020 (a)(d) | 425,000 | 383,563 | ||
| Puerto Rico Electric Power Authority Rev., ”DDD“, 5%, 7/01/2021 (a)(d) | 3,990,000 | 3,610,950 | ||
| Puerto Rico Electric Power Authority Rev., ”DDD“, 5%, 7/01/2022 (a)(d) | 6,450,000 | 5,837,250 | ||
| Puerto Rico Electric Power Authority Rev., ”DDD“, AGM, 3.625%, 7/01/2023 | 445,000 | 445,815 | ||
| Issuer | Shares/Par | Value ($) | ||
| Municipal Bonds - continued | ||||
| Puerto Rico - continued | ||||
| Puerto Rico Electric Power Authority Rev., ”DDD“, AGM, 3.65%, 7/01/2024 | $ | 1,915,000 | $ 1,918,514 | |
| Puerto Rico Electric Power Authority Rev., ”EEE“, 6.05%, 7/01/2032 (a)(d) | 2,380,000 | 2,109,275 | ||
| Puerto Rico Electric Power Authority Rev., ”NN“, NPFG, 5.25%, 7/01/2022 | 1,505,000 | 1,551,705 | ||
| Puerto Rico Electric Power Authority Rev., ”NN“, NPFG, 4.75%, 7/01/2033 | 225,000 | 227,595 | ||
| Puerto Rico Electric Power Authority Rev., ”PP“, NPFG, 5%, 7/01/2022 | 905,000 | 917,578 | ||
| Puerto Rico Electric Power Authority Rev., ”PP“, NPFG, 5%, 7/01/2024 | 160,000 | 163,336 | ||
| Puerto Rico Electric Power Authority Rev., ”PP“, NPFG, 5%, 7/01/2025 | 210,000 | 215,350 | ||
| Puerto Rico Electric Power Authority Rev., ”RR“, AGM, 5%, 7/01/2028 | 110,000 | 113,565 | ||
| Puerto Rico Electric Power Authority Rev., ”RR“, NPFG, 5%, 7/01/2022 | 555,000 | 562,713 | ||
| Puerto Rico Electric Power Authority Rev., ”SS“, AGM, 4.375%, 7/01/2030 | 230,000 | 230,545 | ||
| Puerto Rico Electric Power Authority Rev., ”TT“, 5%, 7/01/2021 (a)(d) | 1,955,000 | 1,769,275 | ||
| Puerto Rico Electric Power Authority Rev., ”TT“, 5%, 7/01/2023 (a)(d) | 1,705,000 | 1,543,025 | ||
| Puerto Rico Electric Power Authority Rev., ”TT“, 5%, 7/01/2027 (a)(d) | 345,000 | 312,225 | ||
| Puerto Rico Electric Power Authority Rev., ”TT“, 5%, 7/01/2037 (a)(d) | 5,215,000 | 4,719,575 | ||
| Puerto Rico Electric Power Authority Rev., ”TT“, NPFG, 5%, 7/01/2024 | 970,000 | 990,222 | ||
| Puerto Rico Electric Power Authority Rev., ”TT“, NPFG, 5%, 7/01/2026 | 35,000 | 35,892 | ||
| Puerto Rico Electric Power Authority Rev., ”UU“, AGM, 5%, 7/01/2022 | 360,000 | 371,655 | ||
| Puerto Rico Electric Power Authority Rev., ”UU“, AGM, 4.25%, 7/01/2027 | 1,385,000 | 1,388,159 | ||
| Puerto Rico Electric Power Authority Rev., ”VV“, NPFG, 5.25%, 7/01/2025 | 280,000 | 303,998 | ||
| Puerto Rico Electric Power Authority Rev., ”VV“, NPFG, 5.25%, 7/01/2026 | 840,000 | 922,905 | ||
| Puerto Rico Electric Power Authority Rev., ”VV“, NPFG, 5.25%, 7/01/2029 | 2,295,000 | 2,543,165 | ||
| Issuer | Shares/Par | Value ($) | ||
| Municipal Bonds - continued | ||||
| Puerto Rico - continued | ||||
| Puerto Rico Electric Power Authority Rev., ”VV“, NPFG, 5.25%, 7/01/2030 | $ | 3,085,000 | $ 3,417,556 | |
| Puerto Rico Electric Power Authority Rev., ”VV“, NPFG, 5.25%, 7/01/2034 | 465,000 | 514,494 | ||
| Puerto Rico Electric Power Authority Rev., ”WW“, 5.375%, 7/01/2022 (a)(d) | 360,000 | 327,150 | ||
| Puerto Rico Electric Power Authority Rev., ”WW“, 5.25%, 7/01/2025 (a)(d) | 815,000 | 739,613 | ||
| Puerto Rico Electric Power Authority Rev., ”ZZ“, 5%, 7/01/2018 (a)(d) | 2,450,000 | 2,183,562 | ||
| Puerto Rico Electric Power Authority Rev., ”ZZ“, 5.25%, 7/01/2023 (a)(d) | 2,730,000 | 2,477,475 | ||
| Puerto Rico Electric Power Authority Rev., ”ZZ“, 5.25%, 7/01/2024 (a)(d) | 955,000 | 866,663 | ||
| Puerto Rico Electric Power Authority Rev., ”ZZ“, 5.25%, 7/01/2026 (a)(d) | 2,950,000 | 2,677,125 | ||
| Puerto Rico Industrial, Tourist, Educational, Medical & Environmental Control Facilities Financing Authority Rev. (Cogeneration Facilities - AES Puerto Rico Project), 9.12%, 6/01/2022 | 5,000,000 | 5,125,000 | ||
| Puerto Rico Industrial, Tourist, Educational, Medical & Environmental Control Facilities Financing Authority, Educational Facilities Rev. (University Plaza Project), NPFG, 5%, 7/01/2033 | 2,805,000 | 2,841,805 | ||
| Puerto Rico Industrial, Tourist, Educational, Medical & Environmental Control Facilities Financing Authority, Higher Education Rev. (Ana G. Mendez University System Project), 5%, 4/01/2021 | 520,000 | 520,000 | ||
| Puerto Rico Industrial, Tourist, Educational, Medical & Environmental Control Facilities Financing Authority, Higher Education Rev. (Ana G. Mendez University System Project), 5.375%, 12/01/2021 | 130,000 | 129,866 | ||
| Puerto Rico Industrial, Tourist, Educational, Medical & Environmental Control Facilities Financing Authority, Higher Education Rev. (Ana G. Mendez University System Project), 5%, 4/01/2022 | 600,000 | 608,071 | ||
| Puerto Rico Industrial, Tourist, Educational, Medical & Environmental Control Facilities Financing Authority, Higher Education Rev. (Ana G. Mendez University System Project), 5%, 3/01/2026 | 155,000 | 154,835 | ||
| Issuer | Shares/Par | Value ($) | ||
| Municipal Bonds - continued | ||||
| Puerto Rico - continued | ||||
| Puerto Rico Industrial, Tourist, Educational, Medical & Environmental Control Facilities Financing Authority, Higher Education Rev. (Ana G. Mendez University System Project), 5%, 4/01/2027 | $ | 2,205,000 | $ 2,232,036 | |
| Puerto Rico Industrial, Tourist, Educational, Medical & Environmental Control Facilities Financing Authority, Higher Education Rev. (Ana G. Mendez University System Project), 5.5%, 12/01/2031 | 690,000 | 689,159 | ||
| Puerto Rico Industrial, Tourist, Educational, Medical & Environmental Control Facilities Financing Authority, Higher Education Rev. (Ana G. Mendez University System Project), 5.125%, 4/01/2032 | 735,000 | 744,741 | ||
| Puerto Rico Industrial, Tourist, Educational, Medical & Environmental Control Facilities Financing Authority, Higher Education Rev. (Ana G. Mendez University System Project), 5%, 3/01/2036 | 820,000 | 819,030 | ||
| Puerto Rico Industrial, Tourist, Educational, Medical & Environmental Control Facilities Financing Authority, Higher Education Rev. (Ana G. Mendez University System Project), 5.375%, 4/01/2042 | 545,000 | 553,175 | ||
| Puerto Rico Infrastructure Financing Authority Special Tax Rev., ”C“, AAC, 5.5%, 7/01/2023 | 3,810,000 | 4,034,172 | ||
| Puerto Rico Infrastructure Financing Authority Special Tax Rev., ”C“, AAC, 5.5%, 7/01/2024 | 7,335,000 | 7,896,112 | ||
| Puerto Rico Infrastructure Financing Authority Special Tax Rev., ”C“, AAC, 5.5%, 7/01/2025 | 705,000 | 768,554 | ||
| Puerto Rico Infrastructure Financing Authority Special Tax Rev., ”C“, AAC, 5.5%, 7/01/2028 | 755,000 | 836,130 | ||
| Puerto Rico Municipal Finance Agency, ”A“, AGM, 5%, 8/01/2027 | 190,000 | 196,157 | ||
| Puerto Rico Public Buildings Authority Government Facilities Rev., ”I“, AGM, 5%, 7/01/2036 | 425,000 | 438,773 | ||
| Puerto Rico Public Buildings Authority Government Facilities Rev., ”M-2“, AAC, 10%, 7/01/2035 | 4,660,000 | 4,897,223 | ||
| Puerto Rico Public Buildings Authority Government Facilities Rev., ”M-3“, NPFG, 6%, 7/01/2027 | 1,600,000 | 1,650,394 | ||
| Puerto Rico Public Buildings Authority Government Facilities Rev., ”M-3“, NPFG, 6%, 7/01/2028 | 435,000 | 449,102 | ||
| Puerto Rico Public Buildings Authority Government Facilities Rev., ”N“, AGM, 5%, 7/01/2032 | 400,000 | 412,963 | ||
| Puerto Rico Sales Tax Financing Corp., Restructured Sales Tax Rev., ”2019A-1“, 4.5%, 7/01/2034 | 395,000 | 426,104 | ||
| Issuer | Shares/Par | Value ($) | ||
| Municipal Bonds - continued | ||||
| Puerto Rico - continued | ||||
| Puerto Rico Sales Tax Financing Corp., Restructured Sales Tax Rev., ”2019A-1“, 4.55%, 7/01/2040 | $ | 974,000 | $ 1,055,624 | |
| Puerto Rico Sales Tax Financing Corp., Restructured Sales Tax Rev., ”2019A-1“, 5%, 7/01/2058 | 21,041,000 | 23,169,928 | ||
| Puerto Rico Sales Tax Financing Corp., Restructured Sales Tax Rev., ”2019A-2“, 4.329%, 7/01/2040 | 9,821,000 | 10,505,720 | ||
| Puerto Rico Sales Tax Financing Corp., Restructured Sales Tax Rev., ”2019A-2“, 4.536%, 7/01/2053 | 132,000 | 141,539 | ||
| Puerto Rico Sales Tax Financing Corp., Restructured Sales Tax Rev., ”2019A-2“, 4.784%, 7/01/2058 | 1,824,000 | 1,973,760 | ||
| Puerto Rico Sales Tax Financing Corp., Restructured Sales Tax Rev., Capital Appreciation, ”2019A-1“, 0%, 7/01/2024 | 157,000 | 147,352 | ||
| Puerto Rico Sales Tax Financing Corp., Restructured Sales Tax Rev., Capital Appreciation, ”2019A-1“, 0%, 7/01/2027 | 1,554,000 | 1,361,426 | ||
| Puerto Rico Sales Tax Financing Corp., Restructured Sales Tax Rev., Capital Appreciation, ”2019A-1“, 0%, 7/01/2029 | 293,000 | 241,307 | ||
| Puerto Rico Sales Tax Financing Corp., Restructured Sales Tax Rev., Capital Appreciation, ”2019A-1“, 0%, 7/01/2031 | 14,021,000 | 10,730,832 | ||
| Puerto Rico Sales Tax Financing Corp., Restructured Sales Tax Rev., Capital Appreciation, ”2019A-1“, 0%, 7/01/2033 | 13,721,000 | 9,739,490 | ||
| Puerto Rico Sales Tax Financing Corp., Restructured Sales Tax Rev., Capital Appreciation, ”2019A-1“, 0%, 7/01/2046 | 9,798,000 | 2,990,056 | ||
| University of Puerto Rico Rev., ”P“, NPFG, 5%, 6/01/2025 | 350,000 | 358,917 | ||
| $262,311,936 | ||||
| Rhode Island - 0.2% | ||||
| Providence, RI, ”A“, 5%, 1/15/2025 (Prerefunded 1/15/2023) | $ | 1,345,000 | $ 1,458,501 | |
| Rhode Island Student Loan Authority, Student Loan Rev., ”A“, 5%, 12/01/2021 | 1,120,000 | 1,153,564 | ||
| Rhode Island Student Loan Authority, Student Loan Rev., ”A“, 3.25%, 12/01/2022 | 1,455,000 | 1,457,660 | ||
| Rhode Island Student Loan Authority, Student Loan Rev., ”A“, 5%, 12/01/2022 | 700,000 | 751,893 | ||
| Rhode Island Student Loan Authority, Student Loan Rev., ”A“, 3.5%, 12/01/2034 | 1,845,000 | 1,902,413 | ||
| Rhode Island Student Loan Authority, Student Loan Rev., ”A“, 3.625%, 12/01/2037 | 4,625,000 | 4,762,182 | ||
| $11,486,213 | ||||
| Issuer | Shares/Par | Value ($) | ||
| Municipal Bonds - continued | ||||
| South Carolina - 2.0% | ||||
| Chesterfield County, SC, School District, 5%, 3/01/2025 | $ | 2,250,000 | $ 2,345,836 | |
| Lexington County, SC, Health Services District, Inc., Hospital Refunding Rev., 5%, 11/01/2028 | 650,000 | 806,380 | ||
| North Charleston, SC, Limited Obligation Bond (Hospitality Fee Pledge), ”A“, 5%, 10/01/2040 | 3,880,000 | 4,587,237 | ||
| Richland County, SC, Environmental Improvement Rev. (International Paper), ”A“, 3.875%, 4/01/2023 | 5,750,000 | 6,105,240 | ||
| Rock Hill, SC, Combined Utility System Rev., ”A“, 4%, 1/01/2049 | 4,350,000 | 4,957,487 | ||
| South Carolina Jobs & Economic Development Authority, Health Facilities Rev. (Lutheran Homes of South Carolina, Inc.), 5%, 5/01/2021 | 875,000 | 876,737 | ||
| South Carolina Jobs & Economic Development Authority, Hospital Rev. (Conway Hospital, Inc.), 5.25%, 7/01/2047 | 8,425,000 | 9,609,466 | ||
| South Carolina Jobs & Economic Development Authority, Hospital Rev. (Prisma Health Obligated Group), ”A“, 5%, 5/01/2048 | 6,685,000 | 7,867,114 | ||
| South Carolina Jobs & Economic Development Authority, Hospital Rev. (St. Joseph's/Candler Health System, Inc.), ”C“, 5%, 7/01/2032 | 5,000,000 | 6,230,761 | ||
| South Carolina Jobs & Economic Development Authority, Residential Care Facilities Rev. (South Carolina Episcopal Home at Still Hopes), 5%, 4/01/2047 | 1,580,000 | 1,684,644 | ||
| South Carolina Jobs & Economic Development Authority, Residential Care Facilities Rev. (South Carolina Episcopal Home at Still Hopes), 5%, 4/01/2052 | 1,210,000 | 1,288,741 | ||
| South Carolina Ports Authority Rev., 5.25%, 7/01/2050 (Prerefunded 7/01/2025) | 3,075,000 | 3,669,700 | ||
| South Carolina Ports Authority Rev. (tax-exempt), ”B“, 5%, 7/01/2044 | 8,000,000 | 9,700,316 | ||
| South Carolina Ports Authority Rev., ”B“, 4%, 7/01/2035 | 3,405,000 | 3,935,335 | ||
| South Carolina Ports Authority Rev., ”B“, 4%, 7/01/2037 | 5,290,000 | 6,073,412 | ||
| South Carolina Ports Authority Rev., ”B“, 4%, 7/01/2039 | 5,235,000 | 5,977,948 | ||
| South Carolina Public Service Authority Rev., ”A“, 5.125%, 12/01/2043 | 2,745,000 | 3,052,554 | ||
| South Carolina Public Service Authority Rev., ”B“, 5.125%, 12/01/2043 | 6,550,000 | 7,283,873 | ||
| South Carolina Public Service Authority Rev., ”C“, 5%, 12/01/2036 | 2,920,000 | 3,001,714 | ||
| South Carolina Student Loan Corp., Student Loan Rev., ”A“, 2.641%, 12/01/2026 | 7,990,000 | 7,816,362 | ||
| South Carolina Student Loan Corp., Student Loan Rev., ”A“, 2.771%, 12/01/2027 | 3,700,000 | 3,579,032 | ||
| Issuer | Shares/Par | Value ($) | ||
| Municipal Bonds - continued | ||||
| South Carolina - continued | ||||
| South Carolina Student Loan Corp., Student Loan Rev., ”A“, 2.923%, 12/01/2028 | $ | 2,750,000 | $ 2,634,864 | |
| South Carolina Student Loan Corp., Student Loan Rev., ”A“, 2.993%, 12/01/2029 | 1,800,000 | 1,712,844 | ||
| South Carolina Student Loan Corp., Student Loan Rev., ”A“, 3.043%, 12/01/2030 | 575,000 | 543,718 | ||
| South Carolina Student Loan Corp., Student Loan Rev., ”A“, 3.593%, 12/01/2039 | 4,150,000 | 3,993,503 | ||
| Spartanburg County, SC, Regional Health Services District Hospital Rev., ”A“, 5%, 4/15/2048 | 4,620,000 | 5,422,673 | ||
| Spartanburg County, SC, Regional Health Services District Hospital Rev., ”A“, AGM, 4%, 4/15/2045 | 1,080,000 | 1,217,108 | ||
| $115,974,599 | ||||
| South Dakota - 0.3% | ||||
| South Dakota Educational Enhancement Funding Corp., Tobacco Settlement Rev., ”B“, 5%, 6/01/2024 | $ | 1,000,000 | $ 1,089,462 | |
| South Dakota Educational Enhancement Funding Corp., Tobacco Settlement Rev., ”B“, 5%, 6/01/2025 | 1,000,000 | 1,085,694 | ||
| South Dakota Educational Enhancement Funding Corp., Tobacco Settlement Rev., ”B“, 5%, 6/01/2026 | 1,400,000 | 1,516,186 | ||
| South Dakota Housing Development Authority, Homeownership Mortgage, ”A“, 3%, 11/01/2051 | 3,010,000 | 3,297,308 | ||
| South Dakota Housing Development Authority, Homeownership Mortgage, ”B“, 4.5%, 11/01/2048 (u) | 8,300,000 | 9,249,547 | ||
| $16,238,197 | ||||
| Tennessee - 2.3% | ||||
| Chattanooga, TN, Health, Educational & Housing Facility Board Rev. (Catholic Health Initiatives), ”A“, 5.25%, 1/01/2045 (Prerefunded 1/01/2023) | $ | 10,310,000 | $ 11,196,248 | |
| Chattanooga, TN, Health, Educational & Housing Facility Board Rev. (CommonSpirit Health), ”A-1“, 4%, 8/01/2044 | 440,000 | 488,199 | ||
| Chattanooga, TN, Health, Educational & Housing Facility Board Rev. (CommonSpirit Health), ”A-2“, 5%, 8/01/2044 | 655,000 | 794,227 | ||
| Chattanooga, TN, Health, Educational & Housing Facility Board Rev. (CommonSpirit Health), ”A-2“, 5%, 8/01/2049 | 330,000 | 397,157 | ||
| Knox County, TN, Health, Educational & Housing Facility Board Hospital Rev. (Covenant Health), ”A“, 5%, 1/01/2042 | 7,000,000 | 8,139,142 | ||
| Knox County, TN, Health, Educational & Housing Facility Board Rev. (University Health Systems, Inc.), 5%, 4/01/2030 | 790,000 | 935,754 | ||
| Knox County, TN, Health, Educational & Housing Facility Board Rev. (University Health Systems, Inc.), 5%, 4/01/2036 | 2,805,000 | 3,255,410 | ||
| Issuer | Shares/Par | Value ($) | ||
| Municipal Bonds - continued | ||||
| Tennessee - continued | ||||
| Knox County, TN, Health, Educational & Housing Facility Board Rev. (University Health Systems, Inc.), ”A“, 5%, 9/01/2030 | $ | 7,250,000 | $ 8,961,349 | |
| Knox County, TN, Health, Educational & Housing Facility Board Rev. (University Health Systems, Inc.), ”A“, 5%, 9/01/2040 | 9,465,000 | 11,326,161 | ||
| Memphis-Shelby County, TN, Airport Authority Rev., ”A“, 5%, 7/01/2031 (w) | 250,000 | 325,329 | ||
| Memphis-Shelby County, TN, Airport Authority Rev., ”A“, 5%, 7/01/2032 (w) | 1,155,000 | 1,492,209 | ||
| Memphis-Shelby County, TN, Airport Authority Rev., ”A“, 5%, 7/01/2033 (w) | 1,750,000 | 2,242,929 | ||
| Memphis-Shelby County, TN, Airport Authority Rev., ”A“, 5%, 7/01/2034 (w) | 3,695,000 | 4,716,815 | ||
| Memphis-Shelby County, TN, Airport Authority Rev., ”A“, 5%, 7/01/2035 (w) | 3,880,000 | 4,938,233 | ||
| Memphis-Shelby County, TN, Airport Authority Rev., ”A“, 5%, 7/01/2036 (w) | 4,075,000 | 5,170,292 | ||
| Memphis-Shelby County, TN, Airport Authority Rev., ”A“, 5%, 7/01/2037 (w) | 4,280,000 | 5,409,671 | ||
| Memphis-Shelby County, TN, Airport Authority Rev., ”A“, 5%, 7/01/2038 (w) | 4,495,000 | 5,663,120 | ||
| Memphis-Shelby County, TN, Airport Authority Rev., ”A“, 5%, 7/01/2039 (w) | 4,715,000 | 5,922,064 | ||
| Memphis-Shelby County, TN, Airport Authority Rev., ”A“, 5%, 7/01/2040 (w) | 1,955,000 | 2,446,934 | ||
| Metropolitan Government of Nashville & Davidson County, TN, Electric Rev., ”A“, 5%, 5/15/2029 (Prerefunded 5/15/2021) | 4,765,000 | 4,790,984 | ||
| Metropolitan Government of Nashville & Davidson County, TN, Electric Rev., ”A“, 5%, 5/15/2030 (Prerefunded 5/15/2021) | 2,500,000 | 2,513,633 | ||
| Metropolitan Government of Nashville & Davidson County, TN, Health & Educational Facilities Board Rev. (Vanderbilt University Medical Center), ”A“, 5%, 7/01/2035 | 2,685,000 | 3,188,809 | ||
| Metropolitan Government of Nashville & Davidson County, TN, Health & Educational Facilities Board Rev., Refunding & Improvement (Trevecca Nazarene University Project), 5%, 10/01/2034 | 170,000 | 198,363 | ||
| Metropolitan Government of Nashville & Davidson County, TN, Health & Educational Facilities Board Rev., Refunding & Improvement (Trevecca Nazarene University Project), 5%, 10/01/2039 | 230,000 | 264,619 | ||
| Metropolitan Nashville Airport Authority, TN, Airport Rev., ”B“, 5%, 7/01/2035 | 1,700,000 | 2,130,723 | ||
| Metropolitan Nashville Airport Authority, TN, Airport Rev., ”B“, 5%, 7/01/2054 | 10,000,000 | 12,076,656 | ||
| Issuer | Shares/Par | Value ($) | ||
| Municipal Bonds - continued | ||||
| Tennessee - continued | ||||
| Tennessee Energy Acquisition Corp., Gas Rev., ”A“, 5.25%, 9/01/2022 | $ | 1,665,000 | $ 1,778,404 | |
| Tennessee Energy Acquisition Corp., Gas Rev., ”A“, 5.25%, 9/01/2023 | 2,385,000 | 2,650,895 | ||
| Tennessee Energy Acquisition Corp., Gas Rev., ”A“, 5.25%, 9/01/2026 | 2,805,000 | 3,405,410 | ||
| Tennessee Housing Development Agency, Residential Finance Program Rev., ”1“, 3.75%, 7/01/2039 | 1,450,000 | 1,577,947 | ||
| Tennessee Housing Development Agency, Residential Finance Program Rev., ”1“, 4%, 1/01/2043 | 2,125,000 | 2,320,919 | ||
| Tennessee Housing Development Agency, Residential Finance Program Rev., ”2-C“, 4%, 1/01/2045 | 770,000 | 814,978 | ||
| Tennessee Housing Development Agency, Residential Finance Program Rev., ”3“, 4.25%, 7/01/2049 | 2,485,000 | 2,742,753 | ||
| Tennessee Housing Development Agency, Residential Finance Program Rev., ”4“, 4.5%, 7/01/2049 (u) | 7,510,000 | 8,403,111 | ||
| $132,679,447 | ||||
| Texas - 4.2% | ||||
| Arlington, TX, Higher Education Finance Corp. Rev. (Riverwalk Education Foundation, Inc.), PSF, 5%, 8/15/2028 | $ | 650,000 | $ 830,012 | |
| Arlington, TX, Higher Education Finance Corp. Rev. (Riverwalk Education Foundation, Inc.), PSF, 5%, 8/15/2029 | 600,000 | 780,571 | ||
| Arlington, TX, Higher Education Finance Corp. Rev. (Riverwalk Education Foundation, Inc.), PSF, 5%, 8/15/2030 | 850,000 | 1,095,333 | ||
| Arlington, TX, Higher Education Finance Corp. Rev. (Riverwalk Education Foundation, Inc.), PSF, 5%, 8/15/2031 | 630,000 | 808,034 | ||
| Arlington, TX, Higher Education Finance Corp. Rev. (Riverwalk Education Foundation, Inc.), PSF, 5%, 8/15/2032 | 625,000 | 797,864 | ||
| Arlington, TX, Senior Lien Special Tax Rev., ”A“, AGM, 5%, 2/15/2037 | 1,200,000 | 1,471,752 | ||
| Arlington, TX, Senior Lien Special Tax Rev., ”A“, AGM, 5%, 2/15/2038 | 980,000 | 1,199,089 | ||
| Arlington, TX, Senior Lien Special Tax Rev., ”A“, AGM, 5%, 2/15/2043 | 5,100,000 | 6,166,090 | ||
| Austin, TX, Airport System Rev., ”B“, 5%, 11/15/2041 | 1,070,000 | 1,242,012 | ||
| Austin, TX, Convention Center (Convention Enterprises, Inc.), ”A“, 5%, 1/01/2029 | 715,000 | 804,443 | ||
| Austin, TX, Convention Center (Convention Enterprises, Inc.), ”A“, 5%, 1/01/2031 | 1,055,000 | 1,171,513 | ||
| Austin, TX, Convention Center (Convention Enterprises, Inc.), ”A“, 5%, 1/01/2034 | 200,000 | 197,437 | ||
| Issuer | Shares/Par | Value ($) | ||
| Municipal Bonds - continued | ||||
| Texas - continued | ||||
| Austin, TX, Convention Center (Convention Enterprises, Inc.), ”B“, 5%, 1/01/2026 | $ | 490,000 | $ 506,897 | |
| Austin, TX, Convention Center (Convention Enterprises, Inc.), ”B“, 5%, 1/01/2028 | 315,000 | 322,320 | ||
| Austin, TX, Convention Center (Convention Enterprises, Inc.), ”B“, 5%, 1/01/2030 | 460,000 | 462,434 | ||
| Austin, TX, Water & Wastewater System Rev., 5%, 11/15/2027 | 3,000,000 | 3,232,225 | ||
| Brazos, TX, Higher Education Authority, Inc., Student Loan Program Rev., ”1A“, 2.35%, 4/01/2040 | 515,000 | 497,435 | ||
| Brazos, TX, Higher Education Authority, Inc., Student Loan Program Rev., ”1A“, 3%, 4/01/2040 | 900,000 | 842,013 | ||
| Brazos, TX, Higher Education Authority, Inc., Taxable Student Loan Program Rev., ”1A“, 3.414%, 4/01/2040 | 1,110,000 | 1,124,401 | ||
| Central Texas Regional Mobility Authority Subordinate Lien Rev., ”C“, 5%, 1/01/2027 (w) | 13,975,000 | 16,482,667 | ||
| College of the Mainland, TX, General Obligation, 4%, 8/15/2044 | 2,240,000 | 2,566,058 | ||
| Dallas and Fort Worth, TX, International Airport Rev., ”C“, 5%, 11/01/2045 | 1,875,000 | 1,924,167 | ||
| Decatur, TX, Hospital Authority Rev. (Wise Regional Health System), ”A“, 5.25%, 9/01/2044 | 415,000 | 448,997 | ||
| Ector County, TX, Hospital District General Obligation Refunding, 5%, 9/15/2021 | 320,000 | 325,664 | ||
| Ector County, TX, Hospital District General Obligation Refunding, 5%, 9/15/2022 | 400,000 | 422,541 | ||
| Ector County, TX, Hospital District General Obligation Refunding, 5%, 9/15/2023 | 850,000 | 927,538 | ||
| Ector County, TX, Hospital District General Obligation Refunding, 5%, 9/15/2025 | 430,000 | 494,460 | ||
| Ector County, TX, Hospital District General Obligation Refunding, 5%, 9/15/2026 | 650,000 | 762,604 | ||
| Ector County, TX, Hospital District General Obligation Refunding, 5%, 9/15/2027 | 1,000,000 | 1,188,808 | ||
| Ector County, TX, Hospital District General Obligation Refunding, 5%, 9/15/2028 | 1,075,000 | 1,288,995 | ||
| Ector County, TX, Hospital District General Obligation Refunding, 5%, 9/15/2029 | 700,000 | 846,949 | ||
| Ector County, TX, Hospital District General Obligation Refunding, 5%, 9/15/2030 | 800,000 | 978,199 | ||
| Ector County, TX, Hospital District General Obligation Refunding, 5%, 9/15/2031 | 1,100,000 | 1,340,352 | ||
| El Paso, TX, Water & Sewer Rev., 5%, 3/01/2028 (Prerefunded 3/01/2022) | 455,000 | 475,175 | ||
| Issuer | Shares/Par | Value ($) | ||
| Municipal Bonds - continued | ||||
| Texas - continued | ||||
| Gulf Coast Waste Disposal Authority, TX, Solid Waste Disposal Rev. (Waste Management of Texas, Inc.), ”B“, 2.45%, 5/01/2028 (Put Date 5/03/2021) | $ | 1,330,000 | $ 1,332,294 | |
| Harlingen, TX, Economic Development Corp., Sales Tax Refunding Rev. (Cameron County), ”A“, BAM, 4%, 2/15/2030 | 1,170,000 | 1,348,680 | ||
| Harlingen, TX, Economic Development Corp., Sales Tax Refunding Rev. (Cameron County), ”A“, BAM, 4%, 2/15/2031 | 1,525,000 | 1,744,231 | ||
| Harris County, TX, Cultural Education Facilities Finance Corp., Hospital Rev. (Texas Children's Hospital), ”A“, 4%, 10/01/2035 | 1,575,000 | 1,851,195 | ||
| Harris County, TX, Cultural Education Facilities Finance Corp., Hospital Rev. (Texas Children's Hospital), ”A“, 4%, 10/01/2036 | 2,790,000 | 3,267,808 | ||
| Harris County, TX, Cultural Education Facilities Finance Corp., Hospital Rev. (Texas Children's Hospital), ”A“, 4%, 10/01/2037 | 3,775,000 | 4,407,444 | ||
| Harris County, TX, Cultural Education Facilities Finance Corp., Hospital Rev. (Texas Children's Hospital), ”A“, 4%, 10/01/2038 | 3,150,000 | 3,667,247 | ||
| Harris County-Houston, TX, Sports Authority Rev., ”C“, 5%, 11/15/2032 | 225,000 | 247,110 | ||
| Harris County-Houston, TX, Sports Authority Rev., ”C“, 5%, 11/15/2033 | 545,000 | 597,468 | ||
| Harris County-Houston, TX, Sports Authority Rev., Capital Appreciation, ”A“, AGM, 0%, 11/15/2041 | 900,000 | 393,079 | ||
| Harris County-Houston, TX, Sports Authority Rev., Capital Appreciation, ”A“, AGM, 0%, 11/15/2046 | 2,250,000 | 757,289 | ||
| Houston, TX, Airport System Rev., Special Facilities Rev. (United Airlines, Inc. Terminal E Project), 4.75%, 7/01/2024 | 2,465,000 | 2,584,571 | ||
| Houston, TX, Airport System Rev., Special Facilities Rev. (United Airlines, Inc. Terminal E Project), 5%, 7/01/2029 | 100,000 | 108,900 | ||
| Houston, TX, Airport System Rev., Special Facilities Rev. (United Airlines, Inc. Terminal E Project), ”A“, 5%, 7/01/2027 | 665,000 | 779,309 | ||
| Houston, TX, Airport System Rev., Special Facilities Rev. (United Airlines, Inc. Terminal Improvement Projects), ”B-1“, 5%, 7/15/2030 | 2,760,000 | 3,067,877 | ||
| Houston, TX, Airport System Rev., Special Facilities Rev. (United Airlines, Inc. Terminal Improvement Projects), ”B-2“, 5%, 7/15/2027 | 905,000 | 1,061,213 | ||
| Houston, TX, Airport System Rev., Subordinate Lien, ”A“, 5%, 7/01/2031 (Prerefunded 7/01/2022) | 2,310,000 | 2,443,848 | ||
| Houston, TX, Higher Education Finance Corp. University Rev. (Houston Baptist University Project), 3.375%, 10/01/2037 | 240,000 | 239,320 | ||
| Houston, TX, Higher Education Finance Corp. University Rev. (Houston Baptist University Project), 4%, 10/01/2051 | 570,000 | 602,517 | ||
| Houston, TX, Industrial Development Corp. (United Parcel Service, Inc.), 6%, 3/01/2023 | 10,000 | 10,030 | ||
| Issuer | Shares/Par | Value ($) | ||
| Municipal Bonds - continued | ||||
| Texas - continued | ||||
| Irving, TX, Hospital Authority Rev. (Baylor Scott & White Medical Center-Irving), ”A“, 5%, 10/15/2044 | $ | 1,565,000 | $ 1,778,163 | |
| Irving, TX, Hotel Occupancy Tax Rev., 5%, 8/15/2035 | 150,000 | 172,029 | ||
| Irving, TX, Hotel Occupancy Tax Rev., 5%, 8/15/2037 | 215,000 | 244,661 | ||
| Irving, TX, Hotel Occupancy Tax Rev., 5%, 8/15/2038 | 240,000 | 272,375 | ||
| Irving, TX, Hotel Occupancy Tax Rev., 5%, 8/15/2043 | 435,000 | 486,979 | ||
| Matagorda County, TX, Navigation District 1, Pollution Control Refunding Rev. (Central Power & Light Co. Project), 0.9%, 5/01/2030 (Put Date 9/01/2023) | 2,640,000 | 2,643,863 | ||
| New Hope, TX, Cultural Education Facilities Finance Corp., Capital Improvement Rev. (CHF - Collegiate Housing Denton LLC - Texas Woman's University Housing Project), “A-1”, AGM, 5%, 7/01/2038 | 490,000 | 575,592 | ||
| New Hope, TX, Cultural Education Facilities Finance Corp., Capital Improvement Rev. (CHF - Collegiate Housing Denton LLC - Texas Woman's University Housing Project), “A-1”, AGM, 5%, 7/01/2048 | 1,595,000 | 1,844,789 | ||
| New Hope, TX, Cultural Education Facilities Finance Corp., Capital Improvement Rev. (CHF - Collegiate Housing Denton LLC - Texas Woman's University Housing Project), “A-1”, AGM, 5%, 7/01/2058 | 1,780,000 | 2,048,942 | ||
| New Hope, TX, Cultural Education Facilities Finance Corp., Senior Living Rev. (Cardinal Bay, Inc. - Village on the Park/Carriage Inn Project), ”A-1“, 5%, 7/01/2031 | 190,000 | 195,538 | ||
| New Hope, TX, Cultural Education Facilities Finance Corp., Senior Living Rev. (Cardinal Bay, Inc. - Village on the Park/Carriage Inn Project), ”A-1“, 4%, 7/01/2036 | 955,000 | 886,721 | ||
| New Hope, TX, Cultural Education Facilities Finance Corp., Student Housing Rev. (CHF - Collegiate Housing Stephenville III LLC - Tarleton State University Project), 5%, 4/01/2030 (Prerefunded 4/01/2025) | 355,000 | 418,167 | ||
| New Hope, TX, Cultural Education Facilities Finance Corp., Student Housing Rev. (CHF - Collegiate Housing Stephenville III LLC - Tarleton State University Project), 5%, 4/01/2035 (Prerefunded 4/01/2025) | 355,000 | 418,167 | ||
| New Hope, TX, Cultural Education Facilities Finance Corp., Student Housing Rev. (CHF - Collegiate Housing Stephenville III LLC - Tarleton State University Project), 5%, 4/01/2047 (Prerefunded 4/01/2025) | 895,000 | 1,054,253 | ||
| New Hope, TX, Cultural Education Facilities Finance Corp., Student Housing Rev. (Collegiate Housing Island Campus LLC - Texas A&M University - Corpus Christi Island Campus Project), ”A“, 5%, 4/01/2029 | 235,000 | 250,625 | ||
| Issuer | Shares/Par | Value ($) | ||
| Municipal Bonds - continued | ||||
| Texas - continued | ||||
| New Hope, TX, Cultural Education Facilities Finance Corp., Student Housing Rev. (Texas A&M University Project), ”A“, AGM, 5%, 4/01/2046 | $ | 1,585,000 | $ 1,712,629 | |
| Newark, TX, Higher Education Finance Corp. Rev. (Austin Achieve Public Schools, Inc.), 5%, 6/15/2033 | 45,000 | 46,541 | ||
| Newark, TX, Higher Education Finance Corp. Rev. (Austin Achieve Public Schools, Inc.), 5%, 6/15/2038 | 115,000 | 118,634 | ||
| Newark, TX, Higher Education Finance Corp. Rev. (Austin Achieve Public Schools, Inc.), 5%, 6/15/2048 | 345,000 | 354,704 | ||
| Newark, TX, Higher Education Finance Corp. Rev. (Austin Achieve Public Schools, Inc.), ”A“, 5%, 6/15/2032 (Prerefunded 6/15/2022) | 155,000 | 163,756 | ||
| Newark, TX, Higher Education Finance Corp. Rev. (Austin Achieve Public Schools, Inc.), ”A“, 5%, 6/15/2037 (Prerefunded 6/15/2022) | 175,000 | 184,885 | ||
| Newark, TX, Higher Education Finance Corp. Rev. (Austin Achieve Public Schools, Inc.), ”A“, 5%, 6/15/2042 (Prerefunded 6/15/2022) | 215,000 | 227,145 | ||
| Newark, TX, Higher Education Finance Corp. Rev. (Austin Achieve Public Schools, Inc.), ”A“, 5.25%, 6/15/2048 (Prerefunded 6/15/2022) | 300,000 | 317,840 | ||
| Port Beaumont, TX, Navigation District Facility Rev. (Jefferson Gulf Coast Energy Project), ”A“, 3.625%, 1/01/2035 (n) | 3,195,000 | 3,265,023 | ||
| Port Beaumont, TX, Navigation District Facility Rev. (Jefferson Gulf Coast Energy Project), ”B“, 6%, 1/01/2025 (n) | 9,425,000 | 9,673,943 | ||
| Red River, TX, Education Finance Corp., Higher Education Rev. (Houston Baptist University Project), 5.5%, 10/01/2046 | 4,380,000 | 5,009,217 | ||
| San Antonio, TX, Airport System Rev., ”A“, 5%, 7/01/2029 | 420,000 | 536,138 | ||
| San Antonio, TX, Airport System Rev., ”A“, 5%, 7/01/2030 | 520,000 | 657,765 | ||
| San Antonio, TX, Airport System Rev., ”A“, 5%, 7/01/2031 | 420,000 | 527,644 | ||
| San Antonio, TX, Airport System Rev., ”A“, 5%, 7/01/2032 | 420,000 | 524,844 | ||
| San Antonio, TX, Electric & Gas Systems Rev., 5%, 2/01/2031 | 6,000,000 | 7,148,090 | ||
| San Antonio, TX, Passenger Facility Charge and Subordinate Lien Airport System Rev., ”A“, 5%, 7/01/2028 | 635,000 | 793,813 | ||
| San Antonio, TX, Passenger Facility Charge and Subordinate Lien Airport System Rev., ”A“, 5%, 7/01/2029 | 625,000 | 792,269 | ||
| San Antonio, TX, Passenger Facility Charge and Subordinate Lien Airport System Rev., ”A“, 5%, 7/01/2030 | 520,000 | 651,827 | ||
| San Antonio, TX, Passenger Facility Charge and Subordinate Lien Airport System Rev., ”A“, 5%, 7/01/2031 | 375,000 | 466,863 | ||
| San Antonio, TX, Passenger Facility Charge and Subordinate Lien Airport System Rev., ”A“, 5%, 7/01/2032 | 465,000 | 575,843 | ||
| Issuer | Shares/Par | Value ($) | ||
| Municipal Bonds - continued | ||||
| Texas - continued | ||||
| Tarrant County, TX, Cultural Education Facilities Finance Corp. Retirement Facility Rev. (Barton Creek Senior Living Center, Inc., Querencia Project), 5%, 11/15/2030 | $ | 1,160,000 | $ 1,279,679 | |
| Tarrant County, TX, Cultural Education Facilities Finance Corp. Retirement Facility Rev. (Barton Creek Senior Living Center, Inc., Querencia Project), 5%, 11/15/2035 | 1,385,000 | 1,508,399 | ||
| Tarrant County, TX, Cultural Education Facilities Finance Corp. Retirement Facility Rev. (Barton Creek Senior Living Center, Inc., Querencia Project), 5%, 11/15/2040 | 1,505,000 | 1,625,593 | ||
| Tarrant County, TX, Cultural Education Facilities Finance Corp. Retirement Facility Rev. (Northwest Senior Housing Corp. Edgemere Project), ”B“, 5%, 11/15/2030 | 3,200,000 | 3,121,195 | ||
| Tarrant County, TX, Cultural Education Facilities Finance Corp. Retirement Facility Rev. (Stayton at Museum Way), 5.75%, 12/01/2054 | 8,751,375 | 9,289,078 | ||
| Tarrant County, TX, Cultural Education Facilities Finance Corp. Retirement Facility Rev. (Trinity Terrace Project), ”A-1“, 5%, 10/01/2044 | 785,000 | 849,084 | ||
| Texas Department of Housing & Community Affairs Residential Mortgage Rev., ”A“, 4.75%, 1/01/2049 (u) | 13,940,000 | 15,676,904 | ||
| Texas Department of Housing & Community Affairs Single Family Mortgage Rev., ”A“, 4.75%, 3/01/2049 (u) | 3,345,000 | 3,750,459 | ||
| Texas Municipal Gas Acquisition and Supply Corp. III, Gas Supply Rev., 5%, 12/15/2030 | 5,140,000 | 6,621,649 | ||
| Texas Municipal Gas Acquisition and Supply Corp. III, Gas Supply Rev., 5%, 12/15/2031 | 4,675,000 | 6,111,382 | ||
| Texas Municipal Gas Acquisition and Supply Corp. III, Gas Supply Rev., 5%, 12/15/2032 | 4,670,000 | 6,175,384 | ||
| Texas Private Activity Surface Transportation Corp., Senior Lien Rev. (NTE Mobility Partners Segments 3 LLC Segment 3C Project), 5%, 6/30/2058 | 22,920,000 | 27,338,573 | ||
| Texas Private Activity Surface Transportation Corp., Senior Lien Rev. (NTE Mobility Partners Segments 3 LLC Segments 3A & 3B Facility), 7%, 12/31/2038 | 1,495,000 | 1,705,734 | ||
| Texas Private Activity Surface Transportation Corp., Senior Lien Rev. (NTE Mobility Partners Segments 3 LLC Segments 3A & 3B Facility), 6.75%, 6/30/2043 | 1,195,000 | 1,354,837 | ||
| Texas Public Finance Authority Rev. (Texas Southern University), BAM, 5%, 5/01/2028 | 1,000,000 | 1,155,066 | ||
| Texas State University, Financing System Rev., ”A“, 5%, 3/15/2032 | 5,000,000 | 6,093,841 | ||
| Texas Transportation Commission, State Highway 249 System Rev., ”A“, 5%, 8/01/2057 | 4,100,000 | 4,711,199 | ||
| Issuer | Shares/Par | Value ($) | ||
| Municipal Bonds - continued | ||||
| Texas - continued | ||||
| Texas Transportation Commission, State Highway 249 System Rev., Capital Appreciation, ”A“, 0%, 8/01/2037 | $ | 455,000 | $ 252,504 | |
| Texas Transportation Commission, State Highway 249 System Rev., Capital Appreciation, ”A“, 0%, 8/01/2038 | 335,000 | 175,864 | ||
| Texas Transportation Commission, State Highway 249 System Rev., Capital Appreciation, ”A“, 0%, 8/01/2039 | 375,000 | 186,392 | ||
| Texas Transportation Commission, State Highway 249 System Rev., Capital Appreciation, ”A“, 0%, 8/01/2040 | 375,000 | 175,956 | ||
| Texas Transportation Commission, State Highway 249 System Rev., Capital Appreciation, ”A“, 0%, 8/01/2041 | 745,000 | 330,433 | ||
| Texas Transportation Commission, State Highway 249 System Rev., Capital Appreciation, ”A“, 0%, 8/01/2042 | 1,025,000 | 429,633 | ||
| Texas Transportation Commission, State Highway 249 System Rev., Capital Appreciation, ”A“, 0%, 8/01/2043 | 840,000 | 333,552 | ||
| University of Texas, System Rev., ”J“, 5%, 8/15/2028 | 5,000,000 | 6,097,326 | ||
| $237,926,472 | ||||
| Utah - 0.4% | ||||
| Utah Charter School Finance Authority, Charter School Rev. (Summit Academy, Inc.), ”A“, 5%, 4/15/2039 | $ | 290,000 | $ 346,449 | |
| Utah Charter School Finance Authority, Charter School Rev. (Summit Academy, Inc.), ”A“, 5%, 4/15/2044 | 260,000 | 306,985 | ||
| Utah Charter School Finance Authority, Charter School Rev. (Summit Academy, Inc.), ”A“, 5%, 4/15/2049 | 1,840,000 | 2,158,865 | ||
| Utah Charter School Finance Authority, Charter School Rev. (Syracuse Arts Academy Project), 5%, 4/15/2037 | 1,000,000 | 1,146,014 | ||
| Utah Charter School Finance Authority, Charter School Rev. (Syracuse Arts Academy Project), 5%, 4/15/2042 | 3,495,000 | 3,971,208 | ||
| Utah County, UT, Hospital Rev. (IHC Health Services, Inc.), ”A“, 5%, 5/15/2043 | 5,000,000 | 6,328,930 | ||
| Utah Housing Corp., Tax Exempt Mortgage-Backed Securities, ”H“, GNMA, 4.5%, 8/21/2049 | 1,175,226 | 1,263,004 | ||
| Utah Housing Corp., Tax Exempt Mortgage-Backed Securities, ”I“, GNMA, 4%, 9/21/2049 | 2,484,892 | 2,664,276 | ||
| Utah Housing Corp., Tax-Exempt Mortgage-Backed Securities, ”G“, GNMA, 4.5%, 7/21/2049 | 2,594,894 | 2,788,707 | ||
| Utah Housing Corp., Tax-Exempt Mortgage-Backed Securities, ”G“, GNMA, 3.5%, 2/21/2050 | 3,208,448 | 3,436,568 | ||
| $24,411,006 | ||||
| Issuer | Shares/Par | Value ($) | ||
| Municipal Bonds - continued | ||||
| Vermont - 0.5% | ||||
| Burlington, VT, Airport Rev., ”A“, 5%, 7/01/2022 | $ | 165,000 | $ 170,354 | |
| Burlington, VT, Airport Rev., ”A“, 4%, 7/01/2028 | 2,020,000 | 2,080,453 | ||
| Vermont Economic Development Authority, Solid Waste Disposal Rev. (Casella Waste Systems, Inc.), 4.625%, 4/01/2036 (Put Date 4/03/2028) (n) | 1,035,000 | 1,174,622 | ||
| Vermont Student Assistance Corp., Education Loan Rev., ”A“, 3.625%, 6/15/2029 | 445,000 | 469,128 | ||
| Vermont Student Assistance Corp., Education Loan Rev., ”A“, 3.75%, 6/15/2030 | 480,000 | 505,037 | ||
| Vermont Student Assistance Corp., Education Loan Rev., ”A“, 4%, 6/15/2033 | 455,000 | 478,993 | ||
| Vermont Student Assistance Corp., Education Loan Rev., ”A“, 4%, 6/15/2034 | 480,000 | 504,151 | ||
| Vermont Student Assistance Corp., Education Loan Rev., ”A“, 3%, 6/15/2035 | 11,845,000 | 11,852,615 | ||
| Vermont Student Assistance Corp., Education Loan Rev., ”A“, 3.375%, 6/15/2036 | 6,495,000 | 6,541,748 | ||
| Vermont Student Assistance Corp., Education Loan Rev., ”B“, 4.375%, 6/15/2046 | 765,000 | 786,083 | ||
| Vermont Student Assistance Corp., Education Loan Rev., ”B“, 4%, 6/15/2047 | 1,260,000 | 1,273,243 | ||
| $25,836,427 | ||||
| Virginia - 1.0% | ||||
| Charles City County, VA, Economic Development Authority Solid Waste Disposal Rev. (Waste Management, Inc. Project), ”A“, 2.4%, 8/01/2027 (Put Date 5/02/2022) | $ | 1,275,000 | $ 1,301,631 | |
| Commonwealth of Virginia, University Health System General Rev., ”A“, 4%, 7/01/2040 | 13,150,000 | 14,704,947 | ||
| Embrey Mill Community Development Authority, VA, Special Assessment Rev., 7.25%, 3/01/2043 | 2,100,000 | 2,196,781 | ||
| Fairfax County, VA, Redevelopment and Housing Authority Rev. (Wedgewood Affordable Housing Acquisition), 5%, 10/01/2035 | 3,905,000 | 4,868,484 | ||
| Fairfax County, VA, Redevelopment and Housing Authority Rev. (Wedgewood Affordable Housing Acquisition), 5%, 10/01/2037 | 3,990,000 | 4,942,204 | ||
| Gloucester County, VA, Industrial Development Authority Rev. (Waste Management Disposal Services of Virginia, Inc.), ”A“, 2.4%, 9/01/2038 (Put Date 5/02/2022) | 1,090,000 | 1,112,767 | ||
| Halifax County, VA, Industrial Development Authority Recovery Zone Facility Rev. (Virginia Electric & Power Co. Project), ”A“, 0.45%, 12/01/2041 (Put Date 4/01/2022) | 5,440,000 | 5,440,536 | ||
| Issuer | Shares/Par | Value ($) | ||
| Municipal Bonds - continued | ||||
| Virginia - continued | ||||
| Henrico County, VA, Industrial Development Authority Rev. (Bon Secours Health Systems, Inc.), RIBS, AGM, 11.384%, 8/23/2027 (p) | $ | 3,150,000 | $ 4,267,892 | |
| King George County, VA, Industrial Development Authority Solid Waste Disposal Rev. (King George Landfill, Inc. Project), ”A“, 2.5%, 6/01/2023 | 1,455,000 | 1,516,348 | ||
| Louisa, VA, Industrial Development Authority, Pollution Control Refunding Rev. (Virginia Electric and Power Co. Project), ”B“, 0.75%, 11/01/2035 (Put Date 9/02/2025) | 4,160,000 | 4,141,983 | ||
| Peninsula Town Center Community Development Authority, VA, Special Obligation Refunding, 4%, 9/01/2023 (n) | 110,000 | 111,545 | ||
| Peninsula Town Center Community Development Authority, VA, Special Obligation Refunding, 4.5%, 9/01/2028 (n) | 145,000 | 154,038 | ||
| Peninsula Town Center Community Development Authority, VA, Special Obligation Refunding, 5%, 9/01/2037 (n) | 270,000 | 291,781 | ||
| Peninsula Town Center Community Development Authority, VA, Special Obligation Refunding, 4.5%, 9/01/2045 (n) | 980,000 | 1,027,853 | ||
| Peninsula Town Center Community Development Authority, VA, Special Obligation Refunding, 5%, 9/01/2045 (n) | 230,000 | 247,852 | ||
| Sussex County, VA, Industrial Development Authority Solid Waste Disposal Rev. (Atlantic Waste Disposal, Inc. Project), ”A“, 2.4%, 6/01/2028 (Put Date 5/01/2022) | 1,275,000 | 1,301,631 | ||
| Virginia College Building Authority, Educational Facilities Rev. (Marymount University Project), ”B“, 5.25%, 7/01/2030 (n) | 800,000 | 861,854 | ||
| Virginia College Building Authority, Educational Facilities Rev. (Marymount University Project), ”B“, 5.25%, 7/01/2035 (n) | 715,000 | 760,956 | ||
| Virginia Small Business Financing Authority Rev. (95 Express Lanes LLC Project), 5%, 7/01/2049 | 1,285,000 | 1,322,822 | ||
| Virginia Small Business Financing Authority Rev. (Hampton University), 5.25%, 10/01/2029 | 625,000 | 723,232 | ||
| Virginia Small Business Financing Authority Rev., Solid Waste Disposal (Covanta Project), 5%, 1/01/2048 (Put Date 7/01/2038) (n) | 185,000 | 193,109 | ||
| Virginia Small Business Financing Authority Senior Lien Rev. (95 Express Lanes LLC Project), 5%, 1/01/2044 | 5,705,000 | 5,874,208 | ||
| West Point, VA, Industrial Development Authority, Solid Waste Disposal Rev. (Chesapeake Corp.), ”A“, 6.375%, 3/01/2019 (a)(d) | 529,028 | 53 | ||
| $57,364,507 | ||||
| Issuer | Shares/Par | Value ($) | ||
| Municipal Bonds - continued | ||||
| Washington - 1.5% | ||||
| Central Puget Sound, WA, Regional Transit Authority Sales Tax & Motor Vehicle Excise Tax Rev., ”S-1“, 5%, 11/01/2041 | $ | 13,000,000 | $ 15,643,818 | |
| Grays Harbor County, WA, Public Hospital District No. 2, Limited Tax General Obligation Refunding, 5%, 12/15/2033 | 1,885,000 | 2,203,563 | ||
| Grays Harbor County, WA, Public Hospital District No. 2, Limited Tax General Obligation Refunding, 5%, 12/15/2038 | 2,410,000 | 2,779,174 | ||
| Grays Harbor County, WA, Public Hospital District No. 2, Limited Tax General Obligation Refunding, 5%, 12/15/2048 | 4,630,000 | 5,245,171 | ||
| Seattle, WA, Port Intermediate Lien Rev., 5%, 4/01/2037 | 10,000,000 | 12,124,016 | ||
| Seattle, WA, Port Rev., 4%, 4/01/2044 | 1,600,000 | 1,766,746 | ||
| Seattle, WA, Port Rev., ”B“, 5%, 8/01/2024 | 3,000,000 | 3,180,872 | ||
| Washington Health Care Facilities Authority Rev. (Seattle Cancer Care Alliance), 5%, 9/01/2045 | 5,140,000 | 6,460,129 | ||
| Washington Health Care Facilities Authority Rev. (Seattle Cancer Care Alliance), 5%, 9/01/2050 | 2,500,000 | 3,124,780 | ||
| Washington Health Care Facilities Authority Rev. (Seattle Cancer Care Alliance), 5%, 9/01/2055 | 6,360,000 | 7,887,844 | ||
| Washington Health Care Facilities Authority Rev. (Virginia Mason Medical Center), 5%, 8/15/2027 | 500,000 | 608,343 | ||
| Washington Health Care Facilities Authority Rev. (Virginia Mason Medical Center), 5%, 8/15/2035 | 1,875,000 | 2,208,098 | ||
| Washington Health Care Facilities Authority Rev. (Virginia Mason Medical Center), 5%, 8/15/2037 | 1,710,000 | 2,003,501 | ||
| Washington Motor Vehicle Fuel Tax, ”E“, 5%, 2/01/2037 | 12,000,000 | 13,407,418 | ||
| Washington Motor Vehicle Fuel Tax, ”E“, 5%, 2/01/2039 | 7,985,000 | 8,904,879 | ||
| $87,548,352 | ||||
| West Virginia - 0.6% | ||||
| Harrison County, WV, Community Solid Waste Disposal Rev. (Monongahela Power Co.), 3%, 10/15/2037 | $ | 10,000,000 | $ 10,096,559 | |
| Monongalia County, WV, Board of Education, 5%, 5/01/2029 (Prerefunded 5/01/2022) | 1,445,000 | 1,519,893 | ||
| West Virginia Economic Development Authority, Solid Waste Disposal Rev. (Appalachian Power Company-Amos Project), ”A“, 0.625%, 12/01/2038 (Put Date 12/15/2025) | 3,335,000 | 3,297,009 | ||
| West Virginia Economic Development Authority, Solid Waste Disposal Rev. (Appalachian Power Company-Amos Project), ”A“, 1%, 1/01/2041 (Put Date 9/01/2025) | 3,140,000 | 3,146,037 | ||
| West Virginia Hospital Finance Authority Hospital Improvement Rev. (Charleston Area Medical Center, Inc.), ”A“, 5%, 9/01/2038 | 840,000 | 1,015,760 | ||
| Issuer | Shares/Par | Value ($) | ||
| Municipal Bonds - continued | ||||
| West Virginia - continued | ||||
| West Virginia Hospital Finance Authority Hospital Improvement Rev. (Charleston Area Medical Center, Inc.), ”A“, 5%, 9/01/2039 | $ | 250,000 | $ 301,559 | |
| West Virginia Hospital Finance Authority Hospital Rev. (West Virginia University Health System Obligated Group), ”A“, 4%, 6/01/2051 | 10,000,000 | 10,928,440 | ||
| West Virginia Housing Development Fund, ”A“, FHA, 3.45%, 11/01/2033 | 640,000 | 695,537 | ||
| West Virginia Housing Development Fund, ”A“, FHA, 3.75%, 11/01/2038 | 605,000 | 656,593 | ||
| West Virginia Housing Development Fund, ”A“, FHA, 3.9%, 11/01/2048 | 130,000 | 130,355 | ||
| West Virginia Water Development Authority Rev. (Loan Program II), ”A-II“, 5%, 11/01/2033 | 675,000 | 825,314 | ||
| $32,613,056 | ||||
| Wisconsin - 1.8% | ||||
| Public Finance Authority Student Housing Rev. (CHF-Wilmington LLC- University of North Carolina at Wilmington Project), AGM, 5%, 7/01/2048 | $ | 6,000,000 | $ 6,995,523 | |
| Public Finance Authority Student Housing Rev. (CHF-Wilmington LLC- University of North Carolina at Wilmington Project), AGM, 5%, 7/01/2053 | 3,570,000 | 4,146,827 | ||
| Public Finance Authority Student Housing Rev. (CHF-Wilmington LLC- University of North Carolina at Wilmington Project), AGM, 5%, 7/01/2058 | 5,000,000 | 5,798,033 | ||
| Wisconsin Center District Junior Dedicated Tax Rev., Capital Appreciation, ”D“, AGM, 0%, 12/15/2031 | 85,000 | 67,588 | ||
| Wisconsin Center District Junior Dedicated Tax Rev., Capital Appreciation, ”D“, AGM, 0%, 12/15/2032 | 650,000 | 497,153 | ||
| Wisconsin Center District Junior Dedicated Tax Rev., Capital Appreciation, ”D“, AGM, 0%, 12/15/2033 | 995,000 | 730,868 | ||
| Wisconsin Center District Junior Dedicated Tax Rev., Capital Appreciation, ”D“, AGM, 0%, 12/15/2034 | 950,000 | 670,940 | ||
| Wisconsin Center District Junior Dedicated Tax Rev., Capital Appreciation, ”D“, AGM, 0%, 12/15/2035 | 1,420,000 | 961,766 | ||
| Wisconsin Center District Junior Dedicated Tax Rev., Capital Appreciation, ”D“, AGM, 0%, 12/15/2036 | 1,460,000 | 948,719 | ||
| Wisconsin Center District Junior Dedicated Tax Rev., Capital Appreciation, ”D“, AGM, 0%, 12/15/2037 | 2,370,000 | 1,477,451 | ||
| Wisconsin Center District Junior Dedicated Tax Rev., Capital Appreciation, ”D“, AGM, 0%, 12/15/2038 | 2,570,000 | 1,534,326 | ||
| Issuer | Shares/Par | Value ($) | ||
| Municipal Bonds - continued | ||||
| Wisconsin - continued | ||||
| Wisconsin Center District Junior Dedicated Tax Rev., Capital Appreciation, ”D“, AGM, 0%, 12/15/2039 | $ | 2,795,000 | $ 1,598,282 | |
| Wisconsin Center District Junior Dedicated Tax Rev., Capital Appreciation, ”D“, AGM, 0%, 12/15/2040 | 1,205,000 | 658,980 | ||
| Wisconsin Center District Senior Dedicated Tax Rev., Capital Appreciation, ”C“, AGM, 0%, 12/15/2031 | 490,000 | 389,625 | ||
| Wisconsin Center District Senior Dedicated Tax Rev., Capital Appreciation, ”C“, AGM, 0%, 12/15/2032 | 665,000 | 508,826 | ||
| Wisconsin Center District Senior Dedicated Tax Rev., Capital Appreciation, ”C“, AGM, 0%, 12/15/2033 | 640,000 | 470,384 | ||
| Wisconsin Center District Senior Dedicated Tax Rev., Capital Appreciation, ”C“, AGM, 0%, 12/15/2034 | 595,000 | 420,552 | ||
| Wisconsin Center District Senior Dedicated Tax Rev., Capital Appreciation, ”C“, AGM, 0%, 12/15/2035 | 760,000 | 515,255 | ||
| Wisconsin Center District Senior Dedicated Tax Rev., Capital Appreciation, ”C“, AGM, 0%, 12/15/2036 | 735,000 | 478,173 | ||
| Wisconsin Center District Senior Dedicated Tax Rev., Capital Appreciation, ”C“, AGM, 0%, 12/15/2037 | 740,000 | 461,632 | ||
| Wisconsin Center District Senior Dedicated Tax Rev., Capital Appreciation, ”C“, AGM, 0%, 12/15/2038 | 760,000 | 454,445 | ||
| Wisconsin Center District Senior Dedicated Tax Rev., Capital Appreciation, ”C“, AGM, 0%, 12/15/2039 | 710,000 | 406,723 | ||
| Wisconsin Center District Senior Dedicated Tax Rev., Capital Appreciation, ”C“, AGM, 0%, 12/15/2040 | 175,000 | 95,891 | ||
| Wisconsin Health & Educational Facilities Authority Rev. (Aurora Health Care, Inc.), ”A“, 5%, 7/15/2026 (Prerefunded 7/15/2021) | 2,215,000 | 2,244,881 | ||
| Wisconsin Health & Educational Facilities Authority Rev. (Bellin Memorial Hospital, Inc.), ”A“, 5%, 12/01/2030 | 115,000 | 146,054 | ||
| Wisconsin Health & Educational Facilities Authority Rev. (Bellin Memorial Hospital, Inc.), ”A“, 5%, 12/01/2031 | 130,000 | 164,366 | ||
| Wisconsin Health & Educational Facilities Authority Rev. (Bellin Memorial Hospital, Inc.), ”A“, 5%, 12/01/2032 | 150,000 | 188,878 | ||
| Wisconsin Health & Educational Facilities Authority Rev. (Bellin Memorial Hospital, Inc.), ”A“, 5%, 12/01/2033 | 160,000 | 200,673 | ||
| Wisconsin Health & Educational Facilities Authority Rev. (Bellin Memorial Hospital, Inc.), ”A“, 5%, 12/01/2034 | 150,000 | 187,598 | ||
| Wisconsin Health & Educational Facilities Authority Rev. (Bellin Memorial Hospital, Inc.), ”A“, 5%, 12/01/2035 | 190,000 | 236,900 | ||
| Wisconsin Health & Educational Facilities Authority Rev. (Marshfield Clinic Health System, Inc.), ”A“, AGM, 4%, 2/15/2036 | 1,200,000 | 1,410,583 | ||
| Issuer | Shares/Par | Value ($) | ||
| Municipal Bonds - continued | ||||
| Wisconsin - continued | ||||
| Wisconsin Health & Educational Facilities Authority Rev. (Marshfield Clinic Health System, Inc.), ”A“, AGM, 4%, 2/15/2037 | $ | 1,100,000 | $ 1,288,293 | |
| Wisconsin Health & Educational Facilities Authority Rev. (Marshfield Clinic Health System, Inc.), ”C“, 5%, 2/15/2047 | 805,000 | 910,566 | ||
| Wisconsin Health & Educational Facilities Authority Rev. (Rogers Memorial Hospital, Inc.), ”A“, 5%, 7/01/2038 | 385,000 | 445,137 | ||
| Wisconsin Health & Educational Facilities Authority Rev. (Rogers Memorial Hospital, Inc.), ”A“, 5%, 7/01/2044 | 450,000 | 515,162 | ||
| Wisconsin Health & Educational Facilities Authority Rev. (Rogers Memorial Hospital, Inc.), ”A“, 5%, 7/01/2049 | 1,875,000 | 2,137,600 | ||
| Wisconsin Health & Educational Facilities Authority Rev. (St. Camillus Health System, Inc.), ”A“, 5%, 11/01/2039 | 815,000 | 865,726 | ||
| Wisconsin Health & Educational Facilities Authority Rev. (St. Camillus Health System, Inc.), ”A“, 5%, 11/01/2046 | 1,045,000 | 1,093,137 | ||
| Wisconsin Health & Educational Facilities Authority Rev. (St. Camillus Health System, Inc.), ”A“, 5%, 11/01/2054 | 5,965,000 | 6,183,583 | ||
| Wisconsin Health & Educational Facilities Authority Rev. (St. Camillus Health System, Inc.), ”B-3“, 2.25%, 11/01/2026 | 1,735,000 | 1,728,672 | ||
| Wisconsin Health & Educational Facilities Authority Rev. (St. John's Community, Inc.), ”A“, 5%, 9/15/2040 | 465,000 | 486,419 | ||
| Wisconsin Health & Educational Facilities Authority Rev. (St. John's Community, Inc.), ”A“, 5%, 9/15/2045 | 630,000 | 656,448 | ||
| Wisconsin Health & Educational Facilities Authority Rev. (St. John's Community, Inc.), ”A“, 5%, 9/15/2050 | 2,560,000 | 2,664,410 | ||
| Wisconsin Housing & Economic Development Authority, Home Ownership Rev., ”D“, 4%, 3/01/2047 (u) | 4,915,000 | 5,417,860 | ||
| Wisconsin Public Finance Authority Airport Facilities Rev. (Transportation Infrastructure Properties LLC), ”B“, 5%, 7/01/2022 | 385,000 | 397,548 | ||
| Wisconsin Public Finance Authority Airport Facilities Rev. (Transportation Infrastructure Properties LLC), ”B“, 5.25%, 7/01/2028 | 1,260,000 | 1,318,068 | ||
| Wisconsin Public Finance Authority Airport Facilities Rev. (Transportation Infrastructure Properties LLC), ”B“, 5%, 7/01/2042 | 1,815,000 | 1,886,180 | ||
| Wisconsin Public Finance Authority Airport Facilities Rev. (Transportation Infrastructure Properties LLC), ”C“, 5%, 7/01/2042 | 1,630,000 | 1,693,106 | ||
| Wisconsin Public Finance Authority Education Facilities Rev. (Piedmont Community Charter School), 5%, 6/15/2039 | 200,000 | 232,927 | ||
| Wisconsin Public Finance Authority Education Facilities Rev. (Piedmont Community Charter School), 5%, 6/15/2049 | 615,000 | 703,887 | ||
| Issuer | Shares/Par | Value ($) | ||
| Municipal Bonds - continued | ||||
| Wisconsin - continued | ||||
| Wisconsin Public Finance Authority Education Facilities Rev. (Piedmont Community Charter School), 5%, 6/15/2053 | $ | 420,000 | $ 477,951 | |
| Wisconsin Public Finance Authority Education Rev. (Pine Lake Preparatory), 4.95%, 3/01/2030 (n) | 120,000 | 129,571 | ||
| Wisconsin Public Finance Authority Education Rev. (Pine Lake Preparatory), 5.25%, 3/01/2035 (n) | 120,000 | 129,326 | ||
| Wisconsin Public Finance Authority Healthcare Facilities Rev. (Blue Ridge Healthcare), ”A“, 4%, 1/01/2045 | 650,000 | 732,829 | ||
| Wisconsin Public Finance Authority Healthcare Facility Rev. (Church Home of Hartford, Inc. Project), ”A“, 5%, 9/01/2025 (n) | 100,000 | 107,245 | ||
| Wisconsin Public Finance Authority Healthcare Facility Rev. (Church Home of Hartford, Inc. Project), ”A“, 5%, 9/01/2030 (n) | 165,000 | 178,776 | ||
| Wisconsin Public Finance Authority Healthcare Facility Rev. (Church Home of Hartford, Inc. Project), ”A“, 5%, 9/01/2038 (n) | 220,000 | 234,873 | ||
| Wisconsin Public Finance Authority Higher Education Facilities Rev. (Gannon University Project), 5%, 5/01/2042 | 655,000 | 732,225 | ||
| Wisconsin Public Finance Authority Higher Education Facilities Rev. (Gannon University Project), 5%, 5/01/2047 | 605,000 | 672,411 | ||
| Wisconsin Public Finance Authority Limited Obligation Grant Rev. (American Dream at Meadowlands Project), ”A“, 6.25%, 8/01/2027 (n) | 10,885,000 | 11,828,684 | ||
| Wisconsin Public Finance Authority Limited Obligation Grant Rev. (American Dream at Meadowlands Project), ”A“, 5.625%, 8/01/2024 (n) | 1,850,000 | 1,921,528 | ||
| Wisconsin Public Finance Authority Limited Obligation PILOT Rev. (American Dream at Meadowlands Project), 6.5%, 12/01/2037 (n) | 190,000 | 216,551 | ||
| Wisconsin Public Finance Authority Limited Obligation PILOT Rev. (American Dream at Meadowlands Project), 7%, 12/01/2050 | 5,595,000 | 6,460,884 | ||
| Wisconsin Public Finance Authority Retirement Communities Rev. (Acts Retirement-Life Communities, Inc. Obligated Group), ”A“, 5%, 11/15/2041 | 1,010,000 | 1,205,845 | ||
| Wisconsin Public Finance Authority Rev. (Celanese Corp.), ”B“, 5%, 12/01/2025 | 620,000 | 719,943 | ||
| Wisconsin Public Finance Authority Senior Living Refunding Bonds Rev. (Mary's Woods at Marylhurst Project), ”A“, 5.25%, 5/15/2037 (n) | 995,000 | 1,066,440 | ||
| Issuer | Shares/Par | Value ($) | ||
| Municipal Bonds - continued | ||||
| Wisconsin - continued | ||||
| Wisconsin Public Finance Authority Senior Living Refunding Bonds Rev. (Mary's Woods at Marylhurst Project), ”A“, 5.25%, 5/15/2042 (n) | $ | 1,005,000 | $ 1,071,597 | |
| Wisconsin Public Finance Authority Senior Living Refunding Bonds Rev. (Mary's Woods at Marylhurst Project), ”A“, 5.25%, 5/15/2047 (n) | 2,320,000 | 2,464,617 | ||
| Wisconsin Public Finance Authority Senior Living Refunding Bonds Rev. (Mary's Woods at Marylhurst Project), ”A“, 5.25%, 5/15/2052 (n) | 200,000 | 212,153 | ||
| Wisconsin Public Finance Authority Senior Living Rev. (Rose Villa Project), ”A“, 5.125%, 11/15/2029 (n) | 490,000 | 525,195 | ||
| Wisconsin Public Finance Authority Senior Living Rev. (Rose Villa Project), ”A“, 5.5%, 11/15/2034 (n) | 455,000 | 490,083 | ||
| Wisconsin Public Finance Authority Senior Living Rev. (Rose Villa Project), ”A“, 5.75%, 11/15/2044 (n) | 375,000 | 402,583 | ||
| Wisconsin Public Finance Authority Senior Living Rev. (Rose Villa Project), ”A“, 6%, 11/15/2049 (n) | 740,000 | 798,303 | ||
| Wisconsin Public Finance Authority Student Housing Rev. (Beyond Boone LLC - Appalachian State University Project), ”A“, 5%, 7/01/2036 | 500,000 | 596,444 | ||
| Wisconsin Public Finance Authority Student Housing Rev. (Beyond Boone LLC - Appalachian State University Project), ”A“, AGM, 5%, 7/01/2044 | 375,000 | 441,094 | ||
| Wisconsin Public Finance Authority Student Housing Rev. (Beyond Boone LLC - Appalachian State University Project), ”A“, AGM, 4%, 7/01/2045 | 805,000 | 885,092 | ||
| Wisconsin Public Finance Authority Student Housing Rev. (Beyond Boone LLC - Appalachian State University Project), ”A“, AGM, 4%, 7/01/2050 | 695,000 | 760,668 | ||
| Wisconsin Public Finance Authority Student Housing Rev. (Beyond Boone LLC - Appalachian State University Project), ”A“, AGM, 5%, 7/01/2054 | 485,000 | 565,457 | ||
| Wisconsin Public Finance Authority Student Housing Rev. (Beyond Boone LLC - Appalachian State University Project), ”A“, AGM, 4%, 7/01/2055 | 785,000 | 856,438 | ||
| Wisconsin Public Finance Authority Student Housing Rev. (Beyond Boone LLC - Appalachian State University Project), ”A“, AGM, 5%, 7/01/2058 | 560,000 | 652,194 | ||
| $103,229,624 | ||||
| Issuer | Shares/Par | Value ($) | ||
| Municipal Bonds - continued | ||||
| Wyoming - 0.2% | ||||
| Laramie County, WY, Hospital Refunding Rev. (Cheyenne Regional Medical Center Project), 4%, 5/01/2031 | $ | 235,000 | $ 285,585 | |
| Laramie County, WY, Hospital Refunding Rev. (Cheyenne Regional Medical Center Project), 4%, 5/01/2032 | 140,000 | 169,035 | ||
| Laramie County, WY, Hospital Refunding Rev. (Cheyenne Regional Medical Center Project), 4%, 5/01/2033 | 235,000 | 282,387 | ||
| Laramie County, WY, Hospital Refunding Rev. (Cheyenne Regional Medical Center Project), 4%, 5/01/2035 | 220,000 | 262,462 | ||
| Laramie County, WY, Hospital Refunding Rev. (Cheyenne Regional Medical Center Project), 4%, 5/01/2037 | 200,000 | 236,294 | ||
| Wyoming Community Development Authority, Housing Rev., 4%, 12/01/2050 (u) | 8,640,000 | 9,717,922 | ||
| $10,953,685 | ||||
| Total Municipal Bonds (Identified Cost, $5,388,566,334) | $ 5,711,721,608 | |||
| Bonds – 0.4% | ||||
| Consumer Services – 0.4% | ||||
| Toll Road Investors Partnership II LP, Capital Appreciation, NPFG, 0%, 2/15/2025 (n) | $ | 7,980,000 | $ 6,969,019 | |
| Toll Road Investors Partnership II LP, Capital Appreciation, NPFG, 0%, 2/15/2026 (n) | 6,065,000 | 4,996,907 | ||
| Toll Road Investors Partnership II LP, Capital Appreciation, NPFG, 0%, 2/15/2027 (n) | 851,000 | 664,266 | ||
| Toll Road Investors Partnership II LP, Capital Appreciation, NPFG, 0%, 2/15/2028 (n) | 2,473,000 | 1,804,870 | ||
| Toll Road Investors Partnership II LP, Capital Appreciation, NPFG, 0%, 2/15/2043 (n) | 25,900,000 | 7,376,405 | ||
| Toll Road Investors Partnership II LP, Capital Appreciation, ”A“, NPFG, 0%, 2/15/2045 (n) | 466,115 | 101,843 | ||
| Toll Road Investors Partnership II LP, Capital Appreciation, ”B“, NPFG, 0%, 2/15/2033 (n) | 3,715,000 | 1,829,933 | ||
| Total Bonds (Identified Cost, $24,884,299) | $ 23,743,243 | |||
| Other Municipal Bonds – 0.3% | ||||
| Multi-Family Housing Revenue – 0.3% | ||||
| Freddie Mac, VRDN, 2.625%, 6/15/2035 (Identified Cost, $18,053,164) | $ | 17,575,000 | $ 18,457,695 | |
| Issuer | Shares/Par | Value ($) | ||
| Investment Companies (h) - 2.6% | ||||
| Money Market Funds – 2.6% | ||||
| MFS Institutional Money Market Portfolio, 0.05% (v) (Identified Cost, $144,968,540) | 144,969,899 | $ 144,969,899 | ||
| Other Assets, Less Liabilities - (4.2)% | (237,056,771) | |||
| Net Assets - 100.0% | $5,661,835,674 | |||
| (a) | Non-income producing security. |
| (d) | In default. |
| (h) | An affiliated issuer, which may be considered one in which the fund owns 5% or more of the outstanding voting securities, or a company which is under common control. At period end, the aggregate values of the fund's investments in affiliated issuers and in unaffiliated issuers were $144,969,899 and $5,753,922,546, respectively. |
| (i) | Interest only security for which the fund receives interest on notional principal (Par amount). Par amount shown is the notional principal and does not reflect the cost of the security. |
| (n) | Securities exempt from registration under Rule 144A of the Securities Act of 1933. These securities may be sold in the ordinary course of business in transactions exempt from registration, normally to qualified institutional buyers. At period end, the aggregate value of these securities was $288,959,361, representing 5.1% of net assets. |
| (p) | Primary market inverse floater. |
| (u) | Underlying security deposited into special purpose trust upon creation of self-deposited inverse floaters. |
| (v) | Affiliated issuer that is available only to investment companies managed by MFS. The rate quoted for the MFS Institutional Money Market Portfolio is the annualized seven-day yield of the fund at period end. |
| (w) | When-issued security. |
| (z) | Restricted securities are not registered under the Securities Act of 1933 and are subject to legal restrictions on resale. These securities generally may be resold in transactions exempt from registration or to the public if the securities are subsequently registered. Disposal of these securities may involve time-consuming negotiations and prompt sale at an acceptable price may be difficult. The fund holds the following restricted securities: |
| Restricted Securities | Acquisition Date | Cost | Value |
| Collier County, FL, Industrial Development Authority, Continuing Care Community Rev. (Arlington of Naples Project), ”A“, 6.25%, 5/15/2035 | 6/30/15 | $100,000 | $61,000 |
| Collier County, FL, Industrial Development Authority, Continuing Care Community Rev. (Arlington of Naples Project), ”A“, 7.75%, 5/15/2035 | 11/15/17 | 902,506 | 509,350 |
| Collier County, FL, Industrial Development Authority, Continuing Care Community Rev. (Arlington of Naples Project), ”A“, 8.125%, 5/15/2044 | 11/15/17 | 1,377,710 | 771,650 |
| Collier County, FL, Industrial Development Authority, Continuing Care Community Rev. (Arlington of Naples Project), ”A“, 6.5%, 5/15/2049 | 6/30/15 | 180,000 | 109,800 |
| Illinois Housing Development Authority Rev., ”A“, 3.87%, 11/15/2035 | 2/04/21 | 9,547,381 | 9,162,764 |
| Restricted Securities - continued | Acquisition Date | Cost | Value |
| Illinois Housing Development Authority Rev., ”B“, 3.87%, 11/15/2035 | 2/04/21 | $3,893,640 | $3,736,784 |
| Illinois Housing Development Authority Rev., ”C“, 3.87%, 11/15/2035 | 2/04/21 | 3,885,341 | 3,728,820 |
| Illinois Housing Development Authority Rev., ”D“, 3.87%, 11/15/2035 | 2/04/21 | 3,545,367 | 3,402,541 |
| Illinois Housing Development Authority Rev., ”E“, 3.87%, 11/15/2035 | 2/04/21 | 2,439,880 | 2,341,589 |
| Total Restricted Securities | $23,824,298 | ||
| % of Net assets | 0.4% |
| The following abbreviations are used in this report and are defined: | |
| AAC | Ambac Assurance Corp. |
| AGM | Assured Guaranty Municipal |
| BAM | Build America Mutual |
| CALHF | California Health Facility Construction Loan Insurance Program |
| COP | Certificate of Participation |
| ETM | Escrowed to Maturity |
| FHA | Federal Housing Administration |
| FHLMC | Federal Home Loan Mortgage Corp. |
| FLR | Floating Rate. Interest rate resets periodically based on the parenthetically disclosed reference rate plus a spread (if any). The period-end rate reported may not be the current rate. All reference rates are USD unless otherwise noted. |
| FNMA | Federal National Mortgage Assn. |
| GNMA | Government National Mortgage Assn. |
| LIBOR | London Interbank Offered Rate |
| MUNIPSA | SIFMA Municipal Swap Index |
| NPFG | National Public Finance Guarantee Corp. |
| PSF | Permanent School Fund |
| RIBS | Residual Interest Bonds |
| VRDN | Variable rate demand note that may be puttable to the issuer at the option of the holder. The stated interest rate, which generally resets either daily or weekly, represents the rate in effect at period end and may not be the current rate. |
| Assets | |
| Investments in unaffiliated issuers, at value (identified cost, $5,431,503,797) | $5,753,922,546 |
| Investments in affiliated issuers, at value (identified cost, $144,968,540) | 144,969,899 |
| Receivables for | |
| Investments sold | 18,053,226 |
| Fund shares sold | 13,059,169 |
| Interest | 56,665,070 |
| Other assets | 13,179 |
| Total assets | $5,986,683,089 |
| Liabilities | |
| Payable to custodian | $38,482 |
| Payables for | |
| Distributions | 1,118,324 |
| Fund shares reacquired | 9,151,196 |
| When-issued investments purchased | 200,563,028 |
| Interest expense and fees | 187,892 |
| Payable to the holders of the floating rate certificates | 111,840,873 |
| Payable to affiliates | |
| Investment adviser | 108,999 |
| Administrative services fee | 3,089 |
| Shareholder servicing costs | 1,459,257 |
| Distribution and service fees | 49,664 |
| Payable for independent Trustees' compensation | 3,603 |
| Accrued expenses and other liabilities | 323,008 |
| Total liabilities | $324,847,415 |
| Net assets | $5,661,835,674 |
| Net assets consist of | |
| Paid-in capital | $5,370,271,528 |
| Total distributable earnings (loss) | 291,564,146 |
| Net assets | $5,661,835,674 |
| Shares of beneficial interest outstanding | 622,982,874 |
| Net assets | Shares outstanding | Net asset value per share (a) | |
| Class A | $3,166,882,551 | 348,358,318 | $9.09 |
| Class B | 4,777,142 | 524,736 | 9.10 |
| Class C | 113,569,078 | 12,449,275 | 9.12 |
| Class I | 1,389,504,727 | 152,980,398 | 9.08 |
| Class R6 | 605,320,255 | 66,697,191 | 9.08 |
| Class A1 | 381,748,300 | 41,969,263 | 9.10 |
| Class B1 | 33,621 | 3,693 | 9.10 |
| (a) | Maximum offering price per share was equal to the net asset value per share for all share classes, except for Classes A and A1, for which the maximum offering prices per share were $9.49 [100 / 95.75 x $9.09] and $9.50 [100 / 95.75 x $9.10], respectively. On sales of $100,000 or more, the maximum offering prices of Class A and Class A1 shares are reduced. A contingent deferred sales charge may be imposed on redemptions of Class A, Class B, Class C, Class A1, and Class B1 shares. Redemption price per share was equal to the net asset value per share for Classes I and R6. |
| Net investment income (loss) | |
| Income | |
| Interest | $171,794,897 |
| Dividends from affiliated issuers | 280,064 |
| Other | 569 |
| Total investment income | $172,075,530 |
| Expenses | |
| Management fee | $18,957,860 |
| Distribution and service fees | 8,669,014 |
| Shareholder servicing costs | 3,648,392 |
| Administrative services fee | 563,814 |
| Independent Trustees' compensation | 47,400 |
| Custodian fee | 362,935 |
| Shareholder communications | 163,273 |
| Audit and tax fees | 64,946 |
| Legal fees | 66,874 |
| Interest expense and fees | 849,014 |
| Miscellaneous | 573,240 |
| Total expenses | $33,966,762 |
| Fees paid indirectly | (977) |
| Reduction of expenses by investment adviser and distributor | (592,677) |
| Net expenses | $33,373,108 |
| Net investment income (loss) | $138,702,422 |
| Realized and unrealized gain (loss) | |
| Realized gain (loss) (identified cost basis) | |
| Unaffiliated issuers | $8,202,880 |
| Affiliated issuers | (34,155) |
| Net realized gain (loss) | $8,168,725 |
| Change in unrealized appreciation or depreciation | |
| Unaffiliated issuers | $220,490,754 |
| Affiliated issuers | (4,117) |
| Net unrealized gain (loss) | $220,486,637 |
| Net realized and unrealized gain (loss) | $228,655,362 |
| Change in net assets from operations | $367,357,784 |
| Year ended | ||
| 3/31/21 | 3/31/20 | |
| Change in net assets | ||
| From operations | ||
| Net investment income (loss) | $138,702,422 | $129,897,932 |
| Net realized gain (loss) | 8,168,725 | (21,589,052) |
| Net unrealized gain (loss) | 220,486,637 | (60,896,867) |
| Change in net assets from operations | $367,357,784 | $47,412,013 |
| Total distributions to shareholders | $(137,129,893) | $(129,401,588) |
| Change in net assets from fund share transactions | $825,458,111 | $1,023,405,944 |
| Total change in net assets | $1,055,686,002 | $941,416,369 |
| Net assets | ||
| At beginning of period | 4,606,149,672 | 3,664,733,303 |
| At end of period | $5,661,835,674 | $4,606,149,672 |
| Class A | Year ended | ||||
| 3/31/21 | 3/31/20 | 3/31/19 | 3/31/18 | 3/31/17 | |
| Net asset value, beginning of period | $8.68 | $8.77 | $8.63 | $8.64 | $8.89 |
| Income (loss) from investment operations | |||||
| Net investment income (loss) (d) | $0.23 | $0.26 | $0.32 | $0.31 | $0.32(c) |
| Net realized and unrealized gain (loss) | 0.41 | (0.09) | 0.11 | (0.02) | (0.27) |
| Total from investment operations | $0.64 | $0.17 | $0.43 | $0.29 | $0.05 |
| Less distributions declared to shareholders | |||||
| From net investment income | $(0.23) | $(0.26) | $(0.29) | $(0.30) | $(0.30) |
| Net asset value, end of period (x) | $9.09 | $8.68 | $8.77 | $8.63 | $8.64 |
| Total return (%) (r)(s)(t)(x) | 7.43 | 1.88 | 5.14 | 3.35 | 0.59(c) |
| Ratios (%) (to average net assets) and Supplemental data: | |||||
| Expenses before expense reductions (f) | 0.74 | 0.78 | 0.77 | 0.77 | 0.78(c) |
| Expenses after expense reductions (f) | 0.73 | 0.77 | 0.75 | 0.73 | 0.73(c) |
| Net investment income (loss) | 2.57 | 2.89 | 3.74 | 3.49 | 3.67(c) |
| Portfolio turnover | 24 | 23 | 19 | 21 | 20 |
| Net assets at end of period (000 omitted) | $3,166,883 | $2,386,528 | $1,683,822 | $1,418,893 | $1,234,571 |
| Supplemental Ratios (%): | |||||
| Ratios of expenses to average net assets after expense reductions and excluding interest expense and fees (f)(l) | 0.72 | 0.73 | 0.73 | 0.72 | 0.72(c) |
| Class B | Year ended | ||||
| 3/31/21 | 3/31/20 | 3/31/19 | 3/31/18 | 3/31/17 | |
| Net asset value, beginning of period | $8.69 | $8.78 | $8.65 | $8.66 | $8.90 |
| Income (loss) from investment operations | |||||
| Net investment income (loss) (d) | $0.17 | $0.20 | $0.26 | $0.24 | $0.26(c) |
| Net realized and unrealized gain (loss) | 0.40 | (0.10) | 0.10 | (0.02) | (0.26) |
| Total from investment operations | $0.57 | $0.10 | $0.36 | $0.22 | $0.00(w) |
| Less distributions declared to shareholders | |||||
| From net investment income | $(0.16) | $(0.19) | $(0.23) | $(0.23) | $(0.24) |
| Net asset value, end of period (x) | $9.10 | $8.69 | $8.78 | $8.65 | $8.66 |
| Total return (%) (r)(s)(t)(x) | 6.63 | 1.14 | 4.23 | 2.58 | (0.04)(c) |
| Ratios (%) (to average net assets) and Supplemental data: | |||||
| Expenses before expense reductions (f) | 1.49 | 1.53 | 1.52 | 1.52 | 1.53(c) |
| Expenses after expense reductions (f) | 1.48 | 1.52 | 1.50 | 1.48 | 1.49(c) |
| Net investment income (loss) | 1.87 | 2.19 | 2.99 | 2.75 | 2.94(c) |
| Portfolio turnover | 24 | 23 | 19 | 21 | 20 |
| Net assets at end of period (000 omitted) | $4,777 | $7,843 | $12,579 | $18,135 | $23,866 |
| Supplemental Ratios (%): | |||||
| Ratios of expenses to average net assets after expense reductions and excluding interest expense and fees (f)(l) | 1.46 | 1.48 | 1.48 | 1.48 | 1.47(c) |
| Class C | Year ended | ||||
| 3/31/21 | 3/31/20 | 3/31/19 | 3/31/18 | 3/31/17 | |
| Net asset value, beginning of period | $8.71 | $8.80 | $8.66 | $8.67 | $8.92 |
| Income (loss) from investment operations | |||||
| Net investment income (loss) (d) | $0.17 | $0.19 | $0.26 | $0.24 | $0.26(c) |
| Net realized and unrealized gain (loss) | 0.40 | (0.09) | 0.11 | (0.02) | (0.27) |
| Total from investment operations | $0.57 | $0.10 | $0.37 | $0.22 | $(0.01) |
| Less distributions declared to shareholders | |||||
| From net investment income | $(0.16) | $(0.19) | $(0.23) | $(0.23) | $(0.24) |
| Net asset value, end of period (x) | $9.12 | $8.71 | $8.80 | $8.66 | $8.67 |
| Total return (%) (r)(s)(t)(x) | 6.62 | 1.13 | 4.35 | 2.58 | (0.16)(c) |
| Ratios (%) (to average net assets) and Supplemental data: | |||||
| Expenses before expense reductions (f) | 1.49 | 1.53 | 1.52 | 1.52 | 1.53(c) |
| Expenses after expense reductions (f) | 1.48 | 1.52 | 1.50 | 1.49 | 1.49(c) |
| Net investment income (loss) | 1.86 | 2.16 | 2.99 | 2.74 | 2.92(c) |
| Portfolio turnover | 24 | 23 | 19 | 21 | 20 |
| Net assets at end of period (000 omitted) | $113,569 | $155,843 | $151,636 | $181,793 | $184,018 |
| Supplemental Ratios (%): | |||||
| Ratios of expenses to average net assets after expense reductions and excluding interest expense and fees (f)(l) | 1.46 | 1.48 | 1.48 | 1.48 | 1.47(c) |
| Class I | Year ended | ||||
| 3/31/21 | 3/31/20 | 3/31/19 | 3/31/18 | 3/31/17 | |
| Net asset value, beginning of period | $8.67 | $8.76 | $8.63 | $8.63 | $8.88 |
| Income (loss) from investment operations | |||||
| Net investment income (loss) (d) | $0.25 | $0.28 | $0.34 | $0.33 | $0.34(c) |
| Net realized and unrealized gain (loss) | 0.41 | (0.09) | 0.10 | (0.01) | (0.26) |
| Total from investment operations | $0.66 | $0.19 | $0.44 | $0.32 | $0.08 |
| Less distributions declared to shareholders | |||||
| From net investment income | $(0.25) | $(0.28) | $(0.31) | $(0.32) | $(0.33) |
| Net asset value, end of period (x) | $9.08 | $8.67 | $8.76 | $8.63 | $8.63 |
| Total return (%) (r)(s)(t)(x) | 7.70 | 2.13 | 5.27 | 3.73 | 0.84(c) |
| Ratios (%) (to average net assets) and Supplemental data: | |||||
| Expenses before expense reductions (f) | 0.49 | 0.53 | 0.52 | 0.52 | 0.54(c) |
| Expenses after expense reductions (f) | 0.48 | 0.52 | 0.51 | 0.49 | 0.49(c) |
| Net investment income (loss) | 2.82 | 3.15 | 3.99 | 3.74 | 3.92(c) |
| Portfolio turnover | 24 | 23 | 19 | 21 | 20 |
| Net assets at end of period (000 omitted) | $1,389,505 | $1,042,592 | $870,855 | $672,870 | $974,392 |
| Supplemental Ratios (%): | |||||
| Ratios of expenses to average net assets after expense reductions and excluding interest expense and fees (f)(l) | 0.47 | 0.48 | 0.48 | 0.48 | 0.47(c) |
| Class R6 | Year ended | |||
| 3/31/21 | 3/31/20 | 3/31/19 | 3/31/18(i) | |
| Net asset value, beginning of period | $8.67 | $8.76 | $8.62 | $8.77 |
| Income (loss) from investment operations | ||||
| Net investment income (loss) (d) | $0.26 | $0.29 | $0.35 | $0.22 |
| Net realized and unrealized gain (loss) | 0.41 | (0.09) | 0.11 | (0.15) |
| Total from investment operations | $0.67 | $0.20 | $0.46 | $0.07 |
| Less distributions declared to shareholders | ||||
| From net investment income | $(0.26) | $(0.29) | $(0.32) | $(0.22) |
| Net asset value, end of period (x) | $9.08 | $8.67 | $8.76 | $8.62 |
| Total return (%) (r)(s)(t)(x) | 7.78 | 2.21 | 5.48 | 0.75(n) |
| Ratios (%) (to average net assets) and Supplemental data: | ||||
| Expenses before expense reductions (f) | 0.42 | 0.46 | 0.45 | 0.42(a) |
| Expenses after expense reductions (f) | 0.41 | 0.45 | 0.43 | 0.41(a) |
| Net investment income (loss) | 2.90 | 3.22 | 4.06 | 3.77(a) |
| Portfolio turnover | 24 | 23 | 19 | 21 |
| Net assets at end of period (000 omitted) | $605,320 | $591,947 | $491,400 | $492,474 |
| Supplemental Ratios (%): | ||||
| Ratios of expenses to average net assets after expense reductions and excluding interest expense and fees (f)(l) | 0.39 | 0.41 | 0.41 | 0.40(a) |
| Class A1 | Year ended | ||||
| 3/31/21 | 3/31/20 | 3/31/19 | 3/31/18 | 3/31/17 | |
| Net asset value, beginning of period | $8.69 | $8.78 | $8.64 | $8.65 | $8.90 |
| Income (loss) from investment operations | |||||
| Net investment income (loss) (d) | $0.25 | $0.28 | $0.34 | $0.33 | $0.35(c) |
| Net realized and unrealized gain (loss) | 0.41 | (0.09) | 0.12 | (0.02) | (0.27) |
| Total from investment operations | $0.66 | $0.19 | $0.46 | $0.31 | $0.08 |
| Less distributions declared to shareholders | |||||
| From net investment income | $(0.25) | $(0.28) | $(0.32) | $(0.32) | $(0.33) |
| Net asset value, end of period (x) | $9.10 | $8.69 | $8.78 | $8.64 | $8.65 |
| Total return (%) (r)(s)(t)(x) | 7.70 | 2.14 | 5.40 | 3.61 | 0.85(c) |
| Ratios (%) (to average net assets) and Supplemental data: | |||||
| Expenses before expense reductions (f) | 0.49 | 0.53 | 0.52 | 0.52 | 0.54(c) |
| Expenses after expense reductions (f) | 0.48 | 0.52 | 0.51 | 0.49 | 0.49(c) |
| Net investment income (loss) | 2.85 | 3.18 | 3.99 | 3.75 | 3.94(c) |
| Portfolio turnover | 24 | 23 | 19 | 21 | 20 |
| Net assets at end of period (000 omitted) | $381,748 | $421,338 | $454,350 | $476,864 | $504,886 |
| Supplemental Ratios (%): | |||||
| Ratios of expenses to average net assets after expense reductions and excluding interest expense and fees (f)(l) | 0.47 | 0.48 | 0.48 | 0.48 | 0.48(c) |
| Class B1 | Year ended | ||||
| 3/31/21 | 3/31/20 | 3/31/19 | 3/31/18 | 3/31/17 | |
| Net asset value, beginning of period | $8.69 | $8.78 | $8.65 | $8.66 | $8.90 |
| Income (loss) from investment operations | |||||
| Net investment income (loss) (d) | $0.19 | $0.22 | $0.28 | $0.26 | $0.28(c) |
| Net realized and unrealized gain (loss) | 0.40 | (0.09) | 0.10 | (0.02) | (0.26) |
| Total from investment operations | $0.59 | $0.13 | $0.38 | $0.24 | $0.02 |
| Less distributions declared to shareholders | |||||
| From net investment income | $(0.18) | $(0.22) | $(0.25) | $(0.25) | $(0.26) |
| Net asset value, end of period (x) | $9.10 | $8.69 | $8.78 | $8.65 | $8.66 |
| Total return (%) (r)(s)(t)(x) | 6.90 | 1.38 | 4.49 | 2.83 | 0.19(c) |
| Ratios (%) (to average net assets) and Supplemental data: | |||||
| Expenses before expense reductions (f) | 1.49 | 1.53 | 1.52 | 1.52 | 1.53(c) |
| Expenses after expense reductions (f) | 1.23 | 1.27 | 1.25 | 1.24 | 1.26(c) |
| Net investment income (loss) | 2.12 | 2.45 | 3.24 | 2.99 | 3.17(c) |
| Portfolio turnover | 24 | 23 | 19 | 21 | 20 |
| Net assets at end of period (000 omitted) | $34 | $58 | $91 | $114 | $152 |
| Supplemental Ratios (%): | |||||
| Ratios of expenses to average net assets after expense reductions and excluding interest expense and fees (f)(l) | 1.21 | 1.23 | 1.23 | 1.23 | 1.25(c) |
| (a) | Annualized. |
| (c) | Amount reflects a one-time reimbursement of expenses by the custodian (or former custodian) without which net investment income and performance would be lower and expenses would be higher. |
| (d) | Per share data is based on average shares outstanding. |
| (f) | Ratios do not reflect reductions from fees paid indirectly, if applicable. |
| (i) | For Class R6, the period is from the class inception, August 1, 2017, through the stated period end. |
| (l) | Interest expense and fees include payments made to the holders of the floating rate certificates. |
| (n) | Not annualized. |
| (r) | Certain expenses have been reduced without which performance would have been lower. |
| (s) | From time to time the fund may receive proceeds from litigation settlements, without which performance would be lower. |
| (t) | Total returns do not include any applicable sales charges. |
| (w) | Per share amount was less than $0.01. |
| (x) | The net asset values and total returns have been calculated on net assets which include adjustments made in accordance with U.S. generally accepted accounting principles required at period end for financial reporting purposes. |
| Financial Instruments | Level 1 | Level 2 | Level 3 | Total |
| Municipal Bonds | $— | $5,730,179,303 | $— | $5,730,179,303 |
| U.S. Corporate Bonds | — | 23,743,243 | — | 23,743,243 |
| Mutual Funds | 144,969,899 | — | — | 144,969,899 |
| Total | $144,969,899 | $5,753,922,546 | $— | $5,898,892,445 |
| Year ended 3/31/21 | Year ended 3/31/20 | |
| Ordinary income (including any short-term capital gains) | $2,956,859 | $1,893,348 |
| Tax-exempt income | 134,173,034 | 127,508,240 |
| Total distributions | $137,129,893 | $129,401,588 |
| As of 3/31/21 | |
| Cost of investments | $5,468,663,818 |
| Gross appreciation | 335,965,432 |
| Gross depreciation | (17,577,678) |
| Net unrealized appreciation (depreciation) | $ 318,387,754 |
| Undistributed ordinary income | 482,923 |
| Undistributed tax-exempt income | 21,884,295 |
| Capital loss carryforwards | (37,696,927) |
| Other temporary differences | (11,493,899) |
| Total distributable earnings (loss) | $ 291,564,146 |
| Short-Term | $(37,696,927) |
| Year ended 3/31/21 | Year ended 3/31/20 | |
| Class A | $73,701,042 | $60,394,449 |
| Class B | 110,563 | 241,460 |
| Class C | 2,529,854 | 3,367,523 |
| Class I | 34,216,338 | 32,798,905 |
| Class R6 | 15,392,100 | 18,309,232 |
| Class A1 | 11,179,079 | 14,288,175 |
| Class B1 | 917 | 1,844 |
| Total | $137,129,893 | $129,401,588 |
| Up to $1.3 billion | 0.40% |
| In excess of $1.3 billion and up to $2 billion | 0.37% |
| In excess of $2 billion and up to $5 billion | 0.35% |
| In excess of $5 billion and up to $10 billion | 0.34% |
| In excess of $10 billion | 0.33% |
| Classes | ||||||
| A | B | C | I | R6 | A1 | B1 |
| 0.73% | 1.48% | 1.48% | 0.48% | 0.42% | 0.48% | 1.23% |
| Distribution Fee Rate (d) | Service Fee Rate (d) | Total Distribution Plan (d) | Annual Effective Rate (e) | Distribution and Service Fee | |
| Class A | — | 0.25% | 0.25% | 0.25% | $ 7,227,567 |
| Class B | 0.75% | 0.25% | 1.00% | 1.00% | 60,071 |
| Class C | 0.75% | 0.25% | 1.00% | 1.00% | 1,380,936 |
| Class B1 | 0.75% | 0.25% | 1.00% | 0.75% | 440 |
| Total Distribution and Service Fees | $8,669,014 |
| (d) | In accordance with the distribution plan for certain classes, the fund pays distribution and/or service fees equal to these annual percentage rates of each class’s average daily net assets. The distribution and service fee rates disclosed by class represent the current rates in effect at the end of the reporting period. Any rate changes, if applicable, are detailed below. |
| (e) | The annual effective rates represent actual fees incurred under the distribution plan for the year ended March 31, 2021 based on each class's average daily net assets. MFD has agreed in writing to reduce the Class B1 service fee rate to 0.00% for all Class B1 shares. This written agreement will continue until modified by the fund’s Board of Trustees, but such agreement will continue at least until July 31, 2021. For the year ended March 31, 2021, this reduction amounted to $110 and is included in the reduction of total expenses in the Statement of Operations. MFD has voluntarily agreed to rebate a portion of each class's 0.25% service fee attributable to accounts for which there is no financial intermediary specified on the account except for accounts attributable to MFS or its affiliates' seed money. For the year ended March 31, 2021, this rebate amounted to $12,327 and $132 for Class A and Class C, respectively, and is included in the reduction of total expenses in the Statement of Operations. |
| Amount | |
| Class A | $201,031 |
| Class B | 11,416 |
| Class C | 30,186 |
| Class A1 | — |
| Class B1 | 187 |
| Year ended 3/31/21 | Year ended 3/31/20 | ||||
| Shares | Amount | Shares | Amount | ||
| Shares sold | |||||
| Class A | 163,511,074 | $1,449,898,229 | 129,556,923 | $1,158,166,774 | |
| Class B | 64,740 | 584,142 | 34,781 | 309,644 | |
| Class C | 2,048,091 | 18,244,795 | 5,233,994 | 47,220,149 | |
| Class I | 67,870,480 | 605,302,854 | 62,975,674 | 564,647,920 | |
| Class R6 | 25,691,923 | 229,019,554 | 23,959,991 | 214,141,467 | |
| Class A1 | 243,978 | 2,158,367 | 442,044 | 3,964,207 | |
| Class B1 | — | — | 390 | 3,408 | |
| 259,430,286 | $2,305,207,941 | 222,203,797 | $1,988,453,569 | ||
| Shares issued to shareholders in reinvestment of distributions | |||||
| Class A | 8,014,052 | $71,605,245 | 6,488,422 | $58,265,262 | |
| Class B | 11,593 | 103,187 | 25,602 | 229,891 | |
| Class C | 254,306 | 2,271,909 | 330,117 | 2,971,507 | |
| Class I | 2,753,753 | 24,593,964 | 2,280,035 | 20,452,915 | |
| Class R6 | 1,694,359 | 15,086,281 | 2,038,200 | 18,267,314 | |
| Class A1 | 1,076,580 | 9,606,905 | 1,352,024 | 12,140,041 | |
| Class B1 | 102 | 906 | 204 | 1,844 | |
| 13,804,745 | $123,268,397 | 12,514,604 | $112,328,774 | ||
| Shares reacquired | |||||
| Class A | (98,070,170) | $(869,788,795) | (53,122,194) | $(470,287,658) | |
| Class B | (453,749) | (4,038,228) | (590,335) | (5,266,361) | |
| Class C | (7,743,118) | (69,691,992) | (4,903,612) | (43,826,403) | |
| Class I | (37,848,226) | (336,537,260) | (44,432,917) | (391,255,575) | |
| Class R6 | (28,991,570) | (252,854,317) | (13,819,437) | (121,383,667) | |
| Class A1 | (7,859,719) | (70,080,445) | (5,061,459) | (45,318,172) | |
| Class B1 | (3,057) | (27,190) | (4,319) | (38,563) | |
| (180,969,609) | $(1,603,018,227) | (121,934,273) | $(1,077,376,399) | ||
| Year ended 3/31/21 | Year ended 3/31/20 | ||||
| Shares | Amount | Shares | Amount | ||
| Net change | |||||
| Class A | 73,454,956 | $651,714,679 | 82,923,151 | $746,144,378 | |
| Class B | (377,416) | (3,350,899) | (529,952) | (4,726,826) | |
| Class C | (5,440,721) | (49,175,288) | 660,499 | 6,365,253 | |
| Class I | 32,776,007 | 293,359,558 | 20,822,792 | 193,845,260 | |
| Class R6 | (1,605,288) | (8,748,482) | 12,178,754 | 111,025,114 | |
| Class A1 | (6,539,161) | (58,315,173) | (3,267,391) | (29,213,924) | |
| Class B1 | (2,955) | (26,284) | (3,725) | (33,311) | |
| 92,265,422 | $825,458,111 | 112,784,128 | $1,023,405,944 | ||
| Affiliated Issuers | Beginning Value | Purchases | Sales Proceeds | Realized Gain (Loss) | Change in Unrealized Appreciation or Depreciation | Ending Value |
| MFS Institutional Money Market Portfolio | $149,559,733 | $1,434,187,518 | $1,438,739,080 | $(34,155) | $(4,117) | $144,969,899 |
| Affiliated Issuers | Dividend Income | Capital Gain Distributions |
| MFS Institutional Money Market Portfolio | $280,064 | $— |
May 14, 2021
| Name, Age | Position(s) Held with Fund | Trustee/Officer Since(h) | Number of MFS Funds overseen by the Trustee | Principal Occupations During the Past Five Years | Other Directorships During the Past Five Years (j) | |||||
| INTERESTED TRUSTEES | ||||||||||
| Robert J. Manning (k) (age 57) | Trustee | February 2004 | 135 | Massachusetts Financial Services Company, Non-Executive Chairman (since January 2021); Director; Chairman of the Board; Executive Chairman (January 2017-2020); Co-Chief Executive Officer (2015-2016) | N/A | |||||
| Michael W. Roberge (k) (age 54) | Trustee | January 2021 | 135 | Massachusetts Financial Services Company, Chairman (since January 2021); Chief Executive Officer (since January 2017); Director; President (until December 2018); Chief Investment Officer (until December 2018); Co-Chief Executive Officer (until December 2016) | N/A | |||||
| INDEPENDENT TRUSTEES | ||||||||||
| John P. Kavanaugh (age 66) | Trustee and Chair of Trustees | January 2009 | 135 | Private investor | N/A | |||||
| Steven E. Buller (age 69) | Trustee | February 2014 | 135 | Private investor | N/A | |||||
| John A. Caroselli (age 66) | Trustee | March 2017 | 135 | Private investor; JC Global Advisors, LLC (management consulting), President (since 2015) | N/A | |||||
| Maureen R. Goldfarb (age 66) | Trustee | January 2009 | 135 | Private investor | N/A | |||||
| Peter D. Jones (age 65) | Trustee | January 2019 | 135 | Private investor | N/A | |||||
| Name, Age | Position(s) Held with Fund | Trustee/Officer Since(h) | Number of MFS Funds overseen by the Trustee | Principal Occupations During the Past Five Years | Other Directorships During the Past Five Years (j) | |||||
| James W. Kilman, Jr. (age 59) | Trustee | January 2019 | 135 | Burford Capital Limited (finance and investment management), Chief Financial Officer (since 2019); KielStrand Capital LLC (family office), Chief Executive Officer (since 2016); Morgan Stanley & Co. (financial services), Vice Chairman of Investment Banking, Co-Head of Diversified Financials Coverage – Financial Institutions Investment Banking Group (until 2016) | Alpha-En Corporation, Director (2016-2019) | |||||
| Clarence Otis, Jr. (age 65) | Trustee | March 2017 | 135 | Private investor | VF Corporation, Director; Verizon Communications, Inc., Director; The Travelers Companies, Director | |||||
| Maryanne L. Roepke (age 65) | Trustee | May 2014 | 135 | Private investor | N/A | |||||
| Laurie J. Thomsen (age 63) | Trustee | March 2005 | 135 | Private investor | The Travelers Companies, Director; Dycom Industries, Inc., Director |
| Name, Age | Position(s) Held with Fund | Trustee/Officer Since(h) | Number of MFS Funds for which the Person is an Officer | Principal Occupations During the Past Five Years | ||||
| OFFICERS | ||||||||
| Christopher R. Bohane (k) (age 47) | Assistant Secretary and Assistant Clerk | July 2005 | 135 | Massachusetts Financial Services Company, Senior Vice President and Associate General Counsel | ||||
| Kino Clark (k) (age 52) | Assistant Treasurer | January 2012 | 135 | Massachusetts Financial Services Company, Vice President |
| Name, Age | Position(s) Held with Fund | Trustee/Officer Since(h) | Number of MFS Funds for which the Person is an Officer | Principal Occupations During the Past Five Years | ||||
| John W. Clark, Jr. (k) (age 54) | Assistant Treasurer | April 2017 | 135 | Massachusetts Financial Services Company, Vice President (since March 2017); Deutsche Bank (financial services), Department Head - Treasurer's Office (until February 2017) | ||||
| Thomas H. Connors (k) (age 61) | Assistant Secretary and Assistant Clerk | September 2012 | 135 | Massachusetts Financial Services Company, Vice President and Senior Counsel | ||||
| David L. DiLorenzo (k) (age 52) | President | July 2005 | 135 | Massachusetts Financial Services Company, Senior Vice President | ||||
| Heidi W. Hardin (k) (age 53) | Secretary and Clerk | April 2017 | 135 | Massachusetts Financial Services Company, Executive Vice President and General Counsel (since March 2017); Harris Associates (investment management), General Counsel (until January 2017) | ||||
| Brian E. Langenfeld (k) (age 48) | Assistant Secretary and Assistant Clerk | June 2006 | 135 | Massachusetts Financial Services Company, Vice President and Senior Counsel | ||||
| Amanda S. Mooradian (k) (age 42) | Assistant Secretary and Assistant Clerk | September 2018 | 135 | Massachusetts Financial Services Company, Assistant Vice President and Senior Counsel | ||||
| Susan A. Pereira (k) (age 50) | Assistant Secretary and Assistant Clerk | July 2005 | 135 | Massachusetts Financial Services Company, Vice President and Assistant General Counsel | ||||
| Kasey L. Phillips (k) (age 50) | Assistant Treasurer | September 2012 | 135 | Massachusetts Financial Services Company, Vice President | ||||
| Matthew A. Stowe (k) (age 46) | Assistant Secretary and Assistant Clerk | October 2014 | 135 | Massachusetts Financial Services Company, Vice President and Assistant General Counsel | ||||
| Martin J. Wolin (k) (age 53) | Chief Compliance Officer | July 2015 | 135 | Massachusetts Financial Services Company, Senior Vice President and Chief Compliance Officer |
| Name, Age | Position(s) Held with Fund | Trustee/Officer Since(h) | Number of MFS Funds for which the Person is an Officer | Principal Occupations During the Past Five Years | ||||
| James O. Yost (k) (age 60) | Treasurer | September 1990 | 135 | Massachusetts Financial Services Company, Senior Vice President |
| (h) | Date first appointed to serve as Trustee/Officer of an MFS Fund. Each Trustee has served continuously since appointment unless indicated otherwise. For the period from December 15, 2004 until February 22, 2005, Mr. Manning served as Advisory Trustee. From January 2012 through December 2016, Messrs. DiLorenzo and Yost served as Treasurer and Deputy Treasurer of the Funds, respectively. |
| (j) | Directorships or trusteeships of companies required to report to the Securities and Exchange Commission (i.e., “public companies”). |
| (k) | “Interested person” of the Trust within the meaning of the Investment Company Act of 1940 (referred to as the 1940 Act), which is the principal federal law governing investment companies like the fund, as a result of a position with MFS. The address of MFS is 111 Huntington Avenue, Boston, Massachusetts 02199-7618. |
| Investment Adviser | Custodian |
| Massachusetts Financial Services Company 111 Huntington Avenue Boston, MA 02199-7618 | JPMorgan Chase Bank, NA 4 Metrotech Center New York, NY 11245 |
| Distributor | Independent Registered Public Accounting Firm |
| MFS Fund Distributors, Inc. 111 Huntington Avenue Boston, MA 02199-7618 | Deloitte & Touche LLP 200 Berkeley Street Boston, MA 02116 |
| Portfolio Manager(s) | |
| Jason Kosty Geoffrey Schechter |
| FACTS | WHAT DOES MFS DO WITH YOUR PERSONAL INFORMATION? |
| Why? | Financial companies choose how they share your personal information. Federal law gives consumers the right to limit some but not all sharing. Federal law also requires us to tell you how we collect, share, and protect your personal information. Please read this notice carefully to understand what we do. |
| What? | The types of personal information we collect and share depend on the product or service you have with us. This information can include: |
| • Social Security number and account balances | |
| • Account transactions and transaction history | |
| • Checking account information and wire transfer instructions | |
| When you are no longer our customer, we continue to share your information as described in this notice. |
| How? | All financial companies need to share customers' personal information to run their everyday business. In the section below, we list the reasons financial companies can share their customers' personal information; the reasons MFS chooses to share; and whether you can limit this sharing. |
| Reasons we can share your personal information | Does MFS share? | Can you limit this sharing? |
| For our everyday business purposes – such as to process your transactions, maintain your account(s), respond to court orders and legal investigations, or report to credit bureaus | Yes | No |
| For our marketing purposes – to offer our products and services to you | No | We don't share |
| For joint marketing with other financial companies | No | We don't share |
| For our affiliates' everyday business purposes – information about your transactions and experiences | No | We don't share |
| For our affiliates' everyday business purposes – information about your creditworthiness | No | We don't share |
| For nonaffiliates to market to you | No | We don't share |
| Questions? | Call 800-225-2606 or go to mfs.com. |

| Who we are | |
| Who is providing this notice? | MFS Funds, MFS Investment Management, MFS Institutional Advisors, Inc., and MFS Heritage Trust Company. |
| What we do | |
| How does MFS protect my personal information? | To protect your personal information from unauthorized access and use, we use security measures that comply with federal law. These measures include procedural, electronic, and physical safeguards for the protection of the personal information we collect about you. |
| How does MFS collect my personal information? | We collect your personal information, for example, when you |
| • open an account or provide account information | |
| • direct us to buy securities or direct us to sell your securities | |
| • make a wire transfer | |
| We also collect your personal information from others, such as credit bureaus, affiliates, or other companies. | |
| Why can't I limit all sharing? | Federal law gives you the right to limit only |
| • sharing for affiliates' everyday business purposes – information about your creditworthiness | |
| • affiliates from using your information to market to you | |
| • sharing for nonaffiliates to market to you | |
| State laws and individual companies may give you additional rights to limit sharing. | |
| Definitions | |
| Affiliates | Companies related by common ownership or control. They can be financial and nonfinancial companies. |
| • MFS does not share personal information with affiliates, except for everyday business purposes as described on page one of this notice. | |
| Nonaffiliates | Companies not related by common ownership or control. They can be financial and nonfinancial companies. |
| • MFS does not share with nonaffiliates so they can market to you. | |
| Joint marketing | A formal agreement between nonaffiliated financial companies that together market financial products or services to you. |
| • MFS doesn't jointly market. | |
| Other important information |
| If you own an MFS product or receive an MFS service in the name of a third party such as a bank or broker-dealer, their privacy policy may apply to you instead of ours. |


1(b):
Not applicable.
| ITEM 2. | CODE OF ETHICS. |
The Registrant has adopted a Code of Ethics (the “Code”) pursuant to Section 406 of the Sarbanes-Oxley Act and as defined in Form N-CSR that applies to the Registrant’s principal executive officer and principal financial and accounting officer. During the period covered by this report, the Registrant has not amended any provision in the Code that relates to an element of the Code’s definition enumerated in paragraph (b) of Item 2 of this Form N-CSR. During the period covered by this report, the Registrant did not grant a waiver, including an implicit waiver, from any provision of the Code.
A copy of the current Code of Ethics is filed as an exhibit to this Form N-CSR.
| ITEM 3. | AUDIT COMMITTEE FINANCIAL EXPERT. |
Messrs. Steven E. Buller, James Kilman, and Clarence Otis, Jr. and Ms. Maryanne L. Roepke, members of the Audit Committee, have been determined by the Board of Trustees in their reasonable business judgment to meet the definition of “audit committee financial expert” as such term is defined in Form N-CSR. In addition, Messrs. Buller, Kilman, and Otis and Ms. Roepke are “independent” members of the Audit Committee (as such term has been defined by the Securities and Exchange Commission in regulations implementing Section 407 of the Sarbanes-Oxley Act of 2002). The Securities and Exchange Commission has stated that the designation of a person as an audit committee financial expert pursuant to this Item 3 on the Form N-CSR does not impose on such a person any duties, obligations or liability that are greater than the duties, obligations or liability imposed on such person as a member of the Audit Committee and the Board of Trustees in the absence of such designation or identification.
| ITEM 4. | PRINCIPAL ACCOUNTANT FEES AND SERVICES. |
Items 4(a) through 4(d) and 4(g):
The Board of Trustees has appointed Deloitte & Touche LLP (“Deloitte”) to serve as independent accountants to a series of the Registrant (each a “Fund” and collectively the “Funds”). The tables below set forth the audit fees billed to each Fund as well as fees for non-audit services provided to each Fund and/or to the Fund’s investment adviser, Massachusetts Financial Services Company (“MFS”), and to various entities either controlling, controlled by, or under common control with MFS that provide ongoing services to the Fund (“MFS Related Entities”).
For the fiscal years ended March 31, 2021 and 2020, audit fees billed to each Fund by Deloitte were as follows:
| Audit Fees | ||||||||
| 2021 | 2020 | |||||||
Fees billed by Deloitte: | ||||||||
MFS Alabama Municipal Bond Fund | 49,459 | 48,787 | ||||||
MFS Arkansas Municipal Bond Fund | 49,459 | 48,787 | ||||||
MFS California Municipal Bond Fund | 49,459 | 48,787 | ||||||
MFS Georgia Municipal Bond Fund | 49,459 | 48,787 | ||||||
MFS Maryland Municipal Bond Fund | 49,459 | 48,787 | ||||||
MFS Massachusetts Municipal Bond Fund | 49,459 | 48,787 | ||||||
MFS Mississippi Municipal Bond Fund | 49,459 | 48,787 | ||||||
MFS Municipal Income Fund | 55,699 | 54,941 | ||||||
MFS New York Municipal Bond Fund | 49,459 | 48,787 | ||||||
MFS North Carolina Municipal Bond Fund | 49,459 | 48,787 | ||||||
MFS Pennsylvania Municipal Bond Fund | 49,459 | 48,787 | ||||||
MFS South Carolina Municipal Bond Fund | 49,459 | 48,787 | ||||||
MFS Tennessee Municipal Bond Fund | 49,459 | 48,787 | ||||||
MFS Virginia Municipal Bond Fund | 49,459 | 48,787 | ||||||
MFS West Virginia Municipal Bond Fund | 49,459 | 48,787 | ||||||
|
|
|
| |||||
Total | 748,125 | 737,959 | ||||||
For the fiscal years ended March 31, 2021 and 2020, fees billed by Deloitte for audit-related, tax and other services provided to each Fund and for audit-related, tax and other services provided to MFS and MFS Related Entities were as follows:
| Audit-Related Fees1 | Tax Fees2 | All Other Fees3 | ||||||||||||||||||||||
| 2021 | 2020 | 2021 | 2020 | 2021 | 2020 | |||||||||||||||||||
Fees billed by Deloitte: | ||||||||||||||||||||||||
To MFS Alabama Municipal Bond Fund | 0 | 0 | 6,724 | 6,237 | 0 | 0 | ||||||||||||||||||
To MFS Arkansas Municipal Bond Fund | 0 | 0 | 6,724 | 6,487 | 0 | 0 | ||||||||||||||||||
To MFS California Municipal Bond Fund | 0 | 0 | 6,724 | 6,237 | 0 | 0 | ||||||||||||||||||
To MFS Georgia Municipal Bond Fund | 0 | 0 | 6,724 | 6,237 | 0 | 0 | ||||||||||||||||||
To MFS Maryland Municipal Bond Fund | 0 | 0 | 6,724 | 6,237 | 0 | 0 | ||||||||||||||||||
To MFS Massachusetts Municipal Bond Fund | 0 | 0 | 6,724 | 6,237 | 0 | 0 | ||||||||||||||||||
To MFS Mississippi Municipal Bond Fund | 0 | 0 | 6,724 | 6,237 | 0 | 0 | ||||||||||||||||||
To MFS Municipal Income Fund | 0 | 0 | 7,040 | 6,552 | 0 | 0 | ||||||||||||||||||
To MFS New York Municipal Bond Fund | 0 | 0 | 6,724 | 6,237 | 0 | 0 | ||||||||||||||||||
To MFS North Carolina Municipal Bond Fund | 0 | 0 | 6,724 | 6,237 | 0 | 0 | ||||||||||||||||||
To MFS Pennsylvania Municipal Bond Fund | 0 | 0 | 6,724 | 6,237 | 0 | 0 | ||||||||||||||||||
To MFS South Carolina Municipal Bond Fund | 0 | 0 | 6,724 | 6,237 | 0 | 0 | ||||||||||||||||||
To MFS Tennessee Municipal Bond Fund | 0 | 0 | 6,724 | 6,237 | 0 | 0 | ||||||||||||||||||
To MFS Virginia Municipal Bond Fund | 0 | 0 | 6,974 | 6,487 | 0 | 0 | ||||||||||||||||||
To MFS West Virginia Municipal Bond Fund | 0 | 0 | 6,724 | 6,237 | 0 | 0 | ||||||||||||||||||
Total fees billed by Deloitte to above Funds: | 0 | 0 | 101,426 | 94,370 | 0 | 0 | ||||||||||||||||||
| Audit-Related Fees1 | Tax Fees2 | All Other Fees3 | ||||||||||||||||||||||
| 2021 | 2020 | 2021 | 2020 | 2021 | 2020 | |||||||||||||||||||
Fees billed by Deloitte: | ||||||||||||||||||||||||
To MFS and MFS Related Entities of MFS Alabama Municipal Bond Fund* | 0 | 0 | 0 | 0 | 5,390 | 3,790 | ||||||||||||||||||
To MFS and MFS Related Entities of MFS Arkansas Municipal Bond Fund* | 0 | 0 | 0 | 0 | 5,390 | 3,790 | ||||||||||||||||||
To MFS and MFS Related Entities of MFS California Municipal Bond Fund* | 0 | 0 | 0 | 0 | 5,390 | 3,790 | ||||||||||||||||||
To MFS and MFS Related Entities of MFS Georgia Municipal Bond Fund* | 0 | 0 | 0 | 0 | 5,390 | 3,790 | ||||||||||||||||||
To MFS and MFS Related Entities of MFS Maryland Municipal Bond Fund* | 0 | 0 | 0 | 0 | 5,390 | 3,790 | ||||||||||||||||||
To MFS and MFS Related Entities of MFS Massachusetts Municipal Bond Fund* | 0 | 0 | 0 | 0 | 5,390 | 3,790 | ||||||||||||||||||
To MFS and MFS Related Entities of MFS Mississippi Municipal Bond Fund* | 0 | 0 | 0 | 0 | 5,390 | 3,790 | ||||||||||||||||||
To MFS and MFS Related Entities of MFS Municipal Income Fund* | 0 | 0 | 0 | 0 | 5,390 | 3,790 | ||||||||||||||||||
To MFS and MFS Related Entities of MFS New York Municipal Bond Fund* | 0 | 0 | 0 | 0 | 5,390 | 3,790 | ||||||||||||||||||
To MFS and MFS Related Entities of MFS North Carolina Municipal Bond Fund* | 0 | 0 | 0 | 0 | 5,390 | 3,790 | ||||||||||||||||||
To MFS and MFS Related Entities of MFS Pennsylvania Municipal Bond Fund* | 0 | 0 | 0 | 0 | 5,390 | 3,790 | ||||||||||||||||||
To MFS and MFS Related Entities of MFS South Carolina Municipal Bond Fund* | 0 | 0 | 0 | 0 | 5,390 | 3,790 | ||||||||||||||||||
To MFS and MFS Related Entities of MFS Tennessee Municipal Bond Fund* | 0 | 0 | 0 | 0 | 5,390 | 3,790 | ||||||||||||||||||
To MFS and MFS Related Entities of MFS Virginia Municipal Bond Fund* | 0 | 0 | 0 | 0 | 5,390 | 3,790 | ||||||||||||||||||
To MFS and MFS Related Entities of MFS West Virginia Municipal Bond Fund* | 0 | 0 | 0 | 0 | 5,390 | 3,790 |
| Aggregate fees for non-audit services | ||||||||
| 2021 | 2020 | |||||||
Fees billed by Deloitte: | ||||||||
To MFS Alabama Municipal Bond Fund, MFS and MFS Related Entities# | 555,864 | 360,027 | ||||||
To MFS Arkansas Municipal Bond Fund, MFS and MFS Related Entities# | 555,864 | 360,277 | ||||||
To MFS California Municipal Bond Fund, MFS and MFS Related Entities# | 555,864 | 360,027 | ||||||
To MFS Georgia Municipal Bond Fund, MFS and MFS Related Entities# | 555,864 | 360,027 | ||||||
To MFS Maryland Municipal Bond Fund, MFS and MFS Related Entities# | 555,864 | 360,027 | ||||||
To MFS Massachusetts Municipal Bond Fund, MFS and MFS Related Entities# | 555,864 | 360,027 | ||||||
To MFS Mississippi Municipal Bond Fund, MFS and MFS Related Entities# | 555,864 | 360,027 | ||||||
To MFS Municipal Income Fund, MFS and MFS Related Entities# | 556,180 | 360,342 | ||||||
To MFS New York Municipal Bond Fund, MFS and MFS Related Entities# | 555,864 | 360,027 | ||||||
To MFS North Carolina Municipal Bond Fund, MFS and MFS Related Entities# | 555,864 | 360,027 | ||||||
To MFS Pennsylvania Municipal Bond Fund, MFS and MFS Related Entities# | 555,864 | 360,027 | ||||||
To MFS South Carolina Municipal Bond Fund, MFS and MFS Related Entities# | 555,864 | 360,027 | ||||||
To MFS Tennessee Municipal Bond Fund, MFS and MFS Related Entities# | 555,864 | 360,027 | ||||||
To MFS Virginia Municipal Bond Fund, MFS and MFS Related Entities# | 556,114 | 360,277 | ||||||
To MFS West Virginia Municipal Bond Fund, MFS and MFS Related Entities# | 555,864 | 360,027 | ||||||
| * | This amount reflects the fees billed to MFS and MFS Related Entities for non-audit services relating directly to the operations and financial reporting of the Funds (portions of which services also related to the operations and financial reporting of other funds within the MFS Funds complex). |
| # | This amount reflects the aggregate fees billed by Deloitte, as the case may be, for non-audit services rendered to the Funds and for non-audit services rendered to MFS and the MFS Related Entities. |
| 1 | The fees included under “Audit-Related Fees” are fees related to assurance and related services that are reasonably related to the performance of the audit or review of financial statements, but not reported under “Audit Fees,” including accounting consultations, agreed-upon procedure reports, attestation reports, comfort letters and internal control reviews. |
| 2 | The fees included under “Tax Fees” are fees associated with tax compliance, tax advice and tax planning, including services relating to the filing or amendment of federal, state or local income tax returns, regulated investment company qualification reviews and tax distribution and analysis. |
| 3 | The fees included under “All Other Fees” are fees for products and services provided by Deloitte other than those reported under “Audit Fees,” “Audit-Related Fees” and “Tax Fees”. |
Item 4(e)(1):
Set forth below are the policies and procedures established by the Audit Committee of the Board of Trustees relating to the pre-approval of audit and non-audit related services:
To the extent required by applicable law, pre-approval by the Audit Committee of the Board is needed for all audit and permissible non-audit services rendered to the Fund and all permissible non-audit services rendered to MFS or MFS Related Entities if the services relate directly to the operations and financial reporting of the Registrant. Pre-approval is currently on an engagement-by-engagement basis. In the event pre-approval of such services is necessary between regular meetings of the Audit Committee and it is not practical to wait to seek pre-approval at the next regular meeting of the Audit Committee, pre-approval of such services may be referred to the Chair of the Audit Committee for approval; provided that the Chair may not pre-approve any individual engagement for such services exceeding $50,000 or multiple engagements for such services in the aggregate exceeding $100,000 in each period between regular meetings of the Audit Committee. Any engagement pre-approved by the Chair between regular meetings of the Audit Committee shall be presented for ratification by the entire Audit Committee at its next regularly scheduled meeting.
Item 4(e)(2):
None, or 0%, of the services relating to the Audit-Related Fees, Tax Fees and All Other Fees paid by the Fund and MFS and MFS Related Entities relating directly to the operations and financial reporting of the Registrant disclosed above were approved by the audit committee pursuant to paragraphs (c)(7)(i)(C) of Rule 2-01 of Regulation S-X (which permits audit committee approval after the start of the engagement with respect to services other than audit, review or attest services, if certain conditions are satisfied).
Item 4(f):
Not applicable.
Item 4(h):
The Registrant’s Audit Committee has considered whether the provision by a Registrant’s independent registered public accounting firm of non-audit services to MFS and MFS Related Entities that were not pre-approved by the Committee (because such services did not relate directly to the operations and financial reporting of the Registrant) was compatible with maintaining the independence of the independent registered public accounting firm as the Registrant’s principal auditors.
| ITEM 5. | AUDIT COMMITTEE OF LISTED REGISTRANTS. |
Not applicable to the Registrant.
| ITEM 6. | INVESTMENTS |
A schedule of investments of the Registrant is included as part of the report to shareholders of such series under Item 1(a) of this Form N-CSR.
| ITEM 7. | DISCLOSURE OF PROXY VOTING POLICIES AND PROCEDURES FOR CLOSED-END MANAGEMENT INVESTMENT COMPANIES. |
Not applicable to the Registrant.
| ITEM 8. | PORTFOLIO MANAGERS OF CLOSED-END MANAGEMENT INVESTMENT COMPANIES. |
Not applicable to the Registrant.
| ITEM 9. | PURCHASES OF EQUITY SECURITIES BY CLOSED-END MANAGEMENT INVESTMENT COMPANY AND AFFILIATED PURCHASERS. |
Not applicable to the Registrant.
| ITEM 10. | SUBMISSION OF MATTERS TO A VOTE OF SECURITY HOLDERS. |
There were no material changes to the procedures by which shareholders may send recommendations to the Board for nominees to the Registrant’s Board since the Registrant last provided disclosure as to such procedures in response to the requirements of Item 407 (c)(2)(iv) of Regulation S-K or this Item.
| ITEM 11. | CONTROLS AND PROCEDURES. |
| (a) | Based upon their evaluation of the effectiveness of the registrant’s disclosure controls and procedures (as defined in Rule 30a-3(c) under the Investment Company Act of 1940 (the “Act”)) as conducted within 90 days of the filing date of this report on Form N-CSR, the registrant’s principal financial officer and principal executive officer have concluded that those disclosure controls and procedures provide reasonable assurance that the material information required to be disclosed by the registrant on this report is recorded, processed, summarized and reported within the time periods specified in the Securities and Exchange Commission’s rules and forms. |
| (b) | There were no changes in the registrant’s internal controls over financial reporting (as defined in Rule 30a-3(d) under the Act) that occurred during the period covered by the report that have materially affected, or are reasonably likely to materially affect, the registrant’s internal control over financial reporting. |
| ITEM 12. | DISCLOSURE OF SECURITIES LENDING ACTIVITIES FOR CLOSED-END MANAGEMENT INVESTMENT COMPANIES. |
Not applicable to the Registrant.
| ITEM 13. | EXHIBITS. |
| (a) | File the exhibits listed below as part of this form. Letter or number the exhibits in the sequence indicated. |
| (1) | Any code of ethics, or amendment thereto, that is the subject of the disclosure required by Item 2, to the extent that the registrant intends to satisfy the Item 2 requirements through filing of an exhibit: Code of Ethics attached hereto as EX-99.COE. |
| (2) | A separate certification for each principal executive officer and principal financial officer of the registrant as required by Rule 30a-2(a) under the Act (17 CFR 270.30a-2): Attached hereto as EX-99.302CERT. |
| (3) | Any written solicitation to purchase securities under Rule 23c-1 under the Act (17 CFR 270.23c-1) sent or given during the period covered by the report by or on behalf of the registrant to 10 or more persons. Not applicable. |
| (4) | Change in the registrant’s independent public accountant. Not applicable. |
| (b) | If the report is filed under Section 13(a) or 15(d) of the Exchange Act, provide the certifications required by Rule 30a-2(b) under the Act (17 CFR 270.30a-2(b)), Rule 13a-14(b) or Rule 15d-14(b) under the Exchange Act (17 CFR 240.13a-14(b) or 240.15d-14(b)) and Section 1350 of Chapter 63 of Title 18 of the United States Code (18 U.S.C. 1350) as an exhibit. A certification furnished pursuant to this paragraph will not be deemed “filed” for the purposes of Section 18 of the Exchange Act (15 U.S.C. 78r), or otherwise subject to the liability of that section. Such certification will not be deemed to be incorporated by reference into any filing under the Securities Act of 1933 or the Exchange Act, except to the extent that the registrant specifically incorporates it by reference: Attached hereto as EX-99.906CERT. |
Notice
A copy of the Amended and Restated Declaration of Trust, as amended, of the Registrant is on file with the Secretary of State of The Commonwealth of Massachusetts and notice is hereby given that this instrument is executed on behalf of the Registrant by an officer of the Registrant as an officer and not individually and the obligations of or arising out of this instrument are not binding upon any of the Trustees or shareholders individually, but are binding only upon the assets and property of the respective constituent series of the Registrant.
SIGNATURES
Pursuant to the requirements of the Securities Exchange Act of 1934 and the Investment Company Act of 1940, the registrant has duly caused this report to be signed on its behalf by the undersigned, thereunto duly authorized.
(Registrant) MFS MUNICIPAL SERIES TRUST
| By (Signature and Title)* | /S/ DAVID L. DILORENZO | |
| David L. DiLorenzo, President |
Date: May 14, 2021
Pursuant to the requirements of the Securities Exchange Act of 1934 and the Investment Company Act of 1940, this report has been signed below by the following persons on behalf of the registrant and in the capacities and on the dates indicated.
| By (Signature and Title)* | /S/ DAVID L. DILORENZO | |
| David L. DiLorenzo, President (Principal Executive Officer) |
Date: May 14, 2021
| By (Signature and Title)* | /S/ JAMES O. YOST | |
| James O. Yost, Treasurer (Principal Financial Officer and Accounting Officer) |
Date: May 14, 2021
| * | Print name and title of each signing officer under his or her signature. |