UNITED STATES
SECURITIES AND EXCHANGE COMMISSION
Washington, D.C. 20549
FORM N-CSR
CERTIFIED SHAREHOLDER REPORT OF REGISTERED MANAGEMENT
INVESTMENT COMPANIES
Investment Company Act file number | 811-2653 | |||||
|
| |||||
| Dreyfus Bond Funds, Inc. |
| ||||
| (Exact name of Registrant as specified in charter) |
| ||||
|
|
| ||||
|
c/o The Dreyfus Corporation 200 Park Avenue New York, New York 10166 |
| ||||
| (Address of principal executive offices) (Zip code) |
| ||||
|
|
| ||||
| Michael A. Rosenberg, Esq. 200 Park Avenue New York, New York 10166 |
| ||||
| (Name and address of agent for service) |
| ||||
| ||||||
Registrant's telephone number, including area code: | (212) 922-6000 | |||||
|
| |||||
Date of fiscal year end:
| 8/31 |
| ||||
Date of reporting period: | 8/31/11 |
| ||||
Save time. Save paper. View your next shareholder report online as soon as it’s available. Log into www.dreyfus.com and sign up for Dreyfus eCommunications. It’s simple and only takes a few minutes.
The views expressed in this report reflect those of the portfolio manager only through the end of the period covered and do not necessarily represent the views of Dreyfus or any other person in the Dreyfus organization. Any such views are subject to change at any time based upon market or other conditions and Dreyfus disclaims any responsibility to update such views.These views may not be relied on as investment advice and, because investment decisions for a Dreyfus fund are based on numerous factors, may not be relied on as an indication of trading intent on behalf of any Dreyfus fund.
Not FDIC-Insured • Not Bank-Guaranteed • May Lose Value
Contents | |
THE FUND | |
| 2 | A Letter from the Chairman and CEO |
| 3 | Discussion of Fund Performance |
| 6 | Fund Performance |
| 7 | Understanding Your Fund’s Expenses |
| 7 | Comparing Your Fund’s Expenses With Those of Other Funds |
| 8 | Statement of Investments |
| 28 | Statement of Assets and Liabilities |
| 29 | Statement of Operations |
| 30 | Statement of Changes in Net Assets |
| 31 | Financial Highlights |
| 32 | Notes to Financial Statements |
| 41 | Report of Independent Registered Public Accounting Firm |
| 42 | Important Tax Information |
| 43 | Board Members Information |
| 46 | Officers of the Fund |
FOR MORE INFORMATION | |
Back Cover |
Dreyfus
Municipal Bond Fund
The Fund

A LETTER FROM THE CHAIRMAN AND CEO
Dear Shareholder:
We are pleased to present this annual report for Dreyfus Municipal Bond Fund, covering the 12-month period from September 1, 2010, through August 31, 2011. For information about how the fund performed during the reporting period, as well as general market perspectives, we provide a Discussion of Fund Performance on the pages that follow.
Although investors were encouraged by expectations of a more robust economic recovery through the first quarter of 2011, the reporting period ended amid sharply deteriorating investor sentiment due to disappointing economic data, an escalating sovereign debt crisis in Europe and a contentious debate regarding taxes, spending and borrowing in the United States. In the final month of the reporting period, a major credit rating agency downgraded U.S. long-term debt, marking the first time in history that U.S. Treasury securities were not assigned the highest credit rating.While most fixed-income securities proved volatile in this tumultuous environment, municipal bonds held up relatively well due to robust demand for a limited supply of newly issued securities.
The economic outlook currently is clouded by uncertainty and political infighting, but we believe that a sustained, moderate global expansion is more likely than a double-dip recession. Inflationary pressures appear to be waning in most countries, including the United States, as energy prices have retreated from their highs.The Federal Reserve Board has signaled its intention to maintain an aggressively accommodative monetary policy, which may help offset the financial stresses caused by recent fiscal policy choices in the United States and Europe.To assess how these and other developments may affect your investments, we encourage you, as always, to speak with your financial advisor.
Thank you for your continued confidence and support.

Jonathan R. Baum
Chairman and Chief Executive Officer
The Dreyfus Corporation
September 15, 2011
2

DISCUSSION OF FUND PERFORMANCE
For the period of September 1, 2010, through August 31, 2011, as provided by James Welch and Daniel Marques, Portfolio Managers
Fund and Market Performance Overview
For the 12-month period ended August 31, 2011, Dreyfus Municipal Bond Fund produced a total return of 1.30%.1 In comparison, the Barclays Capital Municipal Bond Index (the “Index”), the fund’s benchmark, produced a total return of 2.66%.2
After encountering weak market conditions over the final months of 2010, municipal bonds generally rebounded in 2011 as a reduced supply of newly issued securities was met by robust investor demand.The fund lagged its benchmark, primarily due to overweighted exposure to longer-term bonds when yield spreads widened early in the reporting period.
The Fund’s Investment Approach
The fund seeks to maximize current income exempt from federal income tax, to the extent consistent with the preservation of capital.
To pursue this goal, the fund normally invests substantially all of its net assets in municipal bonds that provide income exempt from federal income tax.The fund will invest at least 75% of its assets in municipal bonds rated A or better or the unrated equivalent as determined by Dreyfus. The fund may invest up to 25% of its assets in municipal bonds rated below A or the unrated equivalent as determined by Dreyfus, including bonds rated below investment-grade quality (“high yield” or “junk” bonds).The dollar-weighted average maturity of the fund’s portfolio is not restricted, but normally exceeds 10 years.
We focus on identifying undervalued sectors and securities and minimize the use of interest rate forecasting.The portfolio managers select municipal bonds for the fund’s portfolio by:
Using fundamental credit analysis to estimate the relative value and attractiveness of various sectors and securities and to exploit pricing inefficiencies in the municipal bond market;
| The Fund | 3 |
DISCUSSION OF FUND PERFORMANCE (continued)
Actively trading among various sectors, such as pre-refunded, general obligation, and revenue, based on their apparent relative values. The fund seeks to invest in several of these sectors.
Municipal Bonds Held Up Relatively Well Amid Uncertainty
New stimulative measures from the Federal Reserve Board, improved economic data and rising corporate earnings generally supported investor sentiment into the first quarter of 2011.While investor confidence was shaken in February due to political unrest in the Middle East, and again in March, when natural and nuclear disasters struck Japan, most markets bounced back quickly from these unexpected shocks.
Economic sentiment began to deteriorate in earnest in late April when Greece appeared headed for default on its sovereign debt, U.S. economic data disappointed and the debate regarding U.S. government spending and borrowing intensified. Riskier assets suffered bouts of volatility as investors shifted their focus to traditionally defensive investments. Turbulence among stocks and lower-rated bonds was particularly severe in August, after a major credit-rating agency downgraded its assessment of long-term U.S. debt securities.
Despite these developments, municipal bond prices were buoyed in 2011 by strong investor demand for a limited supply of newly issued securities, offsetting the effects of market weakness at the end of 2010. The termination of the federally subsidized Build America Bonds program and political pressure to reduce spending led to less municipal borrowing over the first eight months of 2011.Yet, demand remained robust from investors seeking competitive levels of tax-exempt income.
Longer Term Bonds Dampened Relative Performance
The fund produced a mildly positive total return during the reporting period, but relative results were undermined by overweighted exposure to longer-term municipal bonds as long-term interest rates climbed and yield differences widened along the market’s maturity spectrum during the reporting period’s first half. Zero-coupon bonds, bonds backed by charter schools, health care securities and bonds backed by the states’ settlement of litigation with U.S. tobacco companies fared relatively poorly.
4
On a more positive note, the fund benefited from housing bonds and a rebound among securities issued by the states of California, Illinois and New Jersey. Corporate-backed bonds subject to the Alternative Minimum Tax also buoyed the fund’s results.
Adjusting to a Slower-Growth Environment
Throughout the reporting period, we took steps to improve the fund’s risk profile by reducing the maturities and increasing the credit quality of its holdings. Consequently, the fund ended the reporting period with an emphasis on higher-rated municipal bonds with intermediate-term maturities. In our view, securities with these characteristics are likely to be the focus of robust demand from individual investors seeking competitive levels of tax-advantaged income as they grow more concerned about persistently low interest rates and potential tax increases.
In addition, due to ongoing supply-and-demand dynamics, we currently expect the municipal bond market to hold up better than many sectors of the taxable fixed-income market. Nonetheless, we intend to remain vigilant in monitoring economic and market developments, including risks stemming from changes in interest rates and credit conditions, until the direction and strength of the U.S. economy become clearer.
September 15, 2011
| Bond funds are subject generally to interest rate, credit, liquidity and market risks, to varying | |
| degrees, all of which are more fully described in the fund’s prospectus. Generally, all other factors | |
| being equal, bond prices are inversely related to interest-rate changes, and rate increases can cause | |
| price declines. High yield bonds involve increased credit and liquidity risk compared with | |
| investment grade bonds and are considered speculative in terms of the issuer’s ability to pay | |
| interest and repay principal on a timely basis. | |
| 1 | Total return includes reinvestment of dividends and any capital gains paid. Past performance is no |
| guarantee of future results. Share price, yield and investment return fluctuate such that upon | |
| redemption, fund shares may be worth more or less than their original cost. Income may be subject | |
| to state and local taxes, and some income may be subject to the federal alternative minimum tax | |
| (AMT) for certain investors. Capital gains, if any, are fully taxable. | |
| 2 | SOURCE: LIPPER INC. — Reflects reinvestment of dividends and, where applicable, capital |
| gain distributions.The Barclays Capital Municipal Bond Index is a widely accepted, unmanaged | |
| total return performance benchmark for the long-term, investment-grade, tax-exempt bond market. | |
| Index returns do not reflect fees and expenses associated with operating a mutual fund. Investors | |
| cannot invest directly in any index. |
| The Fund | 5 |
FUND PERFORMANCE
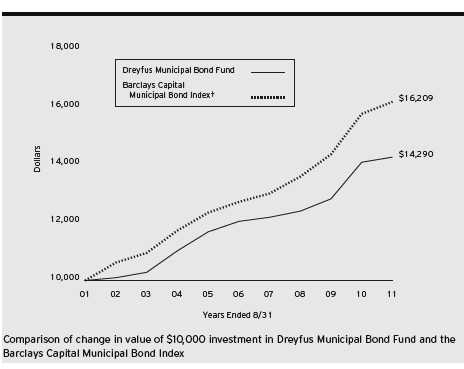
| Average Annual Total Returns as of 8/31/11 | ||||||
| 1Year | 5 Years | 10 Years | ||||
| Fund | 1.30% | 3.46% | 3.63% | |||
| Barclays Capital | ||||||
| Municipal Bond Index | 2.66% | 4.94% | 4.95% | |||
| † Source: Lipper Inc. |
| Past performance is not predictive of future performance.The fund’s performance shown in the graph and table does not |
| reflect the deduction of taxes that a shareholder would pay on fund distributions or the redemption of fund shares. |
| The above graph compares a $10,000 investment made in Dreyfus Municipal Bond Fund on 8/31/01 to a $10,000 |
| investment made in the Barclays Capital Municipal Bond Index (the “Index”) on that date.All dividends and capital |
| gain distributions are reinvested. |
| The fund invests primarily in municipal securities and its performance shown in the line graph takes into account fees |
| and expenses.The Index is an unmanaged total return performance benchmark for the long-term, investment-grade, |
| tax-exempt bond market. Unlike a mutual fund, the Index is not subject to charges, fees and other expenses. Investors |
| cannot invest directly in any index. Further information relating to fund performance, including expense reimbursements, |
| if applicable, is contained in the Financial Highlights section of the prospectus and elsewhere in this report. |
6
UNDERSTANDING YOUR FUND’S EXPENSES (Unaudited)
As a mutual fund investor, you pay ongoing expenses, such as management fees and other expenses. Using the information below, you can estimate how these expenses affect your investment and compare them with the expenses of other funds.You also may pay one-time transaction expenses, including sales charges (loads) and redemption fees, which are not shown in this section and would have resulted in higher total expenses. For more information, see your fund’s prospectus or talk to your financial adviser.
Review your fund’s expenses
The table below shows the expenses you would have paid on a $1,000 investment in Dreyfus Municipal Bond Fund from March 1, 2011 to August 31, 2011. It also shows how much a $1,000 investment would be worth at the close of the period, assuming actual returns and expenses.
| Expenses and Value of a $1,000 Investment | ||
| assuming actual returns for the six months ended August 31, 2011 | ||
| Expenses paid per $1,000† | $ | 3.95 |
| Ending value (after expenses) | $ | 1,063.90 |
COMPARING YOUR FUND’S EXPENSES WITH THOSE OF OTHER FUNDS (Unaudited)
Using the SEC’s method to compare expenses
The Securities and Exchange Commission (SEC) has established guidelines to help investors assess fund expenses. Per these guidelines, the table below shows your fund’s expenses based on a $1,000 investment, assuming a hypothetical 5% annualized return. You can use this information to compare the ongoing expenses (but not transaction expenses or total cost) of investing in the fund with those of other funds.All mutual fund shareholder reports will provide this information to help you make this comparison. Please note that you cannot use this information to estimate your actual ending account balance and expenses paid during the period.
| Expenses and Value of a $1,000 Investment | ||
| assuming a hypothetical 5% annualized return for the six months ended August 31, 2011 | ||
| Expenses paid per $1,000† | $ | 3.87 |
| Ending value (after expenses) | $ | 1,021.37 |
† Expenses are equal to the fund’s annualized expense ratio of .76%, multiplied by the average account value over the period, multiplied by 184/365 (to reflect the one-half year period).
| The Fund | 7 |
| STATEMENT OF INVESTMENTS |
| August 31, 2011 |
| Long-Term Municipal | Coupon | Maturity | Principal | |
| Investments—98.9% | Rate (%) | Date | Amount ($) | Value ($) |
| Alabama—.8% | ||||
| Jefferson County, | ||||
| Limited Obligation | ||||
| School Warrants | 5.25 | 1/1/20 | 15,000,000 | 13,827,600 |
| Alaska—.9% | ||||
| Alaska Energy Authority, | ||||
| Power Revenue (Bradley Lake | ||||
| Hydroelectric Project) | ||||
| (Insured; Assured Guaranty | ||||
| Municipal Corp.) | 6.00 | 7/1/17 | 5,730,000 | 6,870,556 |
| Anchorage, | ||||
| Electric Utility Revenue | ||||
| (Insured; National Public | ||||
| Finance Guarantee Corp.) | 6.50 | 12/1/15 | 6,135,000 | 7,468,197 |
| Arizona—2.2% | ||||
| Apache County Industrial | ||||
| Development Authority, PCR | ||||
| (Tucson Electric Power | ||||
| Company Project) | 5.85 | 3/1/28 | 250,000 | 248,953 |
| Arizona Health Facilities | ||||
| Authority, Revenue | ||||
| (Banner Health) | 6.00 | 1/1/30 | 11,000,000 | 11,207,570 |
| Mohave County Industrial | ||||
| Development Authority, | ||||
| Correctional Facilities | ||||
| Contract Revenue (Mohave | ||||
| Prison, LLC Expansion Project) | 8.00 | 5/1/25 | 9,000,000 | 10,005,120 |
| Pima County Industrial Development | ||||
| Authority, Education Revenue | ||||
| (American Charter Schools | ||||
| Foundation Project) | 5.63 | 7/1/38 | 7,250,000 | 5,807,178 |
| Pima County Industrial Development | ||||
| Authority, IDR (Tucson | ||||
| Electric Power Company Project) | 5.75 | 9/1/29 | 4,815,000 | 4,879,136 |
| Pima County Industrial Development | ||||
| Authority, IDR (Tucson | ||||
| Electric Power Company Project) | 5.25 | 10/1/40 | 4,185,000 | 3,799,017 |
| California—14.0% | ||||
| California, | ||||
| Economic Recovery Bonds | 5.00 | 7/1/20 | 11,000,000 | 12,915,100 |
| California, | ||||
| GO (Insured; AMBAC) | 6.00 | 4/1/17 | 6,080,000 | 7,470,496 |
8
| Long-Term Municipal | Coupon | Maturity | Principal | ||
| Investments (continued) | Rate (%) | Date | Amount ($) | Value ($) | |
| California (continued) | |||||
| California, | |||||
| GO (Various Purpose) | 5.63 | 4/1/25 | 3,500,000 | 3,903,865 | |
| California, | |||||
| GO (Various Purpose) | 5.75 | 4/1/31 | 18,325,000 | 19,923,123 | |
| California, | |||||
| GO (Various Purpose) | 6.50 | 4/1/33 | 15,000,000 | 17,330,700 | |
| California, | |||||
| GO (Various Purpose) | 6.00 | 11/1/35 | 14,000,000 | 15,496,600 | |
| California County Tobacco | |||||
| Securitization Agency, Tobacco | |||||
| Settlement Asset-Backed Bonds | |||||
| (Kern County Tobacco | |||||
| Funding Corporation) | 6.25 | 6/1/37 | 6,100,000 | 4,880,671 | |
| California Department of Veterans | |||||
| Affairs, Home Purchase Revenue | 5.00 | 12/1/42 | 8,000,000 | 7,444,880 | |
| California Department of Water | |||||
| Resources, Water System | |||||
| Revenue (Central Valley Project) | 5.50 | 12/1/16 | 6,330,000 | 6,408,239 | |
| California Department of Water | |||||
| Resources, Water System | |||||
| Revenue (Central Valley Project) | 5.00 | 12/1/27 | 17,350,000 | 19,016,294 | |
| California Department of Water | |||||
| Resources, Water System | |||||
| Revenue (Central Valley | |||||
| Project) (Prerefunded) | 5.50 | 12/1/11 | 60,000 | a | 60,806 |
| California Educational Facilities | |||||
| Authority, Revenue (University | |||||
| of Southern California) | 5.25 | 10/1/38 | 4,000,000 | 4,294,160 | |
| California Public Works Board, | |||||
| LR (Department of Mental | |||||
| Health) (Coalinga State Hospital) | 5.13 | 6/1/29 | 5,000,000 | 5,011,000 | |
| California Statewide Communities | |||||
| Development Authority, Revenue | |||||
| (Inland Regional Center Project) | 5.38 | 12/1/37 | 10,325,000 | 9,579,019 | |
| California Statewide Communities | |||||
| Development Authority, Revenue | |||||
| (Sutter Health) | 5.50 | 8/15/26 | 5,000,000 | 5,334,700 | |
| Chula Vista, | |||||
| IDR (San Diego Gas and | |||||
| Electric Company) | 5.50 | 12/1/21 | 11,725,000 | 12,415,251 |
| The Fund | 9 |
STATEMENT OF INVESTMENTS (continued)
| Long-Term Municipal | Coupon | Maturity | Principal | ||
| Investments (continued) | Rate (%) | Date | Amount ($) | Value ($) | |
| California (continued) | |||||
| Chula Vista, | |||||
| IDR (San Diego Gas and | |||||
| Electric Company) | 5.88 | 2/15/34 | 5,000,000 | 5,484,650 | |
| Coast Community College District, | |||||
| GO (Insured; Assured Guaranty | |||||
| Municipal Corp.) | 0/5.00 | 8/1/29 | 15,000,000 | b | 13,875,300 |
| Golden State Tobacco | |||||
| Securitization Corporation, | |||||
| Enhanced Tobacco | |||||
| Settlement Asset-Backed | |||||
| Bonds (Prerefunded) | 5.50 | 6/1/13 | 8,495,000 | a | 9,255,642 |
| Golden State Tobacco | |||||
| Securitization Corporation, | |||||
| Tobacco Settlement | |||||
| Asset-Backed Bonds | 4.50 | 6/1/27 | 8,690,000 | 6,768,120 | |
| Golden State Tobacco | |||||
| Securitization Corporation, | |||||
| Tobacco Settlement | |||||
| Asset-Backed Bonds | 5.00 | 6/1/33 | 11,155,000 | 7,809,169 | |
| Modesto Irrigation District, | |||||
| Electric System Revenue | 5.00 | 7/1/21 | 3,515,000 | 4,070,721 | |
| Sacramento County, | |||||
| Airport System Senior Revenue | 5.75 | 7/1/39 | 10,260,000 | 10,769,614 | |
| San Francisco City and County | |||||
| Airport Commission, San | |||||
| Francisco International | |||||
| Airport Second Series Revenue | |||||
| (Issue 34E) (Insured; Assured | |||||
| Guaranty Municipal Corp.) | 5.75 | 5/1/22 | 7,000,000 | 7,928,900 | |
| San Francisco City and County | |||||
| Public Utilities Commission, | |||||
| San Francisco Water Revenue | 5.50 | 11/1/30 | 13,555,000 | 15,173,467 | |
| Colorado—1.1% | |||||
| Arkansas River Power Authority, | |||||
| Power Improvement Revenue | |||||
| (Insured; XLCA) | 5.25 | 10/1/32 | 5,860,000 | 5,250,794 | |
| Colorado Health Facilities | |||||
| Authority, Revenue (Sisters of | |||||
| Charity of Leavenworth | |||||
| Health System) | 5.25 | 1/1/25 | 4,000,000 | 4,321,720 |
10
| Long-Term Municipal | Coupon | Maturity | Principal | ||
| Investments (continued) | Rate (%) | Date | Amount ($) | Value ($) | |
| Colorado (continued) | |||||
| E-470 Public Highway Authority, | |||||
| Senior Revenue (Insured; | |||||
| National Public Finance | |||||
| Guarantee Corp.) | 0.00 | 9/1/20 | 6,740,000 | c | 4,079,587 |
| University of Colorado Hospital | |||||
| Authority, Revenue | 5.00 | 11/15/37 | 4,000,000 | 3,863,720 | |
| Delaware—.4% | |||||
| Delaware Transportation Authority, | |||||
| Transportation System | |||||
| Senior Revenue | 5.00 | 7/1/26 | 6,245,000 | 6,988,280 | |
| Florida—6.8% | |||||
| Citizens Property Insurance | |||||
| Corporation, Coastal Account | |||||
| Senior Secured Revenue | 5.00 | 6/1/20 | 7,000,000 | 7,355,810 | |
| Citizens Property Insurance | |||||
| Corporation, High-Risk Account | |||||
| Senior Secured Revenue | 5.25 | 6/1/17 | 10,000,000 | 10,883,100 | |
| Citizens Property Insurance | |||||
| Corporation, High-Risk Account | |||||
| Senior Secured Revenue | 5.50 | 6/1/17 | 6,000,000 | 6,607,260 | |
| Florida Board of Education, | |||||
| Public Education Capital | |||||
| Outlay Bonds | 5.00 | 6/1/18 | 5,420,000 | 6,552,455 | |
| Florida Housing Finance | |||||
| Corporation, Homeowner | |||||
| Mortgage Revenue | |||||
| (Collateralized: FHLMC, | |||||
| FNMA and GNMA) | 5.10 | 7/1/31 | 2,955,000 | 2,972,464 | |
| Florida Municipal Power Agency, | |||||
| Revenue (Saint Lucie Project) | 5.00 | 10/1/20 | 4,065,000 | 4,610,970 | |
| Highlands County Health Facilities | |||||
| Authority, HR (Adventist | |||||
| Health System/Sunbelt | |||||
| Obligated Group) (Prerefunded) | 5.25 | 11/15/16 | 265,000 | a | 323,160 |
| Miami-Dade County, | |||||
| Aviation Revenue (Miami | |||||
| International Airport) | 5.38 | 10/1/35 | 5,000,000 | 5,117,000 | |
| Miami-Dade County, | |||||
| Water and Sewer System Revenue | 5.00 | 10/1/34 | 5,000,000 | 5,178,850 |
| The Fund | 11 |
STATEMENT OF INVESTMENTS (continued)
| Long-Term Municipal | Coupon | Maturity | Principal | |
| Investments (continued) | Rate (%) | Date | Amount ($) | Value ($) |
| Florida (continued) | ||||
| Miami-Dade County, | ||||
| Water and Sewer System Revenue | ||||
| (Insured; National Public | ||||
| Finance Guarantee Corp.) | 5.00 | 10/1/26 | 5,000,000 | 5,316,000 |
| Orange County, | ||||
| Tourist Development Tax | ||||
| Revenue (Insured; AMBAC) | 5.00 | 10/1/24 | 10,110,000 | 10,527,644 |
| Orlando Utilities Commission, | ||||
| Water and Electric Revenue | 6.75 | 10/1/17 | 15,875,000 | 18,526,125 |
| Orlando-Orange County Expressway | ||||
| Authority, Revenue | 5.00 | 7/1/35 | 7,000,000 | 7,112,000 |
| Saint Johns County Industrial | ||||
| Development Authority, Revenue | ||||
| (Presbyterian Retirement | ||||
| Communities Project) | 5.88 | 8/1/40 | 5,000,000 | 4,968,750 |
| Tampa, | ||||
| Utility Tax and Special | ||||
| Revenue (Insured; AMBAC) | 5.75 | 10/1/13 | 9,100,000 | 10,016,370 |
| Tampa Bay Water Regional Water | ||||
| Supply Authority, Utility | ||||
| System Improvement Revenue | ||||
| (Insured; National Public | ||||
| Finance Guarantee Corp.) | 6.00 | 10/1/29 | 5,000,000 | 6,274,550 |
| Georgia—4.7% | ||||
| Atlanta, | ||||
| Airport General Revenue | 5.00 | 1/1/28 | 5,000,000 | 5,119,550 |
| Atlanta, | ||||
| Water and Wastewater Revenue | 5.00 | 11/1/14 | 5,000,000 | 5,623,150 |
| Atlanta, | ||||
| Water and Wastewater Revenue | 6.00 | 11/1/26 | 10,000,000 | 11,336,400 |
| Atlanta, | ||||
| Water and Wastewater Revenue | ||||
| (Insured; Assured Guaranty | ||||
| Municipal Corp.) | 5.25 | 11/1/34 | 5,500,000 | 5,780,885 |
| DeKalb County, | ||||
| Water and Sewerage Revenue | 5.25 | 10/1/25 | 8,590,000 | 9,643,563 |
| DeKalb County Hospital Authority, | ||||
| RAC (DeKalb Medical | ||||
| Center, Inc. Project) | 6.00 | 9/1/30 | 13,000,000 | 13,290,030 |
12
| Long-Term Municipal | Coupon | Maturity | Principal | ||
| Investments (continued) | Rate (%) | Date | Amount ($) | Value ($) | |
| Georgia (continued) | |||||
| Milledgeville and Baldwin County | |||||
| Development Authority, Revenue | |||||
| (Georgia College and State | |||||
| University Foundation Property | |||||
| III, LLC Student Housing | |||||
| System Project) (Prerefunded) | 5.63 | 9/1/14 | 5,100,000 | a | 5,926,047 |
| Municipal Electric Authority of | |||||
| Georgia, GO (Project One | |||||
| Subordinated Bonds) | 5.75 | 1/1/20 | 5,000,000 | 5,902,850 | |
| Municipal Electric Authority of | |||||
| Georgia, GO (Project One | |||||
| Subordinated Bonds) | 5.00 | 1/1/21 | 9,705,000 | 11,287,400 | |
| Thomasville Hospital Authority, | |||||
| RAC (John D. Archbold Memorial | |||||
| Hospital, Inc. Project) | 5.13 | 11/1/30 | 3,500,000 | 3,531,605 | |
| Idaho—.9% | |||||
| Idaho Housing Agency, | |||||
| MFHR | 6.70 | 7/1/24 | 6,945,000 | 6,954,931 | |
| Power County Industrial | |||||
| Development Corporation, SWDR | |||||
| (FMC Corporation Project) | 6.45 | 8/1/32 | 7,625,000 | 7,630,643 | |
| Illinois—7.2% | |||||
| Chicago, | |||||
| General Airport Third Lien | |||||
| Revenue (Chicago O’Hare | |||||
| International Airport) | |||||
| (Insured; AMBAC) | 5.00 | 1/1/19 | 5,175,000 | 5,612,132 | |
| Chicago, | |||||
| General Airport Third Lien | |||||
| Revenue (Chicago O’Hare | |||||
| International Airport) | |||||
| (Insured; National Public | |||||
| Finance Guarantee Corp.) | 5.25 | 1/1/23 | 21,370,000 | 22,648,781 | |
| Chicago, | |||||
| GO (Insured; Assured Guaranty | |||||
| Municipal Corp.) | 5.00 | 1/1/18 | 10,000,000 | 11,037,700 | |
| Chicago Board of Education, | |||||
| Unlimited Tax GO | |||||
| (Dedicated Revenues) | 5.25 | 12/1/25 | 15,000,000 | 15,840,300 |
| The Fund | 13 |
STATEMENT OF INVESTMENTS (continued)
| Long-Term Municipal | Coupon | Maturity | Principal | ||
| Investments (continued) | Rate (%) | Date | Amount ($) | Value ($) | |
| Illinois (continued) | |||||
| Illinois, | |||||
| GO | 5.00 | 1/1/17 | 5,145,000 | 5,776,497 | |
| Illinois, | |||||
| GO | 5.00 | 1/1/22 | 5,000,000 | 5,386,000 | |
| Illinois, | |||||
| GO | 5.00 | 1/1/25 | 5,000,000 | 5,152,550 | |
| Illinois, | |||||
| GO | 5.00 | 3/1/28 | 2,500,000 | 2,516,625 | |
| Illinois Finance Authority, | |||||
| Revenue (Central DuPage Health) | 5.50 | 11/1/39 | 3,500,000 | 3,596,985 | |
| Illinois Finance Authority, | |||||
| Revenue (Northwestern Memorial | |||||
| Hospital) (Prerefunded) | 5.50 | 8/15/14 | 22,310,000 | a | 25,500,553 |
| Illinois Finance Authority, | |||||
| Revenue (Sherman | |||||
| Health Systems) | 5.50 | 8/1/37 | 2,500,000 | 2,251,875 | |
| Railsplitter Tobacco Settlement | |||||
| Authority, Tobacco | |||||
| Settlement Revenue | 5.00 | 6/1/16 | 7,275,000 | 8,202,708 | |
| Railsplitter Tobacco Settlement | |||||
| Authority, Tobacco | |||||
| Settlement Revenue | 5.50 | 6/1/23 | 5,500,000 | 5,805,305 | |
| Indiana—.5% | |||||
| Indianapolis Local Public | |||||
| Improvement Bond Bank, | |||||
| Revenue (Indianapolis | |||||
| Airport Authority Project) | |||||
| (Insured; AMBAC) | 5.00 | 1/1/36 | 8,900,000 | 8,619,383 | |
| Iowa—.2% | |||||
| Tobacco Settlement Authority of | |||||
| Iowa, Tobacco Settlement | |||||
| Asset-Backed Bonds | 5.60 | 6/1/34 | 5,000,000 | 4,129,850 | |
| Kansas—1.5% | |||||
| Kansas Development Finance | |||||
| Authority, Revenue (Lifespace | |||||
| Communities, Inc.) | 5.00 | 5/15/30 | 5,000,000 | 4,660,000 | |
| Wichita, | |||||
| Hospital Facilities | |||||
| Improvement Revenue | |||||
| (Christi Health System) | 5.50 | 11/15/26 | 7,000,000 | 7,084,490 |
14
| Long-Term Municipal | Coupon | Maturity | Principal | |
| Investments (continued) | Rate (%) | Date | Amount ($) | Value ($) |
| Kansas (continued) | ||||
| Wyandotte County Kansas City | ||||
| Unified Government, Utility | ||||
| System Revenue (Insured; AMBAC) | 5.60 | 9/1/23 | 12,010,000 | 13,579,467 |
| Kentucky—.9% | ||||
| Mount Sterling, | ||||
| LR (Kentucky League of Cities | ||||
| Funding Trust Program) | 6.10 | 3/1/18 | 7,955,000 | 8,862,029 |
| Ohio County, | ||||
| PCR (Big Rivers Electric | ||||
| Corporation Project) | 6.00 | 7/15/31 | 6,500,000 | 6,570,720 |
| Louisiana—1.7% | ||||
| Louisiana Local Government | ||||
| Environmental Facilities and | ||||
| Community Development | ||||
| Authority, Revenue (Westlake | ||||
| Chemical Corporation Projects) | 6.75 | 11/1/32 | 2,000,000 | 2,061,220 |
| Louisiana Public Facilities | ||||
| Authority, Revenue (CHRISTUS | ||||
| Health Obligated Group) | 6.00 | 7/1/29 | 6,500,000 | 6,981,845 |
| Louisiana State University | ||||
| Board of Supervisors and | ||||
| Agricultural and Mechanical | ||||
| College, Auxiliary Revenue | 5.00 | 7/1/29 | 12,820,000 | 13,555,099 |
| New Orleans Aviation Board, | ||||
| Gulf Opportunity Zone Customer | ||||
| Facility Charge Revenue | ||||
| (Consolidated Rental Car Project) | 6.25 | 1/1/30 | 5,000,000 | 5,278,850 |
| Maine—.3% | ||||
| Maine Health and Higher | ||||
| Educational Facilities Authority, | ||||
| Revenue (MaineGeneral | ||||
| Medical Center Issue) | 7.50 | 7/1/32 | 5,000,000 | 5,407,550 |
| Maryland—.1% | ||||
| Maryland Economic Development | ||||
| Corporation, EDR (Transportation | ||||
| Facilities Project) | 5.75 | 6/1/35 | 2,500,000 | 2,471,025 |
| Massachusetts—3.5% | ||||
| Massachusetts, | ||||
| Consolidated Loan (Insured; | ||||
| Assured Guaranty Municipal Corp.) | 5.25 | 8/1/24 | 12,000,000 | 13,571,520 |
| The Fund | 15 |
STATEMENT OF INVESTMENTS (continued)
| Long-Term Municipal | Coupon | Maturity | Principal | |
| Investments (continued) | Rate (%) | Date | Amount ($) | Value ($) |
| Massachusetts (continued) | ||||
| Massachusetts Department of | ||||
| Transportation, Metropolitan | ||||
| Highway System Senior Revenue | 5.00 | 1/1/27 | 11,000,000 | 11,696,300 |
| Massachusetts Development Finance | ||||
| Agency, Revenue (Tufts Medical | ||||
| Center Issue) | 6.25 | 1/1/27 | 5,000,000 | 5,251,800 |
| Massachusetts Health and | ||||
| Educational Facilities Authority, | ||||
| Revenue (Northeastern | ||||
| University Issue) | 5.00 | 10/1/30 | 3,000,000 | 3,151,830 |
| Massachusetts Housing Finance | ||||
| Agency, Housing Revenue | 5.30 | 6/1/49 | 6,250,000 | 6,164,063 |
| Massachusetts Municipal Wholesale | ||||
| Electric Company, Power Supply | ||||
| System Revenue (Nuclear | ||||
| Project Number 4 Issue) | ||||
| (Insured; National Public | ||||
| Finance Guarantee Corp.) | 5.25 | 7/1/13 | 10,000,000 | 10,221,400 |
| University of Massachusetts | ||||
| Building Authority, Revenue | ||||
| (Insured; AMBAC) | 5.00 | 11/1/17 | 7,540,000 | 8,524,573 |
| Michigan—2.8% | �� | |||
| Detroit, | ||||
| Sewage Disposal System Senior | ||||
| Lien Revenue (Insured; Assured | ||||
| Guaranty Municipal Corp.) | 7.00 | 7/1/27 | 8,000,000 | 9,385,280 |
| Kent Hospital Finance Authority, | ||||
| Revenue (Spectrum | ||||
| Health System) | 5.50 | 11/15/25 | 7,710,000 | 8,500,121 |
| Michigan Building Authority, | ||||
| Revenue (Facilities Program) | 5.00 | 10/15/24 | 2,500,000 | 2,713,025 |
| Michigan Hospital Finance | ||||
| Authority, HR (Henry Ford | ||||
| Health System) | 5.63 | 11/15/29 | 5,000,000 | 5,089,900 |
| Michigan Hospital Finance | ||||
| Authority, Revenue | ||||
| (McLaren Health Care) | 5.63 | 5/15/28 | 4,575,000 | 4,796,888 |
| Michigan Strategic Fund, | ||||
| LOR (The Dow Chemical | ||||
| Company Project) | 6.25 | 6/1/14 | 6,500,000 | 7,194,590 |
16
| Long-Term Municipal | Coupon | Maturity | Principal | |
| Investments (continued) | Rate (%) | Date | Amount ($) | Value ($) |
| Michigan (continued) | ||||
| Michigan Strategic Fund, | ||||
| SWDR (Genesee Power | ||||
| Station Project) | 7.50 | 1/1/21 | 5,205,000 | 4,875,836 |
| Wayne County Airport Authority, | ||||
| Airport Revenue (Detroit | ||||
| Metropolitan Wayne County | ||||
| Airport) (Insured; National | ||||
| Public Finance Guarantee Corp.) | 5.00 | 12/1/34 | 4,525,000 | 4,152,050 |
| Mississippi—.2% | ||||
| Mississippi Home Corporation, | ||||
| SFMR (Collateralized: | ||||
| FNMA and GNMA) | 6.25 | 12/1/32 | 2,970,000 | 3,194,324 |
| Missouri—.7% | ||||
| Missouri Highways and | ||||
| Transportation Commission, | ||||
| Second Lien State Road Revenue | 5.25 | 5/1/22 | 10,000,000 | 11,575,300 |
| Nebraska—1.6% | ||||
| Omaha Public Power District, | ||||
| Electric Revenue | 5.50 | 2/1/14 | 24,260,000 | 25,773,339 |
| Nevada—1.1% | ||||
| Clark County, | ||||
| Airport System Subordinate | ||||
| Lien Revenue (Insured; Assured | ||||
| Guaranty Municipal Corp.) | 5.00 | 7/1/26 | 5,000,000 | 5,260,950 |
| Clark County, | ||||
| Passenger Facility Charge | ||||
| Revenue (Las Vegas-McCarran | ||||
| International Airport) | 5.00 | 7/1/30 | 12,000,000 | 12,349,320 |
| New Jersey—7.3% | ||||
| Camden County Improvement | ||||
| Authority, Health Care | ||||
| Redevelopment Project Revenue | ||||
| (The Cooper Health System | ||||
| Obligated Group Issue) | 5.25 | 2/15/20 | 9,505,000 | 9,597,294 |
| New Jersey Economic Development | ||||
| Authority, Cigarette Tax Revenue | 5.50 | 6/15/24 | 11,120,000 | 10,840,221 |
| New Jersey Economic Development | ||||
| Authority, School Facilities | ||||
| Construction Revenue | 5.75 | 9/1/23 | 7,500,000 | 8,651,925 |
| The Fund | 17 |
STATEMENT OF INVESTMENTS (continued)
| Long-Term Municipal | Coupon | Maturity | Principal | ||
| Investments (continued) | Rate (%) | Date | Amount ($) | Value ($) | |
| New Jersey (continued) | |||||
| New Jersey Higher Education | |||||
| Student Assistance Authority, | |||||
| Student Loan Revenue (Insured; | |||||
| Assured Guaranty Municipal Corp.) | 6.13 | 6/1/30 | 10,000,000 | 10,433,300 | |
| New Jersey Transportation | |||||
| Trust Fund Authority | |||||
| (Transportation System) | 5.75 | 6/15/18 | 7,750,000 | 9,177,395 | |
| New Jersey Transportation | |||||
| Trust Fund Authority | |||||
| (Transportation System) | 5.25 | 12/15/19 | 7,000,000 | 8,142,330 | |
| New Jersey Transportation | |||||
| Trust Fund Authority | |||||
| (Transportation System) | 5.75 | 6/15/20 | 12,645,000 | 14,767,337 | |
| New Jersey Transportation Trust | |||||
| Fund Authority (Transportation | |||||
| System) (Insured; AMBAC) | 5.00 | 12/15/27 | 14,750,000 | 15,382,922 | |
| New Jersey Transportation Trust | |||||
| Fund Authority (Transportation | |||||
| System) (Insured; National | |||||
| Public Finance Guarantee Corp.) | 5.25 | 12/15/18 | 5,000,000 | 5,601,150 | |
| Tobacco Settlement Financing | |||||
| Corporation of New Jersey, | |||||
| Tobacco Settlement | |||||
| Asset-Backed Bonds | 4.50 | 6/1/23 | 4,950,000 | 4,383,571 | |
| Tobacco Settlement Financing | |||||
| Corporation of New Jersey, | |||||
| Tobacco Settlement | |||||
| Asset-Backed Bonds | 4.63 | 6/1/26 | 5,780,000 | 4,520,191 | |
| Tobacco Settlement Financing | |||||
| Corporation of New Jersey, | |||||
| Tobacco Settlement | |||||
| Asset-Backed Bonds | 5.00 | 6/1/29 | 4,650,000 | 3,423,749 | |
| Tobacco Settlement Financing | |||||
| Corporation of New Jersey, | |||||
| Tobacco Settlement Asset-Backed | |||||
| Bonds (Prerefunded) | 6.75 | 6/1/13 | 3,000,000 | a | 3,337,200 |
| Tobacco Settlement Financing | |||||
| Corporation of New Jersey, | |||||
| Tobacco Settlement Asset-Backed | |||||
| Bonds (Prerefunded) | 7.00 | 6/1/13 | 12,065,000 | a | 13,471,417 |
18
| Long-Term Municipal | Coupon | Maturity | Principal | ||
| Investments (continued) | Rate (%) | Date | Amount ($) | Value ($) | |
| New Mexico—.6% | |||||
| New Mexico Finance Authority, | |||||
| State Transportation Senior | |||||
| Lien Revenue (Insured; | |||||
| National Public Finance | |||||
| Guarantee Corp.) (Prerefunded) | 5.25 | 6/15/14 | 8,000,000 | a | 9,072,560 |
| New Mexico Mortgage Financing | |||||
| Authority, Mortgage-Backed | |||||
| Securities Revenue (Collateralized: | |||||
| FNMA and GNMA) | 6.80 | 1/1/26 | 540,000 | 566,379 | |
| New York—10.9% | |||||
| Austin Trust | |||||
| (Port Authority of New York | |||||
| and New Jersey, Consolidated | |||||
| Bonds, 151st Series) | 6.00 | 9/15/28 | 25,000,000 | d,e | 27,638,000 |
| Long Island Power Authority, | |||||
| Electric System General Revenue | 6.00 | 5/1/33 | 9,000,000 | 10,098,900 | |
| Long Island Power Authority, | |||||
| Electric System General | |||||
| Revenue (Insured; Assured | |||||
| Guaranty Municipal Corp.) | 5.50 | 12/1/13 | 25,860,000 | 28,820,194 | |
| Metropolitan Transportation | |||||
| Authority, State Service | |||||
| Contract Revenue | 5.75 | 1/1/18 | 17,025,000 | 20,719,765 | |
| Metropolitan Transportation | |||||
| Authority, Transportation Revenue | 5.00 | 11/15/31 | 8,250,000 | 8,454,352 | |
| New York City, | |||||
| GO | 5.25 | 8/15/24 | 18,500,000 | 20,303,750 | |
| New York City Health and | |||||
| Hospitals Corporation, | |||||
| Health System Revenue | 5.00 | 2/15/25 | 14,625,000 | 15,666,300 | |
| New York City Industrial | |||||
| Development Agency, Liberty | |||||
| Revenue (7 World Trade | |||||
| Center Project) | 6.25 | 3/1/15 | 1,750,000 | 1,756,860 | |
| New York City Industrial | |||||
| Development Agency, Special | |||||
| Facility Revenue (American | |||||
| Airlines, Inc. John F. Kennedy | |||||
| International Airport Project) | 8.00 | 8/1/28 | 7,450,000 | 7,627,310 |
| The Fund | 19 |
STATEMENT OF INVESTMENTS (continued)
| Long-Term Municipal | Coupon | Maturity | Principal | |
| Investments (continued) | Rate (%) | Date | Amount ($) | Value ($) |
| New York (continued) | ||||
| New York State Dormitory | ||||
| Authority, Revenue (New York | ||||
| University) (Insured; National | ||||
| Public Finance Guarantee Corp.) | 5.75 | 7/1/27 | 9,500,000 | 11,259,210 |
| New York State Dormitory | ||||
| Authority, Revenue (Orange | ||||
| Regional Medical Center | ||||
| Obligated Group) | 6.13 | 12/1/29 | 5,000,000 | 4,967,950 |
| New York State Dormitory | ||||
| Authority, Revenue (Orange | ||||
| Regional Medical Center | �� | |||
| Obligated Group) | 6.25 | 12/1/37 | 6,500,000 | 6,355,830 |
| New York State Thruway Authority, | ||||
| Second General Highway and | ||||
| Bridge Trust Fund Bonds | ||||
| (Insured; National Public | ||||
| Finance Guarantee Corp.) | 5.00 | 4/1/17 | 8,090,000 | 9,288,048 |
| Port Authority of New York and | ||||
| New Jersey (Consolidated Bonds, | ||||
| 141th Series) (Insured; AMBAC) | 5.00 | 9/1/17 | 6,535,000 | 7,214,836 |
| Ohio—.3% | ||||
| Butler County, | ||||
| Hospital Facilities Revenue | ||||
| (UC Health) | 5.50 | 11/1/40 | 5,000,000 | 4,561,400 |
| Oregon—.5% | ||||
| Oregon, | ||||
| GO (State Property— | ||||
| Various Projects) | 5.00 | 5/1/20 | 2,000,000 | 2,460,000 |
| Oregon Department of | ||||
| Administrative Services, Lottery | ||||
| Revenue (Insured; Assured | ||||
| Guaranty Municipal Corp.) | 5.00 | 4/1/26 | 5,000,000 | 5,450,050 |
| Pennsylvania—2.1% | ||||
| Allegheny County Port Authority, | ||||
| Special Transportation Revenue | 5.25 | 3/1/22 | 5,000,000 | 5,715,050 |
| Delaware County Industrial | ||||
| Development Authority, Charter | ||||
| School Revenue (Chester | ||||
| Community Charter | ||||
| School Project) | 5.25 | 8/15/30 | 7,765,000 | 6,769,061 |
20
| Long-Term Municipal | Coupon | Maturity | Principal | |
| Investments (continued) | Rate (%) | Date | Amount ($) | Value ($) |
| Pennsylvania (continued) | ||||
| Geisinger Authority, | ||||
| Health System Revenue | ||||
| (Geisinger Health System) | 5.25 | 6/1/39 | 11,750,000 | 12,133,990 |
| Pennsylvania Turnpike Commission, | ||||
| Turnpike Revenue | 5.00 | 12/1/24 | 5,000,000 | 5,536,900 |
| Philadelphia School District, | ||||
| GO | 5.25 | 9/1/23 | 5,000,000 | 5,473,250 |
| South Carolina—1.3% | ||||
| Greenville County School District, | ||||
| Installment Purchase | ||||
| Revenue (Building Equity | ||||
| Sooner for Tomorrow) | 5.00 | 12/1/23 | 15,000,000 | 16,004,550 |
| Piedmont Municipal Power Agency, | ||||
| Electric Revenue | 5.00 | 1/1/20 | 5,340,000 | 6,107,305 |
| Tennessee—.4% | ||||
| Johnson City Health and | ||||
| Educational Facilities Board, HR | ||||
| (Mountain States Health Alliance) | 6.00 | 7/1/38 | 5,000,000 | 5,169,100 |
| Memphis-Shelby County Airport | ||||
| Authority, Special Facilities Revenue | ||||
| (Federal Express Corporation) | 5.05 | 9/1/12 | 2,000,000 | 2,071,020 |
| Texas—10.7% | ||||
| Austin, | ||||
| Water and Wastewater | ||||
| System Revenue | 5.00 | 11/15/27 | 10,000,000 | 11,095,200 |
| Cities of Dallas and Fort Worth, | ||||
| Dallas/Fort Worth International | ||||
| Airport, Joint Improvement | ||||
| Revenue (Insured; National Public | ||||
| Finance Guarantee Corp.) | 5.75 | 11/1/14 | 15,070,000 | 15,194,780 |
| Cities of Dallas and Fort Worth, | ||||
| Dallas/Fort Worth International | ||||
| Airport, Joint Improvement | ||||
| Revenue (Insured; National Public | ||||
| Finance Guarantee Corp.) | 5.75 | 11/1/15 | 10,000,000 | 10,081,600 |
| Dallas-Fort Worth International | ||||
| Airport Facility Improvement | ||||
| Corporation, Revenue | ||||
| (Learjet Inc. Project) | 6.15 | 1/1/16 | 5,865,000 | 5,864,707 |
| The Fund | 21 |
STATEMENT OF INVESTMENTS (continued)
| Long-Term Municipal | Coupon | Maturity | Principal | |
| Investments (continued) | Rate (%) | Date | Amount ($) | Value ($) |
| Texas (continued) | ||||
| Harris County Cultural Education | ||||
| Facilities Finance Corporation, HR | ||||
| (Texas Children’s Hospital Project) | 5.25 | 10/1/29 | 4,000,000 | 4,204,040 |
| Harris County Health Facilities | ||||
| Development Corporation, HR | ||||
| (Memorial Hermann | ||||
| Healthcare System) | 7.25 | 12/1/35 | 7,000,000 | 7,829,920 |
| Houston, | ||||
| Airport System Subordinate | ||||
| Lien Revenue | 5.00 | 7/1/17 | 7,500,000 | 8,399,175 |
| Houston, | ||||
| Combined Utility System First | ||||
| Lien Revenue (Insured; Assured | ||||
| Guaranty Municipal Corp.) | 5.25 | 5/15/21 | 18,075,000 | 19,727,055 |
| Laredo, | ||||
| Waterworks and Sewer | ||||
| System Revenue | 5.25 | 3/1/30 | 10,950,000 | 11,793,150 |
| Lewisville Independent School | ||||
| District, Unlimited Tax School | ||||
| Building Bonds | 5.00 | 8/15/28 | 10,000,000 | 10,980,100 |
| North Texas Tollway Authority, | ||||
| First Tier System Revenue | ||||
| (Insured; Assured Guaranty | ||||
| Municipal Corp.) | 5.75 | 1/1/40 | 15,000,000 | 15,781,800 |
| North Texas Tollway Authority, | ||||
| Second Tier System Revenue | 5.75 | 1/1/38 | 10,000,000 | 10,001,700 |
| Tarrant County Health Facilities | ||||
| Development Corporation, | ||||
| Health Resources System | ||||
| Revenue (Insured; National | ||||
| Public Finance Guarantee Corp.) | 5.75 | 2/15/14 | 9,470,000 | 10,622,404 |
| Texas Transportation Commission, | ||||
| State Highway Fund First | ||||
| Tier Revenue | 5.00 | 4/1/26 | 20,000,000 | 22,126,200 |
| Texas Turnpike Authority, | ||||
| Central Texas Turnpike System | ||||
| Revenue (Insured; AMBAC) | 5.75 | 8/15/38 | 12,000,000 | 12,054,840 |
| Texas Turnpike Authority, | ||||
| Central Texas Turnpike System | ||||
| Revenue (Insured; AMBAC) | 5.50 | 8/15/39 | 1,500,000 | 1,503,405 |
22
| Long-Term Municipal | Coupon | Maturity | Principal | ||
| Investments (continued) | Rate (%) | Date | Amount ($) | Value ($) | |
| Virginia—2.5% | |||||
| Danville Industrial Development | |||||
| Authority, HR (Danville | |||||
| Regional Medical Center) | |||||
| (Insured; AMBAC) | 5.25 | 10/1/28 | 1,500,000 | 1,810,935 | |
| Tobacco Settlement Financing | |||||
| Corporation, Tobacco | |||||
| Settlement Asset-Backed | |||||
| Bonds (Prerefunded) | 5.50 | 6/1/15 | 10,000,000 | a | 11,099,300 |
| Upper Occoquan Sewage Authority, | |||||
| Regional Sewerage System | |||||
| Revenue (Insured; National | |||||
| Public Finance Guarantee Corp.) | 5.15 | 7/1/20 | 5,210,000 | 6,184,062 | |
| Virginia Housing Development | |||||
| Authority, Commonwealth | |||||
| Mortgage Revenue | 5.00 | 10/1/26 | 8,250,000 | 8,414,505 | |
| Virginia Housing Development | |||||
| Authority, Commonwealth | |||||
| Mortgage Revenue | 6.25 | 7/1/31 | 13,470,000 | 14,297,327 | |
| Washington—2.8% | |||||
| Bellevue, | |||||
| Limited Tax GO (New City | |||||
| Building) (Insured; | |||||
| National Public Finance | |||||
| Guarantee Corp.) | 5.50 | 12/1/39 | 10,520,000 | 11,535,390 | |
| Chelan County Public Utility | |||||
| District Number 1, Consolidated | |||||
| System Revenue | 5.00 | 7/1/17 | 4,000,000 | 4,618,160 | |
| Energy Northwest, | |||||
| Electric Revenue (Columbia | |||||
| Generating Station) | 5.00 | 7/1/23 | 10,060,000 | 11,082,297 | |
| Washington, | |||||
| GO (Various Purpose) | 5.00 | 2/1/28 | 10,000,000 | 11,362,100 | |
| Washington, | |||||
| GO (Various Purpose) | |||||
| (Insured; AMBAC) | 5.00 | 7/1/16 | 7,315,000 | 8,452,995 | |
| West Virginia—.7% | |||||
| West Virginia, | |||||
| Infrastructure GO (Insured; | |||||
| FGIC) (Prerefunded) | 6.50 | 11/1/16 | 2,600,000 | a | 3,394,612 |
The Fund 23
STATEMENT OF INVESTMENTS (continued)
| Long-Term Municipal | Coupon | Maturity | Principal | ||
| Investments (continued) | Rate (%) | Date | Amount ($) | Value ($) | |
| West Virginia (continued) | |||||
| West Virginia School Building | |||||
| Authority, Capital Improvement | |||||
| Revenue (Insured; National | |||||
| Public Finance Guarantee Corp.) | 5.00 | 7/1/18 | 5,500,000 | 6,363,060 | |
| West Virginia State Building | |||||
| Commission, Subordinate LR | |||||
| (West Virginia Regional Jail | |||||
| and Correctional Facility | |||||
| Authority) (Insured; AMBAC) | 5.38 | 7/1/21 | 2,505,000 | 2,674,388 | |
| Wisconsin—.9% | |||||
| Wisconsin Health and Educational | |||||
| Facilities Authority, Revenue | |||||
| (Aurora Health Care, Inc.) | 5.63 | 2/15/29 | 9,600,000 | 9,603,360 | |
| Wisconsin Health and Educational | |||||
| Facilities Authority, Revenue | |||||
| (Aurora Health Care, Inc.) | 5.50 | 4/15/29 | 5,000,000 | 5,123,800 | |
| U.S. Related—3.8% | |||||
| Puerto Rico Commonwealth, | |||||
| Public Improvement GO | 5.00 | 7/1/16 | 5,000,000 | 5,438,400 | |
| Puerto Rico Commonwealth, | |||||
| Public Improvement GO | 6.00 | 7/1/39 | 5,000,000 | 5,052,350 | |
| Puerto Rico Commonwealth, | |||||
| Public Improvement GO | 6.50 | 7/1/40 | 5,000,000 | 5,344,050 | |
| Puerto Rico Electric Power | |||||
| Authority, Power Revenue | 5.50 | 7/1/38 | 10,000,000 | 10,035,900 | |
| Puerto Rico Electric Power | |||||
| Authority, Power Revenue | 5.25 | 7/1/40 | 5,000,000 | 4,865,700 | |
| Puerto Rico Infrastructure | |||||
| Financing Authority, Special | |||||
| Tax Revenue (Insured; AMBAC) | 0.00 | 7/1/36 | 23,400,000 | c | 4,109,040 |
| Puerto Rico Sales Tax Financing | |||||
| Corporation, Sales Tax Revenue | |||||
| (First Subordinate Series) | 5.38 | 8/1/39 | 5,000,000 | 5,043,550 | |
| Puerto Rico Sales Tax Financing | |||||
| Corporation, Sales Tax Revenue | |||||
| (First Subordinate Series) | 6.00 | 8/1/39 | 5,000,000 | 5,322,650 |
24
| Long-Term Municipal | Coupon | Maturity | Principal | |
| Investments (continued) | Rate (%) | Date | Amount ($) | Value ($) |
| U.S. Related (continued) | ||||
| Puerto Rico Sales Tax Financing | ||||
| Corporation, Sales Tax Revenue | ||||
| (First Subordinate Series) | 6.38 | 8/1/39 | 5,000,000 | 5,420,900 |
| Puerto Rico Sales Tax Financing | ||||
| Corporation, Sales Tax Revenue | ||||
| (First Subordinate Series) | 6.00 | 8/1/42 | 11,500,000 | 12,174,360 |
| Total Long-Term Municipal Investments | ||||
| (cost $1,562,907,890) | 1,642,714,614 | |||
| Short-Term Municipal | ||||||
| Investments—.2% | ||||||
| California; | ||||||
| California, | ||||||
| Economic Recovery Bonds (LOC; | ||||||
| JPMorgan Chase Bank) | 0.10 | 9/1/11 | 1,200,000 | f | 1,200,000 | |
| Irvine Assessment District Number | ||||||
| 03-19, Limited Obligation | ||||||
| Improvement Bonds (LOC: | ||||||
| California State Teachers | ||||||
| Retirement System and | ||||||
| U.S. Bank NA) | 0.13 | 9/1/11 | 1,600,000 | f | 1,600,000 | |
| Total Short-Term Municipal Investments | ||||||
| (cost $2,800,000) | 2,800,000 | |||||
| Total Investments (cost $1,565,707,890) | 99.1 | % | 1,645,514,614 | |||
| Cash and Receivables (Net) | .9 | % | 14,891,885 | |||
| Net Assets | 100.0 | % | 1,660,406,499 | |||
| a These securities are prerefunded; the date shown represents the prerefunded date. Bonds which are prerefunded are |
| collateralized by U.S. Government securities which are held in escrow and are used to pay principal and interest on |
| the municipal issue and to retire the bonds in full at the earliest refunding date. |
| b Zero coupon until a specified date at which time the stated coupon rate becomes effective until maturity. |
| c Security issued with a zero coupon. Income is recognized through the accretion of discount. |
| d Collateral for floating rate borrowings. |
| e Security exempt from registration under Rule 144A of the Securities Act of 1933.This security may be resold in |
| transactions exempt from registration, normally to qualified institutional buyers.At August 31, 2011, this security |
| was valued at $27,638,000 or 1.7% of net assets. |
| f Variable rate demand note—rate shown is the interest rate in effect at August 31, 2011. Maturity date represents the |
| next demand date, or the ultimate maturity date if earlier. |
| The Fund | 25 |
STATEMENT OF INVESTMENTS (continued)
| Summary of Abbreviations | |||
| ABAG | Association of Bay Area Governments | ACA | American Capital Access |
| AGC | ACE Guaranty Corporation | AGIC | Asset Guaranty Insurance Company |
| AMBAC | American Municipal Bond | ARRN | Adjustable Rate Receipt Notes |
| Assurance Corporation | |||
| BAN | Bond Anticipation Notes | BPA | Bond Purchase Agreement |
| CIFG | CDC Ixis Financial Guaranty | COP | Certificate of Participation |
| CP | Commercial Paper | EDR | Economic Development Revenue |
| EIR | Environmental Improvement Revenue | FGIC | Financial Guaranty Insurance |
| Company | |||
| FHA | Federal Housing Administration | FHLB | Federal Home Loan Bank |
| FHLMC | Federal Home Loan Mortgage | FNMA | Federal National |
| Corporation | Mortgage Association | ||
| GAN | Grant Anticipation Notes | GIC | Guaranteed Investment Contract |
| GNMA | Government National | GO | General Obligation |
| Mortgage Association | |||
| HR | Hospital Revenue | IDB | Industrial Development Board |
| IDC | Industrial Development Corporation | IDR | Industrial Development Revenue |
| LOC | Letter of Credit | LOR | Limited Obligation Revenue |
| LR | Lease Revenue | MFHR | Multi-Family Housing Revenue |
| MFMR | Multi-Family Mortgage Revenue | PCR | Pollution Control Revenue |
| PILOT | Payment in Lieu of Taxes | PUTTERS | Puttable Tax-Exempt Receipts |
| RAC | Revenue Anticipation Certificates | RAN | Revenue Anticipation Notes |
| RAW | Revenue Anticipation Warrants | RRR | Resources Recovery Revenue |
| SAAN | State Aid Anticipation Notes | SBPA | Standby Bond Purchase Agreement |
| SFHR | Single Family Housing Revenue | SFMR | Single Family Mortgage Revenue |
| SONYMA | State of New York Mortgage Agency | SWDR | Solid Waste Disposal Revenue |
| TAN | Tax Anticipation Notes | TAW | Tax Anticipation Warrants |
| TRAN | Tax and Revenue Anticipation Notes | XLCA | XL Capital Assurance |
26
| Summary of Combined Ratings (Unaudited) | |||||
| Fitch | or | Moody’s | or | Standard & Poor’s | Value (%)† |
| AAA | Aaa | AAA | 24.5 | ||
| AA | Aa | AA | 33.1 | ||
| A | A | A | 25.7 | ||
| BBB | Baa | BBB | 12.3 | ||
| BB | Ba | BB | 1.0 | ||
| B | B | B | .5 | ||
| F1 | MIG1/P1 | SP1/A1 | .2 | ||
| Not Ratedg | Not Ratedg | Not Ratedg | 2.7 | ||
| 100.0 | |||||
| † | Based on total investments. |
| g | Securities which, while not rated by Fitch, Moody’s and Standard & Poor’s, have been determined by the Manager to |
| be of comparable quality to those rated securities in which the fund may invest. | |
| See notes to financial statements. | |
| The Fund | 27 |
| STATEMENT OF ASSETS AND LIABILITIES |
| August 31, 2011 |
| Cost | Value | ||
| Assets ($): | |||
| Investments in securities—See Statement of Investments | 1,565,707,890 | 1,645,514,614 | |
| Cash | 8,459,678 | ||
| Interest receivable | 20,584,875 | ||
| Receivable for shares of Common Stock subscribed | 135,133 | ||
| Prepaid expenses | 24,567 | ||
| 1,674,718,867 | |||
| Liabilities ($): | |||
| Due to The Dreyfus Corporation and affiliates—Note 3(b) | 950,402 | ||
| Payable for floating rate notes issued—Note 4 | 12,500,000 | ||
| Payable for shares of Common Stock redeemed | 641,136 | ||
| Interest and expense payable related to | |||
| floating rate notes issued—Note 4 | 60,549 | ||
| Accrued expenses | 160,281 | ||
| 14,312,368 | |||
| Net Assets ($) | 1,660,406,499 | ||
| Composition of Net Assets ($): | |||
| Paid-in capital | 1,730,213,684 | ||
| Accumulated net realized gain (loss) on investments | (149,613,909) | ||
| Accumulated net unrealized appreciation | |||
| (depreciation) on investments | 79,806,724 | ||
| Net Assets ($) | 1,660,406,499 | ||
| Shares Outstanding | |||
| (600 million shares of $.001 par value Common Stock authorized) | 147,758,853 | ||
| Net Asset Value, offering and redemption price per share ($) | 11.24 | ||
| See notes to financial statements. | |||
28
| STATEMENT OF OPERATIONS |
| Year Ended August 31, 2011 |
| Investment Income ($): | ||
| Interest Income | 84,463,368 | |
| Expenses: | ||
| Management fee—Note 3(a) | 10,028,243 | |
| Shareholder servicing costs—Note 3(b) | 1,884,823 | |
| Directors’ fees and expenses—Note 3(c) | 165,720 | |
| Interest and expense related to floating rate notes issued—Note 4 | 113,992 | |
| Custodian fees—Note 3(b) | 96,183 | |
| Professional fees | 87,053 | |
| Prospectus and shareholders’ reports | 52,163 | |
| Registration fees | 34,152 | |
| Loan commitment fees—Note 2 | 28,990 | |
| Interest expense—Note 2 | 298 | |
| Miscellaneous | 79,726 | |
| Total Expenses | 12,571,343 | |
| Less—reduction in fees due to earnings credits—Note 3(b) | (2,536) | |
| Net Expenses | 12,568,807 | |
| Investment Income—Net | 71,894,561 | |
| Realized and Unrealized Gain (Loss) on Investments—Note 4 ($): | ||
| Net realized gain (loss) on investments | (28,018,125) | |
| Net unrealized appreciation (depreciation) on investments | (29,580,753) | |
| Net Realized and Unrealized Gain (Loss) on Investments | (57,598,878) | |
| Net Increase in Net Assets Resulting from Operations | 14,295,683 | |
| See notes to financial statements. | ||
| The Fund | 29 |
STATEMENT OF CHANGES IN NET ASSETS
| Year Ended August 31, | ||||
| 2011 | 2010 | |||
| Operations ($): | ||||
| Investment income—net | 71,894,561 | 78,181,727 | ||
| Net realized gain (loss) on investments | (28,018,125) | (2,355,749) | ||
| Net unrealized appreciation | ||||
| (depreciation) on investments | (29,580,753) | 91,766,516 | ||
| Net Increase (Decrease) in Net Assets | ||||
| Resulting from Operations | 14,295,683 | 167,592,494 | ||
| Dividends to Shareholders from ($): | ||||
| Investment income—net | (71,474,403) | (77,828,461) | ||
| Capital Stock Transactions ($): | ||||
| Net proceeds from shares sold | 106,351,417 | 79,059,679 | ||
| Dividends reinvested | 49,413,066 | 53,797,493 | ||
| Cost of shares redeemed | (254,747,288) | (163,043,808) | ||
| Increase (Decrease) in Net Assets | ||||
| from Capital Stock Transactions | (98,982,805) | (30,186,636) | ||
| Total Increase (Decrease) in Net Assets | (156,161,525) | 59,577,397 | ||
| Net Assets ($): | ||||
| Beginning of Period | 1,816,568,024 | 1,756,990,627 | ||
| End of Period | 1,660,406,499 | 1,816,568,024 | ||
| Capital Share Transactions (Shares): | ||||
| Shares sold | 9,608,038 | 7,022,963 | ||
| Shares issued for dividends reinvested | 4,479,756 | 4,768,057 | ||
| Shares redeemed | (23,206,797) | (14,483,616) | ||
| Net Increase (Decrease) in Shares Outstanding | (9,119,003) | (2,692,596) | ||
| See notes to financial statements. | ||||
30
FINANCIAL HIGHLIGHTS
The following table describes the performance for the fiscal periods indicated. Total return shows how much your investment in the fund would have increased (or decreased) during each period, assuming you had reinvested all dividends and distributions.These figures have been derived from the fund’s financial statements.
| Year Ended August 31, | ||||||||||
| 2011 | 2010 | 2009 | 2008 | 2007 | ||||||
| Per Share Data ($): | ||||||||||
| Net asset value, | ||||||||||
| beginning of period | 11.58 | 11.01 | 11.19 | 11.50 | 11.86 | |||||
| Investment Operations: | ||||||||||
| Investment income—neta | .48 | .49 | .52 | .52 | .51 | |||||
| Net realized and unrealized | ||||||||||
| gain (loss) on investments | (.35) | .57 | (.18 | ) | (.31 | ) | (.36 | ) | ||
| Total from Investment Operations | .13 | 1.06 | .34 | .21 | .15 | |||||
| Distributions: | ||||||||||
| Dividends from | ||||||||||
| investment income—net | (.47) | (.49) | (.52 | ) | (.52 | ) | (.51 | ) | ||
| Net asset value, end of period | 11.24 | 11.58 | 11.01 | 11.19 | 11.50 | |||||
| Total Return (%) | 1.30 | 9.86 | 3.44 | 1.74 | 1.21 | |||||
| Ratios/Supplemental Data (%): | ||||||||||
| Ratio of total expenses | ||||||||||
| to average net assets | .75 | .74 | .76 | .80 | .89 | |||||
| Ratio of net expenses | ||||||||||
| to average net assets | .75 | .74 | .76 | .80 | .89 | |||||
| Ratio of interest and expense related | ||||||||||
| to floating rate notes issued | ||||||||||
| to average net assets | .01 | .01 | .03 | .08 | .16 | |||||
| Ratio of net investment income | ||||||||||
| to average net assets | 4.30 | 4.39 | 4.91 | 4.56 | 4.31 | |||||
| Portfolio Turnover Rate | 24.24 | 19.86 | 23.28 | 37.04 | 40.26 | |||||
| Net Assets, end of period | ||||||||||
| ($ x 1,000) | 1,660,406 | 1,816,568 | 1,756,991 | 1,843,865 | 1,957,630 | |||||
| a Based on average shares outstanding at each month end. | ||||||||||
| See notes to financial statements. | ||||||||||
| The Fund | 31 |
NOTES TO FINANCIAL STATEMENTS
NOTE 1—Significant Accounting Policies:
Dreyfus Municipal Bond Fund (the “fund”) is the sole series comprising Dreyfus Bond Funds, Inc. (the “Company”), which is registered under the Investment Company Act of 1940, as amended (the “Act”), as a diversified open-end management investment company.The fund’s investment objective is to seek as high a level of current income exempt from federal income tax as is consistent with the preservation of capital. The Dreyfus Corporation (the “Manager” or “Dreyfus”), a wholly-owned subsidiary of The Bank of New York Mellon Corporation (“BNY Mellon”), serves as the fund’s investment adviser. MBSC Securities Corporation (the “Distributor”), a wholly-owned subsidiary of the Manager, is the distributor of the fund’s shares which are sold to the public without a sales charge.
The Financial Accounting Standards Board (“FASB”) Accounting Standards Codification (“ASC”) is the exclusive reference of authoritative U.S. generally accepted accounting principles (“GAAP”) recognized by the FASB to be applied by nongovernmental entities. Rules and interpretive releases of the Securities and Exchange Commission (“SEC”) under authority of federal laws are also sources of authoritative GAAP for SEC registrants. The fund’s financial statements are prepared in accordance with GAAP, which may require the use of management estimates and assumptions.Actual results could differ from those estimates.
The Company enters into contracts that contain a variety of indemnifications. The fund’s maximum exposure under these arrangements is unknown.The fund does not anticipate recognizing any loss related to these arrangements.
(a) Portfolio valuation: The fair value of a financial instrument is the amount that would be received to sell an asset or paid to transfer a liability in an orderly transaction between market participants at the measurement date (i.e. the exit price). GAAP establishes a fair value hierarchy that prioritizes the inputs of valuation techniques used to measure fair value. This hierarchy gives the highest priority
32
to unadjusted quoted prices in active markets for identical assets or liabilities (Level 1 measurements) and the lowest priority to unobservable inputs (Level 3 measurements).
Additionally, GAAP provides guidance on determining whether the volume and activity in a market has decreased significantly and whether such a decrease in activity results in transactions that are not orderly. GAAP requires enhanced disclosures around valuation inputs and techniques used during annual and interim periods.
Various inputs are used in determining the value of the fund’s investments relating to fair value measurements.These inputs are summarized in the three broad levels listed below:
Level 1—unadjusted quoted prices in active markets for identical investments.
Level 2—other significant observable inputs (including quoted prices for similar investments, interest rates, prepayment speeds, credit risk, etc.).
Level 3—significant unobservable inputs (including the fund’s own assumptions in determining the fair value of investments).
The inputs or methodology used for valuing securities are not necessarily an indication of the risk associated with investing in those securities.
Changes in valuation techniques may result in transfers in or out of an assigned level within the disclosure hierarchy. Valuation techniques used to value the fund’s investments are as follows:
Investments in securities are valued each business day by an independent pricing service (the “Service”) approved by the Board of Directors. Investments for which quoted bid prices are readily available and are representative of the bid side of the market in the judgment of the Service are valued at the mean between the quoted bid prices (as obtained by the Service from dealers in such securities) and asked prices (as calculated by the Service based upon its evaluation of the market for such securities). Other investments (which constitute a
| The Fund | 33 |
NOTES TO FINANCIAL STATEMENTS (continued)
majority of the portfolio securities) are carried at fair value as determined by the Service, based on methods which include consideration of: yields or prices of municipal securities of comparable quality, coupon, maturity and type; indications as to values from dealers; and general market conditions. All preceding securities are categorized as Level 2 in the hierarchy.
When market quotations or official closing prices are not readily available, or are determined not to reflect accurately fair value, such as when the value of a security has been significantly affected by events after the close of the exchange or market on which the security is principally traded (for example, a foreign exchange or market), but before the fund calculates its net asset value, the fund may value these investments at fair value as determined in accordance with the procedures approved by the Board of Directors. Certain factors may be considered when fair valuing investments such as: fundamental analytical data, the nature and duration of restrictions on disposition, an evaluation of the forces that influence the market in which the securities are purchased and sold, and public trading in similar securities of the issuer or comparable issuers.These securities are either categorized as Level 2 or 3 depending on the relevant inputs used.
For restricted securities where observable inputs are limited, assumptions about market activity and risk are used and are categorized as Level 3 in the hierarchy.
The following is a summary of the inputs used as of August 31, 2011 in valuing the fund’s investments:
| Level 2—Other | Level 3— | |||
| Level 1— | Significant | Significant | ||
| Unadjusted | Observable Unobservable | |||
| Quoted Prices | Inputs | Inputs | Total | |
| Assets ($) | ||||
| Investments in Securities: | ||||
| Municipal Bonds | — | 1,645,514,614 | — | 1,645,514,614 |
34
In January 2010, FASB issued Accounting Standards Update (“ASU”) No. 2010-06 “Improving Disclosures about Fair Value Measurements” (“ASU 2010-06”). The portions of ASU 2010-06 which require reporting entities to prepare new disclosures surrounding amounts and reasons for significant transfers in and out of Level 1 and Level 2 fair value measurements as well as inputs and valuation techniques used to measure fair value for both recurring and nonrecurring fair value measurements that fall in either Level 2 or Level 3 have been adopted by the fund. No significant transfers between Level 1 or Level 2 fair value measurements occurred at August 31, 2011.
In May 2011, FASB issued ASU No. 2011-04 “Amendments to Achieve Common Fair Value Measurement and Disclosure Requirements in GAAP and International Financial Reporting Standards (“IFRS”)” (“ASU 2011-04”). ASU 2011-04 includes common requirements for measurement of and disclosure about fair value between GAAP and IFRS. ASU 2011-04 will require reporting entities to disclose the following information for fair value measurements categorized within Level 3 of the fair value hierarchy: quantitative information about the unobservable inputs used in the fair value measurement, the valuation processes used by the reporting entity and a narrative description of the sensitivity of the fair value measurement to changes in unobservable inputs and the interrelationships between those unobservable inputs. In addition, ASU 2011-04 will require reporting entities to make disclosures about amounts and reasons for all transfers in and out of Level 1 and Level 2 fair value measurements.The new and revised disclosures are effective for interim and annual reporting periods beginning after December 15, 2011. At this time, management is evaluating the implications of ASU 2011-04 and its impact on the financial statements.
(b) Securities transactions and investment income: Securities transactions are recorded on a trade date basis. Realized gains and losses from securities transactions are recorded on the identified cost basis. Interest
The Fund 35
NOTES TO FINANCIAL STATEMENTS (continued)
income, adjusted for accretion of discount and amortization of premium on investments, is earned from settlement date and recognized on the accrual basis. Securities purchased or sold on a when-issued or delayed delivery basis may be settled a month or more after the trade date.
(c) Dividends to shareholders: It is the policy of the fund to declare dividends daily from investment income-net. Such dividends are paid monthly. Dividends from net realized capital gains, if any, are normally declared and paid annually, but the fund may make distributions on a more frequent basis to comply with the distribution requirements of the Internal Revenue Code of 1986, as amended (the “Code”).To the extent that net realized capital gains can be offset by capital loss carryovers, it is the policy of the fund not to distribute such gains. Income and capital gain distributions are determined in accordance with income tax regulations, which may differ from GAAP.
(d) Federal income taxes: It is the policy of the fund to continue to qualify as a regulated investment company, which can distribute tax exempt dividends, by complying with the applicable provisions of the Code, and to make distributions of income and net realized capital gain sufficient to relieve it from substantially all federal income and excise taxes.
As of and during the period ended August 31, 2011, the fund did not have any liabilities for any uncertain tax positions.The fund recognizes interest and penalties, if any, related to uncertain tax positions as income tax expense in the Statement of Operations. During the period, the fund did not incur any interest or penalties.
Each of the tax years in the four-year period ended August 31, 2011 remains subject to examination by the Internal Revenue Service and state taxing authorities.
At August 31, 2011, the components of accumulated earnings on a tax basis were as follows: undistributed tax exempt income $912,023, accumulated capital losses $118,832,803 and unrealized appreciation $79,399,824. In addition, the fund had $30,374,206 of capital losses
36
realized after October 31, 2010, which were deferred for tax purposes to the first day of the following fiscal year.
The accumulated capital loss carryover is available for federal income tax purposes to be applied against future net securities profits, if any, realized subsequent to August 31, 2011. If not applied, $49,698,815 of the carryover expires in fiscal 2012, $6,826,077 expires in fiscal 2016, $13,380,265 expires in fiscal 2017 and $48,927,646 expires in fiscal 2018.
The tax character of distributions paid to shareholders during the fiscal periods ended August 31, 2011 and August 31, 2010 were as follows: tax exempt income $71,251,980 and $77,660,294 and ordinary income $222,423 and $168,167, respectively.
During the period ended August 31, 2011, as a result of permanent book to tax differences, primarily due to the tax treatment for amortization adjustments and capital loss carryover expiration, the fund decreased accumulated undistributed investment income-net by $420,158, increased accumulated net realized gain (loss) on investments by $32,852,953 and decreased paid-in capital by $32,432,795. Net assets and net asset value per share were not affected by this reclassification.
NOTE 2—Bank Lines of Credit:
The fund participates with other Dreyfus-managed funds in a $225 million unsecured credit facility led by Citibank, N.A. and a $300 million unsecured credit facility provided by The Bank of New York Mellon, a subsidiary of BNY Mellon and an affiliate of Dreyfus, (each, a “Facility”), each to be utilized primarily for temporary or emergency purposes, including the financing of redemptions. In connection therewith, the fund has agreed to pay its pro rata portion of commitment fees for each Facility. Interest is charged to the fund based on rates determined pursuant to the terms of the respective Facility at the time of borrowing.
| The Fund | 37 |
NOTES TO FINANCIAL STATEMENTS (continued)
The average amount of borrowings outstanding under the Facilities during the period ended August 31, 2011 was approximately $20,800, with a related weighted average annualized interest rate of 1.43%.
NOTE 3—Management Fee and Other Transactions with Affiliates:
(a) Pursuant to a management agreement with the Manager, the management fee is computed at the annual rate of .60% of the value of the fund’s average daily net assets and is payable monthly.
(b) Under the Shareholder Services Plan, the fund reimburses the Distributor an amount not to exceed an annual rate of .25% of the value of the fund’s average daily net assets for certain allocated expenses of providing personal services and/or maintaining shareholder accounts. The services provided may include personal services relating to shareholder accounts, such as answering shareholder inquiries regarding the fund and providing reports and other information, and services related to the maintenance of shareholder accounts. During the period ended August 31, 2011, the fund was charged $1,042,241 pursuant to the Shareholder Services Plan.
The fund compensates Dreyfus Transfer, Inc., a wholly-owned subsidiary of the Manager, under a transfer agency agreement for providing personnel and facilities to perform transfer agency services for the fund. During the period ended August 31, 2011, the fund was charged $515,325 pursuant to the transfer agency agreement, which is included in Shareholder servicing costs in the Statement of Operations.
The fund has arrangements with the custodian and cash management bank whereby the fund may receive earnings credits when positive cash balances are maintained, which are used to offset custody and cash management fees. For financial reporting purposes, the fund includes net earnings credits as an expense offset in the Statement of Operations.
The fund compensates The Bank of New York Mellon under a cash management agreement for performing cash management services related to fund subscriptions and redemptions. During the period ended August 31, 2011, the fund was charged $55,532 pursuant to the
38
cash management agreement, which is included in Shareholder servicing costs in the Statement of Operations.These fees were partially offset by earnings credits of $2,536.
The fund also compensates The Bank of New York Mellon under a custody agreement for providing custodial services for the fund. During the period ended August 31, 2011, the fund was charged $96,183 pursuant to the custody agreement.
During the period ended August 31, 2011, the fund was charged $7,225 for services performed by the Chief Compliance Officer.
The components of “Due to The Dreyfus Corporation and affiliates” in the Statement of Assets and Liabilities consist of: management fees $843,072, custodian fees $23,714, chief compliance officer fees $3,253 and transfer agency per account fees $80,363.
(c) Each Board member also serves as a Board member of other funds within the Dreyfus complex. Annual retainer fees and attendance fees are allocated to each fund based on net assets.
NOTE 4—Securities Transactions:
The aggregate amount of purchases and sales of investment securities, excluding short-term securities, during the period ended August 31, 2011, amounted to $400,218,539 and $496,860,448, respectively.
Inverse Floater Securities: The fund participates in secondary inverse floater structures in which fixed-rate, tax-exempt municipal bonds purchased by the fund are transferred to a trust.The trust subsequently issues two or more variable rate securities that are collateralized by the cash flows of the fixed-rate, tax-exempt municipal bonds. One or more of these variable rate securities pays interest based on a short-term floating rate set by a remarketing agent at predetermined intervals. A residual interest tax-exempt security is also created by the trust, which is transferred to the fund, and is paid interest based on the remaining cash flow of the trust, after payment of interest on the other securities and various expenses of the trust.
| The Fund | 39 |
NOTES TO FINANCIAL STATEMENTS (continued)
The fund accounts for the transfer of bonds to the trust as secured borrowings, with the securities transferred remaining in the fund’s investments, and the related floating rate certificate securities reflected as fund liabilities in the Statement of Assets and Liabilities.
The average amount of borrowings outstanding under the inverse floater structure during the period ended August 31, 2011, was approximately $12,500,000, with a related weighted average annualized interest rate of .91%.
At August 31, 2011, the cost of investments for federal income tax purposes was $1,553,614,790; accordingly, accumulated net unrealized appreciation on investments was $79,399,824, consisting of $93,149,771 gross unrealized appreciation and $13,749,947 gross unrealized depreciation.
40
REPORT OF INDEPENDENT REGISTERED
PUBLIC ACCOUNTING FIRM
Shareholders and Board of Directors
Dreyfus Municipal Bond Fund
We have audited the accompanying statement of assets and liabilities, including the statement of investments, of Dreyfus Municipal Bond Fund (the sole series comprising Dreyfus Bond Funds, Inc.) as of August 31, 2011, and the related statement of operations for the year then ended, the statement of changes in net assets for each of the two years in the period then ended and financial highlights for each of the years indicated therein.These financial statements and financial highlights are the responsibility of the Fund’s management. Our responsibility is to express an opinion on these financial statements and financial highlights based on our audits.
We conducted our audits in accordance with the standards of the Public Company Accounting Oversight Board (United States).Those standards require that we plan and perform the audit to obtain reasonable assurance about whether the financial statements and financial highlights are free of material misstatement.We were not engaged to perform an audit of the Fund’s internal control over financial reporting. Our audits included consideration of internal control over financial reporting as a basis for designing audit procedures that are appropriate in the circumstances, but not for the purpose of expressing an opinion on the effectiveness of the Fund’s internal control over financial reporting. Accordingly, we express no such opinion.An audit also includes examining, on a test basis, evidence supporting the amounts and disclosures in the financial statements and financial highlights, assessing the accounting principles used and significant estimates made by management, and evaluating the overall financial statement presentation. Our procedures included confirmation of securities owned as of August 31, 2011 by correspondence with the custodian and others.We believe that our audits provide a reasonable basis for our opinion.
In our opinion, the financial statements and financial highlights referred to above present fairly, in all material respects, the financial position of Dreyfus Municipal Bond Fund at August 31, 2011, the results of its operations for the year then ended, the changes in its net assets for each of the two years in the period then ended, and the financial highlights for each of the indicated years, in conformity with U.S. generally accepted accounting principles.

New York, New York
October 27, 2011
The Fund 41
IMPORTANT TAX INFORMATION (Unaudited)
In accordance with federal tax law, the fund hereby designates all the dividends paid from investment income-net as “exempt-interest dividends” (not generally subject to regular federal income tax), except $222,423 that is being designated as an ordinary income distribution for reporting purposes.Where required by federal tax law rules, shareholders will receive notification of their portion of the fund’s taxable ordinary dividends (if any) and capital gains distributions (if any) paid for the 2011 calendar year on Form 1099-DIV and their portion of the fund’s tax-exempt dividends paid for the 2011 calendar year on Form 1099-INT, both of which will be mailed in early 2012.
42
OFFICERS OF THE FUND (Unaudited)
BRADLEY J. SKAPYAK, President since January 2010.
Chief Operating Officer and a director of the Manager since June 2009. From April 2003 to June 2009, Mr. Skapyak was the head of the Investment Accounting and Support Department of the Manager. He is an officer of 75 investment companies (comprised of 167 portfolios) managed by the Manager. He is 52 years old and has been an employee of the Manager since February 1988.
MICHAEL A. ROSENBERG, Vice President and Secretary since August 2005.
Assistant General Counsel of BNY Mellon, and an officer of 76 investment companies (comprised of 192 portfolios) managed by the Manager. He is 51 years old and has been an employee of the Manager since October 1991.
KIESHA ASTWOOD, Vice President and Assistant Secretary since January 2010.
Counsel of BNY Mellon, and an officer of 76 investment companies (comprised of 192 portfolios) managed by the Manager. She is 38 years old and has been an employee of the Manager since July 1995.
JAMES BITETTO, Vice President and Assistant Secretary since August 2005.
Senior Counsel of BNY Mellon and Secretary of the Manager, and an officer of 76 investment companies (comprised of 192 portfolios) managed by the Manager. He is 45 years old and has been an employee of the Manager since December 1996.
JONI LACKS CHARATAN, Vice President and Assistant Secretary since August 2005.
Senior Counsel of BNY Mellon, and an officer of 76 investment companies (comprised of 192 portfolios) managed by the Manager. She is 55 years old and has been an employee of the Manager since October 1988.
JOSEPH M. CHIOFFI, Vice President and Assistant Secretary since August 2005.
Senior Counsel of BNY Mellon, and an officer of 76 investment companies (comprised of 192 portfolios) managed by the Manager. He is 49 years old and has been an employee of the Manager since June 2000.
KATHLEEN DENICHOLAS, Vice President and Assistant Secretary since January 2010.
Managing Counsel of BNY Mellon, and an officer of 76 investment companies (comprised of 192 portfolios) managed by the Manager. She is 36 years old and has been an employee of the Manager since February 2001.
JANETTE E. FARRAGHER, Vice President and Assistant Secretary since August 2005.
Assistant General Counsel of BNY Mellon, and an officer of 76 investment companies (comprised of 192 portfolios) managed by the Manager. She is 48 years old and has been an employee of the Manager since February 1984.
JOHN B. HAMMALIAN, Vice President and Assistant Secretary since August 2005.
Senior Managing Counsel of BNY Mellon, and an officer of 76 investment companies (comprised of 192 portfolios) managed by the Manager. He is 48 years old and has been an employee of the Manager since February 1991.
M. CRISTINA MEISER, Vice President and Assistant Secretary since January 2010.
Senior Counsel of BNY Mellon, and an officer of 76 investment companies (comprised of 192 portfolios) managed by the Manager. She is 41 years old and has been an employee of the Manager since August 2001.
46
ROBERT R. MULLERY, Vice President and Assistant Secretary since August 2005.
Managing Counsel of BNY Mellon, and an officer of 76 investment companies (comprised of 192 portfolios) managed by the Manager. He is 59 years old and has been an employee of the Manager since May 1986.
JEFF PRUSNOFSKY, Vice President and Assistant Secretary since August 2005.
Senior Managing Counsel of BNY Mellon, and an officer of 76 investment companies (comprised of 192 portfolios) managed by the Manager. He is 46 years old and has been an employee of the Manager since October 1990.
JAMES WINDELS, Treasurer since November 2001.
Director – Mutual Fund Accounting of the Manager, and an officer of 76 investment companies (comprised of 192 portfolios) managed by the Manager. He is 52 years old and has been an employee of the Manager since April 1985.
RICHARD CASSARO, Assistant Treasurer since January 2008.
Senior Accounting Manager – Money Market and Municipal Bond Funds of the Manager, and an officer of 76 investment companies (comprised of 192 portfolios) managed by the Manager. He is 52 years old and has been an employee of the Manager since September 1982.
GAVIN C. REILLY, Assistant Treasurer since December 2005.
Tax Manager of the Investment Accounting and Support Department of the Manager, and an officer of 76 investment companies (comprised of 192 portfolios) managed by the Manager. He is 43 years old and has been an employee of the Manager since April 1991.
ROBERT ROBOL, Assistant Treasurer since August 2005.
Senior Accounting Manager – Fixed Income Funds of the Manager, and an officer of 76 investment companies (comprised of 192 portfolios) managed by the Manager. He is 47 years old and has been an employee of the Manager since October 1988.
ROBERT SALVIOLO, Assistant Treasurer since July 2007.
Senior Accounting Manager – Equity Funds of the Manager, and an officer of 76 investment companies (comprised of 192 portfolios) managed by the Manager. He is 44 years old and has been an employee of the Manager since June 1989.
ROBERT SVAGNA, Assistant Treasurer since August 2005.
Senior Accounting Manager – Equity Funds of the Manager, and an officer of 76 investment companies (comprised of 192 portfolios) managed by the Manager. He is 44 years old and has been an employee of the Manager since November 1990.
| The Fund | 47 |
OFFICERS OF THE FUND (Unaudited) (continued)
JOSEPH W. CONNOLLY, Chief Compliance Officer since October 2004.
Chief Compliance Officer of the Manager and The Dreyfus Family of Funds (76 investment companies, comprised of 192 portfolios). From November 2001 through March 2004, Mr. Connolly was first Vice-President, Mutual Fund Servicing for Mellon Global Securities Services. In that capacity, Mr. Connolly was responsible for managing Mellon’s Custody, Fund Accounting and Fund Administration services to third-party mutual fund clients. He is 54 years old and has served in various capacities with the Manager since 1980, including manager of the firm’s Fund Accounting Department from 1997 through October 2001.
STEPHEN J. STOREN, Anti-Money Laundering Compliance Officer since May 2011.
Chief Compliance Officer of the Distributor, and the Anti-Money Laundering Compliance Officer of 72 investment companies (comprised of 188 portfolios) managed by the Manager. He is 56 years old and has been an employee of the Distributor since October 1999.
48

Item 2. Code of Ethics.
The Registrant has adopted a code of ethics that applies to the Registrant's principal executive officer, principal financial officer, principal accounting officer or controller, or persons performing similar functions. There have been no amendments to, or waivers in connection with, the Code of Ethics during the period covered by this Report.
Item 3. Audit Committee Financial Expert.
The Registrant's Board has determined that Ehud Houminer, a member of the Audit Committee of the Board, is an audit committee financial expert as defined by the Securities and Exchange Commission (the "SEC"). Ehud Houminer is "independent" as defined by the SEC for purposes of audit committee financial expert determinations.
Item 4. Principal Accountant Fees and Services.
(a) Audit Fees. The aggregate fees billed for each of the last two fiscal years (the "Reporting Periods") for professional services rendered by the Registrant's principal accountant (the "Auditor") for the audit of the Registrant's annual financial statements or services that are normally provided by the Auditor in connection with the statutory and regulatory filings or engagements for the Reporting Periods, were $46,596 in 2010 and $30,312 in 2011.
(b) Audit-Related Fees. The aggregate fees billed in the Reporting Periods for assurance and related services by the Auditor that are reasonably related to the performance of the audit of the Registrant's financial statements and are not reported under paragraph (a) of this Item 4 were $5,382 in 2010 and $6,000 in 2011. These services consisted of one or more of the following: (i) agreed upon procedures related to compliance with Internal Revenue Code section 817(h), (ii) security counts required by Rule 17f-2 under the Investment Company Act of 1940, as amended, (iii) advisory services as to the accounting or disclosure treatment of Registrant transactions or events and (iv) advisory services to the accounting or disclosure treatment of the actual or potential impact to the Registrant of final or proposed rules, standards or interpretations by the Securities and Exchange Commission, the Financial Accounting Standards Boards or other regulatory or standard-setting bodies.
The aggregate fees billed in the Reporting Periods for non-audit assurance and related services by the Auditor to the Registrant's investment adviser (not including any sub-investment adviser whose role is primarily portfolio management and is subcontracted with or overseen by another investment adviser), and any entity controlling, controlled by or under common control with the investment adviser that provides ongoing services to the Registrant ("Service Affiliates"), that were reasonably related to the performance of the annual audit of the Service Affiliate, which required pre-approval by the Audit Committee were $ 0 in 2010 and $0 in 2011.
(c) Tax Fees. The aggregate fees billed in the Reporting Periods for professional services rendered by the Auditor for tax compliance, tax advice, and tax planning ("Tax Services") were $3,350 in 2010 and $3,098 in 2011. These services consisted of: (i) review or preparation of U.S. federal, state, local and excise tax returns; (ii) U.S. federal, state and local tax planning, advice and assistance regarding statutory, regulatory or administrative developments; and (iii) tax advice regarding tax qualification matters and/or treatment of various financial instruments held or proposed to be acquired or held. The aggregate fees billed in the Reporting Periods for Tax Services by the Auditor to Service Affiliates, which required pre-approval by the Audit Committee were $0 in 2010 and $0 in 2011.
(d) All Other Fees. The aggregate fees billed in the Reporting Periods for products and services provided by the Auditor, other than the services reported in paragraphs (a) through (c) of this Item, were $667 in 2010 and $507 in 2011. [These services consisted of a review of the Registrant's anti-money laundering program].
The aggregate fees billed in the Reporting Periods for Non-Audit Services by the Auditor to Service Affiliates, other than the services reported in paragraphs (b) through (c) of this Item, which required pre-approval by the Audit Committee, were $0 in 2010 and $0 in 2011.
(e)(1) Audit Committee Pre-Approval Policies and Procedures. The Registrant's Audit Committee has established policies and procedures (the "Policy") for pre-approval (within specified fee limits) of the Auditor's engagements for non-audit services to the Registrant and Service Affiliates without specific case-by-case consideration. The pre-approved services in the Policy can include pre-approved audit services, pre-approved audit-related services, pre-approved tax services and pre-approved all other services. Pre-approval considerations include whether the proposed services are compatible with maintaining the Auditor's independence. Pre-approvals pursuant to the Policy are considered annually.
(e)(2) Note: None of the services described in paragraphs (b) through (d) of this Item 4 were approved by the Audit Committee pursuant to paragraph (c)(7)(i)(C) of Rule 2-01 of Regulation S-X.
(f) None of the hours expended on the principal accountant's engagement to audit the registrant's financial statements for the most recent fiscal year were attributed to work performed by persons other than the principal account's full-time, permanent employees.
Non-Audit Fees. The aggregate non-audit fees billed by the Auditor for services rendered to the Registrant, and rendered to Service Affiliates, for the Reporting Periods were $28,173,266 in 2010 and $16,103,335 in 2011.
Auditor Independence. The Registrant's Audit Committee has considered whether the provision of non-audit services that were rendered to Service Affiliates, which were not pre-approved (not requiring pre-approval), is compatible with maintaining the Auditor's independence.
Item 5. Audit Committee of Listed Registrants.
Not applicable. [CLOSED-END FUNDS ONLY]
Item 6. Investments.
(a) Not applicable.
Item 7. Disclosure of Proxy Voting Policies and Procedures for Closed-End Management Investment Companies.
Not applicable. [CLOSED-END FUNDS ONLY]
Item 8. Portfolio Managers of Closed-End Management Investment Companies.
Not applicable. [CLOSED-END FUNDS ONLY, beginning with reports for periods ended on and after December 31, 2005]
Item 9. Purchases of Equity Securities by Closed-End Management Investment Companies and Affiliated Purchasers.
Not applicable. [CLOSED-END FUNDS ONLY]
Item 10. Submission of Matters to a Vote of Security Holders.
There have been no material changes to the procedures applicable to Item 10.
Item 11. Controls and Procedures.
(a) The Registrant's principal executive and principal financial officers have concluded, based on their evaluation of the Registrant's disclosure controls and procedures as of a date within 90 days of the filing date of this report, that the Registrant's disclosure controls and procedures are reasonably designed to ensure that information required to be disclosed by the Registrant on Form N-CSR is recorded, processed, summarized and reported within the required time periods and that information required to be disclosed by the Registrant in the reports that it files or submits on Form N-CSR is accumulated and communicated to the Registrant's management, including its principal executive and principal financial officers, as appropriate to allow timely decisions regarding required disclosure.
(b) There were no changes to the Registrant's internal control over financial reporting that occurred during the second fiscal quarter of the period covered by this report that have materially affected, or are reasonably likely to materially affect, the Registrant's internal control over financial reporting.
Item 12. Exhibits.
(a)(1) Code of ethics referred to in Item 2.
(a)(2) Certifications of principal executive and principal financial officers as required by Rule 30a-2(a) under the Investment Company Act of 1940.
(a)(3) Not applicable.
(b) Certification of principal executive and principal financial officers as required by Rule 30a-2(b) under the Investment Company Act of 1940.
SIGNATURES
Pursuant to the requirements of the Securities Exchange Act of 1934 and the Investment Company Act of 1940, the Registrant has duly caused this Report to be signed on its behalf by the undersigned, thereunto duly authorized.
Dreyfus Bond Funds, Inc.
By: /s/ Bradley J. Skapyak | |
Bradley J. Skapyak, President
| |
Date: | October 24, 2011 |
| |
Pursuant to the requirements of the Securities Exchange Act of 1934 and the Investment Company Act of 1940, this Report has been signed below by the following persons on behalf of the Registrant and in the capacities and on the dates indicated. | |
| |
By: /s/ Bradley J. Skapyak | |
Bradley J. Skapyak, President
| |
Date: | October 24, 2011 |
| |
By: /s/ James Windels | |
James Windels, Treasurer
| |
Date: | October 24, 2011 |
| |
EXHIBIT INDEX
(a)(1) Code of ethics referred to in Item 2.
(a)(2) Certifications of principal executive and principal financial officers as required by Rule 30a-2(a) under the Investment Company Act of 1940. (EX-99.CERT)
(b) Certification of principal executive and principal financial officers as required by Rule 30a-2(b) under the Investment Company Act of 1940. (EX-99.906CERT)