UNITED STATES
SECURITIES AND EXCHANGE COMMISSION
Washington, D.C. 20549
FORM N-CSR
CERTIFIED SHAREHOLDER REPORT OF REGISTERED MANAGEMENT
INVESTMENT COMPANIES
Investment Company Act file number | 811-2653 | |||||
|
| |||||
| Dreyfus Bond Funds, Inc. |
| ||||
| (Exact name of Registrant as specified in charter) |
| ||||
|
|
| ||||
|
c/o The Dreyfus Corporation 200 Park Avenue New York, New York 10166 |
| ||||
| (Address of principal executive offices) (Zip code) |
| ||||
|
|
| ||||
| Janette E. Farragher, Esq. 200 Park Avenue New York, New York 10166 |
| ||||
| (Name and address of agent for service) |
| ||||
| ||||||
Registrant's telephone number, including area code: | (212) 922-6000 | |||||
|
| |||||
Date of fiscal year end:
| 8/31 |
| ||||
Date of reporting period: | 8/31/12 |
| ||||
Dreyfus
Municipal Bond Fund
ANNUAL REPORT August 31, 2012
Save time. Save paper. View your next shareholder report online as soon as it’s available. Log into www.dreyfus.com and sign up for Dreyfus eCommunications. It’s simple and only takes a few minutes.
The views expressed in this report reflect those of the portfolio manager only through the end of the period covered and do not necessarily represent the views of Dreyfus or any other person in the Dreyfus organization. Any such views are subject to change at any time based upon market or other conditions and Dreyfus disclaims any responsibility to update such views.These views may not be relied on as investment advice and, because investment decisions for a Dreyfus fund are based on numerous factors, may not be relied on as an indication of trading intent on behalf of any Dreyfus fund.
Not FDIC-Insured • Not Bank-Guaranteed • May Lose Value
| Contents | |
| THE FUND | |
| 2 | A Letter from the Chairman and CEO |
| 3 | Discussion of Fund Performance |
| 6 | Fund Performance |
| 7 | Understanding Your Fund’s Expenses |
| 7 | Comparing Your Fund’s Expenses |
| With Those of Other Funds | |
| 8 | Statement of Investments |
| 30 | Statement of Assets and Liabilities |
| 31 | Statement of Operations |
| 32 | Statement of Changes in Net Assets |
| 33 | Financial Highlights |
| 34 | Notes to Financial Statements |
| 46 | Report of Independent Registered |
| Public Accounting Firm | |
| 47 | Important Tax Information |
| 48 | Board Members Information |
| 51 | Officers of the Fund |
| FOR MORE INFORMATION | |
| Back Cover | |
Dreyfus
Municipal Bond Fund
The Fund

A LETTER FROM THE CHAIRMAN AND CEO
Dear Shareholder:
We are pleased to present this annual report for Dreyfus Municipal Bond Fund, covering the 12-month period from September 1, 2011, through August 31, 2012. For information about how the fund performed during the reporting period, as well as general market perspectives, we provide a Discussion of Fund Performance on the pages that follow.
The municipal bond market exhibited heightened volatility over the past year as prices rose and fell according to supply-and-demand factors and investors’ changing expectations of global and domestic economic conditions. While monthly variations in economic data have been pronounced, the longer-term pace of U.S. economic growth has been relatively consistent at about half the average rate achieved in prior recoveries. Even U.S. employment numbers, which have been volatile over short periods, averaged slightly better than 150,000 new jobs a month so far in 2012, roughly unchanged from the monthly average in 2011.
The sustained but subpar U.S. expansion appears likely to continue over the foreseeable future. On one hand, the economy has responded to a variety of stimulative measures, most notably an aggressively accommodative monetary policy. On the other hand, the prospect of automatic spending cuts and tax hikes scheduled for the end of 2012 has weighed on economic growth by contributing to a temporary postponement of spending decisions among consumers and businesses. Indeed, the ability of the U.S. political system to address both this “fiscal cliff” and long-term deficit reduction could go a long way toward shaping the 2013 market environment. As always, we urge you to speak regularly with your financial advisor to discuss how changing economic conditions may affect your investments.
Thank you for your continued confidence and support.

Jonathan R. Baum
Chairman and Chief Executive Officer
The Dreyfus Corporation
September 17, 2012
2

DISCUSSION OF FUND PERFORMANCE
For the period of September 1, 2011, through August 31, 2012, as provided by Daniel Marques and Daniel Rabasco, Primary Portfolio Managers
Fund and Market Performance Overview
For the 12-month period ended August 31, 2012, Dreyfus Municipal Bond Fund achieved a total return of 9.76%.1 In comparison, the fund’s benchmark, the Barclays Municipal Bond Index (the “Index”), produced a total return of 8.78%.2
Falling long-term interest rates and favorable supply-and-demand dynamics supported municipal bond prices throughout the reporting period.The fund achieved higher returns than its benchmark, mainly due to its emphasis on revenue-backed bonds over their general obligation counterparts.
The Fund’s Investment Approach
The fund seeks to maximize current income exempt from federal income tax, to the extent consistent with the preservation of capital.
To pursue this goal, the fund normally invests substantially all of its net assets in municipal bonds that provide income exempt from federal income tax.The fund will invest at least 75% of its assets in municipal bonds rated A or better or the unrated equivalent as determined by Dreyfus. The fund may invest up to 25% of its assets in municipal bonds rated below A or the unrated equivalent as determined by Dreyfus, including bonds rated below investment-grade quality (“high yield” or “junk” bonds).The dollar-weighted average maturity of the fund’s portfolio is not restricted, but normally exceeds 10 years.
We focus on identifying undervalued sectors and securities and minimize the use of interest rate forecasting. The portfolio managers select municipal bonds for the fund’s portfolio by:
Using fundamental credit analysis to estimate the relative value and attractiveness of various sectors and securities and to exploit pricing inefficiencies in the municipal bond market;
Actively trading among various sectors, such as pre-refunded, gen- eral obligation and revenue, based on their apparent relative values.
The fund seeks to invest in several of these sectors.
The Fund 3
DISCUSSION OF FUND PERFORMANCE (continued)
Supply-and-Demand Dynamics Supported Municipal Bonds
Although macroeconomic concerns in September 2011 and the spring of 2012 sparked heightened volatility in most financial markets, municipal bonds generally remained strong throughout the reporting period, in part due to falling long-term interest rates stemming from quantitative easing and other stimulative measures by the Federal Reserve Board.
Municipal bond prices also responded positively to robust demand as investors sought competitive levels of after-tax income in a low interest-rate environment. Meanwhile, new issuance volumes remained relatively low when political pressure led to less borrowing for capital projects, and municipalities primarily issued new bonds to refinance older debt, resulting in a net decrease in the supply of tax-exempt securities. In this constructive environment, lower-rated and longer maturity municipal bonds that had been punished earlier in 2011 led the market higher, while highly rated and shorter-term securities generally lagged market averages.
From a credit-quality perspective, a number of state governments have taken the difficult steps necessary to reduce or eliminate budget deficits, and a few have achieved surpluses. Although the market encountered scattered credit defaults in some localities during the reporting period, we believe they are isolated cases in which the problems leading to insolvency are specific to each issuer.
Credit Selections Buoyed Relative Performance
The fund benefited during the reporting period from its focus on higher yielding revenue-backed municipal bonds and a corresponding de-emphasis on lower yielding general obligation bonds. The fund received especially robust contributions to relative performance from overweighted exposure to municipal bonds backed by revenues from hospitals, airports, industrial development projects, and the states’ settlement of litigation with U.S. tobacco companies. Moreover, we maintained overweighted exposure to bonds with credit ratings toward the lower end of the investment-grade range, which performed better than market averages during the reporting period.
The fund’s performance also was helped by a slightly long duration posture as we favored municipal bonds with maturities from 15 to 25 years at a time when yields fell at the longer end of the market’s maturity
4
spectrum. We also successfully used interest-rate swap contracts to capture the benefits of changing yield differences between municipal bonds and other fixed-income instruments.
Disappointments during the reporting period were relatively limited, concentrated mainly among higher quality, lower yielding market segments, such as escrowed municipal bonds and higher-rated securities backed by revenues from essential municipal services.
Adjusting to Richer Valuations
We have been encouraged by recently improved data, but the U.S. economy remains vulnerable to unexpected shocks and uncertainty regarding future fiscal policies. In addition, higher yielding and longer-maturity bonds have become more richly valued after recent rallies. Consequently, while we have continued to favor revenue-backed municipal bonds over their general obligation counterparts, we have increased the fund’s holdings of high-quality securities from some of the market’s more widely traded issuers, which we regard as a readily available source of funds to invest in new opportunities as they arise.
September 17, 2012
Bond funds are subject generally to interest rate, credit, liquidity and market risks, to varying
degrees, all of which are more fully described in the fund’s prospectus. Generally, all other factors
being equal, bond prices are inversely related to interest-rate changes, and rate increases can cause
price declines. High yield bonds involve increased credit and liquidity risk compared with
investment grade bonds and are considered speculative in terms of the issuer’s ability to pay
interest and repay principal on a timely basis.
The use of derivatives involves risks different from, or possibly greater than, the risks associated
with investing directly in the underlying assets. Derivatives can be highly volatile, illiquid, and
difficult to value and there is the risk that changes in the value of a derivative held by the fund
will not correlate with the underlying instruments or the fund’s other investments.
1 Total return includes reinvestment of dividends and any capital gains paid. Past performance is no
guarantee of future results. Share price, yield and investment return fluctuate such that upon
redemption, fund shares may be worth more or less than their original cost. Income may be subject
to state and local taxes, and some income may be subject to the federal alternative minimum tax
(AMT) for certain investors. Capital gains, if any, are fully taxable.
2 SOURCE: LIPPER INC. — Reflects reinvestment of dividends and, where applicable, capital
gain distributions.The Barclays Municipal Bond Index is a widely accepted, unmanaged total
return performance benchmark for the long-term, investment-grade, tax-exempt bond market.
Index returns do not reflect fees and expenses associated with operating a mutual fund. Investors
cannot invest directly in any index.
The Fund 5
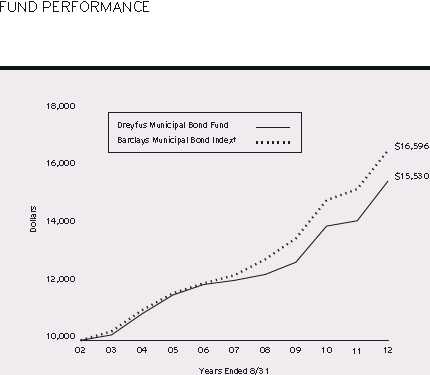
Comparison of change in value of $10,000 investment in Dreyfus Municipal Bond Fund and the Barclays Municipal Bond Index
| Average Annual Total Returns as of 8/31/12 | ||||||
| 1Year | 5 Years | 10 Years | ||||
| Fund | 9.76% | 5.15% | 4.50% | |||
| Barclays Municipal Bond Index | 8.78% | 6.24% | 5.20% | |||
† Source: Lipper Inc.
Past performance is not predictive of future performance.The fund’s performance shown in the graph and table does not reflect the deduction of taxes that a shareholder would pay on fund distributions or the redemption of fund shares.
The above graph compares a $10,000 investment made in Dreyfus Municipal Bond Fund on 8/31/02 to a $10,000 investment made in the Barclays Municipal Bond Index (the “Index”) on that date.All dividends and capital gain distributions are reinvested.
The fund invests primarily in municipal securities and its performance shown in the line graph takes into account fees and expenses.The Index is an unmanaged total return performance benchmark for the long-term, investment-grade, tax-exempt bond market. Unlike a mutual fund, the Index is not subject to charges, fees and other expenses. Investors cannot invest directly in any index. Further information relating to fund performance, including expense reimbursements, if applicable, is contained in the Financial Highlights section of the prospectus and elsewhere in this report.
6
UNDERSTANDING YOUR FUND’S EXPENSES (Unaudited)
As a mutual fund investor, you pay ongoing expenses, such as management fees and other expenses. Using the information below, you can estimate how these expenses affect your investment and compare them with the expenses of other funds.You also may pay one-time transaction expenses, including sales charges (loads) and redemption fees, which are not shown in this section and would have resulted in higher total expenses. For more information, see your fund’s prospectus or talk to your financial adviser.
Review your fund’s expenses
The table below shows the expenses you would have paid on a $1,000 investment in Dreyfus Municipal Bond Fund from March 1, 2012 to August 31, 2012. It also shows how much a $1,000 investment would be worth at the close of the period, assuming actual returns and expenses.
Expenses and Value of a $1,000 Investment
assuming actual returns for the six months ended August 31, 2012
| Expenses paid per $1,000† | $ | 3.83 |
| Ending value (after expenses) | $ | 1,031.30 |
COMPARING YOUR FUND’S EXPENSES WITH THOSE OF OTHER FUNDS (Unaudited)
Using the SEC’s method to compare expenses
The Securities and Exchange Commission (SEC) has established guidelines to help investors assess fund expenses. Per these guidelines, the table below shows your fund’s expenses based on a $1,000 investment, assuming a hypothetical 5% annualized return. You can use this information to compare the ongoing expenses (but not transaction expenses or total cost) of investing in the fund with those of other funds.All mutual fund shareholder reports will provide this information to help you make this comparison. Please note that you cannot use this information to estimate your actual ending account balance and expenses paid during the period.
Expenses and Value of a $1,000 Investment
assuming a hypothetical 5% annualized return for the six months ended August 31, 2012
| Expenses paid per $1,000† | $ | 3.81 |
| Ending value (after expenses) | $ | 1,021.37 |
† Expenses are equal to the fund’s annualized expense ratio of .75%, multiplied by the average account value over the
period, multiplied by 184/366 (to reflect the one-half year period).
The Fund 7
| STATEMENT OF INVESTMENTS | ||||
| August 31, 2012 | ||||
| Long-Term Municipal | Coupon | Maturity | Principal | |
| Investments—99.2% | Rate (%) | Date | Amount ($) | Value ($) |
| Alabama—.9% | ||||
| Jefferson County, | ||||
| Limited Obligation | ||||
| School Warrants | 5.25 | 1/1/20 | 15,000,000 | 15,012,300 |
| Alaska—.8% | ||||
| Alaska Energy Authority, | ||||
| Power Revenue (Bradley Lake | ||||
| Hydroelectric Project) | ||||
| (Insured; Assured Guaranty | ||||
| Municipal Corp.) | 6.00 | 7/1/17 | 5,730,000 | 6,884,710 |
| Anchorage, | ||||
| Electric Utility Revenue | ||||
| (Insured; National Public | ||||
| Finance Guarantee Corp.) | 6.50 | 12/1/15 | 6,135,000 | 7,225,251 |
| Arizona—1.6% | ||||
| Mohave County Industrial | ||||
| Development Authority, | ||||
| Correctional Facilities | ||||
| Contract Revenue (Mohave | ||||
| Prison, LLC Expansion Project) | 8.00 | 5/1/25 | 9,000,000 | 11,186,010 |
| Pima County Industrial Development | ||||
| Authority, Education Revenue | ||||
| (American Charter Schools | ||||
| Foundation Project) | 5.63 | 7/1/38 | 6,750,000 | 6,393,735 |
| Pima County Industrial Development | ||||
| Authority, IDR (Tucson Electric | ||||
| Power Company Project) | 5.75 | 9/1/29 | 4,815,000 | 5,143,816 |
| Pima County Industrial Development | ||||
| Authority, IDR (Tucson Electric | ||||
| Power Company Project) | 5.25 | 10/1/40 | 4,185,000 | 4,532,606 |
| California—12.5% | ||||
| California, | ||||
| GO (Insured; AMBAC) | 6.00 | 4/1/17 | 6,080,000 | 7,432,678 |
| California, | ||||
| GO (Various Purpose) | 5.63 | 4/1/25 | 3,500,000 | 4,160,765 |
| California, | ||||
| GO (Various Purpose) | 5.75 | 4/1/31 | 18,325,000 | 21,644,574 |
| California, | ||||
| GO (Various Purpose) | 6.50 | 4/1/33 | 15,000,000 | 18,718,950 |
| California, | ||||
| GO (Various Purpose) | 6.00 | 11/1/35 | 14,000,000 | 16,966,040 |
8
| Long-Term Municipal | Coupon | Maturity | Principal | ||
| Investments (continued) | Rate (%) | Date | Amount ($) | Value ($) | |
| California (continued) | |||||
| California Department of Veterans | |||||
| Affairs, Home Purchase Revenue | 5.00 | 12/1/42 | 8,000,000 | 8,210,160 | |
| California Department of Water | |||||
| Resources, Water System | |||||
| Revenue (Central Valley Project) | 5.00 | 12/1/27 | 7,850,000 | 9,256,092 | |
| California Educational Facilities | |||||
| Authority, Revenue (University | |||||
| of Southern California) | 5.25 | 10/1/38 | 4,000,000 | 4,703,240 | |
| California Public Works Board, | |||||
| LR (Department of Mental | |||||
| Health) (Coalinga State Hospital) | 5.13 | 6/1/29 | 2,500,000 | 2,592,625 | |
| California Statewide Communities | |||||
| Development Authority, | |||||
| Revenue (Inland Regional | |||||
| Center Project) | 5.38 | 12/1/37 | 10,325,000 | 10,520,039 | |
| California Statewide Communities | |||||
| Development Authority, Revenue | |||||
| (Kaiser Permanente) | 5.00 | 4/1/42 | 5,525,000 | 6,036,946 | |
| California Statewide Communities | |||||
| Development Authority, Revenue | |||||
| (Sutter Health) | 5.50 | 8/15/26 | 5,000,000 | 5,897,750 | |
| Chula Vista, | |||||
| IDR (San Diego Gas and | |||||
| Electric Company) | 5.50 | 12/1/21 | 11,725,000 | 12,666,400 | |
| Chula Vista, | |||||
| IDR (San Diego Gas and | |||||
| Electric Company) | 5.88 | 2/15/34 | 5,000,000 | 5,877,200 | |
| Coast Community College District, | |||||
| GO (Insured; Assured Guaranty | |||||
| Municipal Corp.) | 0/5.00 | 8/1/29 | 15,000,000 | a | 15,283,200 |
| Golden State Tobacco | |||||
| Securitization Corporation, | |||||
| Tobacco Settlement | |||||
| Asset-Backed Bonds | 4.50 | 6/1/27 | 9,690,000 | 8,384,951 | |
| Los Angeles Unified School | |||||
| District, GO | 5.00 | 7/1/21 | 11,000,000 | 13,604,360 | |
| Modesto Irrigation District, | |||||
| Electric System Revenue | 5.00 | 7/1/21 | 3,515,000 | 4,313,749 | |
| Sacramento County, | |||||
| Airport System Senior Revenue | 5.75 | 7/1/39 | 10,260,000 | 11,697,323 |
The Fund 9
STATEMENT OF INVESTMENTS (continued)
| Long-Term Municipal | Coupon | Maturity | Principal | ||
| Investments (continued) | Rate (%) | Date | Amount ($) | Value ($) | |
| California (continued) | |||||
| San Francisco City and County | |||||
| Airport Commission, Second | |||||
| Series Revenue (San Francisco | |||||
| International Airport) (Issue | |||||
| 34E) (Insured; Assured | |||||
| Guaranty Municipal Corp.) | 5.75 | 5/1/22 | 7,000,000 | 8,221,080 | |
| San Francisco City and County | |||||
| Public Utilities Commission, | |||||
| San Francisco Water Revenue | 5.50 | 11/1/30 | 13,555,000 | 16,614,499 | |
| Colorado—1.4% | |||||
| Colorado Health Facilities | |||||
| Authority, Revenue (Sisters of | |||||
| Charity of Leavenworth | |||||
| Health System) | 5.25 | 1/1/25 | 4,000,000 | 4,618,240 | |
| Colorado Springs, | |||||
| Utilities System Revenue | 5.00 | 11/15/23 | 2,955,000 | 3,655,985 | |
| E-470 Public Highway Authority, | |||||
| Senior Revenue (Insured; | |||||
| National Public Finance | |||||
| Guarantee Corp.) | 0.00 | 9/1/20 | 6,740,000 | b | 4,889,735 |
| University of Colorado Hospital | |||||
| Authority, Revenue | 5.00 | 11/15/37 | 4,000,000 | 4,234,440 | |
| University of Colorado Regents, | |||||
| University Enterprise Revenue | 5.25 | 6/1/36 | 5,000,000 | 5,891,500 | |
| Delaware—.4% | |||||
| Delaware Transportation Authority, | |||||
| Transportation System | |||||
| Senior Revenue | 5.00 | 7/1/26 | 6,245,000 | 7,344,245 | |
| Florida—7.3% | |||||
| Broward County, | |||||
| Port Facilities Revenue | 5.00 | 9/1/22 | 6,000,000 | 6,662,820 | |
| Broward County School Board, | |||||
| COP (Master Lease | |||||
| Purchase Agreement) | 5.00 | 7/1/17 | 5,000,000 | 5,805,250 | |
| Citizens Property Insurance | |||||
| Corporation, Coastal Account | |||||
| Senior Secured Revenue | 5.00 | 6/1/20 | 7,000,000 | 8,098,090 |
10
| Long-Term Municipal | Coupon | Maturity | Principal | ||
| Investments (continued) | Rate (%) | Date | Amount ($) | Value ($) | |
| Florida (continued) | |||||
| Citizens Property Insurance | |||||
| Corporation, High-Risk Account | |||||
| Senior Secured Revenue | 5.25 | 6/1/17 | 10,000,000 | 11,471,700 | |
| Citizens Property Insurance | |||||
| Corporation, High-Risk Account | |||||
| Senior Secured Revenue | 5.50 | 6/1/17 | 6,000,000 | 6,950,700 | |
| Citizens Property Insurance | |||||
| Corporation, Personal Lines | |||||
| Account/Commercial Lines | |||||
| Account Senior Secured Revenue | 5.00 | 6/1/22 | 8,000,000 | 9,342,080 | |
| Florida Board of Education, | |||||
| Public Education Capital | |||||
| Outlay Bonds | 5.00 | 6/1/18 | 5,420,000 | 6,607,088 | |
| Florida Housing Finance | |||||
| Corporation, Homeowner | |||||
| Mortgage Revenue | |||||
| (Collateralized: FHLMC, | |||||
| FNMA and GNMA) | 5.10 | 7/1/31 | 2,685,000 | 2,690,504 | |
| Florida Municipal Power Agency, | |||||
| Revenue (Saint Lucie Project) | 5.00 | 10/1/20 | 4,065,000 | 4,956,373 | |
| Florida State Board of Education, | |||||
| Public Education Capital | |||||
| Outlay Bonds | 5.00 | 6/1/21 | 7,500,000 | 9,440,250 | |
| Highlands County Health Facilities | |||||
| Authority, HR (Adventist | |||||
| Health System/Sunbelt | |||||
| Obligated Group) (Prerefunded) | 5.25 | 11/15/16 | 265,000 | c | 316,378 |
| Miami-Dade County, | |||||
| Aviation Revenue (Miami | |||||
| International Airport) | 5.38 | 10/1/35 | 5,000,000 | 5,721,150 | |
| Miami-Dade County, | |||||
| Water and Sewer | |||||
| System Revenue | 5.00 | 10/1/34 | 5,000,000 | 5,642,150 | |
| Miami-Dade County, | |||||
| Water and Sewer System | |||||
| Revenue (Insured; National | |||||
| Public Finance Guarantee Corp.) | 5.00 | 10/1/26 | 5,000,000 | 5,563,550 |
The Fund 11
STATEMENT OF INVESTMENTS (continued)
| Long-Term Municipal | Coupon | Maturity | Principal | ||
| Investments (continued) | Rate (%) | Date | Amount ($) | Value ($) | |
| Florida (continued) | |||||
| Orlando Utilities Commission, | |||||
| Water and Electric Revenue | 6.75 | 10/1/17 | 13,995,000 | 16,211,528 | |
| Orlando-Orange County Expressway | |||||
| Authority, Revenue | 5.00 | 7/1/35 | 7,000,000 | 7,822,920 | |
| Saint Johns County Industrial | |||||
| Development Authority, Revenue | |||||
| (Presbyterian Retirement | |||||
| Communities Project) | 5.88 | 8/1/40 | 5,000,000 | 5,497,100 | |
| Tampa Bay Water Regional Water | |||||
| Supply Authority, Utility | |||||
| System Improvement Revenue | |||||
| (Insured; National Public | |||||
| Finance Guarantee Corp.) | 6.00 | 10/1/29 | 5,000,000 | 7,005,800 | |
| Georgia—4.4% | |||||
| Atlanta, | |||||
| Water and Wastewater Revenue | 5.00 | 11/1/14 | 5,000,000 | 5,462,250 | |
| Atlanta, | |||||
| Water and Wastewater Revenue | 6.00 | 11/1/26 | 10,000,000 | 12,424,000 | |
| Atlanta, | |||||
| Water and Wastewater Revenue | |||||
| (Insured; Assured Guaranty | |||||
| Municipal Corp.) | 5.25 | 11/1/34 | 3,500,000 | 4,003,090 | |
| DeKalb County, | |||||
| Water and Sewerage Revenue | 5.25 | 10/1/25 | 8,590,000 | 11,161,760 | |
| DeKalb County Hospital Authority, | |||||
| RAC (DeKalb Medical | |||||
| Center, Inc. Project) | 6.00 | 9/1/30 | 13,595,000 | 15,586,124 | |
| Milledgeville and Baldwin County | |||||
| Development Authority, Revenue | |||||
| (Georgia College and State | |||||
| University Foundation Property | |||||
| III, LLC Student Housing | |||||
| System Project) (Prerefunded) | 5.63 | 9/1/14 | 5,100,000 | c | 5,693,028 |
| Municipal Electric Authority of | |||||
| Georgia, GO (Project One | |||||
| Subordinated Bonds) | 5.75 | 1/1/20 | 5,000,000 | 6,044,200 | |
| Municipal Electric Authority of | |||||
| Georgia, GO (Project One | |||||
| Subordinated Bonds) | 5.00 | 1/1/21 | 9,705,000 | 11,767,604 |
12
| Long-Term Municipal | Coupon | Maturity | Principal | ||
| Investments (continued) | Rate (%) | Date | Amount ($) | Value ($) | |
| Georgia (continued) | |||||
| Thomasville Hospital Authority, | |||||
| RAC (John D. Archbold Memorial | |||||
| Hospital, Inc. Project) | 5.13 | 11/1/30 | 3,500,000 | 3,801,035 | |
| Idaho—.4% | |||||
| Power County Industrial | |||||
| Development Corporation, SWDR | |||||
| (FMC Corporation Project) | 6.45 | 8/1/32 | 7,625,000 | 7,638,039 | |
| Illinois—6.5% | |||||
| Chicago, | |||||
| General Airport Third Lien | |||||
| Revenue (Chicago O’Hare | |||||
| International Airport) | |||||
| (Insured; AMBAC) | 5.00 | 1/1/19 | 5,175,000 | 5,744,716 | |
| Chicago, | |||||
| General Airport Third Lien | |||||
| Revenue (Chicago O’Hare | |||||
| International Airport) | |||||
| (Insured; National Public | |||||
| Finance Guarantee Corp.) | 5.25 | 1/1/23 | 21,370,000 | 23,733,308 | |
| Chicago, | |||||
| GO (Insured; Assured Guaranty | |||||
| Municipal Corp.) | 5.00 | 1/1/18 | 10,000,000 | 11,152,700 | |
| Chicago Board of Education, | |||||
| Unlimited Tax GO | |||||
| (Dedicated Revenues) | 5.25 | 12/1/25 | 15,000,000 | 17,211,600 | |
| Illinois, | |||||
| GO | 5.00 | 8/1/24 | 4,550,000 | 5,130,580 | |
| Illinois Finance Authority, | |||||
| Revenue (Central | |||||
| DuPage Health) | 5.50 | 11/1/39 | 3,500,000 | 3,938,935 | |
| Illinois Finance Authority, | |||||
| Revenue (Northwestern Memorial | |||||
| Hospital) (Prerefunded) | 5.50 | 8/15/14 | 12,310,000 | c | 13,548,263 |
| Illinois Finance Authority, | |||||
| Revenue (Sherman | |||||
| Health Systems) | 5.50 | 8/1/37 | 2,500,000 | 2,702,275 | |
| Metropolitan Pier and Exposition | |||||
| Authority, Revenue (McCormick | |||||
| Place Expansion Project) | 5.00 | 6/15/42 | 13,090,000 | 14,612,891 |
The Fund 13
STATEMENT OF INVESTMENTS (continued)
| Long-Term Municipal | Coupon | Maturity | Principal | |
| Investments (continued) | Rate (%) | Date | Amount ($) | Value ($) |
| Illinois (continued) | ||||
| Railsplitter Tobacco Settlement | ||||
| Authority, Tobacco | ||||
| Settlement Revenue | 5.00 | 6/1/16 | 7,275,000 | 8,186,339 |
| Railsplitter Tobacco Settlement | ||||
| Authority, Tobacco | ||||
| Settlement Revenue | 5.50 | 6/1/23 | 5,500,000 | 6,426,475 |
| Indiana—.5% | ||||
| Indianapolis Local Public | ||||
| Improvement Bond Bank, Revenue | ||||
| (Indianapolis Airport Authority | ||||
| Project) (Insured; AMBAC) | 5.00 | 1/1/36 | 8,900,000 | 9,298,186 |
| Kansas—1.1% | ||||
| Kansas Development Finance | ||||
| Authority, Revenue (Lifespace | ||||
| Communities, Inc.) | 5.00 | 5/15/30 | 5,000,000 | 5,309,700 |
| Wyandotte County Kansas City | ||||
| Unified Government, | ||||
| Utility System Revenue | ||||
| (Insured; AMBAC) | 5.60 | 9/1/23 | 12,010,000 | 13,609,372 |
| Kentucky—.5% | ||||
| Mount Sterling, | ||||
| LR (Kentucky League of Cities | ||||
| Funding Trust Program) | 6.10 | 3/1/18 | 7,955,000 | 9,023,357 |
| Louisiana—.9% | ||||
| Louisiana Local Government | ||||
| Environmental Facilities and | ||||
| Community Development | ||||
| Authority, Revenue (Westlake | ||||
| Chemical Corporation Projects) | 6.75 | 11/1/32 | 2,000,000 | 2,254,300 |
| Louisiana Public Facilities | ||||
| Authority, Revenue (CHRISTUS | ||||
| Health Obligated Group) | 6.00 | 7/1/29 | 6,500,000 | 7,533,175 |
| New Orleans Aviation Board, | ||||
| Gulf Opportunity Zone Customer | ||||
| Facility Charge Revenue | ||||
| (Consolidated Rental Car Project) | 6.25 | 1/1/30 | 5,000,000 | 5,691,000 |
14
| Long-Term Municipal | Coupon | Maturity | Principal | |
| Investments (continued) | Rate (%) | Date | Amount ($) | Value ($) |
| Maine—.4% | ||||
| Maine Health and Higher | ||||
| Educational Facilities Authority, | ||||
| Revenue (MaineGeneral | ||||
| Medical Center Issue) | 7.50 | 7/1/32 | 5,000,000 | 6,225,650 |
| Maryland—.7% | ||||
| Maryland, | ||||
| GO (State and Local | ||||
| Facilities Loan) | 5.00 | 8/1/21 | 7,500,000 | 9,202,350 |
| Maryland Economic Development | ||||
| Corporation, EDR (Transportation | ||||
| Facilities Project) | 5.75 | 6/1/35 | 2,500,000 | 2,734,000 |
| Massachusetts—5.2% | ||||
| Massachusetts, | ||||
| GO (Consolidated Loan) | ||||
| (Insured; Assured Guaranty | ||||
| Municipal Corp.) | 5.25 | 8/1/24 | 12,000,000 | 14,204,520 |
| Massachusetts, | ||||
| GO (Insured; Assured Guaranty | ||||
| Municipal Corp.) | 5.25 | 9/1/23 | 16,420,000 | 21,416,442 |
| Massachusetts Department of | ||||
| Transportation, Metropolitan | ||||
| Highway System Senior Revenue | 5.00 | 1/1/27 | 11,000,000 | 12,473,010 |
| Massachusetts Development Finance | ||||
| Agency, Revenue (Tufts Medical | ||||
| Center Issue) | 6.25 | 1/1/27 | 5,000,000 | 5,988,150 |
| Massachusetts Health and | ||||
| Educational Facilities Authority, | ||||
| Revenue (Northeastern | ||||
| University Issue) | 5.00 | 10/1/30 | 3,000,000 | 3,412,770 |
| Massachusetts Housing Finance | ||||
| Agency, Housing Revenue | 5.30 | 6/1/49 | 5,940,000 | 6,185,322 |
| Massachusetts School Building | ||||
| Authority, Senior Dedicated | ||||
| Sales Tax Revenue | 5.00 | 10/15/35 | 5,000,000 | 5,877,800 |
| Massachusetts Water Resources | ||||
| Authority, General Revenue | 5.00 | 8/1/42 | 10,000,000 | 11,597,300 |
The Fund 15
STATEMENT OF INVESTMENTS (continued)
| Long-Term Municipal | Coupon | Maturity | Principal | |
| Investments (continued) | Rate (%) | Date | Amount ($) | Value ($) |
| Massachusetts (continued) | ||||
| University of Massachusetts | ||||
| Building Authority, Revenue | ||||
| (Insured; AMBAC) | 5.00 | 11/1/17 | 7,540,000 | 8,576,976 |
| Michigan—4.9% | ||||
| Detroit, | ||||
| Sewage Disposal System Senior | ||||
| Lien Revenue (Insured; Assured | ||||
| Guaranty Municipal Corp.) | 7.00 | 7/1/27 | 8,000,000 | 9,594,000 |
| Detroit, | ||||
| Water Supply System Senior | ||||
| Lien Revenue | 5.00 | 7/1/31 | 5,000,000 | 5,264,100 |
| Detroit Water and Sewerage | ||||
| Department, Senior Lien Sewage | ||||
| Disposal System Revenue | 5.25 | 7/1/39 | 6,500,000 | 6,934,135 |
| Kent Hospital Finance Authority, | ||||
| Revenue (Spectrum | ||||
| Health System) | 5.50 | 11/15/25 | 7,710,000 | 9,185,077 |
| Michigan Building Authority, | ||||
| Revenue (Facilities Program) | 5.00 | 10/15/24 | 2,500,000 | 2,965,000 |
| Michigan Finance Authority, | ||||
| Unemployment Obligation | ||||
| Assessment Revenue | 5.00 | 7/1/21 | 18,000,000 | 21,500,280 |
| Michigan Hospital Finance | ||||
| Authority, HR (Henry Ford | ||||
| Health System) | 5.63 | 11/15/29 | 5,000,000 | 5,741,550 |
| Michigan Hospital Finance | ||||
| Authority, Revenue (McLaren | ||||
| Health Care) | 5.63 | 5/15/28 | 4,575,000 | 5,168,240 |
| Michigan Municipal Bond Authority, | ||||
| State Clean Water Revolving | ||||
| Fund Revenue | 5.00 | 10/1/21 | 5,410,000 | 6,349,555 |
| Michigan Strategic Fund, | ||||
| LOR (The Dow Chemical | ||||
| Company Project) | 6.25 | 6/1/14 | 6,500,000 | 7,103,200 |
| Michigan Strategic Fund, | ||||
| SWDR (Genesee Power | ||||
| Station Project) | 7.50 | 1/1/21 | 5,005,000 | 5,004,500 |
16
| Long-Term Municipal | Coupon | Maturity | Principal | |
| Investments (continued) | Rate (%) | Date | Amount ($) | Value ($) |
| Mississippi—.2% | ||||
| Mississippi Home Corporation, | ||||
| SFMR (Collateralized: | ||||
| FNMA and GNMA) | 6.25 | 12/1/32 | 2,530,000 | 2,683,343 |
| Missouri—.9% | ||||
| Curators of the University of | ||||
| Missouri, System | ||||
| Facilities Revenue | 5.00 | 11/1/19 | 10,000,000 | 12,475,800 |
| Missouri Highways and | ||||
| Transportation Commission, | ||||
| Second Lien State Road Revenue | 5.00 | 5/1/16 | 2,915,000 | 3,394,226 |
| Nebraska—.9% | ||||
| Omaha Public Power District, | ||||
| Electric Revenue | 5.50 | 2/1/14 | 14,935,000 | 15,566,153 |
| New Jersey—4.1% | ||||
| Camden County Improvement | ||||
| Authority, Health Care | ||||
| Redevelopment Project Revenue | ||||
| (The Cooper Health System | ||||
| Obligated Group Issue) | 5.25 | 2/15/20 | 9,505,000 | 10,082,334 |
| New Jersey Economic Development | ||||
| Authority, School Facilities | ||||
| Construction Revenue | 5.75 | 9/1/23 | 7,400,000 | 9,210,854 |
| New Jersey Higher Education | ||||
| Student Assistance Authority, | ||||
| Student Loan Revenue (Insured; | ||||
| Assured Guaranty Municipal Corp.) | 6.13 | 6/1/30 | 10,000,000 | 11,160,000 |
| New Jersey Transportation | ||||
| Trust Fund Authority | ||||
| (Transportation System) | 5.75 | 6/15/18 | 7,750,000 | 9,614,263 |
| New Jersey Transportation | ||||
| Trust Fund Authority | ||||
| (Transportation System) | 5.50 | 6/15/31 | 5,000,000 | 5,952,800 |
| New Jersey Transportation Trust | ||||
| Fund Authority (Transportation | ||||
| System) (Insured; National | ||||
| Public Finance Guarantee Corp.) | 5.25 | 12/15/18 | 5,000,000 | 5,688,700 |
The Fund 17
STATEMENT OF INVESTMENTS (continued)
| Long-Term Municipal | Coupon | Maturity | Principal | ||
| Investments (continued) | Rate (%) | Date | Amount ($) | Value ($) | |
| New Jersey (continued) | |||||
| New Jersey Turnpike Authority, | |||||
| Turnpike Revenue | 5.00 | 1/1/24 | 5,000,000 | 6,098,850 | |
| Tobacco Settlement Financing | |||||
| Corporation of New Jersey, | |||||
| Tobacco Settlement | |||||
| Asset-Backed Bonds | 4.50 | 6/1/23 | 4,845,000 | 4,651,297 | |
| Tobacco Settlement Financing | |||||
| Corporation of New Jersey, | |||||
| Tobacco Settlement | |||||
| Asset-Backed Bonds | 4.63 | 6/1/26 | 5,780,000 | 5,301,300 | |
| Tobacco Settlement Financing | |||||
| Corporation of New Jersey, | |||||
| Tobacco Settlement | |||||
| Asset-Backed Bonds | |||||
| (Prerefunded) | 6.75 | 6/1/13 | 3,000,000 | c | 3,147,300 |
| New Mexico—.5% | |||||
| New Mexico Finance Authority, | |||||
| State Transportation Senior | |||||
| Lien Revenue (Insured; National | |||||
| Public Finance Guarantee | |||||
| Corp.) (Prerefunded) | 5.25 | 6/15/14 | 8,000,000 | c | 8,710,320 |
| New York—13.4% | |||||
| Austin Trust | |||||
| (Port Authority of New York | |||||
| and New Jersey, Consolidated | |||||
| Bonds, 151st Series) | 6.00 | 9/15/28 | 25,000,000 | d,e | 30,065,500 |
| Long Island Power Authority, | |||||
| Electric System General Revenue | 6.00 | 5/1/33 | 9,000,000 | 10,901,430 | |
| Metropolitan Transportation | |||||
| Authority, State Service | |||||
| Contract Revenue | 5.75 | 1/1/18 | 17,025,000 | 20,891,548 | |
| Metropolitan Transportation | |||||
| Authority, Transportation Revenue | 5.00 | 11/15/31 | 8,250,000 | 8,905,462 | |
| New York City, | |||||
| GO | 5.00 | 10/1/36 | 11,505,000 | 13,140,551 | |
| New York City Health and | |||||
| Hospitals Corporation, | |||||
| Health System Revenue | 5.00 | 2/15/25 | 14,625,000 | 16,665,480 |
18
| Long-Term Municipal | Coupon | Maturity | Principal | ||
| Investments (continued) | Rate (%) | Date | Amount ($) | Value ($) | |
| New York (continued) | |||||
| New York City Industrial | |||||
| Development Agency, | |||||
| Senior Airport Facilities | |||||
| Revenue (Transportation | |||||
| Infrastructure Properties, LLC | |||||
| Obligated Group) | 5.00 | 7/1/21 | 6,150,000 | 6,641,570 | |
| New York City Industrial | |||||
| Development Agency, | |||||
| Special Facility Revenue | |||||
| (American Airlines, Inc. | |||||
| John F. Kennedy International | |||||
| Airport Project) | 8.00 | 8/1/28 | 7,450,000 | f | 7,834,644 |
| New York City Municipal Water | |||||
| Finance Authority, Water and | |||||
| Sewer System Second General | |||||
| Resolution Revenue | 5.00 | 6/15/34 | 7,500,000 | 8,672,925 | |
| New York City Transitional Finance | |||||
| Authority, Future Tax Secured | |||||
| Subordinate Revenue | 5.00 | 2/1/35 | 15,055,000 | 17,249,417 | |
| New York Liberty Development | |||||
| Corporation, Liberty Revenue | |||||
| (4 World Trade Center Project) | 5.00 | 11/15/31 | 5,000,000 | 5,744,750 | |
| New York State Dormitory | |||||
| Authority, Revenue | |||||
| (New York University) | |||||
| (Insured; National Public | |||||
| Finance Guarantee Corp.) | 5.75 | 7/1/27 | 9,500,000 | 12,587,310 | |
| New York State Dormitory | |||||
| Authority, Revenue (Orange | |||||
| Regional Medical Center | |||||
| Obligated Group) | 6.13 | 12/1/29 | 5,000,000 | 5,495,050 | |
| New York State Dormitory | |||||
| Authority, Revenue (Orange | |||||
| Regional Medical Center | |||||
| Obligated Group) | 6.25 | 12/1/37 | 6,500,000 | 7,076,290 | |
| New York State Dormitory | |||||
| Authority, State Personal Income | |||||
| Tax Revenue (General Purpose) | 5.00 | 3/15/20 | 6,775,000 | 8,363,060 |
The Fund 19
STATEMENT OF INVESTMENTS (continued)
| Long-Term Municipal | Coupon | Maturity | Principal | |
| Investments (continued) | Rate (%) | Date | Amount ($) | Value ($) |
| New York (continued) | ||||
| New York State Environmental | ||||
| Facilities Corporation, State | ||||
| Clean Water and Drinking Water | ||||
| Revolving Funds Revenue | ||||
| (New York City Municipal Water | ||||
| Finance Authority Projects) | 5.00 | 6/15/23 | 5,000,000 | 6,328,900 |
| New York State Thruway Authority, | ||||
| Second General Highway and | ||||
| Bridge Trust Fund Bonds | 4.00 | 4/1/16 | 5,000,000 | 5,596,100 |
| New York State Thruway Authority, | ||||
| Second General Highway and | ||||
| Bridge Trust Fund Bonds | ||||
| (Insured; National Public | ||||
| Finance Guarantee Corp.) | 5.00 | 4/1/17 | 8,090,000 | 9,201,161 |
| New York State Urban Develpoment | ||||
| Corporation, State Personal | ||||
| Income Tax Revenue | ||||
| (General Purpose) | 5.00 | 3/15/17 | 5,000,000 | 5,922,200 |
| Port Authority of New York and | ||||
| New Jersey (Consolidated Bonds, | ||||
| 141st Series) (Insured; AMBAC) | 5.00 | 9/1/17 | 6,535,000 | 7,299,072 |
| Tobacco Settlement Financing | ||||
| Corporation of New York, | ||||
| Asset-Backed Revenue (State | ||||
| Contingency Contract Secured) | 5.00 | 6/1/18 | 5,000,000 | 6,017,650 |
| Triborough Bridge and Tunnel | ||||
| Authority, General Revenue | ||||
| (MTA Bridges and Tunnels) | 5.00 | 11/15/23 | 6,430,000 | 8,103,729 |
| North Carolina—1.4% | ||||
| Guilford County, | ||||
| Public Improvement GO | 5.00 | 3/1/16 | 8,370,000 | 9,691,623 |
| North Carolina, | ||||
| Limited Obligation Bonds | 5.00 | 11/1/18 | 12,000,000 | 14,716,920 |
| Ohio—.3% | ||||
| Butler County, | ||||
| Hospital Facilities Revenue | ||||
| (UC Health) | 5.50 | 11/1/40 | 5,000,000 | 5,443,350 |
| Oregon—.1% | ||||
| Oregon, | ||||
| GO (State Property— | ||||
| Various Projects) | 5.00 | 5/1/20 | 2,000,000 | 2,525,780 |
20
| Long-Term Municipal | Coupon | Maturity | Principal | |
| Investments (continued) | Rate (%) | Date | Amount ($) | Value ($) |
| Pennsylvania—1.8% | ||||
| Allegheny County Port | ||||
| Authority, Special | ||||
| Transportation Revenue | 5.25 | 3/1/22 | 5,000,000 | 6,042,800 |
| Geisinger Authority, | ||||
| Health System Revenue | ||||
| (Geisinger Health System) | 5.25 | 6/1/39 | 11,750,000 | 13,076,810 |
| Pennsylvania Turnpike Commission, | ||||
| Turnpike Revenue | 5.00 | 12/1/24 | 5,000,000 | 5,834,100 |
| Philadelphia School District, | ||||
| GO | 5.25 | 9/1/23 | 5,000,000 | 5,826,600 |
| South Carolina—2.2% | ||||
| Columbia, | ||||
| Waterworks and Sewer | ||||
| System Revenue | 5.00 | 2/1/36 | 8,000,000 | 9,269,120 |
| Greenville County School District, | ||||
| Installment Purchase Revenue | ||||
| (Building Equity Sooner | ||||
| for Tomorrow) | 5.00 | 12/1/23 | 10,000,000 | 11,581,000 |
| Piedmont Municipal Power Agency, | ||||
| Electric Revenue | 5.00 | 1/1/20 | 5,340,000 | 6,365,280 |
| South Carolina Public Service | ||||
| Authority, Revenue Obligations | ||||
| (Santee Cooper) | 5.00 | 12/1/36 | 10,000,000 | 11,375,100 |
| Tennessee—.5% | ||||
| Johnson City Health and | ||||
| Educational Facilities Board, | ||||
| HR (Mountain States | ||||
| Health Alliance) | 6.00 | 7/1/38 | 5,000,000 | 5,770,050 |
| Memphis-Shelby County Airport | ||||
| Authority, Special Facilities | ||||
| Revenue (Federal | ||||
| Express Corporation) | 5.05 | 9/1/12 | 2,000,000 | 2,000,000 |
| Texas—9.3% | ||||
| Austin, | ||||
| Water and Wastewater | ||||
| System Revenue | 5.00 | 11/15/27 | 10,000,000 | 11,722,200 |
| Dallas and Fort Worth, | ||||
| Joint Improvement Revenue | ||||
| (Dallas/Fort Worth | ||||
| International Airport) | 5.00 | 11/1/42 | 11,500,000 | 12,351,805 |
The Fund 21
STATEMENT OF INVESTMENTS (continued)
| Long-Term Municipal | Coupon | Maturity | Principal | |
| Investments (continued) | Rate (%) | Date | Amount ($) | Value ($) |
| Texas (continued) | ||||
| Dallas and Fort Worth, | ||||
| Joint Improvement Revenue | ||||
| (Dallas/Fort Worth | ||||
| International Airport) | ||||
| (Insured; National Public | ||||
| Finance Guarantee Corp.) | 5.75 | 11/1/14 | 4,525,000 | 4,544,276 |
| Dallas and Fort Worth, | ||||
| Joint Improvement Revenue | ||||
| (Dallas/Fort Worth | ||||
| International Airport) | ||||
| (Insured; National Public | ||||
| Finance Guarantee Corp.) | 5.75 | 11/1/15 | 3,025,000 | 3,037,735 |
| Dallas-Fort Worth International | ||||
| Airport Facility Improvement | ||||
| Corporation, Revenue | ||||
| (Learjet Inc. Project) | 6.15 | 1/1/16 | 5,865,000 | 5,875,674 |
| Harris County Cultural Education | ||||
| Facilities Finance Corporation, | ||||
| HR (Texas Children’s | ||||
| Hospital Project) | 5.25 | 10/1/29 | 4,000,000 | 4,714,200 |
| Harris County Health Facilities | ||||
| Development Corporation, | ||||
| HR (Memorial Hermann | ||||
| Healthcare System) | 7.25 | 12/1/35 | 7,000,000 | 8,758,330 |
| Houston, | ||||
| Airport System Subordinate | ||||
| Lien Revenue | 5.00 | 7/1/17 | 7,500,000 | 8,639,850 |
| Houston, | ||||
| Combined Utility System First | ||||
| Lien Revenue (Insured; Assured | ||||
| Guaranty Municipal Corp.) | 5.25 | 5/15/21 | 18,075,000 | 19,452,496 |
| Houston, | ||||
| Public Improvement GO | 5.00 | 3/1/18 | 5,000,000 | 6,047,450 |
| Love Field Airport Modernization | ||||
| Corporation, Special | ||||
| Facilities Revenue (Southwest | ||||
| Airlines Company—Love Field | ||||
| Modernization Program Project) | 5.00 | 11/1/28 | 3,000,000 | 3,229,200 |
| Midlothian Independent School | ||||
| District, Unlimited Tax School | ||||
| Building Bonds (Permanent | ||||
| School Fund Guarantee Program) | 5.00 | 2/15/40 | 5,000,000 | 5,711,800 |
22
| Long-Term Municipal | Coupon | Maturity | Principal | ||
| Investments (continued) | Rate (%) | Date | Amount ($) | Value ($) | |
| Texas (continued) | |||||
| North Texas Tollway Authority, | |||||
| First Tier System Revenue | |||||
| (Insured; Assured Guaranty | |||||
| Municipal Corp.) | 5.75 | 1/1/40 | 5,000,000 | 5,759,250 | |
| North Texas Tollway Authority, | |||||
| Second Tier System Revenue | 5.75 | 1/1/38 | 10,000,000 | 10,975,800 | |
| San Antonio, | |||||
| Water System Revenue | 5.00 | 5/15/27 | 10,030,000 | 12,266,790 | |
| Tarrant County Health Facilities | |||||
| Development Corporation, | |||||
| Health Resources System | |||||
| Revenue (Insured; National | |||||
| Public Finance Guarantee Corp.) | 5.75 | 2/15/14 | 9,470,000 | 10,225,233 | |
| Texas, | |||||
| GO (College Student | |||||
| Loan Bonds) | 5.50 | 8/1/19 | 8,205,000 | 10,212,599 | |
| Texas Turnpike Authority, | |||||
| Central Texas Turnpike System | |||||
| Revenue (Insured; AMBAC) | 5.75 | 8/15/38 | 10,000,000 | 10,085,600 | |
| Williamson County, | |||||
| Limited Tax Bonds | 5.00 | 2/15/24 | 5,000,000 | 6,256,600 | |
| Utah—.2% | |||||
| Metropolitan Water District of | |||||
| Salt Lake and Sandy, Water | |||||
| Revenue Project Bonds | 5.00 | 7/1/37 | 3,000,000 | 3,514,530 | |
| Virginia—2.5% | |||||
| Danville Industrial Development | |||||
| Authority, HR (Danville | |||||
| Regional Medical Center) | |||||
| (Insured; AMBAC) | 5.25 | 10/1/28 | 1,500,000 | 1,939,695 | |
| Tobacco Settlement Financing | |||||
| Corporation, Tobacco | |||||
| Settlement Asset-Backed | |||||
| Bonds (Prerefunded) | 5.50 | 6/1/15 | 8,975,000 | c | 9,784,186 |
| Upper Occoquan Sewage Authority, | |||||
| Regional Sewerage System | |||||
| Revenue (Insured; National | |||||
| Public Finance Guarantee Corp.) | 5.15 | 7/1/20 | 5,210,000 | 6,308,529 | |
| Virginia Housing Development | |||||
| Authority, Commonwealth | |||||
| Mortgage Revenue | 5.00 | 10/1/26 | 8,250,000 | 8,802,338 |
The Fund 23
STATEMENT OF INVESTMENTS (continued)
| Long-Term Municipal | Coupon | Maturity | Principal | ||
| Investments (continued) | Rate (%) | Date | Amount ($) | Value ($) | |
| Virginia (continued) | |||||
| Virginia Housing Development | |||||
| Authority, Commonwealth | |||||
| Mortgage Revenue | 6.25 | 7/1/31 | 13,470,000 | 15,439,045 | |
| Washington—5.2% | |||||
| Bellevue, | |||||
| Limited Tax GO (New City | |||||
| Building) (Insured; National | |||||
| Public Finance Guarantee | |||||
| Corp.) (Prerefunded) | 5.50 | 12/1/14 | 10,520,000 | c | 11,738,637 |
| Chelan County | |||||
| Public Utility District | |||||
| Number 1, Consolidated | |||||
| System Revenue | 5.00 | 7/1/17 | 4,000,000 | 4,644,200 | |
| Energy Northwest, | |||||
| Electric Revenue (Columbia | |||||
| Generating Station) | 5.00 | 7/1/23 | 10,060,000 | 11,553,910 | |
| Energy Northwest, | |||||
| Electric Revenue (Project 3) | 5.00 | 7/1/18 | 10,000,000 | 12,238,700 | |
| Seattle, | |||||
| Municipal Light and Power | |||||
| Improvement Revenue | 5.00 | 6/1/23 | 6,790,000 | 8,521,789 | |
| Seattle, | |||||
| Water System Revenue | 5.00 | 9/1/23 | 14,315,000 | 18,112,770 | |
| Washington, | |||||
| GO (Various Purpose) | 5.00 | 7/1/18 | 5,000,000 | 6,113,000 | |
| Washington, | |||||
| GO (Various Purpose) | 5.00 | 7/1/23 | 6,115,000 | 7,689,123 | |
| Washington, | |||||
| GO (Various Purpose) | |||||
| (Insured; AMBAC) | 5.00 | 7/1/16 | 7,315,000 | 8,238,811 | |
| West Virginia—.7% | |||||
| West Virginia, | |||||
| Infrastructure GO (Insured; | |||||
| FGIC) (Prerefunded) | 6.50 | 11/1/16 | 2,600,000 | c | 3,296,878 |
| West Virginia School | |||||
| Building Authority, | |||||
| Capital Improvement | |||||
| Revenue (Insured; | |||||
| National Public Finance | |||||
| Guarantee Corp.) | 5.00 | 7/1/18 | 5,500,000 | 6,462,940 |
24
| Long-Term Municipal | Coupon | Maturity | Principal | ||
| Investments (continued) | Rate (%) | Date | Amount ($) | Value ($) | |
| West Virginia (continued) | |||||
| West Virginia State Building | |||||
| Commission, Subordinate LR | |||||
| (West Virginia Regional Jail | |||||
| and Correctional Facility | |||||
| Authority) (Insured; AMBAC) | 5.38 | 7/1/21 | 2,505,000 | 2,820,580 | |
| Wisconsin—.6% | |||||
| Wisconsin, | |||||
| GO | 4.00 | 5/1/15 | 5,000,000 | 5,472,450 | |
| Wisconsin Health and Educational | |||||
| Facilities Authority, Revenue | |||||
| (Aurora Health Care, Inc.) | 5.50 | 4/15/29 | 5,000,000 | 5,651,250 | |
| U.S. Related—4.0% | |||||
| Puerto Rico Commonwealth, | |||||
| Public Improvement GO | 5.00 | 7/1/16 | 5,000,000 | 5,445,450 | |
| Puerto Rico Commonwealth, | |||||
| Public Improvement GO | 6.00 | 7/1/39 | 5,000,000 | 5,478,200 | |
| Puerto Rico Commonwealth, | |||||
| Public Improvement GO | 6.50 | 7/1/40 | 5,000,000 | 5,814,950 | |
| Puerto Rico Electric Power | |||||
| Authority, Power Revenue | 5.50 | 7/1/38 | 10,000,000 | 10,695,100 | |
| Puerto Rico Electric Power | |||||
| Authority, Power Revenue | 5.25 | 7/1/40 | 5,000,000 | 5,203,050 | |
| Puerto Rico Infrastructure | |||||
| Financing Authority, Special | |||||
| Tax Revenue (Insured; AMBAC) | 0.00 | 7/1/36 | 23,400,000 | b | 5,617,872 |
| Puerto Rico Sales Tax Financing | |||||
| Corporation, Sales Tax Revenue | |||||
| (First Subordinate Series) | 5.38 | 8/1/39 | 5,000,000 | 5,352,800 | |
| Puerto Rico Sales Tax Financing | |||||
| Corporation, Sales Tax Revenue | |||||
| (First Subordinate Series) | 6.00 | 8/1/39 | 5,000,000 | 5,703,600 | |
| Puerto Rico Sales Tax Financing | |||||
| Corporation, Sales Tax Revenue | |||||
| (First Subordinate Series) | 6.38 | 8/1/39 | 5,000,000 | 5,908,100 | |
| Puerto Rico Sales Tax Financing | |||||
| Corporation, Sales Tax Revenue | |||||
| (First Subordinate Series) | 6.00 | 8/1/42 | 11,500,000 | 12,910,590 | |
| Total Long-Term Municipal Investments | |||||
| (cost $1,562,587,817) | 1,705,312,687 | ||||
The Fund 25
STATEMENT OF INVESTMENTS (continued)
| Short-Term Municipal | Coupon | Maturity | Principal | ||
| Investments—1.7% | Rate (%) | Date | Amount ($) | Value ($) | |
| California—.7% | |||||
| California, | |||||
| GO Notes (Kindergarten-University) | |||||
| (LOC: California State Teachers | |||||
| Retirement System and | |||||
| Citibank NA) | 0.19 | 9/4/12 | 6,000,000 | g | 6,000,000 |
| California Infrastructure and | |||||
| Economic Development Bank, | |||||
| Revenue, Refunding (Los | |||||
| Angeles County Museum of | |||||
| Natural History Foundation) | |||||
| (LOC; Wells Fargo Bank) | 0.15 | 9/4/12 | 4,800,000 | g | 4,800,000 |
| Irvine Assessment District Number | |||||
| 03-19, Limited Obligation | |||||
| Improvement Bonds (LOC: | |||||
| California State Teachers | |||||
| Retirement System and | |||||
| U.S. Bank NA) | 0.19 | 9/4/12 | 2,000,000 | g | 2,000,000 |
| New York—1.0% | |||||
| New York City, | |||||
| GO Notes (LOC; JPMorgan | |||||
| Chase Bank) | 0.16 | 9/4/12 | 4,600,000 | g | 4,600,000 |
| New York City, | |||||
| GO Notes (LOC; JPMorgan | |||||
| Chase Bank) | 0.16 | 9/4/12 | 2,200,000 | g | 2,200,000 |
| New York City, | |||||
| GO Notes (LOC; JPMorgan | |||||
| Chase Bank) | 0.20 | 9/4/12 | 4,100,000 | g | 4,100,000 |
26
| Short-Term Municipal | Coupon | Maturity | Principal | ||||
| Investments (continued) | Rate (%) | Date | Amount ($) | Value ($) | |||
| New York (continued) | |||||||
| New York City, | |||||||
| GO Notes (LOC; JPMorgan | |||||||
| Chase Bank) | 0.20 | 9/4/12 | 4,200,000 | g | 4,200,000 | ||
| New York State Dormitory | |||||||
| Authority, Revenue (University | |||||||
| of Rochester) (LOC; JPMorgan | |||||||
| Chase Bank) | 0.16 | 9/4/12 | 2,100,000 | g | 2,100,000 | ||
| Total Short-Term Municipal Investments | |||||||
| (cost $30,000,000) | 30,000,000 | ||||||
| Total Investments (cost $1,592,587,817) | 100.9 | % | 1,735,312,687 | ||||
| Liabilities, Less Cash and Receivables | (.9 | %) | (15,910,017) | ||||
| Net Assets | 100.0 | % | 1,719,402,670 | ||||
a Zero coupon until a specified date at which time the stated coupon rate becomes effective until maturity.
b Security issued with a zero coupon. Income is recognized through the accretion of discount.
c These securities are prerefunded; the date shown represents the prerefunded date. Bonds which are prerefunded are
collateralized by U.S. Government securities which are held in escrow and are used to pay principal and interest on
the municipal issue and to retire the bonds in full at the earliest refunding date.
d Collateral for floating rate borrowings.
e Security exempt from registration pursuant to Rule 144A under the Securities Act of 1933.This security may be
resold in transactions exempt from registration, normally to qualified institutional buyers.At August 31, 2012, this
security was valued at $30,065,500 or 1.7% of net assets.
f Non-income producing—security in default.
g Variable rate demand note—rate shown is the interest rate in effect at August 31, 2012. Maturity date represents the
next demand date, or the ultimate maturity date if earlier.
The Fund 27
| STATEMENT OF INVESTMENTS (continued) | |||
| Summary of Abbreviations | |||
| ABAG | Association of Bay Area | ACA | American Capital Access |
| Governments | |||
| AGC | ACE Guaranty Corporation | AGIC | Asset Guaranty Insurance Company |
| AMBAC | American Municipal Bond | ARRN | Adjustable Rate |
| Assurance Corporation | Receipt Notes | ||
| BAN | Bond Anticipation Notes | BPA | Bond Purchase Agreement |
| CIFG | CDC Ixis Financial Guaranty | COP | Certificate of Participation |
| CP | Commercial Paper | DRIVERS | Derivative Inverse |
| Tax-Exempt Receipts | |||
| EDR | Economic Development | EIR | Environmental Improvement |
| Revenue | Revenue | ||
| FGIC | Financial Guaranty | FHA | Federal Housing |
| Insurance Company | Administration | ||
| FHLB | Federal Home | FHLMC | Federal Home Loan Mortgage |
| Loan Bank | Corporation | ||
| FNMA | Federal National | GAN | Grant Anticipation Notes |
| Mortgage Association | |||
| GIC | Guaranteed Investment | GNMA | Government National Mortgage |
| Contract | Association | ||
| GO | General Obligation | HR | Hospital Revenue |
| IDB | Industrial Development Board | IDC | Industrial Development Corporation |
| IDR | Industrial Development | LIFERS | Long Inverse Floating |
| Revenue | Exempt Receipts | ||
| LOC | Letter of Credit | LOR | Limited Obligation Revenue |
| LR | Lease Revenue | MERLOTS | Municipal Exempt Receipt |
| Liquidity Option Tender | |||
| MFHR | Multi-Family Housing Revenue | MFMR | Multi-Family Mortgage Revenue |
| PCR | Pollution Control Revenue | PILOT | Payment in Lieu of Taxes |
| P-FLOATS | Puttable Floating Option | PUTTERS | Puttable Tax-Exempt Receipts |
| Tax-Exempt Receipts | |||
| RAC | Revenue Anticipation Certificates | RAN | Revenue Anticipation Notes |
| RAW | Revenue Anticipation Warrants | ROCS | Reset Options Certificates |
| RRR | Resources Recovery Revenue | SAAN | State Aid Anticipation Notes |
| SBPA | Standby Bond Purchase Agreement | SFHR | Single Family Housing Revenue |
| SFMR | Single Family Mortgage Revenue | SONYMA | State of New York Mortgage Agency |
| SPEARS | Short Puttable Exempt | SWDR | Solid Waste Disposal Revenue |
| Adjustable Receipts | |||
| TAN | Tax Anticipation Notes | TAW | Tax Anticipation Warrants |
| TRAN | Tax and Revenue Anticipation Notes | XLCA | XL Capital Assurance |
28
| Summary of Combined Ratings (Unaudited) | |||||
| Fitch | or | Moody’s | or | Standard & Poor’s | Value (%)† |
| AAA | Aaa | AAA | 12.1 | ||
| AA | Aa | AA | 41.6 | ||
| A | A | A | 30.6 | ||
| BBB | Baa | BBB | 10.7 | ||
| BB | Ba | BB | 1.6 | ||
| B | B | B | 1.4 | ||
| F1 | MIG1/P1 | SP1/A1 | 1.0 | ||
| Not Ratedh | Not Ratedh | Not Ratedh | 1.0 | ||
| 100.0 | |||||
† Based on total investments.
h Securities which, while not rated by Fitch, Moody’s and Standard & Poor’s, have been determined by the Manager to
be of comparable quality to those rated securities in which the fund may invest.
See notes to financial statements.
The Fund 29
STATEMENT OF ASSETS AND LIABILITIES
August 31, 2012
| Cost | Value | ||
| Assets ($): | |||
| Investments in securities—See Statement of Investments | 1,592,587,817 | 1,735,312,687 | |
| Interest receivable | 19,772,918 | ||
| Unrealized appreciation on swap contracts—Note 4 | 1,292,777 | ||
| Receivable from broker for swap transactions—Note 4 | 867,897 | ||
| Receivable for shares of Common Stock subscribed | 162,500 | ||
| Prepaid expenses | 30,702 | ||
| 1,757,439,481 | |||
| Liabilities ($): | |||
| Due to The Dreyfus Corporation and affiliates—Note 3(b) | 1,008,583 | ||
| Cash overdraft due to Custodian | 1,509,365 | ||
| Payable for investment securities purchased | 20,148,062 | ||
| Payable for floating rate notes issued—Note 4 | 12,500,000 | ||
| Unrealized depreciation on swap contracts—Note 4 | 1,569,301 | ||
| Payable for shares of Common Stock redeemed | 802,473 | ||
| Interest and expense payable related to | |||
| floating rate notes issued—Note 4 | 56,255 | ||
| Accrued expenses | 442,772 | ||
| 38,036,811 | |||
| Net Assets ($) | 1,719,402,670 | ||
| Composition of Net Assets ($): | |||
| Paid-in capital | 1,646,358,571 | ||
| Accumulated net realized gain (loss) on investments | (69,404,247) | ||
| Accumulated net unrealized appreciation (depreciation) | |||
| on investments and swap transactions | 142,448,346 | ||
| Net Assets ($) | 1,719,402,670 | ||
| Shares Outstanding | |||
| (600 million shares of $.001 par value Common Stock authorized) | 144,453,821 | ||
| Net Asset Value, offering and redemption price per share ($) | 11.90 | ||
| See notes to financial statements. | |||
30
STATEMENT OF OPERATIONS
Year Ended August 31, 2012
| Investment Income ($): | ||
| Interest Income | 74,159,241 | |
| Expenses: | ||
| Management fee—Note 3(a) | 10,136,478 | |
| Shareholder servicing costs—Note 3(b) | 1,887,035 | |
| Directors’ fees and expenses—Note 3(c) | 176,341 | |
| Interest and expense related to floating rate notes issued—Note 4 | 107,524 | |
| Custodian fees—Note 3(b) | 96,544 | |
| Professional fees | 92,516 | |
| Registration fees | 34,631 | |
| Prospectus and shareholders’ reports | 28,254 | |
| Loan commitment fees—Note 2 | 16,094 | |
| Miscellaneous | 76,499 | |
| Total Expenses | 12,651,916 | |
| Less—reduction in fees due to earnings credits—Note 3(b) | (1,482) | |
| Net Expenses | 12,650,434 | |
| Investment Income—Net | 61,508,807 | |
| Realized and Unrealized Gain (Loss) on Investments—Note 1(b) ($): | ||
| Net realized gain (loss) on investments | 33,329,525 | |
| Net realized gain (loss) on swap transactions | 867,898 | |
| Net Realized Gain (Loss) | 34,197,423 | |
| Net unrealized appreciation (depreciation) on investments | 62,918,146 | |
| Net unrealized appreciation (depreciation) on swap transactions | (276,524) | |
| Net Realized Appreciation (Depreciation) | 62,641,622 | |
| Net Realized and Unrealized Gain (Loss) on Investments | 96,839,045 | |
| Net Increase in Net Assets Resulting from Operations | 158,347,852 | |
| See notes to financial statements. | ||
The Fund 31
STATEMENT OF CHANGES IN NET ASSETS
| Year Ended August 31, | ||||
| 2012 | 2011 | |||
| Operations ($): | ||||
| Investment income—net | 61,508,807 | 71,894,561 | ||
| Net realized gain (loss) on investments | 34,197,423 | (28,018,125) | ||
| Net unrealized appreciation | ||||
| (depreciation) on investments | 62,641,622 | (29,580,753) | ||
| Net Increase (Decrease) in Net Assets | ||||
| Resulting from Operations | 158,347,852 | 14,295,683 | ||
| Dividends to Shareholders from ($): | ||||
| Investment income—net | (61,096,765) | (71,474,403) | ||
| Capital Stock Transactions ($): | ||||
| Net proceeds from shares sold | 147,487,941 | 106,351,417 | ||
| Dividends reinvested | 42,483,068 | 49,413,066 | ||
| Cost of shares redeemed | (228,225,925) | (254,747,288) | ||
| Increase (Decrease) in Net Assets | ||||
| from Capital Stock Transactions | (38,254,916) | (98,982,805) | ||
| Total Increase (Decrease) in Net Assets | 58,996,171 | (156,161,525) | ||
| Net Assets ($): | ||||
| Beginning of Period | 1,660,406,499 | 1,816,568,024 | ||
| End of Period | 1,719,402,670 | 1,660,406,499 | ||
| Capital Share Transactions (Shares): | ||||
| Shares sold | 12,688,261 | 9,608,038 | ||
| Shares issued for dividends reinvested | 3,658,879 | 4,479,756 | ||
| Shares redeemed | (19,652,172) | (23,206,797) | ||
| Net Increase (Decrease) in Shares Outstanding | (3,305,032) | (9,119,003) | ||
| See notes to financial statements. | ||||
32
FINANCIAL HIGHLIGHTS
The following table describes the performance for the fiscal periods indicated. Total return shows how much your investment in the fund would have increased (or decreased) during each period, assuming you had reinvested all dividends and distributions.These figures have been derived from the fund’s financial statements.
| Year Ended August 31, | ||||||||||
| 2012 | 2011 | 2010 | 2009 | 2008 | ||||||
| Per Share Data ($): | ||||||||||
| Net asset value, | ||||||||||
| beginning of period | 11.24 | 11.58 | 11.01 | 11.19 | 11.50 | |||||
| Investment Operations: | ||||||||||
| Investment income—neta | .42 | .48 | .49 | .52 | .52 | |||||
| Net realized and unrealized | ||||||||||
| gain (loss) on investments | .66 | (.35) | .57 | (.18 | ) | (.31 | ) | |||
| Total from Investment Operations | 1.08 | .13 | 1.06 | .34 | .21 | |||||
| Distributions: | ||||||||||
| Dividends from | ||||||||||
| investment income—net | (.42) | (.47) | (.49 | ) | (.52 | ) | (.52 | ) | ||
| Net asset value, end of period | 11.90 | 11.24 | 11.58 | 11.01 | 11.19 | |||||
| Total Return (%) | 9.76 | 1.30 | 9.86 | 3.44 | 1.74 | |||||
| Ratios/Supplemental Data (%): | ||||||||||
| Ratio of total expenses | ||||||||||
| to average net assets | .75 | .75 | .74 | .76 | .80 | |||||
| Ratio of net expenses | ||||||||||
| to average net assets | .75 | .75 | .74 | .76 | .80 | |||||
| Ratio of interest and expense related | ||||||||||
| to floating rate notes issued | ||||||||||
| to average net assets | .01 | .01 | .01 | .03 | .08 | |||||
| Ratio of net investment income | ||||||||||
| to average net assets | 3.64 | 4.30 | 4.39 | 4.91 | 4.56 | |||||
| Portfolio Turnover Rate | 27.88 | 24.24 | 19.86 | 23.28 | 37.04 | |||||
| Net Assets, end of period | ||||||||||
| ($ x 1,000) | 1,719,403 | 1,660,406 | 1,816,568 | 1,756,991 | 1,843,865 | |||||
| a Based on average shares outstanding at each month end. | ||||||||||
| See notes to financial statements. | ||||||||||
The Fund 33
NOTES TO FINANCIAL STATEMENTS
NOTE 1—Significant Accounting Policies:
Dreyfus Municipal Bond Fund (the “fund”) is the sole series comprising Dreyfus Bond Funds, Inc. (the “Company”), which is registered under the Investment Company Act of 1940, as amended (the “Act”), as a diversified open-end management investment company. The fund’s investment objective seeks to maximize current income exempt from federal income tax, to the extent consistent with the preservation of capital.The Dreyfus Corporation (the “Manager” or “Dreyfus”), a wholly-owned subsidiary of The Bank of New York Mellon Corporation (“BNY Mellon”), serves as the fund’s investment adviser. MBSC Securities Corporation (the “Distributor”), a wholly-owned subsidiary of the Manager, is the distributor of the fund’s shares which are sold to the public without a sales charge.
The Financial Accounting Standards Board (“FASB”) Accounting Standards Codification is the exclusive reference of authoritative U.S. generally accepted accounting principles (“GAAP”) recognized by the FASB to be applied by nongovernmental entities. Rules and interpretive releases of the Securities and Exchange Commission (“SEC”) under authority of federal laws are also sources of authoritative GAAP for SEC registrants. The fund’s financial statements are prepared in accordance with GAAP, which may require the use of management estimates and assumptions.Actual results could differ from those estimates.
The Company enters into contracts that contain a variety of indemnifications.The fund’s maximum exposure under these arrangements is unknown.The fund does not anticipate recognizing any loss related to these arrangements.
(a) Portfolio valuation: The fair value of a financial instrument is the amount that would be received to sell an asset or paid to transfer a liability in an orderly transaction between market participants at the measurement date (i.e., the exit price). GAAP establishes a fair value hierarchy that prioritizes the inputs of valuation techniques used to
34
measure fair value.This hierarchy gives the highest priority to unadjusted quoted prices in active markets for identical assets or liabilities (Level 1 measurements) and the lowest priority to unobservable inputs (Level 3 measurements).
Additionally, GAAP provides guidance on determining whether the volume and activity in a market has decreased significantly and whether such a decrease in activity results in transactions that are not orderly. GAAP requires enhanced disclosures around valuation inputs and techniques used during annual and interim periods.
Various inputs are used in determining the value of the fund’s investments relating to fair value measurements.These inputs are summarized in the three broad levels listed below:
Level 1—unadjusted quoted prices in active markets for identical investments.
Level 2—other significant observable inputs (including quoted prices for similar investments, interest rates, prepayment speeds, credit risk, etc.).
Level 3—significant unobservable inputs (including the fund’s own assumptions in determining the fair value of investments).
The inputs or methodology used for valuing securities are not necessarily an indication of the risk associated with investing in those securities.
Changes in valuation techniques may result in transfers in or out of an assigned level within the disclosure hierarchy. Valuation techniques used to value the fund’s investments are as follows:
Investments in securities are valued each business day by an independent pricing service (the “Service”) approved by the Company’s Board of Directors. Investments for which quoted bid prices are readily available and are representative of the bid side of the market in the judgment of the Service are valued at the mean between the quoted bid prices (as
The Fund 35
NOTES TO FINANCIAL STATEMENTS (continued)
obtained by the Service from dealers in such securities) and asked prices (as calculated by the Service based upon its evaluation of the market for such securities). Other investments (which constitute a majority of the portfolio securities) are carried at fair value as determined by the Service, based on methods which include consideration of the following: yields or prices of municipal securities of comparable quality, coupon, maturity and type; indications as to values from dealers; and general market conditions.All of the preceding securities are categorized within Level 2 of the fair value hierarchy.
The Service’s procedures are reviewed by Dreyfus under the general supervision of the Company’s Board of Directors.
When market quotations or official closing prices are not readily available, or are determined not to reflect accurately fair value, such as when the value of a security has been significantly affected by events after the close of the exchange or market on which the security is principally traded, but before the fund calculates its net asset value, the fund may value these investments at fair value as determined in accordance with the procedures approved by the Company’s Board of Directors. Certain factors may be considered when fair valuing investments such as: fundamental analytical data, the nature and duration of restrictions on disposition, an evaluation of the forces that influence the market in which the securities are purchased and sold, and public trading in similar securities of the issuer or comparable issuers.These securities are either categorized as Level 2 or 3 depending on the relevant inputs used.
For restricted securities where observable inputs are limited, assumptions about market activity and risk are used and are categorized within Level 3 of the fair value hierarchy.
Investments in swap transactions are valued each business day by the Service. Swaps are valued by the Service by using a swap pricing model which incorporates among other factors, default probabilities, recovery rates, credit curves of the underlying issuer and swap spreads on interest rates. These securities are generally categorized within Level 2 of the fair value hierarchy.
36
The following is a summary of the inputs used as of August 31, 2012 in valuing the fund’s investments:
| Level 2—Other | Level 3— | |||||
| Level 1— | Significant | Significant | ||||
| Unadjusted | Observable | Unobservable | ||||
| Quoted Prices | Inputs | Inputs | Total | |||
| Assets ($) | ||||||
| Investments in Securities: | ||||||
| Municipal Bonds | — | 1,735,312,687 | — | 1,735,312,687 | ||
| Other Financial | ||||||
| Instruments: | ||||||
| Swaps† | — | 1,292,777 | — | 1,292,777 | ||
| Liabilities ($) | ||||||
| Floating Rate Notes†† | — | (12,500,000 | ) | — | (12,500,000 | ) |
| Other Financial | ||||||
| Instruments: | ||||||
| Swaps† | — | (1,569,301 | ) | — | (1,569,301 | ) |
† Amount shown represents unrealized appreciation (depreciation) at period end.
Certain of the fund’s liabilities are held at carrying amount, which approximates fair value for
financial reporting purposes.
At August 31, 2012, there were no transfers between Level 1 and Level 2 of the fair value hierarchy.
(b) Securities transactions and investment income: Securities transactions are recorded on a trade date basis. Realized gains and losses from securities transactions are recorded on the identified cost basis. Interest income, adjusted for accretion of discount and amortization of premium on investments, is earned from settlement date and recognized on the accrual basis. Securities purchased or sold on a when-issued or delayed delivery basis may be settled a month or more after the trade date.
(c) Dividends to shareholders: It is the policy of the fund to declare dividends daily from investment income-net. Such dividends are paid monthly. Dividends from net realized capital gains, if any, are normally declared and paid annually, but the fund may make distributions on a more frequent basis to comply with the distribution requirements of the Internal Revenue Code of 1986, as amended (the “Code”).To the
The Fund 37
NOTES TO FINANCIAL STATEMENTS (continued)
extent that net realized capital gains can be offset by capital loss carryovers, it is the policy of the fund not to distribute such gains. Income and capital gain distributions are determined in accordance with income tax regulations, which may differ from GAAP.
(d) Federal income taxes: It is the policy of the fund to continue to qualify as a regulated investment company, which can distribute tax-exempt dividends, by complying with the applicable provisions of the Code, and to make distributions of income and net realized capital gain sufficient to relieve it from substantially all federal income and excise taxes.
As of and during the period ended August 31, 2012, the fund did not have any liabilities for any uncertain tax positions.The fund recognizes interest and penalties, if any, related to uncertain tax positions as income tax expense in the Statement of Operations. During the period, the fund did not incur any interest or penalties.
Each of the tax years in the four-year period ended August 31, 2012 remains subject to examination by the Internal Revenue Service and state taxing authorities.
At August 31, 2012, the components of accumulated earnings on a tax basis were as follows: undistributed tax-exempt income $1,302,712, accumulated capital losses $69,133,988 and unrealized appreciation $142,178,087.
Under the Regulated Investment Company Modernization Act of 2010 (the “2010 Act”), the fund is permitted to carry forward capital losses incurred in taxable years beginning after December 22, 2010 (“post-enactment losses”) for an unlimited period. Furthermore, post-enactment capital loss carryovers retain their character as either short-term or long-term capital losses rather than short-term as they were under previous statute.The 2010 Act requires post-enactment losses to be utilized before the utilization of losses incurred in taxable years prior to the effective date of the 2010 Act (“pre-enactment losses”).As a result of this ordering rule, pre-enactment losses may be more likely to expire unused.
38
The accumulated capital loss carryover is available for federal income tax purposes to be applied against future net realized capital gains, if any, realized subsequent to August 31, 2012. If not applied, $6,826,077 of the carryover expires in fiscal year 2016, $13,380,265 expires in fiscal year 2017 and $48,927,646 expires in fiscal year 2018.
The tax character of distributions paid to shareholders during the fiscal periods ended August 31, 2012 and August 31, 2011 were as follows: tax-exempt income $60,881,635 and $71,251,980 and ordinary income $215,130 and $222,423, respectively.
During the period ended August 31, 2012, as a result of permanent book to tax differences, primarily due to the tax treatment for amortization adjustments and capital loss carryover expiration, the fund decreased accumulated undistributed investment income-net by $412,042, increased accumulated net realized gain (loss) on investments by $46,012,239 and decreased paid-in capital by $45,600,197. Net assets and net asset value per share were not affected by this reclassification.
(e) New Accounting Pronouncement: In December 2011, FASB issued Accounting Standards Update No. 2011-11 “Disclosures about Offsetting Assets and Liabilities” (“ASU 2011-11”). These disclosure requirements are intended to help investors and other financial statement users to better assess the effect or potential effect of offsetting arrangements on a company’s financial position.They also improve transparency in the reporting of how companies mitigate credit risk, including disclosure of related collateral pledged or received. In addition,ASU 2011-11 facilitates comparison between those entities that prepare their financial statements on the basis of GAAP and those entities that prepare their financial statements on the basis of International Financial Reporting Standards (“IFRS”). ASU 2011-11 requires entities to: disclose both gross and net information about both instruments and transactions eligible for offset in the financial statements; and disclose instruments and transactions subject to an agreement similar to a master netting agreement. ASU 2011-11 is effective for fiscal years beginning on or
The Fund 39
NOTES TO FINANCIAL STATEMENTS (continued)
after January 1, 2013, and interim periods within those annual periods. At this time, management is evaluating the implications of ASU 2011-11 and its impact on the funds’ financial statement disclosures.
NOTE 2—Bank Lines of Credit:
The fund participates with other Dreyfus-managed funds in a $225 million unsecured credit facility led by Citibank, N.A. and a $300 million unsecured credit facility provided by The Bank of New York Mellon, a subsidiary of BNY Mellon and an affiliate of Dreyfus (each, a “Facility”), each to be utilized primarily for temporary or emergency purposes, including the financing of redemptions. In connection therewith, the fund has agreed to pay its pro rata portion of commitment fees for each Facility. Interest is charged to the fund based on rates determined pursuant to the terms of the respective Facility at the time of borrowing. During the period ended August 31, 2012, the fund did not borrow under the Facilities.
NOTE 3—Management Fee and Other Transactions with Affiliates:
(a) Pursuant to a management agreement with the Manager, the management fee is computed at the annual rate of .60% of the value of the fund’s average daily net assets and is payable monthly.
(b) Under the Shareholder Services Plan, the fund reimburses the Distributor an amount not to exceed an annual rate of .25% of the value of the fund’s average daily net assets for certain allocated expenses of providing personal services and/or maintaining shareholder accounts. The services provided may include personal services relating to shareholder accounts, such as answering shareholder inquiries regarding the fund and providing reports and other information, and services related to the maintenance of shareholder accounts. During the period ended August 31, 2012, the fund was charged $1,013,181 pursuant to the Shareholder Services Plan.
The fund has arrangements with the transfer agent and the custodian whereby the fund may receive earnings credits when positive cash bal-
40
ances are maintained, which are used to offset transfer agency and custody fees. For financial reporting purposes, the fund includes net earnings credits as an expense offset in the Statement of Operations.
The fund compensates DreyfusTransfer, Inc. (“DTI”), a wholly-owned subsidiary of the Manager, under a transfer agency agreement for providing transfer agency services for the fund and, since May 29, 2012, cash management services related to fund subscriptions and redemptions. During the period ended August 31, 2012, the fund was charged $456,974 for transfer agency services and $4,398 for cash management services. Cash management fees were partially offset by earnings credits of $519.These fees are included in Shareholder servicing costs in the Statement of Operations.
The fund compensates The Bank of New York Mellon under a custody agreement for providing custodial services for the fund. During the period ended August 31, 2012, the fund was charged $96,544 pursuant to the custody agreement.
Prior to May 29, 2012, the fund compensated The Bank of New York Mellon under a cash management agreement for performing cash management services related to fund subscriptions and redemptions. Subsequent to May 29, 2012,The Bank of New York Mellon has continued to provide shareholder redemption draft processing services. During the period ended August 31, 2012, the fund was charged $34,409 pursuant to the cash management agreement, which is included in Shareholder servicing costs in the Statement of Operations.These fees were partially offset by earnings credits of $963.
During the period ended August 31, 2012, the fund was charged $6,392 for services performed by the Chief Compliance Officer and his staff.
The components of “Due toThe Dreyfus Corporation and affiliates” in the Statement of Assets and Liabilities consist of: management fees $868,050, custodian fees $24,099, Chief Compliance Officer fees $4,243 and transfer agency per account fees $112,191.
The Fund 41
NOTES TO FINANCIAL STATEMENTS (continued)
(c) Each Board member also serves as a Board member of other funds within the Dreyfus complex. Annual retainer fees and attendance fees are allocated to each fund based on net assets.
NOTE 4—Securities Transactions:
The aggregate amount of purchases and sales of investment securities, excluding short-term securities and swap transactions, during the period ended August 31, 2012, amounted to $463,370,251 and $490,206,227, respectively.
Inverse Floater Securities: The fund participates in secondary inverse floater structures in which fixed-rate, tax-exempt municipal bonds are transferred to a trust.The trust subsequently issues two or more variable rate securities that are collateralized by the cash flows of the fixed-rate, tax-exempt municipal bonds. One or more of these variable rate securities pays interest based on a short-term floating rate set by a remarketing agent at predetermined intervals.A residual interest tax-exempt security is also created by the trust, which is transferred to the fund, and is paid interest based on the remaining cash flow of the trust, after payment of interest on the other securities and various expenses of the trust.
The fund accounts for the transfer of bonds to the trust as secured borrowings, with the securities transferred remaining in the fund’s investments, and the related floating rate certificate securities reflected as fund liabilities in the Statement of Assets and Liabilities.
The average amount of borrowings outstanding under the inverse floater structure during the period ended August 31, 2012, was approximately $12,500,000, with a related weighted average annualized interest rate of .86%.
Derivatives: A derivative is a financial instrument whose performance is derived from the performance of another asset. Each type of derivative instrument that was held by the fund during the period ended August 31, 2012 is discussed below.
42
Swap Transactions: The fund enters into swap agreements to exchange the interest rate on, or return generated by, one nominal instrument for the return generated by another nominal instrument.The fund enters into these agreements to hedge certain market or interest rate risks, to manage the interest rate sensitivity (sometimes called duration) of fixed income securities, to provide a substitute for purchasing or selling particular securities or to increase potential returns.
The fund accrues for the interim payments on swap contracts on a daily basis, with the net amount recorded within unrealized appreciation (depreciation) on swap contracts in the Statement of Assets and Liabilities. Once the interim payments are settled in cash, the net amount is recorded as a realized gain (loss) on swaps, in addition to realized gain (loss) recorded upon the termination of swap contracts in the Statement of Operations. Upfront payments made and/or received by the fund, are recorded as an asset and/or liability in the Statement of Assets and Liabilities and are recorded as a realized gain or loss ratably over the contract’s term/event with the exception of forward starting interest rate swaps which are recorded as realized gains or losses on the termination date. Fluctuations in the value of swap contracts are recorded for financial statement purposes as unrealized appreciation or depreciation on swap transactions.
Interest Rate Swaps: Interest rate swaps involve the exchange of commitments to pay and receive interest based on a notional principal amount. The fund may elect to pay a fixed rate and receive a floating rate, or receive a fixed rate and pay a floating rate on a notional principal amount.The net interest received or paid on interest rate swap agreements is included within unrealized appreciation (depreciation) on swap contracts in the Statement of Assets and Liabilities. Interest rate swaps are valued daily and the change, if any, is recorded as an unrealized gain or loss in the Statement of Operations.When a swap contract is terminated early, the fund records a realized gain or loss equal to the difference
The Fund 43
NOTES TO FINANCIAL STATEMENTS (continued)
between the current realized value and the expected cash flows. For financial reporting purposes, forward rate agreements are classified as interest rate swaps.
The fund’s maximum risk of loss from counterparty credit risk is the discounted value of the cash flows to be received from the counter-party over the contract’s remaining life, to the extent that the amount is positive. This risk is mitigated by having a master netting arrangement between the fund and the counterparty and by the posting of collateral by the counterparty to the fund to cover the fund’s exposure to the counterparty. The following summarizes open interest rate swaps entered into by the fund at August 31, 2012:
| Unrealized | ||||||
| Notional | Reference | Base Index | Determination | Appreciation | ||
| Amount ($) | Counterparty | Index | Value | Date (Depreciation) ($) | ||
| 30,000,000 | Citibank | Forward Rate | 2.03 | 11/15/2012 | 571,003 | |
| Agreement, | ||||||
| Municipal Market | ||||||
| Data General | ||||||
| Obligation, 2022, | ||||||
| AAA Indexa | ||||||
| 48,000,000 | Citibank | Forward Rate | 1.99 | 11/15/2012 | 721,774 | |
| Agreement, | ||||||
| Municipal Market | ||||||
| Data General | ||||||
| Obligation, 2022, | ||||||
| AAA Indexa | ||||||
| 18,750,000 | Citibank | Forward Rate | 2.83 | 11/15/2012 | (695,803 | ) |
| Agreement, | ||||||
| Municipal Market | ||||||
| Data General | ||||||
| Obligation, 2032, | ||||||
| AAA Indexa | ||||||
| 32,000,000 | Citibank | Forward Rate | 2.78 | 11/15/2012 | (873,498 | ) |
| Agreement, | ||||||
| Municipal Market | ||||||
| Data General | ||||||
| Obligation, 2032, | ||||||
| AAA Indexa | ||||||
| Gross Unrealized | ||||||
| Appreciation | 1,292,777 | |||||
| Gross Unrealized | ||||||
| Depreciation | (1,569,301 | ) | ||||
a The fund will receive a payment from the counterparty if the value of the reference index is less
than the base index value on the determination date.The fund will make a payment to the
counterparty if the value of the reference index is greater than the base index value on the
determination date.
44
The following summarizes the average notional value of swap contracts outstanding during the period ended August 31, 2012:
| Average Market Value ($) | |
| Interest rate swap contracts | 17,134,615 |
At August 31, 2012, the cost of investments for federal income tax purposes was $1,580,358,076; accordingly, accumulated net unrealized appreciation on investments was $142,454,611, consisting of $145,216,787 gross unrealized appreciation and $2,762,176 gross unrealized depreciation.
The Fund 45
REPORT OF INDEPENDENT REGISTERED
PUBLIC ACCOUNTING FIRM
Shareholders and Board of Directors
Dreyfus Municipal Bond Fund
We have audited the accompanying statement of assets and liabilities, including the statement of investments, of Dreyfus Municipal Bond Fund (the sole series comprising Dreyfus Bond Funds, Inc.) as of August 31, 2012, and the related statement of operations for the year then ended, the statement of changes in net assets for each of the two years in the period then ended, and the financial highlights for each of the five years in the period then ended.These financial statements and financial highlights are the responsibility of the Fund’s management. Our responsibility is to express an opinion on these financial statements and financial highlights based on our audits.
We conducted our audits in accordance with the standards of the Public Company Accounting Oversight Board (United States).Those standards require that we plan and perform the audit to obtain reasonable assurance about whether the financial statements and financial highlights are free of material misstatement. We were not engaged to perform an audit of the Fund’s internal control over financial reporting. Our audits included consideration of internal control over financial reporting as a basis for designing audit procedures that are appropriate in the circumstances, but not for the purpose of expressing an opinion on the effectiveness of the Fund’s internal control over financial reporting. Accordingly, we express no such opinion. An audit also includes examining, on a test basis, evidence supporting the amounts and disclosures in the financial statements and financial highlights, assessing the accounting principles used and significant estimates made by management, and evaluating the overall financial statement presentation. Our procedures included confirmation of securities owned as of August 31, 2012 by correspondence with the custodian and others.We believe that our audits provide a reasonable basis for our opinion.
In our opinion, the financial statements and financial highlights referred to above present fairly, in all material respects, the financial position of Dreyfus Municipal Bond Fund at August 31, 2012, the results of its operations for the year then ended, the changes in its net assets for each of the two years in the period then ended, and the financial highlights for each of the five years in the period then ended, in conformity with U.S. generally accepted accounting principles.

New York, New York
October 29, 2012
46
IMPORTANT TAX INFORMATION (Unaudited)
In accordance with federal tax law, the fund hereby reports all the dividends paid from investment income-net during its fiscal year ended August 31, 2012 as “exempt-interest dividends” (not generally subject to regular federal income tax), except $215,130 that is being reported as an ordinary income distribution for reporting purposes.
Where required by federal tax law rules, shareholders will receive notification of their portion of the fund’s taxable ordinary dividends (if any), capital gains distributions (if any) and tax-exempt dividends paid for the 2012 calendar year on Form 1099-DIV, which will be mailed in early 2013.
The Fund 47
BOARD MEMBERS INFORMATION (Unaudited)

48
The Fund 49
BOARD MEMBERS INFORMATION (Unaudited) (continued)

Once elected all Board Members serve for an indefinite term, but achieve Emeritus status upon reaching age 80.The address of the Board Members and Officers is c/o The Dreyfus Corporation, 200 Park Avenue, NewYork, NewYork 10166.Additional information about the Board Members is available in the fund’s Statement of Additional Information which can be obtained from Dreyfus free of charge by calling this toll free number: 1-800-DREYFUS.
David W. Burke, Emeritus Board Member
Arnold S. Hiatt, Emeritus Board Member
50
OFFICERS OF THE FUND (Unaudited)
The Fund 51
OFFICERS OF THE FUND (Unaudited) (continued)

52
For More Information

Ticker Symbol: DRTAX
Telephone 1-800-DREYFUS
Mail The Dreyfus Family of Funds, 144 Glenn Curtiss Boulevard, Uniondale, NY 11556-0144
E-mail Send your request to info@dreyfus.com
Internet Information can be viewed online or downloaded at: http://www.dreyfus.com
The fund files its complete schedule of portfolio holdings with the Securities and Exchange
Commission (“SEC”) for the first and third quarters of each fiscal year on Form N-Q. The
fund’s Forms N-Q are available on the SEC’s website at http://www.sec.gov and may be
reviewed and copied at the SEC’s Public Reference Room in Washington, DC. Information on
the operation of the Public Reference Room may be obtained by calling 1-800-SEC-0330.
Information regarding how the fund voted proxies relating to portfolio securities for
the most recent 12-month period ended June 30 is available on the SEC’s website at
http://www.sec.gov and without charge, upon request, by calling 1-800-DREYFUS.

| © 2012 MBSC Securities Corporation |
Item 2. Code of Ethics.
The Registrant has adopted a code of ethics that applies to the Registrant's principal executive officer, principal financial officer, principal accounting officer or controller, or persons performing similar functions. There have been no amendments to, or waivers in connection with, the Code of Ethics during the period covered by this Report.
Item 3. Audit Committee Financial Expert.
The Registrant's Board has determined that Ehud Houminer, a member of the Audit Committee of the Board, is an audit committee financial expert as defined by the Securities and Exchange Commission (the "SEC"). Ehud Houminer is "independent" as defined by the SEC for purposes of audit committee financial expert determinations.
Item 4. Principal Accountant Fees and Services.
(a) Audit Fees. The aggregate fees billed for each of the last two fiscal years (the "Reporting Periods") for professional services rendered by the Registrant's principal accountant (the "Auditor") for the audit of the Registrant's annual financial statements or services that are normally provided by the Auditor in connection with the statutory and regulatory filings or engagements for the Reporting Periods, were $30,312 in 2011 and $31,401 in 2012.
(b) Audit-Related Fees. The aggregate fees billed in the Reporting Periods for assurance and related services by the Auditor that are reasonably related to the performance of the audit of the Registrant's financial statements and are not reported under paragraph (a) of this Item 4 were $6,000 in 2011 and $6,000 in 2012. These services consisted of one or more of the following: (i) agreed upon procedures related to compliance with Internal Revenue Code section 817(h), (ii) security counts required by Rule 17f-2 under the Investment Company Act of 1940, as amended, (iii) advisory services as to the accounting or disclosure treatment of Registrant transactions or events and (iv) advisory services to the accounting or disclosure treatment of the actual or potential impact to the Registrant of final or proposed rules, standards or interpretations by the Securities and Exchange Commission, the Financial Accounting Standards Boards or other regulatory or standard-setting bodies.
The aggregate fees billed in the Reporting Periods for non-audit assurance and related services by the Auditor to the Registrant's investment adviser (not including any sub-investment adviser whose role is primarily portfolio management and is subcontracted with or overseen by another investment adviser), and any entity controlling, controlled by or under common control with the investment adviser that provides ongoing services to the Registrant ("Service Affiliates"), that were reasonably related to the performance of the annual audit of the Service Affiliate, which required pre-approval by the Audit Committee were $ 0 in 2011 and $0 in 2012.
(c) Tax Fees. The aggregate fees billed in the Reporting Periods for professional services rendered by the Auditor for tax compliance, tax advice, and tax planning ("Tax Services") were $3,098 in 2011 and $3,249 in 2012. These services consisted of: (i) review or preparation of U.S. federal, state, local and excise tax returns; (ii) U.S. federal, state and local tax planning, advice and assistance regarding statutory, regulatory or administrative developments; and (iii) tax advice regarding tax qualification matters and/or treatment of various financial instruments held or proposed to be acquired or held. The aggregate fees billed in the Reporting Periods for Tax Services by the Auditor to Service Affiliates, which required pre-approval by the Audit Committee were $0 in 2011 and $0 in 2012.
(d) All Other Fees. The aggregate fees billed in the Reporting Periods for products and services provided by the Auditor, other than the services reported in paragraphs (a) through (c) of this Item, were $507 in 2011 and $2,124 in 2012. [These services consisted of a review of the Registrant's anti-money laundering program].
The aggregate fees billed in the Reporting Periods for Non-Audit Services by the Auditor to Service Affiliates, other than the services reported in paragraphs (b) through (c) of this Item, which required pre-approval by the Audit Committee, were $200,000 in 2012.
(e)(1) Audit Committee Pre-Approval Policies and Procedures. The Registrant's Audit Committee has established policies and procedures (the "Policy") for pre-approval (within specified fee limits) of the Auditor's engagements for non-audit services to the Registrant and Service Affiliates without specific case-by-case consideration. The pre-approved services in the Policy can include pre-approved audit services, pre-approved audit-related services, pre-approved tax services and pre-approved all other services. Pre-approval considerations include whether the proposed services are compatible with maintaining the Auditor's independence. Pre-approvals pursuant to the Policy are considered annually.
(e)(2) Note: None of the services described in paragraphs (b) through (d) of this Item 4 were approved by the Audit Committee pursuant to paragraph (c)(7)(i)(C) of Rule 2-01 of Regulation S-X.
(f) None of the hours expended on the principal accountant's engagement to audit the registrant's financial statements for the most recent fiscal year were attributed to work performed by persons other than the principal account's full-time, permanent employees.
Non-Audit Fees. The aggregate non-audit fees billed by the Auditor for services rendered to the Registrant, and rendered to Service Affiliates, for the Reporting Periods were $16,103,335 in 2011 and $41,730,768 in 2012.
Auditor Independence. The Registrant's Audit Committee has considered whether the provision of non-audit services that were rendered to Service Affiliates, which were not pre-approved (not requiring pre-approval), is compatible with maintaining the Auditor's independence.
Item 5. Audit Committee of Listed Registrants.
Not applicable. [CLOSED-END FUNDS ONLY]
Item 6. Investments.
(a) Not applicable.
Item 7. Disclosure of Proxy Voting Policies and Procedures for Closed-End Management Investment Companies.
Not applicable. [CLOSED-END FUNDS ONLY]
Item 8. Portfolio Managers of Closed-End Management Investment Companies.
Not applicable. [CLOSED-END FUNDS ONLY, beginning with reports for periods ended on and after December 31, 2005]
Item 9. Purchases of Equity Securities by Closed-End Management Investment Companies and Affiliated Purchasers.
Not applicable. [CLOSED-END FUNDS ONLY]
Item 10. Submission of Matters to a Vote of Security Holders.
There have been no material changes to the procedures applicable to Item 10.
Item 11. Controls and Procedures.
(a) The Registrant's principal executive and principal financial officers have concluded, based on their evaluation of the Registrant's disclosure controls and procedures as of a date within 90 days of the filing date of this report, that the Registrant's disclosure controls and procedures are reasonably designed to ensure that information required to be disclosed by the Registrant on Form N-CSR is recorded, processed, summarized and reported within the required time periods and that information required to be disclosed by the Registrant in the reports that it files or submits on Form N-CSR is accumulated and communicated to the Registrant's management, including its principal executive and principal financial officers, as appropriate to allow timely decisions regarding required disclosure.
(b) There were no changes to the Registrant's internal control over financial reporting that occurred during the second fiscal quarter of the period covered by this report that have materially affected, or are reasonably likely to materially affect, the Registrant's internal control over financial reporting.
Item 12. Exhibits.
(a)(1) Code of ethics referred to in Item 2.
(a)(2) Certifications of principal executive and principal financial officers as required by Rule 30a-2(a) under the Investment Company Act of 1940.
(a)(3) Not applicable.
(b) Certification of principal executive and principal financial officers as required by Rule 30a-2(b) under the Investment Company Act of 1940.
SIGNATURES
Pursuant to the requirements of the Securities Exchange Act of 1934 and the Investment Company Act of 1940, the Registrant has duly caused this Report to be signed on its behalf by the undersigned, thereunto duly authorized.
Dreyfus Bond Funds, Inc.
By: /s/Bradley J. Skapyak | |
Bradley J. Skapyak, President
| |
Date: | October 22, 2012 |
| |
Pursuant to the requirements of the Securities Exchange Act of 1934 and the Investment Company Act of 1940, this Report has been signed below by the following persons on behalf of the Registrant and in the capacities and on the dates indicated. | |
| |
By: /s/Bradley J. Skapyak | |
Bradley J. Skapyak, President
| |
Date: | October 22, 2012 |
| |
By: /s/James Windels | |
James Windels, Treasurer
| |
Date: | October 22, 2012 |
| |
EXHIBIT INDEX
(a)(1) Code of ethics referred to in Item 2.
(a)(2) Certifications of principal executive and principal financial officers as required by Rule 30a-2(a) under the Investment Company Act of 1940. (EX-99.CERT)
(b) Certification of principal executive and principal financial officers as required by Rule 30a-2(b) under the Investment Company Act of 1940. (EX-99.906CERT)