UNITED STATES
SECURITIES AND EXCHANGE COMMISSION
Washington, D.C. 20549
FORM N-CSR
CERTIFIED SHAREHOLDER REPORT OF REGISTERED MANAGEMENT
INVESTMENT COMPANIES
Investment Company Act file number | 811-2653 | |||||
|
| |||||
| Dreyfus Bond Funds, Inc. |
| ||||
| (Exact name of Registrant as specified in charter) |
| ||||
|
|
| ||||
|
c/o The Dreyfus Corporation 200 Park Avenue New York, New York 10166 |
| ||||
| (Address of principal executive offices) (Zip code) |
| ||||
|
|
| ||||
| Bennett MacDougall, Esq. 200 Park Avenue New York, New York 10166 |
| ||||
| (Name and address of agent for service) |
| ||||
| ||||||
Registrant's telephone number, including area code: | (212) 922-6000 | |||||
|
| |||||
Date of fiscal year end:
| 8/31 |
| ||||
Date of reporting period: | 8/31/15 |
| ||||

Dreyfus Municipal Bond Fund
| ANNUAL REPORT August 31, 2015 |

|

Save time. Save paper. View your next shareholder report online as soon as it’s available. Log into www.dreyfus.com and sign up for Dreyfus eCommunications. It’s simple and only takes a few minutes. |
The views expressed in this report reflect those of the portfolio manager only through the end of the period covered and do not necessarily represent the views of Dreyfus or any other person in the Dreyfus organization. Any such views are subject to change at any time based upon market or other conditions and Dreyfus disclaims any responsibility to update such views. These views may not be relied on as investment advice and, because investment decisions for a Dreyfus fund are based on numerous factors, may not be relied on as an indication of trading intent on behalf of any Dreyfus fund. |
Not FDIC-Insured • Not Bank-Guaranteed • May Lose Value |
Contents
T H E F U N D
With Those of Other Funds | |
Public Accounting Firm | |
F O R M O R E I N F O R M AT I O N
Back Cover
| The Fund |
Dear Shareholder:
We are pleased to present this annual report for Dreyfus Municipal Bond Fund, covering the 12-month period from September 1, 2014, through August 31, 2015. For information about how the fund performed during the reporting period, as well as general market perspectives, we provide a Discussion of Fund Performance on the pages that follow.
Financial markets proved volatile over the reporting period. For much of the year, a recovering U.S. economy enabled stocks to advance, but those gains were more than erased in August when economic concerns in China, falling commodity prices and a stronger U.S. dollar sparked sharp corrections in equity markets throughout the world. The emerging markets were especially hard hit in this environment. U.S. bonds generally fared better, rallying in late 2014 due to robust investor demand before reversing course in the spring as the domestic economy strengthened. Global economic instability in August hurt corporate-backed and inflation-linked bonds, but U.S. government securities held up relatively well.
We expect market uncertainty and volatility to persist over the near term as investors vacillate between hopes that current market turmoil represents a healthy correction and fears that further disappointments could trigger a full-blown bear market. Our investment strategists and portfolio managers are monitoring developments carefully, keeping a close watch on Chinese fiscal and monetary policy, liquidity factors affecting various asset classes, and other developments that could influence investor sentiment. Over the longer term, we remain confident that financial markets are likely to stabilize as the world adjusts to slower Chinese economic growth, abundant energy resources, and the anticipated eventual normalization of monetary policy. In our view, investors will continue to be well served under these circumstances by a long-term perspective and a disciplined investment approach.
Thank you for your continued confidence and support.
Sincerely,

J. Charles Cardona
President
The Dreyfus Corporation
September 15, 2015
2
DISCUSSION OF FUND PERFORMANCE
For the period of September 1, 2014, through August 31, 2015, as provided by Daniel Marques and Daniel Rabasco, Primary Portfolio Managers
Fund and Market Performance Overview
For the 12-month period ended August 31, 2015, Dreyfus Municipal Bond Fund achieved a total return of 2.67%.1 In comparison, the fund’s benchmark, the Barclays Municipal Bond Index, produced a total return of 2.52%.2
Municipal bonds generally produced modestly positive returns, as declines triggered by rising long-term interest rates during the spring of 2015 were more than offset by rallies early and late in the reporting period. The fund produced higher returns than its benchmark, mainly due to our emphasis on higher yielding revenue-backed bonds.
The Fund’s Investment Approach
The fund seeks to maximize current income exempt from federal income tax, to the extent consistent with the preservation of capital.
To pursue this goal, the fund normally invests substantially all of its net assets in municipal bonds that provide income exempt from federal income tax. The fund generally will invest at least 75% of its assets in municipal bonds rated A or better or the unrated equivalent as determined by Dreyfus. The fund may invest up to 25% of its assets in municipal bonds rated below A or the unrated equivalent as determined by Dreyfus, including bonds rated below investment grade quality (“high yield” or “junk” bonds). The dollar-weighted average maturity of the fund’s portfolio is not restricted, but normally exceeds 10 years.
We focus on identifying undervalued sectors and securities, and minimize the use of interest-rate forecasting. The portfolio managers select municipal bonds for the fund’s portfolio by:
• Using fundamental credit analysis to estimate the relative value and attractiveness of various sectors and securities, and to exploit pricing inefficiencies in the municipal bond market.
• Actively trading among various sectors, such as pre-refunded, general obligation, and revenue, based on their apparent relative values. The fund seeks to invest in several of these sectors.
Fluctuating Interest Rates Sparked Market Volatility
During the reporting period, the financial markets were plagued by higher degrees of volatility. Over the final four months of 2014, global investors seeking more competitive yields than were available in overseas markets flocked to higher yielding investments in the United States, and the resulting supply-and-demand imbalance put downward pressure on U.S. bond yields. This trend began to reverse in early 2015 as investors focused on economic data and the possibility of the Federal Reserve taking a less accommodative stance on monetary policy. Longer term interest rates began to climb when economic growth reaccelerated in the spring and as time progressed during the reporting period, investors anticipated the Federal Reserve would begin to raise short-term interest rates. However,
3
DISCUSSION OF FUND PERFORMANCE (continued)
renewed concerns about sluggish global economic growth, particularly China’s weakening economy, helped push bond yields lower and prices higher in the final weeks of the reporting period.
Municipal bonds were somewhat less volatile than other asset classes as investors were attracted to their favorable after-tax yields. After experiencing robust demand for a limited supply of newly issued bonds during 2014, issuance volumes climbed dramatically during 2015 as issuers rushed to refinance existing debt before expected increases in interest rates. Significant reinvestment by retail investors supported the municipal bond market and absorbed these higher levels of supply.
Underlying credit conditions generally continued to improve not withstanding the well-publicized financial and pension obligation challenges faced by Puerto Rico, Illinois and New Jersey. Many states and local municipalities have seen tax revenues climb beyond pre-recession levels enabling them to balance their budgets, replenish reserves and reduce debt levels.
Revenue Bonds Buoyed Relative Results
Our sector allocation strategy emphasizing higher yielding revenue bonds compared to general obligation and escrowed bonds proved effective over the reporting period. The fund achieved particularly favorable results through bonds backed by hospitals and the states’ settlement of litigation with U.S. tobacco companies. Conversely, the fund avoided some of the weaker segments of the municipal bond market, most notably Puerto Rico bonds that were hurt by the U.S. territory’s deteriorating fiscal condition. On the other hand, the fund’s relative results were constrained to a degree by Illinois bonds that lost value after a credit-rating downgrade stemming from a budget impasse.
Relative performance also was aided by our interest-rate strategies. A modestly long average duration compared to the benchmark and an emphasis on longer maturities helped the fund benefit during times of falling long-term interest rates. Longer maturities also produced higher levels of income in taking advantage of a relatively steep yield curve.
A Generally Constructive Investment Posture
We expect market volatility to persist over the near term in anticipation of higher short-term interest rates, but we remain optimistic about the market’s longer term prospects in a growing U.S. economy. Therefore, we will be taking advantage of bouts of market volatility to purchase fundamentally sound credits at attractive prices, including A- and BBB-rated revenue bonds backed by airports, hospitals, water-and-sewer facilities and public power plants. At the same time, we are focusing on securities with relatively defensive characteristics — including premium coupons and call features that mitigate extension risk — that can help protect the portfolio if interest rates rise.
September 15, 2015
Bond funds are subject generally to interest rate, credit, liquidity, and market risks, to varying degrees, all of which are more fully described in the fund’s prospectus. Generally, all other factors being equal, bond prices are inversely related to interest-rate changes, and rate increases can cause price declines. High yield bond funds involve increased credit and liquidity risk compared with higher quality bond funds. Below-investment-grade bonds are considered speculative as to the continuing ability of an issuer to make interest payments and repay principal.
4
The use of derivatives involves risks different from, or possibly greater than, the risks associated with investing directly in the underlying assets. Derivatives can be highly volatile, illiquid, and difficult to value, and there is the risk that changes in the value of a derivative held by the fund will not correlate with the underlying instruments or the fund’s other investments.
Auction rate securities include preferred shares of closed-end funds, long-term debt issued by municipalities, and many other taxable and tax-exempt issuers. The dividend rates on these securities generally reset through bank managed auctions periodically, including periods ranging from seven days to 35 days.
1 Total return includes reinvestment of dividends and any capital gains paid. Past performance is no guarantee of future results. Share price, yield, and investment return fluctuate such that upon redemption, fund shares may be worth more or less than their original cost. Income may be subject to state and local taxes, and some income may be subject to the federal alternative minimum tax (AMT) for certain investors. Capital gains, if any, are fully taxable.
2 SOURCE: LIPPER INC. — Reflects reinvestment of dividends and, where applicable, capital gain distributions. The Barclays Municipal Bond Index is a widely accepted, unmanaged total return performance benchmark for the long-term, investment-grade, tax-exempt bond market. Index returns do not reflect fees and expenses associated with operating a mutual fund. Investors cannot invest directly in any index.
5
FUND PERFORMANCE
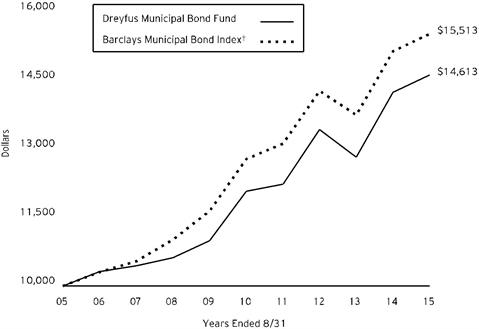
Comparison of change in value of $10,000 investment in Dreyfus Municipal Bond Fund and the Barclays Municipal Bond Index
Average Annual Total Returns as of 8/31/15 | |||
| 1 Year | 5 Years | 10 Years |
Fund | 2.67% | 3.90% | 3.87% |
Barclays Municipal Bond Index | 2.52% | 3.96% | 4.49% |
† Source: Lipper Inc.
Past performance is not predictive of future performance. The fund’s performance shown in the graph and table does not reflect the deduction of taxes that a shareholder would pay on fund distributions or the redemption of fund shares.
The above graph compares a $10,000 investment made in Dreyfus Municipal Bond Fund on 8/31/05 to a $10,000 investment made in the Barclays Municipal Bond Index (the “Index”) on that date. All dividends and capital gain distributions are reinvested.
The fund invests primarily in municipal securities and its performance shown in the line graph takes into account fees and expenses. The Index is an unmanaged total return performance benchmark for the long-term, investment-grade, tax-exempt bond market. Unlike a mutual fund, the Index is not subject to charges, fees and other expenses. Investors cannot invest directly in any index. Further information relating to fund performance, including expense reimbursements, if applicable, is contained in the Financial Highlights section of the prospectus and elsewhere in this report.
6
UNDERSTANDING YOUR FUND’S EXPENSES (Unaudited)
As a mutual fund investor, you pay ongoing expenses, such as management fees and other expenses. Using the information below, you can estimate how these expenses affect your investment and compare them with the expenses of other funds. You also may pay one-time transaction expenses, including sales charges (loads) and redemption fees, which are not shown in this section and would have resulted in higher total expenses. For more information, see your fund’s prospectus or talk to your financial adviser.
Review your fund’s expenses
The table below shows the expenses you would have paid on a $1,000 investment in Dreyfus Municipal Bond Fund from March 1, 2015 to August 31, 2015. It also shows how much a $1,000 investment would be worth at the close of the period, assuming actual returns and expenses.
Expenses and Value of a $1,000 Investment | ||||||||
assuming actual returns for the six months ended August 31, 2015 | ||||||||
| ||||||||
Expenses paid per $1,000† | $ 3.84 | |||||||
Ending value (after expenses) | $1,004.10 | |||||||
COMPARING YOUR FUND’S EXPENSES
WITH THOSE OF OTHER FUNDS (Unaudited)
Using the SEC’s method to compare expenses
The Securities and Exchange Commission (SEC) has established guidelines to help investors assess fund expenses. Per these guidelines, the table below shows your fund’s expenses based on a $1,000 investment, assuming a hypothetical 5% annualized return. You can use this information to compare the ongoing expenses (but not transaction expenses or total cost) of investing in the fund with those of other funds. All mutual fund shareholder reports will provide this information to help you make this comparison. Please note that you cannot use this information to estimate your actual ending account balance and expenses paid during the period.
Expenses and Value of a $1,000 Investment | ||||||
assuming a hypothetical 5% annualized return for the six months ended August 31, 2015 | ||||||
| ||||||
Expenses paid per $1,000† | $ 3.87 | |||||
Ending value (after expenses) | $1,021.37 | |||||
† Expenses are equal to the fund’s annualized expense ratio of .76%, multiplied by the average account value over the period, multiplied
by 184/365 (to reflect the one-half year period).
7
STATEMENT OF INVESTMENTS
August 31, 2015
||ANAME||
Long-Term Municipal Investments - 97.4% | Coupon | Maturity | Principal | Value ($) | |||||||
Alabama - 2.0% | |||||||||||
Jefferson County, | |||||||||||
Limited Obligation School Warrants | 5.25 | 1/1/20 | 15,000,000 | 15,092,250 | |||||||
Jefferson County, | |||||||||||
Senior Lien Sewer Revenue Warrants (Insured; Assured Guaranty Municipal Corp.) | 0/6.60 | 10/1/42 | 20,000,000 | a | 13,897,600 | ||||||
28,989,850 | |||||||||||
Alaska - .8% | |||||||||||
Alaska Energy Authority, | |||||||||||
Power Revenue (Bradley Lake Hydroelectric Project) | 6.00 | 7/1/17 | 5,730,000 | 6,272,230 | |||||||
Northern Tobacco Securitization Corporation of Alaska, | |||||||||||
Tobacco Settlement Asset-Backed Bonds | 5.00 | 6/1/46 | 6,850,000 | 5,296,763 | |||||||
11,568,993 | |||||||||||
Arizona - 1.9% | |||||||||||
Mohave County Industrial Development Authority, | |||||||||||
Correctional Facilities Contract Revenue (Mohave Prison, LLC Expansion Project) | 8.00 | 5/1/25 | 9,000,000 | 10,003,230 | |||||||
Pima County Industrial Development Authority, | |||||||||||
Education Revenue (American Charter Schools Foundation Project) | 5.63 | 7/1/38 | 5,750,000 | 5,381,712 | |||||||
Pima County Industrial Development Authority, | |||||||||||
IDR (Tucson Electric Power Company Project) | 5.25 | 10/1/40 | 4,185,000 | 4,598,855 | |||||||
Salt Verde Financial Corporation, | |||||||||||
Senior Gas Revenue | 5.00 | 12/1/37 | 7,000,000 | 7,602,070 | |||||||
27,585,867 | |||||||||||
California - 15.4% | |||||||||||
Bay Area Toll Authority, | |||||||||||
San Francisco Bay Area Toll Bridge Revenue | 5.00 | 4/1/28 | 5,000,000 | 5,834,500 | |||||||
California, | |||||||||||
GO (Various Purpose) | 5.63 | 4/1/25 | 3,500,000 | 4,057,620 | |||||||
California, | |||||||||||
GO (Various Purpose) | 5.75 | 4/1/31 | 13,325,000 | 15,440,077 | |||||||
California, | |||||||||||
GO (Various Purpose) | 6.50 | 4/1/33 | 15,000,000 | 17,774,250 | |||||||
California, | |||||||||||
GO (Various Purpose) | 6.00 | 11/1/35 | 14,000,000 | 16,691,500 | |||||||
California County Tobacco Securitization Agency, | |||||||||||
Tobacco Settlement Asset-Backed Refunding Bonds | 5.00 | 6/1/34 | 5,295,000 | 5,717,806 | |||||||
California Department of Veterans Affairs, | |||||||||||
Home Purchase Revenue | 5.00 | 12/1/42 | 8,000,000 | 8,110,720 | |||||||
California Department of Water Resources, | |||||||||||
8
Long-Term Municipal Investments - 97.4% (continued) | Coupon | Maturity | Principal | Value ($) | |||||||||
California - 15.4% (continued) | |||||||||||||
Water System Revenue (Central Valley Project) (Prerefunded) | 5.00 | 6/1/18 | 5,000,000 | b | 5,574,600 | ||||||||
California Educational Facilities Authority, | |||||||||||||
Revenue (University of Southern California) | 5.25 | 10/1/38 | 4,000,000 | 4,459,560 | |||||||||
California State Public Works Board, | |||||||||||||
LR (Department of Corrections and Rehabilitation) (Various Correctional Facilities) | 5.00 | 9/1/28 | 5,000,000 | 5,846,600 | |||||||||
California State Public Works Board, | |||||||||||||
LR (Various Capital Projects) | 5.00 | 12/1/25 | 5,000,000 | 6,021,000 | |||||||||
California State Public Works Board, | |||||||||||||
LR (Various Capital Projects) | 5.00 | 11/1/38 | 2,500,000 | 2,821,050 | |||||||||
California Statewide Communities Development Authority, | |||||||||||||
Revenue (Kaiser Permanente) | 5.00 | 4/1/42 | 5,525,000 | 6,064,571 | |||||||||
California Statewide Communities Development Authority, | |||||||||||||
Revenue (Sutter Health) | 5.50 | 8/15/26 | 5,000,000 | 5,780,800 | |||||||||
Chula Vista, | |||||||||||||
IDR (San Diego Gas and Electric Company) | 5.88 | 2/15/34 | 5,000,000 | 5,739,100 | |||||||||
Coast Community College District, | |||||||||||||
GO (Insured; Assured Guaranty Municipal Corp.) | 5.00 | 8/1/29 | 15,000,000 | 16,557,150 | |||||||||
Golden State Tobacco Securitization Corporation, | |||||||||||||
Tobacco Settlement Asset-Backed Bonds | 4.50 | 6/1/27 | 4,655,000 | 4,442,965 | |||||||||
Los Angeles Department of Airports, | |||||||||||||
Senior Revenue (Los Angeles International Airport) | 5.00 | 5/15/28 | 2,850,000 | 3,250,254 | |||||||||
Los Angeles Department of Airports, | |||||||||||||
Senior Revenue (Los Angeles International Airport) | 5.00 | 5/15/33 | 5,000,000 | 5,613,700 | |||||||||
Los Angeles Department of Water and Power, | |||||||||||||
Power System Revenue | 5.00 | 7/1/20 | 6,450,000 | 7,551,273 | |||||||||
Los Angeles Department of Water and Power, | |||||||||||||
Power System Revenue | 5.00 | 7/1/35 | 5,750,000 | 6,588,292 | |||||||||
Los Angeles Unified School District, | |||||||||||||
GO | 5.00 | 7/1/21 | 11,000,000 | 13,041,490 | |||||||||
Modesto Irrigation District, | |||||||||||||
Electric System Revenue | 5.00 | 7/1/21 | 3,515,000 | 4,161,971 | |||||||||
Sacramento County, | |||||||||||||
Airport System Senior Revenue | 5.75 | 7/1/39 | 10,260,000 | 11,433,231 | |||||||||
San Diego County Regional Airport Authority, | |||||||||||||
Senior Airport Revenue | 5.00 | 7/1/43 | 6,000,000 | 6,504,720 | |||||||||
San Francisco City and County Airport Commission, | |||||||||||||
Second Series Revenue | 5.75 | 5/1/22 | 7,000,000 | 7,807,450 | |||||||||
9
STATEMENT OF INVESTMENTS (continued)
Long-Term Municipal Investments - 97.4% (continued) | Coupon | Maturity | Principal | Value ($) | ||||||||
California - 15.4% (continued) | ||||||||||||
San Francisco City and County Public Utilities Commission, | ||||||||||||
San Francisco Water Revenue | 5.50 | 11/1/30 | 10,000,000 | 11,923,400 | ||||||||
University of California Regents, | ||||||||||||
Medical Center Pooled Revenue | 5.00 | 5/15/43 | 5,000,000 | 5,523,800 | ||||||||
220,333,450 | ||||||||||||
Colorado - 2.3% | ||||||||||||
City and County of Denver, | ||||||||||||
Airport System Subordinate Revenue | 5.50 | 11/15/27 | 6,000,000 | 7,017,060 | ||||||||
City and County of Denver, | ||||||||||||
Airport System Subordinate Revenue | 5.25 | 11/15/43 | 6,000,000 | 6,563,760 | ||||||||
Colorado Health Facilities Authority, | ||||||||||||
Revenue (Sisters of Charity of Leavenworth Health System) | 5.25 | 1/1/25 | 4,000,000 | 4,531,600 | ||||||||
Colorado Springs, | ||||||||||||
Utilities System Revenue | 5.00 | 11/15/23 | 2,955,000 | 3,501,616 | ||||||||
E-470 Public Highway Authority, | ||||||||||||
Senior Revenue | 0.00 | 9/1/20 | 6,740,000 | c | 6,081,974 | |||||||
University of Colorado Regents, | ||||||||||||
University Enterprise Revenue | 5.25 | 6/1/36 | 5,000,000 | 5,643,400 | ||||||||
33,339,410 | ||||||||||||
Connecticut - 1.1% | ||||||||||||
Connecticut, | ||||||||||||
Special Tax Obligation Revenue | 5.00 | 10/1/29 | 2,500,000 | 2,895,350 | ||||||||
Connecticut, | ||||||||||||
Special Tax Obligation Revenue | 5.00 | 9/1/33 | 6,000,000 | 6,818,700 | ||||||||
Hartford County Metropolitan District, | ||||||||||||
Clean Water Project Revenue (Green Bonds) | 5.00 | 11/1/34 | 5,025,000 | 5,790,207 | ||||||||
15,504,257 | ||||||||||||
Delaware - .5% | ||||||||||||
Delaware Transportation Authority, | ||||||||||||
Transportation System Senior Revenue | 5.00 | 7/1/26 | 6,245,000 | 7,039,988 | ||||||||
Florida - 8.8% | ||||||||||||
Broward County, | ||||||||||||
Port Facilities Revenue | 5.00 | 9/1/22 | 6,000,000 | 6,829,680 | ||||||||
Citizens Property Insurance Corporation, | ||||||||||||
Coastal Account Senior Secured Revenue | 5.00 | 6/1/20 | 7,000,000 | 8,047,690 | ||||||||
Citizens Property Insurance Corporation, | ||||||||||||
Coastal Account Senior Secured Revenue | 5.00 | 6/1/25 | 30,000,000 | 35,740,200 | ||||||||
Citizens Property Insurance Corporation, | ||||||||||||
Personal Lines Account/Commercial Lines Account Senior Secured Revenue | 5.00 | 6/1/22 | 8,000,000 | 9,375,520 | ||||||||
Florida Department of Transportation, | ||||||||||||
Turnpike Revenue | 5.00 | 7/1/24 | 5,630,000 | 6,704,936 | ||||||||
Florida Housing Finance Corporation, | ||||||||||||
Homeowner Mortgage Revenue (Collateralized: FHLMC, FNMA and GNMA) | 5.10 | 7/1/31 | 1,720,000 | 1,732,350 | ||||||||
10
Long-Term Municipal Investments - 97.4% (continued) | Coupon | Maturity | Principal | Value ($) | |||||||||
Florida - 8.8% (continued) | |||||||||||||
Florida Municipal Power Agency, | |||||||||||||
Revenue (Saint Lucie Project) | 5.00 | 10/1/20 | 5,185,000 | 5,979,238 | |||||||||
Jacksonville Electric Authority, | |||||||||||||
Electric System Subordinated Revenue | 5.00 | 10/1/27 | 2,250,000 | 2,643,593 | |||||||||
Jacksonville Electric Authority, | |||||||||||||
Water and Sewer System Revenue | 5.00 | 10/1/29 | 2,500,000 | 2,914,925 | |||||||||
Lee County, | |||||||||||||
Transportation Facilities Revenue | 5.00 | 10/1/21 | 4,000,000 | 4,688,440 | |||||||||
Miami-Dade County, | |||||||||||||
Aviation Revenue (Miami International Airport) | 5.38 | 10/1/35 | 5,000,000 | 5,717,350 | |||||||||
Miami-Dade County, | |||||||||||||
Seaport Revenue | 5.50 | 10/1/42 | 3,500,000 | 4,015,550 | |||||||||
Miami-Dade County, | |||||||||||||
Water and Sewer System Revenue | 5.00 | 10/1/34 | 5,000,000 | 5,669,050 | |||||||||
Orlando-Orange County Expressway Authority, | |||||||||||||
Revenue | 5.00 | 7/1/35 | 7,000,000 | 7,830,830 | |||||||||
Pinellas County Health Facilities Authority, | |||||||||||||
Health System Revenue (BayCare Health System Issue) | 0.23 | 11/15/23 | 5,275,000 | d | 5,044,219 | ||||||||
Saint Johns County Industrial Development Authority, | |||||||||||||
Revenue (Presbyterian Retirement Communities Project) | 5.88 | 8/1/40 | 5,000,000 | 5,528,400 | |||||||||
Tampa Bay Water Regional Water Supply Authority, | |||||||||||||
Utility System Improvement Revenue | 6.00 | 10/1/29 | 5,000,000 | 6,651,150 | |||||||||
125,113,121 | |||||||||||||
Georgia - 2.6% | |||||||||||||
Atlanta, | |||||||||||||
Water and Wastewater Revenue | 5.25 | 11/1/34 | 3,500,000 | 3,929,590 | |||||||||
Atlanta, | |||||||||||||
Water and Wastewater Revenue (Prerefunded) | 6.00 | 11/1/19 | 10,000,000 | b | 11,986,100 | ||||||||
Municipal Electric Authority of Georgia, | |||||||||||||
GO (Project One Subordinated Bonds) | 5.75 | 1/1/20 | 5,000,000 | 5,666,500 | |||||||||
Municipal Electric Authority of Georgia, | |||||||||||||
GO (Project One Subordinated Bonds) | 5.00 | 1/1/21 | 9,705,000 | 11,271,969 | |||||||||
Thomasville Hospital Authority, | |||||||||||||
RAC (John D. Archbold Memorial Hospital, Inc. Project) | 5.13 | 11/1/30 | 3,500,000 | 3,901,275 | |||||||||
36,755,434 | |||||||||||||
Idaho - .5% | |||||||||||||
Power County Industrial Development Corporation, | |||||||||||||
SWDR (FMC Corporation Project) | 6.45 | 8/1/32 | 7,625,000 | 7,639,564 | |||||||||
11
STATEMENT OF INVESTMENTS (continued)
Long-Term Municipal Investments - 97.4% (continued) | Coupon | Maturity | Principal | Value ($) | ||||||||
Illinois - 7.3% | ||||||||||||
Chicago, | ||||||||||||
General Airport Third Lien Revenue | 5.25 | 1/1/23 | 9,000,000 | 9,138,420 | ||||||||
Chicago, | ||||||||||||
GO | 5.00 | 1/1/34 | 5,700,000 | 5,013,264 | ||||||||
Chicago, | ||||||||||||
GO | 5.00 | 1/1/34 | 2,240,000 | 1,970,125 | ||||||||
Chicago Park District, | ||||||||||||
Limited Tax GO | 5.00 | 1/1/27 | 3,000,000 | 3,261,630 | ||||||||
Illinois, | ||||||||||||
GO | 5.50 | 7/1/38 | 5,500,000 | 5,844,410 | ||||||||
Illinois, | ||||||||||||
Sales Tax Revenue | 5.00 | 6/15/24 | 5,000,000 | 5,875,300 | ||||||||
Illinois Finance Authority, | ||||||||||||
Revenue (Advocate Health Care Network) | 5.00 | 6/1/29 | 9,500,000 | 10,776,610 | ||||||||
Illinois Finance Authority, | ||||||||||||
Revenue (Advocate Health Care Network) | 5.00 | 6/1/30 | 10,305,000 | 11,651,863 | ||||||||
Illinois Finance Authority, | ||||||||||||
Revenue (Central DuPage Health) | 5.50 | 11/1/39 | 3,500,000 | 4,000,850 | ||||||||
Illinois Finance Authority, | ||||||||||||
Revenue (Rehabilitation Institute of Chicago) | 6.00 | 7/1/43 | 3,250,000 | 3,822,975 | ||||||||
Illinois Finance Authority, | ||||||||||||
Revenue (Sherman Health Systems) (Prerefunded) | 5.50 | 8/1/17 | 2,500,000 | b | 2,727,275 | |||||||
Metropolitan Pier and Exposition Authority, | ||||||||||||
Revenue (McCormick Place Expansion Project) | 5.00 | 6/15/42 | 13,090,000 | 13,208,988 | ||||||||
Railsplitter Tobacco Settlement Authority, | ||||||||||||
Tobacco Settlement Revenue | 5.00 | 6/1/16 | 7,275,000 | 7,515,148 | ||||||||
Railsplitter Tobacco Settlement Authority, | ||||||||||||
Tobacco Settlement Revenue | 5.50 | 6/1/23 | 5,500,000 | 6,344,195 | ||||||||
Railsplitter Tobacco Settlement Authority, | ||||||||||||
Tobacco Settlement Revenue | 6.00 | 6/1/28 | 1,480,000 | 1,740,954 | ||||||||
University of Illinois Board of Trustees, | ||||||||||||
Auxiliary Facilities System Revenue (University of Illinois) | 5.00 | 4/1/27 | 5,000,000 | 5,647,450 | ||||||||
University of Illinois Board of Trustees, | ||||||||||||
Auxiliary Facilities System Revenue (University of Illinois) | 5.00 | 4/1/44 | 5,000,000 | 5,420,550 | ||||||||
103,960,007 | ||||||||||||
Iowa - .5% | ||||||||||||
Iowa Finance Authority, | ||||||||||||
Healthcare Revenue (Genesis Health System) | 5.00 | 7/1/25 | 5,910,000 | 6,796,323 | ||||||||
Kentucky - 2.3% | ||||||||||||
Kentucky Public Transportation Infrastructure Authority, | ||||||||||||
Subordinate Toll Revenue, BAN (Downtown Crossing Project) | 5.00 | 7/1/17 | 9,375,000 | 10,061,531 | ||||||||
12
Long-Term Municipal Investments - 97.4% (continued) | Coupon | Maturity | Principal | Value ($) | ||||||||
Kentucky - 2.3% (continued) | ||||||||||||
Louisville/Jefferson County Metro Government, | ||||||||||||
Health System Revenue (Norton Healthcare, Inc.) | 5.75 | 10/1/42 | 6,000,000 | 6,800,820 | ||||||||
Mount Sterling, | ||||||||||||
LR (Kentucky League of Cities Funding Trust Program) | 6.10 | 3/1/18 | 7,955,000 | 8,790,275 | ||||||||
University of Kentucky, | ||||||||||||
General Receipts Bonds | 5.25 | 10/1/19 | 5,565,000 | 6,448,332 | ||||||||
32,100,958 | ||||||||||||
Louisiana - 3.8% | ||||||||||||
East Baton Rouge Sewerage Commission, | ||||||||||||
Revenue | 5.00 | 2/1/39 | 8,000,000 | 9,030,720 | ||||||||
Louisiana Local Government Environmental | ||||||||||||
Revenue (Westlake Chemical Corporation Projects) | 6.75 | 11/1/32 | 2,000,000 | 2,197,020 | ||||||||
Louisiana Public Facilities Authority, | ||||||||||||
Revenue (CHRISTUS Health Obligated Group) | 6.00 | 7/1/29 | 6,500,000 | 7,446,855 | ||||||||
New Orleans Aviation Board, | ||||||||||||
General Airport Revenue (North Terminal Project) | 5.00 | 1/1/45 | 5,000,000 | 5,369,900 | ||||||||
New Orleans Aviation Board, | ||||||||||||
Gulf Opportunity Zone Customer Facility Charge Revenue | 6.25 | 1/1/30 | 5,000,000 | 5,609,500 | ||||||||
Tobacco Settlement Financing Corporation of Louisiana, | ||||||||||||
Tobacco Settlement Asset-Backed Bonds | 5.50 | 5/15/28 | 13,425,000 | 14,413,348 | ||||||||
Tobacco Settlement Financing Corporation of Louisiana, | ||||||||||||
Tobacco Settlement Asset-Backed Bonds | 5.25 | 5/15/35 | 9,000,000 | 9,998,100 | ||||||||
54,065,443 | ||||||||||||
Maine - .4% | ||||||||||||
Maine Health and Higher Educational Facilities Authority, | ||||||||||||
Revenue (Maine General Medical Center Issue) | 7.50 | 7/1/32 | 5,000,000 | 6,002,850 | ||||||||
Maryland - 1.8% | ||||||||||||
Maryland, | ||||||||||||
GO (State and Local Facilities Loan) | 5.25 | 8/1/20 | 10,000,000 | 11,848,600 | ||||||||
Maryland Economic Development Corporation, | ||||||||||||
EDR (Transportation Facilities Project) | 5.75 | 6/1/35 | 2,500,000 | 2,734,550 | ||||||||
Maryland Health and Higher Educational Facilities Authority, | ||||||||||||
Revenue (MedStar Health Issue) | 5.00 | 8/15/38 | 4,000,000 | 4,406,600 | ||||||||
Maryland Health and Higher Educational Facilities Authority, | ||||||||||||
Revenue (The Johns Hopkins Health System Issue) | 4.00 | 5/15/40 | 1,100,000 | 1,114,993 | ||||||||
13
STATEMENT OF INVESTMENTS (continued)
Long-Term Municipal Investments - 97.4% (continued) | Coupon | Maturity | Principal | Value ($) | ||||||||
Maryland - 1.8% (continued) | ||||||||||||
Montgomery County, | ||||||||||||
Consolidated Public Improvement GO | 5.00 | 11/1/21 | 4,730,000 | 5,650,127 | ||||||||
25,754,870 | ||||||||||||
Massachusetts - 3.1% | ||||||||||||
Massachusetts, | ||||||||||||
GO (Insured; Assured Guaranty Municipal Corp.) | 5.25 | 9/1/23 | 5,000,000 | 6,179,150 | ||||||||
Massachusetts Department of Transportation, | ||||||||||||
Metropolitan Highway System Senior Revenue | 5.00 | 1/1/27 | 11,000,000 | 12,382,480 | ||||||||
Massachusetts Educational Financing Authority, | ||||||||||||
Education Loan Revenue (Issue K) | 5.25 | 7/1/29 | 5,050,000 | 5,507,732 | ||||||||
Massachusetts Health and Educational Facilities Authority, | ||||||||||||
Revenue (Northeastern University Issue) | 5.00 | 10/1/30 | 3,000,000 | 3,416,940 | ||||||||
Massachusetts Housing Finance Agency, | ||||||||||||
Housing Revenue | 5.30 | 6/1/49 | 5,940,000 | 6,033,911 | ||||||||
Massachusetts School Building Authority, | ||||||||||||
Senior Dedicated Sales Tax Revenue | 5.00 | 8/15/30 | 3,725,000 | 4,362,273 | ||||||||
Massachusetts School Building Authority, | ||||||||||||
Senior Dedicated Sales Tax Revenue | 5.00 | 10/15/35 | 5,000,000 | 5,714,850 | ||||||||
43,597,336 | ||||||||||||
Michigan - 3.4% | ||||||||||||
Kent Hospital Finance Authority, | ||||||||||||
Revenue (Spectrum Health System) | 5.50 | 11/15/25 | 7,710,000 | 9,056,397 | ||||||||
Michigan Building Authority, | ||||||||||||
Revenue (Facilities Program) | 5.00 | 10/15/24 | 2,500,000 | 2,863,325 | ||||||||
Michigan Finance Authority, | ||||||||||||
HR (Sparrow Obligated Group) | 5.00 | 11/15/34 | 2,965,000 | 3,255,185 | ||||||||
Michigan Finance Authority, | ||||||||||||
Local Government Loan Program Revenue | 5.00 | 7/1/30 | 6,000,000 | 6,736,680 | ||||||||
Michigan Finance Authority, | ||||||||||||
Local Government Loan Program Revenue | 5.00 | 7/1/32 | 5,000,000 | 5,555,400 | ||||||||
Michigan Finance Authority, | ||||||||||||
Unemployment Obligation Assessment Revenue | 5.00 | 7/1/21 | 7,000,000 | 7,779,590 | ||||||||
Michigan Hospital Finance Authority, | ||||||||||||
HR (Henry Ford Health System) | 5.63 | 11/15/29 | 5,000,000 | 5,710,050 | ||||||||
Michigan Hospital Finance Authority, | ||||||||||||
Revenue (McLaren Health Care) (Prerefunded) | 5.63 | 5/15/18 | 4,575,000 | b | 5,159,777 | |||||||
14
Long-Term Municipal Investments - 97.4% (continued) | Coupon | Maturity | Principal | Value ($) | ||||||||
Michigan - 3.4% (continued) | ||||||||||||
Michigan Strategic Fund, | ||||||||||||
SWDR (Genesee Power Station Project) | 7.50 | 1/1/21 | 2,680,000 | 2,643,659 | ||||||||
48,760,063 | ||||||||||||
Minnesota - .1% | ||||||||||||
Western Minnesota Municipal Power Agency, | ||||||||||||
Power Supply Revenue | 5.00 | 1/1/30 | 1,565,000 | 1,809,187 | ||||||||
Missouri - 1.5% | ||||||||||||
Kansas City, | ||||||||||||
General Improvement Airport Revenue | 5.00 | 9/1/22 | 8,380,000 | 9,585,631 | ||||||||
Missouri Health and Educational Facilities Authority, | ||||||||||||
Health Facilities Revenue (CoxHealth) | 5.00 | 11/15/29 | 3,770,000 | 4,316,047 | ||||||||
Missouri Health and Educational Facilities Authority, | ||||||||||||
Health Facilities Revenue (CoxHealth) | 5.00 | 11/15/30 | 3,725,000 | 4,250,672 | ||||||||
Missouri Joint Municipal Electric Utility Commission, | ||||||||||||
Power Project Revenue (Iatan 2 Project) | 5.00 | 1/1/33 | 2,200,000 | 2,458,544 | ||||||||
20,610,894 | ||||||||||||
Nebraska - .2% | ||||||||||||
Nebraska Public Power District, | ||||||||||||
General Revenue | 5.00 | 1/1/34 | 2,975,000 | 3,403,995 | ||||||||
Nevada - 1.5% | ||||||||||||
Clark County, | ||||||||||||
Airport System Revenue | 5.00 | 7/1/40 | 19,000,000 | 21,268,980 | ||||||||
New Jersey - 2.8% | ||||||||||||
Essex County Improvement Authority, | ||||||||||||
SWDR (Covanta Project) | 5.25 | 7/1/45 | 5,000,000 | e | 5,019,700 | |||||||
New Jersey Economic Development Authority, | ||||||||||||
Cigarette Tax Revenue | 5.00 | 6/15/28 | 2,250,000 | 2,378,858 | ||||||||
New Jersey Economic Development Authority, | ||||||||||||
School Facilities Construction Revenue | 5.25 | 6/15/31 | 7,550,000 | 7,782,540 | ||||||||
New Jersey Health Care Facilities Financing Authority, | ||||||||||||
Revenue (Virtua Health Issue) | 5.00 | 7/1/28 | 3,000,000 | 3,406,230 | ||||||||
New Jersey Higher Education Student Assistance Authority, | ||||||||||||
Student Loan Revenue (Insured; Assured Guaranty Corp.) | 6.13 | 6/1/30 | 8,050,000 | 8,684,501 | ||||||||
New Jersey Turnpike Authority, | ||||||||||||
Turnpike Revenue | 5.00 | 1/1/24 | 5,000,000 | 5,843,600 | ||||||||
New Jersey Turnpike Authority, | ||||||||||||
Turnpike Revenue (Insured; National Public Finance Guarantee Corp.) | 0.13 | 1/1/30 | 7,500,000 | d | 6,975,000 | |||||||
40,090,429 | ||||||||||||
New Mexico - .7% | ||||||||||||
New Mexico Municipal Energy Acquisition Authority, | ||||||||||||
Gas Supply Revenue | 0.88 | 8/1/19 | 10,000,000 | d | 10,014,900 | |||||||
15
STATEMENT OF INVESTMENTS (continued)
Long-Term Municipal Investments - 97.4% (continued) | Coupon | Maturity | Principal | Value ($) | ||||||||
New York - 13.0% | ||||||||||||
Long Island Power Authority, | ||||||||||||
Electric System General Revenue | 6.00 | 5/1/33 | 9,000,000 | 10,379,160 | ||||||||
Metropolitan Transportation Authority, | ||||||||||||
State Service Contract Revenue | 5.75 | 1/1/18 | 10,000,000 | 11,124,600 | ||||||||
Metropolitan Transportation Authority, | ||||||||||||
Transportation Revenue | 5.25 | 11/15/29 | 7,375,000 | 8,643,942 | ||||||||
Metropolitan Transportation Authority, | ||||||||||||
Transportation Revenue | 5.00 | 11/15/40 | 5,000,000 | 5,581,900 | ||||||||
New York City, | ||||||||||||
GO | 5.00 | 3/1/25 | 5,000,000 | 5,958,350 | ||||||||
New York City, | ||||||||||||
GO | 5.00 | 8/1/25 | 5,380,000 | 6,403,276 | ||||||||
New York City, | ||||||||||||
GO | 5.00 | 10/1/36 | 11,505,000 | 13,129,046 | ||||||||
New York City Health and Hospitals Corporation, | ||||||||||||
Health System Revenue | 5.00 | 2/15/25 | 14,625,000 | 16,339,781 | ||||||||
New York City Industrial Development Agency, | ||||||||||||
Senior Airport Facilities Revenue | 5.00 | 7/1/21 | 6,150,000 | 6,796,549 | ||||||||
New York City Industrial Development Agency, | ||||||||||||
Special Facility Revenue (American Airlines, Inc. | 8.00 | 8/1/28 | 7,450,000 | 7,942,817 | ||||||||
New York City Municipal Water Finance Authority, | ||||||||||||
Water and Sewer System Second General Resolution Revenue | 5.00 | 6/15/34 | 7,500,000 | 8,546,100 | ||||||||
New York City Transitional Finance Authority, | ||||||||||||
Future Tax Secured Subordinate Revenue | 5.00 | 2/1/35 | 15,055,000 | 17,311,443 | ||||||||
New York Liberty Development Corporation, | ||||||||||||
Liberty Revenue (4 World Trade Center Project) | 5.00 | 11/15/31 | 5,000,000 | 5,671,150 | ||||||||
New York Liberty Development Corporation, | ||||||||||||
Revenue (3 World Trade Center Project) | 5.00 | 11/15/44 | 7,500,000 | e | 7,537,950 | |||||||
New York Liberty Development Corporation, | ||||||||||||
Revenue (Goldman Sachs Headquarters Issue) | 5.25 | 10/1/35 | 1,000,000 | 1,172,930 | ||||||||
New York State Dormitory Authority, | ||||||||||||
Revenue (New York University) (Insured; National Public Finance Guarantee Corp.) | 5.75 | 7/1/27 | 9,500,000 | 11,551,810 | ||||||||
New York State Dormitory Authority, | ||||||||||||
Revenue (Orange Regional Medical Center Obligated Group) | 6.13 | 12/1/29 | 2,500,000 | 2,754,350 | ||||||||
New York State Dormitory Authority, | ||||||||||||
Revenue (Orange Regional Medical Center Obligated Group) | 6.25 | 12/1/37 | 3,800,000 | 4,160,354 | ||||||||
16
Long-Term Municipal Investments - 97.4% (continued) | Coupon | Maturity | Principal | Value ($) | |||||||||
New York - 13.0% (continued) | |||||||||||||
New York State Dormitory Authority, | |||||||||||||
State Personal Income Tax Revenue (General Purpose) | 5.00 | 3/15/20 | 6,775,000 | 7,838,946 | |||||||||
New York State Dormitory Authority, | |||||||||||||
State Personal Income Tax Revenue (General Purpose) | 5.00 | 3/15/32 | 7,100,000 | 8,142,422 | |||||||||
New York State Thruway Authority, | |||||||||||||
General Revenue | 5.00 | 1/1/27 | 5,000,000 | 5,846,750 | |||||||||
Port Authority of New York and New Jersey, | |||||||||||||
(Consolidated Bonds, 183rd Series) | 5.00 | 12/15/26 | 4,125,000 | 4,941,998 | |||||||||
Triborough Bridge and Tunnel Authority, | |||||||||||||
General Revenue (MTA Bridges and Tunnels) | 5.00 | 11/15/23 | 6,430,000 | 7,751,815 | |||||||||
185,527,439 | |||||||||||||
Ohio - 1.2% | |||||||||||||
Butler County, | |||||||||||||
Hospital Facilities Revenue (UC Health) | 5.50 | 11/1/40 | 5,000,000 | 5,637,300 | |||||||||
Hamilton County, | |||||||||||||
Sewer System Revenue (The Metropolitan Sewer District of the Greater Cincinnati) | 5.00 | 12/1/29 | 2,250,000 | 2,646,833 | |||||||||
Ohio Higher Educational Facility Commission, | |||||||||||||
HR (Cleveland Clinic Health System Obligated Group) | 5.00 | 1/1/38 | 5,000,000 | 5,560,500 | |||||||||
Ohio Turnpike and Infrastructure Commission, | |||||||||||||
Junior Lien Turnpike Revenue (Infrastructure Projects) | 5.25 | 2/15/39 | 3,000,000 | 3,396,510 | |||||||||
17,241,143 | |||||||||||||
Pennsylvania - 2.1% | |||||||||||||
Allegheny County Port Authority, | |||||||||||||
Special Transportation Revenue | 5.25 | 3/1/22 | 5,000,000 | 5,823,250 | |||||||||
Geisinger Authority, | |||||||||||||
Health System Revenue (Geisinger Health System) | 5.25 | 6/1/39 | 11,750,000 | 12,943,682 | |||||||||
Pennsylvania Turnpike Commission, | |||||||||||||
Turnpike Revenue | 5.00 | 12/1/24 | 5,000,000 | 5,649,500 | |||||||||
Philadelphia School District, | |||||||||||||
GO | 5.25 | 9/1/23 | 5,000,000 | 5,613,300 | |||||||||
30,029,732 | |||||||||||||
Rhode Island - .4% | |||||||||||||
Rhode Island Health and Educational Building Corporation, | |||||||||||||
Higher Education Facilities Revenue (Brown University Issue) | 5.00 | 9/1/21 | 4,645,000 | 5,509,945 | |||||||||
South Carolina - 3.6% | |||||||||||||
Columbia, | |||||||||||||
Waterworks and Sewer System Revenue | 5.00 | 2/1/36 | 8,000,000 | 9,009,760 | |||||||||
Greenville County School District, | |||||||||||||
Installment Purchase Revenue (Building Equity Sooner for Tomorrow) | 5.00 | 12/1/23 | 7,500,000 | 7,909,275 | |||||||||
Piedmont Municipal Power Agency, | |||||||||||||
Electric Revenue | 5.00 | 1/1/20 | 5,340,000 | 6,109,120 | |||||||||
17
STATEMENT OF INVESTMENTS (continued)
Long-Term Municipal Investments - 97.4% (continued) | Coupon | Maturity | Principal | Value ($) | ||||||||
South Carolina - 3.6% (continued) | ||||||||||||
South Carolina Public Service Authority, | ||||||||||||
Revenue Obligations (Santee Cooper) | 5.00 | 12/1/36 | 10,000,000 | 11,083,500 | ||||||||
South Carolina Public Service Authority, | ||||||||||||
Revenue Obligations (Santee Cooper) | 5.13 | 12/1/43 | 16,000,000 | 17,574,400 | ||||||||
51,686,055 | ||||||||||||
South Dakota - .4% | ||||||||||||
South Dakota Health and Educational Facilities Authority, | ||||||||||||
Revenue (Avera Health Issue) | 5.00 | 7/1/44 | 5,000,000 | 5,483,750 | ||||||||
Tennessee - .5% (continued) | ||||||||||||
Chattanooga Health Educational and Housing Board, | ||||||||||||
Revenue (Catholic Health Initiatives) | 5.25 | 1/1/40 | 1,500,000 | 1,640,505 | ||||||||
Johnson City Health and Educational Facilities Board, | ||||||||||||
HR (Mountain States Health Alliance) | 6.00 | 7/1/38 | 5,000,000 | 5,637,600 | ||||||||
7,278,105 | ||||||||||||
Texas - 5.8% | ||||||||||||
Corpus Christi, | ||||||||||||
Utility System Junior Lien Improvement Revenue | 5.00 | 7/15/40 | 5,000,000 | 5,537,600 | ||||||||
Harris County Cultural Education Facilities Finance Corporation, | ||||||||||||
HR (Texas Children's Hospital Project) | 5.25 | 10/1/29 | 4,000,000 | 4,540,040 | ||||||||
Harris County Health Facilities Development Corporation, | ||||||||||||
HR (Memorial Hermann Healthcare System) (Prerefunded) | 7.25 | 12/1/18 | 7,000,000 | b | 8,403,640 | |||||||
Houston, | ||||||||||||
Combined Utility System First Lien Revenue | 5.00 | 11/15/28 | 4,000,000 | 4,722,960 | ||||||||
Houston Community College System, | ||||||||||||
Limited Tax GO | 5.00 | 2/15/29 | 4,000,000 | 4,597,080 | ||||||||
Love Field Airport Modernization Corporation, | ||||||||||||
Special Facilities Revenue (Southwest Airlines | 5.00 | 11/1/28 | 4,450,000 | 4,920,143 | ||||||||
Lower Colorado River Authority, | ||||||||||||
Transmission Contract Revenue (Lower Colorado River | 5.00 | 5/15/31 | 7,895,000 | 8,875,559 | ||||||||
North Texas Tollway Authority, | ||||||||||||
First Tier System Revenue (Insured; Assured Guaranty Corp.) | 5.75 | 1/1/40 | 5,000,000 | 5,481,700 | ||||||||
North Texas Tollway Authority, | ||||||||||||
Second Tier System Revenue (Prerefunded) | 5.75 | 1/1/18 | 10,000,000 | b | 11,143,100 | |||||||
San Antonio, | ||||||||||||
Electric and Gas Systems Junior Lien Revenue | 5.00 | 2/1/43 | 9,275,000 | 10,265,941 | ||||||||
Socorro Independent School District, | ||||||||||||
Unlimited Tax Bonds | 5.00 | 8/15/29 | 4,080,000 | 4,783,066 | ||||||||
18
Long-Term Municipal Investments - 97.4% (continued) | Coupon | Maturity | Principal | Value ($) | ||||||||
Texas - 5.8% (continued) | ||||||||||||
Texas Transportation Commission, | ||||||||||||
Central Texas Turnpike System First Tier Revenue | 5.00 | 8/15/41 | 3,530,000 | 3,831,639 | ||||||||
Texas Transportation Commission, | ||||||||||||
Central Texas Turnpike System Second Tier Revenue | 5.00 | 8/15/31 | 5,000,000 | 5,543,850 | ||||||||
82,646,318 | ||||||||||||
Utah - .2% | ||||||||||||
Metropolitan Water District of Salt Lake and Sandy, | ||||||||||||
Water Revenue Project Bonds | 5.00 | 7/1/37 | 3,000,000 | 3,352,380 | ||||||||
Virginia - .7% | ||||||||||||
Danville Industrial Development Authority, | ||||||||||||
HR (Danville Regional Medical Center) | 5.25 | 10/1/28 | 1,500,000 | 1,791,930 | ||||||||
Virginia Housing Development Authority, | ||||||||||||
Commonwealth Mortgage Revenue | 5.00 | 10/1/26 | 8,250,000 | 8,611,020 | ||||||||
10,402,950 | ||||||||||||
Washington - 2.4% | ||||||||||||
Port of Seattle, | ||||||||||||
Intermediate Lien Revenue | 5.00 | 4/1/40 | 4,000,000 | 4,349,640 | ||||||||
Seattle, | ||||||||||||
Drainage and Wastewater Improvement Revenue | 5.00 | 9/1/27 | 5,000,000 | 5,832,200 | ||||||||
Seattle, | ||||||||||||
Municipal Light and Power Improvement Revenue | 5.00 | 6/1/23 | 6,790,000 | 8,029,718 | ||||||||
Washington, | ||||||||||||
Motor Vehicle Fuel Tax GO | 5.00 | 7/1/23 | 2,575,000 | 3,106,609 | ||||||||
Washington Health Care Facilities Authority, | ||||||||||||
Revenue (Providence Health and Services) | 5.00 | 10/1/42 | 12,375,000 | 13,522,162 | ||||||||
34,840,329 | ||||||||||||
Wisconsin - 1.8% | ||||||||||||
Wisconsin Health and Educational Facilities Authority, | ||||||||||||
Revenue (Ascension Health Alliance Senior Credit Group) | 5.00 | 11/15/43 | 10,000,000 | e,f | 11,001,400 | |||||||
Wisconsin Health and Educational Facilities Authority, | ||||||||||||
Revenue (Aurora Health Care, Inc.) | 5.50 | 4/15/29 | 5,000,000 | 5,597,450 | ||||||||
Wisconsin Health and Educational Facilities Authority, | ||||||||||||
Revenue (Aurora Health Care, Inc.) | 5.25 | 4/15/35 | 3,000,000 | 3,305,220 | ||||||||
Wisconsin Health and Educational Facilities Authority, | ||||||||||||
Revenue (ProHealth Care, Inc. Obligated Group) | 5.00 | 8/15/39 | 5,000,000 | 5,445,800 | ||||||||
25,349,870 | ||||||||||||
19
STATEMENT OF INVESTMENTS (continued)
Total Investments (cost $1,292,683,290) | 97.4% | 1,391,454,185 | |||
Cash and Receivables (Net) | 2.6% | 37,704,669 | |||
Net Assets | 100.0% | 1,429,158,854 |
a Zero coupon until a specified date at which time the stated coupon rate becomes effective until maturity.
b These securities are prerefunded; the date shown represents the prerefunded date. Bonds which are prerefunded are collateralized by U.S. Government securities which are held in escrow and are used to pay principal and interest on the municipal issue and to retire the bonds in full at the earliest refunding date.
c Security issued with a zero coupon. Income is recognized through the accretion of discount.
d Variable rate security--interest rate subject to periodic change.
e Securities exempt from registration pursuant to Rule 144A under the Securities Act of 1933. These securities may be resold in transactions exempt from registration, normally to qualified institutional buyers. At August 31, 2015, these securities were valued at $23,559,050, or 1.6% of net assets.
f Collateral for floating rate borrowings.
Portfolio Summary (Unaudited) † | Value (%) |
Transportation Services | 20.5 |
Health Care | 15.6 |
Utility-Electric | 9.8 |
Utility-Water and Sewer | 7.9 |
Special Tax | 7.3 |
Education | 5.6 |
State/Territory | 5.2 |
Prerefunded | 3.3 |
City | 3.1 |
Industrial | 2.7 |
Lease | 2.4 |
Housing | 1.7 |
County | 1.3 |
Asset-Backed | .7 |
Resource Recovery | .2 |
Other | 10.1 |
97.4 |
†Based on net assets.
See notes to financial statements.
20
Summary of Abbreviations | |||
ABAG | Association of Bay Area | ACA | American Capital Access |
AGC | ACE Guaranty Corporation | AGIC | Asset Guaranty Insurance Company |
AMBAC | American Municipal Bond | ARRN | Adjustable Rate |
BAN | Bond Anticipation Notes | BPA | Bond Purchase Agreement |
CIFG | CDC Ixis Financial Guaranty | COP | Certificate of Participation |
CP | Commercial Paper | DRIVERS | Derivative Inverse |
EDR | Economic Development | EIR | Environmental Improvement |
FGIC | Financial Guaranty | FHA | Federal Housing Administration |
FHLB | Federal Home | FHLMC | Federal Home Loan Mortgage |
FNMA | Federal National | GAN | Grant Anticipation Notes |
GIC | Guaranteed Investment | GNMA | Government National Mortgage |
GO | General Obligation | HR | Hospital Revenue |
IDB | Industrial Development Board | IDC | Industrial Development Corporation |
IDR | Industrial Development | LIFERS | Long Inverse Floating |
LOC | Letter of Credit | LOR | Limited Obligation Revenue |
LR | Lease Revenue | MERLOTS | Municipal Exempt Receipts |
MFHR | Multi-Family Housing Revenue | MFMR | Multi-Family Mortgage Revenue |
PCR | Pollution Control Revenue | PILOT | Payment in Lieu of Taxes |
P-FLOATS | Puttable Floating Option | PUTTERS | Puttable Tax-Exempt Receipts |
RAC | Revenue Anticipation Certificates | RAN | Revenue Anticipation Notes |
RAW | Revenue Anticipation Warrants | RIB | Residual Interest Bonds |
ROCS | Reset Options Certificates | RRR | Resources Recovery Revenue |
SAAN | State Aid Anticipation Notes | SBPA | Standby Bond Purchase Agreement |
SFHR | Single Family Housing Revenue | SFMR | Single Family Mortgage Revenue |
SONYMA | State of New York | SPEARS | Short Puttable Exempt |
SWDR | Solid Waste Disposal Revenue | TAN | Tax Anticipation Notes |
TAW | Tax Anticipation Warrants | TRAN | Tax and Revenue Anticipation Notes |
XLCA | XL Capital Assurance | ||
See notes to financial statements.
21
STATEMENT OF ASSETS AND LIABILITIES
August 31, 2015
|
|
| Cost |
| Value | |
Assets ($): |
|
|
| |||
Investments in securities—See Statement of Investments |
| 1,292,683,290 |
| 1,391,454,185 | ||
Cash |
|
|
|
| 11,621,984 | |
Interest receivable |
|
|
|
| 16,151,730 | |
Receivable for investment securities sold |
|
|
|
| 16,014,095 | |
Receivable for shares of Common Stock subscribed |
|
|
|
| 504,528 | |
Prepaid expenses |
|
|
|
| 21,424 | |
|
|
|
|
| 1,435,767,946 | |
Liabilities ($): |
|
|
| |||
Due to The Dreyfus Corporation and affiliates—Note 3(b) |
|
|
|
| 894,201 | |
Payable for floating rate notes issued—Note 4 |
|
|
|
| 5,000,000 | |
Payable for shares of Common Stock redeemed |
|
|
|
| 580,540 | |
Interest and expense payable related to |
|
|
|
| 9,648 | |
Accrued expenses |
|
|
|
| 124,703 | |
|
|
|
|
| 6,609,092 | |
Net Assets ($) |
|
| 1,429,158,854 | |||
Composition of Net Assets ($): |
|
|
| |||
Paid-in capital |
|
|
|
| 1,388,776,647 | |
Accumulated net realized gain (loss) on investments |
|
|
|
| (58,388,688) | |
Accumulated net unrealized appreciation (depreciation) |
|
|
|
| 98,770,895 | |
Net Assets ($) |
|
| 1,429,158,854 | |||
Shares Outstanding |
|
| ||||
(600 million shares of $.001 par value Common Stock authorized) |
| 122,067,395 | ||||
Net Asset Value Per Share ($) |
| 11.71 | ||||
See notes to financial statements.
22
STATEMENT OF OPERATIONS
Year Ended August 31, 2015
|
|
|
|
|
|
|
|
|
|
|
|
|
|
Investment Income ($): |
|
|
|
| ||
Interest Income |
|
| 59,188,776 |
| ||
Expenses: |
|
|
|
| ||
Management fee—Note 3(a) |
|
| 8,776,877 |
| ||
Shareholder servicing costs—Note 3(b) |
|
| 1,244,294 |
| ||
Interest and expense related to floating rate notes issued—Note 4 |
|
| 112,786 |
| ||
Directors' fees and expenses—Note 3(c) |
|
| 100,364 |
| ||
Professional fees |
|
| 90,095 |
| ||
Custodian fees—Note 3(b) |
|
| 86,943 |
| ||
Prospectus and shareholders’ reports |
|
| 36,502 |
| ||
Registration fees |
|
| 33,467 |
| ||
Loan commitment fees—Note 2 |
|
| 14,731 |
| ||
Miscellaneous |
|
| 72,891 |
| ||
Total Expenses |
|
| 10,568,950 |
| ||
Less—reduction in fees due to earnings credits—Note 3(b) |
|
| (697) |
| ||
Net Expenses |
|
| 10,568,253 |
| ||
Investment Income—Net |
|
| 48,620,523 |
| ||
Realized and Unrealized Gain (Loss) on Investments—Note 4 ($): |
|
| ||||
Net realized gain (loss) on investments |
|
| 12,806,457 |
| ||
Net unrealized appreciation (depreciation) on investments |
|
| (23,258,849) |
| ||
Net Realized and Unrealized Gain (Loss) on Investments |
|
| (10,452,392) |
| ||
Net Increase in Net Assets Resulting from Operations |
| 38,168,131 |
| |||
See notes to financial statements.
23
STATEMENT OF CHANGES IN NET ASSETS
|
|
|
| Year Ended August 31, | |||||
|
|
|
| 2015 |
|
|
| 2014 |
|
Operations ($): |
|
|
|
|
|
|
|
| |
Investment income—net |
|
| 48,620,523 |
|
|
| 54,826,764 |
| |
Net realized gain (loss) on investments |
| 12,806,457 |
|
|
| (15,935,734) |
| ||
Net unrealized appreciation (depreciation) |
| (23,258,849) |
|
|
| 116,234,588 |
| ||
Net Increase (Decrease) in Net Assets | 38,168,131 |
|
|
| 155,125,618 |
| |||
Dividends to Shareholders from ($): |
|
|
|
|
|
|
|
| |
Investment income—net |
|
| (48,518,696) |
|
|
| (54,243,270) |
| |
Net realized gain on investments |
|
| - |
|
|
| (432,925) |
| |
Total Dividends |
|
| (48,518,696) |
|
|
| (54,676,195) |
| |
Capital Stock Transactions ($): |
|
|
|
|
|
|
|
| |
Net proceeds from shares sold |
|
| 42,301,969 |
|
|
| 34,823,073 |
| |
Dividends reinvested |
|
| 35,410,869 |
|
|
| 39,560,117 |
| |
Cost of shares redeemed |
|
| (128,977,321) |
|
|
| (176,749,298) |
| |
Increase (Decrease) in Net Assets | (51,264,483) |
|
|
| (102,366,108) |
| |||
Total Increase (Decrease) in Net Assets | (61,615,048) |
|
|
| (1,916,685) |
| |||
Net Assets ($): |
|
|
|
|
|
|
|
| |
Beginning of Period |
|
| 1,490,773,902 |
|
|
| 1,492,690,587 |
| |
End of Period |
|
| 1,429,158,854 |
|
|
| 1,490,773,902 |
| |
Undistributed investment income—net | - |
|
|
| 265,551 |
| |||
Capital Share Transactions (Shares): |
|
|
|
|
|
|
|
| |
Shares sold |
|
| 3,585,781 |
|
|
| 3,044,627 |
| |
Shares issued for dividends reinvested |
|
| 3,002,470 |
|
|
| 3,460,833 |
| |
Shares redeemed |
|
| (10,948,016) |
|
|
| (15,578,073) |
| |
Net Increase (Decrease) in Shares Outstanding | (4,359,765) |
|
|
| (9,072,613) |
| |||
See notes to financial statements.
24
FINANCIAL HIGHLIGHTS
The following table describes the performance for the fiscal periods indicated. Total return shows how much your investment in the fund would have increased (or decreased) during each period, assuming you had reinvested all dividends and distributions. These figures have been derived from the fund’s financial statements.
Year Ended August 31, | |||||||
| 2015 | 2014 | 2013 | 2012 | 2011 | ||
Per Share Data ($): | |||||||
Net asset value, beginning of period | 11.79 | 11.02 | 11.90 | 11.24 | 11.58 | ||
Investment Operations: | |||||||
Investment income—neta | .39 | .42 | .38 | .42 | .48 | ||
Net realized and unrealized gain (loss) on investments | (.08) | .77 | (.89) | .66 | (.35) | ||
Total from Investment Operations | .31 | 1.19 | (.51) | 1.08 | .13 | ||
Distributions: | |||||||
Dividends from investment income—net | (.39) | (.42) | (.37) | (.42) | (.47) | ||
Dividends from net realized gain on investments | - | (.00)b | - | - | - | ||
Total Distributions | (.39) | (.42) | (.37) | (.42) | (.47) | ||
Net asset value, end of period | 11.71 | 11.79 | 11.02 | 11.90 | 11.24 | ||
Total Return (%) | 2.67 | 11.10 | (4.52) | 9.76 | 1.30 | ||
Ratios/Supplemental Data (%): | |||||||
Ratio of total expenses to average net assets | .72 | .74 | .72 | .75 | .75 | ||
Ratio of net expenses to average net assets | .72 | .74 | .72 | .75 | .75 | ||
Ratio of interest and expense related to floating rate notes issued to average net assets | .01 | .01 | .01 | .01 | .01 | ||
Ratio of net investment income to average net assets | 3.32 | 3.71 | 3.18 | 3.64 | 4.30 | ||
Portfolio Turnover Rate | 14.65 | 19.04 | 23.67 | 27.88 | 24.24 | ||
Net Assets, end of period ($ x 1,000) | 1,429,159 | 1,490,774 | 1,492,691 | 1,719,403 | 1,660,406 | ||
a Based on average shares outstanding.
b Amount represents less than $.01 per share.
See notes to financial statements.
25
NOTES TO FINANCIAL STATEMENTS
NOTE 1—Significant Accounting Policies:
Dreyfus Municipal Bond Fund (the “fund”) is the sole series of Dreyfus Bond Funds, Inc. (the “Company”), which is registered under the Investment Company Act of 1940, as amended (the “Act”), as a diversified open-end management investment company. The fund’s investment objective is to seek to maximize current income exempt from federal income tax, to the extent consistent with the preservation of capital. The Dreyfus Corporation (the “Manager” or “Dreyfus”), a wholly-owned subsidiary of The Bank of New York Mellon Corporation (“BNY Mellon”), serves as the fund’s investment adviser. MBSC Securities Corporation (the "Distributor"), a wholly-owned subsidiary of Dreyfus, is the distributor of the fund's shares, which are sold to the public without a sales charge.
The Financial Accounting Standards Board (“FASB”) Accounting Standards Codification (“ASC”) is the exclusive reference of authoritative U.S. generally accepted accounting principles (“GAAP”) recognized by the FASB to be applied by nongovernmental entities. Rules and interpretive releases of the Securities and Exchange Commission (“SEC”) under authority of federal laws are also sources of authoritative GAAP for SEC registrants. The fund’s financial statements are prepared in accordance with GAAP, which may require the use of management estimates and assumptions. Actual results could differ from those estimates.
The Company enters into contracts that contain a variety of indemnifications. The fund’s maximum exposure under these arrangements is unknown. The fund does not anticipate recognizing any loss related to these arrangements.
(a) Portfolio valuation: The fair value of a financial instrument is the amount that would be received to sell an asset or paid to transfer a liability in an orderly transaction between market participants at the measurement date (i.e., the exit price). GAAP establishes a fair value hierarchy that prioritizes the inputs of valuation techniques used to measure fair value. This hierarchy gives the highest priority to unadjusted quoted prices in active markets for identical assets or liabilities (Level 1 measurements) and the lowest priority to unobservable inputs (Level 3 measurements).
Additionally, GAAP provides guidance on determining whether the volume and activity in a market has decreased significantly and whether such a decrease in activity results in transactions that are not orderly. GAAP requires enhanced disclosures around valuation inputs and techniques used during annual and interim periods.
26
Various inputs are used in determining the value of the fund’s investments relating to fair value measurements. These inputs are summarized in the three broad levels listed below:
Level 1—unadjusted quoted prices in active markets for identical investments.
Level 2—other significant observable inputs (including quoted prices for similar investments, interest rates, prepayment speeds, credit risk, etc.).
Level 3—significant unobservable inputs (including the fund’s own assumptions in determining the fair value of investments).
The inputs or methodology used for valuing securities are not necessarily an indication of the risk associated with investing in those securities.
Changes in valuation techniques may result in transfers in or out of an assigned level within the disclosure hierarchy. Valuation techniques used to value the fund’s investments are as follows:
Investments in securities are valued each business day by an independent pricing service (the “Service”) approved by the Company's Board of Directors (the “Board”). Investments for which quoted bid prices are readily available and are representative of the bid side of the market in the judgment of the Service are valued at the mean between the quoted bid prices (as obtained by the Service from dealers in such securities) and asked prices (as calculated by the Service based upon its evaluation of the market for such securities). Other investments (which constitute a majority of the portfolio securities) are carried at fair value as determined by the Service, based on methods which include consideration of the following: yields or prices of municipal securities of comparable quality, coupon, maturity and type; indications as to values from dealers; and general market conditions. All of the preceding securities are generally categorized within Level 2 of the fair value hierarchy.
The Service’s procedures are reviewed by Dreyfus under the general supervision of the Board.
When market quotations or official closing prices are not readily available, or are determined not to reflect accurately fair value, such as when the value of a security has been significantly affected by events after the close of the exchange or market on which the security is principally traded, but before the fund calculates its net asset value, the fund may value these investments at fair value as determined in accordance with the procedures approved by the Board. Certain factors may be considered when fair valuing investments such as: fundamental analytical data, the nature and
27
NOTES TO FINANCIAL STATEMENTS (continued)
duration of restrictions on disposition, an evaluation of the forces that influence the market in which the securities are purchased and sold, and public trading in similar securities of the issuer or comparable issuers. These securities are either categorized within Level 2 or 3 of the fair value hierarchy depending on the relevant inputs used.
For restricted securities where observable inputs are limited, assumptions about market activity and risk are used and are generally categorized within Level 3 of the fair value hierarchy.
The following is a summary of the inputs used as of August 31, 2015 in valuing the fund’s investments:
Level 1 - | Level 2 - Other | Level 3 - | Total | |
Assets ($) |
|
|
|
|
Investments in Securities: | ||||
Municipal Bonds† | - | 1,391,454,185 | - | 1,391,454,185 |
Liabilities ($) | ||||
Floating Rate Notes†† | - | (5,000,000) | - | (5,000,000) |
† See Statement of Investments for additional detailed categorizations.
†† Certain of the fund’s liabilities are held at carrying amount, which approximates fair value for financial reporting purposes.
At August 31, 2015, there were no transfers between Level 1 and Level 2 of the fair value hierarchy.
(b) Securities transactions and investment income: Securities transactions are recorded on a trade date basis. Realized gains and losses from securities transactions are recorded on the identified cost basis. Interest income, adjusted for accretion of discount and amortization of premium on investments, is earned from settlement date and recognized on the accrual basis. Securities purchased or sold on a when issued or delayed delivery basis may be settled a month or more after the trade date.
(c) Dividends to shareholders: It is the policy of the fund to declare dividends daily from investment income-net. Such dividends are paid monthly. Dividends from net realized capital gains, if any, are normally declared and paid annually, but the fund may make distributions on a more frequent basis to comply with the distribution requirements of the Internal Revenue Code of 1986, as amended (the “Code”). To the extent that net realized capital gains can be offset by capital loss carryovers, it is the policy of the fund not to distribute such gains. Income and capital gain
28
distributions are determined in accordance with income tax regulations, which may differ from GAAP.
(d) Federal income taxes: It is the policy of the fund to continue to qualify as a regulated investment company, which can distribute tax-exempt dividends, by complying with the applicable provisions of the Code, and to make distributions of income and net realized capital gain sufficient to relieve it from substantially all federal income and excise taxes.
As of and during the period ended August 31, 2015, the fund did not have any liabilities for any uncertain tax positions. The fund recognizes interest and penalties, if any, related to uncertain tax positions as income tax expense in the Statement of Operations. During the period ended August 31, 2015, the fund did not incur any interest or penalties.
Each tax year in the four-year period ended August 31, 2015 remains subject to examination by the Internal Revenue Service and state taxing authorities.
At August 31, 2015, the components of accumulated earnings on a tax basis were as follows: undistributed tax-exempt income $1,441,905, accumulated capital losses $59,459,480 and unrealized appreciation $99,841,687.
Under the Regulated Investment Company Modernization Act of 2010 (the “2010 Act”), the fund is permitted to carry forward capital losses incurred in taxable years beginning after December 22, 2010 (“post-enactment losses”) for an unlimited period. Furthermore, post-enactment capital loss carryovers retain their character as either short-term or long-term capital losses rather than short-term as they were under previous statute. The 2010 Act requires post-enactment losses to be utilized before the utilization of losses incurred in taxable years prior to the effective date of the 2010 Act (“pre-enactment losses”). As a result of this ordering rule, pre-enactment losses may be more likely to expire unused.
The accumulated capital loss carryover is available for federal income tax purposes to be applied against future net realized capital gains, if any, realized subsequent to August 31, 2015. If not applied, $4,454,313 of the carryover expires in fiscal year 2017 and $48,927,645 expires in fiscal year 2018. The fund has $3,335,905 of post-enactment short-term capital losses and $2,741,617 of post-enactment long-term capital losses which can be carried forward for an unlimited period.
The tax character of distributions paid to shareholders during the fiscal periods ended August 31, 2015 and August 31, 2014 were as follows: tax-
29
NOTES TO FINANCIAL STATEMENTS (continued)
exempt income $48,512,208 and $54,053,010, and ordinary income $6,488 and $623,185, respectively.
During the period ended August 31, 2015, as a result of permanent book to tax differences, primarily due to the tax treatment for amortization adjustments and dividend reclassification, the fund decreased accumulated undistributed investment income-net by $367,378, increased accumulated net realized gain (loss) on investments by $359,703 and increased paid-in capital by $7,675. Net assets and net asset value per share were not affected by this reclassification.
NOTE 2—Bank Lines of Credit:
The fund participates with other Dreyfus-managed funds in a $430 million unsecured credit facility led by Citibank, N.A. and a $300 million unsecured credit facility provided by The Bank of New York Mellon, a subsidiary of BNY Mellon and an affiliate of Dreyfus (each, a “Facility”), each to be utilized primarily for temporary or emergency purposes, including the financing of redemptions. Prior to October 8, 2014, the unsecured credit facility with Citibank, N.A. was $265 million. In connection therewith, the fund has agreed to pay its pro rata portion of commitment fees for each Facility. Interest is charged to the fund based on rates determined pursuant to the terms of the respective Facility at the time of borrowing. During the period ended August 31, 2015, the fund did not borrow under the Facilities.
NOTE 3—Management Fee and Other Transactions with Affiliates:
(a) Pursuant to a management agreement with Dreyfus, the management fee is computed at the annual rate of .60% of the value of the fund's average daily net assets and is payable monthly.
(b) Under the Shareholder Services Plan, the fund reimburses the Distributor at an amount not to exceed an annual rate of .25% of the value of the fund's average daily net assets for the provision of certain services. The services provided may include personal services relating to shareholder accounts, such as answering shareholder inquiries regarding the fund and providing reports and other information, and services related to the maintenance of shareholder accounts. During the period ended August 31, 2015, the fund was charged $689,536 pursuant to the Shareholder Services Plan.
The fund has arrangements with the transfer agent and the custodian whereby the fund may receive earnings credits when positive cash balances are maintained, which are used to offset transfer agency and custody fees.
30
For financial reporting purposes, the fund includes net earnings credits as an expense offset in the Statement of Operations.
The fund compensates Dreyfus Transfer, Inc., a wholly-owned subsidiary of Dreyfus, under a transfer agency agreement for providing transfer agency and cash management services for the fund. The majority of transfer agency fees are comprised of amounts paid on a per account basis, while cash management fees are related to fund subscriptions and redemptions. During the period ended August 31, 2015, the fund was charged $371,272 for transfer agency services and $18,143 for cash management services. These fees are included in Shareholder servicing costs in the Statement of Operations. Cash management fees were partially offset by earnings credits of $697.
The fund compensates The Bank of New York Mellon under a custody agreement for providing custodial services for the fund. These fees are determined based on net assets, geographic region and transaction activity. During the period ended August 31, 2015, the fund was charged $86,943 pursuant to the custody agreement.
The fund compensates The Bank of New York Mellon under a shareholder redemption draft processing agreement for providing certain services related to the fund’s check writing privilege. During the period ended August 31, 2015, the fund was charged $13,838 pursuant to the agreement, which is included in Shareholder servicing costs in the Statement of Operations.
During the period ended August 31, 2015, the fund was charged $10,965 for services performed by the Chief Compliance Officer and his staff.
The components of “Due to The Dreyfus Corporation and affiliates” in the Statement of Assets and Liabilities consist of: management fees $728,375, Shareholder Services Plan fees $53,000, custodian fees $43,592, Chief Compliance Officer fees $1,737 and transfer agency fees $67,497.
(c) Each Board member also serves as a Board member of other funds within the Dreyfus complex. Annual retainer fees and attendance fees are allocated to each fund based on net assets.
NOTE 4—Securities Transactions:
The aggregate amount of purchases and sales of investment securities, excluding short-term securities, during the period ended August 31, 2015, amounted to $211,361,285 and $259,127,972, respectively.
Inverse Floater Securities: The fund participates in secondary inverse floater structures in which fixed-rate, tax-exempt municipal bonds are
31
NOTES TO FINANCIAL STATEMENTS (continued)
transferred to a trust (the “Trust”). The Trust typically issues two variable rate securities that are collateralized by the cash flows of the fixed-rate, tax-exempt municipal bonds. One of these variable rate securities pays interest based on a short-term floating rate set by a remarketing agent at predetermined intervals (“Trust Certificates”). A residual interest tax-exempt security is also created by the Trust, which is transferred to the fund, and is paid interest based on the remaining cash flows of the Trust, after payment of interest on the other securities and various expenses of the Trust. An inverse floater security may be collapsed without the consent of the fund due to certain termination events such as bankruptcy, default or other credit event.
The fund accounts for the transfer of bonds to the Trust as secured borrowings, with the securities transferred remaining in the fund’s investments, and the related floating rate certificate securities reflected as fund liabilities in the Statement of Assets and Liabilities.
The fund may invest in inverse floater securities on either a non-recourse or recourse basis. These securities are typically supported by a liquidity facility provided by a bank or other financial institution (the “Liquidity Provider”) that allows the holders of the Trust Certificates to tender their certificates in exchange for payment from the Liquidity Provider of par plus accrued interest on any business day prior to a termination event. When the fund invests in inverse floater securities on a non-recourse basis, the Liquidity Provider is required to make a payment under the liquidity facility due to a termination event to the holders of the Trust Certificates. When this occurs, the Liquidity Provider typically liquidates all or a portion of the municipal securities held in the Trust. A liquidation shortfall occurs if the Trust Certificates exceed the proceeds of the sale of the bonds in the Trust (“Liquidation Shortfall”). When a fund invests in inverse floater securities on a recourse basis, the fund typically enters into a reimbursement agreement with the Liquidity Provider where the fund is required to repay the Liquidity Provider the amount of any Liquidation Shortfall. As a result, a fund investing in a recourse inverse floater security bears the risk of loss with respect to any Liquidation Shortfall.
The average amount of borrowings outstanding under the inverse floater structure during the period ended August 31, 2015 was approximately $16,458,300, with a related weighted average annualized interest rate of .69%.
At August 31, 2015, the cost of investments for federal income tax purposes was $1,286,612,498; accordingly, accumulated net unrealized appreciation on investments was $99,841,687, consisting of $103,274,430 gross unrealized appreciation and $3,432,743 gross unrealized depreciation.
32
REPORT OF INDEPENDENT REGISTERED
PUBLIC ACCOUNTING FIRM
Shareholders and Board of Directors
Dreyfus Municipal Bond Fund
We have audited the accompanying statement of assets and liabilities, including the statement of investments, of Dreyfus Municipal Bond Fund (the sole series comprising Dreyfus Bond Funds, Inc.) as of August 31, 2015, and the related statement of operations for the year then ended, the statement of changes in net assets for each of the two years in the period then ended, and the financial highlights for each of the five years in the period then ended. These financial statements and financial highlights are the responsibility of the Fund’s management. Our responsibility is to express an opinion on these financial statements and financial highlights based on our audits.
We conducted our audits in accordance with the standards of the Public Company Accounting Oversight Board (United States). Those standards require that we plan and perform the audit to obtain reasonable assurance about whether the financial statements and financial highlights are free of material misstatement. We were not engaged to perform an audit of the Fund’s internal control over financial reporting. Our audits included consideration of internal control over financial reporting as a basis for designing audit procedures that are appropriate in the circumstances, but not for the purpose of expressing an opinion on the effectiveness of the Fund’s internal control over financial reporting. Accordingly, we express no such opinion. An audit also includes examining, on a test basis, evidence supporting the amounts and disclosures in the financial statements and financial highlights, assessing the accounting principles used and significant estimates made by management, and evaluating the overall financial statement presentation. Our procedures included confirmation of securities owned as of August 31, 2015 by correspondence with the custodian and others. We believe that our audits provide a reasonable basis for our opinion.
In our opinion, the financial statements and financial highlights referred to above present fairly, in all material respects, the financial position of Dreyfus Municipal Bond Fund at August 31, 2015, the results of its operations for the year then ended, the changes in its net assets for each of the two years in the period then ended, and the financial highlights for each of the five years in the period then ended, in conformity with U.S. generally accepted accounting principles.

New York, New York
October 28, 2015
33
IMPORTANT TAX INFORMATION (Unaudited)
In accordance with federal tax law, the fund hereby reports all the dividends paid from investment income-net during the fiscal year ended August 31, 2015 as “exempt-interest dividends” (not subject to regular federal income tax), except $6,488 that is being reported as an ordinary income distribution for reporting purposes. Where required by federal tax law rules, shareholders will receive notification of their portion of the fund’s taxable ordinary dividends (if any), capital gains distributions (if any) and tax-exempt dividends paid for the 2015 calendar year on Form 1099-DIV, which will be mailed in early 2016.
34
BOARD MEMBERS INFORMATION (Unaudited)
INDEPENDENT BOARD MEMBERS
Chairman of the Board (1995)
Principal Occupation During Past 5 Years:
· Corporate Director and Trustee (1995-present)
Other Public Company Board Memberships During Past 5 Years:
· CBIZ (formerly, Century Business Services, Inc.), a provider of outsourcing functions for small and medium size companies, Director (1997-present)
· The Newark Group, a provider of a national market of paper recovery facilities, paperboard mills and paperboard converting plants, Director (2000-2010)
No. of Portfolios for which Board Member Serves: 144
———————
Joni Evans (73)
Board Member (1985)
Principal Occupation During Past 5 Years:
· Chief Executive Officer, www.wowOwow.com an online community dedicated to women’s conversations and publications (2007-present)
· Principal, Joni Evans Ltd. (publishing) (2006-present)
No. of Portfolios for which Board Member Serves: 25
———————
Ehud Houminer (75)
Board Member (2006)
Principal Occupation During Past 5 Years:
· Executive-in-Residence at the Columbia Business School, Columbia
University (1992-present)
Other Public Company Board Membership During Past 5 Years:
· Avnet, Inc., an electronics distributor, Director (1993-2012)
No. of Portfolios for which Board Member Serves: 62
———————
Hans C. Mautner (77)
Board Member (2006)
Principal Occupation During Past 5 Years:
· President--International Division and an Advisory Director of Simon Property Group, a
real estate investment company (1998-2010)
· Chairman and Chief Executive Officer of Simon Global Limited, a real estate company (1999-2010)
No. of Portfolios for which Board Member Serves: 25
———————
35
BOARD MEMBERS INFORMATION (Unaudited) (continued)
INDEPENDENT BOARD MEMBERS (continued)
Robin A. Melvin (51)
Board Member (2006)
Principal Occupation During Past 5 Years:
· Co-chairman, Illinois Mentoring Partnership, non-profit organization dedicated to increasing the quantity and quality of mentoring services in Illinois; (2014-present; a board member since 2013)
· Director, Boisi Family Foundation, a private family foundation that supports
youth-serving organizations that promote the self sufficiency of youth from
disadvantaged circumstances (1995-2012)
No. of Portfolios for which Board Member Serves: 114
———————
Burton N. Wallack (64)
Board Member (1991)
Principal Occupation During Past 5 Years:
· President and Co-owner of Wallack Management Company, a real estate management
company (1987-present)
No. of Portfolios for which Board Member Serves: 25
———————
John E. Zuccotti (78)
Board Member (2006)
Principal Occupation During Past 5 Years:
· Chairman of Brookfield Properties, Inc. (1996-present)
· Senior Counsel of Weil, Gotshal & Manges, LLP (1997-present)
Other Public Company Board Membership During Past 5 Years:
· Wellpoint, Inc., a health benefits company, Director (2005-2010)
No. of Portfolios for which Board Member Serves: 25
———————
36
INTERESTED BOARD MEMBER
Gordon J. Davis (74)
Board Member (2014)
Principal Occupation During Past 5 Years:
· Partner in the law firm of Venable LLP (2012-present)
· Partner in the law firm of Dewey & LeBoeuf LLP (1994-2012)
Other Public Company Board Memberships During Past 5 Years:
· Consolidated Edison, Inc., a utility company, Director (1997-2014)
· The Phoenix Companies, Inc., a life insurance company, Director (2000-2014)
No. of Portfolios for which Board Member Serves: 63
Gordon J. Davis is deemed to be an “interested person” (as defined under the Act) of the Company as a result of his affiliation with Venable LLP, which provides legal services to the Company.
———————
Once elected all Board Members serve for an indefinite term, but achieve Emeritus status upon reaching age 80. The address of the Board Members and Officers is c/o The Dreyfus Corporation, 200 Park Avenue, New York, New York 10166. Additional information about the Board Members is available in the fund's Statement of Additional Information which can be obtained from Dreyfus free of charge by calling this toll free number: 1-800-DREYFUS.
William Hodding Carter III, Emeritus Board Member
Arnold S. Hiatt, Emeritus Board Member
37
OFFICERS OF THE FUND (Unaudited)
BRADLEY J. SKAPYAK, President since January 2010.
Chief Operating Officer and a director of the Manager since June 2009, Chairman of Dreyfus Transfer, Inc., an affiliate of the Manager and the transfer agent of the funds, since May 2011 and Executive Vice President of the Distributor since June 2007. From April 2003 to June 2009, Mr. Skapyak was the head of the Investment Accounting and Support Department of the Manager. He is an officer of 69 investment companies (comprised of 144 portfolios) managed by the Manager. He is 56 years old and has been an employee of the Manager since February 1988.
BENNETT A. MACDOUGALL, Chief Legal Officer since October 2015
Chief Legal Officer of the Manager since June 2015; from June 2005 to June 2015, Director and Associate General Counsel of Deutsche Bank – Asset & Wealth Management Division, and Chief Legal Officer of Deutsche Investment Management Americas Inc. He is an officer of 70 investment companies (comprised of 169 portfolios) managed by the Manager. He is 44 years old and has been an employee of the Manager since June 2015.
JANETTE E. FARRAGHER, Vice President and Secretary since December 2011.
Assistant General Counsel of BNY Mellon, and an officer of 70 investment companies (comprised of 169 portfolios) managed by the Manager. She is 52 years old and has been an employee of the Manager since February 1984.
JAMES BITETTO, Vice President and Assistant Secretary since August 2005.
Managing Counsel of BNY Mellon and Secretary of the Manager, and an officer of 70 investment companies (comprised of 169 portfolios) managed by the Manager. He is 49 years old and has been an employee of the Manager since December 1996.
JONI LACKS CHARATAN, Vice President and Assistant Secretary since August 2005.
Managing Counsel of BNY Mellon, and an officer of 70 investment companies (comprised of 169 portfolios) managed by the Manager. She is 59 years old and has been an employee of the Manager since October 1988.
JOSEPH M. CHIOFFI, Vice President and Assistant Secretary since August 2005.
Managing Counsel of BNY Mellon, and an officer of 70 investment companies (comprised of 169 portfolios) managed by the Manager. He is 53 years old and has been an employee of the Manager since June 2000.
JOHN B. HAMMALIAN, Vice President and Assistant Secretary since August 2005.
Senior Managing Counsel of BNY Mellon, and an officer of 70 investment companies (comprised of 169 portfolios) managed by the Manager. He is 52 years old and has been an employee of the Manager since February 1991.
MAUREEN E. KANE, Vice President and Assistant Secretary since April 2015.
Managing Counsel of BNY Mellon since July 2014; from October 2004 until July 2014, General Counsel, and from May 2009 until July 2014, Chief Compliance Officer of Century Capital Management. She is an officer of 70 investment companies (comprised of 169 portfolios) managed by the Manager. She is 53 years old and has been an employee of the Manager since July 2014.
SARAH S. KELLEHER, Vice President and Assistant Secretary since April 2014.
Senior Counsel of BNY Mellon, and an officer of 70 investment companies (comprised of 169 portfolios) managed by the Manager; from August 2005 to March 2013, Associate General Counsel of Third Avenue Management. She is 39 years old and has been an employee of the Manager since March 2013.
JEFF PRUSNOFSKY, Vice President and Assistant Secretary since August 2005.
Senior Managing Counsel of BNY Mellon, and an officer of 70 investment companies (comprised of 169 portfolios) managed by the Manager. He is 50 years old and has been an employee of the Manager since October 1990.
JAMES WINDELS, Treasurer since November 2001.
Director – Mutual Fund Accounting of the Manager, and an officer of 70 investment companies (comprised of 169 portfolios) managed by the Manager. He is 56 years old and has been an employee of the Manager since April 1985.
38
RICHARD CASSARO, Assistant Treasurer since January 2008.
Senior Accounting Manager – Money Market and Municipal Bond Funds of the Manager, and an officer of 70 investment companies (comprised of 169 portfolios) managed by the Manager. He is 56 years old and has been an employee of the Manager since September 1982.
GAVIN C. REILLY, Assistant Treasurer since December 2005.
Tax Manager of the Investment Accounting and Support Department of the Manager, and an officer of 70 investment companies (comprised of 169 portfolios) managed by the Manager. He is 47 years old and has been an employee of the Manager since April 1991.
ROBERT S. ROBOL, Assistant Treasurer since August 2005.
Senior Accounting Manager – Fixed Income Funds of the Manager, and an officer of 70 investment companies (comprised of 169 portfolios) managed by the Manager. He is 51 years old and has been an employee of the Manager since October 1988.
ROBERT SALVIOLO, Assistant Treasurer since July 2007.
Senior Accounting Manager – Equity Funds of the Manager, and an officer of 70 investment companies (comprised of 169 portfolios) managed by the Manager. He is 48 years old and has been an employee of the Manager since June 1989.
ROBERT SVAGNA, Assistant Treasurer since December 2002.
Senior Accounting Manager – Equity Funds of the Manager, and an officer of 70 investment companies (comprised of 169 portfolios) managed by the Manager. He is 48 years old and has been an employee of the Manager since November 1990.
JOSEPH W. CONNOLLY, Chief Compliance Officer since October 2004.
Chief Compliance Officer of the Manager and The Dreyfus Family of Funds (70 investment companies, comprised of 169 portfolios). He is 58 years old and has served in various capacities with the Manager since 1980, including manager of the firm’s Fund Accounting Department from 1997 through October 2001.
39
NOTES
40
NOTES
41
Dreyfus Municipal Bond Fund
200 Park Avenue
New York, NY 10166
Manager
The Dreyfus Corporation
200 Park Avenue
New York, NY 10166
Custodian
The Bank of New York Mellon
225 Liberty Street
New York, NY 10286
Transfer Agent &
Dividend Disbursing Agent
Dreyfus Transfer, Inc.
200 Park Avenue
New York, NY 10166
Distributor
MBSC Securities Corporation
200 Park Avenue
New York, NY 10166
Ticker Symbols: DRTAX | |
Telephone Call your financial representative or 1-800-DREYFUS
Mail The Dreyfus Family of Funds, 144 Glenn Curtiss Boulevard, Uniondale, NY 11556-0144
E-mail Send your request to info@dreyfus.com
Internet Information can be viewed online or downloaded at www.dreyfus.com
The fund files its complete schedule of portfolio holdings with the Securities and Exchange Commission (“SEC”) for the first and third quarters of each fiscal year on Form N-Q. The fund’s Forms N-Q are available on the SEC’s website at www.sec.gov and may be reviewed and copied at the SEC’s Public Reference Room in Washington, DC. (phone 1-800-SEC-0330 for information).
Information regarding how the fund voted proxies related to portfolio securities for the most recent 12-month period ended June 30 is available at www.dreyfus.com and on the SEC’s website at www.sec.gov and without charge, upon request, by calling 1-800-DREYFUS.
© 2015 MBSC Securities Corporation |
0054AR0815 |

Item 2. Code of Ethics.
The Registrant has adopted a code of ethics that applies to the Registrant's principal executive officer, principal financial officer, principal accounting officer or controller, or persons performing similar functions. There have been no amendments to, or waivers in connection with, the Code of Ethics during the period covered by this Report.
Item 3. Audit Committee Financial Expert.
The Registrant's Board has determined that Ehud Houminer, a member of the Audit Committee of the Board, is an audit committee financial expert as defined by the Securities and Exchange Commission (the "SEC"). Ehud Houminer is "independent" as defined by the SEC for purposes of audit committee financial expert determinations.
Item 4. Principal Accountant Fees and Services.
(a) Audit Fees. The aggregate fees billed for each of the last two fiscal years (the "Reporting Periods") for professional services rendered by the Registrant's principal accountant (the "Auditor") for the audit of the Registrant's annual financial statements or services that are normally provided by the Auditor in connection with the statutory and regulatory filings or engagements for the Reporting Periods, were $32,792 in 2014 and $33,612 in 2015.
(b) Audit-Related Fees. The aggregate fees billed in the Reporting Periods for assurance and related services by the Auditor that are reasonably related to the performance of the audit of the Registrant's financial statements and are not reported under paragraph (a) of this Item 4 were $12,120 in 2014 and $6,273 in 2015. These services consisted of one or more of the following: (i) agreed upon procedures related to compliance with Internal Revenue Code section 817(h), (ii) security counts required by Rule 17f-2 under the Investment Company Act of 1940, as amended, (iii) advisory services as to the accounting or disclosure treatment of Registrant transactions or events and (iv) advisory services to the accounting or disclosure treatment of the actual or potential impact to the Registrant of final or proposed rules, standards or interpretations by the Securities and Exchange Commission, the Financial Accounting Standards Boards or other regulatory or standard-setting bodies.
The aggregate fees billed in the Reporting Periods for non-audit assurance and related services by the Auditor to the Registrant's investment adviser (not including any sub-investment adviser whose role is primarily portfolio management and is subcontracted with or overseen by another investment adviser), and any entity controlling, controlled by or under common control with the investment adviser that provides ongoing services to the Registrant ("Service Affiliates"), that were reasonably related to the performance of the annual audit of the Service Affiliate, which required pre-approval by the Audit Committee were $-0- in 2014 and $-0- in 2015.
(c) Tax Fees. The aggregate fees billed in the Reporting Periods for professional services rendered by the Auditor for tax compliance, tax advice, and tax planning ("Tax Services") were $3,298 in 2014 and $3,707 in 2015. These services consisted of: (i) review or preparation of U.S. federal, state, local and excise tax returns; (ii) U.S. federal, state and local tax planning, advice and assistance regarding statutory, regulatory or administrative developments; and (iii) tax advice regarding tax qualification matters and/or treatment of various financial instruments held or proposed to be acquired or held. The aggregate fees billed in the Reporting Periods for Tax Services by the Auditor to Service Affiliates, which required pre-approval by the Audit Committee were $-0- in 2014 and $-0- in 2015.
(d) All Other Fees. The aggregate fees billed in the Reporting Periods for products and services provided by the Auditor, other than the services reported in paragraphs (a) through (c) of this Item, were $2,541 in 2014 and $13,031 in 2015. These services included a review of the Registrant's anti-money laundering program.
The aggregate fees billed in the Reporting Periods for Non-Audit Services by the Auditor to Service Affiliates, other than the services reported in paragraphs (b) through (c) of this Item, which required pre-approval by the Audit Committee, were $-0- in 2014 and $-0- in 2015.
(e)(1) Audit Committee Pre-Approval Policies and Procedures. The Registrant's Audit Committee has established policies and procedures (the "Policy") for pre-approval (within specified fee limits) of the Auditor's engagements for non-audit services to the Registrant and Service Affiliates without specific case-by-case consideration. The pre-approved services in the Policy can include pre-approved audit services, pre-approved audit-related services, pre-approved tax services and pre-approved all other services. Pre-approval considerations include whether the proposed services are compatible with maintaining the Auditor's independence. Pre-approvals pursuant to the Policy are considered annually.
(e)(2) Note: None of the services described in paragraphs (b) through (d) of this Item 4 were approved by the Audit Committee pursuant to paragraph (c)(7)(i)(C) of Rule 2-01 of Regulation S-X.
(f) None of the hours expended on the principal accountant's engagement to audit the registrant's financial statements for the most recent fiscal year were attributed to work performed by persons other than the principal account's full-time, permanent employees.
Non-Audit Fees. The aggregate non-audit fees billed by the Auditor for services rendered to the Registrant, and rendered to Service Affiliates, for the Reporting Periods were $32,746,283 in 2014 and $21,000,680 in 2015.
Auditor Independence. The Registrant's Audit Committee has considered whether the provision of non-audit services that were rendered to Service Affiliates, which were not pre-approved (not requiring pre-approval), is compatible with maintaining the Auditor's independence.
Item 5. Audit Committee of Listed Registrants.
Not applicable. [CLOSED-END FUNDS ONLY]
Item 6. Investments.
(a) Not applicable.
Item 7. Disclosure of Proxy Voting Policies and Procedures for Closed-End Management Investment Companies.
Not applicable. [CLOSED-END FUNDS ONLY]
Item 8. Portfolio Managers of Closed-End Management Investment Companies.
Not applicable. [CLOSED-END FUNDS ONLY, beginning with reports for periods ended on and after December 31, 2005]
Item 9. Purchases of Equity Securities by Closed-End Management Investment Companies and Affiliated Purchasers.
Not applicable. [CLOSED-END FUNDS ONLY]
Item 10. Submission of Matters to a Vote of Security Holders.
There have been no material changes to the procedures applicable to Item 10.
Item 11. Controls and Procedures.
(a) The Registrant's principal executive and principal financial officers have concluded, based on their evaluation of the Registrant's disclosure controls and procedures as of a date within 90 days of the filing date of this report, that the Registrant's disclosure controls and procedures are reasonably designed to ensure that information required to be disclosed by the Registrant on Form N-CSR is recorded, processed, summarized and reported within the required time periods and that information required to be disclosed by the Registrant in the reports that it files or submits on Form N-CSR is accumulated and communicated to the Registrant's management, including its principal executive and principal financial officers, as appropriate to allow timely decisions regarding required disclosure.
(b) There were no changes to the Registrant's internal control over financial reporting that occurred during the second fiscal quarter of the period covered by this report that have materially affected, or are reasonably likely to materially affect, the Registrant's internal control over financial reporting.
Item 12. Exhibits.
(a)(1) Code of ethics referred to in Item 2.
(a)(2) Certifications of principal executive and principal financial officers as required by Rule 30a-2(a) under the Investment Company Act of 1940.
(a)(3) Not applicable.
(b) Certification of principal executive and principal financial officers as required by Rule 30a-2(b) under the Investment Company Act of 1940.
SIGNATURES
Pursuant to the requirements of the Securities Exchange Act of 1934 and the Investment Company Act of 1940, the Registrant has duly caused this Report to be signed on its behalf by the undersigned, thereunto duly authorized.
Dreyfus Bond Funds, Inc.
By: /s/ Bradley J. Skapyak
Bradley J. Skapyak
President
Date: October 22, 2015
Pursuant to the requirements of the Securities Exchange Act of 1934 and the Investment Company Act of 1940, this Report has been signed below by the following persons on behalf of the Registrant and in the capacities and on the dates indicated.
By: /s/ Bradley J. Skapyak
Bradley J. Skapyak
President
Date: October 22, 2015
By: /s/ James Windels
James Windels
Treasurer
Date: October 22, 2015
EXHIBIT INDEX
(a)(1) Code of ethics referred to in Item 2.
(a)(2) Certifications of principal executive and principal financial officers as required by Rule 30a-2(a) under the Investment Company Act of 1940. (EX-99.CERT)
(b) Certification of principal executive and principal financial officers as required by Rule 30a-2(b) under the Investment Company Act of 1940. (EX-99.906CERT)