UNITED STATES
SECURITIES AND EXCHANGE COMMISSION
Washington, D.C. 20549
FORM N-CSR
CERTIFIED SHAREHOLDER REPORT
OF
REGISTERED MANAGEMENT INVESTMENT COMPANIES
Investment Company Act file number: 811-04098
Name of Registrant: Vanguard Chester Funds
Address of Registrant:
P.O. Box 2600
Valley Forge, PA 19482
Name and address of agent for service:
Heidi Stam, Esquire
P.O. Box 876
Valley Forge, PA 19482
Registrant’s telephone number, including area code: (610) 669-1000
Date of fiscal year end: September 30
Date of reporting period: October 1, 2014 – September 30, 2015
Item 1: Reports to Shareholders
Annual Report | September 30, 2015
Vanguard PRIMECAP Fund
Vanguard’s Principles for Investing Success
We want to give you the best chance of investment success. These principles, grounded in Vanguard’s research and experience, can put you on the right path.
Goals. Create clear, appropriate investment goals.
Balance. Develop a suitable asset allocation using broadly diversified funds. Cost. Minimize cost.
Discipline. Maintain perspective and long-term discipline.
A single theme unites these principles: Focus on the things you can control.
We believe there is no wiser course for any investor.
| Contents | |
| Your Fund’s Total Returns. | 1 |
| Chairman’s Letter. | 2 |
| Advisor’s Report. | 9 |
| Fund Profile. | 12 |
| Performance Summary. | 13 |
| Financial Statements. | 15 |
| Your Fund’s After-Tax Returns. | 27 |
| About Your Fund’s Expenses. | 28 |
| Trustees Approve Advisory Arrangement. | 30 |
| Glossary. | 31 |
Please note: The opinions expressed in this report are just that—informed opinions. They should not be considered promises or advice. Also, please keep in mind that the information and opinions cover the period through the date on the front of this report. Of course, the risks of investing in your fund are spelled out in the prospectus.
See the Glossary for definitions of investment terms used in this report.
About the cover: Pictured is a sailing block on the Brilliant, a 1932 schooner docked in Mystic, Connecticut. A type of pulley, the sailing block helps coordinate the setting of the sails. At Vanguard, the intricate coordination of technology and people allows us to help millions of clients around the world reach their financial goals.
| Your Fund’s Total Returns | ||||
| Fiscal Year Ended September 30, 2015 | ||||
| Total | ||||
| Returns | ||||
| Vanguard PRIMECAP Fund | ||||
| Investor Shares | -0.76% | |||
| Admiral™ Shares | -0.69 | |||
| S&P 500 Index | -0.61 | |||
| Multi-Cap Growth Funds Average | 1.40 | |||
| Multi-Cap Growth Funds Average: Derived from data provided by Lipper, a Thomson Reuters Company. | ||||
| Admiral Shares carry lower expenses and are available to investors who meet certain account-balance requirements. | ||||
| Your Fund’s Performance at a Glance | ||||
| September 30, 2014, Through September 30, 2015 | ||||
| Distributions Per Share | ||||
| Starting | Ending | |||
| Share | Share | Income | Capital | |
| Price | Price | Dividends | Gains | |
| Vanguard PRIMECAP Fund | ||||
| Investor Shares | $104.16 | $96.99 | $1.160 | $5.708 |
| Admiral Shares | 108.08 | 100.53 | 1.403 | 5.913 |
1

Chairman’s Letter
Dear Shareholder,
Vanguard PRIMECAP Fund wasn’t immune to the challenges faced by the broad U.S. stock market over the fiscal year ended September 30, 2015. The fund’s collection of stocks is quite different from those held by its benchmark, the Standard & Poor’s 500 Index, as well as those that encompass the broad market. Over the 12 months, however, PRIMECAP’s subdued results looked a lot like those of both standards.
PRIMECAP returned about –1%, just slightly trailing its benchmark and finishing further behind the 1.40% average return of its multi-capitalization growth peers.
The advisor’s health care and information technology holdings, historically the sources of the fund’s heaviest sector exposure and greatest contributions to return, delivered subpar results for the period.
If you hold fund shares in a taxable account, you may wish to review the table of after-tax returns, based on the highest federal income tax bracket, that appears later in this report.
China’s economic woes weighed on U.S. stocks
The broad U.S. stock market returned–0.49% for the 12 months. The final two months were especially rocky as investors worried in particular about the global ripple effects of slower growth in China.
2
For much of the fiscal year, investors were preoccupied with the possibility of an increase in short-term interest rates. On September 17, the Federal Reserve announced it would hold rates steady for the time being, a decision that to some investors indicated the Fed’s hesitancy over the fragility of global markets.
International stocks returned about –11%, as the dollar’s strength against many foreign currencies weighed on results. Returns for emerging markets, which were especially hard hit by the concerns about China, trailed those of the developed markets of the Pacific region and Europe.
Taxable bonds recorded gains as investors searched for safety
The broad U.S. taxable bond market returned 2.94% as investors gravitated toward safe-haven assets amid the global stock market turmoil. Stimulative monetary policies from the world’s central banks, declining inflation expectations, and global investors’ search for higher yields also helped lift U.S. bonds.
The yield of the 10-year Treasury note ended September at 2.05%, down from 2.48% a year earlier. (Bond prices and yields move in opposite directions.)
| Market Barometer | |||
| Average Annual Total Returns | |||
| Periods Ended September 30, 2015 | |||
| One | Three | Five | |
| Year | Years | Years | |
| Stocks | |||
| Russell 1000 Index (Large-caps) | -0.61% | 12.66% | 13.42% |
| Russell 2000 Index (Small-caps) | 1.25 | 11.02 | 11.73 |
| Russell 3000 Index (Broad U.S. market) | -0.49 | 12.53 | 13.28 |
| FTSE All-World ex US Index (International) | -11.34 | 2.87 | 2.19 |
| Bonds | |||
| Barclays U.S. Aggregate Bond Index (Broad taxable market) | 2.94% | 1.71% | 3.10% |
| Barclays Municipal Bond Index (Broad tax-exempt market) | 3.16 | 2.88 | 4.14 |
| Citigroup Three-Month U.S. Treasury Bill Index | 0.02 | 0.02 | 0.04 |
| CPI | |||
| Consumer Price Index | -0.04% | 0.93% | 1.73% |
3
International bond markets (as measured by the Barclays Global Aggregate Index ex USD) returned –7.67%, hurt by the dollar’s strength. Without this currency effect, international bonds advanced modestly.
The Fed’s 0%–0.25% target for short-term interest rates continued to limit returns for money market funds and savings accounts.
Health care and tech stocks headed in the wrong direction
Outperformance has characterized overall results for the PRIMECAP Fund since its launch in 1984. But periods of underper-formance haven’t been unusual; such periods inevitably accompany the search for long-term outperformance. Because the fund’s holdings have historically not aligned with those of the benchmark, it’s possible for the fund to trail or trump its comparative standards. To reap the potential benefits of the fund’s strategy, you must have patience through intermittent periods of disappointment.
PRIMECAP Management Company, the fund’s advisor, takes a long-term approach to the investment process. The team employs deep research methods that include one-on-one meetings with company management, competitors, suppliers, and customers in its search for undervalued growth companies.
When PRIMECAP Management identifies the stocks of companies that meet its rigorous standards, it displays conviction and patience through both good times and bad. It typically holds those stocks unless
| Expense Ratios | |||
| Your Fund Compared With Its Peer Group | |||
| Investor | Admiral | Peer Group | |
| Shares | Shares | Average | |
| PRIMECAP Fund | 0.44% | 0.35% | 1.28% |
The fund expense ratios shown are from the prospectus dated January 27, 2015, and represent estimated costs for the current fiscal year. For the fiscal year ended September 30, 2015, the fund’s expense ratios were 0.40% for Investor Shares and 0.34% for Admiral Shares. The peer-group expense ratio is derived from data provided by Lipper, a Thomson Reuters Company, and captures information through year-end 2014.
Peer group: Multi-Cap Growth Funds.
4
and until they no longer fundamentally fit the portfolio or their valuations or business models have changed.
Over the recent fiscal year, health care and information technology stocks combined to account for more than 60 percent of PRIMECAP’s asset allocation, but neither sector was a standout. In both cases, the advisor’s holdings hurt performance, and part of the shortfall came from having zero or minimal exposure to companies that excelled.
PRIMECAP’s health care stocks returned less than 2%, compared with about 5% for those held by the benchmark. The fund’s pharmaceutical stocks did reasonably well but couldn’t offset weakness in biotech- nology. Some stocks in the sector were hurt by controversy over significant product price increases. PRIMECAP also lacked investments in thriving managed-care companies.
Results in information technology also disappointed: PRIMECAP’s IT stocks dipped about 3%, while those held by the benchmark rose 2%. Most of the performance gap was evident in the hardware industry; it had many more stragglers than stars, and the fund owned most of the stragglers. Software companies were a positive, but returns were further restrained by the fund’s holdings in communications equipment and semiconductor businesses.
| Total Returns | |
| Ten Years Ended September 30, 2015 | |
| Average | |
| Annual Return | |
| PRIMECAP Fund Investor Shares | 9.02% |
| S&P 500 Index | 6.80 |
| Multi-Cap Growth Funds Average | 6.40 |
| Multi-Cap Growth Funds Average: Derived from data provided by Lipper, a Thomson Reuters Company. |
The figures shown represent past performance, which is not a guarantee of future results. (Current performance may be lower or higher than the performance data cited. For performance data current to the most recent month-end, visit our website at vanguard.com/performance.) Note, too, that both investment returns and principal value can fluctuate widely, so an investor’s shares, when sold, could be worth more or less than their original cost.
5
Staying the course can help you stay closer to your fund’s return
When stock markets are highly volatile, as in recent months, it’s tempting to run for cover. But the price of panic can be high.
A rough measure of what can be lost from attempts to time the market is the difference between the returns produced by a fund and the returns earned by the fund’s investors.
The results shown in the Performance Summary later in this report are your fund’s time-weighted returns—the average annual returns investors would have earned if they had invested a lump sum in the fund at the start of the period and reinvested any distributions they received. Their actual returns, however, depend on whether they subsequently bought or sold any shares. There’s often a gap between this dollar-weighted return for investors and the fund’s time-weighted return, as shown below.
Many sensible investment behaviors can contribute to the difference in returns, but industry cash flow data suggest that one important factor is the generally counterproductive effort to buy and sell at the “right” time. Keeping your emotions in check can help narrow the gap.
Mutual fund returns and investor returns over the last decade
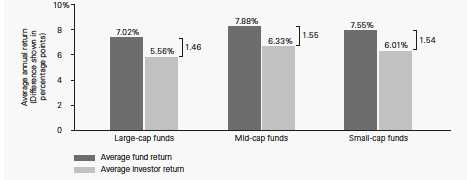
Notes: Data are as of December 31, 2014. The average fund returns and average investor returns are from Morningstar. The average fund returns are the average of the funds’ time-weighted returns in each category. The average investor returns assume that the growth of a fund’s total net assets for a given period is driven by market returns and investor cash ow. To calculate investor return, a fund’s change in assets for the period is discounted by the return of the fund to isolate how much of the asset growth was driven by cash ow. A model, similar to an internal rate-of-return calculation, is then used to calculate a constant growth rate that links the beginning total net assets and periodic cash ows to the ending total net assets.
Sources: Vanguard and Morningstar, Inc.
6
Consumer discretionary stocks, not a traditional stronghold for the fund, rose about 17% and delivered the largest contribution to return among the sectors. Much of the strength was concentrated among apparel retailers.
Returns for PRIMECAP’s industrial and financial stocks were generally muted, but the advisor’s holdings in those sectors outpaced those of the benchmark. The remaining sectors accounted for only about 5% of the fund’s exposure on average over the period, with no utility holdings. PRIMECAP’s energy stocks declined sharply as low oil prices continued to weigh on the sector, but the small allocation limited the damage to returns.
For more about the advisor’s strategy and the fund’s positioning during the 12 months, please see the Advisor’s Report that follows this letter.
The advisor’s longrange focus helped lift results over ten years
Both the PRIMECAP Fund’s performance over the past decade and its path to that performance were rooted in the advisor’s philosophy and strategy of investing with conviction and a long-term lens.
For the ten years ended September 30, 2015, the fund’s Investor Shares registered an average annual return of 9.02%, more than 2 percentage points ahead of both its market benchmark and the average return of its peers. The period included a four-year stretch––fiscal years 2009–2012––in which the fund trailed either its benchmark, its peer average, or both.
Although PRIMECAP’s stock holdings and sector allocation at times didn’t match market trends or investor sentiment, the advisor stuck firmly with its plan, and some of the stocks it held during the leaner years rebounded strongly in the most recent ones.
Along with the advisor’s experience and skill, the fund’s shareholders benefited from relatively low investment expenses. Lower costs allow shareholders to pocket more of the fund’s returns.
A dose of discipline is crucial when markets become volatile
The broad U.S. stock market has posted gains for six straight calendar years—from 2009 to 2014—but that streak may not last a seventh. Stocks tumbled in August and swung up and down in September.
Nobody can control the direction of the markets or predict where they’ll go in the short term. However, investors can control how they react to unstable and turbulent markets.
During periods of market adversity, it’s more important than ever to keep sight of one of Vanguard’s key principles: Maintain perspective and long-term discipline. Whether you’re investing for yourself or on behalf of clients, your success is affected greatly by how you respond—or don’t
7
respond—during turbulent markets. (You can read Vanguard’s Principles for Investing Success at vanguard.com/research.)
As I’ve written in the past, the best course for long-term investors is generally to ignore daily market moves and not make decisions based on emotion. (See the box on page 6 for more about the benefit of staying the course.) This is also a good time to evaluate your portfolio and make sure your asset allocation is aligned with your time horizon, goals, and risk tolerance.
The markets are unpredictable and often confounding. Keeping our long-term plans clearly in focus can be key as we weather these periodic storms.
As always, thank you for investing with Vanguard.
Sincerely,

F. William McNabb III
Chairman and Chief Executive Officer
October 12, 2015
8
Advisor’s Report
For the fiscal year ended September 30, 2015, Vanguard PRIMECAP Fund returned –0.76% for Investor Shares and –0.69% for Admiral Shares. These results trailed both the –0.61% return of the fund’s benchmark, the unmanaged Standard & Poor’s 500 Index, and the 1.40% average return of its multi-capitalization growth fund competitors. Favorable sector allocations, including an underweight position in energy and overweight positions in health care and information technology, were roughly offset by unfavorable stock selection in the same sectors.
The investment environment
Despite a record close on May 21, 2015, the S&P 500 Index delivered a slightly negative total return over the past 12 months, as global growth concerns weighed on equity values late in the fiscal year.
The U.S. economy expanded at a modest pace, as real gross domestic product (GDP) growth averaged approximately 2% during the three quarters ended June 30. The labor market continued to improve, with the unemployment rate declining to 5.1% at the end of September. Monetary policy remained highly accommodative, as the Federal Open Market Committee maintained its 0%–0.25% target for the federal funds rate. The dollar appreciated significantly, driven by the relative strength of the U.S. economy. Over the past 12 months, the price of West Texas Intermediate crude oil declined by approximately 50%.
Concerns about China’s economic health intensified as the year progressed. The Shanghai Stock Exchange Composite Index experienced significant volatility, which reverberated across the global financial markets. U.S. investors tried to assess the impact a slowing Chinese economy may have on the domestic economic recovery.
Outlook for U.S. equities
We find U.S. equities to be fairly valued at current levels. As of September 30, the S&P 500 Index was trading for approximately 16 times the next 12 months’ earnings, a reasonable valuation by historical standards, though the index appears more expensive based on price/ sales ratio because profit margins are near all-time highs. We continue to believe that many individual stocks are attractively valued and that stocks represent a more attractive investment than bonds at current prices.
Portfolio update and outlook
For the 12 months ended September 30, the portfolio was overweighted in information technology, health care, and industrial stocks. These sectors constituted more than 75% of the fund’s holdings on average (compared with a 45% combined average weighting in the S&P 500 Index).
Favorable sector allocations, notably in energy (underweight), health care (overweight), and information technology (overweight), were mostly offset by unfavorable stock selection. Negative
9
stock selection, primarily in information technology, health care, and energy, more than offset positive stock selection, primarily in industrials and consumer discretionary.
Unfavorable stock selection in information technology was driven by Micron (–56%), Hewlett-Packard (–26%), Alibaba (–34%), QUALCOMM (–26%), NetApp (–30%), and the fund’s underweight position in Apple (+11%). In the health care sector, unfavorable selection was driven by Biogen (–12%) and Roche (–8%), and by not owning managed care companies, which performed well. In the energy sector, unfavorable selection was led by Transocean (–56%) and Noble Energy (–55%). In the industrial sector, Alaska Air Group (+84%) and Southwest Airlines (+13%) drove most of the outperformance. The largest positive contributors in the consumer discretionary sector were L Brands (+41%), Ross Stores (+29%), Sony (+36%), TJX (+22%), and Carnival (+27%).
Energy
The fund remains significantly underweighted in energy, which was the worst-performing sector in the S&P 500 Index over the 12 months. We do not believe we are able to predict the direction of oil prices with any certainty; we believe, however, that technological innovation may exert downward pressure on the price of oil over the long term. Advancements such as hydraulic fracturing may continue to lower the cost of production, while new technologies such as vehicle electrification may reduce oil demand.
We have found few compelling investments within the sector, as the valuations of many companies would require a rebound in oil prices to be attractive. While such a scenario is possible, we do not want to invest with a thesis predicated on higher oil prices. Oil prices also have an impact on our investments outside of the energy sector. We believe certain holdings, such as airlines (overweight) and cruise lines (overweight), may continue to benefit from lower input costs if current oil prices persist; other holdings, such as some industrial companies, may continue to face weaker demand from energy-related customers at current oil prices.
Industrials
Within industrials, we continue to find our investments in airlines attractive. The industry has consolidated significantly, and the four largest airlines now control over 80% of total capacity. Management teams are increasingly focused on generating adequate returns on capital, rather than chasing unprofitable market share. Domestic capacity has been reduced since 2007, and utilization is high. In light of these industry dynamics, strong free cash flow, and low valuation multiples, we continue to remain overweighted in airlines.
Technology
We believe that our holdings within information technology represent compelling investments. A major technological shift is under way as software, storage, and computing power continue to move to the “cloud,” where clients can rent these services over the internet. This shift is
10
helping to enable new “big data” and mobility applications, while simultaneously increasing demand for certain types of storage and processing infrastructure. Although these trends have mixed implications for some holdings with legacy technology, these companies’ strong competitive positions, cash-rich balance sheets, and healthy cash-flow generation enable them to invest ample resources in cloud-based offerings. In addition, we believe the low valuation multiples assigned to many of these stocks more than adequately reflect the risks associated with this transition.
Health care
While health care stock selection has been a significant detractor from the fund’s results over the last 12 months, we feel that the industry’s long-term outlook remains favorable. Increasing demand for health care products will be driven by demographic trends as well as the industry’s ability to develop new and more effective therapies. The industry’s pipeline includes promising new treatments for cancer, Alzheimer’s, and autoimmune diseases. In addition, the reduction in the cost of genetic sequencing may result in new breakthroughs in drug development. With the recent pullback in health care stocks, valuations of large-cap biotech and pharmaceutical companies are reasonable, with some trading at a discount to the S&P 500 Index price/earnings multiple, in spite of their superior growth profiles.
Tempering our positive outlook is the nearer-term uncertainty over reimbursement and pricing. Earlier this year, Pharmacy Benefit Managers extracted higher-than-expected pricing concessions from AbbVie and Gilead as the two firms competed for market share with their new hepatitis C drugs. Proposals in the U.S. presidential campaign to reduce pharmaceutical spending have again raised the specter of government-negotiated or mandated pricing. While we are mindful of these potential negatives, we believe that companies with novel drug treatments that provide significant benefits over existing therapies will continue to receive favorable reimbursement from payors.
Conclusion
We remain committed to our investment philosophy, which is to invest in attractively priced stocks for the long term. This “bottom-up” approach often results in a portfolio that bears little resemblance to a market index; therefore, our results often deviate substantially from those of the index. Furthermore, our long-term investment horizon results in low portfolio turnover, which creates the possibility for extended periods of underperformance when the stocks in our portfolio fall out of favor. We nonetheless believe that this approach can generate superior results for shareholders over the long term.
PRIMECAP Management Company October 14, 2015
11
| PRIMECAP Fund | |||
| Fund Profile | |||
| As of September 30, 2015 | |||
| Share-Class Characteristics | |||
| Investor | Admiral | ||
| Shares | Shares | ||
| Ticker Symbol | VPMCX | VPMAX | |
| Expense Ratio1 | 0.44% | 0.35% | |
| 30-Day SEC Yield | 1.36% | 1.43% | |
| Portfolio Characteristics | |||
| DJ | |||
| U.S. | |||
| Total | |||
| Market | |||
| S&P 500 | FA | ||
| Fund | Index | Index | |
| Number of Stocks | 128 | 505 | 4,000 |
| Median Market Cap | $59.9B | $75.8B | $46.5B |
| Price/Earnings Ratio | 20.0x | 18.9x | 20.2x |
| Price/Book Ratio | 3.4x | 2.6x | 2.5x |
| Return on Equity | 18.7% | 18.2% | 17.2% |
| Earnings Growth | |||
| Rate | 8.4% | 9.8% | 10.1% |
| Dividend Yield | 1.8% | 2.3% | 2.1% |
| Foreign Holdings | 11.5% | 0.0% | 0.0% |
| Turnover Rate | 9% | — | — |
| Short-Term | |||
| Reserves | 3.2% | — | — |
| Sector Diversification (% of equity exposure) | |||
| DJ | |||
| U.S. Total | |||
| S&P 500 | Market | ||
| Fund | Index FA Index | ||
| Consumer | |||
| Discretionary | 8.9% | 13.1% | 13.7% |
| Consumer Staples | 0.6 | 9.9 | 8.7 |
| Energy | 1.6 | 6.9 | 6.3 |
| Financials | 6.4 | 16.5 | 18.3 |
| Health Care | 30.3 | 14.7 | 14.4 |
| Industrials | 15.9 | 10.1 | 10.6 |
| Information | |||
| Technology | 33.4 | 20.4 | 19.6 |
| Materials | 1.9 | 2.8 | 3.1 |
| Telecommunication | |||
| Services | 1.0 | 2.4 | 2.1 |
| Utilities | 0.0 | 3.2 | 3.2 |
| Volatility Measures | ||
| DJ | ||
| U.S. Total | ||
| S&P 500 | Market | |
| Index | FA Index | |
| R-Squared | 0.88 | 0.89 |
| Beta | 0.94 | 0.93 |
| These measures show the degree and timing of the fund’s | ||
| fluctuations compared with the indexes over 36 months. | ||
| Ten Largest Holdings (% of total net assets) | ||
| Biogen Inc. | Biotechnology | 6.5% |
| Eli Lilly & Co. | Pharmaceuticals | 5.7 |
| Amgen Inc. | Biotechnology | 5.1 |
| Adobe Systems Inc. | Application Software | 4.2 |
| Google Inc. | Internet Software & | |
| Services | 4.2 | |
| Texas Instruments Inc. | Semiconductors | 4.0 |
| Microsoft Corp. | Systems Software | 4.0 |
| Roche Holding AG | Pharmaceuticals | 3.5 |
| FedEx Corp. | Air Freight & | |
| Logistics | 3.2 | |
| Southwest Airlines Co. | Airlines | 3.1 |
| Top Ten | 43.5% | |
| The holdings listed exclude any temporary cash investments and | ||
| equity index products. | ||
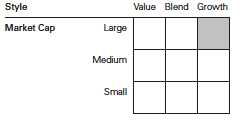
Investment Focus
1 The expense ratios shown are from the prospectus dated January 27, 2015, and represent estimated costs for the current fiscal year. For the fiscal year ended September 30, 2015, the expense ratios were 0.40% for Investor Shares and 0.34% for Admiral Shares.
12
PRIMECAP Fund
Performance Summary
All of the returns in this report represent past performance, which is not a guarantee of future results that may be achieved by the fund. (Current performance may be lower or higher than the performance data cited. For performance data current to the most recent month-end, visit our website at vanguard.com/performance.) Note, too, that both investment returns and principal value can fluctuate widely, so an investor’s shares, when sold, could be worth more or less than their original cost. The returns shown do not reflect taxes that a shareholder would pay on fund distributions or on the sale of fund shares.
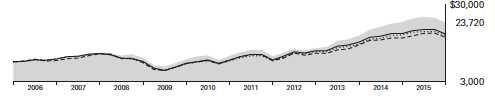
Cumulative Performance: September 30, 2005, Through September 30, 2015
Initial Investment of $10,000
| Average Annual Total Returns | |||||
| Periods Ended September 30, 2015 | |||||
| Final Value | |||||
| One | Five | Ten | of a $10,000 | ||
| Year | Years | Years | Investment | ||
| PRIMECAP Fund*Investor Shares | -0.76% | 14.50% | 9.02% | $23,720 | |
| •••••••• | S&P 500 Index | -0.61 | 13.34 | 6.80 | 19,305 |
| – – – – | Multi-Cap Growth Funds Average | 1.40 | 12.02 | 6.40 | 18,592 |
| Dow Jones U.S. Total Stock Market | |||||
| Float Adjusted Index | -0.55 | 13.26 | 7.06 | 19,778 | |
| Multi-Cap Growth Funds Average: Derived from data provided by Lipper, a Thomson Reuters Company. | |||||
| Final Value | |||||
| One | Five | Ten | of a $50,000 | ||
| Year | Years | Years | Investment | ||
| PRIMECAP Fund Admiral Shares | -0.69% | 14.60% | 9.13% | $119,821 | |
| S&P 500 Index | -0.61 | 13.34 | 6.80 | 96,526 | |
| Dow Jones U.S. Total Stock Market Float | |||||
| Adjusted Index | -0.55 | 13.26 | 7.06 | 98,892 | |
See Financial Highlights for dividend and capital gains information.
13
PRIMECAP Fund
Fiscal-Year Total Returns (%): September 30, 2005, Through September 30, 2015
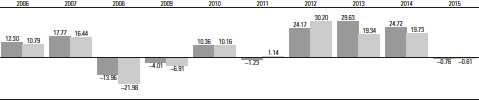
PRIMECAP Fund Investor Shares
S&P 500 Index
14
PRIMECAP Fund
Financial Statements
Statement of Net Assets
As of September 30, 2015
The fund reports a complete list of its holdings in regulatory filings four times in each fiscal year, at the quarter-ends. For the second and fourth fiscal quarters, the lists appear in the fund’s semiannual and annual reports to shareholders. For the first and third fiscal quarters, the fund files the lists with the Securities and Exchange Commission on Form N-Q. Shareholders can look up the fund’s Forms N-Q on the SEC’s website at sec.gov. Forms N-Q may also be reviewed and copied at the SEC’s Public Reference Room (see the back cover of this report for further information).
| Market | |||
| Value | |||
| Shares | ($000) | ||
| Common Stocks (97.0%) | |||
| Consumer Discretionary (8.6%) | |||
| L Brands Inc. | 10,487,493 | 945,238 | |
| TJX Cos. Inc. | 6,875,000 | 491,012 | |
| Walt Disney Co. | 4,700,000 | 480,340 | |
| Ross Stores Inc. | 9,045,200 | 438,421 | |
| * | Sony Corp. ADR | 16,305,000 | 399,472 |
| Carnival Corp. | 7,176,500 | 356,672 | |
| * | Bed Bath & Beyond Inc. | 2,300,975 | 131,202 |
| Royal Caribbean Cruises | |||
| Ltd. | 1,250,000 | 111,363 | |
| * | Amazon.com Inc. | 188,065 | 96,269 |
| VF Corp. | 772,400 | 52,685 | |
| Time Warner Cable Inc. | 293,304 | 52,610 | |
| Whirlpool Corp. | 325,000 | 47,860 | |
| Newell Rubbermaid Inc. | 475,000 | 18,862 | |
| Las Vegas Sands Corp. | 400,000 | 15,188 | |
| * | CarMax Inc. | 161,100 | 9,556 |
| Marriott International Inc. | |||
| Class A | 120,000 | 8,184 | |
| Hilton Worldwide | |||
| Holdings Inc. | 220,000 | 5,047 | |
| Comcast Corp. Class A | 52,800 | 3,003 | |
| 3,662,984 | |||
| Consumer Staples (0.6%) | |||
| CVS Health Corp. | 2,214,065 | 213,613 | |
| Tyson Foods Inc. Class A | 835,000 | 35,988 | |
| 249,601 | |||
| Energy (1.6%) | |||
| Schlumberger Ltd. | 2,935,900 | 202,489 | |
| EOG Resources Inc. | 2,270,000 | 165,256 | |
| ^ | Transocean Ltd. | 10,156,379 | 131,221 |
| Noble Energy Inc. | 2,600,000 | 78,468 | |
| Exxon Mobil Corp. | 615,000 | 45,725 | |
| National Oilwell Varco Inc. | 580,000 | 21,837 | |
| * | Cameron International | ||
| Corp. | 186,200 | 11,418 | |
| * | Southwestern Energy Co. | 593,779 | 7,535 |
| Market | |||
| Value | |||
| Shares | ($000) | ||
| Cabot Oil & Gas Corp. | 290,000 | 6,339 | |
| Encana Corp. | 500,000 | 3,220 | |
| * | Petroleo Brasileiro SA ADR | ||
| Type A | 600,000 | 2,208 | |
| *,^ | Petroleo Brasileiro SA ADR 400,000 | 1,740 | |
| 677,456 | |||
| Financials (6.2%) | |||
| Charles Schwab Corp. | 26,048,100 | 743,934 | |
| Marsh & McLennan | |||
| Cos. Inc. | 10,963,782 | 572,529 | |
| Wells Fargo & Co. | 9,070,000 | 465,745 | |
| Chubb Corp. | 1,695,000 | 207,892 | |
| Progressive Corp. | 6,433,000 | 197,107 | |
| JPMorgan Chase & Co. | 3,210,000 | 195,714 | |
| US Bancorp | 2,625,000 | 107,651 | |
| CME Group Inc. | 806,150 | 74,762 | |
| Discover Financial | |||
| Services | 1,076,100 | 55,946 | |
| American Express Co. | 422,100 | 31,290 | |
| 2,652,570 | |||
| Health Care (29.4%) | |||
| * | Biogen Inc. | 9,455,200 | 2,759,122 |
| Eli Lilly & Co. | 29,110,000 | 2,436,216 | |
| Amgen Inc. | 15,557,800 | 2,151,955 | |
| Roche Holding AG | 5,681,300 | 1,508,224 | |
| Novartis AG ADR | 12,353,965 | 1,135,576 | |
| Medtronic plc | 8,626,952 | 577,488 | |
| Johnson & Johnson | 5,889,500 | 549,785 | |
| * | Boston Scientific Corp. | 27,842,560 | 456,896 |
| Thermo Fisher Scientific | |||
| Inc. | 2,614,213 | 319,666 | |
| Abbott Laboratories | 6,607,034 | 265,735 | |
| GlaxoSmithKline plc ADR | 3,100,000 | 119,195 | |
| Sanofi ADR | 1,600,000 | 75,952 | |
| AbbVie Inc. | 750,000 | 40,808 | |
| Zimmer Biomet Holdings | |||
| Inc. | 340,000 | 31,936 | |
| Agilent Technologies Inc. | 880,500 | 30,228 | |
15
| PRIMECAP Fund | |||
| Market | |||
| Value | |||
| Shares | ($000) | ||
| Stryker Corp. | 250,000 | 23,525 | |
| AstraZeneca plc ADR | 121,100 | 3,853 | |
| 12,486,160 | |||
| Industrials (15.4%) | |||
| FedEx Corp. | 9,470,068 | 1,363,500 | |
| 1 | Southwest Airlines Co. | 34,198,300 | 1,300,903 |
| Airbus Group SE | 11,021,564 | 652,701 | |
| 1 | Alaska Air Group Inc. | 6,656,800 | 528,883 |
| Honeywell International | |||
| Inc. | 3,600,000 | 340,884 | |
| Union Pacific Corp. | 3,567,400 | 315,394 | |
| * | United Continental | ||
| Holdings Inc. | 5,380,800 | 285,451 | |
| Caterpillar Inc. | 4,085,000 | 266,996 | |
| United Parcel Service Inc. | |||
| Class B | 2,181,070 | 215,250 | |
| Delta Air Lines Inc. | 4,518,000 | 202,723 | |
| Deere & Co. | 2,545,500 | 188,367 | |
| Boeing Co. | 1,275,000 | 166,961 | |
| American Airlines Group | |||
| Inc. | 3,845,000 | 149,301 | |
| United Technologies | |||
| Corp. | 1,087,000 | 96,732 | |
| CH Robinson Worldwide | |||
| Inc. | 1,337,950 | 90,686 | |
| Safran SA | 1,036,800 | 77,959 | |
| Rockwell Automation Inc. | 750,000 | 76,103 | |
| Pentair plc | 1,480,000 | 75,539 | |
| CSX Corp. | 2,265,000 | 60,929 | |
| Expeditors International | |||
| of Washington Inc. | 750,000 | 35,288 | |
| * | Hertz Global Holdings Inc. | 2,090,000 | 34,966 |
| Norfolk Southern Corp. | 196,100 | 14,982 | |
| Republic Services Inc. | |||
| Class A | 17,000 | 700 | |
| 6,541,198 | |||
| Information Technology (32.5%) | |||
| * | Adobe Systems Inc. | 21,710,070 | 1,785,002 |
| Texas Instruments Inc. | 34,447,100 | 1,705,820 | |
| Microsoft Corp. | 38,467,300 | 1,702,563 | |
| * | Google Inc. Class A | 1,419,843 | 906,385 |
| * | Google Inc. Class C | 1,425,903 | 867,548 |
| Hewlett-Packard Co. | 25,390,885 | 650,261 | |
| Intel Corp. | 17,810,500 | 536,808 | |
| QUALCOMM Inc. | 9,130,050 | 490,558 | |
| Intuit Inc. | 5,225,000 | 463,719 | |
| EMC Corp./MA | 17,094,600 | 413,005 | |
| * | Micron Technology Inc. | 26,655,000 | 399,292 |
| NetApp Inc. | 13,301,800 | 393,733 | |
| * | Alibaba Group Holding | ||
| Ltd. ADR | 6,393,100 | 377,001 | |
| Telefonaktiebolaget LM | |||
| Ericsson ADR | 35,998,004 | 352,060 | |
| Cisco Systems Inc. | 12,943,050 | 339,755 | |
| Market | |||
| Value | |||
| Shares | ($000) | ||
| NVIDIA Corp. | 12,675,000 | 312,439 | |
| Visa Inc. Class A | 4,021,600 | 280,145 | |
| Oracle Corp. | 7,535,000 | 272,164 | |
| KLA-Tencor Corp. | 4,848,100 | 242,405 | |
| Activision Blizzard Inc. | 6,183,300 | 191,002 | |
| 1 | Plantronics Inc. | 3,701,500 | 188,221 |
| Analog Devices Inc. | 2,260,000 | 127,487 | |
| Broadcom Corp. Class A | 2,450,000 | 126,003 | |
| SanDisk Corp. | 2,211,416 | 120,146 | |
| Corning Inc. | 5,243,200 | 89,764 | |
| *,^ | BlackBerry Ltd. | 10,438,600 | 63,989 |
| Apple Inc. | 552,000 | 60,886 | |
| * | PayPal Holdings Inc. | 1,688,200 | 52,402 |
| MasterCard Inc. Class A | 532,500 | 47,989 | |
| * | eBay Inc. | 1,688,200 | 41,260 |
| * | Entegris Inc. | 2,583,472 | 34,076 |
| * | Rambus Inc. | 2,685,000 | 31,683 |
| * | Yahoo! Inc. | 993,100 | 28,710 |
| * | F5 Networks Inc. | 197,400 | 22,859 |
| Altera Corp. | 425,000 | 21,284 | |
| * | salesforce.com inc | 277,300 | 19,253 |
| Applied Materials Inc. | 970,000 | 14,249 | |
| * | Keysight Technologies Inc. | 340,000 | 10,486 |
| ASML Holding NV | 98,175 | 8,637 | |
| * | Twitter Inc. | 161,000 | 4,337 |
| 13,795,386 | |||
| Materials (1.8%) | |||
| Monsanto Co. | 6,250,125 | 533,386 | |
| Potash Corp. of | |||
| Saskatchewan Inc. | 5,619,200 | 115,474 | |
| Praxair Inc. | 925,000 | 94,220 | |
| Celanese Corp. Class A | 535,000 | 31,656 | |
| LyondellBasell Industries | |||
| NV Class A | 9,400 | 784 | |
| 775,520 | |||
| Telecommunication Services (0.9%) | |||
| AT&T Inc. | 12,371,642 | 403,068 | |
| Total Common Stocks | |||
| (Cost $21,274,136) | 41,243,943 | ||
| Temporary Cash Investment (3.5%) | |||
| Money Market Fund (3.5%) | |||
| 2,3 | Vanguard Market | ||
| Liquidity Fund, 0.189% | |||
| (Cost $1,481,214) 1,481,214,063 | 1,481,214 | ||
| Total Investments (100.5%) | |||
| (Cost $22,755,350) | 42,725,157 | ||
16
| PRIMECAP Fund | |
| Amount | |
| ($000) | |
| Other Assets and Liabilities (-0.5%) | |
| Other Assets | |
| Investment in Vanguard | 3,954 |
Receivables for Investment Securities Sold 6,871
| Receivables for Accrued Income | 39,806 |
| Receivables for Capital Shares Issued | 27,515 |
| Total Other Assets | 78,146 |
| Liabilities | |
| Payables for Investment Securities | |
| Purchased | (96,820) |
| Collateral for Securities on Loan | (91,148) |
| Payables to Investment Advisor | (22,093) |
| Payables for Capital Shares Redeemed | (20,043) |
| Payables to Vanguard | (58,317) |
| Other Liabilities | (650) |
| Total Liabilities | (289,071) |
| Net Assets (100%) | 42,514,232 |
At September 30, 2015, net assets consisted of:
Amount ($000)
| Paid-in Capital | 20,300,163 |
| Undistributed Net Investment Income | 333,810 |
| Accumulated Net Realized Gains | 1,911,255 |
| Unrealized Appreciation (Depreciation) | |
| Investment Securities | 19,969,807 |
| Foreign Currencies | (803) |
| Net Assets | 42,514,232 |
| Investor Shares—Net Assets | |
| Applicable to 79,811,966 outstanding | |
| $.001 par value shares of beneficial | |
| interest (unlimited authorization) | 7,741,140 |
| Net Asset Value Per Share— | |
| Investor Shares | $96.99 |
| Admiral Shares—Net Assets | |
| Applicable to 345,905,182 outstanding | |
| $.001 par value shares of beneficial | |
| interest (unlimited authorization) | 34,773,092 |
| Net Asset Value Per Share— | |
| Admiral Shares | $100.53 |
- See Note A in Notes to Financial Statements.
- Non-income-producing security.
- Includes partial security positions on loan to broker-dealers. The total value of securities on loan is $89,226,000.
- Considered an affiliated company of the fund as the fund owns more than 5% of the outstanding voting securities of such company.
- Affiliated money market fund available only to Vanguard funds and certain trusts and accounts managed by Vanguard. Rate shown is the 7-day yield.
- Includes $91,148,000 of collateral received for securities on loan. ADR—American Depositary Receipt.
See accompanying Notes, which are an integral part of the Financial Statements.
17
| PRIMECAP Fund | |
| Statement of Operations | |
| Year Ended | |
| September 30, 2015 | |
| ($000) | |
| Investment Income | |
| Income | |
| Dividends1 | 785,967 |
| Interest | 2,890 |
| Securities Lending | 8,346 |
| Total Income | 797,203 |
| Expenses | |
| Investment Advisory Fees—Note B | 90,148 |
| The Vanguard Group—Note C | |
| Management and Administrative—Investor Shares | 19,150 |
| Management and Administrative—Admiral Shares | 46,351 |
| Marketing and Distribution—Investor Shares | 1,594 |
| Marketing and Distribution—Admiral Shares | 3,670 |
| Custodian Fees | 673 |
| Auditing Fees | 31 |
| Shareholders’ Reports—Investor Shares | 27 |
| Shareholders’ Reports—Admiral Shares | 52 |
| Trustees’ Fees and Expenses | 73 |
| Total Expenses | 161,769 |
| Net Investment Income | 635,434 |
| Realized Net Gain (Loss) | |
| Investment Securities Sold | 2,666,442 |
| Foreign Currencies | (485) |
| Realized Net Gain (Loss) | 2,665,957 |
| Change in Unrealized Appreciation (Depreciation) | |
| Investment Securities | (3,527,564) |
| Foreign Currencies | 35 |
| Change in Unrealized Appreciation (Depreciation) | (3,527,529) |
| Net Increase (Decrease) in Net Assets Resulting from Operations | (226,138) |
| 1 Dividends are net of foreign withholding taxes of $17,976,000. | |
See accompanying Notes, which are an integral part of the Financial Statements.
18
| PRIMECAP Fund | ||
| Statement of Changes in Net Assets | ||
| Year Ended September 30, | ||
| 2015 | 2014 | |
| ($000) | ($000) | |
| Increase (Decrease) in Net Assets | ||
| Operations | ||
| Net Investment Income | 635,434 | 504,330 |
| Realized Net Gain (Loss) | 2,665,957 | 2,269,913 |
| Change in Unrealized Appreciation (Depreciation) | (3,527,529) | 6,117,551 |
| Net Increase (Decrease) in Net Assets Resulting from Operations | (226,138) | 8,891,794 |
| Distributions | ||
| Net Investment Income | ||
| Investor Shares | (107,352) | (118,024) |
| Admiral Shares | (448,560) | (253,860) |
| Realized Capital Gain1 | ||
| Investor Shares | (528,247) | (532,238) |
| Admiral Shares | (1,890,474) | (1,009,500) |
| Total Distributions | (2,974,633) | (1,913,622) |
| Capital Share Transactions | ||
| Investor Shares | (5,130,078) | (2,143,518) |
| Admiral Shares | 6,589,734 | 3,232,612 |
| Net Increase (Decrease) from Capital Share Transactions | 1,459,656 | 1,089,094 |
| Total Increase (Decrease) | (1,741,115) | 8,067,266 |
| Net Assets | ||
| Beginning of Period | 44,255,347 | 36,188,081 |
| End of Period2 | 42,514,232 | 44,255,347 |
1 Includes fiscal 2015 and 2014 short-term gain distributions totaling $17,373,000 and $8,179,000, respectively. Short-term gain distributions are treated as ordinary income dividends for tax purposes.
2 Net Assets—End of Period includes undistributed (overdistributed) net investment income of $333,810,000 and $318,267,000.
See accompanying Notes, which are an integral part of the Financial Statements.
19
| PRIMECAP Fund | |||||
| Financial Highlights | |||||
| Investor Shares | |||||
| For a Share Outstanding | Year Ended September 30, | ||||
| Throughout Each Period | 2015 | 2014 | 2013 | 2012 | 2011 |
| Net Asset Value, Beginning of Period | $104.16 | $87.83 | $69.39 | $58.46 | $60.36 |
| Investment Operations | |||||
| Net Investment Income | 1.329 | 1.124 | 1.033 | .866 | .651 |
| Net Realized and Unrealized Gain (Loss) | |||||
| on Investments | (1.631) | 19.812 | 19.093 | 12.857 | (1.266) |
| Total from Investment Operations | (. 302) | 20.936 | 20.126 | 13.723 | (.615) |
| Distributions | |||||
| Dividends from Net Investment Income | (1.160) | (.836) | (. 965) | (. 689) | (.614) |
| Distributions from Realized Capital Gains | (5.708) | (3.770) | (.721) | (2.104) | (.671) |
| Total Distributions | (6.868) | (4.606) | (1.686) | (2.793) | (1.285) |
| Net Asset Value, End of Period | $96.99 | $104.16 | $87.83 | $69.39 | $58.46 |
| Total Return1 | -0.76% | 24.72% | 29.63% | 24.17% | -1.23% |
| Ratios/Supplemental Data | |||||
| Net Assets, End of Period (Millions) | $7,741 | $13,273 | $13,059 | $13,632 | $14,359 |
| Ratio of Total Expenses to Average Net Assets | 0.40% | 0.44% | 0.45% | 0.45% | 0.45% |
| Ratio of Net Investment Income to | |||||
| Average Net Assets | 1.33% | 1.17% | 1.32% | 1.30% | 0.95% |
| Portfolio Turnover Rate | 9% | 11% | 5% | 6% | 8% |
1 Total returns do not include transaction or account service fees that may have applied in the periods shown. Fund prospectuses provide information about any applicable transaction and account service fees.
See accompanying Notes, which are an integral part of the Financial Statements.
20
| PRIMECAP Fund | |||||
| Financial Highlights | |||||
| Admiral Shares | |||||
| For a Share Outstanding | Year Ended September 30, | ||||
| Throughout Each Period | 2015 | 2014 | 2013 | 2012 | 2011 |
| Net Asset Value, Beginning of Period | $108.08 | $91.15 | $72.03 | $60.69 | $62.65 |
| Investment Operations | |||||
| Net Investment Income | 1.550 | 1.286 | 1.178 | .974 | .738 |
| Net Realized and Unrealized Gain (Loss) | |||||
| on Investments | (1.784) | 20.536 | 19.769 | 13.333 | (1.319) |
| Total from Investment Operations | (.234) | 21.822 | 20.947 | 14.307 | (. 581) |
| Distributions | |||||
| Dividends from Net Investment Income | (1.403) | (.983) | (1.079) | (.785) | (.683) |
| Distributions from Realized Capital Gains | (5.913) | (3.909) | (.748) | (2.182) | (. 696) |
| Total Distributions | (7.316) | (4.892) | (1.827) | (2.967) | (1.379) |
| Net Asset Value, End of Period | $100.53 | $108.08 | $91.15 | $72.03 | $60.69 |
| Total Return1 | -0.69% | 24.85% | 29.73% | 24.29% | -1.14% |
| Ratios/Supplemental Data | |||||
| Net Assets, End of Period (Millions) | $34,773 | $30,982 | $23,129 | $15,978 | $11,088 |
| Ratio of Total Expenses to Average Net Assets | 0.34% | 0.35% | 0.36% | 0.36% | 0.36% |
| Ratio of Net Investment Income to | |||||
| Average Net Assets | 1.39% | 1.26% | 1.41% | 1.39% | 1.04% |
| Portfolio Turnover Rate | 9% | 11% | 5% | 6% | 8% |
1 Total returns do not include transaction or account service fees that may have applied in the periods shown. Fund prospectuses provide information about any applicable transaction and account service fees.
See accompanying Notes, which are an integral part of the Financial Statements.
21
PRIMECAP Fund
Notes to Financial Statements
Vanguard PRIMECAP Fund is registered under the Investment Company Act of 1940 as an open-end investment company, or mutual fund. The fund offers two classes of shares: Investor Shares and Admiral Shares. Investor Shares are available to any investor who meets the fund’s minimum purchase requirements. Admiral Shares are designed for investors who meet certain administrative, service, and account-size criteria.
A. The following significant accounting policies conform to generally accepted accounting principles for U.S. investment companies. The fund consistently follows such policies in preparing its financial statements.
1. Security Valuation: Securities are valued as of the close of trading on the New York Stock Exchange (generally 4 p.m., Eastern time) on the valuation date. Equity securities are valued at the latest quoted sales prices or official closing prices taken from the primary market in which each security trades; such securities not traded on the valuation date are valued at the mean of the latest quoted bid and asked prices. Securities for which market quotations are not readily available, or whose values have been affected by events occurring before the fund’s pricing time but after the close of the securities’ primary markets, are valued at their fair values calculated according to procedures adopted by the board of trustees. These procedures include obtaining quotations from an independent pricing service, monitoring news to identify significant market- or security-specific events, and evaluating changes in the values of foreign market proxies (for example, ADRs, futures contracts, or exchange-traded funds), between the time the foreign markets close and the fund’s pricing time. When fair-value pricing is employed, the prices of securities used by a fund to calculate its net asset value may differ from quoted or published prices for the same securities. Investments in Vanguard Market Liquidity Fund are valued at that fund’s net asset value.
2. Foreign Currency: Securities and other assets and liabilities denominated in foreign currencies are translated into U.S. dollars using exchange rates obtained from an independent third party as of the fund’s pricing time on the valuation date. Realized gains (losses) and unrealized appreciation (depreciation) on investment securities include the effects of changes in exchange rates since the securities were purchased, combined with the effects of changes in security prices. Fluctuations in the value of other assets and liabilities resulting from changes in exchange rates are recorded as unrealized foreign currency gains (losses) until the assets or liabilities are settled in cash, at which time they are recorded as realized foreign currency gains (losses).
3. Federal Income Taxes: The fund intends to continue to qualify as a regulated investment company and distribute all of its taxable income. Management has analyzed the fund’s tax positions taken for all open federal income tax years (September 30, 2012–2015), and has concluded that no provision for federal income tax is required in the fund’s financial statements.
4. Distributions: Distributions to shareholders are recorded on the ex-dividend date.
5. Securities Lending: To earn additional income, the fund lends its securities to qualified institutional borrowers. Security loans are required to be secured at all times by collateral in an amount at least equal to the market value of securities loaned. Daily market fluctuations could cause the value of loaned securities to be more or less than the value of the collateral received. When this occurs, the collateral is adjusted and settled on the next business day. The fund further mitigates its counterparty risk by entering into securities lending transactions only with a diverse group of prequalified counterparties, monitoring their financial strength, and entering into master securities lending agreements with its counterparties. The master securities lending agreements provide that, in the event of a counterparty’s default (including bankruptcy), the fund may terminate any loans with that borrower, determine the net amount owed, and sell or retain the collateral up to the net amount owed to the fund; however,
22
PRIMECAP Fund
such actions may be subject to legal proceedings. While collateral mitigates counterparty risk, in the absence of a default the fund may experience delays and costs in recovering the securities loaned. The fund invests cash collateral received in Vanguard Market Liquidity Fund, and records a liability in the Statement of Net Assets for the return of the collateral, during the period the securities are on loan. Securities lending income represents fees charged to borrowers plus income earned on invested cash collateral, less expenses associated with the loan.
6. Credit Facility: The fund and certain other funds managed by The Vanguard Group (“Vanguard”) participate in a $3 billion committed credit facility provided by a syndicate of lenders pursuant to a credit agreement that may be renewed annually; each fund is individually liable for its borrowings, if any, under the credit facility. Borrowings may be utilized for temporary and emergency purposes, and are subject to the fund’s regulatory and contractual borrowing restrictions. The participating funds are charged administrative fees and an annual commitment fee of 0.06% of the undrawn amount of the facility; these fees are allocated to the funds based on a method approved by the fund’s board of trustees and included in Management and Administrative expenses on the fund’s Statement of Operations. Any borrowings under this facility bear interest at a rate equal to the higher of the federal funds rate or LIBOR reference rate plus an agreed-upon spread.
The fund had no borrowings outstanding at September 30, 2015, or at any time during the period then ended.
7. Other: Dividend income is recorded on the ex-dividend date. Interest income includes income distributions received from Vanguard Market Liquidity Fund and is accrued daily. Security transactions are accounted for on the date securities are bought or sold. Costs used to determine realized gains (losses) on the sale of investment securities are those of the specific securities sold.
Each class of shares has equal rights as to assets and earnings, except that each class separately bears certain class-specific expenses related to maintenance of shareholder accounts (included in Management and Administrative expenses) and shareholder reporting. Marketing and distribution expenses are allocated to each class of shares based on a method approved by the board of trustees. Income, other non-class-specific expenses, and gains and losses on investments are allocated to each class of shares based on its relative net assets.
B. PRIMECAP Management Company, provides investment advisory services to the fund for a fee calculated at an annual percentage rate of average net assets. For the year ended September 30, 2015, the investment advisory fee represented an effective annual rate of 0.20% of the fund’s average net assets.
C. In accordance with the terms of a Funds’ Service Agreement (the “FSA”) between Vanguard and the fund, Vanguard furnishes to the fund corporate management, administrative, marketing, and distribution services at Vanguard’s cost of operations (as defined by the FSA). These costs of operations are allocated to the fund based on methods and guidelines approved by the board of trustees. Vanguard does not require reimbursement in the current period for certain costs of operations (such as deferred compensation/benefits and risk/insurance costs); the fund’s liability for these costs of operations is included in Payables to Vanguard on the Statement of Net Assets.
Upon the request of Vanguard, the fund may invest up to 0.40% of its net assets as capital in Vanguard. At September 30, 2015, the fund had contributed to Vanguard capital in the amount of $3,954,000, representing 0.01% of the fund’s net assets and 1.58% of Vanguard’s capitalization. The fund’s trustees and officers are also directors and employees, respectively, of Vanguard.
23
PRIMECAP Fund
D. Various inputs may be used to determine the value of the fund’s investments. These inputs are summarized in three broad levels for financial statement purposes. The inputs or methodologies used to value securities are not necessarily an indication of the risk associated with investing in those securities.
Level 1—Quoted prices in active markets for identical securities.
Level 2—Other significant observable inputs (including quoted prices for similar securities, interest rates, prepayment speeds, credit risk, etc.).
Level 3—Significant unobservable inputs (including the fund’s own assumptions used to determine the fair value of investments).
The following table summarizes the market value of the fund’s investments as of September 30, 2015, based on the inputs used to value them:
| Level 1 | Level 2 | Level 3 | |
| Investments | ($000) | ($000) | ($000) |
| Common Stocks | 39,005,059 | 2,238,884 | — |
| Temporary Cash Investments | 1,481,214 | — | — |
| Total | 40,486,273 | 2,238,884 | — |
E. Distributions are determined on a tax basis and may differ from net investment income and realized capital gains for financial reporting purposes. Differences may be permanent or temporary. Permanent differences are reclassified among capital accounts in the financial statements to reflect their tax character. Temporary differences arise when certain items of income, expense, gain, or loss are recognized in different periods for financial statement and tax purposes. These differences will reverse at some time in the future. Differences in classification may also result from the treatment of short-term gains as ordinary income for tax purposes.
During the year ended September 30, 2015, the fund realized net foreign currency losses of $485,000, which decreased distributable net income for tax purposes; accordingly, such losses have been reclassified from accumulated net realized gains to undistributed net investment income.
The fund used a tax accounting practice to treat a portion of the price of capital shares redeemed during the year as distributions from net investment income and realized capital gains. Accordingly, the fund has reclassified $63,494,000 from undistributed net investment income, and $325,228,000 from accumulated net realized gains, to paid-in capital.
For tax purposes, at September 30, 2015, the fund had $388,961,000 of ordinary income and $1,912,535,000 of long-term capital gains available for distribution.
At September 30, 2015, the cost of investment securities for tax purposes was $22,755,350,000. Net unrealized appreciation of investment securities for tax purposes was $19,969,807,000, consisting of unrealized gains of $21,301,535,000 on securities that had risen in value since their purchase and $1,331,728,000 in unrealized losses on securities that had fallen in value since their purchase.
F. During the year ended September 30, 2015, the fund purchased $3,784,387,000 of investment securities and sold $4,338,842,000 of investment securities, other than temporary cash investments.
24
PRIMECAP Fund
| G. Capital share transactions for each class of shares were: | ||||
| Year Ended September 30, | ||||
| 2015 | 2014 | |||
| Amount | Shares | Amount | Shares | |
| ($000) | (000) | ($000) | (000) | |
| Investor Shares | ||||
| Issued | 736,805 | 7,078 | 603,070 | 6,273 |
| Issued in Lieu of Cash Distributions | 625,187 | 5,989 | 642,435 | 7,204 |
| Redeemed | (6,492,070) | (60,686) | (3,389,023) | (34,742) |
| Net Increase (Decrease)—Investor Shares | (5,130,078) | (47,619) | (2,143,518) | (21,265) |
| Admiral Shares | ||||
| Issued | 7,079,989 | 63,906 | 4,000,605 | 39,585 |
| Issued in Lieu of Cash Distributions | 2,216,430 | 20,496 | 1,203,134 | 13,011 |
| Redeemed | (2,706,685) | (25,167) | (1,971,127) | (19,659) |
| Net Increase (Decrease) —Admiral Shares | 6,589,734 | 59,235 | 3,232,612 | 32,937 |
H. Certain of the fund’s investments were in companies that were considered to be affiliated companies of the fund because the fund owned more than 5% of the outstanding voting securities of the company or the issuer was another member of The Vanguard Group. Transactions during the period in securities of these companies were as follows:
| Current Period Transactions | ||||||
| Sept. 30, | Proceeds | Sept. 30, | ||||
| 2014 | from | Capital Gain | 2015 | |||
| Market | Purchases | Securities | Distributions | Market | ||
| Value | at Cost | Sold1 | Income | Received | Value | |
| ($000) | ($000) | ($000) | ($000) | ($000) | ($000) | |
| Alaska Air Group Inc. | NA2 | 29,112 | — | 4,700 | — | 528,883 |
| Plantronics Inc. | 176,858 | — | — | 2,221 | — | 188,221 |
| Southwest Airlines Co. | 1,167,068 | 19,452 | 35,964 | 9,250 | — | 1,300,903 |
| Vanguard Market Liquidity Fund | 1,831,829 | NA 3 | NA 3 | 2,890 | — | 1,481,214 |
| Total | 3,175,755 | 19,061 | — | 3,499,221 | ||
| 1 Includes net realized gain (loss) on affiliated investment securities sold of $22,990,000. | ||||||
| 2 Not applicable—at September 30, 2014, the issuer was not an affiliated company of the fund. | ||||||
| 3 Not applicable—purchases and sales are for temporary cash investment purposes. | ||||||
I. Management has determined that no material events or transactions occurred subsequent to September 30, 2015, that would require recognition or disclosure in these financial statements.
25
Report of Independent Registered Public Accounting Firm
To the Board of Trustees of Vanguard Chester Funds and the Shareholders of Vanguard PRIMECAP Fund: In our opinion, the accompanying statement of net assets and the related statements of operations and of changes in net assets and the financial highlights present fairly, in all material respects, the financial position of Vanguard PRIMECAP Fund (constituting a separate portfolio of Vanguard Chester Funds, hereafter referred to as the “Fund”) at September 30, 2015, the results of its operations for the year then ended, the changes in its net assets for each of the two years in the period then ended, and the financial highlights for each of the five years in the period then ended, in conformity with accounting principles generally accepted in the United States of America. These financial statements and financial highlights (hereafter referred to as “financial statements”) are the responsibility of the Fund’s management. Our responsibility is to express an opinion on these financial statements based on our audits. We conducted our audits of these financial statements in accordance with the standards of the Public Company Accounting Oversight Board (United States). Those standards require that we plan and perform the audit to obtain reasonable assurance about whether the financial statements are free of material misstatement. An audit includes examining, on a test basis, evidence supporting the amounts and disclosures in the financial statements, assessing the accounting principles used and significant estimates made by management, and evaluating the overall financial statement presentation. We believe that our audits, which included confirmation of securities at September 30, 2015 by correspondence with the custodian and brokers, by agreement to the underlying ownership records of the transfer agent and the application of alternative auditing procedures where securities purchased had not been received, provide a reasonable basis for our opinion.
/s/PricewaterhouseCoopers LLP
Philadelphia, Pennsylvania
November 10, 2015
Special 2015 tax information (unaudited) for Vanguard PRIMECAP Fund
This information for the fiscal year ended September 30, 2015, is included pursuant to provisions of the Internal Revenue Code.
The fund distributed $2,726,520,000 as capital gain dividends (20% rate gain distributions) to shareholders during the fiscal year.
For nonresident alien shareholders, 100% of short-term capital gain dividends distributed by the fund are qualified short-term capital gains.
The fund distributed $573,285,000 of qualified dividend income to shareholders during the fiscal year.
For corporate shareholders, 97.1% of investment income (dividend income plus short-term gains, if any) qualifies for the dividends-received deduction.
26
Your Fund’s After-Tax Returns
This table presents returns for your fund both before and after taxes. The after-tax returns are shown in two ways: (1) assuming that an investor owned the fund during the entire period and paid taxes on the fund’s distributions, and (2) assuming that an investor paid taxes on the fund’s distributions and sold all shares at the end of each period.
Calculations are based on the highest individual federal income tax and capital gains tax rates in effect at the times of the distributions and the hypothetical sales. State and local taxes were not considered. After-tax returns reflect any qualified dividend income, using actual prior-year figures and estimates for 2015. (In the example, returns after the sale of fund shares may be higher than those assuming no sale. This occurs when the sale would have produced a capital loss. The calculation assumes that the investor received a tax deduction for the loss.)
The table shows returns for Investor Shares only; returns for other share classes will differ. Please note that your actual after-tax returns will depend on your tax situation and may differ from those shown. Also note that if you own the fund in a tax-deferred account, such as an individual retirement account or a 401(k) plan, this information does not apply to you. Such accounts are not subject to current taxes.
Finally, keep in mind that a fund’s performance—whether before or after taxes—does not guarantee future results.
Average Annual Total Returns: PRIMECAP Fund Investor Shares
Periods Ended September 30, 2015
| One | Five | Ten | |
| Year | Years | Years | |
| Returns Before Taxes | -0.76% | 14.50% | 9.02% |
| Returns After Taxes on Distributions | -2.22 | 13.59 | 8.18 |
| Returns After Taxes on Distributions and Sale of Fund Shares | 0.93 | 11.68 | 7.35 |
27
About Your Fund’s Expenses
As a shareholder of the fund, you incur ongoing costs, which include costs for portfolio management, administrative services, and shareholder reports (like this one), among others. Operating expenses, which are deducted from a fund’s gross income, directly reduce the investment return of the fund.
A fund’s expenses are expressed as a percentage of its average net assets. This figure is known as the expense ratio. The following examples are intended to help you understand the ongoing costs (in dollars) of investing in your fund and to compare these costs with those of other mutual funds. The examples are based on an investment of $1,000 made at the beginning of the period shown and held for the entire period.
The accompanying table illustrates your fund’s costs in two ways:
• Based on actual fund return. This section helps you to estimate the actual expenses that you paid over the period. The ”Ending Account Value“ shown is derived from the fund‘s actual return, and the third column shows the dollar amount that would have been paid by an investor who started with $1,000 in the fund. You may use the information here, together with the amount you invested, to estimate the expenses that you paid over the period.
To do so, simply divide your account value by $1,000 (for example, an $8,600 account value divided by $1,000 = 8.6), then multiply the result by the number given for your fund under the heading ”Expenses Paid During Period.“
• Based on hypothetical 5% yearly return. This section is intended to help you compare your fund‘s costs with those of other mutual funds. It assumes that the fund had a yearly return of 5% before expenses, but that the expense ratio is unchanged. In this case—because the return used is not the fund’s actual return—the results do not apply to your investment. The example is useful in making comparisons because the Securities and Exchange Commission requires all mutual funds to calculate expenses based on a 5% return. You can assess your fund’s costs by comparing this hypothetical example with the hypothetical examples that appear in shareholder reports of other funds.
Note that the expenses shown in the table are meant to highlight and help you compare ongoing costs only and do not reflect transaction costs incurred by the fund for buying and selling securities. Further, the expenses do not include any purchase, redemption, or account service fees described in the fund prospectus. If such fees were applied to your account, your costs would be higher. Your fund does not carry a “sales load.”
The calculations assume no shares were bought or sold during the period. Your actual costs may have been higher or lower, depending on the amount of your investment and the timing of any purchases or redemptions.
You can find more information about the fund’s expenses, including annual expense ratios, in the Financial Statements section of this report. For additional information on operating expenses and other shareholder costs, please refer to your fund’s current prospectus.
28
| Six Months Ended September 30, 2015 | |||
| Beginning | Ending | Expenses | |
| Account Value | Account Value | Paid During | |
| PRIMECAP Fund | 3/31/2015 | 9/30/2015 | Period |
| Based on Actual Fund Return | |||
| Investor Shares | $1,000.00 | $922.31 | $1.83 |
| Admiral Shares | 1,000.00 | 922.55 | 1.59 |
| Based on Hypothetical 5% Yearly Return | |||
| Investor Shares | $1,000.00 | $1,023.16 | $1.93 |
| Admiral Shares | 1,000.00 | 1,023.41 | 1.67 |
The calculations are based on expenses incurred in the most recent six-month period. The fund’s annualized six-month expense ratios for that period are 0.38% for Investor Shares and 0.33% for Admiral Shares. The dollar amounts shown as “Expenses Paid” are equal to the annualized expense ratio multiplied by the average account value over the period, multiplied by the number of days in the most recent six-month period, then divided by the number of days in the most recent 12-month period (183/365).
29
Trustees Approve Advisory Arrangement
The board of trustees of Vanguard PRIMECAP Fund has renewed the fund’s investment advisory arrangement with PRIMECAP Management Company (PRIMECAP Management). The board determined that renewing the fund’s advisory arrangement was in the best interests of the fund and its shareholders.
The board based its decision upon an evaluation of the advisor’s investment staff, portfolio management process, and performance. The trustees considered the factors discussed below, among others. However, no single factor determined whether the board approved the arrangement. Rather, it was the totality of the circumstances that drove the board’s decision.
Nature, extent, and quality of services
The board reviewed the quality of the fund’s investment management services over both the short and long term, and took into account the organizational depth and stability of the advisor. The board considered that PRIMECAP Management, founded in 1983, is recognized for its long-term approach to growth equity investing. Five experienced portfolio managers are responsible for separate subportfolios, and each portfolio manager employs a fundamental, research-driven approach in seeking to identify companies that have long-term growth potential overlooked by the market. The multi-counselor approach employed by PRIMECAP Management is designed to emphasize individual decision-making and enable the portfolio managers to invest in their highest-conviction ideas. The firm’s fundamental research focuses on developing opinions independent from Wall Street’s consensus and maintaining a long-term horizon. PRIMECAP Management has managed the fund since its inception in 1984.
The board concluded that the advisor’s experience, stability, depth, and performance, among other factors, warranted continuation of the advisory arrangement.
Investment performance
The board considered the short- and long-term performance of the fund, including any periods of outperformance or underperformance relative to a benchmark index and peer group. The board concluded that the performance was such that the advisory arrangement should continue. Information about the fund’s most recent performance can be found in the Performance Summary section of this report.
Cost
The board concluded that the fund’s expense ratio was well below the average expense ratio charged by funds in its peer group and that the fund’s advisory fee rate was also well below its peer-group average. Information about the fund’s expenses appears in the About Your Fund’s Expenses section of this report as well as in the Financial Statements section, which also includes information about the fund’s advisory fee rate.
The board did not consider profitability of PRIMECAP Management in determining whether to approve the advisory fee, because PRIMECAP Management is independent of Vanguard and the advisory fee is the result of arm’s-length negotiations.
The benefit of economies of scale
The board concluded that the fund’s shareholders benefit from economies of scale because of breakpoints in the advisory fee schedule. The breakpoints reduce the effective rate of the fee as the fund’s assets increase.
The board will consider whether to renew the advisory arrangement again after a one-year period.
30
Glossary
30-Day SEC Yield. A fund’s 30-day SEC yield is derived using a formula specified by the U.S. Securities and Exchange Commission. Under the formula, data related to the fund’s security holdings in the previous 30 days are used to calculate the fund’s hypothetical net income for that period, which is then annualized and divided by the fund’s estimated average net assets over the calculation period. For the purposes of this calculation, a security’s income is based on its current market yield to maturity (for bonds), its actual income (for asset-backed securities), or its projected dividend yield (for stocks). Because the SEC yield represents hypothetical annualized income, it will differ—at times significantly—from the fund’s actual experience. As a result, the fund’s income distributions may be higher or lower than implied by the SEC yield.
Beta. A measure of the magnitude of a fund’s past share-price fluctuations in relation to the ups and downs of a given market index. The index is assigned a beta of 1.00. Compared with a given index, a fund with a beta of 1.20 typically would have seen its share price rise or fall by 12% when the index rose or fell by 10%. For this report, beta is based on returns over the past 36 months for both the fund and the index. Note that a fund’s beta should be reviewed in conjunction with its R-squared (see definition). The lower the R-squared, the less correlation there is between the fund and the index, and the less reliable beta is as an indicator of volatility.
Dividend Yield. Dividend income earned by stocks, expressed as a percentage of the aggregate market value (or of net asset value, for a fund). The yield is determined by dividing the amount of the annual dividends by the aggregate value (or net asset value) at the end of the period. For a fund, the dividend yield is based solely on stock holdings and does not include any income produced by other investments.
Earnings Growth Rate. The average annual rate of growth in earnings over the past five years for the stocks now in a fund.
Equity Exposure. A measure that reflects a fund’s investments in stocks and stock futures. Any holdings in short-term reserves are excluded.
Expense Ratio. A fund’s total annual operating expenses expressed as a percentage of the fund’s average net assets. The expense ratio includes management and administrative expenses, but does not include the transaction costs of buying and selling portfolio securities.
Foreign Holdings. The percentage of a fund represented by securities or depositary receipts of companies based outside the United States.
Inception Date. The date on which the assets of a fund (or one of its share classes) are first invested in accordance with the fund’s investment objective. For funds with a subscription period, the inception date is the day after that period ends. Investment performance is measured from the inception date.
Median Market Cap. An indicator of the size of companies in which a fund invests; the midpoint of market capitalization (market price x shares outstanding) of a fund’s stocks, weighted by the proportion of the fund’s assets invested in each stock. Stocks representing half of the fund’s assets have market capitalizations above the median, and the rest are below it.
Price/Book Ratio. The share price of a stock divided by its net worth, or book value, per share. For a fund, the weighted average price/book ratio of the stocks it holds.
31
Price/Earnings Ratio. The ratio of a stock’s current price to its per-share earnings over the past year. For a fund, the weighted average P/E of the stocks it holds. P/E is an indicator of market expectations about corporate prospects; the higher the P/E, the greater the expectations for a company’s future growth.
R-Squared. A measure of how much of a fund’s past returns can be explained by the returns from the market in general, as measured by a given index. If a fund’s total returns were precisely synchronized with an index’s returns, its R-squared would be 1.00. If the fund’s returns bore no relationship to the index’s returns, its R-squared would be 0. For this report, R-squared is based on returns over the past 36 months for both the fund and the index.
Return on Equity. The annual average rate of return generated by a company during the past five years for each dollar of shareholder’s equity (net income divided by shareholder’s equity). For a fund, the weighted average return on equity for the companies whose stocks it holds.
Short-Term Reserves. The percentage of a fund invested in highly liquid, short-term securities that can be readily converted to cash.
Turnover Rate. An indication of the fund’s trading activity. Funds with high turnover rates incur higher transaction costs and may be more likely to distribute capital gains (which may be taxable to investors). The turnover rate excludes in-kind transactions, which have minimal impact on costs.
32
This page intentionally left blank.
This page intentionally left blank.
This page intentionally left blank.
The People Who Govern Your Fund
The trustees of your mutual fund are there to see that the fund is operated and managed in your best interests since, as a shareholder, you are a part owner of the fund. Your fund’s trustees also serve on the board of directors of The Vanguard Group, Inc., which is owned by the Vanguard funds and provides services to them on an at-cost basis.
A majority of Vanguard’s board members are independent, meaning that they have no affiliation with Vanguard or the funds they oversee, apart from the sizable personal investments they have made as private individuals. The independent board members have distinguished backgrounds in business, academia, and public service. Each of the trustees and executive officers oversees 194 Vanguard funds.
The following table provides information for each trustee and executive officer of the fund. More information about the trustees is in the Statement of Additional Information, which can be obtained, without charge, by contacting Vanguard at 800-662-7447, or online at vanguard.com.
InterestedTrustee1
F. William McNabb III
Born 1957. Trustee Since July 2009. Chairman of the Board. Principal Occupation(s) During the Past Five Years and Other Experience: Chairman of the Board of The Vanguard Group, Inc., and of each of the investment companies served by The Vanguard Group, since January 2010; Director of The Vanguard Group since 2008; Chief Executive Officer and President of The Vanguard Group, and of each of the investment companies served by The Vanguard Group, since 2008; Director of Vanguard Marketing Corporation; Managing Director of The Vanguard Group (1995–2008).
IndependentTrustees
Emerson U. Fullwood
Born 1948. Trustee Since January 2008. Principal Occupation(s) During the Past Five Years and Other Experience: Executive Chief Staff and Marketing Officer for North America and Corporate Vice President (retired 2008) of Xerox Corporation (document management products and services); Executive in Residence and 2009–2010 Distinguished Minett Professor at the Rochester Institute of Technology; Director of SPX Corporation (multi-industry manufacturing), the United Way of Rochester, Amerigroup Corporation (managed health care), the University of Rochester Medical Center, Monroe Community College Foundation, and North Carolina A&T University.
Rajiv L. Gupta
Born 1945. Trustee Since December 2001.2 Principal Occupation(s) During the Past Five Years and Other Experience: Chairman and Chief Executive Officer (retired 2009) and President (2006–2008) of Rohm and Haas Co. (chemicals); Director of Tyco International PLC (diversified manufacturing and services), Hewlett-Packard Co. (electronic computer manufacturing), and Delphi Automotive PLC (automotive components); Senior Advisor at New Mountain Capital.
Amy Gutmann
Born 1949. Trustee Since June 2006. Principal Occupation(s) During the Past Five Years and Other Experience: President of the University of Pennsylvania; Christopher H. Browne Distinguished Professor of Political Science, School of Arts and Sciences, and Professor of Communication, Annenberg School for Communication, with secondary faculty appointments in the Department of Philosophy, School of Arts and Sciences, and at the Graduate School of Education, University of Pennsylvania; Trustee of the National Constitution Center; Chair of the Presidential Commission for the Study of Bioethical Issues.
JoAnn Heffernan Heisen
Born 1950. Trustee Since July 1998. Principal Occupation(s) During the Past Five Years and Other Experience: Corporate Vice President and Chief Global Diversity Officer (retired 2008) and Member of the Executive Committee (1997–2008) of Johnson & Johnson (pharmaceuticals/medical devices/ consumer products); Director of Skytop Lodge Corporation (hotels), the University Medical Center at Princeton, the Robert Wood Johnson Foundation, and the Center for Talent Innovation; Member of the Advisory Board of the Institute for Women’s Leadership at Rutgers University.
F. Joseph Loughrey
Born 1949. Trustee Since October 2009. Principal Occupation(s) During the Past Five Years and Other Experience: President and Chief Operating Officer (retired 2009) of Cummins Inc. (industrial machinery); Chairman of the Board of Hillenbrand, Inc. (specialized consumer services), and of Oxfam America; Director of SKF AB (industrial machinery), Hyster-Yale Materials Handling, Inc. (forklift trucks), the Lumina Foundation for Education, and the V Foundation for Cancer Research; Member of the Advisory Council for the College of Arts and Letters and of the Advisory Board to the Kellogg Institute for International Studies, both at the University of Notre Dame.
Mark Loughridge
Born 1953. Trustee Since March 2012. Principal Occupation(s) During the Past Five Years and Other Experience: Senior Vice President and Chief Financial Officer (retired 2013) at IBM (information technology services); Fiduciary Member of IBM’s Retirement Plan Committee (2004–2013); Director of the Dow Chemical Company; Member of the Council on Chicago Booth.
Scott C. Malpass
Born 1962. Trustee Since March 2012. Principal Occupation(s) During the Past Five Years and Other Experience: Chief Investment Officer and Vice President at the University of Notre Dame; Assistant Professor of Finance at the Mendoza College of Business at Notre Dame; Member of the Notre Dame 403(b) Investment Committee; Board Member of TIFF Advisory Services, Inc., and Catholic Investment Services, Inc. (investment advisors); Member of the Investment Advisory Committee of Major League Baseball.
André F. Perold
Born 1952. Trustee Since December 2004. Principal Occupation(s) During the Past Five Years and Other Experience: George Gund Professor of Finance and Banking, Emeritus at the Harvard Business School (retired 2011); Chief Investment Officer and Managing Partner of HighVista Strategies LLC (private investment firm); Director of Rand Merchant Bank; Overseer of the Museum of Fine Arts Boston.
Peter F. Volanakis
Born 1955. Trustee Since July 2009. Principal Occupation(s) During the Past Five Years and Other Experience: President and Chief Operating Officer (retired 2010) of Corning Incorporated (communications equipment); Trustee of Colby-Sawyer College; Member of the Advisory Board of the Norris Cotton Cancer Center and of the Advisory Board of the Parthenon Group (strategy consulting).
Executive Officers
Glenn Booraem
Born 1967. Treasurer Since May 2015. Principal Occupation(s) During the Past Five Years and Other Experience: Principal of The Vanguard Group, Inc.; Treasurer of each of the investment companies served by The Vanguard Group; Controller of each of the investment companies served by The Vanguard Group (2010–2015); Assistant Controller of each of the investment companies served by The Vanguard Group (2001–2010).
Thomas J. Higgins
Born 1957. Chief Financial Officer Since September 2008. Principal Occupation(s) During the Past Five Years and Other Experience: Principal of The Vanguard Group, Inc.; Chief Financial Officer of each of the investment companies served by The Vanguard Group; Treasurer of each of the investment companies served by The Vanguard Group (1998–2008).
Peter Mahoney
Born 1974. Controller Since May 2015. Principal Occupation(s) During the Past Five Years and Other Experience: Head of Global Fund Accounting at The Vanguard Group, Inc.; Controller of each of the investment companies served by The Vanguard Group; Head of International Fund Services at The Vanguard Group (2008–2014).
Heidi Stam
Born 1956. Secretary Since July 2005. Principal Occupation(s) During the Past Five Years and Other Experience: Managing Director of The Vanguard Group, Inc.; General Counsel of The Vanguard Group; Secretary of The Vanguard Group and of each of the investment companies served by The Vanguard Group; Director and Senior Vice President of Vanguard Marketing Corporation.
Vanguard Senior Management Team
Mortimer J. Buckley
Kathleen C. Gubanich
Paul A. Heller
Martha G. King
John T. Marcante
Chris D. McIsaac
James M. Norris
Thomas M. Rampulla
Glenn W. Reed
Karin A. Risi
Chairman Emeritus and Senior Advisor
John J. Brennan
Chairman, 1996–2009
Chief Executive Officer and President, 1996–2008
Founder John C. Bogle
Chairman and Chief Executive Officer, 1974–1996
1 Mr. McNabb is considered an “interested person,” as defined in the Investment Company Act of 1940, because he is an officer of the Vanguard funds.
2 December 2002 for Vanguard Equity Income Fund, the Vanguard Municipal Bond Funds, and the Vanguard State Tax-Exempt Funds.
 |
| P.O. Box 2600 |
| Valley Forge, PA 19482-2600 |
Connect with Vanguard® > vanguard.com
| Fund Information > 800-662-7447 | |
| Direct Investor Account Services > 800-662-2739 | |
| Institutional Investor Services > 800-523-1036 | |
| Text Telephone for People | |
| Who Are Deaf or Hard of Hearing> 800-749-7273 | |
| This material may be used in conjunction | |
| with the offering of shares of any Vanguard | |
| fund only if preceded or accompanied by | |
| the fund’s current prospectus. | |
| All comparative mutual fund data are from Lipper, a | |
| Thomson Reuters Company, or Morningstar, Inc., unless | |
| otherwise noted. | |
| You can obtain a free copy of Vanguard’s proxy voting | |
| guidelines by visiting vanguard.com/proxyreporting or by | |
| calling Vanguard at 800-662-2739. The guidelines are | |
| also available from the SEC’s website, sec.gov. In | |
| addition, you may obtain a free report on how your fund | |
| voted the proxies for securities it owned during the 12 | |
| months ended June 30. To get the report, visit either | |
| vanguard.com/proxyreporting or sec.gov. | |
| You can review and copy information about your fund at | |
| the SEC’s Public Reference Room in Washington, D.C. To | |
| find out more about this public service, call the SEC at | |
| 202-551-8090. Information about your fund is also | |
| available on the SEC’s website, and you can receive | |
| copies of this information, for a fee, by sending a | |
| request in either of two ways: via email addressed to | |
| publicinfo@sec.gov or via regular mail addressed to the | |
| Public Reference Section, Securities and Exchange | |
| Commission, Washington, DC 20549-1520. | |
| © 2015 The Vanguard Group, Inc. | |
| All rights reserved. | |
| Vanguard Marketing Corporation, Distributor. | |
| Q590 112015 | |
Annual Report | September 30, 2015
Vanguard Target Retirement Funds
Vanguard Target Retirement Income Fund
Vanguard Target Retirement 2010 Fund
Vanguard Target Retirement 2015 Fund
Vanguard Target Retirement 2020 Fund
Vanguard Target Retirement 2025 Fund
Vanguard Target Retirement 2030 Fund
Vanguard’s Principles for Investing Success
We want to give you the best chance of investment success. These principles, grounded in Vanguard’s research and experience, can put you on the right path.
Goals. Create clear, appropriate investment goals.
Balance. Develop a suitable asset allocation using broadly diversified funds. Cost. Minimize cost.
Discipline. Maintain perspective and long-term discipline.
A single theme unites these principles: Focus on the things you can control.
We believe there is no wiser course for any investor.
| Contents | |
| Your Fund’s Total Returns. | 1 |
| Chairman’s Letter. | 2 |
| Target Retirement Income Fund. | 10 |
| Target Retirement 2010 Fund. | 21 |
| Target Retirement 2015 Fund. | 32 |
| Target Retirement 2020 Fund. | 43 |
| Target Retirement 2025 Fund. | 54 |
| Target Retirement 2030 Fund. | 65 |
| Your Fund’s After-Tax Returns. | 78 |
| About Your Fund’s Expenses. | 80 |
| Glossary. | 82 |
Please note: The opinions expressed in this report are just that—informed opinions. They should not be considered promises or advice. Also, please keep in mind that the information and opinions cover the period through the date on the front of this report. Of course, the risks of investing in your fund are spelled out in the prospectus.
See the Glossary for definitions of investment terms used in this report.
About the cover: Pictured is a sailing block on the Brilliant, a 1932 schooner docked in Mystic, Connecticut. A type of pulley, the sailing block helps coordinate the setting of the sails. At Vanguard, the intricate coordination of technology and people allows us to help millions of clients around the world reach their financial goals.
| Your Fund’s Total Returns | |
| Fiscal Year Ended September 30, 2015 | |
| Total | |
| Returns | |
| Vanguard Target Retirement Income Fund | 0.18% |
| Target Income Composite Index | 0.31 |
| Mixed-Asset Target Today Funds Average | -1.53 |
| Mixed-Asset Target Today Funds Average: Derived from data provided by Lipper, a Thomson Reuters Company. | |
| Vanguard Target Retirement 2010 Fund | 0.06% |
| Target 2010 Composite Index | 0.13 |
| Mixed-Asset Target 2010 Funds Average | -1.87 |
| Mixed-Asset Target 2010 Funds Average: Derived from data provided by Lipper, a Thomson Reuters Company. | |
| Vanguard Target Retirement 2015 Fund | -0.66% |
| Target 2015 Composite Index | -0.61 |
| Mixed-Asset Target 2015 Funds Average | -1.95 |
| Mixed-Asset Target 2015 Funds Average: Derived from data provided by Lipper, a Thomson Reuters Company. | |
| Vanguard Target Retirement 2020 Fund | -1.13% |
| Target 2020 Composite Index | -1.06 |
| Mixed-Asset Target 2020 Funds Average | -2.07 |
| Mixed-Asset Target 2020 Funds Average: Derived from data provided by Lipper, a Thomson Reuters Company. | |
| Vanguard Target Retirement 2025 Fund | -1.60% |
| Target 2025 Composite Index | -1.61 |
| Mixed-Asset Target 2025 Funds Average | -2.53 |
| Mixed-Asset Target 2025 Funds Average: Derived from data provided by Lipper, a Thomson Reuters Company. | |
| Vanguard Target Retirement 2030 Fund | -2.16% |
| Target 2030 Composite Index | -2.17 |
| Mixed-Asset Target 2030 Funds Average | -3.07 |
| Mixed-Asset Target 2030 Funds Average: Derived from data provided by Lipper, a Thomson Reuters Company. | |
| For a benchmark description, see the Glossary. | |
Investments in Target Retirement Funds are subject to the risks of their underlying funds. The year in the fund name refers to the approximate year (the target date) when an investor in the fund would retire and leave the work force. The fund will gradually shift its emphasis from more aggressive investments to more conservative ones based on its target date. An investment in a Target Retirement Fund is not guaranteed at any time, including on or after the target date.
1

Chairman’s Letter
Dear Shareholder,
The fiscal year ended September 30, 2015, was a volatile one for the world’s financial markets. After notching an impressive advance in the first half, U.S. stocks reversed course, but they still held up significantly better than their international counterparts.
Bonds generally outperformed stocks for the period. International bond results differed significantly depending on whether they were hedged or unhedged for currency effects, a point I’ll revisit later in this letter.
Returns for the six Vanguard Target Retirement Funds covered in this report ranged from about –2% for the Vanguard Target Retirement 2030 Fund to less than 1% for Vanguard Target Retirement Income Fund. (The funds with retirement dates of 2035 through 2060 are covered in a separate report.) Given the investment environment, it’s not surprising that the funds with more exposure to bonds and less to stocks performed best.
I mentioned in my last letter to you that the Vanguard Target Retirement Funds would expand their international exposure by the end of 2015, further enhancing the diversification of your investments. With the transition complete, international stocks now account for 40% of the overall equity portfolio, and international bonds make up 30% of the overall fixed income portfolio.
2
China’s economic woes weighed on global stocks
The broad U.S. stock market returned –0.49% for the 12 months. The final two months were rocky as investors worried in particular about the global ripple effects of slower economic growth in China.
For much of the fiscal year, investors were preoccupied with the possibility of an increase in short-term interest rates. On September 17, the Federal Reserve announced that it would hold rates steady for the time being, a decision that to some investors indicated the Fed’s concern about the fragility of global markets.
International stocks returned about –11% as the dollar’s strength against many foreign currencies weighed on results. Returns for emerging markets, which were especially hard hit by concerns about China, trailed those of the developed markets of the Pacific region and Europe.
Taxable bonds recorded gains as investors searched for safety
The broad U.S. taxable bond market returned 2.94% as investors gravitated toward safe-haven assets amid global stock market turmoil. Stimulative monetary policies from the world’s central banks, declining inflation expectations, and global investors’ search for higher yields also helped lift U.S. bonds.
The yield of the 10-year Treasury note ended September at 2.05%, down from 2.48% a year earlier. (Bond prices and yields move in opposite directions.)
| Market Barometer | |||
| Average Annual Total Returns | |||
| Periods Ended September 30, 2015 | |||
| One | Three | Five | |
| Year | Years | Years | |
| Stocks | |||
| Russell 1000 Index (Large-caps) | -0.61% | 12.66% | 13.42% |
| Russell 2000 Index (Small-caps) | 1.25 | 11.02 | 11.73 |
| Russell 3000 Index (Broad U.S. market) | -0.49 | 12.53 | 13.28 |
| FTSE All-World ex US Index (International) | -11.34 | 2.87 | 2.19 |
| Bonds | |||
| Barclays U.S. Aggregate Bond Index (Broad taxable market) | 2.94% | 1.71% | 3.10% |
| Barclays Municipal Bond Index (Broad tax-exempt market) | 3.16 | 2.88 | 4.14 |
| Citigroup Three-Month U.S. Treasury Bill Index | 0.02 | 0.02 | 0.04 |
| CPI | |||
| Consumer Price Index | -0.04% | 0.93% | 1.73% |
3
International bond markets (as measured by the Barclays Global Aggregate Index ex USD) returned –7.67%, hurt by the weakness of international currencies relative to the dollar. Without this currency effect, international bonds advanced modestly.
The Fed’s 0%–0.25% target for short-term interest rates continued to limit returns for money market funds and savings accounts.
More conservative funds fared best amid volatility
Vanguard Target Retirement Funds offer a diversified portfolio within a single fund that adjusts its underlying asset mix over time. As the investor’s retirement date approaches, the portfolio shifts from a growth-oriented, stock-heavy asset allocation to an emphasis on income-generating fixed income securities.
Once its target date is reached, each fund continues to adjust until it enters an income phase, when it converts to the Target Retirement Income Fund. That fund, which represents a static allocation of about 70% bonds and 30% stocks, is mostly focused on helping investors generate income and preserve their wealth.
As I mentioned, bonds outperformed stocks for the most recent 12 months. Mirroring this broad trend, the more conservative of the Target Retirement Funds—those holding more bonds and less stocks—fared
| Expense Ratios | ||
| Your Fund Compared With Its Peer Group | ||
| Acquired Fund Fees | Peer Group | |
| and Expenses | Average | |
| Target Retirement Income Fund | 0.16% | 0.52% |
| Target Retirement 2010 Fund | 0.16 | 0.56 |
| Target Retirement 2015 Fund | 0.16 | 0.47 |
| Target Retirement 2020 Fund | 0.16 | 0.55 |
| Target Retirement 2025 Fund | 0.17 | 0.48 |
| Target Retirement 2030 Fund | 0.17 | 0.54 |
The fund expense figures shown—drawn from the prospectus dated January 27, 2015—represent an estimate of the weighted average of the expense ratios and any transaction fees charged by the underlying mutual funds (the ”acquired” funds) in which the Target Retirement Funds invest. The Target Retirement Funds do not charge any expenses or fees of their own. For the fiscal year ended September 30, 2015, the acquired fund fees and expenses were 0.14% for the Income Fund, 0.14% for the 2010 Fund, 0.14% for the 2015 Fund, 0.14% for the 2020 Fund, 0.15% for the 2025 Fund, and 0.15% for the 2030 Fund. Peer-group expense ratios are derived from data provided by Lipper, a Thomson Reuters Company, and capture information through year-end 2014.
Peer groups: For the Income Fund, Mixed-Asset Target Today Funds Average; for the 2010 Fund, Mixed-Asset Target 2010 Funds; for the 2015 Fund, Mixed-Asset Target 2015 Funds; for the 2020 Fund, Mixed-Asset Target 2020 Funds; for the 2025 Fund, Mixed-Asset Target 2025 Funds; and for the Target Retirement 2030 Fund, Mixed-Asset Target 2030 Funds.
4
| Total Returns | |
| Ten Years Ended September 30, 2015 | |
| Average | |
| Annual Return | |
| Target Retirement Income Fund | 4.96% |
| Target Income Composite Index | 4.99 |
| Spliced Mixed-Asset Target Today Funds Average | 3.64 |
| Spliced Mixed-Asset Target Today Funds Average: Derived from data provided by Lipper, a Thomson Reuters Company. | |
| Target Retirement 2010 Fund (Returns since inception: 6/7/2006) | 5.31% |
| Target 2010 Composite Index | 5.32 |
| Mixed-Asset Target 2010 Funds Average | 3.88 |
| Mixed-Asset Target 2010 Funds Average: Derived from data provided by Lipper, a Thomson Reuters Company. | |
| Target Retirement 2015 Fund | 5.30% |
| Target 2015 Composite Index | 5.30 |
| Mixed-Asset Target 2015 Funds Average | 3.84 |
| Mixed-Asset Target 2015 Funds Average: Derived from data provided by Lipper, a Thomson Reuters Company. | |
| Target Retirement 2020 Fund (Returns since inception: 6/7/2006) | 5.59% |
| Target 2020 Composite Index | 5.70 |
| Mixed-Asset Target 2020 Funds Average | 4.12 |
| Mixed-Asset Target 2020 Funds Average: Derived from data provided by Lipper, a Thomson Reuters Company. | |
| Target Retirement 2025 Fund | 5.41% |
| Target 2025 Composite Index | 5.52 |
| Mixed-Asset Target 2025 Funds Average | 4.51 |
| Mixed-Asset Target 2025 Funds Average: Derived from data provided by Lipper, a Thomson Reuters Company. | |
| Target Retirement 2030 Fund (Returns since inception: 6/7/2006) | 5.56% |
| Target 2030 Composite Index | 5.68 |
| Mixed-Asset Target 2030 Funds Average | 4.26 |
| Mixed-Asset Target 2030 Funds Average: Derived from data provided by Lipper, a Thomson Reuters Company. | |
| For a benchmark description, see the Glossary. | |
The figures shown represent past performance, which is not a guarantee of future results. (Current performance may be lower or higher than the performance data cited. For performance data current to the most recent month-end, visit our website at vanguard.com/performance.) Note, too, that both investment returns and principal value can fluctuate widely, so an investor’s shares, when sold, could be worth more or less than their original cost.
5
best. Not surprisingly, the Income Fund was the group’s top performer, and the Target Retirement 2030 Fund, which has the largest allocation to stocks, had the poorest results. Returns for the four other funds fell in between.
These results, of course, largely reflect the performance of the five underlying portfolios that make up the Target Retirement Funds—Vanguard Total Stock Market Index Fund, Vanguard Total International Stock Index Fund, Vanguard Total Bond Market II Index Fund, Vanguard Total International Bond Index Fund, and Vanguard Short-Term Inflation-Protected Securities Index Fund.
Vanguard Total International Bond Index Fund, which provides broad exposure to non-U.S. investment-grade bonds, was the top performer among the underlying portfolios, returning 3.12%. Vanguard Total Bond Market II Index Fund—which offers broad exposure to the U.S. investment-grade fixed income market—was next in line, returning 2.78%. Global fixed income markets benefited as investors sought solace from the stock markets’ heightened volatility.
Currency hedging, as I mentioned, was a distinguishing factor in the performance of international bonds. The Total International
In stormy markets, target-date funds can help you stay on course
At Vanguard, we advise investors to avoid overreacting to market noise. But we realize that market turmoil, such as that experienced in recent months, can trigger even seasoned investors to make investment decisions based on emotion.
That’s where target-date funds can help. A Vanguard study of defined-contribution retirement plans found that the increasing use of target-date funds is dramatically improving investor behavior.
Target-date investors, it seems, are better able to weather market volatility and stick with their investment plan—probably because they know that their asset mix is automatically adjusted to fit their age and investment horizon.
According to the Vanguard study How America Saves 2015, when compared with other retirement plan investors, those who held their entire account balance in target-date funds:
• Had more balanced portfolios (including, for example, bonds and international stocks).
• Did not hold “extreme” equity allocations (either no stocks or 100% stocks).
• Refrained from frequent trading, which typically leads to disappointing results.
6
Bond Index Fund uses currency exchange contracts to minimize the effects of currency fluctuations. This policy largely erased the negative effect of converting foreign bond returns into more expensive U.S. dollars.
The remaining three underlying funds posted negative results for the fiscal year. Vanguard Total Stock Market Index Fund—which provides investors with broad exposure to the entire U.S. stock market—returned about –0.67%. Vanguard Total International Stock Index Fund, which offers exposure to both developed and emerging international economies, returned –10.77%. Both domestic and international equity markets struggled amid volatility later in the period. The strength of the U.S. dollar furthered hindered results of foreign stocks.
Vanguard Short-Term Inflation-Protected Securities Index Fund—which is held only in the Income Fund, 2010 Fund, and 2015 Fund—returned –1.36%. Investors saw little need for inflation insurance amid low inflationary expectations.
The funds’ long-term performance is helping investors stay on track
Over the long-term, Vanguard Target Retirement Funds have met their shared goal. They have successfully helped investors save for retirement by providing a balanced and diversified portfolio that automatically adjusts over time. For the ten years ended September 30, each of the funds’ average annual returns has topped that of its peer group.
Of course, the performance of the underlying index funds has been key to the funds’ long-term results. Credit goes to Vanguard’s Equity Index and Fixed Income Groups. Their skilled portfolio construction and management have enabled those funds to successfully track their benchmarks while keeping the associated costs very low.
A dose of discipline is crucial when markets become volatile
Although the broad U.S. stock market has posted gains for six straight calendar years—from 2009 to 2014—that streak may not last a seventh. Stocks tumbled in August and swung up and down in September.
Nobody can control the direction of the markets or reliably predict where they’ll go in the short term. However, investors can control how they react to volatility.
During periods of market adversity, it’s more important than ever to keep sight of one of Vanguard’s key principles: Maintain perspective and long-term discipline. Whether you’re investing for yourself or on behalf of clients, your success is affected greatly by how you respond—or don’t respond—during turbulent markets. (You can read Vanguard’s Principles for Investing Success at vanguard.com/research.)
7
As I’ve written in the past, the best course for long-term investors is generally to ignore daily market moves and not make decisions based on emotion. This is also a good time to evaluate your portfolio and make sure your asset allocation is aligned with your time horizon, goals, and risk tolerance.
The markets are unpredictable and often confounding. Keeping our long-term plans clearly in focus can be essential as we weather these periodic storms.
As always, thank you for investing with Vanguard.
Sincerely,

F. William McNabb III
Chairman and Chief Executive Officer
October 13, 2015
8
| Your Fund’s Performance at a Glance | ||||
| September 30, 2014, Through September 30, 2015 | ||||
| Distributions Per Share | ||||
| Starting | Ending | Income | Capital | |
| Share Price | Share Price | Dividends | Gains | |
| Target Retirement Income Fund | $12.84 | $12.59 | $0.236 | $0.042 |
| Target Retirement 2010 Fund | $26.67 | $25.90 | $0.464 | $0.337 |
| Target Retirement 2015 Fund | $15.44 | $14.90 | $0.284 | $0.168 |
| Target Retirement 2020 Fund | $28.40 | $27.52 | $0.541 | $0.041 |
| Target Retirement 2025 Fund | $16.50 | $15.90 | $0.322 | $0.030 |
| Target Retirement 2030 Fund | $28.95 | $27.77 | $0.558 | $0.029 |
9
Target Retirement Income Fund
| Fund Profile | |
| As of September 30, 2015 | |
| Total Fund Characteristics | |
| Ticker Symbol | VTINX |
| 30-Day SEC Yield | 1.90% |
| Acquired Fund Fees and Expenses1 | 0.16% |
| Allocation to Underlying Vanguard Funds | |
| Vanguard Total Bond Market II Index Fund | |
| Investor Shares | 37.6% |
| Vanguard Total Stock Market Index Fund | |
| Investor Shares | 18.2 |
| Vanguard Short-Term Inflation-Protected | |
| Securities Index Fund Investor Shares | 16.7 |
| Vanguard Total International Bond Index | |
| Fund Investor Shares | 15.9 |
| Vanguard Total International Stock Index | |
| Fund Investor Shares | 11.6 |
| Total Fund Volatility Measures | ||
| Target | Barclays | |
| Income | Aggregate | |
| Composite | Bond | |
| Index | Index | |
| R-Squared | 1.00 | 0.30 |
| Beta | 1.01 | 0.69 |
These measures show the degree and timing of the fund’s fluctuations compared with the indexes over 36 months.
Fund Asset Allocation
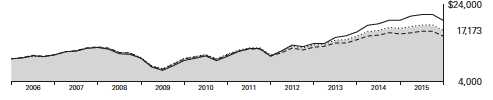
1 This figure—drawn from the prospectus dated January 27, 2015—represents an estimate of the weighted average of the expense ratios and any transaction fees charged by the underlying mutual funds (the ”acquired” funds) in which the Target Retirement Income Fund invests. The fund does not charge any expenses or fees of its own. For the fiscal year ended September 30, 2015, the acquired fund fees and expenses were 0.14%.
10
Target Retirement Income Fund
Performance Summary
All of the returns in this report represent past performance, which is not a guarantee of future results that may be achieved by the fund. (Current performance may be lower or higher than the performance data cited. For performance data current to the most recent month-end, visit our website at vanguard.com/performance.) Note, too, that both investment returns and principal value can fluctuate widely, so an investor’s shares, when sold, could be worth more or less than their original cost. The returns shown do not reflect taxes that a shareholder would pay on fund distributions or on the sale of fund shares.
Cumulative Performance: September 30, 2005, Through September 30, 2015
Initial Investment of $10,000

| Average Annual Total Returns | |||||
| Periods Ended September 30, 2015 | |||||
| Final Value | |||||
| One | Five | Ten | of a $10,000 | ||
| Year | Years | Years | Investment | ||
| Target Retirement Income Fund | 0.18% | 5.17% | 4.96% | $16,223 | |
| •••••••• | Target Income Composite Index | 0.31 | 5.30 | 4.99 | 16,268 |
| – – – – | Spliced Mixed-Asset Target Today | ||||
| -1.53 | 3.99 | 3.64 | 14,294 | ||
| Barclays Funds Average U.S. Aggregate Bond Index | 2.94 | 3.10 | 4.64 | 15,734 | |
| For a benchmark description, see the Glossary. | |||||
| Spliced Mixed-Asset Target Today Funds Average: Derived from data provided by Lipper, a Thomson Reuters Company. | |||||
See Financial Highlights for dividend and capital gains information.
11
Target Retirement Income Fund
Fiscal-Year Total Returns (%): September 30, 2005, Through September 30, 2015
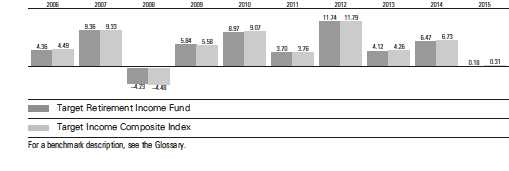
12
Target Retirement Income Fund
Financial Statements
Statement of Net Assets
As of September 30, 2015
The fund reports a complete list of its holdings in regulatory filings four times in each fiscal year, at the quarter-ends. For the second and fourth fiscal quarters, the lists appear in the fund’s semiannual and annual reports to shareholders. For the first and third fiscal quarters, the fund files the lists with the Securities and Exchange Commission on Form N-Q. Shareholders can look up the fund’s Forms N-Q on the SEC’s website at sec.gov. Forms N-Q may also be reviewed and copied at the SEC’s Public Reference Room (see the back cover of this report for further information).
| Market | ||
| Value• | ||
| Shares | ($000) | |
| Investment Companies (100.1%) | ||
| U.S. Stock Fund (18.2%) | ||
| Vanguard Total Stock Market Index Fund Investor Shares | 40,276,597 | 1,935,693 |
| International Stock Fund (11.6%) | ||
| Vanguard Total International Stock Index Fund Investor Shares | 86,721,404 | 1,233,178 |
| U.S. Bond Funds (54.4%) | ||
| 1 Vanguard Total Bond Market II Index Fund Investor Shares | 372,160,605 | 4,004,448 |
| Vanguard Short-Term Inflation-Protected Securities Index Fund Investor Shares | 73,451,328 | 1,779,726 |
| 5,784,174 | ||
| International Bond Fund (15.9%) | ||
| Vanguard Total International Bond Index Fund Investor Shares | 159,646,341 | 1,687,462 |
| Total Investment Companies (Cost $9,678,247) | 10,640,507 | |
| Amount | ||
| ($000) | ||
| Other Assets and Liabilities (-0.1%) | ||
| Other Assets | ||
| Receivables for Investment Securities Sold | 64,000 | |
| Receivables for Accrued Income | 9,750 | |
| Receivables for Capital Shares Issued | 8,157 | |
| Total Other Assets | 81,907 | |
| Liabilities | ||
| Payables for Investment Securities Purchased | (50,977) | |
| Payables for Capital Shares Redeemed | (33,834) | |
| Other Liabilities | (4,182) | |
| Total Liabilities | (88,993) | |
| Net Assets (100%) | ||
| Applicable to 844,664,787 outstanding $.001 par value shares of | ||
| beneficial interest (unlimited authorization) | 10,633,421 | |
| Net Asset Value Per Share | $12.59 | |
13
| Target Retirement Income Fund | |
| At September 30, 2015, net assets consisted of: | |
| Amount | |
| ($000) | |
| Paid-in Capital | 9,513,083 |
| Undistributed Net Investment Income | 8,168 |
| Accumulated Net Realized Gains | 149,910 |
| Unrealized Appreciation (Depreciation) | 962,260 |
| Net Assets | 10,633,421 |
- See Note A in Notes to Financial Statements.
- Affiliated fund available only to Vanguard funds and certain trusts and accounts managed by Vanguard. See accompanying Notes, which are an integral part of the Financial Statements.
14
| Target Retirement Income Fund | |
| Statement of Operations | |
| Year Ended | |
| September 30, 2015 | |
| ($000) | |
| Investment Income | |
| Income | |
| Income Distributions Received | 209,351 |
| Net Investment Income—Note B | 209,351 |
| Realized Net Gain (Loss) | |
| Capital Gain Distributions Received | 13,438 |
| Investment Securities Sold | 174,576 |
| Realized Net Gain (Loss) | 188,014 |
| Change in Unrealized Appreciation (Depreciation) of Investment Securities | (371,136) |
| Net Increase (Decrease) in Net Assets Resulting from Operations | 26,229 |
See accompanying Notes, which are an integral part of the Financial Statements.
15
| Target Retirement Income Fund | ||
| Statement of Changes in Net Assets | ||
| Year Ended September 30, | ||
| 2015 | 2014 | |
| ($000) | ($000) | |
| Increase (Decrease) in Net Assets | ||
| Operations | ||
| Net Investment Income | 209,351 | 187,626 |
| Realized Net Gain (Loss) | 188,014 | 46,896 |
| Change in Unrealized Appreciation (Depreciation) | (371,136) | 432,953 |
| Net Increase (Decrease) in Net Assets Resulting from Operations | 26,229 | 667,475 |
| Distributions | ||
| Net Investment Income | (207,968) | (185,400) |
| Realized Capital Gain1 | (36,816) | (161,457) |
| Total Distributions | (244,784) | (346,857) |
| Capital Share Transactions | ||
| Issued | 2,628,108 | 2,895,274 |
| Issued in Lieu of Cash Distributions | 234,102 | 333,314 |
| Redeemed | (3,224,763) | (2,497,305) |
| Net Increase (Decrease) from Capital Share Transactions | (362,553) | 731,283 |
| Total Increase (Decrease) | (581,108) | 1,051,901 |
| Net Assets | ||
| Beginning of Period | 11,214,529 | 10,162,628 |
| End of Period2 | 10,633,421 | 11,214,529 |
1 Includes fiscal 2015 and 2014 short-term gain distributions totaling $14,025,000 and $2,471,000 respectively. Short-term gain distributions are treated as ordinary income dividends for tax purposes.
2 Net Assets—End of Period includes undistributed (overdistributed) net investment income of $8,168,000 and $6,785,000.
See accompanying Notes, which are an integral part of the Financial Statements.
16
| Target Retirement Income Fund | |||||
| Financial Highlights | |||||
| For a Share Outstanding | Year Ended September 30, | ||||
| Throughout Each Period | 2015 | 2014 | 2013 | 2012 | 2011 |
| Net Asset Value, Beginning of Period | $12.84 | $12.46 | $12.23 | $11.22 | $11.13 |
| Investment Operations | |||||
| Net Investment Income | . 238 | .220 | .246 | .275 | .3031 |
| Capital Gain Distributions Received | .015 | .002 | .067 | .052 | .0301 |
| Net Realized and Unrealized Gain (Loss) | |||||
| on Investments | (. 225) | . 572 | .185 | .977 | .080 |
| Total from Investment Operations | .028 | .794 | .498 | 1.304 | .413 |
| Distributions | |||||
| Dividends from Net Investment Income | (.236) | (.218) | (.247) | (.273) | (. 299) |
| Distributions from Realized Capital Gains | (.042) | (.196) | (. 021) | (. 021) | (. 024) |
| Total Distributions | (.278) | (.414) | (.268) | (.294) | (.323) |
| Net Asset Value, End of Period | $12.59 | $12.84 | $12.46 | $12.23 | $11.22 |
| Total Return2 | 0.18% | 6.47% | 4.12% | 11.74% | 3.70% |
| Ratios/Supplemental Data | |||||
| Net Assets, End of Period (Millions) | $10,633 | $11,215 | $10,163 | $9,382 | $4,765 |
| Ratio of Total Expenses to Average Net Assets | — | — | — | — | — |
| Acquired Fund Fees and Expenses | 0.14% | 0.16% | 0.16% | 0.16% | 0.17% |
| Ratio of Net Investment Income to | |||||
| Average Net Assets | 1.83% | 1.74% | 1.99% | 2.31% | 2.65% |
| Portfolio Turnover Rate | 14% | 6% | 40% | 7% | 14%3 |
1 Calculated based on average shares outstanding.
2 Total returns do not include account service fees that may have applied in the periods shown. Fund prospectuses provide information about any applicable account service fees.
3 Excludes the value of mutual fund shares delivered and received in connection with a change in the fund’s international equity investments from Vanguard European, Pacific, and Emerging Markets Stock Index Funds to Vanguard Total International Stock Index Fund because those transactions were effected in kind and did not cause the fund to incur transaction costs.
See accompanying Notes, which are an integral part of the Financial Statements.
17
Target Retirement Income Fund
Notes to Financial Statements
Vanguard Target Retirement Income Fund is registered under the Investment Company Act of 1940 as an open-end investment company, or mutual fund. The fund follows a balanced investment strategy by investing in selected Vanguard funds to achieve its targeted allocation of assets to U.S. and international stocks, and U.S. and international bonds. Financial statements and other information about each underlying fund are available on vanguard.com.
A. The following significant accounting policies conform to generally accepted accounting principles for U.S. investment companies. The fund consistently follows such policies in preparing its financial statements.
1. Security Valuation: Investments are valued at the net asset value of each underlying Vanguard fund determined as of the close of the New York Stock Exchange (generally 4 p.m., Eastern time) on the valuation date.
2. Federal Income Taxes: The fund intends to continue to qualify as a regulated investment company and distribute all of its taxable income. Management has analyzed the fund’s tax positions taken for all open federal income tax years (September 30, 2012–2015), and has concluded that no provision for federal income tax is required in the fund’s financial statements.
3. Distributions: Distributions to shareholders are recorded on the ex-dividend date.
4. Credit Facility: The fund and certain other funds managed by The Vanguard Group (“Vanguard”) participate in a $3 billion committed credit facility provided by a syndicate of lenders pursuant to a credit agreement that may be renewed annually; each fund is individually liable for its borrowings, if any, under the credit facility. Borrowings may be utilized for temporary and emergency purposes, and are subject to the fund’s regulatory and contractual borrowing restrictions. The participating funds are charged administrative fees and an annual commitment fee of 0.06% of the undrawn amount of the facility; these fees are allocated to the funds based on a method approved by the fund’s board of trustees and borne by the funds in which the fund invests (see Note B). Any borrowings under this facility bear interest at a rate equal to the higher of the federal funds rate or LIBOR reference rate plus an agreed-upon spread.
The fund had no borrowings outstanding at September 30, 2015, or at any time during the period then ended.
5. Other: Income and capital gain distributions received are recorded on the ex-dividend date. Security transactions are accounted for on the date securities are bought or sold. Costs used to determine realized gains (losses) on the sale of investment securities are those of the specific securities sold.
B. In accordance with the terms of a Funds’ Service Agreement (the “FSA”) between Vanguard and the fund, Vanguard furnishes to the fund investment advisory, corporate management, administrative, marketing, and distribution services at Vanguard’s cost of operations (as defined by the FSA). These costs of operations are allocated to the fund based on methods and guidelines approved by the board of trustees. The FSA provides that expenses otherwise allocable to Vanguard funds-of-funds may be reduced or eliminated to the extent of savings realized by the underlying Vanguard funds by virtue of being part of a fund-of-funds. Accordingly, all expenses for services provided by Vanguard to the fund and all other expenses incurred by the fund during the year ended September 30, 2015, were borne by the underlying Vanguard funds in which the fund invests. The fund’s trustees and officers are also trustees and officers, respectively, of the underlying Vanguard funds, as well as directors and employees, respectively, of Vanguard.
18
Target Retirement Income Fund
C. Various inputs may be used to determine the value of the fund’s investments. These inputs are summarized in three broad levels for financial statement purposes. The inputs or methodologies used to value securities are not necessarily an indication of the risk associated with investing in those securities.
Level 1—Quoted prices in active markets for identical securities.
Level 2—Other significant observable inputs (including quoted prices for similar securities, interest rates, prepayment speeds, credit risk, etc.).
Level 3—Significant unobservable inputs (including the fund’s own assumptions used to determine the fair value of investments).
At September 30, 2015, 100% of the market value of the fund’s investments was determined based on Level 1 inputs.
D. Distributions are determined on a tax basis and may differ from net investment income and realized capital gains for financial reporting purposes. Differences may be permanent or temporary. Permanent differences are reclassified among capital accounts in the financial statements to reflect their tax character. Temporary differences arise when certain items of income, expense, gain, or loss are recognized in different periods for financial statement and tax purposes. These differences will reverse at some time in the future. Differences in classification may also result from the treatment of short-term gains as ordinary income for tax purposes.
The fund used a tax accounting practice to treat a portion of the price of capital shares redeemed during the year as distributions from realized capital gains. Accordingly, the fund has reclassified $26,126,000 from accumulated net realized gains to paid-in capital.
For tax purposes, at September 30, 2015, the fund had $12,274,000 of ordinary income and $145,935,000 of long-term capital gains available for distribution.
At September 30, 2015, the cost of investment securities for tax purposes was $9,678,378,000. Net unrealized appreciation of investment securities for tax purposes was $962,129,000, consisting of unrealized gains of $1,085,788,000 on securities that had risen in value since their purchase and $123,659,000 in unrealized losses on securities that had fallen in value since their purchase.
E. During the year ended September 30, 2015, the fund purchased $1,655,952,000 of investment securities and sold $2,050,619,000 of investment securities, other than temporary cash investments.
| F. | Capital shares issued and redeemed were: |
| Year Ended September 30, | ||
| 2015 | 2014 | |
| Shares | Shares | |
| (000) | (000) | |
| Issued | 202,353 | 227,703 |
| Issued in Lieu of Cash Distributions | 18,131 | 26,451 |
| Redeemed | (249,340) | (196,389) |
| Net Increase (Decrease) in Shares Outstanding | (28,856) | 57,765 |
19
Target Retirement Income Fund
| G. Transactions during the period in affiliated underlying Vanguard funds were as follows: | ||||||
| Current Period Transactions | ||||||
| Sept. 30, | Proceeds | Sept. 30, | ||||
| 2014 | from | Capital Gain | 2015 | |||
| Market | Purchases | Securities | Distributions | Market | ||
| Value | at Cost | Sold1 | Income | Received | Value | |
| ($000) | ($000) | ($000) | ($000) | ($000) | ($000) | |
| Vanguard Market Liquidity Fund | 4,174 | NA 2 | NA 2 | 3 | — | — |
| Vanguard Short-Term Inflation- | ||||||
| Protected Securities Fund | 1,886,096 | 172,567 | 239,626 | 13,435 | — | 1,779,726 |
| Vanguard Total Bond Market II | ||||||
| Index Fund | 4,422,906 | 360,657 | 786,119 | 99,614 | 13,438 | 4,004,448 |
| Vanguard Total International | ||||||
| Bond Index Fund | 1,572,397 | 330,141 | 237,285 | 24,479 | — | 1,687,462 |
| Vanguard Total International | ||||||
| Stock Index Fund | 984,712 | 520,969 | 93,090 | 30,575 | — | 1,223,178 |
| Vanguard Total Stock Market | ||||||
| Index Fund | 2,365,624 | 269,210 | 692,117 | 41,245 | — | 1,935,693 |
| Total | 11,235,909 | 1,653,544 | 2,048,237 | 209,351 | 13,438 | 10,640,507 |
| 1 Includes net realized gain (loss) on affiliated investment securities sold of $174,602,000. | ||||||
| 2 Not applicable—purchases and sales are for temporary cash investment purposes. | ||||||
H. Management has determined that no material events or transactions occurred subsequent to September 30, 2015, that would require recognition or disclosure in these financial statements.
20
Target Retirement 2010 Fund
Fund Profile
As of September 30, 2015
| Total Fund Characteristics | |
| Ticker Symbol | VTENX |
| 30-Day SEC Yield | 1.94% |
| Acquired Fund Fees and Expenses1 | 0.16% |
| Allocation to Underlying Vanguard Funds | |
| Vanguard Total Bond Market II Index Fund | |
| Investor Shares | 35.5% |
| Vanguard Total Stock Market Index Fund | |
| Investor Shares | 20.9 |
| Vanguard Total International Bond Index | |
| Fund Investor Shares | 15.1 |
| Vanguard Short-Term Inflation-Protected | |
| Securities Index Fund Investor Shares | 14.9 |
| Vanguard Total International Stock Index | |
| Fund Investor Shares | 13.6 |
| Total Fund Volatility Measures | ||
| Target 2010 | MSCI US | |
| Composite | Broad Market | |
| Index | Index | |
| R-Squared | 1.00 | 0.74 |
| Beta | 1.00 | 0.37 |
These measures show the degree and timing of the fund’s fluctuations compared with the indexes over 36 months.
Fund Asset Allocation
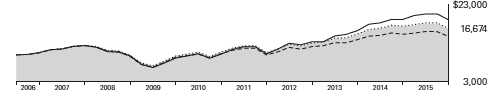
1 This figure—drawn from the prospectus dated January 27, 2015—represents an estimate of the weighted average of the expense ratios and any transaction fees charged by the underlying mutual funds (the ”acquired” funds) in which the Target Retirement 2010 Fund invests. The fund does not charge any expenses or fees of its own. For the fiscal year ended September 30, 2015, the acquired fund fees and expenses were 0.14%.
21
Target Retirement 2010 Fund
Performance Summary
All of the returns in this report represent past performance, which is not a guarantee of future results that may be achieved by the fund. (Current performance may be lower or higher than the performance data cited. For performance data current to the most recent month-end, visit our website at vanguard.com/performance.) Note, too, that both investment returns and principal value can fluctuate widely, so an investor’s shares, when sold, could be worth more or less than their original cost. The returns shown do not reflect taxes that a shareholder would pay on fund distributions or on the sale of fund shares.
Cumulative Performance: June 7, 2006, Through September 30, 2015
Initial Investment of $10,000

| Average Annual Total Returns | |||||
| Periods Ended September 30, 2015 | |||||
| Since | Final Value | ||||
| One | Five | Inception | of a $10,000 | ||
| Year | Years | (6/7/2006) | Investment | ||
| Target Retirement 2010 Fund | 0.06% | 6.24% | 5.31% | $16,190 | |
| •••••••• | Target 2010 Composite Index | 0.13 | 6.32 | 5.32 | 16,207 |
| – – – – | Mixed-Asset Target 2010 Funds | ||||
| -1.87 | 4.71 | 3.88 | 14,256 | ||
| MSCI Average US Broad Market Index | -0.41 | 13.37 | 7.20 | 19,108 | |
| For a benchmark description, see the Glossary. | |||||
| Mixed-Asset Target 2010 Funds Average: Derived from data provided by Lipper, a Thomson Reuters Company. | |||||
| "Since Inception" performance is calculated from the inception date for both the fund and its comparative standards. | |||||
See Financial Highlights for dividend and capital gains information.
22
Target Retirement 2010 Fund
Fiscal-Year Total Returns (%): June 7, 2006, Through September 30, 2015
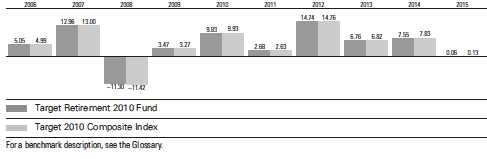
23
Target Retirement 2010 Fund
Financial Statements
Statement of Net Assets
As of September 30, 2015
The fund reports a complete list of its holdings in regulatory filings four times in each fiscal year, at the quarter-ends. For the second and fourth fiscal quarters, the lists appear in the fund’s semiannual and annual reports to shareholders. For the first and third fiscal quarters, the fund files the lists with the Securities and Exchange Commission on Form N-Q. Shareholders can look up the fund’s Forms N-Q on the SEC’s website at sec.gov. Forms N-Q may also be reviewed and copied at the SEC’s Public Reference Room (see the back cover of this report for further information).
| Market | ||
| Value• | ||
| Shares | ($000) | |
| Investment Companies (100.1%) | ||
| U.S. Stock Fund (21.0%) | ||
| Vanguard Total Stock Market Index Fund Investor Shares | 26,776,699 | 1,286,888 |
| International Stock Fund (13.6%) | ||
| Vanguard Total International Stock Index Fund Investor Shares | 58,732,593 | 835,177 |
| U.S. Bond Funds (50.4%) | ||
| 1 Vanguard Total Bond Market II Index Fund Investor Shares | 202,953,287 | 2,183,777 |
| Vanguard Short-Term Inflation-Protected Securities Index Fund Investor Shares | 37,761,047 | 914,950 |
| 3,098,727 | ||
| International Bond Fund (15.1%) | ||
| Vanguard Total International Bond Index Fund Investor Shares | 87,792,106 | 927,963 |
| Total Investment Companies (Cost $5,476,007) | 6,148,755 | |
| Temporary Cash Investment (0.0%) | ||
| Money Market Fund (0.0%) | ||
| 1 Vanguard Market Liquidity Fund, 0.189% (Cost $2,851) | 2,850,785 | 2,851 |
| Total Investments (100.1%) (Cost $5,478,858) | 6,151,606 | |
| Amount | ||
| ($000) | ||
| Other Assets and Liabilities (-0.1%) | ||
| Other Assets | ||
| Receivables for Investment Securities Sold | 20,000 | |
| Receivables for Accrued Income | 5,396 | |
| Receivables for Capital Shares Issued | 3,919 | |
| Total Other Assets | 29,315 | |
| Liabilities | ||
| Payables for Investment Securities Purchased | (12,044) | |
| Payables for Capital Shares Redeemed | (26,396) | |
| Total Liabilities | (38,440) | |
| Net Assets (100%) | ||
| Applicable to 237,152,631 outstanding $.001 par value shares of | ||
| beneficial interest (unlimited authorization) | 6,142,481 | |
| Net Asset Value Per Share | $25.90 | |
24
| Target Retirement 2010 Fund | |
| At September 30, 2015, net assets consisted of: | |
| Amount | |
| ($000) | |
| Paid-in Capital | 5,214,573 |
| Undistributed Net Investment Income | 75,298 |
| Accumulated Net Realized Gains | 179,862 |
| Unrealized Appreciation (Depreciation) | 672,748 |
| Net Assets | 6,142,481 |
- See Note A in Notes to Financial Statements.
- Affiliated fund available only to Vanguard funds and certain trusts and accounts managed by Vanguard. Rate shown for Vanguard Market Liquidity Fund is the 7-day yield.
See accompanying Notes, which are an integral part of the Financial Statements.
25
| Target Retirement 2010 Fund | |
| Statement of Operations | |
| Year Ended | |
| September 30, 2015 | |
| ($000) | |
| Investment Income | |
| Income | |
| Income Distributions Received | 129,075 |
| Other Income | 13 |
| Net Investment Income—Note B | 129,088 |
| Realized Net Gain (Loss) | |
| Capital Gain Distributions Received | 7,771 |
| Investment Securities Sold | 226,235 |
| Realized Net Gain (Loss) | 234,006 |
| Change in Unrealized Appreciation (Depreciation) of Investment Securities | (342,401) |
| Net Increase (Decrease) in Net Assets Resulting from Operations | 20,693 |
See accompanying Notes, which are an integral part of the Financial Statements.
26
| Target Retirement 2010 Fund | ||
| Statement of Changes in Net Assets | ||
| Year Ended September 30, | ||
| 2015 | 2014 | |
| ($000) | ($000) | |
| Increase (Decrease) in Net Assets | ||
| Operations | ||
| Net Investment Income | 129,088 | 126,265 |
| Realized Net Gain (Loss) | 234,006 | 97,844 |
| Change in Unrealized Appreciation (Depreciation) | (342,401) | 273,313 |
| Net Increase (Decrease) in Net Assets Resulting from Operations | 20,693 | 497,422 |
| Distributions | ||
| Net Investment Income | (120,953) | (109,648) |
| Realized Capital Gain1 | (87,847) | (78,208) |
| Total Distributions | (208,800) | (187,856) |
| Capital Share Transactions | ||
| Issued | 1,543,822 | 1,771,303 |
| Issued in Lieu of Cash Distributions | 204,793 | 184,496 |
| Redeemed | (2,370,440) | (1,992,038) |
| Net Increase (Decrease) from Capital Share Transactions | (621,825) | (36,239) |
| Total Increase (Decrease) | (809,932) | 273,327 |
| Net Assets | ||
| Beginning of Period | 6,952,413 | 6,679,086 |
| End of Period2 | 6,142,481 | 6,952,413 |
1 Includes fiscal 2015 and 2014 short-term gain distributions totaling $9,384,000 and $520,000, respectively. Short-term gain distributions are treated as ordinary income dividends for tax purposes.
2 Net Assets—End of Period includes undistributed (overdistributed) net investment income of $75,298,000 and $80,072,000.
See accompanying Notes, which are an integral part of the Financial Statements.
27
| Target Retirement 2010 Fund | |||||
| Financial Highlights | |||||
| For a Share Outstanding | Year Ended September 30, | ||||
| Throughout Each Period | 2015 | 2014 | 2013 | 2012 | 2011 |
| Net Asset Value, Beginning of Period | $26.67 | $25.50 | $24.45 | $21.91 | $21.87 |
| Investment Operations | |||||
| Net Investment Income | . 529 | . 487 | .516 | .571 | .5601 |
| Capital Gain Distributions Received | .036 | .004 | .103 | .100 | .0561 |
| Net Realized and Unrealized Gain (Loss) | |||||
| on Investments | (. 534) | 1.402 | .999 | 2.502 | (.022) |
| Total from Investment Operations | .031 | 1.893 | 1.618 | 3.173 | .594 |
| Distributions | |||||
| Dividends from Net Investment Income | (.464) | (.422) | (. 531) | (. 596) | (. 511) |
| Distributions from Realized Capital Gains | (.337) | (. 301) | (. 037) | (.037) | (.043) |
| Total Distributions | (.801) | (.723) | (.568) | (. 633) | (. 554) |
| Net Asset Value, End of Period | $25.90 | $26.67 | $25.50 | $24.45 | $21.91 |
| Total Return2 | 0.06% | 7.55% | 6.76% | 14.74% | 2.68% |
| Ratios/Supplemental Data | |||||
| Net Assets, End of Period (Millions) | $6,142 | $6,952 | $6,679 | $6,155 | $4,747 |
| Ratio of Total Expenses to Average Net Assets | — | — | — | — | — |
| Acquired Fund Fees and Expenses | 0.14% | 0.16% | 0.16% | 0.16% | 0.17% |
| Ratio of Net Investment Income to | |||||
| Average Net Assets | 1.86% | 1.83% | 2.08% | 2.51% | 2.46% |
| Portfolio Turnover Rate | 15% | 13% | 38% | 12% | 27%3 |
1 Calculated based on average shares outstanding.
2 Total returns do not include account service fees that may have applied in the periods shown. Fund prospectuses provide information about any applicable account service fees.
3 Excludes the value of mutual fund shares delivered and received in connection with a change in the fund’s international equity investments from Vanguard European, Pacific, and Emerging Markets Stock Index Funds to Vanguard Total International Stock Index Fund because those transactions were effected in kind and did not cause the fund to incur transaction costs.
See accompanying Notes, which are an integral part of the Financial Statements.
28
Target Retirement 2010 Fund
Notes to Financial Statements
Vanguard Target Retirement 2010 Fund is registered under the Investment Company Act of 1940 as an open-end investment company, or mutual fund. The fund follows a balanced investment strategy by investing in selected Vanguard funds to achieve its targeted allocation of assets to U.S. and international stocks, and U.S. and international bonds. Financial statements and other information about each underlying fund are available on vanguard.com.
A. The following significant accounting policies conform to generally accepted accounting principles for U.S. investment companies. The fund consistently follows such policies in preparing its financial statements.
1. Security Valuation: Investments are valued at the net asset value of each underlying Vanguard fund determined as of the close of the New York Stock Exchange (generally 4 p.m., Eastern time) on the valuation date.
2. Federal Income Taxes: The fund intends to continue to qualify as a regulated investment company and distribute all of its taxable income. Management has analyzed the fund’s tax positions taken for all open federal income tax years (September 30, 2012–2015), and has concluded that no provision for federal income tax is required in the fund’s financial statements.
3. Distributions: Distributions to shareholders are recorded on the ex-dividend date.
4. Credit Facility: The fund and certain other funds managed by The Vanguard Group (“Vanguard”) participate in a $3 billion committed credit facility provided by a syndicate of lenders pursuant to a credit agreement that may be renewed annually; each fund is individually liable for its borrowings, if any, under the credit facility. Borrowings may be utilized for temporary and emergency purposes, and are subject to the fund’s regulatory and contractual borrowing restrictions. The participating funds are charged administrative fees and an annual commitment fee of 0.06% of the undrawn amount of the facility; these fees are allocated to the funds based on a method approved by the fund’s board of trustees and borne by the funds in which the fund invests (see Note B). Any borrowings under this facility bear interest at a rate equal to the higher of the federal funds rate or LIBOR reference rate plus an agreed-upon spread.
The fund had no borrowings outstanding at September 30, 2015, or at any time during the period then ended.
5. Other: Income and capital gain distributions received are recorded on the ex-dividend date. Security transactions are accounted for on the date securities are bought or sold. Costs used to determine realized gains (losses) on the sale of investment securities are those of the specific securities sold.
B. In accordance with the terms of a Funds’ Service Agreement (the “FSA”) between Vanguard and the fund, Vanguard furnishes to the fund investment advisory, corporate management, administrative, marketing, and distribution services at Vanguard’s cost of operations (as defined by the FSA). These costs of operations are allocated to the fund based on methods and guidelines approved by the board of trustees. The FSA provides that expenses otherwise allocable to Vanguard funds-of-funds may be reduced or eliminated to the extent of savings realized by the underlying Vanguard funds by virtue of being part of a fund-of-funds. Accordingly, all expenses for services provided by Vanguard to the fund and all other expenses incurred by the fund during the year ended September 30, 2015, were borne by the underlying Vanguard funds in which the fund invests. The fund’s trustees and officers are also trustees and officers, respectively, of the underlying Vanguard funds, as well as directors and employees, respectively, of Vanguard.
29
Target Retirement 2010 Fund
C. Various inputs may be used to determine the value of the fund’s investments. These inputs are summarized in three broad levels for financial statement purposes. The inputs or methodologies used to value securities are not necessarily an indication of the risk associated with investing in those securities.
Level 1—Quoted prices in active markets for identical securities.
Level 2—Other significant observable inputs (including quoted prices for similar securities, interest rates, prepayment speeds, credit risk, etc.).
Level 3—Significant unobservable inputs (including the fund’s own assumptions used to determine the fair value of investments).
At September 30, 2015, 100% of the market value of the fund’s investments was determined based on Level 1 inputs.
D. Distributions are determined on a tax basis and may differ from net investment income and realized capital gains for financial reporting purposes. Differences may be permanent or temporary. Permanent differences are reclassified among capital accounts in the financial statements to reflect their tax character. Temporary differences arise when certain items of income, expense, gain, or loss are recognized in different periods for financial statement and tax purposes. These differences will reverse at some time in the future. Differences in classification may also result from the treatment of short-term gains as ordinary income for tax purposes.
The fund used a tax accounting practice to treat a portion of the price of capital shares redeemed during the year as distributions from net investment income and realized capital gains. Accordingly, the fund has reclassified $12,909,000 from undistributed net investment income, and $42,543,000 from accumulated net realized gains, to paid-in capital.
For tax purposes, at September 30, 2015, the fund had $78,283,000 of ordinary income and $178,414,000 of long-term capital gains available for distribution.
At September 30, 2015, the cost of investment securities for tax purposes was $5,480,395,000. Net unrealized appreciation of investment securities for tax purposes was $671,211,000, consisting of unrealized gains of $741,809,000 on securities that had risen in value since their purchase and $70,598,000 in unrealized losses on securities that had fallen in value since their purchase.
E. During the year ended September 30, 2015, the fund purchased $1,070,781,000 of investment securities and sold $1,765,646,000 of investment securities, other than temporary cash investments.
| F. | Capital shares issued and redeemed were: |
| Year Ended September 30, | ||
| 2015 | 2014 | |
| Shares | Shares | |
| (000) | (000) | |
| Issued | 57,848 | 67,740 |
| Issued in Lieu of Cash Distributions | 7,751 | 7,224 |
| Redeemed | (89,126) | (76,186) |
| Net Increase (Decrease) in Shares Outstanding | (23,527) | (1,222) |
30
Target Retirement 2010 Fund
| G. Transactions during the period in affiliated underlying Vanguard funds were as follows: | ||||||
| Current Period Transactions | ||||||
| Sept. 30, | Proceeds | Sept. 30, | ||||
| 2014 | from | Capital Gain | 2015 | |||
| Market | Purchases | Securities | Distributions | Market | ||
| Value | at Cost | Sold1 | Income | Received | Value | |
| ($000) | ($000) | ($000) | ($000) | ($000) | ($000) | |
| Vanguard Market Liquidity Fund | — | NA2 | NA 2 | 2 | — | 2,851 |
| Vanguard Short-Term Inflation- | ||||||
| Protected Securities Index Fund | 949,948 | 136,487 | 151,517 | 6,759 | — | 914,950 |
| Vanguard Total Bond Market II | ||||||
| Index Fund | 2,539,701 | 259,102 | 620,976 | 56,745 | 7,771 | 2,183,777 |
| Vanguard Total International | ||||||
| Bond Index Fund | 874,983 | 183,467 | 142,396 | 13,653 | — | 927,963 |
| Vanguard Total International | ||||||
| Stock Index Fund | 751,381 | 305,821 | 98,206 | 21,891 | — | 835,177 |
| Vanguard Total Stock Market | ||||||
| Index Fund | 1,843,774 | 184,448 | 751,112 | 30,025 | — | 1,286,888 |
| Total | 6,959,787 | 1,069,325 | 1,764,207 | 129,075 | 7,771 | 6,151,606 |
| 1 Includes net realized gain (loss) on affiliated investment securities sold of $226,250,000. | ||||||
| 2 Not applicable—purchases and sales are for temporary cash investment purposes. | ||||||
H. Management has determined that no material events or transactions occurred subsequent to September 30, 2015, that would require recognition or disclosure in these financial statements.
31
Target Retirement 2015 Fund
Fund Profile
As of September 30, 2015
| Total Fund Characteristics | |
| Ticker Symbol | VTXVX |
| 30-Day SEC Yield | 2.07% |
| Acquired Fund Fees and Expenses1 | 0.16% |
| Allocation to Underlying Vanguard Funds | |
| Vanguard Total Bond Market II Index Fund | |
| Investor Shares | 30.0% |
| Vanguard Total Stock Market Index Fund | |
| Investor Shares | 29.3 |
| Vanguard Total International Stock Index | |
| Fund Investor Shares | 19.4 |
| Vanguard Total International Bond Index | |
| Fund Investor Shares | 12.8 |
| Vanguard Short-Term Inflation-Protected | |
| Securities Index Fund Investor Shares | 8.5 |
| Total Fund Volatility Measures | ||
| Target 2015 | MSCI US | |
| Composite | Broad Market | |
| Index | Index | |
| R-Squared | 1.00 | 0.85 |
| Beta | 1.00 | 0.50 |
These measures show the degree and timing of the fund’s fluctuations compared with the indexes over 36 months.
Fund Asset Allocation
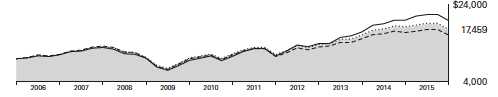
1 This figure—drawn from the prospectus dated January 27, 2015—represents an estimate of the weighted average of the expense ratios and any transaction fees charged by the underlying mutual funds (the ”acquired” funds) in which the Target Retirement 2015 Fund invests. The fund does not charge any expenses or fees of its own. For the fiscal year ended September 30, 2015, the acquired fund fees and expenses were 0.14%.
32
Target Retirement 2015 Fund
Performance Summary
All of the returns in this report represent past performance, which is not a guarantee of future results that may be achieved by the fund. (Current performance may be lower or higher than the performance data cited. For performance data current to the most recent month-end, visit our website at vanguard.com/performance.) Note, too, that both investment returns and principal value can fluctuate widely, so an investor’s shares, when sold, could be worth more or less than their original cost. The returns shown do not reflect taxes that a shareholder would pay on fund distributions or on the sale of fund shares.
Cumulative Performance: September 30, 2005, Through September 30, 2015
Initial Investment of $10,000
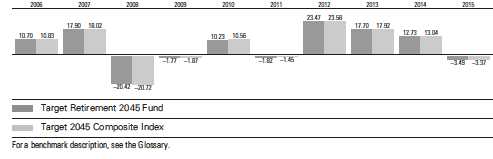
| Average Annual Total Returns | |||||
| Periods Ended September 30, 2015 | |||||
| Final Value | |||||
| One | Five | Ten | of a $10,000 | ||
| Year | Years | Years | Investment | ||
| Target Retirement 2015 Fund | -0.66% | 7.04% | 5.30% | $16,762 | |
| •••••••• | Target 2015 Composite Index | -0.61 | 7.11 | 5.30 | 16,763 |
| – – – – | Mixed-Asset Target 2015 Funds | ||||
| -1.95 | 5.11 | 3.84 | 14,572 | ||
| MSCI Average US Broad Market Index | -0.41 | 13.37 | 7.12 | 19,902 | |
| For a benchmark description, see the Glossary. | |||||
| Mixed-Asset Target 2015 Funds Average: Derived from data provided by Lipper, a Thomson Reuters Company. | |||||
See Financial Highlights for dividend and capital gains information.
33
Target Retirement 2015 Fund
Fiscal-Year Total Returns (%): September 30, 2005, Through September 30, 2015
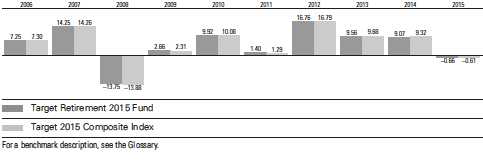
34
Target Retirement 2015 Fund
Financial Statements
Statement of Net Assets
As of September 30, 2015
The fund reports a complete list of its holdings in regulatory filings four times in each fiscal year, at the quarter-ends. For the second and fourth fiscal quarters, the lists appear in the fund’s semiannual and annual reports to shareholders. For the first and third fiscal quarters, the fund files the lists with the Securities and Exchange Commission on Form N-Q. Shareholders can look up the fund’s Forms N-Q on the SEC’s website at sec.gov. Forms N-Q may also be reviewed and copied at the SEC’s Public Reference Room (see the back cover of this report for further information).
| Market | ||
| Value• | ||
| Shares | ($000) | |
| Investment Companies (100.1%) | ||
| U.S. Stock Fund (29.3%) | ||
| Vanguard Total Stock Market Index Fund Investor Shares | 115,067,374 | 5,530,138 |
| International Stock Fund (19.5%) | ||
| Vanguard Total International Stock Index Fund Investor Shares | 257,725,007 | 3,664,850 |
| U.S. Bond Funds (38.5%) | ||
| 1 Vanguard Total Bond Market II Index Fund Investor Shares | 525,200,660 | 5,651,159 |
| Vanguard Short-Term Inflation-Protected Securities Index Fund Investor Shares | 66,507,933 | 1,611,487 |
| 7,262,646 | ||
| International Bond Fund (12.8%) | ||
| Vanguard Total International Bond Index Fund Investor Shares | 228,044,160 | 2,410,427 |
| Total Investment Companies (Cost $16,114,033) | 18,868,061 | |
| Amount | ||
| ($000) | ||
| Other Assets and Liabilities (-0.1%) | ||
| Other Assets | ||
| Receivables for Investment Securities Sold | 106,979 | |
| Receivables for Accrued Income | 14,034 | |
| Receivables for Capital Shares Issued | 9,384 | |
| Total Other Assets | 130,397 | |
| Liabilities | ||
| Payables for Investment Securities Purchased | (14,030) | |
| Payables for Capital Shares Redeemed | (118,000) | |
| Other Liabilities | (8,064) | |
| Total Liabilities | (140,094) | |
| Net Assets (100%) | ||
| Applicable to 1,265,830,721 outstanding $.001 par value shares of | ||
| beneficial interest (unlimited authorization) | 18,858,364 | |
| Net Asset Value Per Share | $14.90 | |
35
| Target Retirement 2015 Fund | |
| At September 30, 2015, net assets consisted of: | |
| Amount | |
| ($000) | |
| Paid-in Capital | 15,103,521 |
| Undistributed Net Investment Income | 255,250 |
| Accumulated Net Realized Gains | 745,565 |
| Unrealized Appreciation (Depreciation) | 2,754,028 |
| Net Assets | 18,858,364 |
- See Note A in Notes to Financial Statements.
- Affiliated fund available only to Vanguard funds and certain trusts and accounts managed by Vanguard. See accompanying Notes, which are an integral part of the Financial Statements.
36
| Target Retirement 2015 Fund | |
| Statement of Operations | |
| Year Ended | |
| September 30, 2015 | |
| ($000) | |
| Investment Income | |
| Income | |
| Income Distributions Received | 424,789 |
| Other Income | 53 |
| Net Investment Income—Note B | 424,842 |
| Realized Net Gain (Loss) | |
| Capital Gain Distributions Received | 21,160 |
| Investment Securities Sold | 939,096 |
| Realized Net Gain (Loss) | 960,256 |
| Change in Unrealized Appreciation (Depreciation) of Investment Securities | (1,454,776) |
| Net Increase (Decrease) in Net Assets Resulting from Operations | (69,678) |
See accompanying Notes, which are an integral part of the Financial Statements.
37
| Target Retirement 2015 Fund | ||
| Statement of Changes in Net Assets | ||
| Year Ended September 30, | ||
| 2015 | 2014 | |
| ($000) | ($000) | |
| Increase (Decrease) in Net Assets | ||
| Operations | ||
| Net Investment Income | 424,842 | 421,762 |
| Realized Net Gain (Loss) | 960,256 | 193,156 |
| Change in Unrealized Appreciation (Depreciation) | (1,454,776) | 1,185,319 |
| Net Increase (Decrease) in Net Assets Resulting from Operations | (69,678) | 1,800,237 |
| Distributions | ||
| Net Investment Income | (397,934) | (357,912) |
| Realized Capital Gain1 | (235,397) | (119,304) |
| Total Distributions | (633,331) | (477,216) |
| Capital Share Transactions | ||
| Issued | 4,554,230 | 5,138,844 |
| Issued in Lieu of Cash Distributions | 621,730 | 470,363 |
| Redeemed | (7,355,716) | (4,930,423) |
| Net Increase (Decrease) from Capital Share Transactions | (2,179,756) | 678,784 |
| Total Increase (Decrease) | (2,882,765) | 2,001,805 |
| Net Assets | ||
| Beginning of Period | 21,741,129 | 19,739,324 |
| End of Period2 | 18,858,364 | 21,741,129 |
1 Includes fiscal 2015 and 2014 short-term gain distributions totaling $35,029,000 and $2,743,000, respectively. Short-term gain distributions are treated as ordinary income dividends for tax purposes.
2 Net Assets—End of Period includes undistributed (overdistributed) net investment income of $255,250,000 and $270,826,000.
See accompanying Notes, which are an integral part of the Financial Statements.
38
| Target Retirement 2015 Fund | |||||
| Financial Highlights | |||||
| For a Share Outstanding | Year Ended September 30, | ||||
| Throughout Each Period | 2015 | 2014 | 2013 | 2012 | 2011 |
| Net Asset Value, Beginning of Period | $15.44 | $14.49 | $13.54 | $11.91 | $12.03 |
| Investment Operations | |||||
| Net Investment Income | . 327 | .300 | .298 | .327 | .2831 |
| Capital Gain Distributions Received | .018 | .002 | .039 | .053 | .0311 |
| Net Realized and Unrealized Gain (Loss) | |||||
| on Investments | (. 433) | .996 | .929 | 1.583 | (.134) |
| Total from Investment Operations | (.088) | 1.298 | 1.266 | 1.963 | .180 |
| Distributions | |||||
| Dividends from Net Investment Income | (.284) | (. 261) | (. 298) | (.313) | (.276) |
| Distributions from Realized Capital Gains | (.168) | (.087) | (.018) | (. 020) | (. 024) |
| Total Distributions | (.452) | (.348) | (. 316) | (. 333) | (. 300) |
| Net Asset Value, End of Period | $14.90 | $15.44 | $14.49 | $13.54 | $11.91 |
| Total Return2 | -0.66% | 9.07% | 9.56% | 16.76% | 1.40% |
| Ratios/Supplemental Data | |||||
| Net Assets, End of Period (Millions) | $18,858 | $21,741 | $19,739 | $16,838 | $13,435 |
| Ratio of Total Expenses to Average Net Assets | — | — | — | — | — |
| Acquired Fund Fees and Expenses | 0.14% | 0.16% | 0.16% | 0.16% | 0.17% |
| Ratio of Net Investment Income to | |||||
| Average Net Assets | 1.95% | 1.99% | 2.17% | 2.59% | 2.24% |
| Portfolio Turnover Rate | 16% | 10% | 26% | 13% | 27%3 |
1 Calculated based on average shares outstanding.
2 Total returns do not include account service fees that may have applied in the periods shown. Fund prospectuses provide information about any applicable account service fees.
3 Excludes the value of mutual fund shares delivered and received in connection with a change in the fund’s international equity investments from Vanguard European, Pacific, and Emerging Markets Stock Index Funds to Vanguard Total International Stock Index Fund because those transactions were effected in kind and did not cause the fund to incur transaction costs.
See accompanying Notes, which are an integral part of the Financial Statements.
39
Target Retirement 2015 Fund
Notes to Financial Statements
Vanguard Target Retirement 2015 Fund is registered under the Investment Company Act of 1940 as an open-end investment company, or mutual fund. The fund follows a balanced investment strategy by investing in selected Vanguard funds to achieve its targeted allocation of assets to U.S. and international stocks, and U.S. and international bonds. Financial statements and other information about each underlying fund are available on vanguard.com.
A. The following significant accounting policies conform to generally accepted accounting principles for U.S. investment companies. The fund consistently follows such policies in preparing its financial statements.
1. Security Valuation: Investments are valued at the net asset value of each underlying Vanguard fund determined as of the close of the New York Stock Exchange (generally 4 p.m., Eastern time) on the valuation date.
2. Federal Income Taxes: The fund intends to continue to qualify as a regulated investment company and distribute all of its taxable income. Management has analyzed the fund’s tax positions taken for all open federal income tax years (September 30, 2012–2015), and has concluded that no provision for federal income tax is required in the fund’s financial statements.
3. Distributions: Distributions to shareholders are recorded on the ex-dividend date.
4. Credit Facility: The fund and certain other funds managed by The Vanguard Group (“Vanguard”) participate in a $3 billion committed credit facility provided by a syndicate of lenders pursuant to a credit agreement that may be renewed annually; each fund is individually liable for its borrowings, if any, under the credit facility. Borrowings may be utilized for temporary and emergency purposes, and are subject to the fund’s regulatory and contractual borrowing restrictions. The participating funds are charged administrative fees and an annual commitment fee of 0.06% of the undrawn amount of the facility; these fees are allocated to the funds based on a method approved by the fund’s board of trustees and borne by the funds in which the fund invests (see Note B). Any borrowings under this facility bear interest at a rate equal to the higher of the federal funds rate or LIBOR reference rate plus an agreed-upon spread.
The fund had no borrowings outstanding at September 30, 2015, or at any time during the period then ended.
5. Other: Income and capital gain distributions received are recorded on the ex-dividend date. Security transactions are accounted for on the date securities are bought or sold. Costs used to determine realized gains (losses) on the sale of investment securities are those of the specific securities sold.
B. In accordance with the terms of a Funds’ Service Agreement (the “FSA”) between Vanguard and the fund, Vanguard furnishes to the fund investment advisory, corporate management, administrative, marketing, and distribution services at Vanguard’s cost of operations (as defined by the FSA). These costs of operations are allocated to the fund based on methods and guidelines approved by the board of trustees. The FSA provides that expenses otherwise allocable to Vanguard funds-of-funds may be reduced or eliminated to the extent of savings realized by the underlying Vanguard funds by virtue of being part of a fund-of-funds. Accordingly, all expenses for services provided by Vanguard to the fund and all other expenses incurred by the fund during the year ended September 30, 2015, were borne by the underlying Vanguard funds in which the fund invests. The fund’s trustees and officers are also trustees and officers, respectively, of the underlying Vanguard funds, as well as directors and employees, respectively, of Vanguard.
40
Target Retirement 2015 Fund
C. Various inputs may be used to determine the value of the fund’s investments. These inputs are summarized in three broad levels for financial statement purposes. The inputs or methodologies used to value securities are not necessarily an indication of the risk associated with investing in those securities.
Level 1—Quoted prices in active markets for identical securities.
Level 2—Other significant observable inputs (including quoted prices for similar securities, interest rates, prepayment speeds, credit risk, etc.).
Level 3—Significant unobservable inputs (including the fund’s own assumptions used to determine the fair value of investments).
At September 30, 2015, 100% of the market value of the fund’s investments was determined based on Level 1 inputs.
D. Distributions are determined on a tax basis and may differ from net investment income and realized capital gains for financial reporting purposes. Differences may be permanent or temporary. Permanent differences are reclassified among capital accounts in the financial statements to reflect their tax character. Temporary differences arise when certain items of income, expense, gain, or loss are recognized in different periods for financial statement and tax purposes. These differences will reverse at some time in the future. Differences in classification may also result from the treatment of short-term gains as ordinary income for tax purposes.
The fund used a tax accounting practice to treat a portion of the price of capital shares redeemed during the year as distributions from net investment income and realized capital gains. Accordingly, the fund has reclassified $42,484,000 from undistributed net investment income, and $146,455,000 from accumulated net realized gains, to paid-in capital.
For tax purposes, at September 30, 2015, the fund had $264,876,000 of ordinary income and $746,114,000 of long-term capital gains available for distribution.
At September 30, 2015, the cost of investment securities for tax purposes was $16,124,208,000. Net unrealized appreciation of investment securities for tax purposes was $2,743,853,000, consisting of unrealized gains of $3,034,000,000 on securities that had risen in value since their purchase and $290,147,000 in unrealized losses on securities that had fallen in value since their purchase.
E. During the year ended September 30, 2015, the fund purchased $3,579,872,000 of investment securities and sold $5,942,765,000 of investment securities, other than temporary cash investments.
| F. | Capital shares issued and redeemed were: |
| Year Ended September 30, | ||
| 2015 | 2014 | |
| Shares | Shares | |
| (000) | (000) | |
| Issued | 293,455 | 341,159 |
| Issued in Lieu of Cash Distributions | 40,425 | 31,932 |
| Redeemed | (476,492) | (326,605) |
| Net Increase (Decrease) in Shares Outstanding | (142,612) | 46,486 |
41
Target Retirement 2015 Fund
| G. Transactions during the period in affiliated underlying Vanguard funds were as follows: | ||||||
| Current Period Transactions | ||||||
| Sept. 30, | Proceeds | Sept. 30, | ||||
| 2014 | from | Capital Gain | 2015 | |||
| Market | Purchases | Securities | Distributions | Market | ||
| Value | at Cost | Sold1 | Income | Received | Value | |
| ($000) | ($000) | ($000) | ($000) | ($000) | ($000) | |
| Vanguard Market Liquidity Fund | 27,597 | NA 2 | NA 2 | 4 | — | — |
| Vanguard Short-Term Inflation- | ||||||
| Protected Securities Fund | 1,564,974 | 372,063 | 292,461 | 11,093 | — | 1,611,487 |
| Vanguard Total Bond Market II | ||||||
| Index Fund | 6,965,045 | 669,492 | 2,000,294 | 152,853 | 21,160 | 5,651,159 |
| Vanguard Total International | ||||||
| Bond Index Fund | 2,130,931 | 725,858 | 473,277 | 34,448 | — | 2,410,427 |
| Vanguard Total International | ||||||
| Stock Index Fund | 3,205,926 | 1,275,374 | 283,061 | 95,432 | — | 3,664,850 |
| Vanguard Total Stock Market | ||||||
| Index Fund | 7,879,758 | 519,526 | 2,876,341 | 130,959 | — | 5,530,138 |
| Total | 21,774,231 | 3,562,313 | 5,925,434 | 424,789 | 21,160 | 18,868,061 |
| 1 Includes net realized gain (loss) on affiliated investment securities sold of $939,324,000. | ||||||
| 2 Not applicable—purchases and sales are for temporary cash investment purposes. | ||||||
H. Management has determined that no material events or transactions occurred subsequent to September 30, 2015, that would require recognition or disclosure in these financial statements.
42
Target Retirement 2020 Fund
Fund Profile
As of September 30, 2015
| Total Fund Characteristics | |
| Ticker Symbol | VTWNX |
| 30-Day SEC Yield | 2.21% |
| Acquired Fund Fees and Expenses1 | 0.16% |
| Allocation to Underlying Vanguard Funds | |
| Vanguard Total Stock Market Index Fund | |
| Investor Shares | 35.8% |
| Vanguard Total Bond Market II Index Fund | |
| Investor Shares | 28.1 |
| Vanguard Total International Stock Index | |
| Fund Investor Shares | 23.6 |
| Vanguard Total International Bond Index | |
| Fund Investor Shares | 12.0 |
| Vanguard Short-Term Inflation-Protected | |
| Securities Index Fund Investor Shares | 0.5 |
| Total Fund Volatility Measures | ||
| Target 2020 | MSCI US | |
| Composite | Broad Market | |
| Index | Index | |
| R-Squared | 1.00 | 0.89 |
| Beta | 1.00 | 0.59 |
These measures show the degree and timing of the fund’s fluctuations compared with the indexes over 36 months.
Fund Asset Allocation
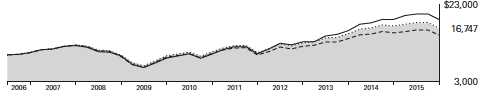
1 This figure—drawn from the prospectus dated January 27, 2015—represents an estimate of the weighted average of the expense ratios and any transaction fees charged by the underlying mutual funds (the ”acquired” funds) in which the Target Retirement 2020 Fund invests. The fund does not charge any expenses or fees of its own. For the fiscal year ended September 30, 2015, the acquired fund fees and expenses were 0.14%.
43
Target Retirement 2020 Fund
Performance Summary
All of the returns in this report represent past performance, which is not a guarantee of future results that may be achieved by the fund. (Current performance may be lower or higher than the performance data cited. For performance data current to the most recent month-end, visit our website at vanguard.com/performance.) Note, too, that both investment returns and principal value can fluctuate widely, so an investor’s shares, when sold, could be worth more or less than their original cost. The returns shown do not reflect taxes that a shareholder would pay on fund distributions or on the sale of fund shares.
Cumulative Performance: June 7, 2006, Through September 30, 2015
Initial Investment of $10,000
| Average Annual Total Returns | |||||
| Periods Ended September 30, 2015 | |||||
| Since | Final Value | ||||
| One | Five | Inception | of a $10,000 | ||
| Year | Years | (6/7/2006) | Investment | ||
| Target Retirement 2020 Fund | -1.13% | 7.66% | 5.59% | $16,593 | |
| •••••••• | Target 2020 Composite Index | -1.06 | 7.88 | 5.70 | 16,754 |
| – – – – | Mixed-Asset Target 2020 Funds | ||||
| -2.07 | 5.81 | 4.12 | 14,563 | ||
| MSCI Average US Broad Market Index | -0.41 | 13.37 | 7.20 | 19,108 | |
| For a benchmark description, see the Glossary. | |||||
| Mixed-Asset Target 2020 Funds Average: Derived from data provided by Lipper, a Thomson Reuters Company. | |||||
| "Since Inception" performance is calculated from the inception date for both the fund and its comparative standards. | |||||
See Financial Highlights for dividend and capital gains information.
44
Target Retirement 2020 Fund
Fiscal-Year Total Returns (%): June 7, 2006, Through September 30, 2015
45
Target Retirement 2020 Fund
Financial Statements
Statement of Net Assets
As of September 30, 2015
The fund reports a complete list of its holdings in regulatory filings four times in each fiscal year, at the quarter-ends. For the second and fourth fiscal quarters, the lists appear in the fund’s semiannual and annual reports to shareholders. For the first and third fiscal quarters, the fund files the lists with the Securities and Exchange Commission on Form N-Q. Shareholders can look up the fund’s Forms N-Q on the SEC’s website at sec.gov. Forms N-Q may also be reviewed and copied at the SEC’s Public Reference Room (see the back cover of this report for further information).
| Market | ||
| Value• | ||
| Shares | ($000) | |
| Investment Companies (100.0%) | ||
| U.S. Stock Fund (35.9%) | ||
| Vanguard Total Stock Market Index Fund Investor Shares | 199,312,986 | 9,578,982 |
| International Stock Fund (23.5%) | ||
| Vanguard Total International Stock Index Fund Investor Shares | 442,097,807 | 6,286,631 |
| U.S. Bond Funds (28.6%) | ||
| 1 Vanguard Total Bond Market II Index Fund Investor Shares | 697,113,853 | 7,500,945 |
| Vanguard Short-Term Inflation-Protected Securities Index Fund Investor Shares | 5,024,637 | 121,747 |
| 7,622,692 | ||
| International Bond Fund (12.0%) | ||
| Vanguard Total International Bond Index Fund Investor Shares | 302,491,533 | 3,197,336 |
| Total Investment Companies (Cost $23,081,797) | 26,685,641 | |
| Temporary Cash Investment (0.0%) | ||
| Money Market Fund (0.0%) | ||
| 1 Vanguard Market Liquidity Fund, 0.189% (Cost $3,128) | 3,128,432 | 3,128 |
| Total Investments (100.0%) (Cost $23,084,925) | 26,688,769 | |
| Amount | ||
| ($000) | ||
| Other Assets and Liabilities (0.0%) | ||
| Other Assets | ||
| Receivables for Investment Securities Sold | 185,430 | |
| Receivables for Accrued Income | 18,936 | |
| Receivables for Capital Shares Issued | 33,473 | |
| Total Other Assets | 237,839 | |
| Liabilities | ||
| Payables for Investment Securities Purchased | (18,935) | |
| Payables for Capital Shares Redeemed | (214,434) | |
| Total Liabilities | (233,369) | |
| Net Assets (100%) | ||
| Applicable to 969,836,750 outstanding $.001 par value shares of | ||
| beneficial interest (unlimited authorization) | 26,693,239 | |
| Net Asset Value Per Share | $27.52 | |
46
| Target Retirement 2020 Fund | |
| At September 30, 2015, net assets consisted of: | |
| Amount | |
| ($000) | |
| Paid-in Capital | 22,338,781 |
| Undistributed Net Investment Income | 389,519 |
| Accumulated Net Realized Gains | 361,095 |
| Unrealized Appreciation (Depreciation) | 3,603,844 |
| Net Assets | 26,693,239 |
- See Note A in Notes to Financial Statements.
- Affiliated fund available only to Vanguard funds and certain trusts and accounts managed by Vanguard. Rate shown for Vanguard Market Liquidity Fund is the 7-day yield.
See accompanying Notes, which are an integral part of the Financial Statements.
47
| Target Retirement 2020 Fund | |
| Statement of Operations | |
| Year Ended | |
| September 30, 2015 | |
| ($000) | |
| Investment Income | |
| Income | |
| Income Distributions Received | 613,866 |
| Other Income | 127 |
| Net Investment Income—Note B | 613,993 |
| Realized Net Gain (Loss) | |
| Capital Gain Distributions Received | 27,179 |
| Investment Securities Sold | 411,095 |
| Realized Net Gain (Loss) | 438,274 |
| Change in Unrealized Appreciation (Depreciation) of Investment Securities | (1,397,892) |
| Net Increase (Decrease) in Net Assets Resulting from Operations | (345,625) |
See accompanying Notes, which are an integral part of the Financial Statements.
48
| Target Retirement 2020 Fund | ||
| Statement of Changes in Net Assets | ||
| Year Ended September 30, | ||
| 2015 | 2014 | |
| ($000) | ($000) | |
| Increase (Decrease) in Net Assets | ||
| Operations | ||
| Net Investment Income | 613,993 | 542,503 |
| Realized Net Gain (Loss) | 438,274 | 27,560 |
| Change in Unrealized Appreciation (Depreciation) | (1,397,892) | 1,764,193 |
| Net Increase (Decrease) in Net Assets Resulting from Operations | (345,625) | 2,334,256 |
| Distributions | ||
| Net Investment Income | (534,873) | (416,278) |
| Realized Capital Gain1 | (40,536) | (9,461) |
| Total Distributions | (575,409) | (425,739) |
| Capital Share Transactions | ||
| Issued | 8,676,675 | 8,357,329 |
| Issued in Lieu of Cash Distributions | 564,612 | 419,089 |
| Redeemed | (9,114,649) | (4,981,957) |
| Net Increase (Decrease) from Capital Share Transactions | 126,638 | 3,794,461 |
| Total Increase (Decrease) | (794,396) | 5,702,978 |
| Net Assets | ||
| Beginning of Period | 27,487,635 | 21,784,657 |
| End of Period2 | 26,693,239 | 27,487,635 |
1 Includes fiscal 2015 and 2014 short-term gain distributions totaling $36,581,000 and $3,440,000, respectively. Short-term gain distributions are treated as ordinary income dividends for tax purposes.
2 Net Assets—End of Period includes undistributed (overdistributed) net investment income of $389,519,000 and $371,798,000.
See accompanying Notes, which are an integral part of the Financial Statements.
49
| Target Retirement 2020 Fund | |||||
| Financial Highlights | |||||
| For a Share Outstanding | Year Ended September 30, | ||||
| Throughout Each Period | 2015 | 2014 | 2013 | 2012 | 2011 |
| Net Asset Value, Beginning of Period | $28.40 | $26.26 | $24.04 | $20.83 | $21.17 |
| Investment Operations | |||||
| Net Investment Income | . 622 | . 577 | .528 | .569 | . 4731 |
| Capital Gain Distributions Received | .026 | .004 | .047 | .079 | .0441 |
| Net Realized and Unrealized Gain (Loss) | |||||
| on Investments | (.946) | 2.054 | 2.179 | 3.106 | (.378) |
| Total from Investment Operations | (.298) | 2.635 | 2.754 | 3.754 | .139 |
| Distributions | |||||
| Dividends from Net Investment Income | (.541) | (.484) | (.508) | (. 513) | (. 444) |
| Distributions from Realized Capital Gains | (.041) | (. 011) | (. 026) | (. 031) | (. 035) |
| Total Distributions | (.582) | (. 495) | (.534) | (.544) | (.479) |
| Net Asset Value, End of Period | $27.52 | $28.40 | $26.26 | $24.04 | $20.83 |
| Total Return2 | -1.13% | 10.13% | 11.70% | 18.30% | 0.53% |
| Ratios/Supplemental Data | |||||
| Net Assets, End of Period (Millions) | $26,693 | $27,488 | $21,785 | $16,078 | $11,032 |
| Ratio of Total Expenses to Average Net Assets | — | — | — | — | — |
| Acquired Fund Fees and Expenses | 0.14% | 0.16% | 0.16% | 0.16% | 0.17% |
| Ratio of Net Investment Income to | |||||
| Average Net Assets | 2.07% | 2.14% | 2.23% | 2.62% | 2.11% |
| Portfolio Turnover Rate | 25% | 7% | 17% | 8% | 23%3 |
1 Calculated based on average shares outstanding.
2 Total returns do not include account service fees that may have applied in the periods shown. Fund prospectuses provide information about any applicable account service fees.
3 Excludes the value of mutual fund shares delivered and received in connection with a change in the fund’s international equity investments from Vanguard European, Pacific, and Emerging Markets Stock Index Funds to Vanguard Total International Stock Index Fund because those transactions were effected in kind and did not cause the fund to incur transaction costs.
See accompanying Notes, which are an integral part of the Financial Statements.
50
Target Retirement 2020 Fund
Notes to Financial Statements
Vanguard Target Retirement 2020 Fund is registered under the Investment Company Act of 1940 as an open-end investment company, or mutual fund. The fund follows a balanced investment strategy by investing in selected Vanguard funds to achieve its targeted allocation of assets to U.S. and international stocks, and U.S. and international bonds. Financial statements and other information about each underlying fund are available on vanguard.com.
A. The following significant accounting policies conform to generally accepted accounting principles for U.S. investment companies. The fund consistently follows such policies in preparing its financial statements.
1. Security Valuation: Investments are valued at the net asset value of each underlying Vanguard fund determined as of the close of the New York Stock Exchange (generally 4 p.m., Eastern time) on the valuation date.
2. Federal Income Taxes: The fund intends to continue to qualify as a regulated investment company and distribute all of its taxable income. Management has analyzed the fund’s tax positions taken for all open federal income tax years (September 30, 2012–2015), and has concluded that no provision for federal income tax is required in the fund’s financial statements.
3. Distributions: Distributions to shareholders are recorded on the ex-dividend date.
4. Credit Facility: The fund and certain other funds managed by The Vanguard Group (“Vanguard”) participate in a $3 billion committed credit facility provided by a syndicate of lenders pursuant to a credit agreement that may be renewed annually; each fund is individually liable for its borrowings, if any, under the credit facility. Borrowings may be utilized for temporary and emergency purposes, and are subject to the fund’s regulatory and contractual borrowing restrictions. The participating funds are charged administrative fees and an annual commitment fee of 0.06% of the undrawn amount of the facility; these fees are allocated to the funds based on a method approved by the fund’s board of trustees and borne by the funds in which the fund invests (see Note B). Any borrowings under this facility bear interest at a rate equal to the higher of the federal funds rate or LIBOR reference rate plus an agreed-upon spread.
The fund had no borrowings outstanding at September 30, 2015, or at any time during the period then ended.
5. Other: Income and capital gain distributions received are recorded on the ex-dividend date. Security transactions are accounted for on the date securities are bought or sold. Costs used to determine realized gains (losses) on the sale of investment securities are those of the specific securities sold.
B. In accordance with the terms of a Funds’ Service Agreement (the “FSA”) between Vanguard and the fund, Vanguard furnishes to the fund investment advisory, corporate management, administrative, marketing, and distribution services at Vanguard’s cost of operations (as defined by the FSA). These costs of operations are allocated to the fund based on methods and guidelines approved by the board of trustees. The FSA provides that expenses otherwise allocable to Vanguard funds-of-funds may be reduced or eliminated to the extent of savings realized by the underlying Vanguard funds by virtue of being part of a fund-of-funds. Accordingly, all expenses for services provided by Vanguard to the fund and all other expenses incurred by the fund during the year ended September 30, 2015, were borne by the underlying Vanguard funds in which the fund invests. The fund’s trustees and officers are also trustees and officers, respectively, of the underlying Vanguard funds, as well as directors and employees, respectively, of Vanguard.
51
Target Retirement 2020 Fund
C. Various inputs may be used to determine the value of the fund’s investments. These inputs are summarized in three broad levels for financial statement purposes. The inputs or methodologies used to value securities are not necessarily an indication of the risk associated with investing in those securities.
Level 1—Quoted prices in active markets for identical securities.
Level 2—Other significant observable inputs (including quoted prices for similar securities, interest rates, prepayment speeds, credit risk, etc.).
Level 3—Significant unobservable inputs (including the fund’s own assumptions used to determine the fair value of investments).
At September 30, 2015, 100% of the market value of the fund’s investments was determined based on Level 1 inputs.
D. Distributions are determined on a tax basis and may differ from net investment income and realized capital gains for financial reporting purposes. Differences may be permanent or temporary. Permanent differences are reclassified among capital accounts in the financial statements to reflect their tax character. Temporary differences arise when certain items of income, expense, gain, or loss are recognized in different periods for financial statement and tax purposes. These differences will reverse at some time in the future. Differences in classification may also result from the treatment of short-term gains as ordinary income for tax purposes.
The fund used a tax accounting practice to treat a portion of the price of capital shares redeemed during the year as distributions from net investment income and realized capital gains. Accordingly, the fund has reclassified $61,399,000 from undistributed net investment income, and $55,787,000 from accumulated net realized gains, to paid-in capital.
For tax purposes, at September 30, 2015, the fund had $436,194,000 of ordinary income and $357,067,000 of long-term capital gains available for distribution.
At September 30, 2015, the cost of investment securities for tax purposes was $23,127,571,000. Net unrealized appreciation of investment securities for tax purposes was $3,561,198,000, consisting of unrealized gains of $4,136,401,000 on securities that had risen in value since their purchase and $575,203,000 in unrealized losses on securities that had fallen in value since their purchase.
E. During the year ended September 30, 2015, the fund purchased $7,500,954,000 of investment securities and sold $7,291,277,000 of investment securities, other than temporary cash investments.
| F. | Capital shares issued and redeemed were: |
| Year Ended September 30, | ||
| 2015 | 2014 | |
| Shares | Shares | |
| (000) | (000) | |
| Issued | 300,789 | 302,759 |
| Issued in Lieu of Cash Distributions | 19,693 | 15,522 |
| Redeemed | (318,675) | (179,980) |
| Net Increase (Decrease) in Shares Outstanding | 1,807 | 138,301 |
52
Target Retirement 2020 Fund
| G. Transactions during the period in affiliated underlying Vanguard funds were as follows: | ||||||
| Current Period Transactions | ||||||
| Sept. 30, | Proceeds | Sept. 30, | ||||
| 2014 | from | Capital Gain | 2015 | |||
| Market | Purchases | Securities | Distributions | Market | ||
| Value | at Cost | Sold1 | Income | Received | Value | |
| ($000) | ($000) | ($000) | ($000) | ($000) | ($000) | |
| Vanguard Market Liquidity Fund | 12,218 | NA 2 | NA 2 | 19 | — | 3,128 |
| Vanguard Short-Term Inflation- | ||||||
| Protected Securities Fund | — | 135,024 | 12,472 | — | — | 121,747 |
| Vanguard Total Bond Market II | ||||||
| Index Fund | 8,633,402 | 1,678,249 | 2,818,509 | 202,798 | 27,179 | 7,500,945 |
| Vanguard Total International | ||||||
| Bond Index Fund | 2,156,344 | 1,595,183 | 576,585 | 40,140 | — | 3,197,336 |
| Vanguard Total International | ||||||
| Stock Index Fund | 4,855,061 | 2,718,704 | 369,761 | 156,471 | — | 6,286,631 |
| Vanguard Total Stock Market | ||||||
| Index Fund | 11,817,952 | 1,283,660 | 3,424,998 | 214,438 | — | 9,578,982 |
| Total | 27,474,977 | 7,410,820 | 7,202,325 | 613,866 | 27,179 | 26,688,769 |
| 1 Includes net realized gain (loss) on affiliated investment securities sold of $412,278,000. | ||||||
| 2 Not applicable—purchases and sales are for temporary cash investment purposes. | ||||||
H. Management has determined that no material events or transactions occurred subsequent to September 30, 2015, that would require recognition or disclosure in these financial statements.
53
Target Retirement 2025 Fund
Fund Profile
As of September 30, 2015
| Total Fund Characteristics | |
| Ticker Symbol | VTTVX |
| 30-Day SEC Yield | 2.23% |
| Acquired Fund Fees and Expenses1 | 0.17% |
| Allocation to Underlying Vanguard Funds | |
| Vanguard Total Stock Market Index Fund | |
| Investor Shares | 40.1% |
| Vanguard Total International Stock Index | |
| Fund Investor Shares | 26.7 |
| Vanguard Total Bond Market II Index Fund | |
| Investor Shares | 23.3 |
| Vanguard Total International Bond Index | |
| Fund Investor Shares | 9.9 |
| Total Fund Volatility Measures | ||
| Target 2025 | MSCI US | |
| Composite | Broad Market | |
| Index | Index | |
| R-Squared | 1.00 | 0.92 |
| Beta | 1.01 | 0.66 |
These measures show the degree and timing of the fund’s fluctuations compared with the indexes over 36 months.
Fund Asset Allocation
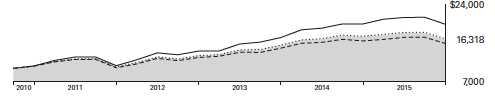
1 This figure—drawn from the prospectus dated January 27, 2015—represents an estimate of the weighted average of the expense ratios and any transaction fees charged by the underlying mutual funds (the ”acquired” funds) in which the Target Retirement 2025 Fund invests. The fund does not charge any expenses or fees of its own. For the fiscal year ended September 30, 2015, the acquired fund fees and expenses were 0.15%.
54
Target Retirement 2025 Fund
Performance Summary
All of the returns in this report represent past performance, which is not a guarantee of future results that may be achieved by the fund. (Current performance may be lower or higher than the performance data cited. For performance data current to the most recent month-end, visit our website at vanguard.com/performance.) Note, too, that both investment returns and principal value can fluctuate widely, so an investor’s shares, when sold, could be worth more or less than their original cost. The returns shown do not reflect taxes that a shareholder would pay on fund distributions or on the sale of fund shares.
Cumulative Performance: September 30, 2005, Through September 30, 2015
Initial Investment of $10,000

| Average Annual Total Returns | |||||
| Periods Ended September 30, 2015 | |||||
| Final Value | |||||
| One | Five | Ten | of a $10,000 | ||
| Year | Years | Years | Investment | ||
| Target Retirement 2025 Fund | -1.60% | 8.16% | 5.41% | $16,943 | |
| •••••••• | Target 2025 Composite Index | -1.61 | 8.35 | 5.52 | 17,119 |
| – – – – | Mixed-Asset Target 2025 Funds | ||||
| -2.53 | 6.74 | 4.51 | 15,547 | ||
| MSCI Average US Broad Market Index | -0.41 | 13.37 | 7.12 | 19,902 | |
| For a benchmark description, see the Glossary. | |||||
| Mixed-Asset Target 2025 Funds Average: Derived from data provided by Lipper, a Thomson Reuters Company. | |||||
See Financial Highlights for dividend and capital gains information.
55
Target Retirement 2025 Fund
Fiscal-Year Total Returns (%): September 30, 2005, Through September 30, 2015
56
Target Retirement 2025 Fund
Financial Statements
Statement of Net Assets
As of September 30, 2015
The fund reports a complete list of its holdings in regulatory filings four times in each fiscal year, at the quarter-ends. For the second and fourth fiscal quarters, the lists appear in the fund’s semiannual and annual reports to shareholders. For the first and third fiscal quarters, the fund files the lists with the Securities and Exchange Commission on Form N-Q. Shareholders can look up the fund’s Forms N-Q on the SEC’s website at sec.gov. Forms N-Q may also be reviewed and copied at the SEC’s Public Reference Room (see the back cover of this report for further information).
| Market | ||
| Value• | ||
| Shares | ($000) | |
| Investment Companies (100.0%) | ||
| U.S. Stock Fund (40.1%) | ||
| Vanguard Total Stock Market Index Fund Investor Shares | 250,838,720 | 12,055,309 |
| International Stock Fund (26.7%) | ||
| Vanguard Total International Stock Index Fund Investor Shares | 564,969,389 | 8,033,865 |
| U.S. Bond Fund (23.3%) | ||
| 1 Vanguard Total Bond Market II Index Fund Investor Shares | 649,865,670 | 6,992,554 |
| International Bond Fund (9.9%) | ||
| Vanguard Total International Bond Index Fund Investor Shares | 280,961,185 | 2,969,760 |
| Total Investment Companies (Cost $25,238,261) | 30,051,488 | |
| Temporary Cash Investment (0.0%) | ||
| Money Market Fund (0.0%) | ||
| 1 Vanguard Market Liquidity Fund, 0.189% (Cost $6,905) | 6,905,000 | 6,905 |
| Total Investments (100.0%) (Cost $25,245,166) | 30,058,393 | |
| Amount | ||
| ($000) | ||
| Other Assets and Liabilities (0.0%) | ||
| Other Assets | ||
| Receivables for Investment Securities Sold | 277,221 | |
| Receivables for Accrued Income | 17,457 | |
| Receivables for Capital Shares Issued | 19,690 | |
| Total Other Assets | 314,368 | |
| Liabilities | ||
| Payables for Investment Securities Purchased | (17,456) | |
| Payables for Capital Shares Redeemed | (307,766) | |
| Total Liabilities | (325,222) | |
| Net Assets (100%) | ||
| Applicable to 1,889,898,728 outstanding $.001 par value shares of | ||
| beneficial interest (unlimited authorization) | 30,047,539 | |
| Net Asset Value Per Share | $15.90 | |
57
| Target Retirement 2025 Fund | |
| At September 30, 2015, net assets consisted of: | |
| Amount | |
| ($000) | |
| Paid-in Capital | 24,131,956 |
| Undistributed Net Investment Income | 438,883 |
| Accumulated Net Realized Gains | 663,473 |
| Unrealized Appreciation (Depreciation) | 4,813,227 |
| Net Assets | 30,047,539 |
- See Note A in Notes to Financial Statements.
- Affiliated fund available only to Vanguard funds and certain trusts and accounts managed by Vanguard. Rate shown for Vanguard Market Liquidity Fund is the 7-day yield.
See accompanying Notes, which are an integral part of the Financial Statements.
58
| Target Retirement 2025 Fund | |
| Statement of Operations | |
| Year Ended | |
| September 30, 2015 | |
| ($000) | |
| Investment Income | |
| Income | |
| Income Distributions Received | 694,167 |
| Other Income | 137 |
| Net Investment Income—Note B | 694,304 |
| Realized Net Gain (Loss) | |
| Capital Gain Distributions Received | 24,900 |
| Investment Securities Sold | 739,720 |
| Realized Net Gain (Loss) | 764,620 |
| Change in Unrealized Appreciation (Depreciation) of Investment Securities | (1,996,620) |
| Net Increase (Decrease) in Net Assets Resulting from Operations | (537,696) |
See accompanying Notes, which are an integral part of the Financial Statements.
59
| Target Retirement 2025 Fund | ||
| Statement of Changes in Net Assets | ||
| Year Ended September 30, | ||
| 2015 | 2014 | |
| ($000) | ($000) | |
| Increase (Decrease) in Net Assets | ||
| Operations | ||
| Net Investment Income | 694,304 | 629,366 |
| Realized Net Gain (Loss) | 764,620 | 45,843 |
| Change in Unrealized Appreciation (Depreciation) | (1,996,620) | 2,213,724 |
| Net Increase (Decrease) in Net Assets Resulting from Operations | (537,696) | 2,888,933 |
| Distributions | ||
| Net Investment Income | (619,150) | (498,818) |
| Realized Capital Gain1 | (57,685) | (29,547) |
| Total Distributions | (676,835) | (528,365) |
| Capital Share Transactions | ||
| Issued | 8,666,183 | 7,966,985 |
| Issued in Lieu of Cash Distributions | 664,059 | 520,247 |
| Redeemed | (9,496,257) | (5,061,387) |
| Net Increase (Decrease) from Capital Share Transactions | (166,015) | 3,425,845 |
| Total Increase (Decrease) | (1,380,546) | 5,786,413 |
| Net Assets | ||
| Beginning of Period | 31,428,085 | 25,641,672 |
| End of Period2 | 30,047,539 | 31,428,085 |
1 Includes fiscal 2015 and 2014 short-term gain distributions totaling $40,379,000 and $29,547,000. Short-term gain distributions are treated as ordinary income dividends for tax purposes.
2 Net Assets—End of Period includes undistributed (overdistributed) net investment income of $438,883,000 and $432,569,000.
See accompanying Notes, which are an integral part of the Financial Statements.
60
| Target Retirement 2025 Fund | |||||
| Financial Highlights | |||||
| For a Share Outstanding | Year Ended September 30, | ||||
| Throughout Each Period | 2015 | 2014 | 2013 | 2012 | 2011 |
| Net Asset Value, Beginning of Period | $16.50 | $15.18 | $13.70 | $11.71 | $11.97 |
| Investment Operations | |||||
| Net Investment Income | . 364 | .350 | .316 | .331 | .2571 |
| Capital Gain Distributions Received | .012 | .002 | .021 | .036 | .0201 |
| Net Realized and Unrealized Gain (Loss) | |||||
| on Investments | (. 624) | 1.272 | 1.451 | 1.927 | (. 271) |
| Total from Investment Operations | (.248) | 1.624 | 1.788 | 2.294 | .006 |
| Distributions | |||||
| Dividends from Net Investment Income | (.322) | (.287) | (. 296) | (. 291) | (. 250) |
| Distributions from Realized Capital Gains | (.030) | (.017) | (. 012) | (. 013) | (. 016) |
| Total Distributions | (.352) | (.304) | (.308) | (.304) | (.266) |
| Net Asset Value, End of Period | $15.90 | $16.50 | $15.18 | $13.70 | $11.71 |
| Total Return2 | -1.60% | 10.80% | 13.34% | 19.89% | -0.11% |
| Ratios/Supplemental Data | |||||
| Net Assets, End of Period (Millions) | $30,048 | $31,428 | $25,642 | $20,022 | $14,997 |
| Ratio of Total Expenses to Average Net Assets | — | — | — | — | — |
| Acquired Fund Fees and Expenses | 0.15% | 0.17% | 0.17% | 0.17% | 0.18% |
| Ratio of Net Investment Income to | |||||
| Average Net Assets | 2.07% | 2.15% | 2.27% | 2.64% | 2.01% |
| Portfolio Turnover Rate | 24% | 7% | 16% | 9% | 23%3 |
1 Calculated based on average shares outstanding.
2 Total returns do not include account service fees that may have applied in the periods shown. Fund prospectuses provide information about any applicable account service fees.
3 Excludes the value of mutual fund shares delivered and received in connection with a change in the fund’s international equity investments from Vanguard European, Pacific, and Emerging Markets Stock Index Funds to Vanguard Total International Stock Index Fund because those transactions were effected in kind and did not cause the fund to incur transaction costs.
See accompanying Notes, which are an integral part of the Financial Statements.
61
Target Retirement 2025 Fund
Notes to Financial Statements
Vanguard Target Retirement 2025 Fund is registered under the Investment Company Act of 1940 as an open-end investment company, or mutual fund. The fund follows a balanced investment strategy by investing in selected Vanguard funds to achieve its targeted allocation of assets to U.S. and international stocks, and U.S. and international bonds. Financial statements and other information about each underlying fund are available on vanguard.com.
A. The following significant accounting policies conform to generally accepted accounting principles for U.S. investment companies. The fund consistently follows such policies in preparing its financial statements.
1. Security Valuation: Investments are valued at the net asset value of each underlying Vanguard fund determined as of the close of the New York Stock Exchange (generally 4 p.m., Eastern time) on the valuation date.
2. Federal Income Taxes: The fund intends to continue to qualify as a regulated investment company and distribute all of its taxable income. Management has analyzed the fund’s tax positions taken for all open federal income tax years (September 30, 2012–2015), and has concluded that no provision for federal income tax is required in the fund’s financial statements.
3. Distributions: Distributions to shareholders are recorded on the ex-dividend date.
4. Credit Facility: The fund and certain other funds managed by The Vanguard Group (“Vanguard”) participate in a $3 billion committed credit facility provided by a syndicate of lenders pursuant to a credit agreement that may be renewed annually; each fund is individually liable for its borrowings, if any, under the credit facility. Borrowings may be utilized for temporary and emergency purposes, and are subject to the fund’s regulatory and contractual borrowing restrictions. The participating funds are charged administrative fees and an annual commitment fee of 0.06% of the undrawn amount of the facility; these fees are allocated to the funds based on a method approved by the fund’s board of trustees and borne by the funds in which the fund invests (see Note B). Any borrowings under this facility bear interest at a rate equal to the higher of the federal funds rate or LIBOR reference rate plus an agreed-upon spread.
The fund had no borrowings outstanding at September 30, 2015, or at any time during the period then ended.
5. Other: Income and capital gain distributions received are recorded on the ex-dividend date. Security transactions are accounted for on the date securities are bought or sold. Costs used to determine realized gains (losses) on the sale of investment securities are those of the specific securities sold.
B. In accordance with the terms of a Funds’ Service Agreement (the “FSA”) between Vanguard and the fund, Vanguard furnishes to the fund investment advisory, corporate management, administrative, marketing, and distribution services at Vanguard’s cost of operations (as defined by the FSA). These costs of operations are allocated to the fund based on methods and guidelines approved by the board of trustees. The FSA provides that expenses otherwise allocable to Vanguard funds-of-funds may be reduced or eliminated to the extent of savings realized by the underlying Vanguard funds by virtue of being part of a fund-of-funds. Accordingly, all expenses for services provided by Vanguard to the fund and all other expenses incurred by the fund during the year ended September 30, 2015, were borne by the underlying Vanguard funds in which the fund invests. The fund’s trustees and officers are also trustees and officers, respectively, of the underlying Vanguard funds, as well as directors and employees, respectively, of Vanguard.
62
Target Retirement 2025 Fund
C. Various inputs may be used to determine the value of the fund’s investments. These inputs are summarized in three broad levels for financial statement purposes. The inputs or methodologies used to value securities are not necessarily an indication of the risk associated with investing in those securities.
Level 1—Quoted prices in active markets for identical securities.
Level 2—Other significant observable inputs (including quoted prices for similar securities, interest rates, prepayment speeds, credit risk, etc.).
Level 3—Significant unobservable inputs (including the fund’s own assumptions used to determine the fair value of investments).
At September 30, 2015, 100% of the market value of the fund’s investments was determined based on Level 1 inputs.
D. Distributions are determined on a tax basis and may differ from net investment income and realized capital gains for financial reporting purposes. Differences may be permanent or temporary. Permanent differences are reclassified among capital accounts in the financial statements to reflect their tax character. Temporary differences arise when certain items of income, expense, gain, or loss are recognized in different periods for financial statement and tax purposes. These differences will reverse at some time in the future. Differences in classification may also result from the treatment of short-term gains as ordinary income for tax purposes.
The fund used a tax accounting practice to treat a portion of the price of capital shares redeemed during the year as distributions from net investment income and realized capital gains. Accordingly, the fund has reclassified $68,840,000 from undistributed net investment income, and $79,370,000 from accumulated net realized gains, to paid-in capital.
For tax purposes, at September 30, 2015, the fund had $506,962,000 of ordinary income and $654,824,000 of long-term capital gains available for distribution.
At September 30, 2015, the cost of investment securities for tax purposes was $25,304,596,000. Net unrealized appreciation of investment securities for tax purposes was $4,753,797,000, consisting of unrealized gains of $5,503,635,000 on securities that had risen in value since their purchase and $749,838,000 in unrealized losses on securities that had fallen in value since their purchase.
E. During the year ended September 30, 2015, the fund purchased $8,077,367,000 of investment securities and sold $8,177,901,000 of investment securities, other than temporary cash investments.
| F. | Capital shares issued and redeemed were: |
| Year Ended September 30, | ||
| 2015 | 2014 | |
| Shares | Shares | |
| (000) | (000) | |
| Issued | 516,906 | 496,821 |
| Issued in Lieu of Cash Distributions | 39,836 | 33,179 |
| Redeemed | (571,576) | (314,735) |
| Net Increase (Decrease) in Shares Outstanding | (14,834) | 215,265 |
63
Target Retirement 2025 Fund
| G. Transactions during the period in affiliated underlying Vanguard funds were as follows: | ||||||
| Current Period Transactions | ||||||
| Sept. 30, | Proceeds | Sept. 30, | ||||
| 2014 | from | Capital Gain | 2015 | |||
| Market | Purchases | Securities | Distributions | Market | ||
| Value | at Cost | Sold1 | Income | Received | Value | |
| ($000) | ($000) | ($000) | ($000) | ($000) | ($000) | |
| Vanguard Market Liquidity Fund | 7,412 | NA2 | NA 2 | 22 | — | 6,905 |
| Vanguard Total Bond Market II | ||||||
| Index Fund | 8,028,026 | 1,531,254 | 2,575,091 | 186,471 | 24,900 | 6,992,554 |
| Vanguard Total International | ||||||
| Bond Index Fund | 1,995,205 | 1,524,548 | 570,947 | 36,902 | — | 2,969,760 |
| Vanguard Total International | ||||||
| Stock Index Fund | 6,272,198 | 3,336,137 | 411,379 | 196,667 | — | 8,033,865 |
| Vanguard Total Stock Market | ||||||
| Index Fund | 15,113,492 | 1,591,698 | 4,527,982 | 274,105 | — | 12,055,309 |
| Total | 31,416,333 | 7,983,637 | 8,085,399 | 694,167 | 24,900 | 30,058,393 |
| 1 Includes net realized gain (loss) on affiliated investment securities sold of $740,948,000. | ||||||
| 2 Not applicable—purchases and sales are for temporary cash investment purposes. | ||||||
H. Management has determined that no material events or transactions occurred subsequent to September 30, 2015, that would require recognition or disclosure in these financial statements.
64
Target Retirement 2030 Fund
Fund Profile
As of September 30, 2015
| Total Fund Characteristics | |
| Ticker Symbol | VTHRX |
| 30-Day SEC Yield | 2.26% |
| Acquired Fund Fees and Expenses1 | 0.17% |
| Allocation to Underlying Vanguard Funds | |
| Vanguard Total Stock Market Index Fund | |
| Investor Shares | 44.6% |
| Vanguard Total International Stock Index | |
| Fund Investor Shares | 29.8 |
| Vanguard Total Bond Market II Index Fund | |
| Investor Shares | 18.0 |
| Vanguard Total International Bond Index | |
| Fund Investor Shares | 7.6 |
| Total Fund Volatility Measures | ||
| Target 2030 | MSCI US | |
| Composite | Broad Market | |
| Index | Index | |
| R-Squared | 1.00 | 0.93 |
| Beta | 1.00 | 0.73 |
These measures show the degree and timing of the fund’s fluctuations compared with the indexes over 36 months.
Fund Asset Allocation
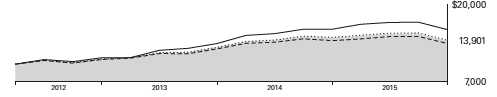
1 This figure—drawn from the prospectus dated January 27, 2015—represents an estimate of the weighted average of the expense ratios and any transaction fees charged by the underlying mutual funds (the ”acquired” funds) in which the Target Retirement 2030 Fund invests. The fund does not charge any expenses or fees of its own. For the fiscal year ended September 30, 2015, the acquired fund fees and expenses were 0.15%.
65
Target Retirement 2030 Fund
Performance Summary
All of the returns in this report represent past performance, which is not a guarantee of future results that may be achieved by the fund. (Current performance may be lower or higher than the performance data cited. For performance data current to the most recent month-end, visit our website at vanguard.com/performance.) Note, too, that both investment returns and principal value can fluctuate widely, so an investor’s shares, when sold, could be worth more or less than their original cost. The returns shown do not reflect taxes that a shareholder would pay on fund distributions or on the sale of fund shares.
Cumulative Performance: June 7, 2006, Through September 30, 2015
Initial Investment of $10,000

| Average Annual Total Returns | |||||
| Periods Ended September 30, 2015 | |||||
| Since | Final Value | ||||
| One | Five | Inception | of a $10,000 | ||
| Year | Years | (6/7/2006) | Investment | ||
| Target Retirement 2030 Fund | -2.16% | 8.61% | 5.56% | $16,554 | |
| •••••••• | Target 2030 Composite Index | -2.17 | 8.82 | 5.68 | 16,736 |
| – – – – | Mixed-Asset Target 2030 Funds | ||||
| -3.07 | 6.97 | 4.26 | 14,750 | ||
| MSCI Average US Broad Market Index | -0.41 | 13.37 | 7.20 | 19,108 | |
| For a benchmark description, see the Glossary. | |||||
| Mixed-Asset Target 2030 Funds Average: Derived from data provided by Lipper, a Thomson Reuters Company. | |||||
| "Since Inception" performance is calculated from the inception date for both the fund and its comparative standards. | |||||
See Financial Highlights for dividend and capital gains information.
66
Target Retirement 2030 Fund
Fiscal-Year Total Returns (%): June 7, 2006, Through September 30, 2015

67
Target Retirement 2030 Fund
Financial Statements
Statement of Net Assets
As of September 30, 2015
The fund reports a complete list of its holdings in regulatory filings four times in each fiscal year, at the quarter-ends. For the second and fourth fiscal quarters, the lists appear in the fund’s semiannual and annual reports to shareholders. For the first and third fiscal quarters, the fund files the lists with the Securities and Exchange Commission on Form N-Q. Shareholders can look up the fund’s Forms N-Q on the SEC’s website at sec.gov. Forms N-Q may also be reviewed and copied at the SEC’s Public Reference Room (see the back cover of this report for further information).
| Market | ||
| Value• | ||
| Shares | ($000) | |
| Investment Companies (100.0%) | ||
| U.S. Stock Fund (44.6%) | ||
| Vanguard Total Stock Market Index Fund Investor Shares | 210,575,806 | 10,120,273 |
| International Stock Fund (29.8%) | ||
| Vanguard Total International Stock Index Fund Investor Shares | 474,421,579 | 6,746,275 |
| U.S. Bond Fund (18.0%) | ||
| 1 Vanguard Total Bond Market II Index Fund Investor Shares | 379,099,295 | 4,079,108 |
| International Bond Fund (7.6%) | ||
| Vanguard Total International Bond Index Fund Investor Shares | 163,606,616 | 1,729,322 |
| Total Investment Companies (Cost $19,196,024) | 22,674,978 | |
| Amount | ||
| ($000) | ||
| Other Assets and Liabilities (0.0%) | ||
| Other Assets | ||
| Receivables for Investment Securities Sold | 191,423 | |
| Receivables for Accrued Income | 10,235 | |
| Receivables for Capital Shares Issued | 27,201 | |
| Total Other Assets | 228,859 | |
| Liabilities | ||
| Payables for Investment Securities Purchased | (10,224) | |
| Payables for Capital Shares Redeemed | (207,883) | |
| Other Liabilities | (1,416) | |
| Total Liabilities | (219,523) | |
| Net Assets (100%) | ||
| Applicable to 816,933,537 outstanding $.001 par value shares of | ||
| beneficial interest (unlimited authorization) | 22,684,314 | |
| Net Asset Value Per Share | $27.77 | |
68
| Target Retirement 2030 Fund | |
| At September 30, 2015, net assets consisted of: | |
| Amount | |
| ($000) | |
| Paid-in Capital | 18,637,579 |
| Undistributed Net Investment Income | 331,281 |
| Accumulated Net Realized Gains | 236,500 |
| Unrealized Appreciation (Depreciation) | 3,478,954 |
| Net Assets | 22,684,314 |
- See Note A in Notes to Financial Statements.
- Affiliated fund available only to Vanguard funds and certain trusts and accounts managed by Vanguard. See accompanying Notes, which are an integral part of the Financial Statements.
69
| Target Retirement 2030 Fund | |
| Statement of Operations | |
| Year Ended | |
| September 30, 2015 | |
| ($000) | |
| Investment Income | |
| Income | |
| Income Distributions Received | 521,667 |
| Other Income | 177 |
| Net Investment Income—Note B | 521,844 |
| Realized Net Gain (Loss) | |
| Capital Gain Distributions Received | 14,077 |
| Investment Securities Sold | 271,180 |
| Realized Net Gain (Loss) | 285,257 |
| Change in Unrealized Appreciation (Depreciation) of Investment Securities | (1,391,581) |
| Net Increase (Decrease) in Net Assets Resulting from Operations | (584,480) |
See accompanying Notes, which are an integral part of the Financial Statements.
70
| Target Retirement 2030 Fund | ||
| Statement of Changes in Net Assets | ||
| Year Ended September 30, | ||
| 2015 | 2014 | |
| ($000) | ($000) | |
| Increase (Decrease) in Net Assets | ||
| Operations | ||
| Net Investment Income | 521,844 | 454,233 |
| Realized Net Gain (Loss) | 285,257 | 18,970 |
| Change in Unrealized Appreciation (Depreciation) | (1,391,581) | 1,691,511 |
| Net Increase (Decrease) in Net Assets Resulting from Operations | (584,480) | 2,164,714 |
| Distributions | ||
| Net Investment Income | (452,597) | (343,337) |
| Realized Capital Gain1 | (23,522) | (25,173) |
| Total Distributions | (476,119) | (368,510) |
| Capital Share Transactions | ||
| Issued | 7,676,431 | 6,870,930 |
| Issued in Lieu of Cash Distributions | 466,220 | 361,941 |
| Redeemed | (7,482,627) | (3,738,811) |
| Net Increase (Decrease) from Capital Share Transactions | 660,024 | 3,494,060 |
| Total Increase (Decrease) | (400,575) | 5,290,264 |
| Net Assets | ||
| Beginning of Period | 23,084,889 | 17,794,625 |
| End of Period2 | 22,684,314 | 23,084,889 |
1 Includes fiscal 2015 and 2014 short-term gain distributions totaling $21,900,000 and $23,076,000, respectively. Short-term gain distributions are treated as ordinary income dividends for tax purposes.
2 Net Assets—End of Period includes undistributed (overdistributed) net investment income of $331,281,000 and $314,218,000.
See accompanying Notes, which are an integral part of the Financial Statements.
71
| Target Retirement 2030 Fund | |||||
| Financial Highlights | |||||
| For a Share Outstanding | Year Ended September 30, | ||||
| Throughout Each Period | 2015 | 2014 | 2013 | 2012 | 2011 |
| Net Asset Value, Beginning of Period | $28.95 | $26.46 | $23.51 | $19.81 | $20.36 |
| Investment Operations | |||||
| Net Investment Income | . 633 | . 613 | . 540 | .561 | .398 |
| Capital Gain Distributions Received | .016 | .002 | .027 | .044 | .011 |
| Net Realized and Unrealized Gain (Loss) | |||||
| on Investments | (1.242) | 2.402 | 2.897 | 3.580 | (.542) |
| Total from Investment Operations | (.593) | 3.017 | 3.464 | 4.185 | (.133) |
| Distributions | |||||
| Dividends from Net Investment Income | (.558) | (.491) | (. 499) | (.468) | (.395) |
| Distributions from Realized Capital Gains | (. 029) | (. 036) | (. 015) | (. 017) | (.022) |
| Total Distributions | (.587) | (.527) | (.514) | (.485) | (. 417) |
| Net Asset Value, End of Period | $27.77 | $28.95 | $26.46 | $23.51 | $19.81 |
| Total Return1 | -2.16% | 11.51% | 15.05% | 21.43% | -0.83% |
| Ratios/Supplemental Data | |||||
| Net Assets, End of Period (Millions) | $22,684 | $23,085 | $17,795 | $12,647 | $8,245 |
| Ratio of Total Expenses to Average Net Assets | — | — | — | — | — |
| Acquired Fund Fees and Expenses | 0.15% | 0.17% | 0.17% | 0.17% | 0.18% |
| Ratio of Net Investment Income to | |||||
| Average Net Assets | 2.08% | 2.16% | 2.30% | 2.66% | 1.91% |
| Portfolio Turnover Rate | 24% | 7% | 14% | 4% | 19%2 |
1 Total returns do not include account service fees that may have applied in the periods shown. Fund prospectuses provide information about any applicable account service fees.
2 Excludes the value of mutual fund shares delivered and received in connection with a change in the fund’s international equity investments from Vanguard European, Pacific, and Emerging Markets Stock Index Funds to Vanguard Total International Stock Index Fund because those transactions were effected in kind and did not cause the fund to incur transaction costs.
See accompanying Notes, which are an integral part of the Financial Statements.
72
Target Retirement 2030 Fund
Notes to Financial Statements
Vanguard Target Retirement 2030 Fund is registered under the Investment Company Act of 1940 as an open-end investment company, or mutual fund. The fund follows a balanced investment strategy by investing in selected Vanguard funds to achieve its targeted allocation of assets to U.S. and international stocks, and U.S. and international bonds. Financial statements and other information about each underlying fund are available on vanguard.com.
A. The following significant accounting policies conform to generally accepted accounting principles for U.S. investment companies. The fund consistently follows such policies in preparing its financial statements.
1. Security Valuation: Investments are valued at the net asset value of each underlying Vanguard fund determined as of the close of the New York Stock Exchange (generally 4 p.m., Eastern time) on the valuation date.
2. Federal Income Taxes: The fund intends to continue to qualify as a regulated investment company and distribute all of its taxable income. Management has analyzed the fund’s tax positions taken for all open federal income tax years (September 30, 2012–2015), and has concluded that no provision for federal income tax is required in the fund’s financial statements.
3. Distributions: Distributions to shareholders are recorded on the ex-dividend date.
4. Credit Facility: The fund and certain other funds managed by The Vanguard Group (“Vanguard”) participate in a $3 billion committed credit facility provided by a syndicate of lenders pursuant to a credit agreement that may be renewed annually; each fund is individually liable for its borrowings, if any, under the credit facility. Borrowings may be utilized for temporary and emergency purposes, and are subject to the fund’s regulatory and contractual borrowing restrictions. The participating funds are charged administrative fees and an annual commitment fee of 0.06% of the undrawn amount of the facility; these fees are allocated to the funds based on a method approved by the fund’s board of trustees and borne by the funds in which the fund invests (see Note B). Any borrowings under this facility bear interest at a rate equal to the higher of the federal funds rate or LIBOR reference rate plus an agreed-upon spread.
The fund had no borrowings outstanding at September 30, 2015, or at any time during the period then ended.
5. Other: Income and capital gain distributions received are recorded on the ex-dividend date. Security transactions are accounted for on the date securities are bought or sold. Costs used to determine realized gains (losses) on the sale of investment securities are those of the specific securities sold.
B. In accordance with the terms of a Funds’ Service Agreement (the “FSA”) between Vanguard and the fund, Vanguard furnishes to the fund investment advisory, corporate management, administrative, marketing, and distribution services at Vanguard’s cost of operations (as defined by the FSA). These costs of operations are allocated to the fund based on methods and guidelines approved by the board of trustees. The FSA provides that expenses otherwise allocable to Vanguard funds-of-funds may be reduced or eliminated to the extent of savings realized by the underlying Vanguard funds by virtue of being part of a fund-of-funds. Accordingly, all expenses for services provided by Vanguard to the fund and all other expenses incurred by the fund during the year ended September 30, 2015, were borne by the underlying Vanguard funds in which the fund invests. The fund’s trustees and officers are also trustees and officers, respectively, of the underlying Vanguard funds, as well as directors and employees, respectively, of Vanguard.
73
Target Retirement 2030 Fund
C. Various inputs may be used to determine the value of the fund’s investments. These inputs are summarized in three broad levels for financial statement purposes. The inputs or methodologies used to value securities are not necessarily an indication of the risk associated with investing in those securities.
Level 1—Quoted prices in active markets for identical securities.
Level 2—Other significant observable inputs (including quoted prices for similar securities, interest rates, prepayment speeds, credit risk, etc.).
Level 3—Significant unobservable inputs (including the fund’s own assumptions used to determine the fair value of investments).
At September 30, 2015, 100% of the market value of the fund’s investments was determined based on Level 1 inputs.
D. Distributions are determined on a tax basis and may differ from net investment income and realized capital gains for financial reporting purposes. Differences may be permanent or temporary. Permanent differences are reclassified among capital accounts in the financial statements to reflect their tax character. Temporary differences arise when certain items of income, expense, gain, or loss are recognized in different periods for financial statement and tax purposes. These differences will reverse at some time in the future. Differences in classification may also result from the treatment of short-term gains as ordinary income for tax purposes.
The fund used a tax accounting practice to treat a portion of the price of capital shares redeemed during the year as distributions from net investment income and realized capital gains. Accordingly, the fund has reclassified $52,184,000 from undistributed net investment income, and $34,744,000 from accumulated net realized gains, to paid-in capital.
For tax purposes, at September 30, 2015, the fund had $370,292,000 of ordinary income and $258,928,000 of long-term capital gains available for distribution.
At September 30, 2015, the cost of investment securities for tax purposes was $19,257,462,000. Net unrealized appreciation of investment securities for tax purposes was $3,417,516,000, consisting of unrealized gains of $4,083,636,000 on securities that had risen in value since their purchase and $666,120,000 in unrealized losses on securities that had fallen in value since their purchase.
E. During the year ended September 30, 2015, the fund purchased $6,704,338,000 of investment securities and sold $5,973,402,000 of investment securities, other than temporary cash investments.
| F. | Capital shares issued and redeemed were: |
| Year Ended September 30, | ||
| 2015 | 2014 | |
| Shares | Shares | |
| (000) | (000) | |
| Issued | 260,591 | 244,389 |
| Issued in Lieu of Cash Distributions | 15,901 | 13,157 |
| Redeemed | (256,833) | (132,691) |
| Net Increase (Decrease) in Shares Outstanding | 19,659 | 124,855 |
74
Target Retirement 2030 Fund
| G. Transactions during the period in affiliated underlying Vanguard funds were as follows: | ||||||
| Current Period Transactions | ||||||
| Sept. 30, | Proceeds | Sept. 30, | ||||
| 2014 | from | Capital Gain | 2015 | |||
| Market | Purchases | Securities | Distributions | Market | ||
| Value | at Cost | Sold1 | Income | Received | Value | |
| ($000) | ($000) | ($000) | ($000) | ($000) | ($000) | |
| Vanguard Market Liquidity Fund | 6,481 | NA2 | NA 2 | 2 | — | — |
| Vanguard Total Bond Market II | ||||||
| Index Fund | 4,502,744 | 1,170,152 | 1,598,939 | 106,938 | 14,077 | 4,079,108 |
| Vanguard Total International | ||||||
| Bond Index Fund | 1,119,160 | 971,201 | 369,204 | 21,670 | — | 1,729,322 |
| Vanguard Total International | ||||||
| Stock Index Fund | 5,149,989 | 2,999,720 | 404,277 | 166,336 | — | 6,746,275 |
| Vanguard Total Stock Market | ||||||
| Index Fund | 12,292,549 | 1,509,633 | 3,548,049 | 226,702 | — | 10,120,273 |
| Total | 23,070,923 | 6,650,706 | 5,920,469 | 521,667 | 14,077 | 22,674,978 |
| 1 Includes net realized gain (loss) on affiliated investment securities sold of $271,879,000. | ||||||
| 2 Not applicable—purchases and sales are for temporary cash investment purposes. | ||||||
H. Management has determined that no material events or transactions occurred subsequent to September 30, 2015, that would require recognition or disclosure in these financial statements.
75
Report of Independent Registered Public Accounting Firm
To the Board of Trustees of Vanguard Chester Funds and the Shareholders of Vanguard Target Retirement Income Fund, Vanguard Target Retirement 2010 Fund, Vanguard Target Retirement 2015 Fund, Vanguard Target Retirement 2020 Fund, Vanguard Target Retirement 2025 Fund and Vanguard Target Retirement 2030 Fund: In our opinion, the accompanying statements of net assets and the related statements of operations and of changes in net assets and the financial highlights present fairly, in all material respects, the financial position of Vanguard Target Retirement Income Fund, Vanguard Target Retirement 2010 Fund, Vanguard Target Retirement 2015 Fund, Vanguard Target Retirement 2020 Fund, Vanguard Target Retirement 2025 Fund and Vanguard Target Retirement 2030 Fund (constituting separate portfolios of Vanguard Chester Funds, hereafter referred to as the “Funds”) at September 30, 2015, the results of each of their operations for the year then ended, the changes in each of their net assets for each of the two years in the period then ended, and the financial highlights for each of the five years in the period then ended, in conformity with accounting principles generally accepted in the United States of America. These financial statements and financial highlights (hereafter referred to as “financial statements”) are the responsibility of the Funds’ management. Our responsibility is to express an opinion on these financial statements based on our audits. We conducted our audits of these financial statements in accordance with the standards of the Public Company Accounting Oversight Board (United States). Those standards require that we plan and perform the audit to obtain reasonable assurance about whether the financial statements are free of material misstatement. An audit includes examining, on a test basis, evidence supporting the amounts and disclosures in the financial statements, assessing the accounting principles used and significant estimates made by management, and evaluating the overall financial statement presentation. We believe that our audits, which included confirmation of securities at September 30, 2015 by agreement to the underlying ownership records of the transfer agent, provide a reasonable basis for our opinion.
/s/PricewaterhouseCoopers LLP
Philadelphia, Pennsylvania
November 10, 2015
Special 2015 tax information (unaudited) for Vanguard Target Retirement Funds
This information for the fiscal year ended September 30, 2015, is included pursuant to provisions of the Internal Revenue Code.
The funds distributed capital gain dividends (from net long-term capital gains) to shareholders during the fiscal year as follows:
| Fund | ($000) |
| Target Retirement Income Fund | 48,026 |
| Target Retirement 2010 Fund | 120,664 |
| Target Retirement 2015 Fund | 345,520 |
| Target Retirement 2020 Fund | 54,955 |
| Target Retirement 2025 Fund | 89,480 |
| Target Retirement 2030 Fund | 32,238 |
76
For non-resident alien shareholders, 100% of short-term capital gain dividends distributed by the funds are qualified short-term capital gains.
The funds distributed qualified dividend income to shareholders during the fiscal year as follows:
| Fund | ($000) |
| Target Retirement Income Fund | 65,429 |
| Target Retirement 2010 Fund | 45,418 |
| Target Retirement 2015 Fund | 191,923 |
| Target Retirement 2020 Fund | 291,399 |
| Target Retirement 2025 Fund | 376,815 |
| Target Retirement 2030 Fund | 304,688 |
For corporate shareholders, the percentage of investment income (dividend income plus short-term gains, if any) that qualifies for the dividends-received deduction is as follows:
| Fund | Percentage |
| Target Retirement Income Fund | 16.7% |
| Target Retirement 2010 Fund | 19.8 |
| Target Retirement 2015 Fund | 26.5 |
| Target Retirement 2020 Fund | 28.9 |
| Target Retirement 2025 Fund | 32.0 |
| Target Retirement 2030 Fund | 35.7 |
The funds designate to shareholders foreign source income and foreign taxes paid as follows:
| Foreign Source Income | Foreign Taxes Paid | |
| Fund | ($000) | ($000) |
| Target Retirement Income Fund | 54,336 | 1,833 |
| Target Retirement 2010 Fund | 35,144 | 1,292 |
| Target Retirement 2015 Fund | 128,870 | 5,498 |
| Target Retirement 2020 Fund | 195,434 | 8,929 |
| Target Retirement 2025 Fund | 232,487 | 11,151 |
| Target Retirement 2030 Fund | 187,370 | 9,381 |
Shareholders will receive more detailed information with their Form 1099-DIV in January 2016 to determine the calendar-year amounts to be included on their 2015 tax returns.
77
Your Fund’s After-Tax Returns
This table presents returns for your fund both before and after taxes. The after-tax returns are shown in two ways: (1) assuming that an investor owned the fund during the entire period and paid taxes on the fund’s distributions, and (2) assuming that an investor paid taxes on the fund’s distributions and sold all shares at the end of each period.
Calculations are based on the highest individual federal income tax and capital gains tax rates in effect at the times of the distributions and the hypothetical sales. State and local taxes were not considered. After-tax returns reflect any qualified dividend income, using actual prior-year figures and estimates for 2015. (In the example, returns after the sale of fund shares may be higher than those assuming no sale. This occurs when the sale would have produced a capital loss. The calculation assumes that the investor received a tax deduction for the loss.)
Please note that your actual after-tax returns will depend on your tax situation and may differ from those shown. Also note that if you own the fund in a tax-deferred account, such as an individual retirement account or a 401(k) plan, this information does not apply to you. Such accounts are not subject to current taxes.
Finally, keep in mind that a fund’s performance—whether before or after taxes—does not guarantee future results.
| Average Annual Total Returns: Target Retirement Funds | |||
| Periods Ended September 30, 2015 | |||
| One | Five | Ten | |
| Year | Years | Years | |
| Target Retirement Income Fund | |||
| Returns Before Taxes | 0.18% | 5.17% | 4.96% |
| Returns After Taxes on Distributions | -0.59 | 4.31 | 3.95 |
| Returns After Taxes on Distributions and Sale of Fund Shares | 0.27 | 3.77 | 3.57 |
| Since | |||
| One | Five | Inception | |
| Year | Years | (6/7/2006) | |
| Target Retirement 2010 Fund | |||
| Returns Before Taxes | 0.06% | 6.24% | 5.31% |
| Returns After Taxes on Distributions | -0.87 | 5.42 | 4.60 |
| Returns After Taxes on Distributions and Sale of Fund Shares | 0.40 | 4.67 | 4.01 |
| One | Five | Ten | |
| Year | Years | Years | |
| Target Retirement 2015 Fund | |||
| Returns Before Taxes | -0.66% | 7.04% | 5.30% |
| Returns After Taxes on Distributions | -1.53 | 6.29 | 4.55 |
| Returns After Taxes on Distributions and Sale of Fund Shares | 0.01 | 5.35 | 4.01 |
78
| Average Annual Total Returns: Target Retirement Funds | |||
| Periods Ended September 30, 2015 | |||
| Since | |||
| One | Five | Inception | |
| Year | Years | (6/7/2006) | |
| Target Retirement 2020 Fund | |||
| Returns Before Taxes | -1.13% | 7.66% | 5.59% |
| Returns After Taxes on Distributions | -1.77 | 7.04 | 5.04 |
| Returns After Taxes on Distributions and Sale of Fund Shares | -0.40 | 5.88 | 4.32 |
| One | Five | Ten | |
| Year | Years | Years | |
| Target Retirement 2025 Fund | |||
| Returns Before Taxes | -1.60% | 8.16% | 5.41% |
| Returns After Taxes on Distributions | -2.23 | 7.55 | 4.82 |
| Returns After Taxes on Distributions and Sale of Fund Shares | -0.63 | 6.31 | 4.18 |
| Since | |||
| One | Five | Inception | |
| Year | Years | (6/7/2006) | |
| Target Retirement 2030 Fund | |||
| Returns Before Taxes | -2.16% | 8.61% | 5.56% |
| Returns After Taxes on Distributions | -2.73 | 8.07 | 5.11 |
| Returns After Taxes on Distributions and Sale of Fund Shares | -0.92 | 6.72 | 4.36 |
79
About Your Fund’s Expenses
As a shareholder of the fund, you incur ongoing costs, which include costs for portfolio management, administrative services, and shareholder reports (like this one), among others. Operating expenses, which are deducted from a fund’s gross income, directly reduce the investment return of the fund.
A typical fund’s expenses are expressed as a percentage of its average net assets. The Target Retirement Funds have no direct expenses, but each fund bears its proportionate share of the costs for the underlying funds in which it invests. These indirect expenses make up the acquired fund fees and expenses, also expressed as a percentage of average net assets.
The following examples are intended to help you understand the ongoing cost (in dollars) of investing in your fund and to compare these costs with those of other mutual funds. The examples are based on an investment of $1,000 made at the beginning of the period shown and held for the entire period. The costs were calculated using the acquired fund fees and expenses for each Target Retirement Fund.
The accompanying table illustrates your fund’s costs in two ways:
• Based on actual fund return. This section helps you to estimate the actual expenses that you paid over the period. The ”Ending Account Value“ shown is derived from the fund‘s actual return, and the third column shows the dollar amount that would have been paid by an investor who started with $1,000 in the fund. You may use the information here, together with the amount you invested, to estimate the expenses that you paid over the period.
To do so, simply divide your account value by $1,000 (for example, an $8,600 account value divided by $1,000 = 8.6), then multiply the result by the number given for your fund under the heading ”Expenses Paid During Period.“
• Based on hypothetical 5% yearly return. This section is intended to help you compare your fund‘s costs with those of other mutual funds. It assumes that the fund had a yearly return of 5% before expenses, but that the expense ratio is unchanged. In this case—because the return used is not the fund’s actual return—the results do not apply to your investment. The example is useful in making comparisons because the Securities and Exchange Commission requires all mutual funds to calculate expenses based on a 5% return. You can assess your fund’s costs by comparing this hypothetical example with the hypothetical examples that appear in shareholder reports of other funds.
Note that the expenses shown in the table are meant to highlight and help you compare ongoing costs only and do not reflect transaction costs incurred by the fund for buying and selling securities. Further, the expenses do not include any purchase, redemption, or account service fees described in the fund prospectus. If such fees were applied to your account, your costs would be higher. Your fund does not carry a “sales load.”
The calculations assume no shares were bought or sold during the period. Your actual costs may have been higher or lower, depending on the amount of your investment and the timing of any purchases or redemptions.
You can find more information about the fund’s expenses, including annual expense ratios, in the Financial Statements section of this report. For additional information on operating expenses and other shareholder costs, please refer to your fund’s current prospectus.
80
| Six Months Ended September 30, 2015 | |||
| Beginning | Ending | Expenses | |
| Account Value | Account Value | Paid During | |
| 3/31/2015 | 9/30/2015 | Period | |
| Based on Actual Fund Return | |||
| Target Retirement Income Fund | $1,000.00 | $969.86 | $0.69 |
| Target Retirement 2010 Fund | $1,000.00 | $960.66 | $0.69 |
| Target Retirement 2015 Fund | $1,000.00 | $955.13 | $0.69 |
| Target Retirement 2020 Fund | $1,000.00 | $946.35 | $0.68 |
| Target Retirement 2025 Fund | $1,000.00 | $940.83 | $0.73 |
| Target Retirement 2030 Fund | $1,000.00 | $934.70 | $0.73 |
| Based on Hypothetical 5% Yearly Return | |||
| Target Retirement Income Fund | $1,000.00 | $1,024.37 | $0.71 |
| Target Retirement 2010 Fund | $1,000.00 | $1,024.37 | $0.71 |
| Target Retirement 2015 Fund | $1,000.00 | $1,024.37 | $0.71 |
| Target Retirement 2020 Fund | $1,000.00 | $1,024.37 | $0.71 |
| Target Retirement 2025 Fund | $1,000.00 | $1,024.32 | $0.76 |
| Target Retirement 2030 Fund | $1,000.00 | $1,024.32 | $0.76 |
The calculations are based on the acquired fund fees and expenses for the most recent six-month period. The funds’ annualized expense figures for that period are (in order as listed from top to bottom above) 0.14%, 0.14%, 0.14%, 0.14%, 0.15%, and 0.15%. The dollar amounts shown as ”Expenses Paid” are equal to the annualized expense figures for the underlying funds multiplied by the average account value over the period, multiplied by the number of days in the most recent six-month period, then divided by the number of days in the most recent 12-month period (183/365).
81
Glossary
30-Day SEC Yield. A fund’s 30-day SEC yield is derived using a formula specified by the U.S. Securities and Exchange Commission. Under the formula, data related to the fund’s security holdings in the previous 30 days are used to calculate the fund’s hypothetical net income for that period, which is then annualized and divided by the fund’s estimated average net assets over the calculation period. For the purposes of this calculation, a security’s income is based on its current market yield to maturity (for bonds), its actual income (for asset-backed securities), or its projected dividend yield (for stocks). Because the SEC yield represents hypothetical annualized income, it will differ—at times significantly—from the fund’s actual experience. As a result, the fund’s income distributions may be higher or lower than implied by the SEC yield.
Acquired Fund Fees and Expenses. Funds that invest in other Vanguard funds incur no direct expenses, but they do bear proportionate shares of the operating, administrative, and advisory expenses of the underlying funds, and they must pay any fees charged by those funds. The figure for acquired fund fees and expenses represents a weighted average of these underlying costs. Acquired is a term that the Securities and Exchange Commission applies to any mutual fund whose shares are owned by another fund.
Beta. A measure of the magnitude of a fund’s past share-price fluctuations in relation to the ups and downs of a given market index. The index is assigned a beta of 1.00. Compared with a given index, a fund with a beta of 1.20 typically would have seen its share price rise or fall by 12% when the index rose or fell by 10%. For this report, beta is based on returns over the past 36 months for both the fund and the index. Note that a fund’s beta should be reviewed in conjunction with its R-squared (see definition). The lower the R-squared, the less correlation there is between the fund and the index, and the less reliable beta is as an indicator of volatility.
Expense Ratio. A fund’s total annual operating expenses expressed as a percentage of the fund’s average net assets. The expense ratio includes management and administrative expenses, but does not include the transaction costs of buying and selling portfolio securities.
Inception Date. The date on which the assets of a fund (or one of its share classes) are first invested in accordance with the fund’s investment objective. For funds with a subscription period, the inception date is the day after that period ends. Investment performance is measured from the inception date.
R-Squared. A measure of how much of a fund’s past returns can be explained by the returns from the market in general, as measured by a given index. If a fund’s total returns were precisely synchronized with an index’s returns, its R-squared would be 1.00. If the fund’s returns bore no relationship to the index’s returns, its R-squared would be 0. For this report, R-squared is based on returns over the past 36 months for both the fund and the index.
Benchmark Information
Spliced Mixed-Asset Target Today Funds Average: Mixed-Asset Target Conservative Funds Average though June 30, 2012; Mixed-Asset Target Today Funds Average thereafter.
82
Target 2010 Composite Index: Derived by applying the fund’s target asset allocation to the results of the following benchmarks: for international stocks of developed markets, the MSCI EAFE Index through December 15, 2010, the MSCI ACWI ex USA IMI Index through June 2, 2013, and the FTSE Global All Cap ex US Index thereafter; for emerging-market stocks, the Select Emerging Markets Index through August 23, 2006, the MSCI Emerging Markets Index through December 15, 2010, the MSCI ACWI ex USA IMI Index through June 2, 2013, and the FTSE Global All Cap ex US Index thereafter; for U.S. bonds, the Barclays U.S. Aggregate Bond Index through December 31, 2009, and the Barclays U.S. Aggregate Float Adjusted Index thereafter, as well as the Barclays U.S. Treasury Inflation Protected Securities Index through June 2, 2013, and the Barclays U.S. Treasury Inflation-Protected Securities (TIPS) 0-5 Year Index thereafter; for short-term reserves, the Citigroup Three-Month Treasury Bill Index through June 2, 2013; for international bonds, the Barclays Global Aggregate ex-USD Float Adjusted RIC Capped Index beginning June 3, 2013; and for U.S. stocks, the MSCI US Broad Market Index through June 2, 2013, and the CRSP US Total Market Index thereafter. International stock benchmark returns are adjusted for withholding taxes.
Target 2015 Composite Index: Derived by applying the fund’s target asset allocation to the results of the following benchmarks: for international stocks of developed markets, the MSCI EAFE Index through December 15, 2010, the MSCI ACWI ex USA IMI Index through June 2, 2013, and the FTSE Global All Cap ex US Index thereafter; for emerging-market stocks, the Select Emerging Markets Index through August 23, 2006, the MSCI Emerging Markets Index through December 15, 2010, the MSCI ACWI ex USA IMI Index through June 2, 2013, and the FTSE Global All Cap ex US Index thereafter; for U.S. bonds, the Barclays U.S. Aggregate Bond Index through December 31, 2009, and the Barclays U.S. Aggregate Float Adjusted Index thereafter, as well as the Barclays U.S. Treasury Inflation Protected Securities Index through June 2, 2013, and the Barclays U.S. Treasury Inflation-Protected Securities (TIPS) 0-5 Year Index thereafter; for international bonds, the Barclays Global Aggregate ex-USD Float Adjusted RIC Capped Index beginning June 3, 2013; and for U.S. stocks, the Dow Jones U.S. Total Stock Market Index (formerly known as the Dow Jones Wilshire 5000 Index) through April 22, 2005, the MSCI US Broad Market Index through June 2, 2013, and the CRSP US Total Market Index thereafter. International stock benchmark returns are adjusted for withholding taxes.
Target 2020 Composite Index: Derived by applying the fund’s target asset allocation to the results of the following benchmarks: for international stocks of developed markets, the MSCI EAFE Index through December 15, 2010, the MSCI ACWI ex USA IMI Index through June 2, 2013, and the FTSE Global All Cap ex US Index thereafter; for emerging-market stocks, the Select Emerging Markets Index through August 23, 2006, the MSCI Emerging Markets Index through December 15, 2010, the MSCI ACWI ex USA IMI Index through June 2, 2013, and the FTSE Global All Cap ex US Index thereafter; for U.S. bonds, the Barclays U.S. Aggregate Bond Index through December 31, 2009, and the Barclays U.S. Aggregate Float Adjusted Index thereafter; for international bonds, the Barclays Global Aggregate ex-USD Float Adjusted RIC Capped Index beginning June 3, 2013; and for U.S. stocks, the MSCI US Broad Market Index through June 2, 2013, and the CRSP US Total Market Index thereafter. International stock benchmark returns are adjusted for withholding taxes.
83
Target 2025 Composite Index: Derived by applying the fund’s target asset allocation to the results of the following benchmarks: for international stocks of developed markets, the MSCI EAFE Index through December 15, 2010, the MSCI ACWI ex USA IMI Index through June 2, 2013, and the FTSE Global All Cap ex US Index thereafter; for emerging-market stocks, the Select Emerging Markets Index through August 23, 2006, the MSCI Emerging Markets Index through December 15, 2010, the MSCI ACWI ex USA IMI Index through June 2, 2013, and the FTSE Global All Cap ex US Index thereafter; for U.S. bonds, the Barclays U.S. Aggregate Bond Index through December 31, 2009, and the Barclays U.S. Aggregate Float Adjusted Index thereafter; for international bonds, the Barclays Global Aggregate ex-USD Float Adjusted RIC Capped Index beginning June 3, 2013; and for U.S. stocks, the Dow Jones U.S. Total Stock Market Index (formerly known as the Dow Jones Wilshire 5000 Index) through April 22, 2005, the MSCI US Broad Market Index through June 2, 2013, and the CRSP US Total Market Index thereafter. International stock benchmark returns are adjusted for withholding taxes.
Target 2030 Composite Index: Derived by applying the fund’s target asset allocation to the results of the following benchmarks: for international stocks of developed markets, the MSCI EAFE Index through December 15, 2010, the MSCI ACWI ex USA IMI Index through June 2, 2013, and the FTSE Global All Cap ex US Index thereafter; for emerging-market stocks, the Select Emerging Markets Index through August 23, 2006, the MSCI Emerging Markets Index through December 15, 2010, the MSCI ACWI ex USA IMI Index through June 2, 2013, and the FTSE Global All Cap ex US Index thereafter; for U.S. bonds, the Barclays U.S. Aggregate Bond Index through December 31, 2009, and the Barclays U.S. Aggregate Float Adjusted Index thereafter; for international bonds, the Barclays Global Aggregate ex-USD Float Adjusted RIC Capped Index beginning June 3, 2013; and for U.S. stocks, the MSCI US Broad Market Index through June 2, 2013, and the CRSP US Total Market Index thereafter. International stock benchmark returns are adjusted for withholding taxes.
Target Income Composite Index: Derived by applying the fund’s target asset allocation to the results of the following benchmarks: for international stocks of developed markets, the MSCI EAFE Index through December 15, 2010, the MSCI ACWI ex USA IMI Index through June 2, 2013, and the FTSE Global All Cap ex US Index thereafter; for emerging-market stocks, the Select Emerging Markets Index through August 23, 2006, the MSCI Emerging Markets Index through December 15, 2010, the MSCI ACWI ex USA IMI Index through June 2, 2013, and the FTSE Global All Cap ex US Index thereafter; for U.S. bonds, the Barclays U.S. Aggregate Bond Index through December 31, 2009, and the Barclays U.S. Aggregate Float Adjusted Index thereafter, as well as the Barclays U.S. Treasury Inflation Protected Securities Index through June 2, 2013, and the Barclays U.S. Treasury Inflation-Protected Securities (TIPS) 0-5 Year Index thereafter; for short-term reserves, the Citigroup Three-Month Treasury Bill Index through June 2, 2013; for international bonds, the Barclays Global Aggregate ex-USD Float Adjusted RIC Capped Index beginning June 3, 2013; and for U.S. stocks, the Dow Jones U.S. Total Stock Market Index (formerly known as the Dow Jones Wilshire 5000 Index) through April 22, 2005, the MSCI US Broad Market Index through June 2, 2013, and the CRSP US Total Market Index thereafter. International stock benchmark returns are adjusted for withholding taxes.
84
This page intentionally left blank.
This page intentionally left blank.
This page intentionally left blank.
The People Who Govern Your Fund
The trustees of your mutual fund are there to see that the fund is operated and managed in your best interests since, as a shareholder, you are a part owner of the fund. Your fund’s trustees also serve on the board of directors of The Vanguard Group, Inc., which is owned by the Vanguard funds and provides services to them on an at-cost basis.
A majority of Vanguard’s board members are independent, meaning that they have no affiliation with Vanguard or the funds they oversee, apart from the sizable personal investments they have made as private individuals. The independent board members have distinguished backgrounds in business, academia, and public service. Each of the trustees and executive officers oversees 194 Vanguard funds.
The following table provides information for each trustee and executive officer of the fund. More information about the trustees is in the Statement of Additional Information, which can be obtained, without charge, by contacting Vanguard at 800-662-7447, or online at vanguard.com.
InterestedTrustee1
F. William McNabb III
Born 1957. Trustee Since July 2009. Chairman of the Board. Principal Occupation(s) During the Past Five Years and Other Experience: Chairman of the Board of The Vanguard Group, Inc., and of each of the investment companies served by The Vanguard Group, since January 2010; Director of The Vanguard Group since 2008; Chief Executive Officer and President of The Vanguard Group, and of each of the investment companies served by The Vanguard Group, since 2008; Director of Vanguard Marketing Corporation; Managing Director of The Vanguard Group (1995–2008).
IndependentTrustees
Emerson U. Fullwood
Born 1948. Trustee Since January 2008. Principal Occupation(s) During the Past Five Years and Other Experience: Executive Chief Staff and Marketing Officer for North America and Corporate Vice President (retired 2008) of Xerox Corporation (document management products and services); Executive in Residence and 2009–2010 Distinguished Minett Professor at the Rochester Institute of Technology; Director of SPX Corporation (multi-industry manufacturing), the United Way of Rochester, Amerigroup Corporation (managed health care), the University of Rochester Medical Center, Monroe Community College Foundation, and North Carolina A&T University.
Rajiv L. Gupta
Born 1945. Trustee Since December 2001.2 Principal Occupation(s) During the Past Five Years and Other Experience: Chairman and Chief Executive Officer (retired 2009) and President (2006–2008) of Rohm and Haas Co. (chemicals); Director of Tyco International PLC (diversified manufacturing and services), Hewlett-Packard Co. (electronic computer manufacturing), and Delphi Automotive PLC (automotive components); Senior Advisor at New Mountain Capital.
Amy Gutmann
Born 1949. Trustee Since June 2006. Principal Occupation(s) During the Past Five Years and Other Experience: President of the University of Pennsylvania; Christopher H. Browne Distinguished Professor of Political Science, School of Arts and Sciences, and Professor of Communication, Annenberg School for Communication, with secondary faculty appointments in the Department of Philosophy, School of Arts and Sciences, and at the Graduate School of Education, University of Pennsylvania; Trustee of the National Constitution Center; Chair of the Presidential Commission for the Study of Bioethical Issues.
JoAnn Heffernan Heisen
Born 1950. Trustee Since July 1998. Principal Occupation(s) During the Past Five Years and Other Experience: Corporate Vice President and Chief Global Diversity Officer (retired 2008) and Member of the Executive Committee (1997–2008) of Johnson & Johnson (pharmaceuticals/medical devices/ consumer products); Director of Skytop Lodge Corporation (hotels), the University Medical Center at Princeton, the Robert Wood Johnson Foundation, and the Center for Talent Innovation; Member of the Advisory Board of the Institute for Women’s Leadership at Rutgers University.
F. Joseph Loughrey
Born 1949. Trustee Since October 2009. Principal Occupation(s) During the Past Five Years and Other Experience: President and Chief Operating Officer (retired 2009) of Cummins Inc. (industrial machinery); Chairman of the Board of Hillenbrand, Inc. (specialized consumer services), and of Oxfam America; Director of SKF AB (industrial machinery), Hyster-Yale Materials Handling, Inc. (forklift trucks), the Lumina Foundation for Education, and the V Foundation for Cancer Research; Member of the Advisory Council for the College of Arts and Letters and of the Advisory Board to the Kellogg Institute for International Studies, both at the University of Notre Dame.
Mark Loughridge
Born 1953. Trustee Since March 2012. Principal Occupation(s) During the Past Five Years and Other Experience: Senior Vice President and Chief Financial Officer (retired 2013) at IBM (information technology services); Fiduciary Member of IBM’s Retirement Plan Committee (2004–2013); Director of the Dow Chemical Company; Member of the Council on Chicago Booth.
Scott C. Malpass
Born 1962. Trustee Since March 2012. Principal Occupation(s) During the Past Five Years and Other Experience: Chief Investment Officer and Vice President at the University of Notre Dame; Assistant Professor of Finance at the Mendoza College of Business at Notre Dame; Member of the Notre Dame 403(b) Investment Committee; Board Member of TIFF Advisory Services, Inc., and Catholic Investment Services, Inc. (investment advisors); Member of the Investment Advisory Committee of Major League Baseball.
André F. Perold
Born 1952. Trustee Since December 2004. Principal Occupation(s) During the Past Five Years and Other Experience: George Gund Professor of Finance and Banking, Emeritus at the Harvard Business School (retired 2011); Chief Investment Officer and Managing Partner of HighVista Strategies LLC (private investment firm); Director of Rand Merchant Bank; Overseer of the Museum of Fine Arts Boston.
Peter F. Volanakis
Born 1955. Trustee Since July 2009. Principal Occupation(s) During the Past Five Years and Other Experience: President and Chief Operating Officer (retired 2010) of Corning Incorporated (communications equipment); Trustee of Colby-Sawyer College; Member of the Advisory Board of the Norris Cotton Cancer Center and of the Advisory Board of the Parthenon Group (strategy consulting).
Executive Officers
Glenn Booraem
Born 1967. Treasurer Since May 2015. Principal Occupation(s) During the Past Five Years and Other Experience: Principal of The Vanguard Group, Inc.; Treasurer of each of the investment companies served by The Vanguard Group; Controller of each of the investment companies served by The Vanguard Group (2010–2015); Assistant Controller of each of the investment companies served by The Vanguard Group (2001–2010).
Thomas J. Higgins
Born 1957. Chief Financial Officer Since September 2008. Principal Occupation(s) During the Past Five Years and Other Experience: Principal of The Vanguard Group, Inc.; Chief Financial Officer of each of the investment companies served by The Vanguard Group; Treasurer of each of the investment companies served by The Vanguard Group (1998–2008).
Peter Mahoney
Born 1974. Controller Since May 2015. Principal Occupation(s) During the Past Five Years and Other Experience: Head of Global Fund Accounting at The Vanguard Group, Inc.; Controller of each of the investment companies served by The Vanguard Group; Head of International Fund Services at The Vanguard Group (2008–2014).
Heidi Stam
Born 1956. Secretary Since July 2005. Principal Occupation(s) During the Past Five Years and Other Experience: Managing Director of The Vanguard Group, Inc.; General Counsel of The Vanguard Group; Secretary of The Vanguard Group and of each of the investment companies served by The Vanguard Group; Director and Senior Vice President of Vanguard Marketing Corporation.
Vanguard Senior Management Team
Mortimer J. Buckley
Kathleen C. Gubanich
Paul A. Heller
Martha G. King
John T. Marcante
Chris D. McIsaac
James M. Norris
Thomas M. Rampulla
Glenn W. Reed
Karin A. Risi
Chairman Emeritus and Senior Advisor
John J. Brennan
Chairman, 1996–2009
Chief Executive Officer and President, 1996–2008
Founder John C. Bogle
Chairman and Chief Executive Officer, 1974–1996
1 Mr. McNabb is considered an “interested person,” as defined in the Investment Company Act of 1940, because he is an officer of the Vanguard funds.
2 December 2002 for Vanguard Equity Income Fund, the Vanguard Municipal Bond Funds, and the Vanguard State Tax-Exempt Funds.
 |
| P.O. Box 2600 |
| Valley Forge, PA 19482-2600 |
Connect with Vanguard® > vanguard.com
| Fund Information > 800-662-7447 | |
| Direct Investor Account Services > 800-662-2739 | |
| Institutional Investor Services > 800-523-1036 | |
| Text Telephone for People | |
| Who Are Deaf or Hard of Hearing> 800-749-7273 | |
| This material may be used in conjunction | |
| with the offering of shares of any Vanguard | |
| fund only if preceded or accompanied by | |
| the fund’s current prospectus. | |
| All comparative mutual fund data are from Lipper, a | |
| Thomson Reuters Company, or Morningstar, Inc., unless | |
| otherwise noted. | |
| You can obtain a free copy of Vanguard’s proxy voting | |
| guidelines by visiting vanguard.com/proxyreporting or by | |
| calling Vanguard at 800-662-2739. The guidelines are | |
| also available from the SEC’s website, sec.gov. In | |
| addition, you may obtain a free report on how your fund | |
| voted the proxies for securities it owned during the 12 | |
| months ended June 30. To get the report, visit either | |
| vanguard.com/proxyreporting or sec.gov. | |
| You can review and copy information about your fund at | |
| the SEC’s Public Reference Room in Washington, D.C. To | |
| find out more about this public service, call the SEC at | |
| 202-551-8090. Information about your fund is also | |
| available on the SEC’s website, and you can receive | |
| copies of this information, for a fee, by sending a | |
| request in either of two ways: via email addressed to | |
| publicinfo@sec.gov or via regular mail addressed to the | |
| Public Reference Section, Securities and Exchange | |
| Commission, Washington, DC 20549-1520. | |
| © 2015 The Vanguard Group, Inc. | |
| All rights reserved. | |
| Vanguard Marketing Corporation, Distributor. | |
| Q3080 112015 | |
Annual Report | September 30, 2015
Vanguard Target Retirement Funds
Vanguard Target Retirement 2035 Fund
Vanguard Target Retirement 2040 Fund
Vanguard Target Retirement 2045 Fund
Vanguard Target Retirement 2050 Fund
Vanguard Target Retirement 2055 Fund
Vanguard Target Retirement 2060 Fund
Vanguard’s Principles for Investing Success
We want to give you the best chance of investment success. These principles, grounded in Vanguard’s research and experience, can put you on the right path.
Goals. Create clear, appropriate investment goals.
Balance. Develop a suitable asset allocation using broadly diversified funds. Cost. Minimize cost.
Discipline. Maintain perspective and long-term discipline.
A single theme unites these principles: Focus on the things you can control.
We believe there is no wiser course for any investor.
| Contents | |
| Your Fund’s Total Returns. | 1 |
| Chairman’s Letter. | 2 |
| Target Retirement 2035 Fund. | 9 |
| Target Retirement 2040 Fund. | 20 |
| Target Retirement 2045 Fund. | 31 |
| Target Retirement 2050 Fund. | 42 |
| Target Retirement 2055 Fund. | 53 |
| Target Retirement 2060 Fund. | 64 |
| Your Fund’s After-Tax Returns. | 77 |
| About Your Fund’s Expenses. | 79 |
| Glossary. | 81 |
Please note: The opinions expressed in this report are just that—informed opinions. They should not be considered promises or advice. Also, please keep in mind that the information and opinions cover the period through the date on the front of this report. Of course, the risks of investing in your fund are spelled out in the prospectus.
See the Glossary for definitions of investment terms used in this report.
About the cover: Pictured is a sailing block on the Brilliant, a 1932 schooner docked in Mystic, Connecticut. A type of pulley, the sailing block helps coordinate the setting of the sails. At Vanguard, the intricate coordination of technology and people allows us to help millions of clients around the world reach their financial goals.
| Your Fund’s Total Returns | |
| Fiscal Year Ended September 30, 2015 | |
| Total | |
| Returns | |
| Vanguard Target Retirement 2035 Fund | -2.75% |
| Target 2035 Composite Index | -2.74 |
| Mixed-Asset Target 2035 Funds Average | -3.40 |
| Mixed-Asset Target 2035 Funds Average: Derived from data provided by Lipper, a Thomson Reuters Company. | |
| Vanguard Target Retirement 2040 Fund | -3.43% |
| Target 2040 Composite Index | -3.33 |
| Mixed-Asset Target 2040 Funds Average | -3.65 |
| Mixed-Asset Target 2040 Funds Average: Derived from data provided by Lipper, a Thomson Reuters Company. | |
| Vanguard Target Retirement 2045 Fund | -3.49% |
| Target 2045 Composite Index | -3.37 |
| Mixed-Asset Target 2045 Funds Average | -3.73 |
| Mixed-Asset Target 2045 Funds Average: Derived from data provided by Lipper, a Thomson Reuters Company. | |
| Vanguard Target Retirement 2050 Fund | -3.46% |
| Target 2050 Composite Index | -3.37 |
| Mixed-Asset Target 2050 Funds Average | -3.72 |
| Mixed-Asset Target 2050 Funds Average: Derived from data provided by Lipper, a Thomson Reuters Company. | |
| Vanguard Target Retirement 2055 Fund | -3.58% |
| Target 2055 Composite Index | -3.37 |
| Mixed-Asset Target 2055+ Funds Average | -3.45 |
| Mixed-Asset Target 2055+ Funds Average: Derived from data provided by Lipper, a Thomson Reuters Company. | |
| Vanguard Target Retirement 2060 Fund | -3.61% |
| Target 2060 Composite Index | -3.37 |
| Mixed-Asset Target 2055+ Funds Average | -3.45 |
| Mixed-Asset Target 2055+ Funds Average: Derived from data provided by Lipper, a Thomson Reuters Company. | |
| For a benchmark description, see the Glossary. | |
Investments in Target Retirement Funds are subject to the risks of their underlying funds. The year in the fund name refers to the approximate year (the target date) when an investor in the fund would retire and leave the work force. The fund will gradually shift its emphasis from more aggressive investments to more conservative ones based on its target date. An investment in a Target Retirement Fund is not guaranteed at any time, including on or after the target date.
1
Chairman’s Letter
Dear Shareholder,
The fiscal year ended September 30, 2015, was a volatile one for the world’s financial markets. After notching an impressive advance in the first half, U.S. stocks reversed course, but they still held up significantly better than their international counterparts.
Bonds generally outperformed stocks for the period. For international bonds, whether returns were hedged or unhedged for currency effects made a significant difference, a point I’ll revisit later in this letter.
Returns for the six Vanguard Target Retirement Funds covered in this report ranged from –3.61% for Vanguard Target Retirement 2060 Fund to –2.75% for Vanguard Target Retirement 2035 Fund. (The funds with retirement dates of 2010 through 2030, along with the Target Retirement Income Fund, are covered in a separate report.) Given the investment environment, it’s not surprising that the funds with more exposure to bonds and less exposure to stocks performed best.
I mentioned in my last letter to you that Vanguard Target Retirement Funds would expand their international exposure by the end of 2015, further enhancing the diversification of your investments. With the transition complete, international stocks now account for 40% of the overall equity portfolio, while international bonds make up 30% of the overall fixed income portfolio.
2
China’s economic woes weighed on U.S. stocks
The broad U.S. stock market returned –0.49% for the 12 months. The final two months were especially rocky as investors worried in particular about the global ripple effects of slower economic growth in China.
For much of the fiscal year, investors were preoccupied with the possibility of an increase in short-term interest rates. On September 17, the Federal Reserve announced that it would hold rates steady for the time being, a decision that to some investors indicated the Fed’s concern about the fragility of global markets.
International stocks returned about –11%, as the dollar’s strength against many foreign currencies weighed on results. Returns for emerging markets, which were especially hard hit by concerns about China, trailed those of the developed markets of the Pacific region and Europe.
Taxable bonds recorded gains as investors searched for safety
The broad U.S. taxable bond market returned 2.94%, as investors gravitated toward safe-haven assets amid global stock market turmoil. Stimulative monetary policies from the world’s central banks, declining inflation expectations, and global investors’ search for higher yields also helped lift U.S. bonds.
| Market Barometer | |||
| Average Annual Total Returns | |||
| Periods Ended September 30, 2015 | |||
| One | Three | Five | |
| Year | Years | Years | |
| Stocks | |||
| Russell 1000 Index (Large-caps) | -0.61% | 12.66% | 13.42% |
| Russell 2000 Index (Small-caps) | 1.25 | 11.02 | 11.73 |
| Russell 3000 Index (Broad U.S. market) | -0.49 | 12.53 | 13.28 |
| FTSE All-World ex US Index (International) | -11.34 | 2.87 | 2.19 |
| Bonds | |||
| Barclays U.S. Aggregate Bond Index (Broad taxable market) | 2.94% | 1.71% | 3.10% |
| Barclays Municipal Bond Index (Broad tax-exempt market) | 3.16 | 2.88 | 4.14 |
| Citigroup Three-Month U.S. Treasury Bill Index | 0.02 | 0.02 | 0.04 |
| CPI | |||
| Consumer Price Index | -0.04% | 0.93% | 1.73% |
3
The yield of the 10-year Treasury note ended September at 2.05%, down from 2.48% a year earlier. (Bond prices and yields move in opposite directions.)
International bond markets (as measured by the Barclays Global Aggregate Index ex USD) returned –7.67%, hurt by the weakness of international currencies relative to the dollar. Without this currency effect, international bonds advanced modestly.
The Fed’s 0%–0.25% target for short-term interest rates continued to limit returns for money market funds and savings accounts.
More conservative funds fared better amid volatility
Vanguard Target Retirement Funds offer a diversified portfolio of index funds within a single fund that adjusts its underlying asset mix over time. The portfolio gradually shifts from a growth-oriented, stock-heavy asset allocation to one that emphasizes income-generating fixed income securities as the investor’s retirement date approaches. Once its target date is reached, each fund continues to adjust until it enters an income phase, when the portfolio converts to the Target Retirement Income Fund. The Income Fund, which represents a static allocation of about 70% bonds and 30% stocks, is mostly focused on helping investors generate income and preserve their wealth.
| Expense Ratios | ||
| Your Fund Compared With Its Peer Group | ||
| Acquired Fund Fees | Peer Group | |
| and Expenses | Average | |
| Target Retirement 2035 Fund | 0.18% | 0.47% |
| Target Retirement 2040 Fund | 0.18 | 0.53 |
| Target Retirement 2045 Fund | 0.18 | 0.47 |
| Target Retirement 2050 Fund | 0.18 | 0.51 |
| Target Retirement 2055 Fund | 0.18 | 0.46 |
| Target Retirement 2060 Fund | 0.18 | 0.46 |
The fund expense figures shown—drawn from the prospectus dated January 27, 2015—represent an estimate of the weighted average of the expense ratios and any transaction fees charged by the underlying mutual funds (the ”acquired” funds) in which the Target Retirement Funds invest. The Target Retirement Funds do not charge any expenses or fees of their own. For the fiscal year ended September 30, 2015, the acquired fund fees and expenses were 0.15% for the 2035 Fund, 0.16% for the 2040 Fund, 0.16% for the 2045 Fund, 0.16% for the 2050 Fund, 0.16% for the 2055 Fund, and 0.16% for the 2060 Fund. Peer-group expense ratios are derived from data provided by Lipper, a Thomson Reuters Company, and capture information through year-end 2014.
Peer groups: For the 2035 Fund, Mixed-Asset Target 2035 Funds; for the 2040 Fund, Mixed-Asset Target 2040 Funds; for the 2045 Fund, Mixed-Asset Target 2045 Funds; for the 2050 Fund, Mixed-Asset Target 2050 Funds, for the 2055 and 2060 Funds, Mixed-Asset Target 2055+ Funds.
4
As I mentioned, bonds outperformed stocks for the most recent 12 months. Mirroring this broad market trend, the more conservative of the Target Retirement Funds—those holding more bonds and fewer stocks—outpaced their more aggressive counterparts. The Target Retirement 2035 Fund, the most conservative of this group, with about 82% of its assets in stocks and 18% in bonds,
| Total Returns | |
| Ten Years Ended September 30, 2015 | |
| Average | |
| Annual Return | |
| Target Retirement 2035 Fund | 5.56% |
| Target 2035 Composite Index | 5.68 |
| Mixed-Asset Target 2035 Funds Average | 4.72 |
| Mixed-Asset Target 2035 Funds Average: Derived from data provided by Lipper, a Thomson Reuters Company. | |
| Target Retirement 2040 Fund (Returns since inception: 6/7/2006) | 5.64% |
| Target 2040 Composite Index | 5.76 |
| Mixed-Asset Target 2040 Funds Average | 4.29 |
| Mixed-Asset Target 2040 Funds Average: Derived from data provided by Lipper, a Thomson Reuters Company. | |
| Target Retirement 2045 Fund | 5.73% |
| Target 2045 Composite Index | 5.85 |
| Mixed-Asset Target 2045 Funds Average | 4.91 |
| Mixed-Asset Target 2045 Funds Average: Derived from data provided by Lipper, a Thomson Reuters Company. | |
| Target Retirement 2050 Fund (Returns since inception: 6/7/2006) | 5.69% |
| Target 2050 Composite Index | 5.80 |
| Mixed-Asset Target 2050 Funds Average | 4.53 |
| Mixed-Asset Target 2050 Funds Average: Derived from data provided by Lipper, a Thomson Reuters Company. | |
| Target Retirement 2055 Fund (Returns since inception: 8/18/2010) | 10.04% |
| Target 2055 Composite Index | 10.25 |
| Spliced Mixed-Asset Target 2055+ Funds Average | 8.89 |
| Spliced Mixed-Asset Target 2055+ Funds Average: Derived from data provided by Lipper, a Thomson Reuters Company. | |
| Target Retirement 2060 Fund (Returns since inception: 1/19/2012) | 9.32% |
| Target 2060 Composite Index | 9.55 |
| Spliced Mixed-Asset Target 2055+ Funds Average | 8.38 |
| Spliced Mixed-Asset Target 2055+ Funds Average: Derived from data provided by Lipper, a Thomson Reuters Company. | |
| For a benchmark description, see the Glossary. | |
The figures shown represent past performance, which is not a guarantee of future results. (Current performance may be lower or higher than the performance data cited. For performance data current to the most recent month-end, visit our website at vanguard.com/performance.) Note, too, that both investment returns and principal value can fluctuate widely, so an investor’s shares, when sold, could be worth more or less than their original cost.
5
fared better than the five other funds, which hold about 90% of assets in stocks and 10% in bonds.
These results, of course, largely reflect the performance of the underlying portfolios that make up the Target Retirement Funds in this report—Vanguard Total Stock Market Index Fund, Vanguard Total International Stock Index Fund, Vanguard Total Bond Market II Index Fund, and Vanguard Total International Bond Index Fund.
The Total International Bond Index Fund, which provides broad exposure to non-U.S. investment-grade bonds, was the top performer among the underlying portfolios, returning 3.12%. The Total Bond Market II Index—which offers broad exposure to the U.S. investment-grade fixed income market—was next in line, returning 2.78%. Global fixed income markets benefited as investors sought shelter from the stock markets’ heightened volatility.
Currency hedging, as I mentioned, was a distinguishing factor in the performance of international bonds. The Total International Bond Index Fund uses currency exchange contracts to minimize the effects of currency fluctuations; this policy largely erased the negative effect of converting foreign bond returns into more expensive U.S. dollars during the period.
The remaining underlying funds posted negative results for the period. The Total Stock Market Index Fund—which provides
In stormy markets, target-date funds can help you stay on course
At Vanguard, we advise investors to avoid overreacting to market noise. But we realize that market turmoil, such as that experienced in recent months, can trigger even seasoned investors to make investment decisions based on emotion.
That’s where target-date funds can help. A Vanguard study of defined-contribution retirement plans found that the increasing use of target-date funds is dramatically improving investor behavior.
Target-date investors, it seems, are better able to weather market volatility and stick with their investment plan—probably because they know that their asset mix is automatically adjusted to fit their age and investment horizon.
According to the Vanguard study How America Saves 2015, when compared with other retirement plan investors, those who held their entire account balance in target-date funds:
- Had more balanced portfolios (including, for example, bonds and international stocks).
- Did not hold “extreme” equity allocations (either no stocks or 100% stocks).
- Refrained from frequent trading, which typically leads to disappointing results.
6
investors with broad exposure to the entire U.S. stock market—returned –0.67%. The Total International Stock Index Fund, which offers investors exposure to both developed and emerging international economies, returned –10.77%. Both domestic and international equity markets struggled amid volatility later in the period. The strength of the U.S. dollar further hindered results of foreign stocks.
The funds’ long-term performance is helping investors stay on track
Over the long term, Vanguard Target Retirement Funds have been successful in meeting their shared goal of helping investors save for retirement by providing a balanced and diversified portfolio that automatically adjusts over time. Each fund’s average annual return has topped that of its peer group.
Of course, the performance of the underlying index funds has been key to the funds’ strong long-term results. Credit goes to Vanguard’s Equity Index and Fixed Income Groups, whose skilled portfolio construction and management have enabled the underlying index funds successfully to track their benchmarks while keeping the associated costs very low.
A dose of discipline is crucial when markets become volatile
While the broad U.S. stock market has posted gains for six straight calendar years—from 2009 to 2014—that streak may not last a seventh. Stocks tumbled in August, and swung up and down in September.
Nobody can control the direction of the markets or reliably predict where they’ll go in the short term. However, investors can control how they react to unstable and turbulent markets.
During periods of market adversity, it’s more important than ever to keep sight of one of Vanguard’s key principles: Maintain perspective and long-term discipline. Whether you’re investing for yourself or on behalf of clients, your success is affected greatly by how you respond—or don’t respond—during turbulent markets. (You can read Vanguard’s Principles for Investing Success at vanguard.com/research.)
As I’ve written in the past, the best course for long-term investors is generally to ignore daily market moves and not make decisions based on emotion. This is also a good time to evaluate your portfolio and make sure your asset allocation is aligned with your time horizon, goals, and risk tolerance.
The markets are unpredictable and often confounding. Keeping long-term plans clearly in focus can help you weather these periodic storms.
As always, thank you for investing with Vanguard.
Sincerely,

F. William McNabb III
Chairman and Chief Executive Officer
October 14, 2015
7
| Your Fund’s Performance at a Glance | ||||
| September 30, 2014, Through September 30, 2015 | ||||
| Distributions Per Share | ||||
| Starting | Ending | Income | Capital | |
| Share Price | Share Price | Dividends | Gains | |
| Target Retirement 2035 Fund | $17.79 | $16.95 | $0.368 | $0.005 |
| Target Retirement 2040 Fund | $29.66 | $28.09 | $0.574 | $0.017 |
| Target Retirement 2045 Fund | $18.61 | $17.60 | $0.383 | $0.003 |
| Target Retirement 2050 Fund | $29.53 | $27.95 | $0.596 | $0.004 |
| Target Retirement 2055 Fund | $31.80 | $30.14 | $0.554 | $0.006 |
| Target Retirement 2060 Fund | $28.03 | $26.58 | $0.464 | $0.007 |
8
Target Retirement 2035 Fund
Fund Profile
As of September 30, 2015
| Total Fund Characteristics | |
| Ticker Symbol | VTTHX |
| 30-Day SEC Yield | 2.28% |
| Acquired Fund Fees and Expenses1 | 0.18% |
| Allocation to Underlying Vanguard Funds | |
| Vanguard Total Stock Market Index Fund | |
| Investor Shares | 49.2% |
| Vanguard Total International Stock Index | |
| Fund Investor Shares | 32.7 |
| Vanguard Total Bond Market II Index Fund | |
| Investor Shares | 12.7 |
| Vanguard Total International Bond Index | |
| Fund Investor Shares | 5.4 |
| Total Fund Volatility Measures | ||
| Target 2035 | MSCI US | |
| Composite | Broad Market | |
| Index | Index | |
| R-Squared | 1.00 | 0.94 |
| Beta | 1.01 | 0.81 |
These measures show the degree and timing of the fund’s fluctuations compared with the indexes over 36 months.
Fund Asset Allocation
1 This figure—drawn from the prospectus dated January 27, 2015—represents an estimate of the weighted average of the expense ratios and any transaction fees charged by the underlying mutual funds (the ”acquired” funds) in which the Target Retirement 2035 Fund invests. The fund does not charge any expenses or fees of its own. For the fiscal year ended September 30, 2015, the acquired fund fees and expenses were 0.15%.
9
Target Retirement 2035 Fund
Performance Summary
All of the returns in this report represent past performance, which is not a guarantee of future results that may be achieved by the fund. (Current performance may be lower or higher than the performance data cited. For performance data current to the most recent month-end, visit our website at vanguard.com/performance.) Note, too, that both investment returns and principal value can fluctuate widely, so an investor’s shares, when sold, could be worth more or less than their original cost. The returns shown do not reflect taxes that a shareholder would pay on fund distributions or on the sale of fund shares.
Cumulative Performance: September 30, 2005, Through September 30, 2015
Initial Investment of $10,000
| Average Annual Total Returns | |||||
| Periods Ended September 30, 2015 | |||||
| Final Value | |||||
| One | Five | Ten | of a $10,000 | ||
| Year | Years | Years | Investment | ||
| Target Retirement 2035 Fund | -2.75% | 9.06% | 5.56% | $17,173 | |
| •••••••• | Target 2035 Composite Index | -2.74 | 9.27 | 5.68 | 17,369 |
| – – – – | Mixed-Asset Target 2035 Funds | ||||
| -3.40 | 7.66 | 4.72 | 15,854 | ||
| MSCI Average US Broad Market Index | -0.41 | 13.37 | 7.12 | 19,902 | |
| For a benchmark description, see the Glossary. | |||||
| Mixed-Asset Target 2035 Funds Average: Derived from data provided by Lipper, a Thomson Reuters Company. | |||||
See Financial Highlights for dividend and capital gains information.
10
Target Retirement 2035 Fund
Fiscal-Year Total Returns (%): September 30, 2005, Through September 30, 2015
11
Target Retirement 2035 Fund
Financial Statements
Statement of Net Assets
As of September 30, 2015
The fund reports a complete list of its holdings in regulatory filings four times in each fiscal year, at the quarter-ends. For the second and fourth fiscal quarters, the lists appear in the fund’s semiannual and annual reports to shareholders. For the first and third fiscal quarters, the fund files the lists with the Securities and Exchange Commission on Form N-Q. Shareholders can look up the fund’s Forms N-Q on the SEC’s website at sec.gov. Forms N-Q may also be reviewed and copied at the SEC’s Public Reference Room (see the back cover of this report for further information).
| Market | ||
| Value• | ||
| Shares | ($000) | |
| Investment Companies (100.1%) | ||
| U.S. Stock Fund (49.2%) | ||
| Vanguard Total Stock Market Index Fund Investor Shares | 233,257,058 | 11,210,334 |
| International Stock Fund (32.8%) | ||
| Vanguard Total International Stock Index Fund Investor Shares | 525,123,591 | 7,467,258 |
| U.S. Bond Fund (12.7%) | ||
| 1 Vanguard Total Bond Market II Index Fund Investor Shares | 269,742,760 | 2,902,432 |
| International Bond Fund (5.4%) | ||
| Vanguard Total International Bond Index Fund Investor Shares | 116,074,953 | 1,226,912 |
| Total Investment Companies (Cost $18,722,534) | 22,806,936 | |
| Temporary Cash Investment (0.0%) | ||
| Money Market Fund (0.0%) | ||
| 1 Vanguard Market Liquidity Fund, 0.189% (Cost $9,770) | 9,769,547 | 9,770 |
| Total Investments (100.1%) (Cost $18,732,304) | 22,816,706 | |
| Amount | ||
| ($000) | ||
| Other Assets and Liabilities (-0.1%) | ||
| Other Assets | ||
| Receivables for Investment Securities Sold | 178,750 | |
| Receivables for Accrued Income | 7,269 | |
| Receivables for Capital Shares Issued | 17,511 | |
| Total Other Assets | 203,530 | |
| Liabilities | ||
| Payables for Investment Securities Purchased | (7,257) | |
| Payables for Capital Shares Redeemed | (212,528) | |
| Total Liabilities | (219,785) | |
| Net Assets (100%) | ||
| Applicable to 1,344,881,608 outstanding $.001 par value shares of | ||
| beneficial interest (unlimited authorization) | 22,800,451 | |
| Net Asset Value Per Share | $16.95 | |
12
| Target Retirement 2035 Fund | |
| At September 30, 2015, net assets consisted of: | |
| Amount | |
| ($000) | |
| Paid-in Capital | 17,922,832 |
| Undistributed Net Investment Income | 338,797 |
| Accumulated Net Realized Gains | 454,420 |
| Unrealized Appreciation (Depreciation) | 4,084,402 |
| Net Assets | 22,800,451 |
- See Note A in Notes to Financial Statements.
- Affiliated fund available only to Vanguard funds and certain trusts and accounts managed by Vanguard. Rate shown for Vanguard Market Liquidity Fund is the 7-day yield.
See accompanying Notes, which are an integral part of the Financial Statements.
13
| Target Retirement 2035 Fund | |
| Statement of Operations | |
| Year Ended | |
| September 30, 2015 | |
| ($000) | |
| Investment Income | |
| Income | |
| Income Distributions Received | 529,769 |
| Other Income | 180 |
| Net Investment Income—Note B | 529,949 |
| Realized Net Gain (Loss) | |
| Capital Gain Distributions Received | 9,997 |
| Investment Securities Sold | 514,475 |
| Realized Net Gain (Loss) | 524,472 |
| Change in Unrealized Appreciation (Depreciation) of Investment Securities | (1,751,937) |
| Net Increase (Decrease) in Net Assets Resulting from Operations | (697,516) |
See accompanying Notes, which are an integral part of the Financial Statements.
14
| Target Retirement 2035 Fund | ||
| Statement of Changes in Net Assets | ||
| Year Ended September 30, | ||
| 2015 | 2014 | |
| ($000) | ($000) | |
| Increase (Decrease) in Net Assets | ||
| Operations | ||
| Net Investment Income | 529,949 | 478,271 |
| Realized Net Gain (Loss) | 524,472 | 13,398 |
| Change in Unrealized Appreciation (Depreciation) | (1,751,937) | 1,929,163 |
| Net Increase (Decrease) in Net Assets Resulting from Operations | (697,516) | 2,420,832 |
| Distributions | ||
| Net Investment Income | (497,432) | (393,936) |
| Realized Capital Gain1 | (6,759) | — |
| Total Distributions | (504,191) | (393,936) |
| Capital Share Transactions | ||
| Issued | 6,526,703 | 5,931,912 |
| Issued in Lieu of Cash Distributions | 495,804 | 388,557 |
| Redeemed | (6,846,464) | (3,547,498) |
| Net Increase (Decrease) from Capital Share Transactions | 176,043 | 2,772,971 |
| Total Increase (Decrease) | (1,025,664) | 4,799,867 |
| Net Assets | ||
| Beginning of Period | 23,826,115 | 19,026,248 |
| End of Period2 | 22,800,451 | 23,826,115 |
1 Includes fiscal 2015 short-term gain distributions totaling $6,759,000. Short-term gain distributions are treated as ordinary income dividends for tax purposes.
2 Net Assets—End of Period includes undistributed (overdistributed) net investment income of $338,797,000 and $354,717,000.
See accompanying Notes, which are an integral part of the Financial Statements.
15
| Target Retirement 2035 Fund | |||||
| Financial Highlights | |||||
| For a Share Outstanding | Year Ended September 30, | ||||
| Throughout Each Period | 2015 | 2014 | 2013 | 2012 | 2011 |
| Net Asset Value, Beginning of Period | $17.79 | $16.16 | $14.15 | $11.77 | $12.22 |
| Investment Operations | |||||
| Net Investment Income | .391 | .359 | .340 | .344 | .235 |
| Capital Gain Distributions Received | .007 | .001 | .011 | .016 | .006 |
| Net Realized and Unrealized Gain (Loss) | |||||
| on Investments | (.865) | 1.594 | 1.972 | 2.307 | (.402) |
| Total from Investment Operations | (.467) | 1.954 | 2.323 | 2.667 | (.161) |
| Distributions | |||||
| Dividends from Net Investment Income | (.368) | (. 324) | (. 307) | (.281) | (.236) |
| Distributions from Realized Capital Gains | (. 005) | — | (. 006) | (. 006) | (. 053) |
| Total Distributions | (.373) | (. 324) | (. 313) | (. 287) | (.289) |
| Net Asset Value, End of Period | $16.95 | $17.79 | $16.16 | $14.15 | $11.77 |
| Total Return1 | -2.75% | 12.20% | 16.77% | 22.98% | -1.55% |
| Ratios/Supplemental Data | |||||
| Net Assets, End of Period (Millions) | $22,800 | $23,826 | $19,026 | $14,220 | $10,239 |
| Ratio of Total Expenses to Average Net Assets | — | — | — | — | — |
| Acquired Fund Fees and Expenses | 0.15% | 0.18% | 0.18% | 0.18% | 0.19% |
| Ratio of Net Investment Income to | |||||
| Average Net Assets | 2.07% | 2.17% | 2.33% | 2.68% | 1.81% |
| Portfolio Turnover Rate | 23% | 6% | 12% | 6% | 18%2 |
1 Total returns do not include account service fees that may have applied in the periods shown. Fund prospectuses provide information about any applicable account service fees.
2 Excludes the value of mutual fund shares delivered and received in connection with a change in the fund’s international equity investments from Vanguard European, Pacific, and Emerging Markets Stock Index Funds to Vanguard Total International Stock Index Fund because those transactions were effected in kind and did not cause the fund to incur transaction costs.
See accompanying Notes, which are an integral part of the Financial Statements.
16
Target Retirement 2035 Fund
Notes to Financial Statements
Vanguard Target Retirement 2035 Fund is registered under the Investment Company Act of 1940 as an open-end investment company, or mutual fund. The fund follows a balanced investment strategy by investing in selected Vanguard funds to achieve its targeted allocation of assets to U.S. and international stocks, and U.S. and international bonds. Financial statements and other information about each underlying fund are available on vanguard.com.
A. The following significant accounting policies conform to generally accepted accounting principles for U.S. investment companies. The fund consistently follows such policies in preparing its financial statements.
1. Security Valuation: Investments are valued at the net asset value of each underlying Vanguard fund determined as of the close of the New York Stock Exchange (generally 4 p.m., Eastern time) on the valuation date.
2. Federal Income Taxes: The fund intends to continue to qualify as a regulated investment company and distribute all of its taxable income. Management has analyzed the fund’s tax positions taken for all open federal income tax years (September 30, 2012–2015), and has concluded that no provision for federal income tax is required in the fund’s financial statements.
3. Distributions: Distributions to shareholders are recorded on the ex-dividend date.
4. Credit Facility: The fund and certain other funds managed by The Vanguard Group (“Vanguard”) participate in a $3 billion committed credit facility provided by a syndicate of lenders pursuant to a credit agreement that may be renewed annually; each fund is individually liable for its borrowings, if any, under the credit facility. Borrowings may be utilized for temporary and emergency purposes, and are subject to the fund’s regulatory and contractual borrowing restrictions. The participating funds are charged administrative fees and an annual commitment fee of 0.06% of the undrawn amount of the facility; these fees are allocated to the funds based on a method approved by the fund’s board of trustees and borne by the funds in which the fund invests (see Note B). Any borrowings under this facility bear interest at a rate equal to the higher of the federal funds rate or LIBOR reference rate plus an agreed-upon spread.
The fund had no borrowings outstanding at September 30, 2015, or at any time during the period then ended.
5. Other: Income and capital gain distributions received are recorded on the ex-dividend date. Security transactions are accounted for on the date securities are bought or sold. Costs used to determine realized gains (losses) on the sale of investment securities are those of the specific securities sold.
B. In accordance with the terms of a Funds’ Service Agreement (the “FSA”) between Vanguard and the fund, Vanguard furnishes to the fund investment advisory, corporate management, administrative, marketing, and distribution services at Vanguard’s cost of operations (as defined by the FSA). These costs of operations are allocated to the fund based on methods and guidelines approved by the board of trustees. The FSA provides that expenses otherwise allocable to Vanguard funds-of-funds may be reduced or eliminated to the extent of savings realized by the underlying Vanguard funds by virtue of being part of a fund-of-funds. Accordingly, all expenses for services provided by Vanguard to the fund and all other expenses incurred by the fund during the year ended September 30, 2015, were borne by the underlying Vanguard funds in which the fund invests. The fund’s trustees and officers are also trustees and officers, respectively, of the underlying Vanguard funds, as well as directors and employees, respectively, of Vanguard.
17
Target Retirement 2035 Fund
C. Various inputs may be used to determine the value of the fund’s investments. These inputs are summarized in three broad levels for financial statement purposes. The inputs or methodologies used to value securities are not necessarily an indication of the risk associated with investing in those securities.
Level 1—Quoted prices in active markets for identical securities.
Level 2—Other significant observable inputs (including quoted prices for similar securities, interest rates, prepayment speeds, credit risk, etc.).
Level 3—Significant unobservable inputs (including the fund’s own assumptions used to determine the fair value of investments).
At September 30, 2015, 100% of the market value of the fund’s investments was determined based on Level 1 inputs.
D. Distributions are determined on a tax basis and may differ from net investment income and realized capital gains for financial reporting purposes. Differences may be permanent or temporary. Permanent differences are reclassified among capital accounts in the financial statements to reflect their tax character. Temporary differences arise when certain items of income, expense, gain, or loss are recognized in different periods for financial statement and tax purposes. These differences will reverse at some time in the future. Differences in classification may also result from the treatment of short-term gains as ordinary income for tax purposes.
The fund used a tax accounting practice to treat a portion of the price of capital shares redeemed during the year as distributions from net investment income and realized capital gains. Accordingly, the fund has reclassified $48,437,000 from undistributed net investment income, and $50,558,000 from accumulated net realized gains, to paid-in capital.
The fund used a capital loss carryforward of $11,731,000 to offset taxable capital gains realized during the year ended September 30, 2015, reducing the amount of capital gains that would otherwise be available to distribute to shareholders. For tax purposes, at September 30, 2015, the fund had $374,043,000 of ordinary income and $468,148,000 of long-term capital gains available for distribution.
At September 30, 2015, the cost of investment securities for tax purposes was $18,781,279,000. Net unrealized appreciation of investment securities for tax purposes was $4,035,427,000, consisting of unrealized gains of $4,764,535,000 on securities that had risen in value since their purchase and $729,108,000 in unrealized losses on securities that had fallen in value since their purchase.
E. During the year ended September 30, 2015, the fund purchased $6,017,213,000 of investment securities and sold $5,780,627,000 of investment securities, other than temporary cash investments.
18
| Target Retirement 2035 Fund | ||||||
| F. Capital shares issued and redeemed were: | ||||||
| Year Ended September 30, | ||||||
| 2015 | 2014 | |||||
| Shares | Shares | |||||
| (000) | (000) | |||||
| Issued | 360,451 | 343,642 | ||||
| Issued in Lieu of Cash Distributions | 27,499 | 23,005 | ||||
| Redeemed | (382,190) | (204,875) | ||||
| Net Increase (Decrease) in Shares Outstanding | 5,760 | 161,772 | ||||
| G. Transactions during the period in affiliated underlying Vanguard funds were as follows: | ||||||
| Current Period Transactions | ||||||
| Sept. 30, | Proceeds | Sept. 30, | ||||
| 2014 | from | Capital Gain | 2015 | |||
| Market | Purchases | Securities | Distributions | Market | ||
| Value | at Cost | Sold1 | Income | Received | Value | |
| ($000) | ($000) | ($000) | ($000) | ($000) | ($000) | |
| Vanguard Market Liquidity Fund | 9,365 | NA2 | NA 2 | 20 | — | 9,770 |
| Vanguard Total Bond Market II | ||||||
| Index Fund | 3,195,065 | 857,905 | 1,155,351 | 75,652 | 9,997 | 2,902,432 |
| Vanguard Total International | ||||||
| Bond Index Fund | 798,045 | 734,532 | 311,741 | 15,430 | — | 1,226,912 |
| Vanguard Total International | ||||||
| Stock Index Fund | 5,876,679 | 3,026,453 | 332,701 | 184,478 | — | 7,467,258 |
| Vanguard Total Stock Market | ||||||
| Index Fund | 13,938,024 | 1,326,393 | 3,909,850 | 254,189 | — | 11,210,334 |
| Total | 23,817,178 | 5,945,283 | 5,709,643 | 529,769 | 9,997 | 22,816,706 |
| 1 Includes net realized gain (loss) on affiliated investment securities sold of $515,420,000. | ||||||
| 2 Not applicable—purchases and sales are for temporary cash investment purposes. | ||||||
H. Management has determined that no material events or transactions occurred subsequent to September 30, 2015, that would require recognition or disclosure in these financial statements.
19
Target Retirement 2040 Fund
Fund Profile
As of September 30, 2015
| Total Fund Characteristics | |
| Ticker Symbol | VFORX |
| 30-Day SEC Yield | 2.31% |
| Acquired Fund Fees and Expenses1 | 0.18% |
| Allocation to Underlying Vanguard Funds | |
| Vanguard Total Stock Market Index Fund | |
| Investor Shares | 53.6% |
| Vanguard Total International Stock Index | |
| Fund Investor Shares | 35.7 |
| Vanguard Total Bond Market II Index Fund | |
| Investor Shares | 7.5 |
| Vanguard Total International Bond Index | |
| Fund Investor Shares | 3.2 |
| Total Fund Volatility Measures | ||
| Target 2040 | MSCI US | |
| Composite | Broad Market | |
| Index | Index | |
| R-Squared | 1.00 | 0.94 |
| Beta | 1.01 | 0.87 |
These measures show the degree and timing of the fund’s fluctuations compared with the indexes over 36 months.
Fund Asset Allocation
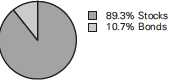
1 This figure—drawn from the prospectus dated January 27, 2015—represents an estimate of the weighted average of the expense ratios and any transaction fees charged by the underlying mutual funds (the ”acquired” funds) in which the Target Retirement 2040 Fund invests. The fund does not charge any expenses or fees of its own. For the fiscal year ended September 30, 2015, the acquired fund fees and expenses were 0.16%.
20
Target Retirement 2040 Fund
Performance Summary
All of the returns in this report represent past performance, which is not a guarantee of future results that may be achieved by the fund. (Current performance may be lower or higher than the performance data cited. For performance data current to the most recent month-end, visit our website at vanguard.com/performance.) Note, too, that both investment returns and principal value can fluctuate widely, so an investor’s shares, when sold, could be worth more or less than their original cost. The returns shown do not reflect taxes that a shareholder would pay on fund distributions or on the sale of fund shares.
Cumulative Performance: June 7, 2006, Through September 30, 2015
Initial Investment of $10,000
| Average Annual Total Returns | |||||
| Periods Ended September 30, 2015 | |||||
| Since | Final Value | ||||
| One | Five | Inception | of a $10,000 | ||
| Year | Years | (6/7/2006) | Investment | ||
| Target Retirement 2040 Fund | -3.43% | 9.18% | 5.64% | $16,674 | |
| •••••••• | Target 2040 Composite Index | -3.33 | 9.43 | 5.76 | 16,845 |
| – – – – | Mixed-Asset Target 2040 Funds | ||||
| -3.65 | 7.48 | 4.29 | 14,784 | ||
| MSCI Average US Broad Market Index | -0.41 | 13.37 | 7.20 | 19,108 | |
| For a benchmark description, see the Glossary. | |||||
| Mixed-Asset Target 2040 Funds Average: Derived from data provided by Lipper, a Thomson Reuters Company. | |||||
| "Since Inception" performance is calculated from the inception date for both the fund and its comparative standards. | |||||
See Financial Highlights for dividend and capital gains information.
21
Target Retirement 2040 Fund
Fiscal-Year Total Returns (%): June 7, 2006, Through September 30, 2015
22
Target Retirement 2040 Fund
Financial Statements
Statement of Net Assets
As of September 30, 2015
The fund reports a complete list of its holdings in regulatory filings four times in each fiscal year, at the quarter-ends. For the second and fourth fiscal quarters, the lists appear in the fund’s semiannual and annual reports to shareholders. For the first and third fiscal quarters, the fund files the lists with the Securities and Exchange Commission on Form N-Q. Shareholders can look up the fund’s Forms N-Q on the SEC’s website at sec.gov. Forms N-Q may also be reviewed and copied at the SEC’s Public Reference Room (see the back cover of this report for further information).
| Market | ||
| Value• | ||
| Shares | ($000) | |
| Investment Companies (100.0%) | ||
| U.S. Stock Fund (53.6%) | ||
| Vanguard Total Stock Market Index Fund Investor Shares | 175,403,724 | 8,429,903 |
| International Stock Fund (35.7%) | ||
| Vanguard Total International Stock Index Fund Investor Shares | 394,885,108 | 5,615,266 |
| U.S. Bond Fund (7.5%) | ||
| 1 Vanguard Total Bond Market II Index Fund Investor Shares | 109,092,781 | 1,173,838 |
| International Bond Fund (3.2%) | ||
| Vanguard Total International Bond Index Fund Investor Shares | 47,459,459 | 501,647 |
| Total Investment Companies (Cost $13,163,140) | 15,720,654 | |
| Temporary Cash Investment (0.0%) | ||
| Money Market Fund (0.0%) | ||
| 1 Vanguard Market Liquidity Fund, 0.189% (Cost $6,418) | 6,417,811 | 6,418 |
| Total Investments (100.0%) (Cost $13,169,558) | 15,727,072 | |
| Amount | ||
| ($000) | ||
| Other Assets and Liabilities (0.0%) | ||
| Other Assets | ||
| Receivables for Investment Securities Sold | 84,884 | |
| Receivables for Accrued Income | 2,930 | |
| Receivables for Capital Shares Issued | 19,243 | |
| Total Other Assets | 107,057 | |
| Liabilities | ||
| Payables for Investment Securities Purchased | (2,910) | |
| Payables for Capital Shares Redeemed | (106,989) | |
| Total Liabilities | (109,899) | |
| Net Assets (100%) | ||
| Applicable to 559,735,613 outstanding $.001 par value shares of | ||
| beneficial interest (unlimited authorization) | 15,724,230 | |
| Net Asset Value Per Share | $28.09 | |
23
| Target Retirement 2040 Fund | |
| At September 30, 2015, net assets consisted of: | |
| Amount | |
| ($000) | |
| Paid-in Capital | 12,855,061 |
| Undistributed Net Investment Income | 232,088 |
| Accumulated Net Realized Gains | 79,567 |
| Unrealized Appreciation (Depreciation) | 2,557,514 |
| Net Assets | 15,724,230 |
- See Note A in Notes to Financial Statements.
- Affiliated fund available only to Vanguard funds and certain trusts and accounts managed by Vanguard. Rate shown for Vanguard Market Liquidity Fund is the 7-day yield.
See accompanying Notes, which are an integral part of the Financial Statements.
24
| Target Retirement 2040 Fund | |
| Statement of Operations | |
| Year Ended | |
| September 30, 2015 | |
| ($000) | |
| Investment Income | |
| Income | |
| Income Distributions Received | 365,262 |
| Other Income | 162 |
| Net Investment Income—Note B | 365,424 |
| Realized Net Gain (Loss) | |
| Capital Gain Distributions Received | 4,006 |
| Investment Securities Sold | 96,788 |
| Realized Net Gain (Loss) | 100,794 |
| Change in Unrealized Appreciation (Depreciation) of Investment Securities | (1,099,235) |
| Net Increase (Decrease) in Net Assets Resulting from Operations | (633,017) |
See accompanying Notes, which are an integral part of the Financial Statements.
25
| Target Retirement 2040 Fund | ||
| Statement of Changes in Net Assets | ||
| Year Ended September 30, | ||
| 2015 | 2014 | |
| ($000) | ($000) | |
| Increase (Decrease) in Net Assets | ||
| Operations | ||
| Net Investment Income | 365,424 | 313,519 |
| Realized Net Gain (Loss) | 100,794 | 9,137 |
| Change in Unrealized Appreciation (Depreciation) | (1,099,235) | 1,291,043 |
| Net Increase (Decrease) in Net Assets Resulting from Operations | (633,017) | 1,613,699 |
| Distributions | ||
| Net Investment Income | (314,420) | (233,406) |
| Realized Capital Gain1 | (9,312) | (3,268) |
| Total Distributions | (323,732) | (236,674) |
| Capital Share Transactions | ||
| Issued | 5,442,252 | 4,886,111 |
| Issued in Lieu of Cash Distributions | 317,439 | 232,555 |
| Redeemed | (4,990,355) | (2,596,989) |
| Net Increase (Decrease) from Capital Share Transactions | 769,336 | 2,521,677 |
| Total Increase (Decrease) | (187,413) | 3,898,702 |
| Net Assets | ||
| Beginning of Period | 15,911,643 | 12,012,941 |
| End of Period2 | 15,724,230 | 15,911,643 |
1 Includes fiscal 2015 and 2014 short-term gain distributions totaling $8,764,000 and $467,000, respectively. Short-term gain distributions are treated as ordinary income dividends for tax purposes.
2 Net Assets—End of Period includes undistributed (overdistributed) net investment income of $232,088,000 and $217,626,000.
See accompanying Notes, which are an integral part of the Financial Statements.
26
| Target Retirement 2040 Fund | |||||
| Financial Highlights | |||||
| For a Share Outstanding | Year Ended September 30, | ||||
| Throughout Each Period | 2015 | 2014 | 2013 | 2012 | 2011 |
| Net Asset Value, Beginning of Period | $29.66 | $26.80 | $23.26 | $19.26 | $20.03 |
| Investment Operations | |||||
| Net Investment Income | .648 | .593 | .546 | .559 | .369 |
| Capital Gain Distributions Received | .007 | .001 | .012 | .022 | .006 |
| Net Realized and Unrealized Gain (Loss) | |||||
| on Investments | (1.634) | 2.773 | 3.485 | 3.872 | (.705) |
| Total from Investment Operations | (.979) | 3.367 | 4.043 | 4.453 | (.330) |
| Distributions | |||||
| Dividends from Net Investment Income | (.574) | (.500) | (.496) | (.444) | (.368) |
| Distributions from Realized Capital Gains | (.017) | (.007) | (.007) | (.009) | (.072) |
| Total Distributions | (.591) | (.507) | (.503) | (.453) | (.440) |
| Net Asset Value, End of Period | $28.09 | $29.66 | $26.80 | $23.26 | $19.26 |
| Total Return1 | -3.43% | 12.66% | 17.75% | 23.43% | -1.87% |
| Ratios/Supplemental Data | |||||
| Net Assets, End of Period (Millions) | $15,724 | $15,912 | $12,013 | $7,982 | $4,977 |
| Ratio of Total Expenses to Average Net Assets | — | — | — | — | — |
| Acquired Fund Fees and Expenses | 0.16% | 0.18% | 0.18% | 0.18% | 0.19% |
| Ratio of Net Investment Income to | |||||
| Average Net Assets | 2.09% | 2.18% | 2.36% | 2.69% | 1.79% |
| Portfolio Turnover Rate | 21% | 6% | 9% | 3% | 15%2 |
1 Total returns do not include account service fees that may have applied in the periods shown. Fund prospectuses provide information about any applicable account service fees.
2 Excludes the value of mutual fund shares delivered and received in connection with a change in the fund’s international equity investments from Vanguard European, Pacific, and Emerging Markets Stock Index Funds to Vanguard Total International Stock Index Fund because those transactions were effected in kind and did not cause the fund to incur transaction costs.
See accompanying Notes, which are an integral part of the Financial Statements.
27
Target Retirement 2040 Fund
Notes to Financial Statements
Vanguard Target Retirement 2040 Fund is registered under the Investment Company Act of 1940 as an open-end investment company, or mutual fund. The fund follows a balanced investment strategy by investing in selected Vanguard funds to achieve its targeted allocation of assets to U.S. and international stocks, and U.S. and international bonds. Financial statements and other information about each underlying fund are available on vanguard.com.
A. The following significant accounting policies conform to generally accepted accounting principles for U.S. investment companies. The fund consistently follows such policies in preparing its financial statements.
1. Security Valuation: Investments are valued at the net asset value of each underlying Vanguard fund determined as of the close of the New York Stock Exchange (generally 4 p.m., Eastern time) on the valuation date.
2. Federal Income Taxes: The fund intends to continue to qualify as a regulated investment company and distribute all of its taxable income. Management has analyzed the fund’s tax positions taken for all open federal income tax years (September 30, 2012–2015), and has concluded that no provision for federal income tax is required in the fund’s financial statements.
3. Distributions: Distributions to shareholders are recorded on the ex-dividend date.
4. Credit Facility: The fund and certain other funds managed by The Vanguard Group (“Vanguard”) participate in a $3 billion committed credit facility provided by a syndicate of lenders pursuant to a credit agreement that may be renewed annually; each fund is individually liable for its borrowings, if any, under the credit facility. Borrowings may be utilized for temporary and emergency purposes, and are subject to the fund’s regulatory and contractual borrowing restrictions. The participating funds are charged administrative fees and an annual commitment fee of 0.06% of the undrawn amount of the facility; these fees are allocated to the funds based on a method approved by the fund’s board of trustees and borne by the funds in which the fund invests (see Note B). Any borrowings under this facility bear interest at a rate equal to the higher of the federal funds rate or LIBOR reference rate plus an agreed-upon spread.
The fund had no borrowings outstanding at September 30, 2015, or at any time during the period then ended.
5. Other: Income and capital gain distributions received are recorded on the ex-dividend date. Security transactions are accounted for on the date securities are bought or sold. Costs used to determine realized gains (losses) on the sale of investment securities are those of the specific securities sold.
B. In accordance with the terms of a Funds’ Service Agreement (the “FSA”) between Vanguard and the fund, Vanguard furnishes to the fund investment advisory, corporate management, administrative, marketing, and distribution services at Vanguard’s cost of operations (as defined by the FSA). These costs of operations are allocated to the fund based on methods and guidelines approved by the board of trustees. The FSA provides that expenses otherwise allocable to Vanguard funds-of-funds may be reduced or eliminated to the extent of savings realized by the underlying Vanguard funds by virtue of being part of a fund-of-funds. Accordingly, all expenses for services provided by Vanguard to the fund and all other expenses incurred by the fund during the year ended September 30, 2015, were borne by the underlying Vanguard funds in which the fund invests. The fund’s trustees and officers are also trustees and officers, respectively, of the underlying Vanguard funds, as well as directors and employees, respectively, of Vanguard.
28
Target Retirement 2040 Fund
C. Various inputs may be used to determine the value of the fund’s investments. These inputs are summarized in three broad levels for financial statement purposes. The inputs or methodologies used to value securities are not necessarily an indication of the risk associated with investing in those securities.
Level 1—Quoted prices in active markets for identical securities.
Level 2—Other significant observable inputs (including quoted prices for similar securities, interest rates, prepayment speeds, credit risk, etc.).
Level 3—Significant unobservable inputs (including the fund’s own assumptions used to determine the fair value of investments).
At September 30, 2015, 100% of the market value of the fund’s investments was determined based on Level 1 inputs.
D. Distributions are determined on a tax basis and may differ from net investment income and realized capital gains for financial reporting purposes. Differences may be permanent or temporary. Permanent differences are reclassified among capital accounts in the financial statements to reflect their tax character. Temporary differences arise when certain items of income, expense, gain, or loss are recognized in different periods for financial statement and tax purposes. These differences will reverse at some time in the future. Differences in classification may also result from the treatment of short-term gains as ordinary income for tax purposes.
The fund used a tax accounting practice to treat a portion of the price of capital shares redeemed during the year as distributions from net investment income and realized capital gains. Accordingly, the fund has reclassified $36,542,000 from undistributed net investment income, and $15,211,000 from accumulated net realized gains, to paid-in capital.
For tax purposes, at September 30, 2015, the fund had $255,747,000 of ordinary income and $101,971,000 of long-term capital gains available for distribution.
At September 30, 2015, the cost of investment securities for tax purposes was $13,215,621,000. Net unrealized appreciation of investment securities for tax purposes was $2,511,451,000, consisting of unrealized gains of $3,115,268,000 on securities that had risen in value since their purchase and $603,817,000 in unrealized losses on securities that had fallen in value since their purchase.
E. During the year ended September 30, 2015, the fund purchased $4,461,346,000 of investment securities and sold $3,650,579,000 of investment securities, other than temporary cash investments.
| F. | Capital shares issued and redeemed were: |
| Year Ended September 30, | ||
| 2015 | 2014 | |
| Shares | Shares | |
| (000) | (000) | |
| Issued | 180,154 | 169,864 |
| Issued in Lieu of Cash Distributions | 10,543 | 8,261 |
| Redeemed | (167,343) | (90,018) |
| Net Increase (Decrease) in Shares Outstanding | 23,354 | 88,107 |
29
Target Retirement 2040 Fund
| G. Transactions during the period in affiliated underlying Vanguard funds were as follows: | ||||||
| Current Period Transactions | ||||||
| Sept. 30, | Proceeds | Sept. 30, | ||||
| 2014 | from | Capital Gain | 2015 | |||
| Market | Purchases | Securities | Distributions | Market | ||
| Value | at Cost | Sold1 | Income | Received | Value | |
| ($000) | ($000) | ($000) | ($000) | ($000) | ($000) | |
| Vanguard Market Liquidity Fund | 10,023 | NA 2 | NA 2 | 16 | — | 6,418 |
| Vanguard Total Bond Market II | ||||||
| Index Fund | 1,274,711 | 402,435 | 505,105 | 30,368 | 4,006 | 1,173,838 |
| Vanguard Total International | ||||||
| Bond Index Fund | 318,470 | 326,800 | 146,479 | 6,141 | — | 501,647 |
| Vanguard Total International | ||||||
| Stock Index Fund | 4,262,284 | 2,655,582 | 433,324 | 141,858 | — | 5,615,266 |
| Vanguard Total Stock Market | ||||||
| Index Fund | 10,056,868 | 1,072,752 | 2,561,935 | 186,879 | — | 8,429,903 |
| Total | 15,922,356 | 4,457,569 | 3,646,843 | 365,262 | 4,006 | 15,727,072 |
| 1 Includes net realized gain (loss) on affiliated investment securities sold of $96,830,000. | ||||||
| 2 Not applicable—purchases and sales are for temporary cash investment purposes. | ||||||
H. Management has determined that no material events or transactions occurred subsequent to September 30, 2015, that would require recognition or disclosure in these financial statements.
30
Target Retirement 2045 Fund
Fund Profile
As of September 30, 2015
| Total Fund Characteristics | |
| Ticker Symbol | VTIVX |
| 30-Day SEC Yield | 2.31% |
| Acquired Fund Fees and Expenses1 | 0.18% |
| Allocation to Underlying Vanguard Funds | |
| Vanguard Total Stock Market Index Fund | |
| Investor Shares | 54.0% |
| Vanguard Total International Stock Index | |
| Fund Investor Shares | 36.0 |
| Vanguard Total Bond Market II Index Fund | |
| Investor Shares | 7.0 |
| Vanguard Total International Bond Index | |
| Fund Investor Shares | 3.0 |
| Total Fund Volatility Measures | ||
| Target 2045 | MSCI US | |
| Composite | Broad Market | |
| Index | Index | |
| R-Squared | 1.00 | 0.94 |
| Beta | 1.00 | 0.87 |
These measures show the degree and timing of the fund’s fluctuations compared with the indexes over 36 months.
Fund Asset Allocation
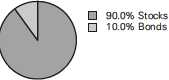
1 This figure—drawn from the prospectus dated January 27, 2015—represents an estimate of the weighted average of the expense ratios and any transaction fees charged by the underlying mutual funds (the ”acquired” funds) in which the Target Retirement 2045 Fund invests. The fund does not charge any expenses or fees of its own. For the fiscal year ended September 30, 2015, the acquired fund fees and expenses were 0.16%.
31
Target Retirement 2045 Fund
Performance Summary
All of the returns in this report represent past performance, which is not a guarantee of future results that may be achieved by the fund. (Current performance may be lower or higher than the performance data cited. For performance data current to the most recent month-end, visit our website at vanguard.com/performance.) Note, too, that both investment returns and principal value can fluctuate widely, so an investor’s shares, when sold, could be worth more or less than their original cost. The returns shown do not reflect taxes that a shareholder would pay on fund distributions or on the sale of fund shares.
Cumulative Performance: September 30, 2005, Through September 30, 2015
Initial Investment of $10,000
| Average Annual Total Returns | |||||
| Periods Ended September 30, 2015 | |||||
| Final Value | |||||
| One | Five | Ten | of a $10,000 | ||
| Year | Years | Years | Investment | ||
| Target Retirement 2045 Fund | -3.49% | 9.19% | 5.73% | $17,459 | |
| •••••••• | Target 2045 Composite Index | -3.37 | 9.42 | 5.85 | 17,651 |
| – – – – | Mixed-Asset Target 2045 Funds | ||||
| -3.73 | 8.03 | 4.91 | 16,156 | ||
| MSCI Average US Broad Market Index | -0.41 | 13.37 | 7.12 | 19,902 | |
| For a benchmark description, see the Glossary. | |||||
| Mixed-Asset Target 2045 Funds Average: Derived from data provided by Lipper, a Thomson Reuters Company. | |||||
See Financial Highlights for dividend and capital gains information.
32
Target Retirement 2045 Fund
Fiscal-Year Total Returns (%): September 30, 2005, Through September 30, 2015
33
Target Retirement 2045 Fund
Financial Statements
Statement of Net Assets
As of September 30, 2015
The fund reports a complete list of its holdings in regulatory filings four times in each fiscal year, at the quarter-ends. For the second and fourth fiscal quarters, the lists appear in the fund’s semiannual and annual reports to shareholders. For the first and third fiscal quarters, the fund files the lists with the Securities and Exchange Commission on Form N-Q. Shareholders can look up the fund’s Forms N-Q on the SEC’s website at sec.gov. Forms N-Q may also be reviewed and copied at the SEC’s Public Reference Room (see the back cover of this report for further information).
| Market | ||
| Value• | ||
| Shares | ($000) | |
| Investment Companies (99.9%) | ||
| U.S. Stock Fund (54.0%) | ||
| Vanguard Total Stock Market Index Fund Investor Shares | 160,627,376 | 7,719,752 |
| International Stock Fund (36.0%) | ||
| Vanguard Total International Stock Index Fund Investor Shares | 361,405,451 | 5,139,185 |
| U.S. Bond Fund (6.9%) | ||
| 1 Vanguard Total Bond Market II Index Fund Investor Shares | 92,448,536 | 994,746 |
| International Bond Fund (3.0%) | ||
| Vanguard Total International Bond Index Fund Investor Shares | 40,168,836 | 424,585 |
| Total Investment Companies (Cost $11,747,202) | 14,278,268 | |
| Temporary Cash Investment (0.1%) | ||
| Money Market Fund (0.1%) | ||
| 1 Vanguard Market Liquidity Fund, 0.189% (Cost $7,954) | 7,953,595 | 7,954 |
| Total Investments (100.0%) (Cost $11,755,156) | 14,286,222 | |
| Amount | ||
| ($000) | ||
| Other Assets and Liabilities (0.0%) | ||
| Other Assets | ||
| Receivables for Investment Securities Sold | 117,092 | |
| Receivables for Accrued Income | 2,523 | |
| Receivables for Capital Shares Issued | 15,100 | |
| Total Other Assets | 134,715 | |
| Liabilities | ||
| Payables for Investment Securities Purchased | (2,508) | |
| Payables for Capital Shares Redeemed | (135,816) | |
| Total Liabilities | (138,324) | |
| Net Assets (100%) | ||
| Applicable to 811,456,422 outstanding $.001 par value shares of | ||
| beneficial interest (unlimited authorization) | 14,282,613 | |
| Net Asset Value Per Share | $17.60 | |
34
| Target Retirement 2045 Fund | |
| At September 30, 2015, net assets consisted of: | |
| Amount | |
| ($000) | |
| Paid-in Capital | 11,425,019 |
| Undistributed Net Investment Income | 213,439 |
| Accumulated Net Realized Gains | 113,089 |
| Unrealized Appreciation (Depreciation) | 2,531,066 |
| Net Assets | 14,282,613 |
- See Note A in Notes to Financial Statements.
- Affiliated fund available only to Vanguard funds and certain trusts and accounts managed by Vanguard. Rate shown for Vanguard Market Liquidity Fund is the 7-day yield.
See accompanying Notes, which are an integral part of the Financial Statements.
35
| Target Retirement 2045 Fund | |
| Statement of Operations | |
| Year Ended | |
| September 30, 2015 | |
| ($000) | |
| Investment Income | |
| Income | |
| Income Distributions Received | 330,836 |
| Other Income | 106 |
| Net Investment Income—Note B | 330,942 |
| Realized Net Gain (Loss) | |
| Capital Gain Distributions Received | 3,643 |
| Investment Securities Sold | 142,653 |
| Realized Net Gain (Loss) | 146,296 |
| Change in Unrealized Appreciation (Depreciation) of Investment Securities | (1,046,669) |
| Net Increase (Decrease) in Net Assets Resulting from Operations | (569,431) |
See accompanying Notes, which are an integral part of the Financial Statements.
36
| Target Retirement 2045 Fund | ||
| Statement of Changes in Net Assets | ||
| Year Ended September 30, | ||
| 2015 | 2014 | |
| ($000) | ($000) | |
| Increase (Decrease) in Net Assets | ||
| Operations | ||
| Net Investment Income | 330,942 | 290,564 |
| Realized Net Gain (Loss) | 146,296 | 8,412 |
| Change in Unrealized Appreciation (Depreciation) | (1,046,669) | 1,216,259 |
| Net Increase (Decrease) in Net Assets Resulting from Operations | (569,431) | 1,515,235 |
| Distributions | ||
| Net Investment Income | (303,599) | (234,723) |
| Realized Capital Gain1 | (2,378) | — |
| Total Distributions | (305,977) | (234,723) |
| Capital Share Transactions | ||
| Issued | 4,573,322 | 3,903,286 |
| Issued in Lieu of Cash Distributions | 301,446 | 231,884 |
| Redeemed | (4,208,051) | (2,365,499) |
| Net Increase (Decrease) from Capital Share Transactions | 666,717 | 1,769,671 |
| Total Increase (Decrease) | (208,691) | 3,050,183 |
| Net Assets | ||
| Beginning of Period | 14,491,304 | 11,441,121 |
| End of Period2 | 14,282,613 | 14,491,304 |
1 Includes fiscal 2015 short-term gain distributions totaling $2,378,000. Short-term gain distributions are treated as ordinary income dividends for tax purposes.
2 Net Assets—End of Period includes undistributed (overdistributed) net investment income of $213,439,000 and $215,739,000.
See accompanying Notes, which are an integral part of the Financial Statements.
37
| Target Retirement 2045 Fund | |||||
| Financial Highlights | |||||
| For a Share Outstanding | Year Ended September 30, | ||||
| Throughout Each Period | 2015 | 2014 | 2013 | 2012 | 2011 |
| Net Asset Value, Beginning of Period | $18.61 | $16.82 | $14.61 | $12.10 | $12.64 |
| Investment Operations | |||||
| Net Investment Income | .406 | .376 | .350 | .354 | .237 |
| Capital Gain Distributions Received | .004 | .001 | .008 | .014 | .005 |
| Net Realized and Unrealized Gain (Loss) | |||||
| on Investments | (1.034) | 1.747 | 2.173 | 2.433 | (.436) |
| Total from Investment Operations | (.624) | 2.124 | 2.531 | 2.801 | (.194) |
| Distributions | |||||
| Dividends from Net Investment Income | (.383) | (.334) | (.316) | (.286) | (.242) |
| Distributions from Realized Capital Gains | (.003) | — | (.005) | (.005) | (.104) |
| Total Distributions | (.386) | (.334) | (.321) | (.291) | (.346) |
| Net Asset Value, End of Period | $17.60 | $18.61 | $16.82 | $14.61 | $12.10 |
| Total Return1 | -3.49% | 12.73% | 17.70% | 23.47% | -1.82% |
| Ratios/Supplemental Data | |||||
| Net Assets, End of Period (Millions) | $14,283 | $14,491 | $11,441 | $8,163 | $5,702 |
| Ratio of Total Expenses to Average Net Assets | — | — | — | — | — |
| Acquired Fund Fees and Expenses | 0.16% | 0.18% | 0.18% | 0.18% | 0.19% |
| Ratio of Net Investment Income to | |||||
| Average Net Assets | 2.10% | 2.17% | 2.36% | 2.70% | 1.79% |
| Portfolio Turnover Rate | 20% | 7% | 10% | 7% | 16%2 |
1 Total returns do not include account service fees that may have applied in the periods shown. Fund prospectuses provide information about any applicable account service fees.
2 Excludes the value of mutual fund shares delivered and received in connection with a change in the fund’s international equity investments from Vanguard European, Pacific, and Emerging Markets Stock Index Funds to Vanguard Total International Stock Index Fund because those transactions were effected in kind and did not cause the fund to incur transaction costs.
See accompanying Notes, which are an integral part of the Financial Statements.
38
Target Retirement 2045 Fund
Notes to Financial Statements
Vanguard Target Retirement 2045 Fund is registered under the Investment Company Act of 1940 as an open-end investment company, or mutual fund. The fund follows a balanced investment strategy by investing in selected Vanguard funds to achieve its targeted allocation of assets to U.S. and international stocks, and U.S. and international bonds. Financial statements and other information about each underlying fund are available on vanguard.com.
A. The following significant accounting policies conform to generally accepted accounting principles for U.S. investment companies. The fund consistently follows such policies in preparing its financial statements.
1. Security Valuation: Investments are valued at the net asset value of each underlying Vanguard fund determined as of the close of the New York Stock Exchange (generally 4 p.m., Eastern time) on the valuation date.
2. Federal Income Taxes: The fund intends to continue to qualify as a regulated investment company and distribute all of its taxable income. Management has analyzed the fund’s tax positions taken for all open federal income tax years (September 30, 2012–2015), and has concluded that no provision for federal income tax is required in the fund’s financial statements.
3. Distributions: Distributions to shareholders are recorded on the ex-dividend date.
4. Credit Facility: The fund and certain other funds managed by The Vanguard Group (“Vanguard”) participate in a $3 billion committed credit facility provided by a syndicate of lenders pursuant to a credit agreement that may be renewed annually; each fund is individually liable for its borrowings, if any, under the credit facility. Borrowings may be utilized for temporary and emergency purposes, and are subject to the fund’s regulatory and contractual borrowing restrictions. The participating funds are charged administrative fees and an annual commitment fee of 0.06% of the undrawn amount of the facility; these fees are allocated to the funds based on a method approved by the fund’s board of trustees and borne by the funds in which the fund invests (see Note B). Any borrowings under this facility bear interest at a rate equal to the higher of the federal funds rate or LIBOR reference rate plus an agreed-upon spread.
The fund had no borrowings outstanding at September 30, 2015, or at any time during the period then ended.
5. Other: Income and capital gain distributions received are recorded on the ex-dividend date. Security transactions are accounted for on the date securities are bought or sold. Costs used to determine realized gains (losses) on the sale of investment securities are those of the specific securities sold.
B. In accordance with the terms of a Funds’ Service Agreement (the “FSA”) between Vanguard and the fund, Vanguard furnishes to the fund investment advisory, corporate management, administrative, marketing, and distribution services at Vanguard’s cost of operations (as defined by the FSA). These costs of operations are allocated to the fund based on methods and guidelines approved by the board of trustees. The FSA provides that expenses otherwise allocable to Vanguard funds-of-funds may be reduced or eliminated to the extent of savings realized by the underlying Vanguard funds by virtue of being part of a fund-of-funds. Accordingly, all expenses for services provided by Vanguard to the fund and all other expenses incurred by the fund during the year ended September 30, 2015, were borne by the underlying Vanguard funds in which the fund invests. The fund’s trustees and officers are also trustees and officers, respectively, of the underlying Vanguard funds, as well as directors and employees, respectively, of Vanguard.
39
Target Retirement 2045 Fund
C. Various inputs may be used to determine the value of the fund’s investments. These inputs are summarized in three broad levels for financial statement purposes. The inputs or methodologies used to value securities are not necessarily an indication of the risk associated with investing in those securities.
Level 1—Quoted prices in active markets for identical securities.
Level 2—Other significant observable inputs (including quoted prices for similar securities, interest rates, prepayment speeds, credit risk, etc.).
Level 3—Significant unobservable inputs (including the fund’s own assumptions used to determine the fair value of investments).
At September 30, 2015, 100% of the market value of the fund’s investments was determined based on Level 1 inputs.
D. Distributions are determined on a tax basis and may differ from net investment income and realized capital gains for financial reporting purposes. Differences may be permanent or temporary. Permanent differences are reclassified among capital accounts in the financial statements to reflect their tax character. Temporary differences arise when certain items of income, expense, gain, or loss are recognized in different periods for financial statement and tax purposes. These differences will reverse at some time in the future. Differences in classification may also result from the treatment of short-term gains as ordinary income for tax purposes.
The fund used a tax accounting practice to treat a portion of the price of capital shares redeemed during the year as distributions from net investment income and realized capital gains. Accordingly, the fund has reclassified $29,643,000 from undistributed net investment income, and $14,663,000 from accumulated net realized gains, to paid-in capital.
The fund used a capital loss carryforward of $15,266,000 to offset taxable capital gains realized during the year ended September 30, 2015, reducing the amount of capital gains that would otherwise be available to distribute to shareholders. For tax purposes, at September 30, 2015, the fund had $228,456,000 of ordinary income and $134,121,000 of long-term capital gains available for distribution.
At September 30, 2015, the cost of investment securities for tax purposes was $11,791,204,000. Net unrealized appreciation of investment securities for tax purposes was $2,495,018,000, consisting of unrealized gains of $3,049,628,000 on securities that had risen in value since their purchase and $554,610,000 in unrealized losses on securities that had fallen in value since their purchase.
E. During the year ended September 30, 2015, the fund purchased $3,797,646,000 of investment securities and sold $3,102,415,000 of investment securities, other than temporary cash investments.
| F. | Capital shares issued and redeemed were: |
| Year Ended September 30, | ||
| 2015 | 2014 | |
| Shares | Shares | |
| (000) | (000) | |
| Issued | 241,435 | 216,231 |
| Issued in Lieu of Cash Distributions | 15,975 | 13,130 |
| Redeemed | (224,761) | (130,624) |
| Net Increase (Decrease) in Shares Outstanding | 32,649 | 98,737 |
40
Target Retirement 2045 Fund
G. Transactions during the period in affiliated underlying Vanguard funds were as follows:
| Current Period Transactions | ||||||
| Sept. 30, | Proceeds | Sept. 30, | ||||
| 2014 | from | Capital Gain | 2015 | |||
| Market | Purchases | Securities | Distributions | Market | ||
| Value | at Cost | Sold1 | Income | Received | Value | |
| ($000) | ($000) | ($000) | ($000) | ($000) | ($000) | |
| Vanguard Market Liquidity Fund | 8,935 | NA 2 | NA 2 | 14 | — | 7,954 |
| Vanguard Total Bond Market II | ||||||
| Index Fund | 1,160,867 | 351,510 | 518,542 | 27,217 | 3,643 | 994,746 |
| Vanguard Total International | ||||||
| Bond Index Fund | 289,934 | 297,252 | 165,169 | 5,463 | — | 424,585 |
| Vanguard Total International | ||||||
| Stock Index Fund | 3,881,078 | 2,328,819 | 288,848 | 128,656 | — | 5,139,185 |
| Vanguard Total Stock Market | ||||||
| Index Fund | 9,155,174 | 817,893 | 2,127,708 | 169,486 | — | 7,719,752 |
| Total | 14,495,988 | 3,795,474 | 3,100,267 | 330,836 | 3,643 | 14,286,222 |
| 1 Includes net realized gain (loss) on affiliated investment securities sold of $142,677,000. | ||||||
| 2 Not applicable—purchases and sales are for temporary cash investment purposes. | ||||||
H. Management has determined that no material events or transactions occurred subsequent to September 30, 2015, that would require recognition or disclosure in these financial statements.
41
Target Retirement 2050 Fund
Fund Profile
As of September 30, 2015
| Total Fund Characteristics | |
| Ticker Symbol | VFIFX |
| 30-Day SEC Yield | 2.31% |
| Acquired Fund Fees and Expenses1 | 0.18% |
| Allocation to Underlying Vanguard Funds | |
| Vanguard Total Stock Market Index Fund | |
| Investor Shares | 54.1% |
| Vanguard Total International Stock Index | |
| Fund Investor Shares | 36.0 |
| Vanguard Total Bond Market II Index Fund | |
| Investor Shares | 6.9 |
| Vanguard Total International Bond Index | |
| Fund Investor Shares | 3.0 |
| Total Fund Volatility Measures | ||
| Target 2050 | MSCI US | |
| Composite | Broad Market | |
| Index | Index | |
| R-Squared | 1.00 | 0.94 |
| Beta | 1.00 | 0.87 |
These measures show the degree and timing of the fund’s fluctuations compared with the indexes over 36 months.
Fund Asset Allocation
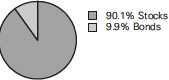
1 This figure—drawn from the prospectus dated January 27, 2015—represents an estimate of the weighted average of the expense ratios and any transaction fees charged by the underlying mutual funds (the ”acquired” funds) in which the Target Retirement 2050 Fund invests. The fund does not charge any expenses or fees of its own. For the fiscal year ended September 30, 2015, the acquired fund fees and expenses were 0.16%.
42
Target Retirement 2050 Fund
Performance Summary
All of the returns in this report represent past performance, which is not a guarantee of future results that may be achieved by the fund. (Current performance may be lower or higher than the performance data cited. For performance data current to the most recent month-end, visit our website at vanguard.com/performance.) Note, too, that both investment returns and principal value can fluctuate widely, so an investor’s shares, when sold, could be worth more or less than their original cost. The returns shown do not reflect taxes that a shareholder would pay on fund distributions or on the sale of fund shares.
Cumulative Performance: June 7, 2006, Through September 30, 2015
Initial Investment of $10,000
| Average Annual Total Returns | |||||
| Periods Ended September 30, 2015 | |||||
| Since | Final Value | ||||
| One | Five | Inception | of a $10,000 | ||
| Year | Years | (6/7/2006) | Investment | ||
| Target Retirement 2050 Fund | -3.46% | 9.18% | 5.69% | $16,747 | |
| •••••••• | Target 2050 Composite Index | -3.37 | 9.42 | 5.80 | 16,912 |
| – – – – | Mixed-Asset Target 2050 Funds | ||||
| -3.72 | 7.83 | 4.53 | 15,113 | ||
| MSCI Average US Broad Market Index | -0.41 | 13.37 | 7.20 | 19,108 | |
| For a benchmark description, see the Glossary. | |||||
| Mixed-Asset Target 2050 Funds Average: Derived from data provided by Lipper, a Thomson Reuters Company. | |||||
| "Since Inception" performance is calculated from the inception date for both the fund and its comparative standards. | |||||
See Financial Highlights for dividend and capital gains information.
43
Target Retirement 2050 Fund
Fiscal-Year Total Returns (%): June 7, 2006, Through September 30, 2015
44
Target Retirement 2050 Fund
Financial Statements
Statement of Net Assets
As of September 30, 2015
The fund reports a complete list of its holdings in regulatory filings four times in each fiscal year, at the quarter-ends. For the second and fourth fiscal quarters, the lists appear in the fund’s semiannual and annual reports to shareholders. For the first and third fiscal quarters, the fund files the lists with the Securities and Exchange Commission on Form N-Q. Shareholders can look up the fund’s Forms N-Q on the SEC’s website at sec.gov. Forms N-Q may also be reviewed and copied at the SEC’s Public Reference Room (see the back cover of this report for further information).
| Market | ||
| Value• | ||
| Shares | ($000) | |
| Investment Companies (99.9%) | ||
| U.S. Stock Fund (54.0%) | ||
| Vanguard Total Stock Market Index Fund Investor Shares | 88,629,418 | 4,259,530 |
| International Stock Fund (36.0%) | ||
| Vanguard Total International Stock Index Fund Investor Shares | 199,716,154 | 2,839,964 |
| U.S. Bond Fund (6.9%) | ||
| 1 Vanguard Total Bond Market II Index Fund Investor Shares | 50,901,927 | 547,705 |
| International Bond Fund (3.0%) | ||
| Vanguard Total International Bond Index Fund Investor Shares | 22,526,791 | 238,108 |
| Total Investment Companies (Cost $6,797,372) | 7,885,307 | |
| Temporary Cash Investment (0.1%) | ||
| Money Market Fund (0.1%) | ||
| 1 Vanguard Market Liquidity Fund, 0.189% (Cost $7,079) | 7,079,123 | 7,079 |
| Total Investments (100.0%) (Cost $6,804,451) | 7,892,386 | |
| Amount | ||
| ($000) | ||
| Other Assets and Liabilities (0.0%) | ||
| Other Assets | ||
| Receivables for Investment Securities Sold | 42,025 | |
| Receivables for Accrued Income | 1,404 | |
| Receivables for Capital Shares Issued | 11,437 | |
| Total Other Assets | 54,866 | |
| Liabilities | ||
| Payables for Investment Securities Purchased | (1,387) | |
| Payables for Capital Shares Redeemed | (53,069) | |
| Total Liabilities | (54,456) | |
| Net Assets (100%) | ||
| Applicable to 282,422,162 outstanding $.001 par value shares of | ||
| beneficial interest (unlimited authorization) | 7,892,796 | |
| Net Asset Value Per Share | $27.95 | |
45
| Target Retirement 2050 Fund | |
| At September 30, 2015, net assets consisted of: | |
| Amount | |
| ($000) | |
| Paid-in Capital | 6,686,449 |
| Undistributed Net Investment Income | 113,040 |
| Accumulated Net Realized Gains | 5,372 |
| Unrealized Appreciation (Depreciation) | 1,087,935 |
| Net Assets | 7,892,796 |
- See Note A in Notes to Financial Statements.
- Affiliated fund available only to Vanguard funds and certain trusts and accounts managed by Vanguard. Rate shown for Vanguard Market Liquidity Fund is the 7-day yield.
See accompanying Notes, which are an integral part of the Financial Statements.
46
| Target Retirement 2050 Fund | |
| Statement of Operations | |
| Year Ended | |
| September 30, 2015 | |
| ($000) | |
| Investment Income | |
| Income | |
| Income Distributions Received | 175,314 |
| Other Income | 63 |
| Net Investment Income—Note B | 175,377 |
| Realized Net Gain (Loss) | |
| Capital Gain Distributions Received | 1,875 |
| Investment Securities Sold | 12,297 |
| Realized Net Gain (Loss) | 14,172 |
| Change in Unrealized Appreciation (Depreciation) of Investment Securities | (527,534) |
| Net Increase (Decrease) in Net Assets Resulting from Operations | (337,985) |
See accompanying Notes, which are an integral part of the Financial Statements.
47
| Target Retirement 2050 Fund | ||
| Statement of Changes in Net Assets | ||
| Year Ended September 30, | ||
| 2015 | 2014 | |
| ($000) | ($000) | |
| Increase (Decrease) in Net Assets | ||
| Operations | ||
| Net Investment Income | 175,377 | 143,739 |
| Realized Net Gain (Loss) | 14,172 | 2,188 |
| Change in Unrealized Appreciation (Depreciation) | (527,534) | 583,773 |
| Net Increase (Decrease) in Net Assets Resulting from Operations | (337,985) | 729,700 |
| Distributions | ||
| Net Investment Income | (153,721) | (108,671) |
| Realized Capital Gain1 | (1,032) | — |
| Total Distributions | (154,753) | (108,671) |
| Capital Share Transactions | ||
| Issued | 3,209,488 | 2,587,083 |
| Issued in Lieu of Cash Distributions | 151,750 | 106,886 |
| Redeemed | (2,364,964) | (1,280,848) |
| Net Increase (Decrease) from Capital Share Transactions | 996,274 | 1,413,121 |
| Total Increase (Decrease) | 503,536 | 2,034,150 |
| Net Assets | ||
| Beginning of Period | 7,389,260 | 5,355,110 |
| End of Period2 | 7,892,796 | 7,389,260 |
1 Includes fiscal 2015 short-term gain distributions totaling $1,032,000. Short-term gain distributions are treated as ordinary income dividends for tax purposes.
2 Net Assets—End of Period includes undistributed (overdistributed) net investment income of $113,040,000 and $108,365,000.
See accompanying Notes, which are an integral part of the Financial Statements.
48
| Target Retirement 2050 Fund | |||||
| Financial Highlights | |||||
| For a Share Outstanding | Year Ended September 30, | ||||
| Throughout Each Period | 2015 | 2014 | 2013 | 2012 | 2011 |
| Net Asset Value, Beginning of Period | $29.53 | $26.69 | $23.16 | $19.17 | $20.10 |
| Investment Operations | |||||
| Net Investment Income | .623 | .586 | .539 | .549 | .360 |
| Capital Gain Distributions Received | .006 | .001 | .012 | .022 | .006 |
| Net Realized and Unrealized Gain (Loss) | |||||
| on Investments | (1.609) | 2.771 | 3.473 | 3.866 | (.682) |
| Total from Investment Operations | (.980) | 3.358 | 4.024 | 4.437 | (.316) |
| Distributions | |||||
| Dividends from Net Investment Income | (.596) | (.518) | (.487) | (.439) | (.370) |
| Distributions from Realized Capital Gains | (.004) | — | (.007) | (.008) | (.244) |
| Total Distributions | (.600) | (.518) | (.494) | (.447) | (.614) |
| Net Asset Value, End of Period | $27.95 | $29.53 | $26.69 | $23.16 | $19.17 |
| Total Return1 | -3.46% | 12.69% | 17.74% | 23.46% | -1.89% |
| Ratios/Supplemental Data | |||||
| Net Assets, End of Period (Millions) | $7,893 | $7,389 | $5,355 | $3,467 | $2,074 |
| Ratio of Total Expenses to Average Net Assets | — | — | — | — | — |
| Acquired Fund Fees and Expenses | 0.16% | 0.18% | 0.18% | 0.18% | 0.19% |
| Ratio of Net Investment Income to | |||||
| Average Net Assets | 2.11% | 2.19% | 2.36% | 2.70% | 1.79% |
| Portfolio Turnover Rate | 18% | 7% | 9% | 4% | 15%2 |
1 Total returns do not include account service fees that may have applied in the periods shown. Fund prospectuses provide information about any applicable account service fees.
2 Excludes the value of mutual fund shares delivered and received in connection with a change in the fund’s international equity investments from Vanguard European, Pacific, and Emerging Markets Stock Index Funds to Vanguard Total International Stock Index Fund because those transactions were effected in kind and did not cause the fund to incur transaction costs.
See accompanying Notes, which are an integral part of the Financial Statements.
49
Target Retirement 2050 Fund
Notes to Financial Statements
Vanguard Target Retirement 2050 Fund is registered under the Investment Company Act of 1940 as an open-end investment company, or mutual fund. The fund follows a balanced investment strategy by investing in selected Vanguard funds to achieve its targeted allocation of assets to U.S. and international stocks, and U.S. and international bonds. Financial statements and other information about each underlying fund are available on vanguard.com.
A. The following significant accounting policies conform to generally accepted accounting principles for U.S. investment companies. The fund consistently follows such policies in preparing its financial statements.
1. Security Valuation: Investments are valued at the net asset value of each underlying Vanguard fund determined as of the close of the New York Stock Exchange (generally 4 p.m., Eastern time) on the valuation date.
2. Federal Income Taxes: The fund intends to continue to qualify as a regulated investment company and distribute all of its taxable income. Management has analyzed the fund’s tax positions taken for all open federal income tax years (September 30, 2012–2015), and has concluded that no provision for federal income tax is required in the fund’s financial statements.
3. Distributions: Distributions to shareholders are recorded on the ex-dividend date.
4. Credit Facility: The fund and certain other funds managed by The Vanguard Group (“Vanguard”) participate in a $3 billion committed credit facility provided by a syndicate of lenders pursuant to a credit agreement that may be renewed annually; each fund is individually liable for its borrowings, if any, under the credit facility. Borrowings may be utilized for temporary and emergency purposes, and are subject to the fund’s regulatory and contractual borrowing restrictions. The participating funds are charged administrative fees and an annual commitment fee of 0.06% of the undrawn amount of the facility; these fees are allocated to the funds based on a method approved by the fund’s board of trustees and borne by the funds in which the fund invests (see Note B). Any borrowings under this facility bear interest at a rate equal to the higher of the federal funds rate or LIBOR reference rate plus an agreed-upon spread.
The fund had no borrowings outstanding at September 30, 2015, or at any time during the period then ended.
5. Other: Income and capital gain distributions received are recorded on the ex-dividend date. Security transactions are accounted for on the date securities are bought or sold. Costs used to determine realized gains (losses) on the sale of investment securities are those of the specific securities sold.
B. In accordance with the terms of a Funds’ Service Agreement (the “FSA”) between Vanguard and the fund, Vanguard furnishes to the fund investment advisory, corporate management, administrative, marketing, and distribution services at Vanguard’s cost of operations (as defined by the FSA). These costs of operations are allocated to the fund based on methods and guidelines approved by the board of trustees. The FSA provides that expenses otherwise allocable to Vanguard funds-of-funds may be reduced or eliminated to the extent of savings realized by the underlying Vanguard funds by virtue of being part of a fund-of-funds. Accordingly, all expenses for services provided by Vanguard to the fund and all other expenses incurred by the fund during the year ended September 30, 2015, were borne by the underlying Vanguard funds in which the fund invests. The fund’s trustees and officers are also trustees and officers, respectively, of the underlying Vanguard funds, as well as directors and employees, respectively, of Vanguard.
50
Target Retirement 2050 Fund
C. Various inputs may be used to determine the value of the fund’s investments. These inputs are summarized in three broad levels for financial statement purposes. The inputs or methodologies used to value securities are not necessarily an indication of the risk associated with investing in those securities.
Level 1—Quoted prices in active markets for identical securities.
Level 2—Other significant observable inputs (including quoted prices for similar securities, interest rates, prepayment speeds, credit risk, etc.).
Level 3—Significant unobservable inputs (including the fund’s own assumptions used to determine the fair value of investments).
At September 30, 2015, 100% of the market value of the fund’s investments was determined based on Level 1 inputs.
D. Distributions are determined on a tax basis and may differ from net investment income and realized capital gains for financial reporting purposes. Differences may be permanent or temporary. Permanent differences are reclassified among capital accounts in the financial statements to reflect their tax character. Temporary differences arise when certain items of income, expense, gain, or loss are recognized in different periods for financial statement and tax purposes. These differences will reverse at some time in the future. Differences in classification may also result from the treatment of short-term gains as ordinary income for tax purposes.
The fund used a tax accounting practice to treat a portion of the price of capital shares redeemed during the year as distributions from net investment income and realized capital gains. Accordingly, the fund has reclassified $16,981,000 from undistributed net investment income, and $2,563,000 from accumulated net realized gains, to paid-in capital.
The fund used a capital loss carryforward of $3,440,000 to offset taxable capital gains realized during the year ended September 30, 2015, reducing the amount of capital gains that would otherwise be available to distribute to shareholders. For tax purposes, at September 30, 2015, the fund had $125,676,000 of ordinary income and $11,573,000 of long-term capital gains available for distribution.
At September 30, 2015, the cost of investment securities for tax purposes was $6,823,288,000. Net unrealized appreciation of investment securities for tax purposes was $1,069,098,000, consisting of unrealized gains of $1,388,888,000 on securities that had risen in value since their purchase and $319,790,000 in unrealized losses on securities that had fallen in value since their purchase.
E. During the year ended September 30, 2015, the fund purchased $2,528,541,000 of investment securities and sold $1,518,895,000 of investment securities, other than temporary cash investments.
| F. | Capital shares issued and redeemed were: |
| Year Ended September 30, | ||
| 2015 | 2014 | |
| Shares | Shares | |
| (000) | (000) | |
| Issued | 106,713 | 90,220 |
| Issued in Lieu of Cash Distributions | 5,063 | 3,813 |
| Redeemed | (79,571) | (44,461) |
| Net Increase (Decrease) in Shares Outstanding | 32,205 | 49,572 |
51
Target Retirement 2050 Fund
| G. Transactions during the period in affiliated underlying Vanguard funds were as follows: | ||||||
| Current Period Transactions | ||||||
| Sept. 30, | Proceeds | Sept. 30, | ||||
| 2014 | from | Capital Gain | 2015 | |||
| Market | Purchases | Securities | Distributions | Market | ||
| Value | at Cost | Sold1 | Income | Received | Value | |
| ($000) | ($000) | ($000) | ($000) | ($000) | ($000) | |
| Vanguard Market Liquidity Fund | 5,041 | NA2 | NA 2 | 10 | — | 7,079 |
| Vanguard Total Bond Market II | ||||||
| Index Fund | 599,028 | 218,602 | 270,408 | 14,263 | 1,875 | 547,705 |
| Vanguard Total International | ||||||
| Bond Index Fund | 147,582 | 175,992 | 86,311 | 2,934 | — | 238,108 |
| Vanguard Total International | ||||||
| Stock Index Fund | 1,990,809 | 1,443,367 | 163,162 | 68,820 | — | 2,839,964 |
| Vanguard Total Stock Market | ||||||
| Index Fund | 4,653,479 | 689,730 | 998,173 | 89,287 | — | 4,259,530 |
| Total | 7,395,939 | 2,527,691 | 1,518,054 | 175,314 | 1,875 | 7,892,386 |
| 1 Includes net realized gain (loss) on affiliated investment securities sold of $12,306,000. | ||||||
| 2 Not applicable—purchases and sales are for temporary cash investment purposes. | ||||||
H. Management has determined that no material events or transactions occurred subsequent to September 30, 2015, that would require recognition or disclosure in these financial statements.
52
Target Retirement 2055 Fund
Fund Profile
As of September 30, 2015
| Total Fund Characteristics | |
| Ticker Symbol | VFFVX |
| 30-Day SEC Yield | 2.31% |
| Acquired Fund Fees and Expenses1 | 0.18% |
| Allocation to Underlying Vanguard Funds | |
| Vanguard Total Stock Market Index Fund | |
| Investor Shares | 53.9% |
| Vanguard Total International Stock Index | |
| Fund Investor Shares | 36.0 |
| Vanguard Total Bond Market II Index Fund | |
| Investor Shares | 7.1 |
| Vanguard Total International Bond Index | |
| Fund Investor Shares | 3.0 |
| Total Fund Volatility Measures | ||
| Target 2055 | MSCI US | |
| Composite | Broad Market | |
| Index | Index | |
| R-Squared | 1.00 | 0.94 |
| Beta | 1.00 | 0.87 |
These measures show the degree and timing of the fund’s fluctuations compared with the indexes over 36 months.
Fund Asset Allocation
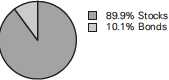
1 This figure—drawn from the prospectus dated January 27, 2015—represents an estimate of the weighted average of the expense ratios and any transaction fees charged by the underlying mutual funds (the ”acquired” funds) in which the Target Retirement 2055 Fund invests. The fund does not charge any expenses or fees of its own. For the fiscal year ended September 30, 2015, the acquired fund fees and expenses were 0.16%.
53
Target Retirement 2055 Fund
Performance Summary
All of the returns in this report represent past performance, which is not a guarantee of future results that may be achieved by the fund. (Current performance may be lower or higher than the performance data cited. For performance data current to the most recent month-end, visit our website at vanguard.com/performance.) Note, too, that both investment returns and principal value can fluctuate widely, so an investor’s shares, when sold, could be worth more or less than their original cost. The returns shown do not reflect taxes that a shareholder would pay on fund distributions or on the sale of fund shares.
Cumulative Performance: August 18, 2010, Through September 30, 2015
Initial Investment of $10,000
| Average Annual Total Returns | |||||
| Periods Ended September 30, 2015 | |||||
| Since | Final Value | ||||
| One | Five | Inception | of a $10,000 | ||
| Year | Years | (8/18/2010) | Investment | ||
| Target Retirement 2055 Fund | -3.58% | 9.24% | 10.04% | $16,318 | |
| •••••••• | Target 2055 Composite Index | -3.37 | 9.42 | 10.25 | 16,477 |
| – – – – | Spliced Mixed-Asset Target 2055+ | ||||
| -3.45 | 8.07 | 8.89 | 15,464 | ||
| MSCI Funds US Average Broad Market Index | -0.41 | 13.37 | 14.14 | 19,678 | |
| For a benchmark description, see the Glossary. | |||||
| Spliced Mixed-Asset Target 2055+ Funds Average: Derived from data provided by Lipper, a Thomson Reuters Company. | |||||
| "Since Inception" performance is calculated from the inception date for both the fund and its comparative standards. | |||||
See Financial Highlights for dividend and capital gains information.
54
Target Retirement 2055 Fund
Fiscal-Year Total Returns (%): August 18, 2010, Through September 30, 2015
55
Target Retirement 2055 Fund
Financial Statements
Statement of Net Assets
As of September 30, 2015
The fund reports a complete list of its holdings in regulatory filings four times in each fiscal year, at the quarter-ends. For the second and fourth fiscal quarters, the lists appear in the fund’s semiannual and annual reports to shareholders. For the first and third fiscal quarters, the fund files the lists with the Securities and Exchange Commission on Form N-Q. Shareholders can look up the fund’s Forms N-Q on the SEC’s website at sec.gov. Forms N-Q may also be reviewed and copied at the SEC’s Public Reference Room (see the back cover of this report for further information).
| Market | ||
| Value• | ||
| Shares | ($000) | |
| Investment Companies (99.9%) | ||
| U.S. Stock Fund (53.9%) | ||
| Vanguard Total Stock Market Index Fund Investor Shares | 25,568,889 | 1,228,841 |
| International Stock Fund (36.0%) | ||
| Vanguard Total International Stock Index Fund Investor Shares | 57,629,390 | 819,490 |
| U.S. Bond Fund (7.0%) | ||
| 1 Vanguard Total Bond Market II Index Fund Investor Shares | 14,938,677 | 160,740 |
| International Bond Fund (3.0%) | ||
| Vanguard Total International Bond Index Fund Investor Shares | 6,486,561 | 68,563 |
| Total Investment Companies (Cost $2,217,310) | 2,277,634 | |
| Temporary Cash Investment (0.2%) | ||
| Money Market Fund (0.2%) | ||
| 1 Vanguard Market Liquidity Fund, 0.189% (Cost $3,549) | 3,548,846 | 3,549 |
| Total Investments (100.1%) (Cost $2,220,859) | 2,281,183 | |
| Amount | ||
| ($000) | ||
| Other Assets and Liabilities (-0.1%) | ||
| Other Assets | ||
| Receivables for Investment Securities Sold | 12,883 | |
| Receivables for Accrued Income | 439 | |
| Receivables for Capital Shares Issued | 4,910 | |
| Total Other Assets | 18,232 | |
| Liabilities | ||
| Payables for Investment Securities Purchased | (398) | |
| Payables for Capital Shares Redeemed | (20,418) | |
| Total Liabilities | (20,816) | |
| Net Assets (100%) | ||
| Applicable to 75,599,322 outstanding $.001 par value shares of | ||
| beneficial interest (unlimited authorization) | 2,278,599 | |
| Net Asset Value Per Share | $30.14 | |
56
| Target Retirement 2055 Fund | |
| At September 30, 2015, net assets consisted of: | |
| Amount | |
| ($000) | |
| Paid-in Capital | 2,193,211 |
| Undistributed Net Investment Income | 31,449 |
| Accumulated Net Realized Losses | (6,385) |
| Unrealized Appreciation (Depreciation) | 60,324 |
| Net Assets | 2,278,599 |
- See Note A in Notes to Financial Statements.
- Affiliated fund available only to Vanguard funds and certain trusts and accounts managed by Vanguard. Rate shown for Vanguard Market Liquidity Fund is the 7-day yield.
See accompanying Notes, which are an integral part of the Financial Statements.
57
| Target Retirement 2055 Fund | |
| Statement of Operations | |
| Year Ended | |
| September 30, 2015 | |
| ($000) | |
| Investment Income | |
| Income | |
| Income Distributions Received | 47,039 |
| Other Income | 40 |
| Net Investment Income—Note B | 47,079 |
| Realized Net Gain (Loss) | |
| Capital Gain Distributions Received | 454 |
| Affiliated Investment Securities Sold | (5,749) |
| Futures Contracts | 90 |
| Realized Net Gain (Loss) | (5,205) |
| Change in Unrealized Appreciation (Depreciation) of Investment Securities | (159,464) |
| Net Increase (Decrease) in Net Assets Resulting from Operations | (117,590) |
See accompanying Notes, which are an integral part of the Financial Statements.
58
| Target Retirement 2055 Fund | ||
| Statement of Changes in Net Assets | ||
| Year Ended September 30, | ||
| 2015 | 2014 | |
| ($000) | ($000) | |
| Increase (Decrease) in Net Assets | ||
| Operations | ||
| Net Investment Income | 47,079 | 29,476 |
| Realized Net Gain (Loss) | (5,205) | (194) |
| Change in Unrealized Appreciation (Depreciation) | (159,464) | 108,847 |
| Net Increase (Decrease) in Net Assets Resulting from Operations | (117,590) | 138,129 |
| Distributions | ||
| Net Investment Income | (31,961) | (17,283) |
| Realized Capital Gain1 | (346) | (145) |
| Total Distributions | (32,307) | (17,428) |
| Capital Share Transactions | ||
| Issued | 1,400,909 | 928,250 |
| Issued in Lieu of Cash Distributions | 31,653 | 17,158 |
| Redeemed | (673,689) | (311,373) |
| Net Increase (Decrease) from Capital Share Transactions | 758,873 | 634,035 |
| Total Increase (Decrease) | 608,976 | 754,736 |
| Net Assets | ||
| Beginning of Period | 1,669,623 | 914,887 |
| End of Period2 | 2,278,599 | 1,669,623 |
1 Includes fiscal 2015 short-term gain distributions totaling $288,000. Short-term gain distributions are treated as ordinary income dividends for tax purposes.
2 Net Assets—End of Period includes undistributed (overdistributed) net investment income of $31,449,000 and $21,039,000.
See accompanying Notes, which are an integral part of the Financial Statements.
59
| Target Retirement 2055 Fund | |||||
| Financial Highlights | |||||
| For a Share Outstanding | Year Ended September 30, | ||||
| Throughout Each Period | 2015 | 2014 | 2013 | 2012 | 2011 |
| Net Asset Value, Beginning of Period | $31.80 | $28.67 | $24.81 | $20.45 | $20.98 |
| Investment Operations | |||||
| Net Investment Income | .631 | .577 | .6411 | .540 | .3881 |
| Capital Gain Distributions Received | .005 | .001 | .0111 | .022 | .001 |
| Net Realized and Unrealized Gain (Loss) | |||||
| on Investments | (1.736) | 3.033 | 3.668 | 4.202 | (.698) |
| Total from Investment Operations | (1.100) | 3.611 | 4.320 | 4.764 | (.309) |
| Distributions | |||||
| Dividends from Net Investment Income | (.554) | (.477) | (.447) | (.391) | (.179) |
| Distributions from Realized Capital Gains | (.006) | (.004) | (.013) | (.013) | (.042) |
| Total Distributions | (.560) | (.481) | (.460) | (.404) | (.221) |
| Net Asset Value, End of Period | $30.14 | $31.80 | $28.67 | $24.81 | $20.45 |
| Total Return2 | -3.58% | 12.69% | 17.73% | 23.56% | -1.58% |
| Ratios/Supplemental Data | |||||
| Net Assets, End of Period (Millions) | $2,279 | $1,670 | $915 | $381 | $124 |
| Ratio of Total Expenses to Average Net Assets | — | — | — | — | — |
| Acquired Fund Fees and Expenses | 0.16% | 0.18% | 0.18% | 0.18% | 0.19% |
| Ratio of Net Investment Income to | |||||
| Average Net Assets | 2.17% | 2.22% | 2.39% | 2.76% | 1.71% |
| Portfolio Turnover Rate | 18% | 7% | 9% | 3% | 12%3 |
1 Calculated based on average shares outstanding.
2 Total returns do not include account service fees that may have applied in the periods shown. Fund prospectuses provide information about any applicable account service fees.
3 Excludes the value of mutual fund shares delivered and received in connection with a change in the fund’s international equity investments from Vanguard European, Pacific, and Emerging Markets Stock Index Funds to Vanguard Total International Stock Index Fund because those transactions were effected in kind and did not cause the fund to incur transaction costs.
See accompanying Notes, which are an integral part of the Financial Statements.
60
Target Retirement 2055 Fund
Notes to Financial Statements
Vanguard Target Retirement 2055 Fund is registered under the Investment Company Act of 1940 as an open-end investment company, or mutual fund. The fund follows a balanced investment strategy by investing in selected Vanguard funds to achieve its targeted allocation of assets to U.S. and international stocks, and U.S. and international bonds. Financial statements and other information about each underlying fund are available on vanguard.com.
A. The following significant accounting policies conform to generally accepted accounting principles for U.S. investment companies. The fund consistently follows such policies in preparing its financial statements.
1. Security Valuation: Investments are valued at the net asset value of each underlying Vanguard fund determined as of the close of the New York Stock Exchange (generally 4 p.m., Eastern time) on the valuation date.
2. Futures Contracts: The fund uses stock and bond futures contracts to a limited extent, with the objectives of maintaining full exposure to the market and maintaining its target asset allocation. The primary risks associated with the use of futures contracts are imperfect correlation between changes in market values of investments held by the fund and the prices of futures contracts, and the possibility of an illiquid market. Counterparty risk involving futures is mitigated because a regulated clearinghouse is the counterparty instead of the clearing broker. To further mitigate counterparty risk, the fund trades futures contracts on an exchange, monitors the financial strength of its clearing brokers and clearinghouse, and has entered into clearing agreements with its clearing brokers. The clearinghouse imposes initial margin requirements to secure the fund’s performance and requires daily settlement of variation margin representing changes in the market value of each contract.
Futures contracts are valued at their quoted daily settlement prices. The aggregate settlement values of the contracts are not recorded in the Statement of Net Assets. Fluctuations in the value of the contracts are recorded in the Statement of Net Assets as an asset (liability) and in the Statement of Operations as unrealized appreciation (depreciation) until the contracts are closed, when they are recorded as realized futures gains (losses).
During the period ended September 30, 2015, the fund’s average investments in long and short futures contracts each represented 0% of net assets, based on the average of aggregate settlement values at each quarter-end during the period. The fund had no open futures contracts at September 30, 2015.
3. Federal Income Taxes: The fund intends to continue to qualify as a regulated investment company and distribute all of its taxable income. Management has analyzed the fund’s tax positions taken for all open federal income tax years (September 30, 2012–2015), and has concluded that no provision for federal income tax is required in the fund’s financial statements.
4. Distributions: Distributions to shareholders are recorded on the ex-dividend date.
5. Credit Facility: The fund and certain other funds managed by The Vanguard Group (“Vanguard”) participate in a $3 billion committed credit facility provided by a syndicate of lenders pursuant to a credit agreement that may be renewed annually; each fund is individually liable for its borrowings, if any, under the credit facility. Borrowings may be utilized for temporary and emergency purposes, and are subject to the fund’s regulatory and contractual borrowing restrictions. The participating funds are charged administrative fees and an annual commitment fee of 0.06% of the undrawn amount of the facility; these fees are allocated to the funds based on a method approved by the fund’s board of trustees and borne by the funds in which the fund invests (see Note B). Any borrowings under this facility bear interest at a rate equal to the higher of the federal funds rate or LIBOR reference rate plus an agreed-upon spread.
61
Target Retirement 2055 Fund
The fund had no borrowings outstanding at September 30, 2015, or at any time during the period then ended.
6. Other: Income and capital gain distributions received are recorded on the ex-dividend date. Security transactions are accounted for on the date securities are bought or sold. Costs used to determine realized gains (losses) on the sale of investment securities are those of the specific securities sold.
B. In accordance with the terms of a Funds’ Service Agreement (the “FSA”) between Vanguard and the fund, Vanguard furnishes to the fund investment advisory, corporate management, administrative, marketing, and distribution services at Vanguard’s cost of operations (as defined by the FSA). These costs of operations are allocated to the fund based on methods and guidelines approved by the board of trustees. The FSA provides that expenses otherwise allocable to Vanguard funds-of-funds may be reduced or eliminated to the extent of savings realized by the underlying Vanguard funds by virtue of being part of a fund-of-funds. Accordingly, all expenses for services provided by Vanguard to the fund and all other expenses incurred by the fund during the year ended September 30, 2015, were borne by the underlying Vanguard funds in which the fund invests. The fund’s trustees and officers are also trustees and officers, respectively, of the underlying Vanguard funds, as well as directors and employees, respectively, of Vanguard.
C. Various inputs may be used to determine the value of the fund’s investments. These inputs are summarized in three broad levels for financial statement purposes. The inputs or methodologies used to value securities are not necessarily an indication of the risk associated with investing in those securities.
Level 1—Quoted prices in active markets for identical securities.
Level 2—Other significant observable inputs (including quoted prices for similar securities, interest rates, prepayment speeds, credit risk, etc.).
Level 3—Significant unobservable inputs (including the fund’s own assumptions used to determine the fair value of investments).
At September 30, 2015, 100% of the market value of the fund’s investments was determined based on Level 1 inputs.
D. Distributions are determined on a tax basis and may differ from net investment income and realized capital gains for financial reporting purposes. Differences may be permanent or temporary. Permanent differences are reclassified among capital accounts in the financial statements to reflect their tax character. Temporary differences arise when certain items of income, expense, gain, or loss are recognized in different periods for financial statement and tax purposes. These differences will reverse at some time in the future. Differences in classification may also result from the treatment of short-term gains as ordinary income for tax purposes.
The fund used a tax accounting practice to treat a portion of the price of capital shares redeemed during the year as distributions from net investment income and realized capital gains. Accordingly, the fund has reclassified $4,708,000 from undistributed net investment income, and $185,000 from accumulated net realized gains, to paid-in capital.
For tax purposes, at September 30, 2015, the fund had $31,527,000 of ordinary income and $418,000 of long-term capital gains available for distribution.
At September 30, 2015, the cost of investment securities for tax purposes was $2,227,739,000. Net unrealized appreciation of investment securities for tax purposes was $53,444,000, consisting of unrealized gains of $164,467,000 on securities that had risen in value since their purchase and $111,023,000 in unrealized losses on securities that had fallen in value since their purchase.
62
| Target Retirement 2055 Fund | ||||||
| E. Capital shares issued and redeemed were: | ||||||
| Year Ended September 30, | ||||||
| 2015 | 2014 | |||||
| Shares | Shares | |||||
| (000) | (000) | |||||
| Issued | 43,184 | 30,025 | ||||
| Issued in Lieu of Cash Distributions | 978 | 569 | ||||
| Redeemed | (21,062) | (10,007) | ||||
| Net Increase (Decrease) in Shares Outstanding | 23,100 | 20,587 | ||||
| F. Transactions during the period in affiliated underlying Vanguard funds were as follows: | ||||||
| Current Period Transactions | ||||||
| Sept. 30, | Proceeds | Sept. 30, | ||||
| 2014 | from | Capital Gain | 2015 | |||
| Market | Purchases | Securities | Distributions | Market | ||
| Value | at Cost | Sold | Income | Received | Value | |
| ($000) | ($000) | ($000) | ($000) | ($000) | ($000) | |
| Vanguard Market Liquidity Fund | 2,341 | NA1 | NA1 | 5 | — | 3,549 |
| Vanguard Total Bond Market II | ||||||
| Index Fund | 133,540 | 120,207 | 92,974 | 3,678 | 454 | 160,740 |
| Vanguard Total International | ||||||
| Bond Index Fund | 33,353 | 60,080 | 24,678 | 783 | — | 68,563 |
| Vanguard Total International | ||||||
| Stock Index Fund | 450,284 | 573,843 | 78,276 | 19,254 | — | 819,490 |
| Vanguard Total Stock Market | ||||||
| Index Fund | 1,049,374 | 411,646 | 193,552 | 23,319 | — | 1,228,841 |
| Total | 1,668,892 | 1,165,776 | 389,480 | 47,039 | 454 | 2,281,183 |
| 1 Not applicable—purchases and sales are for temporary cash investment purposes. | ||||||
G. Management has determined that no material events or transactions occurred subsequent to September 30, 2015, that would require recognition or disclosure in these financial statements.
63
Target Retirement 2060 Fund
Fund Profile
As of September 30, 2015
| Total Fund Characteristics | |
| Ticker Symbol | VTTSX |
| 30-Day SEC Yield | 2.31% |
| Acquired Fund Fees and Expenses1 | 0.18% |
| Allocation to Underlying Vanguard Funds | |
| Vanguard Total Stock Market Index Fund | |
| Investor Shares | 54.0% |
| Vanguard Total International Stock Index | |
| Fund Investor Shares | 36.1 |
| Vanguard Total Bond Market II Index Fund | |
| Investor Shares | 6.9 |
| Vanguard Total International Bond Index | |
| Fund Investor Shares | 3.0 |
| Total Fund Volatility Measures | ||
| Target 2060 | MSCI US | |
| Composite | Broad Market | |
| Index | Index | |
| R-Squared | 1.00 | 0.94 |
| Beta | 1.00 | 0.87 |
These measures show the degree and timing of the fund’s fluctuations compared with the indexes over 36 months.
Fund Asset Allocation

1 This figure—drawn from the prospectus dated January 27, 2015—represents an estimate of the weighted average of the expense ratios and any transaction fees charged by the underlying mutual funds (the ”acquired” funds) in which the Target Retirement 2060 Fund invests. The fund does not charge any expenses or fees of its own. For the fiscal year ended September 30, 2015, the acquired fund fees and expenses were 0.16%.
64
Target Retirement 2060 Fund
Performance Summary
All of the returns in this report represent past performance, which is not a guarantee of future results that may be achieved by the fund. (Current performance may be lower or higher than the performance data cited. For performance data current to the most recent month-end, visit our website at vanguard.com/performance.) Note, too, that both investment returns and principal value can fluctuate widely, so an investor’s shares, when sold, could be worth more or less than their original cost. The returns shown do not reflect taxes that a shareholder would pay on fund distributions or on the sale of fund shares.
Cumulative Performance: January 19, 2012, Through September 30, 2015
Initial Investment of $10,000
| Average Annual Total Returns | ||||
| Periods Ended September 30, 2015 | ||||
| Since | Final Value | |||
| One | Inception | of a $10,000 | ||
| Year | (1/19/2012) | Investment | ||
| Target Retirement 2060 Fund | -3.61% | 9.32% | $13,901 | |
| •••••••• | Target 2060 Composite Index | -3.37 | 9.55 | 14,011 |
| – – – – | Spliced Mixed-Asset Target 2055+ | |||
| -3.45 | 8.38 | 13,464 | ||
| MSCI Funds US Average Broad Market Index | -0.41 | 13.18 | 15,801 | |
| For a benchmark description, see the Glossary. | ||||
| Spliced Mixed-Asset Target 2055+ Funds Average: Derived from data provided by Lipper, a Thomson Reuters Company. | ||||
| "Since Inception" performance is calculated from the inception date for both the fund and its comparative standards. | ||||
See Financial Highlights for dividend and capital gains information.
65
Target Retirement 2060 Fund
Fiscal-Year Total Returns (%): January 19, 2012, Through September 30, 2015
66
Target Retirement 2060 Fund
Financial Statements
Statement of Net Assets
As of September 30, 2015
The fund reports a complete list of its holdings in regulatory filings four times in each fiscal year, at the quarter-ends. For the second and fourth fiscal quarters, the lists appear in the fund’s semiannual and annual reports to shareholders. For the first and third fiscal quarters, the fund files the lists with the Securities and Exchange Commission on Form N-Q. Shareholders can look up the fund’s Forms N-Q on the SEC’s website at sec.gov. Forms N-Q may also be reviewed and copied at the SEC’s Public Reference Room (see the back cover of this report for further information).
| Market | ||
| Value• | ||
| Shares | ($000) | |
| Investment Companies (100.0%) | ||
| U.S. Stock Fund (54.0%) | ||
| Vanguard Total Stock Market Index Fund Investor Shares | 8,241,100 | 396,067 |
| International Stock Fund (36.1%) | ||
| Vanguard Total International Stock Index Fund Investor Shares | 18,604,290 | 264,553 |
| U.S. Bond Fund (6.9%) | ||
| 1 Vanguard Total Bond Market II Index Fund Investor Shares | 4,707,133 | 50,649 |
| International Bond Fund (3.0%) | ||
| Vanguard Total International Bond Index Fund Investor Shares | 2,046,229 | 21,629 |
| Total Investment Companies (Cost $740,657) | 732,898 | |
| Temporary Cash Investment (0.1%) | ||
| Money Market Fund (0.1%) | ||
| 1 Vanguard Market Liquidity Fund, 0.189% (Cost $1,082) | 1,081,522 | 1,082 |
| Total Investments (100.1%) (Cost $741,739) | 733,980 | |
| Amount | ||
| ($000) | ||
| Other Assets and Liabilities (-0.1%) | ||
| Other Assets | ||
| Receivables for Investment Securities Sold | 915 | |
| Receivables for Accrued Income | 126 | |
| Receivables for Capital Shares Issued | 1,835 | |
| Total Other Assets | 2,876 | |
| Liabilities | ||
| Payables for Investment Securities Purchased | (126) | |
| Payables for Capital Shares Redeemed | (3,409) | |
| Total Liabilities | (3,535) | |
| Net Assets (100%) | ||
| Applicable to 27,585,391 outstanding $.001 par value shares of | ||
| beneficial interest (unlimited authorization) | 733,321 | |
| Net Asset Value Per Share | $26.58 | |
67
| Target Retirement 2060 Fund | |
| At September 30, 2015, net assets consisted of: | |
| Amount | |
| ($000) | |
| Paid-in Capital | 731,789 |
| Undistributed Net Investment Income | 9,830 |
| Accumulated Net Realized Losses | (539) |
| Unrealized Appreciation (Depreciation) | (7,759) |
| Net Assets | 733,321 |
- See Note A in Notes to Financial Statements.
- Affiliated fund available only to Vanguard funds and certain trusts and accounts managed by Vanguard. Rate shown for Vanguard Market Liquidity Fund is the 7-day yield.
See accompanying Notes, which are an integral part of the Financial Statements.
68
| Target Retirement 2060 Fund | |
| Statement of Operations | |
| Year Ended | |
| September 30, 2015 | |
| ($000) | |
| Investment Income | |
| Income | |
| Income Distributions Received | 14,507 |
| Net Investment Income—Note B | 14,507 |
| Realized Net Gain (Loss) | |
| Capital Gain Distributions Received | 134 |
| Affiliated Investment Securities Sold | (332) |
| Realized Net Gain (Loss) | (198) |
| Change in Unrealized Appreciation (Depreciation) of Investment Securities | (52,110) |
| Net Increase (Decrease) in Net Assets Resulting from Operations | (37,801) |
See accompanying Notes, which are an integral part of the Financial Statements.
69
| Target Retirement 2060 Fund | ||
| Statement of Changes in Net Assets | ||
| Year Ended September 30, | ||
| 2015 | 2014 | |
| ($000) | ($000) | |
| Increase (Decrease) in Net Assets | ||
| Operations | ||
| Net Investment Income | 14,507 | 8,027 |
| Realized Net Gain (Loss) | (198) | (20) |
| Change in Unrealized Appreciation (Depreciation) | (52,110) | 27,610 |
| Net Increase (Decrease) in Net Assets Resulting from Operations | (37,801) | 35,617 |
| Distributions | ||
| Net Investment Income | (8,995) | (3,832) |
| Realized Capital Gain1 | (136) | (10) |
| Total Distributions | (9,131) | (3,842) |
| Capital Share Transactions | ||
| Issued | 523,888 | 355,026 |
| Issued in Lieu of Cash Distributions | 8,983 | 3,794 |
| Redeemed | (238,028) | (122,342) |
| Net Increase (Decrease) from Capital Share Transactions | 294,843 | 236,478 |
| Total Increase (Decrease) | 247,911 | 268,253 |
| Net Assets | ||
| Beginning of Period | 485,410 | 217,157 |
| End of Period2 | 733,321 | 485,410 |
1 Includes fiscal 2015 short-term gain distributions totaling $116,000. Short-term gain distributions are treated as ordinary income dividends for tax purposes.
2 Net Assets—End of Period includes undistributed (overdistributed) net investment income of $9,830,000 and $5,769,000.
See accompanying Notes, which are an integral part of the Financial Statements.
70
| Target Retirement 2060 Fund | ||||
| Financial Highlights | ||||
| Jan. 19, | ||||
| 20121 to | ||||
| Year Ended September 30, | Sept. 30, | |||
| For a Share Outstanding Throughout Each Period | 2015 | 2014 | 2013 | 2012 |
| Net Asset Value, Beginning of Period | $28.03 | $25.21 | $21.74 | $20.00 |
| Investment Operations | ||||
| Net Investment Income | .540 | .6152 | .5812 | .218 |
| Capital Gain Distributions Received | .004 | .0012 | .0072 | .002 |
| Net Realized and Unrealized Gain (Loss) on Investments | (1.523) | 2.572 | 3.203 | 1.520 |
| Total from Investment Operations | (.979) | 3.188 | 3.791 | 1.740 |
| Distributions | ||||
| Dividends from Net Investment Income | (.464) | (.367) | (.315) | — |
| Distributions from Realized Capital Gains | (.007) | (.001) | (.006) | — |
| Total Distributions | (.471) | (.368) | (.321) | — |
| Net Asset Value, End of Period | $26.58 | $28.03 | $25.21 | $21.74 |
| Total Return3 | -3.61% | 12.72% | 17.69% | 8.70% |
| Ratios/Supplemental Data | ||||
| Net Assets, End of Period (Millions) | $733 | $485 | $217 | $33 |
| Ratio of Total Expenses to Average Net Assets | — | — | — | — |
| Acquired Fund Fees and Expenses | 0.16% | 0.18% | 0.18% | 0.18%4 |
| Ratio of Net Investment Income to Average Net Assets | 2.19% | 2.25% | 2.45% | 2.99%4 |
| Portfolio Turnover Rate | 21% | 11% | 10% | 40% |
| 1 | Inception. |
| 2 | Calculated based on average shares outstanding. |
| 3 | Total returns do not include transaction fees that may have applied in the periods shown. Fund prospectuses provide information about any applicable transaction fees. |
| 4 | Annualized. |
See accompanying Notes, which are an integral part of the Financial Statements.
71
Target Retirement 2060 Fund
Notes to Financial Statements
Vanguard Target Retirement 2060 Fund is registered under the Investment Company Act of 1940 as an open-end investment company, or mutual fund. The fund follows a balanced investment strategy by investing in selected Vanguard funds to achieve its targeted allocation of assets to U.S. and international stocks, and U.S. and international bonds. Financial statements and other information about each underlying fund are available on vanguard.com.
A. The following significant accounting policies conform to generally accepted accounting principles for U.S. investment companies. The fund consistently follows such policies in preparing its financial statements.
1. Security Valuation: Investments are valued at the net asset value of each underlying Vanguard fund determined as of the close of the New York Stock Exchange (generally 4 p.m., Eastern time) on the valuation date.
2. Federal Income Taxes: The fund intends to continue to qualify as a regulated investment company and distribute all of its taxable income. Management has analyzed the fund’s tax positions taken for all open federal income tax years (September 30, 2012–2015), and has concluded that no provision for federal income tax is required in the fund’s financial statements.
3. Distributions: Distributions to shareholders are recorded on the ex-dividend date.
4. Credit Facility: The fund and certain other funds managed by The Vanguard Group (“Vanguard”) participate in a $3 billion committed credit facility provided by a syndicate of lenders pursuant to a credit agreement that may be renewed annually; each fund is individually liable for its borrowings, if any, under the credit facility. Borrowings may be utilized for temporary and emergency purposes, and are subject to the fund’s regulatory and contractual borrowing restrictions. The participating funds are charged administrative fees and an annual commitment fee of 0.06% of the undrawn amount of the facility; these fees are allocated to the funds based on a method approved by the fund’s board of trustees and borne by the funds in which the fund invests (see Note B). Any borrowings under this facility bear interest at a rate equal to the higher of the federal funds rate or LIBOR reference rate plus an agreed-upon spread.
The fund had no borrowings outstanding at September 30, 2015, or at any time during the period then ended.
5. Other: Income and capital gain distributions received are recorded on the ex-dividend date. Security transactions are accounted for on the date securities are bought or sold. Costs used to determine realized gains (losses) on the sale of investment securities are those of the specific securities sold.
B. In accordance with the terms of a Funds’ Service Agreement (the “FSA”) between Vanguard and the fund, Vanguard furnishes to the fund investment advisory, corporate management, administrative, marketing, and distribution services at Vanguard’s cost of operations (as defined by the FSA). These costs of operations are allocated to the fund based on methods and guidelines approved by the board of trustees. The FSA provides that expenses otherwise allocable to Vanguard funds-of-funds may be reduced or eliminated to the extent of savings realized by the underlying Vanguard funds by virtue of being part of a fund-of-funds. Accordingly, all expenses for services provided by Vanguard to the fund and all other expenses incurred by the fund during the year ended September 30, 2015, were borne by the underlying Vanguard funds in which the fund invests. The fund’s trustees and officers are also trustees and officers, respectively, of the underlying Vanguard funds, as well as directors and employees, respectively, of Vanguard.
72
Target Retirement 2060 Fund
C. Various inputs may be used to determine the value of the fund’s investments. These inputs are summarized in three broad levels for financial statement purposes. The inputs or methodologies used to value securities are not necessarily an indication of the risk associated with investing in those securities.
Level 1—Quoted prices in active markets for identical securities.
Level 2—Other significant observable inputs (including quoted prices for similar securities, interest rates, prepayment speeds, credit risk, etc.).
Level 3—Significant unobservable inputs (including the fund’s own assumptions used to determine the fair value of investments).
At September 30, 2015, 100% of the market value of the fund’s investments was determined based on Level 1 inputs.
D. Distributions are determined on a tax basis and may differ from net investment income and realized capital gains for financial reporting purposes. Differences may be permanent or temporary. Permanent differences are reclassified among capital accounts in the financial statements to reflect their tax character. Temporary differences arise when certain items of income, expense, gain, or loss are recognized in different periods for financial statement and tax purposes. These differences will reverse at some time in the future. Differences in classification may also result from the treatment of short-term gains as ordinary income for tax purposes.
The fund used a tax accounting practice to treat a portion of the price of capital shares redeemed during the year as distributions from net investment income and realized capital gains. Accordingly, the fund has reclassified $1,451,000 from undistributed net investment income, and $126,000 from accumulated net realized gains, to paid-in capital.
For tax purposes, at September 30, 2015, the fund had $10,135,000 of ordinary income and $270,000 of long-term capital gains available for distribution.
At September 30, 2015, the cost of investment securities for tax purposes was $742,852,000. Net unrealized depreciation of investment securities for tax purposes was $8,873,000, consisting of unrealized gains of $28,365,000 on securities that had risen in value since their purchase and $37,238,000 in unrealized losses on securities that had fallen in value since their purchase.
| E. | Capital shares issued and redeemed were: |
| Year Ended September 30, | ||
| 2015 | 2014 | |
| Shares | Shares | |
| (000) | (000) | |
| Issued | 18,344 | 13,041 |
| Issued in Lieu of Cash Distributions | 315 | 143 |
| Redeemed | (8,394) | (4,478) |
| Net Increase (Decrease) in Shares Outstanding | 10,265 | 8,706 |
73
Target Retirement 2060 Fund
| F. Transactions during the period in affiliated underlying Vanguard funds were as follows: | ||||||
| Current Period Transactions | ||||||
| Sept. 30, | Proceeds | Sept. 30, | ||||
| 2014 | from | Capital Gain | 2015 | |||
| Market | Purchases | Securities | Distributions | Market | ||
| Value | at Cost | Sold | Income | Received | Value | |
| ($000) | ($000) | ($000) | ($000) | ($000) | ($000) | |
| Vanguard Market Liquidity Fund | 437 | NA1 | NA1 | 2 | — | 1,082 |
| Vanguard Total Bond Market II | ||||||
| Index Fund | 39,012 | 41,871 | 30,185 | 1,115 | 134 | 50,649 |
| Vanguard Total International | ||||||
| Bond Index Fund | 9,579 | 17,456 | 5,345 | 239 | — | 21,629 |
| Vanguard Total International | ||||||
| Stock Index Fund | 131,101 | 204,389 | 31,562 | 5,964 | — | 264,553 |
| Vanguard Total Stock Market | ||||||
| Index Fund | 305,530 | 175,063 | 71,569 | 7,187 | — | 396,067 |
| Total | 485,659 | 438,779 | 138,661 | 14,507 | 134 | 733,980 |
| 1 Not applicable—purchases and sales are for temporary cash investment purposes. | ||||||
G. Management has determined that no material events or transactions occurred subsequent to September 30, 2015, that would require recognition or disclosure in these financial statements.
74
Report of Independent Registered Public Accounting Firm
To the Board of Trustees of Vanguard Chester Funds and the Shareholders of Vanguard Target Retirement 2035 Fund, Vanguard Target Retirement 2040 Fund, Vanguard Target Retirement 2045 Fund, Vanguard Target Retirement 2050 Fund, Vanguard Target Retirement 2055 Fund and Vanguard Target Retirement 2060 Fund: In our opinion, the accompanying statements of net assets and the related statements of operations and of changes in net assets and the financial highlights present fairly, in all material respects, the financial position of Vanguard Target Retirement 2035 Fund, Vanguard Target Retirement 2040 Fund, Vanguard Target Retirement 2045 Fund, Vanguard Target Retirement 2050 Fund, Vanguard Target Retirement 2055 Fund and Vanguard Target Retirement 2060 Fund (constituting separate portfolios of Vanguard Chester Funds, hereafter referred to as the “Funds”) at September 30, 2015, the results of each of their operations for the year then ended, the changes in each of their net assets for each of the two years in the period then ended, and the financial highlights for each of the periods indicated, in conformity with accounting principles generally accepted in the United States of America. These financial statements and financial highlights (hereafter referred to as “financial statements”) are the responsibility of the Funds’ management. Our responsibility is to express an opinion on these financial statements based on our audits. We conducted our audits of these financial statements in accordance with the standards of the Public Company Accounting Oversight Board (United States). Those standards require that we plan and perform the audit to obtain reasonable assurance about whether the financial statements are free of material misstatement. An audit includes examining, on a test basis, evidence supporting the amounts and disclosures in the financial statements, assessing the accounting principles used and significant estimates made by management, and evaluating the overall financial statement presentation. We believe that our audits, which included confirmation of securities at September 30, 2015 by agreement to the underlying ownership records of the transfer agent, provide a reasonable basis for our opinion.
/s/PricewaterhouseCoopers LLP
Philadelphia, Pennsylvania
November 10, 2015
Special 2015 tax information (unaudited) for Vanguard Target Retirement Funds
This information for the fiscal year ended September 30, 2015, is included pursuant to provisions of the Internal Revenue Code.
The funds distributed capital gain dividends (from net long-term capital gains) to shareholders during the fiscal year as follows:
| Fund | ($000) |
| Target Retirement 2035 | 47,093 |
| Target Retirement 2040 | 13,199 |
| Target Retirement 2045 | 13,195 |
| Target Retirement 2050 | 1,241 |
| Target Retirement 2055 | 243 |
| Target Retirement 2060 | 113 |
75
For nonresident alien shareholders, 100% of short-term capital gain dividends distributed by all of the funds are qualified short-term capital gains.
The funds distributed qualified dividend income to shareholders during the fiscal year as follows:
| Fund | ($000) |
| Target Retirement 2035 | 366,359 |
| Target Retirement 2040 | 248,140 |
| Target Retirement 2045 | 239,509 |
| Target Retirement 2050 | 121,348 |
| Target Retirement 2055 | 25,294 |
| Target Retirement 2060 | 7,133 |
For corporate shareholders, the percentage of investment income (dividend income plus short-term gains, if any) that qualifies for the dividends-received deduction is as follows:
| Fund | Percentage |
| Target Retirement 2035 | 39.8% |
| Target Retirement 2040 | 42.7 |
| Target Retirement 2045 | 43.5 |
| Target Retirement 2050 | 42.2 |
| Target Retirement 2055 | 44.1 |
| Target Retirement 2060 | 43.2 |
The funds designate to shareholders foreign source income and foreign taxes paid as follows:
| Foreign Source Income | Foreign Taxes Paid | |
| Fund | ($000) | ($000) |
| Target Retirement 2035 | 199,456 | 10,359 |
| Target Retirement 2040 | 147,819 | 7,935 |
| Target Retirement 2045 | 133,959 | 7,196 |
| Target Retirement 2050 | 71,668 | 3,849 |
| Target Retirement 2055 | 20,014 | 1,077 |
| Target Retirement 2060 | 6,196 | 334 |
Shareholders will receive more detailed information with their Form 1099-DIV in January 2016 to determine the calendar-year amounts to be included on their 2015 tax returns.
76
Your Fund’s After-Tax Returns
This table presents returns for your fund both before and after taxes. The after-tax returns are shown in two ways: (1) assuming that an investor owned the fund during the entire period and paid taxes on the fund’s distributions, and (2) assuming that an investor paid taxes on the fund’s distributions and sold all shares at the end of each period.
Calculations are based on the highest individual federal income tax and capital gains tax rates in effect at the times of the distributions and the hypothetical sales. State and local taxes were not considered. After-tax returns reflect any qualified dividend income, using actual prior-year figures and estimates for 2015. (In the example, returns after the sale of fund shares may be higher than those assuming no sale. This occurs when the sale would have produced a capital loss. The calculation assumes that the investor received a tax deduction for the loss.)
Please note that your actual after-tax returns will depend on your tax situation and may differ from those shown. Also note that if you own the fund in a tax-deferred account, such as an individual retirement account or a 401(k) plan, this information does not apply to you. Such accounts are not subject to current taxes.
Finally, keep in mind that a fund’s performance—whether before or after taxes—does not guarantee future results.
| Average Annual Total Returns: Target Retirement Funds | |||
| Periods Ended September 30, 2015 | |||
| One | Five | Ten | |
| Year | Years | Years | |
| Target Retirement 2035 Fund | |||
| Returns Before Taxes | -2.75% | 9.06% | 5.56% |
| Returns After Taxes on Distributions | -3.30 | 8.53 | 5.07 |
| Returns After Taxes on Distributions and Sale of Fund Shares | -1.21 | 7.12 | 4.38 |
| �� | |||
| Since | |||
| One | Five | Inception | |
| Year | Years | (6/7/2006) | |
| Target Retirement 2040 Fund | |||
| Returns Before Taxes | -3.43% | 9.18% | 5.64% |
| Returns After Taxes on Distributions | -3.94 | 8.69 | 5.23 |
| Returns After Taxes on Distributions and Sale of Fund Shares | -1.60 | 7.23 | 4.46 |
| One | Five | Ten | |
| Year | Years | Years | |
| Target Retirement 2045 Fund | |||
| Returns Before Taxes | -3.49% | 9.19% | 5.73% |
| Returns After Taxes on Distributions | -4.01 | 8.67 | 5.26 |
| Returns After Taxes on Distributions and Sale of Fund Shares | -1.61 | 7.23 | 4.54 |
77
| Average Annual Total Returns: Target Retirement Funds | ||||
| Periods Ended September 30, 2015 | ||||
| Since | ||||
| One | Five | Inception | ||
| Year | Years | (6/7/2006) | ||
| Target Retirement 2050 Fund | ||||
| Returns Before Taxes | -3.46% | 9.18% | 5.69% | |
| Returns After Taxes on Distributions | -3.96 | 8.65 | 5.26 | |
| Returns After Taxes on Distributions and Sale of Fund Shares | -1.60 | 7.22 | 4.50 | |
| Since | ||||
| One | Five | Inception | ||
| Year | Years | (8/18/2010) | ||
| Target Retirement 2055 Fund | ||||
| Returns Before Taxes | -3.58% | 9.24% | 10.04% | |
| Returns After Taxes on Distributions | -4.02 | 8.85 | 9.66 | |
| Returns After Taxes on Distributions and Sale of Fund Shares | -1.71 | 7.28 | 7.95 | |
| Since | ||||
| One | Inception | |||
| Year | (1/19/2012) | |||
| Target Retirement 2060 Fund | ||||
| Returns Before Taxes | -3.61% | 9.32% | ||
| Returns After Taxes on Distributions | -4.03 | 9.00 | ||
| Returns After Taxes on Distributions and Sale of Fund Shares | -1.74 | 7.28 | ||
78
About Your Fund’s Expenses
As a shareholder of the fund, you incur ongoing costs, which include costs for portfolio management, administrative services, and shareholder reports (like this one), among others. Operating expenses, which are deducted from a fund’s gross income, directly reduce the investment return of the fund.
A typical fund’s expenses are expressed as a percentage of its average net assets. The Target Retirement Funds have no direct expenses, but each fund bears its proportionate share of the costs for the underlying funds in which it invests. These indirect expenses make up the acquired fund fees and expenses, also expressed as a percentage of average net assets.
The following examples are intended to help you understand the ongoing cost (in dollars) of investing in your fund and to compare these costs with those of other mutual funds. The examples are based on an investment of $1,000 made at the beginning of the period shown and held for the entire period. The costs were calculated using the acquired fund fees and expenses for each Target Retirement Fund.
The accompanying table illustrates your fund’s costs in two ways:
• Based on actual fund return. This section helps you to estimate the actual expenses that you paid over the period. The ”Ending Account Value“ shown is derived from the fund‘s actual return, and the third column shows the dollar amount that would have been paid by an investor who started with $1,000 in the fund. You may use the information here, together with the amount you invested, to estimate the expenses that you paid over the period.
To do so, simply divide your account value by $1,000 (for example, an $8,600 account value divided by $1,000 = 8.6), then multiply the result by the number given for your fund under the heading ”Expenses Paid During Period.“
• Based on hypothetical 5% yearly return. This section is intended to help you compare your fund‘s costs with those of other mutual funds. It assumes that the fund had a yearly return of 5% before expenses, but that the expense ratio is unchanged. In this case—because the return used is not the fund’s actual return—the results do not apply to your investment. The example is useful in making comparisons because the Securities and Exchange Commission requires all mutual funds to calculate expenses based on a 5% return. You can assess your fund’s costs by comparing this hypothetical example with the hypothetical examples that appear in shareholder reports of other funds.
Note that the expenses shown in the table are meant to highlight and help you compare ongoing costs only and do not reflect transaction costs incurred by the fund for buying and selling securities. Further, the expenses do not include any purchase, redemption, or account service fees described in the fund prospectus. If such fees were applied to your account, your costs would be higher. Your fund does not carry a “sales load.”
The calculations assume no shares were bought or sold during the period. Your actual costs may have been higher or lower, depending on the amount of your investment and the timing of any purchases or redemptions.
You can find more information about the fund’s expenses, including annual expense ratios, in the Financial Statements section of this report. For additional information on operating expenses and other shareholder costs, please refer to your fund’s current prospectus.
79
| Six Months Ended September 30, 2015 | |||
| Beginning | Ending | Expenses | |
| Account Value | Account Value | Paid During | |
| 3/31/2015 | 9/30/2015 | Period | |
| Based on Actual Fund Return | |||
| Target Retirement 2035 Fund | $1,000.00 | $928.26 | $0.73 |
| Target Retirement 2040 Fund | $1,000.00 | $921.47 | $0.77 |
| Target Retirement 2045 Fund | $1,000.00 | $921.89 | $0.77 |
| Target Retirement 2050 Fund | $1,000.00 | $921.83 | $0.77 |
| Target Retirement 2055 Fund | $1,000.00 | $920.59 | $0.77 |
| Target Retirement 2060 Fund | $1,000.00 | $920.68 | $0.77 |
| Based on Hypothetical 5% Yearly Return | |||
| Target Retirement 2035 Fund | $1,000.00 | $1,024.32 | $0.76 |
| Target Retirement 2040 Fund | $1,000.00 | $1,024.27 | $0.81 |
| Target Retirement 2045 Fund | $1,000.00 | $1,024.27 | $0.81 |
| Target Retirement 2050 Fund | $1,000.00 | $1,024.27 | $0.81 |
| Target Retirement 2055 Fund | $1,000.00 | $1,024.27 | $0.81 |
| Target Retirement 2060 Fund | $1,000.00 | $1,024.27 | $0.81 |
The calculations are based on the acquired fund fees and expenses for the most recent six-month period. The funds’ annualized expense figures for the period are (in order as listed from top to bottom above) 0.15%, 0.16%, 0.16%, 0.16%, 0.16%, and 0.16%. The dollar amounts shown as ”Expenses Paid” are equal to the annualized average weighted expense ratio for the underlying funds multiplied by the average account value over the period, multiplied by the number of days in the most recent six-month period, then divided by the number of days in the most recent 12-month period (183/365).
80
Glossary
30-Day SEC Yield. A fund’s 30-day SEC yield is derived using a formula specified by the U.S. Securities and Exchange Commission. Under the formula, data related to the fund’s security holdings in the previous 30 days are used to calculate the fund’s hypothetical net income for that period, which is then annualized and divided by the fund’s estimated average net assets over the calculation period. For the purposes of this calculation, a security’s income is based on its current market yield to maturity (for bonds), its actual income (for asset-backed securities), or its projected dividend yield (for stocks). Because the SEC yield represents hypothetical annualized income, it will differ—at times significantly—from the fund’s actual experience. As a result, the fund’s income distributions may be higher or lower than implied by the SEC yield.
Acquired Fund Fees and Expenses. Funds that invest in other Vanguard funds incur no direct expenses, but they do bear proportionate shares of the operating, administrative, and advisory expenses of the underlying funds, and they must pay any fees charged by those funds. The figure for acquired fund fees and expenses represents a weighted average of these underlying costs. Acquired is a term that the Securities and Exchange Commission applies to any mutual fund whose shares are owned by another fund.
Beta. A measure of the magnitude of a fund’s past share-price fluctuations in relation to the ups and downs of a given market index. The index is assigned a beta of 1.00. Compared with a given index, a fund with a beta of 1.20 typically would have seen its share price rise or fall by 12% when the index rose or fell by 10%. For this report, beta is based on returns over the past 36 months for both the fund and the index. Note that a fund’s beta should be reviewed in conjunction with its R-squared (see definition). The lower the R-squared, the less correlation there is between the fund and the index, and the less reliable beta is as an indicator of volatility.
Expense Ratio. A fund’s total annual operating expenses expressed as a percentage of the fund’s average net assets. The expense ratio includes management and administrative expenses, but does not include the transaction costs of buying and selling portfolio securities.
Inception Date. The date on which the assets of a fund (or one of its share classes) are first invested in accordance with the fund’s investment objective. For funds with a subscription period, the inception date is the day after that period ends. Investment performance is measured from the inception date.
R-Squared. A measure of how much of a fund’s past returns can be explained by the returns from the market in general, as measured by a given index. If a fund’s total returns were precisely synchronized with an index’s returns, its R-squared would be 1.00. If the fund’s returns bore no relationship to the index’s returns, its R-squared would be 0. For this report, R-squared is based on returns over the past 36 months for both the fund and the index.
Benchmark Information
Spliced Mixed-Asset Target 2055+ Funds Average: Mixed-Asset Target 2050 Funds Average through August 31, 2013; Mixed-Asset Target 2055+ Funds Average thereafter.
81
Target 2035 Composite Index: Derived by applying the fund’s target asset allocation to the results of the following benchmarks: for international stocks of developed markets, the MSCI EAFE Index through December 15, 2010, the MSCI ACWI ex USA IMI Index through June 2, 2013, and the FTSE Global All Cap ex US Index thereafter; for emerging-market stocks, the Select Emerging Markets Index through August 23, 2006, the MSCI Emerging Markets Index through December 15, 2010, the MSCI ACWI ex USA IMI Index through June 2, 2013, and the FTSE Global All Cap ex US Index thereafter; for U.S. bonds, the Barclays U.S. Aggregate Bond Index through December 31, 2009, and the Barclays U.S. Aggregate Float Adjusted Index thereafter; for international bonds, the Barclays Global Aggregate ex-USD Float Adjusted RIC Capped Index beginning June 3, 2013; and for U.S. stocks, the Dow Jones U.S. Total Stock Market Index (formerly known as the Dow Jones Wilshire 5000 Index) through April 22, 2005, the MSCI US Broad Market Index through June 2, 2013, and the CRSP US Total Market Index thereafter. International stock benchmark returns are adjusted for withholding taxes.
Target 2040 Composite Index: Derived by applying the fund’s target asset allocation to the results of the following benchmarks: for international stocks of developed markets, the MSCI EAFE Index through December 15, 2010, the MSCI ACWI ex USA IMI Index through June 2, 2013, and the FTSE Global All Cap ex US Index thereafter; for emerging-market stocks, the Select Emerging Markets Index through August 23, 2006, the MSCI Emerging Markets Index through December 15, 2010, the MSCI ACWI ex USA IMI Index through June 2, 2013, and the FTSE Global All Cap ex US Index thereafter; for U.S. bonds, the Barclays U.S. Aggregate Bond Index through December 31, 2009, and the Barclays U.S. Aggregate Float Adjusted Index thereafter; for international bonds, the Barclays Global Aggregate ex-USD Float Adjusted RIC Capped Index beginning June 3, 2013; and for U.S. stocks, the MSCI US Broad Market Index through June 2, 2013, and the CRSP US Total Market Index thereafter. International stock benchmark returns are adjusted for withholding taxes.
Target 2045 Composite Index: Derived by applying the fund’s target asset allocation to the results of the following benchmarks: for international stocks of developed markets, the MSCI EAFE Index through December 15, 2010, the MSCI ACWI ex USA IMI Index through June 2, 2013, and the FTSE Global All Cap ex US Index thereafter; for emerging-market stocks, the Select Emerging Markets Index through August 23, 2006, the MSCI Emerging Markets Index through December 15, 2010, the MSCI ACWI ex USA IMI Index through June 2, 2013, and the FTSE Global All Cap ex US Index thereafter; for U.S. bonds, the Barclays U.S. Aggregate Bond Index through December 31, 2009, and the Barclays U.S. Aggregate Float Adjusted Index thereafter; for international bonds, the Barclays Global Aggregate ex-USD Float Adjusted RIC Capped Index beginning June 3, 2013; and for U.S. stocks, the Dow Jones U.S. Total Stock Market Index (formerly known as the Dow Jones Wilshire 5000 Index) through April 22, 2005, the MSCI US Broad Market Index through June 2, 2013, and the CRSP US Total Market Index thereafter. International stock benchmark returns are adjusted for withholding taxes.
82
Target 2050 Composite Index: Derived by applying the fund’s target asset allocation to the results of the following benchmarks: for international stocks of developed markets, the MSCI EAFE Index through December 15, 2010, the MSCI ACWI ex USA IMI Index through June 2, 2013, and the FTSE Global All Cap ex US Index thereafter; for emerging-market stocks, the Select Emerging Markets Index through August 23, 2006, the MSCI Emerging Markets Index through December 15, 2010, the MSCI ACWI ex USA IMI Index through June 2, 2013, and the FTSE Global All Cap ex US Index thereafter; for U.S. bonds, the Barclays U.S. Aggregate Bond Index through December 31, 2009, and the Barclays U.S. Aggregate Float Adjusted Index thereafter; for international bonds, the Barclays Global Aggregate ex-USD Float Adjusted RIC Capped Index beginning June 3, 2013; and for U.S. stocks, the MSCI US Broad Market Index through June 2, 2013, and the CRSP US Total Market Index thereafter. International stock benchmark returns are adjusted for withholding taxes.
Target 2055 Composite Index: Derived by applying the fund’s target asset allocation to the results of the following benchmarks: for international stocks of developed markets, the MSCI EAFE Index through December 15, 2010, the MSCI ACWI ex USA IMI Index through June 2, 2013, and the FTSE Global All Cap ex US Index thereafter; for emerging-market stocks, the MSCI Emerging Markets Index through December 15, 2010, the MSCI ACWI ex USA IMI Index through June 2, 2013, and the FTSE Global All Cap ex US Index thereafter; for U.S. bonds, the Barclays U.S. Aggregate Float Adjusted Index; for international bonds, the Barclays Global Aggregate ex-USD Float Adjusted RIC Capped Index beginning June 3, 2013; and for U.S. stocks, the MSCI US Broad Market Index through June 2, 2013, and the CRSP US Total Market Index thereafter. International stock benchmark returns are adjusted for withholding taxes.
Target 2060 Composite Index: Derived by applying the fund’s target asset allocation to the results of the following benchmarks: for international stocks of developed markets, the MSCI ACWI ex USA IMI Index through June 2, 2013, and the FTSE Global All Cap ex US Index thereafter; for emerging-market stocks, the MSCI ACWI ex USA IMI Index through June 2, 2013, and the FTSE Global All Cap ex US Index thereafter; for U.S. bonds, the Barclays U.S. Aggregate Float Adjusted Index; for international bonds, the Barclays Global Aggregate ex-USD Float Adjusted RIC Capped Index beginning June 3, 2013; and for U.S. stocks, the MSCI US Broad Market Index through June 2, 2013, and the CRSP US Total Market Index thereafter. International stock benchmark returns are adjusted for withholding taxes.
83
The People Who Govern Your Fund
The trustees of your mutual fund are there to see that the fund is operated and managed in your best interests since, as a shareholder, you are a part owner of the fund. Your fund’s trustees also serve on the board of directors of The Vanguard Group, Inc., which is owned by the Vanguard funds and provides services to them on an at-cost basis.
A majority of Vanguard’s board members are independent, meaning that they have no affiliation with Vanguard or the funds they oversee, apart from the sizable personal investments they have made as private individuals. The independent board members have distinguished backgrounds in business, academia, and public service. Each of the trustees and executive officers oversees 194 Vanguard funds.
The following table provides information for each trustee and executive officer of the fund. More information about the trustees is in the Statement of Additional Information, which can be obtained, without charge, by contacting Vanguard at 800-662-7447, or online at vanguard.com.
InterestedTrustee1
F. William McNabb III
Born 1957. Trustee Since July 2009. Chairman of the Board. Principal Occupation(s) During the Past Five Years and Other Experience: Chairman of the Board of The Vanguard Group, Inc., and of each of the investment companies served by The Vanguard Group, since January 2010; Director of The Vanguard Group since 2008; Chief Executive Officer and President of The Vanguard Group, and of each of the investment companies served by The Vanguard Group, since 2008; Director of Vanguard Marketing Corporation; Managing Director of The Vanguard Group (1995–2008).
IndependentTrustees
Emerson U. Fullwood
Born 1948. Trustee Since January 2008. Principal Occupation(s) During the Past Five Years and Other Experience: Executive Chief Staff and Marketing Officer for North America and Corporate Vice President (retired 2008) of Xerox Corporation (document management products and services); Executive in Residence and 2009–2010 Distinguished Minett Professor at the Rochester Institute of Technology; Director of SPX Corporation (multi-industry manufacturing), the United Way of Rochester, Amerigroup Corporation (managed health care), the University of Rochester Medical Center, Monroe Community College Foundation, and North Carolina A&T University.
Rajiv L. Gupta
Born 1945. Trustee Since December 2001.2 Principal Occupation(s) During the Past Five Years and Other Experience: Chairman and Chief Executive Officer (retired 2009) and President (2006–2008) of Rohm and Haas Co. (chemicals); Director of Tyco International PLC (diversified manufacturing and services), Hewlett-Packard Co. (electronic computer manufacturing), and Delphi Automotive PLC (automotive components); Senior Advisor at New Mountain Capital.
Amy Gutmann
Born 1949. Trustee Since June 2006. Principal Occupation(s) During the Past Five Years and Other Experience: President of the University of Pennsylvania; Christopher H. Browne Distinguished Professor of Political Science, School of Arts and Sciences, and Professor of Communication, Annenberg School for Communication, with secondary faculty appointments in the Department of Philosophy, School of Arts and Sciences, and at the Graduate School of Education, University of Pennsylvania; Trustee of the National Constitution Center; Chair of the Presidential Commission for the Study of Bioethical Issues.
JoAnn Heffernan Heisen
Born 1950. Trustee Since July 1998. Principal Occupation(s) During the Past Five Years and Other Experience: Corporate Vice President and Chief Global Diversity Officer (retired 2008) and Member of the Executive Committee (1997–2008) of Johnson & Johnson (pharmaceuticals/medical devices/ consumer products); Director of Skytop Lodge Corporation (hotels), the University Medical Center at Princeton, the Robert Wood Johnson Foundation, and the Center for Talent Innovation; Member of the Advisory Board of the Institute for Women’s Leadership at Rutgers University.
F. Joseph Loughrey
Born 1949. Trustee Since October 2009. Principal Occupation(s) During the Past Five Years and Other Experience: President and Chief Operating Officer (retired 2009) of Cummins Inc. (industrial machinery); Chairman of the Board of Hillenbrand, Inc. (specialized consumer services), and of Oxfam America; Director of SKF AB (industrial machinery), Hyster-Yale Materials Handling, Inc. (forklift trucks), the Lumina Foundation for Education, and the V Foundation for Cancer Research; Member of the Advisory Council for the College of Arts and Letters and of the Advisory Board to the Kellogg Institute for International Studies, both at the University of Notre Dame.
Mark Loughridge
Born 1953. Trustee Since March 2012. Principal Occupation(s) During the Past Five Years and Other Experience: Senior Vice President and Chief Financial Officer (retired 2013) at IBM (information technology services); Fiduciary Member of IBM’s Retirement Plan Committee (2004–2013); Director of the Dow Chemical Company; Member of the Council on Chicago Booth.
Scott C. Malpass
Born 1962. Trustee Since March 2012. Principal Occupation(s) During the Past Five Years and Other Experience: Chief Investment Officer and Vice President at the University of Notre Dame; Assistant Professor of Finance at the Mendoza College of Business at Notre Dame; Member of the Notre Dame 403(b) Investment Committee; Board Member of TIFF Advisory Services, Inc., and Catholic Investment Services, Inc. (investment advisors); Member of the Investment Advisory Committee of Major League Baseball.
André F. Perold
Born 1952. Trustee Since December 2004. Principal Occupation(s) During the Past Five Years and Other Experience: George Gund Professor of Finance and Banking, Emeritus at the Harvard Business School (retired 2011); Chief Investment Officer and Managing Partner of HighVista Strategies LLC (private investment firm); Director of Rand Merchant Bank; Overseer of the Museum of Fine Arts Boston.
Peter F. Volanakis
Born 1955. Trustee Since July 2009. Principal Occupation(s) During the Past Five Years and Other Experience: President and Chief Operating Officer (retired 2010) of Corning Incorporated (communications equipment); Trustee of Colby-Sawyer College; Member of the Advisory Board of the Norris Cotton Cancer Center and of the Advisory Board of the Parthenon Group (strategy consulting).
Executive Officers
Glenn Booraem
Born 1967. Treasurer Since May 2015. Principal Occupation(s) During the Past Five Years and Other Experience: Principal of The Vanguard Group, Inc.; Treasurer of each of the investment companies served by The Vanguard Group; Controller of each of the investment companies served by The Vanguard Group (2010–2015); Assistant Controller of each of the investment companies served by The Vanguard Group (2001–2010).
Thomas J. Higgins
Born 1957. Chief Financial Officer Since September 2008. Principal Occupation(s) During the Past Five Years and Other Experience: Principal of The Vanguard Group, Inc.; Chief Financial Officer of each of the investment companies served by The Vanguard Group; Treasurer of each of the investment companies served by The Vanguard Group (1998–2008).
Peter Mahoney
Born 1974. Controller Since May 2015. Principal Occupation(s) During the Past Five Years and Other Experience: Head of Global Fund Accounting at The Vanguard Group, Inc.; Controller of each of the investment companies served by The Vanguard Group; Head of International Fund Services at The Vanguard Group (2008–2014).
Heidi Stam
Born 1956. Secretary Since July 2005. Principal Occupation(s) During the Past Five Years and Other Experience: Managing Director of The Vanguard Group, Inc.; General Counsel of The Vanguard Group; Secretary of The Vanguard Group and of each of the investment companies served by The Vanguard Group; Director and Senior Vice President of Vanguard Marketing Corporation.
Vanguard Senior Management Team
Mortimer J. Buckley
Kathleen C. Gubanich
Paul A. Heller
Martha G. King
John T. Marcante
Chris D. McIsaac
James M. Norris
Thomas M. Rampulla
Glenn W. Reed
Karin A. Risi
Chairman Emeritus and Senior Advisor
John J. Brennan
Chairman, 1996–2009
Chief Executive Officer and President, 1996–2008
Founder John C. Bogle
Chairman and Chief Executive Officer, 1974–1996
1 Mr. McNabb is considered an “interested person,” as defined in the Investment Company Act of 1940, because he is an officer of the Vanguard funds.
2 December 2002 for Vanguard Equity Income Fund, the Vanguard Municipal Bond Funds, and the Vanguard State Tax-Exempt Funds.
 |
| P.O. Box 2600 |
| Valley Forge, PA 19482-2600 |
Connect with Vanguard® > vanguard.com
| Fund Information > 800-662-7447 | |
| Direct Investor Account Services > 800-662-2739 | |
| Institutional Investor Services > 800-523-1036 | |
| Text Telephone for People | |
| Who Are Deaf or Hard of Hearing> 800-749-7273 | |
| This material may be used in conjunction | |
| with the offering of shares of any Vanguard | |
| fund only if preceded or accompanied by | |
| the fund’s current prospectus. | |
| All comparative mutual fund data are from Lipper, a | |
| Thomson Reuters Company, or Morningstar, Inc., unless | |
| otherwise noted. | |
| You can obtain a free copy of Vanguard’s proxy voting | |
| guidelines by visiting vanguard.com/proxyreporting or by | |
| calling Vanguard at 800-662-2739. The guidelines are | |
| also available from the SEC’s website, sec.gov. In | |
| addition, you may obtain a free report on how your fund | |
| voted the proxies for securities it owned during the 12 | |
| months ended June 30. To get the report, visit either | |
| vanguard.com/proxyreporting or sec.gov. | |
| You can review and copy information about your fund at | |
| the SEC’s Public Reference Room in Washington, D.C. To | |
| find out more about this public service, call the SEC at | |
| 202-551-8090. Information about your fund is also | |
| available on the SEC’s website, and you can receive | |
| copies of this information, for a fee, by sending a | |
| request in either of two ways: via email addressed to | |
| publicinfo@sec.gov or via regular mail addressed to the | |
| Public Reference Section, Securities and Exchange | |
| Commission, Washington, DC 20549-1520. | |
| © 2015 The Vanguard Group, Inc. | |
| All rights reserved. | |
| Vanguard Marketing Corporation, Distributor. | |
| Q3080B 112015 | |
Annual Report | September 30, 2015
Vanguard Institutional Target Retirement Funds
Vanguard Institutional Target Retirement Income Fund
Vanguard Institutional Target Retirement 2010 Fund
Vanguard Institutional Target Retirement 2015 Fund
Vanguard Institutional Target Retirement 2020 Fund
Vanguard Institutional Target Retirement 2025 Fund
Vanguard Institutional Target Retirement 2030 Fund
Vanguard’s Principles for Investing Success
We want to give you the best chance of investment success. These principles, grounded in Vanguard’s research and experience, can put you on the right path.
Goals. Create clear, appropriate investment goals.
Balance. Develop a suitable asset allocation using broadly diversified funds. Cost. Minimize cost.
Discipline. Maintain perspective and long-term discipline.
A single theme unites these principles: Focus on the things you can control.
We believe there is no wiser course for any investor.
| Contents | |
| Your Fund’s Total Returns. | 1 |
| Chairman’s Letter. | 2 |
| Institutional Target Retirement Income Fund. | 8 |
| Institutional Target Retirement 2010 Fund. | 19 |
| Institutional Target Retirement 2015 Fund. | 30 |
| Institutional Target Retirement 2020 Fund. | 41 |
| Institutional Target Retirement 2025 Fund. | 52 |
| Institutional Target Retirement 2030 Fund. | 63 |
| Trustees Approve Advisory Arrangement. | 76 |
| Glossary. | 77 |
Please note: The opinions expressed in this report are just that—informed opinions. They should not be considered promises or advice. Also, please keep in mind that the information and opinions cover the period through the date on the front of this report. Of course, the risks of investing in your fund are spelled out in the prospectus.
See the Glossary for definitions of investment terms used in this report.
About the cover: Pictured is a sailing block on the Brilliant, a 1932 schooner docked in Mystic, Connecticut. A type of pulley, the sailing block helps coordinate the setting of the sails. At Vanguard, the intricate coordination of technology and people allows us to help millions of clients around the world reach their financial goals.
| Your Fund’s Total Returns | |
| Period Ended September 30, 2015 | |
| Since Inception | |
| Institutional Target Retirement Income Fund (Inception: 6/26/2015) | -2.44% |
| Target Income Composite Index | -2.42 |
| Mixed-Asset Target Today Funds Average | -3.32 |
| Mixed-Asset Target Today Funds Average: Derived from data provided by Lipper, a Thomson Reuters Company. | |
| Institutional Target Retirement 2010 Fund (Inception: 6/26/2015) | -3.00% |
| Target 2010 Composite Index | -3.02 |
| Mixed-Asset Target 2010 Funds Average | -4.22 |
| Mixed-Asset Target 2010 Funds Average: Derived from data provided by Lipper, a Thomson Reuters Company. | |
| Institutional Target Retirement 2015 Fund (Inception: 6/26/2015) | -4.70% |
| Target 2015 Composite Index | -4.69 |
| Mixed-Asset Target 2015 Funds Average | -4.86 |
| Mixed-Asset Target 2015 Funds Average: Derived from data provided by Lipper, a Thomson Reuters Company. | |
| Institutional Target Retirement 2020 Fund (Inception: 6/26/2015) | -5.80% |
| Target 2020 Composite Index | -5.80 |
| Mixed-Asset Target 2020 Funds Average | -5.59 |
| Mixed-Asset Target 2020 Funds Average: Derived from data provided by Lipper, a Thomson Reuters Company. | |
| Institutional Target Retirement 2025 Fund (Inception: 6/26/2015) | -6.75% |
| Target 2025 Composite Index | -6.75 |
| Mixed-Asset Target 2025 Funds Average | -6.69 |
| Mixed-Asset Target 2025 Funds Average: Derived from data provided by Lipper, a Thomson Reuters Company. | |
| Institutional Target Retirement 2030 Fund (Inception: 6/26/2015) | -7.75% |
| Target 2030 Composite Index | -7.69 |
| Mixed-Asset Target 2030 Funds Average | -7.76 |
| Mixed-Asset Target 2030 Funds Average: Derived from data provided by Lipper, a Thomson Reuters Company. | |
| For a benchmark description, see the Glossary. | |
Investments in Target Retirement Funds are subject to the risks of their underlying funds. The year in the fund name refers to the approximate year (the target date) when an investor in the fund would retire and leave the work force. The fund will gradually shift its emphasis from more aggressive investments to more conservative ones based on its target date. An investment in a Target Retirement Fund is not guaranteed at any time, including on or after the target date.
1

Chairman’s Letter
Dear Shareholder,
I am pleased to provide you with the first shareholder report for Vanguard Institutional Target Retirement Funds. These new funds, which began operating on June 26, 2015, offer the same sophisticated asset allocation and disciplined, long-term strategy as our traditional Target Retirement Funds do, but at a lower cost.
The roughly three months from the funds’ inception through September 30, 2015, were a volatile time for the world’s financial markets. After notching an impressive advance earlier in the fiscal year, U.S. stocks reversed course, but they still held up significantly better than their international counterparts.
Bonds generally outperformed stocks for the period. International bond results differed significantly depending on whether they were hedged or unhedged for currency effects, a point I’ll revisit later in this letter.
Returns for the six Vanguard Institutional Target Retirement Funds covered in this report ranged from –7.75% for the Vanguard Target Retirement 2030 Fund to –2.44% for Vanguard Target Retirement Income Fund. (The funds with retirement dates of 2035 through 2060 are covered in a separate report.) Given the investment environment, it’s not surprising that the funds with more exposure to bonds and less exposure to stocks performed best.
2
China’s economic woes weighed on global stocks
The broad U.S. stock market returned –0.49% for the 12 months. The final two months were especially rocky as investors worried in particular about the global ripple effects of slower economic growth in China.
For much of the fiscal year, investors were preoccupied with the possibility of an increase in short-term interest rates. On September 17, the Federal Reserve announced that it would hold rates steady for the time being, a decision that to some investors indicated that the Fed was concerned about the fragility of global markets.
International stocks returned about –11% as the dollar’s strength against many foreign currencies weighed on results. Returns for emerging markets, which were especially hard hit by concerns about China, trailed those of the developed markets of the Pacific region and Europe.
Taxable bonds recorded gains as investors searched for safety
The broad U.S. taxable bond market returned 2.94% as investors gravitated toward safe-haven assets amid global stock market turmoil. Stimulative monetary policies from the world’s central banks, declining inflation expectations, and global investors’ search for higher yields also helped lift U.S. bonds.
| Market Barometer | |||
| Average Annual Total Returns | |||
| Periods Ended September 30, 2015 | |||
| One | Three | Five | |
| Year | Years | Years | |
| Stocks | |||
| Russell 1000 Index (Large-caps) | -0.61% | 12.66% | 13.42% |
| Russell 2000 Index (Small-caps) | 1.25 | 11.02 | 11.73 |
| Russell 3000 Index (Broad U.S. market) | -0.49 | 12.53 | 13.28 |
| FTSE All-World ex US Index (International) | -11.34 | 2.87 | 2.19 |
| Bonds | |||
| Barclays U.S. Aggregate Bond Index (Broad taxable market) | 2.94% | 1.71% | 3.10% |
| Barclays Municipal Bond Index (Broad tax-exempt market) | 3.16 | 2.88 | 4.14 |
| Citigroup Three-Month U.S. Treasury Bill Index | 0.02 | 0.02 | 0.04 |
| CPI | |||
| Consumer Price Index | -0.04% | 0.93% | 1.73% |
3
The yield of the 10-year Treasury note ended September at 2.05%, down from 2.48% a year earlier. (Bond prices and yields move in opposite directions.)
International bond markets (as measured by the Barclays Global Aggregate Index ex USD) returned –7.67%, hurt by the weakness of international currencies relative to the dollar. Without this currency effect, international bonds advanced modestly.
The Fed’s 0%–0.25% target for short-term interest rates continued to limit returns for money market funds and savings accounts.
More conservative funds fared best amid volatility
Vanguard Institutional Target Retirement Funds offer a diversified portfolio within a single fund that adjusts its underlying asset mix over time. As the investor’s retirement date approaches, the portfolio shifts from a growth-oriented, stock-heavy asset allocation to an emphasis on income-generating fixed income securities. Once its target date is reached, each fund continues to adjust until it enters an income phase, at which point it converts to the Income Fund. That fund, which represents a static allocation of about
In stormy markets, target-date funds can help you stay on course
At Vanguard, we advise investors to avoid overreacting to market noise. But we realize that market turmoil, such as that experienced in recent months, can trigger even seasoned investors to make investment decisions based on emotion.
That’s where target-date funds can help. A Vanguard study of defined-contribution retirement plans found that the increasing use of target-date funds is dramatically improving investor behavior.
Target-date investors, it seems, are better able to weather market volatility and stick with their investment plan—probably because they know that their asset mix is automatically adjusted to fit their age and investment horizon.
According to the Vanguard study How America Saves 2015, when compared with other retirement plan investors, those who held their entire account balance in target-date funds:
- Had more balanced portfolios (including, for example, bonds and international stocks).
- Did not hold “extreme” equity allocations (either no stocks or 100% stocks).
- Refrained from frequent trading, which typically leads to disappointing results.
4
70% bonds and 30% stocks, is mostly focused on helping investors generate income and preserve their wealth.
As I mentioned earlier in this letter, bonds outperformed stocks for the most recent fiscal year; they also outperformed stocks for the period since the funds’ inception. Mirroring this broad trend, the more conservative of the Institutional Target Retirement Funds—those holding more bonds and less stocks—fared best. Not surprisingly, the Income Fund was the group’s top performer, and the 2030 Fund, which has the largest allocation to stocks, had the poorest results. Returns for the four other funds fell in between.
These results, of course, largely reflect the performance of the five underlying portfolios that make up the Institutional Target Retirement Funds—Vanguard Total Stock Market Index Fund, Vanguard Total International Stock Index Fund, Vanguard Total Bond Market II Index Fund, Vanguard Total International Bond Index Fund, and Vanguard Short-Term Inflation-Protected Securities Index Fund.
In keeping with the broader market trends, the underlying bond portfolios performed best. Vanguard Total International Bond Index Fund, which provides broad exposure to non-U.S. investment-grade bonds, was the top performer, returning 1.84% (all returns for the underlying portfolios are for June 26, 2015, through September 30, 2015). Vanguard Total Bond Market II Index Fund—which offers broad exposure to the U.S. investment-grade fixed income market—followed close behind, returning 1.84%. Global fixed income markets benefited as investors sought solace from the stock markets’ heightened volatility.
Currency hedging, as I mentioned, was a distinguishing factor in the performance of international bonds. The Total International Bond Index Fund uses currency exchange contracts to minimize the effects of currency fluctuations. This policy largely erased the negative effect of converting foreign bond returns into more expensive U.S. dollars.
The remaining three underlying funds posted negative results for the fiscal year. Vanguard Short-Term Inflation-Protected Securities Index Fund—which is held only in the Income Fund, 2010 Fund, the 2015 Fund, and the 2020 Fund—returned –0.45%. Investors saw little need for inflation insurance amid low inflationary expectations.
Vanguard Total Stock Market Index Fund—which provides investors with broad exposure to the entire U.S. stock market—returned –8.94%. Vanguard Total International Stock Index Fund, which offers exposure to both developed and emerging international economies, returned –13.81%. Both domestic and international equity markets struggled amid volatility later in the period. The strength of the U.S. dollar furthered hindered results of foreign stocks.
5
A dose of discipline is crucial when markets become volatile
Although the broad U.S. stock market has posted gains for six straight calendar years—from 2009 to 2014—that streak may not last a seventh. Stocks tumbled in August, and swung up and down in September.
Nobody can control the direction of the markets or reliably predict where they’ll go in the short term. However, investors can control how they react to volatility.
During periods of market adversity, it’s more important than ever to keep sight of one of Vanguard’s key principles: Maintain perspective and long-term discipline. Whether you’re investing for yourself or on behalf of clients, your success is affected greatly by how you respond—or don’t respond—during turbulent markets. (You can read Vanguard’s Principles for Investing Success at vanguard.com/research.)
As I’ve written in the past, the best course for long-term investors is generally to ignore daily market moves and not make decisions based on emotion. This is also a good time to evaluate your portfolio and make sure your asset allocation is aligned with your time horizon, goals, and risk tolerance.
The markets are unpredictable and often confounding. Keeping long-term plans clearly in focus can be crucial as we weather these periodic storms.
As always, thank you for investing with Vanguard.
Sincerely,

F. William McNabb III
Chairman and Chief Executive Officer
October 16, 2015
6
| Your Fund’s Performance at a Glance | ||||
| Inception Through September 30, 2015 | ||||
| Distributions Per Share | ||||
| Starting | Ending | Income | Capital | |
| Share Price | Share Price | Dividends | Gains | |
| Institutional Target Retirement Income Fund | ||||
| (Inception: 6/26/2015) | $20.00 | $19.46 | $0.052 | $0.000 |
| Institutional Target Retirement 2010 Fund | ||||
| (Inception: 6/26/2015) | $20.00 | $19.40 | $0.000 | $0.000 |
| Institutional Target Retirement 2015 Fund | ||||
| (Inception: 6/26/2015) | $20.00 | $19.06 | $0.000 | $0.000 |
| Institutional Target Retirement 2020 Fund | ||||
| (Inception: 6/26/2015) | $20.00 | $18.84 | $0.000 | $0.000 |
| Institutional Target Retirement 2025 Fund | ||||
| (Inception: 6/26/2015) | $20.00 | $18.65 | $0.000 | $0.000 |
| Institutional Target Retirement 2030 Fund | ||||
| (Inception: 6/26/2015) | $20.00 | $18.45 | $0.000 | $0.000 |
7
Institutional Target Retirement Income Fund
Fund Profile
As of September 30, 2015
| Total Fund Characteristics | |
| Ticker Symbol | VITRX |
| 30-Day SEC Yield | 1.95% |
| Acquired Fund Fees and Expenses1 | 0.10% |
| Allocation to Underlying Vanguard Funds | |
| Vanguard Total Bond Market II Index Fund | |
| Investor Shares | 37.2% |
| Vanguard Total Stock Market Index Fund | |
| Institutional Shares | 18.1 |
| Vanguard Short-Term Inflation-Protected | |
| Securities Index Fund Admiral Shares | 16.8 |
| Vanguard Total International Bond Index | |
| Fund Admiral Shares | 15.9 |
| Vanguard Total International Stock Index | |
| Fund Investor Shares | 12.0 |
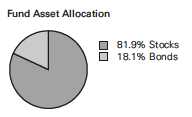
1 This figure—drawn from the prospectus dated June 26, 2015—represents an estimate of the weighted average of the expense ratios and any transaction fees charged by the underlying mutual funds (the ”acquired” funds) in which the Institutional Target Retirement Income Fund invests. The fund does not charge any expenses or fees of its own. For the period from inception through September 30, 2015, the annualized acquired fund fees and expenses were 0.10%.
8
Institutional Target Retirement Income Fund
Performance Summary
All of the returns in this report represent past performance, which is not a guarantee of future results that may be achieved by the fund. (Current performance may be lower or higher than the performance data cited. For performance data current to the most recent month-end, visit our website at vanguard.com/performance.) Note, too, that both investment returns and principal value can fluctuate widely, so an investor’s shares, when sold, could be worth more or less than their original cost. The returns shown do not reflect taxes that a shareholder would pay on fund distributions or on the sale of fund shares.
| Cumulative Performance: June 26, 2015, Through September 30, 2015 | ||
| Initial Investment of $100,000,000 | ||
| Total Returns | ||
| Period Ended September 30, 2015 | ||
| Since | Final Value | |
| Inception | of a $100,000,000 | |
| (6/26/2015) | Investment | |
| Institutional Target Retirement Income Fund | -2.44% | $97,560,000 |
| Target Income Composite Index | -2.42 | 97,583,898 |
| Mixed-Asset Target Today Funds Average | -3.32 | 96,680,235 |
| Barclays U.S. Aggregate Bond Index | 1.87 | 101,865,565 |
For a benchmark description, see the Glossary.
Mixed-Asset Target Today Funds Average: Derived from data provided by Lipper, a Thomson Reuters Company.
"Since Inception" performance is calculated from the fund's inception date for both the fund and its comparative standards.
See Financial Highlights for dividend and capital gains information.
9
Institutional Target Retirement Income Fund
Fiscal-Period Total Returns (%): June 26, 2015, Through September 30, 2015
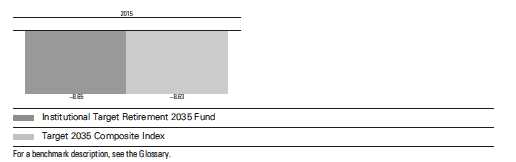
10
Institutional Target Retirement Income Fund
Financial Statements
Statement of Net Assets
As of September 30, 2015
The fund reports a complete list of its holdings in regulatory filings four times in each fiscal year, at the quarter-ends. For the second and fourth fiscal quarters, the lists appear in the fund’s semiannual and annual reports to shareholders. For the first and third fiscal quarters, the fund files the lists with the Securities and Exchange Commission on Form N-Q. Shareholders can look up the fund’s Forms N-Q on the SEC’s website at sec.gov. Forms N-Q may also be reviewed and copied at the SEC’s Public Reference Room (see the back cover of this report for further information).
| Market | ||
| Value• | ||
| Shares | ($000) | |
| Investment Companies (100.0%) | ||
| U.S. Stock Fund (18.1%) | ||
| Vanguard Total Stock Market Index Fund Institutional Shares | 3,171,873 | 152,504 |
| International Stock Fund (12.0%) | ||
| Vanguard Total International Stock Index Fund Investor Shares | 7,133,372 | 101,436 |
| U.S. Bond Funds (54.0%) | ||
| 1 Vanguard Total Bond Market II Index Fund Investor Shares | 29,121,358 | 313,346 |
| Vanguard Short-Term Inflation-Protected Securities Index Fund Admiral Shares | 5,833,079 | 141,569 |
| 454,915 | ||
| International Bond Fund (15.9%) | ||
| Vanguard Total International Bond Index Fund Admiral Shares | 6,340,035 | 133,965 |
| Total Investment Companies (Cost $860,115) | 842,820 | |
| Amount | ||
| ($000) | ||
| Other Assets and Liabilities (0.0%) | ||
| Other Assets | ||
| Receivables for Accrued Income | 687 | |
| Receivables for Capital Shares Issued | 26,363 | |
| Total Other Assets | 27,050 | |
| Liabilities | ||
| Payables for Investment Securities Purchased | (26,672) | |
| Payables for Capital Shares Redeemed | (229) | |
| Other Liabilities | (16) | |
| Total Liabilities | (26,917) | |
| Net Assets (100%) | ||
| Applicable to 43,308,594 outstanding $.001 par value shares of | ||
| beneficial interest (unlimited authorization) | 842,953 | |
| Net Asset Value Per Share | $19.46 | |
11
| Institutional Target Retirement Income Fund | |
| At September 30, 2015, net assets consisted of: | |
| Amount | |
| ($000) | |
| Paid-in Capital | 859,764 |
| Undistributed Net Investment Income | 496 |
| Accumulated Net Realized Losses | (12) |
| Unrealized Appreciation (Depreciation) | (17,295) |
| Net Assets | 842,953 |
- See Note A in Notes to Financial Statements.
- Affiliated fund available only to Vanguard funds and certain trusts and accounts managed by Vanguard. See accompanying Notes, which are an integral part of the Financial Statements.
12
| Institutional Target Retirement Income Fund | |
| Statement of Operations | |
| June 26, 20151 to | |
| September 30, 2015 | |
| ($000) | |
| Investment Income | |
| Income | |
| Income Distributions Received | 2,561 |
| Net Investment Income—Note B | 2,561 |
| Realized Net Gain (Loss) on Affiliated Investment Securities Sold | 4 |
| Change in Unrealized Appreciation (Depreciation) of Investment Securities | (17,295) |
| Net Increase (Decrease) in Net Assets Resulting from Operations | (14,730) |
| 1 Inception. | |
See accompanying Notes, which are an integral part of the Financial Statements.
13
| Institutional Target Retirement Income Fund | |
| Statement of Changes in Net Assets | |
| June 26, 20151 to | |
| September 30, 2015 | |
| ($000) | |
| Increase (Decrease) in Net Assets | |
| Operations | |
| Net Investment Income | 2,561 |
| Realized Net Gain (Loss) | 4 |
| Change in Unrealized Appreciation (Depreciation) | (17,295) |
| Net Increase (Decrease) in Net Assets Resulting from Operations | (14,730) |
| Distributions | |
| Net Investment Income | (2,065) |
| Realized Capital Gain | — |
| Total Distributions | (2,065) |
| Capital Share Transactions | |
| Issued | 876,113 |
| Issued in Lieu of Cash Distributions | 2,065 |
| Redeemed | (18,430) |
| Net Increase (Decrease) from Capital Share Transactions | 859,748 |
| Total Increase (Decrease) | 842,953 |
| Net Assets | |
| Beginning of Period | — |
| End of Period2 | 842,953 |
| 1 | Inception. |
| 2 | Net Assets—End of Period includes undistributed (overdistributed) net investment income of $496,000. |
See accompanying Notes, which are an integral part of the Financial Statements.
14
| Institutional Target Retirement Income Fund | |
| Financial Highlights | |
| June 26, 20151 to | |
| For a Share Outstanding Throughout the Period | September 30, 2015 |
| Net Asset Value, Beginning of Period | $20.00 |
| Investment Operations | |
| Net Investment Income | .1112 |
| Capital Gain Distributions Received | — |
| Net Realized and Unrealized Gain (Loss) on Investments | (.599) |
| Total from Investment Operations | (. 488) |
| Distributions | |
| Dividends from Net Investment Income | (.052) |
| Distributions from Realized Capital Gains | — |
| Total Distributions | (. 052) |
| Net Asset Value, End of Period | $19.46 |
| Total Return | -2.44% |
| Ratios/Supplemental Data | |
| Net Assets, End of Period (Millions) | $843 |
| Ratio of Total Expenses to Average Net Assets | — |
| Acquired Fund Fees and Expenses | 0.10%3 |
| Ratio of Net Investment Income to Average Net Assets | 1.99%3 |
| Portfolio Turnover Rate | 1% |
| 1 | Inception. |
| 2 | Calculated based on average shares outstanding. |
| 3 | Annualized. |
See accompanying Notes, which are an integral part of the Financial Statements.
15
Institutional Target Retirement Income Fund
Notes to Financial Statements
Vanguard Institutional Target Retirement Income Fund is registered under the Investment Company Act of 1940 as an open-end investment company, or mutual fund. The fund follows a balanced investment strategy by investing in selected Vanguard funds to achieve its targeted allocation of assets to U.S. and international stocks, and U.S. and international bonds. Financial statements and other information about each underlying fund are available on vanguard.com.
A. The following significant accounting policies conform to generally accepted accounting principles for U.S. investment companies. The fund consistently follows such policies in preparing its financial statements.
1. Security Valuation: Investments are valued at the net asset value of each underlying Vanguard fund determined as of the close of the New York Stock Exchange (generally 4 p.m., Eastern time) on the valuation date.
2. Federal Income Taxes: The fund intends to qualify as a regulated investment company and distribute all of its taxable income. Management has analyzed the fund’s tax positions taken for its open federal income tax period ended September 30, 2015, and has concluded that no provision for federal income tax is required in the fund’s financial statements.
3. Distributions: Distributions to shareholders are recorded on the ex-dividend date.
4. Other: Income and capital gain distributions received are recorded on the ex-dividend date. Security transactions are accounted for on the date securities are bought or sold. Costs used to determine realized gains (losses) on the sale of investment securities are those of the specific securities sold.
B. In accordance with the terms of a Funds’ Service Agreement (the “FSA”) between Vanguard and the fund, Vanguard furnishes to the fund investment advisory, corporate management, administrative, marketing, and distribution services at Vanguard’s cost of operations (as defined by the FSA). These costs of operations are allocated to the fund based on methods and guidelines approved by the board of trustees. The FSA provides that expenses otherwise allocable to Vanguard funds-of-funds may be reduced or eliminated to the extent of savings realized by the underlying Vanguard funds by virtue of being part of a fund-of-funds. Accordingly, all expenses for services provided by Vanguard to the fund and all other expenses incurred by the fund during the period ended September 30, 2015, were borne by the underlying Vanguard funds in which the fund invests. The fund’s trustees and officers are also trustees and officers, respectively, of the underlying Vanguard funds, as well as directors and employees, respectively, of Vanguard.
C. Various inputs may be used to determine the value of the fund’s investments. These inputs are summarized in three broad levels for financial statement purposes. The inputs or methodologies used to value securities are not necessarily an indication of the risk associated with investing in those securities.
Level 1—Quoted prices in active markets for identical securities.
Level 2—Other significant observable inputs (including quoted prices for similar securities, interest rates, prepayment speeds, credit risk, etc.).
Level 3—Significant unobservable inputs (including the fund’s own assumptions used to determine the fair value of investments).
At September 30, 2015, 100% of the market value of the fund’s investments was determined based on Level 1 inputs.
16
Institutional Target Retirement Income Fund
D. Distributions are determined on a tax basis and may differ from net investment income and realized capital gains for financial reporting purposes. Differences may be permanent or temporary. Permanent differences are reclassified among capital accounts in the financial statements to reflect their tax character. Temporary differences arise when certain items of income, expense, gain, or loss are recognized in different periods for financial statement and tax purposes. These differences will reverse at some time in the future. Differences in classification may also result from the treatment of short-term gains as ordinary income for tax purposes.
The fund used a tax accounting practice to treat a portion of the price of capital shares redeemed during the year as distributions from realized capital gains. Accordingly, the fund has reclassified $16,000 from accumulated net realized gains to paid-in capital.
For tax purposes, at September 30, 2015, the fund had $546,000 of ordinary income available for distribution.
At September 30, 2015, the cost of investment securities for tax purposes was $860,177,000. Net unrealized depreciation of investment securities for tax purposes was $17,357,000, consisting of unrealized gains of $2,245,000 on securities that had risen in value since their purchase and $19,602,000 in unrealized losses on securities that had fallen in value since their purchase.
| E. Capital shares issued and redeemed were: | |
| June 26, 20151 to | |
| September 30, 2015 | |
| Shares | |
| (000) | |
| Issued | 44,137 |
| Issued in Lieu of Cash Distributions | 106 |
| Redeemed | (934) |
| Net Increase (Decrease) in Shares Outstanding | 43,309 |
| 1 Inception. |
17
Institutional Target Retirement Income Fund
| F. Transactions during the period in affiliated underlying Vanguard funds were as follows: | ||||||
| Current Period Transactions | ||||||
| June 26, | Proceeds | Sept. 30, | ||||
| 20151 | from | Capital Gain | 2015 | |||
| Market | Purchases | Securities | Distributions | Market | ||
| Value | at Cost | Sold | Income | Received | Value | |
| ($000) | ($000) | ($000) | ($000) | ($000) | ($000) | |
| Vanguard Market Liquidity Fund | — | NA2 | NA 2 | — | — | — |
| Vanguard Short-Term | ||||||
| Inflation-Protected Securities | ||||||
| Index Fund | — | 142,069 | 295 | — | — | 141,569 |
| Vanguard Total Bond Market II | ||||||
| Index Fund | — | 316,498 | 4,791 | 1,077 | — | 313,346 |
| Vanguard Total International Bond | ||||||
| Index Fund | — | 133,716 | 363 | 334 | — | 133,965 |
| Vanguard Total International Stock | ||||||
| Index Fund | — | 111,282 | 722 | 444 | — | 101,436 |
| Vanguard Total Stock Market | ||||||
| Index Fund | — | 164,065 | 1,348 | 706 | — | 152,504 |
| Total | — | 867,630 | 7,519 | 2,561 | — | 842,820 |
| 1 Inception. | ||||||
| 2 Not applicable—purchases and sales are for temporary cash investment purposes. | ||||||
G. Certain funds managed by The Vanguard Group participate in a $3 billion committed credit facility provided by a syndicate of lenders pursuant to a credit agreement that may be renewed annually; each fund is individually liable for its borrowings, if any, under the credit facility. In October 2015, this credit agreement was amended to designate the fund as an additional borrower. Borrowings may be utilized for temporary and emergency purposes, and are subject to the fund’s regulatory and contractual borrowing restrictions. The participating funds are charged administrative fees and an annual commitment fee of 0.06% of the undrawn amount of the facility; these fees are allocated to the funds based on a method approved by the fund’s board of trustees. Any borrowings under this facility bear interest at a rate equal to the higher of the federal funds rate or LIBOR reference rate plus an agreed-upon spread.
Management has determined that no other transactions occurred subsequent to September 30, 2015, that would require recognition or disclosure in these financial statements.
18
Institutional Target Retirement 2010 Fund
Fund Profile
As of September 30, 2015
| Total Fund Characteristics | |
| Ticker Symbol | VIRTX |
| 30-Day SEC Yield | 1.99% |
| Acquired Fund Fees and Expenses1 | 0.10% |
| Allocation to Underlying Vanguard Funds | |
| Vanguard Total Bond Market II Index Fund | |
| Investor Shares | 35.5% |
| Vanguard Total Stock Market Index Fund | |
| Institutional Shares | 20.7 |
| Vanguard Total International Bond Index | |
| Fund Admiral Shares | 15.2 |
| Vanguard Short-Term Inflation-Protected | |
| Securities Index Fund Admiral Shares | 14.9 |
| Vanguard Total International Stock Index | |
| Fund Investor Shares | 13.7 |
1 This figure—drawn from the prospectus dated June 26, 2015—represents an estimate of the weighted average of the expense ratios and any transaction fees charged by the underlying mutual funds (the ”acquired” funds) in which the Institutional Target Retirement 2010 Fund invests. The fund does not charge any expenses or fees of its own. For the period from inception through September 30, 2015, the annualized acquired fund fees and expenses were 0.10%.
19
Institutional Target Retirement 2010 Fund
Performance Summary
All of the returns in this report represent past performance, which is not a guarantee of future results that may be achieved by the fund. (Current performance may be lower or higher than the performance data cited. For performance data current to the most recent month-end, visit our website at vanguard.com/performance.) Note, too, that both investment returns and principal value can fluctuate widely, so an investor’s shares, when sold, could be worth more or less than their original cost. The returns shown do not reflect taxes that a shareholder would pay on fund distributions or on the sale of fund shares.
| Cumulative Performance: June 26, 2015, Through September 30, 2015 | ||
| Initial Investment of $100,000,000 | ||
| Total Returns | ||
| Period Ended September 30, 2015 | ||
| Since | Final Value | |
| Inception | of a $100,000,000 | |
| (6/26/2015) | Investment | |
| Institutional Target Retirement 2010 Fund | -3.00% | $97,000,000 |
| Target 2010 Composite Index | -3.02 | 96,979,520 |
| Mixed-Asset Target 2010 Funds Average | -4.22 | 95,777,859 |
| MSCI US Broad Market Index | -8.94 | 91,061,036 |
For a benchmark description, see the Glossary.
Mixed-Asset Target 2010 Funds Average: Derived from data provided by Lipper, a Thomson Reuters Company.
"Since Inception" performance is calculated from the fund's inception date for both the fund and its comparative standards.
See Financial Highlights for dividend and capital gains information.
20
Institutional Target Retirement 2010 Fund
Fiscal-Period Total Returns (%): June 26, 2015, Through September 30, 2015
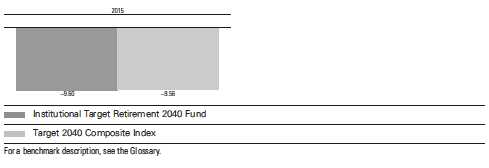
21
Institutional Target Retirement 2010 Fund
Financial Statements
Statement of Net Assets
As of September 30, 2015
The fund reports a complete list of its holdings in regulatory filings four times in each fiscal year, at the quarter-ends. For the second and fourth fiscal quarters, the lists appear in the fund’s semiannual and annual reports to shareholders. For the first and third fiscal quarters, the fund files the lists with the Securities and Exchange Commission on Form N-Q. Shareholders can look up the fund’s Forms N-Q on the SEC’s website at sec.gov. Forms N-Q may also be reviewed and copied at the SEC’s Public Reference Room (see the back cover of this report for further information).
| Market | ||
| Value• | ||
| Shares | ($000) | |
| Investment Companies (100.0%) | ||
| U.S. Stock Fund (20.7%) | ||
| Vanguard Total Stock Market Index Fund Institutional Shares | 3,373,858 | 162,215 |
| International Stock Fund (13.7%) | ||
| Vanguard Total International Stock Index Fund Investor Shares | 7,589,243 | 107,919 |
| U.S. Bond Funds (50.4%) | ||
| 1 Vanguard Total Bond Market II Index Fund Investor Shares | 25,881,471 | 278,485 |
| Vanguard Short-Term Inflation-Protected Securities Index Fund Admiral Shares | 4,811,274 | 116,769 |
| 395,254 | ||
| International Bond Fund (15.2%) | ||
| Vanguard Total International Bond Index Fund Admiral Shares | 5,638,254 | 119,137 |
| Total Investment Companies (Cost $802,960) | 784,525 | |
| Amount | ||
| ($000) | ||
| Other Assets and Liabilities (0.0%) | ||
| Other Assets | ||
| Receivables for Accrued Income | 571 | |
| Receivables for Capital Shares Issued | 23,923 | |
| Total Other Assets | 24,494 | |
| Liabilities | ||
| Payables for Investment Securities Purchased | (23,856) | |
| Payables for Capital Shares Redeemed | (318) | |
| Other Liabilities | (15) | |
| Total Liabilities | (24,189) | |
| Net Assets (100%) | ||
| Applicable to 40,461,083 outstanding $.001 par value shares of | ||
| beneficial interest (unlimited authorization) | 784,830 | |
| Net Asset Value Per Share | $19.40 | |
22
| Institutional Target Retirement 2010 Fund | |
| At September 30, 2015, net assets consisted of: | |
| Amount | |
| ($000) | |
| Paid-in Capital | 800,848 |
| Undistributed Net Investment Income | 2,360 |
| Accumulated Net Realized Gains | 57 |
| Unrealized Appreciation (Depreciation) | (18,435) |
| Net Assets | 784,830 |
- See Note A in Notes to Financial Statements.
- Affiliated fund available only to Vanguard funds and certain trusts and accounts managed by Vanguard. See accompanying Notes, which are an integral part of the Financial Statements.
23
| Institutional Target Retirement 2010 Fund | |
| Statement of Operations | |
| June 26, 20151 to | |
| September 30, 2015 | |
| ($000) | |
| Investment Income | |
| Income | |
| Income Distributions Received | 2,379 |
| Net Investment Income—Note B | 2,379 |
| Realized Net Gain (Loss) | |
| Affiliated Investment Securities Sold | 11 |
| Futures Contracts | 47 |
| Realized Net Gain (Loss) | 58 |
| Change in Unrealized Appreciation (Depreciation) of Investment Securities | (18,435) |
| Net Increase (Decrease) in Net Assets Resulting from Operations | (15,998) |
| 1 Inception. | |
See accompanying Notes, which are an integral part of the Financial Statements.
24
| Institutional Target Retirement 2010 Fund | |
| Statement of Changes in Net Assets | |
| June 26, 20151 to | |
| September 30, 2015 | |
| ($000) | |
| Increase (Decrease) in Net Assets | |
| Operations | |
| Net Investment Income | 2,379 |
| Realized Net Gain (Loss) | 58 |
| Change in Unrealized Appreciation (Depreciation) | (18,435) |
| Net Increase (Decrease) in Net Assets Resulting from Operations | (15,998) |
| Distributions | |
| Net Investment Income | — |
| Realized Capital Gain | — |
| Total Distributions | — |
| Capital Share Transactions | |
| Issued | 819,881 |
| Issued in Lieu of Cash Distributions | — |
| Redeemed | (19,053) |
| Net Increase (Decrease) from Capital Share Transactions | 800,828 |
| Total Increase (Decrease) | 784,830 |
| Net Assets | |
| Beginning of Period | — |
| End of Period2 | 784,830 |
| 1 | Inception. |
| 2 | Net Assets—End of Period includes undistributed (overdistributed) net investment income of $2,360,000. |
See accompanying Notes, which are an integral part of the Financial Statements.
25
| Institutional Target Retirement 2010 Fund | |
| Financial Highlights | |
| June 26, 20151 to | |
| For a Share Outstanding Throughout the Period | September 30, 2015 |
| Net Asset Value, Beginning of Period | $20.00 |
| Investment Operations | |
| Net Investment Income | .1152 |
| Capital Gain Distributions Received | — |
| Net Realized and Unrealized Gain (Loss) on Investments | (.715) |
| Total from Investment Operations | (. 600) |
| Distributions | |
| Dividends from Net Investment Income | — |
| Distributions from Realized Capital Gains | — |
| Total Distributions | — |
| Net Asset Value, End of Period | $19.40 |
| Total Return | -3.00% |
| Ratios/Supplemental Data | |
| Net Assets, End of Period (Millions) | $785 |
| Ratio of Total Expenses to Average Net Assets | — |
| Acquired Fund Fees and Expenses | 0.10%3 |
| Ratio of Net Investment Income to Average Net Assets | 2.02%3 |
| Portfolio Turnover Rate | 3% |
| 1 | Inception. |
| 2 | Calculated based on average shares outstanding. |
| 3 | Annualized. |
See accompanying Notes, which are an integral part of the Financial Statements.
26
Institutional Target Retirement 2010 Fund
Notes to Financial Statements
Vanguard Institutional Target Retirement 2010 Fund is registered under the Investment Company Act of 1940 as an open-end investment company, or mutual fund. The fund follows a balanced investment strategy by investing in selected Vanguard funds to achieve its targeted allocation of assets to U.S. and international stocks, and U.S. and international bonds. Financial statements and other information about each underlying fund are available on vanguard.com.
A. The following significant accounting policies conform to generally accepted accounting principles for U.S. investment companies. The fund consistently follows such policies in preparing its financial statements.
1. Security Valuation: Investments are valued at the net asset value of each underlying Vanguard fund determined as of the close of the New York Stock Exchange (generally 4 p.m., Eastern time) on the valuation date.
2. Futures Contracts: The fund uses stock and bond futures contracts to a limited extent, with the objectives of maintaining full exposure to the market and maintaining its target asset allocation. The primary risks associated with the use of futures contracts are imperfect correlation between changes in market values of investments held by the fund and the prices of futures contracts, and the possibility of an illiquid market. Counterparty risk involving futures is mitigated because a regulated clearinghouse is the counterparty instead of the clearing broker. To further mitigate counterparty risk, the fund trades futures contracts on an exchange, monitors the financial strength of its clearing brokers and clearinghouse, and has entered into clearing agreements with its clearing brokers. The clearinghouse imposes initial margin requirements to secure the fund’s performance and requires daily settlement of variation margin representing changes in the market value of each contract.
Futures contracts are valued at their quoted daily settlement prices. The aggregate settlement values of the contracts are not recorded in the Statement of Net Assets. Fluctuations in the value of the contracts are recorded in the Statement of Net Assets as an asset (liability) and in the Statement of Operations as unrealized appreciation (depreciation) until the contracts are closed, when they are recorded as realized futures gains (losses).
During the period ended September 30, 2015, the fund’s average investments in long and short futures contracts each represented 0% of net assets, based on the average of aggregate settlement values at each quarter-end during the period. The fund had no open futures contracts at September 30, 2015.
3. Federal Income Taxes: The fund intends to qualify as a regulated investment company and distribute all of its taxable income. Management has analyzed the fund’s tax positions taken for its open federal income tax period ended September 30, 2015, and has concluded that no provision for federal income tax is required in the fund’s financial statements.
4. Distributions: Distributions to shareholders are recorded on the ex-dividend date.
5. Other: Income and capital gain distributions received are recorded on the ex-dividend date. Security transactions are accounted for on the date securities are bought or sold. Costs used to determine realized gains (losses) on the sale of investment securities are those of the specific securities sold.
B. In accordance with the terms of a Funds’ Service Agreement (the “FSA”) between Vanguard and the fund, Vanguard furnishes to the fund investment advisory, corporate management, administrative, marketing, and distribution services at Vanguard’s cost of operations (as defined by the FSA). These costs of operations are allocated to the fund based on methods and guidelines approved by the board of trustees. The FSA provides that expenses otherwise allocable to Vanguard funds-of-funds may be reduced or eliminated to the extent of savings realized by the underlying Vanguard funds by virtue of
27
Institutional Target Retirement 2010 Fund
being part of a fund-of-funds. Accordingly, all expenses for services provided by Vanguard to the fund and all other expenses incurred by the fund during the period ended September 30, 2015, were borne by the underlying Vanguard funds in which the fund invests. The fund’s trustees and officers are also trustees and officers, respectively, of the underlying Vanguard funds, as well as directors and employees, respectively, of Vanguard.
C. Various inputs may be used to determine the value of the fund’s investments. These inputs are summarized in three broad levels for financial statement purposes. The inputs or methodologies used to value securities are not necessarily an indication of the risk associated with investing in those securities.
Level 1—Quoted prices in active markets for identical securities.
Level 2—Other significant observable inputs (including quoted prices for similar securities, interest rates, prepayment speeds, credit risk, etc.).
Level 3—Significant unobservable inputs (including the fund’s own assumptions used to determine the fair value of investments).
At September 30, 2015, 100% of the market value of the fund’s investments was determined based on Level 1 inputs.
D. Distributions are determined on a tax basis and may differ from net investment income and realized capital gains for financial reporting purposes. Differences may be permanent or temporary. Permanent differences are reclassified among capital accounts in the financial statements to reflect their tax character. Temporary differences arise when certain items of income, expense, gain, or loss are recognized in different periods for financial statement and tax purposes. These differences will reverse at some time in the future. Differences in classification may also result from the treatment of short-term gains as ordinary income for tax purposes.
The fund used a tax accounting practice to treat a portion of the price of capital shares redeemed during the year as distributions from net investment income and realized capital gains. Accordingly, the fund has reclassified $19,000 from undistributed net investment income, and $1,000 from accumulated net realized gains, to paid-in capital.
For tax purposes, at September 30, 2015, the fund had $2,452,000 of ordinary income and $28,000 of long-term capital gains available for distribution.
At September 30, 2015, the cost of investment securities for tax purposes was $803,023,000. Net unrealized depreciation of investment securities for tax purposes was $18,498,000, consisting of unrealized gains of $1,705,000 on securities that had risen in value since their purchase and $20,203,000 in unrealized losses on securities that had fallen in value since their purchase.
E. Capital shares issued and redeemed were:
| June 26, 20151 to | |
| September 30, 2015 | |
| Shares | |
| (000) | |
| Issued | 41,427 |
| Issued in Lieu of Cash Distributions | — |
| Redeemed | (966) |
| Net Increase (Decrease) in Shares Outstanding | 40,461 |
| 1 Inception. |
28
Institutional Target Retirement 2010 Fund
| F. Transactions during the period in affiliated underlying Vanguard funds were as follows: | ||||||
| Current Period Transactions | ||||||
| June 26, | Proceeds | Sept. 30, | ||||
| 20151 | from | Capital Gain | 2015 | |||
| Market | Purchases | Securities | Distributions | Market | ||
| Value | at Cost | Sold | Income | Received | Value | |
| ($000) | ($000) | ($000) | ($000) | ($000) | ($000) | |
| Vanguard Market Liquidity Fund | — | NA2 | NA 2 | — | — | — |
| Vanguard Short-Term | ||||||
| Inflation-Protected Securities | ||||||
| Index Fund | — | 119,029 | 2,051 | — | — | 116,769 |
| Vanguard Total Bond Market II | ||||||
| Index Fund | — | 283,131 | 5,896 | 925 | — | 278,485 |
| Vanguard Total International | ||||||
| Bond Index Fund | — | 122,684 | 4,014 | 287 | — | 119,137 |
| Vanguard Total International | ||||||
| Stock Index Fund | — | 118,088 | 736 | 459 | — | 107,919 |
| Vanguard Total Stock Market | ||||||
| Index Fund | — | 174,395 | 1,681 | 708 | — | 162,215 |
| Total | — | 817,327 | 14,378 | 2,379 | — | 784,525 |
| 1 Inception. | ||||||
| 2 Not applicable—purchases and sales are for temporary cash investment purposes. | ||||||
G. Certain funds managed by The Vanguard Group participate in a $3 billion committed credit facility provided by a syndicate of lenders pursuant to a credit agreement that may be renewed annually; each fund is individually liable for its borrowings, if any, under the credit facility. In October 2015, this credit agreement was amended to designate the fund as an additional borrower. Borrowings may be utilized for temporary and emergency purposes, and are subject to the fund’s regulatory and contractual borrowing restrictions. The participating funds are charged administrative fees and an annual commitment fee of 0.06% of the undrawn amount of the facility; these fees are allocated to the funds based on a method approved by the fund’s board of trustees. Any borrowings under this facility bear interest at a rate equal to the higher of the federal funds rate or LIBOR reference rate plus an agreed-upon spread.
Management has determined that no other transactions occurred subsequent to September 30, 2015, that would require recognition or disclosure in these financial statements.
29
Institutional Target Retirement 2015 Fund
Fund Profile
As of September 30, 2015
| Total Fund Characteristics | |
| Ticker Symbol | VITVX |
| 30-Day SEC Yield | 2.12% |
| Acquired Fund Fees and Expenses1 | 0.10% |
| Allocation to Underlying Vanguard Funds | |
| Vanguard Total Bond Market II Index Fund | |
| Investor Shares | 29.8% |
| Vanguard Total Stock Market Index Fund | |
| Institutional Shares | 29.3 |
| Vanguard Total International Stock Index | |
| Fund Investor Shares | 19.5 |
| Vanguard Total International Bond Index | |
| Fund Admiral Shares | 12.8 |
| Vanguard Short-Term Inflation-Protected | |
| Securities Index Fund Admiral Shares | 8.6 |
1 This figure—drawn from the prospectus dated June 26, 2015—represents an estimate of the weighted average of the expense ratios and any transaction fees charged by the underlying mutual funds (the ”acquired” funds) in which the Institutional Target Retirement 2015 Fund invests. The fund does not charge any expenses or fees of its own. For the period from inception through September 30, 2015, the annualized acquired fund fees and expenses were 0.10%.
30
Institutional Target Retirement 2015 Fund
Performance Summary
All of the returns in this report represent past performance, which is not a guarantee of future results that may be achieved by the fund. (Current performance may be lower or higher than the performance data cited. For performance data current to the most recent month-end, visit our website at vanguard.com/performance.) Note, too, that both investment returns and principal value can fluctuate widely, so an investor’s shares, when sold, could be worth more or less than their original cost. The returns shown do not reflect taxes that a shareholder would pay on fund distributions or on the sale of fund shares.
| Cumulative Performance: June 26, 2015, Through September 30, 2015 | ||
| Initial Investment of $100,000,000 | ||
| Total Returns | ||
| Period Ended September 30, 2015 | ||
| Since | Final Value | |
| Inception | of a $100,000,000 | |
| (6/26/2015) | Investment | |
| Institutional Target Retirement 2015 Fund | -4.70% | $95,300,000 |
| Target 2015 Composite Index | -4.69 | 95,306,165 |
| Mixed-Asset Target 2015 Funds Average | -4.86 | 95,144,337 |
| MSCI US Broad Market Index | -8.94 | 91,061,036 |
For a benchmark description, see the Glossary.
Mixed-Asset Target 2015 Funds Average: Derived from data provided by Lipper, a Thomson Reuters Company.
"Since Inception" performance is calculated from the fund's inception date for both the fund and its comparative standards.
See Financial Highlights for dividend and capital gains information.
31
Institutional Target Retirement 2015 Fund
Fiscal-Period Total Returns (%): June 26, 2015, Through September 30, 2015
32
Institutional Target Retirement 2015 Fund
Financial Statements
Statement of Net Assets
As of September 30, 2015
The fund reports a complete list of its holdings in regulatory filings four times in each fiscal year, at the quarter-ends. For the second and fourth fiscal quarters, the lists appear in the fund’s semiannual and annual reports to shareholders. For the first and third fiscal quarters, the fund files the lists with the Securities and Exchange Commission on Form N-Q. Shareholders can look up the fund’s Forms N-Q on the SEC’s website at sec.gov. Forms N-Q may also be reviewed and copied at the SEC’s Public Reference Room (see the back cover of this report for further information).
| Market | ||
| Value• | ||
| Shares | ($000) | |
| Investment Companies (99.9%) | ||
| U.S. Stock Fund (29.2%) | ||
| Vanguard Total Stock Market Index Fund Institutional Shares | 16,963,411 | 815,601 |
| International Stock Fund (19.4%) | ||
| Vanguard Total International Stock Index Fund Investor Shares | 38,151,557 | 542,515 |
| U.S. Bond Funds (38.5%) | ||
| 1 Vanguard Total Bond Market II Index Fund Investor Shares | 77,428,642 | 833,132 |
| Vanguard Short-Term Inflation-Protected Securities Index Fund Admiral Shares | 9,880,679 | 239,804 |
| 1,072,936 | ||
| International Bond Fund (12.8%) | ||
| Vanguard Total International Bond Index Fund Admiral Shares | 16,857,938 | 356,208 |
| Total Investment Companies (Cost $2,886,097) | 2,787,260 | |
| Amount | ||
| ($000) | ||
| Other Assets and Liabilities (0.1%) | ||
| Other Assets | ||
| Receivables for Accrued Income | 1,751 | |
| Receivables for Capital Shares Issued | 96,685 | |
| Total Other Assets | 98,436 | |
| Liabilities | ||
| Payables for Investment Securities Purchased | (94,856) | |
| Payables for Capital Shares Redeemed | (240) | |
| Other Liabilities | (397) | |
| Total Liabilities | (95,493) | |
| Net Assets (100%) | ||
| Applicable to 146,389,105 outstanding $.001 par value shares of | ||
| beneficial interest (unlimited authorization) | 2,790,203 | |
| Net Asset Value Per Share | $19.06 | |
33
| Institutional Target Retirement 2015 Fund | |
| At September 30, 2015, net assets consisted of: | |
| Amount | |
| ($000) | |
| Paid-in Capital | 2,879,218 |
| Undistributed Net Investment Income | 9,723 |
| Accumulated Net Realized Gains | 99 |
| Unrealized Appreciation (Depreciation) | (98,837) |
| Net Assets | 2,790,203 |
- See Note A in Notes to Financial Statements.
- Affiliated fund available only to Vanguard funds and certain trusts and accounts managed by Vanguard. See accompanying Notes, which are an integral part of the Financial Statements.
34
| Institutional Target Retirement 2015 Fund | |
| Statement of Operations | |
| June 26, 20151 to | |
| September 30, 2015 | |
| ($000) | |
| Investment Income | |
| Income | |
| Income Distributions Received | 9,769 |
| Net Investment Income—Note B | 9,769 |
| Realized Net Gain (Loss) | |
| Affiliated Investment Securities Sold | 19 |
| Futures Contracts | 81 |
| Realized Net Gain (Loss) | 100 |
| Change in Unrealized Appreciation (Depreciation) of Investment Securities | (98,837) |
| Net Increase (Decrease) in Net Assets Resulting from Operations | (88,968) |
| 1 Inception. | |
See accompanying Notes, which are an integral part of the Financial Statements.
35
| Institutional Target Retirement 2015 Fund | |
| Statement of Changes in Net Assets | |
| June 26, 20151 to | |
| September 30, 2015 | |
| ($000) | |
| Increase (Decrease) in Net Assets | |
| Operations | |
| Net Investment Income | 9,769 |
| Realized Net Gain (Loss) | 100 |
| Change in Unrealized Appreciation (Depreciation) | (98,837) |
| Net Increase (Decrease) in Net Assets Resulting from Operations | (88,968) |
| Distributions | |
| Net Investment Income | — |
| Realized Capital Gain | — |
| Total Distributions | — |
| Capital Share Transactions | |
| Issued | 2,926,694 |
| Issued in Lieu of Cash Distributions | — |
| Redeemed | (47,523) |
| Net Increase (Decrease) from Capital Share Transactions | 2,879,171 |
| Total Increase (Decrease) | 2,790,203 |
| Net Assets | |
| Beginning of Period | — |
| End of Period2 | 2,790,203 |
| 1 | Inception. |
| 2 | Net Assets—End of Period includes undistributed (overdistributed) net investment income of $9,723,000. |
See accompanying Notes, which are an integral part of the Financial Statements.
36
| Institutional Target Retirement 2015 Fund | |
| Financial Highlights | |
| June 26, 20151 to | |
| For a Share Outstanding Throughout the Period | September 30, 2015 |
| Net Asset Value, Beginning of Period | $20.00 |
| Investment Operations | |
| Net Investment Income | .1242 |
| Capital Gain Distributions Received | — |
| Net Realized and Unrealized Gain (Loss) on Investments | (1.064) |
| Total from Investment Operations | (0.940) |
| Distributions | |
| Dividends from Net Investment Income | — |
| Distributions from Realized Capital Gains | — |
| Total Distributions | — |
| Net Asset Value, End of Period | $19.06 |
| Total Return | -4.70% |
| Ratios/Supplemental Data | |
| Net Assets, End of Period (Millions) | $2,790 |
| Ratio of Total Expenses to Average Net Assets | — |
| Acquired Fund Fees and Expenses | 0.10%3 |
| Ratio of Net Investment Income to Average Net Assets | 2.21%3 |
| Portfolio Turnover Rate | 1% |
| 1 | Inception. |
| 2 | Calculated based on average shares outstanding. |
| 3 | Annualized. |
See accompanying Notes, which are an integral part of the Financial Statements.
37
Institutional Target Retirement 2015 Fund
Notes to Financial Statements
Vanguard Institutional Target Retirement 2015 Fund is registered under the Investment Company Act of 1940 as an open-end investment company, or mutual fund. The fund follows a balanced investment strategy by investing in selected Vanguard funds to achieve its targeted allocation of assets to U.S. and international stocks, and U.S. and international bonds. Financial statements and other information about each underlying fund are available on vanguard.com.
A. The following significant accounting policies conform to generally accepted accounting principles for U.S. investment companies. The fund consistently follows such policies in preparing its financial statements.
1. Security Valuation: Investments are valued at the net asset value of each underlying Vanguard fund determined as of the close of the New York Stock Exchange (generally 4 p.m., Eastern time) on the valuation date.
2. Futures Contracts: The fund uses stock and bond futures contracts to a limited extent, with the objectives of maintaining full exposure to the market and maintaining its target asset allocation. The primary risks associated with the use of futures contracts are imperfect correlation between changes in market values of investments held by the fund and the prices of futures contracts, and the possibility of an illiquid market. Counterparty risk involving futures is mitigated because a regulated clearinghouse is the counterparty instead of the clearing broker. To further mitigate counterparty risk, the fund trades futures contracts on an exchange, monitors the financial strength of its clearing brokers and clearinghouse, and has entered into clearing agreements with its clearing brokers. The clearinghouse imposes initial margin requirements to secure the fund’s performance and requires daily settlement of variation margin representing changes in the market value of each contract.
Futures contracts are valued at their quoted daily settlement prices. The aggregate settlement values of the contracts are not recorded in the Statement of Net Assets. Fluctuations in the value of the contracts are recorded in the Statement of Net Assets as an asset (liability) and in the Statement of Operations as unrealized appreciation (depreciation) until the contracts are closed, when they are recorded as realized futures gains (losses).
During the period ended September 30, 2015, the fund’s average investments in long and short futures contracts each represented 0% of net assets, based on the average of aggregate settlement values at each quarter-end during the period. The fund had no open futures contracts at September 30, 2015.
3. Federal Income Taxes: The fund intends to qualify as a regulated investment company and distribute all of its taxable income. Management has analyzed the fund’s tax positions taken for its open federal income tax period ended September 30, 2015, and has concluded that no provision for federal income tax is required in the fund’s financial statements.
4. Distributions: Distributions to shareholders are recorded on the ex-dividend date.
5. Other: Income and capital gain distributions received are recorded on the ex-dividend date. Security transactions are accounted for on the date securities are bought or sold. Costs used to determine realized gains (losses) on the sale of investment securities are those of the specific securities sold.
B. In accordance with the terms of a Funds’ Service Agreement (the “FSA”) between Vanguard and the fund, Vanguard furnishes to the fund investment advisory, corporate management, administrative, marketing, and distribution services at Vanguard’s cost of operations (as defined by the FSA). These costs of operations are allocated to the fund based on methods and guidelines approved by the board of trustees. The FSA provides that expenses otherwise allocable to Vanguard funds-of-funds may be reduced or eliminated to the extent of savings realized by the underlying Vanguard funds by virtue of
38
Institutional Target Retirement 2015 Fund
being part of a fund-of-funds. Accordingly, all expenses for services provided by Vanguard to the fund and all other expenses incurred by the fund during the period ended September 30, 2015, were borne by the underlying Vanguard funds in which the fund invests. The fund’s trustees and officers are also trustees and officers, respectively, of the underlying Vanguard funds, as well as directors and employees, respectively, of Vanguard.
C. Various inputs may be used to determine the value of the fund’s investments. These inputs are summarized in three broad levels for financial statement purposes. The inputs or methodologies used to value securities are not necessarily an indication of the risk associated with investing in those securities.
Level 1—Quoted prices in active markets for identical securities.
Level 2—Other significant observable inputs (including quoted prices for similar securities, interest rates, prepayment speeds, credit risk, etc.).
Level 3—Significant unobservable inputs (including the fund’s own assumptions used to determine the fair value of investments).
At September 30, 2015, 100% of the market value of the fund’s investments was determined based on Level 1 inputs.
D. Distributions are determined on a tax basis and may differ from net investment income and realized capital gains for financial reporting purposes. Differences may be permanent or temporary. Permanent differences are reclassified among capital accounts in the financial statements to reflect their tax character. Temporary differences arise when certain items of income, expense, gain, or loss are recognized in different periods for financial statement and tax purposes. These differences will reverse at some time in the future. Differences in classification may also result from the treatment of short-term gains as ordinary income for tax purposes.
The fund used a tax accounting practice to treat a portion of the price of capital shares redeemed during the period as distributions from net investment income and realized capital gains. Accordingly, the fund has reclassified $46,000 from undistributed net investment income, and $1,000 from accumulated net realized gains, to paid-in capital.
For tax purposes, at September 30, 2015, the fund had $9,835,000 of ordinary income and $48,000 of long-term capital gains available for distribution.
At September 30, 2015, the cost of investment securities for tax purposes was $2,886,158,000. Net unrealized depreciation of investment securities for tax purposes was $98,898,000, consisting of unrealized gains of $5,855,000 on securities that had risen in value since their purchase and $104,753,000 in unrealized losses on securities that had fallen in value since their purchase.
E. Capital shares issued and redeemed were:
| June 26, 20151 to | |
| September 30, 2015 | |
| Shares | |
| (000) | |
| Issued | 148,822 |
| Issued in Lieu of Cash Distributions | — |
| Redeemed | (2,433) |
| Net Increase (Decrease) in Shares Outstanding | 146,389 |
| 1 Inception. |
39
Institutional Target Retirement 2015 Fund
| F. Transactions during the period in affiliated underlying Vanguard funds were as follows: | ||||||
| Current Period Transactions | ||||||
| June 26, | Proceeds | Sept. 30, | ||||
| 20151 | from | Capital Gain | 2015 | |||
| Market | Purchases | Securities | Distributions | Market | ||
| Value | at Cost | Sold | Income | Received | Value | |
| ($000) | ($000) | ($000) | ($000) | ($000) | ($000) | |
| Vanguard Market Liquidity Fund | — | NA2 | NA 2 | — | — | — |
| Vanguard Short-Term | ||||||
| Inflation-Protected Securities | ||||||
| Index Fund | — | 241,135 | 891 | — | — | 239,804 |
| Vanguard Total Bond Market II | ||||||
| Index Fund | — | 845,981 | 17,068 | 2,919 | — | 833,132 |
| Vanguard Total International | ||||||
| Bond Index Fund | — | 356,638 | 2,082 | 900 | — | 356,208 |
| Vanguard Total International | ||||||
| Stock Index Fund | — | 593,934 | 1,608 | 2,330 | — | 542,515 |
| Vanguard Total Stock Market | ||||||
| Index Fund | — | 873,649 | 3,610 | 3,620 | — | 815,601 |
| Total | — | 2,911,337 | 25,259 | 9,769 | — | 2,787,260 |
| 1 Inception. | ||||||
| 2 Not applicable—purchases and sales are for temporary cash investment purposes. | ||||||
G. Certain funds managed by The Vanguard Group participate in a $3 billion committed credit facility provided by a syndicate of lenders pursuant to a credit agreement that may be renewed annually; each fund is individually liable for its borrowings, if any, under the credit facility. In October 2015, this credit agreement was amended to designate the fund as an additional borrower. Borrowings may be utilized for temporary and emergency purposes, and are subject to the fund’s regulatory and contractual borrowing restrictions. The participating funds are charged administrative fees and an annual commitment fee of 0.06% of the undrawn amount of the facility; these fees are allocated to the funds based on a method approved by the fund’s board of trustees. Any borrowings under this facility bear interest at a rate equal to the higher of the federal funds rate or LIBOR reference rate plus an agreed-upon spread.
Management has determined that no other transactions occurred subsequent to September 30, 2015, that would require recognition or disclosure in these financial statements.
40
Institutional Target Retirement 2020 Fund
Fund Profile
As of September 30, 2015
| Total Fund Characteristics | |
| Ticker Symbol | VITWX |
| 30-Day SEC Yield | 2.25% |
| Acquired Fund Fees and Expenses1 | 0.10% |
| Allocation to Underlying Vanguard Funds | |
| Vanguard Total Stock Market Index Fund | |
| Institutional Shares | 35.5% |
| Vanguard Total Bond Market II Index Fund | |
| Investor Shares | 28.1 |
| Vanguard Total International Stock Index | |
| Fund Investor Shares | 23.6 |
| Vanguard Total International Bond Index | |
| Fund Admiral Shares | 12.0 |
| Vanguard Short-Term Inflation-Protected | |
| Securities Index Fund Admiral Shares | 0.8 |
1 This figure—drawn from the prospectus dated June 26, 2015—represents an estimate of the weighted average of the expense ratios and any transaction fees charged by the underlying mutual funds (the ”acquired” funds) in which the Institutional Target Retirement 2020 Fund invests. The fund does not charge any expenses or fees of its own. For the period from inception through September 30, 2015, the annualized acquired fund fees and expenses were 0.10%.
41
Institutional Target Retirement 2020 Fund
Performance Summary
All of the returns in this report represent past performance, which is not a guarantee of future results that may be achieved by the fund. (Current performance may be lower or higher than the performance data cited. For performance data current to the most recent month-end, visit our website at vanguard.com/performance.) Note, too, that both investment returns and principal value can fluctuate widely, so an investor’s shares, when sold, could be worth more or less than their original cost. The returns shown do not reflect taxes that a shareholder would pay on fund distributions or on the sale of fund shares.
| Cumulative Performance: June 26, 2015, Through September 30, 2015 | ||
| Initial Investment of $100,000,000 | ||
| Total Returns | ||
| Period Ended September 30, 2015 | ||
| Since | Final Value | |
| Inception | of a $100,000,000 | |
| (6/26/2015) | Investment | |
| Institutional Target Retirement 2020 Fund | -5.80% | $94,200,000 |
| Target 2020 Composite Index | -5.80 | 94,199,485 |
| Mixed-Asset Target 2020 Funds Average | -5.59 | 94,407,478 |
| MSCI US Broad Market Index | -8.94 | 91,061,036 |
For a benchmark description, see the Glossary.
Mixed-Asset Target 2020 Funds Average: Derived from data provided by Lipper, a Thomson Reuters Company.
"Since Inception" performance is calculated from the fund's inception date for both the fund and its comparative standards.
See Financial Highlights for dividend and capital gains information.
42
Institutional Target Retirement 2020 Fund
Fiscal-Period Total Returns (%): June 26, 2015, Through September 30, 2015
43
Institutional Target Retirement 2020 Fund
Financial Statements
Statement of Net Assets
As of September 30, 2015
The fund reports a complete list of its holdings in regulatory filings four times in each fiscal year, at the quarter-ends. For the second and fourth fiscal quarters, the lists appear in the fund’s semiannual and annual reports to shareholders. For the first and third fiscal quarters, the fund files the lists with the Securities and Exchange Commission on Form N-Q. Shareholders can look up the fund’s Forms N-Q on the SEC’s website at sec.gov. Forms N-Q may also be reviewed and copied at the SEC’s Public Reference Room (see the back cover of this report for further information).
| Market | ||
| Value• | ||
| Shares | ($000) | |
| Investment Companies (99.9%) | ||
| U.S. Stock Fund (35.5%) | ||
| Vanguard Total Stock Market Index Fund Institutional Shares | 35,684,835 | 1,715,727 |
| International Stock Fund (23.6%) | ||
| Vanguard Total International Stock Index Fund Investor Shares | 80,263,035 | 1,141,341 |
| U.S. Bond Funds (28.8%) | ||
| 1 Vanguard Total Bond Market II Index Fund Investor Shares | 125,915,156 | 1,354,847 |
| Vanguard Short-Term Inflation-Protected Securities Index Fund Admiral Shares | 1,591,391 | 38,623 |
| 1,393,470 | ||
| International Bond Fund (12.0%) | ||
| Vanguard Total International Bond Index Fund Admiral Shares | 27,423,724 | 579,463 |
| Total Investment Companies (Cost $5,026,072) | 4,830,001 | |
| Amount | ||
| ($000) | ||
| Other Assets and Liabilities (0.1%) | ||
| Other Assets | ||
| Receivables for Accrued Income | 2,786 | |
| Receivables for Capital Shares Issued | 197,691 | |
| Total Other Assets | 200,477 | |
| Liabilities | ||
| Payables for Investment Securities Purchased | (194,211) | |
| Payables for Capital Shares Redeemed | (427) | |
| Other Liabilities | (575) | |
| Total Liabilities | (195,213) | |
| Net Assets (100%) | ||
| Applicable to 256,702,765 outstanding $.001 par value shares of | ||
| beneficial interest (unlimited authorization) | 4,835,265 | |
| Net Asset Value Per Share | $18.84 | |
44
| Institutional Target Retirement 2020 Fund | |
| At September 30, 2015, net assets consisted of: | |
| Amount | |
| ($000) | |
| Paid-in Capital | 5,013,031 |
| Undistributed Net Investment Income | 17,994 |
| Accumulated Net Realized Gains | 311 |
| Unrealized Appreciation (Depreciation) | (196,071) |
| Net Assets | 4,835,265 |
- See Note A in Notes to Financial Statements.
- Affiliated fund available only to Vanguard funds and certain trusts and accounts managed by Vanguard. See accompanying Notes, which are an integral part of the Financial Statements.
45
| Institutional Target Retirement 2020 Fund | |
| Statement of Operations | |
| June 26, 20151 to | |
| September 30, 2015 | |
| ($000) | |
| Investment Income | |
| Income | |
| Income Distributions Received | 18,060 |
| Net Investment Income—Note B | 18,060 |
| Realized Net Gain (Loss) | |
| Affiliated Investment Securities Sold | 29 |
| Futures Contracts | 283 |
| Realized Net Gain (Loss) | 312 |
| Change in Unrealized Appreciation (Depreciation) of Investment Securities | (196,071) |
| Net Increase (Decrease) in Net Assets Resulting from Operations | (177,699) |
| 1 Inception. | |
See accompanying Notes, which are an integral part of the Financial Statements.
46
| Institutional Target Retirement 2020 Fund | |
| Statement of Changes in Net Assets | |
| June 26, 20151 to | |
| September 30, 2015 | |
| ($000) | |
| Increase (Decrease) in Net Assets | |
| Operations | |
| Net Investment Income | 18,060 |
| Realized Net Gain (Loss) | 312 |
| Change in Unrealized Appreciation (Depreciation) | (196,071) |
| Net Increase (Decrease) in Net Assets Resulting from Operations | (177,699) |
| Distributions | |
| Net Investment Income | — |
| Realized Capital Gain | — |
| Total Distribution | — |
| Capital Share Transactions | |
| Issued | 5,067,821 |
| Issued in Lieu of Cash Distributions | — |
| Redeemed | (54,857) |
| Net Increase (Decrease) from Capital Share Transactions | 5,012,964 |
| Total Increase (Decrease) | 4,835,265 |
| Net Assets | |
| Beginning of Period | — |
| End of Period2 | 4,835,265 |
| 1 | Inception. |
| 2 | Net Assets—End of Period includes undistributed (overdistributed) net investment income of $17,994,000. |
See accompanying Notes, which are an integral part of the Financial Statements.
47
| Institutional Target Retirement 2020 Fund | |
| Financial Highlights | |
| June 26, 20151 to | |
| For a Share Outstanding Throughout the Period | September 30, 2015 |
| Net Asset Value, Beginning of Period | $20.00 |
| Investment Operations | |
| Net Investment Income | .1382 |
| Capital Gain Distributions Received | — |
| Net Realized and Unrealized Gain (Loss) on Investments | (1.298) |
| Total from Investment Operations | (1.160) |
| Distributions | |
| Dividends from Net Investment Income | — |
| Distributions from Realized Capital Gains | — |
| Total Distributions | — |
| Net Asset Value, End of Period | $18.84 |
| Total Return | -5.80% |
| Ratios/Supplemental Data | |
| Net Assets, End of Period (Millions) | $4,835 |
| Ratio of Total Expenses to Average Net Assets | — |
| Acquired Fund Fees and Expenses | 0.10%3 |
| Ratio of Net Investment Income to Average Net Assets | 2.48%3 |
| Portfolio Turnover Rate | 2% |
| 1 | Inception. |
| 2 | Calculated based on average shares outstanding. |
| 3 | Annualized. |
See accompanying Notes, which are an integral part of the Financial Statements.
48
Institutional Target Retirement 2020 Fund
Notes to Financial Statements
Vanguard Institutional Target Retirement 2020 Fund is registered under the Investment Company Act of 1940 as an open-end investment company, or mutual fund. The fund follows a balanced investment strategy by investing in selected Vanguard funds to achieve its targeted allocation of assets to U.S. and international stocks, and U.S. and international bonds. Financial statements and other information about each underlying fund are available on vanguard.com.
A. The following significant accounting policies conform to generally accepted accounting principles for U.S. investment companies. The fund consistently follows such policies in preparing its financial statements.
1. Security Valuation: Investments are valued at the net asset value of each underlying Vanguard fund determined as of the close of the New York Stock Exchange (generally 4 p.m., Eastern time) on the valuation date.
2. Futures Contracts: The fund uses stock and bond futures contracts to a limited extent, with the objectives of maintaining full exposure to the market and maintaining its target asset allocation. The primary risks associated with the use of futures contracts are imperfect correlation between changes in market values of investments held by the fund and the prices of futures contracts, and the possibility of an illiquid market. Counterparty risk involving futures is mitigated because a regulated clearinghouse is the counterparty instead of the clearing broker. To further mitigate counterparty risk, the fund trades futures contracts on an exchange, monitors the financial strength of its clearing brokers and clearinghouse, and has entered into clearing agreements with its clearing brokers. The clearinghouse imposes initial margin requirements to secure the fund’s performance and requires daily settlement of variation margin representing changes in the market value of each contract.
Futures contracts are valued at their quoted daily settlement prices. The aggregate settlement values of the contracts are not recorded in the Statement of Net Assets. Fluctuations in the value of the contracts are recorded in the Statement of Net Assets as an asset (liability) and in the Statement of Operations as unrealized appreciation (depreciation) until the contracts are closed, when they are recorded as realized futures gains (losses).
During the period ended September 30, 2015, the fund’s average investments in long and short futures contracts represented 0% of net assets, based on the average of aggregate settlement values at each quarter-end during the period. The fund had no open futures contracts at September 30, 2015.
3. Federal Income Taxes: The fund intends to qualify as a regulated investment company and distribute all of its taxable income. Management has analyzed the fund’s tax positions taken for its open federal income tax period ended September 30, 2015, and has concluded that no provision for federal income tax is required in the fund’s financial statements.
4. Distributions: Distributions to shareholders are recorded on the ex-dividend date.
5. Other: Income and capital gain distributions received are recorded on the ex-dividend date. Security transactions are accounted for on the date securities are bought or sold. Costs used to determine realized gains (losses) on the sale of investment securities are those of the specific securities sold.
49
Institutional Target Retirement 2020 Fund
B. In accordance with the terms of a Funds’ Service Agreement (the “FSA”) between Vanguard and the fund, Vanguard furnishes to the fund investment advisory, corporate management, administrative, marketing, and distribution services at Vanguard’s cost of operations (as defined by the FSA). These costs of operations are allocated to the fund based on methods and guidelines approved by the board of trustees. The FSA provides that expenses otherwise allocable to Vanguard funds-of-funds may be reduced or eliminated to the extent of savings realized by the underlying Vanguard funds by virtue of being part of a fund-of-funds. Accordingly, all expenses for services provided by Vanguard to the fund and all other expenses incurred by the fund during the period ended September 30, 2015, were borne by the underlying Vanguard funds in which the fund invests. The fund’s trustees and officers are also trustees and officers, respectively, of the underlying Vanguard funds, as well as directors and employees, respectively, of Vanguard.
C. Various inputs may be used to determine the value of the fund’s investments. These inputs are summarized in three broad levels for financial statement purposes. The inputs or methodologies used to value securities are not necessarily an indication of the risk associated with investing in those securities.
Level 1—Quoted prices in active markets for identical securities.
Level 2—Other significant observable inputs (including quoted prices for similar securities, interest rates, prepayment speeds, credit risk, etc.).
Level 3—Significant unobservable inputs (including the fund’s own assumptions used to determine the fair value of investments).
At September 30, 2015, 100% of the market value of the fund’s investments was determined based on Level 1 inputs.
D. Distributions are determined on a tax basis and may differ from net investment income and realized capital gains for financial reporting purposes. Differences may be permanent or temporary. Permanent differences are reclassified among capital accounts in the financial statements to reflect their tax character. Temporary differences arise when certain items of income, expense, gain, or loss are recognized in different periods for financial statement and tax purposes. These differences will reverse at some time in the future. Differences in classification may also result from the treatment of short-term gains as ordinary income for tax purposes.
The fund used a tax accounting practice to treat a portion of the price of capital shares redeemed during the year as distributions from net investment income and realized capital gains. Accordingly, the fund has reclassified $66,000 from undistributed net investment income, and $1,000 from accumulated net realized gains, to paid-in capital.
For tax purposes, at September 30, 2015, the fund had $18,143,000 of ordinary income and $169,000 of long-term capital gains available for distribution.
At September 30, 2015, the cost of investment securities for tax purposes was $5,026,079,000. Net unrealized depreciation of investment securities for tax purposes was $196,078,000, consisting of unrealized gains of $8,993,000 on securities that had risen in value since their purchase and $205,071,000 in unrealized losses on securities that had fallen in value since their purchase.
50
Institutional Target Retirement 2020 Fund
| E. Capital shares issued and redeemed were: | ||||||
| June 26, 20151 to | ||||||
| September 30, 2015 | ||||||
| Shares | ||||||
| (000) | ||||||
| Issued | 259,546 | |||||
| Issued in Lieu of Cash Distribution | — | |||||
| Redeemed | (2,843) | |||||
| Net Increase (Decrease) in Shares Outstanding | 256,703 | |||||
| 1 Inception. | ||||||
| F. Transactions during the period in affiliated underlying Vanguard funds were as follows: | ||||||
| Current Period Transactions | ||||||
| June 26, | Proceeds | Sept. 30, | ||||
| 20151 | from | Capital Gain | 2015 | |||
| Market | Purchases | Securities | Distributions | Market | ||
| Value | at Cost | Sold | Income | Received | Value | |
| ($000) | ($000) | ($000) | ($000) | ($000) | ($000) | |
| Vanguard Market Liquidity Fund | — | NA2 | NA 2 | 1 | — | — |
| Vanguard Short-Term | ||||||
| Inflation-Protected Securities | ||||||
| Index Fund | — | 38,620 | — | — | — | 38,623 |
| Vanguard Total Bond Market II | ||||||
| Index Fund | — | 1,373,740 | 25,375 | 4,540 | — | 1,354,847 |
| Vanguard Total International | ||||||
| Bond Index Fund | — | 584,938 | 8,012 | 1,380 | — | 579,463 |
| Vanguard Total International | ||||||
| Stock Index Fund | — | 1,244,492 | 5,320 | 4,790 | — | 1,141,341 |
| Vanguard Total Stock Market | ||||||
| Index Fund | — | 1,830,300 | 7,340 | 7,349 | — | 1,715,727 |
| Total | — | 5,072,090 | 46,047 | 18,060 | — | 4,830,001 |
| 1 Inception. | ||||||
| 2 Not applicable—purchases and sales are for temporary cash investment purposes. | ||||||
G. Certain funds managed by The Vanguard Group participate in a $3 billion committed credit facility provided by a syndicate of lenders pursuant to a credit agreement that may be renewed annually; each fund is individually liable for its borrowings, if any, under the credit facility. In October 2015, this credit agreement was amended to designate the fund as an additional borrower. Borrowings may be utilized for temporary and emergency purposes, and are subject to the fund’s regulatory and contractual borrowing restrictions. The participating funds are charged administrative fees and an annual commitment fee of 0.06% of the undrawn amount of the facility; these fees are allocated to the funds based on a method approved by the fund’s board of trustees. Any borrowings under this facility bear interest at a rate equal to the higher of the federal funds rate or LIBOR reference rate plus an agreed-upon spread.
Management has determined that no other transactions occurred subsequent to September 30, 2015, that would require recognition or disclosure in these financial statements.
51
Institutional Target Retirement 2025 Fund
Fund Profile
As of September 30, 2015
| Total Fund Characteristics | |
| Ticker Symbol | VRIVX |
| 30-Day SEC Yield | 2.29% |
| Acquired Fund Fees and Expenses1 | 0.10% |
| Allocation to Underlying Vanguard Funds | |
| Vanguard Total Stock Market Index Fund | |
| Institutional Shares | 40.2% |
| Vanguard Total International Stock Index | |
| Fund Investor Shares | 26.7 |
| Vanguard Total Bond Market II Index Fund | |
| Investor Shares | 23.2 |
| Vanguard Total International Bond Index | |
| Fund Admiral Shares | 9.9 |
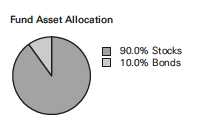
1 This figure—drawn from the prospectus dated June 26, 2015—represents an estimate of the weighted average of the expense ratios and any transaction fees charged by the underlying mutual funds (the ”acquired” funds) in which the Institutional Target Retirement 2025 Fund invests. The fund does not charge any expenses or fees of its own. For the period from inception through September 30, 2015, the annualized acquired fund fees and expenses were 0.10%.
52
Institutional Target Retirement 2025 Fund
Performance Summary
All of the returns in this report represent past performance, which is not a guarantee of future results that may be achieved by the fund. (Current performance may be lower or higher than the performance data cited. For performance data current to the most recent month-end, visit our website at vanguard.com/performance.) Note, too, that both investment returns and principal value can fluctuate widely, so an investor’s shares, when sold, could be worth more or less than their original cost. The returns shown do not reflect taxes that a shareholder would pay on fund distributions or on the sale of fund shares.
| Cumulative Performance: June 26, 2015, Through September 30, 2015 | ||
| Initial Investment of $100,000,000 | ||
| Total Returns | ||
| Period Ended September 30, 2015 | ||
| Since | Final Value | |
| Inception | of a $100,000,000 | |
| (6/26/2015) | Investment | |
| Institutional Target Retirement 2025 Fund | -6.75% | $93,250,000 |
| Target 2025 Composite Index | -6.75 | 93,254,189 |
| Mixed-Asset Target 2025 Funds Average | -6.69 | 93,311,954 |
| MSCI US Broad Market Index | -8.94 | 91,061,036 |
For a benchmark description, see the Glossary.
Mixed-Asset Target 2025 Funds Average: Derived from data provided by Lipper, a Thomson Reuters Company.
"Since Inception" performance is calculated from the fund's inception date for both the fund and its comparative standards.
See Financial Highlights for dividend and capital gains information.
53
Institutional Target Retirement 2025 Fund
Fiscal-Period Total Returns (%): June 26, 2015, Through September 30, 2015
54
Institutional Target Retirement 2025 Fund
Financial Statements
Statement of Net Assets
As of September 30, 2015
The fund reports a complete list of its holdings in regulatory filings four times in each fiscal year, at the quarter-ends. For the second and fourth fiscal quarters, the lists appear in the fund’s semiannual and annual reports to shareholders. For the first and third fiscal quarters, the fund files the lists with the Securities and Exchange Commission on Form N-Q. Shareholders can look up the fund’s Forms N-Q on the SEC’s website at sec.gov. Forms N-Q may also be reviewed and copied at the SEC’s Public Reference Room (see the back cover of this report for further information).
| Market | ||
| Value• | ||
| Shares | ($000) | |
| Investment Companies (99.8%) | ||
| U.S. Stock Fund (40.1%) | ||
| Vanguard Total Stock Market Index Fund Institutional Shares | 44,685,514 | 2,148,480 |
| International Stock Fund (26.7%) | ||
| Vanguard Total International Stock Index Fund Investor Shares | 100,526,313 | 1,429,484 |
| U.S. Bond Fund (23.1%) | ||
| 1 Vanguard Total Bond Market II Index Fund Investor Shares | 115,275,291 | 1,240,362 |
| International Bond Fund (9.9%) | ||
| Vanguard Total International Bond Index Fund Admiral Shares | 25,107,889 | 530,530 |
| Total Investment Companies (Cost $5,607,176) | 5,348,856 | |
| Temporary Cash Investment (0.0%) | ||
| Money Market Fund (0.0%) | ||
| 1 Vanguard Market Liquidity Fund, 0.189% (Cost $1,149) | 1,149,045 | 1,149 |
| Total Investments (99.8%) (Cost $5,608,325) | 5,350,005 | |
| Amount | ||
| ($000) | ||
| Other Assets and Liabilities (0.2%) | ||
| Other Assets | ||
| Receivables for Accrued Income | 2,583 | |
| Receivables for Capital Shares Issued | 226,069 | |
| Total Other Assets | 228,652 | |
| Liabilities | ||
| Payables for Investment Securities Purchased | (216,329) | |
| Payables for Capital Shares Redeemed | (82) | |
| Other Liabilities | (13) | |
| Total Liabilities | (216,424) | |
| Net Assets (100%) | ||
| Applicable to 287,493,169 outstanding $.001 par value shares of | ||
| beneficial interest (unlimited authorization) | 5,362,233 | |
| Net Asset Value Per Share | $18.65 | |
55
| Institutional Target Retirement 2025 Fund | |
| At September 30, 2015, net assets consisted of: | |
| Amount | |
| ($000) | |
| Paid-in Capital | 5,599,458 |
| Undistributed Net Investment Income | 20,968 |
| Accumulated Net Realized Gains | 127 |
| Unrealized Appreciation (Depreciation) | (258,320) |
| Net Assets | 5,362,233 |
- See Note A in Notes to Financial Statements.
- Affiliated fund available only to Vanguard funds and certain trusts and accounts managed by Vanguard. Rate shown for Vanguard Market Liquidity Fund is the 7-day yield.
See accompanying Notes, which are an integral part of the Financial Statements.
56
| Institutional Target Retirement 2025 Fund | |
| Statement of Operations | |
| June 26, 20151 to | |
| September 30, 2015 | |
| ($000) | |
| Investment Income | |
| Income | |
| Income Distributions Received | 20,998 |
| Net Investment Income—Note B | 20,998 |
| Realized Net Gain (Loss) | |
| Affiliated Investment Securities Sold | 9 |
| Futures Contracts | 118 |
| Realized Net Gain (Loss) | 127 |
| Change in Unrealized Appreciation (Depreciation) of Investment Securities | (258,320) |
| Net Increase (Decrease) in Net Assets Resulting from Operations | (237,195) |
| 1 Inception. | |
See accompanying Notes, which are an integral part of the Financial Statements.
57
| Institutional Target Retirement 2025 Fund | |
| Statement of Changes in Net Assets | |
| June 26, 20151 to | |
| September 30, 2015 | |
| ($000) | |
| Increase (Decrease) in Net Assets | |
| Operations | |
| Net Investment Income | 20,998 |
| Realized Net Gain (Loss) | 127 |
| Change in Unrealized Appreciation (Depreciation) | (258,320) |
| Net Increase (Decrease) in Net Assets Resulting from Operations | (237,195) |
| Distributions | |
| Net Investment Income | — |
| Realized Capital Gain | — |
| Total Distribution | — |
| Capital Share Transactions | |
| Issued | 5,632,871 |
| Issued in Lieu of Cash Distributions | — |
| Redeemed | (33,443) |
| Net Increase (Decrease) from Capital Share Transactions | 5,599,428 |
| Total Increase (Decrease) | 5,362,233 |
| Net Assets | |
| Beginning of Period | — |
| End of Period2 | 5,362,233 |
| 1 | Inception. |
| 2 | Net Assets—End of Period includes undistributed (overdistributed) net investment income of $20,968,000. |
See accompanying Notes, which are an integral part of the Financial Statements.
58
| Institutional Target Retirement 2025 Fund | |
| Financial Highlights | |
| June 26, 20151 to | |
| For a Share Outstanding Throughout the Period | September 30, 2015 |
| Net Asset Value, Beginning of Period | $20.00 |
| Investment Operations | |
| Net Investment Income | 0.140 2 |
| Capital Gain Distributions Received | — |
| Net Realized and Unrealized Gain (Loss) on Investments | (1.490) |
| Total from Investment Operations | (1.350) |
| Distributions | |
| Dividends from Net Investment Income | — |
| Distributions from Realized Capital Gains | — |
| Total Distributions | — |
| Net Asset Value, End of Period | $18.65 |
| Total Return | -6.75% |
| Ratios/Supplemental Data | |
| Net Assets, End of Period (Millions) | $5,362 |
| Ratio of Total Expenses to Average Net Assets | — |
| Acquired Fund Fees and Expenses | 0.10%3 |
| Ratio of Net Investment Income to Average Net Assets | 2.52%3 |
| Portfolio Turnover Rate | 1% |
| 1 | Inception. |
| 2 | Calculated based on average shares outstanding. |
| 3 | Annualized. |
See accompanying Notes, which are an integral part of the Financial Statements.
59
Institutional Target Retirement 2025 Fund
Notes to Financial Statements
Vanguard Institutional Target Retirement 2025 Fund is registered under the Investment Company Act of 1940 as an open-end investment company, or mutual fund. The fund follows a balanced investment strategy by investing in selected Vanguard funds to achieve its targeted allocation of assets to U.S. and international stocks, and U.S. and international bonds. Financial statements and other information about each underlying fund are available on vanguard.com.
A. The following significant accounting policies conform to generally accepted accounting principles for U.S. investment companies. The fund consistently follows such policies in preparing its financial statements.
1. Security Valuation: Investments are valued at the net asset value of each underlying Vanguard fund determined as of the close of the New York Stock Exchange (generally 4 p.m., Eastern time) on the valuation date.
2. Futures Contracts: The fund uses stock and bond futures contracts to a limited extent, with the objectives of maintaining full exposure to the market and maintaining its target asset allocation. The primary risks associated with the use of futures contracts are imperfect correlation between changes in market values of investments held by the fund and the prices of futures contracts, and the possibility of an illiquid market. Counterparty risk involving futures is mitigated because a regulated clearinghouse is the counterparty instead of the clearing broker. To further mitigate counterparty risk, the fund trades futures contracts on an exchange, monitors the financial strength of its clearing brokers and clearinghouse, and has entered into clearing agreements with its clearing brokers. The clearinghouse imposes initial margin requirements to secure the fund’s performance and requires daily settlement of variation margin representing changes in the market value of each contract.
Futures contracts are valued at their quoted daily settlement prices. The aggregate settlement values of the contracts are not recorded in the Statement of Net Assets. Fluctuations in the value of the contracts are recorded in the Statement of Net Assets as an asset (liability) and in the Statement of Operations as unrealized appreciation (depreciation) until the contracts are closed, when they are recorded as realized futures gains (losses).
During the period ended September 30, 2015, the fund’s average investments in long and short futures contracts each represented 0% of net assets, based on the average of aggregate settlement values at each quarter-end during the period. The fund had no open futures contracts at September 30, 2015.
3. Federal Income Taxes: The fund intends to qualify as a regulated investment company and distribute all of its taxable income. Management has analyzed the fund’s tax positions taken for its open federal income tax period ended September 30, 2015, and has concluded that no provision for federal income tax is required in the fund’s financial statements.
4. Distributions: Distributions to shareholders are recorded on the ex-dividend date.
5. Other: Income and capital gain distributions received are recorded on the ex-dividend date. Security transactions are accounted for on the date securities are bought or sold. Costs used to determine realized gains (losses) on the sale of investment securities are those of the specific securities sold.
B. In accordance with the terms of a Funds’ Service Agreement (the “FSA”) between Vanguard and the fund, Vanguard furnishes to the fund investment advisory, corporate management, administrative, marketing, and distribution services at Vanguard’s cost of operations (as defined by the FSA). These costs of operations are allocated to the fund based on methods and guidelines approved by the board of trustees. The FSA provides that expenses otherwise allocable to Vanguard funds-of-funds may be reduced or eliminated to the extent of savings realized by the underlying Vanguard funds by virtue of
60
Institutional Target Retirement 2025 Fund
being part of a fund-of-funds. Accordingly, all expenses for services provided by Vanguard to the fund and all other expenses incurred by the fund during the period ended September 30, 2015, were borne by the underlying Vanguard funds in which the fund invests. The fund’s trustees and officers are also trustees and officers, respectively, of the underlying Vanguard funds, as well as directors and employees, respectively, of Vanguard.
C. Various inputs may be used to determine the value of the fund’s investments. These inputs are summarized in three broad levels for financial statement purposes. The inputs or methodologies used to value securities are not necessarily an indication of the risk associated with investing in those securities.
Level 1—Quoted prices in active markets for identical securities.
Level 2—Other significant observable inputs (including quoted prices for similar securities, interest rates, prepayment speeds, credit risk, etc.).
Level 3—Significant unobservable inputs (including the fund’s own assumptions used to determine the fair value of investments).
At September 30, 2015, 100% of the market value of the fund’s investments was determined based on Level 1 inputs.
D. Distributions are determined on a tax basis and may differ from net investment income and realized capital gains for financial reporting purposes. Differences may be permanent or temporary. Permanent differences are reclassified among capital accounts in the financial statements to reflect their tax character. Temporary differences arise when certain items of income, expense, gain, or loss are recognized in different periods for financial statement and tax purposes. These differences will reverse at some time in the future. Differences in classification may also result from the treatment of short-term gains as ordinary income for tax purposes.
The fund used a tax accounting practice to treat a portion of the price of capital shares redeemed during the year as distributions from net investment income and realized capital gains. Accordingly, the fund has reclassified $30,000 from undistributed net investment income to paid-in capital.
For tax purposes, at September 30, 2015, the fund had $21,025,000 of ordinary income and $71,000 of long-term capital gains available for distribution.
At September 30, 2015, the cost of investment securities for tax purposes was $5,608,325,000. Net unrealized depreciation of investment securities for tax purposes was $258,320,000, consisting of unrealized gains of $8,892,000 on securities that had risen in value since their purchase and $267,212,000 in unrealized losses on securities that had fallen in value since their purchase.
E. Capital shares issued and redeemed were:
| June 26, 20151 to | |
| September 30, 2015 | |
| Shares | |
| (000) | |
| Issued | 289,240 |
| Issued in Lieu of Cash Distributions | — |
| Redeemed | (1,747) |
| Net Increase (Decrease) in Shares Outstanding | 287,493 |
| 1 Inception. |
61
Institutional Target Retirement 2025 Fund
| F. Transactions during the period in affiliated underlying Vanguard funds were as follows: | ||||||
| Current Period Transactions | ||||||
| June 26, | Proceeds | Sept. 30, | ||||
| 20151 | from | Capital Gain | 2015 | |||
| Market | Purchases | Securities | Distributions | Market | ||
| Value | at Cost | Sold | Income | Received | Value | |
| ($000) | ($000) | ($000) | ($000) | ($000) | ($000) | |
| Vanguard Market Liquidity Fund | — | NA2 | NA 2 | 1 | — | 1,149 |
| Vanguard Total Bond Market II | ||||||
| Index Fund | — | 1,245,409 | 11,457 | 4,270 | — | 1,240,362 |
| Vanguard Total International | ||||||
| Bond Index Fund | — | 529,303 | 1,264 | 1,309 | — | 530,530 |
| Vanguard Total International | ||||||
| Stock Index Fund | — | 1,558,748 | 1,535 | 6,061 | — | 1,429,484 |
| Vanguard Total Stock Market | ||||||
| Index Fund | — | 2,291,092 | 3,129 | 9,357 | — | 2,148,480 |
| Total | — | 5,624,552 | 17,385 | 20,998 | — | 5,350,005 |
| 1 Inception. | ||||||
| 2 Not applicable—purchases and sales are for temporary cash investment purposes. | ||||||
G. Certain funds managed by The Vanguard Group participate in a $3 billion committed credit facility provided by a syndicate of lenders pursuant to a credit agreement that may be renewed annually; each fund is individually liable for its borrowings, if any, under the credit facility. In October 2015, this credit agreement was amended to designate the fund as an additional borrower. Borrowings may be utilized for temporary and emergency purposes, and are subject to the fund’s regulatory and contractual borrowing restrictions. The participating funds are charged administrative fees and an annual commitment fee of 0.06% of the undrawn amount of the facility; these fees are allocated to the funds based on a method approved by the fund’s board of trustees. Any borrowings under this facility bear interest at a rate equal to the higher of the federal funds rate or LIBOR reference rate plus an agreed-upon spread.
Management has determined that no other transactions occurred subsequent to September 30, 2015, that would require recognition or disclosure in these financial statements.
62
Institutional Target Retirement 2030 Fund
Fund Profile
As of September 30, 2015
| Total Fund Characteristics | |
| Ticker Symbol | VTTWX |
| 30-Day SEC Yield | 2.32% |
| Acquired Fund Fees and Expenses1 | 0.10% |
| Allocation to Underlying Vanguard Funds | |
| Vanguard Total Stock Market Index Fund | |
| Institutional Shares | 44.6% |
| Vanguard Total International Stock Index | |
| Fund Investor Shares | 29.7 |
| Vanguard Total Bond Market II Index Fund | |
| Investor Shares | 18.0 |
| Vanguard Total International Bond Index | |
| Fund Admiral Shares | 7.7 |
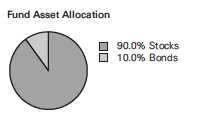
1 This figure—drawn from the prospectus dated June 26, 2015—represents an estimate of the weighted average of the expense ratios and any transaction fees charged by the underlying mutual funds (the ”acquired” funds) in which the Institutional Target Retirement 2030 Fund invests. The fund does not charge any expenses or fees of its own. For the period from inception through September 30, 2015, the annualized acquired fund fees and expenses were 0.10%.
63
Institutional Target Retirement 2030 Fund
Performance Summary
All of the returns in this report represent past performance, which is not a guarantee of future results that may be achieved by the fund. (Current performance may be lower or higher than the performance data cited. For performance data current to the most recent month-end, visit our website at vanguard.com/performance.) Note, too, that both investment returns and principal value can fluctuate widely, so an investor’s shares, when sold, could be worth more or less than their original cost. The returns shown do not reflect taxes that a shareholder would pay on fund distributions or on the sale of fund shares.
| Cumulative Performance: June 26, 2015, Through September 30, 2015 | ||
| Initial Investment of $100,000,000 | ||
| Total Returns | ||
| Period Ended September 30, 2015 | ||
| Since | Final Value | |
| Inception | of a $100,000,000 | |
| (6/26/2015) | Investment | |
| Institutional Target Retirement 2030 Fund | -7.75% | $92,250,000 |
| Target 2030 Composite Index | -7.69 | 92,313,551 |
| Mixed-Asset Target 2030 Funds Average | -7.76 | 92,238,179 |
| MSCI US Broad Market Index | -8.94 | 91,061,036 |
For a benchmark description, see the Glossary.
Mixed-Asset Target 2030 Funds Average: Derived from data provided by Lipper, a Thomson Reuters Company.
"Since Inception" performance is calculated from the fund's inception date for both the fund and its comparative standards.
See Financial Highlights for dividend and capital gains information.
64
Institutional Target Retirement 2030 Fund
Fiscal-Period Total Returns (%): June 26, 2015, Through September 30, 2015

65
Institutional Target Retirement 2030 Fund
Financial Statements
Statement of Net Assets
As of September 30, 2015
The fund reports a complete list of its holdings in regulatory filings four times in each fiscal year, at the quarter-ends. For the second and fourth fiscal quarters, the lists appear in the fund’s semiannual and annual reports to shareholders. For the first and third fiscal quarters, the fund files the lists with the Securities and Exchange Commission on Form N-Q. Shareholders can look up the fund’s Forms N-Q on the SEC’s website at sec.gov. Forms N-Q may also be reviewed and copied at the SEC’s Public Reference Room (see the back cover of this report for further information).
| Market | ||
| Value• | ||
| Shares | ($000) | |
| Investment Companies (99.8%) | ||
| U.S. Stock Fund (44.6%) | ||
| Vanguard Total Stock Market Index Fund Institutional Shares | 41,066,060 | 1,974,456 |
| International Stock Fund (29.6%) | ||
| Vanguard Total International Stock Index Fund Investor Shares | 92,360,154 | 1,313,362 |
| U.S. Bond Fund (17.9%) | ||
| 1 Vanguard Total Bond Market II Index Fund Investor Shares | 73,775,528 | 793,825 |
| International Bond Fund (7.7%) | ||
| Vanguard Total International Bond Index Fund Admiral Shares | 16,049,800 | 339,132 |
| Total Investment Companies (Cost $4,648,984) | 4,420,775 | |
| Temporary Cash Investment (0.0%) | ||
| Money Market Fund (0.0%) | ||
| 1 Vanguard Market Liquidity Fund, 0.189% (Cost $1,392) | 1,392,102 | 1,392 |
| Total Investments (99.8%) (Cost $4,650,376) | 4,422,167 | |
| Amount | ||
| ($000) | ||
| Other Assets and Liabilities (0.2%) | ||
| Other Assets | ||
| Receivables for Accrued Income | 1,621 | |
| Receivables for Capital Shares Issued | 170,372 | |
| Total Other Assets | 171,993 | |
| Liabilities | ||
| Payables for Investment Securities Purchased | (162,804) | |
| Payables for Capital Shares Redeemed | (94) | |
| Other Liabilities | (9) | |
| Total Liabilities | (162,907) | |
| Net Assets (100%) | ||
| Applicable to 240,123,765 outstanding $.001 par value shares of | ||
| beneficial interest (unlimited authorization) | 4,431,253 | |
| Net Asset Value Per Share | $18.45 | |
66
| Institutional Target Retirement 2030 Fund | |
| At September 30, 2015, net assets consisted of: | |
| Amount | |
| ($000) | |
| Paid-in Capital | 4,641,871 |
| Undistributed Net Investment Income | 17,322 |
| Accumulated Net Realized Gains | 269 |
| Unrealized Appreciation (Depreciation) | (228,209) |
| Net Assets | 4,431,253 |
- See Note A in Notes to Financial Statements.
- Affiliated fund available only to Vanguard funds and certain trusts and accounts managed by Vanguard. Rate shown for Vanguard Market Liquidity Fund is the 7-day yield.
See accompanying Notes, which are an integral part of the Financial Statements.
67
| Institutional Target Retirement 2030 Fund | |
| Statement of Operations | |
| June 26, 20151 to | |
| September 30, 2015 | |
| ($000) | |
| Investment Income | |
| Income | |
| Income Distributions Received | 17,322 |
| Net Investment Income—Note B | 17,322 |
| Realized Net Gain (Loss) | |
| Affiliated Investment Securities Sold | 25 |
| Futures Contracts | 244 |
| Realized Net Gain (Loss) | 269 |
| Change in Unrealized Appreciation (Depreciation) of Investment Securities | (228,209) |
| Net Increase (Decrease) in Net Assets Resulting from Operations | (210,618) |
| 1 Inception. | |
See accompanying Notes, which are an integral part of the Financial Statements.
68
| Institutional Target Retirement 2030 Fund | |
| Statement of Changes in Net Assets | |
| June 26, 20151 to | |
| September 30, 2015 | |
| ($000) | |
| Increase (Decrease) in Net Assets | |
| Operations | |
| Net Investment Income | 17,322 |
| Realized Net Gain (Loss) | 269 |
| Change in Unrealized Appreciation (Depreciation) | (228,209) |
| Net Increase (Decrease) in Net Assets Resulting from Operations | (210,618) |
| Distributions | |
| Net Investment Income | — |
| Realized Capital Gain | — |
| Total Distribution | — |
| Capital Share Transactions | |
| Issued | 4,664,363 |
| Issued in Lieu of Cash Distributions | — |
| Redeemed | (22,492) |
| Net Increase (Decrease) from Capital Share Transactions | 4,641,871 |
| Total Increase (Decrease) | 4,431,253 |
| Net Assets | |
| Beginning of Period | — |
| End of Period2 | 4,431,253 |
| 1 | Inception. |
| 2 | Net Assets—End of Period includes undistributed (overdistributed) net investment income of $17,322,000. |
See accompanying Notes, which are an integral part of the Financial Statements.
69
| Institutional Target Retirement 2030 Fund | |
| Financial Highlights | |
| June 26, 20151 to | |
| For a Share Outstanding Throughout the Period | September 30, 2015 |
| Net Asset Value, Beginning of Period | $20.00 |
| Investment Operations | |
| Net Investment Income | .1452 |
| Capital Gain Distributions Received | — |
| Net Realized and Unrealized Gain (Loss) on Investments | (1.695) |
| Total from Investment Operations | (1.550) |
| Distributions | |
| Dividends from Net Investment Income | — |
| Distributions from Realized Capital Gains | — |
| Total Distributions | — |
| Net Asset Value, End of Period | $18.45 |
| Total Return | -7.75% |
| Ratios/Supplemental Data | |
| Net Assets, End of Period (Millions) | $4,431 |
| Ratio of Total Expenses to Average Net Assets | — |
| Acquired Fund Fees and Expenses | 0.10%3 |
| Ratio of Net Investment Income to Average Net Assets | 2.64%3 |
| Portfolio Turnover Rate | 1% |
| 1 | Inception. |
| 2 | Calculated based on average shares outstanding. |
| 3 | Annualized. |
See accompanying Notes, which are an integral part of the Financial Statements.
70
Institutional Target Retirement 2030 Fund
Notes to Financial Statements
Vanguard Institutional Target Retirement 2030 Fund is registered under the Investment Company Act of 1940 as an open-end investment company, or mutual fund. The fund follows a balanced investment strategy by investing in selected Vanguard funds to achieve its targeted allocation of assets to U.S. and international stocks, and U.S. and international bonds. Financial statements and other information about each underlying fund are available on vanguard.com.
A. The following significant accounting policies conform to generally accepted accounting principles for U.S. investment companies. The fund consistently follows such policies in preparing its financial statements.
1. Security Valuation: Investments are valued at the net asset value of each underlying Vanguard fund determined as of the close of the New York Stock Exchange (generally 4 p.m., Eastern time) on the valuation date.
2. Futures Contracts: The fund uses stock and bond futures contracts to a limited extent, with the objectives of maintaining full exposure to the market and maintaining its target asset allocation. The primary risks associated with the use of futures contracts are imperfect correlation between changes in market values of investments held by the fund and the prices of futures contracts, and the possibility of an illiquid market. Counterparty risk involving futures is mitigated because a regulated clearinghouse is the counterparty instead of the clearing broker. To further mitigate counterparty risk, the fund trades futures contracts on an exchange, monitors the financial strength of its clearing brokers and clearinghouse, and has entered into clearing agreements with its clearing brokers. The clearinghouse imposes initial margin requirements to secure the fund’s performance and requires daily settlement of variation margin representing changes in the market value of each contract.
Futures contracts are valued at their quoted daily settlement prices. The aggregate settlement values of the contracts are not recorded in the Statement of Net Assets. Fluctuations in the value of the contracts are recorded in the Statement of Net Assets as an asset (liability) and in the Statement of Operations as unrealized appreciation (depreciation) until the contracts are closed, when they are recorded as realized futures gains (losses).
During the period ended September 30, 2015, the fund’s average investments in long and short futures contracts each represented 0% of net assets, based on the average of aggregate settlement values at each quarter-end during the period. The fund had no open futures contracts at September 30, 2015.
3. Federal Income Taxes: The fund intends to qualify as a regulated investment company and distribute all of its taxable income. Management has analyzed the fund’s tax positions taken for its open federal income tax period ended September 30, 2015, and has concluded that no provision for federal income tax is required in the fund’s financial statements.
4. Distributions: Distributions to shareholders are recorded on the ex-dividend date.
5. Other: Income and capital gain distributions received are recorded on the ex-dividend date. Security transactions are accounted for on the date securities are bought or sold. Costs used to determine realized gains (losses) on the sale of investment securities are those of the specific securities sold.
B. In accordance with the terms of a Funds’ Service Agreement (the “FSA”) between Vanguard and the fund, Vanguard furnishes to the fund investment advisory, corporate management, administrative, marketing, and distribution services at Vanguard’s cost of operations (as defined by the FSA). These costs of operations are allocated to the fund based on methods and guidelines approved by the board
71
Institutional Target Retirement 2030 Fund
of trustees. The FSA provides that expenses otherwise allocable to Vanguard funds-of-funds may be reduced or eliminated to the extent of savings realized by the underlying Vanguard funds by virtue of being part of a fund-of-funds. Accordingly, all expenses for services provided by Vanguard to the fund and all other expenses incurred by the fund during the period ended September 30, 2015, were borne by the underlying Vanguard funds in which the fund invests. The fund’s trustees and officers are also trustees and officers, respectively, of the underlying Vanguard funds, as well as directors and employees, respectively, of Vanguard.
C. Various inputs may be used to determine the value of the fund’s investments. These inputs are summarized in three broad levels for financial statement purposes. The inputs or methodologies used to value securities are not necessarily an indication of the risk associated with investing in those securities.
Level 1—Quoted prices in active markets for identical securities.
Level 2—Other significant observable inputs (including quoted prices for similar securities, interest rates, prepayment speeds, credit risk, etc.).
Level 3—Significant unobservable inputs (including the fund’s own assumptions used to determine the fair value of investments).
At September 30, 2015, 100% of the market value of the fund’s investments was determined based on Level 1 inputs.
D. Distributions are determined on a tax basis and may differ from net investment income and realized capital gains for financial reporting purposes. Differences may be permanent or temporary. Permanent differences are reclassified among capital accounts in the financial statements to reflect their tax character. Temporary differences arise when certain items of income, expense, gain, or loss are recognized in different periods for financial statement and tax purposes. These differences will reverse at some time in the future. Differences in classification may also result from the treatment of short-term gains as ordinary income for tax purposes.
For tax purposes, at September 30, 2015, the fund had $17,444,000 of ordinary income and $146,000 of long-term capital gains available for distribution.
At September 30, 2015, the cost of investment securities for tax purposes was $4,650,376,000. Net unrealized depreciation of investment securities for tax purposes was $228,209,000, consisting of unrealized gains of $5,331,000 on securities that had risen in value since their purchase and $233,540,000 in unrealized losses on securities that had fallen in value since their purchase.
E. Capital shares issued and redeemed were:
| June 26, 20151 to | |
| September 30, 2015 | |
| Shares | |
| (000) | |
| Issued | 241,310 |
| Issued in Lieu of Cash Distributions | — |
| Redeemed | (1,186) |
| Net Increase (Decrease) in Shares Outstanding | 240,124 |
| 1 Inception. |
72
Institutional Target Retirement 2030 Fund
| F. Transactions during the period in affiliated underlying Vanguard funds were as follows: | ||||||
| Current Period Transactions | ||||||
| June 26, | Proceeds | Sept. 30, | ||||
| 20151 | from | Capital Gain | 2015 | |||
| Market | Purchases | Securities | Distributions | Market | ||
| Value | at Cost | Sold | Income | Received | Value | |
| ($000) | ($000) | ($000) | ($000) | ($000) | ($000) | |
| Vanguard Market Liquidity Fund | — | NA2 | NA 2 | 1 | — | 1,392 |
| Vanguard Total Bond Market II | ||||||
| Index Fund | — | 807,473 | 17,521 | 2,593 | — | 793,825 |
| Vanguard Total International Bond | ||||||
| Index Fund | — | 342,056 | 4,407 | 790 | — | 339,132 |
| Vanguard Total International Stock | ||||||
| Index Fund | — | 1,429,304 | 4,465 | 5,488 | — | 1,313,362 |
| Vanguard Total Stock Market | ||||||
| Index Fund | — | 2,105,647 | 9,128 | 8,450 | — | 1,974,456 |
| Total | — | 4,684,480 | 35,521 | 17,322 | — | 4,422,167 |
| 1 Inception. | ||||||
| 2 Not applicable—purchases and sales are for temporary cash investment purposes. | ||||||
G. Certain funds managed by The Vanguard Group participate in a $3 billion committed credit facility provided by a syndicate of lenders pursuant to a credit agreement that may be renewed annually; each fund is individually liable for its borrowings, if any, under the credit facility. In October 2015, this credit agreement was amended to designate the fund as an additional borrower. Borrowings may be utilized for temporary and emergency purposes, and are subject to the fund’s regulatory and contractual borrowing restrictions. The participating funds are charged administrative fees and an annual commitment fee of 0.06% of the undrawn amount of the facility; these fees are allocated to the funds based on a method approved by the fund’s board of trustees. Any borrowings under this facility bear interest at a rate equal to the higher of the federal funds rate or LIBOR reference rate plus an agreed-upon spread.
Management has determined that no other transactions occurred subsequent to September 30, 2015, that would require recognition or disclosure in these financial statements.
73
Report of Independent Registered Public Accounting Firm
To the Board of Trustees of Vanguard Chester Funds and the Shareholders of Vanguard Institutional Target Retirement Income Fund, Vanguard Institutional Target Retirement 2010 Fund, Vanguard Institutional Target Retirement 2015 Fund, Vanguard Institutional Target Retirement 2020 Fund, Vanguard Institutional Target Retirement 2025 Fund and Vanguard Institutional Target Retirement 2030 Fund:
In our opinion, the accompanying statements of net assets and the related statements of operations and of changes in net assets and the financial highlights present fairly, in all material respects, the financial position of Vanguard Institutional Target Retirement Income Fund, Vanguard Institutional Target Retirement 2010 Fund, Vanguard Institutional Target Retirement 2015 Fund, Vanguard Institutional Target Retirement 2020 Fund, Vanguard Institutional Target Retirement 2025 Fund and Vanguard Institutional Target Retirement 2030 Fund (constituting separate portfolios of Vanguard Chester Funds, hereafter referred to as the “Funds”) at September 30, 2015, and the results of each of their operations, the changes in each of their net assets, and the financial highlights for the period June 26, 2015 (commencement of operations) through September 30, 2015, in conformity with accounting principles generally accepted in the United States of America. These financial statements and financial highlights (hereafter referred to as “financial statements”) are the responsibility of the Funds’ management. Our responsibility is to express an opinion on these financial statements based on our audits. We conducted our audits of these financial statements in accordance with the standards of the Public Company Accounting Oversight Board (United States). Those standards require that we plan and perform the audit to obtain reasonable assurance about whether the financial statements are free of material misstatement. An audit includes examining, on a test basis, evidence supporting the amounts and disclosures in the financial statements, assessing the accounting principles used and significant estimates made by management, and evaluating the overall financial statement presentation. We believe that our audits, which included confirmation of securities at September 30, 2015 by agreement to the underlying ownership records of the transfer agent, provide a reasonable basis for our opinion.
/s/PricewaterhouseCoopers LLP
Philadelphia, Pennsylvania
November 16, 2015
74
Special 2015 tax information (unaudited) for Vanguard Institutional Target Retirement Funds
This information for the period ended September 30, 2015, is included pursuant to provisions of the Internal Revenue Code.
The funds distributed qualified dividend income to shareholders during the fiscal year as follows:
| Fund | ($000) |
| Institutional Target Retirement Income Fund | 675 |
| Institutional Target Retirement 2010 Fund | — |
| Institutional Target Retirement 2015 Fund | — |
| Institutional Target Retirement 2020 Fund | — |
| Institutional Target Retirement 2025 Fund | — |
| Institutional Target Retirement 2030 Fund | — |
For corporate shareholders, the percentage of investment income (dividend income plus short-term gains, if any) that qualifies for the dividends-received deduction is as follows:
| Fund | Percentage |
| Institutional Target Retirement Income Fund | 24.6% |
| Institutional Target Retirement 2010 Fund | 26.4 |
| Institutional Target Retirement 2015 Fund | 33.3 |
| Institutional Target Retirement 2020 Fund | 36.7 |
| Institutional Target Retirement 2025 Fund | 40.3 |
| Institutional Target Retirement 2030 Fund | 44.0 |
The funds designate to shareholders foreign source income and foreign taxes paid as follows:
| Foreign Source Income | Foreign Taxes Paid | |
| Fund | ($000) | ($000) |
| Institutional Target Retirement Income Fund | 768 | 26 |
| Institutional Target Retirement 2010 Fund | 742 | 27 |
| Institutional Target Retirement 2015 Fund | 3,219 | 135 |
| Institutional Target Retirement 2020 Fund | 6,174 | 276 |
| Institutional Target Retirement 2025 Fund | 7,382 | 347 |
| Institutional Target Retirement 2030 Fund | 6,317 | 313 |
Shareholders will receive more detailed information with their Form 1099-DIV in January 2016 to determine the calendar-year amounts to be included on their 2015 tax returns.
75
Trustees Approve Advisory Arrangement
The board of trustees approved the launch of Vanguard Institutional Target Retirement Funds utilizing an internalized management structure whereby The Vanguard Group, Inc. (Vanguard)—through its Equity Index Group—would provide investment advisory services to the funds. The board determined that the internalized management structure was in the best interests of the funds and their prospective shareholders.
The board based its decision upon an evaluation of the advisor’s investment staff, portfolio management process, and performance. The trustees considered the factors discussed below, among others. However, no single factor determined whether the board approved the arrangement. Rather, it was the totality of the circumstances that drove the board’s decision.
Nature, extent, and quality of services
The board reviewed the quality of the investment management services to be provided to the funds and took into account the organizational depth and stability of the advisor. The board considered that Vanguard has been managing investments for more than three decades. The Equity Index Group adheres to a sound, disciplined investment management process; the team has considerable experience, stability, and depth.
The board concluded that Vanguard’s experience, stability, depth, and performance, among other factors, warranted approval of the advisory arrangement.
Investment performance
The board determined that, in its management of other Vanguard index funds, the Equity Index Group has a track record of consistent performance and disciplined investment processes. Information about the each fund’s performance since inception can be found in the Performance Summary sections of this report.
Cost
The board considered the cost of services to be provided and concluded that the funds’ acquired fund fees and expenses will be well below the average expense ratios charged by funds in their respective peer groups. The funds do not incur advisory expenses directly; however, the board noted that each of the underlying funds in which the funds invest has advisory expenses well below the relevant peer-group average. Information about each fund’s expense ratio appears in the Financial Statements sections.
The board did not consider profitability analysis of Vanguard because of Vanguard’s unique “at-cost” structure. Unlike most other mutual fund management companies, Vanguard is owned by the funds it oversees and produces “profits” only in the form of reduced expenses for fund shareholders.
The benefit of economies of scale
The board concluded that Vanguard’s at-cost arrangement with the Institutional Target Retirement Funds and their underlying funds ensures that the funds will realize economies of scale as the assets of the underlying funds grow, with the cost to shareholders declining as assets increase.
The board will consider whether to renew the advisory arrangement again after a one-year period.
76
Glossary
30-Day SEC Yield. A fund’s 30-day SEC yield is derived using a formula specified by the U.S. Securities and Exchange Commission. Under the formula, data related to the fund’s security holdings in the previous 30 days are used to calculate the fund’s hypothetical net income for that period, which is then annualized and divided by the fund’s estimated average net assets over the calculation period. For the purposes of this calculation, a security’s income is based on its current market yield to maturity (for bonds), its actual income (for asset-backed securities), or its projected dividend yield (for stocks). Because the SEC yield represents hypothetical annualized income, it will differ—at times significantly—from the fund’s actual experience. As a result, the fund’s income distributions may be higher or lower than implied by the SEC yield.
Acquired Fund Fees and Expenses. Funds that invest in other Vanguard funds incur no direct expenses, but they do bear proportionate shares of the operating, administrative, and advisory expenses of the underlying funds, and they must pay any fees charged by those funds. The figure for acquired fund fees and expenses represents a weighted average of these underlying costs. Acquired is a term that the Securities and Exchange Commission applies to any mutual fund whose shares are owned by another fund.
Expense Ratio. A fund’s total annual operating expenses expressed as a percentage of the fund’s average net assets. The expense ratio includes management and administrative expenses, but does not include the transaction costs of buying and selling portfolio securities.
Inception Date. The date on which the assets of a fund (or one of its share classes) are first invested in accordance with the fund’s investment objective. For funds with a subscription period, the inception date is the day after that period ends. Investment performance is measured from the inception date.
Benchmark Information
Target 2010 Composite Index: Derived by applying the fund’s target asset allocation to the results of the following benchmarks: for international stocks of developed markets, the MSCI EAFE Index through December 15, 2010, the MSCI ACWI ex USA IMI Index through June 2, 2013, and the FTSE Global All Cap ex US Index thereafter; for emerging-market stocks, the Select Emerging Markets Index through August 23, 2006, the MSCI Emerging Markets Index through December 15, 2010, the MSCI ACWI ex USA IMI Index through June 2, 2013, and the FTSE Global All Cap ex US Index thereafter; for U.S. bonds, the Barclays U.S. Aggregate Bond Index through December 31, 2009, and the Barclays U.S. Aggregate Float Adjusted Index thereafter, as well as the Barclays U.S. Treasury Inflation Protected Securities Index through June 2, 2013, and the Barclays U.S. Treasury Inflation-Protected Securities (TIPS) 0-5 Year Index thereafter; for short-term reserves, the Citigroup Three-Month Treasury Bill Index through June 2, 2013; for international bonds, the Barclays Global Aggregate ex-USD Float Adjusted RIC Capped Index beginning June 3, 2013; and for U.S. stocks, the MSCI US Broad Market Index through June 2, 2013, and the CRSP US Total Market Index thereafter. International stock benchmark returns are adjusted for withholding taxes.
77
Target 2015 Composite Index: Derived by applying the fund’s target asset allocation to the results of the following benchmarks: for international stocks of developed markets, the MSCI EAFE Index through December 15, 2010, the MSCI ACWI ex USA IMI Index through June 2, 2013, and the FTSE Global All Cap ex US Index thereafter; for emerging-market stocks, the Select Emerging Markets Index through August 23, 2006, the MSCI Emerging Markets Index through December 15, 2010, the MSCI ACWI ex USA IMI Index through June 2, 2013, and the FTSE Global All Cap ex US Index thereafter; for U.S. bonds, the Barclays U.S. Aggregate Bond Index through December 31, 2009, and the Barclays U.S. Aggregate Float Adjusted Index thereafter, as well as the Barclays U.S. Treasury Inflation Protected Securities Index through June 2, 2013, and the Barclays U.S. Treasury Inflation-Protected Securities (TIPS) 0-5 Year Index thereafter; for international bonds, the Barclays Global Aggregate ex-USD Float Adjusted RIC Capped Index beginning June 3, 2013; and for U.S. stocks, the Dow Jones U.S. Total Stock Market Index (formerly known as the Dow Jones Wilshire 5000 Index) through April 22, 2005, the MSCI US Broad Market Index through June 2, 2013, and the CRSP US Total Market Index thereafter. International stock benchmark returns are adjusted for withholding taxes.
Target 2020 Composite Index: Derived by applying the fund’s target asset allocation to the results of the following benchmarks: for international stocks of developed markets, the MSCI EAFE Index through December 15, 2010, the MSCI ACWI ex USA IMI Index through June 2, 2013, and the FTSE Global All Cap ex US Index thereafter; for emerging-market stocks, the Select Emerging Markets Index through August 23, 2006, the MSCI Emerging Markets Index through December 15, 2010, the MSCI ACWI ex USA IMI Index through June 2, 2013, and the FTSE Global All Cap ex US Index thereafter; for U.S. bonds, the Barclays U.S. Aggregate Bond Index through December 31, 2009, and the Barclays U.S. Aggregate Float Adjusted Index thereafter; for international bonds, the Barclays Global Aggregate ex-USD Float Adjusted RIC Capped Index beginning June 3, 2013; and for U.S. stocks, the MSCI US Broad Market Index through June 2, 2013, and the CRSP US Total Market Index thereafter. International stock benchmark returns are adjusted for withholding taxes.
Target 2025 Composite Index: Derived by applying the fund’s target asset allocation to the results of the following benchmarks: for international stocks of developed markets, the MSCI EAFE Index through December 15, 2010, the MSCI ACWI ex USA IMI Index through June 2, 2013, and the FTSE Global All Cap ex US Index thereafter; for emerging-market stocks, the Select Emerging Markets Index through August 23, 2006, the MSCI Emerging Markets Index through December 15, 2010, the MSCI ACWI ex USA IMI Index through June 2, 2013, and the FTSE Global All Cap ex US Index thereafter; for U.S. bonds, the Barclays U.S. Aggregate Bond Index through December 31, 2009, and the Barclays U.S. Aggregate Float Adjusted Index thereafter; for international bonds, the Barclays Global Aggregate ex-USD Float Adjusted RIC Capped Index beginning June 3, 2013; and for U.S. stocks, the Dow Jones U.S. Total Stock Market Index (formerly known as the Dow Jones Wilshire 5000 Index) through April 22, 2005, the MSCI US Broad Market Index through June 2, 2013, and the CRSP US Total Market Index thereafter. International stock benchmark returns are adjusted for withholding taxes.
78
Target 2030 Composite Index: Derived by applying the fund’s target asset allocation to the results of the following benchmarks: for international stocks of developed markets, the MSCI EAFE Index through December 15, 2010, the MSCI ACWI ex USA IMI Index through June 2, 2013, and the FTSE Global All Cap ex US Index thereafter; for emerging-market stocks, the Select Emerging Markets Index through August 23, 2006, the MSCI Emerging Markets Index through December 15, 2010, the MSCI ACWI ex USA IMI Index through June 2, 2013, and the FTSE Global All Cap ex US Index thereafter; for U.S. bonds, the Barclays U.S. Aggregate Bond Index through December 31, 2009, and the Barclays U.S. Aggregate Float Adjusted Index thereafter; for international bonds, the Barclays Global Aggregate ex-USD Float Adjusted RIC Capped Index beginning June 3, 2013; and for U.S. stocks, the MSCI US Broad Market Index through June 2, 2013, and the CRSP US Total Market Index thereafter. International stock benchmark returns are adjusted for withholding taxes.
Target Income Composite Index: Derived by applying the fund’s target asset allocation to the results of the following benchmarks: for international stocks of developed markets, the MSCI EAFE Index through December 15, 2010, the MSCI ACWI ex USA IMI Index through June 2, 2013, and the FTSE Global All Cap ex US Index thereafter; for emerging-market stocks, the Select Emerging Markets Index through August 23, 2006, the MSCI Emerging Markets Index through December 15, 2010, the MSCI ACWI ex USA IMI Index through June 2, 2013, and the FTSE Global All Cap ex US Index thereafter; for U.S. bonds, the Barclays U.S. Aggregate Bond Index through December 31, 2009, and the Barclays U.S. Aggregate Float Adjusted Index thereafter, as well as the Barclays U.S. Treasury Inflation Protected Securities Index through June 2, 2013, and the Barclays U.S. Treasury Inflation-Protected Securities (TIPS) 0-5 Year Index thereafter; for short-term reserves, the Citigroup Three-Month Treasury Bill Index through June 2, 2013; for international bonds, the Barclays Global Aggregate ex-USD Float Adjusted RIC Capped Index beginning June 3, 2013; and for U.S. stocks, the Dow Jones U.S. Total Stock Market Index (formerly known as the Dow Jones Wilshire 5000 Index) through April 22, 2005, the MSCI US Broad Market Index through June 2, 2013, and the CRSP US Total Market Index thereafter. International stock benchmark returns are adjusted for withholding taxes.
79
The People Who Govern Your Fund
The trustees of your mutual fund are there to see that the fund is operated and managed in your best interests since, as a shareholder, you are a part owner of the fund. Your fund’s trustees also serve on the board of directors of The Vanguard Group, Inc., which is owned by the Vanguard funds and provides services to them on an at-cost basis.
A majority of Vanguard’s board members are independent, meaning that they have no affiliation with Vanguard or the funds they oversee, apart from the sizable personal investments they have made as private individuals. The independent board members have distinguished backgrounds in business, academia, and public service. Each of the trustees and executive officers oversees 194 Vanguard funds.
The following table provides information for each trustee and executive officer of the fund. More information about the trustees is in the Statement of Additional Information, which can be obtained, without charge, by contacting Vanguard at 800-662-7447, or online at vanguard.com.
InterestedTrustee1
F. William McNabb III
Born 1957. Trustee Since July 2009. Chairman of the Board. Principal Occupation(s) During the Past Five Years and Other Experience: Chairman of the Board of The Vanguard Group, Inc., and of each of the investment companies served by The Vanguard Group, since January 2010; Director of The Vanguard Group since 2008; Chief Executive Officer and President of The Vanguard Group, and of each of the investment companies served by The Vanguard Group, since 2008; Director of Vanguard Marketing Corporation; Managing Director of The Vanguard Group (1995–2008).
IndependentTrustees
Emerson U. Fullwood
Born 1948. Trustee Since January 2008. Principal Occupation(s) During the Past Five Years and Other Experience: Executive Chief Staff and Marketing Officer for North America and Corporate Vice President (retired 2008) of Xerox Corporation (document management products and services); Executive in Residence and 2009–2010 Distinguished Minett Professor at the Rochester Institute of Technology; Director of SPX Corporation (multi-industry manufacturing), the United Way of Rochester, Amerigroup Corporation (managed health care), the University of Rochester Medical Center, Monroe Community College Foundation, and North Carolina A&T University.
Rajiv L. Gupta
Born 1945. Trustee Since December 2001.2 Principal Occupation(s) During the Past Five Years and Other Experience: Chairman and Chief Executive Officer (retired 2009) and President (2006–2008) of Rohm and Haas Co. (chemicals); Director of Tyco International PLC (diversified manufacturing and services), Hewlett-Packard Co. (electronic computer manufacturing), and Delphi Automotive PLC (automotive components); Senior Advisor at New Mountain Capital.
Amy Gutmann
Born 1949. Trustee Since June 2006. Principal Occupation(s) During the Past Five Years and Other Experience: President of the University of Pennsylvania; Christopher H. Browne Distinguished Professor of Political Science, School of Arts and Sciences, and Professor of Communication, Annenberg School for Communication, with secondary faculty appointments in the Department of Philosophy, School of Arts and Sciences, and at the Graduate School of Education, University of Pennsylvania; Trustee of the National Constitution Center; Chair of the Presidential Commission for the Study of Bioethical Issues.
JoAnn Heffernan Heisen
Born 1950. Trustee Since July 1998. Principal Occupation(s) During the Past Five Years and Other Experience: Corporate Vice President and Chief Global Diversity Officer (retired 2008) and Member of the Executive Committee (1997–2008) of Johnson & Johnson (pharmaceuticals/medical devices/ consumer products); Director of Skytop Lodge Corporation (hotels), the University Medical Center at Princeton, the Robert Wood Johnson Foundation, and the Center for Talent Innovation; Member of the Advisory Board of the Institute for Women’s Leadership at Rutgers University.
F. Joseph Loughrey
Born 1949. Trustee Since October 2009. Principal Occupation(s) During the Past Five Years and Other Experience: President and Chief Operating Officer (retired 2009) of Cummins Inc. (industrial machinery); Chairman of the Board of Hillenbrand, Inc. (specialized consumer services), and of Oxfam America; Director of SKF AB (industrial machinery), Hyster-Yale Materials Handling, Inc. (forklift trucks), the Lumina Foundation for Education, and the V Foundation for Cancer Research; Member of the Advisory Council for the College of Arts and Letters and of the Advisory Board to the Kellogg Institute for International Studies, both at the University of Notre Dame.
Mark Loughridge
Born 1953. Trustee Since March 2012. Principal Occupation(s) During the Past Five Years and Other Experience: Senior Vice President and Chief Financial Officer (retired 2013) at IBM (information technology services); Fiduciary Member of IBM’s Retirement Plan Committee (2004–2013); Director of the Dow Chemical Company; Member of the Council on Chicago Booth.
Scott C. Malpass
Born 1962. Trustee Since March 2012. Principal Occupation(s) During the Past Five Years and Other Experience: Chief Investment Officer and Vice President at the University of Notre Dame; Assistant Professor of Finance at the Mendoza College of Business at Notre Dame; Member of the Notre Dame 403(b) Investment Committee; Board Member of TIFF Advisory Services, Inc., and Catholic Investment Services, Inc. (investment advisors); Member of the Investment Advisory Committee of Major League Baseball.
André F. Perold
Born 1952. Trustee Since December 2004. Principal Occupation(s) During the Past Five Years and Other Experience: George Gund Professor of Finance and Banking, Emeritus at the Harvard Business School (retired 2011); Chief Investment Officer and Managing Partner of HighVista Strategies LLC (private investment firm); Director of Rand Merchant Bank; Overseer of the Museum of Fine Arts Boston.
Peter F. Volanakis
Born 1955. Trustee Since July 2009. Principal Occupation(s) During the Past Five Years and Other Experience: President and Chief Operating Officer (retired 2010) of Corning Incorporated (communications equipment); Trustee of Colby-Sawyer College; Member of the Advisory Board of the Norris Cotton Cancer Center and of the Advisory Board of the Parthenon Group (strategy consulting).
Executive Officers
Glenn Booraem
Born 1967. Treasurer Since May 2015. Principal Occupation(s) During the Past Five Years and Other Experience: Principal of The Vanguard Group, Inc.; Treasurer of each of the investment companies served by The Vanguard Group; Controller of each of the investment companies served by The Vanguard Group (2010–2015); Assistant Controller of each of the investment companies served by The Vanguard Group (2001–2010).
Thomas J. Higgins
Born 1957. Chief Financial Officer Since September 2008. Principal Occupation(s) During the Past Five Years and Other Experience: Principal of The Vanguard Group, Inc.; Chief Financial Officer of each of the investment companies served by The Vanguard Group; Treasurer of each of the investment companies served by The Vanguard Group (1998–2008).
Peter Mahoney
Born 1974. Controller Since May 2015. Principal Occupation(s) During the Past Five Years and Other Experience: Head of Global Fund Accounting at The Vanguard Group, Inc.; Controller of each of the investment companies served by The Vanguard Group; Head of International Fund Services at The Vanguard Group (2008–2014).
Heidi Stam
Born 1956. Secretary Since July 2005. Principal Occupation(s) During the Past Five Years and Other Experience: Managing Director of The Vanguard Group, Inc.; General Counsel of The Vanguard Group; Secretary of The Vanguard Group and of each of the investment companies served by The Vanguard Group; Director and Senior Vice President of Vanguard Marketing Corporation.
Vanguard Senior Management Team
Mortimer J. Buckley
Kathleen C. Gubanich
Paul A. Heller
Martha G. King
John T. Marcante
Chris D. McIsaac
James M. Norris
Thomas M. Rampulla
Glenn W. Reed
Karin A. Risi
Chairman Emeritus and Senior Advisor
John J. Brennan
Chairman, 1996–2009
Chief Executive Officer and President, 1996–2008
Founder John C. Bogle
Chairman and Chief Executive Officer, 1974–1996
1 Mr. McNabb is considered an “interested person,” as defined in the Investment Company Act of 1940, because he is an officer of the Vanguard funds.
2 December 2002 for Vanguard Equity Income Fund, the Vanguard Municipal Bond Funds, and the Vanguard State Tax-Exempt Funds.
 |
| P.O. Box 2600 |
| Valley Forge, PA 19482-2600 |
Connect with Vanguard® > vanguard.com
| Fund Information > 800-662-7447 | |
| Direct Investor Account Services > 800-662-2739 | |
| Institutional Investor Services > 800-523-1036 | |
| Text Telephone for People | |
| Who Are Deaf or Hard of Hearing> 800-749-7273 | |
| This material may be used in conjunction | |
| with the offering of shares of any Vanguard | |
| fund only if preceded or accompanied by | |
| the fund’s current prospectus. | |
| All comparative mutual fund data are from Lipper, a | |
| Thomson Reuters Company, or Morningstar, Inc., unless | |
| otherwise noted. | |
| You can obtain a free copy of Vanguard’s proxy voting | |
| guidelines by visiting vanguard.com/proxyreporting or by | |
| calling Vanguard at 800-662-2739. The guidelines are | |
| also available from the SEC’s website, sec.gov. In | |
| addition, you may obtain a free report on how your fund | |
| voted the proxies for securities it owned during the 12 | |
| months ended June 30. To get the report, visit either | |
| vanguard.com/proxyreporting or sec.gov. | |
| You can review and copy information about your fund at | |
| the SEC’s Public Reference Room in Washington, D.C. To | |
| find out more about this public service, call the SEC at | |
| 202-551-8090. Information about your fund is also | |
| available on the SEC’s website, and you can receive | |
| copies of this information, for a fee, by sending a | |
| request in either of two ways: via email addressed to | |
| publicinfo@sec.gov or via regular mail addressed to the | |
| Public Reference Section, Securities and Exchange | |
| Commission, Washington, DC 20549-1520. | |
| © 2015 The Vanguard Group, Inc. | |
| All rights reserved. | |
| Vanguard Marketing Corporation, Distributor. | |
| Q6730 112015 | |
Annual Report | September 30, 2015
Vanguard Institutional Target Retirement Funds
Vanguard Institutional Target Retirement 2035 Fund
Vanguard Institutional Target Retirement 2040 Fund
Vanguard Institutional Target Retirement 2045 Fund
Vanguard Institutional Target Retirement 2050 Fund
Vanguard Institutional Target Retirement 2055 Fund
Vanguard Institutional Target Retirement 2060 Fund
Vanguard’s Principles for Investing Success
We want to give you the best chance of investment success. These principles, grounded in Vanguard’s research and experience, can put you on the right path.
Goals. Create clear, appropriate investment goals.
Balance. Develop a suitable asset allocation using broadly diversified funds. Cost. Minimize cost.
Discipline. Maintain perspective and long-term discipline.
A single theme unites these principles: Focus on the things you can control.
We believe there is no wiser course for any investor.
| Contents | |
| Your Fund’s Total Returns. | 1 |
| Chairman’s Letter. | 2 |
| Institutional Target Retirement 2035 Fund. | 8 |
| Institutional Target Retirement 2040 Fund. | 19 |
| Institutional Target Retirement 2045 Fund. | 30 |
| Institutional Target Retirement 2050 Fund. | 41 |
| Institutional Target Retirement 2055 Fund. | 52 |
| Institutional Target Retirement 2060 Fund. | 63 |
| Trustees Approve Advisory Arrangement. | 76 |
| Glossary. | 77 |
Please note: The opinions expressed in this report are just that—informed opinions. They should not be considered promises or advice. Also, please keep in mind that the information and opinions cover the period through the date on the front of this report. Of course, the risks of investing in your fund are spelled out in the prospectus.
See the Glossary for definitions of investment terms used in this report.
About the cover: Pictured is a sailing block on the Brilliant, a 1932 schooner docked in Mystic, Connecticut. A type of pulley, the sailing block helps coordinate the setting of the sails. At Vanguard, the intricate coordination of technology and people allows us to help millions of clients around the world reach their financial goals.
| Your Fund’s Total Returns | |
| Period Ended September 30, 2015 | |
| Since Inception | |
| Institutional Target Retirement 2035 Fund (Inception: 6/26/2015) | -8.65% |
| Target 2035 Composite Index | -8.63 |
| Mixed-Asset Target 2035 Funds Average | -8.83 |
| Mixed-Asset Target 2035 Funds Average: Derived from data provided by Lipper, a Thomson Reuters Company. | |
| Institutional Target Retirement 2040 Fund (Inception: 6/26/2015) | -9.60% |
| Target 2040 Composite Index | -9.56 |
| Mixed-Asset Target 2040 Funds Average | -9.34 |
| Mixed-Asset Target 2040 Funds Average: Derived from data provided by Lipper, a Thomson Reuters Company. | |
| Institutional Target Retirement 2045 Fund (Inception: 6/26/2015) | -9.65% |
| Target 2045 Composite Index | -9.60 |
| Mixed-Asset Target 2045 Funds Average | -9.70 |
| Mixed-Asset Target 2045 Funds Average: Derived from data provided by Lipper, a Thomson Reuters Company. | |
| Institutional Target Retirement 2050 Fund (Inception: 6/26/2015) | -9.65% |
| Target 2050 Composite Index | -9.60 |
| Mixed-Asset Target 2050 Funds Average | -9.70 |
| Mixed-Asset Target 2050 Funds Average: Derived from data provided by Lipper, a Thomson Reuters Company. | |
| Institutional Target Retirement 2055 Fund (Inception: 6/26/2015) | -9.60% |
| Target 2055 Composite Index | -9.60 |
| Mixed-Asset Target 2055+ Funds Average | -9.72 |
| Mixed-Asset Target 2055+ Funds Average: Derived from data provided by Lipper, a Thomson Reuters Company. | |
| Institutional Target Retirement 2060 Fund (Inception: 6/26/2015) | -9.65% |
| Target 2060 Composite Index | -9.60 |
| Mixed-Asset Target 2055+ Funds Average | -9.72 |
| Mixed-Asset Target 2055+ Funds Average: Derived from data provided by Lipper, a Thomson Reuters Company. | |
| For a benchmark description, see the Glossary. | |
Investments in Target Retirement Funds are subject to the risks of their underlying funds. The year in the fund name refers to the approximate year (the target date) when an investor in the fund would retire and leave the work force. The fund will gradually shift its emphasis from more aggressive investments to more conservative ones based on its target date. An investment in a Target Retirement Fund is not guaranteed at any time, including on or after the target date.
1
Chairman’s Letter
Dear Shareholder,
I am pleased to provide you with the first shareholder report for Vanguard Institutional Target Retirement Funds. These new funds, which began operating on June 26, 2015, offer the same sophisticated asset allocation and disciplined, long-term strategy as our traditional Target Retirement Funds, but at a lower cost.
The roughly three months since the funds’ inception through September 30, 2015, were a volatile time for the world’s financial markets. After notching an impressive advance earlier in the fiscal year, U.S. stocks reversed course, but they still held up significantly better than their international counterparts.
Bonds generally outperformed stocks for the period. For international bonds, whether returns were hedged or unhedged for currency effects made a significant difference, a point I’ll revisit later in this letter.
Returns for the six Vanguard Institutional Target Retirement Funds covered in this report ranged from –9.65% for the 2045, 2050 and 2060 Funds to –8.65% for the 2035 Fund. (The funds with retirement dates of 2010 through 2030, along with the Institutional Target Retirement Income Fund, are covered in a separate report.) Given the investment environment, it’s not surprising that the funds with more exposure to bonds and less exposure to stocks performed best.
2
China’s economic woes weighed on global stocks
The broad U.S. stock market returned –0.49% for the 12 months. The final two months were especially rocky as investors worried in particular about the global ripple effects of slower economic growth in China.
For much of the fiscal year, investors were preoccupied with the possibility of an increase in short-term interest rates. On September 17, the Federal Reserve announced that it would hold rates steady for the time being, a decision that to some investors indicated the Fed’s concern about the fragility of global markets.
International stocks returned about –11%, as the dollar’s strength against many foreign currencies weighed on results. Returns for emerging markets, which were especially hard hit by concerns about China, trailed those of the developed markets of the Pacific region and Europe.
Taxable bonds recorded gains as investors searched for safety
The broad U.S. taxable bond market returned 2.94%, as investors gravitated toward safe-haven assets amid global stock market turmoil. Stimulative monetary policies from the world’s central banks, declining inflation expectations, and global investors’ search for higher yields also helped lift U.S. bonds.
| Market Barometer | |||
| Average Annual Total Returns | |||
| Periods Ended September 30, 2015 | |||
| One | Three | Five | |
| Year | Years | Years | |
| Stocks | |||
| Russell 1000 Index (Large-caps) | -0.61% | 12.66% | 13.42% |
| Russell 2000 Index (Small-caps) | 1.25 | 11.02 | 11.73 |
| Russell 3000 Index (Broad U.S. market) | -0.49 | 12.53 | 13.28 |
| FTSE All-World ex US Index (International) | -11.34 | 2.87 | 2.19 |
| Bonds | |||
| Barclays U.S. Aggregate Bond Index (Broad taxable market) | 2.94% | 1.71% | 3.10% |
| Barclays Municipal Bond Index (Broad tax-exempt market) | 3.16 | 2.88 | 4.14 |
| Citigroup Three-Month U.S. Treasury Bill Index | 0.02 | 0.02 | 0.04 |
| CPI | |||
| Consumer Price Index | -0.04% | 0.93% | 1.73% |
3
The yield of the 10-year Treasury note ended September at 2.05%, down from 2.48% a year earlier. (Bond prices and yields move in opposite directions.)
International bond markets (as measured by the Barclays Global Aggregate Index ex USD) returned –7.67%, hurt by the weakness of international currencies relative to the dollar. Without this currency effect, international bonds advanced modestly.
The Fed’s 0%–0.25% target for short-term interest rates continued to limit returns for money market funds and savings accounts.
More conservative funds fared better amid volatility
Vanguard Institutional Target Retirement Funds offer a diversified portfolio of index funds within a single fund that adjusts its underlying asset mix over time. The portfolio gradually shifts from a growth-oriented, stock-heavy asset allocation to one that emphasizes income-generating fixed income securities as the investor’s retirement date approaches. Once its target date is reached, each fund continues to adjust until it enters an income phase, when the portfolio converts to the Income Fund. That fund, which represents a static allocation of about 70% bonds and 30%
In stormy markets, target-date funds can help you stay on course
At Vanguard, we advise investors to avoid overreacting to market noise. But we realize that market turmoil, such as that experienced in recent months, can trigger even seasoned investors to make investment decisions based on emotion.
That’s where target-date funds can help. A Vanguard study of defined-contribution retirement plans found that the increasing use of target-date funds is dramatically improving investor behavior.
Target-date investors, it seems, are better able to weather market volatility and stick with their investment plan—probably because they know that their asset mix is automatically adjusted to fit their age and investment horizon.
According to the Vanguard study How America Saves 2015, when compared with other retirement plan investors, those who held their entire account balance in target-date funds:
• Had more balanced portfolios (including, for example, bonds and international stocks). • Did not hold “extreme” equity allocations (either no stocks or 100% stocks). • Refrained from frequent trading, which typically leads to disappointing results.
4
stocks, is mostly focused on helping investors generate income and preserve their wealth.
As I mentioned, bonds outperformed stocks both for the most recent fiscal year and the period since the funds’ inception. Mirroring this broad market trend, the more conservative of the Institutional Target Retirement Funds—those holding more bonds and fewer stocks—outpaced their more aggressive counterparts. The 2035 Fund, the most conservative of the funds covered in this report, with about 82% of its assets in stocks and 18% in bonds, fared better than the five other funds, which hold about 90% of assets in stocks and 10% in bonds.
These results, of course, largely reflect the performance of the underlying portfolios that make up the Institutional Target Retirement Funds in this report—Vanguard Total Stock Market Index Fund, Vanguard Total International Stock Index Fund, Vanguard Total Bond Market II Index Fund, and Vanguard Total International Bond Index Fund.
Again, in keeping with the broader market trends, the underlying bond portfolios performed best. The Total International Bond Index Fund, which provides broad exposure to non-U.S. investment-grade bonds, was the top performer, returning 1.84%. (All returns for the underlying portfolios are for June 26, 2015, through September 30, 2015.) The Total Bond Market II Index— which offers broad exposure to the U.S. investment-grade fixed income market—also returned 1.84%. Global fixed income markets benefited as investors sought relief from the stock markets’ heightened volatility.
Currency hedging, as I mentioned, was a distinguishing factor in the performance of international bonds. The Total International Bond Index Fund uses currency exchange contracts to minimize the effects of currency fluctuations; this policy largely erased the negative effect of converting foreign bond returns into more expensive U.S. dollars during the period.
The underlying stock funds posted negative returns. The Total Stock Market Index Fund—which provides investors with broad exposure to the entire U.S. stock market—returned –8.94%. The Total International Stock Index Fund, which offers investors exposure to both developed and emerging international economies, returned –13.81%. Both domestic and international equity markets struggled amid volatility later in the period. The strength of the U.S. dollar further hindered results of foreign stocks.
A dose of discipline is crucial when markets become volatile
Although the broad U.S. stock market has posted gains for six straight calendar years—from 2009 to 2014—that streak may not last a seventh. Stocks tumbled in August and swung up and down in September.
5
Nobody can control the direction of the markets or reliably predict where they’ll go in the short term. However, investors can control how they react to unstable and turbulent markets.
During periods of market adversity, it’s more important than ever to keep sight of one of Vanguard’s key principles: Maintain perspective and long-term discipline. Whether you’re investing for yourself or on behalf of clients, your success is affected greatly by how you respond—or don’t respond—during turbulent markets. (You can read
Vanguard’s Principles for Investing Success at vanguard.com/research.)
As I’ve written in the past, the best course for long-term investors is generally to ignore daily market moves and not make decisions based on emotion. This is also a good time to evaluate your portfolio and make sure your asset allocation is aligned with your time horizon, goals, and risk tolerance.
The markets are unpredictable and often confounding. Keeping your long-term plans clearly in focus can help you weather these periodic storms.
As always, thank you for investing with Vanguard.
Sincerely,
F. William McNabb III
Chairman and Chief Executive Officer
October 19, 2015
6
| Your Fund’s Performance at a Glance | ||||
| Inception Through September 30, 2015 | ||||
| Distributions Per Share | ||||
| Starting | Ending | Income | Capital | |
| Share Price | Share Price | Dividends | Gains | |
| Institutional Target Retirement 2035 Fund | ||||
| (Inception: 6/26/2015) | $20.00 | $18.27 | $0.000 | $0.000 |
| Institutional Target Retirement 2040 Fund | ||||
| (Inception: 6/26/2015) | $20.00 | $18.08 | $0.000 | $0.000 |
| Institutional Target Retirement 2045 Fund | ||||
| (Inception: 6/26/2015) | $20.00 | $18.07 | $0.000 | $0.000 |
| Institutional Target Retirement 2050 Fund | ||||
| (Inception: 6/26/2015) | $20.00 | $18.07 | $0.000 | $0.000 |
| Institutional Target Retirement 2055 Fund | ||||
| (Inception: 6/26/2015) | $20.00 | $18.08 | $0.000 | $0.000 |
| Institutional Target Retirement 2060 Fund | ||||
| (Inception: 6/26/2015) | $20.00 | $18.07 | $0.000 | $0.000 |
7
Institutional Target Retirement 2035 Fund
Fund Profile
As of September 30, 2015
| Total Fund Characteristics | |
| Ticker Symbol | VITFX |
| 30-Day SEC Yield | 2.35% |
| Acquired Fund Fees and Expenses1 | 0.10% |
| Allocation to Underlying Vanguard Funds | |
| Vanguard Total Stock Market Index Fund | |
| Institutional Shares | 49.2% |
| Vanguard Total International Stock Index | |
| Fund Investor Shares | 32.7 |
| Vanguard Total Bond Market II Index Fund | |
| Investor Shares | 12.7 |
| Vanguard Total International Bond Index | |
| Fund Admiral Shares | 5.4 |
1 This figure—drawn from the prospectus dated June 26, 2015—represents an estimate of the weighted average of the expense ratios and any transaction fees charged by the underlying mutual funds (the ”acquired” funds) in which the Institutional Target Retirement 2035 Fund invests. The fund does not charge any expenses or fees of its own. For the period from inception through September 30, 2015, the annualized acquired fund fees and expenses were 0.10%.
8
Institutional Target Retirement 2035 Fund
Performance Summary
All of the returns in this report represent past performance, which is not a guarantee of future results that may be achieved by the fund. (Current performance may be lower or higher than the performance data cited. For performance data current to the most recent month-end, visit our website at vanguard.com/performance.) Note, too, that both investment returns and principal value can fluctuate widely, so an investor’s shares, when sold, could be worth more or less than their original cost. The returns shown do not reflect taxes that a shareholder would pay on fund distributions or on the sale of fund shares.
| Cumulative Performance: June 26, 2015, Through September 30, 2015 | ||
| Initial Investment of $100,000,000 | ||
| Total Returns | ||
| Period Ended September 30, 2015 | ||
| Since | Final Value | |
| Inception | of a $100,000,000 | |
| (6/26/2015) | Investment | |
| Institutional Target Retirement 2035 Fund | -8.65% | $91,350,000 |
| Target 2035 Composite Index | -8.63 | 91,372,412 |
| Mixed-Asset Target 2035 Funds Average | -8.83 | 91,168,939 |
| MSCI US Broad Market Index | -8.94 | 91,061,036 |
For a benchmark description, see the Glossary.
Mixed-Asset Target 2035 Funds Average: Derived from data provided by Lipper, a Thomson Reuters Company.
"Since Inception" performance is calculated from the fund's inception date for both the fund and its comparative standards.
See Financial Highlights for dividend and capital gains information.
9
Institutional Target Retirement 2035 Fund
Fiscal-Period Total Returns (%): June 26, 2015, Through September 30, 2015
10
Institutional Target Retirement 2035 Fund
Financial Statements
Statement of Net Assets
As of September 30, 2015
The fund reports a complete list of its holdings in regulatory filings four times in each fiscal year, at the quarter-ends. For the second and fourth fiscal quarters, the lists appear in the fund’s semiannual and annual reports to shareholders. For the first and third fiscal quarters, the fund files the lists with the Securities and Exchange Commission on Form N-Q. Shareholders can look up the fund’s Forms N-Q on the SEC’s website at sec.gov. Forms N-Q may also be reviewed and copied at the SEC’s Public Reference Room (see the back cover of this report for further information).
| Market | ||
| Value | ||
| Shares | ($000) | |
| Investment Companies (99.8%) | ||
| U.S. Stock Fund (49.1%) | ||
| Vanguard Total Stock Market Index Fund Institutional Shares | 41,200,078 | 1,980,900 |
| International Stock Fund (32.6%) | ||
| Vanguard Total International Stock Index Fund Investor Shares | 92,699,736 | 1,318,190 |
| U.S. Bond Fund (12.7%) | ||
| 1 Vanguard Total Bond Market II Index Fund Investor Shares | 47,658,000 | 512,800 |
| International Bond Fund (5.4%) | ||
| Vanguard Total International Bond Index Fund Admiral Shares | 10,351,388 | 218,725 |
| Total Investment Companies (Cost $4,270,794) | 4,030,615 | |
| Temporary Cash Investment (0.1%) | ||
| Money Market Fund (0.1%) | ||
| 1 Vanguard Market Liquidity Fund, 0.189% (Cost $2,065) | 2,064,666 | 2,065 |
| Total Investments (99.9%) (Cost $4,272,859) | 4,032,680 | |
| Amount | ||
| ($000) | ||
| Other Assets and Liabilities (0.1%) | ||
| Other Assets | ||
| Receivables for Accrued Income | 1,045 | |
| Receivables for Capital Shares Issued | 198,693 | |
| Total Other Assets | 199,738 | |
| Liabilities | ||
| Payables for Investment Securities Purchased | (195,117) | |
| Payables for Capital Shares Redeemed | (365) | |
| Other Liabilities | (6) | |
| Total Liabilities | (195,488) | |
| Net Assets (100%) | ||
| Applicable to 220,987,496 outstanding $.001 par value shares of | ||
| beneficial interest (unlimited authorization) | 4,036,930 | |
| Net Asset Value Per Share | $18.27 | |
11
| Institutional Target Retirement 2035 Fund | |
| At September 30, 2015, net assets consisted of: | |
| Amount | |
| ($000) | |
| Paid-in Capital | 4,260,892 |
| Undistributed Net Investment Income | 16,206 |
| Accumulated Net Realized Gains | 11 |
| Unrealized Appreciation (Depreciation) | (240,179) |
| Net Assets | 4,036,930 |
- See Note A in Notes to Financial Statements.
- Affiliated fund available only to Vanguard funds and certain trusts and accounts managed by Vanguard. Rate shown for Vanguard Market Liquidity Fund is the 7-day yield.
See accompanying Notes, which are an integral part of the Financial Statements.
12
| Institutional Target Retirement 2035 Fund | |
| Statement of Operations | |
| June 26, 20151 to | |
| September 30, 2015 | |
| ($000) | |
| Investment Income | |
| Income | |
| Income Distributions Received | 16,206 |
| Net Investment Income—Note B | 16,206 |
| Realized Net Gain (Loss) on Affiliated Investment Securities Sold | 11 |
| Change in Unrealized Appreciation (Depreciation) of Investment Securities | (240,179) |
| Net Increase (Decrease) in Net Assets Resulting from Operations | (223,962) |
| 1 Inception. | |
See accompanying Notes, which are an integral part of the Financial Statements.
13
| Institutional Target Retirement 2035 Fund | |
| Statement of Changes in Net Assets | |
| June 26, 20151 to | |
| September 30, 2015 | |
| ($000) | |
| Increase (Decrease) in Net Assets | |
| Operations | |
| Net Investment Income | 16,206 |
| Realized Net Gain (Loss) | 11 |
| Change in Unrealized Appreciation (Depreciation) | (240,179) |
| Net Increase (Decrease) in Net Assets Resulting from Operations | (223,962) |
| Distributions | |
| Net Investment Income | — |
| Realized Capital Gain | — |
| Total Distributions | — |
| Capital Share Transactions | |
| Issued | 4,281,978 |
| Issued in Lieu of Cash Distributions | — |
| Redeemed | (21,086) |
| Net Increase (Decrease) from Capital Share Transactions | 4,260,892 |
| Total Increase (Decrease) | 4,036,930 |
| Net Assets | |
| Beginning of Period | — |
| End of Period2 | 4,036,930 |
| 1 | Inception. |
| 2 | Net Assets—End of Period includes undistributed (overdistributed) net investment income of $16,206,000. |
See accompanying Notes, which are an integral part of the Financial Statements.
14
| Institutional Target Retirement 2035 Fund | |
| Financial Highlights | |
| June 26, 20151 to | |
| For a Share Outstanding Throughout the Period | September 30, 2015 |
| Net Asset Value, Beginning of Period | $20.00 |
| Investment Operations | |
| Net Investment Income | .1422 |
| Capital Gain Distributions Received | — |
| Net Realized and Unrealized Gain (Loss) on Investments | (1.872) |
| Total from Investment Operations | (1.730) |
| Distributions | |
| Dividends from Net Investment Income | — |
| Distributions from Realized Capital Gains | — |
| Total Distributions | — |
| Net Asset Value, End of Period | $18.27 |
| Total Return | -8.65% |
| Ratios/Supplemental Data | |
| Net Assets, End of Period (Millions) | $4,037 |
| Ratio of Total Expenses to Average Net Assets | — |
| Acquired Fund Fees and Expenses | 0.10%3 |
| Ratio of Net Investment Income to Average Net Assets | 2.62%3 |
| Portfolio Turnover Rate | 0% |
| 1 | Inception. |
| 2 | Calculated based on average shares outstanding. |
| 3 | Annualized. |
See accompanying Notes, which are an integral part of the Financial Statements.
15
Institutional Target Retirement 2035 Fund
Notes to Financial Statements
Vanguard Institutional Target Retirement 2035 Fund is registered under the Investment Company Act of 1940 as an open-end investment company, or mutual fund. The fund follows a balanced investment strategy by investing in selected Vanguard funds to achieve its targeted allocation of assets to U.S. and international stocks, and U.S. and international bonds. Financial statements and other information about each underlying fund are available on vanguard.com.
A. The following significant accounting policies conform to generally accepted accounting principles for U.S. investment companies. The fund consistently follows such policies in preparing its financial statements.
1. Security Valuation: Investments are valued at the net asset value of each underlying Vanguard fund determined as of the close of the New York Stock Exchange (generally 4 p.m., Eastern time) on the valuation date.
2. Federal Income Taxes: The fund intends to qualify as a regulated investment company and distribute all of its taxable income. Management has analyzed the fund’s tax positions taken for its open federal income tax period ended September 30, 2015, and has concluded that no provision for federal income tax is required in the fund’s financial statements.
3. Distributions: Distributions to shareholders are recorded on the ex-dividend date.
4. Other: Income and capital gain distributions received are recorded on the ex-dividend date. Security transactions are accounted for on the date securities are bought or sold. Costs used to determine realized gains (losses) on the sale of investment securities are those of the specific securities sold.
B. In accordance with the terms of a Funds’ Service Agreement (the “FSA”) between Vanguard and the fund, Vanguard furnishes to the fund investment advisory, corporate management, administrative, marketing, and distribution services at Vanguard’s cost of operations (as defined by the FSA). These costs of operations are allocated to the fund based on methods and guidelines approved by the board of trustees. The FSA provides that expenses otherwise allocable to Vanguard funds-of-funds may be reduced or eliminated to the extent of savings realized by the underlying Vanguard funds by virtue of being part of a fund-of-funds. Accordingly, all expenses for services provided by Vanguard to the fund and all other expenses incurred by the fund during the period ended September 30, 2015, were borne by the underlying Vanguard funds in which the fund invests. The fund’s trustees and officers are also trustees and officers, respectively, of the underlying Vanguard funds, as well as directors and employees, respectively, of Vanguard.
C. Various inputs may be used to determine the value of the fund’s investments. These inputs are summarized in three broad levels for financial statement purposes. The inputs or methodologies used to value securities are not necessarily an indication of the risk associated with investing in those securities.
Level 1—Quoted prices in active markets for identical securities.
Level 2—Other significant observable inputs (including quoted prices for similar securities, interest rates, prepayment speeds, credit risk, etc.).
Level 3—Significant unobservable inputs (including the fund’s own assumptions used to determine the fair value of investments).
At September 30, 2015, 100% of the market value of the fund’s investments was determined based on Level 1 inputs.
16
Institutional Target Retirement 2035 Fund
D. Distributions are determined on a tax basis and may differ from net investment income and realized capital gains for financial reporting purposes. Differences may be permanent or temporary. Permanent differences are reclassified among capital accounts in the financial statements to reflect their tax character. Temporary differences arise when certain items of income, expense, gain, or loss are recognized in different periods for financial statement and tax purposes. These differences will reverse at some time in the future. Differences in classification may also result from the treatment of short-term gains as ordinary income for tax purposes.
For tax purposes, at September 30, 2015, the fund had $16,217,000 of ordinary income available for distribution.
At September 30, 2015, the cost of investment securities for tax purposes was $4,272,859,000. Net unrealized depreciation of investment securities for tax purposes was $240,179,000, consisting of unrealized gains of $3,725,000 on securities that had risen in value since their purchase and $243,904,000 in unrealized losses on securities that had fallen in value since their purchase.
E. Capital shares issued and redeemed were:
| June 26, 20151 to | |
| September 30, 2015 | |
| Shares | |
| (000) | |
| Issued | 222,104 |
| Issued in Lieu of Cash Distributions | — |
| Redeemed | (1,117) |
| Net Increase (Decrease) in Shares Outstanding | 220,987 |
| 1 Inception. |
F. Transactions during the period in affiliated underlying Vanguard funds were as follows:
| Current Period Transactions | ||||||
| June 26, | Proceeds | Sept. 30, | ||||
| 20151 | from | Capital Gain | 2015 | |||
| Market | Purchases | Securities | Distributions | Market | ||
| Value | at Cost | Sold | Income | Received | Value | |
| ($000) | ($000) | ($000) | ($000) | ($000) | ($000) | |
| Vanguard Market Liquidity Fund | — | NA2 | NA 2 | 1 | — | 2,065 |
| Vanguard Total Bond Market II | ||||||
| Index Fund | — | 516,753 | 6,596 | 1,723 | — | 512,800 |
| Vanguard Total International Bond | ||||||
| Index Fund | — | 218,947 | 1,315 | 529 | — | 218,725 |
| Vanguard Total International Stock | ||||||
| Index Fund | — | 1,434,947 | 252 | 5,485 | — | 1,318,190 |
| Vanguard Total Stock Market | ||||||
| Index Fund | — | 2,108,474 | 175 | 8,468 | — | 1,980,900 |
| Total | — | 4,279,121 | 8,338 | 16,206 | — | 4,032,680 |
| 1 Inception. | ||||||
| 2 Not applicable—purchases and sales are for temporary cash investment purposes. | ||||||
17
Institutional Target Retirement 2035 Fund
G. Certain funds managed by The Vanguard Group participate in a $3 billion committed credit facility provided by a syndicate of lenders pursuant to a credit agreement that may be renewed annually; each fund is individually liable for its borrowings, if any, under the credit facility. In October 2015, this credit agreement was amended to designate the fund as an additional borrower. Borrowings may be utilized for temporary and emergency purposes, and are subject to the fund’s regulatory and contractual borrowing restrictions. The participating funds are charged administrative fees and an annual commitment fee of 0.06% of the undrawn amount of the facility; these fees are allocated to the funds based on a method approved by the fund’s board of trustees. Any borrowings under this facility bear interest at a rate equal to the higher of the federal funds rate or LIBOR reference rate plus an agreed-upon spread.
Management has determined that no other transactions occurred subsequent to September 30, 2015, that would require recognition or disclosure in these financial statements.
18
Institutional Target Retirement 2040 Fund
Fund Profile
As of September 30, 2015
| Total Fund Characteristics | |
| Ticker Symbol | VIRSX |
| 30-Day SEC Yield | 2.38% |
| Acquired Fund Fees and Expenses1 | 0.10% |
| Allocation to Underlying Vanguard Funds | |
| Vanguard Total Stock Market Index Fund | |
| Institutional Shares | 53.6% |
| Vanguard Total International Stock Index | |
| Fund Investor Shares | 35.7 |
| Vanguard Total Bond Market II Index Fund | |
| Investor Shares | 7.5 |
| Vanguard Total International Bond Index | |
| Fund Admiral Shares | 3.2 |
1 This figure—drawn from the prospectus dated June 26, 2015—represents an estimate of the weighted average of the expense ratios and any transaction fees charged by the underlying mutual funds (the ”acquired” funds) in which the Institutional Target Retirement 2040 Fund invests. The fund does not charge any expenses or fees of its own. For the period from inception through September 30, 2015, the annualized acquired fund fees and expenses were 0.10%.
19
Institutional Target Retirement 2040 Fund
Performance Summary
All of the returns in this report represent past performance, which is not a guarantee of future results that may be achieved by the fund. (Current performance may be lower or higher than the performance data cited. For performance data current to the most recent month-end, visit our website at vanguard.com/performance.) Note, too, that both investment returns and principal value can fluctuate widely, so an investor’s shares, when sold, could be worth more or less than their original cost. The returns shown do not reflect taxes that a shareholder would pay on fund distributions or on the sale of fund shares.
| Cumulative Performance: June 26, 2015, Through September 30, 2015 | ||
| Initial Investment of $100,000,000 | ||
| Total Returns | ||
| Period Ended September 30, 2015 | ||
| Since | Final Value | |
| Inception | of a $100,000,000 | |
| (6/26/2015) | Investment | |
| Institutional Target Retirement 2040 Fund | -9.60% | $90,400,000 |
| Target 2040 Composite Index | -9.56 | 90,440,241 |
| Mixed-Asset Target 2040 Funds Average | -9.34 | 90,661,674 |
| MSCI US Broad Market Index | -8.94 | 91,061,036 |
For a benchmark description, see the Glossary.
Mixed-Asset Target 2040 Funds Average: Derived from data provided by Lipper, a Thomson Reuters Company.
"Since Inception" performance is calculated from the fund's inception date for both the fund and its comparative standards.
See Financial Highlights for dividend and capital gains information.
20
Institutional Target Retirement 2040 Fund
Fiscal-Period Total Returns (%): June 26, 2015, Through September 30, 2015
21
Institutional Target Retirement 2040 Fund
Financial Statements
Statement of Net Assets
As of September 30, 2015
The fund reports a complete list of its holdings in regulatory filings four times in each fiscal year, at the quarter-ends. For the second and fourth fiscal quarters, the lists appear in the fund’s semiannual and annual reports to shareholders. For the first and third fiscal quarters, the fund files the lists with the Securities and Exchange Commission on Form N-Q. Shareholders can look up the fund’s Forms N-Q on the SEC’s website at sec.gov. Forms N-Q may also be reviewed and copied at the SEC’s Public Reference Room (see the back cover of this report for further information).
| Market | ||
| Value | ||
| Shares | ($000) | |
| Investment Companies (99.8%) | ||
| U.S. Stock Fund (53.5%) | ||
| Vanguard Total Stock Market Index Fund Institutional Shares | 33,750,760 | 1,622,736 |
| International Stock Fund (35.6%) | ||
| Vanguard Total International Stock Index Fund Investor Shares | 75,944,243 | 1,079,927 |
| U.S. Bond Fund (7.5%) | ||
| 1 Vanguard Total Bond Market II Index Fund Investor Shares | 21,054,573 | 226,547 |
| International Bond Fund (3.2%) | ||
| Vanguard Total International Bond Index Fund Admiral Shares | 4,563,351 | 96,424 |
| Total Investment Companies (Cost $3,212,954) | 3,025,634 | |
| Temporary Cash Investment (0.0%) | ||
| Money Market Fund (0.0%) | ||
| 1 Vanguard Market Liquidity Fund, 0.189% (Cost $346) | 345,816 | 346 |
| Total Investments (99.8%) (Cost $3,213,300) | 3,025,980 | |
| Other Assets and Liabilities (0.2%) | ||
| Other Assets | 157,106 | |
| Liabilities | (151,575) | |
| 5,531 | ||
| Net Assets (100%) | ||
| Applicable to 167,692,448 outstanding $.001 par value shares of | ||
| beneficial interest (unlimited authorization) | 3,031,511 | |
| Net Asset Value Per Share | $18.08 | |
22
| Institutional Target Retirement 2040 Fund | |
| Amount | |
| ($000) | |
| Statement of Assets and Liabilities | |
| Assets | |
| Investments in Affiliated Vanguard Funds, at Value | 3,025,980 |
| Receivables for Capital Shares Issued | 156,657 |
| Receivables for Accrued Income | 449 |
| Total Assets | 3,183,086 |
| Liabilities | |
| Payables for Investment Securities Purchased | 151,490 |
| Payables for Capital Shares Redeemed | 82 |
| Other Liabilities | 3 |
| Total Liabilities | 151,575 |
| Net Assets | 3,031,511 |
| At September 30, 2015, net assets consisted of: | |
| Amount | |
| ($000) | |
| Paid-in Capital | 3,206,599 |
| Undistributed Net Investment Income | 12,225 |
| Accumulated Net Realized Gains | 7 |
| Unrealized Appreciation (Depreciation) | (187,320) |
| Net Assets | 3,031,511 |
- See Note A in Notes to Financial Statements.
- Affiliated fund available only to Vanguard funds and certain trusts and accounts managed by Vanguard. Rate shown for Vanguard Market Liquidity Fund is the 7-day yield.
See accompanying Notes, which are an integral part of the Financial Statements.
23
| Institutional Target Retirement 2040 Fund | |
| Statement of Operations | |
| June 26, 20151 to | |
| September 30, 2015 | |
| ($000) | |
| Investment Income | |
| Income | |
| Income Distributions Received | 12,225 |
| Net Investment Income—Note B | 12,225 |
| Realized Net Gain (Loss) on Affiliated Investment Securities Sold | 7 |
| Change in Unrealized Appreciation (Depreciation) of Investment Securities | (187,320) |
| Net Increase (Decrease) in Net Assets Resulting from Operations | (175,088) |
| 1 Inception. | |
See accompanying Notes, which are an integral part of the Financial Statements.
24
| Institutional Target Retirement 2040 Fund | |
| Statement of Changes in Net Assets | |
| June 26, 20151 to | |
| September 30, 2015 | |
| ($000) | |
| Increase (Decrease) in Net Assets | |
| Operations | |
| Net Investment Income | 12,225 |
| Realized Net Gain (Loss) | 7 |
| Change in Unrealized Appreciation (Depreciation) | (187,320) |
| Net Increase (Decrease) in Net Assets Resulting from Operations | (175,088) |
| Distributions | |
| Net Investment Income | — |
| Realized Capital Gain | — |
| Total Distributions | — |
| Capital Share Transactions | |
| Issued | 3,224,917 |
| Issued in Lieu of Cash Distributions | — |
| Redeemed | (18,318) |
| Net Increase (Decrease) from Capital Share Transactions | 3,206,599 |
| Total Increase (Decrease) | 3,031,511 |
| Net Assets | |
| Beginning of Period | — |
| End of Period2 | 3,031,511 |
| 1 | Inception. |
| 2 | Net Assets—End of Period includes undistributed (overdistributed) net investment income of $12,225,000. |
See accompanying Notes, which are an integral part of the Financial Statements.
25
| Institutional Target Retirement 2040 Fund | |
| Financial Highlights | |
| June 26, 20151 to | |
| For a Share Outstanding Throughout the Period | September 30, 2015 |
| Net Asset Value, Beginning of Period | $20.00 |
| Investment Operations | |
| Net Investment Income | .1512 |
| Capital Gain Distributions Received | — |
| Net Realized and Unrealized Gain (Loss) on Investments | (2.071) |
| Total from Investment Operations | (1.920) |
| Distributions | |
| Dividends from Net Investment Income | — |
| Distributions from Realized Capital Gains | — |
| Total Distributions | — |
| Net Asset Value, End of Period | $18.08 |
| Total Return | -9.60% |
| Ratios/Supplemental Data | |
| Net Assets, End of Period (Millions) | $3,032 |
| Ratio of Total Expenses to Average Net Assets | — |
| Acquired Fund Fees and Expenses | 0.10%3 |
| Ratio of Net Investment Income to Average Net Assets | 2.81%3 |
| Portfolio Turnover Rate | 1% |
| 1 | Inception. |
| 2 | Calculated based on average shares outstanding. |
| 3 | Annualized. |
See accompanying Notes, which are an integral part of the Financial Statements.
26
Institutional Target Retirement 2040 Fund
Notes to Financial Statements
Vanguard Institutional Target Retirement 2040 Fund is registered under the Investment Company Act of 1940 as an open-end investment company, or mutual fund. The fund follows a balanced investment strategy by investing in selected Vanguard funds to achieve its targeted allocation of assets to U.S. and international stocks, and U.S. and international bonds. Financial statements and other information about each underlying fund are available on vanguard.com.
A. The following significant accounting policies conform to generally accepted accounting principles for U.S. investment companies. The fund consistently follows such policies in preparing its financial statements.
1. Security Valuation: Investments are valued at the net asset value of each underlying Vanguard fund determined as of the close of the New York Stock Exchange (generally 4 p.m., Eastern time) on the valuation date.
2. Federal Income Taxes: The fund intends to qualify as a regulated investment company and distribute all of its taxable income. Management has analyzed the fund’s tax positions taken for its open federal income tax period ended September 30, 2015, and has concluded that no provision for federal income tax is required in the fund’s financial statements.
3. Distributions: Distributions to shareholders are recorded on the ex-dividend date.
4. Other: Income and capital gain distributions received are recorded on the ex-dividend date. Security transactions are accounted for on the date securities are bought or sold. Costs used to determine realized gains (losses) on the sale of investment securities are those of the specific securities sold.
B. In accordance with the terms of a Funds’ Service Agreement (the “FSA”) between Vanguard and the fund, Vanguard furnishes to the fund investment advisory, corporate management, administrative, marketing, and distribution services at Vanguard’s cost of operations (as defined by the FSA). These costs of operations are allocated to the fund based on methods and guidelines approved by the board of trustees. The FSA provides that expenses otherwise allocable to Vanguard funds-of-funds may be reduced or eliminated to the extent of savings realized by the underlying Vanguard funds by virtue of being part of a fund-of-funds. Accordingly, all expenses for services provided by Vanguard to the fund and all other expenses incurred by the fund during the period ended September 30, 2015, were borne by the underlying Vanguard funds in which the fund invests. The fund’s trustees and officers are also trustees and officers, respectively, of the underlying Vanguard funds, as well as directors and employees, respectively, of Vanguard.
C. Various inputs may be used to determine the value of the fund’s investments. These inputs are summarized in three broad levels for financial statement purposes. The inputs or methodologies used to value securities are not necessarily an indication of the risk associated with investing in those securities.
Level 1—Quoted prices in active markets for identical securities.
Level 2—Other significant observable inputs (including quoted prices for similar securities, interest rates, prepayment speeds, credit risk, etc.).
Level 3—Significant unobservable inputs (including the fund’s own assumptions used to determine the fair value of investments).
At September 30, 2015, 100% of the market value of the fund’s investments was determined based on Level 1 inputs.
27
Institutional Target Retirement 2040 Fund
D. Distributions are determined on a tax basis and may differ from net investment income and realized capital gains for financial reporting purposes. Differences may be permanent or temporary. Permanent differences are reclassified among capital accounts in the financial statements to reflect their tax character. Temporary differences arise when certain items of income, expense, gain, or loss are recognized in different periods for financial statement and tax purposes. These differences will reverse at some time in the future. Differences in classification may also result from the treatment of short-term gains as ordinary income for tax purposes.
For tax purposes, at September 30, 2015, the fund had $12,232,000 of ordinary income available for distribution.
At September 30, 2015, the cost of investment securities for tax purposes was $3,213,300,000. Net unrealized depreciation of investment securities for tax purposes was $187,320,000, consisting of unrealized gains of $1,525,000 on securities that had risen in value since their purchase and $188,845,000 in unrealized losses on securities that had fallen in value since their purchase.
E. Capital shares issued and redeemed were:
| June 26, 20151 to | |
| September 30, 2015 | |
| Shares | |
| (000) | |
| Issued | 168,671 |
| Issued in Lieu of Cash Distributions | — |
| Redeemed | (979) |
| Net Increase (Decrease) in Shares Outstanding | 167,692 |
| 1 Inception. |
F. Transactions during the period in affiliated underlying Vanguard funds were as follows:
| Current Period Transactions | ||||||
| June 26, | Proceeds | Sept. 30, | ||||
| 20151 | from | Capital Gain | 2015 | |||
| Market | Purchases | Securities | Distributions | Market | ||
| Value | at Cost | Sold | Income | Received | Value | |
| ($000) | ($000) | ($000) | ($000) | ($000) | ($000) | |
| Vanguard Market Liquidity Fund | — | NA2 | NA 2 | — | — | 346 |
| Vanguard Total Bond Market II | ||||||
| Index Fund | — | 229,698 | 4,250 | 700 | — | 226,547 |
| Vanguard Total International Bond | ||||||
| Index Fund | — | 96,922 | 931 | 217 | — | 96,424 |
| Vanguard Total International Stock | ||||||
| Index Fund | — | 1,170,769 | 1,083 | 4,444 | — | 1,079,927 |
| Vanguard Total Stock Market | ||||||
| Index Fund | — | 1,726,822 | 5,000 | 6,864 | — | 1,622,736 |
| Total | — | 3,224,211 | 11,264 | 12,225 | — | 3,025,980 |
| 1 Inception. | ||||||
| 2 Not applicable—purchases and sales are for temporary cash investment purposes. | ||||||
28
Institutional Target Retirement 2040 Fund
G. Certain funds managed by The Vanguard Group participate in a $3 billion committed credit facility provided by a syndicate of lenders pursuant to a credit agreement that may be renewed annually; each fund is individually liable for its borrowings, if any, under the credit facility. In October 2015, this credit agreement was amended to designate the fund as an additional borrower. Borrowings may be utilized for temporary and emergency purposes, and are subject to the fund’s regulatory and contractual borrowing restrictions. The participating funds are charged administrative fees and an annual commitment fee of 0.06% of the undrawn amount of the facility; these fees are allocated to the funds based on a method approved by the fund’s board of trustees. Any borrowings under this facility bear interest at a rate equal to the higher of the federal funds rate or LIBOR reference rate plus an agreed-upon spread.
Management has determined that no other transactions occurred subsequent to September 30, 2015, that would require recognition or disclosure in these financial statements.
29
Institutional Target Retirement 2045 Fund
Fund Profile
As of September 30, 2015
| Total Fund Characteristics | |
| Ticker Symbol | VITLX |
| 30-Day SEC Yield | 2.38% |
| Acquired Fund Fees and Expenses1 | 0.10% |
| Allocation to Underlying Vanguard Funds | |
| Vanguard Total Stock Market Index Fund | |
| Institutional Shares | 54.0% |
| Vanguard Total International Stock Index | |
| Fund Investor Shares | 36.0 |
| Vanguard Total Bond Market II Index Fund | |
| Investor Shares | 7.0 |
| Vanguard Total International Bond Index | |
| Fund Admiral Shares | 3.0 |
1 This figure—drawn from the prospectus dated June 26, 2015—represents an estimate of the weighted average of the expense ratios and any transaction fees charged by the underlying mutual funds (the ”acquired” funds) in which the Institutional Target Retirement 2045 Fund invests. The fund does not charge any expenses or fees of its own. For the period from inception through September 30, 2015, the annualized acquired fund fees and expenses were 0.10%.
30
Institutional Target Retirement 2045 Fund
Performance Summary
All of the returns in this report represent past performance, which is not a guarantee of future results that may be achieved by the fund. (Current performance may be lower or higher than the performance data cited. For performance data current to the most recent month-end, visit our website at vanguard.com/performance.) Note, too, that both investment returns and principal value can fluctuate widely, so an investor’s shares, when sold, could be worth more or less than their original cost. The returns shown do not reflect taxes that a shareholder would pay on fund distributions or on the sale of fund shares.
| Cumulative Performance: June 26, 2015, Through September 30, 2015 | ||
| Initial Investment of $100,000,000 | ||
| Total Returns | ||
| Period Ended September 30, 2015 | ||
| Since | Final Value | |
| Inception | of a $100,000,000 | |
| (6/26/2015) | Investment | |
| Institutional Target Retirement 2045 Fund | -9.65% | $90,350,000 |
| Target 2045 Composite Index | -9.60 | 90,402,843 |
| Mixed-Asset Target 2045 Funds Average | -9.70 | 90,297,937 |
| MSCI US Broad Market Index | -8.94 | 91,061,036 |
For a benchmark description, see the Glossary.
Mixed-Asset Target 2045 Funds Average: Derived from data provided by Lipper, a Thomson Reuters Company.
"Since Inception" performance is calculated from the fund's inception date for both the fund and its comparative standards.
See Financial Highlights for dividend and capital gains information.
31
Institutional Target Retirement 2045 Fund
Fiscal-Period Total Returns (%): June 26, 2015, Through September 30, 2015
32
Institutional Target Retirement 2045 Fund
Financial Statements
Statement of Net Assets
As of September 30, 2015
The fund reports a complete list of its holdings in regulatory filings four times in each fiscal year, at the quarter-ends. For the second and fourth fiscal quarters, the lists appear in the fund’s semiannual and annual reports to shareholders. For the first and third fiscal quarters, the fund files the lists with the Securities and Exchange Commission on Form N-Q. Shareholders can look up the fund’s Forms N-Q on the SEC’s website at sec.gov. Forms N-Q may also be reviewed and copied at the SEC’s Public Reference Room (see the back cover of this report for further information).
| Market | ||
| Value | ||
| Shares | ($000) | |
| Investment Companies (99.7%) | ||
| U.S. Stock Fund (53.9%) | ||
| Vanguard Total Stock Market Index Fund Institutional Shares | 25,989,652 | 1,249,582 |
| International Stock Fund (35.9%) | ||
| Vanguard Total International Stock Index Fund Investor Shares | 58,442,313 | 831,050 |
| U.S. Bond Fund (6.9%) | ||
| 1 Vanguard Total Bond Market II Index Fund Investor Shares | 14,939,846 | 160,753 |
| International Bond Fund (3.0%) | ||
| Vanguard Total International Bond Index Fund Admiral Shares | 3,239,519 | 68,451 |
| Total Investment Companies (Cost $2,458,554) | 2,309,836 | |
| Temporary Cash Investment (0.1%) | ||
| Money Market Fund (0.1%) | ||
| 1 Vanguard Market Liquidity Fund, 0.189% (Cost $1,965) | 1,964,580 | 1,965 |
| Total Investments (99.8%) (Cost $2,460,519) | 2,311,801 | |
| Other Assets and Liabilities (0.2%) | ||
| Other Assets | 147,802 | |
| Liabilities | (142,524) | |
| 5,278 | ||
| Net Assets (100%) | ||
| Applicable to 128,237,024 outstanding $.001 par value shares of | ||
| beneficial interest (unlimited authorization) | 2,317,079 | |
| Net Asset Value Per Share | $18.07 | |
33
| Institutional Target Retirement 2045 Fund | |
| Amount | |
| ($000) | |
| Statement of Assets and Liabilities | |
| Assets | |
| Investments in Affiliated Vanguard Funds, at Value | 2,311,801 |
| Receivables for Capital Shares Issued | 147,470 |
| Receivables for Accrued Income | 332 |
| Total Assets | 2,459,603 |
| Liabilities | |
| Payables for Investment Securities Purchased | 142,499 |
| Payables for Capital Shares Redeemed | 23 |
| Other Liabilities | 2 |
| Total Liabilities | 142,524 |
| Net Assets | 2,317,079 |
| At September 30, 2015, net assets consisted of: | |
| Amount | |
| ($000) | |
| Paid-in Capital | 2,456,215 |
| Undistributed Net Investment Income | 9,577 |
| Accumulated Net Realized Gains | 5 |
| Unrealized Appreciation (Depreciation) | (148,718) |
| Net Assets | 2,317,079 |
- See Note A in Notes to Financial Statements.
- Affiliated fund available only to Vanguard funds and certain trusts and accounts managed by Vanguard. Rate shown for Vanguard Market Liquidity Fund is the 7-day yield.
See accompanying Notes, which are an integral part of the Financial Statements.
34
| Institutional Target Retirement 2045 Fund | |
| Statement of Operations | |
| June 26, 20151 to | |
| September 30, 2015 | |
| ($000) | |
| Investment Income | |
| Income | |
| Income Distributions Received | 9,577 |
| Net Investment Income—Note B | 9,577 |
| Realized Net Gain (Loss) on Affiliated Investment Securities Sold | 5 |
| Change in Unrealized Appreciation (Depreciation) of Investment Securities | (148,718) |
| Net Increase (Decrease) in Net Assets Resulting from Operations | (139,136) |
| 1 Inception. | |
See accompanying Notes, which are an integral part of the Financial Statements.
35
| Institutional Target Retirement 2045 Fund | |
| Statement of Changes in Net Assets | |
| June 26, 20151 to | |
| September 30, 2015 | |
| ($000) | |
| Increase (Decrease) in Net Assets | |
| Operations | |
| Net Investment Income | 9,577 |
| Realized Net Gain (Loss) | 5 |
| Change in Unrealized Appreciation (Depreciation) | (148,718) |
| Net Increase (Decrease) in Net Assets Resulting from Operations | (139,136) |
| Distributions | |
| Net Investment Income | — |
| Realized Capital Gain | — |
| Capital Share Transactions | |
| Issued | 2,469,343 |
| Issued in Lieu of Cash Distributions | — |
| Redeemed | (13,128) |
| Net Increase (Decrease) from Capital Share Transactions | 2,456,215 |
| Total Increase (Decrease) | 2,317,079 |
| Net Assets | |
| Beginning of Period | — |
| End of Period2 | 2,317,079 |
| 1 | Inception. |
| 2 | Net Assets—End of Period includes undistributed (overdistributed) net investment income of $9,577,000. |
See accompanying Notes, which are an integral part of the Financial Statements.
36
| Institutional Target Retirement 2045 Fund | |
| Financial Highlights | |
| June 26, 20151 to | |
| For a Share Outstanding Throughout the Period | September 30, 2015 |
| Net Asset Value, Beginning of Period | $20.00 |
| Investment Operations | |
| Net Investment Income | .1492 |
| Capital Gain Distributions Received | — |
| Net Realized and Unrealized Gain (Loss) on Investments | (2.079) |
| Total from Investment Operations | (1.930) |
| Distributions | |
| Dividends from Net Investment Income | — |
| Distributions from Realized Capital Gains | — |
| Total Distributions | — |
| Net Asset Value, End of Period | $18.07 |
| Total Return | -9.65% |
| Ratios/Supplemental Data | |
| Net Assets, End of Period (Millions) | $2,317 |
| Ratio of Total Expenses to Average Net Assets | — |
| Acquired Fund Fees and Expenses | 0.10%3 |
| Ratio of Net Investment Income to Average Net Assets | 2.793 |
| Portfolio Turnover Rate | 0% |
| 1 | Inception. |
| 2 | Calculated based on average shares outstanding. |
| 3 | Annualized. |
See accompanying Notes, which are an integral part of the Financial Statements.
37
Institutional Target Retirement 2045 Fund
Notes to Financial Statements
Vanguard Institutional Target Retirement 2045 Fund is registered under the Investment Company Act of 1940 as an open-end investment company, or mutual fund. The fund follows a balanced investment strategy by investing in selected Vanguard funds to achieve its targeted allocation of assets to U.S. and international stocks, and U.S. and international bonds. Financial statements and other information about each underlying fund are available on vanguard.com.
A. The following significant accounting policies conform to generally accepted accounting principles for U.S. investment companies. The fund consistently follows such policies in preparing its financial statements.
1. Security Valuation: Investments are valued at the net asset value of each underlying Vanguard fund determined as of the close of the New York Stock Exchange (generally 4 p.m., Eastern time) on the valuation date.
2. Federal Income Taxes: The fund intends to qualify as a regulated investment company and distribute all of its taxable income. Management has analyzed the fund’s tax positions taken for its open federal income tax period ended September 30, 2015, and has concluded that no provision for federal income tax is required in the fund’s financial statements.
3. Distributions: Distributions to shareholders are recorded on the ex-dividend date.
4. Other: Income and capital gain distributions received are recorded on the ex-dividend date. Security transactions are accounted for on the date securities are bought or sold. Costs used to determine realized gains (losses) on the sale of investment securities are those of the specific securities sold.
B. In accordance with the terms of a Funds’ Service Agreement (the “FSA”) between Vanguard and the fund, Vanguard furnishes to the fund investment advisory, corporate management, administrative, marketing, and distribution services at Vanguard’s cost of operations (as defined by the FSA). These costs of operations are allocated to the fund based on methods and guidelines approved by the board of trustees. The FSA provides that expenses otherwise allocable to Vanguard funds-of-funds may be reduced or eliminated to the extent of savings realized by the underlying Vanguard funds by virtue of being part of a fund-of-funds. Accordingly, all expenses for services provided by Vanguard to the fund and all other expenses incurred by the fund during the period ended September 30, 2015, were borne by the underlying Vanguard funds in which the fund invests. The fund’s trustees and officers are also trustees and officers, respectively, of the underlying Vanguard funds, as well as directors and employees, respectively, of Vanguard.
C. Various inputs may be used to determine the value of the fund’s investments. These inputs are summarized in three broad levels for financial statement purposes. The inputs or methodologies used to value securities are not necessarily an indication of the risk associated with investing in those securities.
Level 1—Quoted prices in active markets for identical securities.
Level 2—Other significant observable inputs (including quoted prices for similar securities, interest rates, prepayment speeds, credit risk, etc.).
Level 3—Significant unobservable inputs (including the fund’s own assumptions used to determine the fair value of investments).
At September 30, 2015, 100% of the market value of the fund’s investments was determined based on Level 1 inputs.
38
Institutional Target Retirement 2045 Fund
D. Distributions are determined on a tax basis and may differ from net investment income and realized capital gains for financial reporting purposes. Differences may be permanent or temporary. Permanent differences are reclassified among capital accounts in the financial statements to reflect their tax character. Temporary differences arise when certain items of income, expense, gain, or loss are recognized in different periods for financial statement and tax purposes. These differences will reverse at some time in the future. Differences in classification may also result from the treatment of short-term gains as ordinary income for tax purposes.
For tax purposes, at September 30, 2015, the fund had $9,582,000 of ordinary income available for distribution.
At September 30, 2015, the cost of investment securities for tax purposes was $2,460,519,000. Net unrealized depreciation of investment securities for tax purposes was $148,718,000, consisting of unrealized gains of $1,216,000 on securities that had risen in value since their purchase and $149,934,000 in unrealized losses on securities that had fallen in value since their purchase.
E. Capital shares issued and redeemed were:
| June 26, 20151 to | |
| September 30, 2015 | |
| Shares | |
| (000) | |
| Issued | 128,933 |
| Issued in Lieu of Cash Distributions | — |
| Redeemed | (696) |
| Net Increase (Decrease) in Shares Outstanding | 128,237 |
| 1 Inception. |
F. Transactions during the period in affiliated underlying Vanguard funds were as follows:
| Current Period Transactions | ||||||
| June 26, | Proceeds | Sept. 30, | ||||
| 20151 | from | Capital Gain | 2015 | |||
| Market | Purchases | Securities | Distributions | Market | ||
| Value | at Cost | Sold | Income | Received | Value | |
| ($000) | ($000) | ($000) | ($000) | ($000) | ($000) | |
| Vanguard Market Liquidity Fund | — | NA2 | NA 2 | — | — | 1,965 |
| Vanguard Total Bond Market II | ||||||
| Index Fund | — | 161,988 | 2,105 | 535 | — | 160,753 |
| Vanguard Total International Bond | ||||||
| Index Fund | — | 68,699 | 599 | 163 | — | 68,451 |
| Vanguard Total International Stock | ||||||
| Index Fund | — | 902,655 | 15 | 3,486 | 831,050 | |
| Vanguard Total Stock Market | ||||||
| Index Fund | — | 1,327,926 | — | 5,393 | 1,249,582 | |
| Total | — | 2,461,268 | 2,719 | 9,577 | — | 2,311,801 |
| 1 Inception. | ||||||
| 2 Not applicable—purchases and sales are for temporary cash investment purposes. | ||||||
39
Institutional Target Retirement 2045 Fund
G. Certain funds managed by The Vanguard Group participate in a $3 billion committed credit facility provided by a syndicate of lenders pursuant to a credit agreement that may be renewed annually; each fund is individually liable for its borrowings, if any, under the credit facility. In October 2015, this credit agreement was amended to designate the fund as an additional borrower. Borrowings may be utilized for temporary and emergency purposes, and are subject to the fund’s regulatory and contractual borrowing restrictions. The participating funds are charged administrative fees and an annual commitment fee of 0.06% of the undrawn amount of the facility; these fees are allocated to the funds based on a method approved by the fund’s board of trustees. Any borrowings under this facility bear interest at a rate equal to the higher of the federal funds rate or LIBOR reference rate plus an agreed-upon spread.
Management has determined that no other transactions occurred subsequent to September 30, 2015, that would require recognition or disclosure in these financial statements.
40
Institutional Target Retirement 2050 Fund
Fund Profile
As of September 30, 2015
| Total Fund Characteristics | |
| Ticker Symbol | VTRLX |
| 30-Day SEC Yield | 2.38% |
| Acquired Fund Fees and Expenses1 | 0.10% |
| Allocation to Underlying Vanguard Funds | |
| Vanguard Total Stock Market Index Fund | |
| Institutional Shares | 54.0% |
| Vanguard Total International Stock Index | |
| Fund Investor Shares | 36.0 |
| Vanguard Total Bond Market II Index Fund | |
| Investor Shares | 7.0 |
| Vanguard Total International Bond Index | |
| Fund Admiral Shares | 3.0 |
1 This figure—drawn from the prospectus dated June 26, 2015—represents an estimate of the weighted average of the expense ratios and any transaction fees charged by the underlying mutual funds (the ”acquired” funds) in which the Institutional Target Retirement 2050 Fund invests. The fund does not charge any expenses or fees of its own. For the period from inception through September 30, 2015, the annualized acquired fund fees and expenses were 0.10%.
41
Institutional Target Retirement 2050 Fund
Performance Summary
All of the returns in this report represent past performance, which is not a guarantee of future results that may be achieved by the fund. (Current performance may be lower or higher than the performance data cited. For performance data current to the most recent month-end, visit our website at vanguard.com/performance.) Note, too, that both investment returns and principal value can fluctuate widely, so an investor’s shares, when sold, could be worth more or less than their original cost. The returns shown do not reflect taxes that a shareholder would pay on fund distributions or on the sale of fund shares.
| Cumulative Performance: June 26, 2015, Through September 30, 2015 | ||
| Initial Investment of $100,000,000 | ||
| Total Returns | ||
| Period Ended September 30, 2015 | ||
| Since | Final Value | |
| Inception | of a $100,000,000 | |
| (6/26/2015) | Investment | |
| Institutional Target Retirement 2050 Fund | -9.65% | $90,350,000 |
| Target 2050 Composite Index | -9.60 | 90,402,843 |
| Mixed-Asset Target 2050 Funds Average | -9.70 | 90,300,263 |
| MSCI US Broad Market Index | -8.94 | 91,061,036 |
For a benchmark description, see the Glossary.
Mixed-Asset Target 2050 Funds Average: Derived from data provided by Lipper, a Thomson Reuters Company.
"Since Inception" performance is calculated from the fund's inception date for both the fund and its comparative standards.
See Financial Highlights for dividend and capital gains information.
42
Institutional Target Retirement 2050 Fund
Fiscal-Period Total Returns (%): June 26, 2015, Through September 30, 2015
43
Institutional Target Retirement 2050 Fund
Financial Statements
Statement of Net Assets
As of September 30, 2015
The fund reports a complete list of its holdings in regulatory filings four times in each fiscal year, at the quarter-ends. For the second and fourth fiscal quarters, the lists appear in the fund’s semiannual and annual reports to shareholders. For the first and third fiscal quarters, the fund files the lists with the Securities and Exchange Commission on Form N-Q. Shareholders can look up the fund’s Forms N-Q on the SEC’s website at sec.gov. Forms N-Q may also be reviewed and copied at the SEC’s Public Reference Room (see the back cover of this report for further information).
| Market | ||
| Value | ||
| Shares | ($000) | |
| Investment Companies (99.8%) | ||
| U.S. Stock Fund (54.0%) | ||
| Vanguard Total Stock Market Index Fund Institutional Shares | 14,135,222 | 679,621 |
| International Stock Fund (35.9%) | ||
| Vanguard Total International Stock Index Fund Investor Shares | 31,785,491 | 451,990 |
| U.S. Bond Fund (6.9%) | ||
| 1 Vanguard Total Bond Market II Index Fund Investor Shares | 8,127,652 | 87,453 |
| International Bond Fund (3.0%) | ||
| Vanguard Total International Bond Index Fund Admiral Shares | 1,760,756 | 37,205 |
| Total Investment Companies (Cost $1,334,582) | 1,256,269 | |
| Temporary Cash Investment (0.1%) | ||
| Money Market Fund (0.1%) | ||
| 1 Vanguard Market Liquidity Fund, 0.189% (Cost $734) | 733,561 | 734 |
| Total Investments (99.9%) (Cost $1,335,316) | 1,257,003 | |
| Other Assets and Liabilities (0.1%) | ||
| Other Assets | 84,948 | |
| Liabilities | (83,323) | |
| 1,625 | ||
| Net Assets (100%) | ||
| Applicable to 69,650,063 outstanding $.001 par value shares of | ||
| beneficial interest (unlimited authorization) | 1,258,628 | |
| Net Asset Value Per Share | $18.07 | |
44
| Institutional Target Retirement 2050 Fund | |
| Amount | |
| ($000) | |
| Statement of Assets and Liabilities | |
| Assets | |
| Investments in Affiliated Vanguard Funds, at Value | 1,257,003 |
| Receivables for Capital Shares Issued | 84,772 |
| Receivables for Accrued Income | 176 |
| Total Assets | 1,341,951 |
| Liabilities | |
| Payables for Investment Securities Purchased | 83,268 |
| Payables for Capital Shares Redeemed | 54 |
| Other Liabilities | 1 |
| Total Liabilities | 83,323 |
| Net Assets | 1,258,628 |
| At September 30, 2015, net assets consisted of: | |
| Amount | |
| ($000) | |
| Paid-in Capital | 1,331,822 |
| Undistributed Net Investment Income | 5,118 |
| Accumulated Net Realized Gains | 1 |
| Unrealized Appreciation (Depreciation) | (78,313) |
| Net Assets | 1,258,628 |
- See Note A in Notes to Financial Statements.
- Affiliated fund available only to Vanguard funds and certain trusts and accounts managed by Vanguard. Rate shown for Vanguard Market Liquidity Fund is the 7-day yield.
See accompanying Notes, which are an integral part of the Financial Statements.
45
| Institutional Target Retirement 2050 Fund | |
| Statement of Operations | |
| June 26, 20151 to | |
| September 30, 2015 | |
| ($000) | |
| Investment Income | |
| Income | |
| Income Distributions Received | 5,118 |
| Net Investment Income—Note B | 5,118 |
| Realized Net Gain (Loss) on Affiliated Investment Securities Sold | 1 |
| Change in Unrealized Appreciation (Depreciation) of Investment Securities | (78,313) |
| Net Increase (Decrease) in Net Assets Resulting from Operations | (73,194) |
| 1 Inception. | |
See accompanying Notes, which are an integral part of the Financial Statements.
46
| Institutional Target Retirement 2050 Fund | |
| Statement of Changes in Net Assets | |
| June 26, 20151 to | |
| September 30, 2015 | |
| ($000) | |
| Increase (Decrease) in Net Assets | |
| Operations | |
| Net Investment Income | 5,118 |
| Realized Net Gain (Loss) | 1 |
| Change in Unrealized Appreciation (Depreciation) | (78,313) |
| Net Increase (Decrease) in Net Assets Resulting from Operations | (73,194) |
| Distributions | |
| Net Investment Income | — |
| Realized Capital Gain | — |
| Total Distributions | — |
| Capital Share Transactions | |
| Issued | 1,341,784 |
| Issued in Lieu of Cash Distributions | — |
| Redeemed | (9,962) |
| Net Increase (Decrease) from Capital Share Transactions | 1,331,822 |
| Total Increase (Decrease) | 1,258,628 |
| Net Assets | |
| Beginning of Period | — |
| End of Period2 | 1,258,628 |
| 1 | Inception. |
| 2 | Net Assets—End of Period includes undistributed (overdistributed) net investment income of $5,118,000. |
See accompanying Notes, which are an integral part of the Financial Statements.
47
| Institutional Target Retirement 2050 Fund | |
| Financial Highlights | |
| June 26, 20151 to | |
| For a Share Outstanding Throughout the Period | September 30, 2015 |
| Net Asset Value, Beginning of Period | $20.00 |
| Investment Operations | |
| Net Investment Income | .1492 |
| Capital Gain Distributions Received | — |
| Net Realized and Unrealized Gain (Loss) on Investments | (2.079) |
| Total from Investment Operations | (1.930) |
| Distributions | |
| Dividends from Net Investment Income | — |
| Distributions from Realized Capital Gains | — |
| Total Distributions | — |
| Net Asset Value, End of Period | $18.07 |
| Total Return | -9.65% |
| Ratios/Supplemental Data | |
| Net Assets, End of Period (Millions) | $1,259 |
| Ratio of Total Expenses to Average Net Assets | — |
| Acquired Fund Fees and Expenses | 0.10%3 |
| Ratio of Net Investment Income to Average Net Assets | 2.81%3 |
| Portfolio Turnover Rate | 1% |
| 1 | Inception. |
| 2 | Calculated based on average shares outstanding. |
| 3 | Annualized. |
See accompanying Notes, which are an integral part of the Financial Statements.
48
Institutional Target Retirement 2050 Fund
Notes to Financial Statements
Vanguard Institutional Target Retirement 2050 Fund is registered under the Investment Company Act of 1940 as an open-end investment company, or mutual fund. The fund follows a balanced investment strategy by investing in selected Vanguard funds to achieve its targeted allocation of assets to U.S. and international stocks, and U.S. and international bonds. Financial statements and other information about each underlying fund are available on vanguard.com.
A. The following significant accounting policies conform to generally accepted accounting principles for U.S. investment companies. The fund consistently follows such policies in preparing its financial statements.
1. Security Valuation: Investments are valued at the net asset value of each underlying Vanguard fund determined as of the close of the New York Stock Exchange (generally 4 p.m., Eastern time) on the valuation date.
2. Federal Income Taxes: The fund intends to qualify as a regulated investment company and distribute all of its taxable income. Management has analyzed the fund’s tax positions taken for its open federal income tax period ended September 30, 2015, and has concluded that no provision for federal income tax is required in the fund’s financial statements.
3. Distributions: Distributions to shareholders are recorded on the ex-dividend date.
4. Other: Income and capital gain distributions received are recorded on the ex-dividend date. Security transactions are accounted for on the date securities are bought or sold. Costs used to determine realized gains (losses) on the sale of investment securities are those of the specific securities sold.
B. In accordance with the terms of a Funds’ Service Agreement (the “FSA”) between Vanguard and the fund, Vanguard furnishes to the fund investment advisory, corporate management, administrative, marketing, and distribution services at Vanguard’s cost of operations (as defined by the FSA). These costs of operations are allocated to the fund based on methods and guidelines approved by the board of trustees. The FSA provides that expenses otherwise allocable to Vanguard funds-of-funds may be reduced or eliminated to the extent of savings realized by the underlying Vanguard funds by virtue of being part of a fund-of-funds. Accordingly, all expenses for services provided by Vanguard to the fund and all other expenses incurred by the fund during the period ended September 30, 2015, were borne by the underlying Vanguard funds in which the fund invests. The fund’s trustees and officers are also trustees and officers, respectively, of the underlying Vanguard funds, as well as directors and employees, respectively, of Vanguard.
C. Various inputs may be used to determine the value of the fund’s investments. These inputs are summarized in three broad levels for financial statement purposes. The inputs or methodologies used to value securities are not necessarily an indication of the risk associated with investing in those securities.
Level 1—Quoted prices in active markets for identical securities.
Level 2—Other significant observable inputs (including quoted prices for similar securities, interest rates, prepayment speeds, credit risk, etc.).
Level 3—Significant unobservable inputs (including the fund’s own assumptions used to determine the fair value of investments).
At September 30, 2015, 100% of the market value of the fund’s investments was determined based on Level 1 inputs.
49
Institutional Target Retirement 2050 Fund
D. Distributions are determined on a tax basis and may differ from net investment income and realized capital gains for financial reporting purposes. Differences may be permanent or temporary. Permanent differences are reclassified among capital accounts in the financial statements to reflect their tax character. Temporary differences arise when certain items of income, expense, gain, or loss are recognized in different periods for financial statement and tax purposes. These differences will reverse at some time in the future. Differences in classification may also result from the treatment of short-term gains as ordinary income for tax purposes.
For tax purposes, at September 30, 2015, the fund had $5,119,000 of ordinary income available for distribution.
At September 30, 2015, the cost of investment securities for tax purposes was $1,335,316,000. Net unrealized depreciation of investment securities for tax purposes was $78,313,000, consisting of unrealized gains of $665,000 on securities that had risen in value since their purchase and $78,978,000 in unrealized losses on securities that had fallen in value since their purchase.
E. Capital shares issued and redeemed were:
| June 26, 20151 to | |
| September 30, 2015 | |
| Shares | |
| (000) | |
| Issued | 70,183 |
| Issued in Lieu of Cash Distributions | — |
| Redeemed | (533) |
| Net Increase (Decrease) in Shares Outstanding | 69,650 |
| 1 Inception. |
F. Transactions during the period in affiliated underlying Vanguard funds were as follows:
| Current Period Transactions | ||||||
| June 26, | Proceeds | Sept. 30, | ||||
| 20151 | from | Capital Gain | 2015 | |||
| Market | Purchases | Securities | Distributions | Market | ||
| Value | at Cost | Sold | Income | Received | Value | |
| ($000) | ($000) | ($000) | ($000) | ($000) | ($000) | |
| Vanguard Market Liquidity Fund | — | NA2 | NA 2 | — | — | 734 |
| Vanguard Total Bond Market II | ||||||
| Index Fund | — | 87,879 | 903 | 284 | — | 87,453 |
| Vanguard Total International Bond | ||||||
| Index Fund | — | 37,016 | — | 87 | — | 37,205 |
| Vanguard Total International Stock | ||||||
| Index Fund | — | 490,214 | 534 | 1,866 | — | 451,990 |
| Vanguard Total Stock Market | ||||||
| Index Fund | — | 723,276 | 2,367 | 2,881 | — | 679,621 |
| Total | — | 1,338,385 | 3,804 | 5,118 | — | 1,257,003 |
| 1 Inception. | ||||||
| 2 Not applicable—purchases and sales are for temporary cash investment purposes. | ||||||
50
Institutional Target Retirement 2050 Fund
G. Certain funds managed by The Vanguard Group participate in a $3 billion committed credit facility provided by a syndicate of lenders pursuant to a credit agreement that may be renewed annually; each fund is individually liable for its borrowings, if any, under the credit facility. In October 2015, this credit agreement was amended to designate the fund as an additional borrower. Borrowings may be utilized for temporary and emergency purposes, and are subject to the fund’s regulatory and contractual borrowing restrictions. The participating funds are charged administrative fees and an annual commitment fee of 0.06% of the undrawn amount of the facility; these fees are allocated to the funds based on a method approved by the fund’s board of trustees. Any borrowings under this facility bear interest at a rate equal to the higher of the federal funds rate or LIBOR reference rate plus an agreed-upon spread.
Management has determined that no other transactions occurred subsequent to September 30, 2015, that would require recognition or disclosure in these financial statements.
51
Institutional Target Retirement 2055 Fund
Fund Profile
As of September 30, 2015
| Total Fund Characteristics | |
| Ticker Symbol | VIVLX |
| 30-Day SEC Yield | 2.38% |
| Acquired Fund Fees and Expenses1 | 0.10% |
| Allocation to Underlying Vanguard Funds | |
| Vanguard Total Stock Market Index Fund | |
| Institutional Shares | 54.0% |
| Vanguard Total International Stock Index | |
| Fund Investor Shares | 36.0 |
| Vanguard Total Bond Market II Index Fund | |
| Investor Shares | 7.0 |
| Vanguard Total International Bond Index | |
| Fund Admiral Shares | 3.0 |
1 This figure—drawn from the prospectus dated June 26, 2015—represents an estimate of the weighted average of the expense ratios and any transaction fees charged by the underlying mutual funds (the ”acquired” funds) in which the Institutional Target Retirement 2055 Fund invests. The fund does not charge any expenses or fees of its own. For the period from inception through September 30, 2015, the annualized acquired fund fees and expenses were 0.10%.
52
Institutional Target Retirement 2055 Fund
Performance Summary
All of the returns in this report represent past performance, which is not a guarantee of future results that may be achieved by the fund. (Current performance may be lower or higher than the performance data cited. For performance data current to the most recent month-end, visit our website at vanguard.com/performance.) Note, too, that both investment returns and principal value can fluctuate widely, so an investor’s shares, when sold, could be worth more or less than their original cost. The returns shown do not reflect taxes that a shareholder would pay on fund distributions or on the sale of fund shares.
| Cumulative Performance: June 26, 2015, Through September 30, 2015 | ||
| Initial Investment of $100,000,000 | ||
| Total Returns | ||
| Period Ended September 30, 2015 | ||
| Since | Final Value | |
| Inception | of a $100,000,000 | |
| (6/26/2015) | Investment | |
| Institutional Target Retirement 2055 Fund | -9.60% | $90,400,000 |
| Target 2055 Composite Index | -9.60 | 90,402,843 |
| Mixed-Asset Target 2055+ Funds Average | -9.72 | 90,277,069 |
| MSCI US Broad Market Index | -8.94 | 91,061,036 |
For a benchmark description, see the Glossary.
Mixed-Asset Target 2055+ Funds Average: Derived from data provided by Lipper, a Thomson Reuters Company.
"Since Inception" performance is calculated from the fund's inception date for both the fund and its comparative standards.
See Financial Highlights for dividend and capital gains information.
53
Institutional Target Retirement 2055 Fund
Fiscal-Period Total Returns (%): June 26, 2015, Through September 30, 2015
54
Institutional Target Retirement 2055 Fund
Financial Statements
Statement of Net Assets
As of September 30, 2015
The fund reports a complete list of its holdings in regulatory filings four times in each fiscal year, at the quarter-ends. For the second and fourth fiscal quarters, the lists appear in the fund’s semiannual and annual reports to shareholders. For the first and third fiscal quarters, the fund files the lists with the Securities and Exchange Commission on Form N-Q. Shareholders can look up the fund’s Forms N-Q on the SEC’s website at sec.gov. Forms N-Q may also be reviewed and copied at the SEC’s Public Reference Room (see the back cover of this report for further information).
| Market | ||
| Value | ||
| Shares | ($000) | |
| Investment Companies (99.8%) | ||
| U.S. Stock Fund (54.0%) | ||
| Vanguard Total Stock Market Index Fund Institutional Shares | 4,186,432 | 201,284 |
| International Stock Fund (35.9%) | ||
| Vanguard Total International Stock Index Fund Investor Shares | 9,415,903 | 133,894 |
| U.S. Bond Fund (6.9%) | ||
| 1 Vanguard Total Bond Market II Index Fund Investor Shares | 2,408,854 | 25,919 |
| International Bond Fund (3.0%) | ||
| Vanguard Total International Bond Index Fund Admiral Shares | 524,325 | 11,079 |
| Total Investment Companies (99.8%) (Cost $393,510) | 372,176 | |
| Other Assets and Liabilities (0.2%) | ||
| Other Assets | 24,528 | |
| Liabilities | (23,670) | |
| 858 | ||
| Net Assets (100%) | ||
| Applicable to 20,637,601 outstanding $.001 par value shares of | ||
| beneficial interest (unlimited authorization) | 373,034 | |
| Net Asset Value Per Share | $18.08 | |
55
| Institutional Target Retirement 2055 Fund | |
| Amount | |
| ($000) | |
| Statement of Assets and Liabilities | |
| Assets | |
| Investments in Affiliated Vanguard Funds, at Value | 372,176 |
| Receivables for Capital Shares Issued | 24,476 |
| Receivables for Accrued Income | 52 |
| Total Assets | 396,704 |
| Liabilities | |
| Payables for Investment Securities Purchased | 23,608 |
| Payables for Capital Shares Redeemed | 20 |
| Other Liabilities | 42 |
| Total Liabilities | 23,670 |
| Net Assets | 373,034 |
| At September 30, 2015, net assets consisted of: | |
| Amount | |
| ($000) | |
| Paid-in Capital | 392,849 |
| Undistributed Net Investment Income | 1,519 |
| Accumulated Net Realized Gains | — |
| Unrealized Appreciation (Depreciation) | (21,334) |
| Net Assets | 373,034 |
- See Note A in Notes to Financial Statements.
- Affiliated fund available only to Vanguard funds and certain trusts and accounts managed by Vanguard. See accompanying Notes, which are an integral part of the Financial Statements.
56
| Institutional Target Retirement 2055 Fund | |
| Statement of Operations | |
| June 26, 20151 to | |
| September 30, 2015 | |
| ($000) | |
| Investment Income | |
| Income | |
| Income Distributions Received | 1,519 |
| Net Investment Income—Note B | 1,519 |
| Realized Net Gain (Loss) on Affiliated Investment Securities Sold | — |
| Change in Unrealized Appreciation (Depreciation) of Investment Securities | (21,334) |
| Net Increase (Decrease) in Net Assets Resulting from Operations | (19,815) |
| 1 Inception. | |
See accompanying Notes, which are an integral part of the Financial Statements.
57
| Institutional Target Retirement 2055 Fund | |
| Statement of Changes in Net Assets | |
| June 26, 20151 to | |
| September 30, 2015 | |
| ($000) | |
| Increase (Decrease) in Net Assets | |
| Operations | |
| Net Investment Income | 1,519 |
| Realized Net Gain (Loss) | — |
| Change in Unrealized Appreciation (Depreciation) | (21,334) |
| Net Increase (Decrease) in Net Assets Resulting from Operations | (19,815) |
| Distributions | |
| Net Investment Income | — |
| Realized Capital Gain | — |
| Total Distributions | — |
| Capital Share Transactions | |
| Issued | 396,960 |
| Issued in Lieu of Cash Distributions | — |
| Redeemed | (4,111) |
| Net Increase (Decrease) from Capital Share Transactions | 392,849 |
| Total Increase (Decrease) | 373,034 |
| Net Assets | |
| Beginning of Period | — |
| End of Period2 | 373,034 |
| 1 | Inception. |
| 2 | Net Assets—End of Period includes undistributed (overdistributed) net investment income of $1,519,000. |
See accompanying Notes, which are an integral part of the Financial Statements.
58
| Institutional Target Retirement 2055 Fund | |
| Financial Highlights | |
| June 26, 20151 to | |
| For a Share Outstanding Throughout the Period | September 30, 2015 |
| Net Asset Value, Beginning of Period | $20.00 |
| Investment Operations | |
| Net Investment Income | .1572 |
| Capital Gain Distributions Received | — |
| Net Realized and Unrealized Gain (Loss) on Investments | (2.077) |
| Total from Investment Operations | (1.920) |
| Distributions | |
| Dividends from Net Investment Income | — |
| Distributions from Realized Capital Gains | — |
| Total Distributions | — |
| Net Asset Value, End of Period | $18.08 |
| Total Return | -9.60% |
| Ratios/Supplemental Data | |
| Net Assets, End of Period (Millions) | $373 |
| Ratio of Total Expenses to Average Net Assets | — |
| Acquired Fund Fees and Expenses | 0.10%3 |
| Ratio of Net Investment Income to Average Net Assets | 3.05%3 |
| Portfolio Turnover Rate | 1% |
| 1 | Inception. |
| 2 | Calculated based on average shares outstanding. |
| 3 | Annualized. |
See accompanying Notes, which are an integral part of the Financial Statements.
59
Institutional Target Retirement 2055 Fund
Notes to Financial Statements
Vanguard Institutional Target Retirement 2055 Fund is registered under the Investment Company Act of 1940 as an open-end investment company, or mutual fund. The fund follows a balanced investment strategy by investing in selected Vanguard funds to achieve its targeted allocation of assets to U.S. and international stocks, and U.S. and international bonds. Financial statements and other information about each underlying fund are available on vanguard.com.
A. The following significant accounting policies conform to generally accepted accounting principles for U.S. investment companies. The fund consistently follows such policies in preparing its financial statements.
1. Security Valuation: Investments are valued at the net asset value of each underlying Vanguard fund determined as of the close of the New York Stock Exchange (generally 4 p.m., Eastern time) on the valuation date.
2. Federal Income Taxes: The fund intends to qualify as a regulated investment company and distribute all of its taxable income. Management has analyzed the fund’s tax positions taken for its open federal income tax period ended September 30, 2015, and has concluded that no provision for federal income tax is required in the fund’s financial statements.
3. Distributions: Distributions to shareholders are recorded on the ex-dividend date.
4. Other: Income and capital gain distributions received are recorded on the ex-dividend date. Security transactions are accounted for on the date securities are bought or sold. Costs used to determine realized gains (losses) on the sale of investment securities are those of the specific securities sold.
B. In accordance with the terms of a Funds’ Service Agreement (the “FSA”) between Vanguard and the fund, Vanguard furnishes to the fund investment advisory, corporate management, administrative, marketing, and distribution services at Vanguard’s cost of operations (as defined by the FSA). These costs of operations are allocated to the fund based on methods and guidelines approved by the board of trustees. The FSA provides that expenses otherwise allocable to Vanguard funds-of-funds may be reduced or eliminated to the extent of savings realized by the underlying Vanguard funds by virtue of being part of a fund-of-funds. Accordingly, all expenses for services provided by Vanguard to the fund and all other expenses incurred by the fund during the period ended September 30, 2015, were borne by the underlying Vanguard funds in which the fund invests. The fund’s trustees and officers are also trustees and officers, respectively, of the underlying Vanguard funds, as well as directors and employees, respectively, of Vanguard.
C. Various inputs may be used to determine the value of the fund’s investments. These inputs are summarized in three broad levels for financial statement purposes. The inputs or methodologies used to value securities are not necessarily an indication of the risk associated with investing in those securities.
Level 1—Quoted prices in active markets for identical securities.
Level 2—Other significant observable inputs (including quoted prices for similar securities, interest rates, prepayment speeds, credit risk, etc.).
Level 3—Significant unobservable inputs (including the fund’s own assumptions used to determine the fair value of investments).
At September 30, 2015, 100% of the market value of the fund’s investments was determined based on Level 1 inputs.
60
Institutional Target Retirement 2055 Fund
D. Distributions are determined on a tax basis and may differ from net investment income and realized capital gains for financial reporting purposes. Differences may be permanent or temporary. Permanent differences are reclassified among capital accounts in the financial statements to reflect their tax character. Temporary differences arise when certain items of income, expense, gain, or loss are recognized in different periods for financial statement and tax purposes. These differences will reverse at some time in the future. Differences in classification may also result from the treatment of short-term gains as ordinary income for tax purposes.
For tax purposes, at September 30, 2015, the fund had $1,539,000 of ordinary income available for distribution.
At September 30, 2015, the cost of investment securities for tax purposes was $393,530,000. Net unrealized depreciation of investment securities for tax purposes was $21,354,000, consisting of unrealized gains of $192,000 on securities that had risen in value since their purchase and $21,546,000 in unrealized losses on securities that had fallen in value since their purchase.
E. Capital shares issued and redeemed were:
| June 26, 20151 to | |
| September 30, 2015 | |
| Shares | |
| (000) | |
| Issued | 20,856 |
| Issued in Lieu of Cash Distributions | — |
| Redeemed | (218) |
| Net Increase (Decrease) in Shares Outstanding | 20,638 |
| 1 Inception. |
F. Transactions during the period in affiliated underlying Vanguard funds were as follows:
| Current Period Transactions | ||||||
| June 26, | Proceeds | Sept. 30, | ||||
| 20151 | from | Capital Gain | 2015 | |||
| Market | Purchases | Securities | Distributions | Market | ||
| Value | at Cost | Sold | Income | Received | Value | |
| ($000) | ($000) | ($000) | ($000) | ($000) | ($000) | |
| Vanguard Total Bond Market II | ||||||
| Index Fund | — | 26,235 | 454 | 78 | — | 25,919 |
| Vanguard Total International Bond | ||||||
| Index Fund | — | 11,226 | 201 | 24 | — | 11,079 |
| Vanguard Total International Stock | ||||||
| Index Fund | — | 144,862 | 717 | 557 | — | 133,894 |
| Vanguard Total Stock Market | ||||||
| Index Fund | — | 213,147 | 588 | 860 | — | 201,284 |
| Total | — | 395,470 | 1,960 | 1,519 | — | 372,176 |
| 1 Inception. | ||||||
61
Institutional Target Retirement 2055 Fund
G. Certain funds managed by The Vanguard Group participate in a $3 billion committed credit facility provided by a syndicate of lenders pursuant to a credit agreement that may be renewed annually; each fund is individually liable for its borrowings, if any, under the credit facility. In October 2015, this credit agreement was amended to designate the fund as an additional borrower. Borrowings may be utilized for temporary and emergency purposes, and are subject to the fund’s regulatory and contractual borrowing restrictions. The participating funds are charged administrative fees and an annual commitment fee of 0.06% of the undrawn amount of the facility; these fees are allocated to the funds based on a method approved by the fund’s board of trustees. Any borrowings under this facility bear interest at a rate equal to the higher of the federal funds rate or LIBOR reference rate plus an agreed-upon spread.
Management has determined that no other transactions occurred subsequent to September 30, 2015, that would require recognition or disclosure in these financial statements.
62
Institutional Target Retirement 2060 Fund
Fund Profile
As of September 30, 2015
| Total Fund Characteristics | |
| Ticker Symbol | VILVX |
| 30-Day SEC Yield | 2.38% |
| Acquired Fund Fees and Expenses1 | 0.10% |
| Allocation to Underlying Vanguard Funds | |
| Vanguard Total Stock Market Index Fund | |
| Institutional Shares | 54.0% |
| Vanguard Total International Stock Index | |
| Fund Investor Shares | 36.0 |
| Vanguard Total Bond Market II Index Fund | |
| Investor Shares | 7.0 |
| Vanguard Total International Bond Index | |
| Fund Admiral Shares | 3.0 |
1 This figure—drawn from the prospectus dated June 26, 2015—represents an estimate of the weighted average of the expense ratios and any transaction fees charged by the underlying mutual funds (the ”acquired” funds) in which the Institutional Target Retirement 2060 Fund invests. The fund does not charge any expenses or fees of its own. For the period from inception through September 30, 2015, the annualized acquired fund fees and expenses were 0.10%.
63
Institutional Target Retirement 2060 Fund
Performance Summary
All of the returns in this report represent past performance, which is not a guarantee of future results that may be achieved by the fund. (Current performance may be lower or higher than the performance data cited. For performance data current to the most recent month-end, visit our website at vanguard.com/performance.) Note, too, that both investment returns and principal value can fluctuate widely, so an investor’s shares, when sold, could be worth more or less than their original cost. The returns shown do not reflect taxes that a shareholder would pay on fund distributions or on the sale of fund shares.
| Cumulative Performance: June 26, 2015, Through September 30, 2015 | ||
| Initial Investment of $100,000,000 | ||
| Total Returns | ||
| Period Ended September 30, 2015 | ||
| Since | Final Value | |
| Inception | of a $100,000,000 | |
| (6/26/2015) | Investment | |
| Institutional Target Retirement 2060 Fund | -9.65% | $90,350,000 |
| Target 2060 Composite Index | -9.60 | 90,402,843 |
| Mixed-Asset Target 2055+ Funds Average | -9.72 | 90,277,069 |
| MSCI US Broad Market Index | -8.94 | 91,061,036 |
For a benchmark description, see the Glossary.
Mixed-Asset Target 2055+ Funds Average: Derived from data provided by Lipper, a Thomson Reuters Company.
"Since Inception" performance is calculated from the fund's inception date for both the fund and its comparative standards.
See Financial Highlights for dividend and capital gains information.
64
Institutional Target Retirement 2060 Fund
Fiscal-Period Total Returns (%): June 26, 2015, Through September 30, 2015
65
Institutional Target Retirement 2060 Fund
Financial Statements
Statement of Net Assets
As of September 30, 2015
The fund reports a complete list of its holdings in regulatory filings four times in each fiscal year, at the quarter-ends. For the second and fourth fiscal quarters, the lists appear in the fund’s semiannual and annual reports to shareholders. For the first and third fiscal quarters, the fund files the lists with the Securities and Exchange Commission on Form N-Q. Shareholders can look up the fund’s Forms N-Q on the SEC’s website at sec.gov. Forms N-Q may also be reviewed and copied at the SEC’s Public Reference Room (see the back cover of this report for further information).
| Market | ||
| Value | ||
| Shares | ($000) | |
| Investment Companies (99.9%) | ||
| U.S. Stock Fund (54.0%) | ||
| Vanguard Total Stock Market Index Fund Institutional Shares | 1,064,698 | 51,191 |
| International Stock Fund (35.9%) | ||
| Vanguard Total International Stock Index Fund Investor Shares | 2,395,170 | 34,059 |
| U.S. Bond Fund (7.0%) | ||
| 1 Vanguard Total Bond Market II Index Fund Investor Shares | 613,017 | 6,596 |
| International Bond Fund (3.0%) | ||
| Vanguard Total International Bond Index Fund Admiral Shares | 133,258 | 2,816 |
| Total Investment Companies (Cost $101,167) | 94,662 | |
| Temporary Cash Investment (0.1%) | ||
| Money Market Fund (0.1%) | ||
| 1 Vanguard Market Liquidity Fund, 0.189% (Cost $133) | 133,000 | 133 |
| Total Investments (100.0%) (Cost $101,300) | 94,795 | |
| Amount | ||
| ($000) | ||
| Other Assets and Liabilities (0.0%) | ||
| Other Assets | ||
| Receivables for Accrued Income | 13 | |
| Receivables for Capital Shares Issued | 3,617 | |
| Total Other Assets | 3,630 | |
| Liabilities | ||
| Payables for Investment Securities Purchased | (3,648) | |
| Payables for Capital Shares Redeemed | (8) | |
| Total Liabilities | (3,656) | |
| Net Assets (100%) | ||
| Applicable to 5,244,492 outstanding $.001 par value shares of | ||
| beneficial interest (unlimited authorization) | 94,769 | |
| Net Asset Value Per Share | $18.07 | |
66
| Institutional Target Retirement 2060 Fund | |
| At September 30, 2015, net assets consisted of: | |
| Amount | |
| ($000) | |
| Paid-in Capital | 100,882 |
| Undistributed Net Investment Income | 393 |
| Accumulated Net Realized Losses | (1) |
| Unrealized Appreciation (Depreciation) | (6,505) |
| Net Assets | 94,769 |
- See Note A in Notes to Financial Statements.
- Affiliated fund available only to Vanguard funds and certain trusts and accounts managed by Vanguard. Rate shown for Vanguard Market Liquidity Fund is the 7-day yield.
See accompanying Notes, which are an integral part of the Financial Statements.
67
| Institutional Target Retirement 2060 Fund | |
| Statement of Operations | |
| June 26, 20151 to | |
| September 30, 2015 | |
| ($000) | |
| Investment Income | |
| Income | |
| Income Distributions Received | 393 |
| Net Investment Income—Note B | 393 |
| Realized Net Gain (Loss) on Affiliated Investment Securities Sold | (1) |
| Change in Unrealized Appreciation (Depreciation) of Investment Securities | (6,505) |
| Net Increase (Decrease) in Net Assets Resulting from Operations | (6,113) |
| 1 Inception. | |
See accompanying Notes, which are an integral part of the Financial Statements.
68
| Institutional Target Retirement 2060 Fund | |
| Statement of Changes in Net Assets | |
| June 26, 20151 to | |
| September 30, 2015 | |
| ($000) | |
| Increase (Decrease) in Net Assets | |
| Operations | |
| Net Investment Income | 393 |
| Realized Net Gain (Loss) | (1) |
| Change in Unrealized Appreciation (Depreciation) | (6,505) |
| Net Increase (Decrease) in Net Assets Resulting from Operations | (6,113) |
| Distributions | |
| Net Investment Income | — |
| Realized Capital Gain | — |
| Total Distributions | — |
| Capital Share Transactions | |
| Issued | 103,763 |
| Issued in Lieu of Cash Distributions | — |
| Redeemed | (2,881) |
| Net Increase (Decrease) from Capital Share Transactions | 100,882 |
| Total Increase (Decrease) | 94,769 |
| Net Assets | |
| Beginning of Period | — |
| End of Period2 | 94,769 |
| 1 | Inception. |
| 2 | Net Assets—End of Period includes undistributed (overdistributed) net investment income of $393,000. |
See accompanying Notes, which are an integral part of the Financial Statements.
69
| Institutional Target Retirement 2060 Fund | |
| Financial Highlights | |
| June 26, 20151 to | |
| For a Share Outstanding Throughout the Period | September 30, 2015 |
| Net Asset Value, Beginning of Period | $20.00 |
| Investment Operations | |
| Net Investment Income | .1352 |
| Capital Gain Distributions Received | — |
| Net Realized and Unrealized Gain (Loss) on Investments | (2.065) |
| Total from Investment Operations | (1.930) |
| Distributions | |
| Dividends from Net Investment Income | — |
| Distributions from Realized Capital Gains | — |
| Total Distributions | — |
| Net Asset Value, End of Period | $18.07 |
| Total Return | -9.65% |
| Ratios/Supplemental Data | |
| Net Assets, End of Period (Millions) | $95 |
| Ratio of Total Expenses to Average Net Assets | — |
| Acquired Fund Fees and Expenses | 0.10%3 |
| Ratio of Net Investment Income to Average Net Assets | 2.53%3 |
| Portfolio Turnover Rate | 4% |
| 1 | Inception. |
| 2 | Calculated based on average shares outstanding. |
| 3 | Annualized. |
See accompanying Notes, which are an integral part of the Financial Statements.
70
Institutional Target Retirement 2060 Fund
Notes to Financial Statements
Vanguard Institutional Target Retirement 2060 Fund is registered under the Investment Company Act of 1940 as an open-end investment company, or mutual fund. The fund follows a balanced investment strategy by investing in selected Vanguard funds to achieve its targeted allocation of assets to U.S. and international stocks, and U.S. and international bonds. Financial statements and other information about each underlying fund are available on vanguard.com.
A. The following significant accounting policies conform to generally accepted accounting principles for U.S. investment companies. The fund consistently follows such policies in preparing its financial statements.
1. Security Valuation: Investments are valued at the net asset value of each underlying Vanguard fund determined as of the close of the New York Stock Exchange (generally 4 p.m., Eastern time) on the valuation date.
2. Federal Income Taxes: The fund intends to qualify as a regulated investment company and distribute all of its taxable income. Management has analyzed the fund’s tax positions taken for its open federal income tax period ended September 30, 2015, and has concluded that no provision for federal income tax is required in the fund’s financial statements.
3. Distributions: Distributions to shareholders are recorded on the ex-dividend date.
4. Other: Income and capital gain distributions received are recorded on the ex-dividend date. Security transactions are accounted for on the date securities are bought or sold. Costs used to determine realized gains (losses) on the sale of investment securities are those of the specific securities sold.
B. In accordance with the terms of a Funds’ Service Agreement (the “FSA”) between Vanguard and the fund, Vanguard furnishes to the fund investment advisory, corporate management, administrative, marketing, and distribution services at Vanguard’s cost of operations (as defined by the FSA). These costs of operations are allocated to the fund based on methods and guidelines approved by the board of trustees. The FSA provides that expenses otherwise allocable to Vanguard funds-of-funds may be reduced or eliminated to the extent of savings realized by the underlying Vanguard funds by virtue of being part of a fund-of-funds. Accordingly, all expenses for services provided by Vanguard to the fund and all other expenses incurred by the fund during the period ended September 30, 2015, were borne by the underlying Vanguard funds in which the fund invests. The fund’s trustees and officers are also trustees and officers, respectively, of the underlying Vanguard funds, as well as directors and employees, respectively, of Vanguard.
C. Various inputs may be used to determine the value of the fund’s investments. These inputs are summarized in three broad levels for financial statement purposes. The inputs or methodologies used to value securities are not necessarily an indication of the risk associated with investing in those securities.
Level 1—Quoted prices in active markets for identical securities.
Level 2—Other significant observable inputs (including quoted prices for similar securities, interest rates, prepayment speeds, credit risk, etc.).
Level 3—Significant unobservable inputs (including the fund’s own assumptions used to determine the fair value of investments).
At September 30, 2015, 100% of the market value of the fund’s investments was determined based on Level 1 inputs.
71
Institutional Target Retirement 2060 Fund
D. Distributions are determined on a tax basis and may differ from net investment income and realized capital gains for financial reporting purposes. Differences may be permanent or temporary. Permanent differences are reclassified among capital accounts in the financial statements to reflect their tax character. Temporary differences arise when certain items of income, expense, gain, or loss are recognized in different periods for financial statement and tax purposes. These differences will reverse at some time in the future. Differences in classification may also result from the treatment of short-term gains as ordinary income for tax purposes.
For tax purposes, at September 30, 2015, the fund had $400,000 of ordinary income available for distribution.
At September 30, 2015, the cost of investment securities for tax purposes was $101,308,000.
Net unrealized depreciation of investment securities for tax purposes was $6,513,000, consisting of unrealized gains of $61,000 on securities that had risen in value since their purchase and $6,574,000 in unrealized losses on securities that had fallen in value since their purchase.
E. Capital shares issued and redeemed were:
| June 26, 20151 to | |
| September 30, 2015 | |
| Shares | |
| (000) | |
| Issued | 5,395 |
| Issued in Lieu of Cash Distributions | — |
| Redeemed | (151) |
| Net Increase (Decrease) in Shares Outstanding | 5,244 |
| 1 Inception. |
F. Transactions during the period in affiliated underlying Vanguard funds were as follows:
| Current Period Transactions | ||||||
| June 26, | Proceeds | Sept. 30, | ||||
| 20151 | from | Capital Gain | 2015 | |||
| Market | Purchases | Securities | Distributions | Market | ||
| Value | at Cost | Sold | Income | Received | Value | |
| ($000) | ($000) | ($000) | ($000) | ($000) | ($000) | |
| Vanguard Market Liquidity Fund | — | NA2 | NA 2 | — | — | 133 |
| Vanguard Total Bond Market II | ||||||
| Index Fund | — | 6,947 | 394 | 24 | — | 6,596 |
| Vanguard Total International Bond | ||||||
| Index Fund | — | 2,962 | 165 | 8 | — | 2,816 |
| Vanguard Total International Stock | ||||||
| Index Fund | — | 37,732 | 501 | 142 | — | 34,059 |
| Vanguard Total Stock Market | ||||||
| Index Fund | — | 55,686 | 1,099 | 219 | — | 51,191 |
| Total | — | 103,327 | 2,159 | 393 | — | 94,795 |
| 1 Inception. | ||||||
| 2 Not applicable—purchases and sales are for temporary cash investment purposes. | ||||||
72
Institutional Target Retirement 2060 Fund
G. Certain funds managed by The Vanguard Group participate in a $3 billion committed credit facility provided by a syndicate of lenders pursuant to a credit agreement that may be renewed annually; each fund is individually liable for its borrowings, if any, under the credit facility. In October 2015, this credit agreement was amended to designate the fund as an additional borrower. Borrowings may be utilized for temporary and emergency purposes, and are subject to the fund’s regulatory and contractual borrowing restrictions. The participating funds are charged administrative fees and an annual commitment fee of 0.06% of the undrawn amount of the facility; these fees are allocated to the funds based on a method approved by the fund’s board of trustees. Any borrowings under this facility bear interest at a rate equal to the higher of the federal funds rate or LIBOR reference rate plus an agreed-upon spread.
Management has determined that no other transactions occurred subsequent to September 30, 2015, that would require recognition or disclosure in these financial statements.
73
Report of Independent Registered Public Accounting Firm
To the Board of Trustees of Vanguard Chester Funds and the Shareholders of Vanguard Institutional Target Retirement 2035 Fund, Vanguard Institutional Target Retirement 2040 Fund, Vanguard Institutional Target Retirement 2045 Fund, Vanguard Institutional Target Retirement 2050 Fund, Vanguard Institutional Target Retirement 2055 Fund and Vanguard Institutional Target Retirement 2060 Fund:
In our opinion, the accompanying statements of net assets, statements of assets and liabilities, and the related statements of operations and of changes in net assets and the financial highlights present fairly, in all material respects, the financial position of Vanguard Institutional Target Retirement 2035 Fund, Vanguard Institutional Target Retirement 2040 Fund, Vanguard Institutional Target Retirement 2045 Fund, Vanguard Institutional Target Retirement 2050 Fund, Vanguard Institutional Target Retirement 2055 Fund and Vanguard Institutional Target Retirement 2060 Fund (constituting separate portfolios of Vanguard Chester Funds, hereafter referred to as the “Funds”) at September 30, 2015, and the results of each of their operations, the changes in each of their net assets, and the financial highlights for the period June 26, 2015 (commencement of operations) through September 30, 2015, in conformity with accounting principles generally accepted in the United States of America. These financial statements and financial highlights (hereafter referred to as “financial statements”) are the responsibility of the Funds’ management. Our responsibility is to express an opinion on these financial statements based on our audits. We conducted our audits of these financial statements in accordance with the standards of the Public Company Accounting Oversight Board (United States). Those standards require that we plan and perform the audit to obtain reasonable assurance about whether the financial statements are free of material misstatement. An audit includes examining, on a test basis, evidence supporting the amounts and disclosures in the financial statements, assessing the accounting principles used and significant estimates made by management, and evaluating the overall financial statement presentation. We believe that our audits, which included confirmation of securities at September 30, 2015 by agreement to the underlying ownership records of the transfer agent, provide a reasonable basis for our opinion.
/s/PricewaterhouseCoopers LLP
Philadelphia, Pennsylvania
November 16, 2015
74
Special 2015 tax information (unaudited) for Vanguard Institutional Target Retirement Funds
This information for the period ended September 30, 2015, is included pursuant to provisions of the Internal Revenue Code.
For corporate shareholders, the percentage of investment income (dividend income plus short-term gains, if any) that qualifies for the dividends-received deduction is as follows:
| Fund | Percentage |
| Institutional Target Retirement 2035 Fund | 48.4% |
| Institutional Target Retirement 2040 Fund | 51.0 |
| Institutional Target Retirement 2045 Fund | 52.1 |
| Institutional Target Retirement 2050 Fund | 52.0 |
| Institutional Target Retirement 2055 Fund | 51.2 |
| Institutional Target Retirement 2060 Fund | 50.2 |
The funds designate to shareholders foreign source income and foreign taxes paid as follows:
| Foreign Source Income | Foreign Taxes Paid | |
| Fund | ($000) | ($000) |
| Institutional Target Retirement 2035 Fund | 6,063 | 311 |
| Institutional Target Retirement 2040 Fund | 4,709 | 252 |
| Institutional Target Retirement 2045 Fund | 3,680 | 197 |
| Institutional Target Retirement 2050 Fund | 1,968 | 105 |
| Institutional Target Retirement 2055 Fund | 580 | 31 |
| Institutional Target Retirement 2060 Fund | 150 | 8 |
Shareholders will receive more detailed information with their Form 1099-DIV in January 2016 to determine the calendar-year amounts to be included on their 2015 tax returns.
75
Trustees Approve Advisory Arrangement
The board of trustees approved the launch of Vanguard Institutional Target Retirement Funds utilizing an internalized management structure whereby The Vanguard Group, Inc. (Vanguard)—through its Equity Index Group—would provide investment advisory services to the funds. The board determined that the internalized management structure was in the best interests of the funds and their prospective shareholders.
The board based its decision upon an evaluation of the advisor’s investment staff, portfolio management process, and performance. The trustees considered the factors discussed below, among others. However, no single factor determined whether the board approved the arrangement. Rather, it was the totality of the circumstances that drove the board’s decision.
Nature, extent, and quality of services
The board reviewed the quality of the investment management services to be provided to the funds and took into account the organizational depth and stability of the advisor. The board considered that Vanguard has been managing investments for more than three decades. The Equity Index Group adheres to a sound, disciplined investment management process; the team has considerable experience, stability, and depth.
The board concluded that Vanguard’s experience, stability, depth, and performance, among other factors, warranted approval of the advisory arrangement.
Investment performance
The board determined that, in its management of other Vanguard index funds, the Equity Index Group has a track record of consistent performance and disciplined investment processes. Information about the each fund’s performance since inception can be found in the Performance Summary sections of this report.
Cost
The board considered the cost of services to be provided and concluded that the funds’ acquired fund fees and expenses will be well below the average expense ratios charged by funds in their respective peer groups. The funds do not incur advisory expenses directly; however, the board noted that each of the underlying funds in which the funds invest has advisory expenses well below the relevant peer-group average. Information about each fund’s expense ratio appears in the Financial Statements sections.
The board did not consider profitability analysis of Vanguard because of Vanguard’s unique “at-cost” structure. Unlike most other mutual fund management companies, Vanguard is owned by the funds it oversees and produces “profits” only in the form of reduced expenses for fund shareholders.
The benefit of economies of scale
The board concluded that Vanguard’s at-cost arrangement with the Institutional Target Retirement Funds and their underlying funds ensures that the funds will realize economies of scale as the assets of the underlying funds grow, with the cost to shareholders declining as assets increase.
The board will consider whether to renew the advisory arrangement again after a one-year period.
76
Glossary
30-Day SEC Yield. A fund’s 30-day SEC yield is derived using a formula specified by the U.S. Securities and Exchange Commission. Under the formula, data related to the fund’s security holdings in the previous 30 days are used to calculate the fund’s hypothetical net income for that period, which is then annualized and divided by the fund’s estimated average net assets over the calculation period. For the purposes of this calculation, a security’s income is based on its current market yield to maturity (for bonds), its actual income (for asset-backed securities), or its projected dividend yield (for stocks). Because the SEC yield represents hypothetical annualized income, it will differ—at times significantly—from the fund’s actual experience. As a result, the fund’s income distributions may be higher or lower than implied by the SEC yield.
Acquired Fund Fees and Expenses. Funds that invest in other Vanguard funds incur no direct expenses, but they do bear proportionate shares of the operating, administrative, and advisory expenses of the underlying funds, and they must pay any fees charged by those funds. The figure for acquired fund fees and expenses represents a weighted average of these underlying costs. Acquired is a term that the Securities and Exchange Commission applies to any mutual fund whose shares are owned by another fund.
Expense Ratio. A fund’s total annual operating expenses expressed as a percentage of the fund’s average net assets. The expense ratio includes management and administrative expenses, but does not include the transaction costs of buying and selling portfolio securities.
Inception Date. The date on which the assets of a fund (or one of its share classes) are first invested in accordance with the fund’s investment objective. For funds with a subscription period, the inception date is the day after that period ends. Investment performance is measured from the inception date.
Benchmark Information
Target 2035 Composite Index: Derived by applying the fund’s target asset allocation to the results of the following benchmarks: for international stocks of developed markets, the MSCI EAFE Index through December 15, 2010, the MSCI ACWI ex USA IMI Index through June 2, 2013, and the FTSE Global All Cap ex US Index thereafter; for emerging-market stocks, the Select Emerging Markets Index through August 23, 2006, the MSCI Emerging Markets Index through December 15, 2010, the MSCI ACWI ex USA IMI Index through June 2, 2013, and the FTSE Global All Cap ex US Index thereafter; for U.S. bonds, the Barclays U.S. Aggregate Bond Index through December 31, 2009, and the Barclays U.S. Aggregate Float Adjusted Index thereafter; for international bonds, the Barclays Global Aggregate ex-USD Float Adjusted RIC Capped Index beginning June 3, 2013; and for U.S. stocks, the Dow Jones U.S. Total Stock Market Index (formerly known as the Dow Jones Wilshire 5000 Index) through April 22, 2005, the MSCI US Broad Market Index through June 2, 2013, and the CRSP US Total Market Index thereafter. International stock benchmark returns are adjusted for withholding taxes.
77
Target 2040 Composite Index: Derived by applying the fund’s target asset allocation to the results of the following benchmarks: for international stocks of developed markets, the MSCI EAFE Index through December 15, 2010, the MSCI ACWI ex USA IMI Index through June 2, 2013, and the FTSE Global All Cap ex US Index thereafter; for emerging-market stocks, the Select Emerging Markets Index through August 23, 2006, the MSCI Emerging Markets Index through December 15, 2010, the MSCI ACWI ex USA IMI Index through June 2, 2013, and the FTSE Global All Cap ex US Index thereafter; for U.S. bonds, the Barclays U.S. Aggregate Bond Index through December 31, 2009, and the Barclays U.S. Aggregate Float Adjusted Index thereafter; for international bonds, the Barclays Global Aggregate ex-USD Float Adjusted RIC Capped Index beginning June 3, 2013; and for U.S. stocks, the MSCI US Broad Market Index through June 2, 2013, and the CRSP US Total Market Index thereafter. International stock benchmark returns are adjusted for withholding taxes.
Target 2045 Composite Index: Derived by applying the fund’s target asset allocation to the results of the following benchmarks: for international stocks of developed markets, the MSCI EAFE Index through December 15, 2010, the MSCI ACWI ex USA IMI Index through June 2, 2013, and the FTSE Global All Cap ex US Index thereafter; for emerging-market stocks, the Select Emerging Markets Index through August 23, 2006, the MSCI Emerging Markets Index through December 15, 2010, the MSCI ACWI ex USA IMI Index through June 2, 2013, and the FTSE Global All Cap ex US Index thereafter; for U.S. bonds, the Barclays U.S. Aggregate Bond Index through December 31, 2009, and the Barclays U.S. Aggregate Float Adjusted Index thereafter; for international bonds, the Barclays Global Aggregate ex-USD Float Adjusted RIC Capped Index beginning June 3, 2013; and for U.S. stocks, the Dow Jones U.S. Total Stock Market Index (formerly known as the Dow Jones Wilshire 5000 Index) through April 22, 2005, the MSCI US Broad Market Index through June 2, 2013, and the CRSP US Total Market Index thereafter. International stock benchmark returns are adjusted for withholding taxes.
Target 2050 Composite Index: Derived by applying the fund’s target asset allocation to the results of the following benchmarks: for international stocks of developed markets, the MSCI EAFE Index through December 15, 2010, the MSCI ACWI ex USA IMI Index through June 2, 2013, and the FTSE Global All Cap ex US Index thereafter; for emerging-market stocks, the Select Emerging Markets Index through August 23, 2006, the MSCI Emerging Markets Index through December 15, 2010, the MSCI ACWI ex USA IMI Index through June 2, 2013, and the FTSE Global All Cap ex US Index thereafter; for U.S. bonds, the Barclays U.S. Aggregate Bond Index through December 31, 2009, and the Barclays U.S. Aggregate Float Adjusted Index thereafter; for international bonds, the Barclays Global Aggregate ex-USD Float Adjusted RIC Capped Index beginning June 3, 2013; and for U.S. stocks, the MSCI US Broad Market Index through June 2, 2013, and the CRSP US Total Market Index thereafter. International stock benchmark returns are adjusted for withholding taxes.
78
Target 2055 Composite Index: Derived by applying the fund’s target asset allocation to the results of the following benchmarks: for international stocks of developed markets, the MSCI EAFE Index through December 15, 2010, the MSCI ACWI ex USA IMI Index through June 2, 2013, and the FTSE Global All Cap ex US Index thereafter; for emerging-market stocks, the MSCI Emerging Markets Index through December 15, 2010, the MSCI ACWI ex USA IMI Index through June 2, 2013, and the FTSE Global All Cap ex US Index thereafter; for U.S. bonds, the Barclays U.S. Aggregate Float Adjusted Index; for international bonds, the Barclays Global Aggregate ex-USD Float Adjusted RIC Capped Index beginning June 3, 2013; and for U.S. stocks, the MSCI US Broad Market Index through June 2, 2013, and the CRSP US Total Market Index thereafter. International stock benchmark returns are adjusted for withholding taxes.
Target 2060 Composite Index: Derived by applying the fund’s target asset allocation to the results of the following benchmarks: for international stocks of developed markets, the MSCI ACWI ex USA IMI Index through June 2, 2013, and the FTSE Global All Cap ex US Index thereafter; for emerging-market stocks, the MSCI ACWI ex USA IMI Index through June 2, 2013, and the FTSE Global All Cap ex US Index thereafter; for U.S. bonds, the Barclays U.S. Aggregate Float Adjusted Index; for international bonds, the Barclays Global Aggregate ex-USD Float Adjusted RIC Capped Index beginning June 3, 2013; and for U.S. stocks, the MSCI US Broad Market Index through June 2, 2013, and the CRSP US Total Market Index thereafter. International stock benchmark returns are adjusted for withholding taxes.
79
The People Who Govern Your Fund
The trustees of your mutual fund are there to see that the fund is operated and managed in your best interests since, as a shareholder, you are a part owner of the fund. Your fund’s trustees also serve on the board of directors of The Vanguard Group, Inc., which is owned by the Vanguard funds and provides services to them on an at-cost basis.
A majority of Vanguard’s board members are independent, meaning that they have no affiliation with Vanguard or the funds they oversee, apart from the sizable personal investments they have made as private individuals. The independent board members have distinguished backgrounds in business, academia, and public service. Each of the trustees and executive officers oversees 194 Vanguard funds.
The following table provides information for each trustee and executive officer of the fund. More information about the trustees is in the Statement of Additional Information, which can be obtained, without charge, by contacting Vanguard at 800-662-7447, or online at vanguard.com.
InterestedTrustee1
F. William McNabb III
Born 1957. Trustee Since July 2009. Chairman of the Board. Principal Occupation(s) During the Past Five Years and Other Experience: Chairman of the Board of The Vanguard Group, Inc., and of each of the investment companies served by The Vanguard Group, since January 2010; Director of The Vanguard Group since 2008; Chief Executive Officer and President of The Vanguard Group, and of each of the investment companies served by The Vanguard Group, since 2008; Director of Vanguard Marketing Corporation; Managing Director of The Vanguard Group (1995–2008).
IndependentTrustees
Emerson U. Fullwood
Born 1948. Trustee Since January 2008. Principal Occupation(s) During the Past Five Years and Other Experience: Executive Chief Staff and Marketing Officer for North America and Corporate Vice President (retired 2008) of Xerox Corporation (document management products and services); Executive in Residence and 2009–2010 Distinguished Minett Professor at the Rochester Institute of Technology; Director of SPX Corporation (multi-industry manufacturing), the United Way of Rochester, Amerigroup Corporation (managed health care), the University of Rochester Medical Center, Monroe Community College Foundation, and North Carolina A&T University.
Rajiv L. Gupta
Born 1945. Trustee Since December 2001.2 Principal Occupation(s) During the Past Five Years and Other Experience: Chairman and Chief Executive Officer (retired 2009) and President (2006–2008) of Rohm and Haas Co. (chemicals); Director of Tyco International PLC (diversified manufacturing and services), Hewlett-Packard Co. (electronic computer manufacturing), and Delphi Automotive PLC (automotive components); Senior Advisor at New Mountain Capital.
Amy Gutmann
Born 1949. Trustee Since June 2006. Principal Occupation(s) During the Past Five Years and Other Experience: President of the University of Pennsylvania; Christopher H. Browne Distinguished Professor of Political Science, School of Arts and Sciences, and Professor of Communication, Annenberg School for Communication, with secondary faculty appointments in the Department of Philosophy, School of Arts and Sciences, and at the Graduate School of Education, University of Pennsylvania; Trustee of the National Constitution Center; Chair of the Presidential Commission for the Study of Bioethical Issues.
JoAnn Heffernan Heisen
Born 1950. Trustee Since July 1998. Principal Occupation(s) During the Past Five Years and Other Experience: Corporate Vice President and Chief Global Diversity Officer (retired 2008) and Member of the Executive Committee (1997–2008) of Johnson & Johnson (pharmaceuticals/medical devices/ consumer products); Director of Skytop Lodge Corporation (hotels), the University Medical Center at Princeton, the Robert Wood Johnson Foundation, and the Center for Talent Innovation; Member of the Advisory Board of the Institute for Women’s Leadership at Rutgers University.
F. Joseph Loughrey
Born 1949. Trustee Since October 2009. Principal Occupation(s) During the Past Five Years and Other Experience: President and Chief Operating Officer (retired 2009) of Cummins Inc. (industrial machinery); Chairman of the Board of Hillenbrand, Inc. (specialized consumer services), and of Oxfam America; Director of SKF AB (industrial machinery), Hyster-Yale Materials Handling, Inc. (forklift trucks), the Lumina Foundation for Education, and the V Foundation for Cancer Research; Member of the Advisory Council for the College of Arts and Letters and of the Advisory Board to the Kellogg Institute for International Studies, both at the University of Notre Dame.
Mark Loughridge
Born 1953. Trustee Since March 2012. Principal Occupation(s) During the Past Five Years and Other Experience: Senior Vice President and Chief Financial Officer (retired 2013) at IBM (information technology services); Fiduciary Member of IBM’s Retirement Plan Committee (2004–2013); Director of the Dow Chemical Company; Member of the Council on Chicago Booth.
Scott C. Malpass
Born 1962. Trustee Since March 2012. Principal Occupation(s) During the Past Five Years and Other Experience: Chief Investment Officer and Vice President at the University of Notre Dame; Assistant Professor of Finance at the Mendoza College of Business at Notre Dame; Member of the Notre Dame 403(b) Investment Committee; Board Member of TIFF Advisory Services, Inc., and Catholic Investment Services, Inc. (investment advisors); Member of the Investment Advisory Committee of Major League Baseball.
André F. Perold
Born 1952. Trustee Since December 2004. Principal Occupation(s) During the Past Five Years and Other Experience: George Gund Professor of Finance and Banking, Emeritus at the Harvard Business School (retired 2011); Chief Investment Officer and Managing Partner of HighVista Strategies LLC (private investment firm); Director of Rand Merchant Bank; Overseer of the Museum of Fine Arts Boston.
Peter F. Volanakis
Born 1955. Trustee Since July 2009. Principal Occupation(s) During the Past Five Years and Other Experience: President and Chief Operating Officer (retired 2010) of Corning Incorporated (communications equipment); Trustee of Colby-Sawyer College; Member of the Advisory Board of the Norris Cotton Cancer Center and of the Advisory Board of the Parthenon Group (strategy consulting).
Executive Officers
Glenn Booraem
Born 1967. Treasurer Since May 2015. Principal Occupation(s) During the Past Five Years and Other Experience: Principal of The Vanguard Group, Inc.; Treasurer of each of the investment companies served by The Vanguard Group; Controller of each of the investment companies served by The Vanguard Group (2010–2015); Assistant Controller of each of the investment companies served by The Vanguard Group (2001–2010).
Thomas J. Higgins
Born 1957. Chief Financial Officer Since September 2008. Principal Occupation(s) During the Past Five Years and Other Experience: Principal of The Vanguard Group, Inc.; Chief Financial Officer of each of the investment companies served by The Vanguard Group; Treasurer of each of the investment companies served by The Vanguard Group (1998–2008).
Peter Mahoney
Born 1974. Controller Since May 2015. Principal Occupation(s) During the Past Five Years and Other Experience: Head of Global Fund Accounting at The Vanguard Group, Inc.; Controller of each of the investment companies served by The Vanguard Group; Head of International Fund Services at The Vanguard Group (2008–2014).
Heidi Stam
Born 1956. Secretary Since July 2005. Principal Occupation(s) During the Past Five Years and Other Experience: Managing Director of The Vanguard Group, Inc.; General Counsel of The Vanguard Group; Secretary of The Vanguard Group and of each of the investment companies served by The Vanguard Group; Director and Senior Vice President of Vanguard Marketing Corporation.
Vanguard Senior Management Team
Mortimer J. Buckley
Kathleen C. Gubanich
Paul A. Heller
Martha G. King
John T. Marcante
Chris D. McIsaac
James M. Norris
Thomas M. Rampulla
Glenn W. Reed
Karin A. Risi
Chairman Emeritus and Senior Advisor
John J. Brennan
Chairman, 1996–2009
Chief Executive Officer and President, 1996–2008
Founder John C. Bogle
Chairman and Chief Executive Officer, 1974–1996
1 Mr. McNabb is considered an “interested person,” as defined in the Investment Company Act of 1940, because he is an officer of the Vanguard funds.
2 December 2002 for Vanguard Equity Income Fund, the Vanguard Municipal Bond Funds, and the Vanguard State Tax-Exempt Funds.
|
| P.O. Box 2600 |
| Valley Forge, PA 19482-2600 |
Connect with Vanguard® > vanguard.com
| Fund Information > 800-662-7447 | |
| Direct Investor Account Services > 800-662-2739 | |
| Institutional Investor Services > 800-523-1036 | |
| Text Telephone for People | |
| Who Are Deaf or Hard of Hearing> 800-749-7273 | |
| This material may be used in conjunction | |
| with the offering of shares of any Vanguard | |
| fund only if preceded or accompanied by | |
| the fund’s current prospectus. | |
| All comparative mutual fund data are from Lipper, a | |
| Thomson Reuters Company, or Morningstar, Inc., unless | |
| otherwise noted. | |
| You can obtain a free copy of Vanguard’s proxy voting | |
| guidelines by visiting vanguard.com/proxyreporting or by | |
| calling Vanguard at 800-662-2739. The guidelines are | |
| also available from the SEC’s website, sec.gov. In | |
| addition, you may obtain a free report on how your fund | |
| voted the proxies for securities it owned during the 12 | |
| months ended June 30. To get the report, visit either | |
| vanguard.com/proxyreporting or sec.gov. | |
| You can review and copy information about your fund at | |
| the SEC’s Public Reference Room in Washington, D.C. To | |
| find out more about this public service, call the SEC at | |
| 202-551-8090. Information about your fund is also | |
| available on the SEC’s website, and you can receive | |
| copies of this information, for a fee, by sending a | |
| request in either of two ways: via email addressed to | |
| publicinfo@sec.gov or via regular mail addressed to the | |
| Public Reference Section, Securities and Exchange | |
| Commission, Washington, DC 20549-1520. | |
| © 2015 The Vanguard Group, Inc. | |
| All rights reserved. | |
| Vanguard Marketing Corporation, Distributor. | |
| Q6730B 112015 | |
Item 2: Code of Ethics. The Registrant has adopted a code of ethics that applies to the Registrant’s principal executive officer, principal financial officer, principal accounting officer or controller or persons performing similar functions. The Code of Ethics was amended during the reporting period covered by this report to make certain technical, non-material changes.
Item 3: Audit Committee Financial Expert. The following members of the Audit Committee have been determined by the Registrant’s Board of Trustees to be Audit Committee Financial Experts serving on its Audit Committee, and to be independent: Rajiv L. Gupta, Amy Gutmann, JoAnn Heffernan Heisen, F. Joseph Loughrey, Mark Loughridge, Scott C. Malpass, and André F. Perold.
Item 4: Principal Accountant Fees and Services.
(a) Audit Fees.
Audit Fees of the Registrant
Fiscal Year Ended September 30, 2015: $737,000 Fiscal Year Ended September 30, 2014: $448,000
Aggregate Audit Fees of Registered Investment Companies in the Vanguard Group.
Fiscal Year Ended September 30, 2015: $7,000,200
Fiscal Year Ended September 30, 2014: $6,605,127
Includes fees billed in connection with audits of the Registrant, other registered investment companies in the Vanguard complex, The Vanguard Group, Inc. and Vanguard Marketing Corporation.
(b) Audit-Related Fees.
Fiscal Year Ended September 30, 2015: $2,899,096
Fiscal Year Ended September 30, 2014: $2,176,479
Includes fees billed in connection with assurance and related services provided to the Registrant, other registered investment companies in the Vanguard complex, The Vanguard Group, Inc., and Vanguard Marketing Corporation.
(c) Tax Fees.
Fiscal Year Ended September 30, 2015: $353,389
Fiscal Year Ended September 30, 2014: $316,869
Includes fees billed in connection with tax compliance, planning, and advice services provided to the Registrant, other registered investment companies in the Vanguard complex, The Vanguard Group, Inc., and Vanguard Marketing Corporation.
(d) All Other Fees.
Fiscal Year Ended September 30, 2015: $202,313
Fiscal Year Ended September 30, 2014: $198,163
Includes fees billed for services related to tax reported information provided to the Registrant, other registered investment companies in the Vanguard complex, The Vanguard Group, Inc., and Vanguard Marketing Corporation.
(e) (1) Pre-Approval Policies. The policy of the Registrant’s Audit Committee is to consider and, if appropriate, approve before the principal accountant is engaged for such services, all specific audit and non-audit services provided to: the Registrant, other registered investment companies in the Vanguard complex, The Vanguard Group, Inc., and entities controlled by The Vanguard Group, Inc. that provide ongoing services to the Registrant. In making a determination, the Audit Committee considers whether the services are consistent with maintaining the principal accountant’s independence.
In the event of a contingency situation in which the principal accountant is needed to provide services in between scheduled Audit Committee meetings, the Chairman of the Audit Committee would be called on to consider and, if appropriate, pre-approve audit or permitted non-audit services in an amount sufficient to complete services through the next Audit Committee meeting, and to determine if such services would be consistent with maintaining the accountant’s independence. At the next scheduled Audit Committee meeting, services and fees would be presented to the Audit Committee for formal consideration, and, if appropriate, approval by the entire Audit Committee. The Audit Committee would again consider whether such services and fees are consistent with maintaining the principal accountant’s independence.
The Registrant’s Audit Committee is informed at least annually of all audit and non-audit services provided by the principal accountant to the Vanguard complex, whether such services are provided to: the Registrant, other registered investment companies in the Vanguard complex, The Vanguard Group, Inc., or other entities controlled by The Vanguard Group, Inc. that provide ongoing services to the Registrant.
(2) No percentage of the principal accountant’s fees or services were approved pursuant to the waiver provision of paragraph (c)(7)(i)(C) of Rule 2-01 of Regulation S-X.
(f) For the most recent fiscal year, over 50% of the hours worked under the principal accountant’s engagement were not performed by persons other than full-time, permanent employees of the principal accountant.
(g) Aggregate Non-Audit Fees.
Fiscal Year Ended September 30, 2015: $555,702
Fiscal Year Ended September 30, 2014: $515,032
Includes fees billed for non-audit services provided to the Registrant, other registered investment companies in the Vanguard complex, The Vanguard Group, Inc., and Vanguard Marketing Corporation.
(h) For the most recent fiscal year, the Audit Committee has determined that the provision of all non-audit services was consistent with maintaining the principal accountant’s independence.
Item 5: Audit Committee of Listed Registrants.
Not Applicable.
Item 6: Investments.
Not Applicable.
Item 7: Disclosure of Proxy Voting Policies and Procedures for Closed-End Management Investment Companies.
Not Applicable.
Item 8: Portfolio Managers of Closed-End Management Investment Companies.
Not Applicable.
Item 9: Purchase of Equity Securities by Closed-End Management Investment Company and Affiliated Purchasers.
Not Applicable.
Item 10: Submission of Matters to a Vote of Security Holders.
Not Applicable.
Item 11: Controls and Procedures.
(a) Disclosure Controls and Procedures. The Principal Executive and Financial Officers concluded that the Registrant’s Disclosure Controls and Procedures are effective based on their evaluation of the Disclosure Controls and Procedures as of a date within 90 days of the filing date of this report.
(b) Internal Control Over Financial Reporting. There were no significant changes in Registrant’s Internal Control Over Financial Reporting or in other factors that could significantly affect this control subsequent to the date of the evaluation, including any corrective actions with regard to significant deficiencies and material weaknesses.
Item 12: Exhibits.
(a) Code of Ethics.
(b) Certifications.
Pursuant to the requirements of the Securities Exchange Act of 1934 and the Investment Company Act of 1940, the registrant has duly caused this report to be signed on its behalf by the undersigned, thereunto duly authorized.
| VANGUARD CHESTER FUNDS | |
| By: | /s/ F. WILLIAM MCNABB III* |
| F. WILLIAM MCNABB III | |
| CHIEF EXECUTIVE OFFICER | |
| Date: November 18, 2015 | |
Pursuant to the requirements of the Securities Exchange Act of 1934 and the Investment Company Act of 1940, this report has been signed below by the following persons on behalf of the registrant and in the capacities and on the dates indicated.
| VANGUARD CHESTER FUNDS | |
| By: | /s/ F. WILLIAM MCNABB III* |
| F. WILLIAM MCNABB III | |
| CHIEF EXECUTIVE OFFICER | |
| Date: November 18, 2015 | |
| VANGUARD CHESTER FUNDS | |
| By: | /s/ THOMAS J. HIGGINS* |
| THOMAS J. HIGGINS | |
| CHIEF FINANCIAL OFFICER | |
| Date: November 18, 2015 | |
* By: /s/ Heidi Stam
Heidi Stam, pursuant to a Power of Attorney filed on April 22, 2014 see file Number 2-17620, Incorporated by Reference.