UNITED STATES
SECURITIES AND EXCHANGE COMMISSION
Washington, D.C. 20549
FORM N-CSR
CERTIFIED SHAREHOLDER REPORT
OF
REGISTERED MANAGEMENT INVESTMENT COMPANIES
Investment Company Act file number: 811-04098
Name of Registrant: Vanguard Chester Funds
Address of Registrant:
P.O. Box 2600
Valley Forge, PA 19482
Name and address of agent for service:
Heidi Stam, Esquire
P.O. Box 876
Valley Forge, PA 19482
Registrant’s telephone number, including area code: (610) 669-1000
Date of fiscal year end: September 30
Date of reporting period: October 1, 2013 – September 30, 2014
Item 1: Reports to Shareholders
Annual Report | September 30, 2014
Vanguard PRIMECAP Fund
The mission continues
On May 1, 1975, Vanguard began operations, a fledgling company based on the simple but revolutionary idea that a mutual fund company should be managed solely in the interest of its investors.
Four decades later, that revolutionary spirit continues to animate the enterprise. Vanguard remains on a mission to give investors the best chance of investment success.
As we mark our 40th anniversary, we thank you for entrusting your assets to Vanguard and giving us the opportunity to help you reach your financial goals in the decades to come.
| Contents | |
| Your Fund’s Total Returns. | 1 |
| Chairman’s Letter. | 2 |
| Advisor’s Report. | 8 |
| Fund Profile. | 11 |
| Performance Summary. | 12 |
| Financial Statements. | 14 |
| Your Fund’s After-Tax Returns. | 26 |
| About Your Fund’s Expenses. | 27 |
| Trustees Approve Advisory Arrangement. | 29 |
| Glossary. | 30 |
Please note: The opinions expressed in this report are just that—informed opinions. They should not be considered promises or advice.
Also, please keep in mind that the information and opinions cover the period through the date on the front of this report. Of course, the
risks of investing in your fund are spelled out in the prospectus.
See the Glossary for definitions of investment terms used in this report.
About the cover: Since our founding, Vanguard has drawn inspiration from the enterprise and valor demonstrated by British
naval hero Horatio Nelson and his command at the Battle of the Nile in 1798. The photograph displays a replica of a merchant
ship from the same era as Nelson’s flagship, the HMS Vanguard.
Your Fund’s Total Returns
| Fiscal Year Ended September 30, 2014 | |
| Total | |
| Returns | |
| Vanguard PRIMECAP Fund | |
| Investor Shares | 24.72% |
| Admiral™ Shares | 24.85 |
| S&P 500 Index | 19.73 |
| Multi-Cap Growth Funds Average | 14.86 |
Admiral Shares carry lower expenses and are available to investors who meet certain account-balance requirements.
Your Fund’s Performance at a Glance
September 30, 2013, Through September 30, 2014
| Distributions Per Share | ||||
| Starting | Ending | |||
| Share | Share | Income | Capital | |
| Price | Price | Dividends | Gains | |
| Vanguard PRIMECAP Fund | ||||
| Investor Shares | $87.83 | $104.16 | $0.836 | $3.770 |
| Admiral Shares | 91.15 | 108.08 | 0.983 | 3.909 |
1

Chairman’s Letter
Dear Shareholder,
Vanguard PRIMECAP Fund registered superior results over the fiscal year as its advisor capitalized on the strongest sectors of the stock market while generally avoiding less productive areas. The fund returned almost 25% for the 12 months ended September 30, 2014, well ahead of both its benchmark, the Standard & Poor’s 500 Index (nearly 20%), and the average return of its multi-capitalization growth peers (nearly 15%).
This strong performance precedes a pair of milestones: November marks the 30th anniversary of both the PRIMECAP Fund and Theo A. Kolokotrones’s tenure as the fund’s co-manager. PRIMECAP Management Company is distinguished by its experience, knowledge, and talent––traits Mr. Kolokotrones also embodies. In dynamic, competitive investment markets, three decades of success is a major accomplishment. We’re grateful for our longstanding relationship with PRIMECAP Management and Mr. Kolokotrones. I’m pleased to congratulate them on their achievements.
If you hold fund shares in a taxable account, you may wish to review the table of after-tax returns, based on the highest federal income tax bracket, that appears later in this report.
2
Despite patchiness of late, stocks posted solid returns
The broad U.S. stock market managed a robust return of nearly 18% for the 12 months ended September 30, despite stumbling in two of the final three months. Generally strong corporate profits and progress in the U.S. economy carried the markets through most of the year. High stock valuations, international tensions, the unsettled global economy, and a gradual shift in the Federal Reserve’s accommodative policies weighed on more recent results.
Over the period’s final months, the performance gap between U.S. stocks and their international counterparts widened amid tensions in the Middle East and Ukraine, China’s slower growth, and Europe’s slumping economy. International stocks returned about 5%. Emerging markets and the developed markets of Europe and the Pacific region all recorded single-digit returns.
Although they met some resistance, bonds bounced back strongly
Bond returns, which were surprisingly robust through most of the fiscal year, also met resistance late in the period. Still, the broad U.S. taxable bond market returned 3.96%, a significant recovery from its negative outcome a year ago.
Since January, the Fed has pared back its bond-buying program, with the aim of ending it in October. Until recently, interest rates did not rise as analysts had predicted. The yield of the 10-year U.S. Treasury note
| Market Barometer | |||
| Average Annual Total Returns | |||
| Periods Ended September 30, 2014 | |||
| One | Three | Five | |
| Year | Years | Years | |
| Stocks | |||
| Russell 1000 Index (Large-caps) | 19.01% | 23.23% | 15.90% |
| Russell 2000 Index (Small-caps) | 3.93 | 21.26 | 14.29 |
| Russell 3000 Index (Broad U.S. market) | 17.76 | 23.08 | 15.78 |
| FTSE All-World ex US Index (International) | 5.11 | 12.12 | 6.31 |
| Bonds | |||
| Barclays U.S. Aggregate Bond Index (Broad taxable market) | 3.96% | 2.43% | 4.12% |
| Barclays Municipal Bond Index (Broad tax-exempt market) | 7.93 | 4.56 | 4.67 |
| Citigroup Three-Month U.S. Treasury Bill Index | 0.04 | 0.04 | 0.06 |
| CPI | |||
| Consumer Price Index | 1.66% | 1.61% | 1.96% |
3
ended September at 2.48%, down from 2.63% a year earlier. (Bond prices and yields move in opposite directions.)
Municipal bonds, which returned 7.93%, benefited from the broad market rally and a limited supply of new issues.
Following this advance for U.S. taxable and tax-exempt bonds, it’s worth remembering that the current low yields imply lower future returns: As yields drop, the scope for further declines—and increases in prices—diminishes.
International bond markets (as measured by the Barclays Global Aggregate Index ex USD) returned –0.81% after sinking in September.
Money market funds and savings accounts posted negligible returns as the Fed kept its target for short-term interest rates to 0%–0.25%.
Technology and health care sectors powered the fund’s strong result
There’s no secret to the PRIMECAP Fund’s success. Through extensive research, the advisor seeks out underrated growth companies, applies a strict filter, and invests with long-term focus. PRIMECAP’s contrarian approach typically results in a portfolio that bears little resemblance to its benchmark index.
This divergence sometimes leads to stretches of underperformance. This was the case in fiscal years 2010 and 2012,
Expense Ratios
Your Fund Compared With Its Peer Group
| Investor | Admiral | Peer Group | |
| Shares | Shares | Average | |
| PRIMECAP Fund | 0.45% | 0.36% | 1.34% |
the fiscal year ended September 30, 2014, the fund’s expense ratios were 0.44% for Investor Shares and 0.35% for Admiral Shares. The
peer-group expense ratio is derived from data provided by Lipper, a Thomson Reuters Company, and captures information through year-end
2013.
Peer group: Multi-Cap Growth Funds.
4
when PRIMECAP’s annual returns fell short of either one or both of its comparative standards. Patience and persistence are crucial to the process, as PRIMECAP’s portfolio is characterized by its low turnover and long-term holdings. Over time, shareholders have been rewarded for staying with the fund.
PRIMECAP’s outcome has historically hinged on the information technology and health care sectors, and fiscal year 2014 was no exception. Technology and health care stocks accounted for more than 60% of the fund’s assets on average during the period. This heavy exposure proved especially favorable as the two sectors powered the stock market and mostly overshadowed even the double-digit returns recorded by other sectors. Together, they were responsible for nearly 18 percentage points of PRIMECAP’s return.
The advisor’s selection among IT stocks further lifted performance: PRIMECAP’s holdings returned nearly 32%, compared with almost 29% for the technology stocks in the benchmark index. Most of the strength came from internet, software, IT services, and semiconductor firms as demand and accessibility increased in the United States and abroad.
The advisor’s choices weren’t quite as successful in the health care sector. PRIMECAP’s stocks returned about 25%, compared with about 28% for those in
| Total Returns | |
| Ten Years Ended September 30, 2014 | |
| Average | |
| Annual Return | |
| PRIMECAP Fund Investor Shares | 10.56% |
| S&P 500 Index | 8.11 |
| Multi-Cap Growth Funds Average | 8.01 |
| Multi-Cap Growth Funds Average: Derived from data provided by Lipper, a Thomson Reuters Company. | |
lower or higher than the performance data cited. For performance data current to the most recent month-end, visit our
website at vanguard.com/performance.) Note, too, that both investment returns and principal value can fluctuate widely, so
an investor’s shares, when sold, could be worth more or less than their original cost.
5
the benchmark, but the fund’s outsized commitment to the sector was still a boon to return. Investors anticipated an increase in health care spending to coincide with the aging population and the expanded number of insured under the Affordable Care Act. The bulk of returns came from pharmaceutical and biotechnology companies, which benefited from mergers and acquisitions, new drug development, and overseas opportunities along with the larger trends lifting the industry. Health care and medical equipment firms excelled as well.
PRIMECAP’s industrial stocks, which increased about 36% over the period, also significantly boosted the fund’s performance. Almost all the strength came from select airline stocks, where mergers and acquisitions resulted in pricing advantages and higher profits. Additionally, lower fuel costs helped airlines along with air freight firms, another area of strength for the fund’s industrial holdings.
The remaining sectors made up only about 20% of the fund’s assets on average. Favorable sector exposure and above-average stock selection in consumer discretionary and financials provided a bit of a lift and outweighed subpar choices in energy and materials.
For more about the advisor’s strategy and the fund’s positioning during the fiscal year, please see the Advisor’s Report that follows this letter.
PRIMECAP’s latest upswing boosted ten-year performance
As I mentioned earlier, PRIMECAP Management directs the fund through a long-term lens. It is willing to endure market volatility and stand behind out-of-favor companies when it believes the future is promising. Along with the broader stock market, the fund was hurt during the financial crisis, but its investment strategy and philosophy have ultimately proven successful.
For the ten years ended September 30, 2014, the fund posted an average annual return of 10.56%. It surpassed both its benchmark index and the average annual return of its peer funds by more than 2 percentage points. PRIMECAP Management deserves credit for this enviable record, and it is helped by Vanguard’s low costs, which ensure that shareholders retain more of the fund’s returns.
High costs don’t equal strong fund performance
The adage “you get what you pay for” doesn’t apply to mutual funds. In fact, the reverse is true: Research suggests that higher costs are consistent with weaker returns. (See, for example, Shopping for Alpha: You Get What You Don’t Pay For at vanguard.com/research.)
Shouldn’t paying the highest fees allow you to purchase the services of the greatest talents and therefore get the best returns? As it turns out, the
6
data don’t support that argument. The explanation is simple: Every dollar paid for management fees is a dollar less earning potential return. Keeping expenses down can help narrow the gap between what the markets return and what investors actually earn.
That’s why Vanguard always seeks to minimize costs. Indexing, of course, is the purest form of low-cost investing. And we negotiate low fees for our actively managed funds, which are run by world-class advisors. It’s a strategy that reflects decades of experience and research, boiled down to one tenet: The less you pay, the more you earn.
As always, thank you for investing with Vanguard.
Sincerely,

F. William McNabb III
Chairman and Chief Executive Officer
October 10, 2014
7
Advisor’s Report
For the fiscal year ended September 30, 2014, Vanguard PRIMECAP Fund returned 24.72% for Investor Shares and 24.85% for Admiral Shares. These results exceeded both the 19.73% return of the fund’s benchmark, the unmanaged Standard & Poor’s 500 Index, and the 14.86% average return of its multi-capitalization growth fund peers. Favorable stock selection in the industrial and information technology sectors, as well as overweight positions in health care and information technology, accounted for most of the fund’s outperformance.
The investment environment
Over the past 12 months, U.S. equities continued to appreciate, and the S&P 500 Index reached a new high during the third calendar quarter. Small-capitalization stocks, as measured by the Russell 2000 Index, began to significantly underperform large-caps beginning in mid-March.
After a rocky start to the year, driven in part by unusually cold weather, the U.S. economy rebounded. Real gross domestic product (GDP) grew by 4.6% in the second calendar quarter after declining 2.1% during the first. The unemployment rate fell to 5.9% at the end of September, the lowest level since July 2008. The improving U.S. economic outlook stood in stark contrast to the deteriorating outlook in Europe, where the European Central Bank introduced new stimulus measures, including an asset purchase program. The U.S. dollar appreciated against most foreign currencies, and commodity prices fell.
The Federal Reserve continued to tighten monetary policy by reducing its monthly asset purchases. The program is expected to end after the Fed’s October meeting. The central bank expects to maintain the current 0%–0.25% target federal funds rate for a considerable time after the asset purchase program ends.
On the geopolitical front, the United States and a number of other countries began conducting air strikes against the militant group ISIS, or Islamic State. After annexing Crimea earlier in the year, Russia continued its support of pro-Russian rebel groups in Eastern Ukraine. In response, the European Union and the United States imposed economic sanctions on Russia, resulting in a devaluation of the ruble and a slowdown in exports to Russia from countries such as Germany. Toward the end of the fiscal year, outbreaks of the Ebola virus in several African countries were increasingly a cause for concern as the first cases of the illness appeared in the United States and Europe.
Outlook for U.S. equities
We are less optimistic on the outlook for U.S. equities than we have been in recent years. We do, however, continue to believe that many individual stocks are attractively valued and that stocks represent a more inviting investment than bonds at current prices. As of September 30, the S&P 500 was trading at approximately 14.8 times 2015 consensus estimated earnings per share of $133. This is a reasonable valuation by historical standards, though the index appears more expensive on a
8
price-to-sales multiple basis because profit margins are near all-time highs. Calendar 2015 consensus estimates assume 4.2% sales-per-share growth and 11.7% earnings-per-share growth, which may prove difficult to achieve.
Portfolio update and outlook
The portfolio remains significantly over- weight in health care and information technology. As of September 30, these sectors accounted for 63% of the fund’s stocks (compared with 34% for the S&P 500), including nine of its ten largest holdings.
Favorable sector allocations and stock selection contributed significantly to the fund’s success. Overweight positions in information technology and health care, the best performers over the period, benefited relative results, as did underweight positions in energy, consumer discretionary, consumer staples, telecommunication services, financials, utilities, and materials.
Positive stock selection in industrials and information technology was partially offset by unfavorable choices in health care and energy. In industrials, Southwest Airlines (+134%), FedEx (+42%), and Alaska Air Group (+41%) accounted for most of the outperformance. In information technology, Micron (+96%), Hewlett-Packard (+72%), Microsoft (+43%), Google (+34%), and Adobe Systems (+33%) were the largest contributors. These gains were partially offset by relatively poor stock picks in health care—including GlaxoSmithKline (–4%), Boston Scientific (+1%), and Roche (+13%)—and in energy, notably Transocean (–24%) and Noble Energy (+3%).
Health care
We believe that favorable global demo-graphic trends and innovation will create opportunities for health care companies to increase revenues faster than overall economic growth for the foreseeable future. Aging populations in developed countries and China should lead to greater consumption of health care products and services. At the same time, rising disposable incomes and household wealth in developing countries should lead to higher use by people of all ages.
The health care industry’s considerable investment in research and development over the years is driving the rise of new and more effective therapies for many diseases, such as cancer, diabetes, and Alzheimer’s. The precipitous decline in the cost of genetic DNA sequencing is allowing researchers to identify unknown diseases and rapidly develop therapies that improve the standard of care. Increasingly, drugs based on a better understanding of diseases’ underlying genetic causes are providing higher cure rates with fewer side effects than conventional treatments.
Technology
We continue to believe that many of the fund’s information technology holdings are attractively valued. The sector’s price-to-earnings multiple relative to that of the
9
broader S&P 500 Index is near a multi-decade low, and tech companies are far better capitalized than those in other sectors. Many of the fund’s IT holdings have considerable percentages of their market capitalization in net cash on their balance sheets. Already at reasonable multiples, their valuations are even more attractive when these net cash balances are considered.
The pace of change in the sector is rapid and can be disruptive, but we believe that many “old technology” companies are evolving their offerings to remain relevant. A fundamental shift from client-server to internet-based or “cloud” architectures is allowing users to rent software applications and computing resources and consume them as services over the internet. This model is more flexible than the traditional one of purchasing perpetual licenses to software applications and running these applications on locally deployed servers. We believe that many of the fund’s old technology holdings, such as Microsoft, Adobe Systems, and Hewlett-Packard, are successfully adapting to the cloud era.
Conclusion
We remain committed to our investment philosophy, which is to invest in attractively priced individual stocks for the long term. This “bottom-up” approach often results in portfolios that bear little resemblance to market indexes; therefore, our results often deviate substantially. Furthermore, our long-term investment horizon results in low portfolio turnover, which creates the possibility for extended periods of underperformance when the stocks in our portfolio fall out of favor. We nonetheless believe that this approach can generate superior results for investors over the long term.
PRIMECAP Management Company October 10, 2014
10
PRIMECAP Fund
Fund Profile
As of September 30, 2014
| Share-Class Characteristics | ||
| Investor | Admiral | |
| Shares | Shares | |
| Ticker Symbol | VPMCX | VPMAX |
| Expense Ratio1 | 0.45% | 0.36% |
| 30-Day SEC Yield | 1.15% | 1.24% |
| Portfolio Characteristics | |||
| DJ | |||
| U.S. | |||
| Total | |||
| Market | |||
| S&P 500 | FA | ||
| Fund | Index | Index | |
| Number of Stocks | 127 | 502 | 3,768 |
| Median Market Cap | $62.5B | $75.5B | $51.1B |
| Price/Earnings Ratio | 20.6x | 19.1x | 20.5x |
| Price/Book Ratio | 3.6x | 2.7x | 2.6x |
| Return on Equity | 20.1% | 19.1% | 17.8% |
| Earnings Growth | |||
| Rate | 15.8% | 15.2% | 15.2% |
| Dividend Yield | 1.6% | 2.0% | 1.9% |
| Foreign Holdings | 10.3% | 0.0% | 0.0% |
| Turnover Rate | 11% | — | — |
| Short-Term Reserves | 3.8% | — | — |
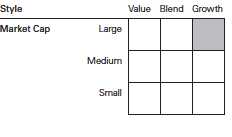
| Sector Diversification (% of equity exposure) | |||
| DJ | |||
| U.S. Total | |||
| S&P 500 | Market | ||
| Fund | Index FA Index | ||
| Consumer | |||
| Discretionary | 8.1% | 11.7% | 12.5% |
| Consumer Staples | 0.5 | 9.5 | 8.3 |
| Energy | 4.2 | 9.7 | 9.1 |
| Financials | 5.7 | 16.3 | 17.4 |
| Health Care | 31.2 | 13.9 | 13.5 |
| Industrials | 15.5 | 10.3 | 11.2 |
| Information | |||
| Technology | 32.3 | 19.7 | 19.0 |
| Materials | 2.5 | 3.5 | 3.8 |
| Telecommunication | |||
| Services | 0.0 | 2.4 | 2.2 |
| Utilities | 0.0 | 3.0 | 3.0 |
| Volatility Measures | ||
| DJ | ||
| U.S. Total | ||
| S&P 500 | Market | |
| Index | FA Index | |
| R-Squared | 0.88 | 0.90 |
| Beta | 0.97 | 0.93 |
| These measures show the degree and timing of the fund’s fluctuations compared with the indexes over 36 months. | ||
| Ten Largest Holdings (% of total net assets) | ||
| Biogen Idec Inc. | Biotechnology | 7.5% |
| Amgen Inc. | Biotechnology | 5.1 |
| Eli Lilly & Co. | Pharmaceuticals | 4.3 |
| FedEx Corp. | Air Freight & | |
| Logistics | 4.1 | |
| Microsoft Corp. | Systems Software | 4.1 |
| Roche Holding AG | Pharmaceuticals | 3.9 |
| Google Inc. | Internet Software & | |
| Services | 3.7 | |
| Texas Instruments Inc. | Semiconductors | 3.7 |
| Adobe Systems Inc. | Application Software | 3.6 |
| Novartis AG | Pharmaceuticals | 2.7 |
| Top Ten | 42.7% | |
| The holdings listed exclude any temporary cash investments and equity index products. | ||
Investment Focus
1 The expense ratios shown are from the prospectus dated January 27, 2014, and represent estimated costs for the current fiscal year. For the fiscal year ended September 30, 2014, the expense ratios were 0.44% for Investor Shares and 0.35% for Admiral Shares.
11
PRIMECAP Fund
Performance Summary
All of the returns in this report represent past performance, which is not a guarantee of future results that may be achieved by the fund. (Current performance may be lower or higher than the performance data cited. For performance data current to the most recent month-end, visit our website at vanguard.com/performance.) Note, too, that both investment returns and principal value can fluctuate widely, so an investor’s shares, when sold, could be worth more or less than their original cost. The returns shown do not reflect taxes that a shareholder would pay on fund distributions or on the sale of fund shares.
Cumulative Performance: September 30, 2004, Through September 30, 2014
Initial Investment of $10,000
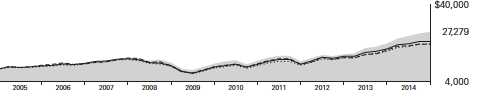
| Average Annual Total Returns | |||||
| Periods Ended September 30, 2014 | |||||
| Final Value | |||||
| One | Five | Ten | of a $10,000 | ||
| Year | Years | Years | Investment | ||
| PRIMECAP Fund*Investor Shares | 24.72% | 16.95% | 10.56% | $27,279 | |
| •••••••• | S&P 500 Index | 19.73 | 15.70 | 8.11 | 21,804 |
| – – – – | Multi-Cap Growth Funds Average | 14.86 | 14.32 | 8.01 | 21,601 |
| Dow Jones U.S. Total Stock Market | |||||
| Float Adjusted Index | 17.69 | 15.84 | 8.59 | 22,805 | |
| Multi-Cap Growth Funds Average: Derived from data provided by Lipper, a Thomson Reuters Company. | |||||
| Final Value | ||||
| One | Five | Ten | of a $50,000 | |
| Year | Years | Years | Investment | |
| PRIMECAP Fund Admiral Shares | 24.85% | 17.06% | 10.68% | $137,945 |
| S&P 500 Index | 19.73 | 15.70 | 8.11 | 109,022 |
| Dow Jones U.S. Total Stock Market Float | ||||
| Adjusted Index | 17.69 | 15.84 | 8.59 | 114,024 |
See Financial Highlights for dividend and capital gains information.
12
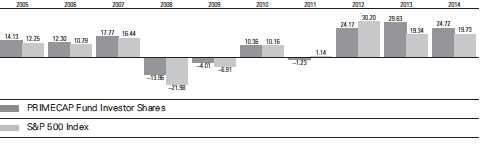
PRIMECAP Fund
Fiscal-Year Total Returns (%): September 30, 2004, Through September 30, 2014
13
PRIMECAP Fund
Financial Statements
Statement of Net Assets
As of September 30, 2014
The fund reports a complete list of its holdings in regulatory filings four times in each fiscal year, at the quarter-ends. For the second and fourth fiscal quarters, the lists appear in the fund’s semiannual and annual reports to shareholders. For the first and third fiscal quarters, the fund files the lists with the Securities and Exchange Commission on Form N-Q. Shareholders can look up the fund’s Forms N-Q on the SEC’s website at sec.gov. Forms N-Q may also be reviewed and copied at the SEC’s Public Reference Room (see the back cover of this report for further information).
| Market | |||
| Value | |||
| Shares | ($000) | ||
| Common Stocks (96.5%) | |||
| Consumer Discretionary (7.8%) | |||
| * | DIRECTV | 8,053,962 | 696,829 |
| L Brands Inc. | 10,018,818 | 671,060 | |
| Walt Disney Co. | 5,150,000 | 458,505 | |
| TJX Cos. Inc. | 6,875,000 | 406,794 | |
| Ross Stores Inc. | 4,523,000 | 341,848 | |
| Carnival Corp. | 5,818,100 | 233,713 | |
| ^ | Sony Corp. ADR | 11,900,000 | 214,676 |
| * | Bed Bath & Beyond Inc. | 2,300,975 | 151,473 |
| Whirlpool Corp. | 725,000 | 105,596 | |
| VF Corp. | 772,400 | 51,002 | |
| * | Amazon.com Inc. | 146,000 | 47,076 |
| Time Warner Cable Inc. | 293,304 | 42,086 | |
| Las Vegas Sands Corp. | 300,000 | 18,663 | |
| 3,439,321 | |||
| Consumer Staples (0.5%) | |||
| CVS Health Corp. | 1,794,065 | 142,790 | |
| Costco Wholesale Corp. | 350,000 | 43,862 | |
| PepsiCo Inc. | 250,000 | 23,272 | |
| Kellogg Co. | 270,000 | 16,632 | |
| 226,556 | |||
| Energy (4.1%) | |||
| ^ | Transocean Ltd. | 16,155,479 | 516,491 |
| Schlumberger Ltd. | 3,642,833 | 370,440 | |
| EOG Resources Inc. | 3,695,000 | 365,879 | |
| Noble Energy Inc. | 4,330,000 | 295,999 | |
| Exxon Mobil Corp. | 615,000 | 57,841 | |
| * | Cameron International | ||
| Corp. | 687,500 | 45,636 | |
| National Oilwell Varco Inc. | 579,600 | 44,107 | |
| Encana Corp. | 1,979,000 | 41,974 | |
| * | Southwestern Energy Co. | 968,779 | 33,859 |
| Petroleo Brasileiro SA | |||
| ADR Type A | 600,000 | 8,934 | |
| Cabot Oil & Gas Corp. | 240,000 | 7,845 | |
| Market | |||
| Value | |||
| Shares | ($000) | ||
| Petroleo Brasileiro SA ADR | 400,000 | 5,676 | |
| Noble Corp. plc | 100,000 | 2,222 | |
| Range Resources Corp. | 12,500 | 848 | |
| * | Paragon Offshore plc | 33,333 | 205 |
| 1,797,956 | |||
| Financials (5.5%) | |||
| Charles Schwab Corp. | 26,623,992 | 782,479 | |
| Marsh & McLennan | |||
| Cos. Inc. | 12,231,100 | 640,176 | |
| Wells Fargo & Co. | 8,115,900 | 420,972 | |
| Chubb Corp. | 2,799,000 | 254,933 | |
| CME Group Inc. | 2,424,100 | 193,819 | |
| Progressive Corp. | 2,004,756 | 50,680 | |
| American Express Co. | 482,100 | 42,203 | |
| Discover Financial | |||
| Services | 436,100 | 28,080 | |
| US Bancorp | 485,000 | 20,288 | |
| 2,433,630 | |||
| Health Care (30.0%) | |||
| * | Biogen Idec Inc. | 9,973,695 | 3,299,398 |
| Amgen Inc. | 15,917,400 | 2,235,758 | |
| Eli Lilly & Co. | 29,130,000 | 1,889,081 | |
| Roche Holding AG | 5,872,200 | 1,734,079 | |
| Novartis AG ADR | 12,568,965 | 1,183,117 | |
| Medtronic Inc. | 15,323,952 | 949,319 | |
| Johnson & Johnson | 6,324,469 | 674,125 | |
| * | Boston Scientific Corp. | 28,342,560 | 334,726 |
| Abbott Laboratories | 6,137,900 | 255,275 | |
| Thermo Fisher | |||
| Scientific Inc. | 1,958,600 | 238,362 | |
| AbbVie Inc. | 2,829,800 | 163,449 | |
| GlaxoSmithKline plc ADR | 3,200,400 | 147,122 | |
| Sanofi ADR | 2,250,000 | 126,968 | |
| Agilent Technologies Inc. | 458,500 | 26,125 | |
| Stryker Corp. | 259,000 | 20,914 | |
| Zimmer Holdings Inc. | 197,000 | 19,808 | |
| 13,297,626 | |||
14
| PRIMECAP Fund | |||
| Market | |||
| Value | |||
| Shares | ($000) | ||
| Industrials (15.0%) | |||
| FedEx Corp. | 11,356,768 | 1,833,550 | |
| 1 | Southwest Airlines Co. | 34,559,300 | 1,167,068 |
| Honeywell | |||
| International Inc. | 5,851,347 | 544,877 | |
| Caterpillar Inc. | 4,050,000 | 401,071 | |
| Union Pacific Corp. | 3,397,400 | 368,346 | |
| Airbus Group NV | 5,433,700 | 341,567 | |
| Alaska Air Group Inc. | 6,207,800 | 270,288 | |
| CH Robinson | |||
| Worldwide Inc. | 3,443,308 | 228,360 | |
| Boeing Co. | 1,744,260 | 222,184 | |
| United Parcel Service Inc. | |||
| Class B | 2,181,070 | 214,377 | |
| * | United Continental | ||
| Holdings Inc. | 4,260,800 | 199,363 | |
| Deere & Co. | 1,976,500 | 162,053 | |
| Delta Air Lines Inc. | 3,783,000 | 136,755 | |
| United Technologies Corp. | 1,007,000 | 106,339 | |
| Pentair plc | 1,399,000 | 91,621 | |
| ^ | Canadian Pacific | ||
| Railway Ltd. | 425,800 | 88,341 | |
| Rockwell Automation Inc. | 775,000 | 85,157 | |
| American Airlines | |||
| Group Inc. | 1,475,000 | 52,333 | |
| CSX Corp. | 1,290,000 | 41,357 | |
| Expeditors International | |||
| of Washington Inc. | 840,742 | 34,117 | |
| Safran SA | 267,000 | 17,311 | |
| Pall Corp. | 205,000 | 17,159 | |
| Norfolk Southern Corp. | 46,100 | 5,145 | |
| * | NOW Inc. | 143,844 | 4,374 |
| Cummins Inc. | 12,150 | 1,604 | |
| Republic Services Inc. | |||
| Class A | 17,000 | 663 | |
| 6,635,380 | |||
| Information Technology (31.2%) | |||
| Microsoft Corp. | 39,156,600 | 1,815,300 | |
| Texas Instruments Inc. | 34,427,100 | 1,641,828 | |
| * | Adobe Systems Inc. | 23,310,070 | 1,612,824 |
| * | Google Inc. Class A | 1,418,843 | 834,861 |
| * | Google Inc. Class C | 1,418,843 | 819,183 |
| Hewlett-Packard Co. | 21,139,400 | 749,815 | |
| QUALCOMM Inc. | 9,609,350 | 718,491 | |
| * | Micron Technology Inc. | 20,120,000 | 689,311 |
| Intuit Inc. | 7,393,700 | 648,058 | |
| Intel Corp. | 17,810,500 | 620,162 | |
| EMC Corp. | 16,752,800 | 490,187 | |
| KLA-Tencor Corp. | 4,553,100 | 358,693 | |
| Oracle Corp. | 8,355,000 | 319,829 | |
| Cisco Systems Inc. | 12,318,050 | 310,045 | |
| NVIDIA Corp. | 13,880,000 | 256,086 | |
| Visa Inc. Class A | 1,145,138 | 244,338 | |
| Market | |||
| Value | |||
| Shares | ($000) | ||
| Accenture plc Class A | 2,386,100 | 194,038 | |
| NetApp Inc. | 4,320,000 | 185,587 | |
| Telefonaktiebolaget LM | |||
| Ericsson ADR | 14,588,314 | 183,667 | |
| 1 | Plantronics Inc. | 3,701,500 | 176,858 |
| * | Alibaba Group | ||
| Holding Ltd. ADR | 1,607,100 | 142,791 | |
| Analog Devices Inc. | 2,240,000 | 110,858 | |
| * | BlackBerry Ltd. | 10,438,600 | 103,760 |
| Corning Inc. | 5,243,200 | 101,403 | |
| Symantec Corp. | 3,974,500 | 93,440 | |
| Activision Blizzard Inc. | 3,945,000 | 82,017 | |
| Apple Inc. | 546,000 | 55,010 | |
| SanDisk Corp. | 500,000 | 48,975 | |
| * | eBay Inc. | 583,000 | 33,015 |
| MasterCard Inc. Class A | 412,500 | 30,492 | |
| * | Entegris Inc. | 2,583,472 | 29,710 |
| * | Rambus Inc. | 2,000,000 | 24,960 |
| Applied Materials Inc. | 970,000 | 20,962 | |
| Altera Corp. | 460,000 | 16,459 | |
| ASML Holding NV | 148,175 | 14,643 | |
| * | F5 Networks Inc. | 97,400 | 11,565 |
| * | salesforce.com inc | 164,000 | 9,435 |
| Motorola Solutions Inc. | 30,000 | 1,898 | |
| 13,800,554 | |||
| Materials (2.4%) | |||
| Monsanto Co. | 6,301,125 | 708,940 | |
| Potash Corp. of | |||
| Saskatchewan Inc. | 5,919,200 | 204,567 | |
| Praxair Inc. | 925,000 | 119,325 | |
| EI du Pont de | |||
| Nemours & Co. | 150,000 | 10,764 | |
| Celanese Corp. Class A | 60,000 | 3,511 | |
| LyondellBasell Industries | |||
| NV Class A | 18,700 | 2,032 | |
| 1,049,139 | |||
| Total Common Stocks | |||
| (Cost $19,182,791) | 42,680,162 | ||
| Temporary Cash Investment (4.1%) | |||
| Money Market Fund (4.1%) | |||
| 2,3 | Vanguard Market | ||
| Liquidity Fund, 0.109% | |||
| (Cost $1,831,829) | 1,831,828,913 | 1,831,829 | |
| Total Investments (100.6%) | |||
| (Cost $21,014,620) | 44,511,991 | ||
| Other Assets and Liabilities (-0.6%) | |||
| Other Assets | 522,705 | ||
| Liabilities3 | (779,349) | ||
| (256,644) | |||
| Net Assets (100%) | 44,255,347 | ||
15
PRIMECAP Fund
| At September 30, 2014, net assets consisted of: | |
| Amount | |
| ($000) | |
| Paid-in Capital | 18,451,785 |
| Undistributed Net Investment Income | 318,267 |
| Accumulated Net Realized Gains | 1,988,762 |
| Unrealized Appreciation (Depreciation) | |
| Investment Securities | 23,497,371 |
| Foreign Currencies | (838) |
| Net Assets | 44,255,347 |
| Investor Shares—Net Assets | |
| Applicable to 127,430,575 outstanding | |
| $.001 par value shares of beneficial | |
| interest (unlimited authorization) | 13,273,321 |
| Net Asset Value Per Share— | |
| Investor Shares | $104.16 |
| Admiral Shares—Net Assets | |
| Applicable to 286,669,913 outstanding | |
| $.001 par value shares of beneficial | |
| interest (unlimited authorization) | 30,982,026 |
| Net Asset Value Per Share— | |
| Admiral Shares | $108.08 |
See Note A in Notes to Financial Statements.
* Non-income-producing security.
^ Includes partial security positions on loan to broker-dealers. The total value of securities on loan is $135,227,000.
1 Considered an affiliated company of the fund as the fund owns more than 5% of the outstanding voting securities of such company.
2 Affiliated money market fund available only to Vanguard funds and certain trusts and accounts managed by Vanguard. Rate shown is
the 7-day yield.
3 Includes $142,145,000 of collateral received for securities on loan.
ADR—American Depositary Receipt.
See accompanying Notes, which are an integral part of the Financial Statements.
16
PRIMECAP Fund
Statement of Operations
| Year Ended | |
| September 30, 2014 | |
| ($000) | |
| Investment Income | |
| Income | |
| Dividends1,2 | 656,631 |
| Interest2 | 2,164 |
| Securities Lending | 1,676 |
| Total Income | 660,471 |
| Expenses | |
| Investment Advisory Fees—Note B | 82,278 |
| The Vanguard Group—Note C | |
| Management and Administrative—Investor Shares | 30,448 |
| Management and Administrative—Admiral Shares | 36,653 |
| Marketing and Distribution—Investor Shares | 2,089 |
| Marketing and Distribution—Admiral Shares | 3,755 |
| Custodian Fees | 586 |
| Auditing Fees | 30 |
| Shareholders’ Reports—Investor Shares | 108 |
| Shareholders’ Reports—Admiral Shares | 127 |
| Trustees’ Fees and Expenses | 67 |
| Total Expenses | 156,141 |
| Net Investment Income | 504,330 |
| Realized Net Gain (Loss) | |
| Investment Securities Sold2 | 2,268,749 |
| Foreign Currencies | 1,164 |
| Realized Net Gain (Loss) | 2,269,913 |
| Change in Unrealized Appreciation (Depreciation) | |
| Investment Securities | 6,119,090 |
| Foreign Currencies | (1,539) |
| Change in Unrealized Appreciation (Depreciation) | 6,117,551 |
| Net Increase (Decrease) in Net Assets Resulting from Operations | 8,891,794 |
2 Dividend income, interest income, and realized net gain (loss) from affiliated companies of the fund were $8,763,000, $2,164,000,
and $0, respectively.
See accompanying Notes, which are an integral part of the Financial Statements.
17
PRIMECAP Fund
Statement of Changes in Net Assets
| Year Ended September 30, | ||
| 2014 | 2013 | |
| ($000) | ($000) | |
| Increase (Decrease) in Net Assets | ||
| Operations | ||
| Net Investment Income | 504,330 | 448,283 |
| Realized Net Gain (Loss) | 2,269,913 | 1,544,820 |
| Change in Unrealized Appreciation (Depreciation) | 6,117,551 | 6,421,396 |
| Net Increase (Decrease) in Net Assets Resulting from Operations | 8,891,794 | 8,414,499 |
| Distributions | ||
| Net Investment Income | ||
| Investor Shares | (118,024) | (181,566) |
| Admiral Shares | (253,860) | (236,821) |
| Realized Capital Gain1 | ||
| Investor Shares | (532,238) | (135,657) |
| Admiral Shares | (1,009,500) | (164,172) |
| Total Distributions | (1,913,622) | (718,216) |
| Capital Share Transactions | ||
| Investor Shares | (2,143,518) | (3,902,726) |
| Admiral Shares | 3,232,612 | 2,784,511 |
| Net Increase (Decrease) from Capital Share Transactions | 1,089,094 | (1,118,215) |
| Total Increase (Decrease) | 8,067,266 | 6,578,068 |
| Net Assets | ||
| Beginning of Period | 36,188,081 | 29,610,013 |
| End of Period2 | 44,255,347 | 36,188,081 |
treated as ordinary income dividends for tax purposes.
2 Net Assets—End of Period includes undistributed (overdistributed) net investment income of $318,267,000 and $216,612,000.
See accompanying Notes, which are an integral part of the Financial Statements.
18
PRIMECAP Fund
Financial Highlights
| Investor Shares | |||||
| For a Share Outstanding | Year Ended September 30, | ||||
| Throughout Each Period | 2014 | 2013 | 2012 | 2011 | 2010 |
| Net Asset Value, Beginning of Period | $87.83 | $69.39 | $58.46 | $60.36 | $55.10 |
| Investment Operations | |||||
| Net Investment Income | 1.124 | 1.033 | .866 | .651 | .6311 |
| Net Realized and Unrealized Gain (Loss) | |||||
| on Investments | 19.812 | 19.093 | 12.857 | (1.266) | 5.076 |
| Total from Investment Operations | 20.936 | 20.126 | 13.723 | (.615) | 5.707 |
| Distributions | |||||
| Dividends from Net Investment Income | (.836) | (.965) | (.689) | (.614) | (.447) |
| Distributions from Realized Capital Gains | (3.770) | (.721) | (2.104) | (.671) | — |
| Total Distributions | (4.606) | (1.686) | (2.793) | (1.285) | (.447) |
| Net Asset Value, End of Period | $104.16 | $87.83 | $69.39 | $58.46 | $60.36 |
| Total Return2 | 24.72% | 29.63% | 24.17% | -1.23% | 10.36% |
| Ratios/Supplemental Data | |||||
| Net Assets, End of Period (Millions) | $13,273 | $13,059 | $13,632 | $14,359 | $18,028 |
| Ratio of Total Expenses to | |||||
| Average Net Assets | 0.44% | 0.45% | 0.45% | 0.45% | 0.45% |
| Ratio of Net Investment Income to | |||||
| Average Net Assets | 1.17% | 1.32% | 1.30% | 0.95% | 1.05%1 |
| Portfolio Turnover Rate | 11% | 5% | 6% | 8% | 5% |
resulting from a special dividend from Weyerhaeuser Co. in July 2010.
2 Total returns do not include transaction or account service fees that may have applied in the periods shown. Fund prospectuses provide
information about any applicable transaction and account service fees.
See accompanying Notes, which are an integral part of the Financial Statements.
19
PRIMECAP Fund
Financial Highlights
| Admiral Shares | |||||
| For a Share Outstanding | Year Ended September 30, | ||||
| Throughout Each Period | 2014 | 2013 | 2012 | 2011 | 2010 |
| Net Asset Value, Beginning of Period | $91.15 | $72.03 | $60.69 | $62.65 | $57.20 |
| Investment Operations | |||||
| Net Investment Income | 1.286 | 1.178 | .974 | .738 | .7111 |
| Net Realized and Unrealized Gain (Loss) | |||||
| on Investments | 20.536 | 19.769 | 13.333 | (1.319) | 5.269 |
| Total from Investment Operations | 21.822 | 20.947 | 14.307 | (.581) | 5.980 |
| Distributions | |||||
| Dividends from Net Investment Income | (.983) | (1.079) | (.785) | (.683) | (.530) |
| Distributions from Realized Capital Gains | (3.909) | (.748) | (2.182) | (.696) | — |
| Total Distributions | (4.892) | (1.827) | (2.967) | (1.379) | (.530) |
| Net Asset Value, End of Period | $108.08 | $91.15 | $72.03 | $60.69 | $62.65 |
| Total Return2 | 24.85% | 29.73% | 24.29% | -1.14% | 10.46% |
| Ratios/Supplemental Data | |||||
| Net Assets, End of Period (Millions) | $30,982 | $23,129 | $15,978 | $11,088 | $9,765 |
| Ratio of Total Expenses to Average Net Assets | 0.35% | 0.36% | 0.36% | 0.36% | 0.36% |
| Ratio of Net Investment Income to | |||||
| Average Net Assets | 1.26% | 1.41% | 1.39% | 1.04% | 1.14%1 |
| Portfolio Turnover Rate | 11% | 5% | 6% | 8% | 5% |
resulting from a special dividend from Weyerhaeuser Co. in July 2010.
2 Total returns do not include transaction fees that may have applied in the periods shown. Fund prospectuses provide information about any
applicable transaction fees.
See accompanying Notes, which are an integral part of the Financial Statements.
20
PRIMECAP Fund
Notes to Financial Statements
Vanguard PRIMECAP Fund is registered under the Investment Company Act of 1940 as an open-end investment company, or mutual fund. The fund offers two classes of shares: Investor Shares and Admiral Shares. Investor Shares are available to any investor who meets the fund’s minimum purchase requirements. Admiral Shares are designed for investors who meet certain administrative, service, and account-size criteria.
A. The following significant accounting policies conform to generally accepted accounting principles for U.S. investment companies. The fund consistently follows such policies in preparing its financial statements.
1. Security Valuation: Securities are valued as of the close of trading on the New York Stock Exchange (generally 4 p.m., Eastern time) on the valuation date. Equity securities are valued at the latest quoted sales prices or official closing prices taken from the primary market in which each security trades; such securities not traded on the valuation date are valued at the mean of the latest quoted bid and asked prices. Securities for which market quotations are not readily available, or whose values have been affected by events occurring before the fund’s pricing time but after the close of the securities’ primary markets, are valued at their fair values calculated according to procedures adopted by the board of trustees. These procedures include obtaining quotations from an independent pricing service, monitoring news to identify significant market- or security-specific events, and evaluating changes in the values of foreign market proxies (for example, ADRs, futures contracts, or exchange-traded funds), between the time the foreign markets close and the fund’s pricing time. When fair-value pricing is employed, the prices of securities used by a fund to calculate its net asset value may differ from quoted or published prices for the same securities. Investments in Vanguard Market Liquidity Fund are valued at that fund’s net asset value.
2. Foreign Currency: Securities and other assets and liabilities denominated in foreign currencies are translated into U.S. dollars using exchange rates obtained from an independent third party as of the fund’s pricing time on the valuation date. Realized gains (losses) and unrealized appreciation (depreciation) on investment securities include the effects of changes in exchange rates since the securities were purchased, combined with the effects of changes in security prices. Fluctuations in the value of other assets and liabilities resulting from changes in exchange rates are recorded as unrealized foreign currency gains (losses) until the assets or liabilities are settled in cash, at which time they are recorded as realized foreign currency gains (losses).
3. Federal Income Taxes: The fund intends to continue to qualify as a regulated investment company and distribute all of its taxable income. Management has analyzed the fund’s tax positions taken for all open federal income tax years (September 30, 2011–2014), and has concluded that no provision for federal income tax is required in the fund’s financial statements.
4. Distributions: Distributions to shareholders are recorded on the ex-dividend date.
5. Securities Lending: To earn additional income, the fund lends its securities to qualified institutional borrowers. Security loans are required to be secured at all times by collateral in an amount at least equal to the market value of securities loaned. Daily market fluctuations could cause the value of loaned securities to be more or less than the value of the collateral received. When this occurs, the collateral is adjusted and settled on the next business day. The fund further mitigates its counterparty risk by entering into securities lending transactions only with a diverse group of prequalified counterparties, monitoring their financial strength, and entering into master securities lending
21
PRIMECAP Fund
agreements with its counterparties. The master securities lending agreements provide that, in the event of a counterparty’s default (including bankruptcy), the fund may terminate any loans with that borrower, determine the net amount owed, and sell or retain the collateral up to the net amount owed to the fund; however, such actions may be subject to legal proceedings. While collateral mitigates counterparty risk, in the absence of a default the fund may experience delays and costs in recovering the securities loaned. The fund invests cash collateral received in Vanguard Market Liquidity Fund, and records a liability in the Statement of Net Assets for the return of the collateral, during the period the securities are on loan. Securities lending income represents fees charged to borrowers plus income earned on invested cash collateral, less expenses associated with the loan.
6. Credit Facility: The fund and certain other funds managed by The Vanguard Group participate in a $2.89 billion committed credit facility provided by a syndicate of lenders pursuant to a credit agreement that may be renewed annually; each fund is individually liable for its borrowings, if any, under the credit facility. Borrowings may be utilized for temporary and emergency purposes, and are subject to the fund’s regulatory and contractual borrowing restrictions. The participating funds are charged administrative fees and an annual commitment fee of 0.06% of the undrawn amount of the facility; these fees are allocated to the funds based on a method approved by the fund’s board of trustees and included in Management and Administrative expenses on the fund’s Statement of Operations. Any borrowings under this facility bear interest at a rate equal to the higher of the federal funds rate or LIBOR reference rate plus an agreed-upon spread.
The fund had no borrowings outstanding at September 30, 2014, or at any time during the period then ended.
7. Other: Dividend income is recorded on the ex-dividend date. Interest income includes income distributions received from Vanguard Market Liquidity Fund and is accrued daily. Security transactions are accounted for on the date securities are bought or sold. Costs used to determine realized gains (losses) on the sale of investment securities are those of the specific securities sold.
Each class of shares has equal rights as to assets and earnings, except that each class separately bears certain class-specific expenses related to maintenance of shareholder accounts (included in Management and Administrative expenses) and shareholder reporting. Marketing and distribution expenses are allocated to each class of shares based on a method approved by the board of trustees. Income, other non-class-specific expenses, and gains and losses on investments are allocated to each class of shares based on its relative net assets.
B. PRIMECAP Management Company provides investment advisory services to the fund for a fee calculated at an annual percentage rate of average net assets. For the year ended September 30, 2014, the investment advisory fee represented an effective annual rate of 0.20% of the fund’s average net assets.
C. The Vanguard Group furnishes at cost corporate management, administrative, marketing, and distribution services. The costs of such services are allocated to the fund based on methods approved by the board of trustees. The fund has committed to invest up to 0.40% of its net assets in Vanguard. At September 30, 2014, the fund had contributed capital of $4,375,000 to Vanguard (included in Other Assets), representing 0.01% of the fund’s net assets and 1.75% of Vanguard’s capitalization. The fund’s trustees and officers are also directors and officers of Vanguard.
22
PRIMECAP Fund
D. Various inputs may be used to determine the value of the fund’s investments. These inputs are summarized in three broad levels for financial statement purposes. The inputs or methodologies used to value securities are not necessarily an indication of the risk associated with investing in those securities.
Level 1—Quoted prices in active markets for identical securities.
Level 2—Other significant observable inputs (including quoted prices for similar securities, interest rates, prepayment speeds, credit risk, etc.).
Level 3—Significant unobservable inputs (including the fund’s own assumptions used to determine the fair value of investments).
The following table summarizes the market value of the fund’s investments as of September 30, 2014, based on the inputs used to value them:
| Level 1 | Level 2 | Level 3 | |
| Investments | ($000) | ($000) | ($000) |
| Common Stocks | 40,587,205 | 2,092,957 | — |
| Temporary Cash Investments | 1,831,829 | — | — |
| Total | 42,419,034 | 2,092,957 | — |
E. Distributions are determined on a tax basis and may differ from net investment income and realized capital gains for financial reporting purposes. Differences may be permanent or temporary. Permanent differences are reclassified among capital accounts in the financial statements to reflect their tax character. Temporary differences arise when certain items of income, expense, gain, or loss are recognized in different periods for financial statement and tax purposes. These differences will reverse at some time in the future. Differences in classification may also result from the treatment of short-term gains as ordinary income for tax purposes.
During the year ended September 30, 2014, the fund realized net foreign currency gains of $1,164,000 which increased distributable net income for tax purposes; accordingly, such gains have been reclassified from accumulated net realized gains to undistributed net investment income.
The fund used a tax accounting practice to treat a portion of the price of capital shares redeemed during the year as distributions from net investment income and realized capital gains. Accordingly, the fund has reclassified $31,955,000 from undistributed net investment income, and $142,858,000 from accumulated net realized gains, to paid-in capital.
For tax purposes, at September 30, 2014, the fund had $390,308,000 of ordinary income and $1,973,160,000 of long-term capital gains available for distribution.
At September 30, 2014, the cost of investment securities for tax purposes was $21,014,620,000. Net unrealized appreciation of investment securities for tax purposes was $23,497,371,000, consisting of unrealized gains of $24,379,530,000 on securities that had risen in value since their purchase and $882,159,000 in unrealized losses on securities that had fallen in value since their purchase.
F. During the year ended September 30, 2014, the fund purchased $4,235,792,000 of investment securities and sold $4,583,824,000 of investment securities, other than temporary cash investments.
23
PRIMECAP Fund
| G. Capital share transactions for each class of shares were: | ||||
| Year Ended September 30, | ||||
| 2014 | 2013 | |||
| Amount | Shares | Amount | Shares | |
| ($000) | (000) | ($000) | (000) | |
| Investor Shares | ||||
| Issued | 603,070 | 6,273 | 668,647 | 8,660 |
| Issued in Lieu of Cash Distributions | 642,435 | 7,204 | 313,404 | 4,485 |
| Redeemed | (3,389,023) | (34,742) | (4,884,777) | (60,900) |
| Net Increase (Decrease)—Investor Shares | (2,143,518) | (21,265) | (3,902,726) | (47,755) |
| Admiral Shares | ||||
| Issued | 4,000,605 | 39,585 | 4,361,547 | 51,652 |
| Issued in Lieu of Cash Distributions | 1,203,134 | 13,011 | 378,497 | 5,223 |
| Redeemed | (1,971,127) | (19,659) | (1,955,533) | (24,968) |
| Net Increase (Decrease)—Admiral Shares | 3,232,612 | 32,937 | 2,784,511 | 31,907 |
H. Certain of the fund’s investments were in companies that were considered to be affiliated companies of the fund because the fund owned more than 5% of the outstanding voting securities of the company. Transactions during the period in securities of these companies were as follows:
| Current Period Transactions | |||||
| Sept. 30, 2013 | Proceeds from | Sept. 30, 2014 | |||
| Market | Purchases | Securities | Dividend | Market | |
| Value | at Cost | Sold | Income | Value | |
| ($000) | ($000) | ($000) | ($000) | ($000) | |
| Plantronics Inc. | 170,454 | — | — | 1,851 | 176,858 |
| Southwest Airlines Co. | NA1 | — | — | 6,912 | 1,167,068 |
| Total | 170,454 | 8,763 | 1,343,926 | ||
I. Management has determined that no material events or transactions occurred subsequent to September 30, 2014, that would require recognition or disclosure in these financial statements.
24
Report of Independent Registered Public Accounting Firm
To the Board of Trustees of Vanguard Chester Funds and the Shareholders of Vanguard PRIMECAP Fund:
In our opinion, the accompanying statement of net assets and the related statements of operations and of changes in net assets and the financial highlights present fairly, in all material respects, the financial position of Vanguard PRIMECAP Fund (constituting a separate portfolio of Vanguard Chester Funds, hereafter referred to as the “Fund”) at September 30, 2014, the results of its operations for the year then ended, the changes in its net assets for each of the two years in the period then ended, and the financial highlights for each of the five years in the period then ended, in conformity with accounting principles generally accepted in the United States of America. These financial statements and financial highlights (hereafter referred to as “financial statements”) are the responsibility of the Fund’s management. Our responsibility is to express an opinion on these financial statements based on our audits. We conducted our audits of these financial statements in accordance with the standards of the Public Company Accounting Oversight Board (United States). Those standards require that we plan and perform the audit to obtain reasonable assurance about whether the financial statements are free of material misstatement. An audit includes examining, on a test basis, evidence supporting the amounts and disclosures in the financial statements, assessing the accounting principles used and significant estimates made by management, and evaluating the overall financial statement presentation. We believe that our audits, which included confirmation of securities at September 30, 2014 by correspondence with the custodian and by agreement to the underlying ownership records of the transfer agent, provide a reasonable basis for our opinion.
/s/PricewaterhouseCoopers LLP
Philadelphia, Pennsylvania
November 10, 2014

Special 2014 tax information (unaudited) for Vanguard PRIMECAP Fund
This information for the fiscal year ended September 30, 2014, is included pursuant to provisions of the Internal Revenue Code.
The fund distributed $1,675,393,000 as capital gain dividends (from net long-term capital gains) to shareholders during the fiscal year.
For non-resident alien shareholders, 100% of short-term capital gain dividends distributed by the fund are qualified short-term capital gains.
The fund distributed $380,064,000 of qualified dividend income to shareholders during the fiscal year.
For corporate shareholders, 98.5% of investment income (dividend income plus short-term gains, if any) qualifies for the dividends-received deduction.
25
Your Fund’s After-Tax Returns
This table presents returns for your fund both before and after taxes. The after-tax returns are shown in two ways: (1) assuming that an investor owned the fund during the entire period and paid taxes on the fund’s distributions, and (2) assuming that an investor paid taxes on the fund’s distributions and sold all shares at the end of each period.
Calculations are based on the highest individual federal income tax and capital gains tax rates in effect at the times of the distributions and the hypothetical sales. State and local taxes were not considered. After-tax returns reflect any qualified dividend income, using actual prior-year figures and estimates for 2014. (In the example, returns after the sale of fund shares may be higher than those assuming no sale. This occurs when the sale would have produced a capital loss. The calculation assumes that the investor received a tax deduction for the loss.)
The table shows returns for Investor Shares only; returns for other share classes will differ. Please note that your actual after-tax returns will depend on your tax situation and may differ from those shown. Also note that if you own the fund in a tax-deferred account, such as an individual retirement account or a 401(k) plan, this information does not apply to you. Such accounts are not subject to current taxes.
Finally, keep in mind that a fund’s performance—whether before or after taxes—does not guarantee future results.
Average Annual Total Returns: PRIMECAP Fund Investor Shares
Periods Ended September 30, 2014
| One | Five | Ten | |
| Year | Years | Years | |
| Returns Before Taxes | 24.72% | 16.95% | 10.56% |
| Returns After Taxes on Distributions | 23.26 | 16.35 | 9.86 |
| Returns After Taxes on Distributions and Sale of Fund Shares | 14.90 | 13.70 | 8.66 |
26
About Your Fund’s Expenses
As a shareholder of the fund, you incur ongoing costs, which include costs for portfolio management, administrative services, and shareholder reports (like this one), among others. Operating expenses, which are deducted from a fund’s gross income, directly reduce the investment return of the fund.
A fund’s expenses are expressed as a percentage of its average net assets. This figure is known as the expense ratio. The following examples are intended to help you understand the ongoing costs (in dollars) of investing in your fund and to compare these costs with those of other mutual funds. The examples are based on an investment of $1,000 made at the beginning of the period shown and held for the entire period.
The accompanying table illustrates your fund’s costs in two ways:
• Based on actual fund return. This section helps you to estimate the actual expenses that you paid over the period. The ”Ending Account Value“ shown is derived from the fund‘s actual return, and the third column shows the dollar amount that would have been paid by an investor who started with $1,000 in the fund. You may use the information here, together with the amount you invested, to estimate the expenses that you paid over the period.
To do so, simply divide your account value by $1,000 (for example, an $8,600 account value divided by $1,000 = 8.6), then multiply the result by the number given for your fund under the heading ”Expenses Paid During Period.“
• Based on hypothetical 5% yearly return. This section is intended to help you compare your fund‘s costs with those of other mutual funds. It assumes that the fund had a yearly return of 5% before expenses, but that the expense ratio is unchanged. In this case—because the return used is not the fund’s actual return—the results do not apply to your investment. The example is useful in making comparisons because the Securities and Exchange Commission requires all mutual funds to calculate expenses based on a 5% return. You can assess your fund’s costs by comparing this hypothetical example with the hypothetical examples that appear in shareholder reports of other funds.
Note that the expenses shown in the table are meant to highlight and help you compare ongoing costs only and do not reflect transaction costs incurred by the fund for buying and selling securities. Further, the expenses do not include any purchase, redemption, or account service fees described in the fund prospectus. If such fees were applied to your account, your costs would be higher. Your fund does not carry a “sales load.”
The calculations assume no shares were bought or sold during the period. Your actual costs may have been higher or lower, depending on the amount of your investment and the timing of any purchases or redemptions.
You can find more information about the fund’s expenses, including annual expense ratios, in the Financial Statements section of this report. For additional information on operating expenses and other shareholder costs, please refer to your fund’s current prospectus.
27
| Six Months Ended September 30, 2014 | |||
| Beginning | Ending | Expenses | |
| Account Value | Account Value | Paid During | |
| PRIMECAP Fund | 3/31/2014 | 9/30/2014 | Period |
| Based on Actual Fund Return | |||
| Investor Shares | $1,000.00 | $1,074.15 | $2.29 |
| Admiral Shares | 1,000.00 | 1,074.67 | 1.82 |
| Based on Hypothetical 5% Yearly Return | |||
| Investor Shares | $1,000.00 | $1,022.86 | $2.23 |
| Admiral Shares | 1,000.00 | 1,023.31 | 1.78 |
period are 0.44% for Investor Shares and 0.35% for Admiral Shares. The dollar amounts shown as “Expenses Paid” are equal to the
annualized expense ratio multiplied by the average account value over the period, multiplied by the number of days in the most recent
six-month period, then divided by the number of days in the most recent 12-month period.
28
Trustees Approve Advisory Arrangement
The board of trustees of Vanguard PRIMECAP Fund has renewed the fund’s investment advisory arrangement with PRIMECAP Management Company (PRIMECAP Management). The board determined that renewing the fund’s advisory arrangement was in the best interests of the fund and its shareholders.
The board based its decision upon an evaluation of the advisor’s investment staff, portfolio management process, and performance. The trustees considered the factors discussed below, among others. However, no single factor determined whether the board approved the arrangement. Rather, it was the totality of the circumstances that drove the board’s decision.
Nature, extent, and quality of services
The board considered the quality of the fund’s investment management services over both the short and long term, and took into account the organizational depth and stability of the advisor. The board noted that PRIMECAP Management, founded in 1983, is recognized for its long-term approach to growth equity investing. Four experienced portfolio managers are responsible for separate subport-folios, and each portfolio manager employs a fundamental, research-driven approach in seeking to identify companies that have long-term growth potential overlooked by the market and are trading at attractive valuation levels. The firm has managed the fund since its inception in 1984.
The board concluded that the advisor’s experience, stability, depth, and performance, among other factors, warranted continuation of the advisory arrangement.
Investment performance
The board considered the short- and long-term performance of the fund, including any periods of outperformance or underperformance relative to a benchmark index and peer group. The board concluded that the performance was such that the advisory arrangement should continue. Information about the fund’s most recent performance can be found in the Performance Summary section of this report.
Cost
The board concluded that the fund’s expense ratio was well below the average expense ratio charged by funds in its peer group and that the fund’s advisory fee rate was also well below its peer-group average. Information about the fund’s expenses appears in the About Your Fund’s Expenses section of this report as well as in the Financial Statements section, which also includes information about the fund’s advisory fee rate.
The board did not consider profitability of PRIMECAP Management in determining whether to approve the advisory fee, because PRIMECAP Management is independent of Vanguard and the advisory fee is the result of arm’s-length negotiations.
The benefit of economies of scale
The board concluded that the fund’s shareholders benefit from economies of scale because of breakpoints in the advisory fee schedule. The breakpoints reduce the effective rate of the fee as the fund’s assets increase.
The board will consider whether to renew the advisory arrangement again after a one-year period.
29
Glossary
30-Day SEC Yield. A fund’s 30-day SEC yield is derived using a formula specified by the U.S. Securities and Exchange Commission. Under the formula, data related to the fund’s security holdings in the previous 30 days are used to calculate the fund’s hypothetical net income for that period, which is then annualized and divided by the fund’s estimated average net assets over the calculation period. For the purposes of this calculation, a security’s income is based on its current market yield to maturity (for bonds), its actual income (for asset-backed securities), or its projected dividend yield (for stocks). Because the SEC yield represents hypothetical annualized income, it will differ—at times significantly—from the fund’s actual experience. As a result, the fund’s income distributions may be higher or lower than implied by the SEC yield.
Beta. A measure of the magnitude of a fund’s past share-price fluctuations in relation to the ups and downs of a given market index. The index is assigned a beta of 1.00. Compared with a given index, a fund with a beta of 1.20 typically would have seen its share price rise or fall by 12% when the index rose or fell by 10%. For this report, beta is based on returns over the past 36 months for both the fund and the index. Note that a fund’s beta should be reviewed in conjunction with its R-squared (see definition). The lower the R-squared, the less correlation there is between the fund and the index, and the less reliable beta is as an indicator of volatility.
Dividend Yield. Dividend income earned by stocks, expressed as a percentage of the aggregate market value (or of net asset value, for a fund). The yield is determined by dividing the amount of the annual dividends by the aggregate value (or net asset value) at the end of the period. For a fund, the dividend yield is based solely on stock holdings and does not include any income produced by other investments.
Earnings Growth Rate. The average annual rate of growth in earnings over the past five years for the stocks now in a fund.
Equity Exposure. A measure that reflects a fund’s investments in stocks and stock futures. Any holdings in short-term reserves are excluded.
Expense Ratio. A fund’s total annual operating expenses expressed as a percentage of the fund’s average net assets. The expense ratio includes management and administrative expenses, but does not include the transaction costs of buying and selling portfolio securities.
Foreign Holdings. The percentage of a fund represented by securities or depositary receipts of companies based outside the United States.
Inception Date. The date on which the assets of a fund (or one of its share classes) are first invested in accordance with the fund’s investment objective. For funds with a subscription period, the inception date is the day after that period ends. Investment performance is measured from the inception date.
Median Market Cap. An indicator of the size of companies in which a fund invests; the midpoint of market capitalization (market price x shares outstanding) of a fund’s stocks, weighted by the proportion of the fund’s assets invested in each stock. Stocks representing half of the fund’s assets have market capitalizations above the median, and the rest are below it.
Price/Book Ratio. The share price of a stock divided by its net worth, or book value, per share. For a fund, the weighted average price/book ratio of the stocks it holds.
30
Price/Earnings Ratio. The ratio of a stock’s current price to its per-share earnings over the past year. For a fund, the weighted average P/E of the stocks it holds. P/E is an indicator of market expectations about corporate prospects; the higher the P/E, the greater the expectations for a company’s future growth.
R-Squared. A measure of how much of a fund’s past returns can be explained by the returns from the market in general, as measured by a given index. If a fund’s total returns were precisely synchronized with an index’s returns, its R-squared would be 1.00. If the fund’s returns bore no relationship to the index’s returns, its R-squared would be 0. For this report, R-squared is based on returns over the past 36 months for both the fund and the index.
Return on Equity. The annual average rate of return generated by a company during the past five years for each dollar of shareholder’s equity (net income divided by shareholder’s equity). For a fund, the weighted average return on equity for the companies whose stocks it holds.
Short-Term Reserves. The percentage of a fund invested in highly liquid, short-term securities that can be readily converted to cash.
Turnover Rate. An indication of the fund’s trading activity. Funds with high turnover rates incur higher transaction costs and may be more likely to distribute capital gains (which may be taxable to investors). The turnover rate excludes in-kind transactions, which have minimal impact on costs.
31
The People Who Govern Your Fund
The trustees of your mutual fund are there to see that the fund is operated and managed in your best interests since, as a shareholder, you are a part owner of the fund. Your fund’s trustees also serve on the board of directors of The Vanguard Group, Inc., which is owned by the Vanguard funds and provides services to them on an at-cost basis.
A majority of Vanguard’s board members are independent, meaning that they have no affiliation with Vanguard or the funds they oversee, apart from the sizable personal investments they have made as private individuals. The independent board members have distinguished backgrounds in business, academia, and public service. Each of the trustees and executive officers oversees 177 Vanguard funds.
The following table provides information for each trustee and executive officer of the fund. More information about the trustees is in the Statement of Additional Information, which can be obtained, without charge, by contacting Vanguard at 800-662-7447, or online at vanguard.com.
| InterestedTrustee1 | and Delphi Automotive LLP (automotive components); |
| Senior Advisor at New Mountain Capital. | |
| F. William McNabb III | |
| Born 1957. Trustee Since July 2009. Chairman of the | Amy Gutmann |
| Board. Principal Occupation(s) During the Past Five | Born 1949. Trustee Since June 2006. Principal |
| Years: Chairman of the Board of The Vanguard Group, | Occupation(s) During the Past Five Years: President of |
| Inc., and of each of the investment companies served | the University of Pennsylvania; Christopher H. Browne |
| by The Vanguard Group, since January 2010; Director | Distinguished Professor of Political Science, School of |
| of The Vanguard Group since 2008; Chief Executive | Arts and Sciences, and Professor of Communication, |
| Officer and President of The Vanguard Group, and of | Annenberg School for Communication, with secondary |
| each of the investment companies served by The | faculty appointments in the Department of Philosophy, |
| Vanguard Group, since 2008; Director of Vanguard | School of Arts and Sciences, and at the Graduate |
| Marketing Corporation; Managing Director of The | School of Education, University of Pennsylvania; |
| Vanguard Group (1995–2008). | Trustee of the National Constitution Center; Chair |
| of the Presidential Commission for the Study of | |
| Bioethical Issues. | |
| IndependentTrustees | |
| JoAnn Heffernan Heisen | |
| Emerson U. Fullwood | Born 1950. Trustee Since July 1998. Principal |
| Born 1948. Trustee Since January 2008. Principal | Occupation(s) During the Past Five Years: Corporate |
| Occupation(s) During the Past Five Years: Executive | Vice President and Chief Global Diversity Officer |
| Chief Staff and Marketing Officer for North America | (retired 2008) and Member of the Executive |
| and Corporate Vice President (retired 2008) of Xerox | Committee (1997–2008) of Johnson & Johnson |
| Corporation (document management products and | (pharmaceuticals/medical devices/consumer |
| services); Executive in Residence and 2009–2010 | products); Director of Skytop Lodge Corporation |
| Distinguished Minett Professor at the Rochester | (hotels), the University Medical Center at Princeton, |
| Institute of Technology; Director of SPX Corporation | the Robert Wood Johnson Foundation, and the Center |
| (multi-industry manufacturing), the United Way of | for Talent Innovation; Member of the Advisory Board |
| Rochester, Amerigroup Corporation (managed health | of the Maxwell School of Citizenship and Public Affairs |
| care), the University of Rochester Medical Center, | at Syracuse University. |
| Monroe Community College Foundation, and North | |
| Carolina A&T University. | F. Joseph Loughrey |
| Born 1949. Trustee Since October 2009. Principal | |
| Rajiv L. Gupta | Occupation(s) During the Past Five Years: President |
| Born 1945. Trustee Since December 2001.2 | and Chief Operating Officer (retired 2009) of Cummins |
| Principal Occupation(s) During the Past Five Years: | Inc. (industrial machinery); Chairman of the BoardInc. |
| Chairman and Chief Executive Officer (retired 2009) | of Hillenbrand, Inc. (specialized consumer services), |
| and President (2006–2008) of Rohm and Haas Co. | and of Oxfam America; Director of SKF AB (industrial |
| (chemicals); Director of Tyco International, Ltd. | machinery), Hyster-Yale Materials Handling, Inc. |
| (diversified manufacturing and services), Hewlett- | (forklift trucks), the Lumina Foundation for Education, |
| Packard Co. (electronic computer manufacturing), |
| and the V Foundation for Cancer Research; Member | Executive Officers | |
| of the Advisory Council for the College of Arts and | ||
| Letters and of the Advisory Board to the Kellogg | Glenn Booraem | |
| Institute for International Studies, both at the | Born 1967. Controller Since July 2010. Principal | |
| University of Notre Dame. | Occupation(s) During the Past Five Years: Principal | |
| of The Vanguard Group, Inc.; Controller of each of | ||
| Mark Loughridge | the investment companies served by The Vanguard | |
| Born 1953. Trustee Since March 2012. Principal | Group; Assistant Controller of each of the investment | |
| Occupation(s) During the Past Five Years: Senior Vice | companies served by The Vanguard Group (2001–2010). | |
| President and Chief Financial Officer (retired 2013) | ||
| at IBM (information technology services); Fiduciary | Thomas J. Higgins | |
| Member of IBM’s Retirement Plan Committee (2004– | Born 1957. Chief Financial Officer Since September | |
| 2013); Member of the Council on Chicago Booth. | 2008. Principal Occupation(s) During the Past Five | |
| Years: Principal of The Vanguard Group, Inc.; Chief | ||
| Scott C. Malpass | Financial Officer of each of the investment companies | |
| Born 1962. Trustee Since March 2012. Principal | served by The Vanguard Group; Treasurer of each of | |
| Occupation(s) During the Past Five Years: Chief | the investment companies served by The Vanguard | |
| Investment Officer and Vice President at the University | Group (1998–2008). | |
| of Notre Dame; Assistant Professor of Finance at the | ||
| Mendoza College of Business at Notre Dame; Member | Kathryn J. Hyatt | |
| of the Notre Dame 403(b) Investment Committee; | Born 1955. Treasurer Since November 2008. Principal | |
| Board Member of TIFF Advisory Services, Inc. | Occupation(s) During the Past Five Years: Principal of | |
| (investment advisor); Member of the Investment | The Vanguard Group, Inc.; Treasurer of each of the | |
| Advisory Committees of the Financial Industry | investment companies served by The Vanguard | |
| Regulatory Authority (FINRA) and of Major League | Group; Assistant Treasurer of each of the investment | |
| Baseball. | companies served by The Vanguard Group (1988–2008). | |
| André F. Perold | Heidi Stam | |
| Born 1952. Trustee Since December 2004. Principal | Born 1956. Secretary Since July 2005. Principal | |
| Occupation(s) During the Past Five Years: George | Occupation(s) During the Past Five Years: Managing | |
| Gund Professor of Finance and Banking, Emeritus | Director of The Vanguard Group, Inc.; General Counsel | |
| at the Harvard Business School (retired 2011); | of The Vanguard Group; Secretary of The Vanguard | |
| Chief Investment Officer and Managing Partner of | Group and of each of the investment companies | |
| HighVista Strategies LLC (private investment firm); | served by The Vanguard Group; Director and Senior | |
| Director of Rand Merchant Bank; Overseer of the | Vice President of Vanguard Marketing Corporation. | |
| Museum of Fine Arts Boston. | ||
| Vanguard Senior ManagementTeam | ||
| Alfred M. Rankin, Jr. | ||
| Born 1941. Trustee Since January 1993. Principal | Mortimer J. Buckley | Chris D. McIsaac |
| Occupation(s) During the Past Five Years: Chairman, | Kathleen C. Gubanich | Michael S. Miller |
| President, and Chief Executive Officer of NACCO | Paul A. Heller | James M. Norris |
| Industries, Inc. (housewares/lignite), and of Hyster- | Martha G. King | Glenn W. Reed |
| Yale Materials Handling, Inc. (forklift trucks); Chairman | John T. Marcante | |
| of the Board of University Hospitals of Cleveland. | ||
| Peter F. Volanakis | Chairman Emeritus and Senior Advisor | |
| Born 1955. Trustee Since July 2009. Principal | ||
| Occupation(s) During the Past Five Years: President | John J. Brennan | |
| and Chief Operating Officer (retired 2010) of Corning | Chairman, 1996–2009 | |
| Incorporated (communications equipment); Trustee of | Chief Executive Officer and President, 1996–2008 | |
| Colby-Sawyer College; Member of the Advisory Board | ||
| of the Norris Cotton Cancer Center and of the Advisory | Founder | |
| Board of the Parthenon Group (strategy consulting). | ||
| John C. Bogle | ||
| Chairman and Chief Executive Officer, 1974–1996 | ||
1 Mr. McNabb is considered an “interested person,” as defined in the Investment Company Act of 1940, because he is an officer of the
Vanguard funds.
2 December 2002 for Vanguard Equity Income Fund, the Vanguard Municipal Bond Funds, and the Vanguard State Tax-Exempt Funds.
| |
P.O. Box 2600 | |
| Valley Forge, PA 19482-2600 | |
| Connect with Vanguard® > vanguard.com | |
| Fund Information > 800-662-7447 | |
| Direct Investor Account Services > 800-662-2739 | |
| Institutional Investor Services > 800-523-1036 | |
| Text Telephone for People | |
| Who Are Deaf or Hard of Hearing> 800-749-7273 | |
| This material may be used in conjunction | |
| with the offering of shares of any Vanguard | |
| fund only if preceded or accompanied by | |
| the fund’s current prospectus. | |
| All comparative mutual fund data are from Lipper, a | |
| Thomson Reuters Company, or Morningstar, Inc., unless | |
| otherwise noted. | |
| You can obtain a free copy of Vanguard’s proxy voting | |
| guidelines by visiting vanguard.com/proxyreporting or by | |
| calling Vanguard at 800-662-2739. The guidelines are | |
| also available from the SEC’s website, sec.gov. In | |
| addition, you may obtain a free report on how your fund | |
| voted the proxies for securities it owned during the 12 | |
| months ended June 30. To get the report, visit either | |
| vanguard.com/proxyreporting or sec.gov. | |
| You can review and copy information about your fund at | |
| the SEC’s Public Reference Room in Washington, D.C. To | |
| find out more about this public service, call the SEC at | |
| 202-551-8090. Information about your fund is also | |
| available on the SEC’s website, and you can receive | |
| copies of this information, for a fee, by sending a | |
| request in either of two ways: via e-mail addressed to | |
| publicinfo@sec.gov or via regular mail addressed to the | |
| Public Reference Section, Securities and Exchange | |
| Commission, Washington, DC 20549-1520. | |
| © 2014 The Vanguard Group, Inc. | |
| All rights reserved. | |
| Vanguard Marketing Corporation, Distributor. | |
| Q590 112014 | |

Annual Report | September 30, 2014
Vanguard Target Retirement Funds
Vanguard Target Retirement Income Fund Vanguard Target Retirement 2010 Fund Vanguard Target Retirement 2015 Fund Vanguard Target Retirement 2020 Fund Vanguard Target Retirement 2025 Fund Vanguard Target Retirement 2030 Fund
The mission continues
On May 1, 1975, Vanguard began operations, a fledgling company based on the simple but revolutionary idea that a mutual fund company should be managed solely in the interest of its investors.
Four decades later, that revolutionary spirit continues to animate the enterprise. Vanguard remains on a mission to give investors the best chance of investment success.
As we mark our 40th anniversary, we thank you for entrusting your assets to Vanguard and giving us the opportunity to help you reach your financial goals in the decades to come.
| Contents | |
| Your Fund’s Total Returns. | 1 |
| Chairman’s Letter. | 2 |
| Target Retirement Income Fund. | 10 |
| Target Retirement 2010 Fund. | 21 |
| Target Retirement 2015 Fund. | 31 |
| Target Retirement 2020 Fund. | 42 |
| Target Retirement 2025 Fund. | 53 |
| Target Retirement 2030 Fund. | 64 |
| Your Fund’s After-Tax Returns. | 77 |
| About Your Fund’s Expenses. | 79 |
| Glossary. | 81 |
Please note: The opinions expressed in this report are just that—informed opinions. They should not be considered promises or advice.
Also, please keep in mind that the information and opinions cover the period through the date on the front of this report. Of course, the
risks of investing in your fund are spelled out in the prospectus.
See the Glossary for definitions of investment terms used in this report.
About the cover: Since our founding, Vanguard has drawn inspiration from the enterprise and valor demonstrated by British
naval hero Horatio Nelson and his command at the Battle of the Nile in 1798. The photograph displays a replica of a merchant
ship from the same era as Nelson’s flagship, the HMS Vanguard.
Your Fund’s Total Returns
Fiscal Year Ended September 30, 2014
| Total | |
| Returns | |
| Vanguard Target Retirement Income Fund | 6.47% |
| Target Income Composite Index | 6.73 |
| Spliced Mixed-Asset Target Today Funds Average | 5.19 |
| Spliced Mixed-Asset Target Today Funds Average: Derived from data provided by Lipper, a Thomson Reuters Company. | |
Vanguard Target Retirement 2010 Fund | 7.55% |
| Target 2010 Composite Index | 7.83 |
| Mixed-Asset Target 2010 Funds Average | 6.31 |
| Mixed-Asset Target 2010 Funds Average: Derived from data provided by Lipper, a Thomson Reuters Company. | |
Vanguard Target Retirement 2015 Fund | 9.07% |
| Target 2015 Composite Index | 9.32 |
| Mixed-Asset Target 2015 Funds Average | 6.79 |
| Mixed-Asset Target 2015 Funds Average: Derived from data provided by Lipper, a Thomson Reuters Company. | |
Vanguard Target Retirement 2020 Fund | 10.13% |
| Target 2020 Composite Index | 10.45 |
| Mixed-Asset Target 2020 Funds Average | 7.43 |
| Mixed-Asset Target 2020 Funds Average: Derived from data provided by Lipper, a Thomson Reuters Company. | |
Vanguard Target Retirement 2025 Fund | 10.80% |
| Target 2025 Composite Index | 11.15 |
| Mixed-Asset Target 2025 Funds Average | 8.78 |
| Mixed-Asset Target 2025 Funds Average: Derived from data provided by Lipper, a Thomson Reuters Company. | |
Vanguard Target Retirement 2030 Fund | 11.51% |
Target 2030 Composite Index | 11.86 |
| Mixed-Asset Target 2030 Funds Average | 9.16 |
| Mixed-Asset Target 2030 Funds Average: Derived from data provided by Lipper, a Thomson Reuters Company. | |
| For a benchmark description, see the Glossary. | |
Investments in Target Retirement Funds are subject to the risks of their underlying funds. The year in the fund name
refers to the approximate year (the target date) when an investor in the fund would retire and leave the work force.
The fund will gradually shift its emphasis from more aggressive investments to more conservative ones based on its
target date. An investment in a Target Retirement Fund is not guaranteed at any time, including on or after the target
date.
1

Chairman’s Letter
Dear Shareholder,
Despite recent volatility in the global markets, both domestic and international equity and fixed income investments posted positive results for the 12 months ended September 30, 2014. U.S. stocks produced the strongest results, significantly outperforming their international counterparts, as well as U.S. and international bonds.
Returns for the six Vanguard Target Retirement Funds covered in this report were positive for the period, ranging from 6.47% for Vanguard Target Retirement Income Fund to 11.51% for Vanguard Target Retirement 2030 Fund. (The funds with retirement dates of 2035 through 2060 are covered in a separate report.) Given the investment environment, it’s not surprising that the funds with a greater exposure to equities returned more than those with a heavier allocation to bonds.
Even with spells of patchiness, stocks posted strong returns
The broad U.S. stock market managed a robust return of nearly 18% for the 12 months ended September 30, despite stumbling later in the period. Generally strong corporate profits and progress in the U.S. economy carried the markets through most of the fiscal year. As the period drew to a close, however, high stock valuations, international tensions, the unsettled global economy, and the Federal Reserve’s gradual shift from accommodative policies weighed on results.
2
During the final months of the fiscal year, the performance gap between U.S. and international stocks widened amid tensions in the Middle East and Ukraine and anxiety over China’s slower growth and Europe’s slumping economy. In the end, international stocks returned about 5%. Emerging markets returned more than 6%, ahead of developed European markets; weakness in Japan weighed on the developed Pacific region.
Bonds bounced back strongly despite a pause late in the year
Bond returns, which were surprisingly robust through most of the fiscal year, also met resistance late in the period. Still, the broad U.S. taxable bond market returned 3.96%, a significant recovery from its negative outcome a year ago.
Since January, the Fed has pared back its bond-buying program, with the aim of ending it in October. For most of the fiscal year, interest rates did not rise as analysts had predicted. The yield of the 10-year U.S. Treasury note ended September at 2.48%, down from 2.63% a year earlier. (Bond prices and yields move in opposite directions.)
Municipal bonds returned 7.93% as strong investor demand and a limited supply of new issues helped drive up prices.
After this advance for U.S. taxable and tax-exempt bonds, it’s worth remembering that the current low yields imply lower future returns: As yields drop, the scope for further declines—and increases in prices—diminishes.
| Market Barometer | |||
| Average Annual Total Returns | |||
| Periods Ended September 30, 2014 | |||
| One | Three | Five | |
| Year | Years | Years | |
| Stocks | |||
| Russell 1000 Index (Large-caps) | 19.01% | 23.23% | 15.90% |
| Russell 2000 Index (Small-caps) | 3.93 | 21.26 | 14.29 |
| Russell 3000 Index (Broad U.S. market) | 17.76 | 23.08 | 15.78 |
| FTSE All-World ex US Index (International) | 5.11 | 12.12 | 6.31 |
| Bonds | |||
| Barclays U.S. Aggregate Bond Index (Broad taxable market) | 3.96% | 2.43% | 4.12% |
| Barclays Municipal Bond Index (Broad tax-exempt market) | 7.93 | 4.56 | 4.67 |
| Citigroup Three-Month U.S. Treasury Bill Index | 0.04 | 0.04 | 0.06 |
| CPI | |||
| Consumer Price Index | 1.66% | 1.61% | 1.96% |
3
Money market funds and savings accounts posted negligible returns, as the Fed kept its target for short-term interest rates to 0%–0.25%.
International bond markets (as measured by the Barclays Global Aggregate Index ex USD) returned –0.81% after sinking in September.
Stock-focused funds outpaced more conservative funds
Vanguard Target Retirement Funds offer a straightforward approach to a complex problem: how to invest successfully for retirement. These “fund of funds” invest in Vanguard’s broadest index funds, giving investors access to thousands of U.S. and international stocks and bonds, including exposure to the major market sectors and segments.
The funds’ managers seek to handle stock market risk by gradually shifting each fund’s asset allocation from stocks to bonds, becoming more conservative as the fund nears its target retirement date. Once its target date is reached, each fund continues to adjust until it enters an income phase, when the portfolio will convert to the Target Retirement Income Fund. The Income Fund, which represents a static allocation of about 70% bonds and 30% stocks, is mostly focused on helping investors generate income and preserve their wealth.
| Expense Ratios | ||
| Your Fund Compared With Its Peer Group | ||
| Acquired Fund Fees | Peer Group | |
| and Expenses | Average | |
| Target Retirement Income Fund | 0.16% | 1.01% |
| Target Retirement 2010 Fund | 0.16 | 0.54 |
| Target Retirement 2015 Fund | 0.16 | 0.49 |
| Target Retirement 2020 Fund | 0.16 | 0.57 |
| Target Retirement 2025 Fund | 0.17 | 0.49 |
| Target Retirement 2030 Fund | 0.17 | 0.56 |
the expense ratios and any transaction fees charged by the underlying mutual funds (the ”acquired” funds) in which the Target Retirement
Funds invest. The Target Retirement Funds do not charge any expenses or fees of their own. For the fiscal year ended September 30, 2014,
the acquired fund fees and expenses were 0.16% for the Income Fund, 0.16% for the 2010 Fund, 0.16% for the 2015 Fund, 0.16% for the 2020
Fund, 0.17% for the 2025 Fund, and 0.17% for the 2030 Fund. Peer-group expense ratios are derived from data provided by Lipper, a Thomson
Reuters Company, and capture information through year-end 2013.
Peer groups: For the Income Fund, Mixed-Asset Target Today Funds Average; for the 2010 Fund, Mixed-Asset Target 2010 Funds; for the 2015
Fund, Mixed-Asset Target 2015 Funds; for the 2020 Fund, Mixed-Asset Target 2020 Funds; for the 2025 Fund, Mixed-Asset Target 2025 Funds;
and for the Target Retirement 2030 Fund, Mixed-Asset Target 2030 Funds.
4
| Total Returns | |
| Ten Years Ended September 30, 2014 | |
| Average | |
| Annual Return | |
| Target Retirement Income Fund | 5.52% |
| Target Income Composite Index | 5.55 |
| Spliced Mixed-Asset Target Today Funds Average | 4.34 |
| Spliced Mixed-Asset Target Today Funds Average: Derived from data provided by Lipper, a Thomson Reuters Company. | |
| Target Retirement 2010 Fund (Returns since inception: 6/7/2006) | 5.96% |
| Target 2010 Composite Index | 5.96 |
| Mixed-Asset Target 2010 Funds Average | 4.59 |
| Mixed-Asset Target 2010 Funds Average: Derived from data provided by Lipper, a Thomson Reuters Company. | |
| Target Retirement 2015 Fund | 6.32% |
| Target 2015 Composite Index | 6.33 |
| Mixed-Asset Target 2015 Funds Average | 4.98 |
| Mixed-Asset Target 2015 Funds Average: Derived from data provided by Lipper, a Thomson Reuters Company. | |
| Target Retirement 2020 Fund (Returns since inception: 6/7/2006) | 6.42% |
| Target 2020 Composite Index | 6.54 |
| Mixed-Asset Target 2020 Funds Average | 4.89 |
| Mixed-Asset Target 2020 Funds Average: Derived from data provided by Lipper, a Thomson Reuters Company. | |
| Target Retirement 2025 Fund | 6.67% |
| Target 2025 Composite Index | 6.80 |
| Mixed-Asset Target 2025 Funds Average | 6.04 |
| Mixed-Asset Target 2025 Funds Average: Derived from data provided by Lipper, a Thomson Reuters Company. | |
| Target Retirement 2030 Fund (Returns since inception: 6/7/2006) | 6.53% |
| Target 2030 Composite Index | 6.67 |
| Mixed-Asset Target 2030 Funds Average | 5.18 |
| Mixed-Asset Target 2030 Funds Average: Derived from data provided by Lipper, a Thomson Reuters Company. | |
| For a benchmark description, see the Glossary. | |
The figures shown represent past performance, which is not a guarantee of future results. (Current performance may be
lower or higher than the performance data cited. For performance data current to the most recent month-end, visit our
website at vanguard.com/performance.) Note, too, that both investment returns and principal value can fluctuate widely, so
an investor’s shares, when sold, could be worth more or less than their original cost.
5
As I mentioned earlier in this letter, the funds’ results for the most recent fiscal period largely depended on their equity allocation. A greater exposure to stocks meant a greater return: The Target Retirement 2030 Fund, which has the largest allocation to stocks, was the group’s top performer, while the Target Retirement Income Fund, which has the smallest allocation to stocks, had the poorest results, and the returns for the four other funds fell in between.
Of course, these returns largely reflect the performance of the five underlying portfolios that make up the Target Retirement Funds—Vanguard Total Stock Market Index Fund, Vanguard Total International Stock Index Fund, Vanguard Total Bond Market II Index Fund, Vanguard Total International Bond Index Fund, and Vanguard Short-Term Inflation-Protected Securities Index Fund.
Among the funds’ underlying investments, Vanguard Total Stock Market Index Fund, which provides its investors with broad exposure to the entire U.S. stock market, was the top performer by far, returning 17.60% (The returns here are for Investor Shares of the underlying index funds.) As I noted earlier, U.S. stocks produced the strongest results for the fiscal year, significantly outperforming international stocks and U.S. and international bonds.
Vanguard Total International Bond Index Fund was next in line, with a return of 6.57%. Currency hedging played an important role in the returns of international
| Investor behavior improves with the use of target-date funds |
| Target-date funds are designed to help investors successfully save for retirement. Over time, |
| these funds may also help save investors from themselves. |
| The rising use of target-date funds is dramatically improving investor behavior, according to a |
| Vanguard study of defined contribution retirement plans. Because these investors know that |
| their asset mix is being adjusted as appropriate for their age and investment horizon, it seems |
| they are better able to weather market volatility and stick with their investment plans. |
| According to the study, How America Saves 2014, compared with other retirement plan |
| investors, those who held their entire account balance in target-date funds: |
| • Had more balanced portfolios (including, for example, bonds as well as international |
| and small-capitalization stocks). |
| • Did not hold “extreme” equity allocations (either no stocks or 100% stocks). |
| • Refrained from frequent trading, which typically leads to disappointing results. |
6
bonds. The Barclays Global Aggregate ex-USD Float Adjusted RIC Capped Index (USD Hedged) returned 6.92% for the 12 months, outpacing the 3.96% return of the Barclays U.S. Aggregate Bond Index. Before currency hedging, however, returns for international bonds were negative.
Vanguard Total International Stock Index Fund returned 4.77% for the period. Results for international equities were muted amid concerns over ongoing strife in Ukraine and the Middle East and slowed growth in both Europe and emerging markets.
Vanguard Total Bond Market II Index Fund produced a result of 3.77% for the 12 months. Investment-grade corporate bonds were the U.S. bond market’s top performers for the period and added most to the fund’s return.
Vanguard Short-Term Inflation-Protected Securities Index Fund, which is held in the three most conservative portfolios (the Income Fund, 2010 Fund, and 2015 Fund), was the only underlying fund to produce a negative result. The fund returned –0.02%, as inflation expectations remained low during the period.
The funds remain on target and continue to help investors
Vanguard Target Retirement Funds have been successful in meeting their goal of helping investors save for retirement by providing a balanced and diversified portfolio that automatically adjusts over time. Each fund’s average annual return has topped that of its peer group.
Of course, the performance of the underlying index funds has been key to the Target Retirement Funds’ strong results. Credit goes to Vanguard’s Equity Investment and Fixed Income Groups, whose skilled portfolio construction and management have enabled the underlying index funds to successfully track their benchmarks while keeping the associated costs very low.
High costs don’t equal strong fund performance
Speaking of investment costs, as a Vanguard investor, you probably realize that the adage “you get what you pay for” doesn’t apply to mutual funds. In fact, the reverse is true: Research suggests that higher costs are consistent with weaker returns. (See, for example, Shopping for Alpha: You Get What You Don’t Pay For at vanguard.com/research.)
Wouldn’t paying the highest fees allow you to purchase the services of the greatest talents, and therefore get you the best returns? As it turns out, the data don’t support that argument. The explanation is simple: Every dollar paid for management fees is a dollar less earning potential return. Keeping expenses down can help narrow the gap between what the markets return and what investors actually earn.
7
That’s why Vanguard always seeks to minimize costs. Indexing, of course, is the purest form of low-cost investing. And we negotiate low fees for our actively managed funds, which are run by world-class advisors. It’s a strategy that reflects decades of experience and research, boiled down to one tenet: The less you pay, the more you earn.
As always, thank you for investing with Vanguard.
Sincerely,
F. William McNabb III
Chairman and Chief Executive Officer
October 13, 2014
8
| Your Fund’s Performance at a Glance | ||||
| September 30, 2013, Through September 30, 2014 | ||||
| Distributions Per Share | ||||
| Starting | Ending | Income | Capital | |
| Share Price | Share Price | Dividends | Gains | |
| Target Retirement Income Fund | $12.46 | $12.84 | $0.218 | $0.196 |
| Target Retirement 2010 Fund | $25.50 | $26.67 | $0.422 | $0.301 |
| Target Retirement 2015 Fund | $14.49 | $15.44 | $0.261 | $0.087 |
| Target Retirement 2020 Fund | $26.26 | $28.40 | $0.484 | $0.011 |
| Target Retirement 2025 Fund | $15.18 | $16.50 | $0.287 | $0.017 |
| Target Retirement 2030 Fund | $26.46 | $28.95 | $0.491 | $0.036 |
9
Target Retirement Income Fund
Fund Profile
As of September 30, 2014
| Total Fund Characteristics | |
| Ticker Symbol | VTINX |
| 30-Day SEC Yield | 1.67% |
| Acquired Fund Fees and Expenses1 | 0.16% |
| Allocation to Underlying Vanguard Funds | |
| Vanguard Total Bond Market II Index Fund | |
| Investor Shares | 39.3% |
| Vanguard Total Stock Market Index Fund | |
| Investor Shares | 21.1 |
| Vanguard Short-Term Inflation-Protected | |
| Securities Index Fund Investor Shares | 16.8 |
| Vanguard Total International Bond Index | |
| Fund Investor Shares | 14.0 |
| Vanguard Total International Stock Index | |
| Fund Investor Shares | 8.8 |
| Total Fund Volatility Measures | ||
| Target | Barclays | |
| Income | Aggregate | |
| Composite | Bond | |
| Index | Index | |
| R-Squared | 1.00 | 0.22 |
| Beta | 1.00 | 0.71 |
| These measures show the degree and timing of the fund’s fluctuations compared with the indexes over 36 months. | ||
Fund Asset Allocation
1 This figure—drawn from the prospectus dated January 27, 2014—represents an estimate of the weighted average of the expense ratios and any
transaction fees charged by the underlying mutual funds (the ”acquired” funds) in which the Target Retirement Income Fund invests. The fund does
not charge any expenses or fees of its own. For the fiscal year ended September 30, 2014, the acquired fund fees and expenses were 0.16%.
10
Target Retirement Income Fund
Performance Summary
All of the returns in this report represent past performance, which is not a guarantee of future results that may be achieved by the fund. (Current performance may be lower or higher than the performance data cited. For performance data current to the most recent month-end, visit our website at vanguard.com/performance.) Note, too, that both investment returns and principal value can fluctuate widely, so an investor’s shares, when sold, could be worth more or less than their original cost. The returns shown do not reflect taxes that a shareholder would pay on fund distributions or on the sale of fund shares.
Cumulative Performance: September 30, 2004, Through September 30, 2014
Initial Investment of $10,000
| Average Annual Total Returns | |||||
| Periods Ended September 30, 2014 | |||||
| Final Value | |||||
| One | Five | Ten | of a $10,000 | ||
| Year | Years | Years | Investment | ||
| Target Retirement Income Fund | 6.47% | 6.96% | 5.52% | $17,121 | |
| •••••••• | Target Income Composite Index | 6.73 | 7.08 | 5.55 | 17,156 |
| – – – – | Spliced Mixed-Asset Target Today | ||||
| 5.19 | 6.14 | 4.34 | 15,297 | ||
| Barclays Funds Average U.S. Aggregate Bond Index | 3.96 | 4.12 | 4.62 | 15,712 | |
Spliced Mixed-Asset Target Today Funds Average: Derived from data provided by Lipper, a Thomson Reuters Company
See Financial Highlights for dividend and capital gains information.
11
Target Retirement Income Fund
Fiscal-Year Total Returns (%): September 30, 2004, Through September 30, 2014
For a benchmark description, see the Glossary.
12
Target Retirement Income Fund
Financial Statements
Statement of Net Assets
As of September 30, 2014
The fund reports a complete list of its holdings in regulatory filings four times in each fiscal year, at the quarter-ends. For the second and fourth fiscal quarters, the lists appear in the fund’s semiannual and annual reports to shareholders. For the first and third fiscal quarters, the fund files the lists with the Securities and Exchange Commission on Form N-Q. Shareholders can look up the fund’s Forms N-Q on the SEC’s website at sec.gov. Forms N-Q may also be reviewed and copied at the SEC’s Public Reference Room (see the back cover of this report for further information).
| Market | ||
| Value | ||
| Shares | ($000) | |
| Investment Companies (100.2%) | ||
| U.S. Stock Fund (21.1%) | ||
| Vanguard Total Stock Market Index Fund Investor Shares | 48,013,477 | 2,365,624 |
| International Stock Fund (8.8%) | ||
| Vanguard Total International Stock Index Fund Investor Shares | 60,190,205 | 984,712 |
| U.S. Bond Funds (56.3%) | ||
| 1 Vanguard Total Bond Market II Index Fund Investor Shares | 411,816,241 | 4,422,906 |
| Vanguard Short-Term Inflation-Protected Securities Index Fund Investor Shares | 76,236,681 | 1,886,096 |
| 6,309,002 | ||
| International Bond Fund (14.0%) | ||
| Vanguard Total International Bond Index Fund Investor Shares | 151,191,997 | 1,572,397 |
| Total Investment Companies (Cost $9,898,339) | 11,231,735 | |
| Temporary Cash Investment (0.0%) | ||
| Money Market Fund (0.0%) | ||
| 1 Vanguard Market Liquidity Fund, 0.109% (Cost $4,174) | 4,174,470 | 4,174 |
| Total Investments (100.2%) (Cost $9,902,513) | 11,235,909 | |
| Other Assets and Liabilities (-0.2%) | ||
| Other Assets | 44,116 | |
| Liabilities | (65,496) | |
| (21,380) | ||
| Net Assets (100%) | ||
| Applicable to 873,520,972 outstanding $.001 par value shares of | ||
| beneficial interest (unlimited authorization) | 11,214,529 | |
| Net Asset Value Per Share | $12.84 | |
13
Target Retirement Income Fund
At September 30, 2014, net assets consisted of:
| Amount | |
| ($000) | |
| Paid-in Capital | 9,849,510 |
| Undistributed Net Investment Income | 6,785 |
| Accumulated Net Realized Gains | 24,838 |
| Unrealized Appreciation (Depreciation) | 1,333,396 |
| Net Assets | 11,214,529 |
See Note A in Notes to Financial Statements.
1 Affiliated fund available only to Vanguard funds and certain trusts and accounts managed by Vanguard. Rate shown for Vanguard Market
Liquidity Fund is the 7-day yield.
See accompanying Notes, which are an integral part of the Financial Statements.
14
Target Retirement Income Fund
Statement of Operations
| Year Ended | |
| September 30, 2014 | |
| ($000) | |
| Investment Income | |
| Income | |
| Income Distributions Received | 187,626 |
| Net Investment Income—Note B | 187,626 |
| Realized Net Gain (Loss) | |
| Capital Gain Distributions Received | 1,933 |
| Affiliated Investment Securities Sold | 44,963 |
| Realized Net Gain (Loss) | 46,896 |
| Change in Unrealized Appreciation (Depreciation) of Investment Securities | 432,953 |
| Net Increase (Decrease) in Net Assets Resulting from Operations | 667,475 |
See accompanying Notes, which are an integral part of the Financial Statements.
15
Target Retirement Income Fund
Statement of Changes in Net Assets
| Year Ended September 30, | ||
| 2014 | 2013 | |
| ($000) | ($000) | |
| Increase (Decrease) in Net Assets | ||
| Operations | ||
| Net Investment Income | 187,626 | 199,821 |
| Realized Net Gain (Loss) | 46,896 | 237,175 |
| Change in Unrealized Appreciation (Depreciation) | 432,953 | (40,097) |
| Net Increase (Decrease) in Net Assets Resulting from Operations | 667,475 | 396,899 |
| Distributions | ||
| Net Investment Income | (185,400) | (200,619) |
| Realized Capital Gain1 | (161,457) | (16,647) |
| Total Distributions | (346,857) | (217,266) |
| Capital Share Transactions | ||
| Issued | 2,895,274 | 3,006,065 |
| Issued in Lieu of Cash Distributions | 333,314 | 209,124 |
| Redeemed | (2,497,305) | (2,614,401) |
| Net Increase (Decrease) from Capital Share Transactions | 731,283 | 600,788 |
| Total Increase (Decrease) | 1,051,901 | 780,421 |
| Net Assets | ||
| Beginning of Period | 10,162,628 | 9,382,207 |
| End of Period2 | 11,214,529 | 10,162,628 |
are treated as ordinary income dividends for tax purposes.
2 Net Assets—End of Period includes undistributed (overdistributed) net investment income of $6,785,000 and $4,559,000.
See accompanying Notes, which are an integral part of the Financial Statements.
16
Target Retirement Income Fund
Financial Highlights
| For a Share Outstanding | Year Ended September 30, | ||||
| Throughout Each Period | 2014 | 2013 | 2012 | 2011 | 2010 |
| Net Asset Value, Beginning of Period | $12.46 | $12.23 | $11.22 | $11.13 | $10.49 |
| Investment Operations | |||||
| Net Investment Income | .220 | .246 | .275 | .3031 | .288 |
| Capital Gain Distributions Received | .002 | .067 | .052 | .0301 | — |
| Net Realized and Unrealized Gain (Loss) | |||||
| on Investments | . 572 | .185 | .977 | .080 | .640 |
| Total from Investment Operations | .794 | .498 | 1.304 | .413 | .928 |
| Distributions | |||||
| Dividends from Net Investment Income | (.218) | (.247) | (.273) | (. 299) | (. 288) |
| Distributions from Realized Capital Gains | (.196) | (. 021) | (. 021) | (. 024) | — |
| Total Distributions | (.414) | (.268) | (. 294) | (. 323) | (. 288) |
| Net Asset Value, End of Period | $12.84 | $12.46 | $12.23 | $11.22 | $11.13 |
| Total Return2 | 6.47% | 4.12% | 11.74% | 3.70% | 8.97% |
| Ratios/Supplemental Data | |||||
| Net Assets, End of Period (Millions) | $11,215 | $10,163 | $9,382 | $4,765 | $3,623 |
| Ratio of Total Expenses to Average Net Assets | — | — | — | — | — |
| Acquired Fund Fees and Expenses | 0.16% | 0.16% | 0.16% | 0.17% | 0.17% |
| Ratio of Net Investment Income to | |||||
| Average Net Assets | 1.74% | 1.99% | 2.31% | 2.65% | 2.70% |
| Portfolio Turnover Rate | 6% | 40% | 7% | 14%3 | 12% |
2 Total returns do not include account service fees that may have applied in the periods shown. Fund prospectuses provide information about
any applicable account service fees.
3 Excludes the value of mutual fund shares delivered and received in connection with a change in the fund’s international equity investments
from Vanguard European, Pacific, and Emerging Markets Stock Index Funds to Vanguard Total International Stock Index Fund because those
transactions were effected in kind and did not cause the fund to incur transaction costs.
See accompanying Notes, which are an integral part of the Financial Statements.
17
Target Retirement Income Fund
Notes to Financial Statements
Vanguard Target Retirement Income Fund is registered under the Investment Company Act of 1940 as an open-end investment company, or mutual fund. The fund follows a balanced investment strategy by investing in selected Vanguard funds to achieve its targeted allocation of assets to U.S. and international stocks, and U.S. and international bonds. Financial statements and other information about each underlying fund are available on vanguard.com.
A. The following significant accounting policies conform to generally accepted accounting principles for U.S. investment companies. The fund consistently follows such policies in preparing its financial statements.
1. Security Valuation: Investments are valued at the net asset value of each underlying Vanguard fund determined as of the close of the New York Stock Exchange (generally 4 p.m., Eastern time) on the valuation date.
2. Federal Income Taxes: The fund intends to continue to qualify as a regulated investment company and distribute all of its taxable income. Management has analyzed the fund’s tax positions taken for all open federal income tax years (September 30, 2011–2014), and has concluded that no provision for federal income tax is required in the fund’s financial statements.
3. Distributions: Distributions to shareholders are recorded on the ex-dividend date.
4. Credit Facility: The fund and certain other funds managed by The Vanguard Group participate in a $2.89 billion committed credit facility provided by a syndicate of lenders pursuant to a credit agreement that may be renewed annually; each fund is individually liable for its borrowings, if any, under the credit facility. Borrowings may be utilized for temporary and emergency purposes, and are subject to the fund’s regulatory and contractual borrowing restrictions. The participating funds are charged administrative fees and an annual commitment fee of 0.06% of the undrawn amount of the facility; these fees are allocated to the funds based on a method approved by the fund’s board of trustees and borne by the funds in which the fund invests (see Note B). Any borrowings under this facility bear interest at a rate equal to the higher of the federal funds rate or LIBOR reference rate plus an agreed-upon spread.
The fund had no borrowings outstanding at September 30, 2014, or at any time during the period then ended.
5. Other: Income and capital gain distributions received are recorded on the ex-dividend date. Security transactions are accounted for on the date securities are bought or sold. Costs used to determine realized gains (losses) on the sale of investment securities are those of the specific securities sold.
B. Under a service agreement, The Vanguard Group furnishes investment advisory, corporate management, administrative, marketing, and distribution services to the fund. The service agreement provides that the fund’s expenses may be reduced or eliminated to the extent of savings realized by the Vanguard funds by the operation of the fund. Accordingly, all incremental expenses for services provided by Vanguard and all other expenses incurred by the fund during the year ended September 30, 2014, were borne by the funds in which the fund invests. The fund’s trustees and officers are also directors and officers of Vanguard and the funds in which the fund invests.
18
Target Retirement Income Fund
C. Various inputs may be used to determine the value of the fund’s investments. These inputs are summarized in three broad levels for financial statement purposes. The inputs or methodologies used to value securities are not necessarily an indication of the risk associated with investing in those securities.
Level 1—Quoted prices in active markets for identical securities.
Level 2—Other significant observable inputs (including quoted prices for similar securities, interest rates, prepayment speeds, credit risk, etc.).
Level 3—Significant unobservable inputs (including the fund’s own assumptions used to determine the fair value of investments).
At September 30, 2014, 100% of the market value of the fund’s investments was determined based on Level 1 inputs.
D. Distributions are determined on a tax basis and may differ from net investment income and realized capital gains for financial reporting purposes. Differences may be permanent or temporary. Permanent differences are reclassified among capital accounts in the financial statements to reflect their tax character. Temporary differences arise when certain items of income, expense, gain, or loss are recognized in different periods for financial statement and tax purposes. These differences will reverse at some time in the future. Differences in classification may also result from the treatment of short-term gains as ordinary income for tax purposes.
The fund used a tax accounting practice to treat a portion of the price of capital shares redeemed during the year as distributions from realized capital gains. Accordingly, the fund has reclassified $16,893,000 from accumulated net realized gains to paid-in capital.
For tax purposes, at September 30, 2014, the fund had $10,205,000 of ordinary income and $22,247,000 of long-term capital gains available for distribution.
At September 30, 2014, the cost of investment securities for tax purposes was $9,903,341,000.
Net unrealized appreciation of investment securities for tax purposes was $1,332,568,000, consisting of unrealized gains of $1,341,408,000 on securities that had risen in value since their purchase and $8,840,000 in unrealized losses on securities that had fallen in value since their purchase.
E. Capital shares issued and redeemed were:
| Year Ended September 30, | ||
| 2014 | 2013 | |
| Shares | Shares | |
| (000) | (000) | |
| Issued | 227,703 | 243,245 |
| Issued in Lieu of Cash Distributions | 26,451 | 17,060 |
| Redeemed | (196,389) | (211,747) |
| Net Increase (Decrease) in Shares Outstanding | 57,765 | 48,558 |
19
Target Retirement Income Fund
| F. Transactions during the period in affiliated underlying Vanguard funds were as follows: | ||||||
| Current Period Transactions | ||||||
| Sept. 30, | Proceeds | Sept. 30, | ||||
| 2013 | from | Capital Gain | 2014 | |||
| Market | Purchases | Securities | Dividend | Distributions | Market | |
| Value | at Cost | Sold | Income | Received | Value | |
| ($000) | ($000) | ($000) | ($000) | ($000) | ($000) | |
| Vanguard Market Liquidity Fund | — | NA1 | NA1 | 3 | — | 4,174 |
| Vanguard Short-Term Inflation- | ||||||
| Protected Securities Index Fund 1,704,621 | 244,210 | 61,319 | 282 | — | 1,886,096 | |
| Vanguard Total Bond Market II | ||||||
| Index Fund | 3,995,392 | 559,849 | 192,423 | 95,385 | 1,933 | 4,422,906 |
| Vanguard Total International | ||||||
| Bond Index Fund | 1,419,783 | 107,094 | 28,818 | 21,646 | — | 1,572,397 |
| Vanguard Total International | ||||||
| Stock Index Fund | 914,147 | 121,452 | 65,082 | 30,817 | — | 984,712 |
| Vanguard Total Stock Market | ||||||
| Index Fund | 2,126,474 | 250,143 | 341,663 | 39,493 | — | 2,365,624 |
| Total | 10,160,417 | 1,282,748 | 689,305 | 187,626 | 1,933 | 11,235,909 |
| 1 Not applicable—Purchases and Sales are for temporary cash investment purposes. | ||||||
G. Management has determined that no material events or transactions occurred subsequent to September 30, 2014, that would require recognition or disclosure in these financial statements.
20
Target Retirement 2010 Fund
Fund Profile
As of September 30, 2014
| Total Fund Characteristics | |
| Ticker Symbol | VTENX |
| 30-Day SEC Yield | 1.75% |
| Acquired Fund Fees and Expenses1 | 0.16% |
| Allocation to Underlying Vanguard Funds | |
| Vanguard Total Bond Market II Index Fund | |
| Investor Shares | 36.5% |
| Vanguard Total Stock Market Index Fund | |
| Investor Shares | 26.5 |
| Vanguard Short-Term Inflation-Protected | |
| Securities Index Fund Investor Shares | 13.6 |
| Vanguard Total International Bond Index | |
| Fund Investor Shares | 12.6 |
| Vanguard Total International Stock Index | |
| Fund Investor Shares | 10.8 |
| Total Fund Volatility Measures | ||
| Target 2010 | MSCI US | |
| Composite | Broad Market | |
| Index | Index | |
| R-Squared | 1.00 | 0.85 |
| Beta | 1.00 | 0.44 |
Fund Asset Allocation

1 This figure—drawn from the prospectus dated January 27, 2014—represents an estimate of the weighted average of the expense ratios and any
transaction fees charged by the underlying mutual funds (the ”acquired” funds) in which the Target Retirement 2010 Fund invests. The fund does not
charge any expenses or fees of its own. For the fiscal year ended September 30, 2014, the acquired fund fees and expenses were 0.16%.
21
Target Retirement 2010 Fund
Performance Summary
All of the returns in this report represent past performance, which is not a guarantee of future results that may be achieved by the fund. (Current performance may be lower or higher than the performance data cited. For performance data current to the most recent month-end, visit our website at vanguard.com/performance.) Note, too, that both investment returns and principal value can fluctuate widely, so an investor’s shares, when sold, could be worth more or less than their original cost. The returns shown do not reflect taxes that a shareholder would pay on fund distributions or on the sale of fund shares.
Cumulative Performance: June 7, 2006, Through September 30, 2014
Initial Investment of $10,000
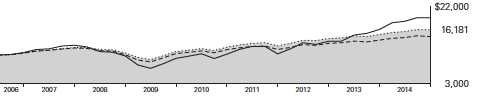
| Average Annual Total Returns | |||||
| Periods Ended September 30, 2014 | |||||
| Since | Final Value | ||||
| One | Five | Inception | of a $10,000 | ||
| Year | Years | (6/7/2006) | Investment | ||
| Target Retirement 2010 Fund | 7.55% | 8.24% | 5.96% | $16,181 | |
| •••••••• | Target 2010 Composite Index | 7.83 | 8.32 | 5.96 | 16,186 |
| – – – – | Mixed-Asset Target 2010 Funds | ||||
| 6.31 | 6.98 | 4.59 | 14,527 | ||
| MSCI Average US Broad Market Index | 17.88 | 15.88 | 8.15 | 19,186 | |
Mixed-Asset Target 2010 Funds Average: Derived from data provided by Lipper, a Thomson Reuters Company.
"Since Inception" performance is calculated from the inception date for both the fund and its comparative standards.
See Financial Highlights for dividend and capital gains information.
22
Target Retirement 2010 Fund
Fiscal-Year Total Returns (%): June 7, 2006, Through September 30, 2014

For a benchmark description, see the Glossary.
23
Target Retirement 2010 Fund
Financial Statements
Statement of Net Assets
As of September 30, 2014
The fund reports a complete list of its holdings in regulatory filings four times in each fiscal year, at the quarter-ends. For the second and fourth fiscal quarters, the lists appear in the fund’s semiannual and annual reports to shareholders. For the first and third fiscal quarters, the fund files the lists with the Securities and Exchange Commission on Form N-Q. Shareholders can look up the fund’s Forms N-Q on the SEC’s website at sec.gov. Forms N-Q may also be reviewed and copied at the SEC’s Public Reference Room (see the back cover of this report for further information).
| Market | ||
| Value | ||
| Shares | ($000) | |
| Investment Companies (100.1%) | ||
| U.S. Stock Fund (26.5%) | ||
| Vanguard Total Stock Market Index Fund Investor Shares | 37,421,839 | 1,843,774 |
| International Stock Fund (10.8%) | ||
| Vanguard Total International Stock Index Fund Investor Shares | 45,927,903 | 751,381 |
| U.S. Bond Funds (50.2%) | ||
| 1 Vanguard Total Bond Market II Index Fund Investor Shares | 236,471,229 | 2,539,701 |
| Vanguard Short-Term Inflation-Protected Securities Index Fund Investor Shares | 38,397,269 | 949,948 |
| 3,489,649 | ||
| International Bond Fund (12.6%) | ||
| Vanguard Total International Bond Index Fund Investor Shares | 84,133,021 | 874,983 |
| Total Investment Companies (Cost $5,944,638) | 6,959,787 | |
| Other Assets and Liabilities (-0.1%) | ||
| Other Assets | 42,533 | |
| Liabilities | (49,907) | |
| (7,374) | ||
| Net Assets (100%) | ||
| Applicable to 260,679,440 outstanding $.001 par value shares of | ||
| beneficial interest (unlimited authorization) | 6,952,413 | |
| Net Asset Value Per Share | $26.67 | |
| At September 30, 2014, net assets consisted of: | ||
| Amount | ||
| ($000) | ||
| Paid-in Capital | 5,780,946 | |
| Undistributed Net Investment Income | 80,072 | |
| Accumulated Net Realized Gains | 76,246 | |
| Unrealized Appreciation (Depreciation) | 1,015,149 | |
| Net Assets | 6,952,413 | |
See Note A in Notes to Financial Statements.
1 Affiliated fund available only to Vanguard funds and certain trusts and accounts managed by Vanguard.
See accompanying Notes, which are an integral part of the Financial Statements.
24
Target Retirement 2010 Fund
Statement of Operations
| Year Ended | |
| September 30, 2014 | |
| ($000) | |
| Investment Income | |
| Income | |
| Income Distributions Received | 126,260 |
| Other Income | 5 |
| Net Investment Income—Note B | 126,265 |
| Realized Net Gain (Loss) | |
| Capital Gain Distributions Received | 1,146 |
| Affiliated Investment Securities Sold | 96,698 |
| Realized Net Gain (Loss) | 97,844 |
| Change in Unrealized Appreciation (Depreciation) of Investment Securities | 273,313 |
| Net Increase (Decrease) in Net Assets Resulting from Operations | 497,422 |
See accompanying Notes, which are an integral part of the Financial Statements.
25
Target Retirement 2010 Fund
Statement of Changes in Net Assets
| Year Ended September 30, | ||
| 2014 | 2013 | |
| ($000) | ($000) | |
| Increase (Decrease) in Net Assets | ||
| Operations | ||
| Net Investment Income | 126,265 | 138,234 |
| Realized Net Gain (Loss) | 97,844 | 149,071 |
| Change in Unrealized Appreciation (Depreciation) | 273,313 | 145,289 |
| Net Increase (Decrease) in Net Assets Resulting from Operations | 497,422 | 432,594 |
| Distributions | ||
| Net Investment Income | (109,648) | (138,503) |
| Realized Capital Gain1 | (78,208) | (9,651) |
| Total Distributions | (187,856) | (148,154) |
| Capital Share Transactions | ||
| Issued | 1,771,303 | 2,006,950 |
| Issued in Lieu of Cash Distributions | 184,496 | 145,950 |
| Redeemed | (1,992,038) | (1,913,559) |
| Net Increase (Decrease) from Capital Share Transactions | (36,239) | 239,341 |
| Total Increase (Decrease) | 273,327 | 523,781 |
| Net Assets | ||
| Beginning of Period | 6,679,086 | 6,155,305 |
| End of Period2 | 6,952,413 | 6,679,086 |
treated as ordinary income dividends for tax purposes.
2 Net Assets—End of Period includes undistributed (overdistributed) net investment income of $80,072,000 and $76,227,000.
See accompanying Notes, which are an integral part of the Financial Statements.
26
Target Retirement 2010 Fund
Financial Highlights
| For a Share Outstanding | Year Ended September 30, | ||||
| Throughout Each Period | 2014 | 2013 | 2012 | 2011 | 2010 |
| Net Asset Value, Beginning of Period | $25.50 | $24.45 | $21.91 | $21.87 | $20.39 |
| Investment Operations | |||||
| Net Investment Income | . 487 | .516 | .571 | .5601 | .520 |
| Capital Gain Distributions Received | .004 | .103 | .100 | .0561 | — |
| Net Realized and Unrealized Gain (Loss) | |||||
| on Investments | 1.402 | .999 | 2.502 | (.022) | 1.455 |
| Total from Investment Operations | 1.893 | 1.618 | 3.173 | .594 | 1.975 |
| Distributions | |||||
| Dividends from Net Investment Income | (. 422) | (. 531) | (. 596) | (. 511) | (. 495) |
| Distributions from Realized Capital Gains | (.301) | (.037) | (.037) | (.043) | — |
| Total Distributions | (.723) | (.568) | (. 633) | (. 554) | (. 495) |
| Net Asset Value, End of Period | $26.67 | $25.50 | $24.45 | $21.91 | $21.87 |
| Total Return2 | 7.55% | 6.76% | 14.74% | 2.68% | 9.83% |
| Ratios/Supplemental Data | |||||
| Net Assets, End of Period (Millions) | $6,952 | $6,679 | $6,155 | $4,747 | $4,247 |
| Ratio of Total Expenses to Average Net Assets | — | — | — | — | — |
| Acquired Fund Fees and Expenses | 0.16% | 0.16% | 0.16% | 0.17% | 0.17% |
| Ratio of Net Investment Income to | |||||
| Average Net Assets | 1.83% | 2.08% | 2.51% | 2.46% | 2.67% |
| Portfolio Turnover Rate | 13% | 38% | 12% | 27%3 | 19% |
2 Total returns do not include account service fees that may have applied in the periods shown. Fund prospectuses provide information about
any applicable account service fees.
3 Excludes the value of mutual fund shares delivered and received in connection with a change in the fund’s international equity investments
from Vanguard European, Pacific, and Emerging Markets Stock Index Funds to Vanguard Total International Stock Index Fund because those
transactions were effected in kind and did not cause the fund to incur transaction costs.
See accompanying Notes, which are an integral part of the Financial Statements.
27
Target Retirement 2010 Fund
Notes to Financial Statements
Vanguard Target Retirement 2010 Fund is registered under the Investment Company Act of 1940 as an open-end investment company, or mutual fund. The fund follows a balanced investment strategy by investing in selected Vanguard funds to achieve its targeted allocation of assets to U.S. and international stocks, and U.S. and international bonds. Financial statements and other information about each underlying fund are available on vanguard.com.
A. The following significant accounting policies conform to generally accepted accounting principles for U.S. investment companies. The fund consistently follows such policies in preparing its financial statements.
1. Security Valuation: Investments are valued at the net asset value of each underlying Vanguard fund determined as of the close of the New York Stock Exchange (generally 4 p.m., Eastern time) on the valuation date.
2. Federal Income Taxes: The fund intends to continue to qualify as a regulated investment company and distribute all of its taxable income. Management has analyzed the fund’s tax positions taken for all open federal income tax years (September 30, 2011–2014), and has concluded that no provision for federal income tax is required in the fund’s financial statements.
3. Distributions: Distributions to shareholders are recorded on the ex-dividend date.
4. Credit Facility: The fund and certain other funds managed by The Vanguard Group participate in a $2.89 billion committed credit facility provided by a syndicate of lenders pursuant to a credit agreement that may be renewed annually; each fund is individually liable for its borrowings, if any, under the credit facility. Borrowings may be utilized for temporary and emergency purposes, and are subject to the fund’s regulatory and contractual borrowing restrictions. The participating funds are charged administrative fees and an annual commitment fee of 0.06% of the undrawn amount of the facility; these fees are allocated to the funds based on a method approved by the fund’s board of trustees and borne by the funds in which the fund invests (see Note B). Any borrowings under this facility bear interest at a rate equal to the higher of the federal funds rate or LIBOR reference rate plus an agreed-upon spread.
The fund had no borrowings outstanding at September 30, 2014, or at any time during the period then ended.
5. Other: Income and capital gain distributions received are recorded on the ex-dividend date. Security transactions are accounted for on the date securities are bought or sold. Costs used to determine realized gains (losses) on the sale of investment securities are those of the specific securities sold.
B. Under a service agreement, The Vanguard Group furnishes investment advisory, corporate management, administrative, marketing, and distribution services to the fund. The service agreement provides that the fund’s expenses may be reduced or eliminated to the extent of savings realized by the Vanguard funds by the operation of the fund. Accordingly, all incremental expenses for services provided by Vanguard and all other expenses incurred by the fund during the year ended September 30, 2014, were borne by the funds in which the fund invests. The fund’s trustees and officers are also directors and officers of Vanguard and the funds in which the fund invests.
28
Target Retirement 2010 Fund
C. Various inputs may be used to determine the value of the fund’s investments. These inputs are summarized in three broad levels for financial statement purposes. The inputs or methodologies used to value securities are not necessarily an indication of the risk associated with investing in those securities.
Level 1—Quoted prices in active markets for identical securities.
Level 2—Other significant observable inputs (including quoted prices for similar securities, interest rates, prepayment speeds, credit risk, etc.).
Level 3—Significant unobservable inputs (including the fund’s own assumptions used to determine the fair value of investments).
At September 30, 2014, 100% of the market value of the fund’s investments was determined based on Level 1 inputs.
D. Distributions are determined on a tax basis and may differ from net investment income and realized capital gains for financial reporting purposes. Differences may be permanent or temporary. Permanent differences are reclassified among capital accounts in the financial statements to reflect their tax character. Temporary differences arise when certain items of income, expense, gain, or loss are recognized in different periods for financial statement and tax purposes. These differences will reverse at some time in the future. Differences in classification may also result from the treatment of short-term gains as ordinary income for tax purposes.
The fund used a tax accounting practice to treat a portion of the price of capital shares redeemed during the year as distributions from net investment income and realized capital gains. Accordingly, the fund has reclassified $12,772,000 from undistributed net investment income, and $14,462,000 from accumulated net realized gains, to paid-in capital.
For tax purposes, at September 30, 2014, the fund had $83,772,000 of ordinary income and $73,011,000 of long-term capital gains available for distribution.
At September 30, 2014, the cost of investment securities for tax purposes was $5,945,103,000.
Net unrealized appreciation of investment securities for tax purposes was $1,014,684,000, consisting of unrealized gains of $1,018,847,000 on securities that had risen in value since their purchase and $4,163,000 in unrealized losses on securities that had fallen in value since their purchase.
E. Capital shares issued and redeemed were:
| Year Ended September 30, | ||
| 2014 | 2013 | |
| Shares | Shares | |
| (000) | (000) | |
| Issued | 67,740 | 81,038 |
| Issued in Lieu of Cash Distributions | 7,224 | 6,076 |
| Redeemed | (76,186) | (76,925) |
| Net Increase (Decrease) in Shares Outstanding | (1,222) | 10,189 |
29
Target Retirement 2010 Fund
| F. Transactions during the period in affiliated underlying Vanguard funds were as follows: | ||||||
| Current Period Transactions | ||||||
| Sept. 30, | Proceeds | Sept. 30, | ||||
| 2013 | from | Capital Gain | 2014 | |||
| Market | Purchases | Securities | Dividend | Distributions | Market | |
| Value | at Cost | Sold | Income | Received | Value | |
| ($000) | ($000) | ($000) | ($000) | ($000) | ($000) | |
| Vanguard Market Liquidity Fund | 498 | NA1 | NA1 | 1 | — | — |
| Vanguard Short-Term Inflation- | ||||||
| Protected Securities Index Fund | 827,253 | 186,775 | 63,338 | 135 | — | 949,948 |
| Vanguard Total Bond Market II | ||||||
| Index Fund | 2,393,388 | 409,863 | 298,948 | 56,103 | 1,146 | 2,539,701 |
| Vanguard Total International | ||||||
| Bond Index Fund | 801,558 | 63,698 | 31,800 | 12,083 | — | 874,983 |
| Vanguard Total International | ||||||
| Stock Index Fund | 801,206 | 68,958 | 133,665 | 25,495 | — | 751,381 |
| Vanguard Total Stock Market | ||||||
| Index Fund | 1,857,619 | 159,541 | 452,331 | 32,443 | — | 1,843,774 |
| Total | 6,681,522 | 888,835 | 980,082 | 126,260 | 1,146 | 6,959,787 |
| 1 Not applicable—Purchases and Sales are for temporary cash investment purposes. | ||||||
G. Management has determined that no material events or transactions occurred subsequent to September 30, 2014, that would require recognition or disclosure in these financial statements.
30
Target Retirement 2015 Fund
Fund Profile
As of September 30, 2014
| Total Fund Characteristics | |
| Ticker Symbol | VTXVX |
| 30-Day SEC Yield | 1.91% |
| Acquired Fund Fees and Expenses1 | 0.16% |
| Allocation to Underlying Vanguard Funds | |
| Vanguard Total Stock Market Index Fund | |
| Investor Shares | 36.3% |
| Vanguard Total Bond Market II Index Fund | |
| Investor Shares | 32.0 |
| Vanguard Total International Stock Index | |
| Fund Investor Shares | 14.7 |
| Vanguard Total International Bond Index | |
| Fund Investor Shares | 9.8 |
| Vanguard Short-Term Inflation-Protected | |
| Securities Index Fund Investor Shares | 7.2 |
| Total Fund Volatility Measures | ||
| Target 2015 | MSCI US | |
| Composite | Broad Market | |
| Index | Index | |
| R-Squared | 1.00 | 0.91 |
| Beta | 1.00 | 0.56 |
These measures show the degree and timing of the fund’s fluctuations compared with the indexes over 36 months.
Fund Asset Allocation

1 This figure—drawn from the prospectus dated January 27, 2014—represents an estimate of the weighted average of the expense ratios and any transaction fees charged by the underlying mutual funds (the ”acquired” funds) in which the Target Retirement 2015 Fund invests. The fund does not charge any expenses or fees of its own. For the fiscal year ended September 30, 2014, the acquired fund fees and expenses were 0.16%.
31
Target Retirement 2015 Fund
Performance Summary
All of the returns in this report represent past performance, which is not a guarantee of future results that may be achieved by the fund. (Current performance may be lower or higher than the performance data cited. For performance data current to the most recent month-end, visit our website at vanguard.com/performance.) Note, too, that both investment returns and principal value can fluctuate widely, so an investor’s shares, when sold, could be worth more or less than their original cost. The returns shown do not reflect taxes that a shareholder would pay on fund distributions or on the sale of fund shares.
Cumulative Performance: September 30, 2004, Through September 30, 2014
Initial Investment of $10,000

| Average Annual Total Returns | |||||
| Periods Ended September 30, 2014 | |||||
| Final Value | |||||
| One | Five | Ten | of a $10,000 | ||
| Year | Years | Years | Investment | ||
| Target Retirement 2015 Fund | 9.07% | 9.23% | 6.32% | $18,459 | |
| •••••••• | Target 2015 Composite Index | 9.32 | 9.32 | 6.33 | 18,480 |
| – – – – | Mixed-Asset Target 2015 Funds | ||||
| 6.79 | 7.49 | 4.98 | 16,256 | ||
| MSCI Average US Broad Market Index | 17.88 | 15.88 | 8.65 | 22,920 | |
Mixed-Asset Target 2015 Funds Average: Derived from data provided by Lipper, a Thomson Reuters Company.
See Financial Highlights for dividend and capital gains information.
32
Target Retirement 2015 Fund
Fiscal-Year Total Returns (%): September 30, 2004, Through September 30, 2014
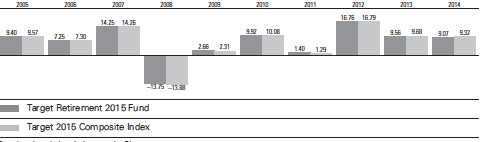
For a benchmark description, see the Glossary.
33
Target Retirement 2015 Fund
Financial Statements
Statement of Net Assets
As of September 30, 2014
The fund reports a complete list of its holdings in regulatory filings four times in each fiscal year, at the quarter-ends. For the second and fourth fiscal quarters, the lists appear in the fund’s semiannual and annual reports to shareholders. For the first and third fiscal quarters, the fund files the lists with the Securities and Exchange Commission on Form N-Q. Shareholders can look up the fund’s Forms N-Q on the SEC’s website at sec.gov. Forms N-Q may also be reviewed and copied at the SEC’s Public Reference Room (see the back cover of this report for further information).
| Market | ||
| Value | ||
| Shares | ($000) | |
| Investment Companies (100.1%) | ||
| U.S. Stock Fund (36.3%) | ||
| Vanguard Total Stock Market Index Fund Investor Shares | 159,930,143 | 7,879,758 |
| International Stock Fund (14.8%) | ||
| Vanguard Total International Stock Index Fund Investor Shares | 195,961,231 | 3,205,926 |
| U.S. Bond Funds (39.2%) | ||
| 1 Vanguard Total Bond Market II Index Fund Investor Shares | 648,514,467 | 6,965,045 |
| Vanguard Short-Term Inflation-Protected Securities Index Fund Investor Shares | 63,256,816 | 1,564,974 |
| 8,530,019 | ||
| International Bond Fund (9.8%) | ||
| Vanguard Total International Bond Index Fund Investor Shares | 204,897,224 | 2,130,931 |
| Total Investment Companies (Cost $17,537,830) | 21,746,634 | |
| Temporary Cash Investment (0.1%) | ||
| Money Market Fund (0.1%) | ||
| 1 Vanguard Market Liquidity Fund, 0.109% (Cost $27,597) | 27,596,972 | 27,597 |
| Total Investments (100.2%) (Cost $17,565,427) | 21,774,231 | |
| Other Assets and Liabilities (-0.2%) | ||
| Other Assets | 175,635 | |
| Liabilities | (208,737) | |
| (33,102) | ||
| Net Assets (100%) | ||
| Applicable to 1,408,442,893 outstanding $.001 par value shares of | ||
| beneficial interest (unlimited authorization) | 21,741,129 | |
| Net Asset Value Per Share | $15.44 | |
34
Target Retirement 2015 Fund
At September 30, 2014, net assets consisted of:
| Amount | |
| ($000) | |
| Paid-in Capital | 17,094,338 |
| Undistributed Net Investment Income | 270,826 |
| Accumulated Net Realized Gains | 167,161 |
| Unrealized Appreciation (Depreciation) | 4,208,804 |
| Net Assets | 21,741,129 |
See Note A in Notes to Financial Statements.
1 Affiliated fund available only to Vanguard funds and certain trusts and accounts managed by Vanguard. Rate shown for Vanguard Market
Liquidity Fund is the 7-day yield.
See accompanying Notes, which are an integral part of the Financial Statements.
35
Target Retirement 2015 Fund
Statement of Operations
| Year Ended | |
| September 30, 2014 | |
| ($000) | |
| Investment Income | |
| Income | |
| Income Distributions Received | 421,740 |
| Other Income | 22 |
| Net Investment Income—Note B | 421,762 |
| Realized Net Gain (Loss) | |
| Capital Gain Distributions Received | 3,100 |
| Affiliated Investment Securities Sold | 190,056 |
| Realized Net Gain (Loss) | 193,156 |
| Change in Unrealized Appreciation (Depreciation) of Investment Securities | 1,185,319 |
| Net Increase (Decrease) in Net Assets Resulting from Operations | 1,800,237 |
See accompanying Notes, which are an integral part of the Financial Statements.
36
Target Retirement 2015 Fund
Statement of Changes in Net Assets
| Year Ended September 30, | ||
| 2014 | 2013 | |
| ($000) | ($000) | |
| Increase (Decrease) in Net Assets | ||
| Operations | ||
| Net Investment Income | 421,762 | 408,230 |
| Realized Net Gain (Loss) | 193,156 | 204,972 |
| Change in Unrealized Appreciation (Depreciation) | 1,185,319 | 1,107,450 |
| Net Increase (Decrease) in Net Assets Resulting from Operations | 1,800,237 | 1,720,652 |
| Distributions | ||
| Net Investment Income | (357,912) | (384,520) |
| Realized Capital Gain1 | (119,304) | (23,226) |
| Total Distributions | (477,216) | (407,746) |
| Capital Share Transactions | ||
| Issued | 5,138,844 | 5,113,964 |
| Issued in Lieu of Cash Distributions | 470,363 | 403,269 |
| Redeemed | (4,930,423) | (3,929,112) |
| Net Increase (Decrease) from Capital Share Transactions | 678,784 | 1,588,121 |
| Total Increase (Decrease) | 2,001,805 | 2,901,027 |
| Net Assets | ||
| Beginning of Period | 19,739,324 | 16,838,297 |
| End of Period2 | 21,741,129 | 19,739,324 |
are treated as ordinary income dividends for tax purposes.
2 Net Assets—End of Period includes undistributed (overdistributed) net investment income of $270,826,000 and $247,209,000.
See accompanying Notes, which are an integral part of the Financial Statements.
37
Target Retirement 2015 Fund
Financial Highlights
| For a Share Outstanding | Year Ended September 30, | ||||
| Throughout Each Period | 2014 | 2013 | 2012 | 2011 | 2010 |
| Net Asset Value, Beginning of Period | $14.49 | $13.54 | $11.91 | $12.03 | $11.21 |
| Investment Operations | |||||
| Net Investment Income | . 300 | . 298 | .327 | .2831 | .285 |
| Capital Gain Distributions Received | .002 | .039 | .053 | .0311 | — |
| Net Realized and Unrealized Gain (Loss) | |||||
| on Investments | .996 | .929 | 1.583 | (.134) | .811 |
| Total from Investment Operations | 1.298 | 1.266 | 1.963 | .180 | 1.096 |
| Distributions | |||||
| Dividends from Net Investment Income | (.261) | (.298) | (.313) | (.276) | (. 276) |
| Distributions from Realized Capital Gains | (.087) | (.018) | (. 020) | (. 024) | — |
| Total Distributions | (.348) | (. 316) | (. 333) | (. 300) | (. 276) |
| Net Asset Value, End of Period | $15.44 | $14.49 | $13.54 | $11.91 | $12.03 |
| Total Return2 | 9.07% | 9.56% | 16.76% | 1.40% | 9.92% |
| Ratios/Supplemental Data | |||||
| Net Assets, End of Period (Millions) | $21,741 | $19,739 | $16,838 | $13,435 | $12,466 |
| Ratio of Total Expenses to Average Net Assets | — | — | — | — | — |
| Acquired Fund Fees and Expenses | 0.16% | 0.16% | 0.16% | 0.17% | 0.17% |
| Ratio of Net Investment Income to | |||||
| Average Net Assets | 1.99% | 2.17% | 2.59% | 2.24% | 2.62% |
| Portfolio Turnover Rate | 10% | 26% | 13% | 27%3 | 19% |
2 Total returns do not include account service fees that may have applied in the periods shown. Fund prospectuses provide information about
any applicable account service fees.
3 Excludes the value of mutual fund shares delivered and received in connection with a change in the fund’s international equity investments
from Vanguard European, Pacific, and Emerging Markets Stock Index Funds to Vanguard Total International Stock Index Fund because those
transactions were effected in kind and did not cause the fund to incur transaction costs.
See accompanying Notes, which are an integral part of the Financial Statements.
38
Target Retirement 2015 Fund
Notes to Financial Statements
Vanguard Target Retirement 2015 Fund is registered under the Investment Company Act of 1940 as an open-end investment company, or mutual fund. The fund follows a balanced investment strategy by investing in selected Vanguard funds to achieve its targeted allocation of assets to U.S. and international stocks, and U.S. and international bonds. Financial statements and other information about each underlying fund are available on vanguard.com.
A. The following significant accounting policies conform to generally accepted accounting principles for U.S. investment companies. The fund consistently follows such policies in preparing its financial statements.
1. Security Valuation: Investments are valued at the net asset value of each underlying Vanguard fund determined as of the close of the New York Stock Exchange (generally 4 p.m., Eastern time) on the valuation date.
2. Federal Income Taxes: The fund intends to continue to qualify as a regulated investment company and distribute all of its taxable income. Management has analyzed the fund’s tax positions taken for all open federal income tax years (September 30, 2011–2014), and has concluded that no provision for federal income tax is required in the fund’s financial statements.
3. Distributions: Distributions to shareholders are recorded on the ex-dividend date.
4. Credit Facility: The fund and certain other funds managed by The Vanguard Group participate in a $2.89 billion committed credit facility provided by a syndicate of lenders pursuant to a credit agreement that may be renewed annually; each fund is individually liable for its borrowings, if any, under the credit facility. Borrowings may be utilized for temporary and emergency purposes, and are subject to the fund’s regulatory and contractual borrowing restrictions. The participating funds are charged administrative fees and an annual commitment fee of 0.06% of the undrawn amount of the facility; these fees are allocated to the funds based on a method approved by the fund’s board of trustees and borne by the funds in which the fund invests (see Note B). Any borrowings under this facility bear interest at a rate equal to the higher of the federal funds rate or LIBOR reference rate plus an agreed-upon spread.
The fund had no borrowings outstanding at September 30, 2014, or at any time during the period then ended.
5. Other: Income and capital gain distributions received are recorded on the ex-dividend date. Security transactions are accounted for on the date securities are bought or sold. Costs used to determine realized gains (losses) on the sale of investment securities are those of the specific securities sold.
B. Under a service agreement, The Vanguard Group furnishes investment advisory, corporate management, administrative, marketing, and distribution services to the fund. The service agreement provides that the fund’s expenses may be reduced or eliminated to the extent of savings realized by the Vanguard funds by the operation of the fund. Accordingly, all incremental expenses for services provided by Vanguard and all other expenses incurred by the fund during the year ended September 30, 2014, were borne by the funds in which the fund invests. The fund’s trustees and officers are also directors and officers of Vanguard and the funds in which the fund invests.
39
Target Retirement 2015 Fund
C. Various inputs may be used to determine the value of the fund’s investments. These inputs are summarized in three broad levels for financial statement purposes. The inputs or methodologies used to value securities are not necessarily an indication of the risk associated with investing in those securities.
Level 1—Quoted prices in active markets for identical securities.
Level 2—Other significant observable inputs (including quoted prices for similar securities, interest rates, prepayment speeds, credit risk, etc.).
Level 3—Significant unobservable inputs (including the fund’s own assumptions used to determine the fair value of investments).
At September 30, 2014, 100% of the market value of the fund’s investments was determined based on Level 1 inputs.
D. Distributions are determined on a tax basis and may differ from net investment income and realized capital gains for financial reporting purposes. Differences may be permanent or temporary. Permanent differences are reclassified among capital accounts in the financial statements to reflect their tax character. Temporary differences arise when certain items of income, expense, gain, or loss are recognized in different periods for financial statement and tax purposes. These differences will reverse at some time in the future. Differences in classification may also result from the treatment of short-term gains as ordinary income for tax purposes.
The fund used a tax accounting practice to treat a portion of the price of capital shares redeemed during the year as distributions from net investment income and realized capital gains. Accordingly, the fund has reclassified $40,233,000 from undistributed net investment income, and $17,958,000 from accumulated net realized gains, to paid-in capital.
For tax purposes, at September 30, 2014, the fund had $288,724,000 of ordinary income and $151,528,000 of long-term capital gains available for distribution.
At September 30, 2014, the cost of investment securities for tax purposes was $17,567,692,000. Net unrealized appreciation of investment securities for tax purposes was $4,206,539,000, consisting of unrealized gains of $4,213,843,000 on securities that had risen in value since their purchase and $7,304,000 in unrealized losses on securities that had fallen in value since their purchase.
E. Capital shares issued and redeemed were:
| Year Ended September 30, | ||
| 2014 | 2013 | |
| Shares | Shares | |
| (000) | (000) | |
| Issued | 341,159 | 368,573 |
| Issued in Lieu of Cash Distributions | 31,932 | 30,344 |
| Redeemed | (326,605) | (280,939) |
| Net Increase (Decrease) in Shares Outstanding | 46,486 | 117,978 |
40
Target Retirement 2015 Fund
F. Transactions during the period in affiliated underlying Vanguard funds were as follows:
| Current Period Transactions | ||||||
| Sept. 30, | Proceeds | Sept. 30, | ||||
| 2013 | from | Capital Gain | 2014 | |||
| Market | Purchases | Securities | Dividend | Distributions | Market | |
| Value | at Cost | Sold | Income | Received | Value | |
| ($000) | ($000) | ($000) | ($000) | ($000) | ($000) | |
| Vanguard Market Liquidity Fund | 8,639 | NA1 | NA1 | 5 | — | 27,597 |
| Vanguard Short-Term Inflation- | ||||||
| Protected Securities Index Fund | 1,104,144 | 564,639 | 101,987 | 185 | — | 1,564,974 |
| Vanguard Total Bond Market II | ||||||
| Index Fund | 6,355,857 | 1,170,907 | 659,327 | 152,994 | 3,100 | 6,965,045 |
| Vanguard Total International | ||||||
| Bond Index Fund | 1,855,357 | 230,894 | 54,725 | 28,900 | — | 2,130,931 |
| Vanguard Total International | ||||||
| Stock Index Fund | 3,138,573 | 250,387 | 236,131 | 105,165 | — | 3,205,926 |
| Vanguard Total Stock Market | ||||||
| Index Fund | 7,287,314 | 602,696 | 1,137,339 | 134,491 | — | 7,879,758 |
| Total | 19,749,884 | 2,819,523 | 2,189,509 | 421,740 | 3,100 | 21,774,231 |
| 1 Not applicable—Purchases and Sales are for temporary cash investment purposes. | ||||||
G. Management has determined that no material events or transactions occurred subsequent to September 30, 2014, that would require recognition or disclosure in these financial statements.
41
Target Retirement 2020 Fund
Fund Profile
As of September 30, 2014
| Total Fund Characteristics | |
| Ticker Symbol | VTWNX |
| 30-Day SEC Yield | 2.07% |
| Acquired Fund Fees and Expenses1 | 0.16% |
| Allocation to Underlying Vanguard Funds | |
| Vanguard Total Stock Market Index Fund | |
| Investor Shares | 43.0% |
| Vanguard Total Bond Market II Index Fund | |
| Investor Shares | 31.4 |
| Vanguard Total International Stock Index | |
| Fund Investor Shares | 17.7 |
| Vanguard Total International Bond Index | |
| Fund Investor Shares | 7.9 |
| Total Fund Volatility Measures | ||
| Target 2020 | MSCI US | |
| Composite | Broad Market | |
| Index | Index | |
| R-Squared | 1.00 | 0.93 |
| Beta | 0.99 | 0.65 |
Fund Asset Allocation
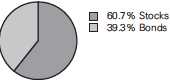
1 This figure—drawn from the prospectus dated January 27, 2014—represents an estimate of the weighted average of the expense ratios and any
transaction fees charged by the underlying mutual funds (the ”acquired” funds) in which the Target Retirement 2020 Fund invests. The fund does not
charge any expenses or fees of its own. For the fiscal year ended September 30, 2014, the acquired fund fees and expenses were 0.16%.
42
Target Retirement 2020 Fund
Performance Summary
All of the returns in this report represent past performance, which is not a guarantee of future results that may be achieved by the fund. (Current performance may be lower or higher than the performance data cited. For performance data current to the most recent month-end, visit our website at vanguard.com/performance.) Note, too, that both investment returns and principal value can fluctuate widely, so an investor’s shares, when sold, could be worth more or less than their original cost. The returns shown do not reflect taxes that a shareholder would pay on fund distributions or on the sale of fund shares.
Cumulative Performance: June 7, 2006, Through September 30, 2014
Initial Investment of $10,000
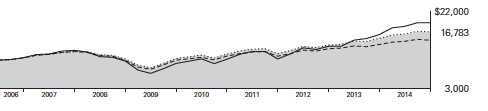
| Average Annual Total Returns | |||||
| Periods Ended September 30, 2014 | |||||
| Since | Final Value | ||||
| One | Five | Inception | of a $10,000 | ||
| Year | Years | (6/7/2006) | Investment | ||
| Target Retirement 2020 Fund | 10.13% | 9.99% | 6.42% | $16,783 | |
| •••••••• | Target 2020 Composite Index | 10.45 | 10.26 | 6.54 | 16,933 |
| – – – – | Mixed-Asset Target 2020 Funds | ||||
| 7.43 | 8.30 | 4.89 | 14,871 | ||
| MSCI Average US Broad Market Index | 17.88 | 15.88 | 8.15 | 19,186 | |
Mixed-Asset Target 2020 Funds Average: Derived from data provided by Lipper, a Thomson Reuters Company.
"Since Inception" performance is calculated from the inception date for both the fund and its comparative standards.
See Financial Highlights for dividend and capital gains information.
43
Target Retirement 2020 Fund
Fiscal-Year Total Returns (%): June 7, 2006, Through September 30, 2014
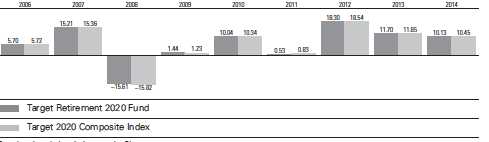
For a benchmark description, see the Glossary.
44
Target Retirement 2020 Fund
Financial Statements
Statement of Net Assets
As of September 30, 2014
The fund reports a complete list of its holdings in regulatory filings four times in each fiscal year, at the quarter-ends. For the second and fourth fiscal quarters, the lists appear in the fund’s semiannual and annual reports to shareholders. For the first and third fiscal quarters, the fund files the lists with the Securities and Exchange Commission on Form N-Q. Shareholders can look up the fund’s Forms N-Q on the SEC’s website at sec.gov. Forms N-Q may also be reviewed and copied at the SEC’s Public Reference Room (see the back cover of this report for further information).
| Market | ||
| Value | ||
| Shares | ($000) | |
| Investment Companies (100.0%) | ||
| U.S. Stock Fund (43.0%) | ||
| Vanguard Total Stock Market Index Fund Investor Shares | 239,861,011 | 11,817,952 |
| International Stock Fund (17.7%) | ||
| Vanguard Total International Stock Index Fund Investor Shares | 296,764,117 | 4,855,061 |
| U.S. Bond Fund (31.4%) | ||
| 1 Vanguard Total Bond Market II Index Fund Investor Shares | 803,854,966 | 8,633,402 |
| International Bond Fund (7.9%) | ||
| Vanguard Total International Bond Index Fund Investor Shares | 207,340,712 | 2,156,344 |
| Total Investment Companies (Cost $22,461,023) | 27,462,759 | |
| Temporary Cash Investment (0.0%) | ||
| Money Market Fund (0.0%) | ||
| 1 Vanguard Market Liquidity Fund, 0.109% (Cost $12,218) | 12,218,174 | 12,218 |
| Total Investments (100.0%) (Cost $22,473,241) | 27,474,977 | |
| Other Assets and Liabilities (0.0%) | ||
| Other Assets | 196,437 | |
| Liabilities | (183,779) | |
| 12,658 | ||
| Net Assets (100%) | ||
| Applicable to 968,029,883 outstanding $.001 par value shares of | ||
| beneficial interest (unlimited authorization) | 27,487,635 | |
| Net Asset Value Per Share | $28.40 | |
45
Target Retirement 2020 Fund
At September 30, 2014, net assets consisted of:
| Amount | |
| ($000) | |
| Paid-in Capital | 22,094,957 |
| Undistributed Net Investment Income | 371,798 |
| Accumulated Net Realized Gains | 19,144 |
| Unrealized Appreciation (Depreciation) | 5,001,736 |
| Net Assets | 27,487,635 |
See Note A in Notes to Financial Statements.
1 Affiliated fund available only to Vanguard funds and certain trusts and accounts managed by Vanguard. Rate shown for Vanguard Market
Liquidity Fund is the 7-day yield.
See accompanying Notes, which are an integral part of the Financial Statements.
46
Target Retirement 2020 Fund
Statement of Operations
| Year Ended | |
| September 30, 2014 | |
| ($000) | |
| Investment Income | |
| Income | |
| Income Distributions Received | 542,484 |
| Other Income | 19 |
| Net Investment Income—Note B | 542,503 |
| Realized Net Gain (Loss) | |
| Capital Gain Distributions Received | 3,327 |
| Affiliated Investment Securities Sold | 24,233 |
| Realized Net Gain (Loss) | 27,560 |
| Change in Unrealized Appreciation (Depreciation) of Investment Securities | 1,764,193 |
| Net Increase (Decrease) in Net Assets Resulting from Operations | 2,334,256 |
See accompanying Notes, which are an integral part of the Financial Statements.
47
Target Retirement 2020 Fund
Statement of Changes in Net Assets
| Year Ended September 30, | ||
| 2014 | 2013 | |
| ($000) | ($000) | |
| Increase (Decrease) in Net Assets | ||
| Operations | ||
| Net Investment Income | 542,503 | 434,879 |
| Realized Net Gain (Loss) | 27,560 | 73,607 |
| Change in Unrealized Appreciation (Depreciation) | 1,764,193 | 1,631,720 |
| Net Increase (Decrease) in Net Assets Resulting from Operations | 2,334,256 | 2,140,206 |
| Distributions | ||
| Net Investment Income | (416,278) | (362,212) |
| Realized Capital Gain1 | (9,461) | (18,538) |
| Total Distributions | (425,739) | (380,750) |
| Capital Share Transactions | ||
| Issued | 8,357,329 | 7,050,481 |
| Issued in Lieu of Cash Distributions | 419,089 | 376,274 |
| Redeemed | (4,981,957) | (3,479,383) |
| Net Increase (Decrease) from Capital Share Transactions | 3,794,461 | 3,947,372 |
| Total Increase (Decrease) | 5,702,978 | 5,706,828 |
| Net Assets | ||
| Beginning of Period | 21,784,657 | 16,077,829 |
| End of Period2 | 27,487,635 | 21,784,657 |
are treated as ordinary income dividends for tax purposes.
2 Net Assets—End of Period includes undistributed (overdistributed) net investment income of $371,798,000 and $282,064,000.
See accompanying Notes, which are an integral part of the Financial Statements.
48
Target Retirement 2020 Fund
Financial Highlights
| For a Share Outstanding | Year Ended September 30, | ||||
| Throughout Each Period | 2014 | 2013 | 2012 | 2011 | 2010 |
| Net Asset Value, Beginning of Period | $26.26 | $24.04 | $20.83 | $21.17 | $19.66 |
| Investment Operations | |||||
| Net Investment Income | . 577 | .528 | .569 | .4731 | .5101 |
| Capital Gain Distributions Received | .004 | .047 | .079 | .0441 | — |
| Net Realized and Unrealized Gain (Loss) | |||||
| on Investments | 2.054 | 2.179 | 3.106 | (.378) | 1.440 |
| Total from Investment Operations | 2.635 | 2.754 | 3.754 | .139 | 1.950 |
| Distributions | |||||
| Dividends from Net Investment Income | (.484) | (. 508) | (. 513) | (. 444) | (. 440) |
| Distributions from Realized Capital Gains | (. 011) | (. 026) | (. 031) | (. 035) | — |
| Total Distributions | (. 495) | (. 534) | (. 544) | (. 479) | (.440) |
| Net Asset Value, End of Period | $28.40 | $26.26 | $24.04 | $20.83 | $21.17 |
| Total Return2 | 10.13% | 11.70% | 18.30% | 0.53% | 10.04% |
| Ratios/Supplemental Data | |||||
| Net Assets, End of Period (Millions) | $27,488 | $21,785 | $16,078 | $11,032 | $8,890 |
| Ratio of Total Expenses to Average Net Assets | — | — | — | — | — |
| Acquired Fund Fees and Expenses | 0.16% | 0.16% | 0.16% | 0.17% | 0.17% |
| Ratio of Net Investment Income to | |||||
| Average Net Assets | 2.14% | 2.23% | 2.62% | 2.11% | 2.51% |
| Portfolio Turnover Rate | 7% | 17% | 8% | 23%3 | 14% |
2 Total returns do not include account service fees that may have applied in the periods shown. Fund prospectuses provide information about
any applicable account service fees.
3 Excludes the value of mutual fund shares delivered and received in connection with a change in the fund’s international equity investments
from Vanguard European, Pacific, and Emerging Markets Stock Index Funds to Vanguard Total International Stock Index Fund because those
transactions were effected in kind and did not cause the fund to incur transaction costs.
See accompanying Notes, which are an integral part of the Financial Statements.
49
Target Retirement 2020 Fund
Notes to Financial Statements
Vanguard Target Retirement 2020 Fund is registered under the Investment Company Act of 1940 as an open-end investment company, or mutual fund. The fund follows a balanced investment strategy by investing in selected Vanguard funds to achieve its targeted allocation of assets to U.S. and international stocks, and U.S. and international bonds. Financial statements and other information about each underlying fund are available on vanguard.com.
A. The following significant accounting policies conform to generally accepted accounting principles for U.S. investment companies. The fund consistently follows such policies in preparing its financial statements.
1. Security Valuation: Investments are valued at the net asset value of each underlying Vanguard fund determined as of the close of the New York Stock Exchange (generally 4 p.m., Eastern time) on the valuation date.
2. Federal Income Taxes: The fund intends to continue to qualify as a regulated investment company and distribute all of its taxable income. Management has analyzed the fund’s tax positions taken for all open federal income tax years (September 30, 2011–2014), and has concluded that no provision for federal income tax is required in the fund’s financial statements.
3. Distributions: Distributions to shareholders are recorded on the ex-dividend date.
4. Credit Facility: The fund and certain other funds managed by The Vanguard Group participate in a $2.89 billion committed credit facility provided by a syndicate of lenders pursuant to a credit agreement that may be renewed annually; each fund is individually liable for its borrowings, if any, under the credit facility. Borrowings may be utilized for temporary and emergency purposes, and are subject to the fund’s regulatory and contractual borrowing restrictions. The participating funds are charged administrative fees and an annual commitment fee of 0.06% of the undrawn amount of the facility; these fees are allocated to the funds based on a method approved by the fund’s board of trustees and borne by the funds in which the fund invests (see Note B). Any borrowings under this facility bear interest at a rate equal to the higher of the federal funds rate or LIBOR reference rate plus an agreed-upon spread.
The fund had no borrowings outstanding at September 30, 2014, or at any time during the period then ended.
5. Other: Income and capital gain distributions received are recorded on the ex-dividend date. Security transactions are accounted for on the date securities are bought or sold. Costs used to determine realized gains (losses) on the sale of investment securities are those of the specific securities sold.
B. Under a service agreement, The Vanguard Group furnishes investment advisory, corporate management, administrative, marketing, and distribution services to the fund. The service agreement provides that the fund’s expenses may be reduced or eliminated to the extent of savings realized by the Vanguard funds by the operation of the fund. Accordingly, all incremental expenses for services provided by Vanguard and all other expenses incurred by the fund during the year ended September 30, 2014, were borne by the funds in which the fund invests. The fund’s trustees and officers are also directors and officers of Vanguard and the funds in which the fund invests.
50
Target Retirement 2020 Fund
C. Various inputs may be used to determine the value of the fund’s investments. These inputs are summarized in three broad levels for financial statement purposes. The inputs or methodologies used to value securities are not necessarily an indication of the risk associated with investing in those securities.
Level 1—Quoted prices in active markets for identical securities.
Level 2—Other significant observable inputs (including quoted prices for similar securities, interest rates, prepayment speeds, credit risk, etc.).
Level 3—Significant unobservable inputs (including the fund’s own assumptions used to determine the fair value of investments).
At September 30, 2014, 100% of the market value of the fund’s investments was determined based on Level 1 inputs.
D. Distributions are determined on a tax basis and may differ from net investment income and realized capital gains for financial reporting purposes. Differences may be permanent or temporary. Permanent differences are reclassified among capital accounts in the financial statements to reflect their tax character. Temporary differences arise when certain items of income, expense, gain, or loss are recognized in different periods for financial statement and tax purposes. These differences will reverse at some time in the future. Differences in classification may also result from the treatment of short-term gains as ordinary income for tax purposes.
The fund used a tax accounting practice to treat a portion of the price of capital shares redeemed during the year as distributions from net investment income and realized capital gains. Accordingly, the fund has reclassified $36,491,000 from undistributed net investment income, and $1,767,000 from accumulated net realized gains, to paid-in capital.
For tax purposes, at September 30, 2014, the fund had $392,702,000 of ordinary income and $3,248,000 of long-term capital gains available for distribution.
At September 30, 2014, the cost of investment securities for tax purposes was $22,478,250,000. Net unrealized appreciation of investment securities for tax purposes was $4,996,727,000, consisting entirely of unrealized gains on securities that had risen in value since their purchase.
E. Capital shares issued and redeemed were:
| Year Ended September 30, | ||
| 2014 | 2013 | |
| Shares | Shares | |
| (000) | (000) | |
| Issued | 302,759 | 283,506 |
| Issued in Lieu of Cash Distributions | 15,522 | 15,924 |
| Redeemed | (179,980) | (138,429) |
| Net Increase (Decrease) in Shares Outstanding | 138,301 | 161,001 |
51
Target Retirement 2020 Fund
F. Transactions during the period in affiliated underlying Vanguard funds were as follows:
| Current Period Transactions | ||||||
| Sept. 30, | Proceeds | Sept. 30, | ||||
| 2013 | from | Capital Gain | 2014 | |||
| Market | Purchases | Securities | Dividend Distributions | Market | ||
| Value | at Cost | Sold | Income | Received | Value | |
| ($000) | ($000) | ($000) | ($000) | ($000) | ($000) | |
| Vanguard Market Liquidity Fund | 16,201 | NA1 | NA1 | 14 | — | 12,218 |
| Vanguard Total Bond Market II | ||||||
| Index Fund | 6,612,270 | 2,857,361 | 949,039 | 175,591 | 3,327 | 8,633,402 |
| Vanguard Total International | ||||||
| Bond Index Fund | 1,643,981 | 417,411 | — | 27,524 | — | 2,156,344 |
| Vanguard Total International | ||||||
| Stock Index Fund | 4,065,684 | 949,663 | 212,246 | 148,831 | — | 4,855,061 |
| Vanguard Total Stock Market | ||||||
| Index Fund | 9,460,621 | 1,522,522 | 693,894 | 190,524 | — | 11,817,952 |
| Total | 21,798,757 | 5,746,957 | 1,855,179 | 542,484 | 3,327 | 27,474,977 |
| 1 Not applicable—Purchases and Sales are for temporary cash investment purposes. | ||||||
G. Management has determined that no material events or transactions occurred subsequent to September 30, 2014, that would require recognition or disclosure in these financial statements.
52
Target Retirement 2025 Fund
Fund Profile
As of September 30, 2014
| Total Fund Characteristics | |
| Ticker Symbol | VTTVX |
| 30-Day SEC Yield | 2.09% |
| Acquired Fund Fees and Expenses1 | 0.17% |
| Allocation to Underlying Vanguard Funds | |
| Vanguard Total Stock Market Index Fund | |
| Investor Shares | 48.0% |
| Vanguard Total Bond Market II Index Fund | |
| Investor Shares | 25.6 |
| Vanguard Total International Stock Index | |
| Fund Investor Shares | 20.0 |
| Vanguard Total International Bond Index | |
| Fund Investor Shares | 6.4 |
| Total Fund Volatility Measures | ||
| Target 2025 | MSCI US | |
| Composite | Broad Market | |
| Index | Index | |
| R-Squared | 1.00 | 0.95 |
| Beta | 1.00 | 0.73 |
Fund Asset Allocation
1 This figure—drawn from the prospectus dated January 27, 2014—represents an estimate of the weighted average of the expense ratios and any
transaction fees charged by the underlying mutual funds (the ”acquired” funds) in which the Target Retirement 2025 Fund invests. The fund does not
charge any expenses or fees of its own. For the fiscal year ended September 30, 2014, the acquired fund fees and expenses were 0.17%.
53
Target Retirement 2025 Fund
Performance Summary
All of the returns in this report represent past performance, which is not a guarantee of future results that may be achieved by the fund. (Current performance may be lower or higher than the performance data cited. For performance data current to the most recent month-end, visit our website at vanguard.com/performance.) Note, too, that both investment returns and principal value can fluctuate widely, so an investor’s shares, when sold, could be worth more or less than their original cost. The returns shown do not reflect taxes that a shareholder would pay on fund distributions or on the sale of fund shares.
Cumulative Performance: September 30, 2004, Through September 30, 2014
Initial Investment of $10,000
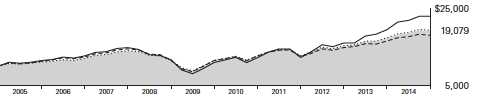
| Average Annual Total Returns | |||||
| Periods Ended September 30, 2014 | |||||
| Final Value | |||||
| One | Five | Ten | of a $10,000 | ||
| Year | Years | Years | Investment | ||
| Target Retirement 2025 Fund | 10.80% | 10.62% | 6.67% | $19,079 | |
| •••••••• | Target 2025 Composite Index | 11.15 | 10.89 | 6.80 | 19,314 |
| – – – – | Mixed-Asset Target 2025 Funds | ||||
| 8.78 | 9.36 | 6.04 | 17,970 | ||
| MSCI Average US Broad Market Index | 17.88 | 15.88 | 8.65 | 22,920 | |
Mixed-Asset Target 2025 Funds Average: Derived from data provided by Lipper, a Thomson Reuters Company.
See Financial Highlights for dividend and capital gains information.
54
Target Retirement 2025 Fund
Fiscal-Year Total Returns (%): September 30, 2004, Through September 30, 2014

For a benchmark description, see the Glossary.
55
Target Retirement 2025 Fund
Financial Statements
Statement of Net Assets
As of September 30, 2014
The fund reports a complete list of its holdings in regulatory filings four times in each fiscal year, at the quarter-ends. For the second and fourth fiscal quarters, the lists appear in the fund’s semiannual and annual reports to shareholders. For the first and third fiscal quarters, the fund files the lists with the Securities and Exchange Commission on Form N-Q. Shareholders can look up the fund’s Forms N-Q on the SEC’s website at sec.gov. Forms N-Q may also be reviewed and copied at the SEC’s Public Reference Room (see the back cover of this report for further information).
| Market | ||
| Value | ||
| Shares | ($000) | |
| Investment Companies (100.0%) | ||
| U.S. Stock Fund (48.1%) | ||
| Vanguard Total Stock Market Index Fund Investor Shares | 306,748,361 | 15,113,492 |
| International Stock Fund (20.0%) | ||
| Vanguard Total International Stock Index Fund Investor Shares | 383,386,212 | 6,272,198 |
| U.S. Bond Fund (25.5%) | ||
| 1 Vanguard Total Bond Market II Index Fund Investor Shares | 747,488,508 | 8,028,026 |
| International Bond Fund (6.4%) | ||
| Vanguard Total International Bond Index Fund Investor Shares | 191,846,640 | 1,995,205 |
| Total Investment Companies (Cost $24,599,074) | 31,408,921 | |
| Temporary Cash Investment (0.0%) | ||
| Money Market Fund (0.0%) | ||
| 1 Vanguard Market Liquidity Fund, 0.109% (Cost $7,412) | 7,411,690 | 7,412 |
| Total Investments (100.0%) (Cost $24,606,486) | 31,416,333 | |
| Other Assets and Liabilities (0.0%) | ||
| Other Assets | 223,171 | |
| Liabilities | (211,419) | |
| 11,752 | ||
| Net Assets (100%) | ||
| Applicable to 1,904,732,783 outstanding $.001 par value shares of | ||
| beneficial interest (unlimited authorization) | 31,428,085 | |
| Net Asset Value Per Share | $16.50 | |
56
Target Retirement 2025 Fund
| At September 30, 2014, net assets consisted of: | |
| Amount | |
| ($000) | |
| Paid-in Capital | 24,149,761 |
| Undistributed Net Investment Income | 432,569 |
| Accumulated Net Realized Gains | 35,908 |
| Unrealized Appreciation (Depreciation) | 6,809,847 |
| Net Assets | 31,428,085 |
See Note A in Notes to Financial Statements.
1 Affiliated fund available only to Vanguard funds and certain trusts and accounts managed by Vanguard. Rate shown for Vanguard Market
Liquidity Fund is the 7-day yield.
See accompanying Notes, which are an integral part of the Financial Statements.
57
Target Retirement 2025 Fund
Statement of Operations
| Year Ended | |
| September 30, 2014 | |
| ($000) | |
| Investment Income | |
| Income | |
| Income Distributions Received | 629,323 |
| Other Income | 43 |
| Net Investment Income—Note B | 629,366 |
| Realized Net Gain (Loss) | |
| Capital Gain Distributions Received | 3,125 |
| Affiliated Investment Securities Sold | 42,718 |
| Realized Net Gain (Loss) | 45,843 |
| Change in Unrealized Appreciation (Depreciation) of Investment Securities | 2,213,724 |
| Net Increase (Decrease) in Net Assets Resulting from Operations | 2,888,933 |
See accompanying Notes, which are an integral part of the Financial Statements.
58
Target Retirement 2025 Fund
Statement of Changes in Net Assets
| Year Ended September 30, | ||
| 2014 | 2013 | |
| ($000) | ($000) | |
| Increase (Decrease) in Net Assets | ||
| Operations | ||
| Net Investment Income | 629,366 | 533,278 |
| Realized Net Gain (Loss) | 45,843 | 118,453 |
| Change in Unrealized Appreciation (Depreciation) | 2,213,724 | 2,280,063 |
| Net Increase (Decrease) in Net Assets Resulting from Operations | 2,888,933 | 2,931,794 |
| Distributions | ||
| Net Investment Income | (498,818) | (454,865) |
| Realized Capital Gain1 | (29,547) | (18,440) |
| Total Distributions | (528,365) | (473,305) |
| Capital Share Transactions | ||
| Issued | 7,966,985 | 6,898,529 |
| Issued in Lieu of Cash Distributions | 520,247 | 468,277 |
| Redeemed | (5,061,387) | (4,205,203) |
| Net Increase (Decrease) from Capital Share Transactions | 3,425,845 | 3,161,603 |
| Total Increase (Decrease) | 5,786,413 | 5,620,092 |
| Net Assets | ||
| Beginning of Period | 25,641,672 | 20,021,580 |
| End of Period2 | 31,428,085 | 25,641,672 |
are treated as ordinary income dividends for tax purposes.
2 Net Assets—End of Period includes undistributed (overdistributed) net investment income of $432,569,000 and $339,939,000.
See accompanying Notes, which are an integral part of the Financial Statements.
59
Target Retirement 2025 Fund
Financial Highlights
| For a Share Outstanding | Year Ended September 30, | ||||
| Throughout Each Period | 2014 | 2013 | 2012 | 2011 | 2010 |
| Net Asset Value, Beginning of Period | $15.18 | $13.70 | $11.71 | $11.97 | $11.11 |
| Investment Operations | |||||
| Net Investment Income | .350 | .316 | .331 | .2571 | .262 |
| Capital Gain Distributions Received | .002 | .021 | .036 | .0201 | — |
| Net Realized and Unrealized Gain (Loss) | |||||
| on Investments | 1.272 | 1.451 | 1.927 | (. 271) | .850 |
| Total from Investment Operations | 1.624 | 1.788 | 2.294 | .006 | 1.112 |
| Distributions | |||||
| Dividends from Net Investment Income | (.287) | (. 296) | (. 291) | (. 250) | (. 252) |
| Distributions from Realized Capital Gains | (.017) | (. 012) | (. 013) | (. 016) | — |
| Total Distributions | (.304) | (.308) | (. 304) | (. 266) | (. 252) |
| Net Asset Value, End of Period | $16.50 | $15.18 | $13.70 | $11.71 | $11.97 |
| Total Return2 | 10.80% | 13.34% | 19.89% | -0.11% | 10.12% |
| Ratios/Supplemental Data | |||||
| Net Assets, End of Period (Millions) | $31,428 | $25,642 | $20,022 | $14,997 | $13,652 |
| Ratio of Total Expenses to Average Net Assets | — | — | — | — | — |
| Acquired Fund Fees and Expenses | 0.17% | 0.17% | 0.17% | 0.18% | 0.18% |
| Ratio of Net Investment Income to | |||||
| Average Net Assets | 2.15% | 2.27% | 2.64% | 2.01% | 2.42% |
| Portfolio Turnover Rate | 7% | 16% | 9% | 23%3 | 11% |
2 Total returns do not include account service fees that may have applied in the periods shown. Fund prospectuses provide information about
any applicable account service fees.
3 Excludes the value of mutual fund shares delivered and received in connection with a change in the fund’s international equity investments
from Vanguard European, Pacific, and Emerging Markets Stock Index Funds to Vanguard Total International Stock Index Fund because those
transactions were effected in kind and did not cause the fund to incur transaction costs.
See accompanying Notes, which are an integral part of the Financial Statements.
60
Target Retirement 2025 Fund
Notes to Financial Statements
Vanguard Target Retirement 2025 Fund is registered under the Investment Company Act of 1940 as an open-end investment company, or mutual fund. The fund follows a balanced investment strategy by investing in selected Vanguard funds to achieve its targeted allocation of assets to U.S. and international stocks, and U.S. and international bonds. Financial statements and other information about each underlying fund are available on vanguard.com.
A. The following significant accounting policies conform to generally accepted accounting principles for U.S. investment companies. The fund consistently follows such policies in preparing its financial statements.
1. Security Valuation: Investments are valued at the net asset value of each underlying Vanguard fund determined as of the close of the New York Stock Exchange (generally 4 p.m., Eastern time) on the valuation date.
2. Federal Income Taxes: The fund intends to continue to qualify as a regulated investment company and distribute all of its taxable income. Management has analyzed the fund’s tax positions taken for all open federal income tax years (September 30, 2011–2014), and has concluded that no provision for federal income tax is required in the fund’s financial statements.
3. Distributions: Distributions to shareholders are recorded on the ex-dividend date.
4. Credit Facility: The fund and certain other funds managed by The Vanguard Group participate in a $2.89 billion committed credit facility provided by a syndicate of lenders pursuant to a credit agreement that may be renewed annually; each fund is individually liable for its borrowings, if any, under the credit facility. Borrowings may be utilized for temporary and emergency purposes, and are subject to the fund’s regulatory and contractual borrowing restrictions. The participating funds are charged administrative fees and an annual commitment fee of 0.06% of the undrawn amount of the facility; these fees are allocated to the funds based on a method approved by the fund’s board of trustees and borne by the funds in which the fund invests (see Note B). Any borrowings under this facility bear interest at a rate equal to the higher of the federal funds rate or LIBOR reference rate plus an agreed-upon spread.
The fund had no borrowings outstanding at September 30, 2014, or at any time during the period then ended.
5. Other: Income and capital gain distributions received are recorded on the ex-dividend date. Security transactions are accounted for on the date securities are bought or sold. Costs used to determine realized gains (losses) on the sale of investment securities are those of the specific securities sold.
B. Under a service agreement, The Vanguard Group furnishes investment advisory, corporate management, administrative, marketing, and distribution services to the fund. The service agreement provides that the fund’s expenses may be reduced or eliminated to the extent of savings realized by the Vanguard funds by the operation of the fund. Accordingly, all incremental expenses for services provided by Vanguard and all other expenses incurred by the fund during the year ended September 30, 2014, were borne by the funds in which the fund invests. The fund’s trustees and officers are also directors and officers of Vanguard and the funds in which the fund invests.
61
Target Retirement 2025 Fund
C. Various inputs may be used to determine the value of the fund’s investments. These inputs are summarized in three broad levels for financial statement purposes. The inputs or methodologies used to value securities are not necessarily an indication of the risk associated with investing in those securities.
Level 1—Quoted prices in active markets for identical securities.
Level 2—Other significant observable inputs (including quoted prices for similar securities, interest rates, prepayment speeds, credit risk, etc.).
Level 3—Significant unobservable inputs (including the fund’s own assumptions used to determine the fair value of investments).
At September 30, 2014, 100% of the market value of the fund’s investments was determined based on Level 1 inputs.
D. Distributions are determined on a tax basis and may differ from net investment income and realized capital gains for financial reporting purposes. Differences may be permanent or temporary. Permanent differences are reclassified among capital accounts in the financial statements to reflect their tax character. Temporary differences arise when certain items of income, expense, gain, or loss are recognized in different periods for financial statement and tax purposes. These differences will reverse at some time in the future. Differences in classification may also result from the treatment of short-term gains as ordinary income for tax purposes.
The fund used a tax accounting practice to treat a portion of the price of capital shares redeemed during the year as distributions from net investment income and realized capital gains. Accordingly, the fund has reclassified $37,918,000 from undistributed net investment income, and $2,708,000 from accumulated net realized gains, to paid-in capital.
For tax purposes, at September 30, 2014, the fund had $457,102,000 of ordinary income and $16,366,000 of long-term capital gains available for distribution.
At September 30, 2014, the cost of investment securities for tax purposes was $24,611,478,000. Net unrealized appreciation of investment securities for tax purposes was $6,804,855,000, consisting entirely of unrealized gains on securities that had risen in value since their purchase.
E. Capital shares issued and redeemed were:
| Year Ended September 30, | ||
| 2014 | 2013 | |
| Shares | Shares | |
| (000) | (000) | |
| Issued | 496,821 | 483,653 |
| Issued in Lieu of Cash Distributions | 33,179 | 34,790 |
| Redeemed | (314,735) | (290,706) |
| Net Increase (Decrease) in Shares Outstanding | 215,265 | 227,737 |
62
Target Retirement 2025 Fund
F. Transactions during the period in affiliated underlying Vanguard funds were as follows:
| Current Period Transactions | ||||||
| Sept. 30, | Proceeds | Sept. 30, | ||||
| 2013 | from | Capital Gain | 2014 | |||
| Market | Purchases | Securities | Dividend | Distributions | Market | |
| Value | at Cost | Sold | Income | Received | Value | |
| ($000) | ($000) | ($000) | ($000) | ($000) | ($000) | |
| Vanguard Market Liquidity Fund | 15,187 | NA1 | NA1 | 15 | — | 7,412 |
| Vanguard Total Bond Market II | ||||||
| Index Fund | 6,237,918 | 2,477,468 | 792,603 | 163,516 | 3,125 | 8,028,026 |
| Vanguard Total International | ||||||
| Bond Index Fund | 1,550,918 | 376,926 | 21,000 | 25,695 | — | 1,995,205 |
| Vanguard Total International | ||||||
| Stock Index Fund | 5,364,414 | 1,032,370 | 192,867 | 193,421 | — | 6,272,198 |
| Vanguard Total Stock Market | ||||||
| Index Fund | 12,491,145 | 1,625,562 | 997,771 | 246,676 | — | 15,113,492 |
| Total | 25,659,582 | 5,512,326 | 2,004,241 | 629,323 | 3,125 | 31,416,333 |
| 1 Not applicable—Purchases and Sales are for temporary cash investment purposes. | ||||||
G. Management has determined that no material events or transactions occurred subsequent to September 30, 2014, that would require recognition or disclosure in these financial statements.
63
Target Retirement 2030 Fund
Fund Profile
As of September 30, 2014
| Total Fund Characteristics | |
| Ticker Symbol | VTHRX |
| 30-Day SEC Yield | 2.10% |
| Acquired Fund Fees and Expenses1 | 0.17% |
| Allocation to Underlying Vanguard Funds | |
| Vanguard Total Stock Market Index Fund | |
| Investor Shares | 53.3% |
| Vanguard Total International Stock Index | |
| Fund Investor Shares | 22.3 |
| Vanguard Total Bond Market II Index Fund | |
| Investor Shares | 19.5 |
| Vanguard Total International Bond Index | |
| Fund Investor Shares | 4.9 |
| Total Fund Volatility Measures | ||
| Target 2030 | MSCI US | |
| Composite | Broad Market | |
| Index | Index | |
| R-Squared | 1.00 | 0.95 |
| Beta | 1.00 | 0.81 |
Fund Asset Allocation

1 This figure—drawn from the prospectus dated January 27, 2014—represents an estimate of the weighted average of the expense ratios and any
transaction fees charged by the underlying mutual funds (the ”acquired” funds) in which the Target Retirement 2030 Fund invests. The fund does not
charge any expenses or fees of its own. For the fiscal year ended September 30, 2014, the acquired fund fees and expenses were 0.17%.
64
Target Retirement 2030 Fund
Performance Summary
All of the returns in this report represent past performance, which is not a guarantee of future results that may be achieved by the fund. (Current performance may be lower or higher than the performance data cited. For performance data current to the most recent month-end, visit our website at vanguard.com/performance.) Note, too, that both investment returns and principal value can fluctuate widely, so an investor’s shares, when sold, could be worth more or less than their original cost. The returns shown do not reflect taxes that a shareholder would pay on fund distributions or on the sale of fund shares.
Cumulative Performance: June 7, 2006, Through September 30, 2014
Initial Investment of $10,000
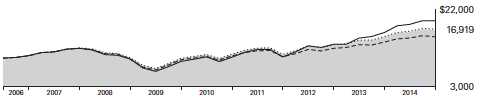
| Average Annual Total Returns | |||||
| Periods Ended September 30, 2014 | |||||
| Since | Final Value | ||||
| One | Five | Inception | of a $10,000 | ||
| Year | Years | (6/7/2006) | Investment | ||
| Target Retirement 2030 Fund | 11.51% | 11.23% | 6.53% | $16,919 | |
| •••••••• | Target 2030 Composite Index | 11.86 | 11.50 | 6.67 | 17,107 |
| – – – – | Mixed-Asset Target 2030 Funds | ||||
| 9.16 | 9.68 | 5.18 | 15,216 | ||
| MSCI Average US Broad Market Index | 17.88 | 15.88 | 8.15 | 19,186 | |
Mixed-Asset Target 2030 Funds Average: Derived from data provided by Lipper, a Thomson Reuters Company.
"Since Inception" performance is calculated from the inception date for both the fund and its comparative standards.
See Financial Highlights for dividend and capital gains information.
65
Target Retirement 2030 Fund
Fiscal-Year Total Returns (%): June 7, 2006, Through September 30, 2014

For a benchmark description, see the Glossary.
66
Target Retirement 2030 Fund
Financial Statements
Statement of Net Assets
As of September 30, 2014
The fund reports a complete list of its holdings in regulatory filings four times in each fiscal year, at the quarter-ends. For the second and fourth fiscal quarters, the lists appear in the fund’s semiannual and annual reports to shareholders. For the first and third fiscal quarters, the fund files the lists with the Securities and Exchange Commission on Form N-Q. Shareholders can look up the fund’s Forms N-Q on the SEC’s website at sec.gov. Forms N-Q may also be reviewed and copied at the SEC’s Public Reference Room (see the back cover of this report for further information).
| Market | ||
| Value | ||
| Shares | ($000) | |
| Investment Companies (99.9%) | ||
| U.S. Stock Fund (53.3%) | ||
| Vanguard Total Stock Market Index Fund Investor Shares | 249,493,593 | 12,292,549 |
| International Stock Fund (22.3%) | ||
| Vanguard Total International Stock Index Fund Investor Shares | 314,791,494 | 5,149,989 |
| U.S. Bond Fund (19.5%) | ||
| 1 Vanguard Total Bond Market II Index Fund Investor Shares | 419,249,876 | 4,502,744 |
| International Bond Fund (4.8%) | ||
| Vanguard Total International Bond Index Fund Investor Shares | 107,611,601 | 1,119,160 |
| Total Investment Companies (Cost $18,193,907) | 23,064,442 | |
| Temporary Cash Investment (0.0%) | ||
| Money Market Fund (0.0%) | ||
| 1 Vanguard Market Liquidity Fund, 0.109% (Cost $6,481) | 6,480,683 | 6,481 |
| Total Investments (99.9%) (Cost $18,200,388) | 23,070,923 | |
| Other Assets and Liabilities (0.1%) | ||
| Other Assets | 169,174 | |
| Liabilities | (155,208) | |
| 13,966 | ||
| Net Assets (100%) | ||
| Applicable to 797,274,701 outstanding $.001 par value shares of | ||
| beneficial interest (unlimited authorization) | 23,084,889 | |
| Net Asset Value Per Share | $28.95 | |
67
Target Retirement 2030 Fund
| At September 30, 2014, net assets consisted of: | |
| Amount | |
| ($000) | |
| Paid-in Capital | 17,890,627 |
| Undistributed Net Investment Income | 314,218 |
| Accumulated Net Realized Gains | 9,509 |
| Unrealized Appreciation (Depreciation) | 4,870,535 |
| Net Assets | 23,084,889 |
See Note A in Notes to Financial Statements.
1 Affiliated fund available only to Vanguard funds and certain trusts and accounts managed by Vanguard. Rate shown for Vanguard Market
Liquidity Fund is the 7-day yield.
See accompanying Notes, which are an integral part of the Financial Statements.
68
Target Retirement 2030 Fund
Statement of Operations
| Year Ended | |
| September 30, 2014 | |
| ($000) | |
| Investment Income | |
| Income | |
| Income Distributions Received | 454,213 |
| Other Income | 20 |
| Net Investment Income—Note B | 454,233 |
| Realized Net Gain (Loss) | |
| Capital Gain Distributions Received | 1,657 |
| Affiliated Investment Securities Sold | 17,313 |
| Realized Net Gain (Loss) | 18,970 |
| Change in Unrealized Appreciation (Depreciation) of Investment Securities | 1,691,511 |
| Net Increase (Decrease) in Net Assets Resulting from Operations | 2,164,714 |
See accompanying Notes, which are an integral part of the Financial Statements.
69
Target Retirement 2030 Fund
Statement of Changes in Net Assets
| Year Ended September 30, | ||
| 2014 | 2013 | |
| ($000) | ($000) | |
| Increase (Decrease) in Net Assets | ||
| Operations | ||
| Net Investment Income | 454,233 | 361,634 |
| Realized Net Gain (Loss) | 18,970 | 40,881 |
| Change in Unrealized Appreciation (Depreciation) | 1,691,511 | 1,795,127 |
| Net Increase (Decrease) in Net Assets Resulting from Operations | 2,164,714 | 2,197,642 |
| Distributions | ||
| Net Investment Income | (343,337) | (289,870) |
| Realized Capital Gain1 | (25,173) | (8,714) |
| Total Distributions | (368,510) | (298,584) |
| Capital Share Transactions | ||
| Issued | 6,870,930 | 5,741,317 |
| Issued in Lieu of Cash Distributions | 361,941 | 294,856 |
| Redeemed | (3,738,811) | (2,787,514) |
| Net Increase (Decrease) from Capital Share Transactions | 3,494,060 | 3,248,659 |
| Total Increase (Decrease) | 5,290,264 | 5,147,717 |
| Net Assets | ||
| Beginning of Period | 17,794,625 | 12,646,908 |
| End of Period2 | 23,084,889 | 17,794,625 |
are treated as ordinary income dividends for tax purposes.
2 Net Assets—End of Period includes undistributed (overdistributed) net investment income of $314,218,000 and $229,962,000.
See accompanying Notes, which are an integral part of the Financial Statements.
70
Target Retirement 2030 Fund
Financial Highlights
| For a Share Outstanding | Year Ended September 30, | ||||
| Throughout Each Period | 2014 | 2013 | 2012 | 2011 | 2010 |
| Net Asset Value, Beginning of Period | $26.46 | $23.51 | $19.81 | $20.36 | $18.84 |
| Investment Operations | |||||
| Net Investment Income | . 613 | . 540 | . 561 | . 398 | .4531 |
| Capital Gain Distributions Received | .002 | .027 | .044 | .011 | — |
| Net Realized and Unrealized Gain (Loss) | |||||
| on Investments | 2.402 | 2.897 | 3.580 | (.542) | 1.453 |
| Total from Investment Operations | 3.017 | 3.464 | 4.185 | (.133) | 1.906 |
| Distributions | |||||
| Dividends from Net Investment Income | (. 491) | (. 499) | (. 468) | (. 395) | (. 386) |
| Distributions from Realized Capital Gains | (.036) | (.015) | (.017) | (.022) | — |
| Total Distributions | (.527) | (. 514) | (. 485) | (. 417) | (.386) |
| Net Asset Value, End of Period | $28.95 | $26.46 | $23.51 | $19.81 | $20.36 |
| Total Return2 | 11.51% | 15.05% | 21.43% | -0.83% | 10.21% |
| Ratios/Supplemental Data | |||||
| Net Assets, End of Period (Millions) | $23,085 | $17,795 | $12,647 | $8,245 | $6,533 |
| Ratio of Total Expenses to Average Net Assets | — | — | — | — | — |
| Acquired Fund Fees and Expenses | 0.17% | 0.17% | 0.17% | 0.18% | 0.19% |
| Ratio of Net Investment Income to | |||||
| Average Net Assets | 2.16% | 2.30% | 2.66% | 1.91% | 2.32% |
| Portfolio Turnover Rate | 7% | 14% | 4% | 19%3 | 9% |
2 Total returns do not include account service fees that may have applied in the periods shown. Fund prospectuses provide information about
any applicable account service fees.
3 Excludes the value of mutual fund shares delivered and received in connection with a change in the fund’s international equity investments
from Vanguard European, Pacific, and Emerging Markets Stock Index Funds to Vanguard Total International Stock Index Fund because those
transactions were effected in kind and did not cause the fund to incur transaction costs.
See accompanying Notes, which are an integral part of the Financial Statements.
71
Target Retirement 2030 Fund
Notes to Financial Statements
Vanguard Target Retirement 2030 Fund is registered under the Investment Company Act of 1940 as an open-end investment company, or mutual fund. The fund follows a balanced investment strategy by investing in selected Vanguard funds to achieve its targeted allocation of assets to U.S. and international stocks, and U.S. and international bonds. Financial statements and other information about each underlying fund are available on vanguard.com.
A. The following significant accounting policies conform to generally accepted accounting principles for U.S. investment companies. The fund consistently follows such policies in preparing its financial statements.
1. Security Valuation: Investments are valued at the net asset value of each underlying Vanguard fund determined as of the close of the New York Stock Exchange (generally 4 p.m., Eastern time) on the valuation date.
2. Federal Income Taxes: The fund intends to continue to qualify as a regulated investment company and distribute all of its taxable income. Management has analyzed the fund’s tax positions taken for all open federal income tax years (September 30, 2011–2014), and has concluded that no provision for federal income tax is required in the fund’s financial statements.
3. Distributions: Distributions to shareholders are recorded on the ex-dividend date.
4. Credit Facility: The fund and certain other funds managed by The Vanguard Group participate in a $2.89 billion committed credit facility provided by a syndicate of lenders pursuant to a credit agreement that may be renewed annually; each fund is individually liable for its borrowings, if any, under the credit facility. Borrowings may be utilized for temporary and emergency purposes, and are subject to the fund’s regulatory and contractual borrowing restrictions. The participating funds are charged administrative fees and an annual commitment fee of 0.06% of the undrawn amount of the facility; these fees are allocated to the funds based on a method approved by the fund’s board of trustees and borne by the funds in which the fund invests (see Note B). Any borrowings under this facility bear interest at a rate equal to the higher of the federal funds rate or LIBOR reference rate plus an agreed-upon spread.
The fund had no borrowings outstanding at September 30, 2014, or at any time during the period then ended.
5. Other: Income and capital gain distributions received are recorded on the ex-dividend date. Security transactions are accounted for on the date securities are bought or sold. Costs used to determine realized gains (losses) on the sale of investment securities are those of the specific securities sold.
B. Under a service agreement, The Vanguard Group furnishes investment advisory, corporate management, administrative, marketing, and distribution services to the fund. The service agreement provides that the fund’s expenses may be reduced or eliminated to the extent of savings realized by the Vanguard funds by the operation of the fund. Accordingly, all incremental expenses for services provided by Vanguard and all other expenses incurred by the fund during the year ended September 30, 2014, were borne by the funds in which the fund invests. The fund’s trustees and officers are also directors and officers of Vanguard and the funds in which the fund invests.
72
Target Retirement 2030 Fund
C. Various inputs may be used to determine the value of the fund’s investments. These inputs are summarized in three broad levels for financial statement purposes. The inputs or methodologies used to value securities are not necessarily an indication of the risk associated with investing in those securities.
Level 1—Quoted prices in active markets for identical securities.
Level 2—Other significant observable inputs (including quoted prices for similar securities, interest rates, prepayment speeds, credit risk, etc.).
Level 3—Significant unobservable inputs (including the fund’s own assumptions used to determine the fair value of investments).
At September 30, 2014, 100% of the market value of the fund’s investments was determined based on Level 1 inputs.
D. Distributions are determined on a tax basis and may differ from net investment income and realized capital gains for financial reporting purposes. Differences may be permanent or temporary. Permanent differences are reclassified among capital accounts in the financial statements to reflect their tax character. Temporary differences arise when certain items of income, expense, gain, or loss are recognized in different periods for financial statement and tax purposes. These differences will reverse at some time in the future. Differences in classification may also result from the treatment of short-term gains as ordinary income for tax purposes.
The fund used a tax accounting practice to treat a portion of the price of capital shares redeemed during the year as distributions from net investment income and realized capital gains. Accordingly, the fund has reclassified $26,640,000 from undistributed net investment income, and $814,000 from accumulated net realized gains, to paid-in capital.
For tax purposes, at September 30, 2014, the fund had $325,799,000 of ordinary income and $1,257,000 of long-term capital gains available for distribution.
At September 30, 2014, the cost of investment securities for tax purposes was $18,203,717,000. Net unrealized appreciation of investment securities for tax purposes was $4,867,206,000, consisting entirely of unrealized gains on securities that had risen in value since their purchase.
E. Capital shares issued and redeemed were:
| Year Ended September 30, | ||
| 2014 | 2013 | |
| Shares | Shares | |
| (000) | (000) | |
| Issued | 244,389 | 233,050 |
| Issued in Lieu of Cash Distributions | 13,157 | 12,748 |
| Redeemed | (132,691) | (111,235) |
| Net Increase (Decrease) in Shares Outstanding | 124,855 | 134,563 |
73
Target Retirement 2030 Fund
F. Transactions during the period in affiliated underlying Vanguard funds were as follows:
| Current Period Transactions | ||||||
| Sept. 30, | Proceeds | Sept. 30, | ||||
| 2013 | from | Capital Gain | 2014 | |||
| Market | Purchases | Securities | Dividend Distributions | Market | ||
| Value | at Cost | Sold | Income | Received | Value | |
| ($000) | ($000) | ($000) | ($000) | ($000) | ($000) | |
| Vanguard Market Liquidity Fund | 8,924 | NA1 | NA1 | 13 | — | 6,481 |
| Vanguard Total Bond Market II | ||||||
| Index Fund | 3,249,479 | 1,771,786 | 575,783 | 89,011 | 1,657 | 4,502,744 |
| Vanguard Total International | ||||||
| Bond Index Fund | 804,907 | 282,137 | 15,610 | 13,860 | — | 1,119,160 |
| Vanguard Total International | ||||||
| Stock Index Fund | 4,121,167 | 1,147,094 | 159,786 | 154,624 | — | 5,149,989 |
| Vanguard Total Stock Market | ||||||
| Index Fund | 9,614,692 | 1,755,589 | 640,053 | 196,705 | — | 12,292,549 |
| Total | 17,799,169 | 4,956,606 | 1,391,232 | 454,213 | 1,657 | 23,070,923 |
| 1 Not applicable—Purchases and Sales are for temporary cash investment purposes. | ||||||
G. Management has determined that no material events or transactions occurred subsequent to September 30, 2014, that would require recognition or disclosure in these financial statements.
74
Report of Independent Registered Public Accounting Firm
To the Board of Trustees of Vanguard Chester Funds and the Shareholders of Vanguard Target Retirement Income Fund, Vanguard Target Retirement 2010 Fund, Vanguard Target Retirement 2015 Fund, Vanguard Target Retirement 2020 Fund, Vanguard Target Retirement 2025 Fund and Vanguard Target Retirement 2030 Fund:
In our opinion, the accompanying statements of net assets and the related statements of operations and of changes in net assets and the financial highlights present fairly, in all material respects, the financial position of Vanguard Target Retirement Income Fund, Vanguard Target Retirement 2010 Fund, Vanguard Target Retirement 2015 Fund, Vanguard Target Retirement 2020 Fund, Vanguard Target Retirement 2025 Fund and Vanguard Target Retirement 2030 Fund (constituting separate portfolios of Vanguard Chester Funds, hereafter referred to as the “Funds”) at September 30, 2014, the results of each of their operations for the year then ended, the changes in each of their net assets for each of the two years in the period then ended, and the financial highlights for each of the five years in the period then ended, in conformity with accounting principles generally accepted in the United States of America. These financial statements and financial highlights (hereafter referred to as “financial statements”) are the responsibility of the Funds’ management. Our responsibility is to express an opinion on these financial statements based on our audits. We conducted our audits of these financial statements in accordance with the standards of the Public Company Accounting Oversight Board (United States). Those standards require that we plan and perform the audit to obtain reasonable assurance about whether the financial statements are free of material misstatement. An audit includes examining, on a test basis, evidence supporting the amounts and disclosures in the financial statements, assessing the accounting principles used and significant estimates made by management, and evaluating the overall financial statement presentation. We believe that our audits, which included confirmation of securities at September 30, 2014 by agreement to the underlying ownership records of the transfer agent, provide a reasonable basis for our opinion.
/s/PricewaterhouseCoopers LLP
Philadelphia, Pennsylvania
November 10, 2014
Special 2014 tax information (unaudited) for Vanguard Target Retirement Funds
This information for the fiscal year ended September 30, 2014, is included pursuant to provisions of the Internal Revenue Code.
The funds distributed capital gain dividends (from net long-term capital gains) to shareholders during the fiscal year as follows:
| Fund | ($000) |
| Target Retirement Income Fund | 172,730 |
| Target Retirement 2010 Fund | 91,725 |
| Target Retirement 2015 Fund | 132,389 |
| Target Retirement 2020 Fund | 6,251 |
| Target Retirement 2025 Fund | 1,030 |
| Target Retirement 2030 Fund | 2,193 |
75
For non-resident alien shareholders, 100% of short-term capital gain dividends distributed by the funds are qualified short-term capital gains.
The funds distributed qualified dividend income to shareholders during the fiscal year as follows:
| Fund | ($000) |
| Target Retirement Income Fund | 59,668 |
| Target Retirement 2010 Fund | 44,988 |
| Target Retirement 2015 Fund | 175,986 |
| Target Retirement 2020 Fund | 226,039 |
| Target Retirement 2025 Fund | 301,336 |
| Target Retirement 2030 Fund | 227,667 |
For corporate shareholders, the percentage of investment income (dividend income plus short-term gains, if any) that qualifies for the dividends-received deduction is as follows:
| Fund | Percentage |
| Target Retirement Income Fund | 18.5% |
| Target Retirement 2010 Fund | 22.8 |
| Target Retirement 2015 Fund | 27.6 |
| Target Retirement 2020 Fund | 30.7 |
| Target Retirement 2025 Fund | 34.2 |
| Target Retirement 2030 Fund | 38.3 |
The funds designate to shareholders foreign source income and foreign taxes paid as follows:
| Foreign Source Income | Foreign Taxes Paid | |
| Fund | ($000) | ($000) |
| Target Retirement Income Fund | 30,532 | 1,763 |
| Target Retirement 2010 Fund | 25,260 | 1,459 |
| Target Retirement 2015 Fund | 104,192 | 6,017 |
| Target Retirement 2020 Fund | 147,455 | 8,515 |
| Target Retirement 2025 Fund | 191,632 | 11,066 |
| Target Retirement 2030 Fund | 153,193 | 8,846 |
Shareholders will receive more detailed information with their Form 1099-DIV in January 2015 to determine the calendar-year amounts to be included on their 2014 tax returns.
76
Your Fund’s After-Tax Returns
This table presents returns for your fund both before and after taxes. The after-tax returns are shown in two ways: (1) assuming that an investor owned the fund during the entire period and paid taxes on the fund’s distributions, and (2) assuming that an investor paid taxes on the fund’s distributions and sold all shares at the end of each period.
Calculations are based on the highest individual federal income tax and capital gains tax rates in effect at the times of the distributions and the hypothetical sales. State and local taxes were not considered. After-tax returns reflect any qualified dividend income, using actual prior-year figures and estimates for 2014. (In the example, returns after the sale of fund shares may be higher than those assuming no sale. This occurs when the sale would have produced a capital loss. The calculation assumes that the investor received a tax deduction for the loss.)
Please note that your actual after-tax returns will depend on your tax situation and may differ from those shown. Also note that if you own the fund in a tax-deferred account, such as an individual retirement account or a 401(k) plan, this information does not apply to you. Such accounts are not subject to current taxes.
Finally, keep in mind that a fund’s performance—whether before or after taxes—does not guarantee future results.
| Average Annual Total Returns: Target Retirement Funds | |||
| Periods Ended September 30, 2014 | |||
| One | Five | Ten | |
| Year | Years | Years | |
| Target Retirement Income Fund | |||
| Returns Before Taxes | 6.47% | 6.96% | 5.52% |
| Returns After Taxes on Distributions | 5.41 | 6.07 | 4.47 |
| Returns After Taxes on Distributions and Sale of Fund Shares | 4.06 | 5.18 | 4.00 |
| Since | |||
| One | Five | Inception | |
| Year | Years | (6/7/2006) | |
| Target Retirement 2010 Fund | |||
| Returns Before Taxes | 7.55% | 8.24% | 5.96% |
| Returns After Taxes on Distributions | 6.65 | 7.47 | 5.27 |
| Returns After Taxes on Distributions and Sale of Fund Shares | 4.63 | 6.28 | 4.53 |
| One | Five | Ten | |
| Year | Years | Years | |
| Target Retirement 2015 Fund | |||
| Returns Before Taxes | 9.07% | 9.23% | 6.32% |
| Returns After Taxes on Distributions | 8.30 | 8.53 | 5.61 |
| Returns After Taxes on Distributions and Sale of Fund Shares | 5.42 | 7.12 | 4.85 |
77
| Average Annual Total Returns: Target Retirement Funds | |||
| Periods Ended September 30, 2014 | |||
| Since | |||
| One | Five | Inception | |
| Year | Years | (6/7/2006) | |
| Target Retirement 2020 Fund | |||
| Returns Before Taxes | 10.13% | 9.99% | 6.42% |
| Returns After Taxes on Distributions | 9.50 | 9.39 | 5.89 |
| Returns After Taxes on Distributions and Sale of Fund Shares | 5.93 | 7.78 | 4.99 |
| One | Five | Ten | |
| Year | Years | Years | |
| Target Retirement 2025 Fund | |||
| Returns Before Taxes | 10.80% | 10.62% | 6.67% |
| Returns After Taxes on Distributions | 10.14 | 10.04 | 6.09 |
| Returns After Taxes on Distributions and Sale of Fund Shares | 6.34 | 8.32 | 5.23 |
| Since | |||
| One | Five | Inception | |
| Year | Years | (6/7/2006) | |
| Target Retirement 2030 Fund | |||
| Returns Before Taxes | 11.51% | 11.23% | 6.53% |
| Returns After Taxes on Distributions | 10.87 | 10.71 | 6.09 |
| Returns After Taxes on Distributions and Sale of Fund Shares | 6.76 | 8.86 | 5.13 |
78
About Your Fund’s Expenses
As a shareholder of the fund, you incur ongoing costs, which include costs for portfolio management, administrative services, and shareholder reports (like this one), among others. Operating expenses, which are deducted from a fund’s gross income, directly reduce the investment return of the fund.
A typical fund’s expenses are expressed as a percentage of its average net assets. The Target Retirement Funds have no direct expenses, but each fund bears its proportionate share of the costs for the underlying funds in which it invests. These indirect expenses make up the acquired fund fees and expenses, also expressed as a percentage of average net assets.
The following examples are intended to help you understand the ongoing cost (in dollars) of investing in your fund and to compare these costs with those of other mutual funds. The examples are based on an investment of $1,000 made at the beginning of the period shown and held for the entire period. The costs were calculated using the acquired fund fees and expenses for each Target Retirement Fund.
The accompanying table illustrates your fund’s costs in two ways:
• Based on actual fund return. This section helps you to estimate the actual expenses that you paid over the period. The ”Ending Account Value“ shown is derived from the fund‘s actual return, and the third column shows the dollar amount that would have been paid by an investor who started with $1,000 in the fund. You may use the information here, together with the amount you invested, to estimate the expenses that you paid over the period.
To do so, simply divide your account value by $1,000 (for example, an $8,600 account value divided by $1,000 = 8.6), then multiply the result by the number given for your fund under the heading ”Expenses Paid During Period.“
• Based on hypothetical 5% yearly return. This section is intended to help you compare your fund‘s costs with those of other mutual funds. It assumes that the fund had a yearly return of 5% before expenses, but that the expense ratio is unchanged. In this case—because the return used is not the fund’s actual return—the results do not apply to your investment. The example is useful in making comparisons because the Securities and Exchange Commission requires all mutual funds to calculate expenses based on a 5% return. You can assess your fund’s costs by comparing this hypothetical example with the hypothetical examples that appear in shareholder reports of other funds.
Note that the expenses shown in the table are meant to highlight and help you compare ongoing costs only and do not reflect transaction costs incurred by the fund for buying and selling securities. Further, the expenses do not include any purchase, redemption, or account service fees described in the fund prospectus. If such fees were applied to your account, your costs would be higher. Your fund does not carry a “sales load.”
The calculations assume no shares were bought or sold during the period. Your actual costs may have been higher or lower, depending on the amount of your investment and the timing of any purchases or redemptions.
You can find more information about the fund’s expenses, including annual expense ratios, in the Financial Statements section of this report. For additional information on operating expenses and other shareholder costs, please refer to your fund’s current prospectus.
79
| Six Months Ended September 30, 2014 | |||
| Beginning | Ending | Expenses | |
| Account Value | Account Value | Paid During | |
| 3/31/2014 | 9/30/2014 | Period | |
| Based on Actual Fund Return | |||
| Target Retirement Income Fund | $1,000.00 | $1,023.38 | $0.81 |
| Target Retirement 2010 Fund | $1,000.00 | $1,024.59 | $0.81 |
| Target Retirement 2015 Fund | $1,000.00 | $1,027.28 | $0.81 |
| Target Retirement 2020 Fund | $1,000.00 | $1,028.99 | $0.81 |
| Target Retirement 2025 Fund | $1,000.00 | $1,029.32 | $0.86 |
| Target Retirement 2030 Fund | $1,000.00 | $1,029.52 | $0.86 |
| Based on Hypothetical 5% Yearly Return | |||
| Target Retirement Income Fund | $1,000.00 | $1,024.27 | $0.81 |
| Target Retirement 2010 Fund | $1,000.00 | $1,024.27 | $0.81 |
| Target Retirement 2015 Fund | $1,000.00 | $1,024.27 | $0.81 |
| Target Retirement 2020 Fund | $1,000.00 | $1,024.27 | $0.81 |
| Target Retirement 2025 Fund | $1,000.00 | $1,024.22 | $0.86 |
| Target Retirement 2030 Fund | $1,000.00 | $1,024.22 | $0.86 |
figures for that period are (in order as listed from top to bottom above) 0.16%, 0.16%, 0.16%, 0.16%, 0.17%, and 0.17%. The dollar amounts
shown as ”Expenses Paid” are equal to the annualized expense figures for the underlying funds multiplied by the average account value over
the period, multiplied by the number of days in the most recent six-month period, then divided by the number of days in the most recent
12-month period.
80
Glossary
30-Day SEC Yield. A fund’s 30-day SEC yield is derived using a formula specified by the U.S. Securities and Exchange Commission. Under the formula, data related to the fund’s security holdings in the previous 30 days are used to calculate the fund’s hypothetical net income for that period, which is then annualized and divided by the fund’s estimated average net assets over the calculation period. For the purposes of this calculation, a security’s income is based on its current market yield to maturity (for bonds), its actual income (for asset-backed securities), or its projected dividend yield (for stocks). Because the SEC yield represents hypothetical annualized income, it will differ—at times significantly—from the fund’s actual experience. As a result, the fund’s income distributions may be higher or lower than implied by the SEC yield.
Acquired Fund Fees and Expenses. Funds that invest in other Vanguard funds incur no direct expenses, but they do bear proportionate shares of the operating, administrative, and advisory expenses of the underlying funds, and they must pay any fees charged by those funds. The figure for acquired fund fees and expenses represents a weighted average of these underlying costs. Acquired is a term that the Securities and Exchange Commission applies to any mutual fund whose shares are owned by another fund.
Beta. A measure of the magnitude of a fund’s past share-price fluctuations in relation to the ups and downs of a given market index. The index is assigned a beta of 1.00. Compared with a given index, a fund with a beta of 1.20 typically would have seen its share price rise or fall by 12% when the index rose or fell by 10%. For this report, beta is based on returns over the past 36 months for both the fund and the index. Note that a fund’s beta should be reviewed in conjunction with its R-squared (see definition). The lower the R-squared, the less correlation there is between the fund and the index, and the less reliable beta is as an indicator of volatility.
Expense Ratio. A fund’s total annual operating expenses expressed as a percentage of the fund’s average net assets. The expense ratio includes management and administrative expenses, but does not include the transaction costs of buying and selling portfolio securities.
Inception Date. The date on which the assets of a fund (or one of its share classes) are first invested in accordance with the fund’s investment objective. For funds with a subscription period, the inception date is the day after that period ends. Investment performance is measured from the inception date.
R-Squared. A measure of how much of a fund’s past returns can be explained by the returns from the market in general, as measured by a given index. If a fund’s total returns were precisely synchronized with an index’s returns, its R-squared would be 1.00. If the fund’s returns bore no relationship to the index’s returns, its R-squared would be 0. For this report, R-squared is based on returns over the past 36 months for both the fund and the index.
Benchmark Information
Spliced Mixed-Asset Target Today Funds Average: Mixed-Asset Target Conservative Funds Average though June 30, 2012; Mixed-Asset Target Today Funds Average thereafter.
81
Target 2010 Composite Index: Derived by applying the fund’s target asset allocation to the results of the following benchmarks: for international stocks of developed markets, the MSCI EAFE Index through December 15, 2010, the MSCI ACWI ex USA IMI Index through June 2, 2013, and the FTSE Global All Cap ex US Index thereafter; for emerging-market stocks, the Select Emerging Markets Index through August 23, 2006, the MSCI Emerging Markets Index through December 15, 2010, the MSCI ACWI ex USA IMI Index through June 2, 2013, and the FTSE Global All Cap ex US Index thereafter; for U.S. bonds, the Barclays U.S. Aggregate Bond Index through December 31, 2009, and the Barclays U.S. Aggregate Float Adjusted Index thereafter, as well as the Barclays U.S. Treasury Inflation Protected Securities Index through June 2, 2013, and the Barclays U.S. Treasury Inflation-Protected Securities (TIPS) 0-5 Year Index thereafter; for short-term reserves, the Citigroup Three-Month Treasury Bill Index through June 2, 2013; for international bonds, the Barclays Global Aggregate ex-USD Float Adjusted RIC Capped Index beginning June 3, 2013; and for U.S. stocks, the MSCI US Broad Market Index through June 2, 2013, and the CRSP US Total Market Index thereafter. International stock benchmark returns are adjusted for withholding taxes.
Target 2015 Composite Index: Derived by applying the fund’s target asset allocation to the results of the following benchmarks: for international stocks of developed markets, the MSCI EAFE Index through December 15, 2010, the MSCI ACWI ex USA IMI Index through June 2, 2013, and the FTSE Global All Cap ex US Index thereafter; for emerging-market stocks, the Select Emerging Markets Index through August 23, 2006, the MSCI Emerging Markets Index through December 15, 2010, the MSCI ACWI ex USA IMI Index through June 2, 2013, and the FTSE Global All Cap ex US Index thereafter; for U.S. bonds, the Barclays U.S. Aggregate Bond Index through December 31, 2009, and the Barclays U.S. Aggregate Float Adjusted Index thereafter, as well as the Barclays U.S. Treasury Inflation Protected Securities Index through June 2, 2013, and the Barclays U.S. Treasury Inflation-Protected Securities (TIPS) 0-5 Year Index thereafter; for international bonds, the Barclays Global Aggregate ex-USD Float Adjusted RIC Capped Index beginning June 3, 2013; and for U.S. stocks, the Dow Jones U.S. Total Stock Market Index (formerly known as the Dow Jones Wilshire 5000 Index) through April 22, 2005, the MSCI US Broad Market Index through June 2, 2013, and the CRSP US Total Market Index thereafter. International stock benchmark returns are adjusted for withholding taxes.
Target 2020 Composite Index: Derived by applying the fund’s target asset allocation to the results of the following benchmarks: for international stocks of developed markets, the MSCI EAFE Index through December 15, 2010, the MSCI ACWI ex USA IMI Index through June 2, 2013, and the FTSE Global All Cap ex US Index thereafter; for emerging-market stocks, the Select Emerging Markets Index through August 23, 2006, the MSCI Emerging Markets Index through December 15, 2010, the MSCI ACWI ex USA IMI Index through June 2, 2013, and the FTSE Global All Cap ex US Index thereafter; for U.S. bonds, the Barclays U.S. Aggregate Bond Index through December 31, 2009, and the Barclays U.S. Aggregate Float Adjusted Index thereafter; for international bonds, the Barclays Global Aggregate ex-USD Float Adjusted RIC Capped Index beginning June 3, 2013; and for U.S. stocks, the MSCI US Broad Market Index through June 2, 2013, and the CRSP US Total Market Index thereafter. International stock benchmark returns are adjusted for withholding taxes.
82
Target 2025 Composite Index: Derived by applying the fund’s target asset allocation to the results of the following benchmarks: for international stocks of developed markets, the MSCI EAFE Index through December 15, 2010, the MSCI ACWI ex USA IMI Index through June 2, 2013, and the FTSE Global All Cap ex US Index thereafter; for emerging-market stocks, the Select Emerging Markets Index through August 23, 2006, the MSCI Emerging Markets Index through December 15, 2010, the MSCI ACWI ex USA IMI Index through June 2, 2013, and the FTSE Global All Cap ex US Index thereafter; for U.S. bonds, the Barclays U.S. Aggregate Bond Index through December 31, 2009, and the Barclays U.S. Aggregate Float Adjusted Index thereafter; for international bonds, the Barclays Global Aggregate ex-USD Float Adjusted RIC Capped Index beginning June 3, 2013; and for U.S. stocks, the Dow Jones U.S. Total Stock Market Index (formerly known as the Dow Jones Wilshire 5000 Index) through April 22, 2005, the MSCI US Broad Market Index through June 2, 2013, and the CRSP US Total Market Index thereafter. International stock benchmark returns are adjusted for withholding taxes.
Target 2030 Composite Index: Derived by applying the fund’s target asset allocation to the results of the following benchmarks: for international stocks of developed markets, the MSCI EAFE Index through December 15, 2010, the MSCI ACWI ex USA IMI Index through June 2, 2013, and the FTSE Global All Cap ex US Index thereafter; for emerging-market stocks, the Select Emerging Markets Index through August 23, 2006, the MSCI Emerging Markets Index through December 15, 2010, the MSCI ACWI ex USA IMI Index through June 2, 2013, and the FTSE Global All Cap ex US Index thereafter; for U.S. bonds, the Barclays U.S. Aggregate Bond Index through December 31, 2009, and the Barclays U.S. Aggregate Float Adjusted Index thereafter; for international bonds, the Barclays Global Aggregate ex-USD Float Adjusted RIC Capped Index beginning June 3, 2013; and for U.S. stocks, the MSCI US Broad Market Index through June 2, 2013, and the CRSP US Total Market Index thereafter. International stock benchmark returns are adjusted for withholding taxes.
Target Income Composite Index: Derived by applying the fund’s target asset allocation to the results of the following benchmarks: for international stocks of developed markets, the MSCI EAFE Index through December 15, 2010, the MSCI ACWI ex USA IMI Index through June 2, 2013, and the FTSE Global All Cap ex US Index thereafter; for emerging-market stocks, the Select Emerging Markets Index through August 23, 2006, the MSCI Emerging Markets Index through December 15, 2010, the MSCI ACWI ex USA IMI Index through June 2, 2013, and the FTSE Global All Cap ex US Index thereafter; for U.S. bonds, the Barclays U.S. Aggregate Bond Index through December 31, 2009, and the Barclays U.S. Aggregate Float Adjusted Index thereafter, as well as the Barclays U.S. Treasury Inflation Protected Securities Index through June 2, 2013, and the Barclays U.S. Treasury Inflation-Protected Securities (TIPS) 0-5 Year Index thereafter; for short-term reserves, the Citigroup Three-Month Treasury Bill Index through June 2, 2013; for international bonds, the Barclays Global Aggregate ex-USD Float Adjusted RIC Capped Index beginning June 3, 2013; and for U.S. stocks, the Dow Jones U.S. Total Stock Market Index (formerly known as the Dow Jones Wilshire 5000 Index) through April 22, 2005, the MSCI US Broad Market Index through June 2, 2013, and the CRSP US Total Market Index thereafter. International stock benchmark returns are adjusted for withholding taxes.
83
The People Who Govern Your Fund
The trustees of your mutual fund are there to see that the fund is operated and managed in your best interests since, as a shareholder, you are a part owner of the fund. Your fund’s trustees also serve on the board of directors of The Vanguard Group, Inc., which is owned by the Vanguard funds and provides services to them on an at-cost basis.
A majority of Vanguard’s board members are independent, meaning that they have no affiliation with Vanguard or the funds they oversee, apart from the sizable personal investments they have made as private individuals. The independent board members have distinguished backgrounds in business, academia, and public service. Each of the trustees and executive officers oversees 177 Vanguard funds.
The following table provides information for each trustee and executive officer of the fund. More information about the trustees is in the Statement of Additional Information, which can be obtained, without charge, by contacting Vanguard at 800-662-7447, or online at vanguard.com.
| InterestedTrustee1 | and Delphi Automotive LLP (automotive components); |
| Senior Advisor at New Mountain Capital. | |
| F. William McNabb III | |
| Born 1957. Trustee Since July 2009. Chairman of the | Amy Gutmann |
| Board. Principal Occupation(s) During the Past Five | Born 1949. Trustee Since June 2006. Principal |
| Years: Chairman of the Board of The Vanguard Group, | Occupation(s) During the Past Five Years: President of |
| Inc., and of each of the investment companies served | the University of Pennsylvania; Christopher H. Browne |
| by The Vanguard Group, since January 2010; Director | Distinguished Professor of Political Science, School of |
| of The Vanguard Group since 2008; Chief Executive | Arts and Sciences, and Professor of Communication, |
| Officer and President of The Vanguard Group, and of | Annenberg School for Communication, with secondary |
| each of the investment companies served by The | faculty appointments in the Department of Philosophy, |
| Vanguard Group, since 2008; Director of Vanguard | School of Arts and Sciences, and at the Graduate |
| Marketing Corporation; Managing Director of The | School of Education, University of Pennsylvania; |
| Vanguard Group (1995–2008). | Trustee of the National Constitution Center; Chair |
| of the Presidential Commission for the Study of | |
| Bioethical Issues. | |
| IndependentTrustees | |
| JoAnn Heffernan Heisen | |
| Emerson U. Fullwood | Born 1950. Trustee Since July 1998. Principal |
| Born 1948. Trustee Since January 2008. Principal | Occupation(s) During the Past Five Years: Corporate |
| Occupation(s) During the Past Five Years: Executive | Vice President and Chief Global Diversity Officer |
| Chief Staff and Marketing Officer for North America | (retired 2008) and Member of the Executive |
| and Corporate Vice President (retired 2008) of Xerox | Committee (1997–2008) of Johnson & Johnson |
| Corporation (document management products and | (pharmaceuticals/medical devices/consumer |
| services); Executive in Residence and 2009–2010 | products); Director of Skytop Lodge Corporation |
| Distinguished Minett Professor at the Rochester | (hotels), the University Medical Center at Princeton, |
| Institute of Technology; Director of SPX Corporation | the Robert Wood Johnson Foundation, and the Center |
| (multi-industry manufacturing), the United Way of | for Talent Innovation; Member of the Advisory Board |
| Rochester, Amerigroup Corporation (managed health | of the Maxwell School of Citizenship and Public Affairs |
| care), the University of Rochester Medical Center, | at Syracuse University. |
| Monroe Community College Foundation, and North | |
| Carolina A&T University. | F. Joseph Loughrey |
| Born 1949. Trustee Since October 2009. Principal | |
| Rajiv L. Gupta | Occupation(s) During the Past Five Years: President |
| Born 1945. Trustee Since December 2001.2 | and Chief Operating Officer (retired 2009) of Cummins |
| Principal Occupation(s) During the Past Five Years: | Inc. (industrial machinery); Chairman of the Board |
| Chairman and Chief Executive Officer (retired 2009) | of Hillenbrand, Inc. (specialized consumer services), |
| and President (2006–2008) of Rohm and Haas Co. | and of Oxfam America; Director of SKF AB (industrial |
| (chemicals); Director of Tyco International, Ltd. | machinery), Hyster-Yale Materials Handling, Inc. |
| (diversified manufacturing and services), Hewlett- | (forklift trucks), the Lumina Foundation for Education, |
| Packard Co. (electronic computer manufacturing), |
| and the V Foundation for Cancer Research; Member | Executive Officers | |
| of the Advisory Council for the College of Arts and | ||
| Letters and of the Advisory Board to the Kellogg | Glenn Booraem | |
| Institute for International Studies, both at the | Born 1967. Controller Since July 2010. Principal | |
| University of Notre Dame. | Occupation(s) During the Past Five Years: Principal | |
| of The Vanguard Group, Inc.; Controller of each of | ||
| Mark Loughridge | the investment companies served by The Vanguard | |
| Born 1953. Trustee Since March 2012. Principal | Group; Assistant Controller of each of the investment | |
| Occupation(s) During the Past Five Years: Senior Vice | companies served by The Vanguard Group (2001–2010). | |
| President and Chief Financial Officer (retired 2013) | ||
| at IBM (information technology services); Fiduciary | Thomas J. Higgins | |
| Member of IBM’s Retirement Plan Committee (2004– | Born 1957. Chief Financial Officer Since September | |
| 2013); Member of the Council on Chicago Booth. | 2008. Principal Occupation(s) During the Past Five | |
| Years: Principal of The Vanguard Group, Inc.; Chief | ||
| Scott C. Malpass | Financial Officer of each of the investment companies | |
| Born 1962. Trustee Since March 2012. Principal | served by The Vanguard Group; Treasurer of each of | |
| Occupation(s) During the Past Five Years: Chief | the investment companies served by The Vanguard | |
| Investment Officer and Vice President at the University | Group (1998–2008). | |
| of Notre Dame; Assistant Professor of Finance at the | ||
| Mendoza College of Business at Notre Dame; Member | Kathryn J. Hyatt | |
| of the Notre Dame 403(b) Investment Committee; | Born 1955. Treasurer Since November 2008. Principal | |
| Board Member of TIFF Advisory Services, Inc. | Occupation(s) During the Past Five Years: Principal of | |
| (investment advisor); Member of the Investment | The Vanguard Group, Inc.; Treasurer of each of the | |
| Advisory Committees of the Financial Industry | investment companies served by The Vanguard | |
| Regulatory Authority (FINRA) and of Major League | Group; Assistant Treasurer of each of the investment | |
| Baseball. | companies served by The Vanguard Group (1988–2008). | |
| André F. Perold | Heidi Stam | |
| Born 1952. Trustee Since December 2004. Principal | Born 1956. Secretary Since July 2005. Principal | |
| Occupation(s) During the Past Five Years: George | Occupation(s) During the Past Five Years: Managing | |
| Gund Professor of Finance and Banking, Emeritus | Director of The Vanguard Group, Inc.; General Counsel | |
| at the Harvard Business School (retired 2011); | of The Vanguard Group; Secretary of The Vanguard | |
| Chief Investment Officer and Managing Partner of | Group and of each of the investment companies | |
| HighVista Strategies LLC (private investment firm); | served by The Vanguard Group; Director and Senior | |
| Director of Rand Merchant Bank; Overseer of the | Vice President of Vanguard Marketing Corporation. | |
| Museum of Fine Arts Boston. | ||
| Vanguard Senior ManagementTeam | ||
| Alfred M. Rankin, Jr. | ||
| Born 1941. Trustee Since January 1993. Principal | Mortimer J. Buckley | Chris D. McIsaac |
| Occupation(s) During the Past Five Years: Chairman, | Kathleen C. Gubanich | Michael S. Miller |
| President, and Chief Executive Officer of NACCO | Paul A. Heller | James M. Norris |
| Industries, Inc. (housewares/lignite), and of Hyster- | Martha G. King | Glenn W. Reed |
| Yale Materials Handling, Inc. (forklift trucks); Chairman | John T. Marcante | |
| of the Board of University Hospitals of Cleveland. | ||
| Peter F. Volanakis | Chairman Emeritus and Senior Advisor | |
| Born 1955. Trustee Since July 2009. Principal | ||
| Occupation(s) During the Past Five Years: President | John J. Brennan | |
| and Chief Operating Officer (retired 2010) of Corning | Chairman, 1996–2009 | |
| Incorporated (communications equipment); Trustee of | Chief Executive Officer and President, 1996–2008 | |
| Colby-Sawyer College; Member of the Advisory Board | ||
| of the Norris Cotton Cancer Center and of the Advisory | Founder | |
| Board of the Parthenon Group (strategy consulting). | ||
| John C. Bogle | ||
| Chairman and Chief Executive Officer, 1974–1996 | ||
1 Mr. McNabb is considered an “interested person,” as defined in the Investment Company Act of 1940, because he is an officer of the
Vanguard funds.
2 December 2002 for Vanguard Equity Income Fund, the Vanguard Municipal Bond Funds, and the Vanguard State Tax-Exempt Funds.
| |
P.O. Box 2600 | |
| Valley Forge, PA 19482-2600 | |
| Connect with Vanguard® > vanguard.com | |
| Fund Information > 800-662-7447 | |
| Direct Investor Account Services > 800-662-2739 | |
| Institutional Investor Services > 800-523-1036 | |
| Text Telephone for People | |
| Who Are Deaf or Hard of Hearing> 800-749-7273 | |
| This material may be used in conjunction | |
| with the offering of shares of any Vanguard | |
| fund only if preceded or accompanied by | |
| the fund’s current prospectus. | |
| All comparative mutual fund data are from Lipper, a | |
| Thomson Reuters Company, or Morningstar, Inc., unless | |
| otherwise noted. | |
| You can obtain a free copy of Vanguard’s proxy voting | |
| guidelines by visiting vanguard.com/proxyreporting or by | |
| calling Vanguard at 800-662-2739. The guidelines are | |
| also available from the SEC’s website, sec.gov. In | |
| addition, you may obtain a free report on how your fund | |
| voted the proxies for securities it owned during the 12 | |
| months ended June 30. To get the report, visit either | |
| vanguard.com/proxyreporting or sec.gov. | |
| You can review and copy information about your fund at | |
| the SEC’s Public Reference Room in Washington, D.C. To | |
| find out more about this public service, call the SEC at | |
| 202-551-8090. Information about your fund is also | |
| available on the SEC’s website, and you can receive | |
| copies of this information, for a fee, by sending a | |
| request in either of two ways: via e-mail addressed to | |
| publicinfo@sec.gov or via regular mail addressed to the | |
| Public Reference Section, Securities and Exchange | |
| Commission, Washington, DC 20549-1520. | |
| © 2014 The Vanguard Group, Inc. | |
| All rights reserved. | |
| Vanguard Marketing Corporation, Distributor. | |
| Q3080 112014 | |

Annual Report | September 30, 2014
Vanguard Target Retirement Funds
Vanguard Target Retirement 2035 Fund Vanguard Target Retirement 2040 Fund Vanguard Target Retirement 2045 Fund Vanguard Target Retirement 2050 Fund Vanguard Target Retirement 2055 Fund Vanguard Target Retirement 2060 Fund
The mission continues
On May 1, 1975, Vanguard began operations, a fledgling company based on the simple but revolutionary idea that a mutual fund company should be managed solely in the interest of its investors.
Four decades later, that revolutionary spirit continues to animate the enterprise. Vanguard remains on a mission to give investors the best chance of investment success.
As we mark our 40th anniversary, we thank you for entrusting your assets to Vanguard and giving us the opportunity to help you reach your financial goals in the decades to come.
| Contents | |
| Your Fund’s Total Returns. | 1 |
| Chairman’s Letter. | 2 |
| Target Retirement 2035 Fund. | 9 |
| Target Retirement 2040 Fund. | 20 |
| Target Retirement 2045 Fund. | 31 |
| Target Retirement 2050 Fund. | 42 |
| Target Retirement 2055 Fund. | 53 |
| Target Retirement 2060 Fund. | 64 |
| Your Fund’s After-Tax Returns. | 77 |
| About Your Fund’s Expenses. | 79 |
| Glossary. | 81 |
Please note: The opinions expressed in this report are just that—informed opinions. They should not be considered promises or advice.
Also, please keep in mind that the information and opinions cover the period through the date on the front of this report. Of course, the
risks of investing in your fund are spelled out in the prospectus.
See the Glossary for definitions of investment terms used in this report.
About the cover: Since our founding, Vanguard has drawn inspiration from the enterprise and valor demonstrated by British
naval hero Horatio Nelson and his command at the Battle of the Nile in 1798. The photograph displays a replica of a merchant
ship from the same era as Nelson’s flagship, the HMS Vanguard.
Your Fund’s Total Returns
Fiscal Year Ended September 30, 2014
| Total | |
| Returns | |
| Vanguard Target Retirement 2035 Fund | 12.20% |
| Target 2035 Composite Index | 12.56 |
| Mixed-Asset Target 2035 Funds Average | 9.95 |
| Mixed-Asset Target 2035 Funds Average: Derived from data provided by Lipper, a Thomson Reuters Company. | |
Vanguard Target Retirement 2040 Fund | 12.66% |
| Target 2040 Composite Index | 13.04 |
| Mixed-Asset Target 2040 Funds Average | 9.97 |
| Mixed-Asset Target 2040 Funds Average: Derived from data provided by Lipper, a Thomson Reuters Company. | |
Vanguard Target Retirement 2045 Fund | 12.73% |
| Target 2045 Composite Index | 13.04 |
| Mixed-Asset Target 2045 Funds Average | 10.46 |
| Mixed-Asset Target 2045 Funds Average: Derived from data provided by Lipper, a Thomson Reuters Company. | |
Vanguard Target Retirement 2050 Fund | 12.69% |
| Target 2050 Composite Index | 13.04 |
| Mixed-Asset Target 2050 Funds Average | 10.33 |
| Mixed-Asset Target 2050 Funds Average: Derived from data provided by Lipper, a Thomson Reuters Company. | |
Vanguard Target Retirement 2055 Fund | 12.69% |
| Target 2055 Composite Index | 13.04 |
| Mixed-Asset Target 2055+ Funds Average | 10.98 |
| Mixed-Asset Target 2055+ Funds Average: Derived from data provided by Lipper, a Thomson Reuters Company. | |
Vanguard Target Retirement 2060 Fund | 12.72% |
| Target 2060 Composite Index | 13.04 |
| Mixed-Asset Target 2055+ Funds Average | 10.98 |
| Mixed-Asset Target 2055+ Funds Average: Derived from data provided by Lipper, a Thomson Reuters Company. | |
| For a benchmark description, see the Glossary. | |
Investments in Target Retirement Funds are subject to the risks of their underlying funds. The year in the fund name
refers to the approximate year (the target date) when an investor in the fund would retire and leave the work force.
The fund will gradually shift its emphasis from more aggressive investments to more conservative ones based on its
target date. An investment in a Target Retirement Fund is not guaranteed at any time, including on or after the target
date.
1

Chairman’s Letter
Dear Shareholder,
Despite recent volatility in the global markets, both domestic and international equity and fixed income investments posted positive results for the 12 months ended September 30, 2014. U.S. stocks produced the strongest results, significantly outperforming their international counterparts, as well as U.S. and international bonds.
Returns for the six Vanguard Target Retirement Funds covered in this report were positive for the period, ranging from just over 12% to about 13%. (The funds with retirement dates of 2010 through 2030, along with the Target Retirement Income Fund, are covered in a separate report.) Given the investment environment, it’s not surprising that the funds with a greater exposure to equities returned the most.
Brief patchiness for stocks didn’t hinder strong returns
The broad U.S. stock market managed a robust return of nearly 18% for the 12 months ended September 30, despite stumbling later in the period. Generally strong corporate profits and progress in the U.S. economy carried the markets through most of the fiscal year. As the period drew to a close, however, high stock valuations, international tensions, the unsettled global economy, and the Federal Reserve’s gradual shift from accommodative policies weighed on results.
2
During the final months of the fiscal year, the performance gap between U.S. and international stocks widened amid tensions in the Middle East and Ukraine, anxiety over China’s slower growth, and Europe’s slumping economy. In the end, international stocks returned about 5% for the period overall. Emerging markets returned more than 6%, ahead of developed European markets; weakness in Japan weighed on the developed Pacific region.
Bonds bounced back strongly despite a pause late in the year
Bond returns, which were surprisingly robust through most of the fiscal year, also met resistance late in the period. Still, the broad U.S. taxable bond market returned 3.96%, a significant recovery from its negative outcome a year ago.
Since January, the Fed has pared back its bond-buying program, with the aim of ending it in October. For most of the fiscal year, interest rates did not rise as analysts had predicted. The yield of the 10-year U.S. Treasury note ended September at 2.48%, down from 2.63% a year earlier. (Bond prices and yields move in opposite directions.)
Municipal bonds returned 7.93% as strong investor demand and a limited supply of new issues helped drive up prices.
After this advance for U.S. taxable and tax-exempt bonds, it’s worth remembering that the current low yields imply lower future returns: As yields drop, the scope for further declines—and increases in prices—diminishes.
| Market Barometer | |||
| Average Annual Total Returns | |||
| Periods Ended September 30, 2014 | |||
| One | Three | Five | |
| Year | Years | Years | |
| Stocks | |||
| Russell 1000 Index (Large-caps) | 19.01% | 23.23% | 15.90% |
| Russell 2000 Index (Small-caps) | 3.93 | 21.26 | 14.29 |
| Russell 3000 Index (Broad U.S. market) | 17.76 | 23.08 | 15.78 |
| FTSE All-World ex US Index (International) | 5.11 | 12.12 | 6.31 |
| Bonds | |||
| Barclays U.S. Aggregate Bond Index (Broad taxable market) | 3.96% | 2.43% | 4.12% |
| Barclays Municipal Bond Index (Broad tax-exempt market) | 7.93 | 4.56 | 4.67 |
| Citigroup Three-Month U.S. Treasury Bill Index | 0.04 | 0.04 | 0.06 |
| CPI | |||
| Consumer Price Index | 1.66% | 1.61% | 1.96% |
3
Money market funds and savings accounts posted negligible returns, as the Fed kept its target for short-term interest rates at 0%–0.25%.
International bond markets (as measured by the Barclays Global Aggregate Index ex USD) returned –0.81% after sinking in September.
More equity exposure meant higher returns
Vanguard Target Retirement Funds offer a straightforward approach to a complex problem: how to invest successfully for retirement. These “funds of funds” invest in Vanguard’s broadest index funds, giving investors access to thousands of U.S. and international stocks and bonds, including exposure to the major market sectors and segments.
The funds’ managers seek to handle stock market risk by gradually shifting each fund’s asset allocation from stocks to bonds, becoming more conservative as the fund nears its target retirement date. Once its target date is reached, each fund continues to adjust until it enters an income phase, when the portfolio will convert to the Target Retirement Income Fund. The Income Fund, which represents a static allocation of about 70% bonds and 30% stocks, is mostly focused on helping investors generate income and preserve their wealth.
| Expense Ratios | ||
| Your Fund Compared With Its Peer Group | ||
| Acquired Fund Fees | Peer Group | |
| and Expenses | Average | |
| Target Retirement 2035 Fund | 0.18% | 0.47% |
| Target Retirement 2040 Fund | 0.18 | 0.55 |
| Target Retirement 2045 Fund | 0.18 | 0.47 |
| Target Retirement 2050 Fund | 0.18 | 0.52 |
| Target Retirement 2055 Fund | 0.18 | 0.47 |
| Target Retirement 2060 Fund | 0.18 | 0.47 |
the expense ratios and any transaction fees charged by the underlying mutual funds (the ”acquired” funds) in which the Target Retirement
Funds invest. The Target Retirement Funds do not charge any expenses or fees of their own. For the fiscal year ended September 30, 2014,
the acquired fund fees and expenses were 0.18% for the 2035 Fund, 0.18% for the 2040 Fund, 0.18% for the 2045 Fund, 0.18% for the 2050
Fund, 0.18% for the 2055 Fund, and 0.18% for the 2060 Fund. Peer-group expense ratios are derived from data provided by Lipper, a Thomson
Reuters Company, and capture information through year-end 2013.
Peer groups: For the 2035 Fund, Mixed-Asset Target 2035 Funds; for the 2040 Fund, Mixed-Asset Target 2040 Funds; for the 2045 Fund,
Mixed-Asset Target 2045 Funds; for the 2050 Fund, Mixed-Asset Target 2050 Funds, for the 2055 and 2060 Funds, Mixed-Asset Target 2055+
Funds.
4
As I’ve mentioned, the funds’ results for the most recent fiscal period largely depended on their equity allocation—a greater exposure to stocks meant a greater return. The Target Retirement 2035 Fund, the most conservative of this group, with about 83% of its assets in stocks and 17% in bonds, returned about 12%. The five other funds, which hold about 90% of assets in stocks and 10% in bonds, posted returns that were closer to 13%.
| Total Returns | |
| Ten Years Ended September 30, 2014 | |
| Average | |
| Annual Return | |
| Target Retirement 2035 Fund | 7.20% |
| Target 2035 Composite Index | 7.34 |
| Mixed-Asset Target 2035 Funds Average | 6.50 |
| Mixed-Asset Target 2035 Funds Average: Derived from data provided by Lipper, a Thomson Reuters Company. | |
| Target Retirement 2040 Fund (Returns since inception: 6/7/2006) | 6.79% |
| Target 2040 Composite Index | 6.91 |
| Mixed-Asset Target 2040 Funds Average | 5.28 |
| Mixed-Asset Target 2040 Funds Average: Derived from data provided by Lipper, a Thomson Reuters Company. | |
| Target Retirement 2045 Fund | 7.61% |
| Target 2045 Composite Index | 7.73 |
| Mixed-Asset Target 2045 Funds Average | 6.82 |
| Mixed-Asset Target 2045 Funds Average: Derived from data provided by Lipper, a Thomson Reuters Company. | |
| Target Retirement 2050 Fund (Returns since inception: 6/7/2006) | 6.85% |
| Target 2050 Composite Index | 6.96 |
| Mixed-Asset Target 2050 Funds Average | 5.57 |
| Mixed-Asset Target 2050 Funds Average: Derived from data provided by Lipper, a Thomson Reuters Company. | |
| Target Retirement 2055 Fund (Returns since inception: 8/18/2010) | 13.63% |
| Target 2055 Composite Index | 13.84 |
| Spliced Mixed-Asset Target 2055+ Funds Average | 12.12 |
| Spliced Mixed-Asset Target 2055+ Funds Average: Derived from data provided by Lipper, a Thomson Reuters Company. | |
| For a benchmark description, see the Glossary. | |
The figures shown represent past performance, which is not a guarantee of future results. (Current performance may be
lower or higher than the performance data cited. For performance data current to the most recent month-end, visit our
website at vanguard.com/performance.) Note, too, that both investment returns and principal value can fluctuate widely, so
an investor’s shares, when sold, could be worth more or less than their original cost.
The table does not include funds that have operated for less than three years.
5
Of course, these returns largely reflect the performance of the four underlying portfolios that make up the Target Retirement Funds in this report—Vanguard Total Stock Market Index Fund, Vanguard Total International Stock Index Fund, Vanguard Total Bond Market II Index Fund, and Vanguard Total International Bond Index Fund.
Among the funds’ underlying investments, Vanguard Total Stock Market Index Fund, which provides its investors with broad exposure to the entire U.S. stock market, was the top performer by far, returning 17.60%. (Returns for underlying funds are for Investor Shares.) As I noted earlier, U.S. stocks produced the strongest results for the fiscal year, significantly outperforming international stocks and U.S. and international bonds.
Vanguard Total International Bond Index Fund was next in line, with a return of 6.57%. Currency hedging played an important role in the returns of international bonds. The Barclays Global Aggregate ex-USD Float Adjusted RIC Capped Index (USD Hedged) returned 6.92% for the 12 months, outpacing the 3.96% return of the Barclays U.S. Aggregate Bond Index. Before currency hedging, however, returns for international bonds were negative.
| Investor behavior improves with the use of target-date funds | |
| Target-date funds are designed to help investors successfully save for retirement. Over time, | |
| these funds may also help save investors from themselves. | |
| The rising use of target-date funds is dramatically improving investor behavior, according to a | |
| Vanguard study of defined contribution retirement plans. Because these investors know that | |
| their asset mix is being adjusted as appropriate for their age and investment horizon, it seems | |
| they are better able to weather market volatility and stick with their investment plans. | |
| According to the study, How America Saves 2014, compared with other retirement plan | |
| investors, those who held their entire account balance in target-date funds: | |
| • | Had more balanced portfolios (including, for example, bonds as well as international |
| and small-capitalization stocks). | |
| • | Did not hold “extreme” equity allocations (either no stocks or 100% stocks). |
| • | Refrained from frequent trading, which typically leads to disappointing results. |
6
Vanguard Total International Stock Index Fund returned 4.77% for the period. Results for international equities were dampened by concerns over slowed growth in Europe and emerging markets and the strife in Ukraine and the Middle East.
Vanguard Total Bond Market II Index Fund produced a result of 3.77% for the 12 months. Investment-grade corporate bonds were the U.S. bond market’s top performers for the period and added most to the fund’s return.
The funds remain on target and continue to help investors
Vanguard Target Retirement Funds have been successful in meeting their goal of helping investors save for retirement by providing a balanced and diversified portfolio that automatically adjusts over time. For the past decade, each fund’s average annual return has topped that of its peer group.
Of course, the performance of the underlying index funds has been key to the Target Retirement Funds’ strong results. Credit goes to Vanguard’s Equity Investment and Fixed Income Groups, whose skilled portfolio construction and management have enabled the underlying index funds to successfully track their benchmarks while keeping the associated costs very low.
High costs don’t equal strong fund performance
Speaking of investment costs, as a Vanguard investor, you probably realize that the adage “you get what you pay for” doesn’t apply to mutual funds. In fact, the reverse is true: Research suggests that higher costs are consistent with weaker returns. (See, for example, Shopping for Alpha: You Get What You Don’t Pay For, at vanguard.com/research.)
Wouldn’t paying the highest fees allow you to purchase the services of the greatest talents, and therefore get you the best returns? As it turns out, the data don’t support that argument. The explanation is simple: Every dollar paid for management fees is a dollar less earning potential return. Keeping expenses down can help narrow the gap between what the markets return and what investors actually earn.
That’s why Vanguard always seeks to minimize costs. Indexing, of course, is the purest form of low-cost investing. And we negotiate low fees for our actively managed funds, which are run by world-class advisors. It’s a strategy that reflects decades of experience and research, boiled down to one tenet: The less you pay, the more you earn.
As always, thank you for investing with Vanguard.
Sincerely,

F. William McNabb III
Chairman and Chief Executive Officer
October 15, 2014
7
Your Fund’s Performance at a Glance
September 30, 2013, Through September 30, 2014
| Distributions Per Share | ||||
| Starting | Ending | Income | Capital | |
| Share Price | Share Price | Dividends | Gains | |
| Target Retirement 2035 Fund | $16.16 | $17.79 | $0.324 | $0.000 |
| Target Retirement 2040 Fund | $26.80 | $29.66 | $0.500 | $0.007 |
| Target Retirement 2045 Fund | $16.82 | $18.61 | $0.334 | $0.000 |
| Target Retirement 2050 Fund | $26.69 | $29.53 | $0.518 | $0.000 |
| Target Retirement 2055 Fund | $28.67 | $31.80 | $0.477 | $0.004 |
| Target Retirement 2060 Fund | $25.21 | $28.03 | $0.367 | $0.001 |
8
Target Retirement 2035 Fund
Fund Profile
As of September 30, 2014
| Total Fund Characteristics | |
| Ticker Symbol | VTTHX |
| 30-Day SEC Yield | 2.11% |
| Acquired Fund Fees and Expenses1 | 0.18% |
| Allocation to Underlying Vanguard Funds | |
| Vanguard Total Stock Market Index Fund | |
| Investor Shares | 58.5% |
| Vanguard Total International Stock Index | |
| Fund Investor Shares | 24.7 |
| Vanguard Total Bond Market II Index Fund | |
| Investor Shares | 13.4 |
| Vanguard Total International Bond Index | |
| Fund Investor Shares | 3.4 |
| Total Fund Volatility Measures | ||
| Target 2035 | MSCI US | |
| Composite | Broad Market | |
| Index | Index | |
| R-Squared | 1.00 | 0.96 |
| Beta | 0.99 | 0.88 |
Fund Asset Allocation
1 This figure—drawn from the prospectus dated January 27, 2014—represents an estimate of the weighted average of the expense ratios and any
transaction fees charged by the underlying mutual funds (the ”acquired” funds) in which the Target Retirement 2035 Fund invests. The fund does not
charge any expenses or fees of its own. For the fiscal year ended September 30, 2014, the acquired fund fees and expenses were 0.18%.
9
Target Retirement 2035 Fund
Performance Summary
All of the returns in this report represent past performance, which is not a guarantee of future results that may be achieved by the fund. (Current performance may be lower or higher than the performance data cited. For performance data current to the most recent month-end, visit our website at vanguard.com/performance.) Note, too, that both investment returns and principal value can fluctuate widely, so an investor’s shares, when sold, could be worth more or less than their original cost. The returns shown do not reflect taxes that a shareholder would pay on fund distributions or on the sale of fund shares.
Cumulative Performance: September 30, 2004, Through September 30, 2014
Initial Investment of $10,000
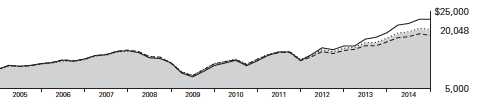
| Average Annual Total Returns | |||||
| Periods Ended September 30, 2014 | |||||
| Final Value | |||||
| One | Five | Ten | of a $10,000 | ||
| Year | Years | Years | Investment | ||
| Target Retirement 2035 Fund | 12.20% | 11.82% | 7.20% | $20,048 | |
| •••••••• | Target 2035 Composite Index | 12.56 | 12.10 | 7.34 | 20,305 |
| – – – – | Mixed-Asset Target 2035 Funds | ||||
| 9.95 | 10.48 | 6.50 | 18,772 | ||
| MSCI Average US Broad Market Index | 17.88 | 15.88 | 8.65 | 22,920 | |
Mixed-Asset Target 2035 Funds Average: Derived from data provided by Lipper, a Thomson Reuters Company.
See Financial Highlights for dividend and capital gains information.
10
Target Retirement 2035 Fund
Fiscal-Year Total Returns (%): September 30, 2004, Through September 30, 2014

For a benchmark description, see the Glossary.
11
Target Retirement 2035 Fund
Financial Statements
Statement of Net Assets
As of September 30, 2014
The fund reports a complete list of its holdings in regulatory filings four times in each fiscal year, at the quarter-ends. For the second and fourth fiscal quarters, the lists appear in the fund’s semiannual and annual reports to shareholders. For the first and third fiscal quarters, the fund files the lists with the Securities and Exchange Commission on Form N-Q. Shareholders can look up the fund’s Forms N-Q on the SEC’s website at sec.gov. Forms N-Q may also be reviewed and copied at the SEC’s Public Reference Room (see the back cover of this report for further information).
| Market | ||
| Value• | ||
| Shares | ($000) | |
| Investment Companies (100.0%) | ||
| U.S. Stock Fund (58.5%) | ||
| Vanguard Total Stock Market Index Fund Investor Shares | 282,890,690 | 13,938,024 |
| International Stock Fund (24.7%) | ||
| Vanguard Total International Stock Index Fund Investor Shares | 359,210,176 | 5,876,679 |
| U.S. Bond Fund (13.4%) | ||
| 1 Vanguard Total Bond Market II Index Fund Investor Shares | 297,492,129 | 3,195,065 |
| International Bond Fund (3.4%) | ||
| Vanguard Total International Bond Index Fund Investor Shares | 76,735,073 | 798,045 |
| Total Investment Companies (Cost $17,971,474) | 23,807,813 | |
| Temporary Cash Investment (0.0%) | ||
| Money Market Fund (0.0%) | ||
| 1 Vanguard Market Liquidity Fund, 0.109% (Cost $9,365) | 9,364,697 | 9,365 |
| Total Investments (100.0%) (Cost $17,980,839) | 23,817,178 | |
| Other Assets and Liabilities (0.0%) | ||
| Other Assets | 195,552 | |
| Liabilities | (186,615) | |
| 8,937 | ||
| Net Assets (100%) | ||
| Applicable to 1,339,121,941 outstanding $.001 par value shares of | ||
| beneficial interest (unlimited authorization) | 23,826,115 | |
| Net Asset Value Per Share | $17.79 | |
12
Target Retirement 2035 Fund
At September 30, 2014, net assets consisted of:
| Amount | |
| ($000) | |
| Paid-in Capital | 17,647,794 |
| Undistributed Net Investment Income | 354,717 |
| Accumulated Net Realized Losses | (12,735) |
| Unrealized Appreciation (Depreciation) | 5,836,339 |
| Net Assets | 23,826,115 |
• See Note A in Notes to Financial Statements.
1 Affiliated fund available only to Vanguard funds and certain trusts and accounts managed by Vanguard. Rate shown for Vanguard Market
Liquidity Fund is the 7-day yield.
See accompanying Notes, which are an integral part of the Financial Statements.
13
Target Retirement 2035 Fund
Statement of Operations
| Year Ended | |
| September 30, 2014 | |
| ($000) | |
| Investment Income | |
| Income | |
| Income Distributions Received | 478,271 |
| Net Investment Income—Note B | 478,271 |
| Realized Net Gain (Loss) | |
| Capital Gain Distributions Received | 1,185 |
| Affiliated Investment Securities Sold | 12,213 |
| Realized Net Gain (Loss) | 13,398 |
| Change in Unrealized Appreciation (Depreciation) of Investment Securities | 1,929,163 |
| Net Increase (Decrease) in Net Assets Resulting from Operations | 2,420,832 |
See accompanying Notes, which are an integral part of the Financial Statements.
14
Target Retirement 2035 Fund
Statement of Changes in Net Assets
| Year Ended September 30, | ||
| 2014 | 2013 | |
| ($000) | ($000) | |
| Increase (Decrease) in Net Assets | ||
| Operations | ||
| Net Investment Income | 478,271 | 398,402 |
| Realized Net Gain (Loss) | 13,398 | 45,931 |
| Change in Unrealized Appreciation (Depreciation) | 1,929,163 | 2,193,228 |
| Net Increase (Decrease) in Net Assets Resulting from Operations | 2,420,832 | 2,637,561 |
| Distributions | ||
| Net Investment Income | (393,936) | (326,142) |
| Realized Capital Gain1 | — | (6,374) |
| Total Distributions | (393,936) | (332,516) |
| Capital Share Transactions | ||
| Issued | 5,931,912 | 5,012,842 |
| Issued in Lieu of Cash Distributions | 388,557 | 329,351 |
| Redeemed | (3,547,498) | (2,840,996) |
| Net Increase (Decrease) from Capital Share Transactions | 2,772,971 | 2,501,197 |
| Total Increase (Decrease) | 4,799,867 | 4,806,242 |
| Net Assets | ||
| Beginning of Period | 19,026,248 | 14,220,006 |
| End of Period2 | 23,826,115 | 19,026,248 |
treated as ordinary income dividends for tax purposes.
2 Net Assets—End of Period includes undistributed (overdistributed) net investment income of $354,717,000 and $270,382,000.
See accompanying Notes, which are an integral part of the Financial Statements.
15
Target Retirement 2035 Fund
Financial Highlights
| For a Share Outstanding | Year Ended September 30, | ||||
| Throughout Each Period | 2014 | 2013 | 2012 | 2011 | 2010 |
| Net Asset Value, Beginning of Period | $16.16 | $14.15 | $11.77 | $12.22 | $11.31 |
| Investment Operations | |||||
| Net Investment Income | .359 | .340 | .344 | .235 | .250 |
| Capital Gain Distributions Received | .001 | .011 | .016 | .006 | — |
| Net Realized and Unrealized Gain (Loss) | |||||
| on Investments | 1.594 | 1.972 | 2.307 | (. 402) | . 898 |
| Total from Investment Operations | 1.954 | 2.323 | 2.667 | (.161) | 1.148 |
| Distributions | |||||
| Dividends from Net Investment Income | (.324) | (.307) | (.281) | (. 236) | (. 238) |
| Distributions from Realized Capital Gains | — | (.006) | (.006) | (.053) | — |
| Total Distributions | (. 324) | (. 313) | (. 287) | (.289) | (. 238) |
| Net Asset Value, End of Period | $17.79 | $16.16 | $14.15 | $11.77 | $12.22 |
| Total Return1 | 12.20% | 16.77% | 22.98% | -1.55% | 10.24% |
| Ratios/Supplemental Data | |||||
| Net Assets, End of Period (Millions) | $23,826 | $19,026 | $14,220 | $10,239 | $9,223 |
| Ratio of Total Expenses to Average Net Assets | — | — | — | — | — |
| Acquired Fund Fees and Expenses | 0.18% | 0.18% | 0.18% | 0.19% | 0.19% |
| Ratio of Net Investment Income to | |||||
| Average Net Assets | 2.17% | 2.33% | 2.68% | 1.81% | 2.24% |
| Portfolio Turnover Rate | 6% | 12% | 6% | 18%2 | 6% |
any applicable account service fees.
2 Excludes the value of mutual fund shares delivered and received in connection with a change in the fund’s international equity investments
from Vanguard European, Pacific, and Emerging Markets Stock Index Funds to Vanguard Total International Stock Index Fund because those
transactions were effected in kind and did not cause the fund to incur transaction costs.
See accompanying Notes, which are an integral part of the Financial Statements.
16
Target Retirement 2035 Fund
Notes to Financial Statements
Vanguard Target Retirement 2035 Fund is registered under the Investment Company Act of 1940 as an open-end investment company, or mutual fund. The fund follows a balanced investment strategy by investing in selected Vanguard funds to achieve its targeted allocation of assets to U.S. and international stocks, and U.S. and international bonds. Financial statements and other information about each underlying fund are available on vanguard.com.
A. The following significant accounting policies conform to generally accepted accounting principles for U.S. investment companies. The fund consistently follows such policies in preparing its financial statements.
1. Security Valuation: Investments are valued at the net asset value of each underlying Vanguard fund determined as of the close of the New York Stock Exchange (generally 4 p.m., Eastern time) on the valuation date.
2. Federal Income Taxes: The fund intends to continue to qualify as a regulated investment company and distribute all of its taxable income. Management has analyzed the fund’s tax positions taken for all open federal income tax years (September 30, 2011–2014), and has concluded that no provision for federal income tax is required in the fund’s financial statements.
3. Distributions: Distributions to shareholders are recorded on the ex-dividend date.
4. Credit Facility: The fund and certain other funds managed by The Vanguard Group participate in a $2.89 billion committed credit facility provided by a syndicate of lenders pursuant to a credit agreement that may be renewed annually; each fund is individually liable for its borrowings, if any, under the credit facility. Borrowings may be utilized for temporary and emergency purposes, and are subject to the fund’s regulatory and contractual borrowing restrictions. The participating funds are charged administrative fees and an annual commitment fee of 0.06% of the undrawn amount of the facility; these fees are allocated to the funds based on a method approved by the fund’s board of trustees and borne by the funds in which the fund invests (See Note B). Any borrowings under this facility bear interest at a rate equal to the higher of the federal funds rate or LIBOR reference rate plus an agreed-upon spread.
The fund had no borrowings outstanding at September 30, 2014, or at any time during the period then ended.
5. Other: Income and capital gain distributions received are recorded on the ex-dividend date. Security transactions are accounted for on the date securities are bought or sold. Costs used to determine realized gains (losses) on the sale of investment securities are those of the specific securities sold.
B. Under a service agreement, The Vanguard Group furnishes investment advisory, corporate management, administrative, marketing, and distribution services to the fund. The service agreement provides that the fund’s expenses may be reduced or eliminated to the extent of savings realized by the Vanguard funds by the operation of the fund. Accordingly, all incremental expenses for services provided by Vanguard and all other expenses incurred by the fund during the year ended September 30, 2014, were borne by the funds in which the fund invests. The fund’s trustees and officers are also directors and officers of Vanguard and the funds in which the fund invests.
17
Target Retirement 2035 Fund
C. Various inputs may be used to determine the value of the fund’s investments. These inputs are summarized in three broad levels for financial statement purposes. The inputs or methodologies used to value securities are not necessarily an indication of the risk associated with investing in those securities.
Level 1—Quoted prices in active markets for identical securities.
Level 2—Other significant observable inputs (including quoted prices for similar securities, interest rates, prepayment speeds, credit risk, etc.).
Level 3—Significant unobservable inputs (including the fund’s own assumptions used to determine the fair value of investments).
At September 30, 2014, 100% of the market value of the fund’s investments was determined based on Level 1 inputs.
D. Distributions are determined on a tax basis and may differ from net investment income and realized capital gains for financial reporting purposes. Differences may be permanent or temporary. Permanent differences are reclassified among capital accounts in the financial statements to reflect their tax character. Temporary differences arise when certain items of income, expense, gain, or loss are recognized in different periods for financial statement and tax purposes. These differences will reverse at some time in the future. Differences in classification may also result from the treatment of short-term gains as ordinary income for tax purposes.
For tax purposes, at September 30, 2014, the fund had $355,190,000 of ordinary income available for distribution. The fund used capital loss carryforwards of $11,482,000 to offset taxable capital gains realized during the year ended September 30, 2014. At September 30, 2014, the fund had available capital losses totaling $11,731,000 that may be carried forward indefinitely to offset future net capital gains.
At September 30, 2014, the cost of investment securities for tax purposes was $17,982,317,000. Net unrealized appreciation of investment securities for tax purposes was $5,834,861,000, consisting entirely of unrealized gains on securities that had risen in value since their purchase.
E. Capital shares issued and redeemed were:
| Year Ended September 30, | ||
| 2014 | 2013 | |
| Shares | Shares | |
| (000) | (000) | |
| Issued | 343,642 | 335,609 |
| Issued in Lieu of Cash Distributions | 23,005 | 23,660 |
| Redeemed | (204,875) | (186,558) |
| Net Increase (Decrease) in Shares Outstanding | 161,772 | 172,711 |
18
Target Retirement 2035 Fund
F. Transactions during the period in affiliated underlying Vanguard funds were as follows:
| Current Period Transactions | ||||||
| Sept. 30, | Proceeds | Sept. 30, | ||||
| 2013 | from | Capital Gain | 2014 | |||
| Market | Purchases | Securities | Dividend | Distributions | Market | |
| Value | at Cost | Sold | Income | Received | Value | |
| ($000) | ($000) | ($000) | ($000) | ($000) | ($000) | |
| Vanguard Market Liquidity Fund | 14,982 | NA1 | NA1 | 12 | — | 9,365 |
| Vanguard Total Bond Market II | ||||||
| Index Fund | 2,346,396 | 1,303,463 | 496,082 | 63,575 | 1,185 | 3,195,065 |
| Vanguard Total International | ||||||
| Bond Index Fund | 580,382 | 208,652 | 25,000 | 9,880 | — | 798,045 |
| Vanguard Total International | ||||||
| Stock Index Fund | 4,858,564 | 1,077,952 | 113,380 | 178,087 | — | 5,876,679 |
| Vanguard Total Stock Market | ||||||
| Index Fund | 11,236,065 | 1,609,734 | 720,309 | 226,717 | — | 13,938,024 |
| Total | 19,036,389 | 4,199,801 | 1,354,771 | 478,271 | 1,185 | 23,817,178 |
| 1 Not applicable—Purchases and Sales are for temporary cash investment purposes. | ||||||
G. Management has determined that no material events or transactions occurred subsequent to September 30, 2014, that would require recognition or disclosure in these financial statements.
19
Target Retirement 2040 Fund
Fund Profile
As of September 30, 2014
| Total Fund Characteristics | |
| Ticker Symbol | VFORX |
| 30-Day SEC Yield | 2.12% |
| Acquired Fund Fees and Expenses1 | 0.18% |
| Allocation to Underlying Vanguard Funds | |
| Vanguard Total Stock Market Index Fund | |
| Investor Shares | 63.2% |
| Vanguard Total International Stock Index | |
| Fund Investor Shares | 26.8 |
| Vanguard Total Bond Market II Index Fund | |
| Investor Shares | 8.0 |
| Vanguard Total International Bond Index | |
| Fund Investor Shares | 2.0 |
| Total Fund Volatility Measures | ||
| Target 2040 | MSCI US | |
| Composite | Broad Market | |
| Index | Index | |
| R-Squared | 1.00 | 0.96 |
| Beta | 0.99 | 0.92 |
Fund Asset Allocation
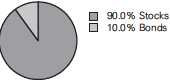
1 This figure—drawn from the prospectus dated January 27, 2014—represents an estimate of the weighted average of the expense ratios and any
transaction fees charged by the underlying mutual funds (the ”acquired” funds) in which the Target Retirement 2040 Fund invests. The fund does not
charge any expenses or fees of its own. For the fiscal year ended September 30, 2014, the acquired fund fees and expenses were 0.18%.
20
Target Retirement 2040 Fund
Performance Summary
All of the returns in this report represent past performance, which is not a guarantee of future results that may be achieved by the fund. (Current performance may be lower or higher than the performance data cited. For performance data current to the most recent month-end, visit our website at vanguard.com/performance.) Note, too, that both investment returns and principal value can fluctuate widely, so an investor’s shares, when sold, could be worth more or less than their original cost. The returns shown do not reflect taxes that a shareholder would pay on fund distributions or on the sale of fund shares.
Cumulative Performance: June 7, 2006, Through September 30, 2014
Initial Investment of $10,000
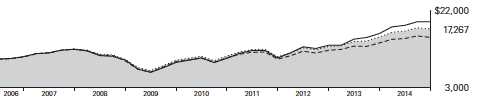
| Average Annual Total Returns | |||||
| Periods Ended September 30, 2014 | |||||
| Since | Final Value | ||||
| One | Five | Inception | of a $10,000 | ||
| Year | Years | (6/7/2006) | Investment | ||
| Target Retirement 2040 Fund | 12.66% | 12.11% | 6.79% | $17,267 | |
| •••••••• | Target 2040 Composite Index | 13.04 | 12.41 | 6.91 | 17,424 |
| – – – – | Mixed-Asset Target 2040 Funds | ||||
| 9.97 | 10.35 | 5.28 | 15,343 | ||
| MSCI Average US Broad Market Index | 17.88 | 15.88 | 8.15 | 19,186 | |
Mixed-Asset Target 2040 Funds Average: Derived from data provided by Lipper, a Thomson Reuters Company.
"Since Inception" performance is calculated from the inception date for both the fund and its comparative standards.
See Financial Highlights for dividend and capital gains information.
21
Target Retirement 2040 Fund
Fiscal-Year Total Returns (%): June 7, 2006, Through September 30, 2014
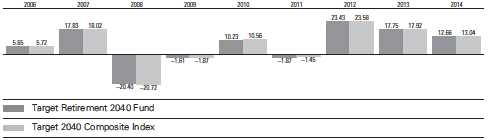
For a benchmark description, see the Glossary.
22
Target Retirement 2040 Fund
Financial Statements
Statement of Net Assets
As of September 30, 2014
The fund reports a complete list of its holdings in regulatory filings four times in each fiscal year, at the quarter-ends. For the second and fourth fiscal quarters, the lists appear in the fund’s semiannual and annual reports to shareholders. For the first and third fiscal quarters, the fund files the lists with the Securities and Exchange Commission on Form N-Q. Shareholders can look up the fund’s Forms N-Q on the SEC’s website at sec.gov. Forms N-Q may also be reviewed and copied at the SEC’s Public Reference Room (see the back cover of this report for further information).
| Market | ||
| Value• | ||
| Shares | ($000) | |
| Investment Companies (100.0%) | ||
| U.S. Stock Fund (63.2%) | ||
| Vanguard Total Stock Market Index Fund Investor Shares | 204,117,479 | 10,056,868 |
| International Stock Fund (26.8%) | ||
| Vanguard Total International Stock Index Fund Investor Shares | 260,530,816 | 4,262,284 |
| U.S. Bond Fund (8.0%) | ||
| 1 Vanguard Total Bond Market II Index Fund Investor Shares | 118,688,134 | 1,274,711 |
| International Bond Fund (2.0%) | ||
| Vanguard Total International Bond Index Fund Investor Shares | 30,622,130 | 318,470 |
| Total Investment Companies (Cost $12,255,584) | 15,912,333 | |
| Temporary Cash Investment (0.1%) | ||
| Money Market Fund (0.1%) | ||
| 1 Vanguard Market Liquidity Fund, 0.109% (Cost $10,023) | 10,023,168 | 10,023 |
| Total Investments (100.1%) (Cost $12,265,607) | 15,922,356 | |
| Other Assets and Liabilities (-0.1%) | ||
| Other Assets | 116,844 | |
| Liabilities | (127,557) | |
| (10,713) | ||
| Net Assets (100%) | ||
| Applicable to 536,381,322 outstanding $.001 par value shares of | ||
| beneficial interest (unlimited authorization) | 15,911,643 | |
| Net Asset Value Per Share | $29.66 | |
23
Target Retirement 2040 Fund
| At September 30, 2014, net assets consisted of: | |
| Amount | |
| ($000) | |
| Paid-in Capital | 12,033,972 |
| Undistributed Net Investment Income | 217,626 |
| Accumulated Net Realized Gains | 3,296 |
| Unrealized Appreciation (Depreciation) | 3,656,749 |
| Net Assets | 15,911,643 |
• See Note A in Notes to Financial Statements.
1 Affiliated fund available only to Vanguard funds and certain trusts and accounts managed by Vanguard. Rate shown for Vanguard Market
Liquidity Fund is the 7-day yield.
See accompanying Notes, which are an integral part of the Financial Statements.
24
Target Retirement 2040 Fund
Statement of Operations
| Year Ended | |
| September 30, 2014 | |
| ($000) | |
| Investment Income | |
| Income | |
| Income Distributions Received | 313,519 |
| Net Investment Income—Note B | 313,519 |
| Realized Net Gain (Loss) | |
| Capital Gain Distributions Received | 495 |
| Affiliated Investment Securities Sold | 8,642 |
| Realized Net Gain (Loss) | 9,137 |
| Change in Unrealized Appreciation (Depreciation) of Investment Securities | 1,291,043 |
| Net Increase (Decrease) in Net Assets Resulting from Operations | 1,613,699 |
See accompanying Notes, which are an integral part of the Financial Statements.
25
Target Retirement 2040 Fund
Statement of Changes in Net Assets
| Year Ended September 30, | ||
| 2014 | 2013 | |
| ($000) | ($000) | |
| Increase (Decrease) in Net Assets | ||
| Operations | ||
| Net Investment Income | 313,519 | 241,052 |
| Realized Net Gain (Loss) | 9,137 | 5,883 |
| Change in Unrealized Appreciation (Depreciation) | 1,291,043 | 1,425,108 |
| Net Increase (Decrease) in Net Assets Resulting from Operations | 1,613,699 | 1,672,043 |
| Distributions | ||
| Net Investment Income | (233,406) | (184,948) |
| Realized Capital Gain1 | (3,268) | (2,610) |
| Total Distributions | (236,674) | (187,558) |
| Capital Share Transactions | ||
| Issued | 4,886,111 | 4,047,039 |
| Issued in Lieu of Cash Distributions | 232,555 | 184,925 |
| Redeemed | (2,596,989) | (1,685,838) |
| Net Increase (Decrease) from Capital Share Transactions | 2,521,677 | 2,546,126 |
| Total Increase (Decrease) | 3,898,702 | 4,030,611 |
| Net Assets | ||
| Beginning of Period | 12,012,941 | 7,982,330 |
| End of Period2 | 15,911,643 | 12,012,941 |
treated as ordinary income dividends for tax purposes.
2 Net Assets—End of Period includes undistributed (overdistributed) net investment income of $217,626,000 and $154,704,000.
See accompanying Notes, which are an integral part of the Financial Statements.
26
Target Retirement 2040 Fund
Financial Highlights
| For a Share Outstanding | Year Ended September 30, | ||||
| Throughout Each Period | 2014 | 2013 | 2012 | 2011 | 2010 |
| Net Asset Value, Beginning of Period | $26.80 | $23.26 | $19.26 | $20.03 | $18.52 |
| Investment Operations | |||||
| Net Investment Income | .593 | .546 | .559 | . 369 | . 393 |
| Capital Gain Distributions Received | .001 | .012 | .022 | .006 | — |
| Net Realized and Unrealized Gain (Loss) on | |||||
| Investments | 2.773 | 3.485 | 3.872 | (.705) | 1.485 |
| Total from Investment Operations | 3.367 | 4.043 | 4.453 | (. 330) | 1.878 |
| Distributions | |||||
| Dividends from Net Investment Income | (. 500) | (. 496) | (. 444) | (. 368) | (.368) |
| Distributions from Realized Capital Gains | (.007) | (.007) | (. 009) | (. 072) | — |
| Total Distributions | (.507) | (. 503) | (. 453) | (. 440) | (. 368) |
| Net Asset Value, End of Period | $29.66 | $26.80 | $23.26 | $19.26 | $20.03 |
| Total Return1 | 12.66% | 17.75% | 23.43% | -1.87% | 10.23% |
| Ratios/Supplemental Data | |||||
| Net Assets, End of Period (Millions) | $15,912 | $12,013 | $7,982 | $4,977 | $3,831 |
| Ratio of Total Expenses to Average Net Assets | — | — | — | — | — |
| Acquired Fund Fees and Expenses | 0.18% | 0.18% | 0.18% | 0.19% | 0.19% |
| Ratio of Net Investment Income to | |||||
| Average Net Assets | 2.18% | 2.36% | 2.69% | 1.79% | 2.23% |
| Portfolio Turnover Rate | 6% | 9% | 3% | 15%2 | 7% |
any applicable account service fees.
2 Excludes the value of mutual fund shares delivered and received in connection with a change in the fund’s international equity investments
from Vanguard European, Pacific, and Emerging Markets Stock Index Funds to Vanguard Total International Stock Index Fund because those
transactions were effected in kind and did not cause the fund to incur transaction costs.
See accompanying Notes, which are an integral part of the Financial Statements.
27
Target Retirement 2040 Fund
Notes to Financial Statements
Vanguard Target Retirement 2040 Fund is registered under the Investment Company Act of 1940 as an open-end investment company, or mutual fund. The fund follows a balanced investment strategy by investing in selected Vanguard funds to achieve its targeted allocation of assets to U.S. and international stocks, and U.S. and international bonds. Financial statements and other information about each underlying fund are available on vanguard.com.
A. The following significant accounting policies conform to generally accepted accounting principles for U.S. investment companies. The fund consistently follows such policies in preparing its financial statements.
1. Security Valuation: Investments are valued at the net asset value of each underlying Vanguard fund determined as of the close of the New York Stock Exchange (generally 4 p.m., Eastern time) on the valuation date.
2. Federal Income Taxes: The fund intends to continue to qualify as a regulated investment company and distribute all of its taxable income. Management has analyzed the fund’s tax positions taken for all open federal income tax years (September 30, 2011–2014), and has concluded that no provision for federal income tax is required in the fund’s financial statements.
3. Distributions: Distributions to shareholders are recorded on the ex-dividend date.
4. Credit Facility: The fund and certain other funds managed by The Vanguard Group participate in a $2.89 billion committed credit facility provided by a syndicate of lenders pursuant to a credit agreement that may be renewed annually; each fund is individually liable for its borrowings, if any, under the credit facility. Borrowings may be utilized for temporary and emergency purposes, and are subject to the fund’s regulatory and contractual borrowing restrictions. The participating funds are charged administrative fees and an annual commitment fee of 0.06% of the undrawn amount of the facility; these fees are allocated to the funds based on a method approved by the fund’s board of trustees and borne by the funds in which the fund invests (See Note B). Any borrowings under this facility bear interest at a rate equal to the higher of the federal funds rate or LIBOR reference rate plus an agreed-upon spread.
The fund had no borrowings outstanding at September 30, 2014, or at any time during the period then ended.
5. Other: Income and capital gain distributions received are recorded on the ex-dividend date. Security transactions are accounted for on the date securities are bought or sold. Costs used to determine realized gains (losses) on the sale of investment securities are those of the specific securities sold.
B. Under a service agreement, The Vanguard Group furnishes investment advisory, corporate management, administrative, marketing, and distribution services to the fund. The service agreement provides that the fund’s expenses may be reduced or eliminated to the extent of savings realized by the Vanguard funds by the operation of the fund. Accordingly, all incremental expenses for services provided by Vanguard and all other expenses incurred by the fund during the year ended September 30, 2014, were borne by the funds in which the fund invests. The fund’s trustees and officers are also directors and officers of Vanguard and the funds in which the fund invests.
28
Target Retirement 2040 Fund
C. Various inputs may be used to determine the value of the fund’s investments. These inputs are summarized in three broad levels for financial statement purposes. The inputs or methodologies used to value securities are not necessarily an indication of the risk associated with investing in those securities.
Level 1—Quoted prices in active markets for identical securities.
Level 2—Other significant observable inputs (including quoted prices for similar securities, interest rates, prepayment speeds, credit risk, etc.).
Level 3—Significant unobservable inputs (including the fund’s own assumptions used to determine the fair value of investments).
At September 30, 2014, 100% of the market value of the fund’s investments was determined based on Level 1 inputs.
D. Distributions are determined on a tax basis and may differ from net investment income and realized capital gains for financial reporting purposes. Differences may be permanent or temporary. Permanent differences are reclassified among capital accounts in the financial statements to reflect their tax character. Temporary differences arise when certain items of income, expense, gain, or loss are recognized in different periods for financial statement and tax purposes. These differences will reverse at some time in the future. Differences in classification may also result from the treatment of short-term gains as ordinary income for tax purposes.
The fund used a tax accounting practice to treat a portion of the price of capital shares redeemed during the year as distributions from net investment income and realized capital gains. Accordingly, the fund has reclassified $17,191,000 from undistributed net investment income, and $343,000 from accumulated net realized gains, to paid-in capital.
For tax purposes, at September 30, 2014, the fund had $224,172,000 of ordinary income and $301,000 of long-term capital gains available for distribution.
At September 30, 2014, the cost of investment securities for tax purposes was $12,269,158,000. Net unrealized appreciation of investment securities for tax purposes was $3,653,198,000, consisting entirely of unrealized gains on securities that had risen in value since their purchase.
E. Capital shares issued and redeemed were:
| Year Ended September 30, | ||
| 2014 | 2013 | |
| Shares | Shares | |
| (000) | (000) | |
| Issued | 169,864 | 164,144 |
| Issued in Lieu of Cash Distributions | 8,261 | 8,082 |
| Redeemed | (90,018) | (67,148) |
| Net Increase (Decrease) in Shares Outstanding | 88,107 | 105,078 |
29
Target Retirement 2040 Fund
F. Transactions during the period in affiliated underlying Vanguard funds were as follows:
| Current Period Transactions | ||||||
| Sept. 30, | Proceeds | Sept. 30, | ||||
| 2013 | from | Capital Gain | 2014 | |||
| Market | Purchases | Securities | Dividend Distributions | Market | ||
| Value | at Cost | Sold | Income | Received | Value | |
| ($000) | ($000) | ($000) | ($000) | ($000) | ($000) | |
| Vanguard Market Liquidity Fund | 8,263 | NA1 | NA1 | 10 | — | 10,023 |
| Vanguard Total Bond Market II | ||||||
| Index Fund | 972,478 | 568,229 | 282,704 | 26,216 | 495 | 1,274,711 |
| Vanguard Total International | ||||||
| Bond Index Fund | 240,208 | 92,505 | 28,192 | 4,072 | — | 318,470 |
| Vanguard Total International | ||||||
| Stock Index Fund | 3,240,900 | 1,155,316 | 159,938 | 124,805 | — | 4,262,284 |
| Vanguard Total Stock Market | ||||||
| Index Fund | 7,553,275 | 1,712,120 | 451,548 | 158,416 | — | 10,056,868 |
| Total | 12,015,124 | 3,528,170 | 922,382 | 313,519 | 495 | 15,922,356 |
| 1 Not applicable—Purchases and Sales are for temporary cash investment purposes. | ||||||
G. Management has determined that no material events or transactions occurred subsequent to September 30, 2014, that would require recognition or disclosure in these financial statements.
30
Target Retirement 2045 Fund
Fund Profile
As of September 30, 2014
| Total Fund Characteristics | |
| Ticker Symbol | VTIVX |
| 30-Day SEC Yield | 2.12% |
| Acquired Fund Fees and Expenses1 | 0.18% |
| Allocation to Underlying Vanguard Funds | |
| Vanguard Total Stock Market Index Fund | |
| Investor Shares | 63.2% |
| Vanguard Total International Stock Index | |
| Fund Investor Shares | 26.8 |
| Vanguard Total Bond Market II Index Fund | |
| Investor Shares | 8.0 |
| Vanguard Total International Bond Index | |
| Fund Investor Shares | 2.0 |
| Total Fund Volatility Measures | ||
| Target 2045 | MSCI US | |
| Composite | Broad Market | |
| Index | Index | |
| R-Squared | 1.00 | 0.96 |
| Beta | 1.00 | 0.92 |
Fund Asset Allocation

1 This figure—drawn from the prospectus dated January 27, 2014—represents an estimate of the weighted average of the expense ratios and any
transaction fees charged by the underlying mutual funds (the ”acquired” funds) in which the Target Retirement 2045 Fund invests. The fund does not
charge any expenses or fees of its own. For the fiscal year ended September 30, 2014, the acquired fund fees and expenses were 0.18%.
31
Target Retirement 2045 Fund
Performance Summary
All of the returns in this report represent past performance, which is not a guarantee of future results that may be achieved by the fund. (Current performance may be lower or higher than the performance data cited. For performance data current to the most recent month-end, visit our website at vanguard.com/performance.) Note, too, that both investment returns and principal value can fluctuate widely, so an investor’s shares, when sold, could be worth more or less than their original cost. The returns shown do not reflect taxes that a shareholder would pay on fund distributions or on the sale of fund shares.
Cumulative Performance: September 30, 2004, Through September 30, 2014
Initial Investment of $10,000
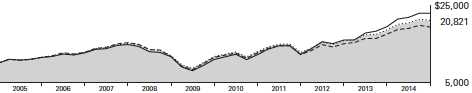
| Average Annual Total Returns | |||||
| Periods Ended September 30, 2014 | |||||
| Final Value | |||||
| One | Five | Ten | of a $10,000 | ||
| Year | Years | Years | Investment | ||
| Target Retirement 2045 Fund | 12.73% | 12.14% | 7.61% | $20,821 | |
| •••••••• | Target 2045 Composite Index | 13.04 | 12.41 | 7.73 | 21,053 |
| – – – – | Mixed-Asset Target 2045 Funds | ||||
| 10.46 | 10.94 | 6.82 | 19,341 | ||
| MSCI Average US Broad Market Index | 17.88 | 15.88 | 8.65 | 22,920 | |
Mixed-Asset Target 2045 Funds Average: Derived from data provided by Lipper, a Thomson Reuters Company.
See Financial Highlights for dividend and capital gains information.
32
Target Retirement 2045 Fund
Fiscal-Year Total Returns (%): September 30, 2004, Through September 30, 2014
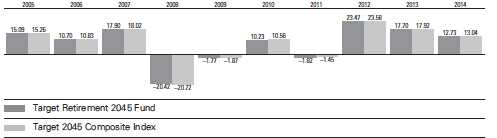
For a benchmark description, see the Glossary.
33
Target Retirement 2045 Fund
Financial Statements
Statement of Net Assets
As of September 30, 2014
The fund reports a complete list of its holdings in regulatory filings four times in each fiscal year, at the quarter-ends. For the second and fourth fiscal quarters, the lists appear in the fund’s semiannual and annual reports to shareholders. For the first and third fiscal quarters, the fund files the lists with the Securities and Exchange Commission on Form N-Q. Shareholders can look up the fund’s Forms N-Q on the SEC’s website at sec.gov. Forms N-Q may also be reviewed and copied at the SEC’s Public Reference Room (see the back cover of this report for further information).
| Market | ||
| Value• | ||
| Shares | ($000) | |
| Investment Companies (99.9%) | ||
| U.S. Stock Fund (63.1%) | ||
| Vanguard Total Stock Market Index Fund Investor Shares | 185,816,393 | 9,155,174 |
| International Stock Fund (26.8%) | ||
| Vanguard Total International Stock Index Fund Investor Shares | 237,229,700 | 3,881,078 |
| U.S. Bond Fund (8.0%) | ||
| 1 Vanguard Total Bond Market II Index Fund Investor Shares | 108,088,152 | 1,160,867 |
| International Bond Fund (2.0%) | ||
| Vanguard Total International Bond Index Fund Investor Shares | 27,878,321 | 289,934 |
| Total Investment Companies (Cost $10,909,318) | 14,487,053 | |
| Temporary Cash Investment (0.1%) | ||
| Money Market Fund (0.1%) | ||
| 1 Vanguard Market Liquidity Fund, 0.109% (Cost $8,935) | 8,935,095 | 8,935 |
| Total Investments (100.0%) (Cost $10,918,253) | 14,495,988 | |
| Other Assets and Liabilities (0.0%) | ||
| Other Assets | 117,975 | |
| Liabilities | (122,659) | |
| (4,684) | ||
| Net Assets (100%) | ||
| Applicable to 778,807,855 outstanding $.001 par value shares of | ||
| beneficial interest (unlimited authorization) | 14,491,304 | |
| Net Asset Value Per Share | $18.61 | |
34
Target Retirement 2045 Fund
| At September 30, 2014, net assets consisted of: | |
| Amount | |
| ($000) | |
| Paid-in Capital | 10,713,996 |
| Undistributed Net Investment Income | 215,739 |
| Accumulated Net Realized Losses | (16,166) |
| Unrealized Appreciation (Depreciation) | 3,577,735 |
| Net Assets | 14,491,304 |
• See Note A in Notes to Financial Statements.
1 Affiliated fund available only to Vanguard funds and certain trusts and accounts managed by Vanguard. Rate shown for Vanguard Market
Liquidity Fund is the 7-day yield.
See accompanying Notes, which are an integral part of the Financial Statements.
35
Target Retirement 2045 Fund
Statement of Operations
| Year Ended | |
| September 30, 2014 | |
| ($000) | |
| Investment Income | |
| Income | |
| Income Distributions Received | 290,564 |
| Net Investment Income—Note B | 290,564 |
| Realized Net Gain (Loss) | |
| Capital Gain Distributions Received | 469 |
| Affiliated Investment Securities Sold | 7,943 |
| Realized Net Gain (Loss) | 8,412 |
| Change in Unrealized Appreciation (Depreciation) of Investment Securities | 1,216,259 |
| Net Increase (Decrease) in Net Assets Resulting from Operations | 1,515,235 |
See accompanying Notes, which are an integral part of the Financial Statements.
36
Target Retirement 2045 Fund
Statement of Changes in Net Assets
| Year Ended September 30, | ||
| 2014 | 2013 | |
| ($000) | ($000) | |
| Increase (Decrease) in Net Assets | ||
| Operations | ||
| Net Investment Income | 290,564 | 234,541 |
| Realized Net Gain (Loss) | 8,412 | 9,477 |
| Change in Unrealized Appreciation (Depreciation) | 1,216,259 | 1,382,551 |
| Net Increase (Decrease) in Net Assets Resulting from Operations | 1,515,235 | 1,626,569 |
| Distributions | ||
| Net Investment Income | (234,723) | (186,901) |
| Realized Capital Gain1 | — | (2,957) |
| Total Distributions | (234,723) | (189,858) |
| Capital Share Transactions | ||
| Issued | 3,903,286 | 3,187,991 |
| Issued in Lieu of Cash Distributions | 231,884 | 188,279 |
| Redeemed | (2,365,499) | (1,534,886) |
| Net Increase (Decrease) from Capital Share Transactions | 1,769,671 | 1,841,384 |
| Total Increase (Decrease) | 3,050,183 | 3,278,095 |
| Net Assets | ||
| Beginning of Period | 11,441,121 | 8,163,026 |
| End of Period2 | 14,491,304 | 11,441,121 |
treated as ordinary income dividends for tax purposes.
2 Net Assets—End of Period includes undistributed (overdistributed) net investment income of $215,739,000 and $159,898,000.
See accompanying Notes, which are an integral part of the Financial Statements.
37
Target Retirement 2045 Fund
Financial Highlights
| For a Share Outstanding | Year Ended September 30, | ||||
| Throughout Each Period | 2014 | 2013 | 2012 | 2011 | 2010 |
| Net Asset Value, Beginning of Period | $16.82 | $14.61 | $12.10 | $12.64 | $11.70 |
| Investment Operations | |||||
| Net Investment Income | . 376 | .350 | .354 | .237 | .257 |
| Capital Gain Distributions Received | .001 | .008 | .014 | .005 | — |
| Net Realized and Unrealized Gain (Loss) | |||||
| on Investments | 1.747 | 2.173 | 2.433 | (.436) | .929 |
| Total from Investment Operations | 2.124 | 2.531 | 2.801 | (.194) | 1.186 |
| Distributions | |||||
| Dividends from Net Investment Income | (.334) | (.316) | (.286) | (. 242) | (. 246) |
| Distributions from Realized Capital Gains | — | (.005) | (.005) | (.104) | — |
| Total Distributions | (. 334) | (. 321) | (. 291) | (. 346) | (. 246) |
| Net Asset Value, End of Period | $18.61 | $16.82 | $14.61 | $12.10 | $12.64 |
| Total Return1 | 12.73% | 17.70% | 23.47% | -1.82% | 10.23% |
| Ratios/Supplemental Data | |||||
| Net Assets, End of Period (Millions) | $14,491 | $11,441 | $8,163 | $5,702 | $4,918 |
| Ratio of Total Expenses to Average Net Assets | — | — | — | — | — |
| Acquired Fund Fees and Expenses | 0.18% | 0.18% | 0.18% | 0.19% | 0.19% |
| Ratio of Net Investment Income to | |||||
| Average Net Assets | 2.17% | 2.36% | 2.70% | 1.79% | 2.24% |
| Portfolio Turnover Rate | 7% | 10% | 7% | 16%2 | 6% |
any applicable account service fees.
2 Excludes the value of mutual fund shares delivered and received in connection with a change in the fund’s international equity investments
from Vanguard European, Pacific, and Emerging Markets Stock Index Funds to Vanguard Total International Stock Index Fund because those
transactions were effected in kind and did not cause the fund to incur transaction costs.
See accompanying Notes, which are an integral part of the Financial Statements.
38
Target Retirement 2045 Fund
Notes to Financial Statements
Vanguard Target Retirement 2045 Fund is registered under the Investment Company Act of 1940 as an open-end investment company, or mutual fund. The fund follows a balanced investment strategy by investing in selected Vanguard funds to achieve its targeted allocation of assets to U.S. and international stocks, and U.S. and international bonds. Financial statements and other information about each underlying fund are available on vanguard.com.
A. The following significant accounting policies conform to generally accepted accounting principles for U.S. investment companies. The fund consistently follows such policies in preparing its financial statements.
1. Security Valuation: Investments are valued at the net asset value of each underlying Vanguard fund determined as of the close of the New York Stock Exchange (generally 4 p.m., Eastern time) on the valuation date.
2. Federal Income Taxes: The fund intends to continue to qualify as a regulated investment company and distribute all of its taxable income. Management has analyzed the fund’s tax positions taken for all open federal income tax years (September 30, 2011–2014), and has concluded that no provision for federal income tax is required in the fund’s financial statements.
3. Distributions: Distributions to shareholders are recorded on the ex-dividend date.
4. Credit Facility: The fund and certain other funds managed by The Vanguard Group participate in a $2.89 billion committed credit facility provided by a syndicate of lenders pursuant to a credit agreement that may be renewed annually; each fund is individually liable for its borrowings, if any, under the credit facility. Borrowings may be utilized for temporary and emergency purposes, and are subject to the fund’s regulatory and contractual borrowing restrictions. The participating funds are charged administrative fees and an annual commitment fee of 0.06% of the undrawn amount of the facility; these fees are allocated to the funds based on a method approved by the fund’s board of trustees and borne by the funds in which the fund invests (See Note B). Any borrowings under this facility bear interest at a rate equal to the higher of the federal funds rate or LIBOR reference rate plus an agreed-upon spread.
The fund had no borrowings outstanding at September 30, 2014, or at any time during the period then ended.
5. Other: Income and capital gain distributions received are recorded on the ex-dividend date. Security transactions are accounted for on the date securities are bought or sold. Costs used to determine realized gains (losses) on the sale of investment securities are those of the specific securities sold.
B. Under a service agreement, The Vanguard Group furnishes investment advisory, corporate management, administrative, marketing, and distribution services to the fund. The service agreement provides that the fund’s expenses may be reduced or eliminated to the extent of savings realized by the Vanguard funds by the operation of the fund. Accordingly, all incremental expenses for services provided by Vanguard and all other expenses incurred by the fund during the year ended September 30, 2014, were borne by the funds in which the fund invests. The fund’s trustees and officers are also directors and officers of Vanguard and the funds in which the fund invests.
39
Target Retirement 2045 Fund
C. Various inputs may be used to determine the value of the fund’s investments. These inputs are summarized in three broad levels for financial statement purposes. The inputs or methodologies used to value securities are not necessarily an indication of the risk associated with investing in those securities.
Level 1—Quoted prices in active markets for identical securities.
Level 2—Other significant observable inputs (including quoted prices for similar securities, interest rates, prepayment speeds, credit risk, etc.).
Level 3—Significant unobservable inputs (including the fund’s own assumptions used to determine the fair value of investments).
At September 30, 2014, 100% of the market value of the fund’s investments was determined based on Level 1 inputs.
D. Distributions are determined on a tax basis and may differ from net investment income and realized capital gains for financial reporting purposes. Differences may be permanent or temporary. Permanent differences are reclassified among capital accounts in the financial statements to reflect their tax character. Temporary differences arise when certain items of income, expense, gain, or loss are recognized in different periods for financial statement and tax purposes. These differences will reverse at some time in the future. Differences in classification may also result from the treatment of short-term gains as ordinary income for tax purposes.
For tax purposes, at September 30, 2014, the fund had $215,630,000 of ordinary income available for distribution. The fund used capital loss carryforwards of $7,051,000 to offset taxable capital gains realized during the year ended September 30, 2014. At September 30, 2014, the fund had available capital losses totaling $15,266,000 that may be carried forward indefinitely to offset future net capital gains.
At September 30, 2014, the cost of investment securities for tax purposes was $10,919,043,000. Net unrealized appreciation of investment securities for tax purposes was $3,576,945,000, consisting entirely of unrealized gains on securities that had risen in value since their purchase.
E. Capital shares issued and redeemed were:
| Year Ended September 30, | ||
| 2014 | 2013 | |
| Shares | Shares | |
| (000) | (000) | |
| Issued | 216,231 | 205,525 |
| Issued in Lieu of Cash Distributions | 13,130 | 13,102 |
| Redeemed | (130,624) | (97,476) |
| Net Increase (Decrease) in Shares Outstanding | 98,737 | 121,151 |
40
Target Retirement 2045 Fund
F. Transactions during the period in affiliated underlying Vanguard funds were as follows:
| Current Period Transactions | ||||||
| Sept. 30, | Proceeds | Sept. 30, | ||||
| 2013 | from | Capital Gain | 2014 | |||
| Market | Purchases | Securities | Dividend Distributions | Market | ||
| Value | at Cost | Sold | Income | Received | Value | |
| ($000) | ($000) | ($000) | ($000) | ($000) | ($000) | |
| Vanguard Market Liquidity Fund | 10,111 | NA1 | NA1 | 9 | — | 8,935 |
| Vanguard Total Bond Market II | ||||||
| Index Fund | 914,861 | 534,665 | 304,223 | 24,308 | 469 | 1,160,867 |
| Vanguard Total International | ||||||
| Bond Index Fund | 233,021 | 70,878 | 27,000 | 3,799 | — | 289,934 |
| Vanguard Total International | ||||||
| Stock Index Fund | 3,085,040 | 849,178 | 82,437 | 115,688 | — | 3,881,078 |
| Vanguard Total Stock Market | ||||||
| Index Fund | 7,195,413 | 1,319,617 | 526,163 | 146,760 | — | 9,155,174 |
| Total | 11,438,446 | 2,774,338 | 939,823 | 290,564 | 469 | 14,495,988 |
| 1 Not applicable—Purchases and Sales are for temporary cash investment purposes. | ||||||
G. Management has determined that no material events or transactions occurred subsequent to September 30, 2014, that would require recognition or disclosure in these financial statements.
41
Target Retirement 2050 Fund
Fund Profile
As of September 30, 2014
| Total Fund Characteristics | |
| Ticker Symbol | VFIFX |
| 30-Day SEC Yield | 2.12% |
| Acquired Fund Fees and Expenses1 | 0.18% |
| Allocation to Underlying Vanguard Funds | |
| Vanguard Total Stock Market Index Fund | |
| Investor Shares | 63.0% |
| Vanguard Total International Stock Index | |
| Fund Investor Shares | 26.9 |
| Vanguard Total Bond Market II Index Fund | |
| Investor Shares | 8.1 |
| Vanguard Total International Bond Index | |
| Fund Investor Shares | 2.0 |
| Total Fund Volatility Measures | ||
| Target 2050 | MSCI US | |
| Composite | Broad Market | |
| Index | Index | |
| R-Squared | 1.00 | 0.96 |
| Beta | 0.99 | 0.92 |
Fund Asset Allocation
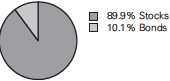
1 This figure—drawn from the prospectus dated January 27, 2014—represents an estimate of the weighted average of the expense ratios and any
transaction fees charged by the underlying mutual funds (the ”acquired” funds) in which the Target Retirement 2050 Fund invests. The fund does not
charge any expenses or fees of its own. For the fiscal year ended September 30, 2014, the acquired fund fees and expenses were 0.18%.
42
Target Retirement 2050 Fund
Performance Summary
All of the returns in this report represent past performance, which is not a guarantee of future results that may be achieved by the fund. (Current performance may be lower or higher than the performance data cited. For performance data current to the most recent month-end, visit our website at vanguard.com/performance.) Note, too, that both investment returns and principal value can fluctuate widely, so an investor’s shares, when sold, could be worth more or less than their original cost. The returns shown do not reflect taxes that a shareholder would pay on fund distributions or on the sale of fund shares.
Cumulative Performance: June 7, 2006, Through September 30, 2014
Initial Investment of $10,000

| Average Annual Total Returns | |||||
| Periods Ended September 30, 2014 | |||||
| Since | Final Value | ||||
| One | Five | Inception | of a $10,000 | ||
| Year | Years | (6/7/2006) | Investment | ||
| Target Retirement 2050 Fund | 12.69% | 12.12% | 6.85% | $17,347 | |
| •••••••• | Target 2050 Composite Index | 13.04 | 12.41 | 6.96 | 17,501 |
| – – – – | Mixed-Asset Target 2050 Funds | ||||
| 10.33 | 10.75 | 5.57 | 15,696 | ||
| MSCI Average US Broad Market Index | 17.88 | 15.88 | 8.15 | 19,186 | |
Mixed-Asset Target 2050 Funds Average: Derived from data provided by Lipper, a Thomson Reuters Company.
"Since Inception" performance is calculated from the inception date for both the fund and its comparative standards.
See Financial Highlights for dividend and capital gains information.
43
Target Retirement 2050 Fund
Fiscal-Year Total Returns (%): June 7, 2006, Through September 30, 2014

For a benchmark description, see the Glossary.
44
Target Retirement 2050 Fund
Financial Statements
Statement of Net Assets
As of September 30, 2014
The fund reports a complete list of its holdings in regulatory filings four times in each fiscal year, at the quarter-ends. For the second and fourth fiscal quarters, the lists appear in the fund’s semiannual and annual reports to shareholders. For the first and third fiscal quarters, the fund files the lists with the Securities and Exchange Commission on Form N-Q. Shareholders can look up the fund’s Forms N-Q on the SEC’s website at sec.gov. Forms N-Q may also be reviewed and copied at the SEC’s Public Reference Room (see the back cover of this report for further information).
| Market | ||
| Value• | ||
| Shares | ($000) | |
| Investment Companies (100.0%) | ||
| U.S. Stock Fund (63.0%) | ||
| Vanguard Total Stock Market Index Fund Investor Shares | 94,448,536 | 4,653,479 |
| International Stock Fund (26.9%) | ||
| Vanguard Total International Stock Index Fund Investor Shares | 121,687,577 | 1,990,809 |
| U.S. Bond Fund (8.1%) | ||
| 1 Vanguard Total Bond Market II Index Fund Investor Shares | 55,775,394 | 599,028 |
| International Bond Fund (2.0%) | ||
| Vanguard Total International Bond Index Fund Investor Shares | 14,190,575 | 147,582 |
| Total Investment Companies (Cost $5,775,429) | 7,390,898 | |
| Temporary Cash Investment (0.1%) | ||
| Money Market Fund (0.1%) | ||
| 1 Vanguard Market Liquidity Fund, 0.109% (Cost $5,041) | 5,041,472 | 5,041 |
| Total Investments (100.1%) (Cost $5,780,470) | 7,395,939 | |
| Other Assets and Liabilities (-0.1%) | ||
| Other Assets | 73,525 | |
| Liabilities | (80,204) | |
| (6,679) | ||
| Net Assets (100%) | ||
| Applicable to 250,216,685 outstanding $.001 par value shares of | ||
| beneficial interest (unlimited authorization) | 7,389,260 | |
| Net Asset Value Per Share | $29.53 | |
45
Target Retirement 2050 Fund
| At September 30, 2014, net assets consisted of: | |
| Amount | |
| ($000) | |
| Paid-in Capital | 5,670,631 |
| Undistributed Net Investment Income | 108,365 |
| Accumulated Net Realized Losses | (5,205) |
| Unrealized Appreciation (Depreciation) | 1,615,469 |
| Net Assets | 7,389,260 |
• See Note A in Notes to Financial Statements.
1 Affiliated fund available only to Vanguard funds and certain trusts and accounts managed by Vanguard. Rate shown for Vanguard Market
Liquidity Fund is the 7-day yield.
See accompanying Notes, which are an integral part of the Financial Statements.
46
Target Retirement 2050 Fund
Statement of Operations
| Year Ended | |
| September 30, 2014 | |
| ($000) | |
| Investment Income | |
| Income | |
| Income Distributions Received | 143,739 |
| Net Investment Income—Note B | 143,739 |
| Realized Net Gain (Loss) | |
| Capital Gain Distributions Received | 221 |
| Affiliated Investment Securities Sold | 1,967 |
| Realized Net Gain (Loss) | 2,188 |
| Change in Unrealized Appreciation (Depreciation) of Investment Securities | 583,773 |
| Net Increase (Decrease) in Net Assets Resulting from Operations | 729,700 |
See accompanying Notes, which are an integral part of the Financial Statements.
47
Target Retirement 2050 Fund
Statement of Changes in Net Assets
| Year Ended September 30, | ||
| 2014 | 2013 | |
| ($000) | ($000) | |
| Increase (Decrease) in Net Assets | ||
| Operations | ||
| Net Investment Income | 143,739 | 105,695 |
| Realized Net Gain (Loss) | 2,188 | (383) |
| Change in Unrealized Appreciation (Depreciation) | 583,773 | 625,961 |
| Net Increase (Decrease) in Net Assets Resulting from Operations | 729,700 | 731,273 |
| Distributions | ||
| Net Investment Income | (108,671) | (79,191) |
| Realized Capital Gain1 | — | (1,138) |
| Total Distributions | (108,671) | (80,329) |
| Capital Share Transactions | ||
| Issued | 2,587,083 | 1,926,591 |
| Issued in Lieu of Cash Distributions | 106,886 | 79,320 |
| Redeemed | (1,280,848) | (769,063) |
| Net Increase (Decrease) from Capital Share Transactions | 1,413,121 | 1,236,848 |
| Total Increase (Decrease) | 2,034,150 | 1,887,792 |
| Net Assets | ||
| Beginning of Period | 5,355,110 | 3,467,318 |
| End of Period2 | 7,389,260 | 5,355,110 |
treated as ordinary income dividends for tax purposes.
2 Net Assets—End of Period includes undistributed (overdistributed) net investment income of $108,365,000 and $73,297,000.
See accompanying Notes, which are an integral part of the Financial Statements.
48
Target Retirement 2050 Fund
Financial Highlights
| For a Share Outstanding | Year Ended September 30, | ||||
| Throughout Each Period | 2014 | 2013 | 2012 | 2011 | 2010 |
| Net Asset Value, Beginning of Period | $26.69 | $23.16 | $19.17 | $20.10 | $18.58 |
| Investment Operations | |||||
| Net Investment Income | . 586 | .539 | .549 | . 360 | . 399 |
| Capital Gain Distributions Received | .001 | .012 | .022 | .006 | — |
| Net Realized and Unrealized Gain (Loss) | |||||
| on Investments | 2.771 | 3.473 | 3.866 | (.682) | 1.492 |
| Total from Investment Operations | 3.358 | 4.024 | 4.437 | (.316) | 1.891 |
| Distributions | |||||
| Dividends from Net Investment Income | (.518) | (.487) | (. 439) | (. 370) | (. 371) |
| Distributions from Realized Capital Gains | — | (.007) | (.008) | (.244) | — |
| Total Distributions | (.518) | (. 494) | (. 447) | (. 614) | (. 371) |
| Net Asset Value, End of Period | $29.53 | $26.69 | $23.16 | $19.17 | $20.10 |
| Total Return1 | 12.69% | 17.74% | 23.46% | -1.89% | 10.26% |
| Ratios/Supplemental Data | |||||
| Net Assets, End of Period (Millions) | $7,389 | $5,355 | $3,467 | $2,074 | $1,517 |
| Ratio of Total Expenses to Average Net Assets | — | — | — | — | — |
| Acquired Fund Fees and Expenses | 0.18% | 0.18% | 0.18% | 0.19% | 0.19% |
| Ratio of Net Investment Income to | |||||
| Average Net Assets | 2.19% | 2.36% | 2.70% | 1.79% | 2.21% |
| Portfolio Turnover Rate | 7% | 9% | 4% | 15%2 | 10% |
any applicable account service fees.
2 Excludes the value of mutual fund shares delivered and received in connection with a change in the fund’s international equity investments
from Vanguard European, Pacific, and Emerging Markets Stock Index Funds to Vanguard Total International Stock Index Fund because those
transactions were effected in kind and did not cause the fund to incur transaction costs.
See accompanying Notes, which are an integral part of the Financial Statements.
49
Target Retirement 2050 Fund
Notes to Financial Statements
Vanguard Target Retirement 2050 Fund is registered under the Investment Company Act of 1940 as an open-end investment company, or mutual fund. The fund follows a balanced investment strategy by investing in selected Vanguard funds to achieve its targeted allocation of assets to U.S. and international stocks, and U.S. and international bonds. Financial statements and other information about each underlying fund are available on vanguard.com.
A. The following significant accounting policies conform to generally accepted accounting principles for U.S. investment companies. The fund consistently follows such policies in preparing its financial statements.
1. Security Valuation: Investments are valued at the net asset value of each underlying Vanguard fund determined as of the close of the New York Stock Exchange (generally 4 p.m., Eastern time) on the valuation date.
2. Federal Income Taxes: The fund intends to continue to qualify as a regulated investment company and distribute all of its taxable income. Management has analyzed the fund’s tax positions taken for all open federal income tax years (September 30, 2011–2014), and has concluded that no provision for federal income tax is required in the fund’s financial statements.
3. Distributions: Distributions to shareholders are recorded on the ex-dividend date.
4. Credit Facility: The fund and certain other funds managed by The Vanguard Group participate in a $2.89 billion committed credit facility provided by a syndicate of lenders pursuant to a credit agreement that may be renewed annually; each fund is individually liable for its borrowings, if any, under the credit facility. Borrowings may be utilized for temporary and emergency purposes, and are subject to the fund’s regulatory and contractual borrowing restrictions. The participating funds are charged administrative fees and an annual commitment fee of 0.06% of the undrawn amount of the facility; these fees are allocated to the funds based on a method approved by the fund’s board of trustees and borne by the funds in which the fund invests (See Note B). Any borrowings under this facility bear interest at a rate equal to the higher of the federal funds rate or LIBOR reference rate plus an agreed-upon spread.
The fund had no borrowings outstanding at September 30, 2014, or at any time during the period then ended.
5. Other: Income and capital gain distributions received are recorded on the ex-dividend date. Security transactions are accounted for on the date securities are bought or sold. Costs used to determine realized gains (losses) on the sale of investment securities are those of the specific securities sold.
B. Under a service agreement, The Vanguard Group furnishes investment advisory, corporate management, administrative, marketing, and distribution services to the fund. The service agreement provides that the fund’s expenses may be reduced or eliminated to the extent of savings realized by the Vanguard funds by the operation of the fund. Accordingly, all incremental expenses for services provided by Vanguard and all other expenses incurred by the fund during the year ended September 30, 2014, were borne by the funds in which the fund invests. The fund’s trustees and officers are also directors and officers of Vanguard and the funds in which the fund invests.
50
Target Retirement 2050 Fund
C. Various inputs may be used to determine the value of the fund’s investments. These inputs are summarized in three broad levels for financial statement purposes. The inputs or methodologies used to value securities are not necessarily an indication of the risk associated with investing in those securities.
Level 1—Quoted prices in active markets for identical securities.
Level 2—Other significant observable inputs (including quoted prices for similar securities, interest rates, prepayment speeds, credit risk, etc.).
Level 3—Significant unobservable inputs (including the fund’s own assumptions used to determine the fair value of investments).
At September 30, 2014, 100% of the market value of the fund’s investments was determined based on Level 1 inputs.
D. Distributions are determined on a tax basis and may differ from net investment income and realized capital gains for financial reporting purposes. Differences may be permanent or temporary. Permanent differences are reclassified among capital accounts in the financial statements to reflect their tax character. Temporary differences arise when certain items of income, expense, gain, or loss are recognized in different periods for financial statement and tax purposes. These differences will reverse at some time in the future. Differences in classification may also result from the treatment of short-term gains as ordinary income for tax purposes.
For tax purposes, at September 30, 2014, the fund had $108,366,000 of ordinary income available for distribution. The fund used capital loss carryforwards of $2,281,000 to offset taxable capital gains realized during the year ended September 30, 2014. At September 30, 2014, the fund had available capital losses totaling $3,440,000 that may be carried forward indefinitely to offset future net capital gains.
At September 30, 2014, the cost of investment securities for tax purposes was $5,782,235,000. Net unrealized appreciation of investment securities for tax purposes was $1,613,704,000, consisting entirely of unrealized gains on securities that had risen in value since their purchase.
E. Capital shares issued and redeemed were:
| Year Ended September 30, | ||
| 2014 | 2013 | |
| Shares | Shares | |
| (000) | (000) | |
| Issued | 90,220 | 78,284 |
| Issued in Lieu of Cash Distributions | 3,813 | 3,480 |
| Redeemed | (44,461) | (30,850) |
| Net Increase (Decrease) in Shares Outstanding | 49,572 | 50,914 |
51
Target Retirement 2050 Fund
F. Transactions during the period in affiliated underlying Vanguard funds were as follows:
| Current Period Transactions | ||||||
| Sept. 30, | Proceeds | Sept. 30, | ||||
| 2013 | from | Capital Gain | 2014 | |||
| Market | Purchases | Securities | Dividend Distributions | Market | ||
| Value | at Cost | Sold | Income | Received | Value | |
| ($000) | ($000) | ($000) | ($000) | ($000) | ($000) | |
| Vanguard Market Liquidity Fund | 6,630 | NA1 | NA1 | 6 | — | 5,041 |
| Vanguard Total Bond Market II | ||||||
| Index Fund | 429,110 | 303,536 | 141,288 | 11,971 | 221 | 599,028 |
| Vanguard Total International | ||||||
| Bond Index Fund | 108,611 | 46,583 | 14,000 | 1,858 | — | 147,582 |
| Vanguard Total International | ||||||
| Stock Index Fund | 1,443,455 | 594,351 | 55,638 | 57,343 | — | 1,990,809 |
| Vanguard Total Stock Market | ||||||
| Index Fund | 3,367,269 | 988,927 | 265,758 | 72,561 | — | 4,653,479 |
| Total | 5,355,075 | 1,933,397 | 476,684 | 143,739 | 221 | 7,395,939 |
| 1 Not applicable—Purchases and Sales are for temporary cash investment purposes. | ||||||
G. Management has determined that no material events or transactions occurred subsequent to September 30, 2014, that would require recognition or disclosure in these financial statements.
52
Target Retirement 2055 Fund
Fund Profile
As of September 30, 2014
| Total Fund Characteristics | |
| Ticker Symbol | VFFVX |
| 30-Day SEC Yield | 2.12% |
| Acquired Fund Fees and Expenses1 | 0.18% |
| Allocation to Underlying Vanguard Funds | |
| Vanguard Total Stock Market Index Fund | |
| Investor Shares | 63.0% |
| Vanguard Total International Stock Index | |
| Fund Investor Shares | 27.0 |
| Vanguard Total Bond Market II Index Fund | |
| Investor Shares | 8.0 |
| Vanguard Total International Bond Index | |
| Fund Investor Shares | 2.0 |
| Total Fund Volatility Measures | ||
| Target 2055 | MSCI US | |
| Composite | Broad Market | |
| Index | Index | |
| R-Squared | 1.00 | 0.96 |
| Beta | 0.99 | 0.92 |
Fund Asset Allocation

1 This figure—drawn from the prospectus dated January 27, 2014—represents an estimate of the weighted average of the expense ratios and any transaction fees charged by the underlying mutual funds (the ”acquired” funds) in which the Target Retirement 2055 Fund invests. The fund does not charge any expenses or fees of its own. For the fiscal year ended September 30, 2014, the acquired fund fees and expenses were 0.18%.
53
Target Retirement 2055 Fund
Performance Summary
All of the returns in this report represent past performance, which is not a guarantee of future results that may be achieved by the fund. (Current performance may be lower or higher than the performance data cited. For performance data current to the most recent month-end, visit our website at vanguard.com/performance.) Note, too, that both investment returns and principal value can fluctuate widely, so an investor’s shares, when sold, could be worth more or less than their original cost. The returns shown do not reflect taxes that a shareholder would pay on fund distributions or on the sale of fund shares.
Cumulative Performance: August 18, 2010, Through September 30, 2014
Initial Investment of $10,000
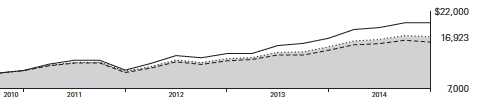
| Average Annual Total Returns | ||||
| Periods Ended September 30, 2014 | ||||
| Since | Final Value | |||
| One | Inception | of a $10,000 | ||
| Year | (8/18/2010) | Investment | ||
| Target Retirement 2055 Fund | 12.69% | 13.63% | $16,923 | |
| •••••••• | Target 2055 Composite Index | 13.04 | 13.84 | 17,051 |
| – – – – | Spliced Mixed-Asset Target 2055+ | |||
| 10.98 | 12.12 | 16,017 | ||
| MSCI Funds US Average Broad Market Index | 17.88 | 17.98 | 19,758 | |
Spliced Mixed-Asset Target 2055+ Funds Average: Derived from data provided by Lipper, a Thomson Reuters Company.
"Since Inception" performance is calculated from the inception date for both the fund and its comparative standards.
See Financial Highlights for dividend and capital gains information.
54
Target Retirement 2055 Fund
Fiscal-Year Total Returns (%): August 18, 2010, Through September 30, 2014
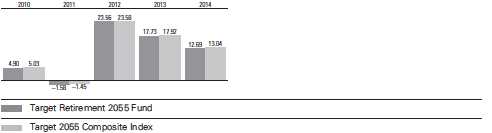
For a benchmark description, see the Glossary.
55
Target Retirement 2055 Fund
Financial Statements
Statement of Net Assets
As of September 30, 2014
The fund reports a complete list of its holdings in regulatory filings four times in each fiscal year, at the quarter-ends. For the second and fourth fiscal quarters, the lists appear in the fund’s semiannual and annual reports to shareholders. For the first and third fiscal quarters, the fund files the lists with the Securities and Exchange Commission on Form N-Q. Shareholders can look up the fund’s Forms N-Q on the SEC’s website at sec.gov. Forms N-Q may also be reviewed and copied at the SEC’s Public Reference Room (see the back cover of this report for further information).
| Market | ||
| Value• | ||
| Shares | ($000) | |
| Investment Companies (99.9%) | ||
| U.S. Stock Fund (62.9%) | ||
| Vanguard Total Stock Market Index Fund Investor Shares | 21,298,437 | 1,049,374 |
| International Stock Fund (27.0%) | ||
| Vanguard Total International Stock Index Fund Investor Shares | 27,523,449 | 450,284 |
| U.S. Bond Fund (8.0%) | ||
| 1 Vanguard Total Bond Market II Index Fund Investor Shares | 12,433,924 | 133,540 |
| International Bond Fund (2.0%) | ||
| Vanguard Total International Bond Index Fund Investor Shares | 3,207,011 | 33,353 |
| Total Investment Companies (Cost $1,446,763) | 1,666,551 | |
| Temporary Cash Investment (0.1%) | ||
| Money Market Fund (0.1%) | ||
| 1 Vanguard Market Liquidity Fund, 0.109% (Cost $2,341) | 2,341,146 | 2,341 |
| Total Investments (100.0%) (Cost $1,449,104) | 1,668,892 | |
| Other Assets and Liabilities (0.0%) | ||
| Other Assets | 18,003 | |
| Liabilities | (17,272) | |
| 731 | ||
| Net Assets (100%) | ||
| Applicable to 52,498,937 outstanding $.001 par value shares of | ||
| beneficial interest (unlimited authorization) | 1,669,623 | |
| Net Asset Value Per Share | $31.80 | |
56
Target Retirement 2055 Fund
| At September 30, 2014, net assets consisted of: | |
| Amount | |
| ($000) | |
| Paid-in Capital | 1,429,445 |
| Undistributed Net Investment Income | 21,039 |
| Accumulated Net Realized Losses | (649) |
| Unrealized Appreciation (Depreciation) | 219,788 |
| Net Assets | 1,669,623 |
• See Note A in Notes to Financial Statements.
1 Affiliated fund available only to Vanguard funds and certain trusts and accounts managed by Vanguard. Rate shown for Vanguard Market
Liquidity Fund is the 7-day yield.
See accompanying Notes, which are an integral part of the Financial Statements.
57
Target Retirement 2055 Fund
Statement of Operations
| Year Ended | |
| September 30, 2014 | |
| ($000) | |
| Investment Income | |
| Income | |
| Income Distributions Received | 29,476 |
| Net Investment Income—Note B | 29,476 |
| Realized Net Gain (Loss) | |
| Capital Gain Distributions Received | 41 |
| Affiliated Investment Securities Sold | (235) |
| Realized Net Gain (Loss) | (194) |
| Change in Unrealized Appreciation (Depreciation) of Investment Securities | 108,847 |
| Net Increase (Decrease) in Net Assets Resulting from Operations | 138,129 |
See accompanying Notes, which are an integral part of the Financial Statements.
58
Target Retirement 2055 Fund
Statement of Changes in Net Assets
| Year Ended September 30, | ||
| 2014 | 2013 | |
| ($000) | ($000) | |
| Increase (Decrease) in Net Assets | ||
| Operations | ||
| Net Investment Income | 29,476 | 15,546 |
| Realized Net Gain (Loss) | (194) | (168) |
| Change in Unrealized Appreciation (Depreciation) | 108,847 | 91,119 |
| Net Increase (Decrease) in Net Assets Resulting from Operations | 138,129 | 106,497 |
| Distributions | ||
| Net Investment Income | (17,283) | (8,415) |
| Realized Capital Gain1 | (145) | (245) |
| Total Distributions | (17,428) | (8,660) |
| Capital Share Transactions | ||
| Issued | 928,250 | 567,744 |
| Issued in Lieu of Cash Distributions | 17,158 | 8,573 |
| Redeemed | (311,373) | (140,041) |
| Net Increase (Decrease) from Capital Share Transactions | 634,035 | 436,276 |
| Total Increase (Decrease) | 754,736 | 534,113 |
| Net Assets | ||
| Beginning of Period | 914,887 | 380,774 |
| End of Period2 | 1,669,623 | 914,887 |
as ordinary income dividends for tax purposes.
2 Net Assets—End of Period includes undistributed (overdistributed) net investment income of $21,039,000 and $10,791,000.
See accompanying Notes, which are an integral part of the Financial Statements.
59
Target Retirement 2055 Fund
Financial Highlights
| Aug. 18, | |||||
| 20101 to | |||||
| Year Ended September 30, | |||||
| For a Share Outstanding | Sept. 30, | ||||
| Throughout Each Period | 2014 | 2013 | 2012 | 2011 | 2010 |
| Net Asset Value, Beginning of Period | $28.67 | $24.81 | $20.45 | $20.98 | $20.00 |
| Investment Operations | |||||
| Net Investment Income | . 577 | .6412 | .540 | . 388 2 | .063 |
| Capital Gain Distributions Received | .001 | .0112 | .022 | .001 | — |
| Net Realized and Unrealized Gain (Loss) | |||||
| on Investments | 3.033 | 3.668 | 4.202 | (.698) | .917 |
| Total from Investment Operations | 3.611 | 4.320 | 4.764 | (.309) | .980 |
| Distributions | |||||
| Dividends from Net Investment Income | (.477) | (.447) | (. 391) | (.179) | — |
| Distributions from Realized Capital Gains | (. 004) | (. 013) | (. 013) | (. 042) | — |
| Total Distributions | (.481) | (. 460) | (. 404) | (. 221) | — |
| Net Asset Value, End of Period | $31.80 | $28.67 | $24.81 | $20.45 | $20.98 |
| Total Return3 | 12.69% | 17.73% | 23.56% | -1.58% | 4.90% |
| Ratios/Supplemental Data | |||||
| Net Assets, End of Period (Millions) | $1,670 | $915 | $381 | $124 | $2 |
| Ratio of Total Expenses to Average Net Assets | — | — | — | — | — |
| Acquired Fund Fees and Expenses | 0.18% | 0.18% | 0.18% | 0.19% | 0.22%4 |
| Ratio of Net Investment Income to | |||||
| Average Net Assets | 2.22% | 2.39% | 2.76% | 1.71% | 2.73%4 |
| Portfolio Turnover Rate | 7% | 9% | 3% | 12%5 | 3% |
2 Calculated based on average shares outstanding.
3 Total returns do not include account service fees that may have applied in the periods shown. Fund prospectuses provide information about
any applicable account service fees.
4 Annualized.
5 Excludes the value of mutual fund shares delivered and received in connection with a change in the fund’s international equity investments
from Vanguard European, Pacific, and Emerging Markets Stock Index Funds to Vanguard Total International Stock Index Fund because those
transactions were effected in kind and did not cause the fund to incur transaction costs.
See accompanying Notes, which are an integral part of the Financial Statements.
60
Target Retirement 2055 Fund
Notes to Financial Statements
Vanguard Target Retirement 2055 Fund is registered under the Investment Company Act of 1940 as an open-end investment company, or mutual fund. The fund follows a balanced investment strategy by investing in selected Vanguard funds to achieve its targeted allocation of assets to U.S. and international stocks, and U.S. and international bonds. Financial statements and other information about each underlying fund are available on vanguard.com.
A. The following significant accounting policies conform to generally accepted accounting principles for U.S. investment companies. The fund consistently follows such policies in preparing its financial statements.
1. Security Valuation: Investments are valued at the net asset value of each underlying Vanguard fund determined as of the close of the New York Stock Exchange (generally 4 p.m., Eastern time) on the valuation date.
2. Federal Income Taxes: The fund intends to continue to qualify as a regulated investment company and distribute all of its taxable income. Management has analyzed the fund’s tax positions taken for all open federal income tax years (September 30, 2011–2014), and has concluded that no provision for federal income tax is required in the fund’s financial statements.
3. Distributions: Distributions to shareholders are recorded on the ex-dividend date.
4. Credit Facility: The fund and certain other funds managed by The Vanguard Group participate in a $2.89 billion committed credit facility provided by a syndicate of lenders pursuant to a credit agreement that may be renewed annually; each fund is individually liable for its borrowings, if any, under the credit facility. Borrowings may be utilized for temporary and emergency purposes, and are subject to the fund’s regulatory and contractual borrowing restrictions. The participating funds are charged administrative fees and an annual commitment fee of 0.06% of the undrawn amount of the facility; these fees are allocated to the funds based on a method approved by the fund’s board of trustees and borne by the funds in which the fund invests (See Note B). Any borrowings under this facility bear interest at a rate equal to the higher of the federal funds rate or LIBOR reference rate plus an agreed-upon spread.
The fund had no borrowings outstanding at September 30, 2014, or at any time during the period then ended.
5. Other: Income and capital gain distributions received are recorded on the ex-dividend date. Security transactions are accounted for on the date securities are bought or sold. Costs used to determine realized gains (losses) on the sale of investment securities are those of the specific securities sold.
B. Under a service agreement, The Vanguard Group furnishes investment advisory, corporate management, administrative, marketing, and distribution services to the fund. The service agreement provides that the fund’s expenses may be reduced or eliminated to the extent of savings realized by the Vanguard funds by the operation of the fund. Accordingly, all incremental expenses for services provided by Vanguard and all other expenses incurred by the fund during the year ended September 30, 2014, were borne by the funds in which the fund invests. The fund’s trustees and officers are also directors and officers of Vanguard and the funds in which the fund invests.
61
Target Retirement 2055 Fund
C. Various inputs may be used to determine the value of the fund’s investments. These inputs are summarized in three broad levels for financial statement purposes. The inputs or methodologies used to value securities are not necessarily an indication of the risk associated with investing in those securities.
Level 1—Quoted prices in active markets for identical securities.
Level 2—Other significant observable inputs (including quoted prices for similar securities, interest rates, prepayment speeds, credit risk, etc.).
Level 3—Significant unobservable inputs (including the fund’s own assumptions used to determine the fair value of investments).
At September 30, 2014, 100% of the market value of the fund’s investments was determined based on Level 1 inputs.
D. Distributions are determined on a tax basis and may differ from net investment income and realized capital gains for financial reporting purposes. Differences may be permanent or temporary. Permanent differences are reclassified among capital accounts in the financial statements to reflect their tax character. Temporary differences arise when certain items of income, expense, gain, or loss are recognized in different periods for financial statement and tax purposes. These differences will reverse at some time in the future. Differences in classification may also result from the treatment of short-term gains as ordinary income for tax purposes.
The fund used a tax accounting practice to treat a portion of the price of capital shares redeemed during the year as distributions from net investment income and realized capital gains. Accordingly, the fund has reclassified $1,945,000 from undistributed net investment income, and $5,000 from accumulated net realized losses, to paid-in capital.
For tax purposes, at September 30, 2014, the fund had $21,084,000 of ordinary income and $20,000 of long-term capital gains available for distribution.
At September 30, 2014, the cost of investment securities for tax purposes was $1,449,817,000. Net unrealized appreciation of investment securities for tax purposes was $219,075,000, consisting entirely of unrealized gains on securities that had risen in value since their purchase.
E. Capital shares issued and redeemed were:
| Year Ended September 30, | ||
| 2014 | 2013 | |
| Shares | Shares | |
| (000) | (000) | |
| Issued | 30,025 | 21,406 |
| Issued in Lieu of Cash Distributions | 569 | 350 |
| Redeemed | (10,007) | (5,194) |
| Net Increase (Decrease) in Shares Outstanding | 20,587 | 16,562 |
62
Target Retirement 2055 Fund
F. Transactions during the period in affiliated underlying Vanguard funds were as follows:
| Current Period Transactions | ||||||
| Sept. 30, | Proceeds | Sept. 30, | ||||
| 2013 | from | Capital Gain | 2014 | |||
| Market | Purchases | Securities | Dividend Distributions | Market | ||
| Value | at Cost | Sold | Income | Received | Value | |
| ($000) | ($000) | ($000) | ($000) | ($000) | ($000) | |
| Vanguard Market Liquidity Fund | 2,542 | NA1 | NA1 | 2 | — | 2,341 |
| Vanguard Total Bond Market II | ||||||
| Index Fund | 73,616 | 91,709 | 33,359 | 2,421 | 41 | 133,540 |
| Vanguard Total International | ||||||
| Bond Index Fund | 18,455 | 15,840 | 2,223 | 370 | — | 33,353 |
| Vanguard Total International | ||||||
| Stock Index Fund | 246,239 | 221,078 | 15,774 | 11,764 | — | 450,284 |
| Vanguard Total Stock Market | ||||||
| Index Fund | 574,420 | 412,223 | 44,287 | 14,919 | — | 1,049,374 |
| Total | 915,272 | 740,850 | 95,643 | 29,476 | 41 | 1,668,892 |
| 1 Not applicable—Purchases and Sales are for temporary cash investment purposes. | ||||||
G. Management has determined that no material events or transactions occurred subsequent to September 30, 2014, that would require recognition or disclosure in these financial statements.
63
Target Retirement 2060 Fund
Fund Profile
As of September 30, 2014
| Total Fund Characteristics | |
| Ticker Symbol | VTTSX |
| 30-Day SEC Yield | 2.12% |
| Acquired Fund Fees and Expenses1 | 0.18% |
| Allocation to Underlying Vanguard Funds | |
| Vanguard Total Stock Market Index Fund | |
| Investor Shares | 63.0% |
| Vanguard Total International Stock Index | |
| Fund Investor Shares | 27.0 |
| Vanguard Total Bond Market II Index Fund | |
| Investor Shares | 8.0 |
| Vanguard Total International Bond Index | |
| Fund Investor Shares | 2.0 |
Fund Asset Allocation

1 This figure—drawn from the prospectus dated January 27, 2014—represents an estimate of the weighted average of the expense ratios and any
transaction fees charged by the underlying mutual funds (the ”acquired” funds) in which the Target Retirement 2060 Fund invests. The fund does not
charge any expenses or fees of its own. For the fiscal year ended September 30, 2014, the acquired fund fees and expenses were 0.18%.
64
Target Retirement 2060 Fund
Performance Summary
All of the returns in this report represent past performance, which is not a guarantee of future results that may be achieved by the fund. (Current performance may be lower or higher than the performance data cited. For performance data current to the most recent month-end, visit our website at vanguard.com/performance.) Note, too, that both investment returns and principal value can fluctuate widely, so an investor’s shares, when sold, could be worth more or less than their original cost. The returns shown do not reflect taxes that a shareholder would pay on fund distributions or on the sale of fund shares.
Cumulative Performance: January 19, 2012, Through September 30, 2014
Initial Investment of $10,000
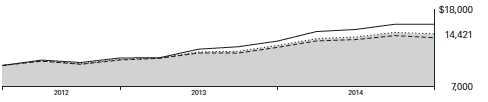
| Average Annual Total Returns | ||||
| Periods Ended September 30, 2014 | ||||
| Since | Final Value | |||
| One | Inception | of a $10,000 | ||
| Year | (1/19/2012) | Investment | ||
| Target Retirement 2060 Fund | 12.72% | 14.54% | $14,421 | |
| •••••••• | Target 2060 Composite Index | 13.04 | 14.77 | 14,499 |
| – – – – | Spliced Mixed-Asset Target 2055+ | |||
| 10.98 | 13.13 | 13,945 | ||
| MSCI Funds US Average Broad Market Index | 17.88 | 18.67 | 15,865 | |
Spliced Mixed-Asset Target 2055+ Funds Average: Derived from data provided by Lipper, a Thomson Reuters Company.
"Since Inception" performance is calculated from the inception date for both the fund and its comparative standards.
See Financial Highlights for dividend and capital gains information.
65
Target Retirement 2060 Fund
Fiscal-Year Total Returns (%): January 19, 2012, Through September 30, 2014

For a benchmark description, see the Glossary.
66
Target Retirement 2060 Fund
Financial Statements
Statement of Net Assets
As of September 30, 2014
The fund reports a complete list of its holdings in regulatory filings four times in each fiscal year, at the quarter-ends. For the second and fourth fiscal quarters, the lists appear in the fund’s semiannual and annual reports to shareholders. For the first and third fiscal quarters, the fund files the lists with the Securities and Exchange Commission on Form N-Q. Shareholders can look up the fund’s Forms N-Q on the SEC’s website at sec.gov. Forms N-Q may also be reviewed and copied at the SEC’s Public Reference Room (see the back cover of this report for further information).
| Market | ||
| Value• | ||
| Shares | ($000) | |
| Investment Companies (100.0%) | ||
| U.S. Stock Fund (63.0%) | ||
| Vanguard Total Stock Market Index Fund Investor Shares | 6,201,133 | 305,530 |
| International Stock Fund (27.0%) | ||
| Vanguard Total International Stock Index Fund Investor Shares | 8,013,544 | 131,101 |
| U.S. Bond Fund (8.0%) | ||
| 1 Vanguard Total Bond Market II Index Fund Investor Shares | 3,632,380 | 39,012 |
| International Bond Fund (2.0%) | ||
| Vanguard Total International Bond Index Fund Investor Shares | 921,057 | 9,579 |
| Total Investment Companies (Cost $440,871) | 485,222 | |
| Temporary Cash Investment (0.1%) | ||
| Money Market Fund (0.1%) | ||
| 1 Vanguard Market Liquidity Fund, 0.109% (Cost $437) | 437,358 | 437 |
| Total Investments (100.1%) (Cost $441,308) | 485,659 | |
| Other Assets and Liabilities (-0.1%) | ||
| Other Assets | 3,646 | |
| Liabilities | (3,895) | |
| (249) | ||
| Net Assets (100%) | ||
| Applicable to 17,320,354 outstanding $.001 par value shares of | ||
| beneficial interest (unlimited authorization) | 485,410 | |
| Net Asset Value Per Share | $28.03 | |
67
Target Retirement 2060 Fund
| At September 30, 2014, net assets consisted of: | |
| Amount | |
| ($000) | |
| Paid-in Capital | 435,369 |
| Undistributed Net Investment Income | 5,769 |
| Accumulated Net Realized Losses | (79) |
| Unrealized Appreciation (Depreciation) | 44,351 |
| Net Assets | 485,410 |
• See Note A in Notes to Financial Statements.
1 Affiliated fund available only to Vanguard funds and certain trusts and accounts managed by Vanguard. Rate shown for Vanguard Market
Liquidity Fund is the 7-day yield.
See accompanying Notes, which are an integral part of the Financial Statements.
68
Target Retirement 2060 Fund
Statement of Operations
| Year Ended | |
| September 30, 2014 | |
| ($000) | |
| Investment Income | |
| Income | |
| Income Distributions Received | 8,027 |
| Net Investment Income—Note B | 8,027 |
| Realized Net Gain (Loss) | |
| Capital Gain Distributions Received | 10 |
| Affiliated Investment Securities Sold | (30) |
| Realized Net Gain (Loss) | (20) |
| Change in Unrealized Appreciation (Depreciation) of Investment Securities | 27,610 |
| Net Increase (Decrease) in Net Assets Resulting from Operations | 35,617 |
See accompanying Notes, which are an integral part of the Financial Statements.
69
Target Retirement 2060 Fund
Statement of Changes in Net Assets
| Year Ended September 30, | ||
| 2014 | 2013 | |
| ($000) | ($000) | |
| Increase (Decrease) in Net Assets | ||
| Operations | ||
| Net Investment Income | 8,027 | 2,846 |
| Realized Net Gain (Loss) | (20) | 141 |
| Change in Unrealized Appreciation (Depreciation) | 27,610 | 15,512 |
| Net Increase (Decrease) in Net Assets Resulting from Operations | 35,617 | 18,499 |
| Distributions | ||
| Net Investment Income | (3,832) | (784) |
| Realized Capital Gain1 | (10) | (15) |
| Total Distributions | (3,842) | (799) |
| Capital Share Transactions | ||
| Issued | 355,026 | 205,842 |
| Issued in Lieu of Cash Distributions | 3,794 | 790 |
| Redeemed | (122,342) | (40,404) |
| Net Increase (Decrease) from Capital Share Transactions | 236,478 | 166,228 |
| Total Increase (Decrease) | 268,253 | 183,928 |
| Net Assets | ||
| Beginning of Period | 217,157 | 33,229 |
| End of Period2 | 485,410 | 217,157 |
as ordinary income dividends for tax purposes.
2 Net Assets—End of Period includes undistributed (overdistributed) net investment income of $5,769,000 and $2,204,000.
See accompanying Notes, which are an integral part of the Financial Statements.
70
Target Retirement 2060 Fund
Financial Highlights
| Jan. 19, | |||
| Year Ended | 20121 to | ||
| September 30, | Sept. 30, | ||
| For a Share Outstanding Throughout Each Period | 2014 | 2013 | 2012 |
| Net Asset Value, Beginning of Period | $25.21 | $21.74 | $20.00 |
| Investment Operations | |||
| Net Investment Income | . 615 2 | .5812 | .218 |
| Capital Gain Distributions Received | .0012 | .0072 | .002 |
| Net Realized and Unrealized Gain (Loss) on Investments | 2.572 | 3.203 | 1.520 |
| Total from Investment Operations | 3.188 | 3.791 | 1.740 |
| Distributions | |||
| Dividends from Net Investment Income | (.367) | (.315) | — |
| Distributions from Realized Capital Gains | (.001) | (.006) | — |
| Total Distributions | (.368) | (.321) | — |
| Net Asset Value, End of Period | $28.03 | $25.21 | $21.74 |
| Total Return3 | 12.72% | 17.69% | 8.70% |
| Ratios/Supplemental Data | |||
| Net Assets, End of Period (Millions) | $485 | $217 | $33 |
| Ratio of Total Expenses to Average Net Assets | — | — | — |
| Acquired Fund Fees and Expenses | 0.18% | 0.18% | 0.18%4 |
| Ratio of Net Investment Income to Average Net Assets | 2.25% | 2.45% | 2.99%4 |
| Portfolio Turnover Rate | 11% | 10% | 40% |
2 Calculated based on average shares outstanding.
3 Total returns do not include account service fees that may have applied in the periods shown. Fund prospectuses provide information about
any applicable account service fees.
4 Annualized.
See accompanying Notes, which are an integral part of the Financial Statements.
71
Target Retirement 2060 Fund
Notes to Financial Statements
Vanguard Target Retirement 2060 Fund is registered under the Investment Company Act of 1940 as an open-end investment company, or mutual fund. The fund follows a balanced investment strategy by investing in selected Vanguard funds to achieve its targeted allocation of assets to U.S. and international stocks, and U.S. and international bonds. Financial statements and other information about each underlying fund are available on vanguard.com.
A. The following significant accounting policies conform to generally accepted accounting principles for U.S. investment companies. The fund consistently follows such policies in preparing its financial statements.
1. Security Valuation: Investments are valued at the net asset value of each underlying Vanguard fund determined as of the close of the New York Stock Exchange (generally 4 p.m., Eastern time) on the valuation date.
2. Federal Income Taxes: The fund intends to continue to qualify as a regulated investment company and distribute all of its taxable income. Management has analyzed the fund’s tax positions taken for all open federal income tax years (September 30, 2012–2014), and has concluded that no provision for federal income tax is required in the fund’s financial statements.
3. Distributions: Distributions to shareholders are recorded on the ex-dividend date.
4. Credit Facility: The fund and certain other funds managed by The Vanguard Group participate in a $2.89 billion committed credit facility provided by a syndicate of lenders pursuant to a credit agreement that may be renewed annually; each fund is individually liable for its borrowings, if any, under the credit facility. Borrowings may be utilized for temporary and emergency purposes, and are subject to the fund’s regulatory and contractual borrowing restrictions. The participating funds are charged administrative fees and an annual commitment fee of 0.06% of the undrawn amount of the facility; these fees are allocated to the funds based on a method approved by the fund’s board of trustees and borne by the funds in which the fund invests (See Note B). Any borrowings under this facility bear interest at a rate equal to the higher of the federal funds rate or LIBOR reference rate plus an agreed-upon spread.
The fund had no borrowings outstanding at September 30, 2014, or at any time during the period then ended.
5. Other: Income and capital gain distributions received are recorded on the ex-dividend date. Security transactions are accounted for on the date securities are bought or sold. Costs used to determine realized gains (losses) on the sale of investment securities are those of the specific securities sold.
B. Under a service agreement, The Vanguard Group furnishes investment advisory, corporate management, administrative, marketing, and distribution services to the fund. The service agreement provides that the fund’s expenses may be reduced or eliminated to the extent of savings realized by the Vanguard funds by the operation of the fund. Accordingly, all incremental expenses for services provided by Vanguard and all other expenses incurred by the fund during the year ended September 30, 2014, were borne by the funds in which the fund invests. The fund’s trustees and officers are also directors and officers of Vanguard and the funds in which the fund invests.
72
Target Retirement 2060 Fund
C. Various inputs may be used to determine the value of the fund’s investments. These inputs are summarized in three broad levels for financial statement purposes. The inputs or methodologies used to value securities are not necessarily an indication of the risk associated with investing in those securities.
Level 1—Quoted prices in active markets for identical securities.
Level 2—Other significant observable inputs (including quoted prices for similar securities, interest rates, prepayment speeds, credit risk, etc.).
Level 3—Significant unobservable inputs (including the fund’s own assumptions used to determine the fair value of investments).
At September 30, 2014, 100% of the market value of the fund’s investments was determined based on Level 1 inputs.
D. Distributions are determined on a tax basis and may differ from net investment income and realized capital gains for financial reporting purposes. Differences may be permanent or temporary. Permanent differences are reclassified among capital accounts in the financial statements to reflect their tax character. Temporary differences arise when certain items of income, expense, gain, or loss are recognized in different periods for financial statement and tax purposes. These differences will reverse at some time in the future. Differences in classification may also result from the treatment of short-term gains as ordinary income for tax purposes.
The fund used a tax accounting practice to treat a portion of the price of capital shares redeemed during the year as distributions from net investment income and realized capital gains. Accordingly, the fund has reclassified $630,000 from undistributed net investment income, and $3,000 from accumulated net realized losses, to paid-in capital.
For tax purposes, at September 30, 2014, the fund had $5,801,000 of ordinary income and $10,000 of long-term capital gains available for distribution.
At September 30, 2014, the cost of investment securities for tax purposes was $441,429,000. Net unrealized appreciation of investment securities for tax purposes was $44,230,000, consisting entirely of unrealized gains on securities that had risen in value since their purchase.
E. Capital shares issued and redeemed were:
| Year Ended September 30, | ||
| 2014 | 2013 | |
| Shares | Shares | |
| (000) | (000) | |
| Issued | 13,041 | 8,760 |
| Issued in Lieu of Cash Distributions | 143 | 37 |
| Redeemed | (4,478) | (1,712) |
| Net Increase (Decrease) in Shares Outstanding | 8,706 | 7,085 |
73
Target Retirement 2060 Fund
F. Transactions during the period in affiliated underlying Vanguard funds were as follows:
| Current Period Transactions | ||||||
| Sept. 30, | Proceeds | Sept. 30, | ||||
| 2013 | from | Capital Gain | 2014 | |||
| Market | Purchases | Securities | Dividend Distributions | Market | ||
| Value | at Cost | Sold | Income | Received | Value | |
| ($000) | ($000) | ($000) | ($000) | ($000) | ($000) | |
| Vanguard Market Liquidity Fund | 219 | NA1 | NA1 | 1 | — | 437 |
| Vanguard Total Bond Market II | ||||||
| Index Fund | 17,247 | 29,929 | 8,576 | 650 | 10 | 39,012 |
| Vanguard Total International | ||||||
| Bond Index Fund | 4,379 | 4,851 | — | 100 | — | 9,579 |
| Vanguard Total International | ||||||
| Stock Index Fund | 58,308 | 81,482 | 7,750 | 3,205 | — | 131,101 |
| Vanguard Total Stock Market | ||||||
| Index Fund | 136,020 | 163,654 | 21,902 | 4,071 | — | 305,530 |
| Total | 216,173 | 279,916 | 38,228 | 8,027 | 10 | 485,659 |
| 1 Not applicable—Purchases and Sales are for temporary cash investment purposes. | ||||||
G. Management has determined that no material events or transactions occurred subsequent to September 30, 2014, that would require recognition or disclosure in these financial statements.
74
Report of Independent Registered Public Accounting Firm
To the Board of Trustees of Vanguard Chester Funds and the Shareholders of Vanguard Target Retirement 2035 Fund, Vanguard Target Retirement 2040 Fund, Vanguard Target Retirement 2045 Fund, Vanguard Target Retirement 2050 Fund, Vanguard Target Retirement 2055 Fund and Vanguard Target Retirement 2060 Fund:
In our opinion, the accompanying statements of net assets and the related statements of operations and of changes in net assets and the financial highlights present fairly, in all material respects, the financial position of Vanguard Target Retirement 2035 Fund, Vanguard Target Retirement 2040 Fund, Vanguard Target Retirement 2045 Fund, Vanguard Target Retirement 2050 Fund, Vanguard Target Retirement 2055 Fund and Vanguard Target Retirement 2060 Fund (constituting separate portfolios of Vanguard Chester Funds, hereafter referred to as the “Funds”) at September 30, 2014, the results of each of their operations for the year then ended, the changes in each of their net assets for each of the two years in the period then ended, and the financial highlights for each of the periods indicated, in conformity with accounting principles generally accepted in the United States of America. These financial statements and financial highlights (hereafter referred to as “financial statements”) are the responsibility of the Funds’ management. Our responsibility is to express an opinion on these financial statements based on our audits. We conducted our audits of these financial statements in accordance with the standards of the Public Company Accounting Oversight Board (United States). Those standards require that we plan and perform the audit to obtain reasonable assurance about whether the financial statements are free of material misstatement. An audit includes examining, on a test basis, evidence supporting the amounts and disclosures in the financial statements, assessing the accounting principles used and significant estimates made by management, and evaluating the overall financial statement presentation. We believe that our audits, which included confirmation of securities at September 30, 2014 by agreement to the underlying ownership records of the transfer agent, provide a reasonable basis for our opinion.
/s/PricewaterhouseCoopers LLP
Philadelphia, Pennsylvania
November 10, 2014
Special 2014 tax information (unaudited) for Vanguard Target Retirement Funds
This information for the fiscal year ended September 30, 2014, is included pursuant to provisions of the Internal Revenue Code.
For non-resident alien shareholders, 100% of short-term capital gain dividends distributed by Target Retirement 2040 Fund are qualified short-term capital gains.
The funds distributed capital gain dividends (from net long-term capital gains) to shareholders during the fiscal year as follows:
| Fund | ($000) |
| Target Retirement 2035 Fund | — |
| Target Retirement 2040 Fund | 2,806 |
| Target Retirement 2045 Fund | — |
| Target Retirement 2050 Fund | — |
| Target Retirement 2055 Fund | 148 |
| Target Retirement 2060 Fund | 12 |
75
The funds distributed qualified dividend income to shareholders during the fiscal year as follows:
| Fund | ($000) |
| Target Retirement 2035 Fund | 283,398 |
| Target Retirement 2040 Fund | 176,105 |
| Target Retirement 2045 Fund | 176,770 |
| Target Retirement 2050 Fund | 81,807 |
| Target Retirement 2055 Fund | 13,080 |
| Target Retirement 2060 Fund | 2,901 |
For corporate shareholders, the percentage of investment income (dividend income plus short-term gains, if any) that qualifies for the dividends-received deduction is as follows:
| Fund | Percentage |
| Target Retirement 2035 Fund | 43.0% |
| Target Retirement 2040 Fund | 44.9 |
| Target Retirement 2045 Fund | 45.7 |
| Target Retirement 2050 Fund | 45.7 |
| Target Retirement 2055 Fund | 45.8 |
| Target Retirement 2060 Fund | 45.7 |
The funds designate to shareholders foreign source income and foreign taxes paid as follows:
| Foreign Source Income | Foreign Taxes Paid | |
| Fund | ($000) | ($000) |
| Target Retirement 2035 Fund | 176,439 | 10,189 |
| Target Retirement 2040 Fund | 123,650 | 7,140 |
| Target Retirement 2045 Fund | 114,618 | 6,619 |
| Target Retirement 2050 Fund | 56,812 | 3,281 |
| Target Retirement 2055 Fund | 11,655 | 673 |
| Target Retirement 2060 Fund | 3,175 | 183 |
Shareholders will receive more detailed information with their Form 1099-DIV in January 2015 to determine the calendar-year amounts to be included on their 2014 tax returns.
76
Your Fund’s After-Tax Returns
This table presents returns for your fund both before and after taxes. The after-tax returns are shown in two ways: (1) assuming that an investor owned the fund during the entire period and paid taxes on the fund’s distributions, and (2) assuming that an investor paid taxes on the fund’s distributions and sold all shares at the end of each period.
Calculations are based on the highest individual federal income tax and capital gains tax rates in effect at the times of the distributions and the hypothetical sales. State and local taxes were not considered. After-tax returns reflect any qualified dividend income, using actual prior-year figures and estimates for 2014. (In the example, returns after the sale of fund shares may be higher than those assuming no sale. This occurs when the sale would have produced a capital loss. The calculation assumes that the investor received a tax deduction for the loss.)
Please note that your actual after-tax returns will depend on your tax situation and may differ from those shown. Also note that if you own the fund in a tax-deferred account, such as an individual retirement account or a 401(k) plan, this information does not apply to you. Such accounts are not subject to current taxes.
Finally, keep in mind that a fund’s performance—whether before or after taxes—does not guarantee future results.
| Average Annual Total Returns: Target Retirement Funds | |||
| Periods Ended September 30, 2014 | |||
| One | Five | Ten | |
| Year | Years | Years | |
| Target Retirement 2035 Fund | |||
| Returns Before Taxes | 12.20% | 11.82% | 7.20% |
| Returns After Taxes on Distributions | 11.60 | 11.33 | 6.74 |
| Returns After Taxes on Distributions and Sale of Fund Shares | 7.19 | 9.39 | 5.76 |
| Since | |||
| One | Five | Inception | |
| Year | Years | (6/7/2006) | |
| Target Retirement 2040 Fund | |||
| Returns Before Taxes | 12.66% | 12.11% | 6.79% |
| Returns After Taxes on Distributions | 12.12 | 11.64 | 6.39 |
| Returns After Taxes on Distributions and Sale of Fund Shares | 7.46 | 9.62 | 5.37 |
| One | Five | Ten | |
| Year | Years | Years | |
| Target Retirement 2045 Fund | |||
| Returns Before Taxes | 12.73% | 12.14% | 7.61% |
| Returns After Taxes on Distributions | 12.16 | 11.63 | 7.16 |
| Returns After Taxes on Distributions and Sale of Fund Shares | 7.51 | 9.64 | 6.11 |
77
| Average Annual Total Returns: Target Retirement Funds | ||||
| Periods Ended September 30, 2014 | ||||
| Since | ||||
| One | Five | Inception | ||
| Year | Years | (6/7/2006) | ||
| Target Retirement 2050 Fund | ||||
| Returns Before Taxes | 12.69% | 12.12% | 6.85% | |
| Returns After Taxes on Distributions | 12.11 | 11.61 | 6.42 | |
| Returns After Taxes on Distributions and Sale of Fund Shares | 7.46 | 9.62 | 5.42 | |
| Since | ||||
| One | Inception | |||
| Year | (8/18/2010) | |||
| Target Retirement 2055 Fund | ||||
| Returns Before Taxes | 12.69% | 13.63% | ||
| Returns After Taxes on Distributions | 12.20 | 13.26 | ||
| Returns After Taxes on Distributions and Sale of Fund Shares | 7.44 | 10.79 | ||
| Since | ||||
| One | Inception | |||
| Year | (1/19/2012) | |||
| Target Retirement 2060 Fund | ||||
| Returns Before Taxes | 12.72% | 14.54% | ||
| Returns After Taxes on Distributions | 12.31 | 14.27 | ||
| Returns After Taxes on Distributions and Sale of Fund Shares | 7.43 | 11.35 | ||
78
About Your Fund’s Expenses
As a shareholder of the fund, you incur ongoing costs, which include costs for portfolio management, administrative services, and shareholder reports (like this one), among others. Operating expenses, which are deducted from a fund’s gross income, directly reduce the investment return of the fund.
A typical fund’s expenses are expressed as a percentage of its average net assets. The Target Retirement Funds have no direct expenses, but each fund bears its proportionate share of the costs for the underlying funds in which it invests. These indirect expenses make up the acquired fund fees and expenses, also expressed as a percentage of average net assets.
The following examples are intended to help you understand the ongoing cost (in dollars) of investing in your fund and to compare these costs with those of other mutual funds. The examples are based on an investment of $1,000 made at the beginning of the period shown and held for the entire period. The costs were calculated using the acquired fund fees and expenses for each Target Retirement Fund.
The accompanying table illustrates your fund’s costs in two ways:
• Based on actual fund return. This section helps you to estimate the actual expenses that you paid over the period. The ”Ending Account Value“ shown is derived from the fund‘s actual return, and the third column shows the dollar amount that would have been paid by an investor who started with $1,000 in the fund. You may use the information here, together with the amount you invested, to estimate the expenses that you paid over the period.
To do so, simply divide your account value by $1,000 (for example, an $8,600 account value divided by $1,000 = 8.6), then multiply the result by the number given for your fund under the heading ”Expenses Paid During Period.“
• Based on hypothetical 5% yearly return. This section is intended to help you compare your fund‘s costs with those of other mutual funds. It assumes that the fund had a yearly return of 5% before expenses, but that the expense ratio is unchanged. In this case—because the return used is not the fund’s actual return—the results do not apply to your investment. The example is useful in making comparisons because the Securities and Exchange Commission requires all mutual funds to calculate expenses based on a 5% return. You can assess your fund’s costs by comparing this hypothetical example with the hypothetical examples that appear in shareholder reports of other funds.
Note that the expenses shown in the table are meant to highlight and help you compare ongoing costs only and do not reflect transaction costs incurred by the fund for buying and selling securities. Further, the expenses do not include any purchase, redemption, or account service fees described in the fund prospectus. If such fees were applied to your account, your costs would be higher. Your fund does not carry a “sales load.”
The calculations assume no shares were bought or sold during the period. Your actual costs may have been higher or lower, depending on the amount of your investment and the timing of any purchases or redemptions.
You can find more information about the fund’s expenses, including annual expense ratios, in the Financial Statements section of this report. For additional information on operating expenses and other shareholder costs, please refer to your fund’s current prospectus.
79
| Six Months Ended September 30, 2014 | |||
| Beginning | Ending | Expenses | |
| Account Value | Account Value | Paid During | |
| 3/31/2014 | 9/30/2014 | Period | |
| Based on Actual Fund Return | |||
| Target Retirement 2035 Fund | $1,000.00 | $1,030.11 | $0.92 |
| Target Retirement 2040 Fund | $1,000.00 | $1,030.22 | $0.92 |
| Target Retirement 2045 Fund | $1,000.00 | $1,030.45 | $0.92 |
| Target Retirement 2050 Fund | $1,000.00 | $1,030.36 | $0.92 |
| Target Retirement 2055 Fund | $1,000.00 | $1,030.13 | $0.92 |
| Target Retirement 2060 Fund | $1,000.00 | $1,030.51 | $0.92 |
| Based on Hypothetical 5% Yearly Return | |||
| Target Retirement 2035 Fund | $1,000.00 | $1,024.17 | $0.91 |
| Target Retirement 2040 Fund | $1,000.00 | $1,024.17 | $0.91 |
| Target Retirement 2045 Fund | $1,000.00 | $1,024.17 | $0.91 |
| Target Retirement 2050 Fund | $1,000.00 | $1,024.17 | $0.91 |
| Target Retirement 2055 Fund | $1,000.00 | $1,024.17 | $0.91 |
| Target Retirement 2060 Fund | $1,000.00 | $1,024.17 | $0.91 |
figures for the period are (in order as listed from top to bottom above) 0.18%, 0.18%, 0.18%, 0.18%, 0.18%, and 0.18%. The dollar amounts
shown as ”Expenses Paid” are equal to the annualized average weighted expense ratio for the underlying funds multiplied by the average
account value over the period, multiplied by the number of days in the most recent six-month period, then divided by the number of days in
the most recent 12-month period.
80
Glossary
30-Day SEC Yield. A fund’s 30-day SEC yield is derived using a formula specified by the U.S. Securities and Exchange Commission. Under the formula, data related to the fund’s security holdings in the previous 30 days are used to calculate the fund’s hypothetical net income for that period, which is then annualized and divided by the fund’s estimated average net assets over the calculation period. For the purposes of this calculation, a security’s income is based on its current market yield to maturity (for bonds), its actual income (for asset-backed securities), or its projected dividend yield (for stocks). Because the SEC yield represents hypothetical annualized income, it will differ—at times significantly—from the fund’s actual experience. As a result, the fund’s income distributions may be higher or lower than implied by the SEC yield.
Acquired Fund Fees and Expenses. Funds that invest in other Vanguard funds incur no direct expenses, but they do bear proportionate shares of the operating, administrative, and advisory expenses of the underlying funds, and they must pay any fees charged by those funds. The figure for acquired fund fees and expenses represents a weighted average of these underlying costs. Acquired is a term that the Securities and Exchange Commission applies to any mutual fund whose shares are owned by another fund.
Beta. A measure of the magnitude of a fund’s past share-price fluctuations in relation to the ups and downs of a given market index. The index is assigned a beta of 1.00. Compared with a given index, a fund with a beta of 1.20 typically would have seen its share price rise or fall by 12% when the index rose or fell by 10%. For this report, beta is based on returns over the past 36 months for both the fund and the index. Note that a fund’s beta should be reviewed in conjunction with its R-squared (see definition). The lower the R-squared, the less correlation there is between the fund and the index, and the less reliable beta is as an indicator of volatility.
Expense Ratio. A fund’s total annual operating expenses expressed as a percentage of the fund’s average net assets. The expense ratio includes management and administrative expenses, but does not include the transaction costs of buying and selling portfolio securities.
Inception Date. The date on which the assets of a fund (or one of its share classes) are first invested in accordance with the fund’s investment objective. For funds with a subscription period, the inception date is the day after that period ends. Investment performance is measured from the inception date.
R-Squared. A measure of how much of a fund’s past returns can be explained by the returns from the market in general, as measured by a given index. If a fund’s total returns were precisely synchronized with an index’s returns, its R-squared would be 1.00. If the fund’s returns bore no relationship to the index’s returns, its R-squared would be 0. For this report, R-squared is based on returns over the past 36 months for both the fund and the index.
Benchmark Information
Spliced Mixed-Asset Target 2055+ Funds Average: Mixed-Asset Target 2050 Funds Average through August 31, 2013; Mixed-Asset Target 2055+ Funds Average thereafter.
81
Target 2035 Composite Index: Derived by applying the fund’s target asset allocation to the results of the following benchmarks: for international stocks of developed markets, the MSCI EAFE Index through December 15, 2010, the MSCI ACWI ex USA IMI Index through June 2, 2013, and the FTSE Global All Cap ex US Index thereafter; for emerging-market stocks, the Select Emerging Markets Index through August 23, 2006, the MSCI Emerging Markets Index through December 15, 2010, the MSCI ACWI ex USA IMI Index through June 2, 2013, and the FTSE Global All Cap ex US Index thereafter; for U.S. bonds, the Barclays U.S. Aggregate Bond Index through December 31, 2009, and the Barclays U.S. Aggregate Float Adjusted Index thereafter; for international bonds, the Barclays Global Aggregate ex-USD Float Adjusted RIC Capped Index beginning June 3, 2013; and for U.S. stocks, the Dow Jones U.S. Total Stock Market Index (formerly known as the Dow Jones Wilshire 5000 Index) through April 22, 2005, the MSCI US Broad Market Index through June 2, 2013, and the CRSP US Total Market Index thereafter. International stock benchmark returns are adjusted for withholding taxes.
Target 2040 Composite Index: Derived by applying the fund’s target asset allocation to the results of the following benchmarks: for international stocks of developed markets, the MSCI EAFE Index through December 15, 2010, the MSCI ACWI ex USA IMI Index through June 2, 2013, and the FTSE Global All Cap ex US Index thereafter; for emerging-market stocks, the Select Emerging Markets Index through August 23, 2006, the MSCI Emerging Markets Index through December 15, 2010, the MSCI ACWI ex USA IMI Index through June 2, 2013, and the FTSE Global All Cap ex US Index thereafter; for U.S. bonds, the Barclays U.S. Aggregate Bond Index through December 31, 2009, and the Barclays U.S. Aggregate Float Adjusted Index thereafter; for international bonds, the Barclays Global Aggregate ex-USD Float Adjusted RIC Capped Index beginning June 3, 2013; and for U.S. stocks, the MSCI US Broad Market Index through June 2, 2013, and the CRSP US Total Market Index thereafter. International stock benchmark returns are adjusted for withholding taxes.
Target 2045 Composite Index: Derived by applying the fund’s target asset allocation to the results of the following benchmarks: for international stocks of developed markets, the MSCI EAFE Index through December 15, 2010, the MSCI ACWI ex USA IMI Index through June 2, 2013, and the FTSE Global All Cap ex US Index thereafter; for emerging-market stocks, the Select Emerging Markets Index through August 23, 2006, the MSCI Emerging Markets Index through December 15, 2010, the MSCI ACWI ex USA IMI Index through June 2, 2013, and the FTSE Global All Cap ex US Index thereafter; for U.S. bonds, the Barclays U.S. Aggregate Bond Index through December 31, 2009, and the Barclays U.S. Aggregate Float Adjusted Index thereafter; for international bonds, the Barclays Global Aggregate ex-USD Float Adjusted RIC Capped Index beginning June 3, 2013; and for U.S. stocks, the Dow Jones U.S. Total Stock Market Index (formerly known as the Dow Jones Wilshire 5000 Index) through April 22, 2005, the MSCI US Broad Market Index through June 2, 2013, and the CRSP US Total Market Index thereafter. International stock benchmark returns are adjusted for withholding taxes.
82
Target 2050 Composite Index: Derived by applying the fund’s target asset allocation to the results of the following benchmarks: for international stocks of developed markets, the MSCI EAFE Index through December 15, 2010, the MSCI ACWI ex USA IMI Index through June 2, 2013, and the FTSE Global All Cap ex US Index thereafter; for emerging-market stocks, the Select Emerging Markets Index through August 23, 2006, the MSCI Emerging Markets Index through December 15, 2010, the MSCI ACWI ex USA IMI Index through June 2, 2013, and the FTSE Global All Cap ex US Index thereafter; for U.S. bonds, the Barclays U.S. Aggregate Bond Index through December 31, 2009, and the Barclays U.S. Aggregate Float Adjusted Index thereafter; for international bonds, the Barclays Global Aggregate ex-USD Float Adjusted RIC Capped Index beginning June 3, 2013; and for U.S. stocks, the MSCI US Broad Market Index through June 2, 2013, and the CRSP US Total Market Index thereafter. International stock benchmark returns are adjusted for withholding taxes.
Target 2055 Composite Index: Derived by applying the fund’s target asset allocation to the results of the following benchmarks: for international stocks of developed markets, the MSCI EAFE Index through December 15, 2010, the MSCI ACWI ex USA IMI Index through June 2, 2013, and the FTSE Global All Cap ex US Index thereafter; for emerging-market stocks, the MSCI Emerging Markets Index through December 15, 2010, the MSCI ACWI ex USA IMI Index through June 2, 2013, and the FTSE Global All Cap ex US Index thereafter; for U.S. bonds, the Barclays U.S. Aggregate Float Adjusted Index; for international bonds, the Barclays Global Aggregate ex-USD Float Adjusted RIC Capped Index beginning June 3, 2013; and for U.S. stocks, the MSCI US Broad Market Index through June 2, 2013, and the CRSP US Total Market Index thereafter. International stock benchmark returns are adjusted for withholding taxes.
Target 2060 Composite Index: Derived by applying the fund’s target asset allocation to the results of the following benchmarks: for international stocks of developed markets, the MSCI ACWI ex USA IMI Index through June 2, 2013, and the FTSE Global All Cap ex US Index thereafter; for emerging-market stocks, the MSCI ACWI ex USA IMI Index through June 2, 2013, and the FTSE Global All Cap ex US Index thereafter; for U.S. bonds, the Barclays U.S. Aggregate Float Adjusted Index; for international bonds, the Barclays Global Aggregate ex-USD Float Adjusted RIC Capped Index beginning June 3, 2013; and for U.S. stocks, the MSCI US Broad Market Index through June 2, 2013, and the CRSP US Total Market Index thereafter. International stock benchmark returns are adjusted for withholding taxes.
83
The People Who Govern Your Fund
The trustees of your mutual fund are there to see that the fund is operated and managed in your best interests since, as a shareholder, you are a part owner of the fund. Your fund’s trustees also serve on the board of directors of The Vanguard Group, Inc., which is owned by the Vanguard funds and provides services to them on an at-cost basis.
A majority of Vanguard’s board members are independent, meaning that they have no affiliation with Vanguard or the funds they oversee, apart from the sizable personal investments they have made as private individuals. The independent board members have distinguished backgrounds in business, academia, and public service. Each of the trustees and executive officers oversees 177 Vanguard funds.
The following table provides information for each trustee and executive officer of the fund. More information about the trustees is in the Statement of Additional Information, which can be obtained, without charge, by contacting Vanguard at 800-662-7447, or online at vanguard.com.
| InterestedTrustee1 | and Delphi Automotive LLP (automotive components); |
| Senior Advisor at New Mountain Capital. | |
| F. William McNabb III | |
| Born 1957. Trustee Since July 2009. Chairman of the | Amy Gutmann |
| Board. Principal Occupation(s) During the Past Five | Born 1949. Trustee Since June 2006. Principal |
| Years: Chairman of the Board of The Vanguard Group, | Occupation(s) During the Past Five Years: President of |
| Inc., and of each of the investment companies served | the University of Pennsylvania; Christopher H. Browne |
| by The Vanguard Group, since January 2010; Director | Distinguished Professor of Political Science, School of |
| of The Vanguard Group since 2008; Chief Executive | Arts and Sciences, and Professor of Communication, |
| Officer and President of The Vanguard Group, and of | Annenberg School for Communication, with secondary |
| each of the investment companies served by The | faculty appointments in the Department of Philosophy, |
| Vanguard Group, since 2008; Director of Vanguard | School of Arts and Sciences, and at the Graduate |
| Marketing Corporation; Managing Director of The | School of Education, University of Pennsylvania; |
| Vanguard Group (1995–2008). | Trustee of the National Constitution Center; Chair |
| of the Presidential Commission for the Study of | |
| Bioethical Issues. | |
| IndependentTrustees | |
| JoAnn Heffernan Heisen | |
| Emerson U. Fullwood | Born 1950. Trustee Since July 1998. Principal |
| Born 1948. Trustee Since January 2008. Principal | Occupation(s) During the Past Five Years: Corporate |
| Occupation(s) During the Past Five Years: Executive | Vice President and Chief Global Diversity Officer |
| Chief Staff and Marketing Officer for North America | (retired 2008) and Member of the Executive |
| and Corporate Vice President (retired 2008) of Xerox | Committee (1997–2008) of Johnson & Johnson |
| Corporation (document management products and | (pharmaceuticals/medical devices/consumer |
| services); Executive in Residence and 2009–2010 | products); Director of Skytop Lodge Corporation |
| Distinguished Minett Professor at the Rochester | (hotels), the University Medical Center at Princeton, |
| Institute of Technology; Director of SPX Corporation | the Robert Wood Johnson Foundation, and the Center |
| (multi-industry manufacturing), the United Way of | for Talent Innovation; Member of the Advisory Board |
| Rochester, Amerigroup Corporation (managed health | of the Maxwell School of Citizenship and Public Affairs |
| care), the University of Rochester Medical Center, | at Syracuse University. |
| Monroe Community College Foundation, and North | |
| Carolina A&T University. | F. Joseph Loughrey |
| Born 1949. Trustee Since October 2009. Principal | |
| Rajiv L. Gupta | Occupation(s) During the Past Five Years: President |
| Born 1945. Trustee Since December 2001.2 | and Chief Operating Officer (retired 2009) of Cummins |
| Principal Occupation(s) During the Past Five Years: | Inc. (industrial machinery); Chairman of the Board |
| Chairman and Chief Executive Officer (retired 2009) | of Hillenbrand, Inc. (specialized consumer services), |
| and President (2006–2008) of Rohm and Haas Co. | and of Oxfam America; Director of SKF AB (industrial |
| (chemicals); Director of Tyco International, Ltd. | machinery), Hyster-Yale Materials Handling, Inc. |
| (diversified manufacturing and services), Hewlett- | (forklift trucks), the Lumina Foundation for Education, |
| Packard Co. (electronic computer manufacturing), |
| and the V Foundation for Cancer Research; Member | Executive Officers | |
| of the Advisory Council for the College of Arts and | ||
| Letters and of the Advisory Board to the Kellogg | Glenn Booraem | |
| Institute for International Studies, both at the | Born 1967. Controller Since July 2010. Principal | |
| University of Notre Dame. | Occupation(s) During the Past Five Years: Principal | |
| of The Vanguard Group, Inc.; Controller of each of | ||
| Mark Loughridge | the investment companies served by The Vanguard | |
| Born 1953. Trustee Since March 2012. Principal | Group; Assistant Controller of each of the investment | |
| Occupation(s) During the Past Five Years: Senior Vice | companies served by The Vanguard Group (2001–2010). | |
| President and Chief Financial Officer (retired 2013) | ||
| at IBM (information technology services); Fiduciary | Thomas J. Higgins | |
| Member of IBM’s Retirement Plan Committee (2004– | Born 1957. Chief Financial Officer Since September | |
| 2013); Member of the Council on Chicago Booth. | 2008. Principal Occupation(s) During the Past Five | |
| Years: Principal of The Vanguard Group, Inc.; Chief | ||
| Scott C. Malpass | Financial Officer of each of the investment companies | |
| Born 1962. Trustee Since March 2012. Principal | served by The Vanguard Group; Treasurer of each of | |
| Occupation(s) During the Past Five Years: Chief | the investment companies served by The Vanguard | |
| Investment Officer and Vice President at the University | Group (1998–2008). | |
| of Notre Dame; Assistant Professor of Finance at the | ||
| Mendoza College of Business at Notre Dame; Member | Kathryn J. Hyatt | |
| of the Notre Dame 403(b) Investment Committee; | Born 1955. Treasurer Since November 2008. Principal | |
| Board Member of TIFF Advisory Services, Inc. | Occupation(s) During the Past Five Years: Principal of | |
| (investment advisor); Member of the Investment | The Vanguard Group, Inc.; Treasurer of each of the | |
| Advisory Committees of the Financial Industry | investment companies served by The Vanguard | |
| Regulatory Authority (FINRA) and of Major League | Group; Assistant Treasurer of each of the investment | |
| Baseball. | companies served by The Vanguard Group (1988–2008). | |
| André F. Perold | Heidi Stam | |
| Born 1952. Trustee Since December 2004. Principal | Born 1956. Secretary Since July 2005. Principal | |
| Occupation(s) During the Past Five Years: George | Occupation(s) During the Past Five Years: Managing | |
| Gund Professor of Finance and Banking, Emeritus | Director of The Vanguard Group, Inc.; General Counsel | |
| at the Harvard Business School (retired 2011); | of The Vanguard Group; Secretary of The Vanguard | |
| Chief Investment Officer and Managing Partner of | Group and of each of the investment companies | |
| HighVista Strategies LLC (private investment firm); | served by The Vanguard Group; Director and Senior | |
| Director of Rand Merchant Bank; Overseer of the | Vice President of Vanguard Marketing Corporation. | |
| Museum of Fine Arts Boston. | ||
| Vanguard Senior ManagementTeam | ||
| Alfred M. Rankin, Jr. | ||
| Born 1941. Trustee Since January 1993. Principal | Mortimer J. Buckley | Chris D. McIsaac |
| Occupation(s) During the Past Five Years: Chairman, | Kathleen C. Gubanich | Michael S. Miller |
| President, and Chief Executive Officer of NACCO | Paul A. Heller | James M. Norris |
| Industries, Inc. (housewares/lignite), and of Hyster- | Martha G. King | Glenn W. Reed |
| Yale Materials Handling, Inc. (forklift trucks); Chairman | John T. Marcante | |
| of the Board of University Hospitals of Cleveland. | ||
| Peter F. Volanakis | Chairman Emeritus and Senior Advisor | |
| Born 1955. Trustee Since July 2009. Principal | ||
| Occupation(s) During the Past Five Years: President | John J. Brennan | |
| and Chief Operating Officer (retired 2010) of Corning | Chairman, 1996–2009 | |
| Incorporated (communications equipment); Trustee of | Chief Executive Officer and President, 1996–2008 | |
| Colby-Sawyer College; Member of the Advisory Board | ||
| of the Norris Cotton Cancer Center and of the Advisory | Founder | |
| Board of the Parthenon Group (strategy consulting). | ||
| John C. Bogle | ||
| Chairman and Chief Executive Officer, 1974–1996 | ||
1 Mr. McNabb is considered an “interested person,” as defined in the Investment Company Act of 1940, because he is an officer of the
Vanguard funds.
2 December 2002 for Vanguard Equity Income Fund, the Vanguard Municipal Bond Funds, and the Vanguard State Tax-Exempt Funds.
| |
P.O. Box 2600 | |
| Valley Forge, PA 19482-2600 | |
| Connect with Vanguard® > vanguard.com | |
| Fund Information > 800-662-7447 | |
| Direct Investor Account Services > 800-662-2739 | |
| Institutional Investor Services > 800-523-1036 | |
| Text Telephone for People | |
| Who Are Deaf or Hard of Hearing> 800-749-7273 | |
| This material may be used in conjunction | |
| with the offering of shares of any Vanguard | |
| fund only if preceded or accompanied by | |
| the fund’s current prospectus. | |
| All comparative mutual fund data are from Lipper, a | |
| Thomson Reuters Company, or Morningstar, Inc., unless | |
| otherwise noted. | |
| You can obtain a free copy of Vanguard’s proxy voting | |
| guidelines by visiting vanguard.com/proxyreporting or by | |
| calling Vanguard at 800-662-2739. The guidelines are | |
| also available from the SEC’s website, sec.gov. In | |
| addition, you may obtain a free report on how your fund | |
| voted the proxies for securities it owned during the 12 | |
| months ended June 30. To get the report, visit either | |
| vanguard.com/proxyreporting or sec.gov. | |
| You can review and copy information about your fund at | |
| the SEC’s Public Reference Room in Washington, D.C. To | |
| find out more about this public service, call the SEC at | |
| 202-551-8090. Information about your fund is also | |
| available on the SEC’s website, and you can receive | |
| copies of this information, for a fee, by sending a | |
| request in either of two ways: via e-mail addressed to | |
| publicinfo@sec.gov or via regular mail addressed to the | |
| Public Reference Section, Securities and Exchange | |
| Commission, Washington, DC 20549-1520. | |
| © 2014 The Vanguard Group, Inc. | |
| All rights reserved. | |
| Vanguard Marketing Corporation, Distributor. | |
| Q3080B 112014 | |

Item 2: Code of Ethics. The Registrant has adopted a code of ethics that applies to the Registrant’s principal executive officer, principal financial officer, principal accounting officer or controller or persons performing similar functions. The Code of Ethics was amended during the reporting period covered by this report to make certain technical, non-material changes.
Item 3: Audit Committee Financial Expert. The following members of the Audit Committee have been determined by the Registrant’s Board of Trustees to be Audit Committee Financial Experts serving on its Audit Committee, and to be independent: Rajiv L. Gupta, Amy Gutmann, JoAnn Heffernan Heisen, F. Joseph Loughrey, Mark Loughridge, Scott C. Malpass, André F. Perold, and Alfred M. Rankin, Jr.
Item 4: Principal Accountant Fees and Services.
(a) Audit Fees.
Audit Fees of the Registrant
Fiscal Year Ended September 30, 2014: $448,000
Fiscal Year Ended September 30, 2013: $287,000
Aggregate Audit Fees of Registered Investment Companies in the Vanguard Group.
Fiscal Year Ended September 30, 2014: $6,605,127
Fiscal Year Ended September 30, 2013: $5,714,113
Includes fees billed in connection with audits of the Registrant, other registered investment companies in the Vanguard complex, The Vanguard Group, Inc. and Vanguard Marketing Corporation.
(b) Audit-Related Fees.
Fiscal Year Ended September 30, 2014: $2,176,479
Fiscal Year Ended September 30, 2013: $1,552,950
Includes fees billed in connection with assurance and related services provided to the Registrant, other registered investment companies in the Vanguard complex, The Vanguard Group, Inc., and Vanguard Marketing Corporation.
(c) Tax Fees.
Fiscal Year Ended September 30, 2014: $316,869
Fiscal Year Ended September 30, 2013: $110,000
Includes fees billed in connection with tax compliance, planning, and advice services provided to the Registrant, other registered investment companies in the Vanguard complex, The Vanguard Group, Inc., and Vanguard Marketing Corporation.
(d) All Other Fees.
Fiscal Year Ended September 30, 2014: $198,163
Fiscal Year Ended September 30, 2013: $132,000
Includes fees billed for services related to tax reported information provided to the Registrant, other registered investment companies in the Vanguard complex, The Vanguard Group, Inc., and Vanguard Marketing Corporation.
(e) (1) Pre-Approval Policies. The policy of the Registrant’s Audit Committee is to consider and, if appropriate, approve before the principal accountant is engaged for such services, all specific audit and non-audit services provided to: the Registrant, other registered investment companies in the Vanguard complex, The Vanguard Group, Inc., and entities controlled by The Vanguard Group, Inc. that provide ongoing services to the Registrant. In making a determination, the Audit Committee considers whether the services are consistent with maintaining the principal accountant’s independence.
In the event of a contingency situation in which the principal accountant is needed to provide services in between scheduled Audit Committee meetings, the Chairman of the Audit Committee would be called on to consider and, if appropriate, pre-approve audit or permitted non-audit services in an amount sufficient to complete services through the next Audit Committee meeting, and to determine if such services would be consistent with maintaining the accountant’s independence. At the next scheduled Audit Committee meeting, services and fees would be presented to the Audit Committee for formal consideration, and, if appropriate, approval by the entire Audit Committee. The Audit Committee would again consider whether such services and fees are consistent with maintaining the principal accountant’s independence.
The Registrant’s Audit Committee is informed at least annually of all audit and non-audit services provided by the principal accountant to the Vanguard complex, whether such services are provided to: the Registrant, other registered investment companies in the Vanguard complex, The Vanguard Group, Inc., or other entities controlled by The Vanguard Group, Inc. that provide ongoing services to the Registrant.
(2) No percentage of the principal accountant’s fees or services were approved pursuant to the waiver provision of paragraph (c)(7)(i)(C) of Rule 2-01 of Regulation S-X.
(f) For the most recent fiscal year, over 50% of the hours worked under the principal accountant’s engagement were not performed by persons other than full-time, permanent employees of the principal accountant.
(g) Aggregate Non-Audit Fees.
Fiscal Year Ended September 30, 2014: $515,032
Fiscal Year Ended September 30, 2013: $242,000
Includes fees billed for non-audit services provided to the Registrant, other registered investment companies in the Vanguard complex, The Vanguard Group, Inc., and Vanguard Marketing Corporation.
(h) For the most recent fiscal year, the Audit Committee has determined that the provision of all non-audit services was consistent with maintaining the principal accountant’s independence.
Item 5: Audit Committee of Listed Registrants.
Not Applicable.
Item 6: Investments.
Not Applicable.
Item 7: Disclosure of Proxy Voting Policies and Procedures for Closed-End Management Investment Companies.
Not Applicable.
Item 8: Portfolio Managers of Closed-End Management Investment Companies.
Not Applicable.
Item 9: Purchase of Equity Securities by Closed-End Management Investment Company and Affiliated Purchasers.
Not Applicable.
Item 10: Submission of Matters to a Vote of Security Holders.
Not Applicable.
Item 11: Controls and Procedures.
(a) Disclosure Controls and Procedures. The Principal Executive and Financial Officers concluded that the Registrant’s Disclosure Controls and Procedures are effective based on their evaluation of the Disclosure Controls and Procedures as of a date within 90 days of the filing date of this report.
(b) Internal Control Over Financial Reporting. There were no significant changes in Registrant’s Internal Control Over Financial Reporting or in other factors that could significantly affect this control subsequent to the date of the evaluation, including any corrective actions with regard to significant deficiencies and material weaknesses.
Item 12: Exhibits.
(a) Code of Ethics.
(b) Certifications.
Pursuant to the requirements of the Securities Exchange Act of 1934 and the Investment Company Act of 1940, the registrant has duly caused this report to be signed on its behalf by the undersigned, thereunto duly authorized.
| VANGUARD CHESTER FUNDS | |
| BY: | /s/ F. WILLIAM MCNABB III* |
| F. WILLIAM MCNABB III | |
| CHIEF EXECUTIVE OFFICER | |
| Date: November 19, 2014 | |
Pursuant to the requirements of the Securities Exchange Act of 1934 and the Investment Company Act of 1940, this report has been signed below by the following persons on behalf of the registrant and in the capacities and on the dates indicated.
| VANGUARD CHESTER FUNDS | |
| BY: | /s/ F. WILLIAM MCNABB III* |
| F. WILLIAM MCNABB III | |
| CHIEF EXECUTIVE OFFICER | |
| Date: November 19, 2014 | |
| VANGUARD CHESTER FUNDS | |
| BY: | /s/ THOMAS J. HIGGINS* |
| THOMAS J. HIGGINS | |
| CHIEF FINANCIAL OFFICER | |
| Date: November 19, 2014 | |
* By: /s/ Heidi Stam
Heidi Stam, pursuant to a Power of Attorney filed on April 22, 2014 see file Number 2-17620, Incorporated by Reference.