UNITED STATES
SECURITIES AND EXCHANGE COMMISSION
Washington, D.C. 20549
FORM N-CSR
CERTIFIED SHAREHOLDER REPORT
OF
REGISTERED MANAGEMENT INVESTMENT COMPANIES
Investment Company Act file number: 811-04098
Name of Registrant: Vanguard Chester Funds
Address of Registrant:
P.O. Box 2600
Valley Forge, PA 19482
Name and address of agent for service:
Anne E. Robinson, Esquire
P.O. Box 876
Valley Forge, PA 19482
Registrant’s telephone number, including area code: (610) 669-1000
Date of fiscal year end: September 30
Date of reporting period: October 1, 2016 – September 30, 2017
Item 1: Reports to Shareholders
 |
| Annual Report | September 30, 2017 |
| Vanguard PRIMECAP Fund |
Vanguard’s Principles for Investing Success
We want to give you the best chance of investment success. These principles, grounded in Vanguard’s research and experience, can put you on the right path.
Goals. Create clear, appropriate investment goals.
Balance. Develop a suitable asset allocation using broadly diversified funds. Cost. Minimize cost.
Discipline. Maintain perspective and long-term discipline.
A single theme unites these principles: Focus on the things you can control. We believe there is no wiser course for any investor.
| |
| Contents | |
| Your Fund’s Performance at a Glance. | 1 |
| Chairman’s Perspective. | 3 |
| Advisor’s Report. | 7 |
| Fund Profile. | 10 |
| Performance Summary. | 12 |
| Financial Statements. | 14 |
| Your Fund’s After-Tax Returns. | 27 |
| About Your Fund’s Expenses. | 28 |
| Trustees Approve Advisory Arrangement. | 30 |
| Glossary. | 32 |
Please note: The opinions expressed in this report are just that—informed opinions. They should not be considered promises or advice. Also, please keep in mind that the information and opinions cover the period through the date on the front of this report. Of course, the risks of investing in your fund are spelled out in the prospectus.
See the Glossary for definitions of investment terms used in this report.
About the cover: Nautical images have been part of Vanguard’s rich heritage since its start in 1975. For an incoming ship, a lighthouse offers a beacon and safe path to shore. You can similarly depend on Vanguard to put you first––and light the way––as you strive to meet your financial goals. Our client focus and low costs, stemming from our unique ownership structure, assure that your interests are paramount.
Your Fund’s Performance at a Glance
• Vanguard PRIMECAP Fund returned nearly 24% for the 12 months ended September 30, 2017, exceeding the return of more than 18% for its benchmark, the Standard and Poor’s 500 Index, and the more than 19% average return of its multi-capitalization growth fund peers.
• Growth stocks outpaced their value counterparts for the period. The PRIMECAP
Fund posted gains in seven of the nine sectors in which it maintained exposure.
• PRIMECAP Management Company, the fund’s advisor, traditionally invests most heavily in the information technology and health care sectors. The fund’s technology stocks climbed nearly 38%, well ahead of those in the benchmark, and contributed about 13 percentage points to results. Although the fund’s health care stocks posted gains of about 11% and added about 2 percentage points to results, they were the biggest detractor from relative performance.
• Over the decade ended September 30, 2017, the fund’s average annual return of about 10% outpaced its comparative standards by more than 2 percentage points.
| |
| Total Returns: Fiscal Year Ended September 30, 2017 | |
| | Total |
| | Returns |
| Vanguard PRIMECAP Fund | |
| Investor Shares | 23.75% |
| Admiral™ Shares | 23.83 |
| S&P 500 Index | 18.61 |
| Multi-Cap Growth Funds Average | 19.24 |
Multi-Cap Growth Funds Average: Derived from data provided by Lipper, a Thomson Reuters Company.
Admiral Shares carry lower expenses and are available to investors who meet certain account-balance requirements.
| |
| Total Returns: Ten Years Ended September 30, 2017 | |
| | Average |
| | Annual Return |
| PRIMECAP Fund Investor Shares | 10.05% |
| S&P 500 Index | 7.44 |
| Multi-Cap Growth Funds Average | 6.53 |
| Multi-Cap Growth Funds Average: Derived from data provided by Lipper, a Thomson Reuters Company. | |
The figures shown represent past performance, which is not a guarantee of future results. (Current performance may be lower or higher than the performance data cited. For performance data current to the most recent month-end, visit our website at vanguard.com/performance.) Note, too, that both investment returns and principal value can fluctuate widely, so an investor’s shares, when sold, could be worth more or less than their original cost.
1
| | | |
| Expense Ratios | | | |
| Your Fund Compared With Its Peer Group | | | |
| | Investor | Admiral | Peer Group |
| | Shares | Shares | Average |
| PRIMECAP Fund | 0.39% | 0.32% | 1.23% |
The fund expense ratios shown are from the prospectus dated January 27, 2017, and represent estimated costs for the current fiscal year. For the fiscal year ended September 30, 2017, the fund’s expense ratios were 0.39% for Investor Shares and 0.32% for Admiral Shares. The peer-group expense ratio is derived from data provided by Lipper, a Thomson Reuters Company, and captures information through year-end 2016.
Peer group: Multi-Cap Growth Funds.
2
Chairman’s Perspective

Bill McNabb
Chairman and Chief Executive Officer
Dear Shareholder,
Our investors depend on Vanguard to be a responsible steward of their assets. This includes our obvious responsibilities—managing the funds, offering investment perspectives and advice, and assisting with questions and transactions.
But because a long-term perspective informs every aspect of our investment approach, we also work on your behalf in less obvious ways, such as by advocating for responsible governance among the companies in which Vanguard funds invest. Vanguard’s index funds are essentially permanent owners of thousands of publicly traded companies, and we have a special obligation to be engaged stewards actively focused on the long term.
Simply put, we believe that well-governed companies are more likely to perform well over the long run.
Although Vanguard has always been an advocate for strong corporate governance, we have expanded our efforts recently as our investor base continues to grow. Our Investment Stewardship team has doubled in size since 2015, and we continue to add analysts, researchers, and operations team members. The team guides our engagement activities and our funds’ proxy voting by analyzing corporate governance practices in companies around the world.
3
Our four Investment Stewardship pillars
As we evaluate company responsiveness to governance matters, including environmental and social concerns, we focus on four key areas—what we call our Investment Stewardship pillars:
• The board: A high-functioning, well-composed, independent, diverse, and experienced board with effective ongoing evaluation practices.
• Governance structures: Provisions and structures that empower shareholders and protect their rights.
• Appropriate compensation: Pay that incentivizes relative outperformance over the long term.
• Risk oversight: Effective, integrated, and ongoing oversight of relevant industry-and company-specific risks.
Guided by these pillars, our Investment Stewardship team conducted more than 950 engagements, or discussions, with company directors and leaders worldwide during the 12 months ended June 30, 2017.
| | | |
| Market Barometer | | | |
| | | Average Annual Total Returns |
| | Periods Ended September 30, 2017 |
| | One Year | Three Years | Five Years |
| Stocks | | | |
| Russell 1000 Index (Large-caps) | 18.54% | 10.63% | 14.27% |
| Russell 2000 Index (Small-caps) | 20.74 | 12.18 | 13.79 |
| Russell 3000 Index (Broad U.S. market) | 18.71 | 10.74 | 14.23 |
| FTSE All-World ex US Index (International) | 19.49 | 5.11 | 7.35 |
| |
| Bonds | | | |
| Bloomberg Barclays U.S. Aggregate Bond Index | | | |
| (Broad taxable market) | 0.07% | 2.71% | 2.06% |
| Bloomberg Barclays Municipal Bond Index | | | |
| (Broad tax-exempt market) | 0.87 | 3.19 | 3.01 |
| Citigroup Three-Month U.S. Treasury Bill Index | 0.64 | 0.28 | 0.18 |
| |
| CPI | | | |
| Consumer Price Index | 2.23% | 1.22% | 1.30% |
4
We also cast more than 171,000 votes on behalf of Vanguard funds at more than 18,000 shareholder meetings.
Gender diversity on boards and climate risk
As we engage with companies, we are devoting increased attention to two specific topics. The first is gender diversity on boards. It’s no secret that the right combination of talent, skills, and experience leads to better results, so we pay close attention to how company boards are structured and managed, and how they evolve.
In recent years, a growing body of research has demonstrated that greater diversity on boards can lead to improved governance and company performance. We are advocating for boards to incorporate diverse perspectives and experience into their strategic planning and decision-making. One example of our commitment to more diverse boards is our participation in the 30% Club, a global coalition working to increase the representation of women in boardrooms and leadership roles.
The second issue is climate risk. We will continue to engage with companies to understand their responses to this risk. Regardless of one’s perspective on the issue, the potential is real for changing regulations, demographics, and consumption behavior to affect business results for companies in many sectors.
We want to ensure that such business and regulatory risks are sufficiently disclosed so investors can value companies appropriately. In the past year, we have voted for shareholder proposals at several energy companies that called for management to improve its climate risk assessment and planning, and we will consider supporting similar proposals if we believe they are beneficial to long-term shareholder value. When a proposal from a shareholder presents a strong case for change, we’re more than willing to fully consider it. And even if the case falls short, these proposals often catalyze a discussion that generates meaningful change over time.
In addition to considering activists’ proposals, we consult research providers and our own network of experts. When we detect material risks to a company’s long-term value (such as bad leadership, poor disclosure, misaligned compensation structures, or threats to shareholder rights), we act with our voice and our vote.
Our stewardship reflects our mission
But we don’t act as independent agents with our own agenda. Every time we speak with a company chairman, CEO, or director, we’re acutely aware of the role we play in representing the economic interests of more than 20 million Vanguard investors. So you can expect us to speak out when we detect threats to the economic interests of our shareholders.
5
We take positions on these matters not because they are inherently good or noble but because they are tied to the long-term economic value of your funds’ investments.
You trust us to represent your interests across the globe. You can be confident we act on that responsibility with the seriousness and dedication it deserves.
To learn more about our Investment Stewardship program, including how our funds have voted, visit https://about. vanguard.com/investment-stewardship/.
As always, thank you for investing with Vanguard.
Sincerely,

F. William McNabb III
Chairman and Chief Executive Officer
October 13, 2017
6
Advisor’s Report
For the fiscal year ended September 30, 2017, Vanguard PRIMECAP Fund returned 23.75% for Investor Shares and 23.83% for Admiral Shares, exceeding the 18.61% return of the fund’s benchmark, the Standard & Poor’s 500 Index, and the 19.24% average return of the fund’s multi-capitalization growth fund competitors. Relative to the index, sector allocation and stock selection added to returns.
The fund’s information technology and industrial holdings contributed to relative results, while its health care holdings underperformed and its underweight position in financials detracted. Underweight positions in consumer staples, energy, real estate, telecommunication services, and utilities helped relative performance and more than offset unfavorable selection in consumer discretionary.
The investment environment
The investment environment has recently been favorable for actively managed growth funds, in large part because of the outperformance of the “FAANG” (Facebook, Amazon, Apple, Netflix, and Google) stocks, which are widely held among growth fund managers. A similar phenomenon occurred in 2015, only to reverse itself in 2016. Bank stocks and semiconductor and related equipment stocks also outperformed significantly during the fiscal year.
Energy stocks underperformed, as the price of a barrel of West Texas Intermediate crude oil declined from $54 at the end of 2016 to $52 on September 30, 2017. Despite attempts by the Organization of Petroleum Exporting Countries (OPEC) and Russia to prop up oil prices by constraining production, U.S. production proved to be more resilient than expected at recent prices. This resilience stems from continued improvements in fracking-related technologies that have significantly lowered the threshold oil price at which wells in certain regions can be profitable. Absent a geopolitical shock in the Middle East, we do not expect oil prices to increase significantly on a sustained basis, which explains our large underweighting in energy stocks.
Outlook for U.S equities
Even after a strong, multiyear run, U.S. equities currently trade for less than 18x forward earnings per share, a reasonable valuation by historical standards. We believe this valuation compares favorably with that of bonds, with the 10-year U.S. Treasury bond yielding approximately 2.3% at the end of the year. After holding flat at about $119 per share for three consecutive years, S&P 500 Index operating earnings per share are expected to grow 10% in 2017 to $131 per share, with double-digit growth forecast for 2018. Ongoing growth in earnings per share could support further S&P 500 Index stock price appreciation.
7
We are constructive on the U.S. economic outlook. The current political environment could lead to deregulation and lower taxes, which would support greater economic growth and corporate profits. Furthermore, we believe the U.S. banking system is far better capitalized than it was before the last financial crisis, as evidenced by the strong performance of most of the largest banks in recent government stress tests.
Portfolio update
The portfolio remains heavily overweighted in information technology, health care, and industrial stocks, with these sectors accounting for 77% of average assets, compared with 46% in the S&P 500 Index. The portfolio’s most significant underweights are in consumer staples, energy, real estate, and utilities, which collectively accounted for 1% of average assets, compared with 22% in the index. The portfolio is also significantly underweighted in financials, materials, and telecommunication services, which represented 9% of average assets, compared with 20% in the index.
Within information technology, the fund is most overweighted in semiconductor and semiconductor equipment stocks (12% versus 3% for the index). Over the past 12 months, the fund’s semiconductor and semiconductor equipment holdings returned 53%, led by NVIDIA (+162%), Micron (+121%), KLA-Tencor (+56%), and Texas Instruments (+31%).
In health care, the fund is most overweighted in biotechnology and pharmaceutical stocks, whose 21% combined weighting was more than double their weighting in the S&P 500 Index. The index’s health care sector underperformed during the period, returning 15%; our health care holdings returned 11%. In addition to pricing concerns, biotechnology and pharmaceutical stocks were negatively impacted by a lull in industry productivity (as measured by Food and Drug Administration approvals) and the failure of a couple of high-profile drug candidates in clinical trials.
The fund is also significantly overweighted in industrial stocks (18% versus 10% for the index) because of its investments in transportation stocks (12% versus the index’s 2%). The fund’s transportation holdings (primarily airlines) returned 31%.
As of September 30, 2017, the fund’s top ten holdings represented 38% of assets.
Advisor perspectives
After two consecutive years of underper-formance, the portfolio’s health care holdings appear attractively valued, and we are especially enthusiastic about the outlook for our health care portfolio. Health care stocks currently trade at a discount to the S&P 500 Index, even though the industry’s fundamental outlook, strengthened by favorable demographics
8
and rising living standards in emerging-market countries, remains bright. We believe that company innovation will be rewarded. Furthermore, the FDA appears to be pursuing a more constructive agenda on the pace of new drug approvals, albeit with more focus on low-cost biologics.
The fund’s information technology holdings, particularly in semiconductors and related equipment, have added significantly to relative results over the past couple of years. Although technology stocks currently trade at a modest premium to the S&P 500 Index, we believe that demand for semiconductors, software, and other technology products and services will continue to outpace demand for goods and services more broadly, as advances in automation and artificial intelligence add ever-greater value to an array of products and services.
Finally, we remain optimistic about the fund’s airline holdings, which continue to trade at valuation multiples far below average. Although prices have come under pressure as ultra-low-cost carriers attempt to gain market share from legacy players, we expect that these legacy players will respond rationally and that their competitive positions will be sustained.
Conclusion
As bottom-up stock pickers, we spend our time searching for opportunities to invest in stocks with long-term prospects we find to be materially better than market prices would seem to imply. Our approach often results in portfolios that bear little resemblance to market indexes creating the possibility for substantial deviations in relative performance. For example, our relative returns were significantly negative during the first half of calendar 2016, when the fund’s overweighted sectors and industries underperformed, and we expect to experience similar conditions in the future. We nonetheless believe that this approach can generate superior results for shareholders over the long term.
PRIMECAP Management Company
October 17, 2017
9
PRIMECAP Fund
Fund Profile
As of September 30, 2017
| | |
| Share-Class Characteristics | |
| | Investor | Admiral |
| | Shares | Shares |
| Ticker Symbol | VPMCX | VPMAX |
| Expense Ratio1 | 0.39% | 0.32% |
| 30-Day SEC Yield | 1.13% | 1.20% |
| | | |
| Portfolio Characteristics | | |
| | | | DJ |
| | | | U.S. |
| | | | Total |
| | | | Market |
| | | S&P 500 | FA |
| | Fund | Index | Index |
| Number of Stocks | 134 | 505 | 3,808 |
| Median Market Cap | $73.6B | $92.1B | $61.4B |
| Price/Earnings Ratio | 22.3x | 22.3x | 21.9x |
| Price/Book Ratio | 3.9x | 3.0x | 2.9x |
| Return on Equity | 18.4% | 16.0% | 15.1% |
| Earnings Growth | | | |
| Rate | 12.3% | 9.3% | 9.6% |
| Dividend Yield | 1.5% | 1.9% | 1.8% |
| Foreign Holdings | 9.8% | 0.0% | 0.0% |
| Turnover Rate | 8% | — | — |
| Short-Term Reserves | 5.6% | — | — |
| | | |
| Sector Diversification (% of equity exposure) |
| | | | DJ |
| | | | U.S. Total |
| | | S&P 500 | Market |
| | Fund | Index FA | Index |
| Consumer Discretionary | 8.2% | 11.9% | 12.3% |
| Consumer Staples | 0.3 | 8.2 | 7.3 |
| Energy | 0.9 | 6.1 | 5.8 |
| Financials | 7.4 | 14.6 | 15.0 |
| Health Care | 24.7 | 14.5 | 14.0 |
| Industrials | 18.7 | 10.2 | 10.8 |
| Information Technology | 37.5 | 23.2 | 22.3 |
| Materials | 1.7 | 3.0 | 3.4 |
| Real Estate | 0.0 | 3.0 | 4.0 |
| Telecommunication | | | |
| Services | 0.6 | 2.2 | 2.0 |
| Utilities | 0.0 | 3.1 | 3.1 |
Sector categories are based on the Global Industry Classification Standard (“GICS”), except for the “Other” category (if applicable), which includes securities that have not been provided a GICS classification as of the effective reporting period.
| | |
| Volatility Measures | | |
| | | DJ |
| | | U.S. Total |
| | S&P 500 | Market |
| | Index | FA Index |
| R-Squared | 0.88 | 0.89 |
| Beta | 1.04 | 1.03 |
These measures show the degree and timing of the fund’s fluctuations compared with the indexes over 36 months.
1 The expense ratios shown are from the prospectus dated January 27, 2017, and represent estimated costs for the current fiscal year. For the fiscal year ended September 30, 2017, the expense ratios were 0.39% for Investor Shares and 0.32% for Admiral Shares.
10
PRIMECAP Fund
| | |
| Ten Largest Holdings (% of total net assets) |
| Biogen Inc. | Biotechnology | 4.9% |
| Alphabet Inc. | Internet Software & | |
| | Services | 4.4 |
| Eli Lilly & Co. | Pharmaceuticals | 4.2 |
| Adobe Systems Inc. | Application Software | 3.9 |
| Texas Instruments Inc. | Semiconductors | 3.8 |
| Amgen Inc. | Biotechnology | 3.8 |
| Microsoft Corp. | Systems Software | 3.8 |
| FedEx Corp. | Air Freight & | |
| | Logistics | 3.7 |
| Southwest Airlines Co. | Airlines | 3.3 |
| Alibaba Group Holding | Internet Software & | |
| Ltd. | Services | 2.5 |
| Top Ten | | 38.3% |
The holdings listed exclude any temporary cash investments and equity index products.
Investment Focus

11
PRIMECAP Fund
Performance Summary
All of the returns in this report represent past performance, which is not a guarantee of future results that may be achieved by the fund. (Current performance may be lower or higher than the performance data cited. For performance data current to the most recent month-end, visit our website at vanguard.com/performance.) Note, too, that both investment returns and principal value can fluctuate widely, so an investor’s shares, when sold, could be worth more or less than their original cost. The returns shown do not reflect taxes that a shareholder would pay on fund distributions or on the sale of fund shares.
Cumulative Performance: September 30, 2007, Through September 30, 2017
Initial Investment of $10,000
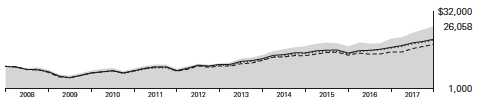
| | | | |
| | Average Annual Total Returns | |
| | Periods Ended September 30, 2017 | |
| | | | | Final Value |
| | One | Five | Ten | of a $10,000 |
| | Year | Years | Years | Investment |
| PRIMECAP Fund*Investor Shares | 23.75% | 18.44% | 10.05% | $26,058 |
| S&P 500 Index | 18.61 | 14.22 | 7.44 | 20,488 |
| Multi-Cap Growth Funds Average | 19.24 | 13.13 | 6.53 | 18,825 |
| Dow Jones U.S. Total Stock Market | | | | |
| Float Adjusted Index | 18.67 | 14.15 | 7.64 | 20,887 |
Multi-Cap Growth Funds Average: Derived from data provided by Lipper, a Thomson Reuters Company.
| | | | |
| | | | | Final Value |
| | One | Five | Ten | of a $50,000 |
| | Year | Years | Years | Investment |
| PRIMECAP Fund Admiral Shares | 23.83% | 18.53% | 10.15% | $131,465 |
| S&P 500 Index | 18.61 | 14.22 | 7.44 | 102,442 |
| Dow Jones U.S. Total Stock Market Float | | | | |
| Adjusted Index | 18.67 | 14.15 | 7.64 | 104,435 |
See Financial Highlights for dividend and capital gains information.
12
PRIMECAP Fund
Fiscal-Year Total Returns (%): September 30, 2007, Through September 30, 2017

13
PRIMECAP Fund
Financial Statements
Statement of Net Assets
As of September 30, 2017
The fund reports a complete list of its holdings in regulatory filings four times in each fiscal year, at the quarter-ends. For the second and fourth fiscal quarters, the lists appear in the fund’s semiannual and annual reports to shareholders. For the first and third fiscal quarters, the fund files the lists with the Securities and Exchange Commission on Form N-Q. Shareholders can look up the fund’s Forms N-Q on the SEC’s website at sec.gov. Forms N-Q may also be reviewed and copied at the SEC’s Public Reference Room (see the back cover of this report for further information).
| | | |
| | | | Market |
| | | | Value• |
| | | Shares | ($000) |
| Common Stocks (94.4%) | | |
| Consumer Discretionary (7.7%) | |
| ^ | Sony Corp. ADR | 17,513,600 | 653,958 |
| | Ross Stores Inc. | 9,002,300 | 581,279 |
| | TJX Cos. Inc. | 6,940,100 | 511,694 |
| | Carnival Corp. | 7,246,300 | 467,894 |
| | L Brands Inc. | 10,574,873 | 440,020 |
| | Walt Disney Co. | 3,700,000 | 364,709 |
| | Royal Caribbean | | |
| | Cruises Ltd. | 3,046,333 | 361,112 |
| 1 | Mattel Inc. | 19,667,900 | 304,459 |
| * | Amazon.com Inc. | 194,765 | 187,237 |
| | Whirlpool Corp. | 900,358 | 166,062 |
| | Comcast Corp. Class A | 1,922,900 | 73,993 |
| | Marriott International | | |
| | Inc. Class A | 490,300 | 54,060 |
| * | Charter | | |
| | Communications Inc. | | |
| | Class A | 136,000 | 49,425 |
| | VF Corp. | 751,500 | 47,773 |
| | Lowe’s Cos. Inc. | 534,500 | 42,728 |
| | MGM Resorts | | |
| | International | 1,294,600 | 42,191 |
| | CBS Corp. Class B | 600,000 | 34,800 |
| | Newell Brands Inc. | 555,000 | 23,682 |
| | Las Vegas Sands Corp. | 361,500 | 23,194 |
| | Hilton Worldwide | | |
| | Holdings Inc. | 295,366 | 20,513 |
| | Bed Bath & Beyond Inc. | 728,670 | 17,102 |
| * | AutoZone Inc. | 11,900 | 7,082 |
| | Adient plc | 69,700 | 5,854 |
| * | Netflix Inc. | 25,100 | 4,552 |
| | | | 4,485,373 |
| Consumer Staples (0.3%) | | |
| | CVS Health Corp. | 2,108,665 | 171,477 |
| | Constellation Brands | | |
| | Inc. Class A | 5,600 | 1,117 |
| | | |
| | | | Market |
| | | | Value• |
| | | Shares | ($000) |
| | Philip Morris | | |
| | International Inc. | 6,600 | 733 |
| | Altria Group Inc. | 7,100 | 450 |
| | | | 173,777 |
| Energy (0.9%) | | |
| | EOG Resources Inc. | 1,897,700 | 183,583 |
| | Schlumberger Ltd. | 2,462,600 | 171,791 |
| ^,* | Transocean Ltd. | 7,875,679 | 84,742 |
| | Noble Energy Inc. | 2,185,600 | 61,984 |
| | National Oilwell Varco | | |
| | Inc. | 375,000 | 13,399 |
| | Pioneer Natural | | |
| | Resources Co. | 2,800 | 413 |
| | | | 515,912 |
| Financials (6.9%) | | |
| | JPMorgan Chase & Co. | 11,143,500 | 1,064,316 |
| | Charles Schwab Corp. | 19,502,375 | 853,034 |
| | Wells Fargo & Co. | 11,264,200 | 621,221 |
| | Marsh & McLennan | | |
| | Cos. Inc. | 6,510,976 | 545,685 |
| | US Bancorp | 3,475,000 | 186,225 |
| | Discover Financial | | |
| | Services | 2,539,971 | 163,777 |
| | Progressive Corp. | 3,356,300 | 162,512 |
| | Citigroup Inc. | 1,841,463 | 133,948 |
| | Bank of America Corp. | 4,817,432 | 122,074 |
| | CME Group Inc. | 896,318 | 121,612 |
| | Travelers Cos. Inc. | 287,601 | 35,237 |
| | American Express Co. | 372,100 | 33,660 |
| | Chubb Ltd. | 41,133 | 5,864 |
| | | | 4,049,165 |
| Health Care (23.4%) | | |
| * | Biogen Inc. | 9,206,500 | 2,882,739 |
| | Eli Lilly & Co. | 28,411,102 | 2,430,286 |
| | Amgen Inc. | 11,834,500 | 2,206,542 |
| | Roche Holding AG | 4,968,100 | 1,269,946 |
| | Novartis AG ADR | 12,847,965 | 1,102,998 |
| * | Boston Scientific Corp. | 27,869,860 | 812,964 |
14
PRIMECAP Fund
| | | |
| | | | Market |
| | | | Value• |
| | | Shares | ($000) |
| ^ | AstraZeneca plc ADR | 22,838,704 | 773,775 |
| | Thermo Fisher | | |
| | Scientific Inc. | 2,595,400 | 491,050 |
| | Medtronic plc | 5,476,300 | 425,892 |
| | Abbott Laboratories | 5,938,768 | 316,893 |
| * | Bioverativ Inc. | 4,642,348 | 264,939 |
| * | BioMarin | | |
| | Pharmaceutical Inc. | 1,320,100 | 122,862 |
| | Bristol-Myers Squibb | | |
| | Co. | 1,794,700 | 114,394 |
| | Merck & Co. Inc. | 1,487,300 | 95,232 |
| | Johnson & Johnson | 696,600 | 90,565 |
| | Agilent Technologies | | |
| | Inc. | 1,169,600 | 75,088 |
| | Sanofi ADR | 1,008,000 | 50,188 |
| | Zimmer Biomet | | |
| | Holdings Inc. | 334,000 | 39,108 |
| | Stryker Corp. | 180,000 | 25,564 |
| | GlaxoSmithKline plc | | |
| | ADR | 560,000 | 22,736 |
| | AbbVie Inc. | 26,700 | 2,372 |
| | | | 13,616,133 |
| Industrials (17.6%) | | |
| | FedEx Corp. | 9,561,326 | 2,156,844 |
| 1 | Southwest Airlines Co. | 34,011,000 | 1,903,936 |
| | Airbus SE | 11,248,558 | 1,070,815 |
| | American Airlines | | |
| | Group Inc. | 20,718,700 | 983,931 |
| | Caterpillar Inc. | 5,488,800 | 684,508 |
| | Delta Air Lines Inc. | 11,558,000 | 557,327 |
| * | United Continental | | |
| | Holdings Inc. | 8,198,100 | 499,100 |
| | Deere & Co. | 3,242,800 | 407,263 |
| | Alaska Air Group Inc. | 4,996,700 | 381,098 |
| | Honeywell | | |
| | International Inc. | 2,330,000 | 330,254 |
| | United Parcel Service | | |
| | Inc. Class B | 2,121,970 | 254,827 |
| | Boeing Co. | 868,700 | 220,832 |
| | Union Pacific Corp. | 1,874,100 | 217,339 |
| | Siemens AG | 1,150,000 | 162,277 |
| | CSX Corp. | 2,610,000 | 141,619 |
| | Textron Inc. | 1,976,416 | 106,489 |
| | Pentair plc | 1,030,000 | 69,999 |
| | United Technologies | | |
| | Corp. | 495,000 | 57,460 |
| | Rockwell Automation | | |
| | Inc. | 180,200 | 32,113 |
| | TransDigm Group Inc. | 108,600 | 27,764 |
| | Safran SA | 150,000 | 15,329 |
| * | Herc Holdings Inc. | 142,000 | 6,977 |
| | | | 10,288,101 |
| | | |
| | | | Market |
| | | | Value• |
| | | Shares | ($000) |
| Information Technology (35.4%) | |
| * | Adobe Systems Inc. | 15,135,270 | 2,257,880 |
| | Texas Instruments Inc. | 24,942,300 | 2,235,828 |
| | Microsoft Corp. | 29,460,500 | 2,194,513 |
| * | Alibaba Group Holding | | |
| | Ltd. ADR | 8,316,073 | 1,436,269 |
| | NVIDIA Corp. | 7,634,800 | 1,364,873 |
| * | Alphabet Inc. Class A | 1,325,334 | 1,290,504 |
| * | Alphabet Inc. Class C | 1,344,255 | 1,289,288 |
| * | Micron Technology Inc. | 31,031,700 | 1,220,477 |
| | KLA-Tencor Corp. | 6,310,400 | 668,902 |
| 1 | NetApp Inc. | 14,494,500 | 634,279 |
| | HP Inc. | 31,484,885 | 628,438 |
| | Hewlett Packard | | |
| | Enterprise Co. | 41,526,254 | 610,851 |
| | Cisco Systems Inc. | 15,161,950 | 509,896 |
| | Intuit Inc. | 3,570,000 | 507,440 |
| | Intel Corp. | 11,093,000 | 422,421 |
| | QUALCOMM Inc. | 8,085,450 | 419,150 |
| | Activision Blizzard Inc. | 5,600,000 | 361,256 |
| | Visa Inc. Class A | 3,322,300 | 349,639 |
| | Oracle Corp. | 5,874,400 | 284,027 |
| | Analog Devices Inc. | 2,756,500 | 237,528 |
| | Telefonaktiebolaget | | |
| | LM Ericsson ADR | 38,989,804 | 224,191 |
| | DXC Technology Co. | 2,526,268 | 216,956 |
| | Corning Inc. | 5,600,700 | 167,573 |
| 1 | Plantronics Inc. | 3,672,300 | 162,389 |
| | Micro Focus | | |
| | International plc ADR | 4,414,685 | 140,828 |
| * | BlackBerry Ltd. | 10,737,500 | 120,045 |
| | Mastercard Inc. | | |
| | Class A | 833,000 | 117,620 |
| * | Dell Technologies Inc. | | |
| | Class V | 1,250,600 | 96,559 |
| * | Altaba Inc. | 1,307,300 | 86,596 |
| | Apple Inc. | 547,500 | 84,381 |
| * | eBay Inc. | 2,058,300 | 79,162 |
| * | Entegris Inc. | 2,638,372 | 76,117 |
| * | PayPal Holdings Inc. | 1,095,900 | 70,171 |
| * | salesforce.com Inc. | 538,400 | 50,297 |
| * | Keysight Technologies | | |
| | Inc. | 375,600 | 15,648 |
| | Applied Materials Inc. | 241,800 | 12,595 |
| | Western Digital Corp. | 134,550 | 11,625 |
| * | Rambus Inc. | 551,897 | 7,368 |
| | | | 20,663,580 |
| Materials (1.6%) | | |
| | Monsanto Co. | 6,012,625 | 720,433 |
| | Praxair Inc. | 902,100 | 126,059 |
| * | DowDuPont Inc. | 671,700 | 46,502 |
| ^ | Potash Corp. of | | |
| | Saskatchewan Inc. | 636,900 | 12,254 |
| | | | 905,248 |
15
PRIMECAP Fund
| | |
| | | Market |
| | | Value• |
| | Shares | ($000) |
| Telecommunication Services (0.6%) | |
| AT&T Inc. | 8,439,742 | 330,585 |
| * T-Mobile US Inc. | 275,600 | 16,993 |
| | | 347,578 |
| Total Common Stocks | | |
| (Cost $23,104,852) | | 55,044,867 |
| Temporary Cash Investment (5.7%) | |
| Money Market Fund (5.7%) | | |
| 2,3 Vanguard Market | | |
| Liquidity Fund, 1.223% | | |
| (Cost $3,318,311) | 33,179,549 | 3,318,618 |
| Total Investments (100.1%) | | |
| (Cost $26,423,163) | | 58,363,485 |
| Other Assets and Liabilities (-0.1%) | |
| Other Assets | | 216,306 |
| Liabilities 3 | | (265,541) |
| | | (49,235) |
| Net Assets (100%) | | 58,314,250 |
| |
| | | Amount |
| | | ($000) |
| Statement of Assets and Liabilities | |
| Assets | | |
| Investments in Securities, at Value | |
| Unaffiliated Issuers | | 52,039,804 |
| Affiliated Vanguard Funds | | 3,318,618 |
| Other Affiliated Issuers | | 3,005,063 |
| Total Investments in Securities | 58,363,485 |
| Investment in Vanguard | | 3,552 |
| Receivables for Investment | | |
| Securities Sold | | 24,034 |
| Receivables for Accrued Income | 47,390 |
| Receivables for Capital Shares Issued | 136,691 |
| Other Assets | | 4,639 |
| Total Assets | | 58,579,791 |
| Liabilities | | |
| Payables for Investment Securities | |
| Purchased | | (7,905) |
| Collateral for Securities on Loan | (57,795) |
| Payables to Investment Advisor | (26,098) |
| Payables for Capital Shares Redeemed | (110,393) |
| Payables to Vanguard | | (59,359) |
| Other Liabilities | | (3,991) |
| Total Liabilities | | (265,541) |
| Net Assets | | 58,314,250 |
| |
| At September 30, 2017, net assets consisted of: |
| | Amount |
| | ($000) |
| Paid-in Capital | 23,321,012 |
| Undistributed Net Investment Income | 440,228 |
| Accumulated Net Realized Gains | 2,611,224 |
| Unrealized Appreciation (Depreciation) | |
| Investment Securities | 31,940,322 |
| Foreign Currencies | 1,464 |
| Net Assets | 58,314,250 |
| |
| Investor Shares—Net Assets | |
| Applicable to 60,699,762 outstanding | |
| $.001 par value shares of beneficial | |
| interest (unlimited authorization) | 7,699,128 |
| Net Asset Value Per Share— | |
| Investor Shares | $126.84 |
| |
| Admiral Shares—Net Assets | |
| Applicable to 385,065,098 outstanding |
| $.001 par value shares of beneficial | |
| interest (unlimited authorization) | 50,615,122 |
| Net Asset Value Per Share— | |
| Admiral Shares | $131.45 |
• See Note A in Notes to Financial Statements.
^ Includes partial security positions on loan to broker-dealers.
The total value of securities on loan is $56,128,000.
* Non-income-producing security.
1 Considered an affiliated company of the fund as the fund owns more than 5% of the outstanding voting securities of such company.
2 Affiliated money market fund available only to Vanguard funds and certain trusts and accounts managed by Vanguard. Rate shown is the 7-day yield.
3 Includes $57,795,000 of collateral received for securities on loan.
ADR—American Depositary Receipt.
See accompanying Notes, which are an integral part of the Financial Statements.
16
PRIMECAP Fund
| |
| Statement of Operations | |
| |
| | Year Ended |
| | September 30, 2017 |
| | ($000) |
| Investment Income | |
| Income | |
| Dividends1 | 808,899 |
| Interest | 22,761 |
| Securities Lending—Net | 700 |
| Total Income | 832,360 |
| Expenses | |
| Investment Advisory Fees—Note B | 98,407 |
| The Vanguard Group—Note C | |
| Management and Administrative—Investor Shares | 13,969 |
| Management and Administrative—Admiral Shares | 53,783 |
| Marketing and Distribution—Investor Shares | 1,034 |
| Marketing and Distribution—Admiral Shares | 2,445 |
| Custodian Fees | 544 |
| Auditing Fees | 35 |
| Shareholders’ Reports and Proxy—Investor Shares | 267 |
| Shareholders’ Reports and Proxy—Admiral Shares | 364 |
| Trustees’ Fees and Expenses | 97 |
| Total Expenses | 170,945 |
| Net Investment Income | 661,415 |
| Realized Net Gain (Loss) | |
| Investment Securities Sold | 2,953,426 |
| Foreign Currencies | (2,409) |
| Realized Net Gain (Loss) | 2,951,017 |
| Change in Unrealized Appreciation (Depreciation) | |
| Investment Securities | 7,554,549 |
| Foreign Currencies | 1,795 |
| Change in Unrealized Appreciation (Depreciation) | 7,556,344 |
| Net Increase (Decrease) in Net Assets Resulting from Operations | 11,168,776 |
| 1 Dividends are net of foreign withholding taxes of $16,178,000. | |
See accompanying Notes, which are an integral part of the Financial Statements.
17
PRIMECAP Fund
| | |
| Statement of Changes in Net Assets | | |
| |
| | Year Ended September 30, |
| | 2017 | 2016 |
| | ($000) | ($000) |
| Increase (Decrease) in Net Assets | | |
| Operations | | |
| Net Investment Income | 661,415 | 641,839 |
| Realized Net Gain (Loss) | 2,951,017 | 2,232,245 |
| Change in Unrealized Appreciation (Depreciation) | 7,556,344 | 4,416,438 |
| Net Increase (Decrease) in Net Assets Resulting from Operations | 11,168,776 | 7,290,522 |
| Distributions | | |
| Net Investment Income | | |
| Investor Shares | (92,535) | (86,405) |
| Admiral Shares | (531,693) | (426,673) |
| Realized Capital Gain1 | | |
| Investor Shares | (269,344) | (370,752) |
| Admiral Shares | (1,457,828) | (1,709,108) |
| Total Distributions | (2,351,400) | (2,592,938) |
| Capital Share Transactions | | |
| Investor Shares | (1,160,090) | (945,771) |
| Admiral Shares | 3,216,264 | 1,174,655 |
| Net Increase (Decrease) from Capital Share Transactions | 2,056,174 | 228,884 |
| Total Increase (Decrease) | 10,873,550 | 4,926,468 |
| Net Assets | | |
| Beginning of Period | 47,440,700 | 42,514,232 |
| End of Period2 | 58,314,250 | 47,440,700 |
1 Includes fiscal 2017 and 2016 short-term gain distributions totaling $54,261,000 and $0, respectively. Short-term gain distributions are treated as ordinary income dividends for tax purposes.
2 Net Assets—End of Period includes undistributed (overdistributed) net investment income of $440,228,000 and $425,507,000.
See accompanying Notes, which are an integral part of the Financial Statements.
18
PRIMECAP Fund
Financial Highlights
| | | | | |
| Investor Shares | | | | | |
| |
| For a Share Outstanding | | | Year Ended September 30, |
| Throughout Each Period | 2017 | 2016 | 2015 | 2014 | 2013 |
| Net Asset Value, Beginning of Period | $107.60 | $96.99 | $104.16 | $87.83 | $69.39 |
| Investment Operations | | | | | |
| Net Investment Income | 1.3981 | 1.401 | 1.329 | 1.124 | 1.033 |
| Net Realized and Unrealized Gain (Loss) | | | | | |
| on Investments | 23.145 | 15.103 | (1.631) | 19.812 | 19.093 |
| Total from Investment Operations | 24.543 | 16.504 | (. 302) | 20.936 | 20.126 |
| Distributions | | | | | |
| Dividends from Net Investment Income | (1.356) | (1.114) | (1.160) | (.836) | (.965) |
| Distributions from Realized Capital Gains | (3.947) | (4.780) | (5.708) | (3.770) | (.721) |
| Total Distributions | (5.303) | (5.894) | (6.868) | (4.606) | (1.686) |
| Net Asset Value, End of Period | $126.84 | $107.60 | $96.99 | $104.16 | $87.83 |
| |
| Total Return2 | 23.75% | 17.40% | -0.76% | 24.72% | 29.63% |
| |
| Ratios/Supplemental Data | | | | | |
| Net Assets, End of Period (Millions) | $7,699 | $7,588 | $7,741 | $13,273 | $13,059 |
| Ratio of Total Expenses to Average Net Assets | 0.39% | 0.39% | 0.40% | 0.44% | 0.45% |
| Ratio of Net Investment Income to | | | | | |
| Average Net Assets | 1.22% | 1.37% | 1.33% | 1.17% | 1.32% |
| Portfolio Turnover Rate | 8% | 6% | 9% | 11% | 5% |
1 Calculated based on average shares outstanding.
2 Total returns do not include account service fees that may have applied in the periods shown. Fund prospectuses provide information about any applicable account service fees.
19
PRIMECAP Fund
Financial Highlights
| | | | | |
| Admiral Shares | | | | | |
| |
| For a Share Outstanding | | | Year Ended September 30, |
| Throughout Each Period | 2017 | 2016 | 2015 | 2014 | 2013 |
| Net Asset Value, Beginning of Period | $111.52 | $100.53 | $108.08 | $91.15 | $72.03 |
| Investment Operations | | | | | |
| Net Investment Income | 1.5281 | 1.532 | 1.550 | 1.286 | 1.178 |
| Net Realized and Unrealized Gain (Loss) | | | | | |
| on Investments | 23.981 | 15.645 | (1.784) | 20.536 | 19.769 |
| Total from Investment Operations | 25.509 | 17.177 | (.234) | 21.822 | 20.947 |
| Distributions | | | | | |
| Dividends from Net Investment Income | (1.491) | (1.236) | (1.403) | (.983) | (1.079) |
| Distributions from Realized Capital Gains | (4.088) | (4.951) | (5.913) | (3.909) | (.748) |
| Total Distributions | (5.579) | (6.187) | (7.316) | (4.892) | (1.827) |
| Net Asset Value, End of Period | $131.45 | $111.52 | $100.53 | $108.08 | $91.15 |
| |
| Total Return2 | 23.83% | 17.48% | -0.69% | 24.85% | 29.73% |
| |
| Ratios/Supplemental Data | | | | | |
| Net Assets, End of Period (Millions) | $50,615 | $39,852 | $34,773 | $30,982 | $23,129 |
| Ratio of Total Expenses to Average Net Assets | 0.32% | 0.33% | 0.34% | 0.35% | 0.36% |
| Ratio of Net Investment Income to | | | | | |
| Average Net Assets | 1.29% | 1.43% | 1.39% | 1.26% | 1.41% |
| Portfolio Turnover Rate | 8% | 6% | 9% | 11% | 5% |
1 Calculated based on average shares outstanding.
2 Total returns do not include account service fees that may have applied in the periods shown. Fund prospectuses provide information about any applicable account service fees.
20
PRIMECAP Fund
Notes to Financial Statements
Vanguard PRIMECAP Fund is registered under the Investment Company Act of 1940 as an open-end investment company, or mutual fund. The fund offers two classes of shares: Investor Shares and Admiral Shares. Investor Shares are available to any investor who meets the fund’s minimum purchase requirements. Admiral Shares are designed for investors who meet certain administrative, service, and account-size criteria.
A. The following significant accounting policies conform to generally accepted accounting principles for U.S. investment companies. The fund consistently follows such policies in preparing its financial statements.
1. Security Valuation: Securities are valued as of the close of trading on the New York Stock Exchange (generally 4 p.m., Eastern time) on the valuation date. Equity securities are valued at the latest quoted sales prices or official closing prices taken from the primary market in which each security trades; such securities not traded on the valuation date are valued at the mean of the latest quoted bid and asked prices. Securities for which market quotations are not readily available, or whose values have been affected by events occurring before the fund’s pricing time but after the close of the securities’ primary markets, are valued at their fair values calculated according to procedures adopted by the board of trustees. These procedures include obtaining quotations from an independent pricing service, monitoring news to identify significant market- or security-specific events, and evaluating changes in the values of foreign market proxies (for example, ADRs, futures contracts, or exchange-traded funds), between the time the foreign markets close and the fund’s pricing time. When fair-value pricing is employed, the prices of securities used by a fund to calculate its net asset value may differ from quoted or published prices for the same securities. Investments in Vanguard Market Liquidity Fund are valued at that fund’s net asset value.
2. Foreign Currency: Securities and other assets and liabilities denominated in foreign currencies are translated into U.S. dollars using exchange rates obtained from an independent third party as of the fund’s pricing time on the valuation date. Realized gains (losses) and unrealized appreciation (depreciation) on investment securities include the effects of changes in exchange rates since the securities were purchased, combined with the effects of changes in security prices. Fluctuations in the value of other assets and liabilities resulting from changes in exchange rates are recorded as unrealized foreign currency gains (losses) until the assets or liabilities are settled in cash, at which time they are recorded as realized foreign currency gains (losses).
3. Federal Income Taxes: The fund intends to continue to qualify as a regulated investment company and distribute all of its taxable income. Management has analyzed the fund’s tax positions taken for all open federal income tax years (September 30, 2014–2017), and has concluded that no provision for federal income tax is required in the fund’s financial statements.
4. Distributions: Distributions to shareholders are recorded on the ex-dividend date.
5. Securities Lending: To earn additional income, the fund lends its securities to qualified institutional borrowers. Security loans are subject to termination by the fund at any time, and are required to be secured at all times by collateral in an amount at least equal to the market value of securities loaned. Daily market fluctuations could cause the value of loaned securities to be more or less than the value of the collateral received. When this occurs, the collateral is adjusted and settled on the next business day. The fund further mitigates its counterparty risk by entering into
21
PRIMECAP Fund
securities lending transactions only with a diverse group of prequalified counterparties, monitoring their financial strength, and entering into master securities lending agreements with its counterparties. The master securities lending agreements provide that, in the event of a counterparty’s default (including bankruptcy), the fund may terminate any loans with that borrower, determine the net amount owed, and sell or retain the collateral up to the net amount owed to the fund; however, such actions may be subject to legal proceedings. While collateral mitigates counter-party risk, in the event of a default, the fund may experience delays and costs in recovering the securities loaned. The fund invests cash collateral received in Vanguard Market Liquidity Fund, and records a liability in the Statement of Net Assets for the return of the collateral, during the period the securities are on loan. Securities lending income represents fees charged to borrowers plus income earned on invested cash collateral, less expenses associated with the loan. During the term of the loan, the fund is entitled to all distributions made on or in respect of the loaned securities.
6. Credit Facility: The fund and certain other funds managed by The Vanguard Group (“Vanguard”) participate in a $3.1 billion committed credit facility provided by a syndicate of lenders pursuant to a credit agreement that may be renewed annually; each fund is individually liable for its borrowings, if any, under the credit facility. Borrowings may be utilized for temporary and emergency purposes, and are subject to the fund’s regulatory and contractual borrowing restrictions. The participating funds are charged administrative fees and an annual commitment fee of 0.10% of the undrawn amount of the facility; these fees are allocated to the funds based on a method approved by the fund’s board of trustees and included in Management and Administrative expenses on the fund’s Statement of Operations. Any borrowings under this facility bear interest at a rate based upon the higher of the one-month London Interbank Offered Rate, federal funds effective rate, or overnight bank funding rate plus an agreed-upon spread.
The fund had no borrowings outstanding at September 30, 2017, or at any time during the period then ended.
7. Other: Dividend income is recorded on the ex-dividend date. Interest income includes income distributions received from Vanguard Market Liquidity Fund and is accrued daily. Security transactions are accounted for on the date securities are bought or sold. Costs used to determine realized gains (losses) on the sale of investment securities are those of the specific securities sold.
Each class of shares has equal rights as to assets and earnings, except that each class separately bears certain class-specific expenses related to maintenance of shareholder accounts (included in Management and Administrative expenses), shareholder reporting, and the proxy. Marketing and distribution expenses are allocated to each class of shares based on a method approved by the board of trustees. Income, other non-class-specific expenses, and gains and losses on investments are allocated to each class of shares based on its relative net assets.
B. PRIMECAP Management Company provides investment advisory services to the fund for a fee calculated at an annual percentage rate of average net assets. For the year ended September 30, 2017, the investment advisory fee represented an effective annual rate of 0.19% of the fund’s average net assets.
22
PRIMECAP Fund
C. In accordance with the terms of a Funds’ Service Agreement (the “FSA”) between Vanguard and the fund, Vanguard furnishes to the fund corporate management, administrative, marketing, and distribution services at Vanguard’s cost of operations (as defined by the FSA). These costs of operations are allocated to the fund based on methods and guidelines approved by the board of trustees. Vanguard does not require reimbursement in the current period for certain costs of operations (such as deferred compensation/benefits and risk/insurance costs); the fund’s liability for these costs of operations is included in Payables to Vanguard on the Statement of Net Assets.
Upon the request of Vanguard, the fund may invest up to 0.40% of its net assets as capital in Vanguard. At September 30, 2017, the fund had contributed to Vanguard capital in the amount of $3,552,000, representing 0.01% of the fund’s net assets and 1.42% of Vanguard’s capitalization. The fund’s trustees and officers are also directors and employees, respectively, of Vanguard.
D. Various inputs may be used to determine the value of the fund’s investments. These inputs are summarized in three broad levels for financial statement purposes. The inputs or methodologies used to value securities are not necessarily an indication of the risk associated with investing in those securities.
Level 1—Quoted prices in active markets for identical securities.
Level 2—Other significant observable inputs (including quoted prices for similar securities, interest rates, prepayment speeds, credit risk, etc.).
Level 3—Significant unobservable inputs (including the fund’s own assumptions used to determine the fair value of investments). Any investments valued with significant unobservable inputs are noted on the Statement of Net Assets.
The following table summarizes the market value of the fund’s investments as of September 30,
2017, based on the inputs used to value them:
| | | |
| | Level 1 | Level 2 | Level 3 |
| Investments | ($000) | ($000) | ($000) |
| Common Stocks | 52,526,500 | 2,518,367 | — |
| Temporary Cash Investments | 3,318,618 | — | — |
| Total | 55,845,118 | 2,518,367 | — |
E. Distributions are determined on a tax basis and may differ from net investment income and realized capital gains for financial reporting purposes. Differences may be permanent or temporary. Permanent differences are reclassified among capital accounts in the financial statements to reflect their tax character. Temporary differences arise when certain items of income, expense, gain, or loss are recognized in different periods for financial statement and tax purposes. These differences will reverse at some time in the future. Differences in classification may also result from the treatment of short-term gains as ordinary income for tax purposes.
During the year ended September 30, 2017, the fund realized $175,022,000 of net capital gains resulting from in-kind redemptions—in which shareholders exchanged fund shares for securities held by the fund rather than for cash. Because such gains are not taxable to the fund, and are not distributed to shareholders, they have been reclassified from accumulated net realized gains to paid-in capital.
23
PRIMECAP Fund
The fund used a tax accounting practice to treat a portion of the price of capital shares redeemed during the year as distributions from net investment income and realized capital gains. Accordingly, the fund has reclassified $20,057,000 from undistributed net investment income and $84,587,000 from accumulated net realized gains to paid-in capital.
For tax purposes, at September 30, 2017, the fund had $596,162,000 of ordinary income and $2,510,915,000 of long-term capital gains available for distribution.
At September 30, 2017, the cost of investment securities for tax purposes was $26,423,163,000. Net unrealized appreciation of investment securities for tax purposes was $31,940,322,000, consisting of unrealized gains of $32,826,209,000 on securities that had risen in value since their purchase and $885,887,000 in unrealized losses on securities that had fallen in value since their purchase.
F. During the year ended September 30, 2017, the fund purchased $4,830,472,000 of investment securities and sold $6,010,137,000 of investment securities, other than temporary cash investments. Purchases and sales include $791,746,000 and $250,034,000, respectively, in connection with in-kind purchases and redemptions of the fund’s capital shares.
G. Capital share transactions for each class of shares were:
| | | | |
| | | | Year Ended September 30, |
| | | 2017 | | 2016 |
| | Amount | Shares | Amount | Shares |
| | ($000) | (000) | ($000) | (000) |
| Investor Shares | | | | |
| Issued | 573,721 | 5,070 | 501,353 | 5,081 |
| Issued in Lieu of Cash Distributions | 353,911 | 3,324 | 448,254 | 4,430 |
| Redeemed | (2,087,722) | (18,215) | (1,895,378) | (18,802) |
| Net Increase (Decrease)—Investor Shares | (1,160,090) | (9,821) | (945,771) | (9,291) |
| Admiral Shares | | | | |
| Issued | 4,401,870 | 36,653 | 3,167,275 | 30,714 |
| Issued in Lieu of Cash Distributions | 1,880,344 | 17,051 | 2,027,098 | 19,341 |
| Redeemed | (3,065,950) | (26,006) | (4,019,718) | (38,593) |
| Net Increase (Decrease)—Admiral Shares | 3,216,264 | 27,698 | 1,174,655 | 11,462 |
24
PRIMECAP Fund
H. Certain of the fund’s investments are in companies that are considered to be affiliated companies of the fund because the fund owns more than 5% of the outstanding voting securities of the company or the issuer is another member of The Vanguard Group. Transactions during the period in securities of these companies were as follows:
| | | | | | | | |
| | | | | | Current Period Transactions | |
| | Sept. 30, | | Proceeds | Realized | | | Capital | Sept. 30, |
| | 2016 | | from | Net | Change in | | Gain | 2017 |
| Market | Purchases | Securities | Gain | Unrealized | | Distributions | Market |
| | Value | at Cost | Sold | (Loss) | App. (Dep.) | Income | Received | Value |
| | ($000) | ($000) | ($000) | ($000) | ($000) | ($000) | ($000) | ($000) |
| Mattel Inc. | — | 378,660 | — | — | (74,201) | 2,520 | — | 304,459 |
| NetApp Inc. | 505,263 | 17,674 | 2,879 | 1,081 | 113,140 | 10,847 | — | 634,279 |
| Plantronics Inc. | 188,043 | 3,011 | 972 | 935 | (28,628) | 2,166 | — | 162,389 |
| Southwest | | | | | | | | |
| Airlines Co. | 1,306,611 | 59,326 | 38,868 | 27,388 | 549,479 | 15,052 | — | 1,903,936 |
| Vanguard Market | | | | | | | | |
| Liquidity Fund | 1,902,618 | NA1 | NA1 | 39 | 153 | 22,761 | — | 3,318,618 |
| Total | 3,902,535 | | | 29,443 | 559,943 | 53,346 | — | 6,323,681 |
| 1 Not applicable—purchases and sales are for temporary cash investment purposes. | | | |
I. Management has determined that no material events or transactions occurred subsequent to September 30, 2017, that would require recognition or disclosure in these financial statements.
25
Report of Independent Registered Public Accounting Firm
To the Board of Trustees of Vanguard Chester Funds and the Shareholders of Vanguard PRIMECAP Fund
In our opinion, the accompanying statement of net assets and statement of assets and liabilities, and the related statements of operations and of changes in net assets and the financial highlights present fairly, in all material respects, the financial position of Vanguard PRIMECAP Fund (constituting a separate portfolio of Vanguard Chester Funds, hereafter referred to as the “Fund”) as of September 30, 2017, the results of its operations for the year then ended, the changes in its net assets for each of the two years in the period then ended and the financial highlights for each of the five years in the period then ended, in conformity with accounting principles generally accepted in the United States of America. These financial statements and financial highlights (hereafter referred to as “financial statements”) are the responsibility of the Fund’s management. Our responsibility is to express an opinion on these financial statements based on our audits. We conducted our audits of these financial statements in accordance with the standards of the Public Company Accounting Oversight Board (United States). Those standards require that we plan and perform the audit to obtain reasonable assurance about whether the financial statements are free of material misstatement. An audit includes examining, on a test basis, evidence supporting the amounts and disclosures in the financial statements, assessing the accounting principles used and significant estimates made by management, and evaluating the overall financial statement presentation. We believe that our audits, which included confirmation of securities as of September 30, 2017 by correspondence with the custodian and brokers and by agreement to the underlying ownership records of the transfer agent, provide a reasonable basis for our opinion.
/s/PricewaterhouseCoopers LLP
Philadelphia, Pennsylvania
November 13, 2017
Special 2017 tax information (unaudited) for Vanguard PRIMECAP Fund
This information for the fiscal year ended September 30, 2017, is included pursuant to provisions of the Internal Revenue Code.
The fund distributed $1,754,351,000 as capital gain dividends (20% rate gain distributions) to shareholders during the fiscal year.
For nonresident alien shareholders, 100% of short-term capital gain dividends distributed by the fund are qualified short-term capital gains.
The fund distributed $624,228,000 of qualified dividend income to shareholders during the fiscal year.
For corporate shareholders, 85.5% of investment income (dividend income plus short-term gains, if any) qualifies for the dividends-received deduction.
26
Your Fund’s After-Tax Returns
This table presents returns for your fund both before and after taxes. The after-tax returns are shown in two ways: (1) assuming that an investor owned the fund during the entire period and paid taxes on the fund’s distributions, and (2) assuming that an investor paid taxes on the fund’s distributions and sold all shares at the end of each period.
Calculations are based on the highest individual federal income tax and capital gains tax rates in effect at the times of the distributions and the hypothetical sales. State and local taxes were not considered. After-tax returns reflect any qualified dividend income, using actual prior-year figures and estimates for 2017. (In the example, returns after the sale of fund shares may be higher than those assuming no sale. This occurs when the sale would have produced a capital loss. The calculation assumes that the investor received a tax deduction for the loss.)
The table shows returns for Investor Shares only; returns for other share classes will differ. Please note that your actual after-tax returns will depend on your tax situation and may differ from those shown. Also note that if you own the fund in a tax-deferred account, such as an individual retirement account or a 401(k) plan, this information does not apply to you. Such accounts are not subject to current taxes.
Finally, keep in mind that a fund’s performance—whether before or after taxes—does not guarantee future results.
| | | |
| Average Annual Total Returns: PRIMECAP Fund Investor Shares | | | |
| Periods Ended September 30, 2017 | | | |
| | One | Five | Ten |
| | Year | Years | Years |
| Returns Before Taxes | 23.75% | 18.44% | 10.05% |
| Returns After Taxes on Distributions | 22.35 | 17.16 | 9.09 |
| Returns After Taxes on Distributions and Sale of Fund Shares | 14.28 | 14.72 | 8.04 |
27
About Your Fund’s Expenses
As a shareholder of the fund, you incur ongoing costs, which include costs for portfolio management, administrative services, and shareholder reports (like this one), among others. Operating expenses, which are deducted from a fund’s gross income, directly reduce the investment return of the fund.
A fund’s expenses are expressed as a percentage of its average net assets. This figure is known as the expense ratio. The following examples are intended to help you understand the ongoing costs (in dollars) of investing in your fund and to compare these costs with those of other mutual funds. The examples are based on an investment of $1,000 made at the beginning of the period shown and held for the entire period.
The accompanying table illustrates your fund’s costs in two ways:
• Based on actual fund return. This section helps you to estimate the actual expenses that you paid over the period. The ”Ending Account Value“ shown is derived from the fund‘s actual return, and the third column shows the dollar amount that would have been paid by an investor who started with $1,000 in the fund. You may use the information here, together with the amount you invested, to estimate the expenses that you paid over the period.
To do so, simply divide your account value by $1,000 (for example, an $8,600 account value divided by $1,000 = 8.6), then multiply the result by the number given for your fund under the heading ”Expenses Paid During Period.“
• Based on hypothetical 5% yearly return. This section is intended to help you compare your fund‘s costs with those of other mutual funds. It assumes that the fund had a yearly return of 5% before expenses, but that the expense ratio is unchanged. In this case—because the return used is not the fund’s actual return—the results do not apply to your investment. The example is useful in making comparisons because the Securities and Exchange Commission requires all mutual funds to calculate expenses based on a 5% return. You can assess your fund’s costs by comparing this hypothetical example with the hypothetical examples that appear in shareholder reports of other funds.
Note that the expenses shown in the table are meant to highlight and help you compare ongoing costs only and do not reflect transaction costs incurred by the fund for buying and selling securities. Further, the expenses do not include any purchase, redemption, or account service fees described in the fund prospectus. If such fees were applied to your account, your costs would be higher. Your fund does not carry a “sales load.”
The calculations assume no shares were bought or sold during the period. Your actual costs may have been higher or lower, depending on the amount of your investment and the timing of any purchases or redemptions.
You can find more information about the fund’s expenses, including annual expense ratios, in the Financial Statements section of this report. For additional information on operating expenses and other shareholder costs, please refer to your fund’s current prospectus.
28
| | | |
| Six Months Ended September 30, 2017 | | | |
| | Beginning | Ending | Expenses |
| | Account Value | Account Value | Paid During |
| PRIMECAP Fund | 3/31/2017 | 9/30/2017 | Period |
| Based on Actual Fund Return | | | |
| Investor Shares | $1,000.00 | $1,115.18 | $2.07 |
| Admiral Shares | 1,000.00 | 1,115.59 | 1.70 |
| Based on Hypothetical 5% Yearly Return | | | |
| Investor Shares | $1,000.00 | $1,023.11 | $1.98 |
| Admiral Shares | 1,000.00 | 1,023.46 | 1.62 |
The calculations are based on expenses incurred in the most recent six-month period. The fund’s annualized six-month expense ratios for that period are 0.39% for Investor Shares and 0.32% for Admiral Shares. The dollar amounts shown as “Expenses Paid” are equal to the annualized expense ratio multiplied by the average account value over the period, multiplied by the number of days in the most recent six-month period, then divided by the number of days in the most recent 12-month period (183/365).
29
Trustees Approve Advisory Arrangement
The board of trustees of Vanguard PRIMECAP Fund has renewed the fund’s investment advisory arrangement with PRIMECAP Management Company (PRIMECAP). The board determined that renewing the fund’s advisory arrangement was in the best interests of the fund and its shareholders.
The board based its decision upon an evaluation of the advisor’s investment staff, portfolio management process, and performance. This evaluation included information provided to the board by Vanguard’s Portfolio Review Department, which is responsible for fund and advisory oversight and product management. The Portfolio Review Department met regularly with the advisor and made monthly presentations to the board during the fiscal year that directed the board’s focus to relevant information and topics.
The board, or an investment committee made up of board members, also received information throughout the year during advisor presentations. For each advisor presentation, the board was provided with letters and reports that included information about, among other things, the advisory firm and the advisor’s assessment of the investment environment, portfolio performance, and portfolio characteristics.
In addition, the board received monthly reports, which included a Market and Economic Report, a Fund Dashboard Monthly Summary, and a Fund Performance Report.
Prior to their meeting, the trustees were provided with a memo and material that summarized the information they received over the course of the year. They also considered the factors discussed below, among others. However, no single factor determined whether the board approved the arrangement. Rather, it was the totality of the circumstances that drove the board’s decision.
Nature, extent, and quality of services
The board reviewed the quality of the fund’s investment management services over both the short and long term, and took into account the organizational depth and stability of the advisor. The board considered that PRIMECAP, founded in 1983, is recognized for its long-term approach to growth equity investing. Five experienced portfolio managers are responsible for separate subportfolios, and each portfolio manager employs a fundamental, research-driven approach in seeking to identify companies with long-term growth potential that the market has yet to appreciate. The multi-counselor approach employed by PRIMECAP is designed to emphasize individual decision-making and enable the portfolio managers to invest in their highest-conviction ideas. The advisor’s fundamental research focuses on developing opinions independent from Wall Street’s consensus and maintaining a long-term horizon. PRIMECAP has managed the fund since its inception in 1984.
The board concluded that the advisor’s experience, stability, depth, and performance, among other factors, warranted continuation of the advisory arrangement.
Investment performance
The board considered the short- and long-term performance of the fund, including any periods of outperformance or underperformance compared with a relevant benchmark index and peer group. The board concluded that the performance was such that the advisory arrangement should continue. Information about the fund’s most recent performance can be found in the Performance Summary section of this report.
30
Cost
The board concluded that the fund’s expense ratio was well below the average expense ratio charged by funds in its peer group and that the fund’s advisory fee rate was also well below its peer-group average. Information about the fund’s expense ratio appears in the About Your Fund’s Expenses section of this report as well as in the Financial Statements section, which also includes information about the fund’s advisory fee rate.
The board did not consider the profitability of PRIMECAP in determining whether to approve the advisory fee, because PRIMECAP is independent of Vanguard and the advisory fee is the result of arm’s-length negotiations.
The benefit of economies of scale
The board concluded that the fund’s shareholders benefit from economies of scale because of breakpoints in the fund’s advisory fee schedule. The breakpoints reduce the effective rate of the fee as the fund’s assets increase.
The board will consider whether to renew the advisory arrangement again after a one-year period.
31
Glossary
30-Day SEC Yield. A fund’s 30-day SEC yield is derived using a formula specified by the U.S. Securities and Exchange Commission. Under the formula, data related to the fund’s security holdings in the previous 30 days are used to calculate the fund’s hypothetical net income for that period, which is then annualized and divided by the fund’s estimated average net assets over the calculation period. For the purposes of this calculation, a security’s income is based on its current market yield to maturity (for bonds), its actual income (for asset-backed securities), or its projected dividend yield (for stocks). Because the SEC yield represents hypothetical annualized income, it will differ—at times significantly—from the fund’s actual experience. As a result, the fund’s income distributions may be higher or lower than implied by the SEC yield.
Beta. A measure of the magnitude of a fund’s past share-price fluctuations in relation to the ups and downs of a given market index. The index is assigned a beta of 1.00. Compared with a given index, a fund with a beta of 1.20 typically would have seen its share price rise or fall by 12% when the index rose or fell by 10%. For this report, beta is based on returns over the past 36 months for both the fund and the index. Note that a fund’s beta should be reviewed in conjunction with its R-squared (see definition). The lower the R-squared, the less correlation there is between the fund and the index, and the less reliable beta is as an indicator of volatility.
Dividend Yield. Dividend income earned by stocks, expressed as a percentage of the aggregate market value (or of net asset value, for a fund). The yield is determined by dividing the amount of the annual dividends by the aggregate value (or net asset value) at the end of the period. For a fund, the dividend yield is based solely on stock holdings and does not include any income produced by other investments.
Earnings Growth Rate. The average annual rate of growth in earnings over the past five years for the stocks now in a fund.
Equity Exposure. A measure that reflects a fund’s investments in stocks and stock futures. Any holdings in short-term reserves are excluded.
Expense Ratio. A fund’s total annual operating expenses expressed as a percentage of the fund’s average net assets. The expense ratio includes management and administrative expenses, but does not include the transaction costs of buying and selling portfolio securities.
Foreign Holdings. The percentage of a fund represented by securities or depositary receipts of companies based outside the United States.
Inception Date. The date on which the assets of a fund (or one of its share classes) are first invested in accordance with the fund’s investment objective. For funds with a subscription period, the inception date is the day after that period ends. Investment performance is measured from the inception date.
Median Market Cap. An indicator of the size of companies in which a fund invests; the midpoint of market capitalization (market price x shares outstanding) of a fund’s stocks, weighted by the proportion of the fund’s assets invested in each stock. Stocks representing half of the fund’s assets have market capitalizations above the median, and the rest are below it.
Price/Book Ratio. The share price of a stock divided by its net worth, or book value, per share. For a fund, the weighted average price/book ratio of the stocks it holds.
32
Price/Earnings Ratio. The ratio of a stock’s current price to its per-share earnings over the past year. For a fund, the weighted average P/E of the stocks it holds. P/E is an indicator of market expectations about corporate prospects; the higher the P/E, the greater the expectations for a company’s future growth.
R-Squared. A measure of how much of a fund’s past returns can be explained by the returns from the market in general, as measured by a given index. If a fund’s total returns were precisely synchronized with an index’s returns, its R-squared would be 1.00. If the fund’s returns bore no relationship to the index’s returns, its R-squared would be 0. For this report, R-squared is based on returns over the past 36 months for both the fund and the index.
Return on Equity. The annual average rate of return generated by a company during the past five years for each dollar of shareholder’s equity (net income divided by shareholder’s equity). For a fund, the weighted average return on equity for the companies whose stocks it holds.
Short-Term Reserves. The percentage of a fund invested in highly liquid, short-term securities that can be readily converted to cash.
Turnover Rate. An indication of the fund’s trading activity. Funds with high turnover rates incur higher transaction costs and may be more likely to distribute capital gains (which may be taxable to investors). The turnover rate excludes in-kind transactions, which have minimal impact on costs.
33
The Global Industry Classification Standard (“GICS”) was developed by and is the exclusive property and a service mark of MSCI Inc. (“MSCI”) and Standard and Poor’s, a division of McGraw-Hill Companies, Inc. (“S&P”), and is licensed for use by Vanguard. Neither MSCI, S&P nor any third party involved in making or compiling the GICS or any GICS classification makes any express or implied warranties or representations with respect to such standard or classification (or the results to be obtained by the use thereof), and all such parties hereby expressly disclaim all warranties of originality, accuracy, completeness, merchantability or fitness for a particular purpose with respect to any such standard or classification. Without limiting any of the foregoing, in no event shall MSCI, S&P, any of its affiliates or any third party involved in making or compiling the GICS or any GICS classification have any liability for any direct, indirect, special, punitive, consequential or any other damages (including lost profits) even if notified of the possibility of such damages.
34
The People Who Govern Your Fund
The trustees of your mutual fund are there to see that the fund is operated and managed in your best interests since, as a shareholder, you are a part owner of the fund. Your fund’s trustees also serve on the board of directors of The Vanguard Group, Inc., which is owned by the Vanguard funds and provides services to them on an at-cost basis.
A majority of Vanguard’s board members are independent, meaning that they have no affiliation with Vanguard or the funds they oversee, apart from the sizable personal investments they have made as private individuals. The independent board members have distinguished backgrounds in business, academia, and public service. Each of the trustees and executive officers oversees 198 Vanguard funds.
Information for each trustee and executive officer of the fund appears below. The mailing address of the trustees and officers is P.O. Box 876, Valley Forge, PA 19482. More information about the trustees is in the Statement of Additional Information, which can be obtained, without charge, by contacting Vanguard at 800-662-7447, or online at vanguard.com.
Interested Trustee1
F. William McNabb III
Born 1957. Trustee Since July 2009. Chairman of the Board. Principal Occupation(s) During the Past Five Years and Other Experience: Chairman of the Board of The Vanguard Group, Inc., and of each of the investment companies served by The Vanguard Group, since January 2010; Chief Executive Officer and Director of The Vanguard Group and President and Chief Executive Officer of each of the investment companies served by The Vanguard Group, since 2008; Director of Vanguard Marketing Corporation; President of The Vanguard Group (2008–2017); Managing Director of The Vanguard Group (1995–2008).
Independent Trustees
Emerson U. Fullwood
Born 1948. Trustee Since January 2008. Principal Occupation(s) During the Past Five Years and Other Experience: Executive Chief Staff and Marketing Officer for North America and Corporate Vice President (retired 2008) of Xerox Corporation (document management products and services);
Executive in Residence and 2009–2010 Distinguished Minett Professor at the Rochester Institute of Technology; Lead Director of SPX FLOW, Inc. (multi-industry manufacturing); Director of the United Way of Rochester, the University of Rochester Medical Center, Monroe Community College Foundation, North Carolina A&T University, and Roberts Wesleyan College; Trustee of the University of Rochester.
Rajiv L. Gupta
Born 1945. Trustee Since December 2001.2 Principal Occupation(s) During the Past Five Years and Other Experience: Chairman and Chief Executive Officer (retired 2009) and President (2006–2008) of Rohm and Haas Co. (chemicals); Director of Arconic Inc. (diversified manufacturer), HP Inc. (printer and personal computer manufacturing), and Delphi Automotive plc (automotive components); Senior Advisor at New Mountain Capital.
Amy Gutmann
Born 1949. Trustee Since June 2006. Principal Occupation(s) During the Past Five Years and Other Experience: President of the University of Pennsylvania; Christopher H. Browne
1 Mr. McNabb is considered an “interested person,” as defined in the Investment Company Act of 1940, because he is an officer of the Vanguard funds.
2 December 2002 for Vanguard Equity Income Fund, the Vanguard Municipal Bond Funds, and the Vanguard State Tax-Exempt Funds.
Distinguished Professor of Political Science, School of Arts and Sciences, and Professor of Communication, Annenberg School for Communication, with secondary faculty appointments in the Department of Philosophy, School of Arts and Sciences, and at the Graduate School of Education, University of Pennsylvania; Trustee of the National Constitution Center.
JoAnn Heffernan Heisen
Born 1950. Trustee Since July 1998. Principal Occupation(s) During the Past Five Years and Other Experience: Corporate Vice President and Member of the Executive Committee (1997–2008), Chief Global Diversity Officer (retired 2008), Vice President and Chief Information Officer (1997–2006), Controller (1995–1997), Treasurer (1991–1995), and Assistant Treasurer (1989–1991) of Johnson & Johnson (pharmaceuticals/medical devices/ consumer products); Director of Skytop Lodge Corporation (hotels) and the Robert Wood Johnson Foundation; Member of the Advisory Board of the Institute for Women’s Leadership at Rutgers University.
F. Joseph Loughrey
Born 1949. Trustee Since October 2009. Principal Occupation(s) During the Past Five Years and Other Experience: President and Chief Operating Officer (retired 2009) of Cummins Inc. (industrial machinery); Chairman of the Board of Hillenbrand, Inc. (specialized consumer services), Oxfam America, and the Lumina Foundation for Education; Director of the V Foundation for Cancer Research; Member of the Advisory Council for the College of Arts and Letters and Chair of the Advisory Board to the Kellogg Institute for International Studies, both at the University of Notre Dame.
Mark Loughridge
Born 1953. Trustee Since March 2012. Principal Occupation(s) During the Past Five Years and Other Experience: Senior Vice President and Chief Financial Officer (retired 2013) at IBM (information technology services); Fiduciary Member of IBM’s Retirement Plan Committee (2004–2013); Member of the Council on Chicago Booth.
Scott C. Malpass
Born 1962. Trustee Since March 2012. Principal Occupation(s) During the Past Five Years and Other Experience: Chief Investment Officer and Vice President at the University of Notre Dame; Assistant Professor of Finance at the Mendoza College of Business at Notre Dame; Member of the Notre Dame 403(b) Investment Committee, the Board of Advisors for Spruceview Capital Partners, the Board of Catholic Investment Services, Inc. (investment advisor), and the Board of Superintendence of the Institute for the Works of Religion; Chairman of the Board of TIFF Advisory Services, Inc. (investment advisor).
André F. Perold
Born 1952. Trustee Since December 2004. Principal Occupation(s) During the Past Five Years and Other Experience: George Gund Professor of Finance and Banking, Emeritus at the Harvard Business School (retired 2011); Chief Investment Officer and Co-Managing Partner of HighVista Strategies LLC (private investment firm); Overseer of the Museum of Fine Arts Boston.
Peter F. Volanakis
Born 1955. Trustee Since July 2009. Principal Occupation(s) During the Past Five Years and Other Experience: President and Chief Operating Officer (retired 2010) of Corning Incorporated (communications equipment); Chairman of the Board of Trustees of Colby-Sawyer College; Member of the Board of Hypertherm, Inc. (industrial cutting systems, software, and consumables).
Executive Officers
Glenn Booraem
Born 1967. Investment Stewardship Officer Since February 2017. Principal Occupation(s) During the Past Five Years and Other Experience: Principal of The Vanguard Group, Inc.; Treasurer (2015–2017), Controller (2010–2015), and Assistant Controller (2001–2010) of each of the investment companies served by The Vanguard Group.
Thomas J. Higgins
Born 1957. Chief Financial Officer Since September 2008. Principal Occupation(s) During the Past Five Years and Other Experience: Principal of The Vanguard Group, Inc.; Chief Financial Officer of each of the investment companies served by The Vanguard Group; Treasurer of each of the investment companies served by The Vanguard Group (1998–2008).
Peter Mahoney
Born 1974. Controller Since May 2015. Principal Occupation(s) During the Past Five Years and Other Experience: Principal of The Vanguard Group, Inc.; Controller of each of the investment companies served by The Vanguard Group; Head of International Fund Services at The Vanguard Group (2008–2014).
Anne E. Robinson
Born 1970. Secretary Since September 2016. Principal Occupation(s) During the Past Five Years and Other Experience: Managing Director of The Vanguard Group, Inc.; General Counsel of The Vanguard Group; Secretary of The Vanguard Group and of each of the investment companies served by The Vanguard Group; Director and Senior Vice President of Vanguard Marketing Corporation; Managing Director and General Counsel of Global Cards and Consumer Services at Citigroup (2014–2016); Counsel at American Express (2003–2014).
Michael Rollings
Born 1963. Treasurer Since February 2017. Principal Occupation(s) During the Past Five Years and Other Experience: Managing Director of The Vanguard Group, Inc.; Treasurer of each of the investment companies served by The Vanguard Group; Director of Vanguard Marketing Corporation; Executive Vice President and Chief Financial Officer of MassMutual Financial Group (2006–2016).
| |
| Vanguard Senior Management Team |
| |
| Mortimer J. Buckley | Chris D. McIsaac |
| Gregory Davis | James M. Norris |
| John James | Thomas M. Rampulla |
| Martha G. King | Karin A. Risi |
| John T. Marcante | |
| |
| |
| Chairman Emeritus and Senior Advisor |
| |
| John J. Brennan | |
| Chairman, 1996–2009 | |
| Chief Executive Officer and President, 1996–2008 |
| |
| |
| Founder | |
| |
| John C. Bogle | |
| Chairman and Chief Executive Officer, 1974–1996 |
|  |
| P.O. Box 2600 |
| Valley Forge, PA 19482-2600 |
Connect with Vanguard® > vanguard.com
| |
| Fund Information > 800-662-7447 | |
| Direct Investor Account Services > 800-662-2739 | |
| Institutional Investor Services > 800-523-1036 | |
| Text Telephone for People | |
| Who Are Deaf or Hard of Hearing> 800-749-7273 | |
| |
| This material may be used in conjunction | |
| with the offering of shares of any Vanguard | |
| fund only if preceded or accompanied by | |
| the fund’s current prospectus. | |
| |
| All comparative mutual fund data are from Lipper, a | |
| Thomson Reuters Company, or Morningstar, Inc., unless | |
| otherwise noted. | |
| |
| You can obtain a free copy of Vanguard’s proxy voting | |
| guidelines by visiting vanguard.com/proxyreporting or by | |
| calling Vanguard at 800-662-2739. The guidelines are | |
| also available from the SEC’s website, sec.gov. In | |
| addition, you may obtain a free report on how your fund | |
| voted the proxies for securities it owned during the 12 | |
| months ended June 30. To get the report, visit either | |
| vanguard.com/proxyreporting or sec.gov. | |
| |
| You can review and copy information about your fund at | |
| the SEC’s Public Reference Room in Washington, D.C. To | |
| find out more about this public service, call the SEC at | |
| 202-551-8090. Information about your fund is also | |
| available on the SEC’s website, and you can receive | |
| copies of this information, for a fee, by sending a | |
| request in either of two ways: via email addressed to | |
| publicinfo@sec.gov or via regular mail addressed to the | |
| Public Reference Section, Securities and Exchange | |
| Commission, Washington, DC 20549-1520. | |
| | © 2017 The Vanguard Group, Inc. |
| | All rights reserved. |
| | Vanguard Marketing Corporation, Distributor. |
| |
| | Q590 112017 |
 |
| Annual Report | September 30, 2017 |
| |
| Vanguard Target Retirement Funds |
| Vanguard Target Retirement Income Fund |
| Vanguard Target Retirement 2015 Fund |
| Vanguard Target Retirement 2020 Fund |
| Vanguard Target Retirement 2025 Fund |
| Vanguard Target Retirement 2030 Fund |
| Vanguard Target Retirement 2035 Fund |
Vanguard’s Principles for Investing Success
We want to give you the best chance of investment success. These principles, grounded in Vanguard’s research and experience, can put you on the right path.
Goals. Create clear, appropriate investment goals.
Balance. Develop a suitable asset allocation using broadly diversified funds. Cost. Minimize cost.
Discipline. Maintain perspective and long-term discipline.
A single theme unites these principles: Focus on the things you can control. We believe there is no wiser course for any investor.
| |
| Contents | |
| Your Fund’s Performance at a Glance. | 1 |
| Chairman’s Perspective. | 4 |
| Target Retirement Income Fund. | 8 |
| Target Retirement 2015 Fund. | 20 |
| Target Retirement 2020 Fund. | 31 |
| Target Retirement 2025 Fund. | 42 |
| Target Retirement 2030 Fund. | 53 |
| Target Retirement 2035 Fund. | 64 |
| Your Fund’s After-Tax Returns. | 78 |
| About Your Fund’s Expenses. | 80 |
| Glossary. | 82 |
Please note: The opinions expressed in this report are just that—informed opinions. They should not be considered promises or advice. Also, please keep in mind that the information and opinions cover the period through the date on the front of this report. Of course, the risks of investing in your fund are spelled out in the prospectus.
See the Glossary for definitions of investment terms used in this report.
About the cover: Nautical images have been part of Vanguard’s rich heritage since its start in 1975. For an incoming ship, a lighthouse offers a beacon and safe path to shore. You can similarly depend on Vanguard to put you first––and light the way––as you strive to meet your financial goals. Our client focus and low costs, stemming from our unique ownership structure, assure that your interests are paramount.
Your Fund’s Performance at a Glance
• For the 12 months ended September 30, 2017, the six Vanguard Target Retirement Funds covered in this report recorded returns ranging from 5.26% for the Target Retirement Income Fund to 14.76% for the Target Retirement 2035 Fund. (The funds with retirement dates of 2040 through 2065 are covered in a separate report.) The funds with a greater allocation to stocks performed best.
• Each fund posted returns that were in line with those of its composite benchmark after expenses. All but two funds surpassed the average returns of their peers.
• Vanguard Target Retirement Funds are designed to reach an allocation of 70% bonds and 30% stocks within seven years after their target dates.
• For the ten years ended September 30, 2017, the funds’ average annual returns ranged from 4.87% for the Target Retirement Income Fund to 5.46% for the Target Retirement 2035 Fund.
• Please note that during the third quarter the 2010 Fund was merged with the Target Retirement Income Fund, as their asset allocations became identical.
| |
| Total Returns: Fiscal Year Ended September 30, 2017 | |
| | Total |
| | Returns |
| Vanguard Target Retirement Income Fund | 5.26% |
| Target Income Composite Index | 5.44 |
| Mixed-Asset Target Today Funds Average | 5.95 |
| Mixed-Asset Target Today Funds Average: Derived from data provided by Lipper, a Thomson Reuters Company. | |
| |
| Vanguard Target Retirement 2015 Fund | 7.95% |
| Target 2015 Composite Index | 8.16 |
| Mixed-Asset Target 2015 Funds Average | 8.04 |
| Mixed-Asset Target 2015 Funds Average: Derived from data provided by Lipper, a Thomson Reuters Company. | |
| |
| Vanguard Target Retirement 2020 Fund | 10.17% |
| Target 2020 Composite Index | 10.32 |
| Mixed-Asset Target 2020 Funds Average | 8.26 |
| Mixed-Asset Target 2020 Funds Average: Derived from data provided by Lipper, a Thomson Reuters Company. | |
| |
| Vanguard Target Retirement 2025 Fund | 11.74% |
| Target 2025 Composite Index | 11.97 |
| Mixed-Asset Target 2025 Funds Average | 10.44 |
| Mixed-Asset Target 2025 Funds Average: Derived from data provided by Lipper, a Thomson Reuters Company. | |
1
| |
| | Total |
| | Returns |
| Vanguard Target Retirement 2030 Fund | 13.25% |
| Target 2030 Composite Index | 13.44 |
| Mixed-Asset Target 2030 Funds Average | 12.14 |
| Mixed-Asset Target 2030 Funds Average: Derived from data provided by Lipper, a Thomson Reuters Company. | |
| |
| Vanguard Target Retirement 2035 Fund | 14.76% |
| Target 2035 Composite Index | 14.94 |
| Mixed-Asset Target 2035 Funds Average | 14.35 |
Mixed-Asset Target 2035 Funds Average: Derived from data provided by Lipper, a Thomson Reuters Company. For a benchmark description, see the Glossary.
Investments in Target Retirement Funds are subject to the risks of their underlying funds. The year in the fund name refers to the approximate year (the target date) when an investor in the fund would retire and leave the work force. The fund will gradually shift its emphasis from more aggressive investments to more conservative ones based on its target date. An investment in a Target Retirement Fund is not guaranteed at any time, including on or after the target date.
| |
| Total Returns: Ten Years Ended September 30, 2017 | |
| | Average |
| | Annual Return |
| Target Retirement Income Fund | 4.87% |
| Target Income Composite Index | 4.93 |
| Spliced Mixed-Asset Target Today Funds Average | 3.66 |
| Spliced Mixed-Asset Target Today Funds Average: Derived from data provided by Lipper, a Thomson Reuters Company. | |
| Target Retirement 2015 Fund | 4.88% |
| Target 2015 Composite Index | 4.92 |
| Mixed-Asset Target 2015 Funds Average | 3.31 |
| Mixed-Asset Target 2015 Funds Average: Derived from data provided by Lipper, a Thomson Reuters Company. | |
| Target Retirement 2020 Fund | 5.15% |
| Target 2020 Composite Index | 5.28 |
| Mixed-Asset Target 2020 Funds Average | 3.53 |
| Mixed-Asset Target 2020 Funds Average: Derived from data provided by Lipper, a Thomson Reuters Company. | |
| Target Retirement 2025 Fund | 5.21% |
| Target 2025 Composite Index | 5.37 |
| Mixed-Asset Target 2025 Funds Average | 3.87 |
| Mixed-Asset Target 2025 Funds Average: Derived from data provided by Lipper, a Thomson Reuters Company. | |
| Target Retirement 2030 Fund | 5.27% |
| Target 2030 Composite Index | 5.41 |
| Mixed-Asset Target 2030 Funds Average | 3.93 |
| Mixed-Asset Target 2030 Funds Average: Derived from data provided by Lipper, a Thomson Reuters Company. | |
2
| |
| | Average |
| | Annual Return |
| Target Retirement 2035 Fund | 5.46% |
| Target 2035 Composite Index | 5.60 |
| Mixed-Asset Target 2035 Funds Average | 4.38 |
| Mixed-Asset Target 2035 Funds Average: Derived from data provided by Lipper, a Thomson Reuters Company. | |
For a benchmark description, see the Glossary.
The figures shown represent past performance, which is not a guarantee of future results. (Current performance may be lower or higher than the performance data cited. For performance data current to the most recent month-end, visit our website at vanguard.com/performance.) Note, too, that both investment returns and principal value can fluctuate widely, so an investor’s shares, when sold, could be worth more or less than their original cost.
| | |
| Expense Ratios | | |
| Your Fund Compared With Its Peer Group | | |
| | Acquired Fund Fees | Peer Group |
| | and Expenses | Average |
| Target Retirement Income Fund | 0.13% | 0.43% |
| Target Retirement 2015 Fund | 0.14 | 0.35 |
| Target Retirement 2020 Fund | 0.14 | 0.45 |
| Target Retirement 2025 Fund | 0.14 | 0.40 |
| Target Retirement 2030 Fund | 0.15 | 0.44 |
| Target Retirement 2035 Fund | 0.15 | 0.40 |
The fund expense figures shown—drawn from the prospectus dated July 12, 2017—represent an estimate of the weighted average of the expense ratios and any transaction fees charged by the underlying mutual funds (the ”acquired” funds) in which the Target Retirement Funds invest. The Target Retirement Funds do not charge any expenses or fees of their own. For the fiscal year ended September 30, 2017, the acquired fund fees and expenses were 0.13% for the Income Fund, 0.13% for the 2015 Fund, 0.13% for the 2020 Fund, 0.14% for the 2025 Fund, 0.14% for the 2030 Fund, and 0.14% for the 2035 Fund. Peer-group expense ratios are derived from data provided by Lipper, a Thomson Reuters Company, and capture information through year-end 2016.
Peer groups: For the Income Fund, Mixed-Asset Target Today Funds Average; for the 2015 Fund, Mixed-Asset Target 2015 Funds; for the 2020 Fund, Mixed-Asset Target 2020 Funds; for the 2025 Fund, Mixed-Asset Target 2025 Funds; for the Target Retirement 2030 Fund, Mixed-Asset Target 2030 Funds; and for the Target Retirement 2035 Fund, Mixed-Asset Target 2035 Funds.
3
Chairman’s Perspective

Bill McNabb
Chairman and Chief Executive Officer
Dear Shareholder,
Our investors depend on Vanguard to be a responsible steward of their assets. This includes our obvious responsibilities—managing the funds, offering investment perspectives and advice, and assisting with questions and transactions.
But because a long-term perspective informs every aspect of our investment approach, we also work on your behalf in less obvious ways, such as by advocating for responsible governance among the companies in which Vanguard funds invest. Vanguard’s index funds are essentially permanent owners of thousands of publicly traded companies, and we have a special obligation to be engaged stewards actively focused on the long term.
Simply put, we believe that well-governed companies are more likely to perform well over the long run.
Although Vanguard has always been an advocate for strong corporate governance, we have expanded our efforts recently as our investor base continues to grow. Our Investment Stewardship team has doubled in size since 2015, and we continue to add analysts, researchers, and operations team members. The team guides our engagement activities and our funds’ proxy voting by analyzing corporate governance practices in companies around the world.
4
Our four Investment Stewardship pillars
As we evaluate company responsiveness to governance matters, including environmental and social concerns, we focus on four key areas—what we call our Investment Stewardship pillars:
• The board: A high-functioning, well-composed, independent, diverse, and experienced board with effective ongoing evaluation practices.
• Governance structures: Provisions and structures that empower shareholders and protect their rights.
• Appropriate compensation: Pay that incentivizes relative outperformance over the long term.
• Risk oversight: Effective, integrated, and ongoing oversight of relevant industry-and company-specific risks.
Guided by these pillars, our Investment Stewardship team conducted more than 950 engagements, or discussions, with company directors and leaders worldwide during the 12 months ended June 30, 2017.
| | | |
| Market Barometer | | | |
| | | Average Annual Total Returns |
| | Periods Ended September 30, 2017 |
| | One Year | Three Years | Five Years |
| Stocks | | | |
| Russell 1000 Index (Large-caps) | 18.54% | 10.63% | 14.27% |
| Russell 2000 Index (Small-caps) | 20.74 | 12.18 | 13.79 |
| Russell 3000 Index (Broad U.S. market) | 18.71 | 10.74 | 14.23 |
| FTSE All-World ex US Index (International) | 19.49 | 5.11 | 7.35 |
| |
| Bonds | | | |
| Bloomberg Barclays U.S. Aggregate Bond Index | | | |
| (Broad taxable market) | 0.07% | 2.71% | 2.06% |
| Bloomberg Barclays Municipal Bond Index | | | |
| (Broad tax-exempt market) | 0.87 | 3.19 | 3.01 |
| Citigroup Three-Month U.S. Treasury Bill Index | 0.64 | 0.28 | 0.18 |
| |
| CPI | | | |
| Consumer Price Index | 2.23% | 1.22% | 1.30% |
5
We also cast more than 171,000 votes on behalf of Vanguard funds at more than 18,000 shareholder meetings.
Gender diversity on boards and climate risk
As we engage with companies, we are devoting increased attention to two specific topics. The first is gender diversity on boards. It’s no secret that the right combination of talent, skills, and experience leads to better results, so we pay close attention to how company boards are structured and managed, and how they evolve.
In recent years, a growing body of research has demonstrated that greater diversity on boards can lead to improved governance and company performance. We are advocating for boards to incorporate diverse perspectives and experience into their strategic planning and decision-making. One example of our commitment to more diverse boards is our participation in the 30% Club, a global coalition working to increase the representation of women in boardrooms and leadership roles.
The second issue is climate risk. We will continue to engage with companies to understand their responses to this risk. Regardless of one’s perspective on the issue, the potential is real for changing regulations, demographics, and consumption behavior to affect business results for companies in many sectors.
We want to ensure that such business and regulatory risks are sufficiently disclosed so investors can value companies appropriately. In the past year, we have voted for shareholder proposals at several energy companies that called for management to improve its climate risk assessment and planning, and we will consider supporting similar proposals if we believe they are beneficial to long-term shareholder value. When a proposal from a shareholder presents a strong case for change, we’re more than willing to fully consider it. And even if the case falls short, these proposals often catalyze a discussion that generates meaningful change over time.
In addition to considering activists’ proposals, we consult research providers and our own network of experts. When we detect material risks to a company’s long-term value (such as bad leadership, poor disclosure, misaligned compensation structures, or threats to shareholder rights), we act with our voice and our vote.
Our stewardship reflects our mission
But we don’t act as independent agents with our own agenda. Every time we speak with a company chairman, CEO, or director, we’re acutely aware of the role we play in representing the economic interests of more than 20 million Vanguard investors. So you can expect us to speak out when we detect threats to the economic interests of our shareholders.
6
We take positions on these matters not because they are inherently good or noble but because they are tied to the long-term economic value of your funds’ investments.
You trust us to represent your interests across the globe. You can be confident we act on that responsibility with the seriousness and dedication it deserves.
To learn more about our Investment Stewardship program, including how our funds have voted, visit https://about. vanguard.com/investment-stewardship/.
As always, thank you for investing with Vanguard.
Sincerely,

F. William McNabb III
Chairman and Chief Executive Officer
October 13, 2017
7
Target Retirement Income Fund
Fund Profile
As of September 30, 2017
| |
| Total Fund Characteristics | |
| Ticker Symbol | VTINX |
| 30-Day SEC Yield | 1.80% |
| Acquired Fund Fees and Expenses1 | 0.13% |
| Allocation to Underlying Vanguard Funds | |
| Vanguard Total Bond Market II | |
| Index Fund Investor Shares | 37.2% |
| Vanguard Total Stock Market Index | |
| Fund Investor Shares | 18.2 |
| Vanguard Short-Term | |
| Inflation-Protected Securities Index | |
| Fund Investor Shares | 16.7 |
| Vanguard Total International Bond | |
| Index Fund Investor Shares | 15.8 |
| Vanguard Total International Stock | |
| Index Fund Investor Shares | 12.1 |
| | |
| Total Fund Volatility Measures | |
| | | Bloomberg |
| | Target | Barclays US |
| | Income | Aggregate |
| | Composite | Bond |
| | Index | Index |
| R-Squared | 0.99 | 0.18 |
| Beta | 0.98 | 0.51 |
These measures show the degree and timing of the fund’s fluctuations compared with the indexes over 36 months.
Fund Asset Allocation

1 This figure—drawn from the prospectus dated July 12, 2017—represents an estimate of the weighted average of the expense ratios and any transaction fees charged by the underlying mutual funds (the ”acquired” funds) in which the Target Retirement Income Fund invests. The fund does not charge any expenses or fees of its own. For the fiscal year ended September 30, 2017, the acquired fund fees and expenses were 0.13%.
8
Target Retirement Income Fund
Performance Summary
All of the returns in this report represent past performance, which is not a guarantee of future results that may be achieved by the fund. (Current performance may be lower or higher than the performance data cited. For performance data current to the most recent month-end, visit our website at vanguard.com/performance.) Note, too, that both investment returns and principal value can fluctuate widely, so an investor’s shares, when sold, could be worth more or less than their original cost. The returns shown do not reflect taxes that a shareholder would pay on fund distributions or on the sale of fund shares.
Cumulative Performance: September 30, 2007, Through September 30, 2017
Initial Investment of $10,000
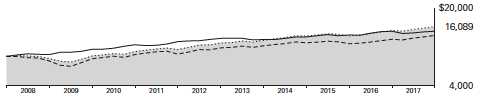
| | | | |
| | Average Annual Total Returns | |
| | Periods Ended September 30, 2017 | |
| | | | | Final Value |
| | One | Five | Ten | of a $10,000 |
| | Year | Years | Years | Investment |
| Target Retirement Income Fund* | 5.26% | 4.68% | 4.87% | $16,089 |
| Target Income Composite Index | 5.44 | 4.87 | 4.93 | 16,186 |
| Spliced Mixed-Asset Target Today | | | | |
| Funds Average | 5.95 | 4.06 | 3.66 | 14,331 |
| Bloomberg Barclays U.S. Aggregate | | | | |
| Bond Index | 0.07 | 2.06 | 4.27 | 15,196 |
For a benchmark description, see the Glossary.
Spliced Mixed-Asset Target Today Funds Average: Derived from data provided by Lipper, a Thomson Reuters Company.
See Financial Highlights for dividend and capital gains information.
9
Target Retirement Income Fund
Fiscal-Year Total Returns (%): September 30, 2007, Through September 30, 2017

10
Target Retirement Income Fund
Financial Statements
Statement of Net Assets
As of September 30, 2017
The fund reports a complete list of its holdings in regulatory filings four times in each fiscal year, at the quarter-ends. For the second and fourth fiscal quarters, the lists appear in the fund’s semiannual and annual reports to shareholders. For the first and third fiscal quarters, the fund files the lists with the Securities and Exchange Commission on Form N-Q. Shareholders can look up the fund’s Forms N-Q on the SEC’s website at sec.gov. Forms N-Q may also be reviewed and copied at the SEC’s Public Reference Room (see the back cover of this report for further information).
| | |
| | | Market |
| | | Value• |
| | Shares | ($000) |
| Investment Companies (100.0%) | | |
| U.S. Stock Fund (18.2%) | | |
| Vanguard Total Stock Market Index Fund Investor Shares | 47,980,002 | 3,024,180 |
| |
| International Stock Fund (12.1%) | | |
| Vanguard Total International Stock Index Fund Investor Shares | 114,645,817 | 2,014,327 |
| |
| U.S. Bond Funds (53.9%) | | |
| 1 Vanguard Total Bond Market II Index Fund Investor Shares | 576,481,296 | 6,197,174 |
| Vanguard Short-Term Inflation-Protected Securities | | |
| Index Fund Investor Shares | 112,050,112 | 2,775,481 |
| | | 8,972,655 |
| International Bond Fund (15.8%) | | |
| Vanguard Total International Bond Index Fund Investor Shares | 240,863,823 | 2,623,007 |
| Total Investment Companies (Cost $14,047,400) | | 16,634,169 |
| Temporary Cash Investment (0.0%) | | |
| Money Market Fund (0.0%) | | |
| 1 Vanguard Market Liquidity Fund, 1.223% (Cost $2,961) | 29,605 | 2,961 |
| Total Investments (100.0%) (Cost $14,050,361) | | 16,637,130 |
| Other Assets and Liabilities (0.0%) | | |
| Other Assets | | 55,529 |
| Liabilities | | (47,663) |
| | | 7,866 |
| Net Assets (100%) | | |
| Applicable to 1,236,182,295 outstanding $.001 par value shares of | | |
| beneficial interest (unlimited authorization) | | 16,644,996 |
| Net Asset Value Per Share | | $13.46 |
11
| |
| Target Retirement Income Fund | |
| |
| |
| |
| |
| | Amount |
| | ($000) |
| Statement of Assets and Liabilities | |
| Assets | |
| Investments in Securities, at Value—Affiliated Vanguard Funds | 16,637,130 |
| Receivables for Investment Securities Sold | 22,172 |
| Receivables for Accrued Income | 14,440 |
| Receivables for Capital Shares Issued | 18,917 |
| Total Assets | 16,692,659 |
| Liabilities | |
| Payables for Investment Securities Purchased | 16,938 |
| Payables for Capital Shares Redeemed | 27,353 |
| Other Liabilities | 3,372 |
| Total Liabilities | 47,663 |
| Net Assets | 16,644,996 |
| |
| |
| At September 30, 2017, net assets consisted of: | |
| | Amount |
| | ($000) |
| Paid-in Capital | 13,988,823 |
| Undistributed Net Investment Income | 6,201 |
| Accumulated Net Realized Gains | 63,203 |
| Unrealized Appreciation (Depreciation) | 2,586,769 |
| Net Assets | 16,644,996 |
• See Note A in Notes to Financial Statements.
1 Affiliated fund available only to Vanguard funds and certain trusts and accounts managed by Vanguard. Rate shown for Vanguard Market Liquidity Fund is the 7-day yield.
See accompanying Notes, which are an integral part of the Financial Statements.
12
| |
| Target Retirement Income Fund | |
| |
| |
| Statement of Operations | |
| |
| | Year Ended |
| | September 30, 2017 |
| | ($000) |
| Investment Income | |
| Income | |
| Income Distributions Received from Affiliated Funds | 227,170 |
| Net Investment Income—Note B | 227,170 |
| Realized Net Gain (Loss) | |
| Capital Gain Distributions Received from Affiliated Funds | 4,082 |
| Affiliated Investment Securities Sold | 83,411 |
| Realized Net Gain (Loss) | 87,493 |
| Change in Unrealized Appreciation (Depreciation) of Investment Securities | 303,251 |
| Net Increase (Decrease) in Net Assets Resulting from Operations | 617,914 |
See accompanying Notes, which are an integral part of the Financial Statements.
13
| | |
| Target Retirement Income Fund | | |
| |
| |
| Statement of Changes in Net Assets | | |
| |
| | Year Ended September 30, |
| | 2017 | 2016 |
| | ($000) | ($000) |
| Increase (Decrease) in Net Assets | | |
| Operations | | |
| Net Investment Income | 227,170 | 186,663 |
| Realized Net Gain (Loss) | 87,493 | 68,724 |
| Change in Unrealized Appreciation (Depreciation) | 303,251 | 510,311 |
| Net Increase (Decrease) in Net Assets Resulting from Operations | 617,914 | 765,698 |
| Distributions | | |
| Net Investment Income | (230,482) | (185,318) |
| Realized Capital Gain1 | (34,498) | (171,451) |
| Total Distributions | (264,980) | (356,769) |
| Capital Share Transactions | | |
| Issued | 3,494,664 | 2,074,919 |
| Issued in Connection with Acquisition of | | |
| Vanguard Target Retirement 2010 Fund—Note F | 4,889,025 | — |
| Issued in Lieu of Cash Distributions | 252,814 | 340,239 |
| Redeemed | (3,134,272) | (2,667,677) |
| Net Increase (Decrease) from Capital Share Transactions | 5,502,231 | (252,519) |
| Total Increase (Decrease) | 5,855,165 | 156,410 |
| Net Assets | | |
| Beginning of Period | 10,789,831 | 10,633,421 |
| End of Period2 | 16,644,996 | 10,789,831 |
1 Includes fiscal 2017 and 2016 short-term gain distributions totaling $3,515,000 and $8,126,000, respectively. Short-term gain distributions are treated as ordinary income dividends for tax purposes.
2 Net Assets—End of Period includes undistributed (overdistributed) net investment income of $6,201,000 and $9,513,000.
See accompanying Notes, which are an integral part of the Financial Statements.
14
| | | | | |
| Target Retirement Income Fund | | | | | |
| |
| |
| Financial Highlights | | | | | |
| |
| |
| For a Share Outstanding | | | Year Ended September 30, |
| Throughout Each Period | 2017 | 2016 | 2015 | 2014 | 2013 |
| Net Asset Value, Beginning of Period | $13.08 | $12.59 | $12.84 | $12.46 | $12.23 |
| Investment Operations | | | | | |
| Net Investment Income | . 2501 | .229 | .238 | .220 | .246 |
| Capital Gain Distributions Received | .0041 | .007 | .015 | .002 | .067 |
| Net Realized and Unrealized Gain (Loss) | | | | | |
| on Investments | .422 | .692 | (. 225) | .572 | .185 |
| Total from Investment Operations | .676 | . 928 | .028 | .794 | .498 |
| Distributions | | | | | |
| Dividends from Net Investment Income | (. 254) | (. 227) | (. 236) | (. 218) | (. 247) |
| Distributions from Realized Capital Gains | (. 042) | (. 211) | (. 042) | (.196) | (. 021) |
| Total Distributions | (. 296) | (. 438) | (. 278) | (. 414) | (. 268) |
| Net Asset Value, End of Period | $13.46 | $13.08 | $12.59 | $12.84 | $12.46 |
| |
| Total Return2 | 5.26% | 7.54% | 0.18% | 6.47% | 4.12% |
| |
| Ratios/Supplemental Data | | | | | |
| Net Assets, End of Period (Millions) | $16,645 | $10,790 | $10,633 | $11,215 | $10,163 |
| Ratio of Total Expenses to Average Net Assets | — | — | — | — | — |
| Acquired Fund Fees and Expenses | 0.13% | 0.13% | 0.14% | 0.16% | 0.16% |
| Ratio of Net Investment Income to | | | | | |
| Average Net Assets | 1.90% | 1.78% | 1.83% | 1.74% | 1.99% |
| Portfolio Turnover Rate | 8% | 11% | 14% | 6% | 40% |
1 Calculated based on average shares outstanding.
2 Total returns do not include account service fees that may have applied in the periods shown. Fund prospectuses provide information about any applicable account service fees.
See accompanying Notes, which are an integral part of the Financial Statements.
15
Target Retirement Income Fund
Notes to Financial Statements
Vanguard Target Retirement Income Fund is registered under the Investment Company Act of 1940 as an open-end investment company, or mutual fund. The fund follows a balanced investment strategy by investing in selected Vanguard funds to achieve its targeted allocation of assets to U.S. and international stocks, and U.S. and international bonds. Financial statements and other information about each underlying fund are available on vanguard.com.
A. The following significant accounting policies conform to generally accepted accounting principles for U.S. investment companies. The fund consistently follows such policies in preparing its financial statements.
1. Security Valuation: Investments are valued at the net asset value of each underlying Vanguard fund determined as of the close of the New York Stock Exchange (generally 4 p.m., Eastern time) on the valuation date.
2. Federal Income Taxes: The fund intends to continue to qualify as a regulated investment company and distribute all of its taxable income. Management has analyzed the fund’s tax positions taken for all open federal income tax years (September 30, 2014–2017), and has concluded that no provision for federal income tax is required in the fund’s financial statements.
3. Distributions: Distributions to shareholders are recorded on the ex-dividend date.
4. Credit Facility: The fund and certain other funds managed by The Vanguard Group (“Vanguard”) participate in a $3.1 billion committed credit facility provided by a syndicate of lenders pursuant to a credit agreement that may be renewed annually; each fund is individually liable for its borrowings, if any, under the credit facility. Borrowings may be utilized for temporary and emergency purposes, and are subject to the fund’s regulatory and contractual borrowing restrictions. The participating funds are charged administrative fees and an annual commitment fee of 0.10% of the undrawn amount of the facility; these fees are allocated to the funds based on a method approved by the fund’s board of trustees and borne by the funds in which the fund invests (see Note B). Any borrowings under this facility bear interest at a rate based upon the higher of the one-month London Interbank Offered Rate, federal funds effective rate, or overnight bank funding rate plus an agreed-upon spread.
The fund had no borrowings outstanding at September 30, 2017, or at any time during the period then ended.
5. Other: Income and capital gain distributions received are recorded on the ex-dividend date. Security transactions are accounted for on the date securities are bought or sold. Costs used to determine realized gains (losses) on the sale of investment securities are those of the specific securities sold.
B. In accordance with the terms of a Funds’ Service Agreement (the “FSA”) between Vanguard and the fund, Vanguard furnishes to the fund investment advisory, corporate management, administrative, marketing, and distribution services at Vanguard’s cost of operations (as defined by the FSA). These costs of operations are allocated to the fund based on methods and guidelines approved by the board of trustees. The FSA provides that expenses otherwise allocable to Vanguard funds-of-funds may be reduced or eliminated to the extent of savings realized by the underlying Vanguard funds by virtue of being part of a fund-of-funds. Accordingly, all expenses for services provided by Vanguard to the fund and all other expenses incurred by the fund during
16
Target Retirement Income Fund
the period ended September 30, 2017, were borne by the underlying Vanguard funds in which the fund invests. The fund’s trustees and officers are also trustees and officers, respectively, of the underlying Vanguard funds, as well as directors and employees, respectively, of Vanguard.
C. Various inputs may be used to determine the value of the fund’s investments. These inputs are summarized in three broad levels for financial statement purposes. The inputs or methodologies used to value securities are not necessarily an indication of the risk associated with investing in those securities.
Level 1—Quoted prices in active markets for identical securities.
Level 2—Other significant observable inputs (including quoted prices for similar securities, interest rates, prepayment speeds, credit risk, etc.).
Level 3—Significant unobservable inputs (including the fund’s own assumptions used to determine the fair value of investments). Any investments valued with significant unobservable inputs are noted on the Statement of Net Assets.
At September 30, 2017, 100% of the market value of the fund’s investments was determined based on Level 1 inputs.
D. Distributions are determined on a tax basis and may differ from net investment income and realized capital gains for financial reporting purposes. Differences may be permanent or temporary. Permanent differences are reclassified among capital accounts in the financial statements to reflect their tax character. Temporary differences arise when certain items of income, expense, gain, or loss are recognized in different periods for financial statement and tax purposes. These differences will reverse at some time in the future. Differences in classification may also result from the treatment of short-term gains as ordinary income for tax purposes.
The fund used a tax accounting practice to treat a portion of the price of capital shares redeemed during the year as distributions from realized capital gains. Accordingly, the fund has reclassified $16,391,000 from accumulated net realized gains to paid-in capital.
For tax purposes, at September 30, 2017, the fund had $9,905,000 of ordinary income and $59,499,000 of long-term capital gains available for distribution.
At September 30, 2017, the cost of investment securities for tax purposes was $14,050,361,000. Net unrealized appreciation of investment securities for tax purposes was $2,586,769,000, consisting of unrealized gains of $2,587,161,000 on securities that had risen in value since their purchase and $392,000 in unrealized losses on securities that had fallen in value since their purchase.
17
| | |
| Target Retirement Income Fund | | |
| |
| |
| |
| |
| E. Capital shares issued and redeemed were: | | |
| | Year Ended September 30, |
| | 2017 | 2016 |
| | Shares | Shares |
| | (000) | (000) |
| Issued | 264,346 | 162,780 |
| Issued in Connection with Acquisition of Vanguard | | |
| Target Retirement 2010 Fund | 366,108 | — |
| Issued in Lieu of Cash Distributions | 19,353 | 26,995 |
| Redeemed | (238,265) | (209,799) |
| Net Increase (Decrease) in Shares Outstanding | 411,542 | (20,024) |
F. On July 21, 2017, the fund acquired all the net assets of Vanguard Target Retirement 2010 Fund pursuant to a plan of reorganization approved by the funds’ board of trustees. The purpose of the transaction was to combine two funds with comparable investment objectives. The acquisition was accomplished by a tax-free exchange of 366,108,000 shares of the fund for 191,723,000 shares of the Vanguard Target Retirement 2010 Fund outstanding as of the close of business on July 21, 2017. The Vanguard Target Retirement 2010 Fund’s net assets as of the close of business on July 21, 2017, of $4,899,025,000, including $810,947,000 of unrealized appreciation, were combined with the fund’s net assets. The net assets of the fund immediately before the acquisition were $11,585,554,000. The net assets of the fund immediately following the acquisition were $16,484,579,000.
Assuming that the acquisition had been completed on October 1, 2016, the beginning of the fund’s reporting period, the fund’s pro forma results of operations for the year ended September 30, 2017, would be:
| |
| | ($000) |
| Net Investment Income | 309,270 |
| Realized Net Gain (Loss) | 305,963 |
| Change in Unrealized Appreciation (Depreciation) | 225,401 |
| Net Increase (Decrease) in Net Assets Resulting from Operations | 840,634 |
Because the combined funds have been managed as a single integrated fund since the acquisition was completed, it is not practical to separate the results of operations of Vanguard Target Retirement 2010 Fund that have been included in the fund’s statement of operations since July 21, 2017.
18
Target Retirement Income Fund
G. Transactions during the period in affiliated underlying Vanguard funds were as follows:
| | | | | | | | |
| | | | | | Current Period Transactions |
| | Sept. 30, | | Proceeds | | | | | Sept. 30, |
| | 2016 | | from | Realized | Change in | | Capital Gain | 2017 |
| Market | Purchases | Securities | Net Gain | Unrealized | | Distributions | Market |
| | Value | at Cost | Sold | (Loss) | App. (Dep.) | Income | Received | Value |
| | ($000) | ($000) | ($000) | ($000) | ($000) | ($000) | ($000) | ($000) |
| Vanguard Market | | | | | | | | |
| Liquidity Fund | 371 | NA1 | NA1 | — | — | 28 | — | 2,961 |
| Vanguard Short-Term | | | | | | | |
| Inflation-Protected | | | | | | | | |
| Securities Index | | | | | | | | |
| Fund | 1,812,902 | 1,047,998 | 81,741 | (81) | (3,597) | 9,745 | — | 2,775,481 |
| Vanguard Total | | | | | | | | |
| Bond Market II | | | | | | | | |
| Index Fund | 4,017,379 | 2,421,932 | 243,272 | 39 | 1,096 105,652 | 4,082 | 6,197,174 |
| Vanguard Total | | | | | | | | |
| International Bond | | | | | | | | |
| Index Fund | 1,718,889 | 932,682 | 35,940 | (50) | 7,426 | 31,715 | — | 2,623,007 |
| Vanguard Total | | | | | | | | |
| International Stock | | | | | | | | |
| Index Fund | 1,303,867 | 602,401 | 205,361 | (2,610) | 316,030 | 39,487 | — | 2,014,327 |
| Vanguard Total | | | | | | | | |
| Stock Market | | | | | | | | |
| Index Fund | 1,951,622 | 554,962 | 361,760 | 86,113 | 793,243 | 40,543 | — | 3,024,180 |
| Total | 10,805,030 | 5,559,9752 | 928,074 | 83,411 | 1,114,1982 | 227,170 | 4,082 | 16,637,130 |
1 Not applicable—purchases and sales are for temporary cash investment purposes.
2 Includes securities of $4,067,332,000 and unrealized appreciation of $810,947,000 related to the acquisition of the Vanguard Target
Retirement 2010 Fund. See Note F.
H. Management has determined that no material events or transactions occurred subsequent to September 30, 2017, that would require recognition or disclosure in these financial statements.
19
Target Retirement 2015 Fund
Fund Profile
As of September 30, 2017
| |
| Total Fund Characteristics | |
| Ticker Symbol | VTXVX |
| 30-Day SEC Yield | 1.88% |
| Acquired Fund Fees and Expenses1 | 0.14% |
| |
| Allocation to Underlying Vanguard Funds | |
| Vanguard Total Bond Market II | |
| Index Fund Investor Shares | 32.1% |
| Vanguard Total Stock Market Index | |
| Fund Investor Shares | 26.0 |
| Vanguard Total International Stock | |
| Index Fund Investor Shares | 17.6 |
| Vanguard Total International Bond | |
| Index Fund Investor Shares | 13.5 |
| Vanguard Short-Term | |
| Inflation-Protected Securities Index | |
| Fund Investor Shares | 10.8 |
| | |
| Total Fund Volatility Measures | |
| | Target 2015 | MSCI US |
| | Composite | Broad Market |
| | Index | Index |
| R-Squared | 0.99 | 0.82 |
| Beta | 0.98 | 0.44 |
These measures show the degree and timing of the fund’s fluctuations compared with the indexes over 36 months.
Fund Asset Allocation

1 This figure—drawn from the prospectus dated July 12, 2017—represents an estimate of the weighted average of the expense ratios and any transaction fees charged by the underlying mutual funds (the ”acquired” funds) in which the Target Retirement 2015 Fund invests. The fund does not charge any expenses or fees of its own. For the fiscal year ended September 30, 2017, the acquired fund fees and expenses were 0.13%.
20
Target Retirement 2015 Fund
Performance Summary
All of the returns in this report represent past performance, which is not a guarantee of future results that may be achieved by the fund. (Current performance may be lower or higher than the performance data cited. For performance data current to the most recent month-end, visit our website at vanguard.com/performance.) Note, too, that both investment returns and principal value can fluctuate widely, so an investor’s shares, when sold, could be worth more or less than their original cost. The returns shown do not reflect taxes that a shareholder would pay on fund distributions or on the sale of fund shares.
Cumulative Performance: September 30, 2007, Through September 30, 2017
Initial Investment of $10,000

| | | | |
| | Average Annual Total Returns | |
| | Periods Ended September 30, 2017 | |
| | | | | Final Value |
| | One | Five | Ten | of a $10,000 |
| | Year | Years | Years | Investment |
| Target Retirement 2015 Fund* | 7.95% | 6.92% | 4.88% | $16,101 |
| • Target 2015 Composite Index | 8.16 | 7.10 | 4.92 | 16,173 |
| Mixed-Asset Target 2015 Funds | | | | |
| Average | 8.04 | 5.55 | 3.31 | 13,846 |
| MSCI US Broad Market Index | 18.67 | 14.26 | 7.72 | 21,034 |
For a benchmark description, see the Glossary.
Mixed-Asset Target 2015 Funds Average: Derived from data provided by Lipper, a Thomson Reuters Company.
See Financial Highlights for dividend and capital gains information.
21
Target Retirement 2015 Fund
Fiscal-Year Total Returns (%): September 30, 2007, Through September 30, 2017
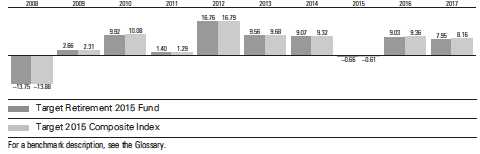
22
Target Retirement 2015 Fund
Financial Statements
Statement of Net Assets
As of September 30, 2017
The fund reports a complete list of its holdings in regulatory filings four times in each fiscal year, at the quarter-ends. For the second and fourth fiscal quarters, the lists appear in the fund’s semiannual and annual reports to shareholders. For the first and third fiscal quarters, the fund files the lists with the Securities and Exchange Commission on Form N-Q. Shareholders can look up the fund’s Forms N-Q on the SEC’s website at sec.gov. Forms N-Q may also be reviewed and copied at the SEC’s Public Reference Room (see the back cover of this report for further information).
| | |
| | | Market |
| | | Value• |
| | Shares | ($000) |
| Investment Companies (100.0%) | | |
| U.S. Stock Fund (26.0%) | | |
| Vanguard Total Stock Market Index Fund Investor Shares | 71,127,557 | 4,483,170 |
| |
| International Stock Fund (17.6%) | | |
| Vanguard Total International Stock Index Fund Investor Shares | 172,704,356 | 3,034,415 |
| |
| U.S. Bond Funds (42.9%) | | |
| 1 Vanguard Total Bond Market II Index Fund Investor Shares | 515,296,529 | 5,539,438 |
| Vanguard Short-Term Inflation-Protected Securities Index Fund | | |
| Investor Shares | 74,997,858 | 1,857,697 |
| | | 7,397,135 |
| International Bond Fund (13.5%) | | |
| Vanguard Total International Bond Index Fund Investor Shares | 214,345,846 | 2,334,226 |
| Total Investment Companies (Cost $13,438,915) | | 17,248,946 |
| Temporary Cash Investment (0.0%) | | |
| Money Market Fund (0.0%) | | |
| 1 Vanguard Market Liquidity Fund, 1.223% (Cost $1) | 8 | 1 |
| Total Investments (100.0%) (Cost $13,438,916) | | 17,248,947 |
| Other Assets and Liabilities (0.0%) | | |
| Other Assets | | 34,942 |
| Liabilities | | (33,726) |
| | | 1,216 |
| Net Assets (100%) | | |
| Applicable to 1,095,241,414 outstanding $.001 par value shares of | | |
| beneficial interest (unlimited authorization) | | 17,250,163 |
| Net Asset Value Per Share | | $15.75 |
23
| |
| Target Retirement 2015 Fund | |
| |
| |
| |
| |
| | Amount |
| | ($000) |
| Statement of Assets and Liabilities | |
| Assets | |
| Investments in Securities, at Value—Affiliated Vanguard Funds | 17,248,947 |
| Receivables for Investment Securities Sold | 3,849 |
| Receivables for Accrued Income | 12,814 |
| Receivables for Capital Shares Issued | 18,279 |
| Total Assets | 17,283,889 |
| Liabilities | |
| Payables for Investment Securities Purchased | 12,813 |
| Payables for Capital Shares Redeemed | 18,735 |
| Other Liabilities | 2,178 |
| Total Liabilities | 33,726 |
| Net Assets | 17,250,163 |
| |
| |
| At September 30, 2017, net assets consisted of: | |
| | Amount |
| | ($000) |
| Paid-in Capital | 12,739,416 |
| Undistributed Net Investment Income | 198,557 |
| Accumulated Net Realized Gains | 502,159 |
| Unrealized Appreciation (Depreciation) | 3,810,031 |
| Net Assets | 17,250,163 |
• See Note A in Notes to Financial Statements.
1 Affiliated fund available only to Vanguard funds and certain trusts and accounts managed by Vanguard. Rate shown
for Vanguard Market Liquidity Fund is the 7-day yield.
See accompanying Notes, which are an integral part of the Financial Statements.
24
| |
| Target Retirement 2015 Fund | |
| |
| |
| Statement of Operations | |
| |
| | Year Ended |
| | September 30, 2017 |
| | ($000) |
| Investment Income | |
| Income | |
| Income Distributions Received from Affiliated Funds | 345,920 |
| Net Investment Income—Note B | 345,920 |
| Realized Net Gain (Loss) | |
| Capital Gain Distributions Received from Affiliated Funds | 5,540 |
| Affiliated Investment Securities Sold | 589,976 |
| Realized Net Gain (Loss) | 595,516 |
| Change in Unrealized Appreciation (Depreciation) of Investment Securities | 374,464 |
| Net Increase (Decrease) in Net Assets Resulting from Operations | 1,315,900 |
See accompanying Notes, which are an integral part of the Financial Statements.
25
| | |
| Target Retirement 2015 Fund | | |
| |
| |
| Statement of Changes in Net Assets | | |
| |
| | Year Ended September 30, |
| | 2017 | 2016 |
| | ($000) | ($000) |
| Increase (Decrease) in Net Assets | | |
| Operations | | |
| Net Investment Income | 345,920 | 349,495 |
| Realized Net Gain (Loss) | 595,516 | 510,780 |
| Change in Unrealized Appreciation (Depreciation) | 374,464 | 681,539 |
| Net Increase (Decrease) in Net Assets Resulting from Operations | 1,315,900 | 1,541,814 |
| Distributions | | |
| Net Investment Income | (327,196) | (358,456) |
| Realized Capital Gain1 | (347,122) | (835,597) |
| Total Distributions | (674,318) | (1,194,053) |
| Capital Share Transactions | | |
| Issued | 3,275,914 | 3,035,107 |
| Issued in Lieu of Cash Distributions | 660,094 | 1,169,881 |
| Redeemed | (4,806,030) | (5,932,510) |
| Net Increase (Decrease) from Capital Share Transactions | (870,022) | (1,727,522) |
| Total Increase (Decrease) | (228,440) | (1,379,761) |
| Net Assets | | |
| Beginning of Period | 17,478,603 | 18,858,364 |
| End of Period2 | 17,250,163 | 17,478,603 |
1 Includes fiscal 2017 and 2016 short-term gain distributions totaling $3,623,000 and $10,790,000, respectively. Short-term gain
distributions are treated as ordinary income dividends for tax purposes.
2 Net Assets—End of Period includes undistributed (overdistributed) net investment income of 198,557,000 and $211,340,000.
See accompanying Notes, which are an integral part of the Financial Statements.
26
| | | | | |
| Target Retirement 2015 Fund | | | | | |
| |
| |
| Financial Highlights | | | | | |
| |
| |
| For a Share Outstanding | | | Year Ended September 30, |
| Throughout Each Period | 2017 | 2016 | 2015 | 2014 | 2013 |
| Net Asset Value, Beginning of Period | $15.19 | $14.90 | $15.44 | $14.49 | $13.54 |
| Investment Operations | | | | | |
| Net Investment Income | . 3051 | .311 | .327 | .300 | .298 |
| Capital Gain Distributions Received | .0051 | .007 | .018 | .002 | .039 |
| Net Realized and Unrealized Gain (Loss) | | | | | |
| on Investments | .846 | .968 | (.433) | .996 | .929 |
| Total from Investment Operations | 1.156 | 1.286 | (.088) | 1.298 | 1.266 |
| Distributions | | | | | |
| Dividends from Net Investment Income | (. 289) | (. 299) | (. 284) | (. 261) | (. 298) |
| Distributions from Realized Capital Gains | (. 307) | (. 697) | (.168) | (. 087) | (. 018) |
| Total Distributions | (. 596) | (. 996) | (. 452) | (. 348) | (. 316) |
| Net Asset Value, End of Period | $15.75 | $15.19 | $14.90 | $15.44 | $14.49 |
| |
| Total Return2 | 7.95% | 9.03% | -0.66% | 9.07% | 9.56% |
| |
| Ratios/Supplemental Data | | | | | |
| Net Assets, End of Period (Millions) | $17,250 | $17,479 | $18,858 | $21,741 | $19,739 |
| Ratio of Total Expenses to Average Net Assets | — | — | — | — | — |
| Acquired Fund Fees and Expenses | 0.13% | 0.14% | 0.14% | 0.16% | 0.16% |
| Ratio of Net Investment Income to | | | | | |
| Average Net Assets | 2.02% | 1.96% | 1.95% | 1.99% | 2.17% |
| Portfolio Turnover Rate | 7% | 9% | 16% | 10% | 26% |
1 Calculated based on average shares outstanding.
2 Total returns do not include account service fees that may have applied in the periods shown. Fund prospectuses provide information
about any applicable account service fees.
See accompanying Notes, which are an integral part of the Financial Statements.
27
Target Retirement 2015 Fund
Notes to Financial Statements
Vanguard Target Retirement 2015 Fund is registered under the Investment Company Act of 1940 as an open-end investment company, or mutual fund. The fund follows a balanced investment strategy by investing in selected Vanguard funds to achieve its targeted allocation of assets to U.S. and international stocks, and U.S. and international bonds. Financial statements and other information about each underlying fund are available on vanguard.com.
A. The following significant accounting policies conform to generally accepted accounting principles for U.S. investment companies. The fund consistently follows such policies in preparing its financial statements.
1. Security Valuation: Investments are valued at the net asset value of each underlying Vanguard fund determined as of the close of the New York Stock Exchange (generally 4 p.m., Eastern time) on the valuation date.
2. Federal Income Taxes: The fund intends to continue to qualify as a regulated investment company and distribute all of its taxable income. Management has analyzed the fund’s tax positions taken for all open federal income tax years (September 30, 2014–2017), and has concluded that no provision for federal income tax is required in the fund’s financial statements.
3. Distributions: Distributions to shareholders are recorded on the ex-dividend date.
4. Credit Facility: The fund and certain other funds managed by The Vanguard Group (“Vanguard”) participate in a $3.1 billion committed credit facility provided by a syndicate of lenders pursuant to a credit agreement that may be renewed annually; each fund is individually liable for its borrowings, if any, under the credit facility. Borrowings may be utilized for temporary and emergency purposes, and are subject to the fund’s regulatory and contractual borrowing restrictions. The participating funds are charged administrative fees and an annual commitment fee of 0.10% of the undrawn amount of the facility; these fees are allocated to the funds based on a method approved by the fund’s board of trustees and borne by the funds in which the fund invests (see Note B). Any borrowings under this facility bear interest at a rate based upon the higher of the one-month London Interbank Offered Rate, federal funds effective rate, or overnight bank funding rate plus an agreed-upon spread.
The fund had no borrowings outstanding at September 30, 2017, or at any time during the period then ended.
5. Other: Income and capital gain distributions received are recorded on the ex-dividend date. Security transactions are accounted for on the date securities are bought or sold. Costs used to determine realized gains (losses) on the sale of investment securities are those of the specific securities sold.
B. In accordance with the terms of a Funds’ Service Agreement (the “FSA”) between Vanguard and the fund, Vanguard furnishes to the fund investment advisory, corporate management, administrative, marketing, and distribution services at Vanguard’s cost of operations (as defined by the FSA). These costs of operations are allocated to the fund based on methods and guidelines approved by the board of trustees. The FSA provides that expenses otherwise allocable to Vanguard funds-of-funds may be reduced or eliminated to the extent of savings realized by the underlying Vanguard funds by virtue of being part of a fund-of-funds. Accordingly, all expenses for services provided by Vanguard to the fund and all other expenses incurred by the fund during
28
Target Retirement 2015 Fund
the period ended September 30, 2017, were borne by the underlying Vanguard funds in which the fund invests. The fund’s trustees and officers are also trustees and officers, respectively, of the underlying Vanguard funds, as well as directors and employees, respectively, of Vanguard.
C. Various inputs may be used to determine the value of the fund’s investments. These inputs are summarized in three broad levels for financial statement purposes. The inputs or methodologies used to value securities are not necessarily an indication of the risk associated with investing in those securities.
Level 1—Quoted prices in active markets for identical securities.
Level 2—Other significant observable inputs (including quoted prices for similar securities, interest rates, prepayment speeds, credit risk, etc.).
Level 3—Significant unobservable inputs (including the fund’s own assumptions used to determine the fair value of investments). Any investments valued with significant unobservable inputs are noted on the Statement of Net Assets.
At September 30, 2017, 100% of the market value of the fund’s investments was determined based on Level 1 inputs.
D. Distributions are determined on a tax basis and may differ from net investment income and realized capital gains for financial reporting purposes. Differences may be permanent or temporary. Permanent differences are reclassified among capital accounts in the financial statements to reflect their tax character. Temporary differences arise when certain items of income, expense, gain, or loss are recognized in different periods for financial statement and tax purposes. These differences will reverse at some time in the future. Differences in classification may also result from the treatment of short-term gains as ordinary income for tax purposes.
The fund used a tax accounting practice to treat a portion of the price of capital shares redeemed during the year as distributions from net investment income and realized capital gains. Accordingly, the fund has reclassified $31,507,000 from undistributed net investment income and $53,872,000 from accumulated net realized gains to paid-in capital.
For tax purposes, at September 30, 2017, the fund had $198,508,000 of ordinary income and $502,208,000 of long-term capital gains available for distribution.
At September 30, 2017, the cost of investment securities for tax purposes was $13,438,916,000. Net unrealized appreciation of investment securities for tax purposes was $3,810,031,000, consisting entirely of unrealized gains on securities that had risen in value since their purchase.
29
Target Retirement 2015 Fund
E. Capital shares issued and redeemed were:
| | |
| | Year Ended September 30, |
| | 2017 | 2016 |
| | Shares | Shares |
| | (000) | (000) |
| Issued | 216,944 | 206,486 |
| Issued in Lieu of Cash Distributions | 45,555 | 81,639 |
| Redeemed | (318,180) | (403,033) |
| Net Increase (Decrease) in Shares Outstanding | (55,681) | (114,908) |
F. Transactions during the period in affiliated underlying Vanguard funds were as follows:
| | | | | | | | |
| | | | | | Current Period Transactions |
| | Sept. 30, | | Proceeds | | | | | Sept. 30, |
| | 2016 | | from | Realized | Change in | Capital Gain | 2017 |
| Market | Purchases | Securities | Net Gain | Unrealized | Distributions | Market |
| | Value | at Cost | Sold | (Loss) | App.(Dep.) | Income | Received | Value |
| | ($000) | ($000) | ($000) | ($000) | ($000) | ($000) | ($000) | ($000) |
| Vanguard Market | | | | | | | | |
| Liquidity Fund | 5,362 | NA1 | NA1 | 1 | (1) | 15 | — | 1 |
| Vanguard Short-Term | | | | | | | |
| Inflation-Protected | | | | | | | | |
| Securities Index | | | | | | | | |
| Fund | 1,669,223 | 207,135 | 15,051 | — | (3,610) | 9,143 | — | 1,857,697 |
| Vanguard Total | | | | | | | | |
| Bond Market II | | | | | | | | |
| Index Fund | 5,387,819 | 570,725 | 281,595 | (1,029) | (136,482) | 128,240 | 5,540 | 5,539,438 |
| Vanguard Total | | | | | | | | |
| International Bond | | | | | | | | |
| Index Fund | 2,326,492 | 123,515 | 58,332 | 269 | (57,718) | 39,520 | — | 2,334,226 |
| Vanguard Total | | | | | | | | |
| International Stock | | | | | | | | |
| Index Fund | 3,245,691 | 150,524 | 820,508 | 18,999 | 439,709 | 83,538 | — | 3,034,415 |
| Vanguard Total | | | | | | | | |
| Stock Market | | | | | | | | |
| Index Fund | 4,867,412 | 132,665 | 1,221,209 | 571,736 | 132,566 | 85,464 | — | 4,483,170 |
| Total | 17,501,999 | 1,184,564 | 2,396,695 | 589,976 | 374,464 | 345,920 | 5,540 | 17,248,947 |
| 1 Not applicable—purchases and sales are for temporary cash investment purposes. | | | |
G. Management has determined that no material events or transactions occurred subsequent to September 30, 2017, that would require recognition or disclosure in these financial statements.
30
Target Retirement 2020 Fund
Fund Profile
As of September 30, 2017
| |
| Total Fund Characteristics | |
| Ticker Symbol | VTWNX |
| 30-Day SEC Yield | 2.00% |
| Acquired Fund Fees and Expenses1 | 0.14% |
| |
| Allocation to Underlying Vanguard Funds | |
| Vanguard Total Stock Market Index | |
| Fund Investor Shares | 33.4% |
| Vanguard Total Bond Market II | |
| Index Fund Investor Shares | 28.6 |
| Vanguard Total International Stock | |
| Index Fund Investor Shares | 22.3 |
| Vanguard Total International Bond | |
| Index Fund Investor Shares | 12.0 |
| Vanguard Short-Term | |
| Inflation-Protected Securities Index | |
| Fund Investor Shares | 3.7 |
| | |
| Total Fund Volatility Measures | |
| | Target 2020 | MSCI US |
| | Composite | Broad Market |
| | Index | Index |
| R-Squared | 1.00 | 0.87 |
| Beta | 0.98 | 0.54 |
These measures show the degree and timing of the fund’s fluctuations compared with the indexes over 36 months.
Fund Asset Allocation

1 This figure—drawn from the prospectus dated July 12, 2017—represents an estimate of the weighted average of the expense ratios and any transaction fees charged by the underlying mutual funds (the ”acquired” funds) in which the Target Retirement 2020 Fund invests. The fund does not charge any expenses or fees of its own. For the fiscal year ended September 30, 2017, the acquired fund fees and expenses were 0.13%.
31
Target Retirement 2020 Fund
Performance Summary
All of the returns in this report represent past performance, which is not a guarantee of future results that may be achieved by the fund. (Current performance may be lower or higher than the performance data cited. For performance data current to the most recent month-end, visit our website at vanguard.com/performance.) Note, too, that both investment returns and principal value can fluctuate widely, so an investor’s shares, when sold, could be worth more or less than their original cost. The returns shown do not reflect taxes that a shareholder would pay on fund distributions or on the sale of fund shares.
Cumulative Performance: September 30, 2007, Through September 30, 2017
Initial Investment of $10,000
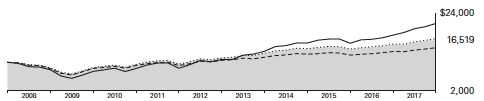
| | | | |
| | Average Annual Total Returns | |
| | Periods Ended September 30, 2017 | |
| | | | | Final Value |
| | One | Five | Ten | of a $10,000 |
| | Year | Years | Years | Investment |
| Target Retirement 2020 Fund* | 10.17% | 8.08% | 5.15% | $16,519 |
| Target 2020 Composite Index | 10.32 | 8.28 | 5.28 | 16,731 |
| Mixed-Asset Target 2020 Funds | | | | |
| Average | 8.26 | 6.00 | 3.53 | 14,142 |
| MSCI US Broad Market Index | 18.67 | 14.26 | 7.72 | 21,034 |
For a benchmark description, see the Glossary.
Mixed-Asset Target 2020 Funds Average: Derived from data provided by Lipper, a Thomson Reuters Company.
See Financial Highlights for dividend and capital gains information.
32
Target Retirement 2020 Fund
Fiscal-Year Total Returns (%): September 30, 2007, Through September 30, 2017

33
Target Retirement 2020 Fund
Financial Statements
Statement of Net Assets
As of September 30, 2017
The fund reports a complete list of its holdings in regulatory filings four times in each fiscal year, at the quarter-ends. For the second and fourth fiscal quarters, the lists appear in the fund’s semiannual and annual reports to shareholders. For the first and third fiscal quarters, the fund files the lists with the Securities and Exchange Commission on Form N-Q. Shareholders can look up the fund’s Forms N-Q on the SEC’s website at sec.gov. Forms N-Q may also be reviewed and copied at the SEC’s Public Reference Room (see the back cover of this report for further information).
| | |
| | | Market |
| | | Value• |
| | Shares | ($000) |
| Investment Companies (100.0%) | | |
| U.S. Stock Fund (33.4%) | | |
| Vanguard Total Stock Market Index Fund Investor Shares | 165,798,481 | 10,450,278 |
| |
| International Stock Fund (22.3%) | | |
| Vanguard Total International Stock Index Fund Investor Shares | 396,161,386 | 6,960,556 |
| |
| U.S. Bond Funds (32.3%) | | |
| 1 Vanguard Total Bond Market II Index Fund Investor Shares | 831,227,691 | 8,935,698 |
| Vanguard Short-Term Inflation-Protected Securities Index Fund | | |
| Investor Shares | 46,978,347 | 1,163,653 |
| | | 10,099,351 |
| International Bond Fund (12.0%) | | |
| Vanguard Total International Bond Index Fund Investor Shares | 344,170,436 | 3,748,016 |
| Total Investment Companies (Cost $24,026,267) | | 31,258,201 |
| Temporary Cash Investment (0.0%) | | |
| Money Market Fund (0.0%) | | |
| 1 Vanguard Market Liquidity Fund, 1.223% (Cost $3,904) | 39,034 | 3,904 |
| Total Investments (100.0%) (Cost $24,030,171) | | 31,262,105 |
| Other Assets and Liabilities (0.0%) | | |
| Other Assets | | 128,569 |
| Liabilities | | (128,132) |
| | | 437 |
| Net Assets (100%) | | |
| Applicable to 1,002,345,237 outstanding $.001 par value shares of | | |
| beneficial interest (unlimited authorization) | | 31,262,542 |
| Net Asset Value Per Share | | $31.19 |
34
| |
| Target Retirement 2020 Fund | |
| |
| |
| |
| |
| | Amount |
| | ($000) |
| Statement of Assets and Liabilities | |
| Assets | |
| Investments in Securities, at Value—Affiliated Vanguard Funds | 31,262,105 |
| Receivables for Investment Securities Sold | 59,197 |
| Receivables for Accrued Income | 20,809 |
| Receivables for Capital Shares Issued | 48,563 |
| Total Assets | 31,390,674 |
| Liabilities | |
| Payables for Investment Securities Purchased | 20,755 |
| Payables for Capital Shares Redeemed | 107,377 |
| Total Liabilities | 128,132 |
| Net Assets | 31,262,542 |
| |
| |
| At September 30, 2017, net assets consisted of: | |
| | Amount |
| | ($000) |
| Paid-in Capital | 23,456,457 |
| Undistributed Net Investment Income | 392,927 |
| Accumulated Net Realized Gains | 181,224 |
| Unrealized Appreciation (Depreciation) | 7,231,934 |
| Net Assets | 31,262,542 |
• See Note A in Notes to Financial Statements.
1 Affiliated fund available only to Vanguard funds and certain trusts and accounts managed by Vanguard. Rate shown
for Vanguard Market Liquidity Fund is the 7-day yield.
See accompanying Notes, which are an integral part of the Financial Statements.
35
| |
| Target Retirement 2020 Fund | |
| |
| |
| Statement of Operations | |
| |
| | Year Ended |
| | September 30, 2017 |
| | ($000) |
| Investment Income | |
| Income | |
| Income Distributions Received from Affiliated Funds | 627,081 |
| Other Income | 52 |
| Net Investment Income—Note B | 627,133 |
| Realized Net Gain (Loss) | |
| Capital Gain Distributions Received from Affiliated Funds | 8,288 |
| Affiliated Investment Securities Sold | 197,118 |
| Realized Net Gain (Loss) | 205,406 |
| Change in Unrealized Appreciation (Depreciation) of Investment Securities | 2,040,744 |
| Net Increase (Decrease) in Net Assets Resulting from Operations | 2,873,283 |
See accompanying Notes, which are an integral part of the Financial Statements.
36
| | |
| Target Retirement 2020 Fund | | |
| |
| |
| Statement of Changes in Net Assets | | |
| |
| | Year Ended September 30, |
| | 2017 | 2016 |
| | ($000) | ($000) |
| Increase (Decrease) in Net Assets | | |
| Operations | | |
| Net Investment Income | 627,133 | 568,590 |
| Realized Net Gain (Loss) | 205,406 | 402,528 |
| Change in Unrealized Appreciation (Depreciation) | 2,040,744 | 1,587,346 |
| Net Increase (Decrease) in Net Assets Resulting from Operations | 2,873,283 | 2,558,464 |
| Distributions | | |
| Net Investment Income | (540,313) | (550,582) |
| Realized Capital Gain1 | (205,071) | (498,411) |
| Total Distributions | (745,384) | (1,048,993) |
| Capital Share Transactions | | |
| Issued | 8,233,193 | 6,393,675 |
| Issued in Lieu of Cash Distributions | 733,928 | 1,028,442 |
| Redeemed | (7,374,696) | (8,082,609) |
| Net Increase (Decrease) from Capital Share Transactions | 1,592,425 | (660,492) |
| Total Increase (Decrease) | 3,720,324 | 848,979 |
| Net Assets | | |
| Beginning of Period | 27,542,218 | 26,693,239 |
| End of Period2 | 31,262,542 | 27,542,218 |
1 Includes fiscal 2017 and 2016 short-term gain distributions totaling $6,153,000 and $47,512,000, respectively. Short-term gain
distributions are treated as ordinary income dividends for tax purposes.
2 Net Assets—End of Period includes undistributed (overdistributed) net investment income of $392,927,000 and $350,668,000.
See accompanying Notes, which are an integral part of the Financial Statements.
37
| | | | | |
| Target Retirement 2020 Fund | | | | | |
| |
| |
| Financial Highlights | | | | | |
| |
| |
| For a Share Outstanding | | | Year Ended September 30, |
| Throughout Each Period | 2017 | 2016 | 2015 | 2014 | 2013 |
| Net Asset Value, Beginning of Period | $29.09 | $27.52 | $28.40 | $26.26 | $24.04 |
| Investment Operations | | | | | |
| Net Investment Income | . 6361 | .619 | .622 | . 577 | . 528 |
| Capital Gain Distributions Received | .0081 | .012 | .026 | .004 | .047 |
| Net Realized and Unrealized Gain (Loss) | | | | | |
| on Investments | 2.231 | 2.065 | (.946) | 2.054 | 2.179 |
| Total from Investment Operations | 2.875 | 2.696 | (.298) | 2.635 | 2.754 |
| Distributions | | | | | |
| Dividends from Net Investment Income | (. 562) | (. 591) | (. 541) | (. 484) | (. 508) |
| Distributions from Realized Capital Gains | (. 213) | (. 535) | (. 041) | (. 011) | (. 026) |
| Total Distributions | (.775) | (1.126) | (. 582) | (. 495) | (. 534) |
| Net Asset Value, End of Period | $31.19 | $29.09 | $27.52 | $28.40 | $26.26 |
| |
| Total Return2 | 10.17% | 10.05% | -1.13% | 10.13% | 11.70% |
| |
| Ratios/Supplemental Data | | | | | |
| Net Assets, End of Period (Millions) | $31,263 | $27,542 | $26,693 | $27,488 | $21,785 |
| Ratio of Total Expenses to Average Net Assets | — | — | — | — | — |
| Acquired Fund Fees and Expenses | 0.13% | 0.14% | 0.14% | 0.16% | 0.16% |
| Ratio of Net Investment Income to | | | | | |
| Average Net Assets | 2.15% | 2.14% | 2.07% | 2.14% | 2.23% |
| Portfolio Turnover Rate | 9% | 15% | 25% | 7% | 17% |
1 Calculated based on average shares outstanding.
2 Total returns do not include account service fees that may have applied in the periods shown. Fund prospectuses provide information
about any applicable account service fees.
See accompanying Notes, which are an integral part of the Financial Statements.
38
Target Retirement 2020 Fund
Notes to Financial Statements
Vanguard Target Retirement 2020 Fund is registered under the Investment Company Act of 1940 as an open-end investment company, or mutual fund. The fund follows a balanced investment strategy by investing in selected Vanguard funds to achieve its targeted allocation of assets to U.S. and international stocks, and U.S. and international bonds. Financial statements and other information about each underlying fund are available on vanguard.com.
A. The following significant accounting policies conform to generally accepted accounting principles for U.S. investment companies. The fund consistently follows such policies in preparing its financial statements.
1. Security Valuation: Investments are valued at the net asset value of each underlying Vanguard fund determined as of the close of the New York Stock Exchange (generally 4 p.m., Eastern time) on the valuation date.
2. Federal Income Taxes: The fund intends to continue to qualify as a regulated investment company and distribute all of its taxable income. Management has analyzed the fund’s tax positions taken for all open federal income tax years (September 30, 2014–2017), and has concluded that no provision for federal income tax is required in the fund’s financial statements.
3. Distributions: Distributions to shareholders are recorded on the ex-dividend date.
4. Credit Facility: The fund and certain other funds managed by The Vanguard Group (“Vanguard”) participate in a $3.1 billion committed credit facility provided by a syndicate of lenders pursuant to a credit agreement that may be renewed annually; each fund is individually liable for its borrowings, if any, under the credit facility. Borrowings may be utilized for temporary and emergency purposes, and are subject to the fund’s regulatory and contractual borrowing restrictions. The participating funds are charged administrative fees and an annual commitment fee of 0.10% of the undrawn amount of the facility; these fees are allocated to the funds based on a method approved by the fund’s board of trustees and borne by the funds in which the fund invests (see Note B). Any borrowings under this facility bear interest at a rate based upon the higher of the one-month London Interbank Offered Rate, federal funds effective rate, or overnight bank funding rate plus an agreed-upon spread.
The fund had no borrowings outstanding at September 30, 2017, or at any time during the period then ended.
5. Other: Income and capital gain distributions received are recorded on the ex-dividend date. Security transactions are accounted for on the date securities are bought or sold. Costs used to determine realized gains (losses) on the sale of investment securities are those of the specific securities sold.
B. In accordance with the terms of a Funds’ Service Agreement (the “FSA”) between Vanguard and the fund, Vanguard furnishes to the fund investment advisory, corporate management, administrative, marketing, and distribution services at Vanguard’s cost of operations (as defined by the FSA). These costs of operations are allocated to the fund based on methods and guidelines approved by the board of trustees. The FSA provides that expenses otherwise allocable to Vanguard funds-of-funds may be reduced or eliminated to the extent of savings realized by the underlying Vanguard funds by virtue of being part of a fund-of-funds. Accordingly, all expenses for services provided by Vanguard to the fund and all other expenses incurred by the fund during the
39
Target Retirement 2020 Fund
period ended September 30, 2017, were borne by the underlying Vanguard funds in which the fund invests. The fund’s trustees and officers are also trustees and officers, respectively, of the underlying Vanguard funds, as well as directors and employees, respectively, of Vanguard.
C. Various inputs may be used to determine the value of the fund’s investments. These inputs are summarized in three broad levels for financial statement purposes. The inputs or methodologies used to value securities are not necessarily an indication of the risk associated with investing in those securities.
Level 1—Quoted prices in active markets for identical securities.
Level 2—Other significant observable inputs (including quoted prices for similar securities, interest rates, prepayment speeds, credit risk, etc.).
Level 3—Significant unobservable inputs (including the fund’s own assumptions used to determine the fair value of investments). Any investments valued with significant unobservable inputs are noted on the Statement of Net Assets.
At September 30, 2017, 100% of the market value of the fund’s investments was determined based on Level 1 inputs.
D. Distributions are determined on a tax basis and may differ from net investment income and realized capital gains for financial reporting purposes. Differences may be permanent or temporary. Permanent differences are reclassified among capital accounts in the financial statements to reflect their tax character. Temporary differences arise when certain items of income, expense, gain, or loss are recognized in different periods for financial statement and tax purposes. These differences will reverse at some time in the future. Differences in classification may also result from the treatment of short-term gains as ordinary income for tax purposes.
The fund used a tax accounting practice to treat a portion of the price of capital shares redeemed during the year as distributions from net investment income and realized capital gains. Accordingly, the fund has reclassified $44,561,000 from undistributed net investment income and $13,873,000 from accumulated net realized gains to paid-in capital.
For tax purposes, at September 30, 2017, the fund had $404,802,000 of ordinary income and $169,349,000 of long-term capital gains available for distribution.
At September 30, 2017, the cost of investment securities for tax purposes was $24,030,171,000. Net unrealized appreciation of investment securities for tax purposes was $7,231,934,000, consisting entirely of unrealized gains on securities that had risen in value since their purchase.
E. Capital shares issued and redeemed were:
| | |
| | Year Ended September 30, |
| | 2017 | 2016 |
| | Shares | Shares |
| | (000) | (000) |
| Issued | 278,945 | 229,362 |
| Issued in Lieu of Cash Distributions | 26,017 | 37,534 |
| Redeemed | (249,268) | (290,081) |
| Net Increase (Decrease) in Shares Outstanding | 55,694 | (23,185) |
40
Target Retirement 2020 Fund
F. Transactions during the period in affiliated underlying Vanguard funds were as follows:
| | | | | | | | |
| | | | | | Current Period Transactions |
| | Sept. 30, | | Proceeds | | | | | Sept. 30, |
| | 2016 | | from | Realized | Change in | | Capital Gain | 2017 |
| Market | Purchases | Securities | Net Gain | Unrealized | | Distributions | Market |
| | Value | at Cost | Sold | (Loss) | App. (Dep.) | Income | Received | Value |
| | ($000) | ($000) | ($000) | ($000) | ($000) | ($000) | ($000) | ($000) |
| Vanguard Market | | | | | | | | |
| Liquidity Fund | 24,057 | NA1 | NA1 | 2 | — | 58 | — | 3,904 |
| Vanguard Short-Term | | | | | | | |
| Inflation-Protected | | | | | | | | |
| Securities | | | | | | | | |
| Index Fund | 587,988 | 588,408 | 12,454 | — | (289) | 3,559 | — | 1,163,653 |
| Vanguard Total | | | | | | | | |
| Bond Market II | | | | | | | | |
| Index Fund | 7,860,605 | 1,783,292 | 514,546 | 58 | (193,711) 198,677 | 8,288 | 8,935,698 |
| Vanguard Total | | | | | | | | |
| International Bond | | | | | | | | |
| Index Fund | 3,310,495 | 534,094 | 16,500 | — | (80,073 ) | 59,102 | — | 3,748,016 |
| Vanguard Total | | | | | | | | |
| International Stock | | | | | | | | |
| Index Fund | 6,312,587 | 458,205 | 823,347 | (657) | 1,013,768 | 181,179 | — | 6,960,556 |
| Vanguard Total | | | | | | | | |
| Stock Market | | | | | | | | |
| Index Fund | 9,496,059 | 811,352 | 1,355,897 | 197,715 | 1,301,049 | 184,506 | — | 10,450,278 |
| Total | 27,591,791 | 4,175,351 | 2,722,744 | 197,118 | 2,040,744 | 627,081 | 8,288 | 31,262,105 |
| 1 Not applicable—purchases and sales are for temporary cash investment purposes. | | | |
G. Management has determined that no material events or transactions occurred subsequent to September 30, 2017, that would require recognition or disclosure in these financial statements.
41
Target Retirement 2025 Fund
Fund Profile
As of September 30, 2017
| |
| Total Fund Characteristics | |
| Ticker Symbol | VTTVX |
| 30-Day SEC Yield | 2.05% |
| Acquired Fund Fees and Expenses1 | 0.14% |
| |
| Allocation to Underlying Vanguard Funds | |
| Vanguard Total Stock Market Index | |
| Fund Investor Shares | 38.7% |
| Vanguard Total International Stock | |
| Index Fund Investor Shares | 25.6 |
| Vanguard Total Bond Market II | |
| Index Fund Investor Shares | 25.2 |
| Vanguard Total International Bond | |
| Index Fund Investor Shares | 10.5 |
| | |
| Total Fund Volatility Measures | |
| | Target 2025 | MSCI US |
| | Composite | Broad Market |
| | Index | Index |
| R-Squared | 1.00 | 0.89 |
| Beta | 0.97 | 0.62 |
These measures show the degree and timing of the fund’s fluctuations compared with the indexes over 36 months.
Fund Asset Allocation
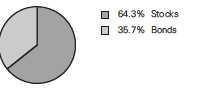
1 This figure—drawn from the prospectus dated July 12, 2017—represents an estimate of the weighted average of the expense ratios and any transaction fees charged by the underlying mutual funds (the ”acquired” funds) in which the Target Retirement 2025 Fund invests. The fund does not charge any expenses or fees of its own. For the fiscal year ended September 30, 2017, the acquired fund fees and expenses were 0.14%.
42
Target Retirement 2025 Fund
Performance Summary
All of the returns in this report represent past performance, which is not a guarantee of future results that may be achieved by the fund. (Current performance may be lower or higher than the performance data cited. For performance data current to the most recent month-end, visit our website at vanguard.com/performance.) Note, too, that both investment returns and principal value can fluctuate widely, so an investor’s shares, when sold, could be worth more or less than their original cost. The returns shown do not reflect taxes that a shareholder would pay on fund distributions or on the sale of fund shares.
Cumulative Performance: September 30, 2007, Through September 30, 2017
Initial Investment of $10,000
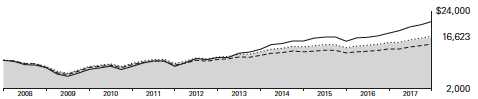
| | | | |
| | Average Annual Total Returns | |
| | Periods Ended September 30, 2017 | |
| | | | | Final Value |
| | One | Five | Ten | of a $10,000 |
| | Year | Years | Years | Investment |
| Target Retirement 2025 Fund* | 11.74% | 8.85% | 5.21% | $16,623 |
| Target 2025 Composite Index | 11.97 | 9.06 | 5.37 | 16,871 |
| Mixed-Asset Target 2025 Funds | | | | |
| Average | 10.44 | 7.39 | 3.87 | 14,617 |
| MSCI US Broad Market Index | 18.67 | 14.26 | 7.72 | 21,034 |
For a benchmark description, see the Glossary.
Mixed-Asset Target 2025 Funds Average: Derived from data provided by Lipper, a Thomson Reuters Company.
See Financial Highlights for dividend and capital gains information.
43
Target Retirement 2025 Fund
Fiscal-Year Total Returns (%): September 30, 2007, Through September 30, 2017

44
Target Retirement 2025 Fund
Financial Statements
Statement of Net Assets
As of September 30, 2017
The fund reports a complete list of its holdings in regulatory filings four times in each fiscal year, at the quarter-ends. For the second and fourth fiscal quarters, the lists appear in the fund’s semiannual and annual reports to shareholders. For the first and third fiscal quarters, the fund files the lists with the Securities and Exchange Commission on Form N-Q. Shareholders can look up the fund’s Forms N-Q on the SEC’s website at sec.gov. Forms N-Q may also be reviewed and copied at the SEC’s Public Reference Room (see the back cover of this report for further information).
| | |
| | | Market |
| | | Value• |
| | Shares | ($000) |
| Investment Companies (100.0%) | | |
| U.S. Stock Fund (38.7%) | | |
| Vanguard Total Stock Market Index Fund Investor Shares | 228,208,792 | 14,384,000 |
| |
| International Stock Fund (25.6%) | | |
| Vanguard Total International Stock Index Fund Investor Shares | 540,940,242 | 9,504,320 |
| |
| U.S. Bond Fund (25.2%) | | |
| 1 Vanguard Total Bond Market II Index Fund Investor Shares | 868,762,158 | 9,339,193 |
| |
| International Bond Fund (10.5%) | | |
| Vanguard Total International Bond Index Fund Investor Shares | 357,167,865 | 3,889,558 |
| Total Investment Companies (Cost $27,359,875) | | 37,117,071 |
| Temporary Cash Investment (0.0%) | | |
| Money Market Fund (0.0%) | | |
| 1 Vanguard Market Liquidity Fund, 1.223% (Cost $8,931) | 89,287 | 8,931 |
| Total Investments (100.0%) (Cost $27,368,806) | | 37,126,002 |
| Other Assets and Liabilities (0.0%) | | |
| Other Assets | | 66,960 |
| Liabilities | | (82,028) |
| | | (15,068) |
| Net Assets (100%) | | |
| Applicable to 2,033,162,578 outstanding $.001 par value shares of | | |
| beneficial interest (unlimited authorization) | | 37,110,934 |
| Net Asset Value Per Share | | $18.25 |
45
| |
| Target Retirement 2025 Fund | |
| |
| |
| |
| |
| | Amount |
| | ($000) |
| Statement of Assets and Liabilities | |
| Assets | |
| Investments in Securities, at Value—Affiliated Vanguard Funds | 37,126,002 |
| Receivables for Accrued Income | 21,540 |
| Receivables for Capital Shares Issued | 45,420 |
| Total Assets | 37,192,962 |
| Liabilities | |
| Payables for Investment Securities Purchased | 50,042 |
| Payables for Capital Shares Redeemed | 31,986 |
| Total Liabilities | 82,028 |
| Net Assets | 37,110,934 |
| |
| |
| At September 30, 2017, net assets consisted of: | |
| | Amount |
| | ($000) |
| Paid-in Capital | 26,687,798 |
| Undistributed Net Investment Income | 486,322 |
| Accumulated Net Realized Gains | 179,618 |
| Unrealized Appreciation (Depreciation) | 9,757,196 |
| Net Assets | 37,110,934 |
• See Note A in Notes to Financial Statements.
1 Affiliated fund available only to Vanguard funds and certain trusts and accounts managed by Vanguard. Rate shown for Vanguard
Market Liquidity Fund is the 7-day yield.
See accompanying Notes, which are an integral part of the Financial Statements.
46
| |
| Target Retirement 2025 Fund | |
| |
| |
| Statement of Operations | |
| |
| | Year Ended |
| | September 30, 2017 |
| | ($000) |
| Investment Income | |
| Income | |
| Income Distributions Received from Affiliated Funds | 752,393 |
| Net Investment Income—Note B | 752,393 |
| Realized Net Gain (Loss) | |
| Capital Gain Distributions Received from Affiliated Funds | 8,304 |
| Affiliated Investment Securities Sold | 197,491 |
| Realized Net Gain (Loss) | 205,795 |
| Change in Unrealized Appreciation (Depreciation) of Investment Securities | 2,911,271 |
| Net Increase (Decrease) in Net Assets Resulting from Operations | 3,869,459 |
See accompanying Notes, which are an integral part of the Financial Statements.
47
| | |
| Target Retirement 2025 Fund | | |
| |
| |
| Statement of Changes in Net Assets | | |
| |
| | Year Ended September 30, |
| | 2017 | 2016 |
| | ($000) | ($000) |
| Increase (Decrease) in Net Assets | | |
| Operations | | |
| Net Investment Income | 752,393 | 662,090 |
| Realized Net Gain (Loss) | 205,795 | 408,716 |
| Change in Unrealized Appreciation (Depreciation) | 2,911,271 | 2,032,698 |
| Net Increase (Decrease) in Net Assets Resulting from Operations | 3,869,459 | 3,103,504 |
| Distributions | | |
| Net Investment Income | (632,365) | (624,626) |
| Realized Capital Gain1 | (214,269) | (796,306) |
| Total Distributions | (846,634) | (1,420,932) |
| Capital Share Transactions | | |
| Issued | 9,126,407 | 6,760,157 |
| Issued in Lieu of Cash Distributions | 834,520 | 1,393,339 |
| Redeemed | (7,579,252) | (8,177,173) |
| Net Increase (Decrease) from Capital Share Transactions | 2,381,675 | (23,677) |
| Total Increase (Decrease) | 5,404,500 | 1,658,895 |
| Net Assets | | |
| Beginning of Period | 31,706,434 | 30,047,539 |
| End of Period2 | 37,110,934 | 31,706,434 |
1 Includes fiscal 2017 and 2016 short-term gain distributions totaling $5,608,000 and $69,403,000, respectively. Short-term gain
distributions are treated as ordinary income dividends for tax purposes.
2 Net Assets—End of Period includes undistributed (overdistributed) net investment income of $486,322,000 and $410,138,000.
See accompanying Notes, which are an integral part of the Financial Statements.
48
| | | | | |
| Target Retirement 2025 Fund | | | | | |
| |
| |
| Financial Highlights | | | | | |
| |
| |
| For a Share Outstanding | | | Year Ended September 30, |
| Throughout Each Period | 2017 | 2016 | 2015 | 2014 | 2013 |
| Net Asset Value, Beginning of Period | $16.77 | $15.90 | $16.50 | $15.18 | $13.70 |
| Investment Operations | | | | | |
| Net Investment Income | . 3801 | .362 | .364 | .350 | .316 |
| Capital Gain Distributions Received | .0041 | .006 | .012 | .002 | .021 |
| Net Realized and Unrealized Gain (Loss) | | | | | |
| on Investments | 1.534 | 1.280 | (.624) | 1.272 | 1.451 |
| Total from Investment Operations | 1.918 | 1.648 | (.248) | 1.624 | 1.788 |
| Distributions | | | | | |
| Dividends from Net Investment Income | (. 327) | (. 342) | (. 322) | (. 287) | (. 296) |
| Distributions from Realized Capital Gains | (.111) | (. 436) | (. 030) | (. 017) | (. 012) |
| Total Distributions | (. 438) | (.778) | (. 352) | (. 304) | (. 308) |
| Net Asset Value, End of Period | $18.25 | $16.77 | $15.90 | $16.50 | $15.18 |
| |
| Total Return2 | 11.74% | 10.67% | -1.60% | 10.80% | 13.34% |
| |
| Ratios/Supplemental Data | | | | | |
| Net Assets, End of Period (Millions) | $37,111 | $31,706 | $30,048 | $31,428 | $25,642 |
| Ratio of Total Expenses to Average Net Assets | — | — | — | — | — |
| Acquired Fund Fees and Expenses | 0.14% | 0.14% | 0.15% | 0.17% | 0.17% |
| Ratio of Net Investment Income to | | | | | |
| Average Net Assets | 2.21% | 2.18% | 2.07% | 2.15% | 2.27% |
| Portfolio Turnover Rate | 10% | 15% | 24% | 7% | 16% |
1 Calculated based on average shares outstanding.
2 Total returns do not include account service fees that may have applied in the periods shown. Fund prospectuses provide information
about any applicable account service fees.
See accompanying Notes, which are an integral part of the Financial Statements.
49
Target Retirement 2025 Fund
Notes to Financial Statements
Vanguard Target Retirement 2025 Fund is registered under the Investment Company Act of 1940 as an open-end investment company, or mutual fund. The fund follows a balanced investment strategy by investing in selected Vanguard funds to achieve its targeted allocation of assets to U.S. and international stocks, and U.S. and international bonds. Financial statements and other information about each underlying fund are available on vanguard.com.
A. The following significant accounting policies conform to generally accepted accounting principles for U.S. investment companies. The fund consistently follows such policies in preparing its financial statements.
1. Security Valuation: Investments are valued at the net asset value of each underlying Vanguard fund determined as of the close of the New York Stock Exchange (generally 4 p.m., Eastern time) on the valuation date.
2. Federal Income Taxes: The fund intends to continue to qualify as a regulated investment company and distribute all of its taxable income. Management has analyzed the fund’s tax positions taken for all open federal income tax years (September 30, 2014–2017), and has concluded that no provision for federal income tax is required in the fund’s financial statements.
3. Distributions: Distributions to shareholders are recorded on the ex-dividend date.
4. Credit Facility: The fund and certain other funds managed by The Vanguard Group (“Vanguard”) participate in a $3.1 billion committed credit facility provided by a syndicate of lenders pursuant to a credit agreement that may be renewed annually; each fund is individually liable for its borrowings, if any, under the credit facility. Borrowings may be utilized for temporary and emergency purposes, and are subject to the fund’s regulatory and contractual borrowing restrictions. The participating funds are charged administrative fees and an annual commitment fee of 0.10% of the undrawn amount of the facility; these fees are allocated to the funds based on a method approved by the fund’s board of trustees and borne by the funds in which the fund invests (see Note B). Any borrowings under this facility bear interest at a rate based upon the higher of the one-month London Interbank Offered Rate, federal funds effective rate, or overnight bank funding rate plus an agreed-upon spread.
The fund had no borrowings outstanding at September 30, 2017, or at any time during the period then ended.
5. Other: Income and capital gain distributions received are recorded on the ex-dividend date. Security transactions are accounted for on the date securities are bought or sold. Costs used to determine realized gains (losses) on the sale of investment securities are those of the specific securities sold.
B. In accordance with the terms of a Funds’ Service Agreement (the “FSA”) between Vanguard and the fund, Vanguard furnishes to the fund investment advisory, corporate management, administrative, marketing, and distribution services at Vanguard’s cost of operations (as defined by the FSA). These costs of operations are allocated to the fund based on methods and guidelines approved by the board of trustees. The FSA provides that expenses otherwise allocable to Vanguard funds-of-funds may be reduced or eliminated to the extent of savings realized by the underlying Vanguard funds by virtue of being part of a fund-of-funds. Accordingly, all expenses for services provided by Vanguard to the fund and all other expenses incurred by the fund during the
50
Target Retirement 2025 Fund
period ended September 30, 2017, were borne by the underlying Vanguard funds in which the fund invests. The fund’s trustees and officers are also trustees and officers, respectively, of the underlying Vanguard funds, as well as directors and employees, respectively, of Vanguard.
C. Various inputs may be used to determine the value of the fund’s investments. These inputs are summarized in three broad levels for financial statement purposes. The inputs or methodologies used to value securities are not necessarily an indication of the risk associated with investing in those securities.
Level 1—Quoted prices in active markets for identical securities.
Level 2—Other significant observable inputs (including quoted prices for similar securities, interest rates, prepayment speeds, credit risk, etc.).
Level 3—Significant unobservable inputs (including the fund’s own assumptions used to determine the fair value of investments). Any investments valued with significant unobservable inputs are noted on the Statement of Net Assets.
At September 30, 2017, 100% of the market value of the fund’s investments was determined based on Level 1 inputs.
D. Distributions are determined on a tax basis and may differ from net investment income and realized capital gains for financial reporting purposes. Differences may be permanent or temporary. Permanent differences are reclassified among capital accounts in the financial statements to reflect their tax character. Temporary differences arise when certain items of income, expense, gain, or loss are recognized in different periods for financial statement and tax purposes. These differences will reverse at some time in the future. Differences in classification may also result from the treatment of short-term gains as ordinary income for tax purposes.
The fund used a tax accounting practice to treat a portion of the price of capital shares redeemed during the year as distributions from net investment income and realized capital gains. Accordingly, the fund has reclassified $43,844,000 from undistributed net investment income and $11,124,000 from accumulated net realized gains to paid-in capital.
For tax purposes, at September 30, 2017, the fund had $505,120,000 of ordinary income and $160,820,000 of long-term capital gains available for distribution.
At September 30, 2017, the cost of investment securities for tax purposes was $27,368,806,000. Net unrealized appreciation of investment securities for tax purposes was $9,757,196,000, consisting entirely of unrealized gains on securities that had risen in value since their purchase.
E. Capital shares issued and redeemed were:
| | |
| | Year Ended September 30, |
| | 2017 | 2016 |
| | Shares | Shares |
| | (000) | (000) |
| Issued | 532,501 | 422,218 |
| Issued in Lieu of Cash Distributions | 51,135 | 88,242 |
| Redeemed | (441,562) | (509,271) |
| Net Increase (Decrease) in Shares Outstanding | 142,074 | 1,189 |
51
Target Retirement 2025 Fund
F. Transactions during the period in affiliated underlying Vanguard funds were as follows:
| | | | | | | | |
| | | | | | Current Period Transactions |
| | Sept. 30, | | Proceeds | | | | | Sept. 30, |
| | 2016 | | from | Realized | Change in | | Capital Gain | 2017 |
| Market | Purchases | Securities | Net Gain | Unrealized | | Distributions | Market |
| | Value | at Cost | Sold | (Loss) | App. (Dep.) | Income | Received | Value |
| | ($000) | ($000) | ($000) | ($000) | ($000) | ($000) | ($000) | ($000) |
| Vanguard Market | | | | | | | | |
| Liquidity Fund | 4,263 | NA1 | NA1 | (1) | — | 77 | — | 8,931 |
| Vanguard Total | | | | | | | | |
| Bond Market II | | | | | | | | |
| Index Fund | 7,759,432 | 2,672,378 | 904,371 | 101 | (188,347) | 201,613 | 8,304 | 9,339,193 |
| Vanguard Total | | | | | | | | |
| International Bond | | | | | | | | |
| Index Fund | 3,219,117 | 748,086 | — | — | (77,645) | 59,419 | — | 3,889,558 |
| Vanguard Total | | | | | | | | |
| International Stock | | | | | | | |
| Index Fund | 8,289,872 | 783,861 | 932,398 | 7,754 | 1,355,231 | 243,311 | — | 9,504,320 |
| Vanguard Total | | | | | | | | |
| Stock Market | | | | | | | | |
| Index Fund | 12,461,906 | 1,402,886 | 1,492,461 | 189,637 | 1,822,032 | 247,973 | — | 14,384,000 |
| Total | 31,734,590 | 5,607,211 | 3,329,230 | 197,491 | 2,911,271 | 752,393 | 8,304 | 37,126,002 |
| 1 Not applicable—purchases and sales are for temporary cash investment purposes. | | | |
G. Management has determined that no material events or transactions occurred subsequent to September 30, 2017, that would require recognition or disclosure in these financial statements.
52
Target Retirement 2030 Fund
Fund Profile
As of September 30, 2017
| |
| Total Fund Characteristics | |
| Ticker Symbol | VTHRX |
| 30-Day SEC Yield | 2.05% |
| Acquired Fund Fees and Expenses1 | 0.15% |
| |
| Allocation to Underlying Vanguard Funds | |
| Vanguard Total Stock Market Index | |
| Fund Investor Shares | 43.2% |
| Vanguard Total International Stock | |
| Index Fund Investor Shares | 28.5 |
| Vanguard Total Bond Market II | |
| Index Fund Investor Shares | 20.1 |
| Vanguard Total International Bond | |
| Index Fund Investor Shares | 8.2 |
| | |
| Total Fund Volatility Measures | |
| | Target 2030 | MSCI US |
| | Composite | Broad Market |
| | Index | Index |
| R-Squared | 1.00 | 0.91 |
| Beta | 0.97 | 0.69 |
These measures show the degree and timing of the fund’s fluctuations compared with the indexes over 36 months.
Fund Asset Allocation
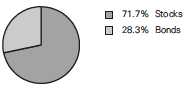
1 This figure—drawn from the prospectus dated July 12, 2017—represents an estimate of the weighted average of the expense ratios and any transaction fees charged by the underlying mutual funds (the ”acquired” funds) in which the Target Retirement 2030 Fund invests. The fund does not charge any expenses or fees of its own. For the fiscal year ended September 30, 2017, the acquired fund fees and expenses were 0.14%.
53
Target Retirement 2030 Fund
Performance Summary
All of the returns in this report represent past performance, which is not a guarantee of future results that may be achieved by the fund. (Current performance may be lower or higher than the performance data cited. For performance data current to the most recent month-end, visit our website at vanguard.com/performance.) Note, too, that both investment returns and principal value can fluctuate widely, so an investor’s shares, when sold, could be worth more or less than their original cost. The returns shown do not reflect taxes that a shareholder would pay on fund distributions or on the sale of fund shares.
Cumulative Performance: September 30, 2007, Through September 30, 2017
Initial Investment of $10,000
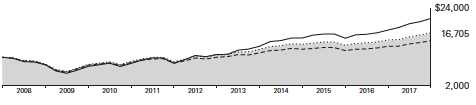
| | | | |
| | Average Annual Total Returns | |
| | Periods Ended September 30, 2017 | |
| | | | | Final Value |
| | One | Five | Ten | of a $10,000 |
| | Year | Years | Years | Investment |
| Target Retirement 2030 Fund* | 13.25% | 9.58% | 5.27% | $16,705 |
| Target 2030 Composite Index | 13.44 | 9.79 | 5.41 | 16,941 |
| Mixed-Asset Target 2030 Funds | | | | |
| Average | 12.14 | 8.05 | 3.93 | 14,710 |
| MSCI US Broad Market Index | 18.67 | 14.26 | 7.72 | 21,034 |
For a benchmark description, see the Glossary.
Mixed-Asset Target 2030 Funds Average: Derived from data provided by Lipper, a Thomson Reuters Company.
See Financial Highlights for dividend and capital gains information.
54
Target Retirement 2030 Fund
Fiscal-Year Total Returns (%): September 30, 2007, Through September 30, 2017

55
Target Retirement 2030 Fund
Financial Statements
Statement of Net Assets
As of September 30, 2017
The fund reports a complete list of its holdings in regulatory filings four times in each fiscal year, at the quarter-ends. For the second and fourth fiscal quarters, the lists appear in the fund’s semiannual and annual reports to shareholders. For the first and third fiscal quarters, the fund files the lists with the Securities and Exchange Commission on Form N-Q. Shareholders can look up the fund’s Forms N-Q on the SEC’s website at sec.gov. Forms N-Q may also be reviewed and copied at the SEC’s Public Reference Room (see the back cover of this report for further information).
| | |
| | | Market |
| | | Value• |
| | Shares | ($000) |
| Investment Companies (100.0%) | | |
| U.S. Stock Fund (43.2%) | | |
| Vanguard Total Stock Market Index Fund Investor Shares | 211,534,599 | 13,333,026 |
| |
| International Stock Fund (28.5%) | | |
| Vanguard Total International Stock Index Fund Investor Shares | 500,646,612 | 8,796,361 |
| |
| U.S. Bond Fund (20.1%) | | |
| 1 Vanguard Total Bond Market II Index Fund Investor Shares | 577,076,452 | 6,203,572 |
| |
| International Bond Fund (8.2%) | | |
| Vanguard Total International Bond Index Fund Investor Shares | 233,927,091 | 2,547,466 |
| Total Investment Companies (Cost $22,773,157) | | 30,880,425 |
| Temporary Cash Investment (0.1%) | | |
| Money Market Fund (0.1%) | | |
| 1 Vanguard Market Liquidity Fund, 1.223% (Cost $16,347) | 163,439 | 16,347 |
| Total Investments (100.1%) (Cost $22,789,504) | | 30,896,772 |
| Other Assets and Liabilities (-0.1%) | | |
| Other Assets | | 97,555 |
| Liabilities | | (117,117) |
| | | (19,562) |
| Net Assets (100%) | | |
| Applicable to 937,706,235 outstanding $.001 par value shares of | | |
| beneficial interest (unlimited authorization) | | 30,877,210 |
| Net Asset Value Per Share | | $32.93 |
56
| |
| Target Retirement 2030 Fund | |
| |
| |
| |
| |
| | Amount |
| | ($000) |
| Statement of Assets and Liabilities | |
| Assets | |
| Investments in Securities, at Value—Affiliated Vanguard Funds | 30,896,772 |
| Receivables for Investment Securities Sold | 40,043 |
| Receivables for Accrued Income | 14,197 |
| Receivables for Capital Shares Issued | 43,315 |
| Total Assets | 30,994,327 |
| Liabilities | |
| Payables for Investment Securities Purchased | 19,097 |
| Payables for Capital Shares Redeemed | 98,020 |
| Total Liabilities | 117,117 |
| Net Assets | 30,877,210 |
| |
| |
| At September 30, 2017, net assets consisted of: | |
| | Amount |
| | ($000) |
| Paid-in Capital | 22,339,910 |
| Undistributed Net Investment Income | 411,884 |
| Accumulated Net Realized Gains | 18,148 |
| Unrealized Appreciation (Depreciation) | 8,107,268 |
| Net Assets | 30,877,210 |
• See Note A in Notes to Financial Statements.
1 Affiliated fund available only to Vanguard funds and certain trusts and accounts managed by Vanguard. Rate shown for Vanguard
Market Liquidity Fund is the 7-day yield.
See accompanying Notes, which are an integral part of the Financial Statements.
57
| |
| Target Retirement 2030 Fund | |
| |
| |
| Statement of Operations | |
| |
| | Year Ended |
| | September 30, 2017 |
| | ($000) |
| Investment Income | |
| Income | |
| Income Distributions Received from Affiliated Funds | 614,498 |
| Net Investment Income—Note B | 614,498 |
| Realized Net Gain (Loss) | |
| Capital Gain Distributions Received from Affiliated Funds | 5,163 |
| Affiliated Investment Securities Sold | 27,931 |
| Realized Net Gain (Loss) | 33,094 |
| Change in Unrealized Appreciation (Depreciation) of Investment Securities | 2,880,568 |
| Net Increase (Decrease) in Net Assets Resulting from Operations | 3,528,160 |
See accompanying Notes, which are an integral part of the Financial Statements.
58
| | |
| Target Retirement 2030 Fund | | |
| |
| |
| Statement of Changes in Net Assets | | |
| |
| | Year Ended September 30, |
| | 2017 | 2016 |
| | ($000) | ($000) |
| Increase (Decrease) in Net Assets | | |
| Operations | | |
| Net Investment Income | 614,498 | 512,248 |
| Realized Net Gain (Loss) | 33,094 | 237,704 |
| Change in Unrealized Appreciation (Depreciation) | 2,880,568 | 1,747,746 |
| Net Increase (Decrease) in Net Assets Resulting from Operations | 3,528,160 | 2,497,698 |
| Distributions | | |
| Net Investment Income | (497,511) | (471,700) |
| Realized Capital Gain1 | (103,476) | (343,700) |
| Total Distributions | (600,987) | (815,400) |
| Capital Share Transactions | | |
| Issued | 8,474,068 | 6,307,641 |
| Issued in Lieu of Cash Distributions | 591,348 | 798,019 |
| Redeemed | (6,081,063) | (6,506,588) |
| Net Increase (Decrease) from Capital Share Transactions | 2,984,353 | 599,072 |
| Total Increase (Decrease) | 5,911,526 | 2,281,370 |
| Net Assets | | |
| Beginning of Period | 24,965,684 | 22,684,314 |
| End of Period2 | 30,877,210 | 24,965,684 |
1 Includes fiscal 2017 and 2016 short-term gain distributions totaling $33,427,000 and $40,296,000, respectively. Short-term gain
distributions are treated as ordinary income dividends for tax purposes.
2 Net Assets—End of Period includes undistributed (overdistributed) net investment income of $411,884,000 and $320,604,000.
See accompanying Notes, which are an integral part of the Financial Statements.
59
| | | | | |
| Target Retirement 2030 Fund | | | | | |
| |
| |
| Financial Highlights | | | | | |
| |
| |
| For a Share Outstanding | | | Year Ended September 30, |
| Throughout Each Period | 2017 | 2016 | 2015 | 2014 | 2013 |
| Net Asset Value, Beginning of Period | $29.77 | $27.77 | $28.95 | $26.46 | $23.51 |
| Investment Operations | | | | | |
| Net Investment Income | . 6831 | .634 | .633 | .613 | . 540 |
| Capital Gain Distributions Received | .0061 | .008 | .016 | .002 | .027 |
| Net Realized and Unrealized Gain (Loss) | | | | | |
| on Investments | 3.167 | 2.390 | (1.242) | 2.402 | 2.897 |
| Total from Investment Operations | 3.856 | 3.032 | (.593) | 3.017 | 3.464 |
| Distributions | | | | | |
| Dividends from Net Investment Income | (. 576) | (. 597) | (. 558) | (. 491) | (. 499) |
| Distributions from Realized Capital Gains | (.120) | (. 435) | (. 029) | (. 036) | (. 015) |
| Total Distributions | (. 696) | (1.032) | (. 587) | (. 527) | (. 514) |
| Net Asset Value, End of Period | $32.93 | $29.77 | $27.77 | $28.95 | $26.46 |
| |
| Total Return2 | 13.25% | 11.15% | -2.16% | 11.51% | 15.05% |
| |
| Ratios/Supplemental Data | | | | | |
| Net Assets, End of Period (Millions) | $30,877 | $24,966 | $22,684 | $23,085 | $17,795 |
| Ratio of Total Expenses to Average Net Assets | — | — | — | — | — |
| Acquired Fund Fees and Expenses | 0.14% | 0.15% | 0.15% | 0.17% | 0.17% |
| Ratio of Net Investment Income to | | | | | |
| Average Net Assets | 2.21% | 2.20% | 2.08% | 2.16% | 2.30% |
| Portfolio Turnover Rate | 9% | 16% | 24% | 7% | 14% |
1 Calculated based on average shares outstanding.
2 Total returns do not include account service fees that may have applied in the periods shown. Fund prospectuses provide information
about any applicable account service fees.
See accompanying Notes, which are an integral part of the Financial Statements.
60
Target Retirement 2030 Fund
Notes to Financial Statements
Vanguard Target Retirement 2030 Fund is registered under the Investment Company Act of 1940 as an open-end investment company, or mutual fund. The fund follows a balanced investment strategy by investing in selected Vanguard funds to achieve its targeted allocation of assets to U.S. and international stocks, and U.S. and international bonds. Financial statements and other information about each underlying fund are available on vanguard.com.
A. The following significant accounting policies conform to generally accepted accounting principles for U.S. investment companies. The fund consistently follows such policies in preparing its financial statements.
1. Security Valuation: Investments are valued at the net asset value of each underlying Vanguard fund determined as of the close of the New York Stock Exchange (generally 4 p.m., Eastern time) on the valuation date.
2. Federal Income Taxes: The fund intends to continue to qualify as a regulated investment company and distribute all of its taxable income. Management has analyzed the fund’s tax positions taken for all open federal income tax years (September 30, 2014–2017), and has concluded that no provision for federal income tax is required in the fund’s financial statements.
3. Distributions: Distributions to shareholders are recorded on the ex-dividend date.
4. Credit Facility: The fund and certain other funds managed by The Vanguard Group (“Vanguard”) participate in a $3.1 billion committed credit facility provided by a syndicate of lenders pursuant to a credit agreement that may be renewed annually; each fund is individually liable for its borrowings, if any, under the credit facility. Borrowings may be utilized for temporary and emergency purposes, and are subject to the fund’s regulatory and contractual borrowing restrictions. The participating funds are charged administrative fees and an annual commitment fee of 0.10% of the undrawn amount of the facility; these fees are allocated to the funds based on a method approved by the fund’s board of trustees and borne by the funds in which the fund invests (see Note B). Any borrowings under this facility bear interest at a rate based upon the higher of the one-month London Interbank Offered Rate, federal funds effective rate, or overnight bank funding rate plus an agreed-upon spread.
The fund had no borrowings outstanding at September 30, 2017, or at any time during the period then ended.
5. Other: Income and capital gain distributions received are recorded on the ex-dividend date. Security transactions are accounted for on the date securities are bought or sold. Costs used to determine realized gains (losses) on the sale of investment securities are those of the specific securities sold.
B. In accordance with the terms of a Funds’ Service Agreement (the “FSA”) between Vanguard and the fund, Vanguard furnishes to the fund investment advisory, corporate management, administrative, marketing, and distribution services at Vanguard’s cost of operations (as defined by the FSA). These costs of operations are allocated to the fund based on methods and guidelines approved by the board of trustees. The FSA provides that expenses otherwise allocable to Vanguard funds-of-funds may be reduced or eliminated to the extent of savings realized by the underlying Vanguard funds by virtue of being part of a fund-of-funds. Accordingly, all expenses for services provided by Vanguard to the fund and all other expenses incurred by the fund during
61
Target Retirement 2030 Fund
the period ended September 30, 2017, were borne by the underlying Vanguard funds in which the fund invests. The fund’s trustees and officers are also trustees and officers, respectively, of the underlying Vanguard funds, as well as directors and employees, respectively, of Vanguard.
C. Various inputs may be used to determine the value of the fund’s investments. These inputs are summarized in three broad levels for financial statement purposes. The inputs or methodologies used to value securities are not necessarily an indication of the risk associated with investing in those securities.
Level 1—Quoted prices in active markets for identical securities.
Level 2—Other significant observable inputs (including quoted prices for similar securities, interest rates, prepayment speeds, credit risk, etc.).
Level 3—Significant unobservable inputs (including the fund’s own assumptions used to determine the fair value of investments). Any investments valued with significant unobservable inputs are noted on the Statement of Net Assets.
At September 30, 2017, 100% of the market value of the fund’s investments was determined based on Level 1 inputs.
D. Distributions are determined on a tax basis and may differ from net investment income and realized capital gains for financial reporting purposes. Differences may be permanent or temporary. Permanent differences are reclassified among capital accounts in the financial statements to reflect their tax character. Temporary differences arise when certain items of income, expense, gain, or loss are recognized in different periods for financial statement and tax purposes. These differences will reverse at some time in the future. Differences in classification may also result from the treatment of short-term gains as ordinary income for tax purposes.
The fund used a tax accounting practice to treat a portion of the price of capital shares redeemed during the year as distributions from net investment income and realized capital gains. Accordingly, the fund has reclassified $25,707,000 from undistributed net investment income and $796,000 from accumulated net realized gains to paid-in capital.
For tax purposes, at September 30, 2017, the fund had $427,152,000 of ordinary income and $2,881,000 of long-term capital gains available for distribution.
At September 30, 2017, the cost of investment securities for tax purposes was $22,789,504,000. Net unrealized appreciation of investment securities for tax purposes was $8,107,268,000, consisting entirely of unrealized gains on securities that had risen in value since their purchase.
E. Capital shares issued and redeemed were:
| | |
| | Year Ended September 30, |
| | 2017 | 2016 |
| | Shares | Shares |
| | (000) | (000) |
| Issued | 275,820 | 222,843 |
| Issued in Lieu of Cash Distributions | 20,272 | 28,460 |
| Redeemed | (197,141) | (229,481) |
| Net Increase (Decrease) in Shares Outstanding | 98,951 | 21,822 |
62
Target Retirement 2030 Fund
F. Transactions during the period in affiliated underlying Vanguard funds were as follows:
| | | | | | | | |
| | | | | | Current Period Transactions |
| | Sept. 30, | | Proceeds | | | | | Sept. 30, |
| | 2016 | | from | Realized | Change in | | Capital Gain | 2017 |
| Market | Purchases | Securities | Net Gain | Unrealized | | Distributions | Market |
| | Value | at Cost | Sold | (Loss) | App. (Dep.) | Income | Received | Value |
| | ($000) | ($000) | ($000) | ($000) | ($000) | ($000) | ($000) | ($000) |
| Vanguard Market | | | | | | | | |
| Liquidity Fund | 18,778 | NA1 | NA1 | 2 | — | 83 | — | 16,347 |
| Vanguard Total | | | | | | | | |
| Bond Market II | | | | | | | | |
| Index Fund | 4,792,722 | 2,246,171 | 721,726 | (255) | (113,340) 129,510 | 5,163 | 6,203,572 |
| Vanguard Total | | | | | | | | |
| International Bond | | | | | | | | |
| Index Fund | 1,968,265 | 625,942 | — | — | (46,741) | 37,772 | — | 2,547,466 |
| Vanguard Total | | | | | | | | |
| International Stock | | | | | | | |
| Index Fund | 7,270,181 | 886,485 | 607,715 | 12,112 | 1,235,298 | 221,404 | — | 8,796,361 |
| Vanguard Total | | | | | | | | |
| Stock Market | | | | | | | | |
| Index Fund | 10,955,214 | 1,654,021 | 1,097,632 | 16,072 | 1,805,351 | 225,729 | — | 13,333,026 |
| Total | 25,005,160 | 5,412,619 | 2,427,073 | 27,931 | 2,880,568 | 614,498 | 5,163 | 30,896,772 |
| 1 Not applicable—purchases and sales are for temporary cash investment purposes. | | | |
G. Management has determined that no material events or transactions occurred subsequent to September 30, 2017, that would require recognition or disclosure in these financial statements.
63
Target Retirement 2035 Fund
Fund Profile
As of September 30, 2017
| |
| Total Fund Characteristics | |
| Ticker Symbol | VTTHX |
| 30-Day SEC Yield | 2.05% |
| Acquired Fund Fees and Expenses1 | 0.15% |
| |
| Allocation to Underlying Vanguard Funds | |
| Vanguard Total Stock Market Index | |
| Fund Investor Shares | 47.6% |
| Vanguard Total International Stock | |
| Index Fund Investor Shares | 31.4 |
| Vanguard Total Bond Market II | |
| Index Fund Investor Shares | 14.8 |
| Vanguard Total International Bond | |
| Index Fund Investor Shares | 6.2 |
| | |
| Total Fund Volatility Measures | |
| | Target 2035 | MSCI US |
| | Composite | Broad Market |
| | Index | Index |
| R-Squared | 1.00 | 0.92 |
| Beta | 0.98 | 0.77 |
These measures show the degree and timing of the fund’s fluctuations compared with the indexes over 36 months.
Fund Asset Allocation
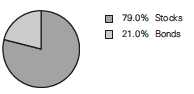
1 This figure—drawn from the prospectus dated July 12, 2017—represents an estimate of the weighted average of the expense ratios and any transaction fees charged by the underlying mutual funds (the ”acquired” funds) in which the Target Retirement 2035 Fund invests. The fund does not charge any expenses or fees of its own. For the fiscal year ended September 30, 2017, the acquired fund fees and expenses were 0.14%.
64
Target Retirement 2035 Fund
Performance Summary
All of the returns in this report represent past performance, which is not a guarantee of future results that may be achieved by the fund. (Current performance may be lower or higher than the performance data cited. For performance data current to the most recent month-end, visit our website at vanguard.com/performance.) Note, too, that both investment returns and principal value can fluctuate widely, so an investor’s shares, when sold, could be worth more or less than their original cost. The returns shown do not reflect taxes that a shareholder would pay on fund distributions or on the sale of fund shares.
Cumulative Performance: September 30, 2007, Through September 30, 2017
Initial Investment of $10,000
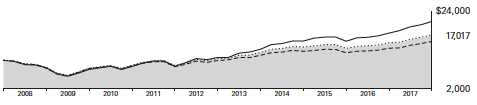
| | | | |
| | Average Annual Total Returns | |
| | Periods Ended September 30, 2017 | |
| | | | | Final Value |
| | One | Five | Ten | of a $10,000 |
| | Year | Years | Years | Investment |
| Target Retirement 2035 Fund* | 14.76% | 10.30% | 5.46% | $17,017 |
| Target 2035 Composite Index | 14.94 | 10.50 | 5.60 | 17,242 |
| Mixed-Asset Target 2035 Funds | | | | |
| Average | 14.35 | 9.12 | 4.38 | 15,356 |
| MSCI US Broad Market Index | 18.67 | 14.26 | 7.72 | 21,034 |
For a benchmark description, see the Glossary.
Mixed-Asset Target 2035 Funds Average: Derived from data provided by Lipper, a Thomson Reuters Company.
See Financial Highlights for dividend and capital gains information.
65
Target Retirement 2035 Fund
Fiscal-Year Total Returns (%): September 30, 2007, Through September 30, 2017

66
Target Retirement 2035 Fund
Financial Statements
Statement of Net Assets
As of September 30, 2017
The fund reports a complete list of its holdings in regulatory filings four times in each fiscal year, at the quarter-ends. For the second and fourth fiscal quarters, the lists appear in the fund’s semiannual and annual reports to shareholders. For the first and third fiscal quarters, the fund files the lists with the Securities and Exchange Commission on Form N-Q. Shareholders can look up the fund’s Forms N-Q on the SEC’s website at sec.gov. Forms N-Q may also be reviewed and copied at the SEC’s Public Reference Room (see the back cover of this report for further information).
| | |
| | | Market |
| | | Value• |
| | Shares | ($000) |
| Investment Companies (99.9%) | | |
| U.S. Stock Fund (47.6%) | | |
| Vanguard Total Stock Market Index Fund Investor Shares | 225,300,720 | 14,200,704 |
| |
| International Stock Fund (31.4%) | | |
| Vanguard Total International Stock Index Fund Investor Shares | 532,493,048 | 9,355,903 |
| |
| U.S. Bond Fund (14.8%) | | |
| 1 Vanguard Total Bond Market II Index Fund Investor Shares | 409,779,313 | 4,405,128 |
| |
| International Bond Fund (6.1%) | | |
| Vanguard Total International Bond Index Fund Investor Shares | 168,508,073 | 1,835,053 |
| Total Investment Companies (Cost $20,852,282) | | 29,796,788 |
| Temporary Cash Investment (0.1%) | | |
| Money Market Fund (0.1%) | | |
| 1 Vanguard Market Liquidity Fund, 1.223% (Cost $15,625) | 156,222 | 15,625 |
| Total Investments (100.0%) (Cost $20,867,907) | | 29,812,413 |
| Other Assets and Liabilities (0.0%) | | |
| Other Assets | | 76,579 |
| Liabilities | | (90,826) |
| | | (14,247) |
| Net Assets (100%) | | |
| Applicable to 1,475,302,703 outstanding $.001 par value shares of | | |
| beneficial interest (unlimited authorization) | | 29,798,166 |
| Net Asset Value Per Share | | $20.20 |
67
| |
| Target Retirement 2035 Fund | |
| |
| |
| |
| |
| | Amount |
| | ($000) |
| Statement of Assets and Liabilities | |
| Assets | |
| Investments in Securities, at Value—Affiliated Vanguard Funds | 29,812,413 |
| Receivables for Accrued Income | 10,050 |
| Receivables for Capital Shares Issued | 66,529 |
| Total Assets | 29,888,992 |
| Liabilities | |
| Payables for Investment Securities Purchased | 56,640 |
| Payables for Capital Shares Redeemed | 34,186 |
| Total Liabilities | 90,826 |
| Net Assets | 29,798,166 |
| |
| |
| At September 30, 2017, net assets consisted of: | |
| | Amount |
| | ($000) |
| Paid-in Capital | 20,405,882 |
| Undistributed Net Investment Income | 398,999 |
| Accumulated Net Realized Gains | 48,779 |
| Unrealized Appreciation (Depreciation) | 8,944,506 |
| Net Assets | 29,798,166 |
• See Note A in Notes to Financial Statements.
1 Affiliated fund available only to Vanguard funds and certain trusts and accounts managed by Vanguard. Rate shown for Vanguard
Market Liquidity Fund is the 7-day yield.
See accompanying Notes, which are an integral part of the Financial Statements.
68
| |
| Target Retirement 2035 Fund | |
| |
| |
| Statement of Operations | |
| |
| | Year Ended |
| | September 30, 2017 |
| | ($000) |
| Investment Income | |
| Income | |
| Income Distributions Received from Affiliated Funds | 597,296 |
| Net Investment Income—Note B | 597,296 |
| Realized Net Gain (Loss) | |
| Capital Gain Distributions Received from Affiliated Funds | 3,648 |
| Affiliated Investment Securities Sold | 59,898 |
| Realized Net Gain (Loss) | 63,546 |
| Change in Unrealized Appreciation (Depreciation) of Investment Securities | 3,103,907 |
| Net Increase (Decrease) in Net Assets Resulting from Operations | 3,764,749 |
See accompanying Notes, which are an integral part of the Financial Statements.
69
| | |
| Target Retirement 2035 Fund | | |
| |
| |
| Statement of Changes in Net Assets | | |
| |
| | Year Ended September 30, |
| | 2017 | 2016 |
| | ($000) | ($000) |
| Increase (Decrease) in Net Assets | | |
| Operations | | |
| Net Investment Income | 597,296 | 512,267 |
| Realized Net Gain (Loss) | 63,546 | 318,684 |
| Change in Unrealized Appreciation (Depreciation) | 3,103,907 | 1,756,197 |
| Net Increase (Decrease) in Net Assets Resulting from Operations | 3,764,749 | 2,587,148 |
| Distributions | | |
| Net Investment Income | (494,222) | (480,079) |
| Realized Capital Gain1 | (187,693) | (537,016) |
| Total Distributions | (681,915) | (1,017,095) |
| Capital Share Transactions | | |
| Issued | 7,084,082 | 5,337,665 |
| Issued in Lieu of Cash Distributions | 673,009 | 999,667 |
| Redeemed | (5,572,365) | (6,177,230) |
| Net Increase (Decrease) from Capital Share Transactions | 2,184,726 | 160,102 |
| Total Increase (Decrease) | 5,267,560 | 1,730,155 |
| Net Assets | | |
| Beginning of Period | 24,530,606 | 22,800,451 |
| End of Period2 | 29,798,166 | 24,530,606 |
1 Includes fiscal 2017 and 2016 short-term gain distributions totaling $5,137,000 and $36,232,000, respectively. Short-term gain
distributions are treated as ordinary income dividends for tax purposes.
2 Net Assets—End of Period includes undistributed (overdistributed) net investment income of $398,999,000 and $319,758,000.
See accompanying Notes, which are an integral part of the Financial Statements.
70
| | | | | |
| Target Retirement 2035 Fund | | | | | |
| |
| |
| Financial Highlights | | | | | |
| |
| |
| For a Share Outstanding | | | Year Ended September 30, |
| Throughout Each Period | 2017 | 2016 | 2015 | 2014 | 2013 |
| Net Asset Value, Beginning of Period | $18.09 | $16.95 | $17.79 | $16.16 | $14.15 |
| Investment Operations | | | | | |
| Net Investment Income | . 4181 | .393 | .391 | .359 | .340 |
| Capital Gain Distributions Received | .0031 | .003 | .007 | .001 | .011 |
| Net Realized and Unrealized Gain (Loss) | | | | | |
| on Investments | 2.180 | 1.530 | (.865) | 1.594 | 1.972 |
| Total from Investment Operations | 2.601 | 1.926 | (.467) | 1.954 | 2.323 |
| Distributions | | | | | |
| Dividends from Net Investment Income | (. 356) | (. 371) | (. 368) | (. 324) | (. 307) |
| Distributions from Realized Capital Gains | (.135) | (. 415) | (. 005) | — | (. 006) |
| Total Distributions | (. 491) | (.786) | (. 373) | (. 324) | (. 313) |
| Net Asset Value, End of Period | $20.20 | $18.09 | $16.95 | $17.79 | $16.16 |
| |
| Total Return2 | 14.76% | 11.64% | -2.75% | 12.20% | 16.77% |
| |
| Ratios/Supplemental Data | | | | | |
| Net Assets, End of Period (Millions) | $29,798 | $24,531 | $22,800 | $23,826 | $19,026 |
| Ratio of Total Expenses to Average Net Assets | — | — | — | — | — |
| Acquired Fund Fees and Expenses | 0.14% | 0.15% | 0.15% | 0.18% | 0.18% |
| Ratio of Net Investment Income to | | | | | |
| Average Net Assets | 2.22% | 2.21% | 2.07% | 2.17% | 2.33% |
| Portfolio Turnover Rate | 9% | 14% | 23% | 6% | 12% |
1 Calculated based on average shares outstanding.
2 Total returns do not include account service fees that may have applied in the periods shown. Fund prospectuses provide information
about any applicable account service fees.
See accompanying Notes, which are an integral part of the Financial Statements.
71
Target Retirement 2035 Fund
Notes to Financial Statements
Vanguard Target Retirement 2035 Fund is registered under the Investment Company Act of 1940 as an open-end investment company, or mutual fund. The fund follows a balanced investment strategy by investing in selected Vanguard funds to achieve its targeted allocation of assets to U.S. and international stocks, and U.S. and international bonds. Financial statements and other information about each underlying fund are available on vanguard.com.
A. The following significant accounting policies conform to generally accepted accounting principles for U.S. investment companies. The fund consistently follows such policies in preparing its financial statements.
1. Security Valuation: Investments are valued at the net asset value of each underlying Vanguard fund determined as of the close of the New York Stock Exchange (generally 4 p.m., Eastern time) on the valuation date.
2. Federal Income Taxes: The fund intends to continue to qualify as a regulated investment company and distribute all of its taxable income. Management has analyzed the fund’s tax positions taken for all open federal income tax years (September 30, 2014–2017), and has concluded that no provision for federal income tax is required in the fund’s financial statements.
3. Distributions: Distributions to shareholders are recorded on the ex-dividend date.
4. Credit Facility: The fund and certain other funds managed by The Vanguard Group (“Vanguard”) participate in a $3.1 billion committed credit facility provided by a syndicate of lenders pursuant to a credit agreement that may be renewed annually; each fund is individually liable for its borrowings, if any, under the credit facility. Borrowings may be utilized for temporary and emergency purposes, and are subject to the fund’s regulatory and contractual borrowing restrictions. The participating funds are charged administrative fees and an annual commitment fee of 0.10% of the undrawn amount of the facility; these fees are allocated to the funds based on a method approved by the fund’s board of trustees and borne by the funds in which the fund invests (see Note B). Any borrowings under this facility bear interest at a rate based upon the higher of the one-month London Interbank Offered Rate, federal funds effective rate, or overnight bank funding rate plus an agreed-upon spread.
The fund had no borrowings outstanding at September 30, 2017, or at any time during the period then ended.
5. Other: Income and capital gain distributions received are recorded on the ex-dividend date. Security transactions are accounted for on the date securities are bought or sold. Costs used to determine realized gains (losses) on the sale of investment securities are those of the specific securities sold.
B. In accordance with the terms of a Funds’ Service Agreement (the “FSA”) between Vanguard and the fund, Vanguard furnishes to the fund investment advisory, corporate management, administrative, marketing, and distribution services at Vanguard’s cost of operations (as defined by the FSA). These costs of operations are allocated to the fund based on methods and guidelines approved by the board of trustees. The FSA provides that expenses otherwise allocable to Vanguard funds-of-funds may be reduced or eliminated to the extent of savings realized by the underlying Vanguard funds by virtue of being part of a fund-of-funds. Accordingly, all expenses for services provided by Vanguard to the fund and all other expenses incurred by the fund during
72
Target Retirement 2035 Fund
the period ended September 30, 2017, were borne by the underlying Vanguard funds in which the fund invests. The fund’s trustees and officers are also trustees and officers, respectively, of the underlying Vanguard funds, as well as directors and employees, respectively, of Vanguard.
C. Various inputs may be used to determine the value of the fund’s investments. These inputs are summarized in three broad levels for financial statement purposes. The inputs or methodologies used to value securities are not necessarily an indication of the risk associated with investing in those securities.
Level 1—Quoted prices in active markets for identical securities.
Level 2—Other significant observable inputs (including quoted prices for similar securities, interest rates, prepayment speeds, credit risk, etc.).
Level 3—Significant unobservable inputs (including the fund’s own assumptions used to determine the fair value of investments). Any investments valued with significant unobservable inputs are noted on the Statement of Net Assets.
At September 30, 2017, 100% of the market value of the fund’s investments was determined based on Level 1 inputs.
D. Distributions are determined on a tax basis and may differ from net investment income and realized capital gains for financial reporting purposes. Differences may be permanent or temporary. Permanent differences are reclassified among capital accounts in the financial statements to reflect their tax character. Temporary differences arise when certain items of income, expense, gain, or loss are recognized in different periods for financial statement and tax purposes. These differences will reverse at some time in the future. Differences in classification may also result from the treatment of short-term gains as ordinary income for tax purposes.
The fund used a tax accounting practice to treat a portion of the price of capital shares redeemed during the year as distributions from net investment income and realized capital gains. Accordingly, the fund has reclassified $23,833,000 from undistributed net investment income and $2,031,000 from accumulated net realized gains to paid-in capital.
For tax purposes, at September 30, 2017, the fund had $419,467,000 of ordinary income and $28,311,000 of long-term capital gains available for distribution.
At September 30, 2017, the cost of investment securities for tax purposes was $20,867,907,000. Net unrealized appreciation of investment securities for tax purposes was $8,944,506,000, consisting entirely of unrealized gains on securities that had risen in value since their purchase.
E. Capital shares issued and redeemed were:
| | |
| | Year Ended September 30, |
| | 2017 | 2016 |
| | Shares | Shares |
| | (000) | (000) |
| Issued | 378,037 | 311,062 |
| Issued in Lieu of Cash Distributions | 37,980 | 58,597 |
| Redeemed | (296,871) | (358,384) |
| Net Increase (Decrease) in Shares Outstanding | 119,146 | 11,275 |
73
Target Retirement 2035 Fund
F. Transactions during the period in affiliated underlying Vanguard funds were as follows:
| | | | | | | | |
| | | | | | Current Period Transactions |
| | Sept. 30, | | Proceeds | | | | | Sept. 30, |
| | 2016 | | from | Realized | Change in | | Capital Gain | 2017 |
| Market | Purchases | Securities | Net Gain | Unrealized | | Distributions | |
| | Value | at Cost | Sold | (Loss) | App.(Dep.) | Income | Received | Value |
| | ($000) | ($000) | ($000) | ($000) | ($000) | ($000) | ($000) | ($000) |
| Vanguard Market | | | | | | | | |
| Liquidity Fund | 10,393 | NA1 | NA1 | 1 | — | 55 | — | 15,625 |
| Vanguard Total | | | | | | | | |
| Bond Market II | | | | | | | | |
| Index Fund | 3,433,858 | 1,597,969 | 545,482 | 98 | (81,315) | 92,020 | 3,648 | 4,405,128 |
| Vanguard Total | | | | | | | | |
| International Bond | | | | | | | | |
| Index Fund | 1,385,325 | 483,051 | — | — | (33,323) | 26,717 | — | 1,835,053 |
| Vanguard Total | | | | | | | | |
| International Stock | | | | | | | |
| Index Fund | 7,873,202 | 884,113 | 730,706 | 13,035 | 1,316,259 | 236,946 | — | 9,355,903 |
| Vanguard Total | | | | | | | | |
| Stock Market | | | | | | | | |
| Index Fund | 11,838,917 | 1,516,576 | 1,103,839 | 46,764 | 1,902,286 | 241,558 | — | 14,200,704 |
| Total | 24,541,695 | 4,481,709 | 2,380,027 | 59,898 | 3,103,907 | 597,296 | 3,648 | 29,812,413 |
| 1 Not Applicable—purchases and sales are for temporary cash investment purposes. | | | |
G. Management has determined that no material events or transactions occurred subsequent to September 30, 2017, that would require recognition or disclosure in these financial statements.
74
Report of Independent Registered Public Accounting Firm
To the Board of Trustees of Vanguard Chester Funds and the Shareholders of Vanguard Target Retirement Income Fund, Vanguard Target Retirement 2015 Fund, Vanguard Target Retirement 2020 Fund, Vanguard Target Retirement 2025 Fund, Vanguard Target Retirement 2030 Fund and Vanguard Target Retirement 2035 Fund
In our opinion, the accompanying statements of net assets and statements of assets and liabilities and the related statements of operations and of changes in net assets and the financial highlights present fairly, in all material respects, the financial position of Vanguard Target Retirement Income Fund, Vanguard Target Retirement 2015 Fund, Vanguard Target Retirement 2020 Fund, Vanguard Target Retirement 2025 Fund, Vanguard Target Retirement 2030 Fund and Vanguard Target Retirement 2035 Fund (constituting separate portfolios of Vanguard Chester Funds, hereafter referred to as the “Funds”) as of September 30, 2017, the results of each of their operations for the year then ended, the changes in each of their net assets for each of the two years in the period then ended and the financial highlights for each of the five years in the period then ended, in conformity with accounting principles generally accepted in the United States of America. These financial statements and financial highlights (hereafter referred to as “financial statements”) are the responsibility of the Funds’ management. Our responsibility is to express an opinion on these financial statements based on our audits. We conducted our audits of these financial statements in accordance with the standards of the Public Company Accounting Oversight Board (United States). Those standards require that we plan and perform the audit to obtain reasonable assurance about whether the financial statements are free of material misstatement. An audit includes examining, on a test basis, evidence supporting the amounts and disclosures in the financial statements, assessing the accounting principles used and significant estimates made by management, and evaluating the overall financial statement presentation. We believe that our audits, which included confirmation of securities as of September 30, 2017 by agreement to the underlying ownership records of the transfer agent, provide a reasonable basis for our opinion.
/s/PricewaterhouseCoopers LLP
Philadelphia, Pennsylvania
November 13, 2017
75
Special 2017 tax information (unaudited) for Vanguard Target Retirement Funds
This information for the fiscal year ended September 30, 2017, is included pursuant to provisions of the Internal Revenue Code.
The funds distributed capital gain dividends (20% rate gain distributions) to shareholders during the fiscal year as follows:
| |
| Fund | ($000) |
| Target Retirement Income Fund | 46,444 |
| Target Retirement 2015 Fund | 397,371 |
| Target Retirement 2020 Fund | 211,883 |
| Target Retirement 2025 Fund | 218,624 |
| Target Retirement 2030 Fund | 70,178 |
| Target Retirement 2035 Fund | 183,738 |
For nonresident alien shareholders, 100% of short-term capital gain dividends distributed by the funds are qualified short-term capital gains.
The funds distributed qualified dividend income to shareholders during the fiscal year as follows:
| |
| Fund | ($000) |
| Target Retirement Income Fund | 64,297 |
| Target Retirement 2015 Fund | 140,792 |
| Target Retirement 2020 Fund | 269,238 |
| Target Retirement 2025 Fund | 352,291 |
| Target Retirement 2030 Fund | 306,517 |
| Target Retirement 2035 Fund | 332,463 |
For corporate shareholders, the percentage of investment income (dividend income plus short-term gains, if any) that qualifies for the dividends-received deduction is as follows:
| |
| Fund | Percentage |
| Target Retirement Income Fund | 15.2% |
| Target Retirement 2015 Fund | 21.4 |
| Target Retirement 2020 Fund | 24.9 |
| Target Retirement 2025 Fund | 27.8 |
| Target Retirement 2030 Fund | 30.9 |
| Target Retirement 2035 Fund | 34.6 |
76
The funds designate to shareholders foreign source income and foreign taxes paid as follows:
| | |
| | Foreign Source Income | Foreign Taxes Paid |
| Fund | ($000) | ($000) |
| Target Retirement Income Fund | 72,433 | 2,907 |
| Target Retirement 2015 Fund | 127,955 | 6,051 |
| Target Retirement 2020 Fund | 251,210 | 13,019 |
| Target Retirement 2025 Fund | 317,847 | 17,406 |
| Target Retirement 2030 Fund | 273,366 | 15,777 |
| Target Retirement 2035 Fund | 279,368 | 16,832 |
Shareholders will receive more detailed information with their Form 1099-DIV in January 2018 to determine the calendar-year amounts to be included on their 2017 tax returns.
77
Your Fund’s After-Tax Returns
This table presents returns for your fund both before and after taxes. The after-tax returns are shown in two ways: (1) assuming that an investor owned the fund during the entire period and paid taxes on the fund’s distributions, and (2) assuming that an investor paid taxes on the fund’s distributions and sold all shares at the end of each period.
Calculations are based on the highest individual federal income tax and capital gains tax rates in effect at the times of the distributions and the hypothetical sales. State and local taxes were not considered. After-tax returns reflect any qualified dividend income, using actual prior-year figures and estimates for 2017. (In the example, returns after the sale of fund shares may be higher than those assuming no sale. This occurs when the sale would have produced a capital loss. The calculation assumes that the investor received a tax deduction for the loss.)
Please note that your actual after-tax returns will depend on your tax situation and may differ from those shown. Also note that if you own the fund in a tax-deferred account, such as an individual retirement account or a 401(k) plan, this information does not apply to you. Such accounts are not subject to current taxes.
Finally, keep in mind that a fund’s performance—whether before or after taxes—does not guarantee future results.
| | | |
| Average Annual Total Returns: Target Retirement Funds | | | |
| Periods Ended September 30, 2017 | | | |
| | One | Five | Ten |
| | Year | Years | Years |
| Target Retirement Income Fund | | | |
| Returns Before Taxes | 5.26% | 4.68% | 4.87% |
| Returns After Taxes on Distributions | 4.41 | 3.77 | 3.94 |
| Returns After Taxes on Distributions and Sale of Fund Shares | 3.13 | 3.33 | 3.52 |
| |
| |
| | One | Five | Ten |
| | Year | Years | Years |
| Target Retirement 2015 Fund | | | |
| Returns Before Taxes | 7.95% | 6.92% | 4.88% |
| Returns After Taxes on Distributions | 6.72 | 5.84 | 3.97 |
| Returns After Taxes on Distributions and Sale of Fund Shares | 5.02 | 5.15 | 3.60 |
| |
| |
| | One | Five | Ten |
| | Year | Years | Years |
| Target Retirement 2020 Fund | | | |
| Returns Before Taxes | 10.17% | 8.08% | 5.15% |
| Returns After Taxes on Distributions | 9.28 | 7.28 | 4.46 |
| Returns After Taxes on Distributions and Sale of Fund Shares | 6.06 | 6.12 | 3.87 |
78
| | | |
| Average Annual Total Returns: Target Retirement Funds | | | |
| Periods Ended September 30, 2017 | | | |
| |
| | One | Five | Ten |
| | Year | Years | Years |
| Target Retirement 2025 Fund | | | |
| Returns Before Taxes | 11.74% | 8.85% | 5.21% |
| Returns After Taxes on Distributions | 10.89 | 8.02 | 4.51 |
| Returns After Taxes on Distributions and Sale of Fund Shares | 6.96 | 6.76 | 3.94 |
| |
| | One | Five | Ten |
| | Year | Years | Years |
| Target Retirement 2030 Fund | | | |
| Returns Before Taxes | 13.25% | 9.58% | 5.27% |
| Returns After Taxes on Distributions | 12.47 | 8.86 | 4.68 |
| Returns After Taxes on Distributions and Sale of Fund Shares | 7.77 | 7.38 | 4.03 |
| |
| | One | Five | Ten |
| | Year | Years | Years |
| Target Retirement 2035 Fund | | | |
| Returns Before Taxes | 14.76% | 10.30% | 5.46% |
| Returns After Taxes on Distributions | 13.91 | 9.54 | 4.86 |
| Returns After Taxes on Distributions and Sale of Fund Shares | 8.73 | 7.99 | 4.21 |
79
About Your Fund’s Expenses
As a shareholder of the fund, you incur ongoing costs, which include costs for portfolio management, administrative services, and shareholder reports (like this one), among others. Operating expenses, which are deducted from a fund’s gross income, directly reduce the investment return of the fund.
A typical fund’s expenses are expressed as a percentage of its average net assets. The Target Retirement Funds have no direct expenses, but each fund bears its proportionate share of the costs for the underlying funds in which it invests. These indirect expenses make up the acquired fund fees and expenses, also expressed as a percentage of average net assets.
The following examples are intended to help you understand the ongoing cost (in dollars) of investing in your fund and to compare these costs with those of other mutual funds. The examples are based on an investment of $1,000 made at the beginning of the period shown and held for the entire period. The costs were calculated using the acquired fund fees and expenses for each Target Retirement Fund.
The accompanying table illustrates your fund’s costs in two ways:
• Based on actual fund return. This section helps you to estimate the actual expenses that you paid over the period. The ”Ending Account Value“ shown is derived from the fund‘s actual return, and the third column shows the dollar amount that would have been paid by an investor who started with $1,000 in the fund. You may use the information here, together with the amount you invested, to estimate the expenses that you paid over the period.
To do so, simply divide your account value by $1,000 (for example, an $8,600 account value divided by $1,000 = 8.6), then multiply the result by the number given for your fund under the heading ”Expenses Paid During Period.“
• Based on hypothetical 5% yearly return. This section is intended to help you compare your fund‘s costs with those of other mutual funds. It assumes that the fund had a yearly return of 5% before expenses, but that the expense ratio is unchanged. In this case—because the return used is not the fund’s actual return—the results do not apply to your investment. The example is useful in making comparisons because the Securities and Exchange Commission requires all mutual funds to calculate expenses based on a 5% return. You can assess your fund’s costs by comparing this hypothetical example with the hypothetical examples that appear in shareholder reports of other funds.
Note that the expenses shown in the table are meant to highlight and help you compare ongoing costs only and do not reflect transaction costs incurred by the fund for buying and selling securities. Further, the expenses do not include any purchase, redemption, or account service fees described in the fund prospectus. If such fees were applied to your account, your costs would be higher. Your fund does not carry a “sales load.”
The calculations assume no shares were bought or sold during the period. Your actual costs may have been higher or lower, depending on the amount of your investment and the timing of any purchases or redemptions.
You can find more information about the fund’s expenses, including annual expense ratios, in the Financial Statements section of this report. For additional information on operating expenses and other shareholder costs, please refer to your fund’s current prospectus.
80
| | | |
| Six Months Ended September 30, 2017 | | | |
| | Beginning | Ending | Expenses |
| | Account Value | Account Value | Paid During |
| | 3/31/2017 | 9/30/2017 | Period |
| Based on Actual Fund Return | | | |
| Target Retirement Income Fund | $1,000.00 | $1,037.71 | $0.66 |
| Target Retirement 2015 Fund | $1,000.00 | $1,050.00 | $0.67 |
| Target Retirement 2020 Fund | $1,000.00 | $1,060.16 | $0.67 |
| Target Retirement 2025 Fund | $1,000.00 | $1,067.25 | $0.73 |
| Target Retirement 2030 Fund | $1,000.00 | $1,072.99 | $0.73 |
| Target Retirement 2035 Fund | $1,000.00 | $1,079.06 | $0.73 |
| Based on Hypothetical 5% Yearly Return | | | |
| Target Retirement Income Fund | $1,000.00 | $1,024.42 | $0.66 |
| Target Retirement 2015 Fund | $1,000.00 | $1,024.21 | $0.66 |
| Target Retirement 2020 Fund | $1,000.00 | $1,024.42 | $0.66 |
| Target Retirement 2025 Fund | $1,000.00 | $1,024.16 | $0.71 |
| Target Retirement 2030 Fund | $1,000.00 | $1,024.37 | $0.71 |
| Target Retirement 2035 Fund | $1,000.00 | $1,024.16 | $0.71 |
The calculations are based on the acquired fund fees and expenses for the most recent six-month period. The funds’ annualized expense figures for that period are (in order as listed from top to bottom above) 0.13%, 0.13%, 0.13%, 0.14%, 0.14%, and 0.14%. The dollar amounts shown as ”Expenses Paid” are equal to the annualized expense figures for the underlying funds multiplied by the average account value over the period, multiplied by the number of days in the most recent six-month period, then divided by the number of days in the most recent 12-month period (183/365).
81
Glossary
30-Day SEC Yield. A fund’s 30-day SEC yield is derived using a formula specified by the U.S. Securities and Exchange Commission. Under the formula, data related to the fund’s security holdings in the previous 30 days are used to calculate the fund’s hypothetical net income for that period, which is then annualized and divided by the fund’s estimated average net assets over the calculation period. For the purposes of this calculation, a security’s income is based on its current market yield to maturity (for bonds), its actual income (for asset-backed securities), or its projected dividend yield (for stocks). Because the SEC yield represents hypothetical annualized income, it will differ—at times significantly—from the fund’s actual experience. As a result, the fund’s income distributions may be higher or lower than implied by the SEC yield.
Acquired Fund Fees and Expenses. Funds that invest in other Vanguard funds incur no direct expenses, but they do bear proportionate shares of the operating, administrative, and advisory expenses of the underlying funds, and they must pay any fees charged by those funds. The figure for acquired fund fees and expenses represents a weighted average of these underlying costs.
Acquired is a term that the Securities and Exchange Commission applies to any mutual fund whose shares are owned by another fund.
Beta. A measure of the magnitude of a fund’s past share-price fluctuations in relation to the ups and downs of a given market index. The index is assigned a beta of 1.00. Compared with a given index, a fund with a beta of 1.20 typically would have seen its share price rise or fall by 12% when the index rose or fell by 10%. For this report, beta is based on returns over the past 36 months for both the fund and the index. Note that a fund’s beta should be reviewed in conjunction with its R-squared (see definition). The lower the R-squared, the less correlation there is between the fund and the index, and the less reliable beta is as an indicator of volatility.
Expense Ratio. A fund’s total annual operating expenses expressed as a percentage of the fund’s average net assets. The expense ratio includes management and administrative expenses, but does not include the transaction costs of buying and selling portfolio securities.
Inception Date. The date on which the assets of a fund (or one of its share classes) are first invested in accordance with the fund’s investment objective. For funds with a subscription period, the inception date is the day after that period ends. Investment performance is measured from the inception date.
R-Squared. A measure of how much of a fund’s past returns can be explained by the returns from the market in general, as measured by a given index. If a fund’s total returns were precisely synchronized with an index’s returns, its R-squared would be 1.00. If the fund’s returns bore no relationship to the index’s returns, its R-squared would be 0. For this report, R-squared is based on returns over the past 36 months for both the fund and the index.
Benchmark Information
Spliced Mixed-Asset Target Today Funds Average: Mixed-Asset Target Conservative Funds Average though June 30, 2012; Mixed-Asset Target Today Funds Average thereafter.
82
Target 2015 Composite Index: Derived by applying the fund’s target asset allocation to the results of the following benchmarks: for international stocks of developed markets, the MSCI EAFE Index through December 15, 2010, the MSCI ACWI ex USA IMI Index through June 2, 2013, and the FTSE Global All Cap ex US Index thereafter; for emerging-market stocks, the Select Emerging Markets Index through August 23, 2006, the MSCI Emerging Markets Index through December 15, 2010, the MSCI ACWI ex USA IMI Index through June 2, 2013, and the FTSE Global All Cap ex US Index thereafter; for U.S. bonds, the Bloomberg Barclays U.S. Aggregate Bond Index through December 31, 2009, and the Bloomberg Barclays U.S. Aggregate Float Adjusted Index thereafter, as well as the Bloomberg Barclays U.S. Treasury Inflation-Protected Securities Index through June 2, 2013, and the Bloomberg Barclays U.S. Treasury Inflation-Protected Securities (TIPS) 0–5 Year Index thereafter; for international bonds, the Bloomberg Barclays Global Aggregate ex-USD Float Adjusted RIC Capped Index beginning June 3, 2013; and for U.S. stocks, the Dow Jones U.S. Total Stock Market Index (formerly known as the Dow Jones Wilshire 5000 Index) through April 22, 2005, the MSCI US Broad Market Index through June 2, 2013, and the CRSP US Total Market Index thereafter. International stock benchmark returns are adjusted for withholding taxes.
Target 2020 Composite Index: Derived by applying the fund’s target asset allocation to the results of the following benchmarks: for international stocks of developed markets, the MSCI EAFE Index through December 15, 2010, the MSCI ACWI ex USA IMI Index through June 2, 2013, and the FTSE Global All Cap ex US Index thereafter; for emerging-market stocks, the Select Emerging Markets Index through August 23, 2006, the MSCI Emerging Markets Index through December 15, 2010, the MSCI ACWI ex USA IMI Index through June 2, 2013, and the FTSE Global All Cap ex US Index thereafter; for U.S. bonds, the Bloomberg Barclays U.S. Aggregate Bond Index through December 31, 2009, and the Bloomberg Barclays U.S. Aggregate Float Adjusted Index thereafter; for international bonds, the Bloomberg Barclays Global Aggregate ex-USD Float Adjusted RIC Capped Index beginning June 3, 2013; and for U.S. stocks, the MSCI US Broad Market Index through June 2, 2013, and the CRSP US Total Market Index thereafter. International stock benchmark returns are adjusted for withholding taxes.
Target 2025 Composite Index: Derived by applying the fund’s target asset allocation to the results of the following benchmarks: for international stocks of developed markets, the MSCI EAFE Index through December 15, 2010, the MSCI ACWI ex USA IMI Index through June 2, 2013, and the FTSE Global All Cap ex US Index thereafter; for emerging-market stocks, the Select Emerging Markets Index through August 23, 2006, the MSCI Emerging Markets Index through December 15, 2010, the MSCI ACWI ex USA IMI Index through June 2, 2013, and the FTSE Global All Cap ex US Index thereafter; for U.S. bonds, the Bloomberg Barclays U.S. Aggregate Bond Index through December 31, 2009, and the Bloomberg Barclays U.S. Aggregate Float Adjusted Index thereafter; for international bonds, the Bloomberg Barclays Global Aggregate ex-USD Float Adjusted RIC Capped Index beginning June 3, 2013; and for U.S. stocks, the Dow Jones U.S. Total Stock Market Index (formerly known as the Dow Jones Wilshire 5000 Index) through April 22, 2005, the MSCI US Broad Market Index through June 2, 2013, and the CRSP US Total Market Index thereafter. International stock benchmark returns are adjusted for withholding taxes.
83
Target 2030 Composite Index: Derived by applying the fund’s target asset allocation to the results of the following benchmarks: for international stocks of developed markets, the MSCI EAFE Index through December 15, 2010, the MSCI ACWI ex USA IMI Index through June 2, 2013, and the FTSE Global All Cap ex US Index thereafter; for emerging-market stocks, the Select Emerging Markets Index through August 23, 2006, the MSCI Emerging Markets Index through December 15, 2010, the MSCI ACWI ex USA IMI Index through June 2, 2013, and the FTSE Global All Cap ex US Index thereafter; for U.S. bonds, the Bloomberg Barclays U.S. Aggregate Bond Index through December 31, 2009, and the Bloomberg Barclays U.S. Aggregate Float Adjusted Index thereafter; for international bonds, the Bloomberg Barclays Global Aggregate ex-USD Float Adjusted RIC Capped Index beginning June 3, 2013; and for U.S. stocks, the MSCI US Broad Market Index through June 2, 2013, and the CRSP US Total Market Index thereafter. International stock benchmark returns are adjusted for withholding taxes.
Target 2035 Composite Index: Derived by applying the fund’s target asset allocation to the results of the following benchmarks: for international stocks of developed markets, the MSCI EAFE Index through December 15, 2010, the MSCI ACWI ex USA IMI Index through June 2, 2013, and the FTSE Global All Cap ex US Index thereafter; for emerging-market stocks, the Select Emerging Markets Index through August 23, 2006, the MSCI Emerging Markets Index through December 15, 2010, the MSCI ACWI ex USA IMI Index through June 2, 2013, and the FTSE Global All Cap ex US Index thereafter; for U.S. bonds, the Bloomberg Barclays U.S. Aggregate Bond Index through December 31, 2009, and the Bloomberg Barclays U.S. Aggregate Float Adjusted Index thereafter; for international bonds, the Bloomberg Barclays Global Aggregate ex-USD Float Adjusted RIC Capped Index beginning June 3, 2013; and for U.S. stocks, the Dow Jones U.S. Total Stock Market Index (formerly known as the Dow Jones Wilshire 5000 Index) through April 22, 2005, the MSCI US Broad Market Index through June 2, 2013, and the CRSP US Total Market Index thereafter. International stock benchmark returns are adjusted for withholding taxes.
84
Target Income Composite Index: Derived by applying the fund’s target asset allocation to the results of the following benchmarks: for international stocks of developed markets, the MSCI EAFE Index through December 15, 2010, the MSCI ACWI ex USA IMI Index through June 2, 2013, and the FTSE Global All Cap ex US Index thereafter; for emerging-market stocks, the Select Emerging Markets Index through August 23, 2006, the MSCI Emerging Markets Index through December 15, 2010, the MSCI ACWI ex USA IMI Index through June 2, 2013, and the FTSE Global All Cap ex US Index thereafter; for U.S. bonds, the Bloomberg Barclays U.S. Aggregate Bond Index through December 31, 2009, and the Bloomberg Barclays U.S. Aggregate Float Adjusted Index thereafter, as well as the Bloomberg Barclays U.S. Treasury Inflation-Protected Securities Index through June 2, 2013, and the Bloomberg Barclays U.S. Treasury Inflation-Protected Securities (TIPS) 0–5 Year Index thereafter; for short-term reserves, the Citigroup Three-Month Treasury Bill Index through June 2, 2013; for international bonds, the Bloomberg Barclays Global Aggregate ex-USD Float Adjusted RIC Capped Index beginning June 3, 2013; and for U.S. stocks, the Dow Jones U.S. Total Stock Market Index (formerly known as the Dow Jones Wilshire 5000 Index) through April 22, 2005, the MSCI US Broad Market Index through June 2, 2013, and the CRSP US Total Market Index thereafter. International stock benchmark returns are adjusted for withholding taxes.
85
BLOOMBERG is a trademark and service mark of Bloomberg Finance L.P. BARCLAYS is a trademark and service mark of Barclays Bank Plc, used under license. Bloomberg Finance L.P. and its affiliates, including Bloomberg Index Services Limited (BISL) (collectively, Bloomberg), or Bloomberg’s licensors, own all proprietary rights in the Bloomberg Barclays U.S. Aggregate Bond Index, Bloomberg Barclays U.S. Aggregate Float Adjusted Index, Bloomberg Barclays U.S. Treasury Inflation Protected Securities Index, Bloomberg Barclays U.S. Treasury Inflation-Protected Securities (TIPS) 0–5 Year Index, and the Bloomberg Barclays Global Aggregate ex-USD Float Adjusted RIC Capped Index (USD Hedged) (the Indices or Bloomberg Barclays Indices).
Neither Barclays Bank Plc, Barclays Capital Inc., or any affiliate (collectively Barclays) or Bloomberg is the issuer or producer of the Target Retirement Funds (including the Total Bond Market II Index Fund, the Total International Bond Index Fund, and the Short-Term Inflation-Protected Securities Index Fund) and neither Bloomberg nor Barclays has any responsibilities, obligations or duties to investors in the Target Retirement Funds. The Indices are licensed for use by The Vanguard Group, Inc. (Vanguard) as the sponsor of the Target Retirement Funds. Bloomberg and Barclays’ only relationship with Vanguard in respect to the Indices is the licensing of the Indices, which is determined, composed and calculated by BISL, or any successor thereto, without regard to the Issuer or the Target Retirement Funds or the owners of the Target Retirement Funds.
Additionally, Vanguard may for itself execute transaction(s) with Barclays in or relating to the Indices in connection with the Target Retirement Funds. Investors acquire the Target Retirement Funds from Vanguard and investors neither acquire any interest in the Indices nor enter into any relationship of any kind whatsoever with Bloomberg or Barclays upon making an investment in the Target Retirement Funds. The Target Retirement Funds are not sponsored, endorsed, sold or promoted by Bloomberg or Barclays. Neither Bloomberg nor Barclays makes any representation or warranty, express or implied regarding the advisability of investing in the Target Retirement Funds or the advisability of investing in securities generally or the ability of the Indices to track corresponding or relative market performance. Neither Bloomberg nor Barclays has passed on the legality or suitability of the Target Retirement Funds with respect to any person or entity. Neither Bloomberg nor Barclays is responsible for and has not participated in the determination of the timing of, prices at, or quantities of the Target Retirement Funds to be issued. Neither Bloomberg nor Barclays has any obligation to take the needs of the Issuer or the owners of the Target Retirement Funds or any other third party into consideration in determining, composing or calculating the Indices. Neither Bloomberg nor Barclays has any obligation or liability in connection with administration, marketing or trading of the Target Retirement Funds.
86
The licensing agreement between Bloomberg and Barclays is solely for the benefit of Bloomberg and Barclays and not for the benefit of the owners of the Target Retirement Funds, investors or other third parties. In addition, the licensing agreement between Vanguard and Bloomberg is solely for the benefit of Vanguard and Bloomberg and not for the benefit of the owners of the Target Retirement Funds, investors or other third parties.
NEITHER BLOOMBERG NOR BARCLAYS SHALL HAVE ANY LIABILITY TO THE ISSUER, INVESTORS OR TO OTHER THIRD PARTIES FOR THE QUALITY, ACCURACY AND/OR COMPLETENESS OF THE BLOOMBERG BARCLAYS INDICES OR ANY DATA INCLUDED THEREIN OR FOR INTERRUPTIONS IN THE DELIVERY OF THE BLOOMBERG BARCLAYS INDICES. NEITHER BLOOMBERG NOR BARCLAYS MAKES ANY WARRANTY, EXPRESS OR IMPLIED, AS TO RESULTS TO BE OBTAINED BY THE ISSUER, THE INVESTORS OR ANY OTHER PERSON OR ENTITY FROM THE USE OF THE BLOOMBERG BARCLAYS INDICES OR ANY DATA INCLUDED THEREIN. NEITHER BLOOMBERG NOR BARCLAYS MAKES ANY EXPRESS OR IMPLIED WARRANTIES, AND EACH HEREBY EXPRESSLY DISCLAIMS ALL WARRANTIES OF MERCHANTABILITY OR FITNESS FOR A PARTICULAR PURPOSE OR USE WITH RESPECT TO BLOOMBERG BARCLAYS INDICES OR ANY DATA INCLUDED THEREIN. BLOOMBERG RESERVES THE RIGHT TO CHANGE THE METHODS OF CALCULATION OR PUBLICATION, OR TO CEASE THE CALCULATION OR PUBLICATION OF THE BLOOMBERG BARCLAYS INDICES, AND NEITHER BLOOMBERG NOR BARCLAYS SHALL BE LIABLE FOR ANY MISCALCULATION OF OR ANY INCORRECT, DELAYED OR INTERRUPTED PUBLICATION WITH RESPECT TO ANY OF THE BLOOMBERG BARCLAYS INDICES. NEITHER BLOOMBERG NOR BARCLAYS SHALL BE LIABLE FOR ANY DAMAGES, INCLUDING, WITHOUT LIMITATION, ANY SPECIAL, INDIRECT OR CONSEQUENTIAL DAMAGES, OR ANY LOST PROFITS AND EVEN IF ADVISED OF THE POSSIBLITY OF SUCH, RESULTING FROM THE USE OF BLOOMBERG BARCLAYS INDICES OR ANY DATA INCLUDED THEREIN OR WITH RESPECT TO THE TARGET RETIREMENT FUNDS.
None of the information supplied by Bloomberg or Barclays and used in this publication may be reproduced in any manner without the prior written permission of both Bloomberg and Barclays Capital, the investment banking division of Barclays Bank Plc. Barclays Bank Plc is registered in England No. 1026167. Registered office 1 Churchill Place London E14 5HP.
© 2017 Bloomberg. Used with Permission.
Source: Bloomberg Index Services Limited. Copyright 2017, Bloomberg. All rights reserved.
87
This page intentionally left blank.
This page intentionally left blank.
This page intentionally left blank.
The People Who Govern Your Fund
The trustees of your mutual fund are there to see that the fund is operated and managed in your best interests since, as a shareholder, you are a part owner of the fund. Your fund’s trustees also serve on the board of directors of The Vanguard Group, Inc., which is owned by the Vanguard funds and provides services to them on an at-cost basis.
A majority of Vanguard’s board members are independent, meaning that they have no affiliation with Vanguard or the funds they oversee, apart from the sizable personal investments they have made as private individuals. The independent board members have distinguished backgrounds in business, academia, and public service. Each of the trustees and executive officers oversees 198 Vanguard funds.
Information for each trustee and executive officer of the fund appears below. The mailing address of the trustees and officers is P.O. Box 876, Valley Forge, PA 19482. More information about the trustees is in the Statement of Additional Information, which can be obtained, without charge, by contacting Vanguard at 800-662-7447, or online at vanguard.com.
Interested Trustee1
F. William McNabb III
Born 1957. Trustee Since July 2009. Chairman of the Board. Principal Occupation(s) During the Past Five Years and Other Experience: Chairman of the Board of The Vanguard Group, Inc., and of each of the investment companies served by The Vanguard Group, since January 2010; Chief Executive Officer and Director of The Vanguard Group and President and Chief Executive Officer of each of the investment companies served by The Vanguard Group, since 2008; Director of Vanguard Marketing Corporation; President of The Vanguard Group (2008–2017); Managing Director of The Vanguard Group (1995–2008).
Independent Trustees
Emerson U. Fullwood
Born 1948. Trustee Since January 2008. Principal Occupation(s) During the Past Five Years and Other Experience: Executive Chief Staff and Marketing Officer for North America and Corporate Vice President (retired 2008) of Xerox Corporation (document management products and services);
Executive in Residence and 2009–2010 Distinguished Minett Professor at the Rochester Institute of Technology; Lead Director of SPX FLOW, Inc. (multi-industry manufacturing); Director of the United Way of Rochester, the University of Rochester Medical Center, Monroe Community College Foundation, North Carolina A&T University, and Roberts Wesleyan College; Trustee of the University of Rochester.
Rajiv L. Gupta
Born 1945. Trustee Since December 2001.2 Principal Occupation(s) During the Past Five Years and Other Experience: Chairman and Chief Executive Officer (retired 2009) and President (2006–2008) of Rohm and Haas Co. (chemicals); Director of Arconic Inc. (diversified manufacturer), HP Inc. (printer and personal computer manufacturing), and Delphi Automotive plc (automotive components); Senior Advisor at New Mountain Capital.
Amy Gutmann
Born 1949. Trustee Since June 2006. Principal Occupation(s) During the Past Five Years and Other Experience: President of the University of Pennsylvania; Christopher H. Browne
1 Mr. McNabb is considered an “interested person,” as defined in the Investment Company Act of 1940, because he is an officer of the
Vanguard funds.
2 December 2002 for Vanguard Equity Income Fund, the Vanguard Municipal Bond Funds, and the Vanguard State Tax-Exempt Funds.
Distinguished Professor of Political Science, School of Arts and Sciences, and Professor of Communication, Annenberg School for Communication, with secondary faculty appointments in the Department of Philosophy, School of Arts and Sciences, and at the Graduate School of Education, University of Pennsylvania; Trustee of the National Constitution Center.
JoAnn Heffernan Heisen
Born 1950. Trustee Since July 1998. Principal Occupation(s) During the Past Five Years and Other Experience: Corporate Vice President and Member of the Executive Committee (1997–2008), Chief Global Diversity Officer (retired 2008), Vice President and Chief Information Officer (1997–2006), Controller (1995–1997), Treasurer (1991–1995), and Assistant Treasurer (1989–1991) of Johnson & Johnson (pharmaceuticals/medical devices/ consumer products); Director of Skytop Lodge Corporation (hotels) and the Robert Wood Johnson Foundation; Member of the Advisory Board of the Institute for Women’s Leadership at Rutgers University.
F. Joseph Loughrey
Born 1949. Trustee Since October 2009. Principal Occupation(s) During the Past Five Years and Other Experience: President and Chief Operating Officer (retired 2009) of Cummins Inc. (industrial machinery); Chairman of the Board of Hillenbrand, Inc. (specialized consumer services), Oxfam America, and the Lumina Foundation for Education; Director of the V Foundation for Cancer Research; Member of the Advisory Council for the College of Arts and Letters and Chair of the Advisory Board to the Kellogg Institute for International Studies, both at the University of Notre Dame.
Mark Loughridge
Born 1953. Trustee Since March 2012. Principal Occupation(s) During the Past Five Years and Other Experience: Senior Vice President and Chief Financial Officer (retired 2013) at IBM (information technology services); Fiduciary Member of IBM’s Retirement Plan Committee (2004–2013); Member of the Council on Chicago Booth.
Scott C. Malpass
Born 1962. Trustee Since March 2012. Principal Occupation(s) During the Past Five Years and Other Experience: Chief Investment Officer and Vice President at the University of Notre Dame; Assistant Professor of Finance at the Mendoza College of Business at Notre Dame; Member of the Notre Dame 403(b) Investment Committee, the Board of Advisors for Spruceview Capital Partners, the Board of Catholic Investment Services, Inc. (investment advisor), and the Board of Superintendence of the Institute for the Works of Religion; Chairman of the Board of TIFF Advisory Services, Inc. (investment advisor).
André F. Perold
Born 1952. Trustee Since December 2004. Principal Occupation(s) During the Past Five Years and Other Experience: George Gund Professor of Finance and Banking, Emeritus at the Harvard Business School (retired 2011); Chief Investment Officer and Co-Managing Partner of HighVista Strategies LLC (private investment firm); Overseer of the Museum of Fine Arts Boston.
Peter F. Volanakis
Born 1955. Trustee Since July 2009. Principal Occupation(s) During the Past Five Years and Other Experience: President and Chief Operating Officer (retired 2010) of Corning Incorporated (communications equipment); Chairman of the Board of Trustees of Colby-Sawyer College; Member of the Board of Hypertherm, Inc. (industrial cutting systems, software, and consumables).
Executive Officers
Glenn Booraem
Born 1967. Investment Stewardship Officer Since February 2017. Principal Occupation(s) During the Past Five Years and Other Experience: Principal of The Vanguard Group, Inc.; Treasurer (2015–2017), Controller (2010–2015), and Assistant Controller (2001–2010) of each of the investment companies served by The Vanguard Group.
Thomas J. Higgins
Born 1957. Chief Financial Officer Since September 2008. Principal Occupation(s) During the Past Five Years and Other Experience: Principal of The Vanguard Group, Inc.; Chief Financial Officer of each of the investment companies served by The Vanguard Group; Treasurer of each of the investment companies served by The Vanguard Group (1998–2008).
Peter Mahoney
Born 1974. Controller Since May 2015. Principal Occupation(s) During the Past Five Years and Other Experience: Principal of The Vanguard Group, Inc.; Controller of each of the investment companies served by The Vanguard Group; Head of International Fund Services at The Vanguard Group (2008–2014).
Anne E. Robinson
Born 1970. Secretary Since September 2016. Principal Occupation(s) During the Past Five Years and Other Experience: Managing Director of The Vanguard Group, Inc.; General Counsel of The Vanguard Group; Secretary of The Vanguard Group and of each of the investment companies served by The Vanguard Group; Director and Senior Vice President of Vanguard Marketing Corporation; Managing Director and General Counsel of Global Cards and Consumer Services at Citigroup (2014–2016); Counsel at American Express (2003–2014).
Michael Rollings
Born 1963. Treasurer Since February 2017. Principal Occupation(s) During the Past Five Years and Other Experience: Managing Director of The Vanguard Group, Inc.; Treasurer of each of the investment companies served by The Vanguard Group; Director of Vanguard Marketing Corporation; Executive Vice President and Chief Financial Officer of MassMutual Financial Group (2006–2016).
| |
| Vanguard Senior Management Team |
| |
| Mortimer J. Buckley | Chris D. McIsaac |
| Gregory Davis | James M. Norris |
| John James | Thomas M. Rampulla |
| Martha G. King | Karin A. Risi |
| John T. Marcante | |
| |
| |
| Chairman Emeritus and Senior Advisor |
| |
| John J. Brennan | |
| Chairman, 1996–2009 | |
| Chief Executive Officer and President, 1996–2008 |
| |
| |
| Founder | |
| |
| John C. Bogle | |
| Chairman and Chief Executive Officer, 1974–1996 |
|  |
| P.O. Box 2600
Valley Forge, PA 19482-2600 |
Connect with Vanguard® > vanguard.com | |
| |
| Fund Information > 800-662-7447 | |
| Direct Investor Account Services > 800-662-2739 | |
| Institutional Investor Services > 800-523-1036 | |
| Text Telephone for People | |
| Who Are Deaf or Hard of Hearing> 800-749-7273 | |
| |
| This material may be used in conjunction | |
| with the offering of shares of any Vanguard | |
| fund only if preceded or accompanied by | |
| the fund’s current prospectus. | |
| |
| All comparative mutual fund data are from Lipper, a | |
| Thomson Reuters Company, or Morningstar, Inc., unless | |
| otherwise noted. | |
| |
| You can obtain a free copy of Vanguard’s proxy voting | |
| guidelines by visiting vanguard.com/proxyreporting or by | |
| calling Vanguard at 800-662-2739. The guidelines are | |
| also available from the SEC’s website, sec.gov. In | |
| addition, you may obtain a free report on how your fund | |
| voted the proxies for securities it owned during the 12 | |
| months ended June 30. To get the report, visit either | |
| vanguard.com/proxyreporting or sec.gov. | |
| |
| You can review and copy information about your fund at | |
| the SEC’s Public Reference Room in Washington, D.C. To | |
| find out more about this public service, call the SEC at | |
| 202-551-8090. Information about your fund is also | |
| available on the SEC’s website, and you can receive | |
| copies of this information, for a fee, by sending a | |
| request in either of two ways: via email addressed to | |
| publicinfo@sec.gov or via regular mail addressed to the | |
| Public Reference Section, Securities and Exchange | |
| Commission, Washington, DC 20549-1520. | |
| | © 2017 The Vanguard Group, Inc. |
| | All rights reserved. |
| | Vanguard Marketing Corporation, Distributor. |
| |
| | Q3080 112017 |
 |
| Annual Report | September 30, 2017 |
| |
| Vanguard Target Retirement Funds |
| Vanguard Target Retirement 2040 Fund |
| Vanguard Target Retirement 2045 Fund |
| Vanguard Target Retirement 2050 Fund |
| Vanguard Target Retirement 2055 Fund |
| Vanguard Target Retirement 2060 Fund |
| Vanguard Target Retirement 2065 Fund |
Vanguard’s Principles for Investing Success
We want to give you the best chance of investment success. These principles, grounded in Vanguard’s research and experience, can put you on the right path.
Goals. Create clear, appropriate investment goals.
Balance. Develop a suitable asset allocation using broadly diversified funds. Cost. Minimize cost.
Discipline. Maintain perspective and long-term discipline.
A single theme unites these principles: Focus on the things you can control. We believe there is no wiser course for any investor.
| |
| Contents | |
| Your Fund’s Performance at a Glance. | 1 |
| Chairman’s Perspective. | 4 |
| Target Retirement 2040 Fund. | 8 |
| Target Retirement 2045 Fund. | 19 |
| Target Retirement 2050 Fund. | 30 |
| Target Retirement 2055 Fund. | 41 |
| Target Retirement 2060 Fund. | 52 |
| Target Retirement 2065 Fund. | 63 |
| Your Fund’s After-Tax Returns. | 78 |
| About Your Fund’s Expenses. | 80 |
| Glossary. | 82 |
Please note: The opinions expressed in this report are just that—informed opinions. They should not be considered promises or advice. Also, please keep in mind that the information and opinions cover the period through the date on the front of this report. Of course, the risks of investing in your fund are spelled out in the prospectus.
See the Glossary for definitions of investment terms used in this report.
About the cover: Nautical images have been part of Vanguard’s rich heritage since its start in 1975. For an incoming ship, a lighthouse offers a beacon and safe path to shore. You can similarly depend on Vanguard to put you first––and light the way––as you strive to meet your financial goals. Our client focus and low costs, stemming from our unique ownership structure, assure that your interests are paramount.
Your Fund’s Performance at a Glance
• For the 12 months ended September 30, 2017, five of the six Vanguard Target Retirement Funds covered in this report recorded returns ranging from 16.26% for the Target Retirement 2040 Fund to 16.86% for the Target Retirement 2055 Fund. In July, the Target Retirement 2065 Fund was launched. (The funds with retirement dates of 2015 through 2035 are covered in a separate report.) The funds with a greater allocation to stocks performed best.
• Each fund posted returns that were in line with those of its composite benchmark after expenses. Each fund surpassed the average return of its peers.
• Vanguard Target Retirement Funds are designed to reach an allocation of 70% bonds and 30% stocks within seven years after their target date.
| |
| Total Returns: Fiscal Year Ended September 30, 2017 | |
| | Total |
| | Returns |
| Vanguard Target Retirement 2040 Fund | 16.26% |
| Target 2040 Composite Index | 16.45 |
| Mixed-Asset Target 2040 Funds Average | 14.90 |
| Mixed-Asset Target 2040 Funds Average: Derived from data provided by Lipper, a Thomson Reuters Company. | |
| |
| Vanguard Target Retirement 2045 Fund | 16.84% |
| Target 2045 Composite Index | 17.01 |
| Mixed-Asset Target 2045 Funds Average | 16.08 |
| Mixed-Asset Target 2045 Funds Average: Derived from data provided by Lipper, a Thomson Reuters Company. | |
| |
| Vanguard Target Retirement 2050 Fund | 16.84% |
| Target 2050 Composite Index | 17.01 |
| Mixed-Asset Target 2050 Funds Average | 15.80 |
| Mixed-Asset Target 2050 Funds Average: Derived from data provided by Lipper, a Thomson Reuters Company. | |
| |
| Vanguard Target Retirement 2055 Fund | 16.86% |
| Target 2055 Composite Index | 17.01 |
| Mixed-Asset Target 2055+ Funds Average | 16.62 |
| Mixed-Asset Target 2055+ Funds Average: Derived from data provided by Lipper, a Thomson Reuters Company. | |
1
| |
| | Total |
| | Returns |
| Vanguard Target Retirement 2060 Fund | 16.84% |
| Target 2060 Composite Index | 17.01 |
| Mixed-Asset Target 2055+ Funds Average | 16.62 |
| Mixed-Asset Target 2055+ Funds Average: Derived from data provided by Lipper, a Thomson Reuters Company. | |
| |
| Vanguard Target Retirement 2065 Fund (Inception: 7/12/2017) | 3.95% |
| Target 2065 Composite Index | 3.84 |
| Mixed-Asset Target 2055+ Funds Average | 3.85 |
Mixed-Asset Target 2055+ Funds Average: Derived from data provided by Lipper, a Thomson Reuters Company. For a benchmark description, see the Glossary.
Investments in Target Retirement Funds are subject to the risks of their underlying funds. The year in the fund name refers to the approximate year (the target date) when an investor in the fund would retire and leave the work force. The fund will gradually shift its emphasis from more aggressive investments to more conservative ones based on its target date. An investment in a Target Retirement Fund is not guaranteed at any time, including on or after the target date.
| |
| Total Returns: Ten Years Ended September 30, 2017 | |
| | Average |
| | Annual Return |
| Target Retirement 2040 Fund | 5.73% |
| Target 2040 Composite Index | 5.87 |
| Mixed-Asset Target 2040 Funds Average | 4.27 |
| Mixed-Asset Target 2040 Funds Average: Derived from data provided by Lipper, a Thomson Reuters Company. | |
| Target Retirement 2045 Fund | 5.77% |
| Target 2045 Composite Index | 5.92 |
| Mixed-Asset Target 2045 Funds Average | 4.62 |
| Mixed-Asset Target 2045 Funds Average: Derived from data provided by Lipper, a Thomson Reuters Company. | |
| Target Retirement 2050 Fund | 5.78% |
| Target 2050 Composite Index | 5.92 |
| Mixed-Asset Target 2050 Funds Average | 4.51 |
| Mixed-Asset Target 2050 Funds Average: Derived from data provided by Lipper, a Thomson Reuters Company. | |
| Target Retirement 2055 Fund (Returns since inception: 8/18/2010) | 11.27% |
| Target 2055 Composite Index | 11.50 |
| Spliced Mixed-Asset Target 2055+ Funds Average | 10.28 |
Spliced Mixed-Asset Target 2055+ Funds Average: Derived from data provided by Lipper, a Thomson Reuters Company.
2
| |
| | Average |
| | Annual Return |
| Target Retirement 2060 Fund (Returns since inception: 1/19/2012) | 11.10% |
| Target 2060 Composite Index | 11.36 |
| Spliced Mixed-Asset Target 2055+ Funds Average | 10.29 |
| Spliced Mixed-Asset Target 2055+ Funds Average: Derived from data provided by Lipper, a Thomson Reuters Company. | |
For a benchmark description, see the Glossary.
The figures shown represent past performance, which is not a guarantee of future results. (Current performance may be lower or higher than the performance data cited. For performance data current to the most recent month-end, visit our website at vanguard.com/performance.) Note, too, that both investment returns and principal value can fluctuate widely, so an investor’s shares, when sold, could be worth more or less than their original cost.
| | |
| Expense Ratios | | |
| Your Fund Compared With Its Peer Group | | |
| | Acquired Fund Fees | Peer Group |
| | and Expenses | Average |
| Target Retirement 2040 Fund | 0.16% | 0.42% |
| Target Retirement 2045 Fund | 0.16 | 0.38 |
| Target Retirement 2050 Fund | 0.16 | 0.41 |
| Target Retirement 2055 Fund | 0.16 | 0.38 |
| Target Retirement 2060 Fund | 0.16 | 0.38 |
| Target Retirement 2065 Fund | 0.16 | 0.38 |
The fund expense figures shown—drawn from the prospectus dated July 12, 2017—represent an estimate of the weighted average of the expense ratios and any transaction fees charged by the underlying mutual funds (the ”acquired” funds) in which the Target Retirement Funds invest. The Target Retirement Funds do not charge any expenses or fees of their own. For the fiscal year ended September 30, 2017, the acquired fund fees and expenses were 0.15% for the 2040 Fund, 0.15% for the 2045 Fund, 0.15% for the 2050 Fund, 0.15% for the 2055 Fund, 0.15% for the 2060 Fund, and 0.15% (annualized) for the 2065 Fund. Peer-group expense ratios are derived from data provided by Lipper, a Thomson Reuters Company, and capture information through year-end 2016.
Peer groups: For the 2040 Fund, Mixed-Asset Target 2040 Funds; for the 2045 Fund, Mixed-Asset Target 2045 Funds; for the 2050 Fund, Mixed-Asset Target 2050 Funds; for the 2055, 2060, and 2065 Funds, Mixed-Asset Target 2055+ Funds.
3
Chairman’s Perspective

Bill McNabb
Chairman and Chief Executive Officer
Dear Shareholder,
Our investors depend on Vanguard to be a responsible steward of their assets. This includes our obvious responsibilities—managing the funds, offering investment perspectives and advice, and assisting with questions and transactions.
But because a long-term perspective informs every aspect of our investment approach, we also work on your behalf in less obvious ways, such as by advocating for responsible governance among the companies in which Vanguard funds invest. Vanguard’s index funds are essentially permanent owners of thousands of publicly traded companies, and we have a special obligation to be engaged stewards actively focused on the long term.
Simply put, we believe that well-governed companies are more likely to perform well over the long run.
Although Vanguard has always been an advocate for strong corporate governance, we have expanded our efforts recently as our investor base continues to grow. Our Investment Stewardship team has doubled in size since 2015, and we continue to add analysts, researchers, and operations team members. The team guides our engagement activities and our funds’ proxy voting by analyzing corporate governance practices in companies around the world.
4
Our four Investment Stewardship pillars
As we evaluate company responsiveness to governance matters, including environmental and social concerns, we focus on four key areas—what we call our Investment Stewardship pillars:
• The board: A high-functioning, well-composed, independent, diverse, and experienced board with effective ongoing evaluation practices.
• Governance structures: Provisions and structures that empower shareholders and protect their rights.
• Appropriate compensation: Pay that incentivizes relative outperformance over the long term.
• Risk oversight: Effective, integrated, and ongoing oversight of relevant industry-and company-specific risks.
Guided by these pillars, our Investment Stewardship team conducted more than 950 engagements, or discussions, with company directors and leaders worldwide during the 12 months ended June 30, 2017.
| | | |
| Market Barometer | | | |
| | | Average Annual Total Returns |
| | Periods Ended September 30, 2017 |
| | One Year | Three Years | Five Years |
| Stocks | | | |
| Russell 1000 Index (Large-caps) | 18.54% | 10.63% | 14.27% |
| Russell 2000 Index (Small-caps) | 20.74 | 12.18 | 13.79 |
| Russell 3000 Index (Broad U.S. market) | 18.71 | 10.74 | 14.23 |
| FTSE All-World ex US Index (International) | 19.49 | 5.11 | 7.35 |
| |
| Bonds | | | |
| Bloomberg Barclays U.S. Aggregate Bond Index | | | |
| (Broad taxable market) | 0.07% | 2.71% | 2.06% |
| Bloomberg Barclays Municipal Bond Index | | | |
| (Broad tax-exempt market) | 0.87 | 3.19 | 3.01 |
| Citigroup Three-Month U.S. Treasury Bill Index | 0.64 | 0.28 | 0.18 |
| |
| CPI | | | |
| Consumer Price Index | 2.23% | 1.22% | 1.30% |
5
We also cast more than 171,000 votes on behalf of Vanguard funds at more than 18,000 shareholder meetings.
Gender diversity on boards and climate risk
As we engage with companies, we are devoting increased attention to two specific topics. The first is gender diversity on boards. It’s no secret that the right combination of talent, skills, and experience leads to better results, so we pay close attention to how company boards are structured and managed, and how they evolve.
In recent years, a growing body of research has demonstrated that greater diversity on boards can lead to improved governance and company performance. We are advocating for boards to incorporate diverse perspectives and experience into their strategic planning and decision-making. One example of our commitment to more diverse boards is our participation in the 30% Club, a global coalition working to increase the representation of women in boardrooms and leadership roles.
The second issue is climate risk. We will continue to engage with companies to understand their responses to this risk. Regardless of one’s perspective on the issue, the potential is real for changing regulations, demographics, and consumption behavior to affect business results for companies in many sectors.
We want to ensure that such business and regulatory risks are sufficiently disclosed so investors can value companies appropriately. In the past year, we have voted for shareholder proposals at several energy companies that called for management to improve its climate risk assessment and planning, and we will consider supporting similar proposals if we believe they are beneficial to long-term shareholder value. When a proposal from a shareholder presents a strong case for change, we’re more than willing to fully consider it. And even if the case falls short, these proposals often catalyze a discussion that generates meaningful change over time.
In addition to considering activists’ proposals, we consult research providers and our own network of experts. When we detect material risks to a company’s long-term value (such as bad leadership, poor disclosure, misaligned compensation structures, or threats to shareholder rights), we act with our voice and our vote.
Our stewardship reflects our mission
But we don’t act as independent agents with our own agenda. Every time we speak with a company chairman, CEO, or director, we’re acutely aware of the role we play in representing the economic interests of more than 20 million Vanguard investors. So you can expect us to speak out when we detect threats to the economic interests of our shareholders.
6
We take positions on these matters not because they are inherently good or noble but because they are tied to the long-term economic value of your funds’ investments.
You trust us to represent your interests across the globe. You can be confident we act on that responsibility with the seriousness and dedication it deserves.
To learn more about our Investment Stewardship program, including how our funds have voted, visit https://about. vanguard.com/investment-stewardship/.
As always, thank you for investing with Vanguard.
Sincerely,

F. William McNabb III
Chairman and Chief Executive Officer
October 13, 2017
7
Target Retirement 2040 Fund
Fund Profile
As of September 30, 2017
| |
| Total Fund Characteristics | |
| Ticker Symbol | VFORX |
| 30-Day SEC Yield | 2.05% |
| Acquired Fund Fees and Expenses1 | 0.16% |
| |
| Allocation to Underlying Vanguard Funds | |
| Vanguard Total Stock Market Index | |
| Fund Investor Shares | 52.0% |
| Vanguard Total International Stock | |
| Index Fund Investor Shares | 34.5 |
| Vanguard Total Bond Market II | |
| Index Fund Investor Shares | 9.6 |
| Vanguard Total International Bond | |
| Index Fund Investor Shares | 3.9 |
| | |
| Total Fund Volatility Measures | |
| | Target 2040 | MSCI US |
| | Composite | Broad Market |
| | Index | Index |
| R-Squared | 1.00 | 0.92 |
| Beta | 0.98 | 0.84 |
These measures show the degree and timing of the fund’s fluctuations compared with the indexes over 36 months.
Fund Asset Allocation
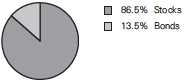
1 This figure—drawn from the prospectus dated July 12, 2017—represents an estimate of the weighted average of the expense ratios and any transaction fees charged by the underlying mutual funds (the ”acquired” funds) in which the Target Retirement 2040 Fund invests. The fund does not charge any expenses or fees of its own. For the fiscal year ended September 30, 2017, the acquired fund fees and expenses were 0.15%.
8
Target Retirement 2040 Fund
Performance Summary
All of the returns in this report represent past performance, which is not a guarantee of future results that may be achieved by the fund. (Current performance may be lower or higher than the performance data cited. For performance data current to the most recent month-end, visit our website at vanguard.com/performance.) Note, too, that both investment returns and principal value can fluctuate widely, so an investor’s shares, when sold, could be worth more or less than their original cost. The returns shown do not reflect taxes that a shareholder would pay on fund distributions or on the sale of fund shares.
Cumulative Performance: September 30, 2007, Through September 30, 2017
Initial Investment of $10,000
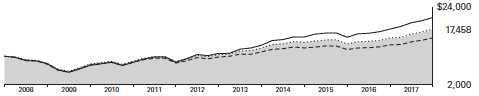
| | | | |
| | Average Annual Total Returns | |
| | Periods Ended September 30, 2017 | |
| | | | | Final Value |
| | One | Five | Ten | of a $10,000 |
| | Year | Years | Years | Investment |
| Target Retirement 2040 Fund* | 16.26% | 10.80% | 5.73% | $17,458 |
| Target 2040 Composite Index | 16.45 | 11.04 | 5.87 | 17,687 |
| Mixed-Asset Target 2040 Funds | | | | |
| Average | 14.90 | 9.20 | 4.27 | 15,193 |
| MSCI US Broad Market Index | 18.67 | 14.26 | 7.72 | 21,034 |
For a benchmark description, see the Glossary.
Mixed-Asset Target 2040 Funds Average: Derived from data provided by Lipper, a Thomson Reuters Company.
See Financial Highlights for dividend and capital gains information.
9
Target Retirement 2040 Fund
Fiscal-Year Total Returns (%): September 30, 2007, Through September 30, 2017

10
Target Retirement 2040 Fund
Financial Statements
Statement of Net Assets
As of September 30, 2017
The fund reports a complete list of its holdings in regulatory filings four times in each fiscal year, at the quarter-ends. For the second and fourth fiscal quarters, the lists appear in the fund’s semiannual and annual reports to shareholders. For the first and third fiscal quarters, the fund files the lists with the Securities and Exchange Commission on Form N-Q. Shareholders can look up the fund’s Forms N-Q on the SEC’s website at sec.gov. Forms N-Q may also be reviewed and copied at the SEC’s Public Reference Room (see the back cover of this report for further information).
| | |
| | | Market |
| | | Value• |
| | Shares | ($000) |
| Investment Companies (100.1%) | | |
| U.S. Stock Fund (52.1%) | | |
| Vanguard Total Stock Market Index Fund Investor Shares | 184,622,693 | 11,636,768 |
| |
| International Stock Fund (34.5%) | | |
| Vanguard Total International Stock Index Fund Investor Shares | 437,797,833 | 7,692,108 |
| |
| U.S. Bond Fund (9.6%) | | |
| 1 Vanguard Total Bond Market II Index Fund Investor Shares | 198,897,910 | 2,138,153 |
| |
| International Bond Fund (3.9%) | | |
| Vanguard Total International Bond Index Fund Investor Shares | 79,054,823 | 860,907 |
| Total Investment Companies (Cost $15,820,350) | | 22,327,936 |
| Temporary Cash Investment (0.0%) | | |
| Money Market Fund (0.0%) | | |
| 1 Vanguard Market Liquidity Fund, 1.223% (Cost $10,689) | 106,868 | 10,689 |
| Total Investments (100.1%) (Cost $15,831,039) | | 22,338,625 |
| Other Assets and Liabilities (-0.1%) | | |
| Other Assets | | 43,915 |
| Liabilities | | (58,287) |
| | | (14,372) |
| Net Assets (100%) | | |
| Applicable to 642,711,552 outstanding $.001 par value shares of | | |
| beneficial interest (unlimited authorization) | | 22,324,253 |
| Net Asset Value Per Share | | $34.73 |
11
| |
| Target Retirement 2040 Fund | |
| |
| |
| |
| |
| | Amount |
| | ($000) |
| Statement of Assets and Liabilities | |
| Assets | |
| Investments in Securities, at Value—Affiliated Vanguard Funds | 22,338,625 |
| Receivables for Investment Securities Sold | 2,069 |
| Receivables for Accrued Income | 4,843 |
| Receivables for Capital Shares Issued | 37,003 |
| Total Assets | 22,382,540 |
| Liabilities | |
| Payables for Investment Securities Purchased | 4,843 |
| Payables for Capital Shares Redeemed | 53,444 |
| Total Liabilities | 58,287 |
| Net Assets | 22,324,253 |
| |
| |
| At September 30, 2017, net assets consisted of: | |
| | Amount |
| | ($000) |
| Paid-in Capital | 15,518,764 |
| Undistributed Net Investment Income | 288,641 |
| Accumulated Net Realized Gains | 9,262 |
| Unrealized Appreciation (Depreciation) | 6,507,586 |
| Net Assets | 22,324,253 |
• See Note A in Notes to Financial Statements.
1 Affiliated fund available only to Vanguard funds and certain trusts and accounts managed by Vanguard. Rate shown for Vanguard
Market Liquidity Fund is the 7-day yield.
See accompanying Notes, which are an integral part of the Financial Statements.
12
| |
| Target Retirement 2040 Fund | |
| |
| |
| Statement of Operations | |
| |
| | Year Ended |
| | September 30, 2017 |
| | ($000) |
| Investment Income | |
| Income | |
| Income Distributions Received from Affiliated Funds | 439,534 |
| Net Investment Income—Note B | 439,534 |
| Realized Net Gain (Loss) | |
| Capital Gain Distributions Received from Affiliated Funds | 1,618 |
| Affiliated Investment Securities Sold | 18,284 |
| Realized Net Gain (Loss) | 19,902 |
| Change in Unrealized Appreciation (Depreciation) of Investment Securities | 2,566,980 |
| Net Increase (Decrease) in Net Assets Resulting from Operations | 3,026,416 |
See accompanying Notes, which are an integral part of the Financial Statements.
13
| | |
| Target Retirement 2040 Fund | | |
| |
| |
| Statement of Changes in Net Assets | | |
| |
| | Year Ended September 30, |
| | 2017 | 2016 |
| | ($000) | ($000) |
| Increase (Decrease) in Net Assets | | |
| Operations | | |
| Net Investment Income | 439,534 | 358,638 |
| Realized Net Gain (Loss) | 19,902 | 134,456 |
| Change in Unrealized Appreciation (Depreciation) | 2,566,980 | 1,383,092 |
| Net Increase (Decrease) in Net Assets Resulting from Operations | 3,026,416 | 1,876,186 |
| Distributions | | |
| Net Investment Income | (349,773) | (329,503) |
| Realized Capital Gain1 | (72,933) | (125,908) |
| Total Distributions | (422,706) | (455,411) |
| Capital Share Transactions | | |
| Issued | 6,021,161 | 4,604,224 |
| Issued in Lieu of Cash Distributions | 415,992 | 446,191 |
| Redeemed | (4,087,681) | (4,824,349) |
| Net Increase (Decrease) from Capital Share Transactions | 2,349,472 | 226,066 |
| Total Increase (Decrease) | 4,953,182 | 1,646,841 |
| Net Assets | | |
| Beginning of Period | 17,371,071 | 15,724,230 |
| End of Period2 | 22,324,253 | 17,371,071 |
1 Includes fiscal 2017 and 2016 short-term gain distributions totaling $10,861,000 and $24,110,000, respectively. Short-term gain
distributions are treated as ordinary income dividends for tax purposes.
2 Net Assets—End of Period includes undistributed (overdistributed) net investment income of $288,641,000 and $225,359,000.
See accompanying Notes, which are an integral part of the Financial Statements.
14
| | | | | |
| Target Retirement 2040 Fund | | | | | |
| |
| |
| Financial Highlights | | | | | |
| |
| |
| For a Share Outstanding | | | Year Ended September 30, |
| Throughout Each Period | 2017 | 2016 | 2015 | 2014 | 2013 |
| Net Asset Value, Beginning of Period | $30.59 | $28.09 | $29.66 | $26.80 | $23.26 |
| Investment Operations | | | | | |
| Net Investment Income | .7181 | .660 | .648 | .593 | .546 |
| Capital Gain Distributions Received | .0031 | .003 | .007 | .001 | .012 |
| Net Realized and Unrealized Gain (Loss) | | | | | |
| on Investments | 4.143 | 2.687 | (1.634) | 2.773 | 3.485 |
| Total from Investment Operations | 4.864 | 3.350 | (.979) | 3.367 | 4.043 |
| Distributions | | | | | |
| Dividends from Net Investment Income | (.599) | (.615) | (.574) | (.500) | (.496) |
| Distributions from Realized Capital Gains | (.125) | (.235) | (.017) | (.007) | (.007) |
| Total Distributions | (.724) | (.850) | (.591) | (.507) | (.503) |
| Net Asset Value, End of Period | $34.73 | $30.59 | $28.09 | $29.66 | $26.80 |
| |
| Total Return2 | 16.26% | 12.11% | -3.43% | 12.66% | 17.75% |
| |
| Ratios/Supplemental Data | | | | | |
| Net Assets, End of Period (Millions) | $22,324 | $17,371 | $15,724 | $15,912 | $12,013 |
| Ratio of Total Expenses to Average Net Assets | — | — | — | — | — |
| Acquired Fund Fees and Expenses | 0.15% | 0.16% | 0.16% | 0.18% | 0.18% |
| Ratio of Net Investment Income to | | | | | |
| Average Net Assets | 2.23% | 2.23% | 2.09% | 2.18% | 2.36% |
| Portfolio Turnover Rate | 8% | 16% | 21% | 6% | 9% |
1 Calculated based on average shares outstanding.
2 Total returns do not include account service fees that may have applied in the periods shown. Fund prospectuses provide information
about any applicable account service fees.
See accompanying Notes, which are an integral part of the Financial Statements.
15
Target Retirement 2040 Fund
Notes to Financial Statements
Vanguard Target Retirement 2040 Fund is registered under the Investment Company Act of 1940 as an open-end investment company, or mutual fund. The fund follows a balanced investment strategy by investing in selected Vanguard funds to achieve its targeted allocation of assets to U.S. and international stocks, and U.S. and international bonds. Financial statements and other information about each underlying fund are available on vanguard.com.
A. The following significant accounting policies conform to generally accepted accounting principles for U.S. investment companies. The fund consistently follows such policies in preparing its financial statements.
1. Security Valuation: Investments are valued at the net asset value of each underlying Vanguard fund determined as of the close of the New York Stock Exchange (generally 4 p.m., Eastern time) on the valuation date.
2. Federal Income Taxes: The fund intends to continue to qualify as a regulated investment company and distribute all of its taxable income. Management has analyzed the fund’s tax positions taken for all open federal income tax years (September 30, 2014–2017), and has concluded that no provision for federal income tax is required in the fund’s financial statements.
3. Distributions: Distributions to shareholders are recorded on the ex-dividend date.
4. Credit Facility: The fund and certain other funds managed by The Vanguard Group (“Vanguard”) participate in a $3.1 billion committed credit facility provided by a syndicate of lenders pursuant to a credit agreement that may be renewed annually; each fund is individually liable for its borrowings, if any, under the credit facility. Borrowings may be utilized for temporary and emergency purposes, and are subject to the fund’s regulatory and contractual borrowing restrictions. The participating funds are charged administrative fees and an annual commitment fee of 0.10% of the undrawn amount of the facility; these fees are allocated to the funds based on a method approved by the fund’s board of trustees and borne by the funds in which the fund invests (see Note B). Any borrowings under this facility bear interest at a rate based upon the higher of the one-month London Interbank Offered Rate, federal funds effective rate, or overnight bank funding rate plus an agreed-upon spread.
The fund had no borrowings outstanding at September 30, 2017, or at any time during the period then ended.
5. Other: Income and capital gain distributions received are recorded on the ex-dividend date. Security transactions are accounted for on the date securities are bought or sold. Costs used to determine realized gains (losses) on the sale of investment securities are those of the specific securities sold.
B. In accordance with the terms of a Funds’ Service Agreement (the “FSA”) between Vanguard and the fund, Vanguard furnishes to the fund investment advisory, corporate management, administrative, marketing, and distribution services at Vanguard’s cost of operations (as defined by the FSA). These costs of operations are allocated to the fund based on methods and guidelines approved by the board of trustees. The FSA provides that expenses otherwise allocable to Vanguard funds-of-funds may be reduced or eliminated to the extent of savings realized by the underlying Vanguard funds by virtue of being part of a fund-of-funds. Accordingly, all expenses for services provided by Vanguard to the fund and all other expenses incurred by the fund during the period
16
Target Retirement 2040 Fund
ended September 30, 2017, were borne by the underlying Vanguard funds in which the fund invests. The fund’s trustees and officers are also trustees and officers, respectively, of the underlying Vanguard funds, as well as directors and employees, respectively, of Vanguard.
C. Various inputs may be used to determine the value of the fund’s investments. These inputs are summarized in three broad levels for financial statement purposes. The inputs or methodologies used to value securities are not necessarily an indication of the risk associated with investing in those securities.
Level 1—Quoted prices in active markets for identical securities.
Level 2—Other significant observable inputs (including quoted prices for similar securities, interest rates, prepayment speeds, credit risk, etc.).
Level 3—Significant unobservable inputs (including the fund’s own assumptions used to determine the fair value of investments). Any investments valued with significant unobservable inputs are noted on the Statement of Net Assets.
At September 30, 2017, 100% of the market value of the fund’s investments was determined based on Level 1 inputs.
D. Distributions are determined on a tax basis and may differ from net investment income and realized capital gains for financial reporting purposes. Differences may be permanent or temporary. Permanent differences are reclassified among capital accounts in the financial statements to reflect their tax character. Temporary differences arise when certain items of income, expense, gain, or loss are recognized in different periods for financial statement and tax purposes. These differences will reverse at some time in the future. Differences in classification may also result from the treatment of short-term gains as ordinary income for tax purposes.
The fund used a tax accounting practice to treat a portion of the price of capital shares redeemed during the year as distributions from net investment income and realized capital gains. Accordingly, the fund has reclassified $26,479,000 from undistributed net investment income and $598,000 from accumulated net realized gains to paid-in capital.
For tax purposes, at September 30, 2017, the fund had $297,454,000 of ordinary income and $448,000 of long-term capital gains available for distribution.
At September 30, 2017, the cost of investment securities for tax purposes was $15,831,039,000. Net unrealized appreciation of investment securities for tax purposes was $6,507,586,000, consisting entirely of unrealized gains on securities that had risen in value since their purchase.
E. Capital shares issued and redeemed were:
| | |
| | Year Ended September 30, |
| | 2017 | 2016 |
| | Shares | Shares |
| | (000) | (000) |
| Issued | 187,954 | 159,514 |
| Issued in Lieu of Cash Distributions | 13,784 | 15,461 |
| Redeemed | (126,965) | (166,772) |
| Net Increase (Decrease) in Shares Outstanding | 74,773 | 8,203 |
17
Target Retirement 2040 Fund
F. Transactions during the period in affiliated underlying Vanguard funds were as follows:
| | | | | | | | |
| | | | | | Current Period Transactions | |
| Sept. 30, | | Proceeds | | | | | Sept. 30, |
| | 2016 | | from | Realized | Change in | | Capital Gain | 2017 |
| | Market | Purchases | Securities | Net Gain | Unrealized | | Distributions | Market |
| | Value | at Cost | Sold | (Loss) | App. (Dep.) | Income | Received | Value |
| | ($000) | ($000) | ($000) | ($000) | ($000) | ($000) | ($000) | ($000) |
| Vanguard Market | | | | | | | | |
| Liquidity Fund | 12,522 | NA1 | NA1 | 2 | — | 40 | — | 10,689 |
| Vanguard Total | | | | | | | | |
| Bond Market II | | | | | | | | |
| Index Fund | 1,507,016 | 1,040,912 | 375,175 | — | (34,600) | 42,687 | 1,618 | 2,138,153 |
| Vanguard Total | | | | | | | | |
| International | | | | | | | | |
| Bond Index | | | | | | | | |
| Fund | 592,479 | 282,186 | — | — | (13,758) | 12,110 | — | 860,907 |
| Vanguard Total | | | | | | | | |
| International | | | | | | | | |
| Stock Index | | | | | | | | |
| Fund | 6,091,376 | 919,159 | 395,296 | 9,057 | 1,067,812 | 190,870 | — | 7,692,108 |
| Vanguard Total | | | | | | | | |
| Stock Market | | | | | | | | |
| Index Fund | 9,176,256 | 1,649,325 | 745,564 | 9,225 | 1,547,526 | 193,827 | — | 11,636,768 |
| Total | 17,379,649 | 3,891,582 | 1,516,035 | 18,284 | 2,566,980 | 439,534 | 1,618 | 22,338,625 |
| 1 Not applicable—purchases and sales are for temporary cash investment purposes. | | | |
G. Management has determined that no material events or transactions occurred subsequent to September 30, 2017, that would require recognition or disclosure in these financial statements.
18
Target Retirement 2045 Fund
Fund Profile
As of September 30, 2017
| |
| Total Fund Characteristics | |
| Ticker Symbol | VTIVX |
| 30-Day SEC Yield | 2.06% |
| Acquired Fund Fees and Expenses1 | 0.16% |
| |
| Allocation to Underlying Vanguard Funds | |
| Vanguard Total Stock Market Index | |
| Fund Investor Shares | 54.2% |
| Vanguard Total International Stock | |
| Index Fund Investor Shares | 35.8 |
| Vanguard Total Bond Market II | |
| Index Fund Investor Shares | 7.0 |
| Vanguard Total International Bond | |
| Index Fund Investor Shares | 3.0 |
| | |
| Total Fund Volatility Measures | |
| | Target 2045 | MSCI US |
| | Composite | Broad Market |
| | Index | Index |
| R-Squared | 1.00 | 0.92 |
| Beta | 0.98 | 0.85 |
These measures show the degree and timing of the fund’s fluctuations compared with the indexes over 36 months.
Fund Asset Allocation
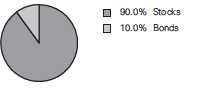
1 This figure—drawn from the prospectus dated July 12, 2017—represents an estimate of the weighted average of the expense ratios and any transaction fees charged by the underlying mutual funds (the ”acquired” funds) in which the Target Retirement 2045 Fund invests. The fund does not charge any expenses or fees of its own. For the fiscal year ended September 30, 2017, the acquired fund fees and expenses were 0.15%.
19
Target Retirement 2045 Fund
Performance Summary
All of the returns in this report represent past performance, which is not a guarantee of future results that may be achieved by the fund. (Current performance may be lower or higher than the performance data cited. For performance data current to the most recent month-end, visit our website at vanguard.com/performance.) Note, too, that both investment returns and principal value can fluctuate widely, so an investor’s shares, when sold, could be worth more or less than their original cost. The returns shown do not reflect taxes that a shareholder would pay on fund distributions or on the sale of fund shares.
Cumulative Performance: September 30, 2007, Through September 30, 2017
Initial Investment of $10,000
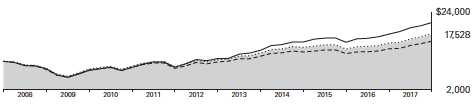
| | | | |
| | Average Annual Total Returns | |
| | Periods Ended September 30, 2017 | |
| | | | | Final Value |
| | One | Five | Ten | of a $10,000 |
| | Year | Years | Years | Investment |
| Target Retirement 2045 Fund* | 16.84% | 10.91% | 5.77% | $17,528 |
| Target 2045 Composite Index | 17.01 | 11.16 | 5.92 | 17,778 |
| Mixed-Asset Target 2045 Funds | | | | |
| Average | 16.08 | 9.86 | 4.62 | 15,710 |
| MSCI US Broad Market Index | 18.67 | 14.26 | 7.72 | 21,034 |
For a benchmark description, see the Glossary.
Mixed-Asset Target 2045 Funds Average: Derived from data provided by Lipper, a Thomson Reuters Company.
See Financial Highlights for dividend and capital gains information.
20
Target Retirement 2045 Fund
Fiscal-Year Total Returns (%): September 30, 2007, Through September 30, 2017
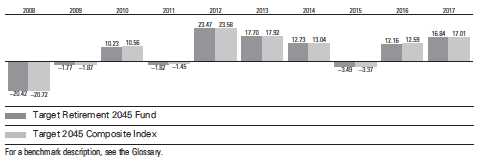
21
Target Retirement 2045 Fund
Financial Statements
Statement of Net Assets
As of September 30, 2017
The fund reports a complete list of its holdings in regulatory filings four times in each fiscal year, at the quarter-ends. For the second and fourth fiscal quarters, the lists appear in the fund’s semiannual and annual reports to shareholders. For the first and third fiscal quarters, the fund files the lists with the Securities and Exchange Commission on Form N-Q. Shareholders can look up the fund’s Forms N-Q on the SEC’s website at sec.gov. Forms N-Q may also be reviewed and copied at the SEC’s Public Reference Room (see the back cover of this report for further information).
| | |
| | | Market |
| | | Value• |
| | Shares | ($000) |
| Investment Companies (100.0%) | | |
| U.S. Stock Fund (54.2%) | | |
| Vanguard Total Stock Market Index Fund Investor Shares | 175,406,810 | 11,055,891 |
| |
| International Stock Fund (35.8%) | | |
| Vanguard Total International Stock Index Fund Investor Shares | 416,461,612 | 7,317,231 |
| |
| U.S. Bond Fund (7.0%) | | |
| 1 Vanguard Total Bond Market II Index Fund Investor Shares | 133,211,861 | 1,432,028 |
| |
| International Bond Fund (3.0%) | | |
| Vanguard Total International Bond Index Fund Investor Shares | 55,435,397 | 603,691 |
| Total Investment Companies (Cost $14,176,344) | | 20,408,841 |
| Temporary Cash Investment (0.0%) | | |
| Money Market Fund (0.0%) | | |
| 1 Vanguard Market Liquidity Fund, 1.223% (Cost $6,235) | 62,338 | 6,235 |
| Total Investments (100.0%) (Cost $14,182,579) | | 20,415,076 |
| Other Assets and Liabilities (0.0%) | | |
| Other Assets | | 41,283 |
| Liabilities | | (43,247) |
| | | (1,964) |
| Net Assets (100%) | | |
| Applicable to 936,225,355 outstanding $.001 par value shares of | | |
| beneficial interest (unlimited authorization) | | 20,413,112 |
| Net Asset Value Per Share | | $21.80 |
22
| |
| Target Retirement 2045 Fund | |
| |
| |
| |
| |
| | Amount |
| | ($000) |
| Statement of Assets and Liabilities | |
| Assets | |
| Investments in Securities, at Value—Affiliated Vanguard Funds | 20,415,076 |
| Receivables for Investment Securities Sold | 12,172 |
| Receivables for Accrued Income | 3,305 |
| Receivables for Capital Shares Issued | 25,806 |
| Total Assets | 20,456,359 |
| Liabilities | |
| Payables for Investment Securities Purchased | 18,305 |
| Payables for Capital Shares Redeemed | 24,942 |
| Total Liabilities | 43,247 |
| Net Assets | 20,413,112 |
| |
| |
| |
| At September 30, 2017, net assets consisted of: | Amount |
| | ($000) |
| Paid-in Capital | 13,906,517 |
| Undistributed Net Investment Income | 265,300 |
| Accumulated Net Realized Gains | 8,798 |
| Unrealized Appreciation (Depreciation) | 6,232,497 |
| Net Assets | 20,413,112 |
• See Note A in Notes to Financial Statements.
1 Affiliated fund available only to Vanguard funds and certain trusts and accounts managed by Vanguard. Rate shown for Vanguard
Market Liquidity Fund is the 7-day yield.
See accompanying Notes, which are an integral part of the Financial Statements.
23
| |
| Target Retirement 2045 Fund | |
| |
| |
| Statement of Operations | |
| |
| | Year Ended |
| | September 30, 2017 |
| | ($000) |
| Investment Income | |
| Income | |
| Income Distributions Received from Affiliated Funds | 402,343 |
| Net Investment Income—Note B | 402,343 |
| Realized Net Gain (Loss) | |
| Capital Gain Distributions Received from Affiliated Funds | 1,218 |
| Affiliated Investment Securities Sold | 15,543 |
| Realized Net Gain (Loss) | 16,761 |
| Change in Unrealized Appreciation (Depreciation) of Investment Securities | 2,430,140 |
| Net Increase (Decrease) in Net Assets Resulting from Operations | 2,849,244 |
See accompanying Notes, which are an integral part of the Financial Statements.
24
| | |
| Target Retirement 2045 Fund | | |
| |
| |
| Statement of Changes in Net Assets | | |
| |
| | Year Ended September 30, |
| | 2017 | 2016 |
| | ($000) | ($000) |
| Increase (Decrease) in Net Assets | | |
| Operations | | |
| Net Investment Income | 402,343 | 330,513 |
| Realized Net Gain (Loss) | 16,761 | 137,100 |
| Change in Unrealized Appreciation (Depreciation) | 2,430,140 | 1,271,291 |
| Net Increase (Decrease) in Net Assets Resulting from Operations | 2,849,244 | 1,738,904 |
| Distributions | | |
| Net Investment Income | (323,102) | (302,945) |
| Realized Capital Gain1 | (79,182) | (156,182) |
| Total Distributions | (402,284) | (459,127) |
| Capital Share Transactions | | |
| Issued | 5,084,279 | 3,900,183 |
| Issued in Lieu of Cash Distributions | 397,131 | 451,577 |
| Redeemed | (3,501,855) | (3,927,553) |
| Net Increase (Decrease) from Capital Share Transactions | 1,979,555 | 424,207 |
| Total Increase (Decrease) | 4,426,515 | 1,703,984 |
| Net Assets | | |
| Beginning of Period | 15,986,597 | 14,282,613 |
| End of Period2 | 20,413,112 | 15,986,597 |
1 Includes fiscal 2017 and 2016 short-term gain distributions totaling $6,807,000 and $14,912,000, respectively. Short-term gain
distributions are treated as ordinary income dividends for tax purposes.
2 Net Assets—End of Period includes undistributed (overdistributed) net investment income of $265,300,000 and $207,956,000.
See accompanying Notes, which are an integral part of the Financial Statements.
25
| | | | | |
| Target Retirement 2045 Fund | | | | | |
| |
| |
| Financial Highlights | | | | | |
| |
| |
| For a Share Outstanding | | | Year Ended September 30, |
| Throughout Each Period | 2017 | 2016 | 2015 | 2014 | 2013 |
| Net Asset Value, Beginning of Period | $19.12 | $17.60 | $18.61 | $16.82 | $14.61 |
| Investment Operations | | | | | |
| Net Investment Income | . 4501 | .411 | .406 | .376 | .350 |
| Capital Gain Distributions Received | .0011 | .002 | .004 | .001 | .008 |
| Net Realized and Unrealized Gain (Loss) | | | | | |
| on Investments | 2.696 | 1.692 | (1.034) | 1.747 | 2.173 |
| Total from Investment Operations | 3.147 | 2.105 | (.624) | 2.124 | 2.531 |
| Distributions | | | | | |
| Dividends from Net Investment Income | (.375) | (.386) | (.383) | (.334) | (.316) |
| Distributions from Realized Capital Gains | (.092) | (.199) | (.003) | — | (.005) |
| Total Distributions | (.467) | (.585) | (.386) | (.334) | (.321) |
| Net Asset Value, End of Period | $21.80 | $19.12 | $17.60 | $18.61 | $16.82 |
| |
| Total Return2 | 16.84% | 12.16% | -3.49% | 12.73% | 17.70% |
| |
| Ratios/Supplemental Data | | | | | |
| Net Assets, End of Period (Millions) | $20,413 | $15,987 | $14,283 | $14,491 | $11,441 |
| Ratio of Total Expenses to Average Net Assets | — | — | — | — | — |
| Acquired Fund Fees and Expenses | 0.15% | 0.16% | 0.16% | 0.18% | 0.18% |
| Ratio of Net Investment Income to | | | | | |
| Average Net Assets | 2.23% | 2.43% | 2.10% | 2.17% | 2.36% |
| Portfolio Turnover Rate | 8% | 13% | 20% | 7% | 10% |
1 Calculated based on average shares outstanding.
2 Total returns do not include account service fees that may have applied in the periods shown. Fund prospectuses provide information
about any applicable account service fees.
See accompanying Notes, which are an integral part of the Financial Statements.
26
Target Retirement 2045 Fund
Notes to Financial Statements
Vanguard Target Retirement 2045 Fund is registered under the Investment Company Act of 1940 as an open-end investment company, or mutual fund. The fund follows a balanced investment strategy by investing in selected Vanguard funds to achieve its targeted allocation of assets to U.S. and international stocks, and U.S. and international bonds. Financial statements and other information about each underlying fund are available on vanguard.com.
A. The following significant accounting policies conform to generally accepted accounting principles for U.S. investment companies. The fund consistently follows such policies in preparing its financial statements.
1. Security Valuation: Investments are valued at the net asset value of each underlying Vanguard fund determined as of the close of the New York Stock Exchange (generally 4 p.m., Eastern time) on the valuation date.
2. Federal Income Taxes: The fund intends to continue to qualify as a regulated investment company and distribute all of its taxable income. Management has analyzed the fund’s tax positions taken for all open federal income tax years (September 30, 2014–2017), and has concluded that no provision for federal income tax is required in the fund’s financial statements.
3. Distributions: Distributions to shareholders are recorded on the ex-dividend date.
4. Credit Facility: The fund and certain other funds managed by The Vanguard Group (“Vanguard”) participate in a $3.1 billion committed credit facility provided by a syndicate of lenders pursuant to a credit agreement that may be renewed annually; each fund is individually liable for its borrowings, if any, under the credit facility. Borrowings may be utilized for temporary and emergency purposes, and are subject to the fund’s regulatory and contractual borrowing restrictions. The participating funds are charged administrative fees and an annual commitment fee of 0.10% of the undrawn amount of the facility; these fees are allocated to the funds based on a method approved by the fund’s board of trustees and borne by the funds in which the fund invests (see Note B). Any borrowings under this facility bear interest at a rate based upon the higher of the one-month London Interbank Offered Rate, federal funds effective rate, or overnight bank funding rate plus an agreed-upon spread.
The fund had no borrowings outstanding at September 30, 2017, or at any time during the period then ended.
5. Other: Income and capital gain distributions received are recorded on the ex-dividend date. Security transactions are accounted for on the date securities are bought or sold. Costs used to determine realized gains (losses) on the sale of investment securities are those of the specific securities sold.
B. In accordance with the terms of a Funds’ Service Agreement (the “FSA”) between Vanguard and the fund, Vanguard furnishes to the fund investment advisory, corporate management, administrative, marketing, and distribution services at Vanguard’s cost of operations (as defined by the FSA). These costs of operations are allocated to the fund based on methods and guidelines approved by the board of trustees. The FSA provides that expenses otherwise allocable to Vanguard funds-of-funds may be reduced or eliminated to the extent of savings realized by the underlying Vanguard funds by virtue of being part of a fund-of-funds. Accordingly, all expenses for services provided by Vanguard to the fund and all other expenses incurred by the fund during the
27
Target Retirement 2045 Fund
period ended September 30, 2017, were borne by the underlying Vanguard funds in which the fund invests. The fund’s trustees and officers are also trustees and officers, respectively, of the underlying Vanguard funds, as well as directors and employees, respectively, of Vanguard.
C. Various inputs may be used to determine the value of the fund’s investments. These inputs are summarized in three broad levels for financial statement purposes. The inputs or methodologies used to value securities are not necessarily an indication of the risk associated with investing in those securities.
Level 1—Quoted prices in active markets for identical securities.
Level 2—Other significant observable inputs (including quoted prices for similar securities, interest rates, prepayment speeds, credit risk, etc.).
Level 3—Significant unobservable inputs (including the fund’s own assumptions used to determine the fair value of investments). Any investments valued with significant unobservable inputs are noted on the Statement of Net Assets.
At September 30, 2017, 100% of the market value of the fund’s investments was determined based on Level 1 inputs.
D. Distributions are determined on a tax basis and may differ from net investment income and realized capital gains for financial reporting purposes. Differences may be permanent or temporary. Permanent differences are reclassified among capital accounts in the financial statements to reflect their tax character. Temporary differences arise when certain items of income, expense, gain, or loss are recognized in different periods for financial statement and tax purposes. These differences will reverse at some time in the future. Differences in classification may also result from the treatment of short-term gains as ordinary income for tax purposes.
The fund used a tax accounting practice to treat a portion of the price of capital shares redeemed during the year as distributions from net investment income and realized capital gains. Accordingly, the fund has reclassified $21,897,000 from undistributed net investment income and $508,000 from accumulated net realized gains to paid-in capital.
For tax purposes, at September 30, 2017, the fund had $274,098,000 of ordinary income available for distribution.
At September 30, 2017, the cost of investment securities for tax purposes was $14,182,579,000. Net unrealized appreciation of investment securities for tax purposes was $6,232,497,000, consisting entirely of unrealized gains on securities that had risen in value since their purchase.
E. Capital shares issued and redeemed were:
| | |
| | Year Ended September 30, |
| | 2017 | 2016 |
| | Shares | Shares |
| | (000) | (000) |
| Issued | 253,488 | 216,385 |
| Issued in Lieu of Cash Distributions | 21,034 | 25,032 |
| Redeemed | (174,328) | (216,842) |
| Net Increase (Decrease) in Shares Outstanding | 100,194 | 24,575 |
28
Target Retirement 2045 Fund
F. Transactions during the period in affiliated underlying Vanguard funds were as follows:
| | | | | | | | |
| | | | | | Current Period Transactions | |
| Sept. 30, | | Proceeds | | | | | Sept. 30, |
| | 2016 | | from | Realized | Change in | | Capital Gain | 2017 |
| | Market | Purchases | Securities | Net Gain | Unrealized | | Distributions | Market |
| | Value | at Cost | Sold | (Loss) | App. (Dep.) | Income | Received | Value |
| | ($000) | ($000) | ($000) | ($000) | ($000) | ($000) | ($000) | ($000) |
| Vanguard Market | | | | | | | | |
| Liquidity Fund | 5,775 | NA1 | NA1 | 2 | — | 35 | — | 6,235 |
| Vanguard Total | | | | | | | | |
| Bond Market II | | | | | | | | |
| Index Fund | 1,130,351 | 612,620 | 283,384 | (541) | (27,018) | 30,316 | 1,218 | 1,432,028 |
| Vanguard Total | | | | | | | | |
| International Bond | | | | | | | | |
| Index Fund | 458,181 | 156,499 | — | — | (10,989) | 8,858 | — | 603,691 |
| Vanguard Total | | | | | | | | |
| International Stock | | | | | | | | |
| Index Fund | 5,745,381 | 977,379 | 418,905 | 5,912 | 1,007,464 | 180,112 | — | 7,317,231 |
| Vanguard Total | | | | | | | | |
| Stock Market | | | | | | | | |
| Index Fund | 8,646,434 | 1,615,013 | 676,409 | 10,170 | 1,460,683 | 183,022 | — | 11,055,891 |
| Total | 15,986,122 | 3,361,511 | 1,378,698 | 15,543 | 2,430,140 | 402,343 | 1,218 | 20,415,076 |
| 1 Not applicable—purchases and sales are for temporary cash investment purposes. | | | |
G. Management has determined that no material events or transactions occurred subsequent to September 30, 2017, that would require recognition or disclosure in these financial statements.
29
Target Retirement 2050 Fund
Fund Profile
As of September 30, 2017
| |
| Total Fund Characteristics | |
| Ticker Symbol | VFIFX |
| 30-Day SEC Yield | 2.06% |
| Acquired Fund Fees and Expenses1 | 0.16% |
| |
| Allocation to Underlying Vanguard Funds | |
| Vanguard Total Stock Market Index | |
| Fund Investor Shares | 54.2% |
| Vanguard Total International Stock | |
| Index Fund Investor Shares | 35.9 |
| Vanguard Total Bond Market II | |
| Index Fund Investor Shares | 7.0 |
| Vanguard Total International Bond | |
| Index Fund Investor Shares | 2.9 |
| | |
| Total Fund Volatility Measures | |
| | Target 2050 | MSCI US |
| | Composite | Broad Market |
| | Index | Index |
| R-Squared | 1.00 | 0.92 |
| Beta | 0.97 | 0.85 |
These measures show the degree and timing of the fund’s fluctuations compared with the indexes over 36 months.
Fund Asset Allocation

1 This figure—drawn from the prospectus dated July 12, 2017—represents an estimate of the weighted average of the expense ratios and any transaction fees charged by the underlying mutual funds (the ”acquired” funds) in which the Target Retirement 2050 Fund invests. The fund does not charge any expenses or fees of its own. For the fiscal year ended September 30, 2017, the acquired fund fees and expenses were 0.15%.
30
Target Retirement 2050 Fund
Performance Summary
All of the returns in this report represent past performance, which is not a guarantee of future results that may be achieved by the fund. (Current performance may be lower or higher than the performance data cited. For performance data current to the most recent month-end, visit our website at vanguard.com/performance.) Note, too, that both investment returns and principal value can fluctuate widely, so an investor’s shares, when sold, could be worth more or less than their original cost. The returns shown do not reflect taxes that a shareholder would pay on fund distributions or on the sale of fund shares.
Cumulative Performance: September 30, 2007, Through September 30, 2017
Initial Investment of $10,000
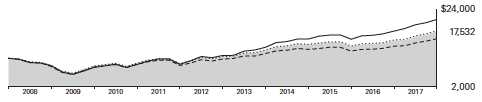
| | | | |
| | Average Annual Total Returns | |
| | Periods Ended September 30, 2017 | |
| | | | | Final Value |
| | One | Five | Ten | of a $10,000 |
| | Year | Years | Years | Investment |
| Target Retirement 2050 Fund* | 16.84% | 10.91% | 5.78% | $17,532 |
| Target 2050 Composite Index | 17.01 | 11.16 | 5.92 | 17,777 |
| Mixed-Asset Target 2050 Funds | | | | |
| Average | 15.80 | 9.78 | 4.51 | 15,550 |
| MSCI US Broad Market Index | 18.67 | 14.26 | 7.72 | 21,034 |
For a benchmark description, see the Glossary.
Mixed-Asset Target 2050 Funds Average: Derived from data provided by Lipper, a Thomson Reuters Company.
See Financial Highlights for dividend and capital gains information.
31
Target Retirement 2050 Fund
Fiscal-Year Total Returns (%): September 30, 2007, Through September 30, 2017
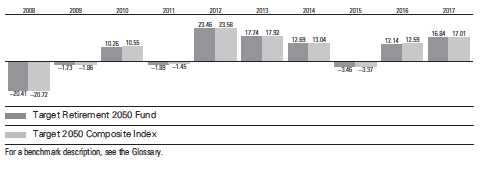
32
Target Retirement 2050 Fund
Financial Statements
Statement of Net Assets
As of September 30, 2017
The fund reports a complete list of its holdings in regulatory filings four times in each fiscal year, at the quarter-ends. For the second and fourth fiscal quarters, the lists appear in the fund’s semiannual and annual reports to shareholders. For the first and third fiscal quarters, the fund files the lists with the Securities and Exchange Commission on Form N-Q. Shareholders can look up the fund’s Forms N-Q on the SEC’s website at sec.gov. Forms N-Q may also be reviewed and copied at the SEC’s Public Reference Room (see the back cover of this report for further information).
| | |
| | | Market |
| | | Value• |
| | Shares | ($000) |
| Investment Companies (100.0%) | | |
| U.S. Stock Fund (54.1%) | | |
| Vanguard Total Stock Market Index Fund Investor Shares | 115,125,408 | 7,256,355 |
| |
| International Stock Fund (35.9%) | | |
| Vanguard Total International Stock Index Fund Investor Shares | 273,875,704 | 4,811,996 |
| |
| U.S. Bond Fund (7.0%) | | |
| 1 Vanguard Total Bond Market II Index Fund Investor Shares | 87,575,076 | 941,432 |
| |
| International Bond Fund (3.0%) | | |
| Vanguard Total International Bond Index Fund Investor Shares | 36,295,509 | 395,258 |
| Total Investment Companies (Cost $9,971,033) | | 13,405,041 |
| Temporary Cash Investment (0.0%) | | |
| Money Market Fund (0.0%) | | |
| 1 Vanguard Market Liquidity Fund, 1.223% (Cost $6,411) | 64,096 | 6,411 |
| Total Investments (100.0%) (Cost $9,977,444) | | 13,411,452 |
| Other Assets and Liabilities (0.0%) | | |
| Other Assets | | 44,234 |
| Liabilities | | (48,581) |
| | | (4,347) |
| Net Assets (100%) | | |
| Applicable to 382,243,072 outstanding $.001 par value shares of | | |
| beneficial interest (unlimited authorization) | | 13,407,105 |
| Net Asset Value Per Share | | $35.07 |
33
| |
| Target Retirement 2050 Fund | |
| |
| |
| |
| |
| | Amount |
| | ($000) |
| Statement of Assets and Liabilities | |
| Assets | |
| Investments in Securities, at Value—Affiliated Vanguard Funds | 13,411,452 |
| Receivables for Investment Securities Sold | 22,185 |
| Receivables for Accrued Income | 2,169 |
| Receivables for Capital Shares Issued | 19,880 |
| Total Assets | 13,455,686 |
| Liabilities | |
| Payables for Investment Securities Purchased | 14,170 |
| Payables for Capital Shares Redeemed | 34,411 |
| Total Liabilities | 48,581 |
| Net Assets | 13,407,105 |
| |
| |
| At September 30, 2017, net assets consisted of: | |
| | Amount |
| | ($000) |
| Paid-in Capital | 9,796,069 |
| Undistributed Net Investment Income | 174,136 |
| Accumulated Net Realized Gains | 2,892 |
| Unrealized Appreciation (Depreciation) | 3,434,008 |
| Net Assets | 13,407,105 |
• See Note A in Notes to Financial Statements.
1 Affiliated fund available only to Vanguard funds and certain trusts and accounts managed by Vanguard. Rate shown for Vanguard
Market Liquidity Fund is the 7-day yield.
See accompanying Notes, which are an integral part of the Financial Statements.
34
| |
| Target Retirement 2050 Fund | |
| |
| |
| Statement of Operations | |
| |
| | Year Ended |
| | September 30, 2017 |
| | ($000) |
| Investment Income | |
| Income | |
| Income Distributions Received from Affiliated Funds | 255,731 |
| Net Investment Income—Note B | 255,731 |
| Realized Net Gain (Loss) | |
| Capital Gain Distributions Received from Affiliated Funds | 751 |
| Affiliated Investment Securities Sold | 7,846 |
| Realized Net Gain (Loss) | 8,597 |
| Change in Unrealized Appreciation (Depreciation) of Investment Securities | 1,550,560 |
| Net Increase (Decrease) in Net Assets Resulting from Operations | 1,814,888 |
See accompanying Notes, which are an integral part of the Financial Statements.
35
| | |
| Target Retirement 2050 Fund | | |
| |
| |
| Statement of Changes in Net Assets | | |
| |
| | Year Ended September 30, |
| | 2017 | 2016 |
| | ($000) | ($000) |
| Increase (Decrease) in Net Assets | | |
| Operations | | |
| Net Investment Income | 255,731 | 191,973 |
| Realized Net Gain (Loss) | 8,597 | 25,508 |
| Change in Unrealized Appreciation (Depreciation) | 1,550,560 | 795,513 |
| Net Increase (Decrease) in Net Assets Resulting from Operations | 1,814,888 | 1,012,994 |
| Distributions | | |
| Net Investment Income | (193,369) | (163,313) |
| Realized Capital Gain1 | (11,266) | (24,567) |
| Total Distributions | (204,635) | (187,880) |
| Capital Share Transactions | | |
| Issued | 4,182,146 | 3,089,676 |
| Issued in Lieu of Cash Distributions | 201,506 | 184,437 |
| Redeemed | (2,220,595) | (2,358,228) |
| Net Increase (Decrease) from Capital Share Transactions | 2,163,057 | 915,885 |
| Total Increase (Decrease) | 3,773,310 | 1,740,999 |
| Net Assets | | |
| Beginning of Period | 9,633,795 | 7,892,796 |
| End of Period2 | 13,407,105 | 9,633,795 |
1 Includes fiscal 2017 and 2016 short-term gain distributions totaling $2,504,000 and $12,842,000, respectively. Short-term gain
distributions are treated as ordinary income dividends for tax purposes.
2 Net Assets—End of Period includes undistributed (overdistributed) net investment income of $174,136,000 and $123,151,000.
See accompanying Notes, which are an integral part of the Financial Statements.
36
| | | | | |
| Target Retirement 2050 Fund | | | | | |
| |
| |
| Financial Highlights | | | | | |
| |
| |
| For a Share Outstanding | | | Year Ended September 30, |
| Throughout Each Period | 2017 | 2016 | 2015 | 2014 | 2013 |
| Net Asset Value, Beginning of Period | $30.63 | $27.95 | $29.53 | $26.69 | $23.16 |
| Investment Operations | | | | | |
| Net Investment Income | .7271 | .636 | .623 | .586 | .539 |
| Capital Gain Distributions Received | .0021 | .003 | .006 | .001 | .012 |
| Net Realized and Unrealized Gain (Loss) | | | | | |
| on Investments | 4.332 | 2.714 | (1.609) | 2.771 | 3.473 |
| Total from Investment Operations | 5.061 | 3.353 | (.980) | 3.358 | 4.024 |
| Distributions | | | | | |
| Dividends from Net Investment Income | (.587) | (.585) | (.596) | (.518) | (.487) |
| Distributions from Realized Capital Gains | (.034) | (.088) | (.004) | — | (.007) |
| Total Distributions | (.621) | (.673) | (.600) | (.518) | (.494) |
| Net Asset Value, End of Period | $35.07 | $30.63 | $27.95 | $29.53 | $26.69 |
| |
| Total Return2 | 16.84% | 12.14% | -3.46% | 12.69% | 17.74% |
| |
| Ratios/Supplemental Data | | | | | |
| Net Assets, End of Period (Millions) | $13,407 | $9,634 | $7,893 | $7,389 | $5,355 |
| Ratio of Total Expenses to Average Net Assets | — | — | — | — | — |
| Acquired Fund Fees and Expenses | 0.15% | 0.16% | 0.16% | 0.18% | 0.18% |
| Ratio of Net Investment Income to | | | | | |
| Average Net Assets | 2.24% | 2.24% | 2.11% | 2.19% | 2.36% |
| Portfolio Turnover Rate | 6% | 12% | 18% | 7% | 9% |
1 Calculated based on average shares outstanding.
2 Total returns do not include account service fees that may have applied in the periods shown. Fund prospectuses provide information
about any applicable account service fees.
See accompanying Notes, which are an integral part of the Financial Statements.
37
Target Retirement 2050 Fund
Notes to Financial Statements
Vanguard Target Retirement 2050 Fund is registered under the Investment Company Act of 1940 as an open-end investment company, or mutual fund. The fund follows a balanced investment strategy by investing in selected Vanguard funds to achieve its targeted allocation of assets to U.S. and international stocks, and U.S. and international bonds. Financial statements and other information about each underlying fund are available on vanguard.com.
A. The following significant accounting policies conform to generally accepted accounting principles for U.S. investment companies. The fund consistently follows such policies in preparing its financial statements.
1. Security Valuation: Investments are valued at the net asset value of each underlying Vanguard fund determined as of the close of the New York Stock Exchange (generally 4 p.m., Eastern time) on the valuation date.
2. Federal Income Taxes: The fund intends to continue to qualify as a regulated investment company and distribute all of its taxable income. Management has analyzed the fund’s tax positions taken for all open federal income tax years (September 30, 2014–2017), and has concluded that no provision for federal income tax is required in the fund’s financial statements.
3. Distributions: Distributions to shareholders are recorded on the ex-dividend date.
4. Credit Facility: The fund and certain other funds managed by The Vanguard Group (“Vanguard”) participate in a $3.1 billion committed credit facility provided by a syndicate of lenders pursuant to a credit agreement that may be renewed annually; each fund is individually liable for its borrowings, if any, under the credit facility. Borrowings may be utilized for temporary and emergency purposes, and are subject to the fund’s regulatory and contractual borrowing restrictions. The participating funds are charged administrative fees and an annual commitment fee of 0.10% of the undrawn amount of the facility; these fees are allocated to the funds based on a method approved by the fund’s board of trustees and borne by the funds in which the fund invests (see Note B). Any borrowings under this facility bear interest at a rate based upon the higher of the one-month London Interbank Offered Rate, federal funds effective rate, or overnight bank funding rate plus an agreed-upon spread.
The fund had no borrowings outstanding at September 30, 2017, or at any time during the period then ended.
5. Other: Income and capital gain distributions received are recorded on the ex-dividend date. Security transactions are accounted for on the date securities are bought or sold. Costs used to determine realized gains (losses) on the sale of investment securities are those of the specific securities sold.
B. In accordance with the terms of a Funds’ Service Agreement (the “FSA”) between Vanguard and the fund, Vanguard furnishes to the fund investment advisory, corporate management, administrative, marketing, and distribution services at Vanguard’s cost of operations (as defined by the FSA). These costs of operations are allocated to the fund based on methods and guidelines approved by the board of trustees. The FSA provides that expenses otherwise allocable to Vanguard funds-of-funds may be reduced or eliminated to the extent of savings realized by the underlying Vanguard funds by virtue of being part of a fund-of-funds. Accordingly, all expenses for services provided by Vanguard to the fund and all other expenses incurred by the fund during the period
38
Target Retirement 2050 Fund
ended September 30, 2017, were borne by the underlying Vanguard funds in which the fund invests. The fund’s trustees and officers are also trustees and officers, respectively, of the underlying Vanguard funds, as well as directors and employees, respectively, of Vanguard.
C. Various inputs may be used to determine the value of the fund’s investments. These inputs are summarized in three broad levels for financial statement purposes. The inputs or methodologies used to value securities are not necessarily an indication of the risk associated with investing in those securities.
Level 1—Quoted prices in active markets for identical securities.
Level 2—Other significant observable inputs (including quoted prices for similar securities, interest rates, prepayment speeds, credit risk, etc.).
Level 3—Significant unobservable inputs (including the fund’s own assumptions used to determine the fair value of investments). Any investments valued with significant unobservable inputs are noted on the Statement of Net Assets.
At September 30, 2017, 100% of the market value of the fund’s investments was determined based on Level 1 inputs.
D. Distributions are determined on a tax basis and may differ from net investment income and realized capital gains for financial reporting purposes. Differences may be permanent or temporary. Permanent differences are reclassified among capital accounts in the financial statements to reflect their tax character. Temporary differences arise when certain items of income, expense, gain, or loss are recognized in different periods for financial statement and tax purposes. These differences will reverse at some time in the future. Differences in classification may also result from the treatment of short-term gains as ordinary income for tax purposes.
The fund used a tax accounting practice to treat a portion of the price of capital shares redeemed during the year as distributions from net investment income and realized capital gains. Accordingly, the fund has reclassified $11,377,000 from undistributed net investment income and $136,000 from accumulated net realized gains to paid-in capital.
For tax purposes, at September 30, 2017, the fund had $177,027,000 of ordinary income available for distribution.
At September 30, 2017, the cost of investment securities for tax purposes was $9,977,444,000. Net unrealized appreciation of investment securities for tax purposes was $3,434,008,000, consisting entirely of unrealized gains on securities that had risen in value since their purchase.
E. Capital shares issued and redeemed were:
| | |
| | Year Ended September 30, |
| | 2017 | 2016 |
| | Shares | Shares |
| | (000) | (000) |
| Issued | 129,546 | 107,122 |
| Issued in Lieu of Cash Distributions | 6,635 | 6,382 |
| Redeemed | (68,419) | (81,445) |
| Net Increase (Decrease) in Shares Outstanding | 67,762 | 32,059 |
39
Target Retirement 2050 Fund
F. Transactions during the period in affiliated underlying Vanguard funds were as follows:
| | | | | | | | |
| | | | | | Current Period Transactions | |
| Sept. 30, | | Proceeds | | | | | Sept. 30, |
| | 2016 | | from | Realized | Change in | | Capital Gain | 2017 |
| | Market | Purchases | Securities | Net Gain | Unrealized | | Distributions | Market |
| | Value | at Cost | Sold | (Loss) | App. (Dep.) | Income | Received | Value |
| | ($000) | ($000) | ($000) | ($000) | ($000) | ($000) | ($000) | ($000) |
| Vanguard Market | | | | | | | | |
| Liquidity Fund | 7,485 | NA1 | NA1 | — | — | 30 | — | 6,411 |
| Vanguard Total | | | | | | | | |
| Bond Market II | | | | | | | | |
| Index Fund | 683,264 | 445,104 | 170,820 | (652) | (15,464) | 19,258 | 751 | 941,432 |
| Vanguard Total | | | | | | | | |
| International Bond | | | | | | | | |
| Index Fund | 274,376 | 127,327 | — | — | (6,445) | 5,490 | — | 395,258 |
| Vanguard Total | | | | | | | | |
| International Stock | | | | | | | | |
| Index Fund | 3,464,877 | 886,062 | 190,199 | 4,750 | 646,506 | 114,777 | — | 4,811,996 |
| Vanguard Total | | | | | | | | |
| Stock Market | | | | | | | | |
| Index Fund | 5,211,104 | 1,471,321 | 355,781 | 3,748 | 925,963 | 116,176 | — | 7,256,355 |
| Total | 9,641,106 | 2,929,814 | 716,800 | 7,846 | 1,550,560 | 255,731 | 751 | 13,411,452 |
| 1 Not applicable—purchases and sales are for temporary cash investment purposes. | | | |
G. Management has determined that no material events or transactions occurred subsequent to September 30, 2017, that would require recognition or disclosure in these financial statements.
40
Target Retirement 2055 Fund
Fund Profile
As of September 30, 2017
| |
| Total Fund Characteristics | |
| Ticker Symbol | VFFVX |
| 30-Day SEC Yield | 2.05% |
| Acquired Fund Fees and Expenses1 | 0.16% |
| |
| Allocation to Underlying Vanguard Funds | |
| Vanguard Total Stock Market Index | |
| Fund Investor Shares | 54.1% |
| Vanguard Total International Stock | |
| Index Fund Investor Shares | 35.9 |
| Vanguard Total Bond Market II | |
| Index Fund Investor Shares | 7.1 |
| Vanguard Total International Bond | |
| Index Fund Investor Shares | 2.9 |
| | |
| Total Fund Volatility Measures | |
| | Target 2055 | MSCI US |
| | Composite | Broad Market |
| | Index | Index |
| R-Squared | 1.00 | 0.92 |
| Beta | 0.97 | 0.85 |
These measures show the degree and timing of the fund’s fluctuations compared with the indexes over 36 months.
Fund Asset Allocation
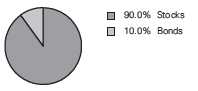
1 This figure—drawn from the prospectus dated July 12, 2017—represents an estimate of the weighted average of the expense ratios and any transaction fees charged by the underlying mutual funds (the ”acquired” funds) in which the Target Retirement 2055 Fund invests. The fund does not charge any expenses or fees of its own. For the fiscal year ended September 30, 2017, the acquired fund fees and expenses were 0.15%.
41
Target Retirement 2055 Fund
Performance Summary
All of the returns in this report represent past performance, which is not a guarantee of future results that may be achieved by the fund. (Current performance may be lower or higher than the performance data cited. For performance data current to the most recent month-end, visit our website at vanguard.com/performance.) Note, too, that both investment returns and principal value can fluctuate widely, so an investor’s shares, when sold, could be worth more or less than their original cost. The returns shown do not reflect taxes that a shareholder would pay on fund distributions or on the sale of fund shares.
Cumulative Performance: August 18, 2010, Through September 30, 2017
Initial Investment of $10,000

| | | | |
| | Average Annual Total Returns | |
| | Periods Ended September 30, 2017 | |
| | | | Since | Final Value |
| | One | Five | Inception | of a $10,000 |
| | Year | Years | (8/18/2010) | Investment |
| Target Retirement 2055 Fund* | 16.86% | 10.88% | 11.27% | $21,381 |
| • Target 2055 Composite Index | 17.01 | 11.16 | 11.50 | 21,708 |
| Spliced Mixed-Asset Target 2055+ | | | | |
| Funds Average | 16.62 | 10.13 | 10.28 | 20,066 |
| MSCI US Broad Market Index | 18.67 | 14.26 | 14.89 | 26,859 |
For a benchmark description, see the Glossary.
"Since Inception" performance is calculated from the inception date for both the fund and its comparative standards.
See Financial Highlights for dividend and capital gains information.
42
Target Retirement 2055 Fund
Fiscal-Year Total Returns (%): August 18, 2010, Through September 30, 2017
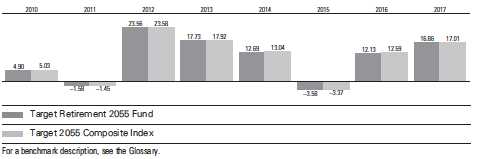
43
Target Retirement 2055 Fund
Financial Statements
Statement of Net Assets
As of September 30, 2017
The fund reports a complete list of its holdings in regulatory filings four times in each fiscal year, at the quarter-ends. For the second and fourth fiscal quarters, the lists appear in the fund’s semiannual and annual reports to shareholders. For the first and third fiscal quarters, the fund files the lists with the Securities and Exchange Commission on Form N-Q. Shareholders can look up the fund’s Forms N-Q on the SEC’s website at sec.gov. Forms N-Q may also be reviewed and copied at the SEC’s Public Reference Room (see the back cover of this report for further information).
| | |
| | | Market |
| | | Value• |
| | Shares | ($000) |
| Investment Companies (99.8%) | | |
| U.S. Stock Fund (54.0%) | | |
| Vanguard Total Stock Market Index Fund Investor Shares | 47,984,739 | 3,024,478 |
| |
| International Stock Fund (35.9%) | | |
| Vanguard Total International Stock Index Fund Investor Shares | 114,434,677 | 2,010,617 |
| |
| U.S. Bond Fund (7.0%) | | |
| 1 Vanguard Total Bond Market II Index Fund Investor Shares | 36,629,639 | 393,769 |
| |
| International Bond Fund (2.9%) | | |
| Vanguard Total International Bond Index Fund Investor Shares | 15,063,739 | 164,044 |
| Total Investment Companies (Cost $4,659,734) | | 5,592,908 |
| Temporary Cash Investment (0.1%) | | |
| Money Market Fund (0.1%) | | |
| 1 Vanguard Market Liquidity Fund, 1.223% (Cost $2,448) | 24,476 | 2,448 |
| Total Investments (99.9%) (Cost $4,662,182) | | 5,595,356 |
| Other Assets and Liabilities (0.1%) | | |
| Other Assets | | 18,756 |
| Liabilities | | (14,144) |
| | | 4,612 |
| Net Assets (100%) | | |
| Applicable to 147,463,322 outstanding $.001 par value shares of | | |
| beneficial interest (unlimited authorization) | | 5,599,968 |
| Net Asset Value Per Share | | $37.98 |
44
| |
| Target Retirement 2055 Fund | |
| |
| |
| |
| |
| | Amount |
| | ($000) |
| Statement of Assets and Liabilities | |
| Assets | |
| Investments in Securities, at Value—Affiliated Vanguard Funds | 5,595,356 |
| Receivables for Accrued Income | 903 |
| Receivables for Investment Securities Sold | 5,056 |
| Receivables for Capital Shares Issued | 12,797 |
| Total Assets | 5,614,112 |
| Liabilities | |
| Payables for Investment Securities Purchased | 8,303 |
| Payables for Capital Shares Redeemed | 5,841 |
| Total Liabilities | 14,144 |
| Net Assets | 5,599,968 |
| |
| |
| At September 30, 2017, net assets consisted of: | |
| | Amount |
| | ($000) |
| Paid-in Capital | 4,596,162 |
| Undistributed Net Investment Income | 71,775 |
| Accumulated Net Realized Losses | (1,143) |
| Unrealized Appreciation (Depreciation) | 933,174 |
| Net Assets | 5,599,968 |
• See Note A in Notes to Financial Statements.
1 Affiliated fund available only to Vanguard funds and certain trusts and accounts managed by Vanguard. Rate shown for Vanguard
Market Liquidity Fund is the 7-day yield.
See accompanying Notes, which are an integral part of the Financial Statements.
45
| |
| Target Retirement 2055 Fund | |
| |
| |
| Statement of Operations | |
| |
| | Year Ended |
| | September 30, 2017 |
| | ($000) |
| Investment Income | |
| Income | |
| Income Distributions Received from Affiliated Funds | 100,282 |
| Net Investment Income—Note B | 100,282 |
| Realized Net Gain (Loss) | |
| Capital Gain Distributions Received from Affiliated Funds | 278 |
| Affiliated Investment Securities Sold | 809 |
| Realized Net Gain (Loss) | 1,087 |
| Change in Unrealized Appreciation (Depreciation) of Investment Securities | 610,032 |
| Net Increase (Decrease) in Net Assets Resulting from Operations | 711,401 |
See accompanying Notes, which are an integral part of the Financial Statements.
46
| | |
| Target Retirement 2055 Fund | | |
| |
| |
| Statement of Changes in Net Assets | | |
| |
| | Year Ended September 30, |
| | 2017 | 2016 |
| | ($000) | ($000) |
| Increase (Decrease) in Net Assets | | |
| Operations | | |
| Net Investment Income | 100,282 | 62,698 |
| Realized Net Gain (Loss) | 1,087 | 5,634 |
| Change in Unrealized Appreciation (Depreciation) | 610,032 | 262,818 |
| Net Increase (Decrease) in Net Assets Resulting from Operations | 711,401 | 331,150 |
| Distributions | | |
| Net Investment Income | (73,319) | (46,523) |
| Realized Capital Gain1 | (224) | (1,255) |
| Total Distributions | (73,543) | (47,778) |
| Capital Share Transactions | | |
| Issued | 2,324,300 | 1,535,226 |
| Issued in Lieu of Cash Distributions | 72,303 | 46,827 |
| Redeemed | (833,493) | (745,024) |
| Net Increase (Decrease) from Capital Share Transactions | 1,563,110 | 837,029 |
| Total Increase (Decrease) | 2,200,968 | 1,120,401 |
| Net Assets | | |
| Beginning of Period | 3,399,000 | 2,278,599 |
| End of Period2 | 5,599,968 | 3,399,000 |
1 Includes fiscal 2017 and 2016 short-term gain distributions totaling $224,000 and $78,000, respectively. Short-term gain
distributions are treated as ordinary income dividends for tax purposes.
2 Net Assets—End of Period includes undistributed (overdistributed) net investment income of $71,775,000 and $47,624,000.
See accompanying Notes, which are an integral part of the Financial Statements.
47
| | | | | |
| Target Retirement 2055 Fund | | | | | |
| |
| |
| Financial Highlights | | | | | |
| |
| |
| For a Share Outstanding | | | Year Ended September 30, |
| Throughout Each Period | 2017 | 2016 | 2015 | 2014 | 2013 |
| Net Asset Value, Beginning of Period | $33.15 | $30.14 | $31.80 | $28.67 | $24.81 |
| Investment Operations | | | | | |
| Net Investment Income | .7961 | .642 | .631 | .577 | .6411 |
| Capital Gain Distributions Received | .0021 | .003 | .005 | .001 | .0111 |
| Net Realized and Unrealized Gain (Loss) | | | | | |
| on Investments | 4.688 | 2.974 | (1.736) | 3.033 | 3.668 |
| Total from Investment Operations | 5.486 | 3.619 | (1.100) | 3.611 | 4.320 |
| Distributions | | | | | |
| Dividends from Net Investment Income | (.654) | (.593) | (.554) | (.477) | (.447) |
| Distributions from Realized Capital Gains | (.002) | (.016) | (.006) | (.004) | (.013) |
| Total Distributions | (.656) | (.609) | (.560) | (.481) | (.460) |
| Net Asset Value, End of Period | $37.98 | $33.15 | $30.14 | $31.80 | $28.67 |
| |
| Total Return2 | 16.86% | 12.13% | -3.58% | 12.69% | 17.73% |
| |
| Ratios/Supplemental Data | | | | | |
| Net Assets, End of Period (Millions) | $5,600 | $3,399 | $2,279 | $1,670 | $915 |
| Ratio of Total Expenses to Average Net Assets | — | — | — | — | — |
| Acquired Fund Fees and Expenses | 0.15% | 0.16% | 0.16% | 0.18% | 0.18% |
| Ratio of Net Investment Income to | | | | | |
| Average Net Assets | 2.26% | 2.27% | 2.17% | 2.22% | 2.39 |
| Portfolio Turnover Rate | 5% | 8% | 18% | 7% | 9% |
1 Calculated based on average shares outstanding.
2 Total returns do not include account service fees that may have applied in the periods shown. Fund prospectuses provide information
about any applicable account service fees.
See accompanying Notes, which are an integral part of the Financial Statements.
48
Target Retirement 2055 Fund
Notes to Financial Statements
Vanguard Target Retirement 2055 Fund is registered under the Investment Company Act of 1940 as an open-end investment company, or mutual fund. The fund follows a balanced investment strategy by investing in selected Vanguard funds to achieve its targeted allocation of assets to U.S. and international stocks, and U.S. and international bonds. Financial statements and other information about each underlying fund are available on vanguard.com.
A. The following significant accounting policies conform to generally accepted accounting principles for U.S. investment companies. The fund consistently follows such policies in preparing its financial statements.
1. Security Valuation: Investments are valued at the net asset value of each underlying Vanguard fund determined as of the close of the New York Stock Exchange (generally 4 p.m., Eastern time) on the valuation date.
2. Federal Income Taxes: The fund intends to continue to qualify as a regulated investment company and distribute all of its taxable income. Management has analyzed the fund’s tax positions taken for all open federal income tax years (September 30, 2014–2017), and has concluded that no provision for federal income tax is required in the fund’s financial statements.
3. Distributions: Distributions to shareholders are recorded on the ex-dividend date.
4. Credit Facility: The fund and certain other funds managed by The Vanguard Group (“Vanguard”) participate in a $3.1 billion committed credit facility provided by a syndicate of lenders pursuant to a credit agreement that may be renewed annually; each fund is individually liable for its borrowings, if any, under the credit facility. Borrowings may be utilized for temporary and emergency purposes, and are subject to the fund’s regulatory and contractual borrowing restrictions. The participating funds are charged administrative fees and an annual commitment fee of 0.10% of the undrawn amount of the facility; these fees are allocated to the funds based on a method approved by the fund’s board of trustees and borne by the funds in which the fund invests (see Note B). Any borrowings under this facility bear interest at a rate based upon the higher of the one-month London Interbank Offered Rate, federal funds effective rate, or overnight bank funding rate plus an agreed-upon spread.
The fund had no borrowings outstanding at September 30, 2017, or at any time during the period then ended.
5. Other: Income and capital gain distributions received are recorded on the ex-dividend date. Security transactions are accounted for on the date securities are bought or sold. Costs used to determine realized gains (losses) on the sale of investment securities are those of the specific securities sold.
B. In accordance with the terms of a Funds’ Service Agreement (the “FSA”) between Vanguard and the fund, Vanguard furnishes to the fund investment advisory, corporate management, administrative, marketing, and distribution services at Vanguard’s cost of operations (as defined by the FSA). These costs of operations are allocated to the fund based on methods and guidelines approved by the board of trustees. The FSA provides that expenses otherwise allocable to Vanguard funds-of-funds may be reduced or eliminated to the extent of savings realized by the underlying Vanguard funds by virtue of being part of a fund-of-funds. Accordingly, all expenses for services provided by Vanguard to the fund and all other expenses incurred by the fund during the period
49
Target Retirement 2055 Fund
ended September 30, 2017, were borne by the underlying Vanguard funds in which the fund invests. The fund’s trustees and officers are also trustees and officers, respectively, of the underlying Vanguard funds, as well as directors and employees, respectively, of Vanguard.
C. Various inputs may be used to determine the value of the fund’s investments. These inputs are summarized in three broad levels for financial statement purposes. The inputs or methodologies used to value securities are not necessarily an indication of the risk associated with investing in those securities.
Level 1—Quoted prices in active markets for identical securities.
Level 2—Other significant observable inputs (including quoted prices for similar securities, interest rates, prepayment speeds, credit risk, etc.).
Level 3—Significant unobservable inputs (including the fund’s own assumptions used to determine the fair value of investments). Any investments valued with significant unobservable inputs are noted on the Statement of Net Assets.
At September 30, 2017, 100% of the market value of the fund’s investments was determined based on Level 1 inputs.
D. Distributions are determined on a tax basis and may differ from net investment income and realized capital gains for financial reporting purposes. Differences may be permanent or temporary. Permanent differences are reclassified among capital accounts in the financial statements to reflect their tax character. Temporary differences arise when certain items of income, expense, gain, or loss are recognized in different periods for financial statement and tax purposes. These differences will reverse at some time in the future. Differences in classification may also result from the treatment of short-term gains as ordinary income for tax purposes.
The fund used a tax accounting practice to treat a portion of the price of capital shares redeemed during the year as distributions from realized capital gains. Accordingly, the fund has reclassified $2,812,000 from undistributed net income to paid-in capital.
For tax purposes, at September 30, 2017, the fund had $71,776,000 of ordinary income available for distribution. The fund used capital loss carryforwards of $885,000 to offset taxable capital gains realized during the year ended September 30, 2017. Capital losses of $1,144,000 realized beginning in fiscal 2012 may be carried forward indefinitely under the Regulated Investment Company Modernization Act of 2010, but must be used before any expiring loss carryforwards.
At September 30, 2017, the cost of investment securities for tax purposes was $4,662,182,000. Net unrealized appreciation of investment securities for tax purposes was $933,174,000, consisting entirely of unrealized gains on securities that had risen in value since their purchase.
50
| | |
| Target Retirement 2055 Fund | | |
| |
| |
| |
| |
| E. Capital shares issued and redeemed were: | | |
| | Year Ended September 30, |
| | 2017 | 2016 |
| | Shares | Shares |
| | (000) | (000) |
| Issued | 66,428 | 49,206 |
| Issued in Lieu of Cash Distributions | 2,199 | 1,497 |
| Redeemed | (23,689) | (23,777) |
| Net Increase (Decrease) in Shares Outstanding | 44,938 | 26,926 |
F. Transactions during the period in affiliated underlying Vanguard funds were as follows:
| | | | | | | | |
| | | | | | Current Period Transactions | |
| Sept. 30, | | Proceeds | | | | | Sept. 30, |
| | 2016 | | from | Realized | Change in | | Capital Gain | 2017 |
| | Market | Purchases | Securities | Net Gain | Unrealized | | Distributions | Market |
| | Value | at Cost | Sold | (Loss) | App. (Dep.) | Income | Received | Value |
| | ($000) | ($000) | ($000) | ($000) | ($000) | ($000) | ($000) | ($000) |
| Vanguard Market | | | | | | | | |
| Liquidity Fund | 4,193 | NA1 | NA1 | (2) | — | 31 | — | 2,448 |
| Vanguard Total | | | | | | | | |
| Bond Market II | | | | | | | | |
| Index Fund | 245,049 | 223,296 | 69,054 | (338) | (5,184) | 7,491 | 278 | 393,769 |
| Vanguard Total | | | | | | | | |
| International Bond | | | | | | | | |
| Index Fund | 95,263 | 70,962 | — | — | (2,181) | 2,090 | — | 164,044 |
| Vanguard Total | | | | | | | | |
| International Stock | | | | | | | | |
| Index Fund | 1,221,202 | 582,605 | 51,629 | — | 258,439 | 45,155 | — | 2,010,617 |
| Vanguard Total | | | | | | | | |
| Stock Market | | | | | | | | |
| Index Fund | 1,837,903 | 925,507 | 99,039 | 1,149 | 358,958 | 45,515 | — | 3,024,478 |
| Total | 3,403,610 | 1,802,370 | 219,722 | 809 | 610,032 | 100,282 | 278 | 5,595,356 |
| 1 Not applicable—purchases and sales are for temporary cash investment purposes. | | | |
G. Management has determined that no material events or transactions occurred subsequent to September 30, 2017, that would require recognition or disclosure in these financial statements.
51
Target Retirement 2060 Fund
Fund Profile
As of September 30, 2017
| |
| Total Fund Characteristics | |
| Ticker Symbol | VTTSX |
| 30-Day SEC Yield | 2.05% |
| Acquired Fund Fees and Expenses1 | 0.16% |
| |
| Allocation to Underlying Vanguard Funds | |
| Vanguard Total Stock Market Index | |
| Fund Investor Shares | 54.1% |
| Vanguard Total International Stock | |
| Index Fund Investor Shares | 35.9 |
| Vanguard Total Bond Market II | |
| Index Fund Investor Shares | 7.0 |
| Vanguard Total International Bond | |
| Index Fund Investor Shares | 3.0 |
| | |
| Total Fund Volatility Measures | |
| | Target 2060 | MSCI US |
| | Composite | Broad Market |
| | Index | Index |
| R-Squared | 1.00 | 0.92 |
| Beta | 0.98 | 0.85 |
These measures show the degree and timing of the fund’s fluctuations compared with the indexes over 36 months.
Fund Asset Allocation
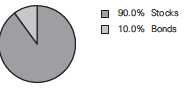
1 This figure—drawn from the prospectus dated July 12, 2017—represents an estimate of the weighted average of the expense ratios and any transaction fees charged by the underlying mutual funds (the ”acquired” funds) in which the Target Retirement 2060 Fund invests. The fund does not charge any expenses or fees of its own. For the fiscal year ended September 30, 2017, the acquired fund fees and expenses were 0.15%.
52
Target Retirement 2060 Fund
Performance Summary
All of the returns in this report represent past performance, which is not a guarantee of future results that may be achieved by the fund. (Current performance may be lower or higher than the performance data cited. For performance data current to the most recent month-end, visit our website at vanguard.com/performance.) Note, too, that both investment returns and principal value can fluctuate widely, so an investor’s shares, when sold, could be worth more or less than their original cost. The returns shown do not reflect taxes that a shareholder would pay on fund distributions or on the sale of fund shares.
Cumulative Performance: January 19, 2012, Through September 30, 2017
Initial Investment of $10,000
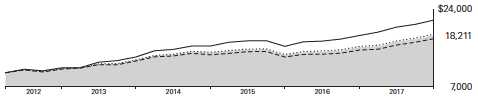
| | | | |
| | Average Annual Total Returns | |
| | Periods Ended September 30, 2017 | |
| | | | Since | Final Value |
| | One | Five | Inception | of a $10,000 |
| | Year | Years | (1/19/2012) | Investment |
| Target Retirement 2060 Fund* | 16.84% | 10.87% | 11.10% | $18,211 |
| Target 2060 Composite Index | 17.01 | 11.16 | 11.36 | 18,458 |
| Spliced Mixed-Asset Target 2055+ | | | | |
| Funds Average | 16.62 | 10.13 | 10.29 | 17,471 |
| MSCI US Broad Market Index | 18.67 | 14.26 | 14.45 | 21,568 |
For a benchmark description, see the Glossary.
"Since Inception" performance is calculated from the inception date for both the fund and its comparative standards.
See Financial Highlights for dividend and capital gains information.
53
Target Retirement 2060 Fund
Fiscal-Year Total Returns (%): January 19, 2012, Through September 30, 2017

54
Target Retirement 2060 Fund
Financial Statements
Statement of Net Assets
As of September 30, 2017
The fund reports a complete list of its holdings in regulatory filings four times in each fiscal year, at the quarter-ends. For the second and fourth fiscal quarters, the lists appear in the fund’s semiannual and annual reports to shareholders. For the first and third fiscal quarters, the fund files the lists with the Securities and Exchange Commission on Form N-Q. Shareholders can look up the fund’s Forms N-Q on the SEC’s website at sec.gov. Forms N-Q may also be reviewed and copied at the SEC’s Public Reference Room (see the back cover of this report for further information).
| | |
| | | Market |
| | | Value• |
| | Shares | ($000) |
| Investment Companies (99.9%) | | |
| U.S. Stock Fund (54.1%) | | |
| Vanguard Total Stock Market Index Fund Investor Shares | 17,859,060 | 1,125,657 |
| |
| International Stock Fund (35.9%) | | |
| Vanguard Total International Stock Index Fund Investor Shares | 42,518,191 | 747,045 |
| |
| U.S. Bond Fund (7.0%) | | |
| 1 Vanguard Total Bond Market II Index Fund Investor Shares | 13,620,782 | 146,423 |
| |
| International Bond Fund (2.9%) | | |
| Vanguard Total International Bond Index Fund Investor Shares | 5,597,792 | 60,960 |
| Total Investment Companies (Cost $1,783,307) | | 2,080,085 |
| Temporary Cash Investment (0.1%) | | |
| Money Market Fund (0.1%) | | |
| 1 Vanguard Market Liquidity Fund, 1.223% (Cost $1,175) | 11,743 | 1,174 |
| Total Investments (100.0%) (Cost $1,784,482) | | 2,081,259 |
| Other Assets and Liabilities (0.0%) | | |
| Other Assets | | 7,089 |
| Liabilities | | (7,830) |
| | | (741) |
| Net Assets (100%) | | |
| Applicable to 62,082,187 outstanding $.001 par value shares of | | |
| beneficial interest (unlimited authorization) | | 2,080,518 |
| Net Asset Value Per Share | | $33.51 |
55
| |
| Target Retirement 2060 Fund | |
| |
| |
| |
| |
| | Amount |
| | ($000) |
| Statement of Assets and Liabilities | |
| Assets | |
| Investments in Securities, at Value—Affiliated Vanguard Funds | 2,081,259 |
| Receivables for Accrued Income | 335 |
| Receivables for Investment Securities Sold | 2,058 |
| Receivables for Capital Shares Issued | 4,696 |
| Total Assets | 2,088,348 |
| Liabilities | |
| Payables for Investment Securities Purchased | 4,766 |
| Payables for Capital Shares Redeemed | 3,064 |
| Total Liabilities | 7,830 |
| Net Assets | 2,080,518 |
| |
| |
| At September 30, 2017, net assets consisted of: | |
| | Amount |
| | ($000) |
| Paid-in Capital | 1,758,022 |
| Undistributed Net Investment Income | 25,857 |
| Accumulated Net Realized Losses | (138) |
| Unrealized Appreciation (Depreciation) | 296,777 |
| Net Assets | 2,080,518 |
• See Note A in Notes to Financial Statements.
1 Affiliated fund available only to Vanguard funds and certain trusts and accounts managed by Vanguard. Rate shown for Vanguard
Market Liquidity Fund is the 7-day yield.
See accompanying Notes, which are an integral part of the Financial Statements.
56
| |
| Target Retirement 2060 Fund | |
| |
| |
| Statement of Operations | |
| |
| | Year Ended |
| | September 30, 2017 |
| | ($000) |
| Investment Income | |
| Income | |
| Income Distributions Received from Affiliated Funds | 35,708 |
| Net Investment Income—Note B | 35,708 |
| Realized Net Gain (Loss) | |
| Capital Gain Distributions Received from Affiliated Funds | 95 |
| Affiliated Investment Securities Sold | 81 |
| Realized Net Gain (Loss) | 176 |
| Change in Unrealized Appreciation (Depreciation) of Investment Securities | 216,221 |
| Net Increase (Decrease) in Net Assets Resulting from Operations | 252,105 |
See accompanying Notes, which are an integral part of the Financial Statements.
57
| | |
| Target Retirement 2060 Fund | | |
| |
| |
| Statement of Changes in Net Assets | | |
| |
| | Year Ended September 30, |
| | 2017 | 2016 |
| | ($000) | ($000) |
| Increase (Decrease) in Net Assets | | |
| Operations | | |
| Net Investment Income | 35,708 | 20,971 |
| Realized Net Gain (Loss) | 176 | 893 |
| Change in Unrealized Appreciation (Depreciation) | 216,221 | 88,315 |
| Net Increase (Decrease) in Net Assets Resulting from Operations | 252,105 | 110,179 |
| Distributions | | |
| Net Investment Income | (24,622) | (14,861) |
| Realized Capital Gain1 | (77) | (591) |
| Total Distributions | (24,699) | (15,452) |
| Capital Share Transactions | | |
| Issued | 1,001,387 | 553,901 |
| Issued in Lieu of Cash Distributions | 24,164 | 15,145 |
| Redeemed | (315,380) | (254,153) |
| Net Increase (Decrease) from Capital Share Transactions | 710,171 | 314,893 |
| Total Increase (Decrease) | 937,577 | 409,620 |
| Net Assets | | |
| Beginning of Period | 1,142,941 | 733,321 |
| End of Period2 | 2,080,518 | 1,142,941 |
1 Includes fiscal 2017 and 2016 short-term gain distributions totaling $77,000 and $325,000 respectively. Short-term gain
distributions are treated as ordinary income dividends for tax purposes.
2 Net Assets—End of Period includes undistributed (overdistributed) net investment income of $25,857,000 and $15,940,000.
See accompanying Notes, which are an integral part of the Financial Statements.
58
| | | | | |
| Target Retirement 2060 Fund | | | | | |
| |
| |
| Financial Highlights | | | | | |
| |
| |
| For a Share Outstanding | | | Year Ended September 30, |
| Throughout Each Period | 2017 | 2016 | 2015 | 2014 | 2013 |
| Net Asset Value, Beginning of Period | $29.25 | $26.58 | $28.03 | $25.21 | $21.74 |
| Investment Operations | | | | | |
| Net Investment Income | .7081 | .555 | .540 | .6151 | . 5811 |
| Capital Gain Distributions Received | .0021 | .003 | .004 | .0011 | .0071 |
| Net Realized and Unrealized Gain (Loss) | | | | | |
| on Investments | 4.126 | 2.635 | (1.523) | 2.572 | 3.203 |
| Total from Investment Operations | 4.836 | 3.193 | (.979) | 3.188 | 3.791 |
| Distributions | | | | | |
| Dividends from Net Investment Income | (.574) | (.503) | (.464) | (.367) | (.315) |
| Distributions from Realized Capital Gains | (.002) | (.020) | (.007) | (.001) | (.006) |
| Total Distributions | (.576) | (.523) | (.471) | (.368) | (.321) |
| Net Asset Value, End of Period | $33.51 | $29.25 | $26.58 | $28.03 | $25.21 |
| |
| Total Return2 | 16.84% | 12.13% | -3.61% | 12.72% | 17.69% |
| |
| Ratios/Supplemental Data | | | | | |
| Net Assets, End of Period (Millions) | $2,081 | $1,143 | $733 | $485 | $217 |
| Ratio of Total Expenses to Average Net Assets | — | — | — | — | — |
| Acquired Fund Fees and Expenses | 0.15% | 0.16% | 0.16% | 0.18% | 0.18% |
| Ratio of Net Investment Income to | | | | | |
| Average Net Assets | 2.28% | 2.28% | 2.19% | 2.25% | 2.45% |
| Portfolio Turnover Rate | 4% | 6% | 21% | 11% | 10% |
1 Calculated based on average shares outstanding.
2 Total returns do not include account service fees that may have applied in the periods shown. Fund prospectuses provide information
about any applicable account service fees.
See accompanying Notes, which are an integral part of the Financial Statements.
59
Target Retirement 2060 Fund
Notes to Financial Statements
Vanguard Target Retirement 2060 Fund is registered under the Investment Company Act of 1940 as an open-end investment company, or mutual fund. The fund follows a balanced investment strategy by investing in selected Vanguard funds to achieve its targeted allocation of assets to U.S. and international stocks, and U.S. and international bonds. Financial statements and other information about each underlying fund are available on vanguard.com.
A. The following significant accounting policies conform to generally accepted accounting principles for U.S. investment companies. The fund consistently follows such policies in preparing its financial statements.
1. Security Valuation: Investments are valued at the net asset value of each underlying Vanguard fund determined as of the close of the New York Stock Exchange (generally 4 p.m., Eastern time) on the valuation date.
2. Federal Income Taxes: The fund intends to continue to qualify as a regulated investment company and distribute all of its taxable income. Management has analyzed the fund’s tax positions taken for all open federal income tax years (September 30, 2014–2017), and has concluded that no provision for federal income tax is required in the fund’s financial statements.
3. Distributions: Distributions to shareholders are recorded on the ex-dividend date.
4. Credit Facility: The fund and certain other funds managed by The Vanguard Group (“Vanguard”) participate in a $3.1 billion committed credit facility provided by a syndicate of lenders pursuant to a credit agreement that may be renewed annually; each fund is individually liable for its borrowings, if any, under the credit facility. Borrowings may be utilized for temporary and emergency purposes, and are subject to the fund’s regulatory and contractual borrowing restrictions. The participating funds are charged administrative fees and an annual commitment fee of 0.10% of the undrawn amount of the facility; these fees are allocated to the funds based on a method approved by the fund’s board of trustees and borne by the funds in which the fund invests (see Note B). Any borrowings under this facility bear interest at a rate based upon the higher of the one-month London Interbank Offered Rate, federal funds effective rate, or overnight bank funding rate plus an agreed-upon spread.
The fund had no borrowings outstanding at September 30, 2017, or at any time during the period then ended.
5. Other: Income and capital gain distributions received are recorded on the ex-dividend date. Security transactions are accounted for on the date securities are bought or sold. Costs used to determine realized gains (losses) on the sale of investment securities are those of the specific securities sold.
B. In accordance with the terms of a Funds’ Service Agreement (the “FSA”) between Vanguard and the fund, Vanguard furnishes to the fund investment advisory, corporate management, administrative, marketing, and distribution services at Vanguard’s cost of operations (as defined by the FSA). These costs of operations are allocated to the fund based on methods and guidelines approved by the board of trustees. The FSA provides that expenses otherwise allocable to Vanguard funds-of-funds may be reduced or eliminated to the extent of savings realized by the underlying Vanguard funds by virtue of being part of a fund-of-funds. Accordingly, all expenses for services provided by Vanguard to the fund and all other expenses incurred by the fund during the
60
Target Retirement 2060 Fund
period ended September 30, 2017, were borne by the underlying Vanguard funds in which the fund invests. The fund’s trustees and officers are also trustees and officers, respectively, of the underlying Vanguard funds, as well as directors and employees, respectively, of Vanguard.
C. Various inputs may be used to determine the value of the fund’s investments. These inputs are summarized in three broad levels for financial statement purposes. The inputs or methodologies used to value securities are not necessarily an indication of the risk associated with investing in those securities.
Level 1—Quoted prices in active markets for identical securities.
Level 2—Other significant observable inputs (including quoted prices for similar securities, interest rates, prepayment speeds, credit risk, etc.).
Level 3—Significant unobservable inputs (including the fund’s own assumptions used to determine the fair value of investments). Any investments valued with significant unobservable inputs are noted on the Statement of Net Assets.
At September 30, 2017, 100% of the market value of the fund’s investments was determined based on Level 1 inputs.
D. Distributions are determined on a tax basis and may differ from net investment income and realized capital gains for financial reporting purposes. Differences may be permanent or temporary. Permanent differences are reclassified among capital accounts in the financial statements to reflect their tax character. Temporary differences arise when certain items of income, expense, gain, or loss are recognized in different periods for financial statement and tax purposes. These differences will reverse at some time in the future. Differences in classification may also result from the treatment of short-term gains as ordinary income for tax purposes.
The fund used a tax accounting practice to treat a portion of the price of capital shares redeemed during the year as distributions from net investment income and realized capital gains. Accordingly, the fund has reclassified $1,169,000 from undistributed net investment income to paid-in capital.
For tax purposes, at September 30, 2017, the fund had $25,856,000 of ordinary income available for distribution. The fund used capital loss carryforwards of $108,000 to offset taxable capital gains realized during the year ended September 30, 2017. Capital losses of $137,000 realized beginning in fiscal 2012 may be carried forward indefinitely under the Regulated Investment Company Modernization Act of 2010, but must be used before any expiring loss carryforwards.
At September 30, 2017, the cost of investment securities for tax purposes was $1,784,482,000. Net unrealized appreciation of investment securities for tax purposes was $296,777,000, consisting entirely of unrealized gains on securities that had risen in value since their purchase.
61
Target Retirement 2060 Fund
E. Capital shares issued and redeemed were:
| | |
| | Year Ended September 30, |
| | 2017 | 2016 |
| | Shares | Shares |
| | (000) | (000) |
| Issued | 32,339 | 20,147 |
| Issued in Lieu of Cash Distributions | 833 | 549 |
| Redeemed | (10,161) | (9,210) |
| Net Increase (Decrease) in Shares Outstanding | 23,011 | 11,486 |
F. Transactions during the period in affiliated underlying Vanguard funds were as follows:
| | | | | | | | |
| | | | | | Current Period Transactions | |
| Sept. 30, | | Proceeds | | | | | Sept. 30, |
| | 2016 | | from | Realized | Change in | | Capital Gain | 2017 |
| | Market | Purchases | Securities | Net Gain | Unrealized | | Distributions | Market |
| | Value | at Cost | Sold | (Loss) | App. (Dep.) | Income | Received | Value |
| | ($000) | ($000) | ($000) | ($000) | ($000) | ($000) | ($000) | ($000) |
| Vanguard Market | | | | | | | | |
| Liquidity Fund | 893 | NA1 | NA1 | — | — | 10 | — | 1,174 |
| Vanguard Total | | | | | | | | |
| Bond Market II | | | | | | | | |
| Index Fund | 82,405 | 89,896 | 24,111 | (113) | (1,654) | 2,658 | 95 | 146,423 |
| Vanguard Total | | | | | | | | |
| International | | | | | | | | |
| Bond Index Fund | 32,213 | 29,463 | — | — | (716) | 719 | — | 60,960 |
| Vanguard Total | | | | | | | | |
| International | | | | | | | | |
| Stock Index Fund | 411,442 | 251,987 | 8,535 | — | 92,151 | 16,129 | — | 747,045 |
| Vanguard Total | | | | | | | | |
| Stock Market | | | | | | | | |
| Index Fund | 617,141 | 405,006 | 23,124 | 194 | 126,440 | 16,192 | — | 1,125,657 |
| Total | 1,144,094 | 776,352 | 55,770 | 81 | 216,221 | 35,708 | 95 | 2,081,259 |
| 1 Not applicable—purchases and sales are for temporary cash investment purposes. | | | |
G. Management has determined that no material events or transactions occurred subsequent to September 30, 2017, that would require recognition or disclosure in these financial statements.
62
Target Retirement 2065 Fund
Fund Profile
As of September 30, 2017
| |
| Total Fund Characteristics | |
| Ticker Symbol | VLXVX |
| 30-Day SEC Yield | 2.05% |
| Acquired Fund Fees and Expenses1 | 0.16% |
| |
| Allocation to Underlying Vanguard Funds | |
| Vanguard Total Stock Market Index | |
| Fund Investor Shares | 53.9% |
| Vanguard Total International Stock | |
| Index Fund Investor Shares | 36.1 |
| Vanguard Total Bond Market II | |
| Index Fund Investor Shares | 7.0 |
| Vanguard Total International Bond | |
| Index Fund Investor Shares | 3.0 |
Fund Asset Allocation
1 This figure—drawn from the prospectus dated July 12, 2017—represents an estimate of the weighted average of the expense ratios and any transaction fees charged by the underlying mutual funds (the ”acquired” funds) in which the Target Retirement 2065 Fund invests. The fund does not charge any expenses or fees of its own. For the fiscal year ended September 30, 2017, the annualized acquired fund fees and expenses were 0.15%.
63
Target Retirement 2065 Fund
Performance Summary
All of the returns in this report represent past performance, which is not a guarantee of future results that may be achieved by the fund. (Current performance may be lower or higher than the performance data cited. For performance data current to the most recent month-end, visit our website at vanguard.com/performance.) Note, too, that both investment returns and principal value can fluctuate widely, so an investor’s shares, when sold, could be worth more or less than their original cost. The returns shown do not reflect taxes that a shareholder would pay on fund distributions or on the sale of fund shares.
Cumulative Performance: July 12, 2017, Through September 30, 2017
Initial Investment of $10,000
| | |
| | Total Returns | |
| | Period Ended September 30, 2017 | |
| | Since | Final Value |
| | Inception | of a $10,000 |
| | (7/12/2017) | Investment |
| Target Retirement 2065 Fund* | 3.95% | $10,395 |
| Target 2065 Composite Index | 3.84 | 10,384 |
| Spliced Mixed-Asset Target 2055+ | | |
| Funds Average | 3.85 | 10,385 |
| MSCI US Broad Market Index | 3.66 | 10,366 |
For a benchmark description, see the Glossary.
"Since Inception" performance is calculated from the inception date for both the fund and its comparative standards.
See Financial Highlights for dividend and capital gains information.
64
Target Retirement 2065 Fund
Fiscal-Period Total Returns (%): July 12, 2017, Through September 30, 2017
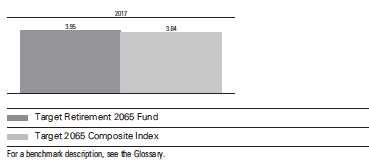
65
Target Retirement 2065 Fund
Financial Statements
Statement of Net Assets
As of September 30, 2017
The fund reports a complete list of its holdings in regulatory filings four times in each fiscal year, at the quarter-ends. For the second and fourth fiscal quarters, the lists appear in the fund’s semiannual and annual reports to shareholders. For the first and third fiscal quarters, the fund files the lists with the Securities and Exchange Commission on Form N-Q. Shareholders can look up the fund’s Forms N-Q on the SEC’s website at sec.gov. Forms N-Q may also be reviewed and copied at the SEC’s Public Reference Room (see the back cover of this report for further information).
| | |
| | | Market |
| | | Value• |
| | Shares | ($000) |
| Investment Companies (99.2%) | | |
| U.S. Stock Fund (53.5%) | | |
| Vanguard Total Stock Market Index Fund Investor Shares | 161,278 | 10,166 |
| |
| International Stock Fund (35.8%) | | |
| Vanguard Total International Stock Index Fund Investor Shares | 386,861 | 6,797 |
| |
| U.S. Bond Funds (6.9%) | | |
| 1 Vanguard Total Bond Market II Index Fund Investor Shares | 122,341 | 1,315 |
| |
| International Bond Fund (3.0%) | | |
| Vanguard Total International Bond Index Fund Investor Shares | 51,771 | 564 |
| Total Investment Companies (Cost $18,504) | | 18,842 |
| Temporary Cash Investment (0.5%) | | |
| Money Market Fund (0.5%) | | |
| 1 Vanguard Market Liquidity Fund, 1.223% (Cost $101) | 1,010 | 101 |
| Total Investments (99.7%) (Cost $18,605) | | 18,943 |
| Other Assets and Liabilities (0.3%) | | |
| Other Assets | | 206 |
| Liabilities | | (156) |
| | | 50 |
| Net Assets (100%) | | |
| Applicable to 913,488 outstanding $.001 par value shares of | | |
| beneficial interest (unlimited authorization) | | 18,993 |
| Net Asset Value Per Share | | $20.79 |
66
| |
| Target Retirement 2065 Fund | |
| |
| |
| |
| |
| | Amount |
| | ($000) |
| Statement of Assets and Liabilities | |
| Assets | |
| Investments in Securities, at Value—Affiliated Vanguard Funds | 18,943 |
| Receivables for Accrued Income | 3 |
| Receivables for Capital Shares Issued | 203 |
| Total Assets | 19,149 |
| Liabilities | |
| Payables for Investment Securities Purchased | 145 |
| Payables for Capital Shares Redeemed | 11 |
| Total Liabilities | 156 |
| Net Assets | 18,993 |
| |
| |
| At September 30, 2017, net assets consisted of: | |
| | Amount |
| | ($000) |
| Paid-in Capital | 18,592 |
| Undistributed Net Investment Income | 73 |
| Accumulated Net Realized Losses | (10) |
| Unrealized Appreciation (Depreciation) | 338 |
| Net Assets | 18,993 |
• See Note A in Notes to Financial Statements.
1 Affiliated fund available only to Vanguard funds and certain trusts and accounts managed by Vanguard. Rate shown for Vanguard
Market Liquidity Fund is the 7-day yield.
See accompanying Notes, which are an integral part of the Financial Statements.
67
| |
| Target Retirement 2065 Fund | |
| |
| |
| Statement of Operations | |
| |
| | July 12, 20171 to |
| | September 30, 2017 |
| | ($000) |
| Investment Income | |
| Income | |
| Income Distributions Received from Affiliated Funds | 73 |
| Net Investment Income—Note B | 73 |
| Realized Net Gain (Loss) | |
| Affiliated Investment Securities Sold | (12) |
| Futures Contracts | 2 |
| Realized Net Gain (Loss) | (10) |
| Change in Unrealized Appreciation (Depreciation) of Investment Securities | 338 |
| Net Increase (Decrease) in Net Assets Resulting from Operations | 401 |
| 1 Inception. | |
See accompanying Notes, which are an integral part of the Financial Statements.
68
| |
| Target Retirement 2065 Fund | |
| |
| |
| Statement of Changes in Net Assets | |
| |
| | July 12, 20171 to |
| | September 30, 2017 |
| | ($000) |
| Increase (Decrease) in Net Assets | |
| Operations | |
| Net Investment Income | 73 |
| Realized Net Gain (Loss) | (10) |
| Change in Unrealized Appreciation (Depreciation) | 338 |
| Net Increase (Decrease) in Net Assets Resulting from Operations | 401 |
| Distributions | |
| Net Investment Income | — |
| Realized Capital Gain | — |
| Total Distributions | — |
| Capital Share Transactions | |
| Issued | 19,735 |
| Issued in Lieu of Cash Distributions | — |
| Redeemed | (1,143) |
| Net Increase (Decrease) from Capital Share Transactions | 18,592 |
| Total Increase (Decrease) | 18,993 |
| Net Assets | |
| Beginning of Period | — |
| End of Period2 | 18,993 |
1 Inception.
2 Net Assets—End of Period includes undistributed (overdistributed) net investment income of $73,000.
See accompanying Notes, which are an integral part of the Financial Statements.
69
| |
| Target Retirement 2065 Fund | |
| |
| |
| Financial Highlights | |
| |
| |
| | July 12, 20171 to |
| For a Share Outstanding Throughout the Period | September 30, 2017 |
| Net Asset Value, Beginning of Period | 20.00 |
| Investment Operations | |
| Net Investment Income2 | .150 |
| Capital Gain Distributions Received 2 | — |
| Net Realized and Unrealized Gain (Loss) on Investments | .640 |
| Total from Investment Operations | .790 |
| Distributions | |
| Dividends from Net Investment Income | — |
| Distributions from Realized Capital Gains | — |
| Total Distributions | — |
| Net Asset Value, End of Period | $20.79 |
| |
| Total Return 3 | 3.95% |
| |
| Ratios/Supplemental Data | |
| Net Assets, End of Period (Millions) | $19 |
| Ratio of Total Expenses to Average Net Assets | — |
| Acquired Fund Fees and Expenses | 0.15%4 |
| Ratio of Net Investment Income to Average Net Assets | 3.30%4 |
| Portfolio Turnover Rate | 29% |
1 Inception.
2 Calculated based on average shares outstanding.
3 Total returns do not include account service fees that may have applied in the periods shown. Fund prospectuses provide information
about any applicable account service fees.
4 Annualized.
See accompanying Notes, which are an integral part of the Financial Statements.
70
Target Retirement 2065 Fund
Notes to Financial Statements
Vanguard Target Retirement 2065 Fund is registered under the Investment Company Act of 1940 as an open-end investment company, or mutual fund. The fund follows a balanced investment strategy by investing in selected Vanguard funds to achieve its targeted allocation of assets to U.S. and international stocks, and U.S. and international bonds. Financial statements and other information about each underlying fund are available on vanguard.com.
A. The following significant accounting policies conform to generally accepted accounting principles for U.S. investment companies. The fund consistently follows such policies in preparing its financial statements.
1. Security Valuation: Investments are valued at the net asset value of each underlying Vanguard fund determined as of the close of the New York Stock Exchange (generally 4 p.m., Eastern time) on the valuation date.
2. Futures Contracts: The fund uses index futures contracts to a limited extent, with the objectives of maintaining full exposure to the stock market, enhancing returns, maintaining liquidity, and minimizing transaction costs. The fund may purchase futures contracts to immediately invest incoming cash in the market, or sell futures in response to cash outflows, thereby simulating a fully invested position in the underlying index while maintaining a cash balance for liquidity. The fund may seek to enhance returns by using futures contracts instead of the underlying securities when futures are believed to be priced more attractively than the underlying securities. The primary risks associated with the use of futures contracts are imperfect correlation between changes in market values of stocks held by the fund and the prices of futures contracts, and the possibility of an illiquid market. Counterparty risk involving futures is mitigated because a regulated clearinghouse is the counterparty instead of the clearing broker. To further mitigate counterparty risk, the fund trades futures contracts on an exchange, monitors the financial strength of its clearing brokers and clearinghouse, and has entered into clearing agreements with its clearing brokers. The clearinghouse imposes initial margin requirements to secure the fund’s performance and requires daily settlement of variation margin representing changes in the market value of each contract.
Futures contracts are valued at their quoted daily settlement prices. The notional amounts of the contracts are not recorded in the Statement of Net Assets. Fluctuations in the value of the contracts are recorded in the Statement of Net Assets as an asset (liability) and in the Statement of Operations as unrealized appreciation (depreciation) until the contracts are closed, when they are recorded as realized futures gains (losses).
During the period ended September 30, 2017, the fund’s average investments in long and short futures contracts represented less than 1% and 0% of net assets, respectively, based on the average of the notional amounts at each quarter-end during the period. The fund had no open futures contracts at September 30, 2017.
3. Federal Income Taxes: The fund intends to continue to qualify as a regulated investment company and distribute all of its taxable income. Management has analyzed the fund’s tax positions taken for all open federal income tax period ended September 30, 2017, and has concluded that no provision for federal income tax is required in the fund’s financial statements.
71
Target Retirement 2065 Fund
4. Distributions: Distributions to shareholders are recorded on the ex-dividend date.
5. Other: Income and capital gain distributions received are recorded on the ex-dividend date. Security transactions are accounted for on the date securities are bought or sold. Costs used to determine realized gains (losses) on the sale of investment securities are those of the specific securities sold.
B. In accordance with the terms of a Funds’ Service Agreement (the “FSA”) between Vanguard and the fund, Vanguard furnishes to the fund investment advisory, corporate management, administrative, marketing, and distribution services at Vanguard’s cost of operations (as defined by the FSA). These costs of operations are allocated to the fund based on methods and guidelines approved by the board of trustees. The FSA provides that expenses otherwise allocable to Vanguard funds-of-funds may be reduced or eliminated to the extent of savings realized by the underlying Vanguard funds by virtue of being part of a fund-of-funds. Accordingly, all expenses for services provided by Vanguard to the fund and all other expenses incurred by the fund during the period ended September 30, 2017, were borne by the underlying Vanguard funds in which the fund invests. The fund’s trustees and officers are also trustees and officers, respectively, of the underlying Vanguard funds, as well as directors and employees, respectively, of Vanguard.
C. Various inputs may be used to determine the value of the fund’s investments. These inputs are summarized in three broad levels for financial statement purposes. The inputs or methodologies used to value securities are not necessarily an indication of the risk associated with investing in those securities.
Level 1—Quoted prices in active markets for identical securities.
Level 2—Other significant observable inputs (including quoted prices for similar securities, interest rates, prepayment speeds, credit risk, etc.).
Level 3—Significant unobservable inputs (including the fund’s own assumptions used to determine the fair value of investments). Any investments valued with significant unobservable inputs are noted on the Statement of Net Assets.
At September 30, 2017, 100% of the market value of the fund’s investments was determined based on Level 1 inputs.
D. Distributions are determined on a tax basis and may differ from net investment income and realized capital gains for financial reporting purposes. Differences may be permanent or temporary. Permanent differences are reclassified among capital accounts in the financial statements to reflect their tax character. Temporary differences arise when certain items of income, expense, gain, or
72
Target Retirement 2065 Fund
loss are recognized in different periods for financial statement and tax purposes. These differences will reverse at some time in the future. Differences in classification may also result from the treatment of short-term gains as ordinary income for tax purposes.
For tax purposes, at September 30, 2017, the fund had $73,000 of ordinary income available for distribution. The fund had available capital losses totaling $10,000 that may be carried forward indefinitely to offset future net capital gains.
At September 30, 2017, the cost of investment securities for tax purposes was $18,605,000. Net unrealized appreciation of investment securities for tax purposes was $338,000, consisting entirely of unrealized gains on securities that had risen in value since their purchase.
| |
| E. Capital shares issued and redeemed were: | |
| | July 12, 20171 to |
| | September 30, 2017 |
| | Shares |
| | (000) |
| Issued | 969 |
| Issued in Lieu of Cash Distributions | — |
| Redeemed | (56) |
| Net Increase (Decrease) in Shares Outstanding | 913 |
| 1 Inception. | |
73
Target Retirement 2065 Fund
| | | | | | | | |
| F. Transactions during the period in affiliated underlying Vanguard funds were as follows: | |
| |
| | | | | | Current Period Transactions | |
| Sept. 30, | | Proceeds | | | | | Sept. 30, |
| | 2016 | | from | Realized | Change in | | Capital Gain | 2017 |
| | Market | Purchases | Securities | Net Gain | Unrealized | | Distributions | Market |
| | Value | at Cost | Sold | (Loss) | App. (Dep.) | Income | Received | Value |
| | ($000) | ($000) | ($000) | ($000) | ($000) | ($000) | ($000) | ($000) |
| Vanguard Market | | | | | | | | |
| Liquidity Fund | — | NA2 | NA 2 | — | — | — | — | 101 |
| Vanguard Total | | | | | | | | |
| Bond Market II | | | | | | | | |
| Index Fund | — | 1,420 | 102 | — | (3) | 4 | — | 1,315 |
| Vanguard Total | | | | | | | | |
| International Bond | | | | | | | | |
| Index Fund | — | 608 | 44 | — | — | — | — | 564 |
| Vanguard Total | | | | | | | | |
| International Stock Index | | | | | | | |
| Fund Investor Shares | — | 7,211 | 524 | (3) | 113 | 32 | — | 6,797 |
| Vanguard Total | | | | | | | | |
| International Stock | | | | | | | | |
| Index Fund ETF Shares3 | — | 583 | 583 | — | — | — | — | — |
| Vanguard Total Stock | | | | | | | | |
| Market Index Fund | | | | | | | | |
| Investor Shares | — | 10,682 | 735 | (9) | 228 | 37 | — | 10,166 |
| Vanguard Total | | | | | | | | |
| Stock Market Index | | | | | | | | |
| Fund ETF Shares3 | — | 1,480 | 1,480 | — | — | — | — | — |
| Total | — | 21,984 | 3,468 | (12) | 338 | 73 | — | 18,943 |
1 Inception.
2 Not applicable—purchases and sales are for temporary cash investment purposes.
3 The fund invested in ETF shares during the period, but sold their positions before the period end.
G. Management has determined that no material events or transactions occurred subsequent to September 30, 2017, that would require recognition or disclosure in these financial statements.
74
Report of Independent Registered Public Accounting Firm
To the Board of Trustees of Vanguard Chester Funds and the Shareholders of Vanguard Target Retirement 2040 Fund, Vanguard Target Retirement 2045 Fund, Vanguard Target Retirement 2050 Fund, Vanguard Target Retirement 2055 Fund, Vanguard Target Retirement 2060 Fund and Vanguard Target Retirement 2065 Fund In our opinion, the accompanying statements of net assets and statements of assets and liabilities, and the related statements of operations and of changes in net assets and the financial highlights present fairly, in all material respects, the financial position of Vanguard Target Retirement 2040 Fund, Vanguard Target Retirement 2045 Fund, Vanguard Target Retirement 2050 Fund, Vanguard Target Retirement 2055 Fund, Vanguard Target Retirement 2060 Fund and Vanguard Target Retirement 2065 Fund (constituting separate portfolios of Vanguard Chester Funds, hereafter referred to as the “Funds”) as of September 30, 2017, the results of operations for the year then ended, the changes in net assets for each of the two years in the period then ended and the financial highlights for each of the five years in the period then ended for Vanguard Target Retirement 2040 Fund, Vanguard Target Retirement 2045 Fund, Vanguard Target Retirement 2050 Fund, Vanguard Target Retirement 2055 Fund and Vanguard Target Retirement 2060 Fund, and the results of operations, the changes in net assets and the financial highlights for the period July 12, 2017 (commencement of operations) through September 30, 2017 for Vanguard Target Retirement 2065 Fund, in conformity with accounting principles generally accepted in the United States of America. These financial statements and financial highlights (hereafter referred to as “financial statements”) are the responsibility of the Funds’ management. Our responsibility is to express an opinion on these financial statements based on our audits. We conducted our audits of these financial statements in accordance with the standards of the Public Company Accounting Oversight Board (United States). Those standards require that we plan and perform the audit to obtain reasonable assurance about whether the financial statements are free of material misstatement. An audit includes examining, on a test basis, evidence supporting the amounts and disclosures in the financial statements, assessing the accounting principles used and significant estimates made by management, and evaluating the overall financial statement presentation. We believe that our audits, which included confirmation of securities as of September 30, 2017 by agreement to the underlying ownership records of the transfer agent, provide a reasonable basis for our opinion.
/s/PricewaterhouseCoopers LLP
Philadelphia, Pennsylvania
November 13, 2017
75
Special 2017 tax information (unaudited) for Vanguard Target Retirement Funds
This information for the fiscal year ended September 30, 2017, is included pursuant to provisions of the Internal Revenue Code.
The funds distributed capital gain dividends (from net long-term capital gains) to shareholders during the fiscal year as follows:
| |
| Fund | ($000) |
| Target Retirement 2040 Fund | 62,104 |
| Target Retirement 2045 Fund | 72,375 |
| Target Retirement 2050 Fund | 8,763 |
| Target Retirement 2055 Fund | — |
| Target Retirement 2060 Fund | — |
| Target Retirement 2065 Fund | — |
For nonresident alien shareholders, 100% of short-term capital gain dividends distributed by the funds are qualified short-term capital gains.
The funds distributed qualified dividend income to shareholders during the fiscal year as follows:
| |
| Fund | ($000) |
| Target Retirement 2040 Fund | 255,055 |
| Target Retirement 2045 Fund | 240,162 |
| Target Retirement 2050 Fund | 143,886 |
| Target Retirement 2055 Fund | 54,638 |
| Target Retirement 2060 Fund | 18,351 |
| Target Retirement 2065 Fund | — |
For corporate shareholders, the percentage of investment income (dividend income plus short-term gains, if any) that qualifies for the dividends-received deduction is as follows:
| |
| Fund | Percentage |
| Target Retirement 2040 Fund | 37.2% |
| Target Retirement 2045 Fund | 38.3 |
| Target Retirement 2050 Fund | 38.7 |
| Target Retirement 2055 Fund | 39.1 |
| Target Retirement 2060 Fund | 39.1 |
| Target Retirement 2065 Fund | 44.9 |
76
The funds designate to shareholders foreign source income and foreign taxes paid as follows:
| | |
| | Foreign Source Income | Foreign Taxes Paid |
| Fund | ($000) | ($000) |
| Target Retirement 2040 Fund | 215,930 | 13,523 |
| Target Retirement 2045 Fund | 201,361 | 12,751 |
| Target Retirement 2050 Fund | 128,145 | 8,125 |
| Target Retirement 2055 Fund | 50,330 | 3,196 |
| Target Retirement 2060 Fund | 17,947 | 1,142 |
| Target Retirement 2065 Fund | — | — |
Shareholders will receive more detailed information with their Form 1099-DIV in January 2018 to determine the calendar-year amounts to be included on their 2017 tax returns.
77
Your Fund’s After-Tax Returns
This table presents returns for your fund both before and after taxes. The after-tax returns are shown in two ways: (1) assuming that an investor owned the fund during the entire period and paid taxes on the fund’s distributions, and (2) assuming that an investor paid taxes on the fund’s distributions and sold all shares at the end of each period.
Calculations are based on the highest individual federal income tax and capital gains tax rates in effect at the times of the distributions and the hypothetical sales. State and local taxes were not considered. After-tax returns reflect any qualified dividend income, using actual prior-year figures and estimates for 2017. (In the example, returns after the sale of fund shares may be higher than those assuming no sale. This occurs when the sale would have produced a capital loss. The calculation assumes that the investor received a tax deduction for the loss.) Please note that your actual after-tax returns will depend on your tax situation and may differ from those shown. Also note that if you own the fund in a tax-deferred account, such as an individual retirement account or a 401(k) plan, this information does not apply to you. Such accounts are not subject to current taxes.
Finally, keep in mind that a fund’s performance—whether before or after taxes—does not guarantee future results.
| | | |
| Average Annual Total Returns: Target Retirement Funds | | | |
| Periods Ended September 30, 2017 | | | |
| | One | Five | Ten |
| | Year | Years | Years |
| Target Retirement 2040 Fund | | | |
| Returns Before Taxes | 16.26% | 10.80% | 5.73% |
| Returns After Taxes on Distributions | 15.52 | 10.18 | 5.21 |
| Returns After Taxes on Distributions and Sale of Fund Shares | 9.53 | 8.44 | 4.45 |
| |
| |
| | One | Five | Ten |
| | Year | Years | Years |
| Target Retirement 2045 Fund | | | |
| Returns Before Taxes | 16.84% | 10.91% | 5.77% |
| Returns After Taxes on Distributions | 16.09 | 10.26 | 5.22 |
| Returns After Taxes on Distributions and Sale of Fund Shares | 9.88 | 8.53 | 4.48 |
| |
| |
| | One | Five | Ten |
| | Year | Years | Years |
| Target Retirement 2050 Fund | | | |
| Returns Before Taxes | 16.84% | 10.91% | 5.78% |
| Returns After Taxes on Distributions | 16.21 | 10.34 | 5.27 |
| Returns After Taxes on Distributions and Sale of Fund Shares | 9.82 | 8.54 | 4.49 |
78
| | | |
| Average Annual Total Returns: Target Retirement Funds | | | |
| Periods Ended September 30, 2017 | | | |
| |
| | | | Since |
| | One | Five | Inception |
| | Year | Years | (8/18/2010) |
| Target Retirement 2055 Fund | | | |
| Returns Before Taxes | 16.86% | 10.88% | 11.27% |
| Returns After Taxes on Distributions | 16.24 | 10.38 | 10.82 |
| Returns After Taxes on Distributions and Sale of Fund Shares | 9.82 | 8.54 | 9.05 |
| |
| | | | Since |
| | One | Five | Inception |
| | Year | Years | (1/19/2012) |
| Target Retirement 2060 Fund | | | |
| Returns Before Taxes | 16.84% | 10.87% | 11.10% |
| Returns After Taxes on Distributions | 16.22 | 10.41 | 10.69 |
| Returns After Taxes on Distributions and Sale of Fund Shares | 9.81 | 8.54 | 8.80 |
The Target Retirement 2065 Fund is not listed because the fund has operated for less than one year.
79
About Your Fund’s Expenses
As a shareholder of the fund, you incur ongoing costs, which include costs for portfolio management, administrative services, and shareholder reports (like this one), among others. Operating expenses, which are deducted from a fund’s gross income, directly reduce the investment return of the fund.
A typical fund’s expenses are expressed as a percentage of its average net assets. The Target Retirement Funds have no direct expenses, but each fund bears its proportionate share of the costs for the underlying funds in which it invests. These indirect expenses make up the acquired fund fees and expenses, also expressed as a percentage of average net assets.
The following examples are intended to help you understand the ongoing cost (in dollars) of investing in your fund and to compare these costs with those of other mutual funds. The examples are based on an investment of $1,000 made at the beginning of the period shown and held for the entire period. The costs were calculated using the acquired fund fees and expenses for each Target Retirement Fund.
The accompanying table illustrates your fund’s costs in two ways:
• Based on actual fund return. This section helps you to estimate the actual expenses that you paid over the period. The ”Ending Account Value“ shown is derived from the fund‘s actual return, and the third column shows the dollar amount that would have been paid by an investor who started with $1,000 in the fund. You may use the information here, together with the amount you invested, to estimate the expenses that you paid over the period.
To do so, simply divide your account value by $1,000 (for example, an $8,600 account value divided by $1,000 = 8.6), then multiply the result by the number given for your fund under the heading ”Expenses Paid During Period.“
• Based on hypothetical 5% yearly return. This section is intended to help you compare your fund‘s costs with those of other mutual funds. It assumes that the fund had a yearly return of 5% before expenses, but that the expense ratio is unchanged. In this case—because the return used is not the fund’s actual return—the results do not apply to your investment. The example is useful in making comparisons because the Securities and Exchange Commission requires all mutual funds to calculate expenses based on a 5% return. You can assess your fund’s costs by comparing this hypothetical example with the hypothetical examples that appear in shareholder reports of other funds.
Note that the expenses shown in the table are meant to highlight and help you compare ongoing costs only and do not reflect transaction costs incurred by the fund for buying and selling securities. Further, the expenses do not include any purchase, redemption, or account service fees described in the fund prospectus. If such fees were applied to your account, your costs would be higher. Your fund does not carry a “sales load.”
The calculations assume no shares were bought or sold during the period. Your actual costs may have been higher or lower, depending on the amount of your investment and the timing of any purchases or redemptions.
You can find more information about the fund’s expenses, including annual expense ratios, in the Financial Statements section of this report. For additional information on operating expenses and other shareholder costs, please refer to your fund’s current prospectus.
80
| | | |
| Six Months Ended September 30, 2017 | | | |
| | Beginning | Ending | Expenses |
| | Account Value | Account Value | Paid During |
| | 3/31/2017 | 9/30/2017 | Period |
| Based on Actual Fund Return | | | |
| Target Retirement 2040 Fund1 | $1,000.00 | $1,162.57 | $0.81 |
| Target Retirement 2045 Fund1 | $1,000.00 | $1,168.36 | $0.82 |
| Target Retirement 2050 Fund1 | $1,000.00 | $1,168.38 | $0.82 |
| Target Retirement 2055 Fund1 | $1,000.00 | $1,168.56 | $0.82 |
| Target Retirement 2060 Fund1 | $1,000.00 | $1,168.38 | $0.82 |
| Target Retirement 2065 Fund2 | $1,000.00 | $1,039.50 | $0.34 |
| Based on Hypothetical 5% Yearly Return | | | |
| Target Retirement 2040 Fund1 | $1,000.00 | $1,024.32 | $0.76 |
| Target Retirement 2045 Fund1 | $1,000.00 | $1,024.32 | $0.76 |
| Target Retirement 2050 Fund1 | $1,000.00 | $1,024.32 | $0.76 |
| Target Retirement 2055 Fund1 | $1,000.00 | $1,024.32 | $0.76 |
| Target Retirement 2060 Fund1 | $1,000.00 | $1,024.32 | $0.76 |
| Target Retirement 2065 Fund2 | $1,000.00 | $1,010.63 | $0.33 |
1 The calculations are based on the acquired fund fees and expenses for the most recent six-month period. The funds’ annualized expense figures for the period are (in order as listed from top to bottom above) 0.15%, 0.15%, 0.15%, 0.15%, and 0.15%. The dollar amounts shown as ”Expenses Paid” are equal to the annualized average weighted expense ratio for the underlying funds multiplied by the average account value over the period, multiplied by the number of days in the most recent six-month period, then divided by the number of days in the most recent 12-month period (183/365).
2 The calculation is based on the acquired fund fees and expenses for the most recent six-month period. The fund’s annualized expense figure for the period is 0.15%. The dollar amount shown as ”Expenses Paid” is equal to the annualized average weighted expense ratio for the underlying funds multiplied by the average account value over the period, multiplied by the number of days in the period since inception July 12, 2017, to September 30, 2017, then divided by the number of days in the 12-month period (81/365).
81
Glossary
30-Day SEC Yield. A fund’s 30-day SEC yield is derived using a formula specified by the U.S. Securities and Exchange Commission. Under the formula, data related to the fund’s security holdings in the previous 30 days are used to calculate the fund’s hypothetical net income for that period, which is then annualized and divided by the fund’s estimated average net assets over the calculation period. For the purposes of this calculation, a security’s income is based on its current market yield to maturity (for bonds), its actual income (for asset-backed securities), or its projected dividend yield (for stocks). Because the SEC yield represents hypothetical annualized income, it will differ—at times significantly—from the fund’s actual experience. As a result, the fund’s income distributions may be higher or lower than implied by the SEC yield.
Acquired Fund Fees and Expenses. Funds that invest in other Vanguard funds incur no direct expenses, but they do bear proportionate shares of the operating, administrative, and advisory expenses of the underlying funds, and they must pay any fees charged by those funds. The figure for acquired fund fees and expenses represents a weighted average of these underlying costs. Acquired is a term that the Securities and Exchange Commission applies to any mutual fund whose shares are owned by another fund.
Beta. A measure of the magnitude of a fund’s past share-price fluctuations in relation to the ups and downs of a given market index. The index is assigned a beta of 1.00. Compared with a given index, a fund with a beta of 1.20 typically would have seen its share price rise or fall by 12% when the index rose or fell by 10%. For this report, beta is based on returns over the past 36 months for both the fund and the index. Note that a fund’s beta should be reviewed in conjunction with its R-squared (see definition). The lower the R-squared, the less correlation there is between the fund and the index, and the less reliable beta is as an indicator of volatility.
Expense Ratio. A fund’s total annual operating expenses expressed as a percentage of the fund’s average net assets. The expense ratio includes management and administrative expenses, but does not include the transaction costs of buying and selling portfolio securities.
Inception Date. The date on which the assets of a fund (or one of its share classes) are first invested in accordance with the fund’s investment objective. For funds with a subscription period, the inception date is the day after that period ends. Investment performance is measured from the inception date.
R-Squared. A measure of how much of a fund’s past returns can be explained by the returns from the market in general, as measured by a given index. If a fund’s total returns were precisely synchronized with an index’s returns, its R-squared would be 1.00. If the fund’s returns bore no relationship to the index’s returns, its R-squared would be 0. For this report, R-squared is based on returns over the past 36 months for both the fund and the index.
Benchmark Information
Spliced Mixed-Asset Target 2055+ Funds Average: Mixed-Asset Target 2050 Funds Average through August 31, 2013; Mixed-Asset Target 2055+ Funds Average thereafter.
82
Target 2040 Composite Index: Derived by applying the fund’s target asset allocation to the results of the following benchmarks: for international stocks of developed markets, the MSCI EAFE Index through December 15, 2010, the MSCI ACWI ex USA IMI Index through June 2, 2013, and the FTSE Global All Cap ex US Index thereafter; for emerging-market stocks, the Select Emerging Markets Index through August 23, 2006, the MSCI Emerging Markets Index through December 15, 2010, the MSCI ACWI ex USA IMI Index through June 2, 2013, and the FTSE Global All Cap ex US Index thereafter; for U.S. bonds, the Bloomberg Barclays U.S. Aggregate Bond Index through December 31, 2009, and the Bloomberg Barclays U.S. Aggregate Float Adjusted Index thereafter; for international bonds, the Bloomberg Barclays Global Aggregate ex-USD Float Adjusted RIC Capped Index beginning June 3, 2013; and for U.S. stocks, the MSCI US Broad Market Index through June 2, 2013, and the CRSP US Total Market Index thereafter. International stock benchmark returns are adjusted for withholding taxes.
Target 2045 Composite Index: Derived by applying the fund’s target asset allocation to the results of the following benchmarks: for international stocks of developed markets, the MSCI EAFE Index through December 15, 2010, the MSCI ACWI ex USA IMI Index through June 2, 2013, and the FTSE Global All Cap ex US Index thereafter; for emerging-market stocks, the Select Emerging Markets Index through August 23, 2006, the MSCI Emerging Markets Index through December 15, 2010, the MSCI ACWI ex USA IMI Index through June 2, 2013, and the FTSE Global All Cap ex US Index thereafter; for U.S. bonds, the Bloomberg Barclays U.S. Aggregate Bond Index through December 31, 2009, and the Bloomberg Barclays U.S. Aggregate Float Adjusted Index thereafter; for international bonds, the Bloomberg Barclays Global Aggregate ex-USD Float Adjusted RIC Capped Index beginning June 3, 2013; and for U.S. stocks, the Dow Jones U.S. Total Stock Market Index (formerly known as the Dow Jones Wilshire 5000 Index) through April 22, 2005, the MSCI US Broad Market Index through June 2, 2013, and the CRSP US Total Market Index thereafter. International stock benchmark returns are adjusted for withholding taxes.
Target 2050 Composite Index: Derived by applying the fund’s target asset allocation to the results of the following benchmarks: for international stocks of developed markets, the MSCI EAFE Index through December 15, 2010, the MSCI ACWI ex USA IMI Index through June 2, 2013, and the FTSE Global All Cap ex US Index thereafter; for emerging-market stocks, the Select Emerging Markets Index through August 23, 2006, the MSCI Emerging Markets Index through December 15, 2010, the MSCI ACWI ex USA IMI Index through June 2, 2013, and the FTSE Global All Cap ex US Index thereafter; for U.S. bonds, the Bloomberg Barclays U.S. Aggregate Bond Index through December 31, 2009, and the Bloomberg Barclays U.S. Aggregate Float Adjusted Index thereafter; for international bonds, the Bloomberg Barclays Global Aggregate ex-USD Float Adjusted RIC Capped Index beginning June 3, 2013; and for U.S. stocks, the MSCI US Broad Market Index through June 2, 2013, and the CRSP US Total Market Index thereafter. International stock benchmark returns are adjusted for withholding taxes.
83
Target 2055 Composite Index: Derived by applying the fund’s target asset allocation to the results of the following benchmarks: for international stocks of developed markets, the MSCI EAFE Index through December 15, 2010, the MSCI ACWI ex USA IMI Index through June 2, 2013, and the FTSE Global All Cap ex US Index thereafter; for emerging-market stocks, the MSCI Emerging Markets Index through December 15, 2010, the MSCI ACWI ex USA IMI Index through June 2, 2013, and the FTSE Global All Cap ex US Index thereafter; for U.S. bonds, the Bloomberg Barclays U.S. Aggregate Float Adjusted Index; for international bonds, the Bloomberg Barclays Global Aggregate ex-USD Float Adjusted RIC Capped Index beginning June 3, 2013; and for U.S. stocks, the MSCI US Broad Market Index through June 2, 2013, and the CRSP US Total Market Index thereafter. International stock benchmark returns are adjusted for withholding taxes.
Target 2060 Composite Index: Derived by applying the fund’s target asset allocation to the results of the following benchmarks: for international stocks of developed markets, the MSCI ACWI ex USA IMI Index through June 2, 2013, and the FTSE Global All Cap ex US Index thereafter; for emerging-market stocks, the MSCI ACWI ex USA IMI Index through June 2, 2013, and the FTSE Global All Cap ex US Index thereafter; for U.S. bonds, the Bloomberg Barclays U.S. Aggregate Float Adjusted Index; for international bonds, the Bloomberg Barclays Global Aggregate ex-USD Float Adjusted RIC Capped Index beginning June 3, 2013; and for U.S. stocks, the MSCI US Broad Market Index through June 2, 2013, and the CRSP US Total Market Index thereafter. International stock benchmark returns are adjusted for withholding taxes.
Target 2065 Composite Index: Derived by applying the Target Retirement 2065 Fund’s target asset allocation to the results of the following benchmarks: the FTSE Global All Cap ex US Index for international stocks, the Bloomberg Barclays U.S. Aggregate Float Adjusted Index for U.S. bonds, the Bloomberg Barclays Global Aggregate ex-USD Float Adjusted RIC Capped Index for international bonds, and the CRSP US Total Market Index for U.S. stocks. International stock benchmark returns are adjusted for withholding taxes.
84
BLOOMBERG is a trademark and service mark of Bloomberg Finance L.P. BARCLAYS is a trademark and service mark of Barclays Bank Plc, used under license. Bloomberg Finance L.P. and its affiliates, including Bloomberg Index Services Limited (BISL) (collectively, Bloomberg), or Bloomberg’s licensors, own all proprietary rights in the Bloomberg Barclays U.S. Aggregate Bond Index, Bloomberg Barclays U.S. Aggregate Float Adjusted Index, and the Bloomberg Barclays Global Aggregate ex-USD Float Adjusted RIC Capped Index (USD Hedged) (the Indices or Bloomberg Barclays Indices).
Neither Barclays Bank Plc, Barclays Capital Inc., or any affiliate (collectively Barclays) or Bloomberg is the issuer or producer of the Target Retirement Funds (including the Total Bond Market II Index Fund and the Total International Bond Index Fund) and neither Bloomberg nor Barclays has any responsibilities, obligations or duties to investors in the Target Retirement Funds. The Indices are licensed for use by The Vanguard Group, Inc. (Vanguard) as the sponsor of the Target Retirement Funds. Bloomberg and Barclays’ only relationship with Vanguard in respect to the Indices is the licensing of the Indices, which is determined, composed and calculated by BISL, or any successor thereto, without regard to the Issuer or the Target Retirement Funds or the owners of the Target Retirement Funds.
Additionally, Vanguard may for itself execute transaction(s) with Barclays in or relating to the Indices in connection with the Target Retirement Funds. Investors acquire the Target Retirement Funds from Vanguard and investors neither acquire any interest in the Indices nor enter into any relationship of any kind whatsoever with Bloomberg or Barclays upon making an investment in the Target Retirement Funds. The Target Retirement Funds are not sponsored, endorsed, sold or promoted by Bloomberg or Barclays. Neither Bloomberg nor Barclays makes any representation or warranty, express or implied regarding the advisability of investing in the Target Retirement Funds or the advisability of investing in securities generally or the ability of the Indices to track corresponding or relative market performance. Neither Bloomberg nor Barclays has passed on the legality or suitability of the Target Retirement Funds with respect to any person or entity. Neither Bloomberg nor Barclays is responsible for and has not participated in the determination of the timing of, prices at, or quantities of the Target Retirement Funds to be issued. Neither Bloomberg nor Barclays has any obligation to take the needs of the Issuer or the owners of the Target Retirement Funds or any other third party into consideration in determining, composing or calculating the Indices. Neither Bloomberg nor Barclays has any obligation or liability in connection with administration, marketing or trading of the Target Retirement Funds.
The licensing agreement between Bloomberg and Barclays is solely for the benefit of Bloomberg and Barclays and not for the benefit of the owners of the Target Retirement Funds, investors or other third parties. In addition, the licensing agreement between Vanguard and Bloomberg is solely for the benefit of Vanguard and Bloomberg and not for the benefit of the owners of the Target Retirement Funds, investors or other third parties.
85
NEITHER BLOOMBERG NOR BARCLAYS SHALL HAVE ANY LIABILITY TO THE ISSUER, INVESTORS OR TO OTHER THIRD PARTIES FOR THE QUALITY, ACCURACY AND/OR COMPLETENESS OF THE BLOOMBERG BARCLAYS INDICES OR ANY DATA INCLUDED THEREIN OR FOR INTERRUPTIONS IN THE DELIVERY OF THE BLOOMBERG BARCLAYS INDICES. NEITHER BLOOMBERG NOR BARCLAYS MAKES ANY WARRANTY, EXPRESS OR IMPLIED, AS TO RESULTS TO BE OBTAINED BY THE ISSUER, THE INVESTORS OR ANY OTHER PERSON OR ENTITY FROM THE USE OF THE BLOOMBERG BARCLAYS INDICES OR ANY DATA INCLUDED THEREIN. NEITHER BLOOMBERG NOR BARCLAYS MAKES ANY EXPRESS OR IMPLIED WARRANTIES, AND EACH HEREBY EXPRESSLY DISCLAIMS ALL WARRANTIES OF MERCHANTABILITY
OR FITNESS FOR A PARTICULAR PURPOSE OR USE WITH RESPECT TO BLOOMBERG BARCLAYS INDICES OR ANY DATA INCLUDED THEREIN. BLOOMBERG RESERVES THE RIGHT TO CHANGE THE METHODS OF CALCULATION OR PUBLICATION, OR TO CEASE THE CALCULATION OR PUBLICATION OF THE BLOOMBERG BARCLAYS INDICES, AND NEITHER BLOOMBERG NOR BARCLAYS SHALL BE LIABLE FOR ANY MISCALCULATION OF OR ANY INCORRECT, DELAYED OR INTERRUPTED PUBLICATION WITH RESPECT TO ANY OF THE BLOOMBERG BARCLAYS INDICES. NEITHER BLOOMBERG NOR BARCLAYS SHALL BE LIABLE FOR ANY DAMAGES, INCLUDING, WITHOUT LIMITATION, ANY SPECIAL, INDIRECT OR CONSEQUENTIAL DAMAGES, OR ANY LOST PROFITS AND EVEN IF ADVISED OF THE POSSIBLITY OF SUCH, RESULTING FROM THE USE OF BLOOMBERG BARCLAYS INDICES OR ANY DATA INCLUDED THEREIN OR WITH RESPECT TO THE TARGET RETIREMENT FUNDS.
None of the information supplied by Bloomberg or Barclays and used in this publication may be reproduced in any manner without the prior written permission of both Bloomberg and Barclays Capital, the investment banking division of Barclays Bank Plc. Barclays Bank Plc is registered in England No. 1026167. Registered office 1 Churchill Place London E14 5HP.
© 2017 Bloomberg. Used with Permission.
Source: Bloomberg Index Services Limited. Copyright 2017, Bloomberg. All rights reserved.
86
This page intentionally left blank.
This page intentionally left blank.
This page intentionally left blank.
This page intentionally left blank.
The People Who Govern Your Fund
The trustees of your mutual fund are there to see that the fund is operated and managed in your best interests since, as a shareholder, you are a part owner of the fund. Your fund’s trustees also serve on the board of directors of The Vanguard Group, Inc., which is owned by the Vanguard funds and provides services to them on an at-cost basis.
A majority of Vanguard’s board members are independent, meaning that they have no affiliation with Vanguard or the funds they oversee, apart from the sizable personal investments they have made as private individuals. The independent board members have distinguished backgrounds in business, academia, and public service. Each of the trustees and executive officers oversees 198 Vanguard funds.
Information for each trustee and executive officer of the fund appears below. The mailing address of the trustees and officers is P.O. Box 876, Valley Forge, PA 19482. More information about the trustees is in the Statement of Additional Information, which can be obtained, without charge, by contacting Vanguard at 800-662-7447, or online at vanguard.com.
Interested Trustee1
F. William McNabb III
Born 1957. Trustee Since July 2009. Chairman of the Board. Principal Occupation(s) During the Past Five Years and Other Experience: Chairman of the Board of The Vanguard Group, Inc., and of each of the investment companies served by The Vanguard Group, since January 2010; Chief Executive Officer and Director of The Vanguard Group and President and Chief Executive Officer of each of the investment companies served by The Vanguard Group, since 2008; Director of Vanguard Marketing Corporation; President of The Vanguard Group (2008–2017); Managing Director of The Vanguard Group (1995–2008).
Independent Trustees
Emerson U. Fullwood
Born 1948. Trustee Since January 2008. Principal Occupation(s) During the Past Five Years and Other Experience: Executive Chief Staff and Marketing Officer for North America and Corporate Vice President (retired 2008) of Xerox Corporation (document management products and services);
Executive in Residence and 2009–2010 Distinguished Minett Professor at the Rochester Institute of Technology; Lead Director of SPX FLOW, Inc. (multi-industry manufacturing); Director of the United Way of Rochester, the University of Rochester Medical Center, Monroe Community College Foundation, North Carolina A&T University, and Roberts Wesleyan College; Trustee of the University of Rochester.
Rajiv L. Gupta
Born 1945. Trustee Since December 2001.2 Principal Occupation(s) During the Past Five Years and Other Experience: Chairman and Chief Executive Officer (retired 2009) and President (2006–2008) of Rohm and Haas Co. (chemicals); Director of Arconic Inc. (diversified manufacturer), HP Inc. (printer and personal computer manufacturing), and Delphi Automotive plc (automotive components); Senior Advisor at New Mountain Capital.
Amy Gutmann
Born 1949. Trustee Since June 2006. Principal Occupation(s) During the Past Five Years and Other Experience: President of the University of Pennsylvania; Christopher H. Browne
1 Mr. McNabb is considered an “interested person,” as defined in the Investment Company Act of 1940, because he is an officer of the
Vanguard funds.
2 December 2002 for Vanguard Equity Income Fund, the Vanguard Municipal Bond Funds, and the Vanguard State Tax-Exempt Funds.
Distinguished Professor of Political Science, School of Arts and Sciences, and Professor of Communication, Annenberg School for Communication, with secondary faculty appointments in the Department of Philosophy, School of Arts and Sciences, and at the Graduate School of Education, University of Pennsylvania; Trustee of the National Constitution Center.
JoAnn Heffernan Heisen
Born 1950. Trustee Since July 1998. Principal Occupation(s) During the Past Five Years and Other Experience: Corporate Vice President and Member of the Executive Committee (1997–2008), Chief Global Diversity Officer (retired 2008), Vice President and Chief Information Officer (1997–2006), Controller (1995–1997), Treasurer (1991–1995), and Assistant Treasurer (1989–1991) of Johnson & Johnson (pharmaceuticals/medical devices/ consumer products); Director of Skytop Lodge Corporation (hotels) and the Robert Wood Johnson Foundation; Member of the Advisory Board of the Institute for Women’s Leadership at Rutgers University.
F. Joseph Loughrey
Born 1949. Trustee Since October 2009. Principal Occupation(s) During the Past Five Years and Other Experience: President and Chief Operating Officer (retired 2009) of Cummins Inc. (industrial machinery); Chairman of the Board of Hillenbrand, Inc. (specialized consumer services), Oxfam America, and the Lumina Foundation for Education; Director of the V Foundation for Cancer Research; Member of the Advisory Council for the College of Arts and Letters and Chair of the Advisory Board to the Kellogg Institute for International Studies, both at the University of Notre Dame.
Mark Loughridge
Born 1953. Trustee Since March 2012. Principal Occupation(s) During the Past Five Years and Other Experience: Senior Vice President and Chief Financial Officer (retired 2013) at IBM (information technology services); Fiduciary Member of IBM’s Retirement Plan Committee (2004–2013); Member of the Council on Chicago Booth.
Scott C. Malpass
Born 1962. Trustee Since March 2012. Principal Occupation(s) During the Past Five Years and Other Experience: Chief Investment Officer and Vice President at the University of Notre Dame; Assistant Professor of Finance at the Mendoza College of Business at Notre Dame; Member of the Notre Dame 403(b) Investment Committee, the Board of Advisors for Spruceview Capital Partners, the Board of Catholic Investment Services, Inc. (investment advisor), and the Board of Superintendence of the Institute for the Works of Religion; Chairman of the Board of TIFF Advisory Services, Inc. (investment advisor).
André F. Perold
Born 1952. Trustee Since December 2004. Principal Occupation(s) During the Past Five Years and Other Experience: George Gund Professor of Finance and Banking, Emeritus at the Harvard Business School (retired 2011); Chief Investment Officer and Co-Managing Partner of HighVista Strategies LLC (private investment firm); Overseer of the Museum of Fine Arts Boston.
Peter F. Volanakis
Born 1955. Trustee Since July 2009. Principal Occupation(s) During the Past Five Years and Other Experience: President and Chief Operating Officer (retired 2010) of Corning Incorporated (communications equipment); Chairman of the Board of Trustees of Colby-Sawyer College; Member of the Board of Hypertherm, Inc. (industrial cutting systems, software, and consumables).
Executive Officers
Glenn Booraem
Born 1967. Investment Stewardship Officer Since February 2017. Principal Occupation(s) During the Past Five Years and Other Experience: Principal of The Vanguard Group, Inc.; Treasurer (2015–2017), Controller (2010–2015), and Assistant Controller (2001–2010) of each of the investment companies served by The Vanguard Group.
Thomas J. Higgins
Born 1957. Chief Financial Officer Since September 2008. Principal Occupation(s) During the Past Five Years and Other Experience: Principal of The Vanguard Group, Inc.; Chief Financial Officer of each of the investment companies served by The Vanguard Group; Treasurer of each of the investment companies served by The Vanguard Group (1998–2008).
Peter Mahoney
Born 1974. Controller Since May 2015. Principal Occupation(s) During the Past Five Years and Other Experience: Principal of The Vanguard Group, Inc.; Controller of each of the investment companies served by The Vanguard Group; Head of International Fund Services at The Vanguard Group (2008–2014).
Anne E. Robinson
Born 1970. Secretary Since September 2016. Principal Occupation(s) During the Past Five Years and Other Experience: Managing Director of The Vanguard Group, Inc.; General Counsel of The Vanguard Group; Secretary of The Vanguard Group and of each of the investment companies served by The Vanguard Group; Director and Senior Vice President of Vanguard Marketing Corporation; Managing Director and General Counsel of Global Cards and Consumer Services at Citigroup (2014–2016); Counsel at American Express (2003–2014).
Michael Rollings
Born 1963. Treasurer Since February 2017. Principal Occupation(s) During the Past Five Years and Other Experience: Managing Director of The Vanguard Group, Inc.; Treasurer of each of the investment companies served by The Vanguard Group; Director of Vanguard Marketing Corporation; Executive Vice President and Chief Financial Officer of MassMutual Financial Group (2006–2016).
| |
| Vanguard Senior Management Team |
| |
| Mortimer J. Buckley | Chris D. McIsaac |
| Gregory Davis | James M. Norris |
| John James | Thomas M. Rampulla |
| Martha G. King | Karin A. Risi |
| John T. Marcante | |
| |
| |
| Chairman Emeritus and Senior Advisor |
| |
| John J. Brennan | |
| Chairman, 1996–2009 | |
| Chief Executive Officer and President, 1996–2008 |
| |
| |
| Founder | |
| |
| John C. Bogle | |
| Chairman and Chief Executive Officer, 1974–1996 |
|
|
|  |
| P.O. Box 2600 |
| Valley Forge, PA 19482-2600 |
Connect with Vanguard® > vanguard.com
| |
| Fund Information > 800-662-7447 | |
| Direct Investor Account Services > 800-662-2739 | |
| Institutional Investor Services > 800-523-1036 | |
| Text Telephone for People | |
| Who Are Deaf or Hard of Hearing> 800-749-7273 | |
| |
| This material may be used in conjunction | |
| with the offering of shares of any Vanguard | |
| fund only if preceded or accompanied by | |
| the fund’s current prospectus. | |
| |
| All comparative mutual fund data are from Lipper, a | |
| Thomson Reuters Company, or Morningstar, Inc., unless | |
| otherwise noted. | |
| |
| You can obtain a free copy of Vanguard’s proxy voting | |
| guidelines by visiting vanguard.com/proxyreporting or by | |
| calling Vanguard at 800-662-2739. The guidelines are | |
| also available from the SEC’s website, sec.gov. In | |
| addition, you may obtain a free report on how your fund | |
| voted the proxies for securities it owned during the 12 | |
| months ended June 30. To get the report, visit either | |
| vanguard.com/proxyreporting or sec.gov. | |
| |
| You can review and copy information about your fund at | |
| the SEC’s Public Reference Room in Washington, D.C. To | |
| find out more about this public service, call the SEC at | |
| 202-551-8090. Information about your fund is also | |
| available on the SEC’s website, and you can receive | |
| copies of this information, for a fee, by sending a | |
| request in either of two ways: via email addressed to | |
| publicinfo@sec.gov or via regular mail addressed to the | |
| Public Reference Section, Securities and Exchange | |
| Commission, Washington, DC 20549-1520. | |
| | © 2017 The Vanguard Group, Inc. |
| | All rights reserved. |
| | Vanguard Marketing Corporation, Distributor. |
| |
| | Q3080B 112017 |
 |
| Annual Report | September 30, 2017 |
| |
| Vanguard Institutional Target |
| Retirement Funds |
| Vanguard Institutional Target Retirement Income Fund |
| Vanguard Institutional Target Retirement 2015 Fund |
| Vanguard Institutional Target Retirement 2020 Fund |
| Vanguard Institutional Target Retirement 2025 Fund |
| Vanguard Institutional Target Retirement 2030 Fund |
| Vanguard Institutional Target Retirement 2035 Fund |
Vanguard’s Principles for Investing Success
We want to give you the best chance of investment success. These principles, grounded in Vanguard’s research and experience, can put you on the right path.
Goals. Create clear, appropriate investment goals.
Balance. Develop a suitable asset allocation using broadly diversified funds. Cost. Minimize cost.
Discipline. Maintain perspective and long-term discipline.
A single theme unites these principles: Focus on the things you can control. We believe there is no wiser course for any investor.
| |
| Contents | |
| Your Fund’s Performance at a Glance. | 1 |
| Chairman’s Perspective. | 3 |
| Institutional Target Retirement Income Fund. | 7 |
| Institutional Target Retirement 2015 Fund. | 19 |
| Institutional Target Retirement 2020 Fund. | 31 |
| Institutional Target Retirement 2025 Fund. | 42 |
| Institutional Target Retirement 2030 Fund. | 54 |
| Institutional Target Retirement 2035 Fund. | 65 |
| About Your Fund’s Expenses. | 80 |
| Glossary. | 82 |
Please note: The opinions expressed in this report are just that—informed opinions. They should not be considered promises or advice. Also, please keep in mind that the information and opinions cover the period through the date on the front of this report. Of course, the risks of investing in your fund are spelled out in the prospectus.
See the Glossary for definitions of investment terms used in this report.
About the cover: Nautical images have been part of Vanguard’s rich heritage since its start in 1975. For an incoming ship, a lighthouse offers a beacon and safe path to shore. You can similarly depend on Vanguard to put you first––and light the way––as you strive to meet your financial goals. Our client focus and low costs, stemming from our unique ownership structure, assure that your interests are paramount.
Your Fund’s Performance at a Glance
• For the 12 months ended September 30, 2017, the six Vanguard Institutional Target Retirement Funds covered in this report recorded returns ranging from 5.30% for the Target Retirement Income Fund to 14.85% for the Target Retirement 2035 Fund. (The funds with retirement dates of 2040 through 2065 are covered in a separate report.)
• Each fund posted returns that were in line with those of its benchmark after expenses. And each fund except the Institutional Target Retirement Income Fund and the Institutional Target Retirement 2015 Fund surpassed the average return of its peers.
• Vanguard Target Retirement Funds are designed to reach an allocation of 70% bonds and 30% stocks within seven years after their target dates.
• Please note, during the third quarter the Institutional Target Retirement 2010 Fund was merged with the Institutional Target Retirement Income Fund, as their asset allocations became identical.
| |
| Total Returns: Fiscal Year Ended September 30, 2017 | |
| | Total |
| | Returns |
| Vanguard Institutional Target Retirement Income Fund | 5.30% |
| Target Income Composite Index | 5.44 |
| Mixed-Asset Target Today Funds Average | 5.95 |
| Mixed-Asset Target Today Funds Average: Derived from data provided by Lipper, a Thomson Reuters Company. | |
| |
| Vanguard Institutional Target Retirement 2015 Fund | 8.02% |
| Target 2015 Composite Index | 8.16 |
| Mixed-Asset Target 2015 Funds Average | 8.04 |
| Mixed-Asset Target 2015 Funds Average: Derived from data provided by Lipper, a Thomson Reuters Company. | |
| |
| Vanguard Institutional Target Retirement 2020 Fund | 10.17% |
| Target 2020 Composite Index | 10.32 |
| Mixed-Asset Target 2020 Funds Average | 8.26 |
| Mixed-Asset Target 2020 Funds Average: Derived from data provided by Lipper, a Thomson Reuters Company. | |
| |
| Vanguard Institutional Target Retirement 2025 Fund | 11.85% |
| Target 2025 Composite Index | 11.97 |
| Mixed-Asset Target 2025 Funds Average | 10.44 |
| Mixed-Asset Target 2025 Funds Average: Derived from data provided by Lipper, a Thomson Reuters Company. | |
1
| |
| | Total |
| | Returns |
| Vanguard Institutional Target Retirement 2030 Fund | 13.27% |
| Target 2030 Composite Index | 13.44 |
| Mixed-Asset Target 2030 Funds Average | 12.14 |
| Mixed-Asset Target 2030 Funds Average: Derived from data provided by Lipper, a Thomson Reuters Company. | |
| |
| Vanguard Institutional Target Retirement 2035 Fund | 14.85% |
| Target 2035 Composite Index | 14.94 |
| Mixed-Asset Target 2035 Funds Average | 14.35 |
| Mixed-Asset Target 2035 Funds Average: Derived from data provided by Lipper, a Thomson Reuters Company. | |
| For a benchmark description, see the Glossary. | |
Investments in Target Retirement Funds are subject to the risks of their underlying funds. The year in the fund name refers to the approximate year (the target date) when an investor in the fund would retire and leave the work force. The fund will gradually shift its emphasis from more aggressive investments to more conservative ones based on its target date. An investment in a Target Retirement Fund is not guaranteed at any time, including on or after the target date.
2
Chairman’s Perspective

Bill McNabb
Chairman and Chief Executive Officer
Dear Shareholder,
Our investors depend on Vanguard to be a responsible steward of their assets. This includes our obvious responsibilities—managing the funds, offering investment perspectives and advice, and assisting with questions and transactions.
But because a long-term perspective informs every aspect of our investment approach, we also work on your behalf in less obvious ways, such as by advocating for responsible governance among the companies in which Vanguard funds invest. Vanguard’s index funds are essentially permanent owners of thousands of publicly traded companies, and we have a special obligation to be engaged stewards actively focused on the long term.
Simply put, we believe that well-governed companies are more likely to perform well over the long run.
Although Vanguard has always been an advocate for strong corporate governance, we have expanded our efforts recently as our investor base continues to grow. Our Investment Stewardship team has doubled in size since 2015, and we continue to add analysts, researchers, and operations team members. The team guides our engagement activities and our funds’ proxy voting by analyzing corporate governance practices in companies around the world.
3
Our four Investment Stewardship pillars
As we evaluate company responsiveness to governance matters, including environmental and social concerns, we focus on four key areas—what we call our Investment Stewardship pillars:
• The board: A high-functioning, well-composed, independent, diverse, and experienced board with effective ongoing evaluation practices.
• Governance structures: Provisions and structures that empower shareholders and protect their rights.
• Appropriate compensation: Pay that incentivizes relative outperformance over the long term.
• Risk oversight: Effective, integrated, and ongoing oversight of relevant industry-and company-specific risks.
Guided by these pillars, our Investment Stewardship team conducted more than 950 engagements, or discussions, with company directors and leaders worldwide during the 12 months ended June 30, 2017.
| | | |
| Market Barometer | | | |
| | | Average Annual Total Returns |
| | Periods Ended September 30, 2017 |
| | One Year | Three Years | Five Years |
| Stocks | | | |
| Russell 1000 Index (Large-caps) | 18.54% | 10.63% | 14.27% |
| Russell 2000 Index (Small-caps) | 20.74 | 12.18 | 13.79 |
| Russell 3000 Index (Broad U.S. market) | 18.71 | 10.74 | 14.23 |
| FTSE All-World ex US Index (International) | 19.49 | 5.11 | 7.35 |
| |
| Bonds | | | |
| Bloomberg Barclays U.S. Aggregate Bond Index | | | |
| (Broad taxable market) | 0.07% | 2.71% | 2.06% |
| Bloomberg Barclays Municipal Bond Index | | | |
| (Broad tax-exempt market) | 0.87 | 3.19 | 3.01 |
| Citigroup Three-Month U.S. Treasury Bill Index | 0.64 | 0.28 | 0.18 |
| |
| CPI | | | |
| Consumer Price Index | 2.23% | 1.22% | 1.30% |
4
We also cast more than 171,000 votes on behalf of Vanguard funds at more than 18,000 shareholder meetings.
Gender diversity on boards and climate risk
As we engage with companies, we are devoting increased attention to two specific topics. The first is gender diversity on boards. It’s no secret that the right combination of talent, skills, and experience leads to better results, so we pay close attention to how company boards are structured and managed, and how they evolve.
In recent years, a growing body of research has demonstrated that greater diversity on boards can lead to improved governance and company performance. We are advocating for boards to incorporate diverse perspectives and experience into their strategic planning and decision-making. One example of our commitment to more diverse boards is our participation in the 30% Club, a global coalition working to increase the representation of women in boardrooms and leadership roles.
The second issue is climate risk. We will continue to engage with companies to understand their responses to this risk. Regardless of one’s perspective on the issue, the potential is real for changing regulations, demographics, and consumption behavior to affect business results for companies in many sectors.
We want to ensure that such business and regulatory risks are sufficiently disclosed so investors can value companies appropriately. In the past year, we have voted for shareholder proposals at several energy companies that called for management to improve its climate risk assessment and planning, and we will consider supporting similar proposals if we believe they are beneficial to long-term shareholder value. When a proposal from a shareholder presents a strong case for change, we’re more than willing to fully consider it. And even if the case falls short, these proposals often catalyze a discussion that generates meaningful change over time.
In addition to considering activists’ proposals, we consult research providers and our own network of experts. When we detect material risks to a company’s long-term value (such as bad leadership, poor disclosure, misaligned compensation structures, or threats to shareholder rights), we act with our voice and our vote.
Our stewardship reflects our mission
But we don’t act as independent agents with our own agenda. Every time we speak with a company chairman, CEO, or director, we’re acutely aware of the role we play in representing the economic interests of more than 20 million Vanguard investors. So you can expect us to speak out when we detect threats to the economic interests of our shareholders.
5
We take positions on these matters not because they are inherently good or noble but because they are tied to the long-term economic value of your funds’ investments.
You trust us to represent your interests across the globe. You can be confident we act on that responsibility with the seriousness and dedication it deserves.
To learn more about our Investment Stewardship program, including how our funds have voted, visit https://about. vanguard.com/investment-stewardship/.
As always, thank you for investing with Vanguard.
Sincerely,

F. William McNabb III
Chairman and Chief Executive Officer
October 13, 2017
6
Institutional Target Retirement Income Fund
Fund Profile
As of September 30, 2017
| |
| Total Fund Characteristics | |
| Ticker Symbol | VITRX |
| 30-Day SEC Yield | 1.87% |
| Acquired Fund Fees and Expenses1 | 0.09% |
| |
| Allocation to Underlying Vanguard Funds | |
| Vanguard Total Bond Market II | |
| Index Fund Investor Shares | 37.7% |
| Vanguard Total Stock Market Index | |
| Fund Institutional Shares | 18.1 |
| Vanguard Short-Term | |
| Inflation-Protected Securities Index | |
| Fund Admiral Shares | 16.7 |
| Vanguard Total International Bond | |
| Index Fund Admiral Shares | 15.5 |
| Vanguard Total International Stock | |
| Index Fund Investor Shares | 12.0 |
Fund Asset Allocation

1 This figure—drawn from the prospectus dated July 12, 2017—represents an estimate of the weighted average of the expense ratios and any transaction fees charged by the underlying mutual funds (the ”acquired” funds) in which the Institutional Target Retirement Income Fund invests. The fund does not charge any expenses or fees of its own. For the fiscal year ended September 30, 2017, the annualized acquired fund fees and expenses were 0.09%.
7
Institutional Target Retirement Income Fund
Performance Summary
All of the returns in this report represent past performance, which is not a guarantee of future results that may be achieved by the fund. (Current performance may be lower or higher than the performance data cited. For performance data current to the most recent month-end, visit our website at vanguard.com/performance.) Note, too, that both investment returns and principal value can fluctuate widely, so an investor’s shares, when sold, could be worth more or less than their original cost. The returns shown do not reflect taxes that a shareholder would pay on fund distributions or on the sale of fund shares.
Cumulative Performance: June 26, 2015, Through September 30, 2017
Initial Investment of $100,000,000
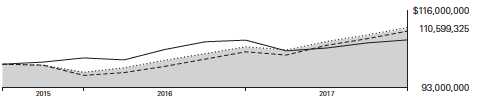
| | | |
| | Average Annual Total Returns | |
| | Periods Ended September 30, 2017 | |
| | | Since | Final Value |
| | One | Inception | of a $100,000,000 |
| | Year | (6/26/2015) | Investment |
| Institutional Target Retirement Income | | | |
| Fund* | 5.30% | 4.55% | $110,599,325 |
| Target Income Composite Index | 5.44 | 4.68 | 110,912,895 |
| Mixed-Asset Target Today Funds | | | |
| Average | 5.95 | 4.24 | 109,854,353 |
| Bloomberg Barclays U.S. Aggregate | | | |
| Bond Index | 0.07 | 3.13 | 107,232,572 |
For a benchmark description, see the Glossary.
Mixed-Asset Target Today Funds Average: Derived from data provided by Lipper, a Thomson Reuters Company.
"Since Inception" performance is calculated from the fund's inception date for both the fund and its comparative standards.
See Financial Highlights for dividend and capital gains information.
8
Institutional Target Retirement Income Fund
Fiscal-Year Total Returns (%): June 26, 2015, Through September 30, 2017
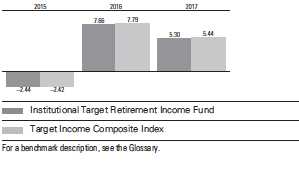
9
Institutional Target Retirement Income Fund
Financial Statements
Statement of Net Assets
As of September 30, 2017
The fund reports a complete list of its holdings in regulatory filings four times in each fiscal year, at the quarter-ends. For the second and fourth fiscal quarters, the lists appear in the fund’s semiannual and annual reports to shareholders. For the first and third fiscal quarters, the fund files the lists with the Securities and Exchange Commission on Form N-Q. Shareholders can look up the fund’s Forms N-Q on the SEC’s website at sec.gov. Forms N-Q may also be reviewed and copied at the SEC’s Public Reference Room (see the back cover of this report for further information).
| | |
| | | Market |
| | | Value• |
| | Shares | ($000) |
| Investment Companies (99.8%) | | |
| U.S. Stock Fund (18.1%) | | |
| Vanguard Total Stock Market Index Fund Institutional Shares | 14,453,855 | 911,460 |
| |
| International Stock Fund (11.9%) | | |
| Vanguard Total International Stock Index Fund Investor Shares | 34,204,705 | 600,976 |
| |
| U.S. Bond Funds (54.3%) | | |
| 1 Vanguard Total Bond Market II Index Fund Investor Shares | 176,330,147 | 1,895,549 |
| Vanguard Short-Term Inflation-Protected Securities Index Fund | | |
| Admiral Shares | 33,950,651 | 841,637 |
| | | 2,737,186 |
| International Bond Fund (15.5%) | | |
| Vanguard Total International Bond Index Fund Admiral Shares | 35,792,465 | 779,202 |
| Total Investment Companies (Cost $4,748,773) | | 5,028,824 |
| Temporary Cash Investment (0.0%) | | |
| Money Market Fund (0.0%) | | |
| 1 Vanguard Market Liquidity Fund, 1.223% (Cost $1,358) | 13,575 | 1,358 |
| Total Investments (99.8%) (Cost $4,750,131) | | 5,030,182 |
| Other Assets and Liabilities (0.2%) | | |
| Other Assets | | 52,719 |
| Liabilities | | (43,910) |
| | | 8,809 |
| Net Assets (100%) | | |
| Applicable to 236,872,312 outstanding $.001 par value shares of | | |
| beneficial interest (unlimited authorization) | | 5,038,991 |
| Net Asset Value Per Share | | $21.27 |
10
| |
| Institutional Target Retirement Income Fund | |
| |
| |
| |
| |
| | Amount |
| | ($000) |
| Statement of Assets and Liabilities | |
| Assets | |
| Investments in Securities, at Value—Affiliated Vanguard Funds | 5,030,182 |
| Receivables for Accrued Income | 4,419 |
| Receivables for Capital Shares Issued | 48,295 |
| Other Assets | 5 |
| Total Assets | 5,082,901 |
| Liabilities | |
| Payables for Investment Securities Purchased | 22,044 |
| Payables for Capital Shares Redeemed | 21,866 |
| Total Liabilities | 43,910 |
| Net Assets | 5,038,991 |
| |
| |
| At September 30, 2017, net assets consisted of: | |
| | Amount |
| | ($000) |
| Paid-in Capital | 4,756,163 |
| Undistributed Net Investment Income | 2,096 |
| Accumulated Net Realized Gains | 681 |
| Unrealized Appreciation (Depreciation) | 280,051 |
| Net Assets | 5,038,991 |
• See Note A in Notes to Financial Statements.
1 Affiliated fund available only to Vanguard funds and certain trusts and accounts managed by Vanguard. Rate shown for Vanguard
Market Liquidity Fund is the 7-day yield.
See accompanying Notes, which are an integral part of the Financial Statements.
11
| |
| Institutional Target Retirement Income Fund | |
| |
| |
| Statement of Operations | |
| |
| | Year Ended |
| | September 30, 2017 |
| | ($000) |
| Investment Income | |
| Income | |
| Income Distributions Received from Affiliated Funds | 55,222 |
| Other Income | 33 |
| Net Investment Income—Note B | 55,255 |
| Realized Net Gain (Loss) | |
| Capital Gain Distributions Received from Affiliated Funds | 844 |
| Affiliated Investment Securities Sold | 1,655 |
| Realized Net Gain (Loss) | 2,499 |
| Change in Unrealized Appreciation (Depreciation) of Investment Securities | 99,003 |
| Net Increase (Decrease) in Net Assets Resulting from Operations | 156,757 |
See accompanying Notes, which are an integral part of the Financial Statements.
12
| | |
| Institutional Target Retirement Income Fund | | |
| |
| |
| Statement of Changes in Net Assets | | |
| |
| | Year Ended September 30, |
| | 2017 | 2016 |
| | ($000) | ($000) |
| Increase (Decrease) in Net Assets | | |
| Operations | | |
| Net Investment Income | 55,255 | 28,797 |
| Realized Net Gain (Loss) | 2,499 | 661 |
| Change in Unrealized Appreciation (Depreciation) | 99,003 | 87,221 |
| Net Increase (Decrease) in Net Assets Resulting from Operations | 156,757 | 116,679 |
| Distributions | | |
| Net Investment Income | (54,657) | (27,795) |
| Realized Capital Gain1 | (952) | (68) |
| Total Distributions | (55,609) | (27,863) |
| Capital Share Transactions | | |
| Issued | 1,997,355 | 1,311,304 |
| Issued in Connection with Acquisition of | | |
| Vanguard Institutional Target Retirement 2010 Fund—Note F | 1,874,542 | — |
| Issued in Lieu of Cash Distributions | 55,149 | 27,701 |
| Redeemed | (1,019,703) | (240,274) |
| Net Increase (Decrease) from Capital Share Transactions | 2,907,343 | 1,098,731 |
| Total Increase (Decrease) | 3,008,491 | 1,187,547 |
| Net Assets | | |
| Beginning of Period | 2,030,500 | 842,953 |
| End of Period2 | 5,038,991 | 2,030,500 |
1 Includes fiscal 2017 and 2016 short-term gain distributions totaling $688,000 and $68,000, respectively. Short-term gain
distributions are treated as ordinary income dividends for tax purposes.
2 Net Assets—End of Period includes undistributed (overdistributed) net investment income of $2,096,000 and $1,498,000.
See accompanying Notes, which are an integral part of the Financial Statements.
13
| | | |
| Institutional Target Retirement Income Fund | | | |
| |
| |
| Financial Highlights | | | |
| |
| |
| | | | June 26, |
| | Year Ended | 20151 to |
| | September 30, | Sept. 30, |
| For a Share Outstanding Throughout Each Period | 2017 | 2016 | 2015 |
| Net Asset Value, Beginning of Period | $20.60 | $19.46 | $20.00 |
| Investment Operations | | | |
| Net Investment Income | . 404 2 | .341 | .1112 |
| Capital Gain Distributions Received | .006 2 | .010 | — |
| Net Realized and Unrealized Gain (Loss) on Investments | .667 | 1.127 | (.599) |
| Total from Investment Operations | 1.077 | 1.478 | (.488) |
| Distributions | | | |
| Dividends from Net Investment Income | (.398) | (.337) | (.052) |
| Distributions from Realized Capital Gains | (.009) | (.001) | — |
| Total Distributions | (.407) | (.338) | (.052) |
| Net Asset Value, End of Period | $21.27 | $20.60 | $19.46 |
| |
| Total Return | 5.30% | 7.66% | -2.44% |
| |
| Ratios/Supplemental Data | | | |
| Net Assets, End of Period (Millions) | $5,039 | $2,031 | $843 |
| Ratio of Total Expenses to Average Net Assets | — | — | — |
| Acquired Fund Fees and Expenses | 0.09% | 0.09% | 0.10%3 |
| Ratio of Net Investment Income to Average Net Assets | 1.94% | 1.83% | 1.99%3 |
| Portfolio Turnover Rate | 7% | 7% | 1% |
1 Inception.
2 Calculated based on average shares outstanding.
3 Annualized.
See accompanying Notes, which are an integral part of the Financial Statements.
14
Institutional Target Retirement Income Fund
Notes to Financial Statements
Vanguard Institutional Target Retirement Income Fund is registered under the Investment Company Act of 1940 as an open-end investment company, or mutual fund. The fund follows a balanced investment strategy by investing in selected Vanguard funds to achieve its targeted allocation of assets to U.S. and international stocks, and U.S. and international bonds. Financial statements and other information about each underlying fund are available on vanguard.com.
A. The following significant accounting policies conform to generally accepted accounting principles for U.S. investment companies. The fund consistently follows such policies in preparing its financial statements.
1. Security Valuation: Investments are valued at the net asset value of each underlying Vanguard fund determined as of the close of the New York Stock Exchange (generally 4 p.m., Eastern time) on the valuation date.
2. Federal Income Taxes: The fund intends to continue to qualify as a regulated investment company and distribute all of its taxable income. Management has analyzed the fund’s tax positions taken for all open federal income tax years (September 30, 2015–2017), and has concluded that no provision for federal income tax is required in the fund’s financial statements.
3. Distributions: Distributions to shareholders are recorded on the ex-dividend date.
4. Credit Facility: The fund and certain other funds managed by The Vanguard Group (“Vanguard”) participate in a $3.1 billion committed credit facility provided by a syndicate of lenders pursuant to a credit agreement that may be renewed annually; each fund is individually liable for its borrowings, if any, under the credit facility. Borrowings may be utilized for temporary and emergency purposes, and are subject to the fund’s regulatory and contractual borrowing restrictions. The participating funds are charged administrative fees and an annual commitment fee of 0.10% of the undrawn amount of the facility; these fees are allocated to the funds based on a method approved by the fund’s board of trustees and borne by the funds in which the fund invests (see Note B). Any borrowings under this facility bear interest at a rate based upon the higher of the one-month London Interbank Offered Rate, federal funds effective rate, or overnight bank funding rate plus an agreed-upon spread.
The fund had no borrowings outstanding at September 30, 2017, or at any time during the period then ended.
5. Other: Income and capital gain distributions received are recorded on the ex-dividend date. Security transactions are accounted for on the date securities are bought or sold. Costs used to determine realized gains (losses) on the sale of investment securities are those of the specific securities sold.
15
Institutional Target Retirement Income Fund
B. In accordance with the terms of a Funds’ Service Agreement (the “FSA”) between Vanguard and the fund, Vanguard furnishes to the fund investment advisory, corporate management, administrative, marketing, and distribution services at Vanguard’s cost of operations (as defined by the FSA). These costs of operations are allocated to the fund based on methods and guidelines approved by the board of trustees. The FSA provides that expenses otherwise allocable to Vanguard funds-of-funds may be reduced or eliminated to the extent of savings realized by the underlying Vanguard funds by virtue of being part of a fund-of-funds. Accordingly, all expenses for services provided by Vanguard to the fund and all other expenses incurred by the fund during the period ended September 30, 2017, were borne by the underlying Vanguard funds in which the fund invests. The fund’s trustees and officers are also trustees and officers, respectively, of the underlying Vanguard funds, as well as directors and employees, respectively, of Vanguard.
C. Various inputs may be used to determine the value of the fund’s investments. These inputs are summarized in three broad levels for financial statement purposes. The inputs or methodologies used to value securities are not necessarily an indication of the risk associated with investing in those securities.
Level 1—Quoted prices in active markets for identical securities.
Level 2—Other significant observable inputs (including quoted prices for similar securities, interest rates, prepayment speeds, credit risk, etc.).
Level 3—Significant unobservable inputs (including the fund’s own assumptions used to determine the fair value of investments). Any investments valued with significant unobservable inputs are noted on the Statement of Net Assets.
At September 30, 2017, 100% of the market value of the fund’s investments was determined based on Level 1 inputs.
D. Distributions are determined on a tax basis and may differ from net investment income and realized capital gains for financial reporting purposes. Differences may be permanent or temporary. Permanent differences are reclassified among capital accounts in the financial statements to reflect their tax character. Temporary differences arise when certain items of income, expense, gain, or loss are recognized in different periods for financial statement and tax purposes. These differences will reverse at some time in the future. Differences in classification may also result from the treatment of short-term gains as ordinary income for tax purposes.
For tax purposes, at September 30, 2017, the fund had $2,382,000 of ordinary income and $395,000 of long-term capital gains available for distribution.
At September 30, 2017, the cost of investment securities for tax purposes was $4,750,131,000. Net unrealized appreciation of investment securities for tax purposes was $280,051,000, consisting entirely of unrealized gains on securities that had risen in value since their purchase.
16
| | |
| Institutional Target Retirement Income Fund | | |
| |
| |
| |
| |
| E. Capital shares issued and redeemed were: | | |
| | Year Ended September 30, |
| | 2017 | 2016 |
| | Shares | Shares |
| | (000) | (000) |
| Issued | 95,617 | 65,895 |
| Issued in Connection with Acquisition of Vanguard Institutional | | |
| Target Retirement 2010 Fund | 88,677 | — |
| Issued in Lieu of Cash Distributions | 2,657 | 1,381 |
| Redeemed | (48,625) | (12,038) |
| Net Increase (Decrease) in Shares Outstanding | 138,326 | 55,238 |
At September 30, 2017, one shareholder was the record or beneficial owner of 29% of the fund’s net assets. If the shareholder were to redeem its investment in the fund, the redemption might lead to the realization of taxable capital gains.
F. On July 21, 2017, the fund acquired all the net assets of Vanguard Institutional Target Retirement 2010 Fund pursuant to a plan of reorganization approved by the funds’ board of trustees. The purpose of the transaction was to combine two funds with comparable investment objectives. The acquisition was accomplished by a tax-free exchange of 88,677,000 shares of the fund for 89,056,000 shares of the Vanguard Institutional Target Retirement 2010 Fund outstanding as of the close of business on July 21, 2017. The Vanguard Institutional Target Retirement 2010 Fund’s net assets as of the close of business on July 21, 2017, of $1,874,542,000, including $111,122,000 of unrealized appreciation, were combined with the fund’s net assets. The net assets of the fund immediately before the acquisition were $2,936,988,000. The net assets of the fund immediately following the acquisition were $4,811,530,000.
Assuming that the acquisition had been completed on October 1, 2016, the beginning of the fund’s reporting period, the fund’s pro forma results of operations for the year ended September 30, 2017, would be:
| |
| | ($000) |
| Net Investment Income | 86,895 |
| Realized Net Gain (Loss) | 10,268 |
| Change in Unrealized Appreciation (Depreciation) | 146,955 |
| Net Increase (Decrease) in Net Assets Resulting from Operations | 244,118 |
Because the combined funds have been managed as a single integrated fund since the acquisition was completed, it is not practical to separate the results of operations of Vanguard Institutional Target Retirement 2010 Fund that have been included in the fund’s statement of operations since July 21, 2017.
17
Institutional Target Retirement Income Fund
G. Transactions during the period in affiliated underlying Vanguard funds were as follows:
| | | | | | | | |
| | | | | | Current Period Transactions | |
| Sept. 30, | | Proceeds | | | | | Sept. 30, |
| | 2016 | | from | Realized | Change in | | Capital Gain | 2017 |
| | Market | Purchases | Securities | Net Gain | Unrealized | | Distributions | Market |
| | Value | at Cost | Sold | (Loss) | App. (Dep.) | Income | Received | Value |
| | ($000) | ($000) | ($000) | ($000) | ($000) | ($000) | ($000) | ($000) |
| Vanguard Market | | | | | | | | |
| Liquidity Fund | — | NA1 | NA1 | — | — | 4 | — | 1,358 |
| Vanguard Short-Term | | | | | | | |
| Inflation-Protected | | | | | | | | |
| Securities Index | | | | | | | | |
| Fund | 338,055 | 508,711 | 9,267 | — | 4,138 | 2,620 | — | 841,637 |
| Vanguard Total | | | | | | | | |
| Bond Market II | | | | | | | | |
| Index Fund | 750,039 | 1,254,648 | 92,814 | — | (16,324) | 25,354 | 844 | 1,895,549 |
| Vanguard Total | | | | | | | | |
| International Bond | | | | | | | | |
| Index Fund | 328,408 | 454,542 | 2,401 | — | (1,347) | 7,254 | — | 779,202 |
| Vanguard Total | | | | | | | | |
| International Stock | | | | | | | | |
| Index Fund | 242,762 | 301,861 | 31,067 | 114 | 87,306 | 9,583 | — | 600,976 |
| Vanguard Total Stock | | | | | | | |
| Market Index Fund | 365,313 | 483,817 | 75,563 | 1,541 | 136,352 | 10,407 | — | 911,460 |
| Total | 2,024,577 | 3,003,579 2 | 211,112 | 1,655 | 210,1252 | 55,222 | 844 | 5,030,182 |
1 Not applicable—purchases and sales are for temporary cash investment purposes.
2 Includes securities of $1,754,030,000 and unrealized appreciation of $111,122,000 related to the acquisition of the Vanguard Institutional Target Retirement 2010 Fund. See Note F.
H. Management has determined that no material events or transactions occurred subsequent to September 30, 2017, that would require recognition or disclosure in these financial statements.
18
Institutional Target Retirement 2015 Fund
Fund Profile
As of September 30, 2017
| |
| Total Fund Characteristics | |
| Ticker Symbol | VITVX |
| 30-Day SEC Yield | 1.95% |
| Acquired Fund Fees and Expenses1 | 0.09% |
| |
| Allocation to Underlying Vanguard Funds | |
| Vanguard Total Bond Market II | |
| Index Fund Investor Shares | 32.1% |
| Vanguard Total Stock Market Index | |
| Fund Institutional Shares | 26.1 |
| Vanguard Total International Stock | |
| Index Fund Investor Shares | 17.4 |
| Vanguard Total International Bond | |
| Index Fund Admiral Shares | 13.4 |
| Vanguard Short-Term | |
| Inflation-Protected Securities Index | |
| Fund Admiral Shares | 11.0 |
Fund Asset Allocation

1 This figure—drawn from the prospectus dated July 12, 2017—represents an estimate of the weighted average of the expense ratios and any transaction fees charged by the underlying mutual funds (the ”acquired” funds) in which the Institutional Target Retirement 2015 Fund invests. The fund does not charge any expenses or fees of its own. For the fiscal year ended September 30, 2017, the annualized acquired fund fees and expenses were 0.09%.
19
Institutional Target Retirement 2015 Fund
Performance Summary
All of the returns in this report represent past performance, which is not a guarantee of future results that may be achieved by the fund. (Current performance may be lower or higher than the performance data cited. For performance data current to the most recent month-end, visit our website at vanguard.com/performance.) Note, too, that both investment returns and principal value can fluctuate widely, so an investor’s shares, when sold, could be worth more or less than their original cost. The returns shown do not reflect taxes that a shareholder would pay on fund distributions or on the sale of fund shares.
Cumulative Performance: June 26, 2015, Through September 30, 2017
Initial Investment of $100,000,000
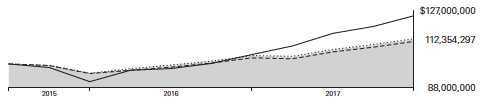
| | | |
| | Average Annual Total Returns | |
| | Periods Ended September 30, 2017 | |
| | | Since | Final Value |
| | One | Inception | of a $100,000,000 |
| | Year | (6/26/2015) | Investment |
| Institutional Target Retirement 2015 | | | |
| Fund* | 8.02% | 5.28% | $112,354,297 |
| Target 2015 Composite Index | 8.16 | 5.44 | 112,723,969 |
| Mixed-Asset Target 2015 Funds | | | |
| Average | 8.04 | 4.86 | 111,347,662 |
| MSCI US Broad Market Index | 18.67 | 10.09 | 124,295,206 |
For a benchmark description, see the Glossary.
Mixed-Asset Target 2015 Funds Average: Derived from data provided by Lipper, a Thomson Reuters Company.
"Since Inception" performance is calculated from the fund's inception date for both the fund and its comparative standards.
See Financial Highlights for dividend and capital gains information.
20
Institutional Target Retirement 2015 Fund
Fiscal-Year Total Returns (%): June 26, 2015, Through September 30, 2017

21
Institutional Target Retirement 2015 Fund
Financial Statements
Statement of Net Assets
As of September 30, 2017
The fund reports a complete list of its holdings in regulatory filings four times in each fiscal year, at the quarter-ends. For the second and fourth fiscal quarters, the lists appear in the fund’s semiannual and annual reports to shareholders. For the first and third fiscal quarters, the fund files the lists with the Securities and Exchange Commission on Form N-Q. Shareholders can look up the fund’s Forms N-Q on the SEC’s website at sec.gov. Forms N-Q may also be reviewed and copied at the SEC’s Public Reference Room (see the back cover of this report for further information).
| | |
| | | Market |
| | | Value• |
| | Shares | ($000) |
| Investment Companies (99.9%) | | |
| U.S. Stock Fund (26.1%) | | |
| Vanguard Total Stock Market Index Fund Institutional Shares | 31,503,750 | 1,986,626 |
| |
| International Stock Fund (17.4%) | | |
| Vanguard Total International Stock Index Fund Investor Shares | 75,333,309 | 1,323,606 |
| |
| U.S. Bond Funds (43.0%) | | |
| 1 Vanguard Total Bond Market II Index Fund Investor Shares | 227,166,972 | 2,442,045 |
| Vanguard Short-Term Inflation-Protected Securities Index Fund | | |
| Admiral Shares | 33,700,391 | 835,433 |
| | | 3,277,478 |
| International Bond Fund (13.4%) | | |
| Vanguard Total International Bond Index Fund Admiral Shares | 46,785,696 | 1,018,525 |
| Total Investment Companies (Cost $6,994,328) | | 7,606,235 |
| Temporary Cash Investment (0.0%) | | |
| Money Market Fund (0.0%) | | |
| 1 Vanguard Market Liquidity Fund, 1.223% (Cost $1) | 14 | 1 |
| Total Investments (99.9%) (Cost $6,994,329) | | 7,606,236 |
| Other Assets and Liabilities (0.1%) | | |
| Other Assets | | 57,098 |
| Liabilities | | (49,114) |
| | | 7,984 |
| Net Assets (100%) | | |
| Applicable to 348,156,852 outstanding $.001 par value shares of | | |
| beneficial interest (unlimited authorization) | | 7,614,220 |
| Net Asset Value Per Share | | $21.87 |
22
| |
| Institutional Target Retirement 2015 Fund | |
| |
| |
| |
| |
| | Amount |
| | ($000) |
| Statement of Assets and Liabilities | |
| Assets | |
| Investments in Securities, at Value—Affiliated Vanguard Funds | 7,606,236 |
| Receivables for Investment Securities Sold | 9,817 |
| Receivables for Accrued Income | 5,726 |
| Receivables for Capital Shares Issued | 41,555 |
| Total Assets | 7,663,334 |
| Liabilities | |
| Payables for Investment Securities Purchased | 7,825 |
| Payables for Capital Shares Redeemed | 37,371 |
| Other Liabilities | 3,918 |
| Total Liabilities | 49,114 |
| Net Assets | 7,614,220 |
| |
| |
| At September 30, 2017, net assets consisted of: | |
| | Amount |
| | ($000) |
| Paid-in Capital | 6,903,956 |
| Undistributed Net Investment Income | 92,190 |
| Accumulated Net Realized Gains | 6,167 |
| Unrealized Appreciation (Depreciation) | 611,907 |
| Net Assets | 7,614,220 |
• See Note A in Notes to Financial Statements.
1 Affiliated fund available only to Vanguard funds and certain trusts and accounts managed by Vanguard. Rate shown for Vanguard
Market Liquidity Fund is the 7-day yield.
See accompanying Notes, which are an integral part of the Financial Statements.
23
| |
| Institutional Target Retirement 2015 Fund | |
| |
| |
| Statement of Operations | |
| |
| | Year Ended |
| | September 30, 2017 |
| | ($000) |
| Investment Income | |
| Income | |
| Income Distributions Received from Affiliated Funds | 141,091 |
| Net Investment Income—Note B | 141,091 |
| Realized Net Gain (Loss) | |
| Capital Gain Distributions Received from Affiliated Funds | 2,041 |
| Affiliated Investment Securities Sold | 6,498 |
| Futures Contracts | 15 |
| Realized Net Gain (Loss) | 8,554 |
| Change in Unrealized Appreciation (Depreciation) of Investment Securities | 393,230 |
| Net Increase (Decrease) in Net Assets Resulting from Operations | 542,875 |
See accompanying Notes, which are an integral part of the Financial Statements.
24
| | |
| Institutional Target Retirement 2015 Fund | | |
| |
| |
| Statement of Changes in Net Assets | | |
| |
| | Year Ended September 30, |
| | 2017 | 2016 |
| | ($000) | ($000) |
| Increase (Decrease) in Net Assets | | |
| Operations | | |
| Net Investment Income | 141,091 | 97,172 |
| Realized Net Gain (Loss) | 8,554 | 1,159 |
| Change in Unrealized Appreciation (Depreciation) | 393,230 | 317,514 |
| Net Increase (Decrease) in Net Assets Resulting from Operations | 542,875 | 415,845 |
| Distributions | | |
| Net Investment Income | (115,625) | (31,436) |
| Realized Capital Gain1 | (3,156) | (207) |
| Total Distributions | (118,781) | (31,643) |
| Capital Share Transactions | | |
| Issued | 2,199,372 | 3,476,404 |
| Issued in Lieu of Cash Distributions | 118,060 | 31,604 |
| Redeemed | (1,150,053) | (659,666) |
| Net Increase (Decrease) from Capital Share Transactions | 1,167,379 | 2,848,342 |
| Total Increase (Decrease) | 1,591,473 | 3,232,544 |
| Net Assets | | |
| Beginning of Period | 6,022,747 | 2,790,203 |
| End of Period2 | 7,614,220 | 6,022,747 |
1 Includes fiscal 2017 and 2016 short-term gain distributions totaling $1,791,000 and $207,000, respectively. Short-term gain
distributions are treated as ordinary income dividends for tax purposes.
2 Net Assets—End of Period includes undistributed (overdistributed) net investment income of $92,190,000 and $72,225,000.
See accompanying Notes, which are an integral part of the Financial Statements.
25
| | | |
| Institutional Target Retirement 2015 Fund | | | |
| |
| |
| Financial Highlights | | | |
| |
| |
| | | | June 26, |
| | Year Ended | 20151 to |
| | September 30, | Sept. 30, |
| For a Share Outstanding Throughout Each Period | 2017 | 2016 | 2015 |
| Net Asset Value, Beginning of Period | $20.64 | $19.06 | $20.00 |
| Investment Operations | | | |
| Net Investment Income | . 433 2 | .345 | .1242 |
| Capital Gain Distributions Received | .006 2 | .008 | — |
| Net Realized and Unrealized Gain (Loss) on Investments | 1.182 | 1.380 | (1.064) |
| Total from Investment Operations | 1.621 | 1.733 | (.940) |
| Distributions | | | |
| Dividends from Net Investment Income | (.381) | (.152) | — |
| Distributions from Realized Capital Gains | (.010) | (.001) | — |
| Total Distributions | (.391) | (.153) | — |
| Net Asset Value, End of Period | $21.87 | $20.64 | $19.06 |
| |
| Total Return | 8.02% | 9.14% | -4.70% |
| |
| Ratios/Supplemental Data | | | |
| Net Assets, End of Period (Millions) | $7,614 | $6,023 | $2,790 |
| Ratio of Total Expenses to Average Net Assets | — | — | — |
| Acquired Fund Fees and Expenses | 0.09% | 0.09% | 0.10%3 |
| Ratio of Net Investment Income to Average Net Assets | 2.07% | 2.04% | 2.21%3 |
| Portfolio Turnover Rate | 10% | 10% | 1% |
1 Inception.
2 Calculated based on average shares outstanding.
3 Annualized.
See accompanying Notes, which are an integral part of the Financial Statements.
26
Institutional Target Retirement 2015 Fund
Notes to Financial Statements
Vanguard Institutional Target Retirement 2015 Fund is registered under the Investment Company Act of 1940 as an open-end investment company, or mutual fund. The fund follows a balanced investment strategy by investing in selected Vanguard funds to achieve its targeted allocation of assets to U.S. and international stocks, and U.S. and international bonds. Financial statements and other information about each underlying fund are available on vanguard.com.
A. The following significant accounting policies conform to generally accepted accounting principles for U.S. investment companies. The fund consistently follows such policies in preparing its financial statements.
1. Security Valuation: Investments are valued at the net asset value of each underlying Vanguard fund determined as of the close of the New York Stock Exchange (generally 4 p.m., Eastern time) on the valuation date.
2. Futures Contracts: The fund uses stock and bond futures contracts to a limited extent, with the objectives of maintaining full exposure to the market and maintaining its target asset allocation. The primary risks associated with the use of futures contracts are imperfect correlation between changes in market values of investments held by the fund and the prices of futures contracts, and the possibility of an illiquid market. Counterparty risk involving futures is mitigated because a regulated clearinghouse is the counterparty instead of the clearing broker. To further mitigate counterparty risk, the fund trades futures contracts on an exchange, monitors the financial strength of its clearing brokers and clearinghouse, and has entered into clearing agreements with its clearing brokers. The clearinghouse imposes initial margin requirements to secure the fund’s performance and requires daily settlement of variation margin representing changes in the market value of each contract.
Futures contracts are valued at their quoted daily settlement prices. The notional amounts of the contracts are not recorded in the Statement of Net Assets. Fluctuations in the value of the contracts are recorded in the Statement of Assets and Liabilities as an asset (liability) and in the Statement of Operations as unrealized appreciation (depreciation) until the contracts are closed, when they are recorded as realized futures gains (losses).
During the year ended September 30, 2017, the fund’s average investments in long and short futures contracts represented less than 1% and 0% of net assets, respectively, based on the average of the notional amounts at each quarter-end during the period. The fund had no open futures contracts at September 30, 2017.
3. Federal Income Taxes: The fund intends to continue to qualify as a regulated investment company and distribute all of its taxable income. Management has analyzed the fund’s tax positions taken for all open federal income tax years (September 30, 2015–2017), and has concluded that no provision for federal income tax is required in the fund’s financial statements.
4. Distributions: Distributions to shareholders are recorded on the ex-dividend date.
5. Credit Facility: The fund and certain other funds managed by The Vanguard Group (“Vanguard”) participate in a $3.1 billion committed credit facility provided by a syndicate of lenders pursuant to a credit agreement that may be renewed annually; each fund is individually liable for its borrowings, if any, under the credit facility. Borrowings may be utilized for temporary and emergency purposes, and are subject to the fund’s regulatory and contractual borrowing restrictions. The participating funds are charged administrative fees and an annual commitment fee of 0.10% of the undrawn amount of the facility; these fees are allocated to the funds based on a method approved by the
27
Institutional Target Retirement 2015 Fund
fund’s board of trustees and included in Management and Administrative expenses on the fund’s Statement of Operations. Any borrowings under this facility bear interest at a rate based upon the higher of the one-month London Interbank Offered Rate, federal funds effective rate, or overnight bank funding rate plus an agreed-upon spread.
The fund had no borrowings outstanding at September 30, 2017, or at any time during the period then ended.
6. Other: Income and capital gain distributions received are recorded on the ex-dividend date. Security transactions are accounted for on the date securities are bought or sold. Costs used to determine realized gains (losses) on the sale of investment securities are those of the specific securities sold.
B. In accordance with the terms of a Funds’ Service Agreement (the “FSA”) between Vanguard and the fund, Vanguard furnishes to the fund investment advisory, corporate management, administrative, marketing, and distribution services at Vanguard’s cost of operations (as defined by the FSA). These costs of operations are allocated to the fund based on methods and guidelines approved by the board of trustees. The FSA provides that expenses otherwise allocable to Vanguard funds-of-funds may be reduced or eliminated to the extent of savings realized by the underlying Vanguard funds by virtue of being part of a fund-of-funds. Accordingly, all expenses for services provided by Vanguard to the fund and all other expenses incurred by the fund during the period ended September 30, 2017, were borne by the underlying Vanguard funds in which the fund invests. The fund’s trustees and officers are also trustees and officers, respectively, of the underlying Vanguard funds, as well as directors and employees, respectively, of Vanguard.
C. Various inputs may be used to determine the value of the fund’s investments. These inputs are summarized in three broad levels for financial statement purposes. The inputs or methodologies used to value securities are not necessarily an indication of the risk associated with investing in those securities.
Level 1—Quoted prices in active markets for identical securities.
Level 2—Other significant observable inputs (including quoted prices for similar securities, interest rates, prepayment speeds, credit risk, etc.).
Level 3—Significant unobservable inputs (including the fund’s own assumptions used to determine the fair value of investments). Any investments valued with significant unobservable inputs are noted on the Statement of Net Assets.
At September 30, 2017, 100% of the market value of the fund’s investments was determined based on Level 1 inputs.
28
Institutional Target Retirement 2015 Fund
D. Distributions are determined on a tax basis and may differ from net investment income and realized capital gains for financial reporting purposes. Differences may be permanent or temporary. Permanent differences are reclassified among capital accounts in the financial statements to reflect their tax character. Temporary differences arise when certain items of income, expense, gain, or loss are recognized in different periods for financial statement and tax purposes. These differences will reverse at some time in the future. Differences in classification may also result from the treatment of short-term gains as ordinary income for tax purposes.
The fund used a tax accounting practice to treat a portion of the price of capital shares redeemed during the year as distributions from net investment income and realized capital gains. Accordingly, the fund has reclassified $5,501,000 from undistributed net investment income and $251,000 from accumulated net realized gains to paid-in capital.
For tax purposes, at September 30, 2017, the fund had $94,715,000 of ordinary income and $3,642,000 of long-term capital gains available for distribution.
At September 30, 2017, the cost of investment securities for tax purposes was $6,994,329,000. Net unrealized appreciation of investment securities for tax purposes was $611,907,000, consisting entirely of unrealized gains on securities that had risen in value since their purchase.
| | |
| E. Capital shares issued and redeemed were: | | |
| | Year Ended September 30, |
| | 2017 | 2016 |
| | Shares | Shares |
| | (000) | (000) |
| Issued | 105,356 | 177,151 |
| Issued in Lieu of Cash Distributions | 5,871 | 1,623 |
| Redeemed | (54,838) | (33,396) |
| Net Increase (Decrease) in Shares Outstanding | 56,389 | 145,378 |
At September 30, 2017, one shareholder was the record or beneficial owner of 31% of the fund’s net assets. If the shareholder were to redeem its investment in the fund, the redemption might lead to the realization of taxable capital gains.
29
Institutional Target Retirement 2015 Fund
F. Transactions during the period in affiliated underlying Vanguard funds were as follows:
| | | | | | | | |
| | | | | | Current Period Transactions | |
| Sept. 30, | | Proceeds | | | | | Sept. 30, |
| | 2016 | | from | Realized | Change in | | Capital Gain | 2017 |
| | Market | Purchases | Securities | Net Gain | Unrealized | | Distributions | Market |
| | Value | at Cost | Sold | (Loss) | App. (Dep.) | Income | Received | Value |
| | ($000) | ($000) | ($000) | ($000) | ($000) | ($000) | ($000) | ($000) |
| Vanguard Market | | | | | | | | |
| Liquidity Fund | 56 | NA1 | NA1 | — | — | 7 | — | 1 |
| Vanguard Short-Term | | | | | | | |
| Inflation-Protected | | | | | | | | |
| Securities | 583,720 | 269,197 | 15,995 | — | (1,489) | 4,544 | — | 835,433 |
| Vanguard Total | | | | | | | | |
| Bond Market II | | | | | | | | |
| Index Fund | 1,852,305 | 839,792 | 205,140 | — | (44,912) | 51,381 | 2,041 | 2,442,045 |
| Vanguard Total | | | | | | | | |
| International Bond | | | | | | | | |
| Index Fund | 813,923 | 233,940 | 9,769 | — | (19,569) | 15,216 | — | 1,018,525 |
| Vanguard Total | | | | | | | | |
| International Stock | | | | | | | | |
| Index Fund | 1,106,773 | 173,692 | 145,252 | 796 | 187,597 | 33,730 | — | 1,323,606 |
| Vanguard Total | | | | | | | | |
| Stock Market | | | | | | | | |
| Index Fund | 1,656,707 | 326,677 | 274,063 | 5,702 | 271,603 | 36,213 | — | 1,986,626 |
| Total | 6,013,484 | 1,843,298 | 650,219 | 6,498 | 393,230 | 141,091 | 2,041 | 7,606,236 |
| 1 Not applicable—purchases and sales are for temporary cash investment purposes. | | | |
G. Management has determined that no material events or transactions occurred subsequent to September 30, 2017, that would require recognition or disclosure in these financial statements.
30
Institutional Target Retirement 2020 Fund
Fund Profile
As of September 30, 2017
| |
| Total Fund Characteristics | |
| Ticker Symbol | VITWX |
| 30-Day SEC Yield | 2.05% |
| Acquired Fund Fees and Expenses1 | 0.09% |
| |
| Allocation to Underlying Vanguard Funds | |
| Vanguard Total Stock Market Index | |
| Fund Institutional Shares | 33.3% |
| Vanguard Total Bond Market II | |
| Index Fund Investor Shares | 28.8 |
| Vanguard Total International Stock | |
| Index Fund Investor Shares | 22.0 |
| Vanguard Total International Bond | |
| Index Fund Admiral Shares | 12.1 |
| Vanguard Short-Term | |
| Inflation-Protected Securities Index | |
| Fund Admiral Shares | 3.8 |
Fund Asset Allocation

1 This figure—drawn from the prospectus dated July 12, 2017—represents an estimate of the weighted average of the expense ratios and any transaction fees charged by the underlying mutual funds (the ”acquired” funds) in which the Institutional Target Retirement 2020 Fund invests. The fund does not charge any expenses or fees of its own. For the fiscal year ended September 30, 2017, the annualized acquired fund fees and expenses were 0.09%.
31
Institutional Target Retirement 2020 Fund
Performance Summary
All of the returns in this report represent past performance, which is not a guarantee of future results that may be achieved by the fund. (Current performance may be lower or higher than the performance data cited. For performance data current to the most recent month-end, visit our website at vanguard.com/performance.) Note, too, that both investment returns and principal value can fluctuate widely, so an investor’s shares, when sold, could be worth more or less than their original cost. The returns shown do not reflect taxes that a shareholder would pay on fund distributions or on the sale of fund shares.
Cumulative Performance: June 26, 2015, Through September 30, 2017
Initial Investment of $100,000,000
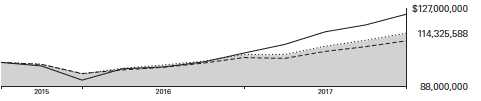
| | | |
| | Average Annual Total Returns | |
| | Periods Ended September 30, 2017 | |
| | | Since | Final Value |
| | One | Inception | of a $100,000,000 |
| | Year | (6/26/2015) | Investment |
| Institutional Target Retirement 2020 | | | |
| Fund* | 10.17% | 6.09% | $114,325,588 |
| Target 2020 Composite Index | 10.32 | 6.26 | 114,736,921 |
| Mixed-Asset Target 2020 Funds | | | |
| Average | 8.26 | 4.67 | 110,890,435 |
| MSCI US Broad Market Index | 18.67 | 10.09 | 124,295,206 |
For a benchmark description, see the Glossary.
Mixed-Asset Target 2020 Funds Average: Derived from data provided by Lipper, a Thomson Reuters Company.
"Since Inception" performance is calculated from the fund's inception date for both the fund and its comparative standards.
See Financial Highlights for dividend and capital gains information.
32
Institutional Target Retirement 2020 Fund
Fiscal-Year Total Returns (%): June 26, 2015, Through September 30, 2017

33
Institutional Target Retirement 2020 Fund
Financial Statements
Statement of Net Assets
As of September 30, 2017
The fund reports a complete list of its holdings in regulatory filings four times in each fiscal year, at the quarter-ends. For the second and fourth fiscal quarters, the lists appear in the fund’s semiannual and annual reports to shareholders. For the first and third fiscal quarters, the fund files the lists with the Securities and Exchange Commission on Form N-Q. Shareholders can look up the fund’s Forms N-Q on the SEC’s website at sec.gov. Forms N-Q may also be reviewed and copied at the SEC’s Public Reference Room (see the back cover of this report for further information).
| | |
| | | Market |
| | | Value• |
| | Shares | ($000) |
| Investment Companies (100.0%) | | |
| U.S. Stock Fund (33.3%) | | |
| Vanguard Total Stock Market Index Fund Institutional Shares | 92,791,412 | 5,851,427 |
| |
| International Stock Fund (22.0%) | | |
| Vanguard Total International Stock Index Fund Investor Shares | 219,811,689 | 3,862,091 |
| |
| U.S. Bond Funds (32.6%) | | |
| 1 Vanguard Total Bond Market II Index Fund Investor Shares | 471,247,472 | 5,065,910 |
| Vanguard Short-Term Inflation-Protected Securities Index Fund | | |
| Admiral Shares | 27,025,326 | 669,958 |
| | | 5,735,868 |
| International Bond Fund (12.1%) | | |
| Vanguard Total International Bond Index Fund Admiral Shares | 97,830,241 | 2,129,764 |
| Total Investment Companies (Cost $15,975,887) | | 17,579,150 |
| Temporary Cash Investment (0.0%) | | |
| Money Market Fund (0.0%) | | |
| 1 Vanguard Market Liquidity Fund, 1.223% (Cost $972) | 9,724 | 973 |
| Total Investments (100.0%) (Cost $15,976,859) | | 17,580,123 |
| Other Assets and Liabilities (0.0%) | | |
| Other Assets | | 197,699 |
| Liabilities | | (191,016) |
| | | 6,683 |
| Net Assets (100%) | | |
| Applicable to 791,063,560 outstanding $.001 par value shares of | | |
| beneficial interest (unlimited authorization) | | 17,586,806 |
| Net Asset Value Per Share | | $22.23 |
34
| |
| Institutional Target Retirement 2020 Fund | |
| |
| |
| |
| |
| | Amount |
| | ($000) |
| Statement of Assets and Liabilities | |
| Assets | |
| Investments in Securities, at Value—Affiliated Vanguard Funds | 17,580,123 |
| Receivables for Investment Securities Sold | 23,731 |
| Receivables for Accrued Income | 11,826 |
| Receivables for Capital Shares Issued | 162,142 |
| Total Assets | 17,777,822 |
| Liabilities | |
| Payables for Investment Securities Purchased | 110,753 |
| Payables for Capital Shares Redeemed | 80,263 |
| Total Liabilities | 191,016 |
| Net Assets | 17,586,806 |
| |
| |
| At September 30, 2017, net assets consisted of: | |
| | Amount |
| | ($000) |
| Paid-in Capital | 15,752,422 |
| Undistributed Net Investment Income | 225,478 |
| Accumulated Net Realized Gains | 5,642 |
| Unrealized Appreciation (Depreciation) | 1,603,264 |
| Net Assets | 17,586,806 |
• See Note A in Notes to Financial Statements.
1 Affiliated fund available only to Vanguard funds and certain trusts and accounts managed by Vanguard. Rate shown for Vanguard
Market Liquidity Fund is the 7-day yield.
See accompanying Notes, which are an integral part of the Financial Statements.
35
| |
| Institutional Target Retirement 2020 Fund | |
| |
| |
| Statement of Operations | |
| |
| | Year Ended |
| | September 30, 2017 |
| | ($000) |
| Investment Income | |
| Income | |
| Income Distributions Received from Affiliated Funds | 319,434 |
| Other Income | 73 |
| Net Investment Income—Note B | 319,507 |
| Realized Net Gain (Loss) | |
| Capital Gain Distributions Received from Affiliated Funds | 3,757 |
| Affiliated Investment Securities Sold | 4,824 |
| Realized Net Gain (Loss) | 8,581 |
| Change in Unrealized Appreciation (Depreciation) of Investment Securities | 1,148,562 |
| Net Increase (Decrease) in Net Assets Resulting from Operations | 1,476,650 |
See accompanying Notes, which are an integral part of the Financial Statements.
36
| | |
| Institutional Target Retirement 2020 Fund | | |
| |
| |
| Statement of Changes in Net Assets | | |
| |
| | Year Ended September 30, |
| | 2017 | 2016 |
| | ($000) | ($000) |
| Increase (Decrease) in Net Assets | | |
| Operations | | |
| Net Investment Income | 319,507 | 197,155 |
| Realized Net Gain (Loss) | 8,581 | 3,648 |
| Change in Unrealized Appreciation (Depreciation) | 1,148,562 | 650,773 |
| Net Increase (Decrease) in Net Assets Resulting from Operations | 1,476,650 | 851,576 |
| Distributions | | |
| Net Investment Income | (237,390) | (60,615) |
| Realized Capital Gain1 | (5,950) | (748) |
| Total Distributions | (243,340) | (61,363) |
| Capital Share Transactions | | |
| Issued | 5,982,661 | 6,547,919 |
| Issued in Lieu of Cash Distributions | 241,218 | 61,249 |
| Redeemed | (1,483,882) | (621,147) |
| Net Increase (Decrease) from Capital Share Transactions | 4,739,997 | 5,988,021 |
| Total Increase (Decrease) | 5,973,307 | 6,778,234 |
| Net Assets | | |
| Beginning of Period | 11,613,499 | 4,835,265 |
| End of Period2 | 17,586,806 | 11,613,499 |
1 Includes fiscal 2017 and 2016 short-term gain distributions totaling $3,279,000 and $374,000, respectively. Short-term gain
distributions are treated as ordinary income dividends for tax purposes.
2 Net Assets—End of Period includes undistributed (overdistributed) net investment income of $225,478,000 and $151,271,000.
See accompanying Notes, which are an integral part of the Financial Statements.
37
| | | |
| Institutional Target Retirement 2020 Fund | | | |
| |
| |
| Financial Highlights | | | |
| |
| |
| | | | June 26, |
| | Year Ended | 20151 to |
| | September 30, | Sept. 30, |
| For a Share Outstanding Throughout Each Period | 2017 | 2016 | 2015 |
| Net Asset Value, Beginning of Period | $20.58 | $18.84 | $20.00 |
| Investment Operations | | | |
| Net Investment Income2 | .464 | .444 | .138 |
| Capital Gain Distributions Received 2 | .005 | .007 | — |
| Net Realized and Unrealized Gain (Loss) on Investments | 1.582 | 1.453 | (1.298) |
| Total from Investment Operations | 2.051 | 1.904 | (1.160) |
| Distributions | | | |
| Dividends from Net Investment Income | (.391) | (.162) | — |
| Distributions from Realized Capital Gains | (.010) | (.002) | — |
| Total Distributions | (.401) | (.164) | — |
| Net Asset Value, End of Period | $22.23 | $20.58 | $18.84 |
| |
| Total Return | 10.17% | 10.16% | -5.80% |
| |
| Ratios/Supplemental Data | | | |
| Net Assets, End of Period (Millions) | $17,587 | $11,613 | $4,835 |
| Ratio of Total Expenses to Average Net Assets | — | — | — |
| Acquired Fund Fees and Expenses | 0.09% | 0.10% | 0.10%3 |
| Ratio of Net Investment Income to Average Net Assets | 2.20% | 2.25% | 2.48%3 |
| Portfolio Turnover Rate | 6% | 5% | 2% |
1 Inception.
2 Calculated based on average shares outstanding.
3 Annualized.
See accompanying Notes, which are an integral part of the Financial Statements.
38
Institutional Target Retirement 2020 Fund
Notes to Financial Statements
Vanguard Institutional Target Retirement 2020 Fund is registered under the Investment Company Act of 1940 as an open-end investment company, or mutual fund. The fund follows a balanced investment strategy by investing in selected Vanguard funds to achieve its targeted allocation of assets to U.S. and international stocks, and U.S. and international bonds. Financial statements and other information about each underlying fund are available on vanguard.com.
A. The following significant accounting policies conform to generally accepted accounting principles for U.S. investment companies. The fund consistently follows such policies in preparing its financial statements.
1. Security Valuation: Investments are valued at the net asset value of each underlying Vanguard fund determined as of the close of the New York Stock Exchange (generally 4 p.m., Eastern time) on the valuation date.
2. Federal Income Taxes: The fund intends to continue to qualify as a regulated investment company and distribute all of its taxable income. Management has analyzed the fund’s tax positions taken for all open federal income tax years (September 30, 2015–2017), and has concluded that no provision for federal income tax is required in the fund’s financial statements.
3. Distributions: Distributions to shareholders are recorded on the ex-dividend date.
4. Credit Facility: The fund and certain other funds managed by The Vanguard Group (“Vanguard”) participate in a $3.1 billion committed credit facility provided by a syndicate of lenders pursuant to a credit agreement that may be renewed annually; each fund is individually liable for its borrowings, if any, under the credit facility. Borrowings may be utilized for temporary and emergency purposes, and are subject to the fund’s regulatory and contractual borrowing restrictions. The participating funds are charged administrative fees and an annual commitment fee of 0.10% of the undrawn amount of the facility; these fees are allocated to the funds based on a method approved by the fund’s board of trustees and borne by the funds in which the fund invests (see Note B). Any borrowings under this facility bear interest at a rate based upon the higher of the one-month London Interbank Offered Rate, federal funds effective rate, or overnight bank funding rate plus an agreed-upon spread.
The fund had no borrowings outstanding at September 30, 2017, or at any time during the period then ended.
5. Other: Income and capital gain distributions received are recorded on the ex-dividend date. Security transactions are accounted for on the date securities are bought or sold. Costs used to determine realized gains (losses) on the sale of investment securities are those of the specific securities sold.
B. In accordance with the terms of a Funds’ Service Agreement (the “FSA”) between Vanguard and the fund, Vanguard furnishes to the fund investment advisory, corporate management, administrative, marketing, and distribution services at Vanguard’s cost of operations (as defined by the FSA). These costs of operations are allocated to the fund based on methods and guidelines approved by the board of trustees. The FSA provides that expenses otherwise allocable to
39
Institutional Target Retirement 2020 Fund
Vanguard funds-of-funds may be reduced or eliminated to the extent of savings realized by the underlying Vanguard funds by virtue of being part of a fund-of-funds. Accordingly, all expenses for services provided by Vanguard to the fund and all other expenses incurred by the fund during the period ended September 30, 2017, were borne by the underlying Vanguard funds in which the fund invests. The fund’s trustees and officers are also trustees and officers, respectively, of the underlying Vanguard funds, as well as directors and employees, respectively, of Vanguard.
C. Various inputs may be used to determine the value of the fund’s investments. These inputs are summarized in three broad levels for financial statement purposes. The inputs or methodologies used to value securities are not necessarily an indication of the risk associated with investing in those securities.
Level 1—Quoted prices in active markets for identical securities.
Level 2—Other significant observable inputs (including quoted prices for similar securities, interest rates, prepayment speeds, credit risk, etc.).
Level 3—Significant unobservable inputs (including the fund’s own assumptions used to determine the fair value of investments). Any investments valued with significant unobservable inputs are noted on the Statement of Net Assets.
At September 30, 2017, 100% of the market value of the fund’s investments was determined based on Level 1 inputs.
D. Distributions are determined on a tax basis and may differ from net investment income and realized capital gains for financial reporting purposes. Differences may be permanent or temporary. Permanent differences are reclassified among capital accounts in the financial statements to reflect their tax character. Temporary differences arise when certain items of income, expense, gain, or loss are recognized in different periods for financial statement and tax purposes. These differences will reverse at some time in the future. Differences in classification may also result from the treatment of short-term gains as ordinary income for tax purposes.
The fund used a tax accounting practice to treat a portion of the price of capital shares redeemed during the year as distributions from net investment income and realized capital gains. Accordingly, the fund has reclassified $7,910,000 from undistributed net investment income and $144,000 from accumulated net realized gains to paid-in capital.
For tax purposes, at September 30, 2017, the fund had $230,023,000 of ordinary income and $1,097,000 of long-term capital gains available for distribution.
At September 30, 2017, the cost of investment securities for tax purposes was $15,976,859,000. Net unrealized appreciation of investment securities for tax purposes was $1,603,264,000, consisting entirely of unrealized gains on securities that had risen in value since their purchase.
40
| | |
| Institutional Target Retirement 2020 Fund | | |
| |
| |
| |
| |
| E. Capital shares issued and redeemed were: | | |
| | Year Ended September 30, |
| | 2017 | 2016 |
| | Shares | Shares |
| | (000) | (000) |
| Issued | 284,709 | 336,206 |
| Issued in Lieu of Cash Distributions | 11,995 | 3,164 |
| Redeemed | (69,990) | (31,724) |
| Net Increase (Decrease) in Shares Outstanding | 226,714 | 307,646 |
At September 30, 2017, one shareholder was the record or beneficial owner of 35% of the fund’s net assets. If the shareholder were to redeem its investment in the fund, the redemption might lead to the realization of taxable capital gains.
F. Transactions during the period in affiliated underlying Vanguard funds were as follows:
| | | | | | | | |
| | | | | | Current Period Transactions | |
| Sept. 30, | | Proceeds | | | | | Sept. 30, |
| | 2016 | | from | Realized | Change in | | Capital Gain | 2017 |
| | Market | Purchases | Securities | Net Gain | Unrealized | | Distributions | Market |
| | Value | at Cost | Sold | (Loss) | App. (Dep.) | Income | Received | Value |
| | ($000) | ($000) | ($000) | ($000) | ($000) | ($000) | ($000) | ($000) |
| Vanguard Market | | | | | | | | |
| Liquidity Fund | 2 | NA1 | NA1 | (1) | — | 14 | — | 973 |
| Vanguard Short-Term | | | | | | | |
| Inflation-Protected | | | | | | | | |
| Securities Index | | | | | | | | |
| Fund | 259,311 | 416,359 | 5,809 | — | 97 | 2,169 | — | 669,958 |
| Vanguard Total | | | | | | | | |
| Bond Market II | | | | | | | | |
| Index Fund | 3,278,731 | 2,184,525 | 322,041 | (715) | (74,590) | 99,424 | 3,757 | 5,065,910 |
| Vanguard Total | | | | | | | | |
| International Bond | | | | | | | | |
| Index Fund | 1,427,024 | 736,238 | — | — | (33,498) | 28,495 | — | 2,129,764 |
| Vanguard Total | | | | | | | | |
| International | | | | | | | | |
| Stock Index Fund | 2,641,993 | 804,159 | 106,503 | 1,188 | 521,254 | 91,508 | — | 3,862,091 |
| Vanguard Total | | | | | | | | |
| Stock Market | | | | | | | | |
| Index Fund | 3,981,250 | 1,503,984 | 373,458 | 4,352 | 735,299 | 97,824 | — | 5,851,427 |
| Total | 11,588,311 | 5,645,265 | 807,811 | 4,824 | 1,148,562 | 319,434 | 3,757 | 17,580,123 |
| 1 Not applicable—purchases and sales are for temporary cash investment purposes. | | | |
G. Management has determined that no material events or transactions occurred subsequent to September 30, 2017, that would require recognition or disclosure in these financial statements.
41
Institutional Target Retirement 2025 Fund
Fund Profile
As of September 30, 2017
| |
| Total Fund Characteristics | |
| Ticker Symbol | VRIVX |
| 30-Day SEC Yield | 2.11% |
| Acquired Fund Fees and Expenses1 | 0.09% |
| |
| Allocation to Underlying Vanguard Funds | |
| Vanguard Total Stock Market Index | |
| Fund Institutional Shares | 38.7% |
| Vanguard Total Bond Market II | |
| Index Fund Investor Shares | 25.4 |
| Vanguard Total International Stock | |
| Index Fund Investor Shares | 25.4 |
| Vanguard Total International Bond | |
| Index Fund Admiral Shares | 10.5 |
Fund Asset Allocation

1 This figure—drawn from the prospectus dated July 12, 2017—represents an estimate of the weighted average of the expense ratios and any transaction fees charged by the underlying mutual funds (the ”acquired” funds) in which the Institutional Target Retirement 2025 Fund invests. The fund does not charge any expenses or fees of its own. For the fiscal year ended September 30, 2017, the annualized acquired fund fees and expenses were 0.09%.
42
Institutional Target Retirement 2025 Fund
Performance Summary
All of the returns in this report represent past performance, which is not a guarantee of future results that may be achieved by the fund. (Current performance may be lower or higher than the performance data cited. For performance data current to the most recent month-end, visit our website at vanguard.com/performance.) Note, too, that both investment returns and principal value can fluctuate widely, so an investor’s shares, when sold, could be worth more or less than their original cost. The returns shown do not reflect taxes that a shareholder would pay on fund distributions or on the sale of fund shares.
Cumulative Performance: June 26, 2015, Through September 30, 2017
Initial Investment of $100,000,000

| | | |
| | Average Annual Total Returns | |
| | Periods Ended September 30, 2017 | |
| | | Since | Final Value |
| | One | Inception | of a $100,000,000 |
| | Year | (6/26/2015) | Investment |
| Institutional Target Retirement 2025 | | | |
| Fund* | 11.85% | 6.59% | $115,525,415 |
| Target 2025 Composite Index | 11.97 | 6.74 | 115,909,442 |
| Mixed-Asset Target 2025 Funds | | | |
| Average | 10.44 | 5.47 | 112,813,667 |
| MSCI US Broad Market Index | 18.67 | 10.09 | 124,295,206 |
For a benchmark description, see the Glossary.
Mixed-Asset Target 2025 Funds Average: Derived from data provided by Lipper, a Thomson Reuters Company.
"Since Inception" performance is calculated from the fund's inception date for both the fund and its comparative standards.
See Financial Highlights for dividend and capital gains information.
43
Institutional Target Retirement 2025 Fund
Fiscal-Year Total Returns (%): June 26, 2015, Through September 30, 2017
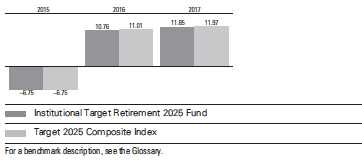
44
Institutional Target Retirement 2025 Fund
Financial Statements
Statement of Net Assets
As of September 30, 2017
The fund reports a complete list of its holdings in regulatory filings four times in each fiscal year, at the quarter-ends. For the second and fourth fiscal quarters, the lists appear in the fund’s semiannual and annual reports to shareholders. For the first and third fiscal quarters, the fund files the lists with the Securities and Exchange Commission on Form N-Q. Shareholders can look up the fund’s Forms N-Q on the SEC’s website at sec.gov. Forms N-Q may also be reviewed and copied at the SEC’s Public Reference Room (see the back cover of this report for further information).
| | |
| | | Market |
| | | Value• |
| | Shares | ($000) |
| Investment Companies (100.0%) | | |
| U. S. Stock Fund (38.7%) | | |
| Vanguard Total Stock Market Index Fund Institutional Shares | 132,420,659 | 8,350,447 |
| |
| International Stock Fund (25.4%) | | |
| Vanguard Total International Stock Index Fund Investor Shares | 312,212,472 | 5,485,573 |
| |
| U.S. Bond Fund (25.4%) | | |
| 1 Vanguard Total Bond Market II Index Fund Investor Shares | 510,750,993 | 5,490,573 |
| |
| International Bond Fund (10.5%) | | |
| Vanguard Total International Bond Index Fund Admiral Shares | 104,514,514 | 2,275,281 |
| Total Investment Companies (Cost $19,423,018) | | 21,601,874 |
| Temporary Cash Investment (0.0%) | | |
| Money Market Fund (0.0%) | | |
| 1 Vanguard Market Liquidity Fund, 1.223% (Cost $4,152) | 41,513 | 4,152 |
| Total Investments (100.0%) (Cost $19,427,170) | | 21,606,026 |
| Other Assets and Liabilities (0.0%) | | |
| Other Assets | | 152,028 |
| Liabilities | | (147,976) |
| | | 4,052 |
| Net Assets (100%) | | |
| Applicable to 962,250,430 outstanding $.001 par value shares of | | |
| beneficial interest (unlimited authorization) | | 21,610,078 |
| Net Asset Value Per Share | | $22.46 |
45
| |
| Institutional Target Retirement 2025 Fund | |
| |
| |
| |
| |
| | Amount |
| | ($000) |
| Statement of Assets and Liabilities | |
| Assets | |
| Investments in Securities, at Value—Affiliated Vanguard Funds | 21,606,026 |
| Receivables for Investment Securities Sold | 40,195 |
| Receivables for Capital Shares Issued | 99,066 |
| Receivables for Accrued Income | 12,767 |
| Total Assets | 21,758,054 |
| Liabilities | |
| Payables for Investment Securities Purchased | 61,704 |
| Payables for Capital Shares Redeemed | 86,272 |
| Total Liabilities | 147,976 |
| Net Assets | 21,610,078 |
| |
| |
| At September 30, 2017, net assets consisted of: | |
| | Amount |
| | ($000) |
| Paid-in Capital | 19,140,366 |
| Undistributed Net Investment Income | 287,626 |
| Accumulated Net Realized Gains | 3,230 |
| Unrealized Appreciation (Depreciation) | 2,178,856 |
| Net Assets | 21,610,078 |
• See Note A in Notes to Financial Statements.
1 Affiliated fund available only to Vanguard funds and certain trusts and accounts managed by Vanguard. Rate shown for Vanguard
Market Liquidity Fund is the 7-day yield.
See accompanying Notes, which are an integral part of the Financial Statements.
46
| |
| Institutional Target Retirement 2025 Fund | |
| |
| |
| Statement of Operations | |
| |
| | Year Ended |
| | September 30, 2017 |
| | ($000) |
| Investment Income | |
| Income | |
| Income Distributions Received from Affiliated Funds | 396,685 |
| Other Income | 66 |
| Net Investment Income—Note B | 396,751 |
| Realized Net Gain (Loss) | |
| Capital Gain Distributions Received from Affiliated Funds | 3,810 |
| Affiliated Investment Securities Sold | 2,238 |
| Futures Contracts | 20 |
| Realized Net Gain (Loss) | 6,068 |
| Change in Unrealized Appreciation (Depreciation) of Investment Securities | 1,638,559 |
| Net Increase (Decrease) in Net Assets Resulting from Operations | 2,041,378 |
See accompanying Notes, which are an integral part of the Financial Statements.
47
| | |
| Institutional Target Retirement 2025 Fund | | |
| |
| |
| Statement of Changes in Net Assets | | |
| |
| | Year Ended September 30, |
| | 2017 | 2016 |
| | ($000) | ($000) |
| Increase (Decrease) in Net Assets | | |
| Operations | | |
| Net Investment Income | 396,751 | 230,756 |
| Realized Net Gain (Loss) | 6,068 | 3,521 |
| Change in Unrealized Appreciation (Depreciation) | 1,638,559 | 798,617 |
| Net Increase (Decrease) in Net Assets Resulting from Operations | 2,041,378 | 1,032,894 |
| Distributions | | |
| Net Investment Income | (282,158) | (69,282) |
| Realized Capital Gain1 | (5,974) | (420) |
| Total Distributions | (288,132) | (69,702) |
| Capital Share Transactions | | |
| Issued | 7,171,272 | 7,657,545 |
| Issued in Lieu of Cash Distributions | 284,805 | 69,540 |
| Redeemed | (1,225,661) | (426,094) |
| Net Increase (Decrease) from Capital Share Transactions | 6,230,416 | 7,300,991 |
| Total Increase (Decrease) | 7,983,662 | 8,264,183 |
| Net Assets | | |
| Beginning of Period | 13,626,416 | 5,362,233 |
| End of Period2 | 21,610,078 | 13,626,416 |
1 Includes fiscal 2017 and 2016 short-term gain distributions totaling $3,311,000 and $420,000, respectively. Short-term gain
distributions are treated as ordinary income dividends for tax purposes.
2 Net Assets—End of Period includes undistributed (overdistributed) net investment income of $287,626,000 and $180,129,000.
See accompanying Notes, which are an integral part of the Financial Statements.
48
| | | |
| Institutional Target Retirement 2025 Fund | | | |
| |
| |
| Financial Highlights | | | |
| |
| |
| | | | June 26, |
| | Year Ended | 20151 to |
| | September 30, | Sept. 30, |
| For a Share Outstanding Throughout Each Period | 2017 | 2016 | 2015 |
| Net Asset Value, Beginning of Period | $20.48 | $18.65 | $20.00 |
| Investment Operations | | | |
| Net Investment Income2 | .480 | .452 | .140 |
| Capital Gain Distributions Received 2 | .005 | .006 | — |
| Net Realized and Unrealized Gain (Loss) on Investments | 1.895 | 1.538 | (1.490) |
| Total from Investment Operations | 2.380 | 1.996 | (1.350) |
| Distributions | | | |
| Dividends from Net Investment Income | (.392) | (.165) | — |
| Distributions from Realized Capital Gains | (.008) | (.001) | — |
| Total Distributions | (.400) | (.166) | — |
| Net Asset Value, End of Period | $22.46 | $20.48 | $18.65 |
| |
| Total Return | 11.85% | 10.76% | -6.75% |
| |
| Ratios/Supplemental Data | | | |
| Net Assets, End of Period (Millions) | $21,610 | $13,626 | $5,362 |
| Ratio of Total Expenses to Average Net Assets | — | — | — |
| Acquired Fund Fees and Expenses | 0.09% | 0.10% | 0.10%3 |
| Ratio of Net Investment Income to Average Net Assets | 2.27% | 2.30% | 2.52%3 |
| Portfolio Turnover Rate | 4% | 4% | 1% |
1 Inception.
2 Calculated based on average shares outstanding.
3 Annualized.
See accompanying Notes, which are an integral part of the Financial Statements.
49
Institutional Target Retirement 2025 Fund
Notes to Financial Statements
Vanguard Institutional Target Retirement 2025 Fund is registered under the Investment Company Act of 1940 as an open-end investment company, or mutual fund. The fund follows a balanced investment strategy by investing in selected Vanguard funds to achieve its targeted allocation of assets to U.S. and international stocks, and U.S. and international bonds. Financial statements and other information about each underlying fund are available on vanguard.com.
A. The following significant accounting policies conform to generally accepted accounting principles for U.S. investment companies. The fund consistently follows such policies in preparing its financial statements.
1. Security Valuation: Investments are valued at the net asset value of each underlying Vanguard fund determined as of the close of the New York Stock Exchange (generally 4 p.m., Eastern time) on the valuation date.
2. Futures Contracts: The fund uses stock and bond futures contracts to a limited extent, with the objectives of maintaining full exposure to the market and maintaining its target asset allocation. The primary risks associated with the use of futures contracts are imperfect correlation between changes in market values of investments held by the fund and the prices of futures contracts, and the possibility of an illiquid market. Counterparty risk involving futures is mitigated because a regulated clearinghouse is the counterparty instead of the clearing broker. To further mitigate counterparty risk, the fund trades futures contracts on an exchange, monitors the financial strength of its clearing brokers and clearinghouse, and has entered into clearing agreements with its clearing brokers. The clearinghouse imposes initial margin requirements to secure the fund’s performance and requires daily settlement of variation margin representing changes in the market value of each contract.
Futures contracts are valued at their quoted daily settlement prices. The notional amounts of the contracts are not recorded in the Statement of Net Assets. Fluctuations in the value of the contracts are recorded in the Statement of Assets and Liabilities as an asset (liability) and in the Statement of Operations as unrealized appreciation (depreciation) until the contracts are closed, when they are recorded as realized futures gains (losses).
During the year ended September 30, 2017, the fund’s average investments in long and short futures contracts represented less than 1% and 0% of net assets, respectively, based on the average of the notional amounts at each quarter-end during the period. The fund had no open futures contracts at September 30, 2017.
3. Federal Income Taxes: The fund intends to continue to qualify as a regulated investment company and distribute all of its taxable income. Management has analyzed the fund’s tax positions taken for all open federal income tax years (September 30, 2015–2017), and has concluded that no provision for federal income tax is required in the fund’s financial statements.
4. Distributions: Distributions to shareholders are recorded on the ex-dividend date.
5. Credit Facility: The fund and certain other funds managed by The Vanguard Group (“Vanguard”) participate in a $3.1 billion committed credit facility provided by a syndicate of lenders pursuant to a credit agreement that may be renewed annually; each fund is individually liable for its borrowings, if any, under the credit facility. Borrowings may be utilized for temporary and emergency purposes, and are subject to the fund’s regulatory and contractual borrowing restrictions. The participating
50
Institutional Target Retirement 2025 Fund
funds are charged administrative fees and an annual commitment fee of 0.10% of the undrawn amount of the facility; these fees are allocated to the funds based on a method approved by the fund’s board of trustees and borne by the funds in which the fund invests (see Note B). Any borrowings under this facility bear interest at a rate based upon the higher of the one-month London Interbank Offered Rate, federal funds effective rate, or overnight bank funding rate plus an agreed-upon spread.
The fund had no borrowings outstanding at September 30, 2017, or at any time during the period then ended.
6. Other: Income and capital gain distributions received are recorded on the ex-dividend date. Security transactions are accounted for on the date securities are bought or sold. Costs used to determine realized gains (losses) on the sale of investment securities are those of the specific securities sold.
B. In accordance with the terms of a Funds’ Service Agreement (the “FSA”) between Vanguard and the fund, Vanguard furnishes to the fund investment advisory, corporate management, administrative, marketing, and distribution services at Vanguard’s cost of operations (as defined by the FSA). These costs of operations are allocated to the fund based on methods and guidelines approved by the board of trustees. The FSA provides that expenses otherwise allocable to Vanguard funds-of-funds may be reduced or eliminated to the extent of savings realized by the underlying Vanguard funds by virtue of being part of a fund-of-funds. Accordingly, all expenses for services provided by Vanguard to the fund and all other expenses incurred by the fund during the period ended September 30, 2017, were borne by the underlying Vanguard funds in which the fund invests. The fund’s trustees and officers are also trustees and officers, respectively, of the underlying Vanguard funds, as well as directors and employees, respectively, of Vanguard.
C. Various inputs may be used to determine the value of the fund’s investments. These inputs are summarized in three broad levels for financial statement purposes. The inputs or methodologies used to value securities are not necessarily an indication of the risk associated with investing in those securities.
Level 1—Quoted prices in active markets for identical securities.
Level 2—Other significant observable inputs (including quoted prices for similar securities, interest rates, prepayment speeds, credit risk, etc.).
Level 3—Significant unobservable inputs (including the fund’s own assumptions used to determine the fair value of investments). Any investments valued with significant unobservable inputs are noted on the Statement of Net Assets.
At September 30, 2017, 100% of the market value of the fund’s investments was determined based on Level 1 inputs.
51
Institutional Target Retirement 2025 Fund
D. Distributions are determined on a tax basis and may differ from net investment income and realized capital gains for financial reporting purposes. Differences may be permanent or temporary. Permanent differences are reclassified among capital accounts in the financial statements to reflect their tax character. Temporary differences arise when certain items of income, expense, gain, or loss are recognized in different periods for financial statement and tax purposes. These differences will reverse at some time in the future. Differences in classification may also result from the treatment of short-term gains as ordinary income for tax purposes.
The fund used a tax accounting practice to treat a portion of the price of capital shares redeemed during the year as distributions from net investment income and realized capital gains. Accordingly, the fund has reclassified $7,096,000 from undistributed net investment income and $59,000 from accumulated net realized gains to paid-in capital.
For tax purposes, at September 30, 2017, the fund had $290,856,000 of ordinary income available for distribution.
At September 30, 2017, the cost of investment securities for tax purposes was $19,427,170,000. Net unrealized appreciation of investment securities for tax purposes was $2,178,856,000, consisting entirely of unrealized gains on securities that had risen in value since their purchase.
| | |
| E. Capital shares issued and redeemed were: | | |
| | Year Ended September 30, |
| | 2017 | 2016 |
| | Shares | Shares |
| | (000) | (000) |
| Issued | 340,218 | 396,056 |
| Issued in Lieu of Cash Distributions | 14,184 | 3,609 |
| Redeemed | (57,419) | (21,891) |
| Net Increase (Decrease) in Shares Outstanding | 296,983 | 377,774 |
At September 30, 2017, one shareholder was the record or beneficial owner of 31% of the fund’s net assets. If the shareholder were to redeem its investment in the fund, the redemption might lead to the realization of taxable capital gains.
52
Institutional Target Retirement 2025 Fund
F. Transactions during the period in affiliated underlying Vanguard funds were as follows:
| | | | | | | | |
| | | | | | Current Period Transactions | |
| Sept. 30, | | Proceeds | | | | | Sept. 30, |
| | 2016 | | from | Realized | Change in | | Capital Gain | 2017 |
| | Market | Purchases | Securities | Net Gain | Unrealized | | Distributions | Market |
| | Value | at Cost | Sold | (Loss) | App. (Dep.) | Income | Received | Value |
| | ($000) | ($000) | ($000) | ($000) | ($000) | ($000) | ($000) | ($000) |
| Vanguard Market | | | | | | | | |
| Liquidity Fund | 3,049 | NA1 | NA1 | — | — | 32 | — | 4,152 |
| Vanguard Total | | | | | | | | |
| Bond Market II | | | | | | | | |
| Index Fund | 3,312,072 | 2,664,706 | 412,513 | (1,270) | (72,422) | 104,247 | 3,810 | 5,490,573 |
| Vanguard Total | | | | | | | | |
| International Bond | | | | | | | | |
| Index Fund | 1,434,178 | 873,713 | — | — | (32,610) | 29,381 | — | 2,275,281 |
| Vanguard Total | | | | | | | | |
| International Stock | | | | | | | | |
| Index Fund | 3,542,135 | 1,303,952 | 86,237 | 557 | 725,166 | 127,160 | — | 5,485,573 |
| Vanguard Total | | | | | | | | |
| Stock Market | | | | | | | | |
| Index Fund | 5,299,479 | 2,305,331 | 275,739 | 2,951 | 1,018,425 | 135,865 | — | 8,350,447 |
| Total | 13,590,913 | 7,147,702 | 774,489 | 2,238 | 1,638,559 | 396,685 | 3,810 | 21,606,026 |
| 1 Not applicable—purchases and sales are for temporary cash investment purposes. | | | |
G. Management has determined that no material events or transactions occurred subsequent to September 30, 2017, that would require recognition or disclosure in these financial statements.
53
Institutional Target Retirement 2030 Fund
Fund Profile
As of September 30, 2017
| |
| Total Fund Characteristics | |
| Ticker Symbol | VTTWX |
| 30-Day SEC Yield | 2.11% |
| Acquired Fund Fees and Expenses1 | 0.09% |
| |
| Allocation to Underlying Vanguard Funds | |
| Vanguard Total Stock Market Index | |
| Fund Institutional Shares | 43.1% |
| Vanguard Total International Stock | |
| Index Fund Investor Shares | 28.3 |
| Vanguard Total Bond Market II | |
| Index Fund Investor Shares | 20.3 |
| Vanguard Total International Bond | |
| Index Fund Admiral Shares | 8.3 |
Fund Asset Allocation
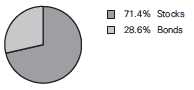
1 This figure—drawn from the prospectus dated July 12, 2017—represents an estimate of the weighted average of the expense ratios and any transaction fees charged by the underlying mutual funds (the ”acquired” funds) in which the Institutional Target Retirement 2030 Fund invests. The fund does not charge any expenses or fees of its own. For the fiscal year ended September 30, 2017, the annualized acquired fund fees and expenses were 0.09%.
54
Institutional Target Retirement 2030 Fund
Performance Summary
All of the returns in this report represent past performance, which is not a guarantee of future results that may be achieved by the fund. (Current performance may be lower or higher than the performance data cited. For performance data current to the most recent month-end, visit our website at vanguard.com/performance.) Note, too, that both investment returns and principal value can fluctuate widely, so an investor’s shares, when sold, could be worth more or less than their original cost. The returns shown do not reflect taxes that a shareholder would pay on fund distributions or on the sale of fund shares.
Cumulative Performance: June 26, 2015, Through September 30, 2017
Initial Investment of $100,000,000

| | | |
| | Average Annual Total Returns | |
| | Periods Ended September 30, 2017 | |
| | | Since | Final Value |
| | One | Inception | of a $100,000,000 |
| | Year | (6/26/2015) | Investment |
| Institutional Target Retirement 2030 | | | |
| Fund* | 13.27% | 6.90% | $116,291,740 |
| Target 2030 Composite Index | 13.44 | 7.10 | 116,789,054 |
| Mixed-Asset Target 2030 Funds | | | |
| Average | 12.14 | 5.95 | 113,976,684 |
| MSCI US Broad Market Index | 18.67 | 10.09 | 124,295,206 |
For a benchmark description, see the Glossary.
Mixed-Asset Target 2030 Funds Average: Derived from data provided by Lipper, a Thomson Reuters Company.
"Since Inception" performance is calculated from the fund's inception date for both the fund and its comparative standards.
See Financial Highlights for dividend and capital gains information.
55
Institutional Target Retirement 2030 Fund
Fiscal-Year Total Returns (%): June 26, 2015, Through September 30, 2017

56
Institutional Target Retirement 2030 Fund
Financial Statements
Statement of Net Assets
As of September 30, 2017
The fund reports a complete list of its holdings in regulatory filings four times in each fiscal year, at the quarter-ends. For the second and fourth fiscal quarters, the lists appear in the fund’s semiannual and annual reports to shareholders. For the first and third fiscal quarters, the fund files the lists with the Securities and Exchange Commission on Form N-Q. Shareholders can look up the fund’s Forms N-Q on the SEC’s website at sec.gov. Forms N-Q may also be reviewed and copied at the SEC’s Public Reference Room (see the back cover of this report for further information).
| | |
| | | Market |
| | | Value• |
| | Shares | ($000) |
| Investment Companies (100.0%) | | |
| U.S. Stock Fund (43.1%) | | |
| Vanguard Total Stock Market Index Fund Institutional Shares | 130,652,855 | 8,238,969 |
| |
| International Stock Fund (28.3%) | | |
| Vanguard Total International Stock Index Fund Investor Shares | 307,899,591 | 5,409,796 |
| |
| U.S. Bond Fund (20.3%) | | |
| 1 Vanguard Total Bond Market II Index Fund Investor Shares | 362,091,436 | 3,892,483 |
| |
| International Bond Fund (8.3%) | | |
| Vanguard Total International Bond Index Fund Admiral Shares | 73,305,925 | 1,595,870 |
| Total Investment Companies (Cost $17,042,605) | | 19,137,118 |
| Temporary Cash Investment (0.0%) | | |
| Money Market Fund (0.0%) | | |
| 1 Vanguard Market Liquidity Fund, 1.223% (Cost $7,534) | 75,332 | 7,534 |
| Total Investments (100.0%) (Cost $17,050,139) | | 19,144,652 |
| Other Assets and Liabilities (0.0%) | | |
| Other Assets | | 171,017 |
| Liabilities | | (173,864) |
| | | (2,847) |
| Net Assets (100%) | | |
| Applicable to 846,451,756 outstanding $.001 par value shares of | | |
| beneficial interest (unlimited authorization) | | 19,141,805 |
| Net Asset Value Per Share | | $22.61 |
57
| |
| Institutional Target Retirement 2030 Fund | |
| |
| |
| |
| |
| | Amount |
| | ($000) |
| Statement of Assets and Liabilities | |
| Assets | |
| Investments in Securities, at Value—Affiliated Vanguard Funds | 19,144,652 |
| Receivables for Capital Shares Issued | 161,972 |
| Receivables for Accrued Income | 9,045 |
| Total Assets | 19,315,669 |
| Liabilities | |
| Payables for Investment Securities Purchased | 117,696 |
| Payables for Capital Shares Redeemed | 56,168 |
| Total Liabilities | 173,864 |
| Net Assets | 19,141,805 |
| |
| |
| At September 30, 2017, net assets consisted of: | |
| | Amount |
| | ($000) |
| Paid-in Capital | 16,791,930 |
| Undistributed Net Investment Income | 252,441 |
| Accumulated Net Realized Gains | 2,921 |
| Unrealized Appreciation (Depreciation) | 2,094,513 |
| Net Assets | 19,141,805 |
• See Note A in Notes to Financial Statements.
1 Affiliated fund available only to Vanguard funds and certain trusts and accounts managed by Vanguard. Rate shown for Vanguard
Market Liquidity Fund is the 7-day yield.
See accompanying Notes, which are an integral part of the Financial Statements.
58
| |
| Institutional Target Retirement 2030 Fund | |
| |
| |
| Statement of Operations | |
| |
| | Year Ended |
| | September 30, 2017 |
| | ($000) |
| Investment Income | |
| Income | |
| Income Distributions Received from Affiliated Funds | 345,544 |
| Other Income | 178 |
| Net Investment Income—Note B | 345,722 |
| Realized Net Gain (Loss) | |
| Capital Gain Distributions Received from Affiliated Funds | 2,551 |
| Affiliated Investment Securities Sold | 2,346 |
| Realized Net Gain (Loss) | 4,897 |
| Change in Unrealized Appreciation (Depreciation) of Investment Securities | 1,616,456 |
| Net Increase (Decrease) in Net Assets Resulting from Operations | 1,967,075 |
See accompanying Notes, which are an integral part of the Financial Statements.
59
| | |
| Institutional Target Retirement 2030 Fund | | |
| |
| |
| Statement of Changes in Net Assets | | |
| |
| | Year Ended September 30, |
| | 2017 | 2016 |
| | ($000) | ($000) |
| Increase (Decrease) in Net Assets | | |
| Operations | | |
| Net Investment Income | 345,722 | 197,264 |
| Realized Net Gain (Loss) | 4,897 | 2,058 |
| Change in Unrealized Appreciation (Depreciation) | 1,616,456 | 706,266 |
| Net Increase (Decrease) in Net Assets Resulting from Operations | 1,967,075 | 905,588 |
| Distributions | | |
| Net Investment Income | (241,723) | (58,300) |
| Realized Capital Gain1 | (3,875) | (358) |
| Total Distributions | (245,598) | (58,658) |
| Capital Share Transactions | | |
| Issued | 6,851,346 | 6,510,570 |
| Issued in Lieu of Cash Distributions | 243,168 | 58,472 |
| Redeemed | (1,159,952) | (361,459) |
| Net Increase (Decrease) from Capital Share Transactions | 5,934,562 | 6,207,583 |
| Total Increase (Decrease) | 7,656,039 | 7,054,513 |
| Net Assets | | |
| Beginning of Period | 11,485,766 | 4,431,253 |
| End of Period2 | 19,141,805 | 11,485,766 |
1 Includes fiscal 2017 and 2016 short-term gain distributions totaling $2,153,000 and $358,000, respectively. Short-term gain
distributions are treated as ordinary income dividends for tax purposes.
2 Net Assets—End of Period includes undistributed (overdistributed) net investment income of $252,441,000 and $154,293,000.
See accompanying Notes, which are an integral part of the Financial Statements.
60
| | | |
| Institutional Target Retirement 2030 Fund | | | |
| |
| |
| Financial Highlights | | | |
| |
| |
| | | | June 26, |
| | Year Ended | 20151 to |
| | September 30, | Sept. 30, |
| For a Share Outstanding Throughout Each Period | 2017 | 2016 | 2015 |
| Net Asset Value, Beginning of Period | $20.36 | $18.45 | $20.00 |
| Investment Operations | | | |
| Net Investment Income2 | .485 | .455 | .145 |
| Capital Gain Distributions Received 2 | .004 | .004 | — |
| Net Realized and Unrealized Gain (Loss) on Investments | 2.160 | 1.615 | (1.695) |
| Total from Investment Operations | 2.649 | 2.074 | (1.550) |
| Distributions | | | |
| Dividends from Net Investment Income | (.393) | (.163) | — |
| Distributions from Realized Capital Gains | (.006) | (.001) | — |
| Total Distributions | (.399) | (.164) | — |
| Net Asset Value, End of Period | $22.61 | $20.36 | $18.45 |
| |
| Total Return | 13.27% | 11.30% | -7.75% |
| |
| Ratios/Supplemental Data | | | |
| Net Assets, End of Period (Millions) | $19,142 | $11,486 | $4,431 |
| Ratio of Total Expenses to Average Net Assets | — | — | — |
| Acquired Fund Fees and Expenses | 0.09% | 0.10% | 0.10%3 |
| Ratio of Net Investment Income to Average Net Assets | 2.29% | 2.34% | 2.64%3 |
| Portfolio Turnover Rate | 4% | 3% | 1% |
1 Inception.
2 Calculated based on average shares outstanding.
3 Annualized.
See accompanying Notes, which are an integral part of the Financial Statements.
61
Institutional Target Retirement 2030 Fund
Notes to Financial Statements
Vanguard Institutional Target Retirement 2030 Fund is registered under the Investment Company Act of 1940 as an open-end investment company, or mutual fund. The fund follows a balanced investment strategy by investing in selected Vanguard funds to achieve its targeted allocation of assets to U.S. and international stocks, and U.S. and international bonds. Financial statements and other information about each underlying fund are available on vanguard.com.
A. The following significant accounting policies conform to generally accepted accounting principles for U.S. investment companies. The fund consistently follows such policies in preparing its financial statements.
1. Security Valuation: Investments are valued at the net asset value of each underlying Vanguard fund determined as of the close of the New York Stock Exchange (generally 4 p.m., Eastern time) on the valuation date.
2. Federal Income Taxes: The fund intends to continue to qualify as a regulated investment company and distribute all of its taxable income. Management has analyzed the fund’s tax positions taken for all open federal income tax years (September 30, 2015–2017), and has concluded that no provision for federal income tax is required in the fund’s financial statements.
3. Distributions: Distributions to shareholders are recorded on the ex-dividend date.
4. Credit Facility: The fund and certain other funds managed by The Vanguard Group (“Vanguard”) participate in a $3.1 billion committed credit facility provided by a syndicate of lenders pursuant to a credit agreement that may be renewed annually; each fund is individually liable for its borrowings, if any, under the credit facility. Borrowings may be utilized for temporary and emergency purposes, and are subject to the fund’s regulatory and contractual borrowing restrictions. The participating funds are charged administrative fees and an annual commitment fee of 0.10% of the undrawn amount of the facility; these fees are allocated to the funds based on a method approved by the fund’s board of trustees and borne by the funds in which the fund invests (see Note B). Any borrowings under this facility bear interest at a rate based upon the higher of the one-month London Interbank Offered Rate, federal funds effective rate, or overnight bank funding rate plus an agreed-upon spread.
The fund had no borrowings outstanding at September 30, 2017, or at any time during the period then ended.
5. Other: Income and capital gain distributions received are recorded on the ex-dividend date. Security transactions are accounted for on the date securities are bought or sold. Costs used to determine realized gains (losses) on the sale of investment securities are those of the specific securities sold.
B. In accordance with the terms of a Funds’ Service Agreement (the “FSA”) between Vanguard and the fund, Vanguard furnishes to the fund investment advisory, corporate management, administrative, marketing, and distribution services at Vanguard’s cost of operations (as defined by the FSA). These costs of operations are allocated to the fund based on methods and guidelines approved by the board of trustees. The FSA provides that expenses otherwise allocable to
62
Institutional Target Retirement 2030 Fund
Vanguard funds-of-funds may be reduced or eliminated to the extent of savings realized by the underlying Vanguard funds by virtue of being part of a fund-of-funds. Accordingly, all expenses for services provided by Vanguard to the fund and all other expenses incurred by the fund during the period ended September 30, 2017, were borne by the underlying Vanguard funds in which the fund invests. The fund’s trustees and officers are also trustees and officers, respectively, of the underlying Vanguard funds, as well as directors and employees, respectively, of Vanguard.
C. Various inputs may be used to determine the value of the fund’s investments. These inputs are summarized in three broad levels for financial statement purposes. The inputs or methodologies used to value securities are not necessarily an indication of the risk associated with investing in those securities.
Level 1—Quoted prices in active markets for identical securities.
Level 2—Other significant observable inputs (including quoted prices for similar securities, interest rates, prepayment speeds, credit risk, etc.).
Level 3—Significant unobservable inputs (including the fund’s own assumptions used to determine the fair value of investments). Any investments valued with significant unobservable inputs are noted on the Statement of Net Assets.
At September 30, 2017, 100% of the market value of the fund’s investments was determined based on Level 1 inputs.
D. Distributions are determined on a tax basis and may differ from net investment income and realized capital gains for financial reporting purposes. Differences may be permanent or temporary. Permanent differences are reclassified among capital accounts in the financial statements to reflect their tax character. Temporary differences arise when certain items of income, expense, gain, or loss are recognized in different periods for financial statement and tax purposes. These differences will reverse at some time in the future. Differences in classification may also result from the treatment of short-term gains as ordinary income for tax purposes.
The fund used a tax accounting practice to treat a portion of the price of capital shares redeemed during the year as distributions from net investment income and realized capital gains. Accordingly, the fund has reclassified $5,851,000 from undistributed net investment income and $51,000 from accumulated net realized gains to paid-in capital.
For tax purposes, at September 30, 2017, the fund had $254,643,000 of ordinary income and $718,000 of long-term capital gains available for distribution.
At September 30, 2017, the cost of investment securities for tax purposes was $17,050,139,000. Net unrealized appreciation of investment securities for tax purposes was $2,094,513,000, consisting entirely of unrealized gains on securities that had risen in value since their purchase.
63
| | |
| Institutional Target Retirement 2030 Fund | | |
| |
| |
| |
| |
| E. Capital shares issued and redeemed were: | | |
| | Year Ended September 30, |
| | 2017 | 2016 |
| | Shares | Shares |
| | (000) | (000) |
| Issued | 324,504 | 339,804 |
| Issued in Lieu of Cash Distributions | 12,146 | 3,052 |
| Redeemed | (54,468) | (18,710) |
| Net Increase (Decrease) in Shares Outstanding | 282,182 | 324,146 |
At September 30, 2017, one shareholder was the record or beneficial owner of 33% of the fund’s net assets. If the shareholder were to redeem its investment in the fund, the redemption might lead to the realization of taxable capital gains.
F. Transactions during the period in affiliated underlying Vanguard funds were as follows:
| | | | | | | | |
| | | | | | | | |
| | | | | | Current Period Transactions | |
| Sept. 30, | | Proceeds | | | | | Sept. 30, |
| | 2016 | | from | Realized | Change in | | Capital Gain | 2017 |
| | Market | Purchases | Securities | Net Gain | Unrealized | | Distributions | Market |
| | Value | at Cost | Sold | (Loss) | App. (Dep.) | Income | Received | Value |
| | ($000) | ($000) | ($000) | ($000) | ($000) | ($000) | ($000) | ($000) |
| Vanguard Market | | | | | | | | |
| Liquidity Fund | 3 | NA1 | NA1 | (2) | — | 26 | — | 7,534 |
| Vanguard Total | | | | | | | | |
| Bond Market II | | | | | | | | |
| Index Fund | 2,179,713 | 2,009,769 | 249,234 | 31 | (47,796) | 71,082 | 2,551 | 3,892,483 |
| Vanguard Total | | | | | | | | |
| International Bond | | | | | | | | |
| Index Fund | 947,145 | 670,202 | — | — | (21,477) | 19,830 | — | 1,595,870 |
| Vanguard Total | | | | | | | | |
| International Stock | | | | | | | | |
| Index Fund | 3,333,395 | 1,474,117 | 102,136 | 607 | 703,813 | 123,193 | — | 5,409,796 |
| Vanguard Total | | | | | | | | |
| Stock Market | | | | | | | | |
| Index Fund | 4,983,834 | 2,566,112 | 294,603 | 1,710 | 981,916 | 131,413 | — | 8,238,969 |
| Total | 11,444,090 | 6,720,200 | 645,973 | 2,346 | 1,616,456 | 345,544 | 2,551 | 19,144,652 |
| 1 Not applicable—purchases and sales are for temporary cash investment purposes. | | | |
G. Management has determined that no material events or transactions occurred subsequent to September 30, 2017, that would require recognition or disclosure in these financial statements.
64
Institutional Target Retirement 2035 Fund
Fund Profile
As of September 30, 2017
| |
| Total Fund Characteristics | |
| Ticker Symbol | VITFX |
| 30-Day SEC Yield | 2.11% |
| Acquired Fund Fees and Expenses1 | 0.09% |
| |
| Allocation to Underlying Vanguard Funds | |
| Vanguard Total Stock Market Index | |
| Fund Institutional Shares | 47.6% |
| Vanguard Total International Stock | |
| Index Fund Investor Shares | 31.2 |
| Vanguard Total Bond Market II | |
| Index Fund Investor Shares | 15.1 |
| Vanguard Total International Bond | |
| Index Fund Admiral Shares | 6.1 |
Fund Asset Allocation
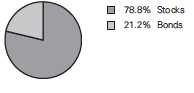
1 This figure—drawn from the prospectus dated July 12, 2017—represents an estimate of the weighted average of the expense ratios and any transaction fees charged by the underlying mutual funds (the ”acquired” funds) in which the Institutional Target Retirement 2035 Fund invests. The fund does not charge any expenses or fees of its own. For the fiscal year ended September 30, 2017, the annualized acquired fund fees and expenses were 0.09%.
65
Institutional Target Retirement 2035 Fund
Performance Summary
All of the returns in this report represent past performance, which is not a guarantee of future results that may be achieved by the fund. (Current performance may be lower or higher than the performance data cited. For performance data current to the most recent month-end, visit our website at vanguard.com/performance.) Note, too, that both investment returns and principal value can fluctuate widely, so an investor’s shares, when sold, could be worth more or less than their original cost. The returns shown do not reflect taxes that a shareholder would pay on fund distributions or on the sale of fund shares.
Cumulative Performance: June 26, 2015, Through September 30, 2017
Initial Investment of $100,000,000

| | | |
| | Average Annual Total Returns | |
| | Periods Ended September 30, 2017 | |
| | | Since | Final Value |
| | One | Inception | of a $100,000,000 |
| | Year | (6/26/2015) | Investment |
| Institutional Target Retirement 2035 | | | |
| Fund* | 14.85% | 7.25% | $117,171,318 |
| Target 2035 Composite Index | 14.94 | 7.44 | 117,644,510 |
| Mixed-Asset Target 2035 Funds | | | |
| Average | 14.35 | 6.55 | 115,442,130 |
| MSCI US Broad Market Index | 18.67 | 10.09 | 124,295,206 |
For a benchmark description, see the Glossary.
Mixed-Asset Target 2035 Funds Average: Derived from data provided by Lipper, a Thomson Reuters Company.
"Since Inception" performance is calculated from the fund's inception date for both the fund and its comparative standards.
66
Institutional Target Retirement 2035 Fund
Fiscal-Year Total Returns (%): June 26, 2015, Through September 30, 2017

67
Institutional Target Retirement 2035 Fund
Financial Statements
Statement of Net Assets
As of September 30, 2017
The fund reports a complete list of its holdings in regulatory filings four times in each fiscal year, at the quarter-ends. For the second and fourth fiscal quarters, the lists appear in the fund’s semiannual and annual reports to shareholders. For the first and third fiscal quarters, the fund files the lists with the Securities and Exchange Commission on Form N-Q. Shareholders can look up the fund’s Forms N-Q on the SEC’s website at sec.gov. Forms N-Q may also be reviewed and copied at the SEC’s Public Reference Room (see the back cover of this report for further information).
| | |
| | | Market |
| | | Value• |
| | Shares | ($000) |
| Investment Companies (100.0%) | | |
| U.S. Stock Fund (47.6%) | | |
| Vanguard Total Stock Market Index Fund Institutional Shares | 132,540,141 | 8,357,981 |
| |
| International Stock Fund (31.2%) | | |
| Vanguard Total International Stock Index Fund Investor Shares | 312,502,123 | 5,490,662 |
| |
| U.S. Bond Fund (15.1%) | | |
| 1 Vanguard Total Bond Market II Index Fund Investor Shares | 247,361,769 | 2,659,139 |
| |
| International Bond Fund (6.1%) | | |
| Vanguard Total International Bond Index Fund Admiral Shares | 48,906,808 | 1,064,701 |
| Total Investment Companies (Cost $15,454,487) | | 17,572,483 |
| Temporary Cash Investment (0.0%) | | |
| Money Market Fund (0.0%) | | |
| 1 Vanguard Market Liquidity Fund, 1.223% (Cost $3,600) | 35,987 | 3,600 |
| Total Investments (100.0%) (Cost $15,458,087) | | 17,576,083 |
| Other Assets and Liabilities (0.0%) | | |
| Other Assets | | 112,130 |
| Liabilities | | (112,259) |
| | | (129) |
| Net Assets (100%) | | |
| Applicable to 771,674,800 outstanding $.001 par value shares of | | |
| beneficial interest (unlimited authorization) | | 17,575,954 |
| Net Asset Value Per Share | | $22.78 |
68
| |
| Institutional Target Retirement 2035 Fund | |
| |
| |
| |
| |
| | Amount |
| | ($000) |
| Statement of Assets and Liabilities | |
| Assets | |
| Investments in Securities, at Value—Affiliated Vanguard Funds | 17,576,083 |
| Receivables for Accrued Income | 6,018 |
| Receivables for Capital Shares Issued | 106,112 |
| Total Assets | 17,688,213 |
| Liabilities | |
| Payables for Investment Securities Purchased | 72,477 |
| Payables for Capital Shares Redeemed | 39,773 |
| Other Liabilities | 9 |
| Total Liabilities | 112,259 |
| Net Assets | 17,575,954 |
| |
| |
| At September 30, 2017, net assets consisted of: | |
| | Amount |
| | ($000) |
| Paid-in Capital | 15,220,059 |
| Undistributed Net Investment Income | 235,131 |
| Accumulated Net Realized Gains | 2,768 |
| Unrealized Appreciation (Depreciation) | 2,117,996 |
| Net Assets | 17,575,954 |
• See Note A in Notes to Financial Statements.
1 Affiliated fund available only to Vanguard funds and certain trusts and accounts managed by Vanguard. Rate shown for Vanguard
Market Liquidity Fund is the 7-day yield.
See accompanying Notes, which are an integral part of the Financial Statements.
69
| |
| Institutional Target Retirement 2035 Fund | |
| |
| |
| Statement of Operations | |
| |
| | Year Ended |
| | September 30, 2017 |
| | ($000) |
| Investment Income | |
| Income | |
| Income Distributions Received from Affiliated Funds | 321,318 |
| Net Investment Income—Note B | 321,318 |
| Realized Net Gain (Loss) | |
| Capital Gain Distributions Received from Affiliated Funds | 1,723 |
| Affiliated Investment Securities Sold | 2,465 |
| Futures Contracts | 8 |
| Realized Net Gain (Loss) | 4,196 |
| Change in Unrealized Appreciation (Depreciation) of Investment Securities | 1,669,268 |
| Net Increase (Decrease) in Net Assets Resulting from Operations | 1,994,782 |
See accompanying Notes, which are an integral part of the Financial Statements.
70
| | |
| Institutional Target Retirement 2035 Fund | | |
| |
| |
| Statement of Changes in Net Assets | | |
| |
| | Year Ended September 30, |
| | 2017 | 2016 |
| | ($000) | ($000) |
| Increase (Decrease) in Net Assets | | |
| Operations | | |
| Net Investment Income | 321,318 | 184,298 |
| Realized Net Gain (Loss) | 4,196 | 1,217 |
| Change in Unrealized Appreciation (Depreciation) | 1,669,268 | 688,907 |
| Net Increase (Decrease) in Net Assets Resulting from Operations | 1,994,782 | 874,422 |
| Distributions | | |
| Net Investment Income | (225,679) | (54,138) |
| Realized Capital Gain1 | (2,578) | — |
| Total Distributions | (228,257) | (54,138) |
| Capital Share Transactions | | |
| Issued | 5,844,698 | 6,102,339 |
| Issued in Lieu of Cash Distributions | 225,973 | 53,955 |
| Redeemed | (962,824) | (311,926) |
| Net Increase (Decrease) from Capital Share Transactions | 5,107,847 | 5,844,368 |
| Total Increase (Decrease) | 6,874,372 | 6,664,652 |
| Net Assets | | |
| Beginning of Period | 10,701,582 | 4,036,930 |
| End of Period2 | 17,575,954 | 10,701,582 |
1 Includes fiscal 2017 and 2016 short-term gain distributions totaling $1,489,000 and $0, respectively. Short-term gain distributions
are treated as ordinary income dividends for tax purposes.
2 Net Assets—End of Period includes undistributed (overdistributed) net investment income of $235,131,000 and $144,710,000.
See accompanying Notes, which are an integral part of the Financial Statements.
71
| | | |
| Institutional Target Retirement 2035 Fund | | | |
| |
| |
| Financial Highlights | | | |
| |
| |
| | | | June 26, |
| | Year Ended | 20151 to |
| | September 30, | Sept. 30, |
| For a Share Outstanding Throughout Each Period | 2017 | 2016 | 2015 |
| Net Asset Value, Beginning of Period | $20.23 | $18.27 | $20.00 |
| Investment Operations | | | |
| Net Investment Income2 | .489 | .457 | .142 |
| Capital Gain Distributions Received 2 | .003 | .003 | — |
| Net Realized and Unrealized Gain (Loss) on Investments | 2.457 | 1.664 | (1.872) |
| Total from Investment Operations | 2.949 | 2.124 | (1.730) |
| Distributions | | | |
| Dividends from Net Investment Income | (.394) | (.164) | — |
| Distributions from Realized Capital Gains | (.005) | — | — |
| Total Distributions | (.399) | (.164) | — |
| Net Asset Value, End of Period | $22.78 | $20.23 | $18.27 |
| |
| Total Return | 14.85% | 11.68% | -8.65% |
| |
| Ratios/Supplemental Data | | | |
| Net Assets, End of Period (Millions) | $17,576 | $10,702 | $4,037 |
| Ratio of Total Expenses to Average Net Assets | — | — | — |
| Acquired Fund Fees and Expenses | 0.09% | 0.10% | 0.10%3 |
| Ratio of Net Investment Income to Average Net Assets | 2.30% | 2.37% | 2.62%3 |
| Portfolio Turnover Rate | 4% | 2% | 0% |
1 Inception.
2 Calculated based on average shares outstanding.
3 Annualized.
See accompanying Notes, which are an integral part of the Financial Statements.
72
Institutional Target Retirement 2035 Fund
Notes to Financial Statements
Vanguard Institutional Target Retirement 2035 Fund is registered under the Investment Company Act of 1940 as an open-end investment company, or mutual fund. The fund follows a balanced investment strategy by investing in selected Vanguard funds to achieve its targeted allocation of assets to U.S. and international stocks, and U.S. and international bonds. Financial statements and other information about each underlying fund are available on vanguard.com.
A. The following significant accounting policies conform to generally accepted accounting principles for U.S. investment companies. The fund consistently follows such policies in preparing its financial statements.
1. Security Valuation: Investments are valued at the net asset value of each underlying Vanguard fund determined as of the close of the New York Stock Exchange (generally 4 p.m., Eastern time) on the valuation date.
2. Futures Contracts: The fund uses stock and bond futures contracts to a limited extent, with the objectives of maintaining full exposure to the market and maintaining its target asset allocation. The primary risks associated with the use of futures contracts are imperfect correlation between changes in market values of investments held by the fund and the prices of futures contracts, and the possibility of an illiquid market. Counterparty risk involving futures is mitigated because a regulated clearinghouse is the counterparty instead of the clearing broker. To further mitigate counterparty risk, the fund trades futures contracts on an exchange, monitors the financial strength of its clearing brokers and clearinghouse, and has entered into clearing agreements with its clearing brokers. The clearinghouse imposes initial margin requirements to secure the fund’s performance and requires daily settlement of variation margin representing changes in the market value of each contract.
Futures contracts are valued at their quoted daily settlement prices. The notional amounts of the contracts are not recorded in the Statement of Net Assets. Fluctuations in the value of the contracts are recorded in the Statement of Assets and Liabilities as an asset (liability) and in the Statement of Operations as unrealized appreciation (depreciation) until the contracts are closed, when they are recorded as realized futures gains (losses).
During the year ended September 30, 2017, the fund’s average investments in long and short futures contracts represented less than 1% and 0% of net assets, respectively, based on the average of the notional amounts at each quarter-end during the period. The fund had no open futures contracts at September 30, 2017.
3. Federal Income Taxes: The fund intends to continue to qualify as a regulated investment company and distribute all of its taxable income. Management has analyzed the fund’s tax positions taken for all open federal income tax years (September 30, 2015–2017), and has concluded that no provision for federal income tax is required in the fund’s financial statements.
4. Distributions: Distributions to shareholders are recorded on the ex-dividend date.
73
Institutional Target Retirement 2035 Fund
5. Credit Facility: The fund and certain other funds managed by The Vanguard Group (“Vanguard”) participate in a $3.1 billion committed credit facility provided by a syndicate of lenders pursuant to a credit agreement that may be renewed annually; each fund is individually liable for its borrowings, if any, under the credit facility. Borrowings may be utilized for temporary and emergency purposes, and are subject to the fund’s regulatory and contractual borrowing restrictions. The participating funds are charged administrative fees and an annual commitment fee of 0.10% of the undrawn amount of the facility; these fees are allocated to the funds based on a method approved by the fund’s board of trustees and borne by the funds in which the fund invests (see Note B). Any borrowings under this facility bear interest at a rate based upon the higher of the one-month London Interbank Offered Rate, federal funds effective rate, or overnight bank funding rate plus an agreed-upon spread.
The fund had no borrowings outstanding at September 30, 2017, or at any time during the period then ended.
6. Other: Income and capital gain distributions received are recorded on the ex-dividend date. Security transactions are accounted for on the date securities are bought or sold. Costs used to determine realized gains (losses) on the sale of investment securities are those of the specific securities sold.
B. In accordance with the terms of a Funds’ Service Agreement (the “FSA”) between Vanguard and the fund, Vanguard furnishes to the fund investment advisory, corporate management, administrative, marketing, and distribution services at Vanguard’s cost of operations (as defined by the FSA). These costs of operations are allocated to the fund based on methods and guidelines approved by the board of trustees. The FSA provides that expenses otherwise allocable to Vanguard funds-of-funds may be reduced or eliminated to the extent of savings realized by the underlying Vanguard funds by virtue of being part of a fund-of-funds. Accordingly, all expenses for services provided by Vanguard to the fund and all other expenses incurred by the fund during the period ended September 30, 2017, were borne by the underlying Vanguard funds in which the fund invests. The fund’s trustees and officers are also trustees and officers, respectively, of the underlying Vanguard funds, as well as directors and employees, respectively, of Vanguard.
C. Various inputs may be used to determine the value of the fund’s investments. These inputs are summarized in three broad levels for financial statement purposes. The inputs or methodologies used to value securities are not necessarily an indication of the risk associated with investing in those securities.
Level 1—Quoted prices in active markets for identical securities.
Level 2—Other significant observable inputs (including quoted prices for similar securities, interest rates, prepayment speeds, credit risk, etc.).
Level 3—Significant unobservable inputs (including the fund’s own assumptions used to determine the fair value of investments). Any investments valued with significant unobservable inputs are noted on the Statement of Net Assets.
At September 30, 2017, 100% of the market value of the fund’s investments was determined based on Level 1 inputs.
74
Institutional Target Retirement 2035 Fund
D. Distributions are determined on a tax basis and may differ from net investment income and realized capital gains for financial reporting purposes. Differences may be permanent or temporary. Permanent differences are reclassified among capital accounts in the financial statements to reflect their tax character. Temporary differences arise when certain items of income, expense, gain, or loss are recognized in different periods for financial statement and tax purposes. These differences will reverse at some time in the future. Differences in classification may also result from the treatment of short-term gains as ordinary income for tax purposes.
The fund used a tax accounting practice to treat a portion of the price of capital shares redeemed during the year as distributions from net investment income and realized capital gains. Accordingly, the fund has reclassified $5,240,000 from undistributed net investment income and $46,000 from accumulated net realized gains to paid-in capital.
For tax purposes, at September 30, 2017, the fund had $237,432,000 of ordinary income and $467,000 of long-term capital gains available for distribution.
At September 30, 2017, the cost of investment securities for tax purposes was $15,458,087,000. Net unrealized appreciation of investment securities for tax purposes was $2,117,996,000, consisting entirely of unrealized gains on securities that had risen in value since their purchase.
| | |
| E. Capital shares issued and redeemed were: | | |
| | Year Ended September 30, |
| | 2017 | 2016 |
| | Shares | Shares |
| | (000) | (000) |
| Issued | 276,466 | 321,366 |
| Issued in Lieu of Cash Distributions | 11,310 | 2,831 |
| Redeemed | (45,006) | (16,279) |
| Net Increase (Decrease) in Shares Outstanding | 242,770 | 307,918 |
At September 30, 2017, one shareholder was the record or beneficial owner of 31% of the fund’s net assets. If the shareholder were to redeem its investment in the fund, the redemption might lead to the realization of taxable capital gains.
75
Institutional Target Retirement 2035 Fund
F. Transactions during the period in affiliated underlying Vanguard funds were as follows:
| | | | | | | | |
| | | | | | Current Period Transactions | |
| Sept. 30, | | Proceeds | | | | | Sept. 30, |
| | 2016 | | from | Realized | Change in | | Capital Gain | 2017 |
| | Market | Purchases | Securities | Net Gain | Unrealized | | Distributions | Market |
| | Value | at Cost | Sold | (Loss) | App. (Dep.) | Income | Received | Value |
| | ($000) | ($000) | ($000) | ($000) | ($000) | ($000) | ($000) | ($000) |
| Vanguard Market | | | | | | | | |
| Liquidity Fund | 1,869 | NA1 | NA1 | — | — | 28 | — | 3,600 |
| Vanguard Total | | | | | | | | |
| Bond Market II | | | | | | | | |
| Index Fund | 1,483,982 | 1,450,440 | 243,085 | 139 | (32,337) | 48,159 | 1,723 | 2,659,139 |
| Vanguard Total | | | | | | | | |
| International Bond | | | | | | | | |
| Index Fund | 634,610 | 444,254 | — | — | (14,163) | 13,330 | — | 1,064,701 |
| Vanguard Total | | | | | | | | |
| International Stock | | | | | | | | |
| Index Fund | 3,406,782 | 1,471,072 | 103,177 | 584 | 715,401 | 125,648 | — | 5,490,662 |
| Vanguard Total | | | | | | | | |
| Stock Market | | | | | | | | |
| Index Fund | 5,140,542 | 2,481,705 | 266,375 | 1,742 | 1,000,367 | 134,153 | — | 8,357,981 |
| Total | 10,667,785 | 5,847,471 | 612,637 | 2,465 | 1,669,268 | 321,318 | 1,723 | 17,576,083 |
| 1 Not applicable—purchases and sales are for temporary cash investment purposes. | | | |
G. Management has determined that no material events or transactions occurred subsequent to September 30, 2017, that would require recognition or disclosure in these financial statements.
76
Report of Independent Registered Public Accounting Firm
To the Board of Trustees of Vanguard Chester Funds and the Shareholders of Vanguard Institutional Target Retirement Income Fund, Vanguard Institutional Target Retirement 2015 Fund, Vanguard Institutional Target Retirement 2020 Fund, Vanguard Institutional Target Retirement 2025 Fund, Vanguard Institutional Target Retirement 2030 Fund and Vanguard Institutional Target Retirement 2035 Fund In our opinion, the accompanying statements of net assets and statements of assets and liabilities, and the related statements of operations and of changes in net assets and the financial highlights present fairly, in all material respects, the financial position of Vanguard Institutional Target Retirement Income Fund, Vanguard Institutional Target Retirement 2015 Fund, Vanguard Institutional Target Retirement 2020 Fund, Vanguard Institutional Target Retirement 2025 Fund, Vanguard Institutional Target Retirement 2030 Fund and Vanguard Institutional Target Retirement 2035 Fund (constituting separate portfolios of Vanguard Chester Funds, hereafter referred to as the “Funds”) as of September 30, 2017, the results of each of their operations for the year then ended, the changes in each of their net assets for each of the two years in the period then ended and the financial highlights for each of the periods indicated, in conformity with accounting principles generally accepted in the United States of America. These financial statements and financial highlights (hereafter referred to as “financial statements”) are the responsibility of the Funds’ management. Our responsibility is to express an opinion on these financial statements based on our audits. We conducted our audits of these financial statements in accordance with the standards of the Public Company Accounting Oversight Board (United States). Those standards require that we plan and perform the audit to obtain reasonable assurance about whether the financial statements are free of material misstatement. An audit includes examining, on a test basis, evidence supporting the amounts and disclosures in the financial statements, assessing the accounting principles used and significant estimates made by management, and evaluating the overall financial statement presentation. We believe that our audits, which included confirmation of securities as of September 30, 2017 by agreement to the underlying ownership records of the transfer agent, provide a reasonable basis for our opinion.
/s/PricewaterhouseCoopers LLP
Philadelphia, Pennsylvania
November 16, 2017
77
Special 2017 tax information (unaudited) for Vanguard Institutional Target Retirement Funds
This information for the fiscal year ended September 30, 2017, is included pursuant to provisions of the Internal Revenue Code.
The funds distributed capital gain dividends (20% rate gain distributions) to shareholders during the fiscal year as follows:
| |
| Fund | ($000) |
| Institutional Target Retirement Income Fund | 914 |
| Institutional Target Retirement 2015 Fund | 1,513 |
| Institutional Target Retirement 2020 Fund | 2,699 |
| Institutional Target Retirement 2025 Fund | 2,663 |
| Institutional Target Retirement 2030 Fund | 1,735 |
| Institutional Target Retirement 2035 Fund | 1,096 |
For nonresident alien shareholders, 100% of short-term capital gain dividends distributed by the funds are qualified short-term capital gains.
The funds distributed qualified dividend income to shareholders during the fiscal year as follows:
| |
| Fund | ($000) |
| Institutional Target Retirement Income Fund | 15,730 |
| Institutional Target Retirement 2015 Fund | 50,355 |
| Institutional Target Retirement 2020 Fund | 120,547 |
| Institutional Target Retirement 2025 Fund | 160,209 |
| Institutional Target Retirement 2030 Fund | 151,222 |
| Institutional Target Retirement 2035 Fund | 153,891 |
For corporate shareholders, the percentage of investment income (dividend income plus short-term gains, if any) that qualifies for the dividends-received deduction is as follows:
| |
| Fund | Percentage |
| Institutional Target Retirement Income Fund | 16.2% |
| Institutional Target Retirement 2015 Fund | 21.9 |
| Institutional Target Retirement 2020 Fund | 26.1 |
| Institutional Target Retirement 2025 Fund | 29.4 |
| Institutional Target Retirement 2030 Fund | 32.7 |
| Institutional Target Retirement 2035 Fund | 35.8 |
78
The funds designate to shareholders foreign source income and foreign taxes paid as follows:
| | |
| | Foreign Source Income | Foreign Taxes Paid |
| Fund | ($000) | ($000) |
| Institutional Target Retirement Income Fund | 16,892 | 703 |
| Institutional Target Retirement 2015 Fund | 50,679 | 2,439 |
| Institutional Target Retirement 2020 Fund | 125,009 | 6,568 |
| Institutional Target Retirement 2025 Fund | 163,877 | 9,088 |
| Institutional Target Retirement 2030 Fund | 150,556 | 8,772 |
| Institutional Target Retirement 2035 Fund | 147,060 | 8,921 |
Shareholders will receive more detailed information with their Form 1099-DIV in January 2018 to determine the calendar-year amounts to be included on their 2017 tax returns.
79
About Your Fund’s Expenses
As a shareholder of the fund, you incur ongoing costs, which include costs for portfolio management, administrative services, and shareholder reports (like this one), among others. Operating expenses, which are deducted from a fund’s gross income, directly reduce the investment return of the fund.
A typical fund’s expenses are expressed as a percentage of its average net assets. The Institutional Target Retirement Funds have no direct expenses, but each fund bears its proportionate share of the costs for the underlying funds in which it invests. These indirect expenses make up the acquired fund fees and expenses, also expressed as a percentage of average net assets.
The following examples are intended to help you understand the ongoing cost (in dollars) of investing in your fund and to compare these costs with those of other mutual funds. The examples are based on an investment of $1,000 made at the beginning of the period shown and held for the entire period. The costs were calculated using the acquired fund fees and expenses for each Institutional Target Retirement Fund.
The accompanying table illustrates your fund’s costs in two ways:
• Based on actual fund return. This section helps you to estimate the actual expenses that you paid over the period. The ”Ending Account Value“ shown is derived from the fund‘s actual return, and the third column shows the dollar amount that would have been paid by an investor who started with $1,000 in the fund. You may use the information here, together with the amount you invested, to estimate the expenses that you paid over the period.
To do so, simply divide your account value by $1,000 (for example, an $8,600 account value divided by $1,000 = 8.6), then multiply the result by the number given for your fund under the heading ”Expenses Paid During Period.“
• Based on hypothetical 5% yearly return. This section is intended to help you compare your fund‘s costs with those of other mutual funds. It assumes that the fund had a yearly return of 5% before expenses, but that the expense ratio is unchanged. In this case—because the return used is not the fund’s actual return—the results do not apply to your investment. The example is useful in making comparisons because the Securities and Exchange Commission requires all mutual funds to calculate expenses based on a 5% return. You can assess your fund’s costs by comparing this hypothetical example with the hypothetical examples that appear in shareholder reports of other funds.
Note that the expenses shown in the table are meant to highlight and help you compare ongoing costs only and do not reflect transaction costs incurred by the fund for buying and selling securities. Further, the expenses do not include any purchase, redemption, or account service fees described in the fund prospectus. If such fees were applied to your account, your costs would be higher. Your fund does not carry a “sales load.”
The calculations assume no shares were bought or sold during the period. Your actual costs may have been higher or lower, depending on the amount of your investment and the timing of any purchases or redemptions.
You can find more information about the fund’s expenses, including annual expense ratios, in the Financial Statements section of this report. For additional information on operating expenses and other shareholder costs, please refer to your fund’s current prospectus.
80
| | | |
| Six Months Ended September 30, 2017 | | | |
| | Beginning | Ending | Expenses |
| | Account Value | Account Value | Paid During |
| | 3/31/2017 | 9/30/2017 | Period |
| Based on Actual Fund Return | | | |
| Institutional Target Retirement Income Fund | $1,000.00 | $1,038.04 | $0.46 |
| Institutional Target Retirement 2015 Fund | $1,000.00 | $1,049.93 | $0.46 |
| Institutional Target Retirement 2020 Fund | $1,000.00 | $1,060.09 | $0.46 |
| Institutional Target Retirement 2025 Fund | $1,000.00 | $1,067.49 | $0.47 |
| Institutional Target Retirement 2030 Fund | $1,000.00 | $1,073.09 | $0.47 |
| Institutional Target Retirement 2035 Fund | $1,000.00 | $1,079.10 | $0.47 |
| Based on Hypothetical 5% Yearly Return | | | |
| Institutional Target Retirement Income Fund | $1,000.00 | $1,024.62 | $0.46 |
| Institutional Target Retirement 2015 Fund | $1,000.00 | $1,024.62 | $0.46 |
| Institutional Target Retirement 2020 Fund | $1,000.00 | $1,024.62 | $0.46 |
| Institutional Target Retirement 2025 Fund | $1,000.00 | $1,024.62 | $0.46 |
| Institutional Target Retirement 2030 Fund | $1,000.00 | $1,024.62 | $0.46 |
| Institutional Target Retirement 2035 Fund | $1,000.00 | $1,024.62 | $0.46 |
The calculations are based on the acquired fund fees and expenses for the most recent six-month period. The funds’ annualized expense figures for that period are (in order as listed from top to bottom above) 0.09%, 0.09%, 0.09%, 0.09%, 0.09%, and 0.09%. The dollar amounts shown as ”Expenses Paid” are equal to the annualized expense figures for the underlying funds multiplied by the average account value over the period, multiplied by the number of days in the most recent six-month period, then divided by the number of days in the most recent 12-month period (183/365).
81
Glossary
30-Day SEC Yield. A fund’s 30-day SEC yield is derived using a formula specified by the U.S. Securities and Exchange Commission. Under the formula, data related to the fund’s security holdings in the previous 30 days are used to calculate the fund’s hypothetical net income for that period, which is then annualized and divided by the fund’s estimated average net assets over the calculation period. For the purposes of this calculation, a security’s income is based on its current market yield to maturity (for bonds), its actual income (for asset-backed securities), or its projected dividend yield (for stocks). Because the SEC yield represents hypothetical annualized income, it will differ—at times significantly—from the fund’s actual experience. As a result, the fund’s income distributions may be higher or lower than implied by the SEC yield.
Acquired Fund Fees and Expenses. Funds that invest in other Vanguard funds incur no direct expenses, but they do bear proportionate shares of the operating, administrative, and advisory expenses of the underlying funds, and they must pay any fees charged by those funds. The figure for acquired fund fees and expenses represents a weighted average of these underlying costs. Acquired is a term that the Securities and Exchange Commission applies to any mutual fund whose shares are owned by another fund.
Expense Ratio. A fund’s total annual operating expenses expressed as a percentage of the fund’s average net assets. The expense ratio includes management and administrative expenses, but does not include the transaction costs of buying and selling portfolio securities.
Inception Date. The date on which the assets of a fund (or one of its share classes) are first invested in accordance with the fund’s investment objective. For funds with a subscription period, the inception date is the day after that period ends. Investment performance is measured from the inception date.
Benchmark Information
Target 2015 Composite Index: Derived by applying the fund’s target asset allocation to the results of the following benchmarks: for international stocks of developed markets, the MSCI EAFE Index through December 15, 2010, the MSCI ACWI ex USA IMI Index through June 2, 2013, and the FTSE Global All Cap ex US Index thereafter; for emerging-market stocks, the Select Emerging Markets Index through August 23, 2006, the MSCI Emerging Markets Index through December 15, 2010, the MSCI ACWI ex USA IMI Index through June 2, 2013, and the FTSE Global All Cap ex US Index thereafter; for U.S. bonds, the Bloomberg Barclays U.S. Aggregate Bond Index through December 31, 2009, and the Bloomberg Barclays U.S. Aggregate Float Adjusted Index thereafter, as well as the Bloomberg Barclays U.S. Treasury Inflation-Protected Securities Index through June 2, 2013, and the Bloomberg Barclays U.S. Treasury Inflation-Protected Securities (TIPS) 0–5 Year Index thereafter; for international bonds, the Bloomberg Barclays Global Aggregate ex-USD Float Adjusted RIC Capped Index beginning June 3, 2013; and for U.S. stocks, the Dow Jones U.S. Total Stock Market Index (formerly known as the Dow Jones Wilshire 5000 Index) through April 22, 2005, the MSCI US Broad Market Index through June 2, 2013, and the CRSP US Total Market Index thereafter. International stock benchmark returns are adjusted for withholding taxes.
82
Target 2020 Composite Index: Derived by applying the fund’s target asset allocation to the results of the following benchmarks: for international stocks of developed markets, the MSCI EAFE Index through December 15, 2010, the MSCI ACWI ex USA IMI Index through June 2, 2013, and the FTSE Global All Cap ex US Index thereafter; for emerging-market stocks, the Select Emerging Markets Index through August 23, 2006, the MSCI Emerging Markets Index through December 15, 2010, the MSCI ACWI ex USA IMI Index through June 2, 2013, and the FTSE Global All Cap ex US Index thereafter; for U.S. bonds, the Bloomberg Barclays U.S. Aggregate Bond Index through December 31, 2009, and the Bloomberg Barclays U.S. Aggregate Float Adjusted Index thereafter; for international bonds, the Bloomberg Barclays Global Aggregate ex-USD Float Adjusted RIC Capped Index beginning June 3, 2013; and for U.S. stocks, the MSCI US Broad Market Index through June 2, 2013, and the CRSP US Total Market Index thereafter. International stock benchmark returns are adjusted for withholding taxes.
Target 2025 Composite Index: Derived by applying the fund’s target asset allocation to the results of the following benchmarks: for international stocks of developed markets, the MSCI EAFE Index through December 15, 2010, the MSCI ACWI ex USA IMI Index through June 2, 2013, and the FTSE Global All Cap ex US Index thereafter; for emerging-market stocks, the Select Emerging Markets Index through August 23, 2006, the MSCI Emerging Markets Index through December 15, 2010, the MSCI ACWI ex USA IMI Index through June 2, 2013, and the FTSE Global All Cap ex US Index thereafter; for U.S. bonds, the Bloomberg Barclays U.S. Aggregate Bond Index through December 31, 2009, and the Bloomberg Barclays U.S. Aggregate Float Adjusted Index thereafter; for international bonds, the Bloomberg Barclays Global Aggregate ex-USD Float Adjusted RIC Capped Index beginning June 3, 2013; and for U.S. stocks, the Dow Jones U.S. Total Stock Market Index (formerly known as the Dow Jones Wilshire 5000 Index) through April 22, 2005, the MSCI US Broad Market Index through June 2, 2013, and the CRSP US Total Market Index thereafter. International stock benchmark returns are adjusted for withholding taxes.
Target 2030 Composite Index: Derived by applying the fund’s target asset allocation to the results of the following benchmarks: for international stocks of developed markets, the MSCI EAFE Index through December 15, 2010, the MSCI ACWI ex USA IMI Index through June 2, 2013, and the FTSE Global All Cap ex US Index thereafter; for emerging-market stocks, the Select Emerging Markets Index through August 23, 2006, the MSCI Emerging Markets Index through December 15, 2010, the MSCI ACWI ex USA IMI Index through June 2, 2013, and the FTSE Global All Cap ex US Index thereafter; for U.S. bonds, the Bloomberg Barclays U.S. Aggregate Bond Index through December 31, 2009, and the Bloomberg Barclays U.S. Aggregate Float Adjusted Index thereafter; for international bonds, the Bloomberg Barclays Global Aggregate ex-USD Float Adjusted RIC Capped Index beginning June 3, 2013; and for U.S. stocks, the MSCI US Broad Market Index through June 2, 2013, and the CRSP US Total Market Index thereafter. International stock benchmark returns are adjusted for withholding taxes.
83
Target 2035 Composite Index: Derived by applying the fund’s target asset allocation to the results of the following benchmarks: for international stocks of developed markets, the MSCI EAFE Index through December 15, 2010, the MSCI ACWI ex USA IMI Index through June 2, 2013, and the FTSE Global All Cap ex US Index thereafter; for emerging-market stocks, the Select Emerging Markets Index through August 23, 2006, the MSCI Emerging Markets Index through December 15, 2010, the MSCI ACWI ex USA IMI Index through June 2, 2013, and the FTSE Global All Cap ex US Index thereafter; for U.S. bonds, the Bloomberg Barclays U.S. Aggregate Bond Index through December 31, 2009, and the Bloomberg Barclays U.S. Aggregate Float Adjusted Index thereafter; for international bonds, the Bloomberg Barclays Global Aggregate ex-USD Float Adjusted RIC Capped Index beginning June 3, 2013; and for U.S. stocks, the Dow Jones U.S. Total Stock Market Index (formerly known as the Dow Jones Wilshire 5000 Index) through April 22, 2005, the MSCI US Broad Market Index through June 2, 2013, and the CRSP US Total Market Index thereafter. International stock benchmark returns are adjusted for withholding taxes.
Target Income Composite Index: Derived by applying the fund’s target asset allocation to the results of the following benchmarks: for international stocks of developed markets, the MSCI EAFE Index through December 15, 2010, the MSCI ACWI ex USA IMI Index through June 2, 2013, and the FTSE Global All Cap ex US Index thereafter; for emerging-market stocks, the Select Emerging Markets Index through August 23, 2006, the MSCI Emerging Markets Index through December 15, 2010, the MSCI ACWI ex USA IMI Index through June 2, 2013, and the FTSE Global All Cap ex US Index thereafter; for U.S. bonds, the Bloomberg Barclays U.S. Aggregate Bond Index through December 31, 2009, and the Bloomberg Barclays U.S. Aggregate Float Adjusted Index thereafter, as well as the Bloomberg Barclays U.S. Treasury Inflation-Protected Securities Index through June 2, 2013, and the Bloomberg Barclays U.S. Treasury Inflation-Protected Securities (TIPS) 0–5 Year Index thereafter; for short-term reserves, the Citigroup Three-Month Treasury Bill Index through June 2, 2013; for international bonds, the Bloomberg Barclays Global Aggregate ex-USD Float Adjusted RIC Capped Index beginning June 3, 2013; and for U.S. stocks, the Dow Jones U.S. Total Stock Market Index (formerly known as the Dow Jones Wilshire 5000 Index) through April 22, 2005, the MSCI US Broad Market Index through June 2, 2013, and the CRSP US Total Market Index thereafter. International stock benchmark returns are adjusted for withholding taxes.
84
BLOOMBERG is a trademark and service mark of Bloomberg Finance L.P. BARCLAYS is a trademark and service mark of Barclays Bank Plc, used under license. Bloomberg Finance L.P. and its affiliates, including Bloomberg Index Services Limited (BISL) (collectively, Bloomberg), or Bloomberg’s licensors, own all proprietary rights in the Bloomberg Barclays U.S. Aggregate Bond Index, Bloomberg Barclays U.S. Aggregate Float Adjusted Index, Bloomberg Barclays U.S. Treasury Inflation Protected Securities Index, Bloomberg Barclays U.S. Treasury Inflation-Protected Securities (TIPS) 0–5 Year Index, and the Bloomberg Barclays Global Aggregate ex-USD Float Adjusted RIC Capped Index (USD Hedged) (the Indices or Bloomberg Barclays Indices).
Neither Barclays Bank Plc, Barclays Capital Inc., or any affiliate (collectively Barclays) or Bloomberg is the issuer or producer of the Target Retirement Funds (including the Total Bond Market II Index Fund, the Total International Bond Index Fund, and the Short-Term Inflation-Protected Securities Index Fund) and neither Bloomberg nor Barclays has any responsibilities, obligations or duties to investors in the Target Retirement Funds. The Indices are licensed for use by The Vanguard Group, Inc. (Vanguard) as the sponsor of the Target Retirement Funds. Bloomberg and Barclays’ only relationship with Vanguard in respect to the Indices is the licensing of the Indices, which is determined, composed and calculated by BISL, or any successor thereto, without regard to the Issuer or the Target Retirement Funds or the owners of the Target Retirement Funds.
Additionally, Vanguard may for itself execute transaction(s) with Barclays in or relating to the Indices in connection with the Target Retirement Funds. Investors acquire the Target Retirement Funds from Vanguard and investors neither acquire any interest in the Indices nor enter into any relationship of any kind whatsoever with Bloomberg or Barclays upon making an investment in the Target Retirement Funds. The Target Retirement Funds are not sponsored, endorsed, sold or promoted by Bloomberg or Barclays. Neither Bloomberg nor Barclays makes any representation or warranty, express or implied regarding the advisability of investing in the Target Retirement Funds or the advisability of investing in securities generally or the ability of the Indices to track corresponding or relative market performance. Neither Bloomberg nor Barclays has passed on the legality or suitability of the Target Retirement Funds with respect to any person or entity. Neither Bloomberg nor Barclays is responsible for and has not participated in the determination of the timing of, prices at, or quantities of the Target Retirement Funds to be issued. Neither Bloomberg nor Barclays has any obligation to take the needs of the Issuer or the owners of the Target Retirement Funds or any other third party into consideration in determining, composing or calculating the Indices. Neither Bloomberg nor Barclays has any obligation or liability in connection with administration, marketing or trading of the Target Retirement Funds.
85
The licensing agreement between Bloomberg and Barclays is solely for the benefit of Bloomberg and Barclays and not for the benefit of the owners of the Target Retirement Funds, investors or other third parties. In addition, the licensing agreement between Vanguard and Bloomberg is solely for the benefit of Vanguard and Bloomberg and not for the benefit of the owners of the Target Retirement Funds, investors or other third parties.
NEITHER BLOOMBERG NOR BARCLAYS SHALL HAVE ANY LIABILITY TO THE ISSUER, INVESTORS OR TO OTHER THIRD PARTIES FOR THE QUALITY, ACCURACY AND/OR COMPLETENESS OF THE BLOOMBERG BARCLAYS INDICES OR ANY DATA INCLUDED THEREIN OR FOR INTERRUPTIONS IN THE DELIVERY OF THE BLOOMBERG BARCLAYS INDICES. NEITHER BLOOMBERG NOR BARCLAYS MAKES ANY WARRANTY, EXPRESS OR IMPLIED, AS TO RESULTS TO BE OBTAINED BY THE ISSUER, THE INVESTORS OR ANY OTHER PERSON OR ENTITY FROM THE USE OF THE BLOOMBERG BARCLAYS INDICES OR ANY DATA INCLUDED THEREIN. NEITHER BLOOMBERG NOR BARCLAYS MAKES ANY EXPRESS OR IMPLIED WARRANTIES, AND EACH HEREBY EXPRESSLY DISCLAIMS ALL WARRANTIES OF MERCHANTABILITY OR FITNESS FOR A PARTICULAR PURPOSE OR USE WITH RESPECT TO BLOOMBERG BARCLAYS INDICES OR ANY DATA INCLUDED THEREIN. BLOOMBERG RESERVES THE RIGHT TO CHANGE THE METHODS OF CALCULATION OR PUBLICATION, OR TO CEASE THE CALCULATION OR PUBLICATION OF THE BLOOMBERG BARCLAYS INDICES, AND NEITHER BLOOMBERG NOR BARCLAYS SHALL BE LIABLE FOR ANY MISCALCULATION OF OR ANY INCORRECT, DELAYED OR INTERRUPTED PUBLICATION WITH RESPECT TO ANY OF THE BLOOMBERG BARCLAYS INDICES. NEITHER BLOOMBERG NOR BARCLAYS SHALL BE LIABLE FOR ANY DAMAGES, INCLUDING, WITHOUT LIMITATION, ANY SPECIAL, INDIRECT OR CONSEQUENTIAL DAMAGES, OR ANY LOST PROFITS AND EVEN IF ADVISED OF THE POSSIBLITY OF SUCH, RESULTING FROM THE USE OF BLOOMBERG BARCLAYS INDICES OR ANY DATA INCLUDED THEREIN OR WITH RESPECT TO THE TARGET RETIREMENT FUNDS.
None of the information supplied by Bloomberg or Barclays and used in this publication may be reproduced in any manner without the prior written permission of both Bloomberg and Barclays Capital, the investment banking division of Barclays Bank Plc. Barclays Bank Plc is registered in England No. 1026167. Registered office 1 Churchill Place London E14 5HP.
© 2017 Bloomberg. Used with Permission.
Source: Bloomberg Index Services Limited. Copyright 2017, Bloomberg. All rights reserved.
86
This page intentionally left blank.
This page intentionally left blank.
This page intentionally left blank.
This page intentionally left blank.
The People Who Govern Your Fund
The trustees of your mutual fund are there to see that the fund is operated and managed in your best interests since, as a shareholder, you are a part owner of the fund. Your fund’s trustees also serve on the board of directors of The Vanguard Group, Inc., which is owned by the Vanguard funds and provides services to them on an at-cost basis.
A majority of Vanguard’s board members are independent, meaning that they have no affiliation with Vanguard or the funds they oversee, apart from the sizable personal investments they have made as private individuals. The independent board members have distinguished backgrounds in business, academia, and public service. Each of the trustees and executive officers oversees 198 Vanguard funds.
Information for each trustee and executive officer of the fund appears below. The mailing address of the trustees and officers is P.O. Box 876, Valley Forge, PA 19482. More information about the trustees is in the Statement of Additional Information, which can be obtained, without charge, by contacting Vanguard at 800-662-7447, or online at vanguard.com.
Interested Trustee1
F. William McNabb III
Born 1957. Trustee Since July 2009. Chairman of the Board. Principal Occupation(s) During the Past Five Years and Other Experience: Chairman of the Board of The Vanguard Group, Inc., and of each of the investment companies served by The Vanguard Group, since January 2010; Chief Executive Officer and Director of The Vanguard Group and President and Chief Executive Officer of each of the investment companies served by The Vanguard Group, since 2008; Director of Vanguard Marketing Corporation; President of The Vanguard Group (2008–2017); Managing Director of The Vanguard Group (1995–2008).
Independent Trustees
Emerson U. Fullwood
Born 1948. Trustee Since January 2008. Principal Occupation(s) During the Past Five Years and Other Experience: Executive Chief Staff and Marketing Officer for North America and Corporate Vice President (retired 2008) of Xerox Corporation (document management products and services);
Executive in Residence and 2009–2010 Distinguished Minett Professor at the Rochester Institute of Technology; Lead Director of SPX FLOW, Inc. (multi-industry manufacturing); Director of the United Way of Rochester, the University of Rochester Medical Center, Monroe Community College Foundation, North Carolina A&T University, and Roberts Wesleyan College; Trustee of the University of Rochester.
Rajiv L. Gupta
Born 1945. Trustee Since December 2001.2 Principal Occupation(s) During the Past Five Years and Other Experience: Chairman and Chief Executive Officer (retired 2009) and President (2006–2008) of Rohm and Haas Co. (chemicals); Director of Arconic Inc. (diversified manufacturer), HP Inc. (printer and personal computer manufacturing), and Delphi Automotive plc (automotive components); Senior Advisor at New Mountain Capital.
Amy Gutmann
Born 1949. Trustee Since June 2006. Principal Occupation(s) During the Past Five Years and Other Experience: President of the University of Pennsylvania; Christopher H. Browne
1 Mr. McNabb is considered an “interested person,” as defined in the Investment Company Act of 1940, because he is an officer of the
Vanguard funds.
2 December 2002 for Vanguard Equity Income Fund, the Vanguard Municipal Bond Funds, and the Vanguard State Tax-Exempt Funds.
Distinguished Professor of Political Science, School of Arts and Sciences, and Professor of Communication, Annenberg School for Communication, with secondary faculty appointments in the Department of Philosophy, School of Arts and Sciences, and at the Graduate School of Education, University of Pennsylvania; Trustee of the National Constitution Center.
JoAnn Heffernan Heisen
Born 1950. Trustee Since July 1998. Principal Occupation(s) During the Past Five Years and Other Experience: Corporate Vice President and Member of the Executive Committee (1997–2008), Chief Global Diversity Officer (retired 2008), Vice President and Chief Information Officer (1997–2006), Controller (1995–1997), Treasurer (1991–1995), and Assistant Treasurer (1989–1991) of Johnson & Johnson (pharmaceuticals/medical devices/ consumer products); Director of Skytop Lodge Corporation (hotels) and the Robert Wood Johnson Foundation; Member of the Advisory Board of the Institute for Women’s Leadership at Rutgers University.
F. Joseph Loughrey
Born 1949. Trustee Since October 2009. Principal Occupation(s) During the Past Five Years and Other Experience: President and Chief Operating Officer (retired 2009) of Cummins Inc. (industrial machinery); Chairman of the Board of Hillenbrand, Inc. (specialized consumer services), Oxfam America, and the Lumina Foundation for Education; Director of the V Foundation for Cancer Research; Member of the Advisory Council for the College of Arts and Letters and Chair of the Advisory Board to the Kellogg Institute for International Studies, both at the University of Notre Dame.
Mark Loughridge
Born 1953. Trustee Since March 2012. Principal Occupation(s) During the Past Five Years and Other Experience: Senior Vice President and Chief Financial Officer (retired 2013) at IBM (information technology services); Fiduciary Member of IBM’s Retirement Plan Committee (2004–2013); Member of the Council on Chicago Booth.
Scott C. Malpass
Born 1962. Trustee Since March 2012. Principal Occupation(s) During the Past Five Years and Other Experience: Chief Investment Officer and Vice President at the University of Notre Dame; Assistant Professor of Finance at the Mendoza College of Business at Notre Dame; Member of the Notre Dame 403(b) Investment Committee, the Board of Advisors for Spruceview Capital Partners, the Board of Catholic Investment Services, Inc. (investment advisor), and the Board of Superintendence of the Institute for the Works of Religion; Chairman of the Board of TIFF Advisory Services, Inc. (investment advisor).
André F. Perold
Born 1952. Trustee Since December 2004. Principal Occupation(s) During the Past Five Years and Other Experience: George Gund Professor of Finance and Banking, Emeritus at the Harvard Business School (retired 2011); Chief Investment Officer and Co-Managing Partner of HighVista Strategies LLC (private investment firm); Overseer of the Museum of Fine Arts Boston.
Peter F. Volanakis
Born 1955. Trustee Since July 2009. Principal Occupation(s) During the Past Five Years and Other Experience: President and Chief Operating Officer (retired 2010) of Corning Incorporated (communications equipment); Chairman of the Board of Trustees of Colby-Sawyer College; Member of the Board of Hypertherm, Inc. (industrial cutting systems, software, and consumables).
Executive Officers
Glenn Booraem
Born 1967. Investment Stewardship Officer Since February 2017. Principal Occupation(s) During the Past Five Years and Other Experience: Principal of The Vanguard Group, Inc.; Treasurer (2015–2017), Controller (2010–2015), and Assistant Controller (2001–2010) of each of the investment companies served by The Vanguard Group.
Thomas J. Higgins
Born 1957. Chief Financial Officer Since September 2008. Principal Occupation(s) During the Past Five Years and Other Experience: Principal of The Vanguard Group, Inc.; Chief Financial Officer of each of the investment companies served by The Vanguard Group; Treasurer of each of the investment companies served by The Vanguard Group (1998–2008).
Peter Mahoney
Born 1974. Controller Since May 2015. Principal Occupation(s) During the Past Five Years and Other Experience: Principal of The Vanguard Group, Inc.; Controller of each of the investment companies served by The Vanguard Group; Head of International Fund Services at The Vanguard Group (2008–2014).
Anne E. Robinson
Born 1970. Secretary Since September 2016. Principal Occupation(s) During the Past Five Years and Other Experience: Managing Director of The Vanguard Group, Inc.; General Counsel of The Vanguard Group; Secretary of The Vanguard Group and of each of the investment companies served by The Vanguard Group; Director and Senior Vice President of Vanguard Marketing Corporation; Managing Director and General Counsel of Global Cards and Consumer Services at Citigroup (2014–2016); Counsel at American Express (2003–2014).
Michael Rollings
Born 1963. Treasurer Since February 2017. Principal Occupation(s) During the Past Five Years and Other Experience: Managing Director of The Vanguard Group, Inc.; Treasurer of each of the investment companies served by The Vanguard Group; Director of Vanguard Marketing Corporation; Executive Vice President and Chief Financial Officer of MassMutual Financial Group (2006–2016).
Vanguard Senior Management Team
| |
| Mortimer J. Buckley | Chris D. McIsaac |
| Gregory Davis | James M. Norris |
| John James | Thomas M. Rampulla |
| Martha G. King | Karin A. Risi |
| John T. Marcante | |
| |
| |
| Chairman Emeritus and Senior Advisor |
| |
| John J. Brennan | |
| Chairman, 1996–2009 | |
| Chief Executive Officer and President, 1996–2008 |
| |
| |
| Founder | |
| |
| John C. Bogle | |
| Chairman and Chief Executive Officer, 1974–1996 |
|  |
| P.O. Box 2600
Valley Forge, PA 19482-2600 |
Connect with Vanguard® > vanguard.com | |
| | |
| Fund Information > 800-662-7447 | |
| Direct Investor Account Services > 800-662-2739 | |
| Institutional Investor Services > 800-523-1036 | |
| Text Telephone for People | |
| Who Are Deaf or Hard of Hearing> 800-749-7273 | |
| |
| This material may be used in conjunction | |
| with the offering of shares of any Vanguard | |
| fund only if preceded or accompanied by | |
| the fund’s current prospectus. | |
| |
| All comparative mutual fund data are from Lipper, a | |
| Thomson Reuters Company, or Morningstar, Inc., unless | |
| otherwise noted. | |
| |
| You can obtain a free copy of Vanguard’s proxy voting | |
| guidelines by visiting vanguard.com/proxyreporting or by | |
| calling Vanguard at 800-662-2739. The guidelines are | |
| also available from the SEC’s website, sec.gov. In | |
| addition, you may obtain a free report on how your fund | |
| voted the proxies for securities it owned during the 12 | |
| months ended June 30. To get the report, visit either | |
| vanguard.com/proxyreporting or sec.gov. | |
| |
| You can review and copy information about your fund at | |
| the SEC’s Public Reference Room in Washington, D.C. To | |
| find out more about this public service, call the SEC at | |
| 202-551-8090. Information about your fund is also | |
| available on the SEC’s website, and you can receive | |
| copies of this information, for a fee, by sending a | |
| request in either of two ways: via email addressed to | |
| publicinfo@sec.gov or via regular mail addressed to the | |
| Public Reference Section, Securities and Exchange | |
| Commission, Washington, DC 20549-1520. | |
| | © 2017 The Vanguard Group, Inc. |
| | All rights reserved. |
| | Vanguard Marketing Corporation, Distributor. |
| |
| | Q6730 112017 |
 |
| Annual Report | September 30, 2017 |
| |
| Vanguard Institutional Target |
| Retirement Funds |
| Vanguard Institutional Target Retirement 2040 Fund |
| Vanguard Institutional Target Retirement 2045 Fund |
| Vanguard Institutional Target Retirement 2050 Fund |
| Vanguard Institutional Target Retirement 2055 Fund |
| Vanguard Institutional Target Retirement 2060 Fund |
| Vanguard Institutional Target Retirement 2065 Fund |
Vanguard’s Principles for Investing Success
We want to give you the best chance of investment success. These principles, grounded in Vanguard’s research and experience, can put you on the right path.
Goals. Create clear, appropriate investment goals.
Balance. Develop a suitable asset allocation using broadly diversified funds. Cost. Minimize cost.
Discipline. Maintain perspective and long-term discipline.
A single theme unites these principles: Focus on the things you can control. We believe there is no wiser course for any investor.
| |
| Contents | |
| Your Fund’s Performance at a Glance. | 1 |
| Chairman’s Perspective. | 3 |
| Institutional Target Retirement 2040 Fund. | 7 |
| Institutional Target Retirement 2045 Fund. | 18 |
| Institutional Target Retirement 2050 Fund. | 29 |
| Institutional Target Retirement 2055 Fund. | 40 |
| Institutional Target Retirement 2060 Fund. | 51 |
| Institutional Target Retirement 2065 Fund. | 62 |
| About Your Fund’s Expenses. | 76 |
| Glossary. | 78 |
Please note: The opinions expressed in this report are just that—informed opinions. They should not be considered promises or advice. Also, please keep in mind that the information and opinions cover the period through the date on the front of this report. Of course, the risks of investing in your fund are spelled out in the prospectus.
See the Glossary for definitions of investment terms used in this report.
About the cover: Nautical images have been part of Vanguard’s rich heritage since its start in 1975. For an incoming ship, a lighthouse offers a beacon and safe path to shore. You can similarly depend on Vanguard to put you first––and light the way––as you strive to meet your financial goals. Our client focus and low costs, stemming from our unique ownership structure, assure that your interests are paramount.
Your Fund’s Performance at a Glance
• For the 12 months ended September 30, 2017, five of the six Vanguard Institutional Target Retirement Funds covered in this report recorded returns ranging from 16.35% for the Institutional Target Retirement 2040 Fund to 16.95% for the Institutional Target Retirement 2055 Fund. In July, the Institutional Target Retirement 2065 Fund was launched. (The funds with retirement dates of 2015 through 2035 are covered in a separate report.) The funds with a greater allocation to stocks performed best.
• Each fund posted returns that were in line with those of its composite benchmark after expenses. With the exception of the Institutional Target Retirement 2065 Fund, which matched the average return of its peers, each fund surpassed its peer-group average.
• Vanguard Target Retirement Funds are designed to reach an allocation of 70% bonds and 30% stocks within seven years after their target date.
| |
| Total Returns: Fiscal Year Ended September 30, 2017 | |
| | Total |
| | Returns |
| Vanguard Institutional Target Retirement 2040 Fund | 16.35% |
| Target 2040 Composite Index | 16.45 |
| Mixed-Asset Target 2040 Funds Average | 14.90 |
| Mixed-Asset Target 2040 Funds Average: Derived from data provided by Lipper, a Thomson Reuters Company. | |
| |
| Vanguard Institutional Target Retirement 2045 Fund | 16.87% |
| Target 2045 Composite Index | 17.01 |
| Mixed-Asset Target 2045 Funds Average | 16.08 |
| Mixed-Asset Target 2045 Funds Average: Derived from data provided by Lipper, a Thomson Reuters Company. | |
| |
| Vanguard Institutional Target Retirement 2050 Fund | 16.92% |
| Target 2050 Composite Index | 17.01 |
| Mixed-Asset Target 2050 Funds Average | 15.80 |
| Mixed-Asset Target 2050 Funds Average: Derived from data provided by Lipper, a Thomson Reuters Company. | |
| |
| Vanguard Institutional Target Retirement 2055 Fund | 16.95% |
| Target 2055 Composite Index | 17.01 |
| Mixed-Asset Target 2055+ Funds Average | 16.62 |
| Mixed-Asset Target 2055+ Funds Average: Derived from data provided by Lipper, a Thomson Reuters Company. | |
1
| |
| | Total |
| | Returns |
| Vanguard Institutional Target Retirement 2060 Fund | 16.90% |
| Target 2060 Composite Index | 17.01 |
| Mixed-Asset Target 2055+ Funds Average | 16.62 |
| Mixed-Asset Target 2055+ Funds Average: Derived from data provided by Lipper, a Thomson Reuters Company. | |
| |
| Vanguard Institutional Target Retirement 2065 Fund (Inception: 7/12/2017) | 4.00% |
| Target 2065 Composite Index | 3.84 |
| Mixed-Asset Target 2055+ Funds Average | 4.00 |
| Mixed-Asset Target 2055+ Funds Average: Derived from data provided by Lipper, a Thomson Reuters Company. | |
| For a benchmark description, see the Glossary. | |
Investments in Target Retirement Funds are subject to the risks of their underlying funds. The year in the fund name refers to the approximate year (the target date) when an investor in the fund would retire and leave the work force. The fund will gradually shift its emphasis from more aggressive investments to more conservative ones based on its target date. An investment in a Target Retirement Fund is not guaranteed at any time, including on or after the target date.
2
Chairman’s Perspective

Bill McNabb
Chairman and Chief Executive Officer
Dear Shareholder,
Our investors depend on Vanguard to be a responsible steward of their assets. This includes our obvious responsibilities—managing the funds, offering investment perspectives and advice, and assisting with questions and transactions.
But because a long-term perspective informs every aspect of our investment approach, we also work on your behalf in less obvious ways, such as by advocating for responsible governance among the companies in which Vanguard funds invest. Vanguard’s index funds are essentially permanent owners of thousands of publicly traded companies, and we have a special obligation to be engaged stewards actively focused on the long term.
Simply put, we believe that well-governed companies are more likely to perform well over the long run.
Although Vanguard has always been an advocate for strong corporate governance, we have expanded our efforts recently as our investor base continues to grow. Our Investment Stewardship team has doubled in size since 2015, and we continue to add analysts, researchers, and operations team members. The team guides our engagement activities and our funds’ proxy voting by analyzing corporate governance practices in companies around the world.
3
Our four Investment Stewardship pillars
As we evaluate company responsiveness to governance matters, including environmental and social concerns, we focus on four key areas—what we call our Investment Stewardship pillars:
• The board: A high-functioning, well-composed, independent, diverse, and experienced board with effective ongoing evaluation practices.
• Governance structures: Provisions and structures that empower shareholders and protect their rights.
• Appropriate compensation: Pay that incentivizes relative outperformance over the long term.
• Risk oversight: Effective, integrated, and ongoing oversight of relevant industry-and company-specific risks.
Guided by these pillars, our Investment Stewardship team conducted more than 950 engagements, or discussions, with company directors and leaders worldwide during the 12 months ended June 30, 2017.
| | | |
| Market Barometer | | | |
| | | Average Annual Total Returns |
| | Periods Ended September 30, 2017 |
| | One Year | Three Years | Five Years |
| Stocks | | | |
| Russell 1000 Index (Large-caps) | 18.54% | 10.63% | 14.27% |
| Russell 2000 Index (Small-caps) | 20.74 | 12.18 | 13.79 |
| Russell 3000 Index (Broad U.S. market) | 18.71 | 10.74 | 14.23 |
| FTSE All-World ex US Index (International) | 19.49 | 5.11 | 7.35 |
| |
| Bonds | | | |
| Bloomberg Barclays U.S. Aggregate Bond Index | | | |
| (Broad taxable market) | 0.07% | 2.71% | 2.06% |
| Bloomberg Barclays Municipal Bond Index | | | |
| (Broad tax-exempt market) | 0.87 | 3.19 | 3.01 |
| Citigroup Three-Month U.S. Treasury Bill Index | 0.64 | 0.28 | 0.18 |
| |
| CPI | | | |
| Consumer Price Index | 2.23% | 1.22% | 1.30% |
4
We also cast more than 171,000 votes on behalf of Vanguard funds at more than 18,000 shareholder meetings.
Gender diversity on boards and climate risk
As we engage with companies, we are devoting increased attention to two specific topics. The first is gender diversity on boards. It’s no secret that the right combination of talent, skills, and experience leads to better results, so we pay close attention to how company boards are structured and managed, and how they evolve.
In recent years, a growing body of research has demonstrated that greater diversity on boards can lead to improved governance and company performance. We are advocating for boards to incorporate diverse perspectives and experience into their strategic planning and decision-making. One example of our commitment to more diverse boards is our participation in the 30% Club, a global coalition working to increase the representation of women in boardrooms and leadership roles.
The second issue is climate risk. We will continue to engage with companies to understand their responses to this risk. Regardless of one’s perspective on the issue, the potential is real for changing regulations, demographics, and consumption behavior to affect business results for companies in many sectors.
We want to ensure that such business and regulatory risks are sufficiently disclosed so investors can value companies appropriately. In the past year, we have voted for shareholder proposals at several energy companies that called for management to improve its climate risk assessment and planning, and we will consider supporting similar proposals if we believe they are beneficial to long-term shareholder value. When a proposal from a shareholder presents a strong case for change, we’re more than willing to fully consider it. And even if the case falls short, these proposals often catalyze a discussion that generates meaningful change over time.
In addition to considering activists’ proposals, we consult research providers and our own network of experts. When we detect material risks to a company’s long-term value (such as bad leadership, poor disclosure, misaligned compensation structures, or threats to shareholder rights), we act with our voice and our vote.
Our stewardship reflects our mission
But we don’t act as independent agents with our own agenda. Every time we speak with a company chairman, CEO, or director, we’re acutely aware of the role we play in representing the economic interests of more than 20 million Vanguard investors. So you can expect us to speak out when we detect threats to the economic interests of our shareholders.
5
We take positions on these matters not because they are inherently good or noble but because they are tied to the long-term economic value of your funds’ investments.
You trust us to represent your interests across the globe. You can be confident we act on that responsibility with the seriousness and dedication it deserves.
To learn more about our Investment Stewardship program, including how our funds have voted, visit https://about. vanguard.com/investment-stewardship/.
As always, thank you for investing with Vanguard.
Sincerely,

F. William McNabb III
Chairman and Chief Executive Officer
October 13, 2017
6
Institutional Target Retirement 2040 Fund
Fund Profile
As of September 30, 2017
| |
| Total Fund Characteristics | |
| Ticker Symbol | VIRSX |
| 30-Day SEC Yield | 2.12% |
| Acquired Fund Fees and Expenses1 | 0.09% |
| |
| Allocation to Underlying Vanguard Funds | |
| Vanguard Total Stock Market Index | |
| Fund Institutional Shares | 52.4% |
| Vanguard Total International Stock | |
| Index Fund Investor Shares | 33.9 |
| Vanguard Total Bond Market II | |
| Index Fund Investor Shares | 9.8 |
| Vanguard Total International Bond | |
| Index Fund Admiral Shares | 3.9 |
Fund Asset Allocation
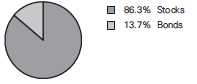
Institutional Target Retirement 2040 Fund
Performance Summary
All of the returns in this report represent past performance, which is not a guarantee of future results that may be achieved by the fund. (Current performance may be lower or higher than the performance data cited. For performance data current to the most recent month-end, visit our website at vanguard.com/performance.) Note, too, that both investment returns and principal value can fluctuate widely, so an investor’s shares, when sold, could be worth more or less than their original cost. The returns shown do not reflect taxes that a shareholder would pay on fund distributions or on the sale of fund shares.
Cumulative Performance: June 26, 2015, Through September 30, 2017
Initial Investment of $100,000,000

| | | |
| | Average Annual Total Returns | |
| | Periods Ended September 30, 2017 | |
| | | Since | Final Value |
| | One | Inception | of a $100,000,000 |
| | Year | (6/26/2015) | Investment |
| Institutional Target Retirement 2040 | | | |
| Fund* | 16.35% | 7.56% | $117,919,776 |
| Target 2040 Composite Index | 16.45 | 7.78 | 118,487,297 |
| Mixed-Asset Target 2040 Funds | | | |
| Average | 14.90 | 6.65 | 115,696,887 |
| MSCI US Broad Market Index | 18.67 | 10.09 | 124,295,206 |
For a benchmark description, see the Glossary.
Mixed-Asset Target 2040 Funds Average: Derived from data provided by Lipper, a Thomson Reuters Company.
"Since Inception" performance is calculated from the fund's inception date for both the fund and its comparative standards.
See Financial Highlights for dividend and capital gains information.
8
Institutional Target Retirement 2040 Fund
Fiscal-Year Total Returns (%): June 26, 2015, Through September 30, 2017
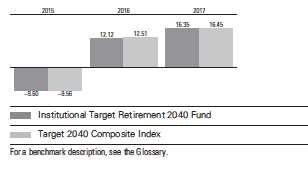
9
Institutional Target Retirement 2040 Fund
Financial Statements
Statement of Net Assets
As of September 30, 2017
The fund reports a complete list of its holdings in regulatory filings four times in each fiscal year, at the quarter-ends. For the second and fourth fiscal quarters, the lists appear in the fund’s semiannual and annual reports to shareholders. For the first and third fiscal quarters, the fund files the lists with the Securities and Exchange Commission on Form N-Q. Shareholders can look up the fund’s Forms N-Q on the SEC’s website at sec.gov. Forms N-Q may also be reviewed and copied at the SEC’s Public Reference Room (see the back cover of this report for further information).
| | |
| | | Market |
| | | Value• |
| | Shares | ($000) |
| Investment Companies (100.0%) | | |
| U.S. Stock Fund (52.4%) | | |
| Vanguard Total Stock Market Index Fund Institutional Shares | 123,378,468 | 7,780,246 |
| |
| International Stock Fund (33.9%) | | |
| Vanguard Total International Stock Index Fund Investor Shares | 287,127,413 | 5,044,829 |
| |
| U.S. Bond Fund (9.8%) | | |
| 1 Vanguard Total Bond Market II Index Fund Investor Shares | 135,131,061 | 1,452,659 |
| |
| International Bond Fund (3.9%) | | |
| Vanguard Total International Bond Index Fund Admiral Shares | 26,892,810 | 585,456 |
| Total Investment Companies (Cost $12,936,525) | | 14,863,190 |
| Temporary Cash Investment (0.0%) | | |
| Money Market Fund (0.0%) | | |
| 1 Vanguard Market Liquidity Fund, 1.223% (Cost $2,675) | 26,747 | 2,675 |
| Total Investments (100.0%) (Cost $12,939,200) | | 14,865,865 |
| Other Assets and Liabilities (0.0%) | | |
| Other Assets | | 166,352 |
| Liabilities | | (169,703) |
| | | (3,351) |
| Net Assets (100%) | | |
| Applicable to 648,144,908 outstanding $.001 par value shares of | | |
| beneficial interest (unlimited authorization) | | 14,862,514 |
| Net Asset Value Per Share | | $22.93 |
10
| |
| Institutional Target Retirement 2040 Fund | |
| |
| |
| |
| |
| | Amount |
| | ($000) |
| Statement of Assets and Liabilities | |
| Assets | |
| Investments in Securities, at Value—Affiliated Vanguard Funds | 14,865,865 |
| Receivables for Accrued Income | 3,375 |
| Receivables for Capital Shares Issued | 162,977 |
| Total Assets | 15,032,217 |
| Liabilities | |
| Payables for Investment Securities Purchased | 140,253 |
| Payables for Capital Shares Redeemed | 29,450 |
| Total Liabilities | 169,703 |
| Net Assets | 14,862,514 |
| |
| |
| At September 30, 2017, net assets consisted of: | |
| | Amount |
| | ($000) |
| Paid-in Capital | 12,736,540 |
| Undistributed Net Investment Income | 197,319 |
| Accumulated Net Realized Gains | 1,990 |
| Unrealized Appreciation (Depreciation) | 1,926,665 |
| Net Assets | 14,862,514 |
• See Note A in Notes to Financial Statements.
1 Affiliated fund available only to Vanguard funds and certain trusts and accounts managed by Vanguard. Rate shown for Vanguard
Market Liquidity Fund is the 7-day yield.
See accompanying Notes, which are an integral part of the Financial Statements.
11
| |
| Institutional Target Retirement 2040 Fund | |
| |
| |
| Statement of Operations | |
| |
| | Year Ended |
| | September 30, 2017 |
| | ($000) |
| Investment Income | |
| Income | |
| Income Distributions Received from Affiliated Funds | 268,994 |
| Other Income | 132 |
| Net Investment Income—Note B | 269,126 |
| Realized Net Gain (Loss) | |
| Capital Gain Distributions Received from Affiliated Funds | 880 |
| Affiliated Investment Securities Sold | 1,795 |
| Realized Net Gain (Loss) | 2,675 |
| Change in Unrealized Appreciation (Depreciation) of Investment Securities | 1,540,042 |
| Net Increase (Decrease) in Net Assets Resulting from Operations | 1,811,843 |
See accompanying Notes, which are an integral part of the Financial Statements.
12
| | |
| Institutional Target Retirement 2040 Fund | | |
| |
| |
| Statement of Changes in Net Assets | | |
| |
| | Year Ended September 30, |
| | 2017 | 2016 |
| | ($000) | ($000) |
| Increase (Decrease) in Net Assets | | |
| Operations | | |
| Net Investment Income | 269,126 | 150,878 |
| Realized Net Gain (Loss) | 2,675 | 584 |
| Change in Unrealized Appreciation (Depreciation) | 1,540,042 | 573,943 |
| Net Increase (Decrease) in Net Assets Resulting from Operations | 1,811,843 | 725,405 |
| Distributions | | |
| Net Investment Income | (185,811) | (42,868) |
| Realized Capital Gain1 | (1,229) | — |
| Total Distributions | (187,040) | (42,868) |
| Capital Share Transactions | | |
| Issued | 5,265,281 | 5,238,013 |
| Issued in Lieu of Cash Distributions | 185,271 | 42,639 |
| Redeemed | (937,018) | (270,523) |
| Net Increase (Decrease) from Capital Share Transactions | 4,513,534 | 5,010,129 |
| Total Increase (Decrease) | 6,138,337 | 5,692,666 |
| Net Assets | | |
| Beginning of Period | 8,724,177 | 3,031,511 |
| End of Period2 | 14,862,514 | 8,724,177 |
1 Includes fiscal 2017 and 2016 short-term gain distributions totaling $709,000 and $0, respectively. Short-term gain distributions are
treated as ordinary income dividends for tax purposes.
2 Net Assets—End of Period includes undistributed (overdistributed) net investment income of $197,319,000 and $118,844,000.
See accompanying Notes, which are an integral part of the Financial Statements.
13
| | | |
| Institutional Target Retirement 2040 Fund | | | |
| |
| |
| Financial Highlights | | | |
| |
| |
| | | | June 26, |
| | Year Ended | 20151 to |
| | September 30, | Sept. 30, |
| For a Share Outstanding Throughout Each Period | 2017 | 2016 | 2015 |
| Net Asset Value, Beginning of Period | $20.10 | $18.08 | $20.00 |
| Investment Operations | | | |
| Net Investment Income2 | .494 | .461 | .151 |
| Capital Gain Distributions Received 2 | .002 | .002 | — |
| Net Realized and Unrealized Gain (Loss) on Investments | 2.730 | 1.718 | (2.071) |
| Total from Investment Operations | 3.226 | 2.181 | (1.920) |
| Distributions | | | |
| Dividends from Net Investment Income | (.393) | (.161) | — |
| Distributions from Realized Capital Gains | (.003) | — | — |
| Total Distributions | (.396) | (.161) | — |
| Net Asset Value, End of Period | $22.93 | $20.10 | $18.08 |
| |
| Total Return | 16.35% | 12.12% | -9.60% |
| |
| Ratios/Supplemental Data | | | |
| Net Assets, End of Period (Millions) | $14,863 | $8,724 | $3,032 |
| Ratio of Total Expenses to Average Net Assets | — | — | — |
| Acquired Fund Fees and Expenses | 0.09% | 0.10% | 0.10%3 |
| Ratio of Net Investment Income to Average Net Assets | 2.32% | 2.62% | 2.81%3 |
| Portfolio Turnover Rate | 5% | 0% | 1% |
1 Inception.
2 Calculated based on average shares outstanding.
3 Annualized.
See accompanying Notes, which are an integral part of the Financial Statements.
14
Institutional Target Retirement 2040 Fund
Notes to Financial Statements
Vanguard Institutional Target Retirement 2040 Fund is registered under the Investment Company Act of 1940 as an open-end investment company, or mutual fund. The fund follows a balanced investment strategy by investing in selected Vanguard funds to achieve its targeted allocation of assets to U.S. and international stocks, and U.S. and international bonds. Financial statements and other information about each underlying fund are available on vanguard.com.
A. The following significant accounting policies conform to generally accepted accounting principles for U.S. investment companies. The fund consistently follows such policies in preparing its financial statements.
1. Security Valuation: Investments are valued at the net asset value of each underlying Vanguard fund determined as of the close of the New York Stock Exchange (generally 4 p.m., Eastern time) on the valuation date.
2. Federal Income Taxes: The fund intends to continue to qualify as a regulated investment company and distribute all of its taxable income. Management has analyzed the fund’s tax positions taken for all open federal income tax years (September 30, 2015–2017), and has concluded that no provision for federal income tax is required in the fund’s financial statements.
3. Distributions: Distributions to shareholders are recorded on the ex-dividend date.
4. Credit Facility: The fund and certain other funds managed by The Vanguard Group (“Vanguard”) participate in a $3.1 billion committed credit facility provided by a syndicate of lenders pursuant to a credit agreement that may be renewed annually; each fund is individually liable for its borrowings, if any, under the credit facility. Borrowings may be utilized for temporary and emergency purposes, and are subject to the fund’s regulatory and contractual borrowing restrictions. The participating funds are charged administrative fees and an annual commitment fee of 0.10% of the undrawn amount of the facility; these fees are allocated to the funds based on a method approved by the fund’s board of trustees and borne by the funds in which the fund invests (see Note B). Any borrowings under this facility bear interest at a rate based upon the higher of the one-month London Interbank Offered Rate, federal funds effective rate, or overnight bank funding rate plus an agreed-upon spread.
The fund had no borrowings outstanding at September 30, 2017, or at any time during the period then ended.
5. Other: Income and capital gain distributions received are recorded on the ex-dividend date. Security transactions are accounted for on the date securities are bought or sold. Costs used to determine realized gains (losses) on the sale of investment securities are those of the specific securities sold.
B. In accordance with the terms of a Funds’ Service Agreement (the “FSA”) between Vanguard and the fund, Vanguard furnishes to the fund investment advisory, corporate management, administrative, marketing, and distribution services at Vanguard’s cost of operations (as defined by the FSA). These costs of operations are allocated to the fund based on methods and guidelines approved by the board of trustees. The FSA provides that expenses otherwise allocable to Vanguard funds-of-funds may be reduced or eliminated to the extent of savings realized by the underlying Vanguard funds by virtue of being part of a fund-of-funds. Accordingly, all expenses for services provided by Vanguard to the fund and all other expenses incurred by the fund during the period ended September 30, 2017, were borne by the underlying Vanguard funds in which the fund invests. The fund’s trustees and officers are also trustees and officers, respectively, of the underlying Vanguard funds, as well as directors and employees, respectively, of Vanguard.
15
Institutional Target Retirement 2040 Fund
C. Various inputs may be used to determine the value of the fund’s investments. These inputs are summarized in three broad levels for financial statement purposes. The inputs or methodologies used to value securities are not necessarily an indication of the risk associated with investing in those securities.
Level 1—Quoted prices in active markets for identical securities.
Level 2—Other significant observable inputs (including quoted prices for similar securities, interest rates, prepayment speeds, credit risk, etc.).
Level 3—Significant unobservable inputs (including the fund’s own assumptions used to determine the fair value of investments). Any investments valued with significant unobservable inputs are noted on the Statement of Net Assets.
At September 30, 2017, 100% of the market value of the fund’s investments was determined based on Level 1 inputs.
D. Distributions are determined on a tax basis and may differ from net investment income and realized capital gains for financial reporting purposes. Differences may be permanent or temporary. Permanent differences are reclassified among capital accounts in the financial statements to reflect their tax character. Temporary differences arise when certain items of income, expense, gain, or loss are recognized in different periods for financial statement and tax purposes. These differences will reverse at some time in the future. Differences in classification may also result from the treatment of short-term gains as ordinary income for tax purposes.
The fund used a tax accounting practice to treat a portion of the price of capital shares redeemed during the year as distributions from net investment income and realized capital gains. Accordingly, the fund has reclassified $4,845,000 from undistributed net investment income and $37,000 from accumulated net realized gains to paid-in capital.
For tax purposes, at September 30, 2017, the fund had $198,981,000 of ordinary income and $328,000 of long-term capital gains available for distribution.
At September 30, 2017, the cost of investment securities for tax purposes was $12,939,200,000. Net unrealized appreciation of investment securities for tax purposes was $1,926,665,000, consisting entirely of unrealized gains on securities that had risen in value since their purchase.
| | |
| E. Capital shares issued and redeemed were: | | |
| | Year Ended September 30, |
| | 2017 | 2016 |
| | Shares | Shares |
| | (000) | (000) |
| Issued | 248,613 | 278,300 |
| Issued in Lieu of Cash Distributions | 9,301 | 2,249 |
| Redeemed | (43,745) | (14,266) |
| Net Increase (Decrease) in Shares Outstanding | 214,169 | 266,283 |
At September 30, 2017, one shareholder was the record or beneficial owner of 31% of the fund’s net assets. If the shareholder were to redeem its investment in the fund, the redemption might lead to the realization of taxable capital gains.
16
Institutional Target Retirement 2040 Fund
F. Transactions during the period in affiliated underlying Vanguard funds were as follows:
| | | | | | | | |
| | | | | | Current Period Transactions | |
| Sept. 30, | | Proceeds | | | | | Sept. 30, |
| | 2016 | | from | Realized | Change in | | Capital Gain | 2017 |
| | Market | Purchases | Securities | Net Gain | Unrealized | | Distributions | Market |
| | Value | at Cost | Sold | (Loss) | App. (Dep.) | Income | Received | Value |
| | ($000) | ($000) | ($000) | ($000) | ($000) | ($000) | ($000) | ($000) |
| Vanguard Market | | | | | | | | |
| Liquidity Fund | 2 | NA1 | NA1 | (2) | — | 20 | — | 2,675 |
| Vanguard Total | | | | | | | | |
| Bond Market II | | | | | | | | |
| Index Fund | 752,334 | 854,386 | 138,268 | — | (15,793) | 25,333 | 880 | 1,452,659 |
| Vanguard Total | | | | | | | | |
| International Bond | | | | | | | | |
| Index Fund | 322,118 | 270,325 | — | — | (6,987) | 6,929 | — | 585,456 |
| Vanguard Total | | | | | | | | |
| International Stock | | | | | | | | |
| Index Fund | 3,049,503 | 1,439,009 | 98,394 | 800 | 653,911 | 114,424 | — | 5,044,829 |
| Vanguard Total | | | | | | | | |
| Stock Market | | | | | | | | |
| Index Fund | 4,584,021 | 2,572,511 | 286,194 | 997 | 908,911 | 122,288 | — | 7,780,246 |
| Total | 8,707,978 | 5,136,231 | 522,856 | 1,795 | 1,540,042 | 268,994 | 880 14,865,865 |
| 1 Not applicable—purchases and sales are for temporary cash investment purposes. | | | |
G. Management has determined that no material events or transactions occurred subsequent to September 30, 2017, that would require recognition or disclosure in these financial statements.
17
Institutional Target Retirement 2045 Fund
Fund Profile
As of September 30, 2017
| |
| Total Fund Characteristics | |
| Ticker Symbol | VITLX |
| 30-Day SEC Yield | 2.12% |
| Acquired Fund Fees and Expenses1 | 0.09% |
| |
| Allocation to Underlying Vanguard Funds | |
| Vanguard Total Stock Market Index | |
| Fund Institutional Shares | 54.2% |
| Vanguard Total International Stock | |
| Index Fund Investor Shares | 35.8 |
| Vanguard Total Bond Market II | |
| Index Fund Investor Shares | 7.1 |
| Vanguard Total International Bond | |
| Index Fund Admiral Shares | 2.9 |
Fund Asset Allocation
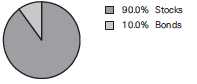
Institutional Target Retirement 2045 Fund
Performance Summary
All of the returns in this report represent past performance, which is not a guarantee of future results that may be achieved by the fund. (Current performance may be lower or higher than the performance data cited. For performance data current to the most recent month-end, visit our website at vanguard.com/performance.) Note, too, that both investment returns and principal value can fluctuate widely, so an investor’s shares, when sold, could be worth more or less than their original cost. The returns shown do not reflect taxes that a shareholder would pay on fund distributions or on the sale of fund shares.
Cumulative Performance: June 26, 2015, Through September 30, 2017
Initial Investment of $100,000,000
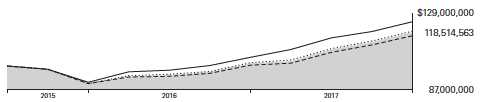
| | | |
| | Average Annual Total Returns | |
| | Periods Ended September 30, 2017 | |
| | | Since | Final Value |
| | One | Inception | of a $100,000,000 |
| | Year | (6/26/2015) | Investment |
| Institutional Target Retirement 2045 | | | |
| Fund* | 16.87% | 7.80% | $118,514,563 |
| Target 2045 Composite Index | 17.01 | 8.03 | 119,097,598 |
| Mixed-Asset Target 2045 Funds | | | |
| Average | 16.08 | 7.02 | 116,591,788 |
| MSCI US Broad Market Index | 18.67 | 10.09 | 124,295,206 |
For a benchmark description, see the Glossary.
Mixed-Asset Target 2045 Funds Average: Derived from data provided by Lipper, a Thomson Reuters Company.
"Since Inception" performance is calculated from the fund's inception date for both the fund and its comparative standards.
See Financial Highlights for dividend and capital gains information.
19
Institutional Target Retirement 2045 Fund
Fiscal-Year Total Returns (%): June 26, 2015, Through September 30, 2017
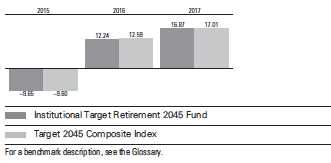
20
Institutional Target Retirement 2045 Fund
Financial Statements
Statement of Net Assets
As of September 30, 2017
The fund reports a complete list of its holdings in regulatory filings four times in each fiscal year, at the quarter-ends. For the second and fourth fiscal quarters, the lists appear in the fund’s semiannual and annual reports to shareholders. For the first and third fiscal quarters, the fund files the lists with the Securities and Exchange Commission on Form N-Q. Shareholders can look up the fund’s Forms N-Q on the SEC’s website at sec.gov. Forms N-Q may also be reviewed and copied at the SEC’s Public Reference Room (see the back cover of this report for further information).
| | |
| | | Market |
| | | Value• |
| | Shares | ($000) |
| Investment Companies (99.9%) | | |
| U.S. Stock Fund (54.2%) | | |
| Vanguard Total Stock Market Index Fund Institutional Shares | 103,549,112 | 6,529,807 |
| |
| International Stock Fund (35.7%) | | |
| Vanguard Total International Stock Index Fund Investor Shares | 245,045,018 | 4,305,441 |
| |
| U.S. Bond Fund (7.1%) | | |
| 1 Vanguard Total Bond Market II Index Fund Investor Shares | 79,640,562 | 856,136 |
| |
| International Bond Fund (2.9%) | | |
| Vanguard Total International Bond Index Fund Admiral Shares | 16,155,799 | 351,712 |
| Total Investment Companies (Cost $10,440,129) | | 12,043,096 |
| Temporary Cash Investment (0.0%) | | |
| Money Market Fund (0.0%) | | |
| 1 Vanguard Market Liquidity Fund, 1.223% (Cost $3,581) | 35,806 | 3,581 |
| Total Investments (99.9%) (Cost $10,443,710) | | 12,046,677 |
| Other Assets and Liabilities (0.1%) | | |
| Other Assets | | 66,486 |
| Liabilities | | (59,426) |
| | | 7,060 |
| Net Assets (100%) | | |
| Applicable to 522,838,362 outstanding $.001 par value shares of | | |
| beneficial interest (unlimited authorization) | | 12,053,737 |
| Net Asset Value Per Share | | $23.05 |
21
| |
| Institutional Target Retirement 2045 Fund | |
| |
| |
| |
| |
| | Amount |
| | ($000) |
| Statement of Assets and Liabilities | |
| Assets | |
| Investments in Securities, at Value—Affiliated Vanguard Funds | 12,046,677 |
| Receivables for Accrued Income | 1,977 |
| Receivables for Capital Shares Issued | 64,509 |
| Total Assets | 12,113,163 |
| Liabilities | |
| Payables for Investment Securities Purchased | 34,591 |
| Payables for Capital Shares Redeemed | 24,835 |
| Total Liabilities | 59,426 |
| Net Assets | 12,053,737 |
| |
| |
| At September 30, 2017, net assets consisted of: | |
| | Amount |
| | ($000) |
| Paid-in Capital | 10,287,734 |
| Undistributed Net Investment Income | 160,962 |
| Accumulated Net Realized Gains | 2,074 |
| Unrealized Appreciation (Depreciation) | 1,602,967 |
| Net Assets | 12,053,737 |
• See Note A in Notes to Financial Statements.
1 Affiliated fund available only to Vanguard funds and certain trusts and accounts managed by Vanguard. Rate shown for Vanguard
Market Liquidity Fund is the 7-day yield.
See accompanying Notes, which are an integral part of the Financial Statements.
22
| |
| Institutional Target Retirement 2045 Fund | |
| |
| |
| Statement of Operations | |
| |
| | Year Ended |
| | September 30, 2017 |
| | ($000) |
| Investment Income | |
| Income | |
| Income Distributions Received from Affiliated Funds | 219,189 |
| Net Investment Income—Note B | 219,189 |
| Realized Net Gain (Loss) | |
| Capital Gain Distributions Received from Affiliated Funds | 578 |
| Affiliated Investment Securities Sold | 2,042 |
| Futures Contracts | 18 |
| Realized Net Gain (Loss) | 2,638 |
| Change in Unrealized Appreciation (Depreciation) of Investment Securities | 1,297,074 |
| Net Increase (Decrease) in Net Assets Resulting from Operations | 1,518,901 |
See accompanying Notes, which are an integral part of the Financial Statements.
23
| | |
| Institutional Target Retirement 2045 Fund | | |
| |
| |
| Statement of Changes in Net Assets | | |
| |
| | Year Ended September 30, |
| | 2017 | 2016 |
| | ($000) | ($000) |
| Increase (Decrease) in Net Assets | | |
| Operations | | |
| Net Investment Income | 219,189 | 118,493 |
| Realized Net Gain (Loss) | 2,638 | 351 |
| Change in Unrealized Appreciation (Depreciation) | 1,297,074 | 454,611 |
| Net Increase (Decrease) in Net Assets Resulting from Operations | 1,518,901 | 573,455 |
| Distributions | | |
| Net Investment Income | (147,574) | (33,117) |
| Realized Capital Gain1 | (873) | — |
| Total Distributions | (148,447) | (33,117) |
| Capital Share Transactions | | |
| Issued | 4,325,560 | 4,302,587 |
| Issued in Lieu of Cash Distributions | 146,968 | 33,014 |
| Redeemed | (778,614) | (203,649) |
| Net Increase (Decrease) from Capital Share Transactions | 3,693,914 | 4,131,952 |
| Total Increase (Decrease) | 5,064,368 | 4,672,290 |
| Net Assets | | |
| Beginning of Period | 6,989,369 | 2,317,079 |
| End of Period2 | 12,053,737 | 6,989,369 |
1 Includes fiscal 2017 and 2016 short-term gain distributions totaling $493,000 and $0, respectively. Short-term gain distributions
are treated as ordinary income dividends for tax purposes.
2 Net Assets—End of Period includes undistributed (overdistributed) net investment income of $160,962,000 and $93,893,000.
See accompanying Notes, which are an integral part of the Financial Statements.
24
| | | |
| Institutional Target Retirement 2045 Fund | | | |
| |
| |
| Financial Highlights | | | |
| |
| |
| | | | June 26, |
| | Year Ended | 20151 to |
| | September 30, | Sept. 30, |
| For a Share Outstanding Throughout Each Period | 2017 | 2016 | 2015 |
| Net Asset Value, Beginning of Period | $20.11 | $18.07 | $20.00 |
| Investment Operations | | | |
| Net Investment Income2 | .497 | .464 | .149 |
| Capital Gain Distributions Received 2 | .001 | .002 | — |
| Net Realized and Unrealized Gain (Loss) on Investments | 2.833 | 1.736 | (2.079) |
| Total from Investment Operations | 3.331 | 2.202 | (1.930) |
| Distributions | | | |
| Dividends from Net Investment Income | (.389) | (.162) | — |
| Distributions from Realized Capital Gains | (.002) | — | — |
| Total Distributions | (.391) | (.162) | — |
| Net Asset Value, End of Period | $23.05 | $20.11 | $18.07 |
| |
| Total Return | 16.87% | 12.24% | -9.65% |
| |
| Ratios/Supplemental Data | | | |
| Net Assets, End of Period (Millions) | $12,054 | $6,989 | $2,317 |
| Ratio of Total Expenses to Average Net Assets | — | — | — |
| Acquired Fund Fees and Expenses | 0.09% | 0.10% | 0.10%3 |
| Ratio of Net Investment Income to Average Net Assets | 2.33% | 2.42% | 2.79%3 |
| Portfolio Turnover Rate | 5% | 1% | 0% |
1 Inception.
2 Calculated based on average shares outstanding.
3 Annualized.
See accompanying Notes, which are an integral part of the Financial Statements.
25
Institutional Target Retirement 2045 Fund
Notes to Financial Statements
Vanguard Institutional Target Retirement 2045 Fund is registered under the Investment Company Act of 1940 as an open-end investment company, or mutual fund. The fund follows a balanced investment strategy by investing in selected Vanguard funds to achieve its targeted allocation of assets to U.S. and international stocks, and U.S. and international bonds. Financial statements and other information about each underlying fund are available on vanguard.com.
A. The following significant accounting policies conform to generally accepted accounting principles for U.S. investment companies. The fund consistently follows such policies in preparing its financial statements.
1. Security Valuation: Investments are valued at the net asset value of each underlying Vanguard fund determined as of the close of the New York Stock Exchange (generally 4 p.m., Eastern time) on the valuation date.
2. Futures Contracts: The fund uses stock and bond futures contracts to a limited extent, with the objectives of maintaining full exposure to the market and maintaining its target asset allocation. The primary risks associated with the use of futures contracts are imperfect correlation between changes in market values of investments held by the fund and the prices of futures contracts, and the possibility of an illiquid market. Counterparty risk involving futures is mitigated because a regulated clearinghouse is the counterparty instead of the clearing broker. To further mitigate counterparty risk, the fund trades futures contracts on an exchange, monitors the financial strength of its clearing brokers and clearinghouse, and has entered into clearing agreements with its clearing brokers. The clearinghouse imposes initial margin requirements to secure the fund’s performance and requires daily settlement of variation margin representing changes in the market value of each contract.
Futures contracts are valued at their quoted daily settlement prices. The notional amounts of the contracts are not recorded in the Statement of Net Assets. Fluctuations in the value of the contracts are recorded in the Statement of Assets and Liabilities as an asset (liability) and in the Statement of Operations as unrealized appreciation (depreciation) until the contracts are closed, when they are recorded as realized futures gains (losses).
During the year ended September 30, 2017, the fund’s average investments in long and short futures contracts represented 0% and 0% of net assets, respectively, based on the average of the notional amounts at each quarter-end during the period. The fund had no open futures contracts at September 30, 2017.
3. Federal Income Taxes: The fund intends to continue to qualify as a regulated investment company and distribute all of its taxable income. Management has analyzed the fund’s tax positions taken for all open federal income tax years (September 30, 2015–2017), and has concluded that no provision for federal income tax is required in the fund’s financial statements.
4. Distributions: Distributions to shareholders are recorded on the ex-dividend date.
5. Credit Facility: The fund and certain other funds managed by The Vanguard Group (“Vanguard”) participate in a $3.1 billion committed credit facility provided by a syndicate of lenders pursuant to a credit agreement that may be renewed annually; each fund is individually liable for its borrowings, if any, under the credit facility. Borrowings may be utilized for temporary and emergency purposes, and are subject to the fund’s regulatory and contractual borrowing restrictions. The participating funds are charged administrative fees and an annual commitment fee of 0.10% of the undrawn amount of the facility; these fees are allocated to the funds based on a method approved by the fund’s board of
26
Institutional Target Retirement 2045 Fund
trustees and borne by the funds in which the fund invests (see Note B). Any borrowings under this facility bear interest at a rate based upon the higher of the one-month London Interbank Offered Rate, federal funds effective rate, or overnight bank funding rate plus an agreed-upon spread.
The fund had no borrowings outstanding at September 30, 2017, or at any time during the period then ended.
6. Other: Income and capital gain distributions received are recorded on the ex-dividend date. Security transactions are accounted for on the date securities are bought or sold. Costs used to determine realized gains (losses) on the sale of investment securities are those of the specific securities sold.
B. In accordance with the terms of a Funds’ Service Agreement (the “FSA”) between Vanguard and the fund, Vanguard furnishes to the fund investment advisory, corporate management, administrative, marketing, and distribution services at Vanguard’s cost of operations (as defined by the FSA). These costs of operations are allocated to the fund based on methods and guidelines approved by the board of trustees. The FSA provides that expenses otherwise allocable to Vanguard funds-of-funds may be reduced or eliminated to the extent of savings realized by the underlying Vanguard funds by virtue of being part of a fund-of-funds. Accordingly, all expenses for services provided by Vanguard to the fund and all other expenses incurred by the fund during the period ended September 30, 2017, were borne by the underlying Vanguard funds in which the fund invests. The fund’s trustees and officers are also trustees and officers, respectively, of the underlying Vanguard funds, as well as directors and employees, respectively, of Vanguard.
C. Various inputs may be used to determine the value of the fund’s investments. These inputs are summarized in three broad levels for financial statement purposes. The inputs or methodologies used to value securities are not necessarily an indication of the risk associated with investing in those securities.
Level 1—Quoted prices in active markets for identical securities.
Level 2—Other significant observable inputs (including quoted prices for similar securities, interest rates, prepayment speeds, credit risk, etc.).
Level 3—Significant unobservable inputs (including the fund’s own assumptions used to determine the fair value of investments). Any investments valued with significant unobservable inputs are noted on the Statement of Net Assets.
At September 30, 2017, 100% of the market value of the fund’s investments was determined based on Level 1 inputs.
D. Distributions are determined on a tax basis and may differ from net investment income and realized capital gains for financial reporting purposes. Differences may be permanent or temporary. Permanent differences are reclassified among capital accounts in the financial statements to reflect their tax character. Temporary differences arise when certain items of income, expense, gain, or loss are recognized in different periods for financial statement and tax purposes. These differences will reverse at some time in the future. Differences in classification may also result from the treatment of short-term gains as ordinary income for tax purposes.
The fund used a tax accounting practice to treat a portion of the price of capital shares redeemed during the year as distributions from net investment income and realized capital gains. Accordingly, the fund has reclassified $4,546,000 from undistributed net investment income and $44,000 from accumulated net realized gains to paid-in capital.
27
Institutional Target Retirement 2045 Fund
For tax purposes, at September 30, 2017, the fund had $162,872,000 of ordinary income and $164,000 of long-term capital gains available for distribution.
At September 30, 2017, the cost of investment securities for tax purposes was $10,443,710,000. Net unrealized appreciation of investment securities for tax purposes was $1,602,967,000, consisting entirely of unrealized gains on securities that had risen in value since their purchase.
| | |
| E. Capital shares issued and redeemed were: | | |
| | Year Ended September 30, |
| | 2017 | 2016 |
| | Shares | Shares |
| | (000) | (000) |
| Issued | 203,890 | 228,312 |
| Issued in Lieu of Cash Distributions | 7,367 | 1,741 |
| Redeemed | (35,984) | (10,725) |
| Net Increase (Decrease) in Shares Outstanding | 175,273 | 219,328 |
At September 30, 2017, one shareholder was the record or beneficial owner of 27% of the fund’s net assets. If the shareholder were to redeem its investment in the fund, the redemption might lead to the realization of taxable capital gains.
F. Transactions during the period in affiliated underlying Vanguard funds were as follows:
| | | | | | | | |
| | | | | | Current Period Transactions | |
| Sept. 30, | | Proceeds | | | | | Sept. 30, |
| | 2016 | | from | Realized | Change in | | Capital Gain | 2017 |
| | Market | Purchases | Securities | Net Gain | Unrealized | | Distributions | Market |
| | Value | at Cost | Sold | (Loss) | App. (Dep.) | Income | Received | Value |
| | ($000) | ($000) | ($000) | ($000) | ($000) | ($000) | ($000) | ($000) |
| Vanguard Market | | | | | | | | |
| Liquidity Fund | 1,266 | NA1 | NA1 | (1) | — | 34 | — | 3,581 |
| Vanguard Total | | | | | | | | |
| Bond Market II | | | | | | | | |
| Index Fund | 485,809 | 478,237 | 97,137 | 82 | (10,855) | 15,962 | 578 | 856,136 |
| Vanguard Total | | | | | | | | |
| International Bond | | | | | | | | |
| Index Fund | 208,090 | 148,268 | — | — | (4,646) | 4,411 | — | 351,712 |
| Vanguard Total | | | | | | | | |
| International Stock | | | | | | | | |
| Index Fund | 2,498,811 | 1,362,322 | 107,877 | 758 | 551,427 | 96,170 | — | 4,305,441 |
| Vanguard Total | | | | | | | | |
| Stock Market | | | | | | | | |
| Index Fund | 3,767,707 | 2,226,467 | 226,718 | 1,203 | 761,148 | 102,612 | — | 6,529,807 |
| Total | 6,961,683 | 4,215,294 | 431,732 | 2,042 | 1,297,074 | 219,189 | 578 | 12,046,677 |
| 1 Not applicable—purchases and sales are for temporary cash investment purposes. | | | |
G. Management has determined that no material events or transactions occurred subsequent to September 30, 2017, that would require recognition or disclosure in these financial statements.
28
Institutional Target Retirement 2050 Fund
Fund Profile
As of September 30, 2017
| |
| Total Fund Characteristics | |
| Ticker Symbol | VTRLX |
| 30-Day SEC Yield | 2.12% |
| Acquired Fund Fees and Expenses1 | 0.09% |
| |
| Allocation to Underlying Vanguard Funds | |
| Vanguard Total Stock Market Index | |
| Fund Institutional Shares | 54.3% |
| Vanguard Total International Stock | |
| Index Fund Investor Shares | 35.8 |
| Vanguard Total Bond Market II | |
| Index Fund Investor Shares | 7.0 |
| Vanguard Total International Bond | |
| Index Fund Admiral Shares | 2.9 |
Fund Asset Allocation

1 This figure—drawn from the prospectus dated July 12, 2017—represents an estimate of the weighted average of the expense ratios and any transaction fees charged by the underlying mutual funds (the ”acquired” funds) in which the Institutional Target Retirement 2050 Fund invests. The fund does not charge any expenses or fees of its own. For the fiscal year ended September 30, 2017, the acquired fund fees and expenses were 0.09%.
29
Institutional Target Retirement 2050 Fund
Performance Summary
All of the returns in this report represent past performance, which is not a guarantee of future results that may be achieved by the fund. (Current performance may be lower or higher than the performance data cited. For performance data current to the most recent month-end, visit our website at vanguard.com/performance.) Note, too, that both investment returns and principal value can fluctuate widely, so an investor’s shares, when sold, could be worth more or less than their original cost. The returns shown do not reflect taxes that a shareholder would pay on fund distributions or on the sale of fund shares.
Cumulative Performance: June 26, 2015, Through September 30, 2017
Initial Investment of $100,000,000

| | | |
| | Average Annual Total Returns | |
| | Periods Ended September 30, 2017 | |
| | | Since | Final Value |
| | One | Inception | of a $100,000,000 |
| | Year | (6/26/2015) | Investment |
| Institutional Target Retirement 2050 | | | |
| Fund* | 16.92% | 7.81% | $118,550,230 |
| Target 2050 Composite Index | 17.01 | 8.03 | 119,097,600 |
| Mixed-Asset Target 2050 Funds | | | |
| Average | 15.80 | 7.01 | 116,569,760 |
| MSCI US Broad Market Index | 18.67 | 10.09 | 124,295,210 |
For a benchmark description, see the Glossary.
Mixed-Asset Target 2050 Funds Average: Derived from data provided by Lipper, a Thomson Reuters Company.
"Since Inception" performance is calculated from the fund's inception date for both the fund and its comparative standards.
See Financial Highlights for dividend and capital gains information.
30
Institutional Target Retirement 2050 Fund
Fiscal-Year Total Returns (%): June 26, 2015, Through September 30, 2017

31
Institutional Target Retirement 2050 Fund
Financial Statements
Statement of Net Assets
As of September 30, 2017
The fund reports a complete list of its holdings in regulatory filings four times in each fiscal year, at the quarter-ends. For the second and fourth fiscal quarters, the lists appear in the fund’s semiannual and annual reports to shareholders. For the first and third fiscal quarters, the fund files the lists with the Securities and Exchange Commission on Form N-Q. Shareholders can look up the fund’s Forms N-Q on the SEC’s website at sec.gov. Forms N-Q may also be reviewed and copied at the SEC’s Public Reference Room (see the back cover of this report for further information).
| | |
| | | Market |
| | | Value• |
| | Shares | ($000) |
| Investment Companies (99.9%) | | |
| U.S. Stock Fund (54.2%) | | |
| Vanguard Total Stock Market Index Fund Institutional Shares | 68,348,655 | 4,310,066 |
| |
| International Stock Fund (35.7%) | | |
| Vanguard Total International Stock Index Fund Investor Shares | 161,691,658 | 2,840,923 |
| |
| U.S. Bond Fund (7.1%) | | |
| 1 Vanguard Total Bond Market II Index Fund Investor Shares | 52,063,127 | 559,679 |
| |
| International Bond Fund (2.9%) | | |
| Vanguard Total International Bond Index Fund Admiral Shares | 10,649,803 | 231,846 |
| Total Investment Companies (Cost $6,912,010) | | 7,942,514 |
| Temporary Cash Investment (0.0%) | | |
| Money Market Fund (0.0%) | | |
| 1 Vanguard Market Liquidity Fund, 1.223% (Cost $2,047) | 20,469 | 2,047 |
| Total Investments (99.9%) (Cost $6,914,057) | | 7,944,561 |
| Other Assets and Liabilities (0.1%) | | |
| Other Assets | | 65,765 |
| Liabilities | | (60,103) |
| | | 5,662 |
| Net Assets (100%) | | |
| Applicable to 344,646,077 outstanding $.001 par value shares of | | |
| beneficial interest (unlimited authorization) | | 7,950,223 |
| Net Asset Value Per Share | | $23.07 |
32
| |
| Institutional Target Retirement 2050 Fund | |
| |
| |
| |
| |
| | Amount |
| | ($000) |
| Statement of Assets and Liabilities | |
| Assets | |
| Investments in Securities, at Value—Affiliated Vanguard Funds | 7,944,561 |
| Receivables for Investment Securities Sold | 4,681 |
| Receivables for Accrued Income | 1,344 |
| Receivables for Capital Shares Issued | 59,740 |
| Total Assets | 8,010,326 |
| Liabilities | |
| Payables for Investment Securities Purchased | 47,241 |
| Payables for Capital Shares Redeemed | 12,862 |
| Total Liabilities | 60,103 |
| Net Assets | 7,950,223 |
| |
| |
| At September 30, 2017, net assets consisted of: | |
| | Amount |
| | ($000) |
| Paid-in Capital | 6,814,041 |
| Undistributed Net Investment Income | 104,104 |
| Accumulated Net Realized Gains | 1,574 |
| Unrealized Appreciation (Depreciation) | 1,030,504 |
| Net Assets | 7,950,223 |
• See Note A in Notes to Financial Statements.
1 Affiliated fund available only to Vanguard funds and certain trusts and accounts managed by Vanguard. Rate shown for Vanguard
Market Liquidity Fund is the 7-day yield.
See accompanying Notes, which are an integral part of the Financial Statements.
33
| |
| Institutional Target Retirement 2050 Fund | |
| |
| |
| Statement of Operations | |
| |
| | Year Ended |
| | September 30, 2017 |
| | ($000) |
| Investment Income | |
| Income | |
| Income Distributions Received from Affiliated Funds | 141,764 |
| Other Income | 46 |
| Net Investment Income—Note B | 141,810 |
| Realized Net Gain (Loss) | |
| Capital Gain Distributions Received from Affiliated Funds | 364 |
| Affiliated Investment Securities Sold | 1,522 |
| Realized Net Gain (Loss) | 1,886 |
| Change in Unrealized Appreciation (Depreciation) of Investment Securities | 838,364 |
| Net Increase (Decrease) in Net Assets Resulting from Operations | 982,060 |
See accompanying Notes, which are an integral part of the Financial Statements.
34
| | |
| Institutional Target Retirement 2050 Fund | | |
| |
| |
| Statement of Changes in Net Assets | | |
| |
| | Year Ended September 30, |
| | 2017 | 2016 |
| | ($000) | ($000) |
| Increase (Decrease) in Net Assets | | |
| Operations | | |
| Net Investment Income | 141,810 | 70,655 |
| Realized Net Gain (Loss) | 1,886 | 233 |
| Change in Unrealized Appreciation (Depreciation) | 838,364 | 270,453 |
| Net Increase (Decrease) in Net Assets Resulting from Operations | 982,060 | 341,341 |
| Distributions | | |
| Net Investment Income | (90,785) | (18,343) |
| Realized Capital Gain1 | (502) | — |
| Total Distributions | (91,287) | (18,343) |
| Capital Share Transactions | | |
| Issued | 3,268,759 | 2,864,884 |
| Issued in Lieu of Cash Distributions | 90,205 | 18,188 |
| Redeemed | (628,910) | (135,302) |
| Net Increase (Decrease) from Capital Share Transactions | 2,730,054 | 2,747,770 |
| Total Increase (Decrease) | 3,620,827 | 3,070,768 |
| Net Assets | | |
| Beginning of Period | 4,329,396 | 1,258,628 |
| End of Period2 | 7,950,223 | 4,329,396 |
1 Includes fiscal 2017 and 2016 short-term gain distributions totaling $287,000 and $0, respectively. Short-term gain distributions are
treated as ordinary income dividends for tax purposes.
2 Net Assets—End of Period includes undistributed (overdistributed) net investment income of $104,104,000 and $56,710,000.
See accompanying Notes, which are an integral part of the Financial Statements.
35
| | | |
| Institutional Target Retirement 2050 Fund | | | |
| |
| |
| Financial Highlights | | | |
| |
| |
| | | | June 26, |
| | Year Ended | 20151 to |
| | September 30, | Sept. 30, |
| For a Share Outstanding Throughout Each Period | 2017 | 2016 | 2015 |
| Net Asset Value, Beginning of Period | $20.11 | $18.07 | $20.00 |
| Investment Operations | | | |
| Net Investment Income2 | .503 | .466 | .149 |
| Capital Gain Distributions Received 2 | .001 | .002 | — |
| Net Realized and Unrealized Gain (Loss) on Investments | 2.838 | 1.732 | (2.079) |
| Total from Investment Operations | 3.342 | 2.200 | (1.930) |
| Distributions | | | |
| Dividends from Net Investment Income | (.380) | (.160) | — |
| Distributions from Realized Capital Gains | (.002) | — | — |
| Total Distributions | (.382) | (.160) | — |
| Net Asset Value, End of Period | $23.07 | $20.11 | $18.07 |
| |
| Total Return | 16.92% | 12.23% | -9.65% |
| |
| Ratios/Supplemental Data | | | |
| Net Assets, End of Period (Millions) | $7,950 | $4,329 | $1,259 |
| Ratio of Total Expenses to Average Net Assets | — | — | — |
| Acquired Fund Fees and Expenses | 0.09% | 0.10% | 0.10%3 |
| Ratio of Net Investment Income to Average Net Assets | 2.34% | 2.43% | 2.81%3 |
| Portfolio Turnover Rate | 5% | 1% | 1% |
1 Inception.
2 Calculated based on average shares outstanding.
3 Annualized.
See accompanying Notes, which are an integral part of the Financial Statements.
36
Institutional Target Retirement 2050 Fund
Notes to Financial Statements
Vanguard Institutional Target Retirement 2050 Fund is registered under the Investment Company Act of 1940 as an open-end investment company, or mutual fund. The fund follows a balanced investment strategy by investing in selected Vanguard funds to achieve its targeted allocation of assets to U.S. and international stocks, and U.S. and international bonds. Financial statements and other information about each underlying fund are available on vanguard.com.
A. The following significant accounting policies conform to generally accepted accounting principles for U.S. investment companies. The fund consistently follows such policies in preparing its financial statements.
1. Security Valuation: Investments are valued at the net asset value of each underlying Vanguard fund determined as of the close of the New York Stock Exchange (generally 4 p.m., Eastern time) on the valuation date.
2. Federal Income Taxes: The fund intends to qualify as a regulated investment company and distribute all of its taxable income. Management has analyzed the fund’s tax positions taken for all open federal income tax years (September 30, 2015–2017), and has concluded that no provision for federal income tax is required in the fund’s financial statements.
3. Distributions: Distributions to shareholders are recorded on the ex-dividend date.
4. Credit Facility: The fund and certain other funds managed by The Vanguard Group (“Vanguard”) participate in a $3.1 billion committed credit facility provided by a syndicate of lenders pursuant to a credit agreement that may be renewed annually; each fund is individually liable for its borrowings, if any, under the credit facility. Borrowings may be utilized for temporary and emergency purposes, and are subject to the fund’s regulatory and contractual borrowing restrictions. The participating funds are charged administrative fees and an annual commitment fee of 0.10% of the undrawn amount of the facility; these fees are allocated to the funds based on a method approved by the fund’s board of trustees and borne by the funds in which the fund invests (see Note B). Any borrowings under this facility bear interest at a rate based upon the higher of the one-month London Interbank Offered Rate, federal funds effective rate, or overnight bank funding rate plus an agreed-upon spread.
The fund had no borrowings outstanding at September 30, 2017, or at any time during the period then ended.
5. Other: Income and capital gain distributions received are recorded on the ex-dividend date. Security transactions are accounted for on the date securities are bought or sold. Costs used to determine realized gains (losses) on the sale of investment securities are those of the specific securities sold.
B. In accordance with the terms of a Funds’ Service Agreement (the “FSA”) between Vanguard and the fund, Vanguard furnishes to the fund investment advisory, corporate management, administrative, marketing, and distribution services at Vanguard’s cost of operations (as defined by the FSA). These costs of operations are allocated to the fund based on methods and guidelines approved by the board of trustees. The FSA provides that expenses otherwise allocable to Vanguard funds-of-funds may be reduced or eliminated to the extent of savings realized by the underlying Vanguard funds by virtue of being part of a fund-of-funds. Accordingly, all expenses for services provided by Vanguard to the fund and all other expenses incurred by the fund during the period ended September 30, 2017, were borne by the underlying Vanguard funds in which the fund invests. The fund’s trustees and officers are also trustees and officers, respectively, of the underlying Vanguard funds, as well as directors and employees, respectively, of Vanguard.
37
Institutional Target Retirement 2050 Fund
C. Various inputs may be used to determine the value of the fund’s investments. These inputs are summarized in three broad levels for financial statement purposes. The inputs or methodologies used to value securities are not necessarily an indication of the risk associated with investing in those securities.
Level 1—Quoted prices in active markets for identical securities.
Level 2—Other significant observable inputs (including quoted prices for similar securities, interest rates, prepayment speeds, credit risk, etc.).
Level 3—Significant unobservable inputs (including the fund’s own assumptions used to determine the fair value of investments). Any investments valued with significant unobservable inputs are noted on the Statement of Net Assets.
At September 30, 2017, 100% of the market value of the fund’s investments was determined based on Level 1 inputs.
D. Distributions are determined on a tax basis and may differ from net investment income and realized capital gains for financial reporting purposes. Differences may be permanent or temporary. Permanent differences are reclassified among capital accounts in the financial statements to reflect their tax character. Temporary differences arise when certain items of income, expense, gain, or loss are recognized in different periods for financial statement and tax purposes. These differences will reverse at some time in the future. Differences in classification may also result from the treatment of short-term gains as ordinary income for tax purposes.
The fund used a tax accounting practice to treat a portion of the price of capital shares redeemed during the year as distributions from net investment income and realized capital gains. Accordingly, the fund has reclassified $3,631,000 from undistributed net investment income and $42,000 from accumulated net realized gains to paid-in capital.
For tax purposes, at September 30, 2017, the fund had $105,678,000 of ordinary income available for distribution.
At September 30, 2017, the cost of investment securities for tax purposes was $6,914,057,000. Net unrealized appreciation of investment securities for tax purposes was $1,030,504,000, consisting entirely of unrealized gains on securities that had risen in value since their purchase.
| | |
| E. Capital shares issued and redeemed were: | | |
| | Year Ended September 30, |
| | 2017 | 2016 |
| | Shares | Shares |
| | (000) | (000) |
| Issued | 153,901 | 151,751 |
| Issued in Lieu of Cash Distributions | 4,519 | 959 |
| Redeemed | (29,024) | (7,110) |
| Net Increase (Decrease) in Shares Outstanding | 129,396 | 145,600 |
At September 30, 2017, one shareholder was the record or beneficial owner of 26% of the fund’s net assets. If the shareholder were to redeem its investment in the fund, the redemption might lead to the realization of taxable capital gains.
38
Institutional Target Retirement 2050 Fund
F. Transactions during the period in affiliated underlying Vanguard funds were as follows:
| | | | | | | | |
| | | | | | Current Period Transactions | |
| Sept. 30, | | Proceeds | | | | | Sept. 30, |
| | 2016 | | from | Realized | Change in | | Capital Gain | 2017 |
| | Market | Purchases | Securities | Net Gain | Unrealized | | Distributions | Market |
| | Value | at Cost | Sold | (Loss) | App. (Dep.) | Income | Received | Value |
| | ($000) | ($000) | ($000) | ($000) | ($000) | ($000) | ($000) | ($000) |
| Vanguard Market | | | | | | | | |
| Liquidity Fund | 1,065 | NA1 | NA1 | (2) | — | 25 | — | 2,047 |
| Vanguard Total | | | | | | | | |
| Bond Market II | | | | | | | | |
| Index Fund | 308,788 | 321,373 | 63,911 | (241) | (6,330) | 10,284 | 364 | 559,679 |
| Vanguard Total | | | | | | | | |
| International Bond | | | | | | | | |
| Index Fund | 128,417 | 106,272 | — | — | (2,843) | 2,812 | — | 231,846 |
| Vanguard Total | | | | | | | | |
| International Stock | | | | | | | | |
| Index Fund | 1,546,635 | 1,032,035 | 96,487 | 869 | 357,871 | 62,270 | — | 2,840,923 |
| Vanguard Total | | | | | | | | |
| Stock Market | | | | | | | | |
| Index Fund | 2,331,764 | 1,652,285 | 164,545 | 896 | 489,666 | 66,373 | — | 4,310,066 |
| Total | 4,316,669 | 3,111,965 | 324,943 | 1,522 | 838,364 | 141,764 | 364 | 7,944,561 |
| 1 Not applicable—purchases and sales are for temporary cash investment purposes. | | | |
G. Management has determined that no material events or transactions occurred subsequent to September 30, 2017, that would require recognition or disclosure in these financial statements.
39
Institutional Target Retirement 2055 Fund
Fund Profile
As of September 30, 2017
| |
| Total Fund Characteristics | |
| Ticker Symbol | VIVLX |
| 30-Day SEC Yield | 2.12% |
| Acquired Fund Fees and Expenses1 | 0.09% |
| |
| Allocation to Underlying Vanguard Funds | |
| Vanguard Total Stock Market Index | |
| Fund Institutional Shares | 54.4% |
| Vanguard Total International Stock | |
| Index Fund Investor Shares | 35.7 |
| Vanguard Total Bond Market II | |
| Index Fund Investor Shares | 7.0 |
| Vanguard Total International Bond | |
| Index Fund Admiral Shares | 2.9 |
Fund Asset Allocation
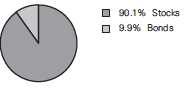
1 This figure—drawn from the prospectus dated July 12, 2017—represents an estimate of the weighted average of the expense ratios and any transaction fees charged by the underlying mutual funds (the ”acquired” funds) in which the Institutional Target Retirement 2055 Fund invests. The fund does not charge any expenses or fees of its own. For the fiscal year ended September 30, 2017, the acquired fund fees and expenses were 0.09%.
40
Institutional Target Retirement 2055 Fund
Performance Summary
All of the returns in this report represent past performance, which is not a guarantee of future results that may be achieved by the fund. (Current performance may be lower or higher than the performance data cited. For performance data current to the most recent month-end, visit our website at vanguard.com/performance.) Note, too, that both investment returns and principal value can fluctuate widely, so an investor’s shares, when sold, could be worth more or less than their original cost. The returns shown do not reflect taxes that a shareholder would pay on fund distributions or on the sale of fund shares.
Cumulative Performance: June 26, 2015, Through September 30, 2017
Initial Investment of $100,000,000

| | | |
| | Average Annual Total Returns | |
| | Periods Ended September 30, 2017 | |
| | | Since | Final Value |
| | One | Inception | of a $100,000,000 |
| | Year | (6/26/2015) | Investment |
| Institutional Target Retirement 2055 | | | |
| Fund* | 16.95% | 7.82% | $118,574,295 |
| Target 2055 Composite Index | 17.01 | 8.03 | 119,097,598 |
| Mixed-Asset Target 2055+ Funds | | | |
| Average | 16.62 | 7.24 | 117,138,590 |
| MSCI US Broad Market Index | 18.67 | 10.09 | 124,295,206 |
For a benchmark description, see the Glossary.
Mixed-Asset Target 2055+ Funds Average: Derived from data provided by Lipper, a Thomson Reuters Company.
"Since Inception" performance is calculated from the fund's inception date for both the fund and its comparative standards.
See Financial Highlights for dividend and capital gains information.
41
Institutional Target Retirement 2055 Fund
Fiscal-Year Total Returns (%): June 26, 2015, Through September 30, 2017

42
Institutional Target Retirement 2055 Fund
Financial Statements
Statement of Net Assets
As of September 30, 2017
The fund reports a complete list of its holdings in regulatory filings four times in each fiscal year, at the quarter-ends. For the second and fourth fiscal quarters, the lists appear in the fund’s semiannual and annual reports to shareholders. For the first and third fiscal quarters, the fund files the lists with the Securities and Exchange Commission on Form N-Q. Shareholders can look up the fund’s Forms N-Q on the SEC’s website at sec.gov. Forms N-Q may also be reviewed and copied at the SEC’s Public Reference Room (see the back cover of this report for further information).
| | |
| | | Market |
| | | Value• |
| | Shares | ($000) |
| Investment Companies (99.8%) | | |
| U.S. Stock Fund (54.2%) | | |
| Vanguard Total Stock Market Index Fund Institutional Shares | 27,633,751 | 1,742,584 |
| |
| International Stock Fund (35.7%) | | |
| Vanguard Total International Stock Index Fund Investor Shares | 65,217,737 | 1,145,876 |
| |
| U.S. Bond Fund (7.0%) | | |
| 1 Vanguard Total Bond Market II Index Fund Investor Shares | 20,971,842 | 225,447 |
| |
| International Bond Fund (2.9%) | | |
| Vanguard Total International Bond Index Fund Admiral Shares | 4,294,334 | 93,488 |
| Total Investment Companies (Cost $2,813,239) | | 3,207,395 |
| Temporary Cash Investment (0.1%) | | |
| Money Market Fund (0.1%) | | |
| 1 Vanguard Market Liquidity Fund, 1.223% (Cost $2,132) | 21,320 | 2,132 |
| Total Investments (99.9%) (Cost $2,815,371) | | 3,209,527 |
| Other Assets and Liabilities (0.1%) | | |
| Other Assets | | 27,069 |
| Liabilities | | (24,052) |
| | | 3,017 |
| Net Assets (100%) | | |
| Applicable to 139,096,400 outstanding $.001 par value shares of | | |
| beneficial interest (unlimited authorization) | | 3,212,544 |
| Net Asset Value Per Share | | $23.10 |
43
| |
| Institutional Target Retirement 2055 Fund | |
| |
| |
| |
| |
| | Amount |
| | ($000) |
| Statement of Assets and Liabilities | |
| Assets | |
| Investments in Securities, at Value—Affiliated Vanguard Funds | 3,209,527 |
| Receivables for Investment Securities Sold | 2,817 |
| Receivables for Accrued Income | 524 |
| Receivables for Capital Shares Issued | 23,728 |
| Total Assets | 3,236,596 |
| Liabilities | |
| Payables for Investment Securities Purchased | 21,146 |
| Payables for Capital Shares Redeemed | 2,906 |
| Total Liabilities | 24,052 |
| Net Assets | 3,212,544 |
| |
| |
| At September 30, 2017, net assets consisted of: | |
| | Amount |
| | ($000) |
| Paid-in Capital | 2,776,711 |
| Undistributed Net Investment Income | 40,851 |
| Accumulated Net Realized Gains | 826 |
| Unrealized Appreciation (Depreciation) | 394,156 |
| Net Assets | 3,212,544 |
• See Note A in Notes to Financial Statements.
1 Affiliated fund available only to Vanguard funds and certain trusts and accounts managed by Vanguard. Rate shown for Vanguard
Market Liquidity Fund is the 7-day yield.
See accompanying Notes, which are an integral part of the Financial Statements.
44
| |
| Institutional Target Retirement 2055 Fund | |
| |
| |
| Statement of Operations | |
| |
| | Year Ended |
| | September 30, 2017 |
| | ($000) |
| Investment Income | |
| Income | |
| Income Distributions Received from Affiliated Funds | 54,997 |
| Net Investment Income—Note B | 54,997 |
| Realized Net Gain (Loss) | |
| Capital Gain Distributions Received from Affiliated Funds | 132 |
| Affiliated Investment Securities Sold | 840 |
| Realized Net Gain (Loss) | 972 |
| Change in Unrealized Appreciation (Depreciation) of Investment Securities | 325,002 |
| Net Increase (Decrease) in Net Assets Resulting from Operations | 380,971 |
See accompanying Notes, which are an integral part of the Financial Statements.
45
| | |
| Institutional Target Retirement 2055 Fund | | |
| |
| |
| Statement of Changes in Net Assets | | |
| |
| | Year Ended September 30, |
| | 2017 | 2016 |
| | ($000) | ($000) |
| Increase (Decrease) in Net Assets | | |
| Operations | | |
| Net Investment Income | 54,997 | 23,312 |
| Realized Net Gain (Loss) | 972 | 46 |
| Change in Unrealized Appreciation (Depreciation) | 325,002 | 90,488 |
| Net Increase (Decrease) in Net Assets Resulting from Operations | 380,971 | 113,846 |
| Distributions | | |
| Net Investment Income | (31,435) | (5,544) |
| Realized Capital Gain1 | (131) | (35) |
| Total Distributions | (31,566) | (5,579) |
| Capital Share Transactions | | |
| Issued | 1,588,184 | 1,099,916 |
| Issued in Lieu of Cash Distributions | 31,142 | 5,531 |
| Redeemed | (283,411) | (59,524) |
| Net Increase (Decrease) from Capital Share Transactions | 1,335,915 | 1,045,923 |
| Total Increase (Decrease) | 1,685,320 | 1,154,190 |
| Net Assets | | |
| Beginning of Period | 1,527,224 | 373,034 |
| End of Period2 | 3,212,544 | 1,527,224 |
1 Includes fiscal 2017 and 2016 short-term gain distributions totaling $87,000 and $35,000 respectively. Short-term gain distributions
are treated as ordinary income dividends for tax purposes.
2 Net Assets-End of period includes undistributed (overdistributed) net investment income of $40,851,000 and $18,984,000.
See accompanying Notes, which are an integral part of the Financial Statements.
46
| | | |
| Institutional Target Retirement 2055 Fund | | | |
| |
| |
| Financial Highlights | | | |
| |
| |
| | | | June 26, |
| | Year Ended | 20151 to |
| | September 30, | Sept. 30, |
| For a Share Outstanding Throughout Each Period | 2017 | 2016 | 2015 |
| Net Asset Value, Beginning of Period | $20.11 | $18.08 | $20.00 |
| Investment Operations | | | |
| Net Investment Income2 | .506 | .470 | .157 |
| Capital Gain Distributions Received 2 | .001 | .001 | — |
| Net Realized and Unrealized Gain (Loss) on Investments | 2.845 | 1.718 | (2.077) |
| Total from Investment Operations | 3.352 | 2.189 | (1.920) |
| Distributions | | | |
| Dividends from Net Investment Income | (.360) | (.158) | — |
| Distributions from Realized Capital Gains | (.002) | (.001) | — |
| Total Distributions | (.362) | (.159) | — |
| Net Asset Value, End of Period | $23.10 | $20.11 | $18.08 |
| |
| Total Return | 16.95% | 12.16% | -9.60% |
| |
| Ratios/Supplemental Data | | | |
| Net Assets, End of Period (Millions) | $3,213 | $1,527 | $373 |
| Ratio of Total Expenses to Average Net Assets | — | — | — |
| Acquired Fund Fees and Expenses | 0.09% | 0.10% | 0.10%3 |
| Ratio of Net Investment Income to Average Net Assets | 2.36% | 2.47% | 3.05%3 |
| Portfolio Turnover Rate | 6% | 1% | 1% |
1 Inception.
2 Calculated based on average shares outstanding.
3 Annualized.
See accompanying Notes, which are an integral part of the Financial Statements.
47
Institutional Target Retirement 2055 Fund
Notes to Financial Statements
Vanguard Institutional Target Retirement 2055 Fund is registered under the Investment Company Act of 1940 as an open-end investment company, or mutual fund. The fund follows a balanced investment strategy by investing in selected Vanguard funds to achieve its targeted allocation of assets to U.S. and international stocks, and U.S. and international bonds. Financial statements and other information about each underlying fund are available on vanguard.com.
A. The following significant accounting policies conform to generally accepted accounting principles for U.S. investment companies. The fund consistently follows such policies in preparing its financial statements.
1. Security Valuation: Investments are valued at the net asset value of each underlying Vanguard fund determined as of the close of the New York Stock Exchange (generally 4 p.m., Eastern time) on the valuation date.
2. Federal Income Taxes: The fund intends to continue to qualify as a regulated investment company and distribute all of its taxable income. Management has analyzed the fund’s tax positions taken for all open federal income tax years (September 30, 2015–2017), and has concluded that no provision for federal income tax is required in the fund’s financial statements.
3. Distributions: Distributions to shareholders are recorded on the ex-dividend date.
4. Credit Facility: The fund and certain other funds managed by The Vanguard Group (“Vanguard”) participate in a $3.1 billion committed credit facility provided by a syndicate of lenders pursuant to a credit agreement that may be renewed annually; each fund is individually liable for its borrowings, if any, under the credit facility. Borrowings may be utilized for temporary and emergency purposes, and are subject to the fund’s regulatory and contractual borrowing restrictions. The participating funds are charged administrative fees and an annual commitment fee of 0.10% of the undrawn amount of the facility; these fees are allocated to the funds based on a method approved by the fund’s board of trustees and borne by the funds in which the fund invests (see Note B). Any borrowings under this facility bear interest at a rate based upon the higher of the one-month London Interbank Offered Rate, federal funds effective rate, or overnight bank funding rate plus an agreed-upon spread.
The fund had no borrowings outstanding at September 30, 2017, or at any time during the period then ended.
5. Other: Income and capital gain distributions received are recorded on the ex-dividend date. Security transactions are accounted for on the date securities are bought or sold. Costs used to determine realized gains (losses) on the sale of investment securities are those of the specific securities sold.
B. In accordance with the terms of a Funds’ Service Agreement (the “FSA”) between Vanguard and the fund, Vanguard furnishes to the fund investment advisory, corporate management, administrative, marketing, and distribution services at Vanguard’s cost of operations (as defined by the FSA). These costs of operations are allocated to the fund based on methods and guidelines approved by the board of trustees. The FSA provides that expenses otherwise allocable to Vanguard funds-of-funds may be reduced or eliminated to the extent of savings realized by the underlying Vanguard funds by virtue of being part of a fund-of-funds. Accordingly, all expenses for services provided by Vanguard to the fund and all other expenses incurred by the fund during the period ended September 30, 2017, were borne by the underlying Vanguard funds in which the fund invests. The fund’s trustees and officers are also trustees and officers, respectively, of the underlying Vanguard funds, as well as directors and employees, respectively, of Vanguard.
48
Institutional Target Retirement 2055 Fund
C. Various inputs may be used to determine the value of the fund’s investments. These inputs are summarized in three broad levels for financial statement purposes. The inputs or methodologies used to value securities are not necessarily an indication of the risk associated with investing in those securities.
Level 1—Quoted prices in active markets for identical securities.
Level 2—Other significant observable inputs (including quoted prices for similar securities, interest rates, prepayment speeds, credit risk, etc.).
Level 3—Significant unobservable inputs (including the fund’s own assumptions used to determine the fair value of investments). Any investments valued with significant unobservable inputs are noted on the Statement of Net Assets.
At September 30, 2017, 100% of the market value of the fund’s investments was determined based on Level 1 inputs.
D. Distributions are determined on a tax basis and may differ from net investment income and realized capital gains for financial reporting purposes. Differences may be permanent or temporary. Permanent differences are reclassified among capital accounts in the financial statements to reflect their tax character. Temporary differences arise when certain items of income, expense, gain, or loss are recognized in different periods for financial statement and tax purposes. These differences will reverse at some time in the future. Differences in classification may also result from the treatment of short-term gains as ordinary income for tax purposes.
The fund used a tax accounting practice to treat a portion of the price of capital shares redeemed during the year as distributions from net investment income and realized capital gains. Accordingly, the fund has reclassified $1,695,000 from undistributed net investment income and $26,000 from accumulated net realized gains to paid-in capital.
For tax purposes, at September 30, 2017, the fund had $41,678,000 of ordinary available for distribution.
At September 30, 2017, the cost of investment securities for tax purposes was $2,815,371,000. Net unrealized appreciation of investment securities for tax purposes was $394,156,000, consisting entirely of unrealized gains on securities that had risen in value since their purchase.
E. Capital shares issued and redeemed were:
| | |
| | Year Ended September 30, |
| | 2017 | 2016 |
| | Shares | Shares |
| | (000) | (000) |
| Issued | 74,615 | 58,130 |
| Issued in Lieu of Cash Distributions | 1,558 | 292 |
| Redeemed | (13,002) | (3,134) |
| Net Increase (Decrease) in Shares Outstanding | 63,171 | 55,288 |
49
Institutional Target Retirement 2055 Fund
F. Transactions during the period in affiliated underlying Vanguard funds were as follows:
| | | | | | | | |
| | | | | | Current Period Transactions | |
| Sept. 30, | | Proceeds | | | | | Sept. 30, |
| | 2016 | | from | Realized | Change in | | Capital Gain | 2017 |
| | Market | Purchases | Securities | Net Gain | Unrealized | | Distributions | Market |
| | Value | at Cost | Sold | (Loss) | App. (Dep.) | Income | Received | Value |
| | ($000) | ($000) | ($000) | ($000) | ($000) | ($000) | ($000) | ($000) |
| Vanguard Market | | | | | | | | |
| Liquidity Fund | 746 | NA1 | NA1 | (1) | — | 13 | — | 2,132 |
| Vanguard Total | | | | | | | | |
| Bond Market II | | | | | | | | |
| Index Fund | 106,412 | 151,602 | 30,397 | (130) | (2,040) | 3,953 | 132 | 225,447 |
| Vanguard Total | | | | | | | | |
| International Bond | | | | | | | | |
| Index Fund | 45,232 | 49,243 | — | — | (987) | 1,069 | — | 93,488 |
| Vanguard Total | | | | | | | | |
| International Stock | | | | | | | | |
| Index Fund | 546,748 | 509,274 | 50,677 | 495 | 140,036 | 24,213 | — | 1,145,876 |
| Vanguard Total | | | | | | | | |
| Stock Market | | | | | | | | |
| Index Fund | 822,011 | 798,195 | 66,091 | 476 | 187,993 | 25,749 | — | 1,742,584 |
| Total | 1,521,149 | 1,508,314 | 147,165 | 840 | 325,002 | 54,997 | 132 | 3,209,527 |
| 1 Not applicable—purchases and sales are for temporary cash investment purposes. | | | |
G. Management has determined that no material events or transactions occurred subsequent to September 30, 2017, that would require recognition or disclosure in these financial statements.
50
Institutional Target Retirement 2060 Fund
Fund Profile
As of September 30, 2017
| |
| Total Fund Characteristics | |
| Ticker Symbol | VILVX |
| 30-Day SEC Yield | 2.12% |
| Acquired Fund Fees and Expenses1 | 0.09% |
| |
| |
| Allocation to Underlying Vanguard Funds | |
| Vanguard Total Stock Market Index | |
| Fund Institutional Shares | 54.1% |
| Vanguard Total International Stock | |
| Index Fund Investor Shares | 36.0 |
| Vanguard Total Bond Market II | |
| Index Fund Investor Shares | 7.0 |
| Vanguard Total International Bond | |
| Index Fund Admiral Shares | 2.9 |
Fund Asset Allocation

1 This figure—drawn from the prospectus dated July 12, 2017—represents an estimate of the weighted average of the expense ratios and any transaction fees charged by the underlying mutual funds (the ”acquired” funds) in which the Institutional Target Retirement 2060 Fund invests. The fund does not charge any expenses or fees of its own. For the fiscal year ended September 30, 2017, the annualized acquired fund fees and expenses were 0.09%.
51
Institutional Target Retirement 2060 Fund
Performance Summary
All of the returns in this report represent past performance, which is not a guarantee of future results that may be achieved by the fund. (Current performance may be lower or higher than the performance data cited. For performance data current to the most recent month-end, visit our website at vanguard.com/performance.) Note, too, that both investment returns and principal value can fluctuate widely, so an investor’s shares, when sold, could be worth more or less than their original cost. The returns shown do not reflect taxes that a shareholder would pay on fund distributions or on the sale of fund shares.
Cumulative Performance: June 26, 2015, Through September 30, 2017
Initial Investment of $100,000,000
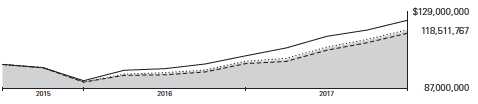
| | | |
| | Average Annual Total Returns | |
| | Periods Ended September 30, 2017 | |
| | | Since | Final Value |
| | One | Inception | of a $100,000,000 |
| | Year | (6/26/2015) | Investment |
| Institutional Target Retirement 2060 | | | |
| Fund* | 16.90% | 7.79% | $118,511,767 |
| Target 2060 Composite Index | 17.01 | 8.03 | 119,097,598 |
| Mixed-Asset Target 2055+ Funds | | | |
| Average | 16.62 | 7.24 | 117,138,590 |
| MSCI US Broad Market Index | 18.67 | 10.09 | 124,295,206 |
For a benchmark description, see the Glossary.
Mixed-Asset Target 2055+ Funds Average: Derived from data provided by Lipper, a Thomson Reuters Company.
"Since Inception" performance is calculated from the fund's inception date for both the fund and its comparative standards.
See Financial Highlights for dividend and capital gains information.
52
Institutional Target Retirement 2060 Fund
Fiscal-Year Total Returns (%): June 26, 2015, Through September 30, 2017
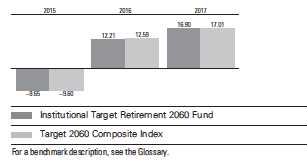
53
Institutional Target Retirement 2060 Fund
Financial Statements
Statement of Net Assets
As of September 30, 2017
The fund reports a complete list of its holdings in regulatory filings four times in each fiscal year, at the quarter-ends. For the second and fourth fiscal quarters, the lists appear in the fund’s semiannual and annual reports to shareholders. For the first and third fiscal quarters, the fund files the lists with the Securities and Exchange Commission on Form N-Q. Shareholders can look up the fund’s Forms N-Q on the SEC’s website at sec.gov. Forms N-Q may also be reviewed and copied at the SEC’s Public Reference Room (see the back cover of this report for further information).
| | |
| | | Market |
| | | Value• |
| | Shares | ($000) |
| Investment Companies (99.7%) | | |
| U.S. Stock Fund (53.9%) | | |
| Vanguard Total Stock Market Index Fund Institutional Shares | 6,912,042 | 435,873 |
| |
| International Stock Fund (35.9%) | | |
| Vanguard Total International Stock Index Fund Investor Shares | 16,523,763 | 290,323 |
| |
| U.S. Bond Fund (7.0%) | | |
| 1 Vanguard Total Bond Market II Index Fund Investor Shares | 5,269,525 | 56,647 |
| |
| International Bond Fund (2.9%) | | |
| Vanguard Total International Bond Index Fund Admiral Shares | 1,083,977 | 23,598 |
| Total Investment Companies (Cost $715,631) | | 806,441 |
| Temporary Cash Investment (0.1%) | | |
| Money Market Fund (0.1%) | | |
| 1 Vanguard Market Liquidity Fund, 1.223% (Cost $1,282) | 12,815 | 1,282 |
| Total Investments (99.8%) (Cost $716,913) | | 807,723 |
| Other Assets and Liabilities (0.2%) | | |
| Other Assets | | 7,284 |
| Liabilities | | (5,987) |
| | | 1,297 |
| Net Assets (100%) | | |
| Applicable to 35,058,820 outstanding $.001 par value shares of | | |
| beneficial interest (unlimited authorization) | | 809,020 |
| Net Asset Value Per Share | | $23.08 |
54
| |
| Institutional Target Retirement 2060 Fund | |
| |
| |
| |
| |
| | Amount |
| | ($000) |
| Statement of Assets and Liabilities | |
| Assets | |
| Investments in Securities, at Value—Affiliated Vanguard Funds | 807,723 |
| Receivables for Investment Securities Sold | 725 |
| Receivables for Accrued Income | 150 |
| Receivables for Capital Shares Issued | 6,409 |
| Total Assets | 815,007 |
| Liabilities | |
| Payables for Investment Securities Purchased | 3,860 |
| Payables for Capital Shares Redeemed | 2,127 |
| Total Liabilities | 5,987 |
| Net Assets | 809,020 |
| |
| |
| At September 30, 2017, net assets consisted of: | |
| | Amount |
| | ($000) |
| Paid-in Capital | 708,304 |
| Undistributed Net Investment Income | 9,804 |
| Accumulated Net Realized Gains | 102 |
| Unrealized Appreciation (Depreciation) | 90,810 |
| Net Assets | 809,020 |
• See Note A in Notes to Financial Statements.
1 Affiliated fund available only to Vanguard funds and certain trusts and accounts managed by Vanguard. Rate shown for Vanguard
Market Liquidity Fund is the 7-day yield.
See accompanying Notes, which are an integral part of the Financial Statements.
55
| |
| Institutional Target Retirement 2060 Fund | |
| |
| |
| Statement of Operations | |
| |
| | Year Ended |
| | September 30, 2017 |
| | ($000) |
| Investment Income | |
| Income | |
| Income Distributions Received from Affiliated Funds | 13,065 |
| Other Income | 19 |
| Net Investment Income—Note B | 13,084 |
| Realized Net Gain (Loss) | |
| Capital Gain Distributions Received from Affiliated Funds | 30 |
| Affiliated Investment Securities Sold | 109 |
| Realized Net Gain (Loss) | 139 |
| Change in Unrealized Appreciation (Depreciation) of Investment Securities | 76,789 |
| Net Increase (Decrease) in Net Assets Resulting from Operations | 90,012 |
See accompanying Notes, which are an integral part of the Financial Statements.
56
| | |
| Institutional Target Retirement 2060 Fund | | |
| |
| |
| Statement of Changes in Net Assets | | |
| |
| | Year Ended September 30, |
| | 2017 | 2016 |
| | ($000) | ($000) |
| Increase (Decrease) in Net Assets | | |
| Operations | | |
| Net Investment Income | 13,084 | 5,225 |
| Realized Net Gain (Loss) | 139 | 4 |
| Change in Unrealized Appreciation (Depreciation) | 76,789 | 20,526 |
| Net Increase (Decrease) in Net Assets Resulting from Operations | 90,012 | 25,755 |
| Distributions | | |
| Net Investment Income | (7,097) | (1,314) |
| Realized Capital Gain1 | (28) | (8) |
| Total Distributions | (7,125) | (1,322) |
| Capital Share Transactions | | |
| Issued | 479,635 | 244,013 |
| Issued in Lieu of Cash Distributions | 7,005 | 1,322 |
| Redeemed | (95,004) | (30,040) |
| Net Increase (Decrease) from Capital Share Transactions | 391,636 | 215,295 |
| Total Increase (Decrease) | 474,523 | 239,728 |
| Net Assets | | |
| Beginning of Period | 334,497 | 94,769 |
| End of Period2 | 809,020 | 334,497 |
1 Includes fiscal 2017 and 2016 short-term gain distributions totaling $22,000 and $8,000, respectively. Short-term gain distributions
are treated as ordinary income dividends for tax purposes.
2 Net Assets—End of Period includes undistributed (overdistributed) net investment income of $9,804,000 and $4,304,000.
See accompanying Notes, which are an integral part of the Financial Statements.
57
| | | |
| Institutional Target Retirement 2060 Fund | | | |
| |
| |
| Financial Highlights | | | |
| |
| |
| | | | June 26, |
| | Year Ended | 20151 to |
| | September 30, | Sept. 30, |
| For a Share Outstanding Throughout Each Period | 2017 | 2016 | 2015 |
| Net Asset Value, Beginning of Period | $20.10 | $18.07 | $20.00 |
| Investment Operations | | | |
| Net Investment Income2 | .511 | .466 | .135 |
| Capital Gain Distributions Received 2 | .001 | .001 | — |
| Net Realized and Unrealized Gain (Loss) on Investments | 2.828 | 1.729 | (2.065) |
| Total from Investment Operations | 3.340 | 2.196 | (1.930) |
| Distributions | | | |
| Dividends from Net Investment Income | (.359) | (.165) | — |
| Distributions from Realized Capital Gains | (.001) | (.001) | — |
| Total Distributions | (.360) | (.166) | — |
| Net Asset Value, End of Period | $23.08 | $20.10 | $18.07 |
| |
| Total Return | 16.90% | 12.21% | -9.65% |
| |
| Ratios/Supplemental Data | | | |
| Net Assets, End of Period (Millions) | $809 | $334 | $95 |
| Ratio of Total Expenses to Average Net Assets | — | — | — |
| Acquired Fund Fees and Expenses | 0.09% | 0.10% | 0.10%3 |
| Ratio of Net Investment Income to Average Net Assets | 2.38% | 2.45% | 2.53%3 |
| Portfolio Turnover Rate | 7% | 4% | 4% |
1 Inception.
2 Calculated based on average shares outstanding.
3 Annualized.
See accompanying Notes, which are an integral part of the Financial Statements.
58
Institutional Target Retirement 2060 Fund
Notes to Financial Statements
Vanguard Institutional Target Retirement 2060 Fund is registered under the Investment Company Act of 1940 as an open-end investment company, or mutual fund. The fund follows a balanced investment strategy by investing in selected Vanguard funds to achieve its targeted allocation of assets to U.S. and international stocks, and U.S. and international bonds. Financial statements and other information about each underlying fund are available on vanguard.com.
A. The following significant accounting policies conform to generally accepted accounting principles for U.S. investment companies. The fund consistently follows such policies in preparing its financial statements.
1. Security Valuation: Investments are valued at the net asset value of each underlying Vanguard fund determined as of the close of the New York Stock Exchange (generally 4 p.m., Eastern time) on the valuation date.
2. Federal Income Taxes: The fund intends to continue to qualify as a regulated investment company and distribute all of its taxable income. Management has analyzed the fund’s tax positions taken for all open federal income tax years (September 30, 2015–2017), and has concluded that no provision for federal income tax is required in the fund’s financial statements.
3. Distributions: Distributions to shareholders are recorded on the ex-dividend date.
4. Credit Facility: The fund and certain other funds managed by The Vanguard Group (“Vanguard”) participate in a $3.1 billion committed credit facility provided by a syndicate of lenders pursuant to a credit agreement that may be renewed annually; each fund is individually liable for its borrowings, if any, under the credit facility. Borrowings may be utilized for temporary and emergency purposes, and are subject to the fund’s regulatory and contractual borrowing restrictions. The participating funds are charged administrative fees and an annual commitment fee of 0.10% of the undrawn amount of the facility; these fees are allocated to the funds based on a method approved by the fund’s board of trustees and borne by the funds in which the fund invests (see Note B). Any borrowings under this facility bear interest at a rate based upon the higher of the one-month London Interbank Offered Rate, federal funds effective rate, or overnight bank funding rate plus an agreed-upon spread.
The fund had no borrowings outstanding at September 30, 2017, or at any time during the period then ended.
5. Other: Income and capital gain distributions received are recorded on the ex-dividend date. Security transactions are accounted for on the date securities are bought or sold. Costs used to determine realized gains (losses) on the sale of investment securities are those of the specific securities sold.
B. In accordance with the terms of a Funds’ Service Agreement (the “FSA”) between Vanguard and the fund, Vanguard furnishes to the fund investment advisory, corporate management, administrative, marketing, and distribution services at Vanguard’s cost of operations (as defined by the FSA). These costs of operations are allocated to the fund based on methods and guidelines approved by the board of trustees. The FSA provides that expenses otherwise allocable to Vanguard funds-of-funds may be reduced or eliminated to the extent of savings realized by the underlying Vanguard funds by virtue of being part of a fund-of-funds. Accordingly, all expenses for services provided by Vanguard to the fund and all other expenses incurred by the fund during the period ended September 30, 2017, were borne by the underlying Vanguard funds in which the fund invests. The fund’s trustees and officers are also trustees and officers, respectively, of the underlying Vanguard funds, as well as directors and employees, respectively, of Vanguard.
59
Institutional Target Retirement 2060 Fund
C. Various inputs may be used to determine the value of the fund’s investments. These inputs are summarized in three broad levels for financial statement purposes. The inputs or methodologies used to value securities are not necessarily an indication of the risk associated with investing in those securities.
Level 1—Quoted prices in active markets for identical securities.
Level 2—Other significant observable inputs (including quoted prices for similar securities, interest rates, prepayment speeds, credit risk, etc.).
Level 3—Significant unobservable inputs (including the fund’s own assumptions used to determine the fair value of investments). Any investments valued with significant unobservable inputs are noted on the Statement of Net Assets.
At September 30, 2017, 100% of the market value of the fund’s investments was determined based on Level 1 inputs.
D. Distributions are determined on a tax basis and may differ from net investment income and realized capital gains for financial reporting purposes. Differences may be permanent or temporary. Permanent differences are reclassified among capital accounts in the financial statements to reflect their tax character. Temporary differences arise when certain items of income, expense, gain, or loss are recognized in different periods for financial statement and tax purposes. These differences will reverse at some time in the future. Differences in classification may also result from the treatment of short-term gains as ordinary income for tax purposes.
The fund used a tax accounting practice to treat a portion of the price of capital shares redeemed during the year as distributions from net investment income and realized capital gains. Accordingly, the fund has reclassified $487,000 from undistributed net investment income and $4,000 from accumulated net realized gains to paid-in capital.
For tax purposes, at September 30, 2017, the fund had $9,905,000 of ordinary income available for distribution.
At September 30, 2017, the cost of investment securities for tax purposes was $716,913,000. Net unrealized appreciation of investment securities for tax purposes was $90,810,000, consisting entirely of unrealized gains on securities that had risen in value since their purchase.
E. Capital shares issued and redeemed were:
| | |
| | Year Ended September 30, |
| | 2017 | 2016 |
| | Shares | Shares |
| | (000) | (000) |
| Issued | 22,464 | 12,908 |
| Issued in Lieu of Cash Distributions | 351 | 70 |
| Redeemed | (4,397) | (1,581) |
| Net Increase (Decrease) in Shares Outstanding | 18,418 | 11,397 |
60
Institutional Target Retirement 2060 Fund
| | | | | | | | |
| F. Transactions during the period in affiliated underlying Vanguard funds were as follows: | |
| |
| | | | | | Current Period Transactions | |
| Sept. 30, | | Proceeds | | | | | Sept. 30, |
| | 2016 | | from | Realized | Change in | | Capital Gain | 2017 |
| | Market | Purchases | Securities | Net Gain | Unrealized | | Distributions | Market |
| | Value | at Cost | Sold | (Loss) | App. (Dep.) | Income | Received | Value |
| | ($000) | ($000) | ($000) | ($000) | ($000) | ($000) | ($000) | ($000) |
| Vanguard Market | | | | | | | | |
| Liquidity Fund | 410 | NA1 | NA1 | — | — | 7 | — | 1,282 |
| Vanguard Total | | | | | | | | |
| Bond Market II | | | | | | | | |
| Index Fund | 23,180 | 42,570 | 8,652 | (43) | (408) | 932 | 30 | 56,647 |
| Vanguard Total | | | | | | | | |
| International Bond | | | | | | | | |
| Index Fund | 9,902 | 13,975 | 67 | (2) | (210) | 245 | — | 23,598 |
| Vanguard Total | | | | | | | | |
| International Stock | | | | | | | | |
| Index Fund | 119,551 | 148,777 | 11,311 | 66 | 33,240 | 5,767 | — | 290,323 |
| Vanguard Total | | | | | | | | |
| Stock Market | | | | | | | | |
| Index Fund | 180,198 | 228,593 | 17,173 | 88 | 44,167 | 6,114 | — | 435,873 |
| Total | 333,241 | 433,915 | 37,203 | 109 | 76,789 | 13,065 | 30 | 807,723 |
| 1 Not applicable—purchases and sales are for temporary cash investment purposes. | | | |
G. Management has determined that no material events or transactions occurred subsequent to September 30, 2017, that would require recognition or disclosure in these financial statements.
61
Institutional Target Retirement 2065 Fund
Fund Profile
As of September 30, 2017
| |
| Total Fund Characteristics | |
| Ticker Symbol | VSXFX |
| 30-Day SEC Yield | 2.09% |
| Acquired Fund Fees and Expenses1 | 0.10% |
| |
| |
| Allocation to Underlying Vanguard Funds | |
| Vanguard Total Stock Market Index | |
| Fund Institutional Shares | 53.9% |
| Vanguard Total International Stock | |
| Index Fund Investor Shares | 36.1 |
| Vanguard Total Bond Market II | |
| Index Fund Investor Shares | 7.0 |
| Vanguard Total International Bond | |
| Index Fund Admiral Shares | 3.0 |
Fund Asset Allocation

1 This figure—drawn from the prospectus dated July 12, 2017, as supplemented July 24, 2017—represents an estimate of the weighted average of the expense ratios and any transaction fees charged by the underlying mutual funds (the ”acquired” funds) in which the Institutional Target Retirement 2065 Fund invests. The fund does not charge any expenses or fees of its own. For the period from the fund’s inception through September 30, 2017, the annualized acquired fund fees and expenses were 0.09%.
62
Institutional Target Retirement 2065 Fund
Performance Summary
All of the returns in this report represent past performance, which is not a guarantee of future results that may be achieved by the fund. (Current performance may be lower or higher than the performance data cited. For performance data current to the most recent month-end, visit our website at vanguard.com/performance.) Note, too, that both investment returns and principal value can fluctuate widely, so an investor’s shares, when sold, could be worth more or less than their original cost. The returns shown do not reflect taxes that a shareholder would pay on fund distributions or on the sale of fund shares.
Cumulative Performance: July 12, 2017, Through September 30, 2017
Initial Investment of $100,000,000

| | |
| | Total Returns | |
| | Period Ended September 30, 2017 | |
| | Since | Final Value |
| | Inception | of a $100,000,000 |
| | (7/12/2017) | Investment |
| Institutional Target Retirement 2065 | | |
| Fund* | 4.00% | $104,000,000 |
| Target 2065 Composite Index | 3.84 | 103,841,580 |
| Mixed-Asset Target 2055+ Funds | | |
| Average | 4.00 | 104,004,920 |
| MSCI US Broad Market Index | 3.66 | 103,660,040 |
For a benchmark description, see the Glossary.
Mixed-Asset Target 2055+ Funds Average: Derived from data provided by Lipper, a Thomson Reuters Company.
"Since Inception" performance is calculated from the fund's inception date for both the fund and its comparative standards.
See Financial Highlights for dividend and capital gains information.
63
Institutional Target Retirement 2065 Fund
Fiscal-Period Total Returns (%): July 12, 2017, Through September 30, 2017
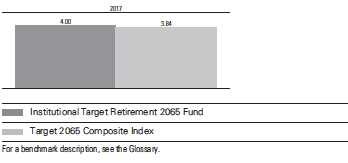
64
Institutional Target Retirement 2065 Fund
Financial Statements
Statement of Net Assets
As of September 30, 2017
The fund reports a complete list of its holdings in regulatory filings four times in each fiscal year, at the quarter-ends. For the second and fourth fiscal quarters, the lists appear in the fund’s semiannual and annual reports to shareholders. For the first and third fiscal quarters, the fund files the lists with the Securities and Exchange Commission on Form N-Q. Shareholders can look up the fund’s Forms N-Q on the SEC’s website at sec.gov. Forms N-Q may also be reviewed and copied at the SEC’s Public Reference Room (see the back cover of this report for further information).
| | |
| | | Market |
| | | Value• |
| | Shares | ($000) |
| Investment Companies (98.7%) | | |
| U.S. Stock Fund (53.3%) | | |
| Vanguard Total Stock Market Index Fund Institutional Shares | 46,162 | 2,911 |
| |
| International Stock Fund (35.6%) | | |
| Vanguard Total International Stock Index Fund Investor Shares | 110,787 | 1,946 |
| |
| U.S. Bond Fund (6.9%) | | |
| 1 Vanguard Total Bond Market II Index Fund Investor Shares | 35,051 | 377 |
| |
| International Bond Fund (2.9%) | | |
| Vanguard Total International Bond Index Fund Admiral Shares | 7,407 | 161 |
| Total Investment Companies (Cost $5,323) | | 5,395 |
| Temporary Cash Investment (1.6%) | | |
| Money Market Fund (1.6%) | | |
| 1 Vanguard Market Liquidity Fund, 1.223% (Cost $86) | 858 | 86 |
| Total Investments (100.3%) (Cost $5,409) | | 5,481 |
| Other Assets and Liabilities (-0.3%) | | |
| Other Assets | | 98 |
| Liabilities | | (116) |
| | | (18) |
| Net Assets (100%) | | |
| Applicable to 262,702 outstanding $.001 par value shares of | | |
| beneficial interest (unlimited authorization) | | 5,463 |
| Net Asset Value Per Share | | $20.80 |
65
| |
| Institutional Target Retirement 2065 Fund | |
| |
| |
| |
| |
| | Amount |
| | ($000) |
| Statement of Assets and Liabilities | |
| Assets | |
| Investments in Securities, at Value—Affiliated Vanguard Funds | 5,481 |
| Receivables for Accrued Income | 1 |
| Receivables for Capital Shares Issued | 97 |
| Total Assets | 5,579 |
| Liabilities | |
| Payables for Investment Securities Purchased | 112 |
| Payables for Capital Shares Redeemed | 4 |
| Total Liabilities | 116 |
| Net Assets | 5,463 |
| |
| |
| At September 30, 2017, net assets consisted of: | |
| | Amount |
| | ($000) |
| Paid-in Capital | 5,371 |
| Undistributed Net Investment Income | 20 |
| Accumulated Net Realized Gains | — |
| Unrealized Appreciation (Depreciation) | 72 |
| Net Assets | 5,463 |
• See Note A in Notes to Financial Statements.
1 Affiliated money market fund available only to Vanguard funds and certain trusts and accounts managed by Vanguard. Rate shown
is the 7-day yield.
See accompanying Notes, which are an integral part of the Financial Statements.
66
| |
| Institutional Target Retirement 2065 Fund | |
| |
| |
| Statement of Operations | |
| |
| | July 12, 20171 to |
| | September 30, 2017 |
| | ($000) |
| Investment Income | |
| Income | |
| Income Distributions Received from Affiliated Funds | 20 |
| Net Investment Income—Note B | 20 |
| Realized Net Gain (Loss) | — |
| Change in Unrealized Appreciation (Depreciation) of Investment Securities | 72 |
| Net Increase (Decrease) in Net Assets Resulting from Operations | 92 |
| 1 Inception. | |
See accompanying Notes, which are an integral part of the Financial Statements.
67
| |
| Institutional Target Retirement 2065 Fund | |
| |
| |
| Statement of Changes in Net Assets | |
| |
| | July 12, 20171 to |
| | September 30, 2017 |
| | ($000) |
| Increase (Decrease) in Net Assets | |
| Operations | |
| Net Investment Income | 20 |
| Realized Net Gain (Loss) | — |
| Change in Unrealized Appreciation (Depreciation) | 72 |
| Net Increase (Decrease) in Net Assets Resulting from Operations | 92 |
| Distributions | |
| Net Investment Income | — |
| Realized Capital Gain | — |
| Total Distributions | — |
| Capital Share Transactions | |
| Issued | 5,581 |
| Issued in Lieu of Cash Distributions | — |
| Redeemed | (210) |
| Net Increase (Decrease) from Capital Share Transactions | 5,371 |
| Total Increase (Decrease) | 5,463 |
| Net Assets | |
| Beginning of Period | — |
| End of Period2 | 5,463 |
1 Inception.
2 Net Assets—End of Period includes undistributed (overdistributed) net investment income of $20,000.
See accompanying Notes, which are an integral part of the Financial Statements.
68
| |
| Institutional Target Retirement 2065 Fund | |
| |
| |
| Financial Highlights | |
| |
| |
| | July 12, 20171 to |
| For a Share Outstanding Throughout the Period | September 30, 2017 |
| Net Asset Value, Beginning of Period | 20.00 |
| Investment Operations | |
| Net Investment Income2 | .197 |
| Capital Gain Distributions Received 2 | — |
| Net Realized and Unrealized Gain (Loss) on Investments | 0.603 |
| Total from Investment Operations | 0.800 |
| Distributions | |
| Dividends from Net Investment Income | — |
| Distributions from Realized Capital Gains | — |
| Total Distributions | — |
| Net Asset Value, End of Period | $20.80 |
| |
| Total Return | 4.00% |
| |
| Ratios/Supplemental Data | |
| Net Assets, End of Period (Millions) | $5 |
| Ratio of Total Expenses to Average Net Assets | — |
| Acquired Fund Fees and Expenses | 0.09%3 |
| Ratio of Net Investment Income to Average Net Assets | 4.33%3 |
| Portfolio Turnover Rate | 133% |
1 Inception.
2 Calculated based on average shares outstanding.
3 Annualized.
See accompanying Notes, which are an integral part of the Financial Statements.
69
Institutional Target Retirement 2065 Fund
Notes to Financial Statements
Vanguard Institutional Target Retirment 2065 Fund is registered under the Investment Company Act of 1940 as an open-end investment company, or mutual fund. The fund follows a balanced investment strategy by investing in selected Vanguard funds to achieve its targeted allocation of assets to U.S. and international stocks, and U.S. and international bonds. Financial statements and other information about each underlying fund are available on vanguard.com.
A. The following significant accounting policies conform to generally accepted accounting principles for U.S. investment companies. The fund consistently follows such policies in preparing its financial statements.
1. Security Valuation: Investments are valued at the net asset value of each underlying Vanguard fund determined as of the close of the New York Stock Exchange (generally 4 p.m., Eastern time) on the valuation date.
2. Federal Income Taxes: The fund intends to qualify as a regulated investment company and distribute all of its taxable income. Management has analyzed the fund’s tax positions taken for its open federal income tax period ended September 30, 2017, and has concluded that no provision for federal income tax is required in the fund’s financial statements.
3. Distributions: Distributions to shareholders are recorded on the ex-dividend date.
4. Other: Income and capital gain distributions received are recorded on the ex-dividend date. Security transactions are accounted for on the date securities are bought or sold. Costs used to determine realized gains (losses) on the sale of investment securities are those of the specific securities sold.
B. In accordance with the terms of a Funds’ Service Agreement (the “FSA”) between Vanguard and the fund, Vanguard furnishes to the fund investment advisory, corporate management, administrative, marketing, and distribution services at Vanguard’s cost of operations (as defined by the FSA). These costs of operations are allocated to the fund based on methods and guidelines approved by the board of trustees. The FSA provides that expenses otherwise allocable to Vanguard funds-of-funds may be reduced or eliminated to the extent of savings realized by the underlying Vanguard funds by virtue of being part of a fund-of-funds. Accordingly, all expenses for services provided by Vanguard to the fund and all other expenses incurred by the fund during the period ended September 30, 2017, were borne by the underlying Vanguard funds in which the fund invests. The fund’s trustees and officers are also trustees and officers, respectively, of the underlying Vanguard funds, as well as directors and employees, respectively, of Vanguard.
C. Various inputs may be used to determine the value of the fund’s investments. These inputs are summarized in three broad levels for financial statement purposes. The inputs or methodologies used to value securities are not necessarily an indication of the risk associated with investing in those securities.
Level 1—Quoted prices in active markets for identical securities.
Level 2—Other significant observable inputs (including quoted prices for similar securities, interest rates, prepayment speeds, credit risk, etc.).
Level 3—Significant unobservable inputs (including the fund’s own assumptions used to determine the fair value of investments). Any investments valued with significant unobservable inputs are noted on the Statement of Net Assets.
At September 30, 2017, 100% of the market value of the fund’s investments was determined based on Level 1 inputs.
70
Institutional Target Retirement 2065 Fund
D. Distributions are determined on a tax basis and may differ from net investment income and realized capital gains for financial reporting purposes. Differences may be permanent or temporary. Permanent differences are reclassified among capital accounts in the financial statements to reflect their tax character. Temporary differences arise when certain items of income, expense, gain, or loss are recognized in different periods for financial statement and tax purposes. These differences will reverse at some time in the future. Differences in classification may also result from the treatment of short-term gains as ordinary income for tax purposes.
For tax purposes, at September 30, 2017, the fund had $20,000 of ordinary income available for distribution.
At September 30, 2017, the cost of investment securities for tax purposes was $5,409,000. Net unrealized appreciation of investment securities for tax purposes was $72,000, consisting of unrealized gains of $74,000 on securities that had risen in value since their purchase and $2,000 in unrealized losses on securities that had fallen in value since their purchase.
| |
| E. Capital shares issued and redeemed were: | |
| | July 12, 20171 to |
| | September 30, 2017 |
| | Shares |
| | (000) |
| Issued | 273 |
| Issued in Lieu of Cash Distributions | — |
| Redeemed | (10) |
| Net Increase (Decrease) in Shares Outstanding | 263 |
| 1 Inception. | |
71
Institutional Target Retirement 2065 Fund
| | | | | | | | |
| F. Transactions during the period in affiliated underlying Vanguard funds were as follows: | |
| |
| | | | | | Current Period Transactions | |
| Sept. 30, | | Proceeds | | | | | Sept. 30, |
| | 2016 | | from | Realized | Change in | | Capital Gain | 2017 |
| | Market | Purchases | Securities | Net Gain | Unrealized | | Distributions | Market |
| | Value | at Cost | Sold | (Loss) | App. (Dep.) | Income | Received | Value |
| | ($000) | ($000) | ($000) | ($000) | ($000) | ($000) | ($000) | ($000) |
| Vanguard Market | | | | | | | | |
| Liquidity Fund | — | NA2 | NA 2 | — | — | — | — | 86 |
| Vanguard Total | | | | | | | | |
| Bond Market II | | | | | | | | |
| Index Fund | — | 401 | 23 | — | (1) | 1 | — | 377 |
| Vanguard Total | | | | | | | | |
| International Bond | | | | | | | | |
| Index Fund | — | 172 | 10 | — | (1) | — | — | 161 |
| Vanguard Total | | | | | | | | |
| International Stock | | | | | | | | |
| Index Fund | | | | | | | | |
| Investor Shares | — | 2,045 | 121 | — | 22 | 9 | — | 1,946 |
| Vanguard International | | | | | | | |
| Stock Index Fund | | | | | | | | |
| ETF Shares3 | — | 1,090 | 1,090 | — | — | — | — | — |
| Vanguard Total | | | | | | | | |
| Stock Market | | | | | | | | |
| Index Fund | | | | | | | | |
| Institutional Shares | — | 3,056 | 196 | (1) | 52 | 10 | — | 2,911 |
| Vanguard Total | | | | | | | | |
| Stock Market | | | | | | | | |
| Index Fund | | | | | | | | |
| ETF Shares3 | — | 2,444 | 2,445 | 1 | — | — | — | — |
| Total | — | 9,208 | 3,885 | — | 72 | 20 | — | 5,481 |
1 Inception.
2 Not applicable—purchases and sales are for temporary cash investment purposes.
3 The fund invested in ETF Shares during the period, but sold their positions before period end.
G. Management has determined that no material events or transactions occurred subsequent to September 30, 2017, that would require recognition or disclosure in these financial statements.
72
Report of Independent Registered Public Accounting Firm
To the Board of Trustees of Vanguard Chester Funds and the Shareholders of Vanguard Institutional Target Retirement 2040 Fund, Vanguard Institutional Target Retirement 2045 Fund, Vanguard Institutional Target Retirement 2050 Fund, Vanguard Institutional Target Retirement 2055 Fund, Vanguard Institutional Target Retirement 2060 Fund and Vanguard Institutional Target Retirement 2065 Fund In our opinion, the accompanying statements of net assets and statements of assets and liabilities, and the related statements of operations and of changes in net assets and the financial highlights present fairly, in all material respects, the financial position of Vanguard Institutional Target Retirement 2040 Fund, Vanguard Institutional Target Retirement 2045 Fund, Vanguard Institutional Target Retirement 2050 Fund, Vanguard Institutional Target Retirement 2055 Fund, Vanguard Institutional Target Retirement 2060 Fund and Vanguard Institutional Target Retirement 2065 Fund (constituting separate portfolios of Vanguard Chester Funds, hereafter referred to as the “Funds”) as of September 30, 2017, the results of operations for the year then ended, the changes in net assets for each of the two years in the period then ended and the financial highlights for each of the periods indicated for Vanguard Institutional Target Retirement 2040 Fund, Vanguard Institutional Target Retirement 2045 Fund, Vanguard Institutional Target Retirement 2050 Fund, Vanguard Institutional Target Retirement 2055 Fund and Vanguard Institutional Target Retirement 2060 Fund, and the results of operations, the changes in net assets and the financial highlights for the period July 12, 2017 (commencement of operations) through September 30, 2017 for Vanguard Institutional Target Retirement 2065 Fund, in conformity with accounting principles generally accepted in the United States of America. These financial statements and financial highlights (hereafter referred to as “financial statements”) are the responsibility of the Funds’ management. Our responsibility is to express an opinion on these financial statements based on our audits. We conducted our audits of these financial statements in accordance with the standards of the Public Company Accounting Oversight Board (United States). Those standards require that we plan and perform the audit to obtain reasonable assurance about whether the financial statements are free of material misstatement. An audit includes examining, on a test basis, evidence supporting the amounts and disclosures in the financial statements, assessing the accounting principles used and significant estimates made by management, and evaluating the overall financial statement presentation. We believe that our audits, which included confirmation of securities as of September 30, 2017 by agreement to the underlying ownership records of the transfer agent, provide a reasonable basis for our opinion.
/s/PricewaterhouseCoopers LLP
Philadelphia, Pennsylvania
November 16, 2017
73
Special 2017 tax information (unaudited) for Vanguard Institutional Target Retirement Funds
This information for the fiscal year ended September 30, 2017, is included pursuant to provisions of the Internal Revenue Code.
The funds distributed capital gain dividends (20% rate gain distributions) to shareholders during the fiscal year as follows:
| |
| Fund | ($000) |
| Institutional Target Retirement 2040 | 526 |
| Institutional Target Retirement 2045 | 383 |
| Institutional Target Retirement 2050 | 215 |
| Institutional Target Retirement 2055 | 44 |
| Institutional Target Retirement 2060 | 6 |
| Institutional Target Retirement 2065 | — |
For nonresident alien shareholders, 100% of short-term capital gain dividends distributed by the funds are qualified short-term capital gains.
The funds distributed qualified dividend income to shareholders during the fiscal year as follows:
| |
| Fund | ($000) |
| Institutional Target Retirement 2040 | 137,017 |
| Institutional Target Retirement 2045 | 110,769 |
| Institutional Target Retirement 2050 | 68,207 |
| Institutional Target Retirement 2055 | 23,592 |
| Institutional Target Retirement 2060 | 5,308 |
| Institutional Target Retirement 2065 | — |
For corporate shareholders, the percentage of investment income (dividend income plus short-term gains, if any) that qualifies for the dividends-received deduction is as follows:
| |
| Fund | Percentage |
| Institutional Target Retirement 2040 | 39.0% |
| Institutional Target Retirement 2045 | 40.0 |
| Institutional Target Retirement 2050 | 39.9 |
| Institutional Target Retirement 2055 | 39.8 |
| Institutional Target Retirement 2060 | 40.0 |
| Institutional Target Retirement 2065 | 44.7 |
74
The funds designate to shareholders foreign source income and foreign taxes paid as follows:
| | |
| | Foreign Source Income | Foreign Taxes Paid |
| Fund | ($000) | ($000) |
| Institutional Target Retirement 2040 | 128,997 | 8,105 |
| Institutional Target Retirement 2045 | 107,116 | 6,807 |
| Institutional Target Retirement 2050 | 69,308 | 4,407 |
| Institutional Target Retirement 2055 | 26,918 | 1,714 |
| Institutional Target Retirement 2060 | 6,400 | 408 |
| Institutional Target Retirement 2065 | — | — |
Shareholders will receive more detailed information with their Form 1099-DIV in January 2018 to determine the calendar-year amounts to be included on their 2017 tax returns.
75
About Your Fund’s Expenses
As a shareholder of the fund, you incur ongoing costs, which include costs for portfolio management, administrative services, and shareholder reports (like this one), among others. Operating expenses, which are deducted from a fund’s gross income, directly reduce the investment return of the fund.
A typical fund’s expenses are expressed as a percentage of its average net assets. The Institutional Target Retirement Funds have no direct expenses, but each fund bears its proportionate share of the costs for the underlying funds in which it invests. These indirect expenses make up the acquired fund fees and expenses, also expressed as a percentage of average net assets.
The following examples are intended to help you understand the ongoing cost (in dollars) of investing in your fund and to compare these costs with those of other mutual funds. The examples are based on an investment of $1,000 made at the beginning of the period shown and held for the entire period. The costs were calculated using the acquired fund fees and expenses for each Institutional Target Retirement Fund.
The accompanying table illustrates your fund’s costs in two ways:
• Based on actual fund return. This section helps you to estimate the actual expenses that you paid over the period. The ”Ending Account Value“ shown is derived from the fund‘s actual return, and the third column shows the dollar amount that would have been paid by an investor who started with $1,000 in the fund. You may use the information here, together with the amount you invested, to estimate the expenses that you paid over the period.
To do so, simply divide your account value by $1,000 (for example, an $8,600 account value divided by $1,000 = 8.6), then multiply the result by the number given for your fund under the heading ”Expenses Paid During Period.“
• Based on hypothetical 5% yearly return. This section is intended to help you compare your fund‘s costs with those of other mutual funds. It assumes that the fund had a yearly return of 5% before expenses, but that the expense ratio is unchanged. In this case—because the return used is not the fund’s actual return—the results do not apply to your investment. The example is useful in making comparisons because the Securities and Exchange Commission requires all mutual funds to calculate expenses based on a 5% return. You can assess your fund’s costs by comparing this hypothetical example with the hypothetical examples that appear in shareholder reports of other funds.
Note that the expenses shown in the table are meant to highlight and help you compare ongoing costs only and do not reflect transaction costs incurred by the fund for buying and selling securities. Further, the expenses do not include any purchase, redemption, or account service fees described in the fund prospectus. If such fees were applied to your account, your costs would be higher. Your fund does not carry a “sales load.”
The calculations assume no shares were bought or sold during the period. Your actual costs may have been higher or lower, depending on the amount of your investment and the timing of any purchases or redemptions.
You can find more information about the fund’s expenses, including annual expense ratios, in the Financial Statements section of this report. For additional information on operating expenses and other shareholder costs, please refer to your fund’s current prospectus.
76
| | | |
| Six Months Ended September 30, 2017 | | | |
| | Beginning | Ending | Expenses |
| | Account Value | Account Value | Paid During |
| | 3/31/2017 | 9/30/2017 | Period |
| Based on Actual Fund Return | | | |
| Institutional Target Retirement 2040 Fund1 | $1,000.00 | $1,084.67 | $0.47 |
| Institutional Target Retirement 2045 Fund1 | $1,000.00 | $1,086.75 | $0.47 |
| Institutional Target Retirement 2050 Fund1 | $1,000.00 | $1,087.18 | $0.47 |
| Institutional Target Retirement 2055 Fund1 | $1,000.00 | $1,087.06 | $0.47 |
| Institutional Target Retirement 2060 Fund1 | $1,000.00 | $1,087.14 | $0.47 |
| Institutional Target Retirement 2065 Fund2 | $1,000.00 | $1,040.00 | $0.20 |
| Based on Hypothetical 5% Yearly Return | | | |
| Institutional Target Retirement 2040 Fund1 | $1,000.00 | $1,024.62 | $0.46 |
| Institutional Target Retirement 2045 Fund1 | $1,000.00 | $1,024.62 | $0.46 |
| Institutional Target Retirement 2050 Fund1 | $1,000.00 | $1,024.62 | $0.46 |
| Institutional Target Retirement 2055 Fund1 | $1,000.00 | $1,024.62 | $0.46 |
| Institutional Target Retirement 2060 Fund1 | $1,000.00 | $1,024.62 | $0.46 |
| Institutional Target Retirement 2065 Fund2 | $1,000.00 | $1,010.76 | $0.20 |
1 The calculations are based on the acquired fund fees and expenses for the most recent six-month period. The funds’ annualized expense figures for that period are (in order as listed from top to bottom above) 0.09%, 0.09%, 0.09%, 0.09%, and 0.09%. The dollar amounts shown as ”Expenses Paid” are equal to the annualized expense figures for the underlying funds multiplied by the average account value over the period, multiplied by the number of days in the most recent six-month period, then divided by the number of days in the most recent 12-month period (183/365).
2 The calculation is based on the acquired fund fees and expenses for the most recent six-month period. The fund’s annualized expense figure for the period is 0.09%. The dollar amount shown as ”Expenses Paid” is equal to the annualized average weighted expense ratio for the underlying funds multiplied by the average account value over the period, multiplied by the number of days in the period from inception (July 12, 2017) to September 30, 2017, then divided by the number of days in the 12-month period (81/365).
77
Glossary
30-Day SEC Yield. A fund’s 30-day SEC yield is derived using a formula specified by the U.S. Securities and Exchange Commission. Under the formula, data related to the fund’s security holdings in the previous 30 days are used to calculate the fund’s hypothetical net income for that period, which is then annualized and divided by the fund’s estimated average net assets over the calculation period. For the purposes of this calculation, a security’s income is based on its current market yield to maturity (for bonds), its actual income (for asset-backed securities), or its projected dividend yield (for stocks). Because the SEC yield represents hypothetical annualized income, it will differ—at times significantly—from the fund’s actual experience. As a result, the fund’s income distributions may be higher or lower than implied by the SEC yield.
Acquired Fund Fees and Expenses. Funds that invest in other Vanguard funds incur no direct expenses, but they do bear proportionate shares of the operating, administrative, and advisory expenses of the underlying funds, and they must pay any fees charged by those funds. The figure for acquired fund fees and expenses represents a weighted average of these underlying costs. Acquired is a term that the Securities and Exchange Commission applies to any mutual fund whose shares are owned by another fund.
Expense Ratio. A fund’s total annual operating expenses expressed as a percentage of the fund’s average net assets. The expense ratio includes management and administrative expenses, but does not include the transaction costs of buying and selling portfolio securities.
Inception Date. The date on which the assets of a fund (or one of its share classes) are first invested in accordance with the fund’s investment objective. For funds with a subscription period, the inception date is the day after that period ends. Investment performance is measured from the inception date.
Benchmark Information
Target 2040 Composite Index: Derived by applying the fund’s target asset allocation to the results of the following benchmarks: for international stocks of developed markets, the MSCI EAFE Index through December 15, 2010, the MSCI ACWI ex USA IMI Index through June 2, 2013, and the FTSE Global All Cap ex US Index thereafter; for emerging-market stocks, the Select Emerging Markets Index through August 23, 2006, the MSCI Emerging Markets Index through December 15, 2010, the MSCI ACWI ex USA IMI Index through June 2, 2013, and the FTSE Global All Cap ex US Index thereafter; for U.S. bonds, the Bloomberg Barclays U.S. Aggregate Bond Index through December 31, 2009, and the Bloomberg Barclays U.S. Aggregate Float Adjusted Index thereafter; for international bonds, the Bloomberg Barclays Global Aggregate ex-USD Float Adjusted RIC Capped Index beginning June 3, 2013; and for U.S. stocks, the MSCI US Broad Market Index through June 2, 2013, and the CRSP US Total Market Index thereafter. International stock benchmark returns are adjusted for withholding taxes.
78
Target 2045 Composite Index: Derived by applying the fund’s target asset allocation to the results of the following benchmarks: for international stocks of developed markets, the MSCI EAFE Index through December 15, 2010, the MSCI ACWI ex USA IMI Index through June 2, 2013, and the FTSE Global All Cap ex US Index thereafter; for emerging-market stocks, the Select Emerging Markets Index through August 23, 2006, the MSCI Emerging Markets Index through December 15, 2010, the MSCI ACWI ex USA IMI Index through June 2, 2013, and the FTSE Global All Cap ex US Index thereafter; for U.S. bonds, the Bloomberg Barclays U.S. Aggregate Bond Index through December 31, 2009, and the Bloomberg Barclays U.S. Aggregate Float Adjusted Index thereafter; for international bonds, the Bloomberg Barclays Global Aggregate ex-USD Float Adjusted RIC Capped Index beginning June 3, 2013; and for U.S. stocks, the Dow Jones U.S. Total Stock Market Index (formerly known as the Dow Jones Wilshire 5000 Index) through April 22, 2005, the MSCI US Broad Market Index through June 2, 2013, and the CRSP US Total Market Index thereafter. International stock benchmark returns are adjusted for withholding taxes.
Target 2050 Composite Index: Derived by applying the fund’s target asset allocation to the results of the following benchmarks: for international stocks of developed markets, the MSCI EAFE Index through December 15, 2010, the MSCI ACWI ex USA IMI Index through June 2, 2013, and the FTSE Global All Cap ex US Index thereafter; for emerging-market stocks, the Select Emerging Markets Index through August 23, 2006, the MSCI Emerging Markets Index through December 15, 2010, the MSCI ACWI ex USA IMI Index through June 2, 2013, and the FTSE Global All Cap ex US Index thereafter; for U.S. bonds, the Bloomberg Barclays U.S. Aggregate Bond Index through December 31, 2009, and the Bloomberg Barclays U.S. Aggregate Float Adjusted Index thereafter; for international bonds, the Bloomberg Barclays Global Aggregate ex-USD Float Adjusted RIC Capped Index beginning June 3, 2013; and for U.S. stocks, the MSCI US Broad Market Index through June 2, 2013, and the CRSP US Total Market Index thereafter. International stock benchmark returns are adjusted for withholding taxes.
Target 2055 Composite Index: Derived by applying the fund’s target asset allocation to the results of the following benchmarks: for international stocks of developed markets, the MSCI EAFE Index through December 15, 2010, the MSCI ACWI ex USA IMI Index through June 2, 2013, and the FTSE Global All Cap ex US Index thereafter; for emerging-market stocks, the MSCI Emerging Markets Index through December 15, 2010, the MSCI ACWI ex USA IMI Index through June 2, 2013, and the FTSE Global All Cap ex US Index thereafter; for U.S. bonds, the Bloomberg Barclays U.S. Aggregate Float Adjusted Index; for international bonds, the Bloomberg Barclays Global Aggregate ex-USD Float Adjusted RIC Capped Index beginning June 3, 2013; and for U.S. stocks, the MSCI US Broad Market Index through June 2, 2013, and the CRSP US Total Market Index thereafter. International stock benchmark returns are adjusted for withholding taxes.
79
Target 2060 Composite Index: Derived by applying the fund’s target asset allocation to the results of the following benchmarks: for international stocks of developed markets, the MSCI ACWI ex USA IMI Index through June 2, 2013, and the FTSE Global All Cap ex US Index thereafter; for emerging-market stocks, the MSCI ACWI ex USA IMI Index through June 2, 2013, and the FTSE Global All Cap ex US Index thereafter; for U.S. bonds, the Bloomberg Barclays U.S. Aggregate Float Adjusted Index; for international bonds, the Bloomberg Barclays Global Aggregate ex-USD Float Adjusted RIC Capped Index beginning June 3, 2013; and for U.S. stocks, the MSCI US Broad Market Index through June 2, 2013, and the CRSP US Total Market Index thereafter. International stock benchmark returns are adjusted for withholding taxes.
Target 2065 Composite Index: Derived by applying the fund’s target asset allocation to the results of the following benchmarks: the FTSE Global All Cap ex US Index for international stocks, the Bloomberg Barclays U.S. Aggregate Float Adjusted Index for U.S. bonds, the Bloomberg Barclays Global Aggregate ex-USD Float Adjusted RIC Capped Index for international bonds, and the CRSP US Total Market Index for U.S. stocks. International stock benchmark returns are adjusted for withholding taxes.
80
BLOOMBERG is a trademark and service mark of Bloomberg Finance L.P. BARCLAYS is a trademark and service mark of Barclays Bank Plc, used under license. Bloomberg Finance L.P. and its affiliates, including Bloomberg Index Services Limited (BISL) (collectively, Bloomberg), or Bloomberg’s licensors, own all proprietary rights in the Bloomberg Barclays U.S. Aggregate Bond Index, Bloomberg Barclays U.S. Aggregate Float Adjusted Index, and the Bloomberg Barclays Global Aggregate ex-USD Float Adjusted RIC Capped Index (USD Hedged) (the Indices or Bloomberg Barclays Indices).
Neither Barclays Bank Plc, Barclays Capital Inc., or any affiliate (collectively Barclays) or Bloomberg is the issuer or producer of the Target Retirement Funds (including the Total Bond Market II Index Fund and the Total International Bond Index Fund) and neither Bloomberg nor Barclays has any responsibilities, obligations or duties to investors in the Target Retirement Funds. The Indices are licensed for use by The Vanguard Group, Inc. (Vanguard) as the sponsor of the Target Retirement Funds. Bloomberg and Barclays’ only relationship with Vanguard in respect to the Indices is the licensing of the Indices, which is determined, composed and calculated by BISL, or any successor thereto, without regard to the Issuer or the Target Retirement Funds or the owners of the Target Retirement Funds.
Additionally, Vanguard may for itself execute transaction(s) with Barclays in or relating to the Indices in connection with the Target Retirement Funds. Investors acquire the Target Retirement Funds from Vanguard and investors neither acquire any interest in the Indices nor enter into any relationship of any kind whatsoever with Bloomberg or Barclays upon making an investment in the Target Retirement Funds. The Target Retirement Funds are not sponsored, endorsed, sold or promoted by Bloomberg or Barclays. Neither Bloomberg nor Barclays makes any representation or warranty, express or implied regarding the advisability of investing in the Target Retirement Funds or the advisability of investing in securities generally or the ability of the Indices to track corresponding or relative market performance. Neither Bloomberg nor Barclays has passed on the legality or suitability of the Target Retirement Funds with respect to any person or entity. Neither Bloomberg nor Barclays is responsible for and has not participated in the determination of the timing of, prices at, or quantities of the Target Retirement Funds to be issued. Neither Bloomberg nor Barclays has any obligation to take the needs of the Issuer or the owners of the Target Retirement Funds or any other third party into consideration in determining, composing or calculating the Indices. Neither Bloomberg nor Barclays has any obligation or liability in connection with administration, marketing or trading of the Target Retirement Funds.
The licensing agreement between Bloomberg and Barclays is solely for the benefit of Bloomberg and Barclays and not for the benefit of the owners of the Target Retirement Funds, investors or other third parties. In addition, the licensing agreement between Vanguard and Bloomberg is solely for the benefit of Vanguard and Bloomberg and not for the benefit of the owners of the Target Retirement Funds, investors or other third parties.
81
NEITHER BLOOMBERG NOR BARCLAYS SHALL HAVE ANY LIABILITY TO THE ISSUER, INVESTORS OR TO OTHER THIRD PARTIES FOR THE QUALITY, ACCURACY AND/OR COMPLETENESS OF THE BLOOMBERG BARCLAYS INDICES OR ANY DATA INCLUDED THEREIN OR FOR INTERRUPTIONS IN THE DELIVERY OF THE BLOOMBERG BARCLAYS INDICES. NEITHER BLOOMBERG NOR BARCLAYS MAKES ANY WARRANTY, EXPRESS OR IMPLIED, AS TO RESULTS TO BE OBTAINED BY THE ISSUER, THE INVESTORS OR ANY OTHER PERSON OR ENTITY FROM THE USE OF THE BLOOMBERG BARCLAYS INDICES OR ANY DATA INCLUDED THEREIN. NEITHER BLOOMBERG NOR BARCLAYS MAKES ANY EXPRESS OR IMPLIED WARRANTIES, AND EACH HEREBY EXPRESSLY DISCLAIMS ALL WARRANTIES OF MERCHANTABILITY
OR FITNESS FOR A PARTICULAR PURPOSE OR USE WITH RESPECT TO BLOOMBERG BARCLAYS INDICES OR ANY DATA INCLUDED THEREIN. BLOOMBERG RESERVES THE RIGHT TO CHANGE THE METHODS OF CALCULATION OR PUBLICATION, OR TO CEASE THE CALCULATION OR PUBLICATION OF THE BLOOMBERG BARCLAYS INDICES, AND NEITHER BLOOMBERG NOR BARCLAYS SHALL BE LIABLE FOR ANY MISCALCULATION OF OR ANY INCORRECT, DELAYED OR INTERRUPTED PUBLICATION WITH RESPECT TO ANY OF THE BLOOMBERG BARCLAYS INDICES. NEITHER BLOOMBERG NOR BARCLAYS SHALL BE LIABLE FOR ANY DAMAGES, INCLUDING, WITHOUT LIMITATION, ANY SPECIAL, INDIRECT OR CONSEQUENTIAL DAMAGES, OR ANY LOST PROFITS AND EVEN IF ADVISED OF THE POSSIBLITY OF SUCH, RESULTING FROM THE USE OF BLOOMBERG BARCLAYS INDICES OR ANY DATA INCLUDED THEREIN OR WITH RESPECT TO THE TARGET RETIREMENT FUNDS.
None of the information supplied by Bloomberg or Barclays and used in this publication may be reproduced in any manner without the prior written permission of both Bloomberg and Barclays Capital, the investment banking division of Barclays Bank Plc. Barclays Bank Plc is registered in England No. 1026167. Registered office 1 Churchill Place London E14 5HP.
© 2017 Bloomberg. Used with Permission.
Source: Bloomberg Index Services Limited. Copyright 2017, Bloomberg. All rights reserved.
82
The People Who Govern Your Fund
The trustees of your mutual fund are there to see that the fund is operated and managed in your best interests since, as a shareholder, you are a part owner of the fund. Your fund’s trustees also serve on the board of directors of The Vanguard Group, Inc., which is owned by the Vanguard funds and provides services to them on an at-cost basis.
A majority of Vanguard’s board members are independent, meaning that they have no affiliation with Vanguard or the funds they oversee, apart from the sizable personal investments they have made as private individuals. The independent board members have distinguished backgrounds in business, academia, and public service. Each of the trustees and executive officers oversees 198 Vanguard funds.
Information for each trustee and executive officer of the fund appears below. The mailing address of the trustees and officers is P.O. Box 876, Valley Forge, PA 19482. More information about the trustees is in the Statement of Additional Information, which can be obtained, without charge, by contacting Vanguard at 800-662-7447, or online at vanguard.com.
Interested Trustee1
F. William McNabb III
Born 1957. Trustee Since July 2009. Chairman of the Board. Principal Occupation(s) During the Past Five Years and Other Experience: Chairman of the Board of The Vanguard Group, Inc., and of each of the investment companies served by The Vanguard Group, since January 2010; Chief Executive Officer and Director of The Vanguard Group and President and Chief Executive Officer of each of the investment companies served by The Vanguard Group, since 2008; Director of Vanguard Marketing Corporation; President of The Vanguard Group (2008–2017); Managing Director of The Vanguard Group (1995–2008).
Independent Trustees
Emerson U. Fullwood
Born 1948. Trustee Since January 2008. Principal Occupation(s) During the Past Five Years and Other Experience: Executive Chief Staff and Marketing Officer for North America and Corporate Vice President (retired 2008) of Xerox Corporation (document management products and services);
Executive in Residence and 2009–2010 Distinguished Minett Professor at the Rochester Institute of Technology; Lead Director of SPX FLOW, Inc. (multi-industry manufacturing); Director of the United Way of Rochester, the University of Rochester Medical Center, Monroe Community College Foundation, North Carolina A&T University, and Roberts Wesleyan College; Trustee of the University of Rochester.
Rajiv L. Gupta
Born 1945. Trustee Since December 2001.2 Principal Occupation(s) During the Past Five Years and Other Experience: Chairman and Chief Executive Officer (retired 2009) and President (2006–2008) of Rohm and Haas Co. (chemicals); Director of Arconic Inc. (diversified manufacturer), HP Inc. (printer and personal computer manufacturing), and Delphi Automotive plc (automotive components); Senior Advisor at New Mountain Capital.
Amy Gutmann
Born 1949. Trustee Since June 2006. Principal Occupation(s) During the Past Five Years and Other Experience: President of the University of Pennsylvania; Christopher H. Browne
1 Mr. McNabb is considered an “interested person,” as defined in the Investment Company Act of 1940, because he is an officer of the
Vanguard funds.
2 December 2002 for Vanguard Equity Income Fund, the Vanguard Municipal Bond Funds, and the Vanguard State Tax-Exempt Funds.
Distinguished Professor of Political Science, School of Arts and Sciences, and Professor of Communication, Annenberg School for Communication, with secondary faculty appointments in the Department of Philosophy, School of Arts and Sciences, and at the Graduate School of Education, University of Pennsylvania; Trustee of the National Constitution Center.
JoAnn Heffernan Heisen
Born 1950. Trustee Since July 1998. Principal Occupation(s) During the Past Five Years and Other Experience: Corporate Vice President and Member of the Executive Committee (1997–2008), Chief Global Diversity Officer (retired 2008), Vice President and Chief Information Officer (1997–2006), Controller (1995–1997), Treasurer (1991–1995), and Assistant Treasurer (1989–1991) of Johnson & Johnson (pharmaceuticals/medical devices/ consumer products); Director of Skytop Lodge Corporation (hotels) and the Robert Wood Johnson Foundation; Member of the Advisory Board of the Institute for Women’s Leadership at Rutgers University.
F. Joseph Loughrey
Born 1949. Trustee Since October 2009. Principal Occupation(s) During the Past Five Years and Other Experience: President and Chief Operating Officer (retired 2009) of Cummins Inc. (industrial machinery); Chairman of the Board of Hillenbrand, Inc. (specialized consumer services), Oxfam America, and the Lumina Foundation for Education; Director of the V Foundation for Cancer Research; Member of the Advisory Council for the College of Arts and Letters and Chair of the Advisory Board to the Kellogg Institute for International Studies, both at the University of Notre Dame.
Mark Loughridge
Born 1953. Trustee Since March 2012. Principal Occupation(s) During the Past Five Years and Other Experience: Senior Vice President and Chief Financial Officer (retired 2013) at IBM (information technology services); Fiduciary Member of IBM’s Retirement Plan Committee (2004–2013); Member of the Council on Chicago Booth.
Scott C. Malpass
Born 1962. Trustee Since March 2012. Principal Occupation(s) During the Past Five Years and Other Experience: Chief Investment Officer and Vice President at the University of Notre Dame; Assistant Professor of Finance at the Mendoza College of Business at Notre Dame; Member of the Notre Dame 403(b) Investment Committee, the Board of Advisors for Spruceview Capital Partners, the Board of Catholic Investment Services, Inc. (investment advisor), and the Board of Superintendence of the Institute for the Works of Religion; Chairman of the Board of TIFF Advisory Services, Inc. (investment advisor).
André F. Perold
Born 1952. Trustee Since December 2004. Principal Occupation(s) During the Past Five Years and Other Experience: George Gund Professor of Finance and Banking, Emeritus at the Harvard Business School (retired 2011); Chief Investment Officer and Co-Managing Partner of HighVista Strategies LLC (private investment firm); Overseer of the Museum of Fine Arts Boston.
Peter F. Volanakis
Born 1955. Trustee Since July 2009. Principal Occupation(s) During the Past Five Years and Other Experience: President and Chief Operating Officer (retired 2010) of Corning Incorporated (communications equipment); Chairman of the Board of Trustees of Colby-Sawyer College; Member of the Board of Hypertherm, Inc. (industrial cutting systems, software, and consumables).
Executive Officers
Glenn Booraem
Born 1967. Investment Stewardship Officer Since February 2017. Principal Occupation(s) During the Past Five Years and Other Experience: Principal of The Vanguard Group, Inc.; Treasurer (2015–2017), Controller (2010–2015), and Assistant Controller (2001–2010) of each of the investment companies served by The Vanguard Group.
Thomas J. Higgins
Born 1957. Chief Financial Officer Since September 2008. Principal Occupation(s) During the Past Five Years and Other Experience: Principal of The Vanguard Group, Inc.; Chief Financial Officer of each of the investment companies served by The Vanguard Group; Treasurer of each of the investment companies served by The Vanguard Group (1998–2008).
Peter Mahoney
Born 1974. Controller Since May 2015. Principal Occupation(s) During the Past Five Years and Other Experience: Principal of The Vanguard Group, Inc.; Controller of each of the investment companies served by The Vanguard Group; Head of International Fund Services at The Vanguard Group (2008–2014).
Anne E. Robinson
Born 1970. Secretary Since September 2016. Principal Occupation(s) During the Past Five Years and Other Experience: Managing Director of The Vanguard Group, Inc.; General Counsel of The Vanguard Group; Secretary of The Vanguard Group and of each of the investment companies served by The Vanguard Group; Director and Senior Vice President of Vanguard Marketing Corporation; Managing Director and General Counsel of Global Cards and Consumer Services at Citigroup (2014–2016); Counsel at American Express (2003–2014).
Michael Rollings
Born 1963. Treasurer Since February 2017. Principal Occupation(s) During the Past Five Years and Other Experience: Managing Director of The Vanguard Group, Inc.; Treasurer of each of the investment companies served by The Vanguard Group; Director of Vanguard Marketing Corporation; Executive Vice President and Chief Financial Officer of MassMutual Financial Group (2006–2016).
| |
| Vanguard Senior Management Team |
| |
| Mortimer J. Buckley | Chris D. McIsaac |
| Gregory Davis | James M. Norris |
| John James | Thomas M. Rampulla |
| Martha G. King | Karin A. Risi |
| John T. Marcante | |
| |
| |
| Chairman Emeritus and Senior Advisor |
| |
| John J. Brennan | |
| Chairman, 1996–2009 | |
| Chief Executive Officer and President, 1996–2008 |
| |
| |
| Founder | |
| |
| John C. Bogle | |
| Chairman and Chief Executive Officer, 1974–1996 |
|  |
| P.O. Box 2600
Valley Forge, PA 19482-2600 |
Connect with Vanguard® > vanguard.com | |
| | |
| Fund Information > 800-662-7447 | |
| Direct Investor Account Services > 800-662-2739 | |
| Institutional Investor Services > 800-523-1036 | |
| Text Telephone for People | |
| Who Are Deaf or Hard of Hearing> 800-749-7273 | |
| |
| This material may be used in conjunction | |
| with the offering of shares of any Vanguard | |
| fund only if preceded or accompanied by | |
| the fund’s current prospectus. | |
| |
| All comparative mutual fund data are from Lipper, a | |
| Thomson Reuters Company, or Morningstar, Inc., unless | |
| otherwise noted. | |
| |
| You can obtain a free copy of Vanguard’s proxy voting | |
| guidelines by visiting vanguard.com/proxyreporting or by | |
| calling Vanguard at 800-662-2739. The guidelines are | |
| also available from the SEC’s website, sec.gov. In | |
| addition, you may obtain a free report on how your fund | |
| voted the proxies for securities it owned during the 12 | |
| months ended June 30. To get the report, visit either | |
| vanguard.com/proxyreporting or sec.gov. | |
| |
| You can review and copy information about your fund at | |
| the SEC’s Public Reference Room in Washington, D.C. To | |
| find out more about this public service, call the SEC at | |
| 202-551-8090. Information about your fund is also | |
| available on the SEC’s website, and you can receive | |
| copies of this information, for a fee, by sending a | |
| request in either of two ways: via email addressed to | |
| publicinfo@sec.gov or via regular mail addressed to the | |
| Public Reference Section, Securities and Exchange | |
| Commission, Washington, DC 20549-1520. | |
| | © 2017 The Vanguard Group, Inc. |
| | All rights reserved. |
| | Vanguard Marketing Corporation, Distributor. |
| |
| | Q6730B 112017 |
Item 2: Code of Ethics. The Registrant has adopted a code of ethics that applies to the Registrant’s principal
executive officer, principal financial officer, principal accounting officer or controller or persons performing similar
functions. The Code of Ethics was amended during the reporting period covered by this report to make certain
technical, non-material changes.
Item 3: Audit Committee Financial Expert. All members of the Audit Committee have been determined by the
Registrant’s Board of Trustees to be Audit Committee Financial Experts and to be independent: Rajiv L. Gupta,
JoAnn Heffernan Heisen, F. Joseph Loughrey, Mark Loughridge, and Peter F. Volanakis.
Item 4: Principal Accountant Fees and Services.
(a) Audit Fees.
Audit Fees of the Registrant
Fiscal Year Ended September 30, 2017: $35,000
Fiscal Year Ended September 30, 2016: $35,000
Aggregate Audit Fees of Registered Investment Companies in the Vanguard Group.
Fiscal Year Ended September 30, 2017: $8,424,459
Fiscal Year Ended September 30, 2016: $9,629,849
Includes fees billed in connection with audits of the Registrant, other registered investment companies in
the Vanguard complex, The Vanguard Group, Inc. and Vanguard Marketing Corporation.
(b) Audit-Related Fees.
Fiscal Year Ended September 30, 2017: $3,194,093
Fiscal Year Ended September 30, 2016: $2,717,627
Includes fees billed in connection with assurance and related services provided to the Registrant, other
registered investment companies in the Vanguard complex, The Vanguard Group, Inc., and Vanguard
Marketing Corporation.
(c) Tax Fees.
Fiscal Year Ended September 30, 2017: $274,313
Fiscal Year Ended September 30, 2016: $254,050
Includes fees billed in connection with tax compliance, planning, and advice services provided to the
Registrant, other registered investment companies in the Vanguard complex, The Vanguard Group, Inc.,
and Vanguard Marketing Corporation.
(d) All Other Fees.
Fiscal Year Ended September 30, 2017: $0
Fiscal Year Ended September 30, 2016: $214,225
Includes fees billed for services related to tax reported information provided to the Registrant, other
registered investment companies in the Vanguard complex, The Vanguard Group, Inc., and Vanguard
Marketing Corporation.
(e) (1) Pre-Approval Policies. The policy of the Registrant’s Audit Committee is to consider and, if
appropriate, approve before the principal accountant is engaged for such services, all specific audit and
non-audit services provided to: the Registrant, other registered investment companies in the Vanguard
complex, The Vanguard Group, Inc., and entities controlled by The Vanguard Group, Inc. that provide
ongoing services to the Registrant. In making a determination, the Audit Committee considers whether the
services are consistent with maintaining the principal accountant’s independence.
In the event of a contingency situation in which the principal accountant is needed to provide services
in between scheduled Audit Committee meetings, the Chairman of the Audit Committee would be called on
to consider and, if appropriate, pre-approve audit or permitted non-audit services in an amount sufficient to
complete services through the next Audit Committee meeting, and to determine if such services would be
consistent with maintaining the accountant’s independence. At the next scheduled Audit Committee
meeting, services and fees would be presented to the Audit Committee for formal consideration, and, if
appropriate, approval by the entire Audit Committee. The Audit Committee would again consider whether
such services and fees are consistent with maintaining the principal accountant’s independence.
The Registrant’s Audit Committee is informed at least annually of all audit and non-audit services
provided by the principal accountant to the Vanguard complex, whether such services are provided to: the
Registrant, other registered investment companies in the Vanguard complex, The Vanguard Group, Inc., or
other entities controlled by The Vanguard Group, Inc. that provide ongoing services to the Registrant.
(2) No percentage of the principal accountant’s fees or services were approved pursuant to the waiver
provision of paragraph (c)(7)(i)(C) of Rule 2-01 of Regulation S-X.
(f) For the most recent fiscal year, over 50% of the hours worked under the principal accountant’s
engagement were not performed by persons other than full-time, permanent employees of the principal
accountant.
(g) Aggregate Non-Audit Fees.
Fiscal Year Ended September 30, 2017: $274,313
Fiscal Year Ended September 30, 2016: $468,275
Includes fees billed for non-audit services provided to the Registrant, other registered investment
companies in the Vanguard complex, The Vanguard Group, Inc., and Vanguard Marketing Corporation.
(h) For the most recent fiscal year, the Audit Committee has determined that the provision of all non-
audit services was consistent with maintaining the principal accountant’s independence.
Item 5: Audit Committee of Listed Registrants.
Not Applicable.
Item 6: Investments.
Not Applicable.
Item 7: Disclosure of Proxy Voting Policies and Procedures for Closed-End Management Investment Companies.
Not Applicable.
Item 8: Portfolio Managers of Closed-End Management Investment Companies.
Not Applicable.
Item 9: Purchase of Equity Securities by Closed-End Management Investment Company and Affiliated
Purchasers.
Not Applicable.
Item 10: Submission of Matters to a Vote of Security Holders.
Not Applicable.
Item 11: Controls and Procedures.
(a) Disclosure Controls and Procedures. The Principal Executive and Financial Officers
concluded that the Registrant’s Disclosure Controls and Procedures are effective based on their evaluation
of the Disclosure Controls and Procedures as of a date within 90 days of the filing date of this report.
(b) Internal Control Over Financial Reporting. There were no significant changes in Registrant’s
Internal Control Over Financial Reporting or in other factors that could significantly affect this control
subsequent to the date of the evaluation, including any corrective actions with regard to significant
deficiencies and material weaknesses.
Item 12: Disclosure of Securities Lending Activities for Closed-End Management
Investment Companies.
Not Applicable.
Item 13: Exhibits.
(a) Code of Ethics.
(b) Certifications.
Pursuant to the requirements of the Securities Exchange Act of 1934 and the Investment Company Act of
1940, the registrant has duly caused this report to be signed on its behalf by the undersigned, thereunto
duly authorized.
| |
| | VANGUARD CHESTER FUNDS |
| |
| By: | /s/ F. WILLIAM MCNABB III* |
| | F. WILLIAM MCNABB III |
| | CHIEF EXECUTIVE OFFICER |
| |
| Date: November 21, 2017 |
Pursuant to the requirements of the Securities Exchange Act of 1934 and the Investment Company Act of 1940, this report has been signed below by the following persons on behalf of the registrant and in the capacities and on the dates indicated.
| |
| | VANGUARD CHESTER FUNDS |
| |
| By: | /s/ F. WILLIAM MCNABB III* |
| | F. WILLIAM MCNABB III |
| | CHIEF EXECUTIVE OFFICER |
| |
| Date: November 21, 2017 |
| |
| | VANGUARD CHESTER FUNDS |
| |
| By: | /s/ THOMAS J. HIGGINS* |
| | THOMAS J. HIGGINS |
| | CHIEF FINANCIAL OFFICER |
| |
| Date: November 21, 2017 |
* By: /s/ Anne E. Robinson
Anne E. Robinson, pursuant to a Power of Attorney filed on October 4, 2016 see file Number 33-32548,
Incorporated by Reference.