UNITED STATES
SECURITIES AND EXCHANGE COMMISSION
Washington, D.C. 20549
FORM N-CSR
CERTIFIED SHAREHOLDER REPORT
OF
REGISTERED MANAGEMENT INVESTMENT COMPANIES
Investment Company Act file number: 811-04098
Name of Registrant: | | Vanguard Chester Funds |
Address of Registrant: | | P.O. Box 2600 |
| | Valley Forge, PA 19482 |
| | |
Name and address of agent for service: | | Anne E. Robinson, Esquire |
| | P.O. Box 876 |
| | Valley Forge, PA 19482 |
Registrant’s telephone number, including area code: (610) 669-1000
Date of fiscal year end: September 30
Date of reporting period: October 1, 2018—September 30, 2019
Item 1: Reports to Shareholders

Annual Report | September 30, 2019 Vanguard PRIMECAP Fund |
See the inside front cover for important information about access to your fund’s annual and semiannual shareholder reports. |
Important information about access to shareholder reports
Beginning on January 1, 2021, as permitted by regulations adopted by the Securities and Exchange Commission, paper copies of your fund’s annual and semiannual shareholder reports will no longer be sent to you by mail, unless you specifically request them. Instead, you will be notified by mail each time a report is posted on the website and will be provided with a link to access the report.
If you have already elected to receive shareholder reports electronically, you will not be affected by this change and do not need to take any action. You may elect to receive shareholder reports and other communications from the fund electronically by contacting your financial intermediary (such as a broker-dealer or bank) or, if you invest directly with the fund, by calling Vanguard at one of the phone numbers on the back cover of this report or by logging on to vanguard.com.
You may elect to receive paper copies of all future shareholder reports free of charge. If you invest through a financial intermediary, you can contact the intermediary to request that you continue to receive paper copies. If you invest directly with the fund, you can call Vanguard at one of the phone numbers on the back cover of this report or log on to vanguard.com. Your election to receive paper copies will apply to all the funds you hold through an intermediary or directly with Vanguard.
Contents | |
| |
A Note From Our Chairman | 1 |
Your Fund’s Performance at a Glance | 2 |
Advisor’s Report | 3 |
About Your Fund’s Expenses | 7 |
Performance Summary | 9 |
Financial Statements | 11 |
Trustees Approve Advisory Arrangement | 25 |
Please note: The opinions expressed in this report are just that—informed opinions. They should not be considered promises or advice. Also, please keep in mind that the information and opinions cover the period through the date on the front of this report. Of course, the risks of investing in your fund are spelled out in the prospectus.
A Note From Our Chairman

Tim Buckley
Chairman and Chief Executive Officer
Dear Shareholder,
Recent volatility in financial markets—affecting stocks, bonds, and commodities—has been a good reminder of the wise old adage, “Never keep all your eggs in one basket.” Maintaining balance and diversification in your investment portfolio can help to both limit risk and set you up for long-term success.
It’s understandable why some investors might become complacent after a long market run-up like the one that lifted stock prices, especially U.S. stock prices, in the years following the global financial crisis. But failing to rebalance regularly can leave a portfolio with a much different mix of assets than intended and, often, more risk than intended.
Balance across and diversification within asset classes are powerful tools for managing risk and achieving your investment goals. A portfolio’s allocation will determine a large portion of its long-term return and also the majority of its volatility risk. A well-diversified portfolio is less vulnerable to significant swings in the performance of any one segment of the asset classes in which it invests.
Balance and diversification will never eliminate the risk of loss, nor will they guarantee positive returns in a declining market. But they should reduce the chance that you’ll suffer disproportionate losses in one particular high-flying asset class or sector when it comes back to earth. And exposure to all key market components should give you at least some participation in the sectors that are performing best at any given time.
Vanguard is committed to helping you achieve balance and diversification in your portfolios to help meet your investment goals. We thank you for your continued loyalty.
Sincerely,

Mortimer J. Buckley
Chairman and Chief Executive Officer
October 14, 2019
1
Your Fund’s Performance at a Glance
· Vanguard PRIMECAP Fund returned less than –2% for the 12 months ended September 30, 2019, lagging its benchmark, the Standard & Poor’s 500 Index.
· The broad U.S. stock market advanced nearly 3% for the year, which was marked by sharp intervals of volatility and uncertainty. Investors fretted over U.S.-China trade, heightened tensions with Iran, the imbroglio over Britain’s exit from the European Union, and whether an inverted yield curve signaled a recession ahead. With an eye toward the deteriorating global economic outlook, the Federal Reserve lowered short-term interest rates twice to sustain the U.S. economic recovery.
· Large- and mid-capitalization stocks generally outdistanced their small-cap counterparts.
· The fund’s industrial and information technology holdings detracted most from relative performance. In health care, the advisor’s selections performed better than the benchmark’s but still proved a drag on returns. Energy stocks were a net positive for the fund, based on their underweighting relative to the benchmark in a sagging sector.
Market Barometer
| | Average Annual Total Returns | |
| | Periods Ended September 30, 2019 | |
| | One Year | | Three Years | | Five Years | |
Stocks | | | | | | | |
Russell 1000 Index (Large-caps) | | 3.87% | | 13.19% | | 10.62% | |
Russell 2000 Index (Small-caps) | | -8.89 | | 8.23 | | 8.19 | |
Russell 3000 Index (Broad U.S. market) | | 2.92 | | 12.83 | | 10.44 | |
FTSE All-World ex US Index (International) | | -1.12 | | 6.46 | | 3.24 | |
| | | | | | | |
Bonds | | | | | | | |
Bloomberg Barclays U.S. Aggregate Bond Index (Broad taxable market) | | 10.30% | | 2.92% | | 3.38% | |
Bloomberg Barclays Municipal Bond Index (Broad tax-exempt market) | | 8.55 | | 3.19 | | 3.66 | |
FTSE Three-Month U.S. Treasury Bill Index | | 2.36 | | 1.52 | | 0.95 | |
| | | | | | | |
CPI | | | | | | | |
Consumer Price Index | | 1.71% | | 2.07% | | 1.53% | |
2
Advisor’s Report
For the 12 months ended September 30, 2019, Vanguard PRIMECAP Fund returned –2.41% for Investor Shares and –2.34% for Admiral Shares, trailing the 4.25% return of the fund’s benchmark, the Standard & Poor’s 500 Index. Relative to the S&P 500 Index, sector allocation and stock selection both detracted from the fund’s results.
The investment environment
The fiscal year featured a moderating U.S. economy and choppy performance in the U.S. equity market. The decade-long American expansion continued but showed signs of late-cycle fatigue amid a broader global slowdown. Consumer spending remained healthy, bolstered by labor market strength, even as consumer confidence waned in the summer months. Business investment weakened late in the fiscal year, a notable reversal from a year ago, and trade-driven uncertainty hindered business confidence.
Other major economies slowed, particularly in Europe and China. Geopolitical tension intensified, including an apparent Iranian attack on Saudi Arabia’s oil infrastructure and a further deterioration in U.S.-China relations. The Federal Reserve responded to the unease with interest rate cuts that took effect in August and September, an about-face from last year’s tightening campaign.
The equity market proved resilient in the face of this widespread uncertainty, with the S&P 500 Index finishing the fiscal year up more than 4% even as corporate earnings sharply decelerated. Analysts now project just 2% earnings growth for the index in 2019, well below the original expectations for double-digit growth. Market sentiment hinged chiefly on U.S.-China trade progress and Fed policy.
In late 2018, the stock market fell precipitously as rising interest rates and trade negativity spawned fears of imminent recession. This decline proved short-lived, however, as optimism grew for a trade deal and more accommodative Fed commentary. The market bounced aggressively and ascended to record highs in April, June, and July. Defensive sectors generally outperformed, led by utilities (+27%), real estate (+25%), and consumer staples (+17%). Health care (–4%) was a notable outlier, as its political sensitivity outweighed its defensive merits. Energy (–19%) was the biggest laggard amid a steep decline in oil prices.
Outlook for U.S. equities
Our long-standing cautious optimism currently tilts slightly more toward caution, a reflection of increased concerns in both the international and domestic arenas. The S&P 500 Index is near record highs despite a moderation in economic activity. Absolute valuation (16.7 times forward price/earnings valuation) is perhaps reasonable relative to anemic bond yields (1.7% on 10-year Treasuries at the end of the fiscal year), but the divergence between equity market performance and underlying economic activity feels unsustainable.
3
Indeed, though equity market indexes have prevailed at elevated levels, the bond markets are indicating apparent distress. In August, the 10-year Treasury yield briefly dipped below that of 2-year Treasuries, a yield-curve inversion that is often seen as a harbinger of recession.
Meanwhile, confidence persists that a U.S.-China trade deal will be achieved, even as relations steadily worsen and political crises unfold in both countries (an impeachment inquiry in the U.S. and the Hong Kong protests for China). We have been hopeful that trade-inspired geopolitical risks would subside, but instead we observe mostly false starts and provocation. American domestic political rancor has likewise escalated, with hyperpartisanship effectively paralyzing the federal government’s legislative and executive branches.
Despite the relentless uncertainty, we believe in America’s economic engine, the free enterprise system. This fundamental faith undergirds and informs our desire to own U.S. equities over the long term, and we remain cognizant of how quickly conditions can improve. Our largest sector positions continue to be in information technology and health care, where the development of innovative technologies and therapies is not tied to near-term economic prospects. However, we also invest in companies and industries with more cyclical orientations, such as semiconductors and airlines. These companies rely heavily on global growth and, in some cases, a constructive China relationship.
Portfolio update
The portfolio maintained large overweight positions in information technology, health care, and industrial stocks. These sectors made up 72% of average assets, compared with their 45% combined weighting in the S&P 500 Index. The portfolio and index were equally weighted in consumer discretionary, at 10% of average assets, and the portfolio was modestly under-weighted in financials (8% of average assets, compared with 13% for the index) and communication services (6%, compared with 10%). The fund maintained an underweight position in all other sectors: consumer staples, energy, materials, real estate, and utilities.
Unfavorable stock selection primarily drove fund underperformance, with particular weakness in industrials and information technology. Within industrials, key detractors included FedEx (–39%), whose operational miscues have exacerbated trade war concerns, and several airlines, including American (–34%) and Southwest (–12%). Within information technology, laggards NVIDIA (–38%) and NetApp (–37%) more than offset strong performances by KLA (+61%) and Texas Instruments (+24%).
Sector allocation also detracted from relative performance, driven primarily by the fund’s varied positioning within the four defensive-oriented sectors. The portfolio had negligible exposure to the three outperforming defensive sectors (consumer staples, utilities, and real estate) and a significant overweight position in the single underperforming defensive sector (health care). This
4
collective headwind proved significant, more than offsetting the benefit from the portfolio’s energy underweight.
The fund’s substantial health care portfolio (–2%) fared somewhat better than the health care sector generally (–4%) because of favorable stock selection, but it was not enough to offset our overweight to the second-poorest-performing sector in the index. Key contributors included pharmaceutical companies Roche (+24%), Novartis (+17%), AstraZeneca (+16%), and Eli Lilly (+7%). These stocks more than offset the decline in Biogen (–34%).
As of September 30, 2019, the fund’s top ten holdings made up 36% of assets.
Advisor perspectives
We routinely discuss portfolio positioning within the framework of the S&P 500 Index sectors. For instance, our over-weight sector allocations for some time have included information technology, health care, and industrials. We also occasionally discuss portfolio structure more thematically; for example, we highlight our preference for “mind”—technology, innovation, and the like—over “matter”—commodities and other real assets.
Another way to frame our exposures is via high-level categories such as defensive, growth/cyclical, and commodity-linked stocks. For instance, our aggregate portfolio weighting in the defensive bucket is comparable to that of the S&P 500 Index, but as previously noted, our actual underlying ownership is heavily skewed toward health care.
We believe our portfolio has credible defensive qualities even if achieved in unorthodox fashion, and we prefer pharmaceutical and biotech companies—and, in particular, the unsung potential of novel drugs—to businesses tied to food and other staples. Following its under-performance, the health care sector traded at a far more attractive absolute and relative valuation at the end of the 12 months (14.4 times forward P/E, compared with its 16.2 times 20-year average) than its defensive sector peers, including consumer staples (19.9 times, compared with 16.8 times) and utilities (20.1 times, compared with 14.4 times).
In the growth/cyclical and commodity-linked buckets, the story is similar: comparable exposure at the aggregate level, but significant differentiation beneath the surface. Within growth/cyclical, which houses our information technology over-weight position, our ownership of FAANG (Facebook, Apple, Amazon, Netflix, and Google/Alphabet) stocks, the market’s putative technology leaders, has materially lagged their market weighting. We instead own semiconductor and other technology hardware and software companies with secular (and cyclical) growth trajectories at a valuation discount to the typical FAANG premium.
And in the commodity-linked sectors (energy, materials, and industrials), our slight overweight posture is especially superficial, as our ownership—principally, commodity-consuming companies—stands in direct contrast to the bucket’s pro-commodity bias. Avoiding the commodity
5
producers has generally served us well in recent years. That said, the fund has derived no obvious benefit from its substantial exposure to cheaper commodities on the cost side of the ledger. Within industrials, for instance, our airlines ownership underperformed the market despite solid fundamentals amid a decline in crude oil prices; we continue to see exceptional value in this industry.
Conclusion
Regardless of the framing, a differentiated portfolio guarantees only divergence, not outperformance. The fund’s disappointing year reaffirms this basic truth, with weak stock selection serving as the primary culprit for our underperformance. Many of the fund’s idiosyncratic bottom-up features directly contributed to these poor relative results. A confluence of nonmarket considerations has recently plagued our drug-centric defensives (health care reform rhetoric) and our growth-oriented cyclicals (the U.S.-China imbroglio). We are optimistic that our portfolio—and the company-specific trajectories therein—features an attractive combination of secular growth and reasonable valuations, and we are hopeful it will outperform in the years ahead.
PRIMECAP Management Company
October 15, 2019
6
About Your Fund’s Expenses
As a shareholder of the fund, you incur ongoing costs, which include costs for portfolio management, administrative services, and shareholder reports (like this one), among others. Operating expenses, which are deducted from a fund’s gross income, directly reduce the investment return of the fund.
A fund’s expenses are expressed as a percentage of its average net assets. This figure is known as the expense ratio. The following examples are intended to help you understand the ongoing costs (in dollars) of investing in your fund and to compare these costs with those of other mutual funds. The examples are based on an investment of $1,000 made at the beginning of the period shown and held for the entire period.
The accompanying table illustrates your fund’s costs in two ways:
· Based on actual fund return. This section helps you to estimate the actual expenses that you paid over the period. The “Ending Account Value” shown is derived from the fund’s actual return, and the third column shows the dollar amount that would have been paid by an investor who started with $1,000 in the fund. You may use the information here, together with the amount you invested, to estimate the expenses that you paid over the period.
To do so, simply divide your account value by $1,000 (for example, an $8,600 account value divided by $1,000 = 8.6), then multiply the result by the number given for your fund under the heading “Expenses Paid During Period.”
· Based on hypothetical 5% yearly return. This section is intended to help you compare your fund’s costs with those of other mutual funds. It assumes that the fund had a yearly return of 5% before expenses, but that the expense ratio is unchanged. In this case—because the return used is not the fund’s actual return—the results do not apply to your investment. The example is useful in making comparisons because the Securities and Exchange Commission requires all mutual funds to calculate expenses based on a 5% return. You can assess your fund’s costs by comparing this hypothetical example with the hypothetical examples that appear in shareholder reports of other funds.
Note that the expenses shown in the table are meant to highlight and help you compare ongoing costs only and do not reflect transaction costs incurred by the fund for buying and selling securities. Further, the expenses do not include any purchase, redemption, or account service fees described in the fund prospectus. If such fees were applied to your account, your costs would be higher. Your fund does not carry a “sales load.”
The calculations assume no shares were bought or sold during the period. Your actual costs may have been higher or lower, depending on the amount of your investment and the timing of any purchases or redemptions.
You can find more information about the fund’s expenses, including annual expense ratios, in the Financial Statements section of this report. For additional information on operating expenses and other shareholder costs, please refer to your fund’s current prospectus.
7
Six Months Ended September 30, 2019
| | Beginning | | Ending | | Expenses |
| | Account Value | | Account Value | | Paid During |
PRIMECAP Fund | | 3/31/2019 | | 9/30/2019 | | Period |
Based on Actual Fund Return | | | | | | |
Investor Shares | | $1,000.00 | | $1,029.70 | | $1.93 |
Admiral™ Shares | | 1,000.00 | | 1,030.08 | | 1.58 |
Based on Hypothetical 5% Yearly Return | | | | | | |
Investor Shares | | $1,000.00 | | $1,023.16 | | $1.93 |
Admiral Shares | | 1,000.00 | | 1,023.51 | | 1.57 |
The calculations are based on expenses incurred in the most recent six-month period. The fund’s annualized six-month expense ratios for that period are 0.38% for Investor Shares and 0.31% for Admiral Shares. The dollar amounts shown as “Expenses Paid” are equal to the annualized expense ratio multiplied by the average account value over the period, multiplied by the number of days in the most recent six-month period, then divided by the number of days in the most recent 12-month period (183/365).
8
PRIMECAP Fund
Performance Summary
All of the returns in this report represent past performance, which is not a guarantee of future results that may be achieved by the fund. (Current performance may be lower or higher than the performance data cited. For performance data current to the most recent month-end, visit our website at vanguard.com/performance.) Note, too, that both investment returns and principal value can fluctuate widely, so an investor’s shares, when sold, could be worth more or less than their original cost. The returns shown do not reflect taxes that a shareholder would pay on fund distributions or on the sale of fund shares.
Cumulative Performance: September 30, 2009, Through September 30, 2019
Initial Investment of $10,000

| | Average Annual Total Returns | |
| | Periods Ended September 30, 2019 | |
| | | | | Final Value |
| | One | Five | Ten | of a $10,000 |
| | Year | Years | Years | Investment |

| PRIMECAP Fund Investor Shares | -2.41% | 11.57% | 14.23% | $37,829 |

| S&P 500 Index | 4.25 | 10.84 | 13.24 | 34,674 |

| Dow Jones U.S. Total Stock Market Float Adjusted Index | 2.81 | 10.40 | 13.09 | 34,207 |
| | | | | |
| | | | | Final Value |
| | One | Five | Ten | of a $50,000 |
| | Year | Years | Years | Investment |
PRIMECAP Fund Admiral Shares | -2.34% | 11.65% | 14.32% | $190,658 |
S&P 500 Index | 4.25 | 10.84 | 13.24 | 173,372 |
Dow Jones U.S. Total Stock Market Float Adjusted Index | 2.81 | 10.40 | 13.09 | 171,034 |
See Financial Highlights for dividend and capital gains information.
9
PRIMECAP Fund
Sector Diversification
As of September 30, 2019
Communication Services | 6.0% |
Consumer Discretionary | 10.3 |
Consumer Staples | 0.0 |
Energy | 1.4 |
Financials | 9.2 |
Health Care | 24.4 |
Industrials | 18.8 |
Information Technology | 29.0 |
Materials | 0.9 |
The table reflects the fund’s equity exposure, based on its investments in stocks. Any holdings in short-term reserves are excluded. Sector categories are based on the Global Industry Classification Standard (“GICS”), except for the “Other” category (if applicable), which includes securities that have not been provided a GICS classification as of the effective reporting period.
The Global Industry Classification Standard (“GICS”) was developed by and is the exclusive property and a service mark of MSCI Inc. (“MSCI”) and Standard and Poor’s, a division of McGraw-Hill Companies, Inc. (“S&P”), and is licensed for use by Vanguard. Neither MSCI, S&P nor any third party involved in making or compiling the GICS or any GICS classification makes any express or implied warranties or representations with respect to such standard or classification (or the results to be obtained by the use thereof), and all such parties hereby expressly disclaim all warranties of originality, accuracy, completeness, merchantability or fitness for a particular purpose with respect to any such standard or classification. Without limiting any of the foregoing, in no event shall MSCI, S&P, any of its affiliates or any third party involved in making or compiling the GICS or any GICS classification have any liability for any direct, indirect, special, punitive, consequential or any other damages (including lost profits) even if notified of the possibility of such damages.
10
PRIMECAP Fund
Financial Statements
Statement of Net Assets
As of September 30, 2019
The fund files its complete schedule of portfolio holdings with the Securities and Exchange Commission (SEC) for the first and third quarters of each fiscal year as an exhibit to its reports on Form N-PORT. The fund’s Form N-PORT reports are available on the SEC’s website at www.sec.gov.
| | | | | Market | |
| | | | | Value· | |
| | | Shares | | ($000 | ) |
Common Stocks (97.5%) | | | | | |
Communication Services (5.8%) | | | | | |
* | Alphabet Inc. Class C | | 1,188,403 | | 1,448,663 | |
* | Alphabet Inc. Class A | | 1,183,255 | | 1,444,920 | |
| Walt Disney Co. | | 2,720,700 | | 354,562 | |
| Activision Blizzard Inc. | | 5,600,000 | | 296,352 | |
* | Charter Communications Inc. Class A | | 134,800 | | 55,554 | |
| Comcast Corp. Class A | | 1,100,000 | | 49,588 | |
* | T-Mobile US Inc. | | 365,700 | | 28,806 | |
| | | | | 3,678,445 | |
Consumer Discretionary (10.0%) | | | | | |
* | Alibaba Group Holding Ltd. ADR | | 8,330,655 | | 1,393,135 | |
^ | Sony Corp. ADR | | 17,275,106 | | 1,021,477 | |
| Ross Stores Inc. | | 7,598,000 | | 834,640 | |
1 | Whirlpool Corp. | | 4,209,572 | | 666,628 | |
| TJX Cos. Inc. | | 8,935,000 | | 498,037 | |
* | Amazon.com Inc. | | 194,765 | | 338,094 | |
| Carnival Corp. | | 7,721,565 | | 337,510 | |
| Royal Caribbean Cruises Ltd. | | 2,875,433 | | 311,496 | |
*,^,1 | Mattel Inc. | | 26,546,638 | | 302,366 | |
| L Brands Inc. | | 10,640,571 | | 208,449 | |
*,^ | Tesla Inc. | | 511,000 | | 123,085 | |
| Marriott International Inc. Class A | | 490,300 | | 60,979 | |
| eBay Inc. | | 1,447,800 | | 56,435 | |
| MGM Resorts International | | 1,961,000 | | 54,359 | |
| Restaurant Brands International Inc. | | 522,900 | | 37,199 | |
| Hilton Worldwide Holdings Inc. | | 295,366 | | 27,502 | |
* | Ulta Beauty Inc. | | 105,500 | | 26,444 | |
| Las Vegas Sands Corp. | | 390,000 | | 22,526 | |
| McDonald’s Corp. | | 101,800 | | 21,857 | |
| Newell Brands Inc. | | 555,000 | | 10,390 | |
* | AutoZone Inc. | | 2,950 | | 3,200 | |
* | Burlington Stores Inc. | | 15,300 | | 3,057 | |
| Adient plc | | 69,700 | | 1,600 | |
| | | | | 6,360,465 | |
Consumer Staples (0.0%) | | | | | |
| Constellation Brands Inc. Class A | | 45,600 | | 9,452 | |
| Kroger Co. | | 316,000 | | 8,146 | |
| Philip Morris International Inc. | | 58,000 | | 4,404 | |
| Altria Group Inc. | | 78,500 | | 3,211 | |
| | | | | 25,213 | |
Energy (1.3%) | | | | | |
| Pioneer Natural Resources Co. | | 2,271,100 | | 285,636 | |
| Hess Corp. | | 4,715,000 | | 285,163 | |
| EOG Resources Inc. | | 1,918,034 | | 142,356 | |
* | Transocean Ltd. | | 12,148,573 | | 54,304 | |
| Noble Energy Inc. | | 2,160,000 | | 48,514 | |
| Schlumberger Ltd. | | 1,039,056 | | 35,505 | |
| | | | | 851,478 | |
Financials (9.0%) | | | | | |
| Wells Fargo & Co. | | 29,628,647 | | 1,494,469 | |
| JPMorgan Chase & Co. | | 11,300,275 | | 1,329,929 | |
| Charles Schwab Corp. | | 17,005,616 | | 711,345 | |
| Bank of America Corp. | | 20,875,532 | | 608,939 | |
| Marsh & McLennan Cos. Inc. | | 6,082,815 | | 608,586 | |
| Discover Financial Services | | 3,040,825 | | 246,580 | |
| US Bancorp | | 3,917,300 | | 216,783 | |
| CME Group Inc. | | 896,318 | | 189,428 | |
| Citigroup Inc. | | 2,100,000 | | 145,068 | |
| Progressive Corp. | | 1,575,000 | | 121,669 | |
| American Express Co. | | 118,300 | | 13,993 | |
| | | | | 5,686,789 | |
Health Care (23.8%) | | | | | |
| Eli Lilly & Co. | | 22,720,608 | | 2,540,846 | |
* | Biogen Inc. | | 9,216,356 | | 2,145,752 | |
| Amgen Inc. | | 10,368,044 | | 2,006,320 | |
| AstraZeneca plc ADR | | 28,851,088 | | 1,285,893 | |
| Novartis AG ADR | | 14,327,125 | | 1,245,027 | |
* | Boston Scientific Corp. | | 29,991,344 | | 1,220,348 | |
| Roche Holding AG | | 3,243,662 | | 944,440 | |
| Thermo Fisher Scientific Inc. | | 2,538,202 | | 739,302 | |
11
PRIMECAP Fund
| | | | | Market | |
| | | | | Value· | |
| | | Shares | | ($000 | ) |
| Bristol-Myers Squibb Co. | | 9,013,113 | | 457,055 | |
| Medtronic plc | | 3,840,000 | | 417,101 | |
| Abbott Laboratories | | 4,598,595 | | 384,764 | |
* | Elanco Animal Health Inc. | | 13,939,314 | | 370,646 | |
* | BioMarin Pharmaceutical Inc. | | 4,701,774 | | 316,900 | |
| CVS Health Corp. | | 2,919,065 | | 184,105 | |
* | Alcon Inc. | | 2,780,412 | | 162,070 | |
2 | Siemens Healthineers AG | | 3,991,700 | | 156,963 | |
| Zimmer Biomet Holdings Inc. | | 1,059,800 | | 145,479 | |
| Merck & Co. Inc. | | 1,500,000 | | 126,270 | |
| Agilent Technologies Inc. | | 1,128,216 | | 86,455 | |
| Sanofi ADR | | 969,000 | | 44,894 | |
| Stryker Corp. | | 180,000 | | 38,934 | |
| GlaxoSmithKline plc ADR | | 548,000 | | 23,389 | |
| | | | | 15,042,953 | |
Industrials (18.4%) | | | | | |
1 | Southwest Airlines Co. | | 34,982,556 | | 1,889,408 | |
*,1 | United Airlines Holdings Inc. | | 15,925,403 | | 1,407,965 | |
| FedEx Corp. | | 9,566,406 | | 1,392,582 | |
| Airbus SE | | 10,056,514 | | 1,305,627 | |
| Siemens AG | | 10,572,604 | | 1,131,750 | |
1 | American Airlines Group Inc. | | 30,326,913 | | 817,917 | |
| Caterpillar Inc. | | 5,590,989 | | 706,198 | |
| Delta Air Lines Inc. | | 11,818,000 | | 680,717 | |
| Union Pacific Corp. | | 2,340,800 | | 379,163 | |
| Boeing Co. | | 918,500 | | 349,461 | |
| Alaska Air Group Inc. | | 4,996,700 | | 324,336 | |
| Honeywell International Inc. | | 1,584,000 | | 268,013 | |
| United Parcel Service Inc. Class B | | 2,125,170 | | 254,638 | |
| Textron Inc. | | 3,615,000 | | 176,990 | |
| United Technologies Corp. | | 1,095,000 | | 149,489 | |
| TransDigm Group Inc. | | 180,016 | | 93,729 | |
| Deere & Co. | | 430,000 | | 72,532 | |
| General Dynamics Corp. | | 308,900 | | 56,445 | |
| CSX Corp. | | 700,000 | | 48,489 | |
| Pentair plc | | 956,000 | | 36,137 | |
| Rockwell Automation Inc. | | 180,680 | | 29,776 | |
| nVent Electric plc | | 900,000 | | 19,836 | |
* | Ryanair Holdings plc ADR | | 250,000 | | 16,595 | |
* | Lyft Inc. Class A | | 225,200 | | 9,197 | |
| | | | | 11,616,990 | |
Information Technology (28.3%) | | | | | |
* | Adobe Inc. | | 10,901,557 | | 3,011,555 | |
| Microsoft Corp. | | 21,365,567 | | 2,970,455 | |
| Texas Instruments Inc. | | 19,661,572 | | 2,541,061 | |
* | Micron Technology Inc. | | 30,939,574 | | 1,325,761 | |
| QUALCOMM Inc. | | 11,744,337 | | 895,858 | |
| KLA Corp. | | 5,045,775 | | 804,549 | |
| Intel Corp. | | 14,277,292 | | 735,709 | |
1 | NetApp Inc. | | 12,931,241 | | 679,019 | |
| Hewlett Packard Enterprise Co. | | 41,254,566 | | 625,832 | |
| Telefonaktiebolaget LM Ericsson ADR | | 72,832,026 | | 581,199 | |
| Cisco Systems Inc. | | 10,627,550 | | 525,107 | |
| HP Inc. | | 26,058,716 | | 493,031 | |
| Intuit Inc. | | 1,720,000 | | 457,417 | |
| NVIDIA Corp. | | 2,053,000 | | 357,366 | |
| Oracle Corp. | | 6,300,429 | | 346,713 | |
| Analog Devices Inc. | | 2,640,000 | | 294,967 | |
| Visa Inc. Class A | | 1,277,000 | | 219,657 | |
| Corning Inc. | | 5,712,100 | | 162,909 | |
1 | Plantronics Inc. | | 3,672,300 | | 137,050 | |
| Entegris Inc. | | 2,650,322 | | 124,724 | |
| Apple Inc. | | 547,500 | | 122,624 | |
* | PayPal Holdings Inc. | | 1,045,000 | | 108,251 | |
* | salesforce.com Inc. | | 602,700 | | 89,465 | |
* | BlackBerry Ltd. | | 10,854,800 | | 56,988 | |
| DXC Technology Co. | | 1,444,045 | | 42,599 | |
| Micro Focus International plc ADR | | 2,432,245 | | 34,416 | |
* | Keysight Technologies Inc. | | 287,000 | | 27,911 | |
| Applied Materials Inc. | | 526,300 | | 26,262 | |
* | Palo Alto Networks Inc. | | 99,940 | | 20,371 | |
| Mastercard Inc. Class A | | 54,000 | | 14,665 | |
* | Dell Technologies Inc. | | 279,800 | | 14,510 | |
| Perspecta Inc. | | 470,023 | | 12,277 | |
| Western Digital Corp. | | 200,000 | | 11,928 | |
| Nokia Oyj ADR | | 1,750,000 | | 8,855 | |
* | Rambus Inc. | | 554,197 | | 7,274 | |
* | Arista Networks Inc. | | 6,700 | | 1,601 | |
| | | | | 17,889,936 | |
Materials (0.9%) | | | | | |
| Albemarle Corp. | | 2,777,535 | | 193,094 | |
| Linde plc | | 775,000 | | 150,133 | |
| DuPont de Nemours Inc. | | 1,314,516 | | 93,738 | |
| Dow Inc. | | 1,494,217 | | 71,199 | |
| Corteva Inc. | | 1,339,516 | | 37,507 | |
| | | | | 545,671 | |
Total Common Stocks | | | | | |
(Cost $27,968,918) | | | | 61,697,940 | |
12
PRIMECAP Fund
| | | | | Market | |
| | | | | Value· | |
| | | Shares | | ($000 | ) |
Temporary Cash Investment (2.9%) | | | | | |
Money Market Fund (2.9%) | | | | | |
| | | | | |
3,4 | Vanguard Market Liquidity Fund, 2.098%
(Cost $1,855,619) | | 18,557,348 | | 1,855,920 | |
Total Investments (100.4%) | | | | | |
(Cost $29,824,537) | | | | 63,553,860 | |
Other Assets and Liabilities (-0.4%) | | | | | |
Other Assets | | | | 83,861 | |
Liabilities3 | | | | (366,452 | ) |
Net Assets (100%) | | | | 63,271,269 | |
| | | | Amount | |
| | | | ($000 | ) |
Statement of Assets and Liabilities | | | | | |
Assets | | | | | |
Investments in Securities, at Value | | | | | |
Unaffiliated Issuers | | | | 55,797,587 | |
Affiliated Issuers | | | | 7,756,273 | |
Total Investments in Securities | | | | 63,553,860 | |
Investment in Vanguard | | | | 2,994 | |
Receivables for Investment Securities Sold | | | | 55 | |
Receivables for Accrued Income | | | | 65,201 | |
Receivables for Capital Shares Issued | | | | 11,118 | |
Other Assets | | | | 4,493 | |
Total Assets | | | | 63,637,721 | |
Liabilities | | | | | |
Payables for Investment Securities Purchased | | | | 9,700 | |
Collateral for Securities on Loan | | | | 261,181 | |
Payables to Investment Advisor | | | | 29,190 | |
Payables for Capital Shares Redeemed | | | | 30,237 | |
Payables to Vanguard | | | | 34,064 | |
Other Liabilities | | | | 2,080 | |
Total Liabilities | | | | 366,452 | |
Net Assets | | | | 63,271,269 | |
At September 30, 2019, net assets consisted of:
| | Amount | |
| | ($000 | ) |
Paid-in Capital | | 25,149,237 | |
Total Distributable Earnings (Loss) | | 38,122,032 | |
Net Assets | | 63,271,269 | |
| | | |
Investor Shares—Net Assets | | | |
Applicable to 45,782,718 outstanding $.001 par value shares of beneficial interest (unlimited authorization) | | 6,094,636 | |
Net Asset Value Per Share—Investor Shares | | $133.12 | |
| | | |
Admiral Shares—Net Assets | | | |
Applicable to 414,263,954 outstanding $.001 par value shares of beneficial interest (unlimited authorization) | | 57,176,633 | |
Net Asset Value Per Share—Admiral Shares | | $138.02 | |
· | See Note A in Notes to Financial Statements. |
| |
* | Non-income-producing security. |
| |
^ | Includes partial security positions on loan to broker-dealers. The total value of securities on loan is $253,590,000. |
| |
1 | Considered an affiliated company of the fund as the fund owns more than 5% of the outstanding voting securities of such company. |
| |
2 | Security exempt from registration under Rule 144A of the Securities Act of 1933. Such securities may be sold in transactions exempt from registration, normally to qualified institutional buyers. At September 30, 2019, the value of this security represented 0.2% of net assets. |
| |
3 | Collateral of $261,181,000 was received for securities on loan. |
| |
4 | Affiliated money market fund available only to Vanguard funds and certain trusts and accounts managed by Vanguard. Rate shown is the 7-day yield. |
| |
| ADR—American Depositary Receipt. |
See accompanying Notes, which are an integral part of the Financial Statements.
13
PRIMECAP Fund
Statement of Operations
| | Year Ended | |
| | September 30, 2019 | |
| | ($000 | ) |
Investment Income | | | |
Income | | | |
Dividends—Unaffiliated Issuers1 | | 955,213 | |
Dividends—Affiliated Issuers | | 80,403 | |
Interest—Affiliated Issuers | | 41,427 | |
Securities Lending—Net | | 4,064 | |
Total Income | | 1,081,107 | |
Expenses | | | |
Investment Advisory Fees—Note B | | 116,302 | |
The Vanguard Group—Note C | | | |
Management and Administrative—Investor Shares | | 11,628 | |
Management and Administrative—Admiral Shares | | 70,593 | |
Marketing and Distribution—Investor Shares | | 608 | |
Marketing and Distribution—Admiral Shares | | 2,015 | |
Custodian Fees | | 2,000 | |
Auditing Fees | | 31 | |
Shareholders’ Reports—Investor Shares | | 46 | |
Shareholders’ Reports—Admiral Shares | | 147 | |
Trustees’ Fees and Expenses | | 65 | |
Total Expenses | | 203,435 | |
Net Investment Income | | 877,672 | |
Realized Net Gain (Loss) | | | |
Investment Securities Sold – Unaffiliated Issuers | | 4,046,698 | |
Investment Securities Sold – Affiliated Issuers | | 54,082 | |
Foreign Currencies | | (420 | ) |
Realized Net Gain (Loss) | | 4,100,360 | |
Change in Unrealized Appreciation (Depreciation) | | | |
Investment Securities – Unaffiliated Issuers | | (5,483,811 | ) |
Investment Securities – Affiliated Issuers | | (1,270,884 | ) |
Foreign Currencies | | 81 | |
Change in Unrealized Appreciation (Depreciation) | | (6,754,614 | ) |
Net Increase (Decrease) in Net Assets Resulting from Operations | | (1,776,582 | ) |
1 Dividends are net of foreign withholding taxes of $22,352,000.
See accompanying Notes, which are an integral part of the Financial Statements.
14
PRIMECAP Fund
Statement of Changes in Net Assets
| Year Ended September 30, |
| 2019 | 2018 |
| ($000) | ($000) |
Increase (Decrease) in Net Assets | | |
Operations | | |
Net Investment Income | 877,672 | 736,330 |
Realized Net Gain (Loss) | 4,100,360 | 3,916,635 |
Change in Unrealized Appreciation (Depreciation) | (6,754,614) | 8,541,839 |
Net Increase (Decrease) in Net Assets Resulting from Operations | (1,776,582) | 13,194,804 |
Distributions | | |
Net Investment Income | | |
Investor Shares | (69,715) | (78,554) |
Admiral Shares | (666,757) | (559,059) |
Realized Capital Gain1 | | |
Investor Shares | (390,890) | (327,320) |
Admiral Shares | (3,460,942) | (2,340,855) |
Total Distributions | (4,588,304) | (3,305,788) |
Capital Share Transactions | | |
Investor Shares | (352,243) | (1,710,759) |
Admiral Shares | 501,276 | 2,994,615 |
Net Increase (Decrease) from Capital Share Transactions | 149,033 | 1,283,856 |
Total Increase (Decrease) | (6,215,853) | 11,172,872 |
Net Assets | | |
Beginning of Period | 69,487,122 | 58,314,250 |
End of Period | 63,271,269 | 69,487,122 |
1 Includes fiscal 2019 and 2018 short-term gain distributions totaling $38,624,000 and $104,276,000, respectively. Short-term gain distributions are treated as ordinary income dividends for tax purposes.
See accompanying Notes, which are an integral part of the Financial Statements.
15
PRIMECAP Fund
Financial Highlights
Investor Shares
For a Share Outstanding | | | Year Ended September 30, | |
Throughout Each Period | 2019 | 2018 | 2017 | 2016 | 2015 | |
Net Asset Value, Beginning of Period | $147.61 | $126.84 | $107.60 | $96.99 | $104.16 | |
Investment Operations | | | | | | |
Net Investment Income | 1.7151 | 1.4741 | 1.3981 | 1.401 | 1.329 | |
Net Realized and Unrealized Gain (Loss) on Investments | (6.495) | 26.529 | 23.145 | 15.103 | (1.631) | |
Total from Investment Operations | (4.780) | 28.003 | 24.543 | 16.504 | (.302) | |
Distributions | | | | | | |
Dividends from Net Investment Income | (1.470) | (1.400) | (1.356) | (1.114) | (1.160) | |
Distributions from Realized Capital Gains | (8.240) | (5.833) | (3.947) | (4.780) | (5.708) | |
Total Distributions | (9.710) | (7.233) | (5.303) | (5.894) | (6.868) | |
Net Asset Value, End of Period | $133.12 | $147.61 | $126.84 | $107.60 | $96.99 | |
| | | | | | |
Total Return2 | -2.41% | 22.86% | 23.75% | 17.40% | -0.76% | |
| | | | | | |
Ratios/Supplemental Data | | | | | | |
Net Assets, End of Period (Millions) | $6,095 | $7,126 | $7,699 | $7,588 | $7,741 | |
Ratio of Total Expenses to Average Net Assets | 0.38% | 0.38% | 0.39% | 0.39% | 0.40% | |
Ratio of Net Investment Income to Average Net Assets | 1.32% | 1.08% | 1.22% | 1.37% | 1.33% | |
Portfolio Turnover Rate | 5% | 8% | 8% | 6% | 9% | |
1 Calculated based on average shares outstanding.
2 Total returns do not include account service fees that may have applied in the periods shown. Fund prospectuses provide information about any applicable account service fees.
See accompanying Notes, which are an integral part of the Financial Statements.
16
PRIMECAP Fund
Financial Highlights
Admiral Shares
For a Share Outstanding | | | Year Ended September 30, | |
Throughout Each Period | 2019 | 2018 | 2017 | 2016 | 2015 | |
Net Asset Value, Beginning of Period | $153.09 | $131.45 | $111.52 | $100.53 | $108.08 | |
Investment Operations | | | | | | |
Net Investment Income | 1.8801 | 1.6221 | 1.5281 | 1.532 | 1.550 | |
Net Realized and Unrealized Gain (Loss) on Investments | (6.756) | 27.508 | 23.981 | 15.645 | (1.784) | |
Total from Investment Operations | (4.876) | 29.130 | 25.509 | 17.177 | (.234) | |
Distributions | | | | | | |
Dividends from Net Investment Income | (1.647) | (1.444) | (1.491) | (1.236) | (1.403) | |
Distributions from Realized Capital Gains | (8.547) | (6.046) | (4.088) | (4.951) | (5.913) | |
Total Distributions | (10.194) | (7.490) | (5.579) | (6.187) | (7.316) | |
Net Asset Value, End of Period | $138.02 | $153.09 | $131.45 | $111.52 | $100.53 | |
| | | | | | |
Total Return2 | -2.34% | 22.95% | 23.83% | 17.48% | -0.69% | |
| | | | | | |
Ratios/Supplemental Data | | | | | | |
Net Assets, End of Period (Millions) | $57,177 | $62,361 | $50,615 | $39,852 | $34,773 | |
Ratio of Total Expenses to Average Net Assets | 0.31% | 0.31% | 0.32% | 0.33% | 0.34% | |
Ratio of Net Investment Income to Average Net Assets | 1.39% | 1.15% | 1.29% | 1.43% | 1.39% | |
Portfolio Turnover Rate | 5% | 8% | 8% | 6% | 9% | |
1 Calculated based on average shares outstanding.
2 Total returns do not include account service fees that may have applied in the periods shown. Fund prospectuses provide information about any applicable account service fees.
See accompanying Notes, which are an integral part of the Financial Statements.
17
PRIMECAP Fund
Notes to Financial Statements
Vanguard PRIMECAP Fund is registered under the Investment Company Act of 1940 as an open-end investment company, or mutual fund. The fund offers two classes of shares: Investor Shares and Admiral Shares. Each of the share classes has different eligibility and minimum purchase requirements, and is designed for different types of investors.
A. The following significant accounting policies conform to generally accepted accounting principles for U.S. investment companies. The fund consistently follows such policies in preparing its financial statements.
1. Security Valuation: Securities are valued as of the close of trading on the New York Stock Exchange (generally 4 p.m., Eastern time) on the valuation date. Equity securities are valued at the latest quoted sales prices or official closing prices taken from the primary market in which each security trades; such securities not traded on the valuation date are valued at the mean of the latest quoted bid and asked prices. Securities for which market quotations are not readily available, or whose values have been affected by events occurring before the fund’s pricing time but after the close of the securities’ primary markets, are valued at their fair values calculated according to procedures adopted by the board of trustees. These procedures include obtaining quotations from an independent pricing service, monitoring news to identify significant market- or security-specific events, and evaluating changes in the values of foreign market proxies (for example, ADRs, futures contracts, or exchange-traded funds), between the time the foreign markets close and the fund’s pricing time. When fair-value pricing is employed, the prices of securities used by a fund to calculate its net asset value may differ from quoted or published prices for the same securities. Investments in Vanguard Market Liquidity Fund are valued at that fund’s net asset value.
2. Foreign Currency: Securities and other assets and liabilities denominated in foreign currencies are translated into U.S. dollars using exchange rates obtained from an independent third party as of the fund’s pricing time on the valuation date. Realized gains (losses) and unrealized appreciation (depreciation) on investment securities include the effects of changes in exchange rates since the securities were purchased, combined with the effects of changes in security prices. Fluctuations in the value of other assets and liabilities resulting from changes in exchange rates are recorded as unrealized foreign currency gains (losses) until the assets or liabilities are settled in cash, at which time they are recorded as realized foreign currency gains (losses).
3. Federal Income Taxes: The fund intends to continue to qualify as a regulated investment company and distribute all of its taxable income. Management has analyzed the fund’s tax positions taken for all open federal income tax years (September 30, 2016–2019), and has concluded that no provision for federal income tax is required in the fund’s financial statements.
4. Distributions: Distributions to shareholders are recorded on the ex-dividend date. Distributions are determined on a tax basis and may differ from net investment income and realized capital gains for financial reporting purposes.
5. Securities Lending: To earn additional income, the fund lends its securities to qualified institutional borrowers. Security loans are subject to termination by the fund at any time, and are required to be secured at all times by collateral in an amount at least equal to the market value of securities loaned. Daily market fluctuations could cause the value of loaned securities to be more or less than the value of the collateral received. When this occurs, the collateral is adjusted and settled before the opening of the market on the next business day. The fund further mitigates its counterparty risk by entering into securities lending transactions only with a diverse group of prequalified counterparties, monitoring their financial strength, and entering into master securities lending agreements with its
18
PRIMECAP Fund
counterparties. The master securities lending agreements provide that, in the event of a counterparty’s default (including bankruptcy), the fund may terminate any loans with that borrower, determine the net amount owed, and sell or retain the collateral up to the net amount owed to the fund; however, such actions may be subject to legal proceedings. While collateral mitigates counterparty risk, in the event of a default, the fund may experience delays and costs in recovering the securities loaned. The fund invests cash collateral received in Vanguard Market Liquidity Fund, and records a liability in the Statement of Assets and Liabilities for the return of the collateral, during the period the securities are on loan. Securities lending income represents fees charged to borrowers plus income earned on invested cash collateral, less expenses associated with the loan. During the term of the loan, the fund is entitled to all distributions made on or in respect of the loaned securities.
6. Credit Facility: The fund and certain other funds managed by The Vanguard Group (“Vanguard”) participate in a $4.3 billion committed credit facility provided by a syndicate of lenders pursuant to a credit agreement that may be renewed annually; each fund is individually liable for its borrowings, if any, under the credit facility. Borrowings may be utilized for temporary and emergency purposes, and are subject to the fund’s regulatory and contractual borrowing restrictions. The participating funds are charged administrative fees and an annual commitment fee of 0.10% of the undrawn amount of the facility; these fees are allocated to the funds based on a method approved by the fund’s board of trustees and included in Management and Administrative expenses on the fund’s Statement of Operations. Any borrowings under this facility bear interest at a rate based upon the higher of the one-month London Interbank Offered Rate, federal funds effective rate, or overnight bank funding rate plus an agreed-upon spread.
The fund had no borrowings outstanding at September 30, 2019, or at any time during the period then ended.
7. Other: Dividend income is recorded on the ex-dividend date. Interest income includes income distributions received from Vanguard Market Liquidity Fund and is accrued daily. Security transactions are accounted for on the date securities are bought or sold. Costs used to determine realized gains (losses) on the sale of investment securities are those of the specific securities sold.
Each class of shares has equal rights as to assets and earnings, except that each class separately bears certain class-specific expenses related to maintenance of shareholder accounts (included in Management and Administrative expenses) and shareholder reporting. Marketing and distribution expenses are allocated to each class of shares based on a method approved by the board of trustees. Income, other non-class-specific expenses, and gains and losses on investments are allocated to each class of shares based on its relative net assets.
B. PRIMECAP Management Company provides investment advisory services to the fund for a fee calculated at an annual percentage rate of average net assets. For the year ended September 30, 2019, the investment advisory fee represented an effective annual rate of 0.18% of the fund’s average net assets.
C. In accordance with the terms of a Funds’ Service Agreement (the “FSA”) between Vanguard and the fund, Vanguard furnishes to the fund corporate management, administrative, marketing, and distribution services at Vanguard’s cost of operations (as defined by the FSA). These costs of operations are allocated to the fund based on methods and guidelines approved by the board of trustees. Vanguard does not require reimbursement in the current period for certain costs of
19
PRIMECAP Fund
operations (such as deferred compensation/benefits and risk/insurance costs); the fund’s liability for these costs of operations is included in Payables to Vanguard on the Statement of Assets and Liabilities. All other costs of operations payable to Vanguard are generally settled twice a month.
Upon the request of Vanguard, the fund may invest up to 0.40% of its net assets as capital in Vanguard. At September 30, 2019, the fund had contributed to Vanguard capital in the amount of $2,994,000, representing less than 0.01% of the fund’s net assets and 1.20% of Vanguard’s capital received pursuant to the FSA. The fund’s trustees and officers are also directors and employees, respectively, of Vanguard.
D. Various inputs may be used to determine the value of the fund’s investments. These inputs are summarized in three broad levels for financial statement purposes. The inputs or methodologies used to value securities are not necessarily an indication of the risk associated with investing in those securities.
Level 1—Quoted prices in active markets for identical securities.
Level 2—Other significant observable inputs (including quoted prices for similar securities, interest rates, prepayment speeds, credit risk, etc.).
Level 3—Significant unobservable inputs (including the fund’s own assumptions used to determine the fair value of investments). Any investments valued with significant unobservable inputs are noted on the Statement of Net Assets.
The following table summarizes the market value of the fund’s investments as of September 30, 2019, based on the inputs used to value them:
| Level 1 | Level 2 | Level 3 |
Investments | ($000) | ($000) | ($000) |
Common Stocks | 58,159,161 | 3,538,779 | — |
Temporary Cash Investments | 1,855,920 | — | — |
Total | 60,015,081 | 3,538,779 | — |
E. Permanent differences between book-basis and tax-basis components of net assets are reclassified among capital accounts in the financial statements to reflect their tax character. These reclassifications have no effect on net assets or net asset value per share. As of period end, permanent differences primarily attributable to the accounting for foreign currency transactions and distributions in connection with fund share redemptions were reclassified between the following accounts:
| Amount |
| ($000) |
Paid-in Capital | 226,124 |
Total Distributable Earnings (Loss) | (226,124) |
20
PRIMECAP Fund
Temporary differences between book-basis and tax-basis components of total distributable earnings (loss) arise when certain items of income, gain, or loss are recognized in different periods for financial statement and tax purposes; these differences will reverse at some time in the future. The differences are primarily related to the tax deferral of losses on wash sales. As of period end, the tax-basis components of total distributable earnings (loss) are detailed in the table as follows:
| Amount |
| ($000) |
Undistributed Ordinary Income | 739,405 |
Undistributed Long-Term Gains | 3,683,351 |
Capital Loss Carryforwards (Non-expiring) | — |
Net Unrealized Gains (Losses) | 33,729,011 |
As of September 30, 2019, gross unrealized appreciation and depreciation for investments based on cost for U.S. federal income tax purposes were as follows:
| Amount |
| ($000) |
Tax Cost | 29,824,537 |
Gross Unrealized Appreciation | 36,079,691 |
Gross Unrealized Depreciation | (2,350,368) |
Net Unrealized Appreciation (Depreciation) | 33,729,323 |
F. During the year ended September 30, 2019, the fund purchased $3,201,728,000 of investment securities and sold $6,367,691,000 of investment securities, other than temporary cash investments
G. Capital share transactions for each class of shares were:
| Year Ended September 30, |
| 2019 | | 2018 |
| Amount | Shares | | Amount | Shares |
| ($000) | (000) | | ($000) | (000) |
Investor Shares | | | | | |
Issued | 625,656 | 4,823 | | 748,854 | 5,524 |
Issued in Lieu of Cash Distributions | 449,317 | 3,799 | | 396,358 | 3,055 |
Redeemed | (1,427,216) | (11,115) | | (2,855,971) | (21,003) |
Net Increase (Decrease)—Investor Shares | (352,243) | (2,493) | | (1,710,759) | (12,424) |
Admiral Shares | | | | | |
Issued | 2,512,990 | 18,918 | | 4,800,588 | 34,215 |
Issued in Lieu of Cash Distributions | 3,905,419 | 31,871 | | 2,746,449 | 20,423 |
Redeemed | (5,917,133) | (43,874) | | (4,552,422) | (32,354) |
Net Increase (Decrease)—Admiral Shares | 501,276 | 6,915 | | 2,994,615 | 22,284 |
21
PRIMECAP Fund
H. Certain of the fund’s investments are in companies that are considered to be affiliated companies of the fund because the fund owns more than 5% of the outstanding voting securities of the company or the issuer is another member of The Vanguard Group. Transactions during the period in securities of these companies were as follows:
| | Current Period Transactions | |
| Sept. 30, | | Proceeds | Net | | | | Sept. 30, |
| 2018 | | from | Realized | Change in | | Capital Gain | 2019 |
| Market | Purchases | Securities | Gain | Unrealized | | Distributions | Market |
| Value | at Cost | Sold | (Loss) | App. (Dep.) | Income | Received | Value |
| ($000) | ($000) | ($000) | ($000) | ($000) | ($000) | ($000) | ($000) |
Vanguard Market Liquidity Fund | 2,087,963 | NA1 | NA1 | 8 | 155 | 41,427 | — | 1,855,920 |
American Airlines Group Inc. | 1,253,411 | — | — | — | (435,494) | 12,131 | — | 817,917 |
Mattel Inc. | 410,502 | 4,537 | — | — | (112,673) | — | — | 302,366 |
NetApp Inc. | 1,248,858 | — | 125,309 | 55,881 | (500,411) | 22,553 | — | 679,019 |
Plantronics Inc. | 221,440 | — | — | — | (84,390) | 2,203 | — | 137,050 |
Southwest Airlines Co. | 2,195,065 | — | 8,355 | (1,807) | (295,495) | 23,871 | — | 1,889,408 |
United Airlines Holdings Inc. | 1,410,309 | 7,499 | — | — | (9,843) | — | — | 1,407,965 |
Whirlpool Corp. | 486,575 | 12,786 | — | — | 167,267 | 19,645 | — | 666,628 |
Total | 9,314,123 | 24,822 | 133,664 | 54,082 | (1,270,884) | 121,830 | — | 7,756,273 |
1 Not applicable—purchases and sales are for temporary cash investment purposes.
I. Management has determined that no events or transactions occurred subsequent to September 30, 2019, that would require recognition or disclosure in these financial statements.
22
Report of Independent Registered Public Accounting Firm
To the Board of Trustees of Vanguard Chester Funds and Shareholders of Vanguard PRIMECAP Fund
Opinion on the Financial Statements
We have audited the accompanying statement of net assets and statement of assets and liabilities of Vanguard PRIMECAP Fund (one of the funds constituting Vanguard Chester Funds, referred to hereafter as the “Fund”) as of September 30, 2019, the related statement of operations for the year ended September 30, 2019, the statement of changes in net assets for each of the two years in the period ended September 30, 2019, including the related notes, and the financial highlights for each of the five years in the period ended September 30, 2019 (collectively referred to as the “financial statements”). In our opinion, the financial statements present fairly, in all material respects, the financial position of the Fund as of September 30, 2019, the results of its operations for the year then ended, the changes in its net assets for each of the two years in the period ended September 30, 2019 and the financial highlights for each of the five years in the period ended September 30, 2019 in conformity with accounting principles generally accepted in the United States of America.
Basis for Opinion
These financial statements are the responsibility of the Fund’s management. Our responsibility is to express an opinion on the Fund’s financial statements based on our audits. We are a public accounting firm registered with the Public Company Accounting Oversight Board (United States) (“PCAOB”) and are required to be independent with respect to the Fund in accordance with the U.S. federal securities laws and the applicable rules and regulations of the Securities and Exchange Commission and the PCAOB.
We conducted our audits of these financial statements in accordance with the standards of the PCAOB. Those standards require that we plan and perform the audit to obtain reasonable assurance about whether the financial statements are free of material misstatement, whether due to error or fraud.
Our audits included performing procedures to assess the risks of material misstatement of the financial statements, whether due to error or fraud, and performing procedures that respond to those risks. Such procedures included examining, on a test basis, evidence regarding the amounts and disclosures in the financial statements. Our audits also included evaluating the accounting principles used and significant estimates made by management, as well as evaluating the overall presentation of the financial statements. Our procedures included confirmation of securities owned as of September 30, 2019 by correspondence with the custodian and brokers and by agreement to the underlying ownership records of the transfer agent; when replies were not received from brokers, we performed other auditing procedures. We believe that our audits provide a reasonable basis for our opinion.
/s/PricewaterhouseCoopers LLP
Philadelphia, Pennsylvania
November 13, 2019
We have served as the auditor of one or more investment companies in The Vanguard Group of Funds since 1975.
23
Special 2019 tax information (unaudited) for Vanguard PRIMECAP Fund
This information for the fiscal year ended September 30, 2019, is included pursuant to provisions of the Internal Revenue Code.
The fund distributed $3,995,384,000 as capital gain dividends (20% rate gain distributions) to shareholders during the fiscal year.
For nonresident alien shareholders, 100% of short-term capital gain dividends distributed by the fund are qualified short-term capital gains.
The fund distributed $775,112,000 of qualified dividend income to shareholders during the fiscal year.
For corporate shareholders, 84.2% of investment income (dividend income plus short-term gains, if any) qualifies for the dividends-received deduction.
24
Trustees Approve Advisory Arrangement
The board of trustees of Vanguard PRIMECAP Fund has renewed the fund’s investment advisory arrangement with PRIMECAP Management Company (PRIMECAP). The board determined that renewing the fund’s advisory arrangement was in the best interests of the fund and its shareholders.
The board based its decision upon an evaluation of the advisor’s investment staff, portfolio management process, and performance. This evaluation included information provided to the board by Vanguard’s Portfolio Review Department, which is responsible for fund and advisor oversight and product management. The Portfolio Review Department met regularly with the advisor and made monthly presentations to the board during the fiscal year that directed the board’s focus to relevant information and topics.
The board, or an investment committee made up of board members, also received information throughout the year during advisor presentations. For each advisor presentation, the board was provided with letters and reports that included information about, among other things, the advisory firm and the advisor’s assessment of the investment environment, portfolio performance, and portfolio characteristics.
In addition, the board received monthly reports, which included a Market and Economic Report, a Fund Dashboard Monthly Summary, and a Fund Performance Report.
Prior to their meeting, the trustees were provided with a memo and material that summarized the information they received over the course of the year. They also considered the factors discussed below, among others. However, no single factor determined whether the board approved the arrangement. Rather, it was the totality of the circumstances that drove the board’s decision.
Nature, extent, and quality of services
The board reviewed the quality of the fund’s investment management services over both the short and long term, and took into account the organizational depth and stability of the advisor. The board considered that PRIMECAP, founded in 1983, is recognized for its long-term approach to growth equity investing. Five experienced portfolio managers are responsible for separate subportfolios, and each portfolio manager employs a fundamental, research-driven approach in seeking to identify companies with long-term growth potential that the market has yet to appreciate. The multi-counselor approach employed by PRIMECAP is designed to emphasize individual decision-making and enable the portfolio managers to invest in their highest-conviction ideas. The advisor’s fundamental research focuses on developing opinions independent from Wall Street’s consensus and maintaining a long-term horizon. PRIMECAP has managed the fund since its inception in 1984.
The board concluded that the advisor’s experience, stability, depth, and performance, among other factors, warranted continuation of the advisory arrangement.
Investment performance
The board considered the short- and long-term performance of the fund, including any periods of outperformance or underperformance compared with a relevant benchmark index and peer group. The board concluded that the performance was such that the advisory arrangement should continue.
25
Cost
The board concluded that the fund’s expense ratio was well below the average expense ratio charged by funds in its peer group and that the fund’s advisory fee rate was also well below the peer-group average.
The board did not consider the profitability of PRIMECAP in determining whether to approve the advisory fee, because PRIMECAP is independent of Vanguard and the advisory fee is the result of arm’s-length negotiations.
The benefit of economies of scale
The board concluded that the fund’s shareholders benefit from economies of scale because of breakpoints in the fund’s advisory fee schedule. The breakpoints reduce the effective rate of the fee as the fund’s assets increase.
The board will consider whether to renew the advisory arrangement again after a one-year period.
26
The People Who Govern Your Fund
The trustees of your mutual fund are there to see that the fund is operated and managed in your best interests since, as a shareholder, you are a part owner of the fund. Your fund’s trustees also serve on the board of directors of The Vanguard Group, Inc., which is owned by the Vanguard funds and provides services to them.
A majority of Vanguard’s board members are independent, meaning that they have no affiliation with Vanguard or the funds they oversee, apart from the sizable personal investments they have made as private individuals. The independent board members have distinguished backgrounds in business, academia, and public service. Each of the trustees and executive officers oversees 212 Vanguard funds.
Information for each trustee and executive officer of the fund appears below. That information, as well as the Vanguard fund count, is as of the date on the cover of this fund report. The mailing address of the trustees and officers is P.O. Box 876, Valley Forge, PA 19482. More information about the trustees is in the Statement of Additional Information, which can be obtained, without charge, by contacting Vanguard at 800-662-7447, or online at vanguard.com.
Interested Trustee1
Mortimer J. Buckley
Born in 1969. Trustee since January 2018. Principal occupation(s) during the past five years and other experience: chairman of the board (January 2019–present) of Vanguard and of each of the investment companies served by Vanguard; chief executive officer (January 2018–present) of Vanguard; chief executive officer, president, and trustee (January 2018–present) of each of the investment companies served by Vanguard; president and director (2017–present) of Vanguard; and president (February 2018–present) of Vanguard Marketing Corporation. Chief investment officer (2013–2017), managing director (2002–2017), head of the Retail Investor Group (2006–2012), and chief information officer (2001–2006) of Vanguard. Chairman of the board (2011–2017) and trustee (2009–2017) of the Children’s Hospital of Philadelphia; trustee (2018–present) of The Shipley School.
Independent Trustees
Emerson U. Fullwood
Born in 1948. Trustee since January 2008. Principal occupation(s) during the past five years and other experience: executive chief staff and marketing officer for North America and corporate vice president (retired 2008) of Xerox Corporation (document management products and services). Former president of the Worldwide Channels Group, Latin America, and Worldwide Customer Service and executive chief staff officer of Developing Markets of Xerox. Executive in residence and 2009–2010 Distinguished Minett Professor at the Rochester Institute of Technology. Director of SPX FLOW, Inc. (multi-industry manufacturing). Director of the University of Rochester Medical Center, the Monroe Community College Foundation, the United Way of Rochester, North Carolina A&T University, and Roberts Wesleyan College. Trustee of the University of Rochester.
Amy Gutmann
Born in 1949. Trustee since June 2006. Principal occupation(s) during the past five years and other experience: president (2004–present) of the University of Pennsylvania. Christopher H. Browne Distinguished Professor of Political Science, School of Arts and Sciences, and professor of communication, Annenberg School for Communication, with secondary faculty appointments in the Department of Philosophy, School of Arts and Sciences, and at the Graduate School of Education, University of Pennsylvania. Trustee of the National Constitution Center.
F. Joseph Loughrey
Born in 1949. Trustee since October 2009. Principal occupation(s) during the past five years and other experience: president and chief operating officer (retired 2009) and vice chairman of the board (2008–2009) of Cummins Inc. (industrial machinery). Chairman of the board of Hillenbrand, Inc. (specialized consumer services), and the Lumina Foundation.
1 Mr. Buckley is considered an “interested person,” as defined in the Investment Company Act of 1940, because he is an officer of the Vanguard funds.
Director of the V Foundation and Oxfam America. Member of the advisory council for the College of Arts and Letters and chair of the advisory board to the Kellogg Institute for International Studies, both at the University of Notre Dame.
Mark Loughridge
Born in 1953. Trustee since March 2012. Principal occupation(s) during the past five years and other experience: senior vice president and chief financial officer (retired 2013) of IBM (information technology services). Fiduciary member of IBM’s Retirement Plan Committee (2004–2013), senior vice president and general manager (2002–2004) of IBM Global Financing, vice president and controller (1998–2002) of IBM, and a variety of other prior management roles at IBM. Member of the Council on Chicago Booth.
Scott C. Malpass
Born in 1962. Trustee since March 2012. Principal occupation(s) during the past five years and other experience: chief investment officer (1989–present) and vice president (1996–present) of the University of Notre Dame. Assistant professor of finance at the Mendoza College of Business, University of Notre Dame, and member of the Notre Dame 403(b) Investment Committee. Chairman of the board of TIFF Advisory Services, Inc. Member of the board of Catholic Investment Services, Inc. (investment advisors) and the board of superintendence of the Institute for the Works of Religion.
Deanna Mulligan
Born in 1963. Trustee since January 2018. Principal occupation(s) during the past five years and other experience: president (2010–present) and chief executive officer (2011–present) of The Guardian Life Insurance Company of America. Chief operating officer (2010–2011) and executive vice president (2008–2010) of Individual Life and Disability of The Guardian Life Insurance Company of America. Member of the board of The Guardian Life Insurance Company of America, the American Council of Life Insurers, the Partnership for New York City (business leadership), and the Committee Encouraging Corporate Philanthropy. Trustee of the Economic Club of New York and the Bruce Museum (arts and science). Member of the Advisory Council for the Stanford Graduate School of Business.
André F. Perold
Born in 1952. Trustee since December 2004. Principal occupation(s) during the past five years and other experience: George Gund Professor of Finance and Banking, Emeritus at the Harvard Business School (retired 2011). Chief investment officer and co-managing partner of HighVista Strategies LLC (private investment firm). Board of advisors and investment committee member of the Museum of Fine Arts Boston. Board member (2018–present) of RIT Capital Partners (investment firm); investment committee member of Partners Health Care System.
Sarah Bloom Raskin
Born in 1961. Trustee since January 2018. Principal occupation(s) during the past five years and other experience: deputy secretary (2014–2017) of the United States Department of the Treasury. Governor (2010–2014) of the Federal Reserve Board. Commissioner (2007–2010) of financial regulation for the State of Maryland. Member of the board of directors (2012–2014) of Neighborhood Reinvestment Corporation. Director (2017–present) of i(x) Investments, LLC; director (2017–present) of Reserve Trust. Rubinstein Fellow (2017–present) of Duke University; trustee (2017–present) of Amherst College.
Peter F. Volanakis
Born in 1955. Trustee since July 2009. Principal occupation(s) during the past five years and other experience: president and chief operating officer (retired 2010) of Corning Incorporated (communications equipment) and director of Corning Incorporated (2000–2010) and Dow Corning (2001–2010). Director (2012) of SPX Corporation (multi-industry manufacturing). Overseer of the Amos Tuck School of Business Administration, Dartmouth College (2001–2013). Chairman of the board of trustees of Colby-Sawyer College. Member of the board of Hypertherm Inc. (industrial cutting systems, software, and consumables).
Executive Officers
Glenn Booraem
Born in 1967. Principal occupation(s) during the past five years and other experience: principal of Vanguard. Investment stewardship officer (2017–present), treasurer (2015–2017), controller (2010–2015), and assistant controller (2001–2010) of each of the investment companies served by Vanguard.
Christine M. Buchanan
Born in 1970. Principal occupation(s) during the past five years and other experience: principal of Vanguard and global head of Fund Administration at Vanguard. Treasurer (2017–present) of each of the investment companies served by Vanguard. Partner (2005–2017) at KPMG LLP (audit, tax, and advisory services).
Thomas J. Higgins
Born in 1957. Principal occupation(s) during the past five years and other experience: principal of Vanguard. Chief financial officer (2008–present) and treasurer (1998–2008) of each of the investment companies served by Vanguard.
Peter Mahoney
Born in 1974. Principal occupation(s) during the past five years and other experience: principal of Vanguard. Controller (2015–present) of each of the investment companies served by Vanguard. Head of International Fund Services (2008–2014) at Vanguard.
Anne E. Robinson
Born in 1970. Principal occupation(s) during the past five years and other experience: general counsel (2016–present) of Vanguard. Secretary (2016–present) of Vanguard and of each of the investment companies served by Vanguard. Managing director (2016–present) of Vanguard. Director and senior vice president (2016–2018) of Vanguard Marketing Corporation. Managing director and general counsel of Global Cards and Consumer Services (2014–2016) at Citigroup. Counsel (2003–2014) at American Express.
Michael Rollings
Born in 1963. Principal occupation(s) during the past five years and other experience: finance director (2017–present) and treasurer (2017) of each of the investment companies served by Vanguard. Managing director (2016–present) of Vanguard. Chief financial officer (2016–present) of Vanguard. Director (2016–present) of Vanguard Marketing Corporation. Executive vice president and chief financial officer (2006–2016) of MassMutual Financial Group.
John E. Schadl
Born in 1972. Principal occupation(s) during the past five years and other experience: principal of Vanguard. Chief compliance officer (2019–present) of Vanguard and of each of the investment companies served by Vanguard. Assistant vice president (May 2019–present) of Vanguard Marketing Corporation.
Vanguard Senior Management Team |
| |
Joseph Brennan | Chris D. McIsaac |
Mortimer J. Buckley | James M. Norris |
Gregory Davis | Thomas M. Rampulla |
John James | Karin A. Risi |
Martha G. King | Anne E. Robinson |
John T. Marcante | Michael Rollings |
| 
|
| |
| P.O. Box 2600 |
| Valley Forge, PA 19482-2600 |
Connect with Vanguard® > vanguard.com
Fund Information > 800-662-7447
Direct Investor Account Services > 800-662-2739
Institutional Investor Services > 800-523-1036
Text Telephone for People
Who Are Deaf or Hard of Hearing > 800-749-7273
This material may be used in conjunction with the offering of shares of any Vanguard fund only if preceded or accompanied by the fund’s current prospectus.
All comparative mutual fund data are from Morningstar, Inc., unless otherwise noted.
You can obtain a free copy of Vanguard’s proxy voting guidelines by visiting vanguard.com/proxyreporting or by calling Vanguard at 800-662-2739. The guidelines are also available from the SEC’s website, www.sec.gov. In addition, you may obtain a free report on how your fund voted the proxies for securities it owned during the 12 months ended June 30. To get the report, visit either vanguard.com/proxyreporting or www.sec.gov.
You can review information about your fund on the SEC’s website, and you can receive copies of this information, for a fee, by sending a request via email addressed to publicinfo@sec.gov.
Source for Bloomberg Barclays indexes: Bloomberg Index Services Limited. Copyright 2019, Bloomberg. All rights reserved.
| © 2019 The Vanguard Group, Inc. |
| All rights reserved. |
| Vanguard Marketing Corporation, Distributor. |
| |
| Q590 112019 |

Annual Report | September 30, 2019 Vanguard Target Retirement Funds |
Vanguard Target Retirement Income Fund Vanguard Target Retirement 2015 Fund Vanguard Target Retirement 2020 Fund Vanguard Target Retirement 2025 Fund Vanguard Target Retirement 2030 Fund Vanguard Target Retirement 2035 Fund See the inside front cover for important information about access to your fund’s annual and semiannual shareholder reports. |
Important information about access to shareholder reports
Beginning on January 1, 2021, as permitted by regulations adopted by the Securities and Exchange Commission, paper copies of your fund’s annual and semiannual shareholder reports will no longer be sent to you by mail, unless you specifically request them. Instead, you will be notified by mail each time a report is posted on the website and will be provided with a link to access the report.
If you have already elected to receive shareholder reports electronically, you will not be affected by this change and do not need to take any action. You may elect to receive shareholder reports and other communications from the fund electronically by contacting your financial intermediary (such as a broker-dealer or bank) or, if you invest directly with the fund, by calling Vanguard at one of the phone numbers on the back cover of this report or by logging on to vanguard.com.
You may elect to receive paper copies of all future shareholder reports free of charge. If you invest through a financial intermediary, you can contact the intermediary to request that you continue to receive paper copies. If you invest directly with the fund, you can call Vanguard at one of the phone numbers on the back cover of this report or log on to vanguard.com. Your election to receive paper copies will apply to all the funds you hold through an intermediary or directly with Vanguard.
Contents | | |
| | |
A Note From Our Chairman | | 1 |
| | |
Your Fund’s Performance at a Glance | | 2 |
| | |
About Your Fund’s Expenses | | 3 |
| | |
Target Retirement Income Fund | | 5 |
| | |
Target Retirement 2015 Fund | | 16 |
| | |
Target Retirement 2020 Fund | | 27 |
| | |
Target Retirement 2025 Fund | | 38 |
| | |
Target Retirement 2030 Fund | | 49 |
| | |
Target Retirement 2035 Fund | | 60 |
Please note: The opinions expressed in this report are just that—informed opinions. They should not be considered promises or advice. Also, please keep in mind that the information and opinions cover the period through the date on the front of this report. Of course, the risks of investing in your fund are spelled out in the prospectus.
A Note From Our Chairman

Tim Buckley
Chairman and Chief Executive Officer
Dear Shareholder,
Recent volatility in financial markets—affecting stocks, bonds, and commodities—has been a good reminder of the wise old adage, “Never keep all your eggs in one basket.” Maintaining balance and diversification in your investment portfolio can help to both limit risk and set you up for long-term success.
It’s understandable why some investors might become complacent after a long market run-up like the one that lifted stock prices, especially U.S. stock prices, in the years following the global financial crisis. But failing to rebalance regularly can leave a portfolio with a much different mix of assets than intended and, often, more risk than intended.
Balance across and diversification within asset classes are powerful tools for managing risk and achieving your investment goals. A portfolio’s allocation will determine a large portion of its long-term return and also the majority of its volatility risk. A well-diversified portfolio is less vulnerable to significant swings in the performance of any one segment of the asset classes in which it invests.
Balance and diversification will never eliminate the risk of loss, nor will they guarantee positive returns in a declining market. But they should reduce the chance that you’ll suffer disproportionate losses in one particular high-flying asset class or sector when it comes back to earth. And exposure to all key market components should give you at least some participation in the sectors that are performing best at any given time.
Vanguard is committed to helping you achieve balance and diversification in your portfolios to help meet your investment goals. We thank you for your continued loyalty.
Sincerely,

Mortimer J. Buckley
Chairman and Chief Executive Officer
October 14, 2019
1
Your Fund’s Performance at a Glance
· For the 12 months ended September 30, 2019, the six Vanguard Target Retirement Funds covered in this report recorded returns ranging from 3.37% for the Target Retirement 2035 Fund to 6.75% for the Target Retirement Income Fund. (The funds with target dates of 2040 through 2065 are covered in a separate report.) The funds with a greater allocation to bonds did best.
· Each fund performed in line with its composite benchmark after expenses. The Target Retirement Funds invest all of their assets in Vanguard index funds that seek to match the performance of broad stock and bond market indexes.
· Worries about the pace of global economic growth and central bank plans to loosen monetary policies virtually worldwide encouraged investment in bonds, sending their yields lower and their prices markedly higher. Broad measures of both the U.S. and non-U.S. investment-grade bond markets returned more than 10% during the funds’ fiscal year. Stocks, in contrast, cooled. U.S. shares gained less than 3%, while non-U.S. shares returned roughly –1% in U.S. dollars.
· Vanguard Target Retirement Funds are designed to reach an allocation of 70% bonds and 30% stocks within seven years after their target dates.
· For the ten years ended September 30, the funds’ average annual returns ranged from 5.76% for the Target Retirement Income Fund to 9.35% for the Target Retirement 2035 Fund.
Market Barometer
| | Average Annual Total Returns | |
| | Periods Ended September 30, 2019 | |
| | One Year | | Three Years | | Five Years | |
Stocks | | | | | | | |
Russell 1000 Index (Large-caps) | | 3.87% | | 13.19% | | 10.62% | |
Russell 2000 Index (Small-caps) | | -8.89 | | 8.23 | | 8.19 | |
Russell 3000 Index (Broad U.S. market) | | 2.92 | | 12.83 | | 10.44 | |
FTSE All-World ex US Index (International) | | -1.12 | | 6.46 | | 3.24 | |
| | | | | | | |
Bonds | | | | | | | |
Bloomberg Barclays U.S. Aggregate Bond Index (Broad taxable market) | | 10.30% | | 2.92% | | 3.38% | |
Bloomberg Barclays Municipal Bond Index (Broad tax-exempt market) | | 8.55 | | 3.19 | | 3.66 | |
FTSE Three-Month U.S. Treasury Bill Index | | 2.36 | | 1.52 | | 0.95 | |
| | | | | | | |
CPI | | | | | | | |
Consumer Price Index | | 1.71% | | 2.07% | | 1.53% | |
2
About Your Fund’s Expenses
As a shareholder of the fund, you incur ongoing costs, which include costs for portfolio management, administrative services, and shareholder reports (like this one), among others. Operating expenses, which are deducted from a fund’s gross income, directly reduce the investment return of the fund.
A typical fund’s expenses are expressed as a percentage of its average net assets. The Target Retirement Funds have no direct expenses, but each fund bears its proportionate share of the costs for the underlying funds in which it invests. These indirect expenses make up the acquired fund fees and expenses, also expressed as a percentage of average net assets.
The following examples are intended to help you understand the ongoing cost (in dollars) of investing in your fund and to compare these costs with those of other mutual funds. The examples are based on an investment of $1,000 made at the beginning of the period shown and held for the entire period. The costs were calculated using the acquired fund fees and expenses for each Target Retirement Fund.
The accompanying table illustrates your fund’s costs in two ways:
· Based on actual fund return. This section helps you to estimate the actual expenses that you paid over the period. The “Ending Account Value” shown is derived from the fund’s actual return, and the third column shows the dollar amount that would have been paid by an investor who started with $1,000 in the fund. You may use the information here, together with the amount you invested, to estimate the expenses that you paid over the period.
To do so, simply divide your account value by $1,000 (for example, an $8,600 account value divided by $1,000 = 8.6), then multiply the result by the number given for your fund under the heading “Expenses Paid During Period.”
· Based on hypothetical 5% yearly return. This section is intended to help you compare your fund’s costs with those of other mutual funds. It assumes that the fund had a yearly return of 5%before expenses, but that the expense ratio is unchanged. In this case—because the return used is not the fund’s actual return—the results do not apply to your investment. The example is useful in making comparisons because the Securities and Exchange Commission requires all mutual funds to calculate expenses based on a 5% return. You can assess your fund’s costs by comparing this hypothetical example with the hypothetical examples that appear in shareholder reports of other funds.
Note that the expenses shown in the table are meant to highlight and help you compare ongoing costs only and do not reflect transaction costs incurred by the fund for buying and selling securities. Further, the expenses do not include any purchase, redemption, or account service fees described in the fund prospectus. If such fees were applied to your account, your costs would be higher. Your fund does not carry a “sales load.”
The calculations assume no shares were bought or sold during the period. Your actual costs may have been higher or lower, depending on the amount of your investment and the timing of any purchases or redemptions.
You can find more information about the fund’s expenses, including annual expense ratios, in the Financial Statements section of this report. For additional information on operating expenses and other shareholder costs, please refer to your fund’s current prospectus.
3
Six Months Ended September 30, 2019
| | Beginning | | Ending | | Expenses |
| | Account Value | | Account Value | | Paid During |
| | 3/31/2019 | | 9/30/2019 | | Period |
Based on Actual Fund Return | | | | | | |
Target Retirement Income Fund | | $1,000.00 | | $1,045.36 | | $0.62 |
Target Retirement 2015 Fund | | $1,000.00 | | $1,044.72 | | $0.67 |
Target Retirement 2020 Fund | | $1,000.00 | | $1,044.38 | | $0.67 |
Target Retirement 2025 Fund | | $1,000.00 | | $1,044.84 | | $0.67 |
Target Retirement 2030 Fund | | $1,000.00 | | $1,043.25 | | $0.72 |
Target Retirement 2035 Fund | | $1,000.00 | | $1,041.47 | | $0.72 |
Based on Hypothetical 5% Yearly Return | | | | | | |
Target Retirement Income Fund | | $1,000.00 | | $1,024.47 | | $0.61 |
Target Retirement 2015 Fund | | $1,000.00 | | $1,024.42 | | $0.66 |
Target Retirement 2020 Fund | | $1,000.00 | | $1,024.42 | | $0.66 |
Target Retirement 2025 Fund | | $1,000.00 | | $1,024.42 | | $0.66 |
Target Retirement 2030 Fund | | $1,000.00 | | $1,024.37 | | $0.71 |
Target Retirement 2035 Fund | | $1,000.00 | | $1,024.37 | | $0.71 |
The calculations are based on the acquired fund fees and expenses for the most recent six-month period. The funds’ annualized expense figures for that period are (in order as listed from top to bottom above) 0.12%, 0.13%, 0.13%, 0.13%, 0.14%, and 0.14%. The dollar amounts shown as “Expenses Paid” are equal to the annualized expense figures for the underlying funds multiplied by the average account value over the period, multiplied by the number of days in the most recent six-month period, then divided by the number of days in the most recent 12-month period (183/365).
4
Target Retirement Income Fund
Performance Summary
All of the returns in this report represent past performance, which is not a guarantee of future results that may be achieved by the fund. (Current performance may be lower or higher than the performance data cited. For performance data current to the most recent month-end, visit our website at vanguard.com/performance.) Note, too, that both investment returns and principal value can fluctuate widely, so an investor’s shares, when sold, could be worth more or less than their original cost. The returns shown do not reflect taxes that a shareholder would pay on fund distributions or on the sale of fund shares.
Cumulative Performance: September 30, 2009, Through September 30, 2019
Initial Investment of $10,000
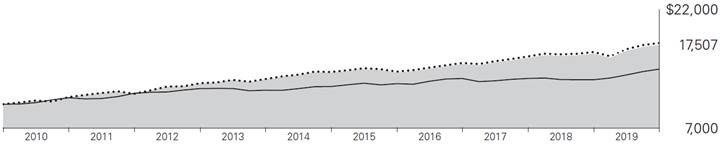
| | | | Average Annual Total Returns | | |
| | | | Periods Ended September 30, 2019 | | |
| | | | | | | | | | Final Value |
| | | | One | | Five | | Ten | | of a $10,000 |
| | | | Year | | Years | | Years | | Investment |

| | Target Retirement Income Fund | | 6.75% | | 4.57% | | 5.76% | | $17,507 |

| | Target Income Composite Index | | 6.83 | | 4.73 | | 5.90 | | 17,741 |

| | Bloomberg Barclays U.S. Aggregate Bond Index | | 10.30 | | 3.38 | | 3.75 | | 14,448 |
Target Income Composite Index: Derived by applying the fund’s target asset allocation to the results of the following benchmarks: for international stocks of developed markets, the MSCI EAFE Index through December 15, 2010, the MSCI ACWI ex USA IMI Index through June 2, 2013, and the FTSE Global All Cap ex US Index thereafter; for emerging-market stocks, the Select Emerging Markets Index through August 23, 2006, the MSCI Emerging Markets Index through December 15, 2010, the MSCI ACWI ex USA IMI Index through June 2, 2013, and the FTSE Global All Cap ex US Index thereafter; for U.S. bonds, the Bloomberg Barclays U.S. Aggregate Bond Index through December 31, 2009, and the Bloomberg Barclays U.S. Aggregate Float Adjusted Index thereafter, as well as the Bloomberg Barclays U.S. Treasury Inflation-Protected Securities Index through June 2, 2013, and the Bloomberg Barclays U.S. Treasury Inflation-Protected Securities (TIPS) 0–5 Year Index thereafter; for short-term reserves, the Citigroup Three-Month Treasury Bill Index through June 2, 2013; for international bonds, the Bloomberg Barclays Global Aggregate ex-USD Float Adjusted RIC Capped Index Hedged beginning June 3, 2013; and for U.S. stocks, the Dow Jones U.S. Total Stock Market Index (formerly known as the Dow Jones Wilshire 5000 Index) through April 22, 2005, the MSCI US Broad Market Index through June 2, 2013, and the CRSP US Total Market Index thereafter. International stock benchmark returns are adjusted for withholding taxes.
See Financial Highlights for dividend and capital gains information.
5
Target Retirement Income Fund
Underlying Vanguard Funds
As of September 30, 2019
Vanguard Total Bond Market II Index Fund Investor Shares | | 37.1% |
Vanguard Total Stock Market Index Fund Investor Shares | | 18.3 |
Vanguard Short-Term Inflation-Protected Securities Index Fund Investor Shares | | 16.6 |
Vanguard Total International Bond Index Fund Investor Shares | | 16.1 |
Vanguard Total International Stock Index Fund Investor Shares | | 11.9 |
6
Target Retirement Income Fund
Financial Statements
Statement of Net Assets
As of September 30, 2019
The fund files its complete schedule of portfolio holdings with the Securities and Exchange Commission (SEC) for the first and third quarters of each fiscal year as an exhibit to its reports on Form N-PORT. The fund’s Form N-PORT reports are available on the SEC’s website at www.sec.gov.
| | | | | Market | |
| | | | | Value· | |
| | | Shares | | ($000 | ) |
Investment Companies (100.0%) | | | | | |
U.S. Stock Fund (18.3%) | | | | | |
| Vanguard Total Stock Market Index Fund Investor Shares | | 42,249,458 | | 3,104,490 | |
| | | | | | |
International Stock Fund (11.9%) | | | | | |
| Vanguard Total International Stock Index Fund Investor Shares | | 121,435,524 | | 2,012,186 | |
| | | | | | |
U.S. Bond Funds (53.7%) | | | | | |
1 | Vanguard Total Bond Market II Index Fund Investor Shares | | 568,891,400 | | 6,303,317 | |
| Vanguard Short-Term Inflation-Protected Securities Index Fund Investor Shares | | 114,851,283 | | 2,821,896 | |
| | | | | 9,125, 213 | |
International Bond Fund (16.1%) | | | | | |
| Vanguard Total International Bond Index Fund Investor Shares | | 232,834,156 | | 2,738,130 | |
Total Investment Companies (Cost $13,906,300) | | | | 16,980,019 | |
Temporary Cash Investment (0.0%) | | | | | |
Money Market Fund (0.0%) | | | | | |
1 | Vanguard Market Liquidity Fund, 2.098% (Cost $4,215) | | 42,144 | | 4,215 | |
Total Investments (100.0%) (Cost $13,910,515) | | | | 16,984,234 | |
Other Assets and Liabilities (0.0%) | | | | | |
Other Assets | | | | 33,397 | |
Liabilities | | | | (34,123 | ) |
| | | | | (726 | ) |
Net Assets (100%) | | | | | |
Applicable to 1,226,585,490 outstanding $.001 par value shares of beneficial interest (unlimited authorization) | | | | 16,983,508 | |
Net Asset Value Per Share | | | | $13.85 | |
7
Target Retirement Income Fund
| | Amount | |
| | ($000 | ) |
Statement of Assets and Liabilities | | | |
Assets | | | |
Investments in Securities, at Value—Affiliated Funds | | 16,984,234 | |
Receivables for Investment Securities Sold | | 5,378 | |
Receivables for Accrued Income | | 15,781 | |
Receivables for Capital Shares Issued | | 12,238 | |
Total Assets | | 17,017,631 | |
Liabilities | | | |
Payables for Investment Securities Purchased | | 15,780 | |
Payables for Capital Shares Redeemed | | 13,696 | |
Payables for Distributions | | 4,647 | |
Total Liabilities | | 34,123 | |
Net Assets | | 16,983,508 | |
At September 30, 2019, net assets consisted of:
| | Amount | |
| | ($000 | ) |
Paid-in Capital | | 13,886,283 | |
Total Distributable Earnings (Loss) | | 3,097,225 | |
Net Assets | | 16,983,508 | |
· See Note A in Notes to Financial Statements.
1 Affiliated fund available only to Vanguard funds and certain trusts and accounts managed by Vanguard. Rate shown for Vanguard Market Liquidity Fund is the 7-day yield.
See accompanying Notes, which are an integral part of the Financial Statements.
8
Target Retirement Income Fund
Statement of Operations
| | Year Ended | |
| | September 30, 2019 | |
| | ($000 | ) |
Investment Income | | | |
Income | | | |
Income Distributions Received from Affiliated Funds | | 415,089 | |
Net Investment Income – Note B | | 415,089 | |
Realized Net Gain (Loss) | | | |
Capital Gain Distributions Received from Affiliated Funds | | — | |
Affiliated Funds Sold | | 22,491 | |
Realized Net Gain (Loss) | | 22,491 | |
Change in Unrealized Appreciation (Depreciation) from Affiliated Funds | | 626,217 | |
Net Increase (Decrease) in Net Assets Resulting from Operations | | 1,063,797 | |
See accompanying Notes, which are an integral part of the Financial Statements.
9
Target Retirement Income Fund
Statement of Changes in Net Assets
| | Year Ended September 30, | |
| | 2019 | | 2018 | |
| | ($000 | ) | ($000 | ) |
Increase (Decrease) in Net Assets | | | | | |
Operations | | | | | |
Net Investment Income | | 415,089 | | 413,947 | |
Realized Net Gain (Loss) | | 22,491 | | 261,296 | |
Change in Unrealized Appreciation (Depreciation) | | 626,217 | | (139,267 | ) |
Net Increase (Decrease) in Net Assets Resulting from Operations | | 1,063,797 | | 535,976 | |
Distributions | | | | | |
Net Investment Income | | (425,968 | ) | (403,170 | ) |
Realized Capital Gain1 | | (230,195 | ) | (68,416 | ) |
Total Distributions | | (656,163 | ) | (471,586 | ) |
Capital Share Transactions | | | | | |
Issued | | 2,449,733 | | 2,962,286 | |
Issued in Lieu of Cash Distributions | | 627,398 | | 451,985 | |
Redeemed | | (3,114,349 | ) | (3,510,565 | ) |
Net Increase (Decrease) from Capital Share Transactions | | (37,218 | ) | (96,294 | ) |
Total Increase (Decrease) | | 370,416 | | (31,904 | ) |
Net Assets | | | | | |
Beginning of Period | | 16,613,092 | | 16,644,996 | |
End of Period | | 16,983,508 | | 16,613,092 | |
1 Includes fiscal 2019 and 2018 short-term gain distributions totaling $5,284,000 and $7,271,000, respectively. Short-term gain distributions are treated as ordinary income dividends for tax purposes.
See accompanying Notes, which are an integral part of the Financial Statements.
10
Target Retirement Income Fund
Financial Highlights
For a Share Outstanding | | Year Ended September 30, | |
Throughout Each Period | | 2019 | | 2018 | | 2017 | | 2016 | | 2015 | |
Net Asset Value, Beginning of Period | | $13.52 | | $13.46 | | $13.08 | | $12.59 | | $12.84 | |
Investment Operations | | | | | | | | | | | |
Net Investment Income | | .341 | 1 | .334 | 1 | .250 | 1 | .229 | | .238 | |
Capital Gain Distributions Received | | — | | .001 | 1 | .004 | 1 | .007 | | .015 | |
Net Realized and Unrealized Gain (Loss) on Investments | | .533 | | .107 | | .422 | | .692 | | (.225 | ) |
Total from Investment Operations | | .874 | | .442 | | .676 | | .928 | | .028 | |
Distributions | | | | | | | | | | | |
Dividends from Net Investment Income | | (.352 | ) | (.327 | ) | (.254 | ) | (.227 | ) | (.236 | ) |
Distributions from Realized Capital Gains | | (.192 | ) | (.055 | ) | (.042 | ) | (.211 | ) | (.042 | ) |
Total Distributions | | (.544 | ) | (.382 | ) | (.296 | ) | (.438 | ) | (.278 | ) |
Net Asset Value, End of Period | | $13.85 | | $13.52 | | $13.46 | | $13.08 | | $12.59 | |
| | | | | | | | | | | |
Total Return2 | | 6.75% | | 3.31% | | 5.26% | | 7.54% | | 0.18% | |
| | | | | | | | | | | |
Ratios/Supplemental Data | | | | | | | | | | | |
Net Assets, End of Period (Millions) | | $16,984 | | $16,613 | | $16,645 | | $10,790 | | $10,633 | |
Ratio of Total Expenses to Average Net Assets | | — | | — | | — | | — | | — | |
Acquired Fund Fees and Expenses | | 0.12% | | 0.12% | | 0.13% | | 0.13% | | 0.14% | |
Ratio of Net Investment Income to Average Net Assets | | 2.54% | | 2.47% | | 1.90% | | 1.78% | | 1.83% | |
Portfolio Turnover Rate | | 10% | | 6% | | 8% | | 11% | | 14% | |
1 Calculated based on average shares outstanding.
2 Total returns do not include account service fees that may have applied in the periods shown. Fund prospectuses provide information about any applicable account service fees.
See accompanying Notes, which are an integral part of the Financial Statements.
11
Target Retirement Income Fund
Notes to Financial Statements
Vanguard Target Retirement Income Fund is registered under the Investment Company Act of 1940 as an open-end investment company, or mutual fund. The fund follows a balanced investment strategy by investing in selected Vanguard funds to achieve its targeted allocation of assets to U.S. and international stocks, and U.S. and international bonds. Financial statements and other information about each underlying fund are available on vanguard.com.
A. The following significant accounting policies conform to generally accepted accounting principles for U.S. investment companies. The fund consistently follows such policies in preparing its financial statements.
1. Security Valuation: Investments are valued at the net asset value of each underlying Vanguard fund determined as of the close of the New York Stock Exchange (generally 4 p.m., Eastern time) on the valuation date.
2. Federal Income Taxes: The fund intends to continue to qualify as a regulated investment company and distribute all of its taxable income. Management has analyzed the fund’s tax positions taken for all open federal income tax years (September 30, 2016–2019), and has concluded that no provision for federal income tax is required in the fund’s financial statements.
3. Distributions: Distributions to shareholders are recorded on the ex-dividend date. Distributions are determined on a tax basis and may differ from net investment income and realized capital gains for financial reporting purposes.
4. Credit Facility: The fund and certain other funds managed by The Vanguard Group (“Vanguard”) participate in a $4.3 billion committed credit facility provided by a syndicate of lenders pursuant to a credit agreement that may be renewed annually; each fund is individually liable for its borrowings, if any, under the credit facility. Borrowings may be utilized for temporary and emergency purposes, and are subject to the fund’s regulatory and contractual borrowing restrictions. The participating funds are charged administrative fees and an annual commitment fee of 0.10% of the undrawn amount of the facility; these fees are allocated to the funds based on a method approved by the fund’s board of trustees and borne by the funds in which the fund invests (see Note B). Any borrowings under this facility bear interest at a rate based upon the higher of the one-month London Interbank Offered Rate, federal funds effective rate, or overnight bank funding rate plus an agreed-upon spread.
The fund had no borrowings outstanding at September 30, 2019, or at any time during the period then ended.
5. Other: Income and capital gain distributions received are recorded on the ex-dividend date. Security transactions are accounted for on the date securities are bought or sold. Costs used to determine realized gains (losses) on the sale of investment securities are those of the specific securities sold.
12
Target Retirement Income Fund
B. In accordance with the terms of a Funds’ Service Agreement (the “FSA”) between Vanguard and the fund, Vanguard furnishes to the fund investment advisory, corporate management, administrative, marketing, and distribution services at Vanguard’s cost of operations (as defined by the FSA). These costs of operations are allocated to the fund based on methods and guidelines approved by the board of trustees. The FSA provides that expenses otherwise allocable to Vanguard funds-of-funds may be reduced or eliminated to the extent of savings realized by the underlying Vanguard funds by virtue of being part of a fund-of-funds. Accordingly, all expenses for services provided by Vanguard to the fund and all other expenses incurred by the fund during the period ended September 30, 2019, were borne by the underlying Vanguard funds in which the fund invests. The fund’s trustees and officers are also trustees and officers, respectively, of the underlying Vanguard funds, as well as directors and employees, respectively, of Vanguard.
C. Various inputs may be used to determine the value of the fund’s investments. These inputs are summarized in three broad levels for financial statement purposes. The inputs or methodologies used to value securities are not necessarily an indication of the risk associated with investing in those securities.
Level 1—Quoted prices in active markets for identical securities.
Level 2—Other significant observable inputs (including quoted prices for similar securities, interest rates, prepayment speeds, credit risk, etc.).
Level 3—Significant unobservable inputs (including the fund’s own assumptions used to determine the fair value of investments). Any investments valued with significant unobservable inputs are noted on the Statement of Net Assets.
At September 30, 2019, 100% of the market value of the fund’s investments was determined based on Level 1 inputs.
D. Permanent differences between book-basis and tax-basis components of net assets are reclassified among capital accounts in the financial statements to reflect their tax character. These reclassifications have no effect on net assets or net asset value per share. As of period end, permanent differences primarily attributable to the accounting for distributions in connection with fund share redemptions were reclassified between the following accounts:
| | Amount | |
| | ($000 | ) |
Paid-in Capital | | 5,226 | |
Total Distributable Earnings (Loss) | | (5,226 | ) |
13
Target Retirement Income Fund
Temporary differences between book-basis and tax-basis components of total distributable earnings (loss) arise when certain items of income, gain, or loss are recognized in different periods for financial statement and tax purposes; these differences will reverse at some time in the future. The differences are primarily related to the tax deferral of losses on wash sales; and payables for distributions. As of period end, the tax-basis components of total distributable earnings (loss) are detailed in the table as follows:
| | Amount | |
| | ($000 | ) |
Undistributed Ordinary Income | | 28,153 | |
Undistributed Long-Term Gains | | — | |
Capital Loss Carryforwards (Non-expiring) | | — | |
Net Unrealized Gains (Losses) | | 3,073,719 | |
As of September 30, 2019, gross unrealized appreciation and depreciation for investments based on cost for U.S. federal income tax purposes were as follows:
| | Amount | |
| | ($000 | ) |
Tax Cost | | 13,910,515 | |
Gross Unrealized Appreciation | | 3,098,699 | |
Gross Unrealized Depreciation | | (24,980 | ) |
Net Unrealized Appreciation (Depreciation) | | 3,073,719 | |
E. Capital shares issued and redeemed were:
| | Year Ended September 30, | |
| | 2019 | | 2018 | |
| | Shares | | Shares | |
| | (000 | ) | (000 | ) |
Issued | | 182,664 | | 218,663 | |
Issued in Lieu of Cash Distributions | | 48,017 | | 33,394 | |
Redeemed | | (233,197 | ) | (259,138 | ) |
Net Increase (Decrease) in Shares Outstanding | | (2,516 | ) | (7,081 | ) |
14
Target Retirement Income Fund
F. Transactions during the period in affiliated underlying Vanguard funds were as follows:
| | | | Current Period Transactions | | |
| | Sept. 30, | | | Proceeds | Realized | | | | | Sept. 30, |
| | 2018 | | | from | Net | Change in | | Capital Gain | | 2019 |
| | Market | | Purchases | Securities | Gain | Unrealized | | Distributions | | Market |
| | Value | | at Cost | Sold | (Loss) | App. (Dep.) | Income | Received | | Value |
| | ($000 | ) | ($000) | ($000) | ($000) | ($000) | ($000) | ($000 | ) | ($000) |
Vanguard Market Liquidity Fund | | 2 | | NA1 | NA1 | (5) | — | 135 | — | | 4,215 |
Vanguard Short-Term Inflation-Protected Securities Index Fund | | 2,790,710 | | 169,604 | 175,389 | (4,083) | 41,054 | 52,596 | | | 2,821,896 |
Vanguard Total Bond Market II Index Fund | | 6,189,471 | | 505,293 | 820,039 | (16,435) | 445,027 | 173,273 | — | | 6,303,317 |
Vanguard Total International Bond Index Fund | | 2,646,629 | | 91,986 | 204,721 | 542 | 203,694 | 76,860 | — | | 2,738,130 |
Vanguard Total International Stock Index Fund | | 1,972,431 | | 252,370 | 132,265 | (3,221) | (77,129) | 58,436 | — | | 2,012,186 |
Vanguard Total Stock Market Index Fund | | 3,012,123 | | 612,123 | 579,020 | 45,693 | 13,571 | 53,789 | — | | 3,104,490 |
Total | | 16,611,366 | | 1,631,376 | 1,911,434 | 22,491 | 626,217 | 415,089 | — | | 16,984,234 |
1 Not applicable—purchases and sales are for temporary cash investment purposes.
G. Management has determined that no events or transactions occurred subsequent to September 30, 2019, that would require recognition or disclosure in these financial statements.
15
Target Retirement 2015 Fund
Performance Summary
All of the returns in this report represent past performance, which is not a guarantee of future results that may be achieved by the fund. (Current performance may be lower or higher than the performance data cited. For performance data current to the most recent month-end, visit our website at vanguard.com/performance.) Note, too, that both investment returns and principal value can fluctuate widely, so an investor’s shares, when sold, could be worth more or less than their original cost. The returns shown do not reflect taxes that a shareholder would pay on fund distributions or on the sale of fund shares.
Cumulative Performance: September 30, 2009, Through September 30, 2019
Initial Investment of $10,000
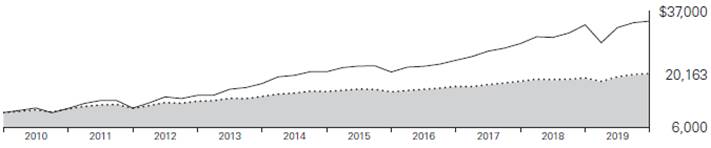
| | | | Average Annual Total Returns | | |
| | | | Periods Ended September 30, 2019 | | |
| | | | | | | | | | Final Value |
| | | | One | | Five | | Ten | | of a $10,000 |
| | | | Year | | Years | | Years | | Investment |

| | Target Retirement 2015 Fund | | 6.08% | | 5.33% | | 7.26% | | $20,163 |

| | Target 2015 Composite Index | | 6.17 | | 5.51 | | 7.40 | | 20,416 |

| | MSCI US Broad Market Index | | 2.91 | | 10.47 | | 13.15 | | 34,386 |
Target 2015 Composite Index: Derived by applying the fund’s target asset allocation to the results of the following benchmarks: for international stocks of developed markets, the MSCI EAFE Index through December 15, 2010, the MSCI ACWI ex USA IMI Index through June 2, 2013, and the FTSE Global All Cap ex US Index thereafter; for emerging-market stocks, the Select Emerging Markets Index through August 23, 2006, the MSCI Emerging Markets Index through December 15, 2010, the MSCI ACWI ex USA IMI Index through June 2, 2013, and the FTSE Global All Cap ex US Index thereafter; for U.S. bonds, the Bloomberg Barclays U.S. Aggregate Bond Index through December 31, 2009, and the Bloomberg Barclays U.S. Aggregate Float Adjusted Index thereafter, as well as the Bloomberg Barclays U.S. Treasury Inflation-Protected Securities Index through June 2, 2013, and the Bloomberg Barclays U.S. Treasury Inflation-Protected Securities (TIPS) 0–5 Year Index thereafter; for international bonds, the Bloomberg Barclays Global Aggregate ex-USD Float Adjusted RIC Capped Index Hedged beginning June 3, 2013; and for U.S. stocks, the Dow Jones U.S. Total Stock Market Index (formerly known as the Dow Jones Wilshire 5000 Index) through April 22, 2005, the MSCI US Broad Market Index through June 2, 2013, and the CRSP US Total Market Index thereafter. International stock benchmark returns are adjusted for withholding taxes.
See Financial Highlights for dividend and capital gains information.
16
Target Retirement 2015 Fund
Underlying Vanguard Funds
As of September 30, 2019
Vanguard Total Bond Market II Index Fund Investor Shares | | 34.1% |
Vanguard Total Stock Market Index Fund Investor Shares | | 22.7 |
Vanguard Total International Stock Index Fund Investor Shares | | 15.2 |
Vanguard Total International Bond Index Fund Investor Shares | | 15.0 |
Vanguard Short-Term Inflation-Protected Securities Index Fund Investor Shares | | 13.0 |
17
Target Retirement 2015 Fund
Financial Statements
Statement of Net Assets
As of September 30, 2019
The fund files its complete schedule of portfolio holdings with the Securities and Exchange Commission (SEC) for the first and third quarters of each fiscal year as an exhibit to its reports on Form N-PORT. The fund’s Form N-PORT reports are available on the SEC’s website at www.sec.gov.
| | | Market |
| | | Value· |
| Shares | | ($000) |
Investment Companies (100.0%) | | | |
U.S. Stock Fund (22.7%) | | | |
Vanguard Total Stock Market Index Fund Investor Shares | 48,263,224 | | 3,546,381 |
| | | |
International Stock Fund (15.2%) | | | |
Vanguard Total International Stock Index Fund Investor Shares | 143,151,610 | | 2,372,022 |
| | | |
U.S. Bond Funds (47.1%) | | | |
1 Vanguard Total Bond Market II Index Fund Investor Shares | 481,165,121 | | 5,331,310 |
Vanguard Short-Term Inflation-Protected Securities Index Fund Investor Shares | 83,093,361 | | 2,041,604 |
| | | 7,372,914 |
International Bond Fund (15.0%) | | | |
Vanguard Total International Bond Index Fund Investor Shares | 200,225,799 | | 2,354,655 |
Total Investment Companies (Cost $12,085,315) | | | 15,645,972 |
Temporary Cash Investment (0.0%) | | | |
Money Market Fund (0.0%) | | | |
1 Vanguard Market Liquidity Fund, 2.098% (Cost $10) | 96 | | 10 |
Total Investments (100.0%) (Cost $12,085,325) | | | 15,645,982 |
Other Assets and Liabilities (0.0%) | | | |
Other Assets | | | 39,641 |
Liabilities | | | (38,333) |
| | | 1,308 |
Net Assets (100%) | | | |
Applicable to 1,014,862,285 outstanding $.001 par value shares of beneficial interest (unlimited authorization) | | | 15,647,290 |
Net Asset Value Per Share | | | $15.42 |
18
Target Retirement 2015 Fund
| | Amount |
| | ($000) |
Statement of Assets and Liabilities | | |
Assets | | |
Investments in Securities, at Value—Affiliated Funds | | 15,645,982 |
Receivables for Investment Securities Sold | | 17,995 |
Receivables for Accrued Income | | 13,439 |
Receivables for Capital Shares Issued | | 8,207 |
Total Assets | | 15,685,623 |
Liabilities | | |
Payables for Investment Securities Purchased | | 13,389 |
Payables for Capital Shares Redeemed | | 16,924 |
Other Liabilities | | 8,020 |
Total Liabilities | | 38,333 |
Net Assets | | 15,647,290 |
At September 30, 2019, net assets consisted of:
| | Amount |
| | ($000) |
Paid-in Capital | | 11,561,378 |
Total Distributable Earnings (Loss) | | 4,085,912 |
Net Assets | | 15,647,290 |
· See Note A in Notes to Financial Statements.
1 Affiliated fund available only to Vanguard funds and certain trusts and accounts managed by Vanguard. Rate shown for Vanguard Market Liquidity Fund is the 7-day yield.
See accompanying Notes, which are an integral part of the Financial Statements.
19
Target Retirement 2015 Fund
Statement of Operations
| | Year Ended |
| | September 30, 2019 |
| | ($000) |
Investment Income | | |
Income | | |
Income Distributions Received from Affiliated Funds | | 393,734 |
Other Income | | 50 |
Net Investment Income—Note B | | 393,784 |
Realized Net Gain (Loss) | | |
Capital Gain Distributions Received from Affiliated Funds | | — |
Affiliated Funds Sold | | 354,227 |
Realized Net Gain (Loss) | | 354,227 |
Change in Unrealized Appreciation (Depreciation) from Affiliated Funds | | 144,719 |
Net Increase (Decrease) in Net Assets Resulting from Operations | | 892,730 |
See accompanying Notes, which are an integral part of the Financial Statements.
20
Target Retirement 2015 Fund
Statement of Changes in Net Assets
| | Year Ended September 30, |
| | 2019 | | 2018 |
| | ($000) | | ($000) |
Increase (Decrease) in Net Assets | | | | |
Operations | | | | |
Net Investment Income | | 393,784 | | 404,958 |
Realized Net Gain (Loss) | | 354,227 | | 752,181 |
Change in Unrealized Appreciation (Depreciation) | | 144,719 | | (394,093) |
Net Increase (Decrease) in Net Assets Resulting from Operations | | 892,730 | | 763,046 |
Distributions | | | | |
Net Investment Income | | (381,350) | | (344,563) |
Realized Capital Gain1 | | (655,589) | | (575,173) |
Total Distributions | | (1,036,939) | | (919,736) |
Capital Share Transactions | | | | |
Issued | | 1,965,353 | | 2,644,360 |
Issued in Lieu of Cash Distributions | | 1,009,506 | | 898,348 |
Redeemed | | (3,593,321) | | (4,226,220) |
Net Increase (Decrease) from Capital Share Transactions | | (618,462) | | (683,512) |
Total Increase (Decrease) | | (762,671) | | (840,202) |
Net Assets | | | | |
Beginning of Period | | 16,409,961 | | 17,250,163 |
End of Period | | 15,647,290 | | 16,409,961 |
1 Includes fiscal 2019 and 2018 short-term gain distributions totaling $6,053,000 and $0, respectively. Short-term gain distributions are treated as ordinary income dividends for tax purposes.
See accompanying Notes, which are an integral part of the Financial Statements.
21
Target Retirement 2015 Fund
Financial Highlights
For a Share Outstanding | | Year Ended September 30, |
Throughout Each Period | | 2019 | | 2018 | | 2017 | | 2016 | | 2015 |
Net Asset Value, Beginning of Period | | $15.60 | | $15.75 | | $15.19 | | $14.90 | | $15.44 |
Investment Operations | | | | | | | | | | |
Net Investment Income | | .376 | 1 | .371 | 1 | .305 | 1 | .311 | | .327 |
Capital Gain Distributions Received | | — | | .001 | 1 | .005 | 1 | .007 | | .018 |
Net Realized and Unrealized Gain (Loss) on Investments | | .455 | | .328 | | .846 | | .968 | | (.433) |
Total from Investment Operations | | .831 | | .700 | | 1.156 | | 1.286 | | (.088) |
Distributions | | | | | | | | | | |
Dividends from Net Investment Income | | (.372 | ) | (.318 | ) | (.289 | ) | (.299 | ) | (.284) |
Distributions from Realized Capital Gains | | (.639 | ) | (.532 | ) | (.307 | ) | (.697 | ) | (.168) |
Total Distributions | | (1.011 | ) | (.850 | ) | (.596 | ) | (.996 | ) | (.452) |
Net Asset Value, End of Period | | $15.42 | | $15.60 | | $15.75 | | $15.19 | | $14.90 |
| | | | | | | | | | |
Total Return2 | | 6.08% | | 4.54% | | 7.95% | | 9.03% | | -0.66% |
| | | | | | | | | | |
Ratios/Supplemental Data | | | | | | | | | | |
Net Assets, End of Period (Millions) | | $15,647 | | $16,410 | | $17,250 | | $17,479 | | $18,858 |
Ratio of Total Expenses to Average Net Assets | | — | | — | | — | | — | | — |
Acquired Fund Fees and Expenses | | 0.13% | | 0.13% | | 0.13% | | 0.14% | | 0.14% |
Ratio of Net Investment Income to Average Net Assets | | 2.52% | | 2.39% | | 2.02% | | 1.96% | | 1.95% |
Portfolio Turnover Rate | | 10% | | 7% | | 7% | | 9% | | 16% |
1 Calculated based on average shares outstanding.
2 Total returns do not include account service fees that may have applied in the periods shown. Fund prospectuses provide information about any applicable account service fees.
See accompanying Notes, which are an integral part of the Financial Statements.
22
Target Retirement 2015 Fund
Notes to Financial Statements
Vanguard Target Retirement 2015 Fund is registered under the Investment Company Act of 1940 as an open-end investment company, or mutual fund. The fund follows a balanced investment strategy by investing in selected Vanguard funds to achieve its targeted allocation of assets to U.S. and international stocks, and U.S. and international bonds. Financial statements and other information about each underlying fund are available on vanguard.com.
A. The following significant accounting policies conform to generally accepted accounting principles for U.S. investment companies. The fund consistently follows such policies in preparing its financial statements.
1. Security Valuation: Investments are valued at the net asset value of each underlying Vanguard fund determined as of the close of the New York Stock Exchange (generally 4 p.m., Eastern time) on the valuation date.
2. Federal Income Taxes: The fund intends to continue to qualify as a regulated investment company and distribute all of its taxable income. Management has analyzed the fund’s tax positions taken for all open federal income tax years (September 30, 2016–2019), and has concluded that no provision for federal income tax is required in the fund’s financial statements.
3. Distributions: Distributions to shareholders are recorded on the ex-dividend date. Distributions are determined on a tax basis and may differ from net investment income and realized capital gains for financial reporting purposes.
4. Credit Facility: The fund and certain other funds managed by The Vanguard Group (“Vanguard”) participate in a $4.3 billion committed credit facility provided by a syndicate of lenders pursuant to a credit agreement that may be renewed annually; each fund is individually liable for its borrowings, if any, under the credit facility. Borrowings may be utilized for temporary and emergency purposes, and are subject to the fund’s regulatory and contractual borrowing restrictions. The participating funds are charged administrative fees and an annual commitment fee of 0.10% of the undrawn amount of the facility; these fees are allocated to the funds based on a method approved by the fund’s board of trustees and borne by the funds in which the fund invests (see Note B). Any borrowings under this facility bear interest at a rate based upon the higher of the one-month London Interbank Offered Rate, federal funds effective rate, or overnight bank funding rate plus an agreed-upon spread.
The fund had no borrowings outstanding at September 30, 2019, or at any time during the period then ended.
5. Other: Income and capital gain distributions received are recorded on the ex-dividend date. Security transactions are accounted for on the date securities are bought or sold. Costs used to determine realized gains (losses) on the sale of investment securities are those of the specific securities sold.
23
Target Retirement 2015 Fund
B. In accordance with the terms of a Funds’ Service Agreement (the “FSA”) between Vanguard and the fund, Vanguard furnishes to the fund investment advisory, corporate management, administrative, marketing, and distribution services at Vanguard’s cost of operations (as defined by the FSA). These costs of operations are allocated to the fund based on methods and guidelines approved by the board of trustees. The FSA provides that expenses otherwise allocable to Vanguard funds-of-funds may be reduced or eliminated to the extent of savings realized by the underlying Vanguard funds by virtue of being part of a fund-of-funds. Accordingly, all expenses for services provided by Vanguard to the fund and all other expenses incurred by the fund during the period ended September 30, 2019, were borne by the underlying Vanguard funds in which the fund invests. The fund’s trustees and officers are also trustees and officers, respectively, of the underlying Vanguard funds, as well as directors and employees, respectively, of Vanguard.
C. Various inputs may be used to determine the value of the fund’s investments. These inputs are summarized in three broad levels for financial statement purposes. The inputs or methodologies used to value securities are not necessarily an indication of the risk associated with investing in those securities.
Level 1—Quoted prices in active markets for identical securities.
Level 2—Other significant observable inputs (including quoted prices for similar securities, interest rates, prepayment speeds, credit risk, etc.).
Level 3—Significant unobservable inputs (including the fund’s own assumptions used to determine the fair value of investments). Any investments valued with significant unobservable inputs are noted on the Statement of Net Assets.
At September 30, 2019, 100% of the market value of the fund’s investments was determined based on Level 1 inputs.
D. Permanent differences between book-basis and tax-basis components of net assets are reclassified among capital accounts in the financial statements to reflect their tax character. These reclassifications have no effect on net assets or net asset value per share. As of period end, permanent differences primarily attributable to the accounting for distributions in connection with fund share redemptions were reclassified between the following accounts:
| | Amount |
| | ($000) |
Paid-in Capital | | 38,554 |
Total Distributable Earnings (Loss) | | (38,554) |
24
Target Retirement 2015 Fund
Temporary differences between book-basis and tax-basis components of total distributable earnings (loss) arise when certain items of income, gain, or loss are recognized in different periods for financial statement and tax purposes; these differences will reverse at some time in the future. The differences are primarily related to the tax deferral of losses on wash sales. As of period end, the tax-basis components of total distributable earnings (loss) are detailed in the table as follows:
| | Amount |
| | ($000) |
Undistributed Ordinary Income | | 234,166 |
Undistributed Long-Term Gains | | 291,089 |
Capital Loss Carryforwards (Non-expiring) | | — |
Net Unrealized Gains (Losses) | | 3,560,657 |
As of September 30, 2019, gross unrealized appreciation and depreciation for investments based on cost for U.S. federal income tax purposes were as follows:
| | Amount |
| | ($000) |
Tax Cost | | 12,085,325 |
Gross Unrealized Appreciation | | 3,573,487 |
Gross Unrealized Depreciation | | (12,830) |
Net Unrealized Appreciation (Depreciation) | | 3,560,657 |
E. Capital shares issued and redeemed were:
| | Year Ended September 30, |
| | 2019 | | 2018 |
| | Shares | | Shares |
| | (000 | ) | (000) |
Issued | | 132,213 | | 169,901 |
Issued in Lieu of Cash Distributions | | 73,100 | | 58,562 |
Redeemed | | (242,220 | ) | (271,935) |
Net Increase (Decrease) in Shares Outstanding | | (36,907 | ) | (43,472) |
25
Target Retirement 2015 Fund
F. Transactions during the period in affiliated underlying Vanguard funds were as follows:
| | | | Current Period Transactions | | | |
| | Sept. 30, | | | | Proceeds | | Realized | | | | | | | | Sept. 30, | |
| | 2018 | | | | from | | Net | | Change in | | | | Capital Gain | | 2019 | |
| | Market | | Purchases | | Securities | | Gain | | Unrealized | | | | Distributions | | Market | |
| | Value | | at Cost | | Sold | | (Loss | ) | App. (Dep. | ) | Income | | Received | | Value | |
| | ($000 | ) | ($000 | ) | ($000 | ) | ($000 | ) | ($000 | ) | ($000 | ) | ($000 | ) | ($000 | ) |
Vanguard Market Liquidity Fund | | 3 | | NA1 | | NA1 | | (2 | ) | — | | 105 | | — | | 10 | |
Vanguard Short-Term Inflation-Protected Securities Index Fund | | 2,000,417 | | 150,847 | | 137,366 | | (1,538 | ) | 29,244 | | 38,056 | | — | | 2,041,604 | |
Vanguard Total Bond Market II Index Fund | | 5,441,759 | | 442,037 | | 920,796 | | (4,557 | ) | 372,867 | | 149,705 | | — | | 5,331,310 | |
Vanguard Total International Bond Index Fund | | 2,318,150 | | 78,658 | | 219,592 | | 5,264 | | 172,175 | | 67,458 | | — | | 2,354,655 | |
Vanguard Total International Stock Index Fund | | 2,652,203 | | 192,420 | | 355,546 | | 14,708 | | (131,763 | ) | 72,475 | | — | | 2,372,022 | |
Vanguard Total Stock Market Index Fund | | 3,998,603 | | 648,982 | | 1,143,752 | | 340,352 | | (297,804 | ) | 65,935 | | — | | 3,546,381 | |
Total | | 16,411,135 | | 1,512,944 | | 2,777,052 | | 354,227 | | 144,719 | | 393,734 | | — | | 15,645,982 | |
1 Not applicable—purchases and sales are for temporary cash investment purposes.
G. Management has determined that no events or transactions occurred subsequent to September 30, 2019, that would require recognition or disclosure in these financial statements.
26
Target Retirement 2020 Fund
Performance Summary
All of the returns in this report represent past performance, which is not a guarantee of future results that may be achieved by the fund. (Current performance may be lower or higher than the performance data cited. For performance data current to the most recent month-end, visit our website at vanguard.com/performance.) Note, too, that both investment returns and principal value can fluctuate widely, so an investor’s shares, when sold, could be worth more or less than their original cost. The returns shown do not reflect taxes that a shareholder would pay on fund distributions or on the sale of fund shares.
Cumulative Performance: September 30, 2009, Through September 30, 2019
Initial Investment of $10,000
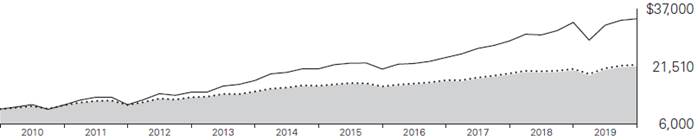
| | | | Average Annual Total Returns | | |
| | | | Periods Ended September 30, 2019 | | |
| | | | | | | | | | Final Value |
| | | | One | | Five | | Ten | | of a $10,000 |
| | | | Year | | Years | | Years | | Investment |

| | Target Retirement 2020 Fund | | 5.29% | | 5.97% | | 7.96% | | $21,510 |

| | Target 2020 Composite Index | | 5.45 | | 6.16 | | 8.19 | | 21,970 |

| | MSCI US Broad Market Index | | 2.91 | | 10.47 | | 13.15 | | 34,386 |
Target 2020 Composite Index: Derived by applying the fund’s target asset allocation to the results of the following benchmarks: for international stocks of developed markets, the MSCI EAFE Index through December 15, 2010, the MSCI ACWI ex USA IMI Index through June 2, 2013, and the FTSE Global All Cap ex US Index thereafter; for emerging-market stocks, the Select Emerging Markets Index through August 23, 2006, the MSCI Emerging Markets Index through December 15, 2010, the MSCI ACWI ex USA IMI Index through June 2, 2013, and the FTSE Global All Cap ex US Index thereafter; for U.S. bonds, the Bloomberg Barclays U.S. Aggregate Bond Index through December 31, 2009, and the Bloomberg Barclays U.S. Aggregate Float Adjusted Index thereafter; for international bonds, the Bloomberg Barclays Global Aggregate ex-USD Float Adjusted RIC Capped Index Hedged beginning June 3, 2013; and for U.S. stocks, the MSCI US Broad Market Index through June 2, 2013, and the CRSP US Total Market Index thereafter. International stock benchmark returns are adjusted for withholding taxes.
See Financial Highlights for dividend and capital gains information.
27
Target Retirement 2020 Fund
Underlying Vanguard Funds
As of September 30, 2019
Vanguard Total Stock Market Index Fund Investor Shares | | 30.9% |
Vanguard Total Bond Market II Index Fund Investor Shares | | 29.2 |
Vanguard Total International Stock Index Fund Investor Shares | | 20.6 |
Vanguard Total International Bond Index Fund Investor Shares | | 12.8 |
Vanguard Short-Term Inflation-Protected Securities Index Fund Investor Shares | | 6.5 |
28
Target Retirement 2020 Fund
Financial Statements
Statement of Net Assets
As of September 30, 2019
The fund files its complete schedule of portfolio holdings with the Securities and Exchange Commission (SEC) for the first and third quarters of each fiscal year as an exhibit to its reports on Form N-PORT. The fund’s Form N-PORT reports are available on the SEC’s website at www.sec.gov.
| | | | Market | |
| | | | Value· | |
| | Shares | | ($000 | ) |
Investment Companies (100.1%) | | | | | |
U.S. Stock Fund (30.8%) | | | | | |
Vanguard Total Stock Market Index Fund Investor Shares | | 137,470,597 | | 10,101,340 | |
| | | | | |
International Stock Fund (20.7%) | | | | | |
Vanguard Total International Stock Index Fund Investor Shares | | 408,557,900 | | 6,769,805 | |
| | | | | |
U.S. Bond Funds (35.8%) | | | | | |
1 Vanguard Total Bond Market II Index Fund Investor Shares | | 864,540,974 | | 9,579,114 | |
Vanguard Short-Term Inflation-Protected Securities Index Fund Investor Shares | | 87,340,462 | | 2,145,955 | |
| | | | 11,725,069 | |
International Bond Fund (12.8%) | | | | | |
Vanguard Total International Bond Index Fund Investor Shares | | 358,115,574 | | 4,211,439 | |
Total Investment Companies (Cost $24,747,832) | | | | 32,807,653 | |
Temporary Cash Investment (0.0%) | | | | | |
Money Market Fund (0.0%) | | | | | |
1 Vanguard Market Liquidity Fund, 2.098% (Cost $7,708) | | 77,076 | | 7,708 | |
Total Investments (100.1%) (Cost $24,755,540) | | | | 32,815,361 | |
Other Assets and Liabilities (-0.1%) | | | | | |
Other Assets | | | | 45,259 | |
Liabilities | | | | (71,015 | ) |
| | | | (25,756 | ) |
Net Assets (100%) | | | | | |
Applicable to 1,016,898,680 outstanding $.001 par value shares of beneficial interest (unlimited authorization) | | | | 32,789,605 | |
Net Asset Value Per Share | | | | $32.24 | |
29
Target Retirement 2020 Fund
| | Amount | |
| | ($000 | ) |
Statement of Assets and Liabilities | | | |
Assets | | | |
Investments in Securities, at Value—Affiliated Funds | | 32,815,361 | |
Receivables for Accrued Income | | 24,058 | |
Receivables for Capital Shares Issued | | 21,201 | |
Total Assets | | 32,860,620 | |
Liabilities | | | |
Payables for Investment Securities Purchased | | 33,857 | |
Payables for Capital Shares Redeemed | | 37,158 | |
Total Liabilities | | 71,015 | |
Net Assets | | 32,789,605 | |
| | | |
At September 30, 2019, net assets consisted of: | | | |
| | Amount | |
| | ($000 | ) |
Paid-in Capital | | 23,960,907 | |
Total Distributable Earnings (Loss) | | 8,828,698 | |
Net Assets | | 32,789,605 | |
· | See Note A in Notes to Financial Statements. |
| |
1 | Affiliated fund available only to Vanguard funds and certain trusts and accounts managed by Vanguard. Rate shown for Vanguard Market Liquidity Fund is the 7-day yield. |
See accompanying Notes, which are an integral part of the Financial Statements.
30
Target Retirement 2020 Fund
Statement of Operations
| | Year Ended | |
| | September 30, 2019 | |
| | ($000 | ) |
Investment Income | | | |
Income | | | |
Income Distributions Received from Affiliated Funds | | 802,676 | |
Other Income | | 97 | |
Net Investment Income – Note B | | 802,773 | |
Realized Net Gain (Loss) | | | |
Capital Gain Distributions Received from Affiliated Funds | | — | |
Affiliated Funds Sold | | 344,747 | |
Futures Contracts | | (68 | ) |
Realized Net Gain (Loss) | | 344,679 | |
Change in Unrealized Appreciation (Depreciation) from Affiliated Funds | | 476,788 | |
Net Increase (Decrease) in Net Assets Resulting from Operations | | 1,624,240 | |
See accompanying Notes, which are an integral part of the Financial Statements.
31
Target Retirement 2020 Fund
Statement of Changes in Net Assets
| | Year Ended September 30, | |
| | 2019 | | 2018 | |
| | ($000 | ) | ($000 | ) |
Increase (Decrease) in Net Assets | | | | | |
Operations | | | | | |
Net Investment Income | | 802,773 | | 751,364 | |
Realized Net Gain (Loss) | | 344,679 | | 742,599 | |
Change in Unrealized Appreciation (Depreciation) | | 476,788 | | 351,099 | |
Net Increase (Decrease) in Net Assets Resulting from Operations | | 1,624,240 | | 1,845,062 | |
Distributions | | | | | |
Net Investment Income | | (754,360 | ) | (641,685 | ) |
Realized Capital Gain1 | | (677,191 | ) | (232,702 | ) |
Total Distributions | | (1,431,551 | ) | (874,387 | ) |
Capital Share Transactions | | | | | |
Issued | | 5,598,664 | | 7,270,038 | |
Issued in Lieu of Cash Distributions | | 1,402,515 | | 859,230 | |
Redeemed | | (7,517,881 | ) | (7,248,867 | ) |
Net Increase (Decrease) from Capital Share Transactions | | (516,702 | ) | 880,401 | |
Total Increase (Decrease) | | (324,013 | ) | 1,851,076 | |
Net Assets | | | | | |
Beginning of Period | | 33,113,618 | | 31,262,542 | |
End of Period | | 32,789,605 | | 33,113,618 | |
1 | Includes fiscal 2019 and 2018 short-term gain distributions totaling $14,887,000 and $12,707,000, respectively. Short-term gain distributions are treated as ordinary income dividends for tax purposes. |
See accompanying Notes, which are an integral part of the Financial Statements.
32
Target Retirement 2020 Fund
Financial Highlights
For a Share Outstanding | Year Ended September 30, | |
Throughout Each Period | 2019 | | 2018 | | 2017 | | 2016 | | 2015 | |
Net Asset Value, Beginning of Period | $32.14 | | $31.19 | | $29.09 | | $27.52 | | $28.40 | |
Investment Operations | | | | | | | | | | |
Net Investment Income | .778 | 1 | .729 | 1 | .636 | 1 | .619 | | .622 | |
Capital Gain Distributions Received | — | | .002 | 1 | .008 | 1 | .012 | | .026 | |
Net Realized and Unrealized Gain (Loss) on Investments | .736 | | 1.079 | | 2.231 | | 2.065 | | (.946 | ) |
Total from Investment Operations | 1.514 | | 1.810 | | 2.875 | | 2.696 | | (.298 | ) |
Distributions | | | | | | | | | | |
Dividends from Net Investment Income | (.745 | ) | (.631 | ) | (.562 | ) | (.591 | ) | (.541 | ) |
Distributions from Realized Capital Gains | (.669 | ) | (.229 | ) | (.213 | ) | (.535 | ) | (.041 | ) |
Total Distributions | (1.414 | ) | (.860 | ) | (.775 | ) | (1.126 | ) | (.582 | ) |
Net Asset Value, End of Period | $32.24 | | $32.14 | | $31.19 | | $29.09 | | $27.52 | |
| | | | | | | | | | |
Total Return2 | 5.29% | | 5.87% | | 10.17% | | 10.05% | | -1.13% | |
| | | | | | | | | | |
Ratios/Supplemental Data | | | | | | | | | | |
Net Assets, End of Period (Millions) | $32,790 | | $33,114 | | $31,263 | | $27,542 | | $26,693 | |
Ratio of Total Expenses to Average Net Assets | — | | — | | — | | — | | — | |
Acquired Fund Fees and Expenses | 0.13% | | 0.13% | | 0.13% | | 0.14% | | 0.14% | |
Ratio of Net Investment Income to Average Net Assets | 2.51% | | 2.30% | | 2.15% | | 2.14% | | 2.07% | |
Portfolio Turnover Rate | 13% | | 10% | | 9% | | 15% | | 25% | |
1 | Calculated based on average shares outstanding. |
| |
2 | Total returns do not include account service fees that may have applied in the periods shown. Fund prospectuses provide information about any applicable account service fees. |
See accompanying Notes, which are an integral part of the Financial Statements.
33
Target Retirement 2020 Fund
Notes to Financial Statements
Vanguard Target Retirement 2020 Fund is registered under the Investment Company Act of 1940 as an open-end investment company, or mutual fund. The fund follows a balanced investment strategy by investing in selected Vanguard funds to achieve its targeted allocation of assets to U.S. and international stocks, and U.S. and international bonds. Financial statements and other information about each underlying fund are available on vanguard.com.
A. The following significant accounting policies conform to generally accepted accounting principles for U.S. investment companies. The fund consistently follows such policies in preparing its financial statements.
1. Security Valuation: Investments are valued at the net asset value of each underlying Vanguard fund determined as of the close of the New York Stock Exchange (generally 4 p.m., Eastern time) on the valuation date.
2. Futures Contracts: The fund uses stock and bond futures contracts to a limited extent, with the objectives of maintaining full exposure to the market and maintaining its target asset allocation. The primary risks associated with the use of futures contracts are imperfect correlation between changes in market values of investments held by the fund and the prices of futures contracts, and the possibility of an illiquid market. Counterparty risk involving futures is mitigated because a regulated clearinghouse is the counterparty instead of the clearing broker. To further mitigate counterparty risk, the fund trades futures contracts on an exchange, monitors the financial strength of its clearing brokers and clearinghouse, and has entered into clearing agreements with its clearing brokers. The clearinghouse imposes initial margin requirements to secure the fund’s performance and requires daily settlement of variation margin representing changes in the market value of each contract. Any assets pledged as initial margin for open contracts are noted in the Statement of Net Assets.
Futures contracts are valued at their quoted daily settlement prices. The notional amounts of the contracts are not recorded in the Statement of Net Assets. Fluctuations in the value of the contracts are recorded in the Statement of Assets and Liabilities as an asset (liability) and in the Statement of Operations as unrealized appreciation (depreciation) until the contracts are closed, when they are recorded as realized futures gains (losses).
During the year ended September 30, 2019, the fund’s average investments in long and short futures contracts represented less than 1% and 0% of net assets, respectively, based on the average of the notional amounts at each quarter-end during the period. The fund had no open futures contracts at September 30, 2019.
3. Federal Income Taxes: The fund intends to continue to qualify as a regulated investment company and distribute all of its taxable income. Management has analyzed the fund’s tax positions taken for all open federal income tax years (September 30, 2016–2019), and has concluded that no provision for federal income tax is required in the fund’s financial statements.
4. Distributions: Distributions to shareholders are recorded on the ex-dividend date. Distributions are determined on a tax basis and may differ from net investment income and realized capital gains for financial reporting purposes.
34
Target Retirement 2020 Fund
5. Credit Facility: The fund and certain other funds managed by The Vanguard Group (“Vanguard”) participate in a $4.3 billion committed credit facility provided by a syndicate of lenders pursuant to a credit agreement that may be renewed annually; each fund is individually liable for its borrowings, if any, under the credit facility. Borrowings may be utilized for temporary and emergency purposes, and are subject to the fund’s regulatory and contractual borrowing restrictions. The participating funds are charged administrative fees and an annual commitment fee of 0.10% of the undrawn amount of the facility; these fees are allocated to the funds based on a method approved by the fund’s board of trustees and borne by the funds in which the fund invests (see Note B). Any borrowings under this facility bear interest at a rate based upon the higher of the one-month London Interbank Offered Rate, federal funds effective rate, or overnight bank funding rate plus an agreed-upon spread.
The fund had no borrowings outstanding at September 30, 2019, or at any time during the period then ended.
6. Other: Income and capital gain distributions received are recorded on the ex-dividend date. Security transactions are accounted for on the date securities are bought or sold. Costs used to determine realized gains (losses) on the sale of investment securities are those of the specific securities sold.
B. In accordance with the terms of a Funds’ Service Agreement (the “FSA”) between Vanguard and the fund, Vanguard furnishes to the fund investment advisory, corporate management, administrative, marketing, and distribution services at Vanguard’s cost of operations (as defined by the FSA). These costs of operations are allocated to the fund based on methods and guidelines approved by the board of trustees. The FSA provides that expenses otherwise allocable to Vanguard funds-of-funds may be reduced or eliminated to the extent of savings realized by the underlying Vanguard funds by virtue of being part of a fund-of-funds. Accordingly, all expenses for services provided by Vanguard to the fund and all other expenses incurred by the fund during the period ended September 30, 2019, were borne by the underlying Vanguard funds in which the fund invests. The fund’s trustees and officers are also trustees and officers, respectively, of the underlying Vanguard funds, as well as directors and employees, respectively, of Vanguard.
C. Various inputs may be used to determine the value of the fund’s investments. These inputs are summarized in three broad levels for financial statement purposes. The inputs or methodologies used to value securities are not necessarily an indication of the risk associated with investing in those securities.
Level 1—Quoted prices in active markets for identical securities.
Level 2—Other significant observable inputs (including quoted prices for similar securities, interest rates, prepayment speeds, credit risk, etc.).
Level 3—Significant unobservable inputs (including the fund’s own assumptions used to determine the fair value of investments). Any investments valued with significant unobservable inputs are noted on the Statement of Net Assets.
At September 30, 2019, 100% of the market value of the fund’s investments was determined based on Level 1 inputs.
35
Target Retirement 2020 Fund
D. Permanent differences between book-basis and tax-basis components of net assets are reclassified among capital accounts in the financial statements to reflect their tax character. These reclassifications have no effect on net assets or net asset value per share. As of period end, permanent differences primarily attributable to the accounting for distributions in connection with fund share redemptions were reclassified between the following accounts:
| | Amount | |
| | ($000 | ) |
Paid-in Capital | | 52,878 | |
Total Distributable Earnings (Loss) | | (52,878 | ) |
Temporary differences between book-basis and tax-basis components of total distributable earnings (loss) arise when certain items of income, gain, or loss are recognized in different periods for financial statement and tax purposes; these differences will reverse at some time in the future. The differences are primarily related to the tax deferral of losses on wash sales. As of period end, the tax-basis components of total distributable earnings (loss) are detailed in the table as follows:
| | Amount | |
| | ($000 | ) |
Undistributed Ordinary Income | | 491,659 | |
Undistributed Long-Term Gains | | 277,218 | |
Capital Loss Carryforwards (Non-expiring) | | — | |
Net Unrealized Gains (Losses) | | 8,059,821 | |
As of September 30, 2019, gross unrealized appreciation and depreciation for investments based on cost for U.S. federal income tax purposes were as follows:
| | | | Amount | |
| | | | ($000 | ) |
Tax Cost | | | | 24,755,540 | |
Gross Unrealized Appreciation | | | | 8,068,823 | |
Gross Unrealized Depreciation | | | | (9,002 | ) |
Net Unrealized Appreciation (Depreciation) | | | | 8,059,821 | |
| | | | | |
E. Capital shares issued and redeemed were: | | | | | |
| | Year Ended September 30, | |
| | 2019 | | 2018 | |
| | Shares | | Shares | |
| | (000 | ) | (000 | ) |
Issued | | 181,093 | | 229,558 | |
Issued in Lieu of Cash Distributions | | 49,211 | | 27,347 | |
Redeemed | | (243,796 | ) | (228,859 | ) |
Net Increase (Decrease) in Shares Outstanding | | (13,492 | ) | 28,046 | |
36
Target Retirement 2020 Fund
F. Transactions during the period in affiliated underlying Vanguard funds were as follows:
| | | | Current Period Transactions | | |
| | Sept. 30, | | | | Proceeds | | Realized | | | | | | | | Sept. 30, |
| | 2018 | | | | from | | Net | | Change in | | | | Capital Gain | | 2019 |
| | Market | | Purchases | | Securities | | Gain | | Unrealized | | | | Distributions | | Market |
| | Value | | at Cost | | Sold | | (Loss | ) | App. (Dep. | ) | Income | | Received | | Value |
| | ($000 | ) | ($000 | ) | ($000 | ) | ($000 | ) | ($000 | ) | ($000 | ) | ($000 | ) | ($000) |
Vanguard Market Liquidity Fund | | 1 | | NA1 | | NA1 | | 1 | | — | | 119 | | — | | 7,708 |
Vanguard Short-Term Inflation-Protected Securities Index Fund | | 1,773,964 | | 479,612 | | 135,409 | | (65 | ) | 27,853 | | 37,703 | | — | | 2,145,955 |
Vanguard Total Bond Market II Index Fund | | 9,567,933 | | 1,303,259 | | 1,947,524 | | (30,235 | ) | 685,681 | | 264,908 | | — | | 9,579,114 |
Vanguard Total International Bond Index Fund | | 4,044,384 | | 204,239 | | 348,725 | | (1,126 | ) | 312,667 | | 118,439 | | — | | 4,211,439 |
Vanguard Total International Stock Index Fund | | 7,061,776 | | 624,433 | | 606,987 | | (28,855 | ) | (280,562 | ) | 200,254 | | — | | 6,769,805 |
Vanguard Total Stock Market Index Fund | | 10,662,039 | | 1,433,217 | | 2,130,092 | | 405,027 | | (268,851 | ) | 181,253 | | — | | 10,101,340 |
Total | | 33,110,097 | | 4,044,760 | | 5,168,737 | | 344,747 | | 476,788 | | 802,676 | | — | | 32,815,361 |
1 | Not applicable—purchases and sales are for temporary cash investment purposes. |
G. Management has determined that no events or transactions occurred subsequent to September 30, 2019, that would require recognition or disclosure in these financial statements.
37
Target Retirement 2025 Fund
Performance Summary
All of the returns in this report represent past performance, which is not a guarantee of future results that may be achieved by the fund. (Current performance may be lower or higher than the performance data cited. For performance data current to the most recent month-end, visit our website at vanguard.com/performance.) Note, too, that both investment returns and principal value can fluctuate widely, so an investor’s shares, when sold, could be worth more or less than their original cost. The returns shown do not reflect taxes that a shareholder would pay on fund distributions or on the sale of fund shares.
Cumulative Performance: September 30, 2009, Through September 30, 2019
Initial Investment of $10,000
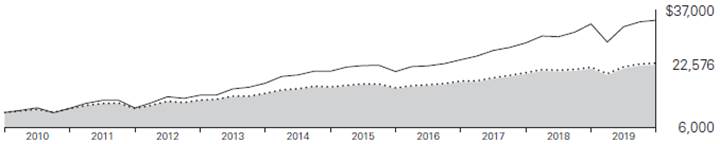
| | Average Annual Total Returns | | |
| | Periods Ended September 30, 2019 | | |
| | | | | | Final Value |
| | One | Five | Ten | | of a $10,000 |
| | Year | Years | Years | | Investment |

| Target Retirement 2025 Fund | | 4.89% | 6.39% | 8.48% | | $22,576 |

| Target 2025 Composite Index | | 5.02 | 6.58 | 8.71 | | 23,055 |

| MSCI US Broad Market Index | | 2.91 | 10.47 | 13.15 | | 34,386 |
Target 2025 Composite Index: Derived by applying the fund’s target asset allocation to the results of the following benchmarks: for international stocks of developed markets, the MSCI EAFE Index through December 15, 2010, the MSCI ACWI ex USA IMI Index through June 2, 2013, and the FTSE Global All Cap ex US Index thereafter; for emerging-market stocks, the Select Emerging Markets Index through August 23, 2006, the MSCI Emerging Markets Index through December 15, 2010, the MSCI ACWI ex USA IMI Index through June 2, 2013, and the FTSE Global All Cap ex US Index thereafter; for U.S. bonds, the Bloomberg Barclays U.S. Aggregate Bond Index through December 31, 2009, and the Bloomberg Barclays U.S. Aggregate Float Adjusted Index thereafter; for international bonds, the Bloomberg Barclays Global Aggregate ex-USD Float Adjusted RIC Capped Index Hedged beginning June 3, 2013; and for U.S. stocks, the Dow Jones U.S. Total Stock Market Index (formerly known as the Dow Jones Wilshire 5000 Index) through April 22, 2005, the MSCI US Broad Market Index through June 2, 2013, and the CRSP US Total Market Index thereafter. International stock benchmark returns are adjusted for withholding taxes.
See Financial Highlights for dividend and capital gains information.
38
Target Retirement 2025 Fund
Underlying Vanguard Funds
As of September 30, 2019
Vanguard Total Stock Market Index Fund Investor Shares | | 36.7% |
Vanguard Total Bond Market II Index Fund Investor Shares | | 27.3 |
Vanguard Total International Stock Index Fund Investor Shares | | 24.4 |
Vanguard Total International Bond Index Fund Investor Shares | | 11.6 |
39
Target Retirement 2025 Fund
Financial Statements
Statement of Net Assets
As of September 30, 2019
The fund files its complete schedule of portfolio holdings with the Securities and Exchange Commission (SEC) for the first and third quarters of each fiscal year as an exhibit to its reports on Form N-PORT. The fund’s Form N-PORT reports are available on the SEC’s website at www.sec.gov.
| | | | Market | |
| | | | Value· | |
| | Shares | | ($000 | ) |
Investment Companies (100.0%) | | | | | |
U.S. Stock Fund (36.7%) | | | | | |
Vanguard Total Stock Market Index Fund Investor Shares | | 220,732,650 | | 16,219,435 | |
| | | | | |
International Stock Fund (24.4%) | | | | | |
Vanguard Total International Stock Index Fund Investor Shares | | 651,256,103 | | 10,791,314 | |
| | | | | |
U.S. Bond Fund (27.3%) | | | | | |
1 Vanguard Total Bond Market II Index Fund Investor Shares | | 1,086,529,782 | | 12,038,750 | |
| | | | | |
International Bond Fund (11.6%) | | | | | |
Vanguard Total International Bond Index Fund Investor Shares | | 434,236,586 | | 5,106,622 | |
Total Investment Companies (Cost $32,071,245) | | | | 44,156,121 | |
Temporary Cash Investment (0.1%) | | | | | |
Money Market Fund (0.1%) | | | | | |
1 Vanguard Market Liquidity Fund, 2.098% (Cost $23,148) | | 231,462 | | 23,149 | |
Total Investments (100.1%) (Cost $32,094,393) | | | | 44,179,270 | |
Other Assets and Liabilities (-0.1%) | | | | | |
Other Assets | | | | 63,488 | |
Liabilities | | | | (96,670 | ) |
| | | | (33,182 | ) |
Net Assets (100%) | | | | | |
Applicable to 2,283,035,692 outstanding $.001 par value shares of beneficial interest (unlimited authorization) | | | | 44,146,088 | |
Net Asset Value Per Share | | | | $19.34 | |
40
Target Retirement 2025 Fund
| | Amount | |
| | ($000 | ) |
Statement of Assets and Liabilities | | | |
Assets | | | |
Investments in Securities, at Value—Affiliated Funds | | 44,179,270 | |
Receivables for Investment Securities Sold | | 11,000 | |
Receivables for Accrued Income | | 30,123 | |
Receivables for Capital Shares Issued | | 22,365 | |
Total Assets | | 44,242,758 | |
Liabilities | | | |
Payables for Investment Securities Purchased | | 46,780 | |
Payables for Capital Shares Redeemed | | 49,890 | |
Total Liabilities | | 96,670 | |
Net Assets | | 44,146,088 | |
| | | |
At September 30, 2019, net assets consisted of: | | | |
| | | |
| | Amount | |
| | ($000 | ) |
Paid-in Capital | | 31,328,458 | |
Total Distributable Earnings (Loss) | | 12,817,630 | |
Net Assets | | 44,146,088 | |
· | See Note A in Notes to Financial Statements. |
| |
1 | Affiliated fund available only to Vanguard funds and certain trusts and accounts managed by Vanguard. Rate shown for Vanguard Market Liquidity Fund is the 7-day yield. |
See accompanying Notes, which are an integral part of the Financial Statements.
41
Target Retirement 2025 Fund
Statement of Operations
| | Year Ended | |
| | September 30, 2019 | |
| | ($000 | ) |
Investment Income | | | |
Income | | | |
Income Distributions Received from Affiliated Funds | | 1,043,536 | |
Other Income | | 221 | |
Net Investment Income — Note B | | 1,043,757 | |
Realized Net Gain (Loss) | | | |
Capital Gain Distributions Received from Affiliated Funds | | — | |
Affiliated Funds Sold | | 93,854 | |
Futures Contracts | | (83 | ) |
Realized Net Gain (Loss) | | 93,771 | |
Change in Unrealized Appreciation (Depreciation) from Affiliated Funds | | 865,279 | |
Net Increase (Decrease) in Net Assets Resulting from Operations | | 2,002,807 | |
See accompanying Notes, which are an integral part of the Financial Statements.
42
Target Retirement 2025 Fund
Statement of Changes in Net Assets
| | Year Ended September 30, | |
| | 2019 | | 2018 | |
| | ($000 | ) | ($000 | ) |
Increase (Decrease) in Net Assets | | | | | |
Operations | | | | | |
Net Investment Income | | 1,043,757 | | 898,441 | |
Realized Net Gain (Loss) | | 93,771 | | 229,180 | |
Change in Unrealized Appreciation (Depreciation) | | 865,279 | | 1,462,402 | |
Net Increase (Decrease) in Net Assets Resulting from Operations | | 2,002,807 | | 2,590,023 | |
Distributions | | | | | |
Net Investment Income | | (953,869 | ) | (768,518 | ) |
Realized Capital Gain1 | | (220,293 | ) | (182,505 | ) |
Total Distributions | | (1,174,162 | ) | (951,023 | ) |
Capital Share Transactions | | | | | |
Issued | | 7,794,924 | | 9,267,239 | |
Issued in Lieu of Cash Distributions | | 1,152,542 | | 935,571 | |
Redeemed | | (7,489,764 | ) | (7,093,003 | ) |
Net Increase (Decrease) from Capital Share Transactions | | 1,457,702 | | 3,109,807 | |
Total Increase (Decrease) | | 2,286,347 | | 4,748,807 | |
Net Assets | | | | | |
Beginning of Period | | 41,859,741 | | 37,110,934 | |
End of Period | | 44,146,088 | | 41,859,741 | |
1 | Includes fiscal 2019 and 2018 short-term gain distributions totaling $82,582,000 and $21,642,000, respectively. Short-term gain distributions are treated as ordinary income dividends for tax purposes. |
See accompanying Notes, which are an integral part of the Financial Statements.
43
Target Retirement 2025 Fund
Financial Highlights
For a Share Outstanding | Year Ended September 30, | |
Throughout Each Period | 2019 | | 2018 | | 2017 | | 2016 | | 2015 | |
Net Asset Value, Beginning of Period | $19.02 | | $18.25 | | $16.77 | | $15.90 | | $16.50 | |
Investment Operations | | | | | | | | | | |
Net Investment Income | .464 | 1 | .419 | 1 | .380 | 1 | .362 | | .364 | |
Capital Gain Distributions Received | — | | .001 | 1 | .004 | 1 | .006 | | .012 | |
Net Realized and Unrealized Gain (Loss) on Investments | .390 | | .807 | | 1.534 | | 1.280 | | (.624 | ) |
Total from Investment Operations | .854 | | 1.227 | | 1.918 | | 1.648 | | (.248 | ) |
Distributions | | | | | | | | | | |
Dividends from Net Investment Income | (.434 | ) | (.369 | ) | (.327 | ) | (.342 | ) | (.322 | ) |
Distributions from Realized Capital Gains | (.100 | ) | (.088 | ) | (.111 | ) | (.436 | ) | (.030 | ) |
Total Distributions | (.534 | ) | (.457 | ) | (.438 | ) | (.778 | ) | (.352 | ) |
Net Asset Value, End of Period | $19.34 | | $19.02 | | $18.25 | | $16.77 | | $15.90 | |
| | | | | | | | | | |
Total Return2 | 4.89% | | 6.79% | | 11.74% | | 10.67% | | -1.60% | |
| | | | | | | | | | |
Ratios/Supplemental Data | | | | | | | | | | |
Net Assets, End of Period (Millions) | $44,146 | | $41,860 | | $37,111 | | $31,706 | | $30,048 | |
Ratio of Total Expenses to Average Net Assets | — | | — | | — | | — | | — | |
Acquired Fund Fees and Expenses | 0.13% | | 0.13% | | 0.14% | | 0.14% | | 0.15% | |
Ratio of Net Investment Income to Average Net Assets | 2.51% | | 2.24% | | 2.21% | | 2.18% | | 2.07% | |
Portfolio Turnover Rate | 11% | | 8% | | 10% | | 15% | | 24% | |
1 | Calculated based on average shares outstanding. |
| |
2 | Total returns do not include account service fees that may have applied in the periods shown. Fund prospectuses provide information about any applicable account service fees. |
See accompanying Notes, which are an integral part of the Financial Statements.
44
Target Retirement 2025 Fund
Notes to Financial Statements
Vanguard Target Retirement 2025 Fund is registered under the Investment Company Act of 1940 as an open-end investment company, or mutual fund. The fund follows a balanced investment strategy by investing in selected Vanguard funds to achieve its targeted allocation of assets to U.S. and international stocks, and U.S. and international bonds. Financial statements and other information about each underlying fund are available on vanguard.com.
A. The following significant accounting policies conform to generally accepted accounting principles for U.S. investment companies. The fund consistently follows such policies in preparing its financial statements.
1. Security Valuation: Investments are valued at the net asset value of each underlying Vanguard fund determined as of the close of the New York Stock Exchange (generally 4 p.m., Eastern time) on the valuation date.
2. Futures Contracts: The fund uses stock and bond futures contracts to a limited extent, with the objectives of maintaining full exposure to the market and maintaining its target asset allocation. The primary risks associated with the use of futures contracts are imperfect correlation between changes in market values of investments held by the fund and the prices of futures contracts, and the possibility of an illiquid market. Counterparty risk involving futures is mitigated because a regulated clearinghouse is the counterparty instead of the clearing broker. To further mitigate counterparty risk, the fund trades futures contracts on an exchange, monitors the financial strength of its clearing brokers and clearinghouse, and has entered into clearing agreements with its clearing brokers. The clearinghouse imposes initial margin requirements to secure the fund’s performance and requires daily settlement of variation margin representing changes in the market value of each contract. Any assets pledged as initial margin for open contracts are noted in the Statement of Net Assets.
Futures contracts are valued at their quoted daily settlement prices. The notional amounts of the contracts are not recorded in the Statement of Net Assets. Fluctuations in the value of the contracts are recorded in the Statement of Assets and Liabilities as an asset (liability) and in the Statement of Operations as unrealized appreciation (depreciation) until the contracts are closed, when they are recorded as realized futures gains (losses).
During the year ended September 30, 2019, the fund’s average investments in long and short futures contracts represented less than 1% and 0% of net assets, respectively, based on the average of the notional amounts at each quarter-end during the period. The fund had no open futures contracts at September 30, 2019.
3. Federal Income Taxes: The fund intends to continue to qualify as a regulated investment company and distribute all of its taxable income. Management has analyzed the fund’s tax positions taken for all open federal income tax years (September 30, 2016–2019), and has concluded that no provision for federal income tax is required in the fund’s financial statements.
4. Distributions: Distributions to shareholders are recorded on the ex-dividend date. Distributions are determined on a tax basis and may differ from net investment income and realized capital gains for financial reporting purposes.
45
Target Retirement 2025 Fund
5. Credit Facility: The fund and certain other funds managed by The Vanguard Group (“Vanguard”) participate in a $4.3 billion committed credit facility provided by a syndicate of lenders pursuant to a credit agreement that may be renewed annually; each fund is individually liable for its borrowings, if any, under the credit facility. Borrowings may be utilized for temporary and emergency purposes, and are subject to the fund’s regulatory and contractual borrowing restrictions. The participating funds are charged administrative fees and an annual commitment fee of 0.10% of the undrawn amount of the facility; these fees are allocated to the funds based on a method approved by the fund’s board of trustees and borne by the funds in which the fund invests (see Note B). Any borrowings under this facility bear interest at a rate based upon the higher of the one-month London Interbank Offered Rate, federal funds effective rate, or overnight bank funding rate plus an agreed-upon spread.
The fund had no borrowings outstanding at September 30, 2019, or at any time during the period then ended.
6. Other: Income and capital gain distributions received are recorded on the ex-dividend date. Security transactions are accounted for on the date securities are bought or sold. Costs used to determine realized gains (losses) on the sale of investment securities are those of the specific securities sold.
B. In accordance with the terms of a Funds’ Service Agreement (the “FSA”) between Vanguard and the fund, Vanguard furnishes to the fund investment advisory, corporate management, administrative, marketing, and distribution services at Vanguard’s cost of operations (as defined by the FSA). These costs of operations are allocated to the fund based on methods and guidelines approved by the board of trustees. The FSA provides that expenses otherwise allocable to Vanguard funds-of-funds may be reduced or eliminated to the extent of savings realized by the underlying Vanguard funds by virtue of being part of a fund-of-funds. Accordingly, all expenses for services provided by Vanguard to the fund and all other expenses incurred by the fund during the period ended September 30, 2019, were borne by the underlying Vanguard funds in which the fund invests. The fund’s trustees and officers are also trustees and officers, respectively, of the underlying Vanguard funds, as well as directors and employees, respectively, of Vanguard.
C. Various inputs may be used to determine the value of the fund’s investments. These inputs are summarized in three broad levels for financial statement purposes. The inputs or methodologies used to value securities are not necessarily an indication of the risk associated with investing in those securities.
Level 1—Quoted prices in active markets for identical securities.
Level 2—Other significant observable inputs (including quoted prices for similar securities, interest rates, prepayment speeds, credit risk, etc.).
Level 3—Significant unobservable inputs (including the fund’s own assumptions used to determine the fair value of investments). Any investments valued with significant unobservable inputs are noted on the Statement of Net Assets.
At September 30, 2019, 100% of the market value of the fund’s investments was determined based on Level 1 inputs.
46
Target Retirement 2025 Fund
D. Permanent differences between book-basis and tax-basis components of net assets are reclassified among capital accounts in the financial statements to reflect their tax character. These reclassifications have no effect on net assets or net asset value per share. As of period end, permanent differences primarily attributable to the accounting for distributions in connection with fund share redemptions were reclassified between the following accounts:
| | Amount | |
| | ($000 | ) |
Paid-in Capital | | 35,117 | |
Total Distributable Earnings (Loss) | | (35,117 | ) |
Temporary differences between book-basis and tax-basis components of total distributable earnings (loss) arise when certain items of income, gain, or loss are recognized in different periods for financial statement and tax purposes; these differences will reverse at some time in the future. The differences are primarily related to the tax deferral of losses on wash sales. As of period end, the tax-basis components of total distributable earnings (loss) are detailed in the table as follows:
| | Amount | |
| | ($000 | ) |
Undistributed Ordinary Income | | 712,819 | |
Undistributed Long-Term Gains | | 19,934 | |
Capital Loss Carryforwards (Non-expiring) | | — | |
Net Unrealized Gains (Losses) | | 12,084,877 | |
As of September 30, 2019, gross unrealized appreciation and depreciation for investments based on cost for U.S. federal income tax purposes were as follows:
| | Amount | |
| | ($000 | ) |
Tax Cost | | 32,094,393 | |
Gross Unrealized Appreciation | | 12,142,367 | |
Gross Unrealized Depreciation | | (57,490 | ) |
Net Unrealized Appreciation (Depreciation) | | 12,084,877 | |
E. Capital shares issued and redeemed were:
| | Year Ended September 30, | |
| | 2019 | | 2018 | |
| | Shares | | Shares | |
| | (000 | ) | (000 | ) |
Issued | | 422,593 | | 496,292 | |
Issued in Lieu of Cash Distributions | | 68,077 | | 50,490 | |
Redeemed | | (407,912 | ) | (379,667 | ) |
Net Increase (Decrease) in Shares Outstanding | | 82,758 | | 167,115 | |
47
Target Retirement 2025 Fund
F. Transactions during the period in affiliated underlying Vanguard funds were as follows:
| | | | Current Period Transactions | | |
| | Sept. 30, | | | | Proceeds | | Realized | | | | | | | | Sept. 30, |
| | 2018 | | | | from | | Net | | Change in | | | | Capital Gain | | 2019 |
| | Market | | Purchases | | Securities | | Gain | | Unrealized | | | | Distributions | | Market |
| | Value | | at Cost | | Sold | | (Loss | ) | App. (Dep. | ) | Income | | Received | | Value |
| | ($000 | ) | ($000 | ) | ($000 | ) | ($000 | ) | ($000 | ) | ($000 | ) | ($000 | ) | ($000) |
Vanguard Market Liquidity Fund | | 3 | | NA1 | | NA1 | | 4 | | — | | 336 | | — | | 23,149 |
Vanguard Total Bond Market II Index Fund | | 10,979,534 | | 2,323,337 | | 2,059,683 | | (30,214 | ) | 825,776 | | 317,816 | | — | | 12,038,750 |
Vanguard Total International Bond Index Fund | | 4,578,888 | | 474,784 | | 321,637 | | (2,122 | ) | 376,709 | | 137,845 | | — | | 5,106,622 |
Vanguard Total International Stock Index Fund | | 10,424,031 | | 1,152,759 | | 333,537 | | (11,915 | ) | (440,024 | ) | 308,448 | | — | | 10,791,314 |
Vanguard Total Stock Market Index Fund | | 15,883,028 | | 1,925,857 | | 1,830,369 | | 138,101 | | 102,818 | | 279,091 | | — | | 16,219,435 |
Total | | 41,865,484 | | 5,876,737 | | 4,545,226 | | 93,854 | | 865,279 | | 1,043,536 | | — | | 44,179,270 |
1 | Not applicable—purchases and sales are for temporary cash investment purposes. |
G. Management has determined that no events or transactions occurred subsequent to September 30, 2019, that would require recognition or disclosure in these financial statements.
48
Target Retirement 2030 Fund
Performance Summary
All of the returns in this report represent past performance, which is not a guarantee of future results that may be achieved by the fund. (Current performance may be lower or higher than the performance data cited. For performance data current to the most recent month-end, visit our website at vanguard.com/performance.) Note, too, that both investment returns and principal value can fluctuate widely, so an investor’s shares, when sold, could be worth more or less than their original cost. The returns shown do not reflect taxes that a shareholder would pay on fund distributions or on the sale of fund shares.
Cumulative Performance: September 30, 2009, Through September 30, 2019
Initial Investment of $10,000
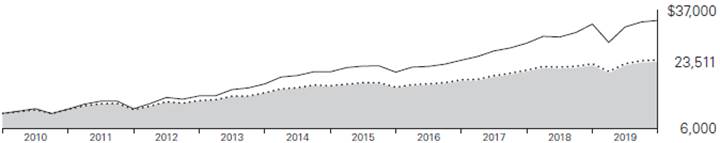
| | Average Annual Total Returns | | |
| | Periods Ended September 30, 2019 | | |
| | | | | | Final Value |
| | One | Five | Ten | | of a $10,000 |
| | Year | Years | Years | | Investment |

| Target Retirement 2030 Fund | | 4.15% | 6.67% | 8.92% | | $23,511 |

| Target 2030 Composite Index | | 4.30 | 6.86 | 9.16 | | 24,015 |

| MSCI US Broad Market Index | | 2.91 | 10.47 | 13.15 | | 34,386 |
Target 2030 Composite Index: Derived by applying the fund’s target asset allocation to the results of the following benchmarks: for international stocks of developed markets, the MSCI EAFE Index through December 15, 2010, the MSCI ACWI ex USA IMI Index through June 2, 2013, and the FTSE Global All Cap ex US Index thereafter; for emerging-market stocks, the Select Emerging Markets Index through August 23, 2006, the MSCI Emerging Markets Index through December 15, 2010, the MSCI ACWI ex USA IMI Index through June 2, 2013, and the FTSE Global All Cap ex US Index thereafter; for U.S. bonds, the Bloomberg Barclays U.S. Aggregate Bond Index through December 31, 2009, and the Bloomberg Barclays U.S. Aggregate Float Adjusted Index thereafter; for international bonds, the Bloomberg Barclays Global Aggregate ex-USD Float Adjusted RIC Capped Index Hedged beginning June 3, 2013; and for U.S. stocks, the MSCI US Broad Market Index through June 2, 2013, and the CRSP US Total Market Index thereafter. International stock benchmark returns are adjusted for withholding taxes.
See Financial Highlights for dividend and capital gains information.
49
Target Retirement 2030 Fund
Underlying Vanguard Funds
As of September 30, 2019
Vanguard Total Stock Market Index Fund Investor Shares | | 41.1% |
Vanguard Total International Stock Index Fund Investor Shares | | 27.4 |
Vanguard Total Bond Market II Index Fund Investor Shares | | 22.1 |
Vanguard Total International Bond Index Fund Investor Shares | | 9.4 |
50
Target Retirement 2030 Fund
Financial Statements
Statement of Net Assets
As of September 30, 2019
The fund files its complete schedule of portfolio holdings with the Securities and Exchange Commission (SEC) for the first and third quarters of each fiscal year as an exhibit to its reports on Form N-PORT. The fund’s Form N-PORT reports are available on the SEC’s website at www.sec.gov.
| | | | | Market | |
| | | | | Value· | |
| | | Shares | | ($000 | ) |
Investment Companies (100.1%) | | | | | |
U.S. Stock Fund (41.2%) | | | | | |
| Vanguard Total Stock Market Index Fund Investor Shares | | 219,409,169 | | 16,122,186 | |
| | | | | | |
International Stock Fund (27.4%) | | | | | |
| Vanguard Total International Stock Index Fund Investor Shares | | 646,650,747 | | 10,715,003 | |
| | | | | | |
U.S. Bond Fund (22.1%) | | | | | |
1 | Vanguard Total Bond Market II Index Fund Investor Shares | | 779,601,140 | | 8,637,980 | |
| | | | | | |
International Bond Fund (9.4%) | | | | | |
| Vanguard Total International Bond Index Fund Investor Shares | | 311,219,538 | | 3,659,942 | |
Total Investment Companies (Cost $28,758,328) | | | | 39,135,111 | |
Temporary Cash Investment (0.0%) | | | | | |
Money Market Fund (0.0%) | | | | | |
1 | Vanguard Market Liquidity Fund, 2.098% (Cost $8,567) | | 86,659 | | 8,567 | |
Total Investments (100.1%) (Cost $28,766,895) | | | | 39,143,678 | |
Other Assets and Liabilities (-0.1%) | | | | | |
Other Assets | | | | 48,603 | |
Liabilities | | | | (78,270 | ) |
| | | | | (29,667 | ) |
Net Assets (100%) | | | | | |
Applicable to 1,110,599,835 outstanding $.001 par value shares of beneficial interest (unlimited authorization) | | | | 39,114,011 | |
Net Asset Value Per Share | | | | $35.22 | |
51
Target Retirement 2030 Fund
| | Amount | |
| | ($000 | ) |
Statement of Assets and Liabilities | | | |
Assets | | | |
Investments in Securities, at Value—Affiliated Funds | | 39,143,678 | |
Receivables for Accrued Income | | 21,358 | |
Receivables for Capital Shares Issued | | 27,245 | |
Total Assets | | 39,192,281 | |
Liabilities | | | |
Payables for Investment Securities Purchased | | 39,185 | |
Payables for Capital Shares Redeemed | | 39,085 | |
Total Liabilities | | 78,270 | |
Net Assets | | 39,114,011 | |
| | | |
| | | |
At September 30, 2019, net assets consisted of: | | | |
| | Amount | |
| | ($000 | ) |
Paid-in Capital | | 28,148,011 | |
Total Distributable Earnings (Loss) | | 10,966,000 | |
Net Assets | | 39,114,011 | |
· See Note A in Notes to Financial Statements.
1 Affiliated fund available only to Vanguard funds and certain trusts and accounts managed by Vanguard. Rate shown for Vanguard Market Liquidity Fund is the 7-day yield.
See accompanying Notes, which are an integral part of the Financial Statements.
52
Target Retirement 2030 Fund
Statement of Operations
| | Year Ended | |
| | September 30, 2019 | |
| | ($000 | ) |
Investment Income | | | |
Income | | | |
Income Distributions Received from Affiliated Funds | | 892,761 | |
Other Income | | 25 | |
Net Investment Income — Note B | | 892,786 | |
Realized Net Gain (Loss) | | | |
Capital Gain Distributions Received from Affiliated Funds | | — | |
Affiliated Funds Sold | | 139 | |
Futures Contracts | | (138 | ) |
Realized Net Gain (Loss) | | 1 | |
Change in Unrealized Appreciation (Depreciation) from Affiliated Funds | | 649,511 | |
Net Increase (Decrease) in Net Assets Resulting from Operations | | 1,542,298 | |
See accompanying Notes, which are an integral part of the Financial Statements.
53
Target Retirement 2030 Fund
Statement of Changes in Net Assets
| | Year Ended September 30, | |
| | 2019 | | 2018 | |
| | ($000 | ) | ($000 | ) |
Increase (Decrease) in Net Assets | | | | | |
Operations | | | | | |
Net Investment Income | | 892,786 | | 751,027 | |
Realized Net Gain (Loss) | | 1 | | 72,973 | |
Change in Unrealized Appreciation (Depreciation) | | 649,511 | | 1,620,004 | |
Net Increase (Decrease) in Net Assets Resulting from Operations | | 1,542,298 | | 2,444,004 | |
Distributions | | | | | |
Net Investment Income | | (797,744 | ) | (643,271 | ) |
Realized Capital Gain1 | | (72,087 | ) | (18,256 | ) |
Total Distributions | | (869,831 | ) | (661,527 | ) |
Capital Share Transactions | | | | | |
Issued | | 7,520,484 | | 8,378,602 | |
Issued in Lieu of Cash Distributions | | 856,060 | | 651,753 | |
Redeemed | | (5,848,492 | ) | (5,776,550 | ) |
Net Increase (Decrease) from Capital Share Transactions | | 2,528,052 | | 3,253,805 | |
Total Increase (Decrease) | | 3,200,519 | | 5,036,282 | |
Net Assets | | | | | |
Beginning of Period | | 35,913,492 | | 30,877,210 | |
End of Period | | 39,114,011 | | 35,913,492 | |
1 Includes fiscal 2019 and 2018 short-term gain distributions totaling $65,534,000 and $15,085,000, respectively. Short-term gain distributions are treated as ordinary income dividends for tax purposes.
See accompanying Notes, which are an integral part of the Financial Statements.
54
Target Retirement 2030 Fund
Financial Highlights
For a Share Outstanding | | Year Ended September 30, |
Throughout Each Period | | 2019 | | 2018 | | 2017 | | 2016 | | 2015 |
Net Asset Value, Beginning of Period | | $34.74 | | $32.93 | | $29.77 | | $27.77 | | $28.95 |
Investment Operations | | | | | | | | | | |
Net Investment Income | | .8301 | | .7541 | | .6831 | | .634 | | .633 |
Capital Gain Distributions Received | | — | | .0011 | | .0061 | | .008 | | .016 |
Net Realized and Unrealized Gain (Loss) on Investments | | .486 | | 1.744 | | 3.167 | | 2.390 | | (1.242) |
Total from Investment Operations | | 1.316 | | 2.499 | | 3.856 | | 3.032 | | (.593) |
Distributions | | | | | | | | | | |
Dividends from Net Investment Income | | (.767) | | (.670) | | (.576) | | (.597) | | (.558) |
Distributions from Realized Capital Gains | | (.069) | | (.019) | | (.120) | | (.435) | | (.029) |
Total Distributions | | (.836) | | (.689) | | (.696) | | (1.032) | | (.587) |
Net Asset Value, End of Period | | $35.22 | | $34.74 | | $32.93 | | $29.77 | | $27.77 |
| | | | | | | | | | |
Total Return2 | | 4.15% | | 7.65% | | 13.25% | | 11.15% | | -2.16% |
| | | | | | | | | | |
Ratios/Supplemental Data | | | | | | | | | | |
Net Assets, End of Period (Millions) | | $39,114 | | $35,913 | | $30,877 | | $24,966 | | $22,684 |
Ratio of Total Expenses to Average Net Assets | | — | | — | | — | | — | | — |
Acquired Fund Fees and Expenses | | 0.14% | | 0.14% | | 0.14% | | 0.15% | | 0.15% |
Ratio of Net Investment Income to Average Net Assets | | 2.46% | | 2.22% | | 2.21% | | 2.20% | | 2.08% |
Portfolio Turnover Rate | | 8% | | 9% | | 9% | | 16% | | 24% |
1 Calculated based on average shares outstanding.
2 Total returns do not include account service fees that may have applied in the periods shown. Fund prospectuses provide information about any applicable account service fees.
See accompanying Notes, which are an integral part of the Financial Statements.
55
Target Retirement 2030 Fund
Notes to Financial Statements
Vanguard Target Retirement 2030 Fund is registered under the Investment Company Act of 1940 as an open-end investment company, or mutual fund. The fund follows a balanced investment strategy by investing in selected Vanguard funds to achieve its targeted allocation of assets to U.S. and international stocks, and U.S. and international bonds. Financial statements and other information about each underlying fund are available on vanguard.com.
A. The following significant accounting policies conform to generally accepted accounting principles for U.S. investment companies. The fund consistently follows such policies in preparing its financial statements.
1. Security Valuation: Investments are valued at the net asset value of each underlying Vanguard fund determined as of the close of the New York Stock Exchange (generally 4 p.m., Eastern time) on the valuation date.
2. Futures Contracts: The fund uses stock and bond futures contracts to a limited extent, with the objectives of maintaining full exposure to the market and maintaining its target asset allocation. The primary risks associated with the use of futures contracts are imperfect correlation between changes in market values of investments held by the fund and the prices of futures contracts, and the possibility of an illiquid market. Counterparty risk involving futures is mitigated because a regulated clearinghouse is the counterparty instead of the clearing broker. To further mitigate counterparty risk, the fund trades futures contracts on an exchange, monitors the financial strength of its clearing brokers and clearinghouse, and has entered into clearing agreements with its clearing brokers. The clearinghouse imposes initial margin requirements to secure the fund’s performance and requires daily settlement of variation margin representing changes in the market value of each contract. Any assets pledged as initial margin for open contracts are noted in the Statement of Net Assets.
Futures contracts are valued at their quoted daily settlement prices. The notional amounts of the contracts are not recorded in the Statement of Net Assets. Fluctuations in the value of the contracts are recorded in the Statement of Assets and Liabilities as an asset (liability) and in the Statement of Operations as unrealized appreciation (depreciation) until the contracts are closed, when they are recorded as realized futures gains (losses).
During the year ended September 30, 2019, the fund’s average investments in long and short futures contracts represented less than 1% and 0% of net assets, respectively, based on the average of the notional amounts at each quarter-end during the period. The fund had no open futures contracts at September 30, 2019.
3. Federal Income Taxes: The fund intends to continue to qualify as a regulated investment company and distribute all of its taxable income. Management has analyzed the fund’s tax positions taken for all open federal income tax years (September 30, 2016–2019), and has concluded that no provision for federal income tax is required in the fund’s financial statements.
4. Distributions: Distributions to shareholders are recorded on the ex-dividend date. Distributions are determined on a tax basis and may differ from net investment income and realized capital gains for financial reporting purposes.
56
Target Retirement 2030 Fund
5. Credit Facility: The fund and certain other funds managed by The Vanguard Group (“Vanguard”) participate in a $4.3 billion committed credit facility provided by a syndicate of lenders pursuant to a credit agreement that may be renewed annually; each fund is individually liable for its borrowings, if any, under the credit facility. Borrowings may be utilized for temporary and emergency purposes, and are subject to the fund’s regulatory and contractual borrowing restrictions. The participating funds are charged administrative fees and an annual commitment fee of 0.10% of the undrawn amount of the facility; these fees are allocated to the funds based on a method approved by the fund’s board of trustees and borne by the funds in which the fund invests (see Note B). Any borrowings under this facility bear interest at a rate based upon the higher of the one-month London Interbank Offered Rate, federal funds effective rate, or overnight bank funding rate plus an agreed-upon spread.
The fund had no borrowings outstanding at September 30, 2019, or at any time during the period then ended.
6. Other: Income and capital gain distributions received are recorded on the ex-dividend date. Security transactions are accounted for on the date securities are bought or sold. Costs used to determine realized gains (losses) on the sale of investment securities are those of the specific securities sold.
B. In accordance with the terms of a Funds’ Service Agreement (the “FSA”) between Vanguard and the fund, Vanguard furnishes to the fund investment advisory, corporate management, administrative, marketing, and distribution services at Vanguard’s cost of operations (as defined by the FSA). These costs of operations are allocated to the fund based on methods and guidelines approved by the board of trustees. The FSA provides that expenses otherwise allocable to Vanguard funds-of-funds may be reduced or eliminated to the extent of savings realized by the underlying Vanguard funds by virtue of being part of a fund-of-funds. Accordingly, all expenses for services provided by Vanguard to the fund and all other expenses incurred by the fund during the period ended September 30, 2019, were borne by the underlying Vanguard funds in which the fund invests. The fund’s trustees and officers are also trustees and officers, respectively, of the underlying Vanguard funds, as well as directors and employees, respectively, of Vanguard.
C. Various inputs may be used to determine the value of the fund’s investments. These inputs are summarized in three broad levels for financial statement purposes. The inputs or methodologies used to value securities are not necessarily an indication of the risk associated with investing in those securities.
Level 1—Quoted prices in active markets for identical securities.
Level 2—Other significant observable inputs (including quoted prices for similar securities, interest rates, prepayment speeds, credit risk, etc.).
Level 3—Significant unobservable inputs (including the fund’s own assumptions used to determine the fair value of investments). Any investments valued with significant unobservable inputs are noted on the Statement of Net Assets.
At September 30, 2019, 100% of the market value of the fund’s investments was determined based on Level 1 inputs.
57
Target Retirement 2030 Fund
D. Permanent differences between book-basis and tax-basis components of net assets, if any, are reclassified among capital accounts in the financial statements to reflect their tax character. These reclassifications have no effect on net assets or net asset value per share.
Temporary differences between book-basis and tax-basis components of total distributable earnings (loss) arise when certain items of income, gain, or loss are recognized in different periods for financial statement and tax purposes; these differences will reverse at some time in the future. The differences are primarily related to the tax deferral of losses on wash sales. As of period end, the tax-basis components of total distributable earnings (loss) are detailed in the table as follows:
| | Amount | |
| | ($000 | ) |
Undistributed Ordinary Income | | 590,696 | |
Undistributed Long-Term Gains | | — | |
Capital Loss Carryforwards (Non-expiring) | | (1,479 | ) |
Net Unrealized Gains (Losses) | | 10,376,783 | |
As of September 30, 2019, gross unrealized appreciation and depreciation for investments based on cost for U.S. federal income tax purposes were as follows:
| | Amount | |
| | ($000 | ) |
Tax Cost | | 28,766,895 | |
Gross Unrealized Appreciation | | 10,468,747 | |
Gross Unrealized Depreciation | | (91,964 | ) |
Net Unrealized Appreciation (Depreciation) | | 10,376,783 | |
E. Capital shares issued and redeemed were:
| | Year Ended September 30, | |
| | 2019 | | 2018 | |
| | Shares | | Shares | |
| | (000 | ) | (000 | ) |
Issued | | 224,037 | | 246,657 | |
Issued in Lieu of Cash Distributions | | 27,921 | | 19,346 | |
Redeemed | | (175,095 | ) | (169,972 | ) |
Net Increase (Decrease) in Shares Outstanding | | 76,863 | | 96,031 | |
58
Target Retirement 2030 Fund
F. Transactions during the period in affiliated underlying Vanguard funds were as follows:
| | | | Current Period Transactions | | | |
| | Sept. 30, | | | | Proceeds | | Realized | | | | | | | | Sept. 30, | |
| | 2018 | | | | from | | Net | | Change in | | | | Capital Gain | | 2019 | |
| | Market | | Purchases | | Securities | | Gain | | Unrealized | | | | Distributions | | Market | |
| | Value | | at Cost | | Sold | | (Loss) | | App. (Dep. | ) | Income | | Received | | Value | |
| | ($000 | ) | ($000 | ) | ($000 | ) | ($000 | ) | ($000 | ) | ($000 | ) | ($000 | ) | ($000 | ) |
Vanguard Market Liquidity Fund | | 1,900 | | NA1 | | NA1 | | — | | — | | 268 | | — | | 8,567 | |
Vanguard Total Bond Market II Index Fund | | 7,595,101 | | 2,205,401 | | 1,727,555 | | (17,121 | ) | 582,154 | | 223,240 | | — | | 8,637,980 | |
Vanguard Total International Bond Index Fund | | 3,114,618 | | 478,561 | | 197,543 | | (941 | ) | 265,247 | | 94,705 | | — | | 3,659,942 | |
Vanguard Total International Stock Index Fund | | 10,047,896 | | 1,262,717 | | 162,360 | | (229 | ) | (433,021 | ) | 301,067 | | — | | 10,715,003 | |
Vanguard Total Stock Market Index Fund | | 15,156,276 | | 1,686,093 | | 973,744 | | 18,430 | | 235,131 | | 273,481 | | — | | 16,122,186 | |
Total | | 35,915,791 | | 5,632,772 | | 3,061,202 | | 139 | | 649,511 | | 892,761 | | — | | 39,143,678 | |
1 Not applicable—purchases and sales are for temporary cash investment purposes.
G. Management has determined that no events or transactions occurred subsequent to September 30, 2019, that would require recognition or disclosure in these financial statements.
59
Target Retirement 2035 Fund
Performance Summary
All of the returns in this report represent past performance, which is not a guarantee of future results that may be achieved by the fund. (Current performance may be lower or higher than the performance data cited. For performance data current to the most recent month-end, visit our website at vanguard.com/performance.) Note, too, that both investment returns and principal value can fluctuate widely, so an investor’s shares, when sold, could be worth more or less than their original cost. The returns shown do not reflect taxes that a shareholder would pay on fund distributions or on the sale of fund shares.
Cumulative Performance: September 30, 2009, Through September 30, 2019
Initial Investment of $10,000
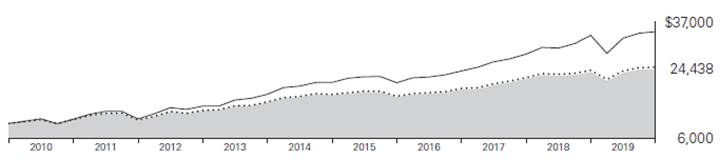
| | | | Average Annual Total Returns | | |
| | | | Periods Ended September 30, 2019 | | |
| | | | | | | | | | Final Value |
| | | | One | | Five | | Ten | | of a $10,000 |
| | | | Year | | Years | | Years | | Investment |

| | Target Retirement 2035 Fund | | 3.37% | | 6.92% | | 9.35% | | $24,438 |

| | Target 2035 Composite Index | | 3.57 | | 7.13 | | 9.58 | | 24,973 |

| | MSCI US Broad Market Index | | 2.91 | | 10.47 | | 13.15 | | 34,386 |
Target 2035 Composite Index: Derived by applying the fund’s target asset allocation to the results of the following benchmarks: for international stocks of developed markets, the MSCI EAFE Index through December 15, 2010, the MSCI ACWI ex USA IMI Index through June 2, 2013, and the FTSE Global All Cap ex US Index thereafter; for emerging-market stocks, the Select Emerging Markets Index through August 23, 2006, the MSCI Emerging Markets Index through December 15, 2010, the MSCI ACWI ex USA IMI Index through June 2, 2013, and the FTSE Global All Cap ex US Index thereafter; for U.S. bonds, the Bloomberg Barclays U.S. Aggregate Bond Index through December 31, 2009, and the Bloomberg Barclays U.S. Aggregate Float Adjusted Index thereafter; for international bonds, the Bloomberg Barclays Global Aggregate ex-USD Float Adjusted RIC Capped Index Hedged beginning June 3, 2013; and for U.S. stocks, the Dow Jones U.S. Total Stock Market Index (formerly known as the Dow Jones Wilshire 5000 Index) through April 22, 2005, the MSCI US Broad Market Index through June 2, 2013, and the CRSP US Total Market Index thereafter. International stock benchmark returns are adjusted for withholding taxes.
See Financial Highlights for dividend and capital gains information.
60
Target Retirement 2035 Fund
Underlying Vanguard Funds
As of September 30, 2019
Vanguard Total Stock Market Index Fund Investor Shares | | 45.8% |
Vanguard Total International Stock Index Fund Investor Shares | | 30.3 |
Vanguard Total Bond Market II Index Fund Investor Shares | | 16.6 |
Vanguard Total International Bond Index Fund Investor Shares | | 7.3 |
61
Target Retirement 2035 Fund
Financial Statements
Statement of Net Assets
As of September 30, 2019
The fund files its complete schedule of portfolio holdings with the Securities and Exchange Commission (SEC) for the first and third quarters of each fiscal year as an exhibit to its reports on Form N-PORT. The fund’s Form N-PORT reports are available on the SEC’s website at www.sec.gov.
| | | | | Market | |
| | | | | Value· | |
| | | Shares | | ($000 | ) |
Investment Companies (100.1%) | | | | | |
U.S. Stock Fund (45.9%) | | | | | |
| Vanguard Total Stock Market Index Fund Investor Shares | | 231,726,158 | | 17,027,238 | |
| | | | | | |
International Stock Fund (30.3%) | | | | | |
| Vanguard Total International Stock Index Fund Investor Shares | | 679,047,604 | | 11,251,819 | |
| | | | | | |
U.S. Bond Fund (16.6%) | | | | | |
1 | Vanguard Total Bond Market II Index Fund Investor Shares | | 557,622,223 | | 6,178,454 | |
| | | | | | |
International Bond Fund (7.3%) | | | | | |
| Vanguard Total International Bond Index Fund Investor Shares | | 229,075,816 | | 2,693,932 | |
Total Investment Companies (Cost $26,001,056) | | | | 37,151,443 | |
Temporary Cash Investment (0.0%) | | | | | |
Money Market Fund (0.0%) | | | | | |
1 | Vanguard Market Liquidity Fund, 2.098% (Cost $9,487) | | 94,859 | | 9,487 | |
Total Investments (100.1%) (Cost $26,010,543) | | | | 37,160,930 | |
Other Assets and Liabilities (-0.1%) | | | | | |
Other Assets | | | | 38,313 | |
Liabilities | | | | (72,765 | ) |
| | | | | (34,452 | ) |
Net Assets (100%) | | | | | |
Applicable to 1,718,650,318 outstanding $.001 par value shares of beneficial interest (unlimited authorization) | | | | 37,126,478 | |
Net Asset Value Per Share | | | | $21.60 | |
62
Target Retirement 2035 Fund
| | Amount | |
| | ($000 | ) |
Statement of Assets and Liabilities | | | |
Assets | | | |
Investments in Securities, at Value—Affiliated Funds | | 37,160,930 | |
Receivables for Accrued Income | | 15,438 | |
Receivables for Capital Shares Issued | | 22,875 | |
Total Assets | | 37,199,243 | |
Liabilities | | | |
Payables for Investment Securities Purchased | | 24,299 | |
Payables for Capital Shares Redeemed | | 48,466 | |
Total Liabilities | | 72,765 | |
Net Assets | | 37,126,478 | |
| | | |
At September 30, 2019, net assets consisted of: | | | |
| | Amount | |
| | ($000 | ) |
Paid-in Capital | | 25,423,436 | |
Total Distributable Earnings (Loss) | | 11,703,042 | |
Net Assets | | 37,126,478 | |
· See Note A in Notes to Financial Statements.
1 Affiliated fund available only to Vanguard funds and certain trusts and accounts managed by Vanguard. Rate shown for Vanguard Market Liquidity Fund is the 7-day yield.
See accompanying Notes, which are an integral part of the Financial Statements.
63
Target Retirement 2035 Fund
Statement of Operations
| | Year Ended | |
| | September 30, 2019 | |
| | ($000 | ) |
Investment Income | | | |
Income | | | |
Income Distributions Received from Affiliated Funds | | 834,841 | |
Other Income | | 107 | |
Net Investment Income—Note B | | 834,948 | |
Realized Net Gain (Loss) | | | |
Capital Gain Distributions Received from Affiliated Funds | | — | |
Affiliated Funds Sold | | (5,651 | ) |
Futures Contracts | | (115 | ) |
Realized Net Gain (Loss) | | (5,766 | ) |
Change in Unrealized Appreciation (Depreciation) from Affiliated Funds | | 378,643 | |
Net Increase (Decrease) in Net Assets Resulting from Operations | | 1,207,825 | |
See accompanying Notes, which are an integral part of the Financial Statements.
64
Target Retirement 2035 Fund
Statement of Changes in Net Assets
| | Year Ended September 30, | |
| | 2019 | | 2018 | |
| | ($000 | ) | ($000 | ) |
Increase (Decrease) in Net Assets | | | | | |
Operations | | | | | |
Net Investment Income | | 834,948 | | 714,823 | |
Realized Net Gain (Loss) | | (5,766 | ) | 71,217 | |
Change in Unrealized Appreciation (Depreciation) | | 378,643 | | 1,827,238 | |
Net Increase (Decrease) in Net Assets Resulting from Operations | | 1,207,825 | | 2,613,278 | |
Distributions | | | | | |
Net Investment Income | | (750,873 | ) | (618,358 | ) |
Realized Capital Gain1 | | (68,688 | ) | (49,432 | ) |
Total Distributions | | (819,561 | ) | (667,790 | ) |
Capital Share Transactions | | | | | |
Issued | | 6,583,434 | | 7,351,952 | |
Issued in Lieu of Cash Distributions | | 806,942 | | 658,556 | |
Redeemed | | (5,173,902 | ) | (5,232,422 | ) |
Net Increase (Decrease) from Capital Share Transactions | | 2,216,474 | | 2,778,086 | |
Total Increase (Decrease) | | 2,604,738 | | 4,723,574 | |
Net Assets | | | | | |
Beginning of Period | | 34,521,740 | | 29,798,166 | |
End of Period | | 37,126,478 | | 34,521,740 | |
1 Includes fiscal 2019 and 2018 short-term gain distributions totaling $64,476,000 and $21,099,000, respectively. Short-term gain distributions are treated as ordinary income dividends for tax purposes.
See accompanying Notes, which are an integral part of the Financial Statements.
65
Target Retirement 2035 Fund
Financial Highlights
For a Share Outstanding | | Year Ended September 30, |
Throughout Each Period | | 2019 | | 2018 | | 2017 | | 2016 | | 2015 |
Net Asset Value, Beginning of Period | | $21.46 | | $20.20 | | $18.09 | | $16.95 | | $17.79 |
Investment Operations | | | | | | | | | | |
Net Investment Income | | .5001 | | .4591 | | .4181 | | .393 | | .391 |
Capital Gain Distributions Received | | — | | .0011 | | .0031 | | .003 | | .007 |
Net Realized and Unrealized Gain (Loss) on Investments | | .146 | | 1.243 | | 2.180 | | 1.530 | | (.865) |
Total from Investment Operations | | .646 | | 1.703 | | 2.601 | | 1.926 | | (.467) |
Distributions | | | | | | | | | | |
Dividends from Net Investment Income | | (.464) | | (.410) | | (.356) | | (.371) | | (.368) |
Distributions from Realized Capital Gains | | (.042) | | (.033) | | (.135) | | (.415) | | (.005) |
Total Distributions | | (.506) | | (.443) | | (.491) | | (.786) | | (.373) |
Net Asset Value, End of Period | | $21.60 | | $21.46 | | $20.20 | | $18.09 | | $16.95 |
| | | | | | | | | | |
Total Return2 | | 3.37% | | 8.51% | | 14.76% | | 11.64% | | -2.75% |
| | | | | | | | | | |
Ratios/Supplemental Data | | | | | | | | | | |
Net Assets, End of Period (Millions) | | $37,126 | | $34,522 | | $29,798 | | $24,531 | | $22,800 |
Ratio of Total Expenses to Average Net Assets | | — | | — | | — | | — | | — |
Acquired Fund Fees and Expenses | | 0.14% | | 0.14% | | 0.14% | | 0.15% | | 0.15% |
Ratio of Net Investment Income to Average Net Assets | | 2.42% | | 2.19% | | 2.22% | | 2.21% | | 2.07% |
Portfolio Turnover Rate | | 7% | | 8% | | 9% | | 14% | | 23% |
1 Calculated based on average shares outstanding.
2 Total returns do not include account service fees that may have applied in the periods shown. Fund prospectuses provide information about any applicable account service fees.
See accompanying Notes, which are an integral part of the Financial Statements.
66
Target Retirement 2035 Fund
Notes to Financial Statements
Vanguard Target Retirement 2035 Fund is registered under the Investment Company Act of 1940 as an open-end investment company, or mutual fund. The fund follows a balanced investment strategy by investing in selected Vanguard funds to achieve its targeted allocation of assets to U.S. and international stocks, and U.S. and international bonds. Financial statements and other information about each underlying fund are available on vanguard.com.
A. The following significant accounting policies conform to generally accepted accounting principles for U.S. investment companies. The fund consistently follows such policies in preparing its financial statements.
1. Security Valuation: Investments are valued at the net asset value of each underlying Vanguard fund determined as of the close of the New York Stock Exchange (generally 4 p.m., Eastern time) on the valuation date.
2. Futures Contracts: The fund uses stock and bond futures contracts to a limited extent, with the objectives of maintaining full exposure to the market and maintaining its target asset allocation. The primary risks associated with the use of futures contracts are imperfect correlation between changes in market values of investments held by the fund and the prices of futures contracts, and the possibility of an illiquid market. Counterparty risk involving futures is mitigated because a regulated clearinghouse is the counterparty instead of the clearing broker. To further mitigate counterparty risk, the fund trades futures contracts on an exchange, monitors the financial strength of its clearing brokers and clearinghouse, and has entered into clearing agreements with its clearing brokers. The clearinghouse imposes initial margin requirements to secure the fund’s performance and requires daily settlement of variation margin representing changes in the market value of each contract. Any assets pledged as initial margin for open contracts are noted in the Statement of Net Assets.
Futures contracts are valued at their quoted daily settlement prices. The notional amounts of the contracts are not recorded in the Statement of Net Assets. Fluctuations in the value of the contracts are recorded in the Statement of Assets and Liabilities as an asset (liability) and in the Statement of Operations as unrealized appreciation (depreciation) until the contracts are closed, when they are recorded as realized futures gains (losses).
During the year ended September 30, 2019, the fund’s average investments in long and short futures contracts represented less than 1% and 0% of net assets, respectively, based on the average of the notional amounts at each quarter-end during the period. The fund had no open futures contracts at September 30, 2019.
3. Federal Income Taxes: The fund intends to continue to qualify as a regulated investment company and distribute all of its taxable income. Management has analyzed the fund’s tax positions taken for all open federal income tax years (September 30, 2016–2019), and has concluded that no provision for federal income tax is required in the fund’s financial statements.
4. Distributions: Distributions to shareholders are recorded on the ex-dividend date. Distributions are determined on a tax basis and may differ from net investment income and realized capital gains for financial reporting purposes.
67
Target Retirement 2035 Fund
5. Credit Facility: The fund and certain other funds managed by The Vanguard Group (“Vanguard”) participate in a $4.3 billion committed credit facility provided by a syndicate of lenders pursuant to a credit agreement that may be renewed annually; each fund is individually liable for its borrowings, if any, under the credit facility. Borrowings may be utilized for temporary and emergency purposes, and are subject to the fund’s regulatory and contractual borrowing restrictions. The participating funds are charged administrative fees and an annual commitment fee of 0.10% of the undrawn amount of the facility; these fees are allocated to the funds based on a method approved by the fund’s board of trustees and borne by the funds in which the fund invests (see Note B). Any borrowings under this facility bear interest at a rate based upon the higher of the one-month London Interbank Offered Rate, federal funds effective rate, or overnight bank funding rate plus an agreed-upon spread.
The fund had no borrowings outstanding at September 30, 2019, or at any time during the period then ended.
6. Other: Income and capital gain distributions received are recorded on the ex-dividend date. Security transactions are accounted for on the date securities are bought or sold. Costs used to determine realized gains (losses) on the sale of investment securities are those of the specific securities sold.
B. In accordance with the terms of a Funds’ Service Agreement (the “FSA”) between Vanguard and the fund, Vanguard furnishes to the fund investment advisory, corporate management, administrative, marketing, and distribution services at Vanguard’s cost of operations (as defined by the FSA). These costs of operations are allocated to the fund based on methods and guidelines approved by the board of trustees. The FSA provides that expenses otherwise allocable to Vanguard funds-of-funds may be reduced or eliminated to the extent of savings realized by the underlying Vanguard funds by virtue of being part of a fund-of-funds. Accordingly, all expenses for services provided by Vanguard to the fund and all other expenses incurred by the fund during the period ended September 30, 2019, were borne by the underlying Vanguard funds in which the fund invests. The fund’s trustees and officers are also trustees and officers, respectively, of the underlying Vanguard funds, as well as directors and employees, respectively, of Vanguard.
C. Various inputs may be used to determine the value of the fund’s investments. These inputs are summarized in three broad levels for financial statement purposes. The inputs or methodologies used to value securities are not necessarily an indication of the risk associated with investing in those securities.
Level 1—Quoted prices in active markets for identical securities.
Level 2—Other significant observable inputs (including quoted prices for similar securities, interest rates, prepayment speeds, credit risk, etc.).
Level 3—Significant unobservable inputs (including the fund’s own assumptions used to determine the fair value of investments). Any investments valued with significant unobservable inputs are noted on the Statement of Net Assets.
At September 30, 2019, 100% of the market value of the fund’s investments was determined based on Level 1 inputs.
68
Target Retirement 2035 Fund
D. Permanent differences between book-basis and tax-basis components of net assets, if any, are reclassified among capital accounts in the financial statements to reflect their tax character. These reclassifications have no effect on net assets or net asset value per share.
Temporary differences between book-basis and tax-basis components of total distributable earnings (loss) arise when certain items of income, gain, or loss are recognized in different periods for financial statement and tax purposes; these differences will reverse at some time in the future. The differences are primarily related to the tax deferral of losses on wash sales. As of period end, the tax-basis components of total distributable earnings (loss) are detailed in the table as follows:
| | Amount | |
| | ($000 | ) |
Undistributed Ordinary Income | | 558,434 | |
Undistributed Long-Term Gains | | — | |
Capital Loss Carryforwards (Non-expiring) | | (5,779 | ) |
Net Unrealized Gains (Losses) | | 11,150,387 | |
As of September 30, 2019, gross unrealized appreciation and depreciation for investments based on cost for U.S. federal income tax purposes were as follows:
| | Amount | |
| | ($000 | ) |
Tax Cost | | 26,010,543 | |
Gross Unrealized Appreciation | | 11,242,257 | |
Gross Unrealized Depreciation | | (91,870 | ) |
Net Unrealized Appreciation (Depreciation) | | 11,150,387 | |
E. Capital shares issued and redeemed were:
| | Year Ended September 30, | |
| | 2019 | | 2018 | |
| | Shares | | Shares | |
| | (000 | ) | (000 | ) |
Issued | | 319,514 | | 351,488 | |
Issued in Lieu of Cash Distributions | | 43,129 | | 31,768 | |
Redeemed | | (252,750 | ) | (249,802 | ) |
Net Increase (Decrease) in Shares Outstanding | | 109,893 | | 133,454 | |
69
Target Retirement 2035 Fund
F. Transactions during the period in affiliated underlying Vanguard funds were as follows:
| | | | Current Period Transactions | | | |
| | Sept. 30, | | | | Proceeds | | Realized | | | | | | | | Sept. 30, | |
| | 2018 | | | | from | | Net | | Change in | | | | Capital Gain | | 2019 | |
| | Market | | Purchases | | Securities | | Gain | | Unrealized | | | | Distributions | | Market | |
| | Value | | at Cost | | Sold | | (Loss | ) | App. (Dep. | ) | Income | | Received | | Value | |
| | ($000 | ) | ($000 | ) | ($000 | ) | ($000 | ) | ($000 | ) | ($000 | ) | ($000 | ) | ($000 | ) |
Vanguard Market Liquidity Fund | | 1,202 | | NA1 | | NA1 | | 1 | | — | | 241 | | — | | 9,487 | |
Vanguard Total Bond Market II Index Fund | | 5,473,272 | | 1,611,971 | | 1,315,303 | | (14,996 | ) | 423,510 | | 161,307 | | — | | 6,178,454 | |
Vanguard Total International Bond Index Fund | | 2,237,151 | | 410,187 | | 143,828 | | (1,142 | ) | 191,564 | | 68,199 | | — | | 2,693,932 | |
Vanguard Total International Stock Index Fund | | 10,652,883 | | 1,299,688 | | 234,588 | | (2,225 | ) | (463,939 | ) | 317,313 | | — | | 11,251,819 | |
Vanguard Total Stock Market Index Fund | | 16,162,127 | | 1,421,907 | | 797,015 | | 12,711 | | 227,508 | | 287,781 | | — | | 17,027,238 | |
Total | | 34,526,635 | | 4,743,753 | | 2,490,734 | | (5,651 | ) | 378,643 | | 834,841 | | — | | 37,160,930 | |
1 Not applicable—purchases and sales are for temporary cash investment purposes.
G. Management has determined that no events or transactions occurred subsequent to September 30, 2019, that would require recognition or disclosure in these financial statements.
70
Report of Independent Registered Public Accounting Firm
To the Board of Trustees of Vanguard Chester Funds and Shareholders of Vanguard Target Retirement Income Fund, Vanguard Target Retirement 2015 Fund, Vanguard Target Retirement 2020 Fund, Vanguard Target Retirement 2025 Fund, Vanguard Target Retirement 2030 Fund and Vanguard Target Retirement 2035 Fund
Opinions on the Financial Statements
We have audited the accompanying statements of net assets and statements of assets and liabilities of Vanguard Target Retirement Income Fund, Vanguard Target Retirement 2015 Fund, Vanguard Target Retirement 2020 Fund, Vanguard Target Retirement 2025 Fund, Vanguard Target Retirement 2030 Fund and Vanguard Target Retirement 2035 Fund (six of the funds constituting Vanguard Chester Funds, hereafter collectively referred to as the “Funds”) as of September 30, 2019, the related statements of operations for the year ended September 30, 2019, the statements of changes in net assets for each of the two years in the period ended September 30, 2019, including the related notes, and the financial highlights for each of the five years in the period ended September 30, 2019 (collectively referred to as the “financial statements”). In our opinion, the financial statements present fairly, in all material respects, the financial position of each of the Funds as of September 30, 2019, the results of each of their operations for the year then ended, the changes in each of their net assets for each of the two years in the period ended September 30, 2019 and each of the financial highlights for each of the five years in the period ended September 30, 2019 in conformity with accounting principles generally accepted in the United States of America.
Basis for Opinions
These financial statements are the responsibility of the Funds’ management. Our responsibility is to express an opinion on the Funds’ financial statements based on our audits. We are a public accounting firm registered with the Public Company Accounting Oversight Board (United States) (“PCAOB”) and are required to be independent with respect to the Funds in accordance with the U.S. federal securities laws and the applicable rules and regulations of the Securities and Exchange Commission and the PCAOB.
We conducted our audits of these financial statements in accordance with the standards of the PCAOB. Those standards require that we plan and perform the audit to obtain reasonable assurance about whether the financial statements are free of material misstatement, whether due to error or fraud.
Our audits included performing procedures to assess the risks of material misstatement of the financial statements, whether due to error or fraud, and performing procedures that respond to those risks. Such procedures included examining, on a test basis, evidence regarding the amounts and disclosures in the financial statements. Our audits also included evaluating the accounting principles used and significant estimates made by management, as well as evaluating the overall presentation of the financial statements. Our procedures included confirmation of securities owned as of September 30, 2019 by correspondence with the transfer agent. We believe that our audits provide a reasonable basis for our opinions.
/s/PricewaterhouseCoopers LLP
Philadelphia, Pennsylvania
November 13, 2019
We have served as the auditor of one or more investment companies in The Vanguard Group of Funds since 1975.
71
Special 2019 tax information (unaudited) for Vanguard Target Retirement Funds
This information for the fiscal year ended September 30, 2019, is included pursuant to provisions of the Internal Revenue Code.
The funds distributed capital gain dividends (from net long-term capital gains) to shareholders during the fiscal year as follows:
Fund | | ($000 | ) |
Target Retirement Income Fund | | $224,912 | |
Target Retirement 2015 Fund | | 667,010 | |
Target Retirement 2020 Fund | | 677,118 | |
Target Retirement 2025 Fund | | 138,391 | |
Target Retirement 2030 Fund | | 6,553 | |
Target Retirement 2035 Fund | | 4,138 | |
For nonresident alien shareholders, 100% of short-term capital gain dividends distributed by the funds are qualified short-term capital gains.
The funds distributed qualified dividend income to shareholders during the fiscal year as follows:
Fund | | ($000 | ) |
Target Retirement Income Fund | | 97,821 | |
Target Retirement 2015 Fund | | 116,878 | |
Target Retirement 2020 Fund | | 310,224 | |
Target Retirement 2025 Fund | | 467,367 | |
Target Retirement 2030 Fund | | 446,770 | |
Target Retirement 2035 Fund | | 474,847 | |
For corporate shareholders, the percentage of investment income (dividend income plus short-term gains, if any) that qualifies for the dividends-received deduction is as follows:
Fund | | Percentage | |
Target Retirement Income Fund | | 10.9% | |
Target Retirement 2015 Fund | | 14.2 | |
Target Retirement 2020 Fund | | 19.2 | |
Target Retirement 2025 Fund | | 22.1 | |
Target Retirement 2030 Fund | | 26.8 | |
Target Retirement 2035 Fund | | 30.1 | |
72
The funds designate to shareholders foreign source income and foreign taxes paid as follows:
| | Foreign Source Income | | Foreign Taxes Paid | |
Fund | | ($000 | ) | ($000 | ) |
Target Retirement Income Fund | | $140,335 | | $4,851 | |
Target Retirement 2015 Fund | | 146,095 | | 5,961 | |
Target Retirement 2020 Fund | | 335,291 | | 16,334 | |
Target Retirement 2025 Fund | | 471,394 | | 25,070 | |
Target Retirement 2030 Fund | | 420,021 | | 24,391 | |
Target Retirement 2035 Fund | | 410,999 | | 25,644 | |
Shareholders will receive more detailed information with their Form 1099-DIV in January 2020 to determine the calendar-year amounts to be included on their 2019 tax returns.
73
BLOOMBERG is a trademark and service mark of Bloomberg Finance L.P. BARCLAYS is a trademark and service mark of Barclays Bank Plc, used under license. Bloomberg Finance L.P. and its affiliates, including Bloomberg Index Services Limited (BISL) (collectively, Bloomberg), or Bloomberg’s licensors, own all proprietary rights in the Bloomberg Barclays U.S. Aggregate Bond Index, Bloomberg Barclays U.S. Aggregate Float Adjusted Index, Bloomberg Barclays U.S. Treasury Inflation Protected Securities Index, Bloomberg Barclays U.S. Treasury Inflation-Protected Securities (TIPS) 0–5 Year Index, and the Bloomberg Barclays Global Aggregate ex-USD Float Adjusted RIC Capped Index (USD Hedged) (the Indices or Bloomberg Barclays Indices).
Neither Barclays Bank Plc, Barclays Capital Inc., or any affiliate (collectively Barclays) or Bloomberg is the issuer or producer of the Target Retirement Funds (including the Total Bond Market II Index Fund, the Total International Bond Index Fund, and the Short-Term Inflation-Protected Securities Index Fund) and neither Bloomberg nor Barclays has any responsibilities, obligations or duties to investors in the Target Retirement Funds. The Indices are licensed for use by The Vanguard Group, Inc. (Vanguard) as the sponsor of the Target Retirement Funds. Bloomberg and Barclays’ only relationship with Vanguard in respect to the Indices is the licensing of the Indices, which is determined, composed and calculated by BISL, or any successor thereto, without regard to the Issuer or the Target Retirement Funds or the owners of the Target Retirement Funds.
Additionally, Vanguard may for itself execute transaction(s) with Barclays in or relating to the Indices in connection with the Target Retirement Funds. Investors acquire the Target Retirement Funds from Vanguard and investors neither acquire any interest in the Indices nor enter into any relationship of any kind whatsoever with Bloomberg or Barclays upon making an investment in the Target Retirement Funds. The Target Retirement Funds are not sponsored, endorsed, sold or promoted by Bloomberg or Barclays. Neither Bloomberg nor Barclays makes any representation or warranty, express or implied regarding the advisability of investing in the Target Retirement Funds or the advisability of investing in securities generally or the ability of the Indices to track corresponding or relative market performance. Neither Bloomberg nor Barclays has passed on the legality or suitability of the Target Retirement Funds with respect to any person or entity. Neither Bloomberg nor Barclays is responsible for and has not participated in the determination of the timing of, prices at, or quantities of the Target Retirement Funds to be issued. Neither Bloomberg nor Barclays has any obligation to take the needs of the Issuer or the owners of the Target Retirement Funds or any other third party into consideration in determining, composing or calculating the Indices. Neither Bloomberg nor Barclays has any obligation or liability in connection with administration, marketing or trading of the Target Retirement Funds.
74
The licensing agreement between Bloomberg and Barclays is solely for the benefit of Bloomberg and Barclays and not for the benefit of the owners of the Target Retirement Funds, investors or other third parties. In addition, the licensing agreement between Vanguard and Bloomberg is solely for the benefit of Vanguard and Bloomberg and not for the benefit of the owners of the Target Retirement Funds, investors or other third parties.
NEITHER BLOOMBERG NOR BARCLAYS SHALL HAVE ANY LIABILITY TO THE ISSUER, INVESTORS OR TO OTHER THIRD PARTIES FOR THE QUALITY, ACCURACY AND/OR COMPLETENESS OF THE BLOOMBERG BARCLAYS INDICES OR ANY DATA INCLUDED THEREIN OR FOR INTERRUPTIONS IN THE DELIVERY OF THE BLOOMBERG BARCLAYS INDICES. NEITHER BLOOMBERG NOR BARCLAYS MAKES ANY WARRANTY, EXPRESS OR IMPLIED, AS TO RESULTS TO BE OBTAINED BY THE ISSUER, THE INVESTORS OR ANY OTHER PERSON OR ENTITY FROM THE USE OF THE BLOOMBERG BARCLAYS INDICES OR ANY DATA INCLUDED THEREIN. NEITHER BLOOMBERG NOR BARCLAYS MAKES ANY EXPRESS OR IMPLIED WARRANTIES, AND EACH HEREBY EXPRESSLY DISCLAIMS ALL WARRANTIES OF MERCHANTABILITY OR FITNESS FOR A PARTICULAR PURPOSE OR USE WITH RESPECT TO BLOOMBERG BARCLAYS INDICES OR ANY DATA INCLUDED THEREIN. BLOOMBERG RESERVES THE RIGHT TO CHANGE THE METHODS OF CALCULATION OR PUBLICATION, OR TO CEASE THE CALCULATION OR PUBLICATION OF THE BLOOMBERG BARCLAYS INDICES, AND NEITHER BLOOMBERG NOR BARCLAYS SHALL BE LIABLE FOR ANY MISCALCULATION OF OR ANY INCORRECT, DELAYED OR INTERRUPTED PUBLICATION WITH RESPECT TO ANY OF THE BLOOMBERG BARCLAYS INDICES. NEITHER BLOOMBERG NOR BARCLAYS SHALL BE LIABLE FOR ANY DAMAGES, INCLUDING, WITHOUT LIMITATION, ANY SPECIAL, INDIRECT OR CONSEQUENTIAL DAMAGES, OR ANY LOST PROFITS AND EVEN IF ADVISED OF THE POSSIBILITY OF SUCH, RESULTING FROM THE USE OF BLOOMBERG BARCLAYS INDICES OR ANY DATA INCLUDED THEREIN OR WITH RESPECT TO THE TARGET RETIREMENT FUNDS.
None of the information supplied by Bloomberg or Barclays and used in this publication may be reproduced in any manner without the prior written permission of both Bloomberg and Barclays Capital, the investment banking division of Barclays Bank Plc. Barclays Bank Plc is registered in England No. 1026167. Registered office 1 Churchill Place London E14 5HP.
© 2019 Bloomberg. Used with Permission.
Source: Bloomberg Index Services Limited. Copyright 2019, Bloomberg. All rights reserved.
75
This page intentionally left blank.
This page intentionally left blank.
This page intentionally left blank.
This page intentionally left blank.
This page intentionally left blank.
This page intentionally left blank.
This page intentionally left blank.
The People Who Govern Your Fund
The trustees of your mutual fund are there to see that the fund is operated and managed in your best interests since, as a shareholder, you are a part owner of the fund. Your fund’s trustees also serve on the board of directors of The Vanguard Group, Inc., which is owned by the Vanguard funds and provides services to them.
A majority of Vanguard’s board members are independent, meaning that they have no affiliation with Vanguard or the funds they oversee, apart from the sizable personal investments they have made as private individuals. The independent board members have distinguished backgrounds in business, academia, and public service. Each of the trustees and executive officers oversees 212 Vanguard funds.
Information for each trustee and executive officer of the fund appears below. That information, as well as the Vanguard fund count, is as of the date on the cover of this fund report. The mailing address of the trustees and officers is P.O. Box 876, Valley Forge, PA 19482. More information about the trustees is in the Statement of Additional Information, which can be obtained, without charge, by contacting Vanguard at 800-662-7447, or online at vanguard.com.
Interested Trustee1
Mortimer J. Buckley
Born in 1969. Trustee since January 2018. Principal occupation(s) during the past five years and other experience: chairman of the board (January 2019–present) of Vanguard and of each of the investment companies served by Vanguard; chief executive officer (January 2018–present) of Vanguard; chief executive officer, president, and trustee (January 2018–present) of each of the investment companies served by Vanguard; president and director (2017–present) of Vanguard; and president (February 2018–present) of Vanguard Marketing Corporation. Chief investment officer (2013–2017), managing director (2002–2017), head of the Retail Investor Group (2006–2012), and chief information officer (2001–2006) of Vanguard. Chairman of the board (2011–2017) and trustee (2009–2017) of the Children’s Hospital of Philadelphia; trustee (2018–present) of The Shipley School.
Independent Trustees
Emerson U. Fullwood
Born in 1948. Trustee since January 2008. Principal occupation(s) during the past five years and other experience: executive chief staff and marketing officer for North America and corporate vice president (retired 2008) of Xerox Corporation (document management products and services). Former president of the Worldwide Channels Group, Latin America, and Worldwide Customer Service and executive chief staff officer of Developing Markets of Xerox. Executive in residence and 2009–2010 Distinguished Minett Professor at the Rochester Institute of Technology. Director of SPX FLOW, Inc. (multi-industry manufacturing). Director of the University of Rochester Medical Center, the Monroe Community College Foundation, the United Way of Rochester, North Carolina A&T University, and Roberts Wesleyan College. Trustee of the University of Rochester.
Amy Gutmann
Born in 1949. Trustee since June 2006. Principal occupation(s) during the past five years and other experience: president (2004–present) of the University of Pennsylvania. Christopher H. Browne Distinguished Professor of Political Science, School of Arts and Sciences, and professor of communication, Annenberg School for Communication, with secondary faculty appointments in the Department of Philosophy, School of Arts and Sciences, and at the Graduate School of Education, University of Pennsylvania. Trustee of the National Constitution Center.
F. Joseph Loughrey
Born in 1949. Trustee since October 2009. Principal occupation(s) during the past five years and other experience: president and chief operating officer (retired 2009) and vice chairman of the board (2008–2009) of Cummins Inc. (industrial machinery). Chairman of the board of Hillenbrand, Inc. (specialized consumer services), and the Lumina Foundation.
1 Mr. Buckley is considered an “interested person,” as defined in the Investment Company Act of 1940, because he is an officer of the Vanguard funds.
Director of the V Foundation and Oxfam America. Member of the advisory council for the College of Arts and Letters and chair of the advisory board to the Kellogg Institute for International Studies, both at the University of Notre Dame.
Mark Loughridge
Born in 1953. Trustee since March 2012. Principal occupation(s) during the past five years and other experience: senior vice president and chief financial officer (retired 2013) of IBM (information technology services). Fiduciary member of IBM’s Retirement Plan Committee (2004–2013), senior vice president and general manager (2002–2004) of IBM Global Financing, vice president and controller (1998–2002) of IBM, and a variety of other prior management roles at IBM. Member of the Council on Chicago Booth.
Scott C. Malpass
Born in 1962. Trustee since March 2012. Principal occupation(s) during the past five years and other experience: chief investment officer (1989–present) and vice president (1996–present) of the University of Notre Dame. Assistant professor of finance at the Mendoza College of Business, University of Notre Dame, and member of the Notre Dame 403(b) Investment Committee. Chairman of the board of TIFF Advisory Services, Inc. Member of the board of Catholic Investment Services, Inc. (investment advisors) and the board of superintendence of the Institute for the Works of Religion.
Deanna Mulligan
Born in 1963. Trustee since January 2018. Principal occupation(s) during the past five years and other experience: president (2010–present) and chief executive officer (2011–present) of The Guardian Life Insurance Company of America. Chief operating officer (2010–2011) and executive vice president (2008–2010) of Individual Life and Disability of The Guardian Life Insurance Company of America. Member of the board of The Guardian Life Insurance Company of America, the American Council of Life Insurers, the Partnership for New York City (business leadership), and the Committee Encouraging Corporate Philanthropy. Trustee of the Economic Club of New York and the Bruce Museum (arts and science). Member of the Advisory Council for the Stanford Graduate School of Business.
André F. Perold
Born in 1952. Trustee since December 2004. Principal occupation(s) during the past five years and other experience: George Gund Professor of Finance and Banking, Emeritus at the Harvard Business School (retired 2011). Chief investment officer and co-managing partner of HighVista Strategies LLC (private investment firm). Board of advisors and investment committee member of the Museum of Fine Arts Boston. Board member (2018–present) of RIT Capital Partners (investment firm); investment committee member of Partners Health Care System.
Sarah Bloom Raskin
Born in 1961. Trustee since January 2018. Principal occupation(s) during the past five years and other experience: deputy secretary (2014–2017) of the United States Department of the Treasury. Governor (2010–2014) of the Federal Reserve Board. Commissioner (2007–2010) of financial regulation for the State of Maryland. Member of the board of directors (2012–2014) of Neighborhood Reinvestment Corporation. Director (2017–present) of i(x) Investments, LLC; director (2017–present) of Reserve Trust. Rubinstein Fellow (2017–present) of Duke University; trustee (2017–present) of Amherst College.
Peter F. Volanakis
Born in 1955. Trustee since July 2009. Principal occupation(s) during the past five years and other experience: president and chief operating officer (retired 2010) of Corning Incorporated (communications equipment) and director of Corning Incorporated (2000–2010) and Dow Corning (2001–2010). Director (2012) of SPX Corporation (multi-industry manufacturing). Overseer of the Amos Tuck School of Business Administration, Dartmouth College (2001–2013). Chairman of the board of trustees of Colby-Sawyer College. Member of the board of Hypertherm Inc. (industrial cutting systems, software, and consumables).
Executive Officers
Glenn Booraem
Born in 1967. Principal occupation(s) during the past five years and other experience: principal of Vanguard. Investment stewardship officer (2017–present), treasurer (2015–2017), controller (2010–2015), and assistant controller (2001–2010) of each of the investment companies served by Vanguard.
Christine M. Buchanan
Born in 1970. Principal occupation(s) during the past five years and other experience: principal of Vanguard and global head of Fund Administration at Vanguard. Treasurer (2017–present) of each of the investment companies served by Vanguard. Partner (2005–2017) at KPMG LLP (audit, tax, and advisory services).
Thomas J. Higgins
Born in 1957. Principal occupation(s) during the past five years and other experience: principal of Vanguard. Chief financial officer (2008–present) and treasurer (1998–2008) of each of the investment companies served by Vanguard.
Peter Mahoney
Born in 1974. Principal occupation(s) during the past five years and other experience: principal of Vanguard. Controller (2015–present) of each of the investment companies served by Vanguard. Head of International Fund Services (2008–2014) at Vanguard.
Anne E. Robinson
Born in 1970. Principal occupation(s) during the past five years and other experience: general counsel (2016–present) of Vanguard. Secretary (2016–present) of Vanguard and of each of the investment companies served by Vanguard. Managing director (2016–present) of Vanguard. Director and senior vice president (2016–2018) of Vanguard Marketing Corporation. Managing director and general counsel of Global Cards and Consumer Services (2014–2016) at Citigroup. Counsel (2003–2014) at American Express.
Michael Rollings
Born in 1963. Principal occupation(s) during the past five years and other experience: finance director (2017–present) and treasurer (2017) of each of the investment companies served by Vanguard. Managing director (2016–present) of Vanguard. Chief financial officer (2016–present) of Vanguard. Director (2016–present) of Vanguard Marketing Corporation. Executive vice president and chief financial officer (2006–2016) of MassMutual Financial Group.
John E. Schadl
Born in 1972. Principal occupation(s) during the past five years and other experience: principal of Vanguard. Chief compliance officer (2019–present) of Vanguard and of each of the investment companies served by Vanguard. Assistant vice president (May 2019–present) of Vanguard Marketing Corporation.
Vanguard Senior Management Team
Joseph Brennan | Chris D. McIsaac |
Mortimer J. Buckley | James M. Norris |
Gregory Davis | Thomas M. Rampulla |
John James | Karin A. Risi |
Martha G. King | Anne E. Robinson |
John T. Marcante | Michael Rollings |
| 
|
| |
| P.O. Box 2600 |
| Valley Forge, PA 19482-2600 |
Connect with Vanguard® > vanguard.com
Fund Information > 800-662-7447
Direct Investor Account Services > 800-662-2739
Institutional Investor Services > 800-523-1036
Text Telephone for People
Who Are Deaf or Hard of Hearing > 800-749-7273
This material may be used in conjunction with the offering of shares of any Vanguard fund only if preceded or accompanied by the fund’s current prospectus.
All comparative mutual fund data are from Morningstar, Inc., unless otherwise noted.
You can obtain a free copy of Vanguard’s proxy voting guidelines by visiting vanguard.com/proxyreporting or by calling Vanguard at 800-662-2739. The guidelines are also available from the SEC’s website, www.sec.gov. In addition, you may obtain a free report on how your fund voted the proxies for securities it owned during the 12 months ended June 30. To get the report, visit either vanguard.com/proxyreporting or www.sec.gov.
You can review information about your fund on the SEC’s website, and you can receive copies of this information, for a fee, by sending a request via email addressed to publicinfo@sec.gov.
| © 2019 The Vanguard Group, Inc. |
| All rights reserved. |
| Vanguard Marketing Corporation, Distributor. |
| |
| Q3080 112019 |

Annual Report | September 30, 2019 Vanguard Target Retirement Funds |
Vanguard Target Retirement 2040 Fund Vanguard Target Retirement 2045 Fund Vanguard Target Retirement 2050 Fund Vanguard Target Retirement 2055 Fund Vanguard Target Retirement 2060 Fund Vanguard Target Retirement 2065 Fund See the inside front cover for important information about access to your fund’s annual and semiannual shareholder reports. |
Important information about access to shareholder reports
Beginning on January 1, 2021, as permitted by regulations adopted by the Securities and Exchange Commission, paper copies of your fund’s annual and semiannual shareholder reports will no longer be sent to you by mail, unless you specifically request them. Instead, you will be notified by mail each time a report is posted on the website and will be provided with a link to access the report.
If you have already elected to receive shareholder reports electronically, you will not be affected by this change and do not need to take any action. You may elect to receive shareholder reports and other communications from the fund electronically by contacting your financial intermediary (such as a broker-dealer or bank) or, if you invest directly with the fund, by calling Vanguard at one of the phone numbers on the back cover of this report or by logging on to vanguard.com.
You may elect to receive paper copies of all future shareholder reports free of charge. If you invest through a financial intermediary, you can contact the intermediary to request that you continue to receive paper copies. If you invest directly with the fund, you can call Vanguard at one of the phone numbers on the back cover of this report or log on to vanguard.com. Your election to receive paper copies will apply to all the funds you hold through an intermediary or directly with Vanguard.
Contents
| |
A Note From Our Chairman | 1 |
Your Fund’s Performance at a Glance | 2 |
About Your Fund’s Expenses | 3 |
Target Retirement 2040 Fund | 5 |
Target Retirement 2045 Fund | 16 |
Target Retirement 2050 Fund | 27 |
Target Retirement 2055 Fund | 38 |
Target Retirement 2060 Fund | 48 |
Target Retirement 2065 Fund | 59 |
Please note: The opinions expressed in this report are just that—informed opinions. They should not be considered promises or advice. Also, please keep in mind that the information and opinions cover the period through the date on the front of this report. Of course, the risks of investing in your fund are spelled out in the prospectus.
A Note From Our Chairman

Tim Buckley
Chairman and Chief Executive Officer
Dear Shareholder,
Recent volatility in financial markets—affecting stocks, bonds, and commodities—has been a good reminder of the wise old adage, “Never keep all your eggs in one basket.” Maintaining balance and diversification in your investment portfolio can help to both limit risk and set you up for long-term success.
It’s understandable why some investors might become complacent after a long market run-up like the one that lifted stock prices, especially U.S. stock prices, in the years following the global financial crisis. But failing to rebalance regularly can leave a portfolio with a much different mix of assets than intended and, often, more risk than intended.
Balance across and diversification within asset classes are powerful tools for managing risk and achieving your investment goals. A portfolio’s allocation will determine a large portion of its long-term return and also the majority of its volatility risk. A well-diversified portfolio is less vulnerable to significant swings in the performance of any one segment of the asset classes in which it invests.
Balance and diversification will never eliminate the risk of loss, nor will they guarantee positive returns in a declining market. But they should reduce the chance that you’ll suffer disproportionate losses in one particular high-flying asset class or sector when it comes back to earth. And exposure to all key market components should give you at least some participation in the sectors that are performing best at any given time.
Vanguard is committed to helping you achieve balance and diversification in your portfolios to help meet your investment goals. We thank you for your continued loyalty.
Sincerely,

Mortimer J. Buckley
Chairman and Chief Executive Officer
October 14, 2019
1
Your Fund’s Performance at a Glance
· For the 12 months ended September 30, 2019, the six Vanguard Target Retirement Funds covered in this report recorded returns ranging from 2.06% for the Target Retirement 2045 Fund to 2.63% for the Target Retirement 2040 Fund. (The funds with target dates of 2015 through 2035, as well as the Target Retirement Income Fund, are covered in a separate report.)
· Each fund performed in line with its composite benchmark after expenses. The Target Retirement Funds invest all of their assets in Vanguard index funds that seek to match the performance of broad stock and bond market indexes.
· Global stock markets cooled during the funds’ fiscal year. U.S. shares gained less than 3%, while non-U.S. shares returned roughly –1% in U.S. dollars. Worries about the pace of global economic growth and central bank plans to loosen monetary policies virtually worldwide encouraged investment in bonds, sending their yields lower and their prices markedly higher. Broad measures of both the U.S. and non-U.S. investment-grade bond markets returned more than 10%.
· Vanguard Target Retirement Funds are designed to reach an allocation of 70% bonds and 30% stocks within seven years after their target dates.
· For the ten years ended September 30—or since inception for the three newest funds—the average annual returns ranged from 7.11% for the Target Retirement 2065 Fund to 10.06% for the Target Retirement 2055 Fund.
Market Barometer | | | | | | | |
| | Average Annual Total Returns | |
| | Periods Ended September 30, 2019 | |
| | One Year | | Three Years | | Five Years | |
Stocks | | | | | | | |
Russell 1000 Index (Large-caps) | | 3.87% | | 13.19% | | 10.62% | |
Russell 2000 Index (Small-caps) | | -8.89 | | 8.23 | | 8.19 | |
Russell 3000 Index (Broad U.S. market) | | 2.92 | | 12.83 | | 10.44 | |
FTSE All-World ex US Index (International) | | -1.12 | | 6.46 | | 3.24 | |
| | | | | | | |
Bonds | | | | | | | |
Bloomberg Barclays U.S. Aggregate Bond Index (Broad taxable market) | | 10.30% | | 2.92% | | 3.38% | |
Bloomberg Barclays Municipal Bond Index (Broad tax-exempt market) | | 8.55 | | 3.19 | | 3.66 | |
FTSE Three-Month U.S. Treasury Bill Index | | 2.36 | | 1.52 | | 0.95 | |
| | | | | | | |
CPI | | | | | | | |
Consumer Price Index | | 1.71% | | 2.07% | | 1.53% | |
2
About Your Fund’s Expenses
As a shareholder of the fund, you incur ongoing costs, which include costs for portfolio management, administrative services, and shareholder reports (like this one), among others. Operating expenses, which are deducted from a fund’s gross income, directly reduce the investment return of the fund.
A typical fund’s expenses are expressed as a percentage of its average net assets. The Target Retirement Funds have no direct expenses, but each fund bears its proportionate share of the costs for the underlying funds in which it invests. These indirect expenses make up the acquired fund fees and expenses, also expressed as a percentage of average net assets.
The following examples are intended to help you understand the ongoing cost (in dollars) of investing in your fund and to compare these costs with those of other mutual funds. The examples are based on an investment of $1,000 made at the beginning of the period shown and held for the entire period. The costs were calculated using the acquired fund fees and expenses for each Target Retirement Fund.
The accompanying table illustrates your fund’s costs in two ways:
· Based on actual fund return. This section helps you to estimate the actual expenses that you paid over the period. The “Ending Account Value” shown is derived from the fund’s actual return, and the third column shows the dollar amount that would have been paid by an investor who started with $1,000 in the fund. You may use the information here, together with the amount you invested, to estimate the expenses that you paid over the period.
To do so, simply divide your account value by $1,000 (for example, an $8,600 account value divided by $1,000 = 8.6), then multiply the result by the number given for your fund under the heading “Expenses Paid During Period.”
· Based on hypothetical 5% yearly return. This section is intended to help you compare your fund’s costs with those of other mutual funds. It assumes that the fund had a yearly return of 5% before expenses, but that the expense ratio is unchanged. In this case—because the return used is not the fund’s actual return—the results do not apply to your investment. The example is useful in making comparisons because the Securities and Exchange Commission requires all mutual funds to calculate expenses based on a 5% return. You can assess your fund’s costs by comparing this hypothetical example with the hypothetical examples that appear in shareholder reports of other funds.
Note that the expenses shown in the table are meant to highlight and help you compare ongoing costs only and do not reflect transaction costs incurred by the fund for buying and selling securities. Further, the expenses do not include any purchase, redemption, or account service fees described in the fund prospectus. If such fees were applied to your account, your costs would be higher. Your fund does not carry a “sales load.”
The calculations assume no shares were bought or sold during the period. Your actual costs may have been higher or lower, depending on the amount of your investment and the timing of any purchases or redemptions.
You can find more information about the fund’s expenses, including annual expense ratios, in the Financial Statements section of this report. For additional information on operating expenses and other shareholder costs, please refer to your fund’s current prospectus.
3
Six Months Ended September 30, 2019 | | | | | | | | |
| | | | Beginning | | Ending | | Expenses |
| | | | Account Value | | Account Value | | Paid During |
| | | | 3/31/2019 | | 9/30/2019 | | Period |
Based on Actual Fund Return | | | | | | | | |
Target Retirement 2040 Fund | | | | $1,000.00 | | $1,039.61 | | $0.72 |
Target Retirement 2045 Fund | | | | $1,000.00 | | $1,037.73 | | $0.77 |
Target Retirement 2050 Fund | | | | $1,000.00 | | $1,037.78 | | $0.77 |
Target Retirement 2055 Fund | | | | $1,000.00 | | $1,037.60 | | $0.77 |
Target Retirement 2060 Fund | | | | $1,000.00 | | $1,037.69 | | $0.77 |
Target Retirement 2065 Fund | | | | $1,000.00 | | $1,037.97 | | $0.77 |
Based on Hypothetical 5% Yearly Return | | | | | | | | |
Target Retirement 2040 Fund | | | | $1,000.00 | | $1,024.37 | | $0.71 |
Target Retirement 2045 Fund | | | | $1,000.00 | | $1,024.32 | | $0.76 |
Target Retirement 2050 Fund | | | | $1,000.00 | | $1,024.32 | | $0.76 |
Target Retirement 2055 Fund | | | | $1,000.00 | | $1,024.32 | | $0.76 |
Target Retirement 2060 Fund | | | | $1,000.00 | | $1,024.32 | | $0.76 |
Target Retirement 2065 Fund | | | | $1,000.00 | | $1,024.32 | | $0.76 |
The calculations are based on the acquired fund fees and expenses for the most recent six-month period. The funds’ annualized expense figures for the period are (in order as listed from top to bottom above) 0.14%, 0.15%, 0.15%, 0.15%, 0.15%, and 0.15%. The dollar amounts shown as “Expenses Paid” are equal to the annualized average weighted expense ratio for the underlying funds multiplied by the average account value over the period, multiplied by the number of days in the most recent six-month period, then divided by the number of days in the most recent 12-month period (183/365).
4
Target Retirement 2040 Fund
Performance Summary
All of the returns in this report represent past performance, which is not a guarantee of future results that may be achieved by the fund. (Current performance may be lower or higher than the performance data cited. For performance data current to the most recent month-end, visit our website at vanguard.com/performance.) Note, too, that both investment returns and principal value can fluctuate widely, so an investor’s shares, when sold, could be worth more or less than their original cost. The returns shown do not reflect taxes that a shareholder would pay on fund distributions or on the sale of fund shares.
Cumulative Performance: September 30, 2009, Through September 30, 2019
Initial Investment of $10,000
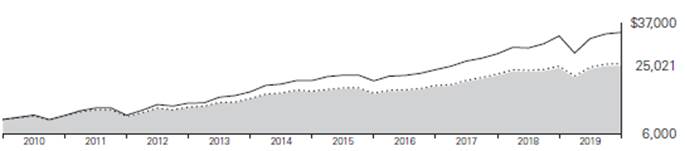
| | | | Average Annual Total Returns | | |
| | | | Periods Ended September 30, 2019 | | |
| | | | | | | | | | Final Value |
| | | | One
Year | | Five
Years | | Ten
Years | | of a $10,000
Investment |

| | Target Retirement 2040 Fund | | 2.63% | | 7.15% | | 9.61% | | $25,021 |

| | Target 2040 Composite Index | | 2.83 | | 7.39 | | 9.87 | | 25,635 |

| | MSCI US Broad Market Index | | 2.91 | | 10.47 | | 13.15 | | 34,386 |
Target 2040 Composite Index: Derived by applying the fund’s target asset allocation to the results of the following benchmarks: for international stocks of developed markets, the MSCI EAFE Index through December 15, 2010, the MSCI ACWI ex USA IMI Index through June 2, 2013, and the FTSE Global All Cap ex US Index thereafter; for emerging-market stocks, the Select Emerging Markets Index through August 23, 2006, the MSCI Emerging Markets Index through December 15, 2010, the MSCI ACWI ex USA IMI Index through June 2, 2013, and the FTSE Global All Cap ex US Index thereafter; for U.S. bonds, the Bloomberg Barclays U.S. Aggregate Bond Index through December 31, 2009, and the Bloomberg Barclays U.S. Aggregate Float Adjusted Index thereafter; for international bonds, the Bloomberg Barclays Global Aggregate ex-USD Float Adjusted RIC Capped Index Hedged beginning June 3, 2013; and for U.S. stocks, the MSCI US Broad Market Index through June 2, 2013, and the CRSP US Total Market Index thereafter. International stock benchmark returns are adjusted for withholding taxes.
See Financial Highlights for dividend and capital gains information.
5
Target Retirement 2040 Fund
Underlying Vanguard Funds
As of September 30, 2019
Vanguard Total Stock Market Index Fund Investor Shares | | 50.0% | |
Vanguard Total International Stock Index Fund Investor Shares | | 33.3 | |
Vanguard Total Bond Market II Index Fund Investor Shares | | 11.7 | |
Vanguard Total International Bond Index Fund Investor Shares | | 5.0 | |
6
Target Retirement 2040 Fund
Financial Statements
Statement of Net Assets
As of September 30, 2019
The fund files its complete schedule of portfolio holdings with the Securities and Exchange Commission (SEC) for the first and third quarters of each fiscal year as an exhibit to its reports on Form N-PORT. The fund’s Form N-PORT reports are available on the SEC’s website at www.sec.gov.
| | | | | Market | |
| | | | | Value· | |
| | | Shares | | ($000 | ) |
Investment Companies (100.1%) | | | | | |
U.S. Stock Fund (50.1%) | | | | | |
Vanguard Total Stock Market Index Fund Investor Shares | | 198,136,989 | | 14,559,106 | |
| | | | | |
International Stock Fund (33.3%) | | | | | |
Vanguard Total International Stock Index Fund Investor Shares | | 583,719,421 | | 9,672,231 | |
| | | | | |
U.S. Bond Fund (11.7%) | | | | | |
1 Vanguard Total Bond Market II Index Fund Investor Shares | | 306,536,251 | | 3,396,422 | |
| | | | | |
International Bond Fund (5.0%) | | | | | |
Vanguard Total International Bond Index Fund Investor Shares | | 122,842,775 | | 1,444,631 | |
Total Investment Companies (Cost $20,840,395) | | | | 29,072,390 | |
Temporary Cash Investment (0.0%) | | | | | |
Money Market Fund (0.0%) | | | | | |
1 Vanguard Market Liquidity Fund, 2.098% (Cost $9,867) | | 98,662 | | 9,867 | |
Total Investments (100.1%) (Cost $20,850,262) | | | | 29,082,257 | |
Other Assets and Liabilities (-0.1%) | | | | | |
Other Assets | | | | 27,083 | |
Liabilities | | | | (66,556 | ) |
| | | | (39,473 | ) |
Net Assets (100%) | | | | | |
Applicable to 779,242,914 outstanding $.001 par value shares of beneficial interest (unlimited authorization) | | | | 29,042,784 | |
Net Asset Value Per Share | | | | $37.27 | |
7
Target Retirement 2040 Fund
| | Amount | |
| | ($000 | ) |
Statement of Assets and Liabilities | | | |
Assets | | | |
Investments in Securities, at Value—Affiliated Funds | | 29,082,257 | |
Receivables for Accrued Income | | 8,325 | |
Receivables for Capital Shares Issued | | 18,758 | |
Total Assets | | 29,109,340 | |
Liabilities | | | |
Payables for Investment Securities Purchased | | 30,489 | |
Payables for Capital Shares Redeemed | | 36,067 | |
Total Liabilities | | 66,556 | |
Net Assets | | 29,042,784 | |
| | | |
| | | |
At September 30, 2019, net assets consisted of: | | | |
| | | |
| | Amount | |
| | ($000 | ) |
Paid-in Capital | | 20,386,854 | |
Total Distributable Earnings (Loss) | | 8,655,930 | |
Net Assets | | 29,042,784 | |
· See Note A in Notes to Financial Statements.
1 Affiliated fund available only to Vanguard funds and certain trusts and accounts managed by Vanguard. Rate shown for Vanguard Market Liquidity Fund is the 7-day yield.
See accompanying Notes, which are an integral part of the Financial Statements.
8
Target Retirement 2040 Fund
Statement of Operations
| Year Ended |
| September 30, 2019 |
| ($000) |
Investment Income | |
Income | |
Income Distributions Received from Affiliated Funds | 634,780 |
Net Investment Income—Note B | 634,780 |
Realized Net Gain (Loss) | |
Capital Gain Distributions Received from Affiliated Funds | — |
Affiliated Funds Sold | (8,099) |
Futures Contracts | (94) |
Realized Net Gain (Loss) | (8,193) |
Change in Unrealized Appreciation (Depreciation) from Affiliated Funds | 137,697 |
Net Increase (Decrease) in Net Assets Resulting from Operations | 764,284 |
See accompanying Notes, which are an integral part of the Financial Statements.
9
Target Retirement 2040 Fund
Statement of Changes in Net Assets
| Year Ended September 30, |
| 2019 | | 2018 |
| ($000) | | ($000) |
Increase (Decrease) in Net Assets | | | |
Operations | | | |
Net Investment Income | 634,780 | | 535,805 |
Realized Net Gain (Loss) | (8,193) | | 40,240 |
Change in Unrealized Appreciation (Depreciation) | 137,697 | | 1,586,712 |
Net Increase (Decrease) in Net Assets Resulting from Operations | 764,284 | | 2,162,757 |
Distributions | | | |
Net Investment Income | (559,639) | | (450,227) |
Realized Capital Gain1 | (40,000) | | (9,411) |
Total Distributions | (599,639) | | (459,638) |
Capital Share Transactions | | | |
Issued | 5,852,726 | | 6,304,784 |
Issued in Lieu of Cash Distributions | 590,157 | | 453,171 |
Redeemed | (4,010,068) | | (4,340,003) |
Net Increase (Decrease) from Capital Share Transactions | 2,432,815 | | 2,417,952 |
Total Increase (Decrease) | 2,597,460 | | 4,121,071 |
Net Assets | | | |
Beginning of Period | 26,445,324 | | 22,324,253 |
End of Period | 29,042,784 | | 26,445,324 |
1 Includes fiscal 2019 and 2018 short-term gain distributions totaling $39,425,000 and $8,951,000, respectively. Short-term gain distributions are treated as ordinary income dividends for tax purposes.
See accompanying Notes, which are an integral part of the Financial Statements.
10
Target Retirement 2040 Fund
Financial Highlights
For a Share Outstanding | | | Year Ended September 30, | |
Throughout Each Period | 2019 | 2018 | 2017 | 2016 | 2015 | |
Net Asset Value, Beginning of Period | $37.26 | $34.73 | $30.59 | $28.09 | $29.66 | |
Investment Operations | | | | | | |
Net Investment Income | .8501 | .7861 | .7181 | .660 | .648 | |
Capital Gain Distributions Received | — | .0011 | .0031 | .003 | .007 | |
Net Realized and Unrealized Gain (Loss) on Investments | (.005) | 2.441 | 4.143 | 2.687 | (1.634) | |
Total from Investment Operations | .845 | 3.228 | 4.864 | 3.350 | (.979) | |
Distributions | | | | | | |
Dividends from Net Investment Income | (.779) | (.684) | (.599) | (.615) | (.574) | |
Distributions from Realized Capital Gains | (.056) | (.014) | (.125) | (.235) | (.017) | |
Total Distributions | (.835) | (.698) | (.724) | (.850) | (.591) | |
Net Asset Value, End of Period | $37.27 | $37.26 | $34.73 | $30.59 | $28.09 | |
| | | | | | |
Total Return2 | 2.63% | 9.37% | 16.26% | 12.11% | -3.43% | |
| | | | | | |
Ratios/Supplemental Data | | | | | | |
Net Assets, End of Period (Millions) | $29,043 | $26,445 | $22,324 | $17,371 | $15,724 | |
Ratio of Total Expenses to Average Net Assets | — | — | — | — | — | |
Acquired Fund Fees and Expenses | 0.14% | 0.14% | 0.15% | 0.16% | 0.16% | |
Ratio of Net Investment Income to Average Net Assets | 2.38% | 2.17% | 2.23% | 2.23% | 2.09% | |
Portfolio Turnover Rate | 5% | 8% | 8% | 16% | 21% | |
1 Calculated based on average shares outstanding.
2 Total returns do not include account service fees that may have applied in the periods shown. Fund prospectuses provide information about any applicable account service fees.
See accompanying Notes, which are an integral part of the Financial Statements.
11
Target Retirement 2040 Fund
Notes to Financial Statements
Vanguard Target Retirement 2040 Fund is registered under the Investment Company Act of 1940 as an open-end investment company, or mutual fund. The fund follows a balanced investment strategy by investing in selected Vanguard funds to achieve its targeted allocation of assets to U.S. and international stocks, and U.S. and international bonds. Financial statements and other information about each underlying fund are available on vanguard.com.
A. The following significant accounting policies conform to generally accepted accounting principles for U.S. investment companies. The fund consistently follows such policies in preparing its financial statements.
1. Security Valuation: Investments are valued at the net asset value of each underlying Vanguard fund determined as of the close of the New York Stock Exchange (generally 4 p.m., Eastern time) on the valuation date.
2. Futures Contracts: The fund uses stock and bond futures contracts to a limited extent, with the objectives of maintaining full exposure to the market and maintaining its target asset allocation. The primary risks associated with the use of futures contracts are imperfect correlation between changes in market values of investments held by the fund and the prices of futures contracts, and the possibility of an illiquid market. Counterparty risk involving futures is mitigated because a regulated clearinghouse is the counterparty instead of the clearing broker. To further mitigate counterparty risk, the fund trades futures contracts on an exchange, monitors the financial strength of its clearing brokers and clearinghouse, and has entered into clearing agreements with its clearing brokers. The clearinghouse imposes initial margin requirements to secure the fund’s performance and requires daily settlement of variation margin representing changes in the market value of each contract. Any assets pledged as initial margin for open contracts are noted in the Statement of Net Assets.
Futures contracts are valued at their quoted daily settlement prices. The notional amounts of the contracts are not recorded in the Statement of Net Assets. Fluctuations in the value of the contracts are recorded in the Statement of Assets and Liabilities as an asset (liability) and in the Statement of Operations as unrealized appreciation (depreciation) until the contracts are closed, when they are recorded as realized futures gains (losses).
During the year ended September 30, 2019, the fund’s average investments in long and short futures contracts represented less than 1% and 0% of net assets, respectively, based on the average of the notional amounts at each quarter-end during the period. The fund had no open futures contracts at September 30, 2019.
3. Federal Income Taxes: The fund intends to continue to qualify as a regulated investment company and distribute all of its taxable income. Management has analyzed the fund’s tax positions taken for all open federal income tax years (September 30, 2016–2019), and has concluded that no provision for federal income tax is required in the fund’s financial statements.
4. Distributions: Distributions to shareholders are recorded on the ex-dividend date. Distributions are determined on a tax basis and may differ from net investment income and realized capital gains for financial reporting purposes.
12
Target Retirement 2040 Fund
5. Credit Facility: The fund and certain other funds managed by The Vanguard Group (“Vanguard”) participate in a $4.3 billion committed credit facility provided by a syndicate of lenders pursuant to a credit agreement that may be renewed annually; each fund is individually liable for its borrowings, if any, under the credit facility. Borrowings may be utilized for temporary and emergency purposes, and are subject to the fund’s regulatory and contractual borrowing restrictions. The participating funds are charged administrative fees and an annual commitment fee of 0.10% of the undrawn amount of the facility; these fees are allocated to the funds based on a method approved by the fund’s board of trustees and borne by the funds in which the fund invests (see Note B). Any borrowings under this facility bear interest at a rate based upon the higher of the one-month London Interbank Offered Rate, federal funds effective rate, or overnight bank funding rate plus an agreed-upon spread.
The fund had no borrowings outstanding at September 30, 2019, or at any time during the period then ended.
6. Other: Income and capital gain distributions received are recorded on the ex-dividend date. Security transactions are accounted for on the date securities are bought or sold. Costs used to determine realized gains (losses) on the sale of investment securities are those of the specific securities sold.
B. In accordance with the terms of a Funds’ Service Agreement (the “FSA”) between Vanguard and the fund, Vanguard furnishes to the fund investment advisory, corporate management, administrative, marketing, and distribution services at Vanguard’s cost of operations (as defined by the FSA). These costs of operations are allocated to the fund based on methods and guidelines approved by the board of trustees. The FSA provides that expenses otherwise allocable to Vanguard funds-of-funds may be reduced or eliminated to the extent of savings realized by the underlying Vanguard funds by virtue of being part of a fund-of-funds. Accordingly, all expenses for services provided by Vanguard to the fund and all other expenses incurred by the fund during the period ended September 30, 2019, were borne by the underlying Vanguard funds in which the fund invests. The fund’s trustees and officers are also trustees and officers, respectively, of the underlying Vanguard funds, as well as directors and employees, respectively, of Vanguard.
C. Various inputs may be used to determine the value of the fund’s investments. These inputs are summarized in three broad levels for financial statement purposes. The inputs or methodologies used to value securities are not necessarily an indication of the risk associated with investing in those securities.
Level 1—Quoted prices in active markets for identical securities.
Level 2—Other significant observable inputs (including quoted prices for similar securities, interest rates, prepayment speeds, credit risk, etc.).
Level 3—Significant unobservable inputs (including the fund’s own assumptions used to determine the fair value of investments). Any investments valued with significant unobservable inputs are noted on the Statement of Net Assets.
At September 30, 2019, 100% of the market value of the fund’s investments was determined based on Level 1 inputs.
13
Target Retirement 2040 Fund
D. Permanent differences between book-basis and tax-basis components of net assets, if any, are reclassified among capital accounts in the financial statements to reflect their tax character. These reclassifications have no effect on net assets or net asset value per share.
Temporary differences between book-basis and tax-basis components of total distributable earnings (loss) arise when certain items of income, gain, or loss are recognized in different periods for financial statement and tax purposes; these differences will reverse at some time in the future. The differences are primarily related to the tax deferral of losses on wash sales. As of period end, the tax-basis components of total distributable earnings (loss) are detailed in the table as follows:
| Amount |
| ($000) |
Undistributed Ordinary Income | 433,224 |
Undistributed Long-Term Gains | — |
Capital Loss Carryforwards (Non-Expiring) | (9,289) |
Net Unrealized Gains (Losses) | 8,231,995 |
As of September 30, 2019, gross unrealized appreciation and depreciation for investments based on cost for U.S. federal income tax purposes were as follows:
| Amount |
| ($000) |
Tax Cost | 20,850,262 |
Gross Unrealized Appreciation | 8,347,394 |
Gross Unrealized Depreciation | (115,399) |
Net Unrealized Appreciation (Depreciation) | 8,231,995 |
E. Capital shares issued and redeemed were:
| Year Ended September 30, |
| 2019 | 2018 |
| Shares | Shares |
| (000) | (000) |
Issued | 164,515 | 174,069 |
Issued in Lieu of Cash Distributions | 18,379 | 12,637 |
Redeemed | (113,431) | (119,638) |
Net Increase (Decrease) in Shares Outstanding | 69,463 | 67,068 |
| | |
| | | |
14
Target Retirement 2040 Fund
F. Transactions during the period in affiliated underlying Vanguard funds were as follows:
| | Current Period Transactions | |
| Sept. 30, | | Proceeds | Realized | | | | Sept. 30, |
| 2018 | | from | Net | Change in | | Capital Gain | 2019 |
| Market | Purchases | Securities | Gain | Unrealized | | Distributions | Market |
| Value | at Cost | Sold | (Loss) | App. (Dep.) | Income | Received | Value |
| ($000) | ($000) | ($000) | ($000) | ($000) | ($000) | ($000) | ($000) |
Vanguard Market Liquidity Fund | 11 | NA1 | NA1 | 1 | — | 183 | — | 9,867 |
Vanguard Total Bond Market II Index Fund | 2,828,171 | 1,168,891 | 817,948 | (8,452) | 225,760 | 85,708 | — | 3,396,422 |
Vanguard Total International Bond Index Fund | 1,138,754 | 270,034 | 65,126 | (253) | 101,222 | 35,084 | — | 1,444,631 |
Vanguard Total International Stock Index Fund | 8,962,774 | 1,251,928 | 141,745 | (515) | (400,211) | 269,968 | — | 9,672,231 |
Vanguard Total Stock Market Index Fund | 13,505,535 | 1,187,368 | 345,843 | 1,120 | 210,926 | 243,837 | — | 14,559,106 |
Total | 26,435,245 | 3,878,221 | 1,370,662 | (8,099) | 137,697 | 634,780 | — | 29,082,257 |
1 Not applicable—purchases and sales are for temporary cash investment purposes.
G. Management has determined that no events or transactions occurred subsequent to September 30, 2019, that would require recognition or disclosure in these financial statements.
15
Target Retirement 2045 Fund
Performance Summary
All of the returns in this report represent past performance, which is not a guarantee of future results that may be achieved by the fund. (Current performance may be lower or higher than the performance data cited. For performance data current to the most recent month-end, visit our website at vanguard.com/performance.) Note, too, that both investment returns and principal value can fluctuate widely, so an investor’s shares, when sold, could be worth more or less than their original cost. The returns shown do not reflect taxes that a shareholder would pay on fund distributions or on the sale of fund shares.
Cumulative Performance: September 30, 2009, Through September 30, 2019
Initial Investment of $10,000

| | Average Annual Total Returns | | |
| | Periods Ended September 30, 2019 | | |
| | | | | | Final Value |
| | One | Five | Ten | | of a $10,000 |
| | Year | Years | Years | | Investment |

| Target Retirement 2045 Fund | | 2.06% | 7.23% | 9.66% | | $25,137 |

| Target 2045 Composite Index | | 2.32 | 7.49 | 9.92 | | 25,753 |

| MSCI US Broad Market Index | | 2.91 | 10.47 | 13.15 | | 34,386 |
Target 2045 Composite Index: Derived by applying the fund’s target asset allocation to the results of the following benchmarks: for international stocks of developed markets, the MSCI EAFE Index through December 15, 2010, the MSCI ACWI ex USA IMI Index through June 2, 2013, and the FTSE Global All Cap ex US Index thereafter; for emerging-market stocks, the Select Emerging Markets Index through August 23, 2006, the MSCI Emerging Markets Index through December 15, 2010, the MSCI ACWI ex USA IMI Index through June 2, 2013, and the FTSE Global All Cap ex US Index thereafter; for U.S. bonds, the Bloomberg Barclays U.S. Aggregate Bond Index through December 31, 2009, and the Bloomberg Barclays U.S. Aggregate Float Adjusted Index thereafter; for international bonds, the Bloomberg Barclays Global Aggregate ex-USD Float Adjusted RIC Capped Index Hedged beginning June 3, 2013; and for U.S. stocks, the Dow Jones U.S. Total Stock Market Index (formerly known as the Dow Jones Wilshire 5000 Index) through April 22, 2005, the MSCI US Broad Market Index through June 2, 2013, and the CRSP US Total Market Index thereafter. International stock benchmark returns are adjusted for withholding taxes.
See Financial Highlights for dividend and capital gains information.
16
Target Retirement 2045 Fund
Underlying Vanguard Funds
As of September 30, 2019
Vanguard Total Stock Market Index Fund Investor Shares | | 53.9% |
Vanguard Total International Stock Index Fund Investor Shares | | 35.9 |
Vanguard Total Bond Market II Index Fund Investor Shares | | 7.2 |
Vanguard Total International Bond Index Fund Investor Shares | | 3.0 |
17
Target Retirement 2045 Fund
Financial Statements
Statement of Net Assets
As of September 30, 2019
The fund files its complete schedule of portfolio holdings with the Securities and Exchange Commission (SEC) for the first and third quarters of each fiscal year as an exhibit to its reports on Form N-PORT. The fund’s Form N-PORT reports are available on the SEC’s website at www.sec.gov.
| | | | Market | |
| | | | Value· | |
| | Shares | | ($000 | ) |
Investment Companies (100.0%) | | | | | |
U.S. Stock Fund (53.9%) | | | | | |
Vanguard Total Stock Market Index Fund Investor Shares | | 195,793,049 | | 14,386,873 | |
| | | | | |
International Stock Fund (35.9%) | | | | | |
Vanguard Total International Stock Index Fund Investor Shares | | 578,337,123 | | 9,583,046 | |
| | | | | |
U.S. Bond Fund (7.2%) | | | | | |
1 Vanguard Total Bond Market II Index Fund Investor Shares | | 172,113,994 | | 1,907,023 | |
| | | | | |
International Bond Fund (3.0%) | | | | | |
Vanguard Total International Bond Index Fund Investor Shares | | 68,640,757 | | 807,216 | |
Total Investment Companies (Cost $18,879,076) | | | | 26,684,158 | |
Temporary Cash Investment (0.1%) | | | | | |
Money Market Fund (0.1%) | | | | | |
1 Vanguard Market Liquidity Fund, 2.098% (Cost $12,586) | | 125,847 | | 12,586 | |
Total Investments (100.1%) (Cost $18,891,662) | | | | 26,696,744 | |
Other Assets and Liabilities (-0.1%) | | | | | |
Other Assets | | | | 23,287 | |
Liabilities | | | | (50,097 | ) |
| | | | (26,810 | ) |
Net Assets (100%) | | | | | |
Applicable to 1,140,586,154 outstanding $.001 par value shares of beneficial interest (unlimited authorization) | | | | 26,669,934 | |
Net Asset Value Per Share | | | | $23.38 | |
18
Target Retirement 2045 Fund
| | Amount | |
| | ($000 | ) |
Statement of Assets and Liabilities | | | |
Assets | | | |
Investments in Securities, at Value—Affiliated Funds | | 26,696,744 | |
Receivables for Accrued Income | | 4,867 | |
Receivables for Capital Shares Issued | | 18,420 | |
Total Assets | | 26,720,031 | |
Liabilities | | | |
Payables for Investment Securities Purchased | | 21,449 | |
Payables for Capital Shares Redeemed | | 28,648 | |
Total Liabilities | | 50,097 | |
Net Assets | | 26,669,934 | |
| | | |
| | | |
At September 30, 2019, net assets consisted of: | | | |
| | | |
| | Amount | |
| | ($000 | ) |
Paid-in Capital | | 18,477,288 | |
Total Distributable Earnings (Loss) | | 8,192,646 | |
Net Assets | | 26,669,934 | |
· See Note A in Notes to Financial Statements.
1 Affiliated fund available only to Vanguard funds and certain trusts and accounts managed by Vanguard. Rate shown for Vanguard Market Liquidity Fund is the 7-day yield.
See accompanying Notes, which are an integral part of the Financial Statements.
19
Target Retirement 2045 Fund
Statement of Operations
| | Year Ended | |
| | September 30, 2019 | |
| | ($000 | ) |
Investment Income | | | |
Income | | | |
Income Distributions Received from Affiliated Funds | | 575,282 | |
Other Income | | 90 | |
Net Investment Income—Note B | | 575,372 | |
Realized Net Gain (Loss) | | | |
Capital Gain Distributions Received from Affiliated Funds | | — | |
Affiliated Funds Sold | | (5,727 | ) |
Futures Contracts | | (101 | ) |
Realized Net Gain (Loss) | | (5,828 | ) |
Change in Unrealized Appreciation (Depreciation) from Affiliated Funds | | 5,053 | |
Net Increase (Decrease) in Net Assets Resulting from Operations | | 574,597 | |
See accompanying Notes, which are an integral part of the Financial Statements.
20
Target Retirement 2045 Fund
Statement of Changes in Net Assets
| | Year Ended September 30, | |
| | 2019 | | 2018 | |
| | ($000 | ) | ($000 | ) |
Increase (Decrease) in Net Assets | | | | | |
Operations | | | | | |
Net Investment Income | | 575,372 | | 490,471 | |
Realized Net Gain (Loss) | | (5,828 | ) | 26,325 | |
Change in Unrealized Appreciation (Depreciation) | | 5,053 | | 1,567,532 | |
Net Increase (Decrease) in Net Assets Resulting from Operations | | 574,597 | | 2,084,328 | |
Distributions | | | | | |
Net Investment Income | | (507,946 | ) | (412,734 | ) |
Realized Capital Gain1 | | (27,641 | ) | (9,737 | ) |
Total Distributions | | (535,587 | ) | (422,471 | ) |
Capital Share Transactions | | | | | |
Issued | | 5,288,388 | | 5,662,342 | |
Issued in Lieu of Cash Distributions | | 527,209 | | 416,672 | |
Redeemed | | (3,514,240 | ) | (3,824,416 | ) |
Net Increase (Decrease) from Capital Share Transactions | | 2,301,357 | | 2,254,598 | |
Total Increase (Decrease) | | 2,340,367 | | 3,916,455 | |
Net Assets | | | | | |
Beginning of Period | | 24,329,567 | | 20,413,112 | |
End of Period | | 26,669,934 | | 24,329,567 | |
1 Includes fiscal 2019 and 2018 short-term gain distributions totaling $27,221,000 and $9,737,000, respectively. Short-term gain distributions are treated as ordinary income dividends for tax purposes.
See accompanying Notes, which are an integral part of the Financial Statements.
21
Target Retirement 2045 Fund
Financial Highlights
For a Share Outstanding | | Year Ended September 30, | |
Throughout Each Period | | 2019 | | 2018 | | 2017 | | 2016 | | 2015 | |
Net Asset Value, Beginning of Period | | $23.49 | | $21.80 | | $19.12 | | $17.60 | | $18.61 | |
Investment Operations | | | | | | | | | | | |
Net Investment Income | | .527 | 1 | .492 | 1 | .450 | 1 | .411 | | .406 | |
Capital Gain Distributions Received | | — | | — | | .001 | 1 | .002 | | .004 | |
Net Realized and Unrealized Gain (Loss) on Investments | | (.128 | ) | 1.636 | | 2.696 | | 1.692 | | (1.034 | ) |
Total from Investment Operations | | .399 | | 2.128 | | 3.147 | | 2.105 | | (.624 | ) |
Distributions | | | | | | | | | | | |
Dividends from Net Investment Income | | (.483 | ) | (.428 | ) | (.375 | ) | (.386 | ) | (.383 | ) |
Distributions from Realized Capital Gains | | (.026 | ) | (.010 | ) | (.092 | ) | (.199 | ) | (.003 | ) |
Total Distributions | | (.509 | ) | (.438 | ) | (.467 | ) | (.585 | ) | (.386 | ) |
Net Asset Value, End of Period | | $23.38 | | $23.49 | | $21.80 | | $19.12 | | $17.60 | |
| | | | | | | | | | | |
Total Return2 | | 2.06% | | 9.85% | | 16.84% | | 12.16% | | -3.49% | |
| | | | | | | | | | | |
Ratios/Supplemental Data | | | | | | | | | | | |
Net Assets, End of Period (Millions) | | $26,670 | | $24,330 | | $20,413 | | $15,987 | | $14,283 | |
Ratio of Total Expenses to Average Net Assets | | — | | — | | — | | — | | — | |
Acquired Fund Fees and Expenses | | 0.15% | | 0.15% | | 0.15% | | 0.16% | | 0.16% | |
Ratio of Net Investment Income to Average Net Assets | | 2.35% | | 2.16% | | 2.23% | | 2.43% | | 2.10% | |
Portfolio Turnover Rate | | 4% | | 7% | | 8% | | 13% | | 20% | |
1 Calculated based on average shares outstanding.
2 Total returns do not include account service fees that may have applied in the periods shown. Fund prospectuses provide information about any applicable account service fees.
See accompanying Notes, which are an integral part of the Financial Statements.
22
Target Retirement 2045 Fund
Notes to Financial Statements
Vanguard Target Retirement 2045 Fund is registered under the Investment Company Act of 1940 as an open-end investment company, or mutual fund. The fund follows a balanced investment strategy by investing in selected Vanguard funds to achieve its targeted allocation of assets to U.S. and international stocks, and U.S. and international bonds. Financial statements and other information about each underlying fund are available on vanguard.com.
A. The following significant accounting policies conform to generally accepted accounting principles for U.S. investment companies. The fund consistently follows such policies in preparing its financial statements.
1. Security Valuation: Investments are valued at the net asset value of each underlying Vanguard fund determined as of the close of the New York Stock Exchange (generally 4 p.m., Eastern time) on the valuation date.
2. Futures Contracts: The fund uses stock and bond futures contracts to a limited extent, with the objectives of maintaining full exposure to the market and maintaining its target asset allocation. The primary risks associated with the use of futures contracts are imperfect correlation between changes in market values of investments held by the fund and the prices of futures contracts, and the possibility of an illiquid market. Counterparty risk involving futures is mitigated because a regulated clearinghouse is the counterparty instead of the clearing broker. To further mitigate counterparty risk, the fund trades futures contracts on an exchange, monitors the financial strength of its clearing brokers and clearinghouse, and has entered into clearing agreements with its clearing brokers. The clearinghouse imposes initial margin requirements to secure the fund’s performance and requires daily settlement of variation margin representing changes in the market value of each contract. Any assets pledged as initial margin for open contracts are noted in the Statement of Net Assets.
Futures contracts are valued at their quoted daily settlement prices. The notional amounts of the contracts are not recorded in the Statement of Net Assets. Fluctuations in the value of the contracts are recorded in the Statement of Assets and Liabilities as an asset (liability) and in the Statement of Operations as unrealized appreciation (depreciation) until the contracts are closed, when they are recorded as realized futures gains (losses).
During the year ended September 30, 2019, the fund’s average investments in long and short futures contracts represented less than 1% and 0% of net assets, respectively, based on the average of the notional amounts at each quarter-end during the period. The fund had no open futures contracts at September 30, 2019.
3. Federal Income Taxes: The fund intends to continue to qualify as a regulated investment company and distribute all of its taxable income. Management has analyzed the fund’s tax positions taken for all open federal income tax years (September 30, 2016–2019), and has concluded that no provision for federal income tax is required in the fund’s financial statements.
4. Distributions: Distributions to shareholders are recorded on the ex-dividend date. Distributions are determined on a tax basis and may differ from net investment income and realized capital gains for financial reporting purposes.
23
Target Retirement 2045 Fund
5. Credit Facility: The fund and certain other funds managed by The Vanguard Group (“Vanguard”) participate in a $4.3 billion committed credit facility provided by a syndicate of lenders pursuant to a credit agreement that may be renewed annually; each fund is individually liable for its borrowings, if any, under the credit facility. Borrowings may be utilized for temporary and emergency purposes, and are subject to the fund’s regulatory and contractual borrowing restrictions. The participating funds are charged administrative fees and an annual commitment fee of 0.10% of the undrawn amount of the facility; these fees are allocated to the funds based on a method approved by the fund’s board of trustees and borne by the funds in which the fund invests (see Note B). Any borrowings under this facility bear interest at a rate based upon the higher of the one-month London Interbank Offered Rate, federal funds effective rate, or overnight bank funding rate plus an agreed-upon spread.
The fund had no borrowings outstanding at September 30, 2019, or at any time during the period then ended.
6. Other: Income and capital gain distributions received are recorded on the ex-dividend date. Security transactions are accounted for on the date securities are bought or sold. Costs used to determine realized gains (losses) on the sale of investment securities are those of the specific securities sold.
B. In accordance with the terms of a Funds’ Service Agreement (the “FSA”) between Vanguard and the fund, Vanguard furnishes to the fund investment advisory, corporate management, administrative, marketing, and distribution services at Vanguard’s cost of operations (as defined by the FSA). These costs of operations are allocated to the fund based on methods and guidelines approved by the board of trustees. The FSA provides that expenses otherwise allocable to Vanguard funds-of-funds may be reduced or eliminated to the extent of savings realized by the underlying Vanguard funds by virtue of being part of a fund-of-funds. Accordingly, all expenses for services provided by Vanguard to the fund and all other expenses incurred by the fund during the period ended September 30, 2019, were borne by the underlying Vanguard funds in which the fund invests. The fund’s trustees and officers are also trustees and officers, respectively, of the underlying Vanguard funds, as well as directors and employees, respectively, of Vanguard.
C. Various inputs may be used to determine the value of the fund’s investments. These inputs are summarized in three broad levels for financial statement purposes. The inputs or methodologies used to value securities are not necessarily an indication of the risk associated with investing in those securities.
Level 1—Quoted prices in active markets for identical securities.
Level 2—Other significant observable inputs (including quoted prices for similar securities, interest rates, prepayment speeds, credit risk, etc.).
Level 3—Significant unobservable inputs (including the fund’s own assumptions used to determine the fair value of investments). Any investments valued with significant unobservable inputs are noted on the Statement of Net Assets.
At September 30, 2019, 100% of the market value of the fund’s investments was determined based on Level 1 inputs.
24
Target Retirement 2045 Fund
D. Permanent differences between book-basis and tax-basis components of net assets, if any, are reclassified among capital accounts in the financial statements to reflect their tax character. These reclassifications have no effect on net assets or net asset value per share.
Temporary differences between book-basis and tax-basis components of total distributable earnings (loss) arise when certain items of income, gain, or loss are recognized in different periods for financial statement and tax purposes; these differences will reverse at some time in the future. The differences are primarily related to the tax deferral of losses on wash sales. As of period end, the tax-basis components of total distributable earnings (loss) are detailed in the table as follows:
| Amount | |
| ($000 | ) |
Undistributed Ordinary Income | 396,319 | |
Undistributed Long-Term Gains | — | |
Capital Loss Carryforwards (Non-expiring) | (8,755 | ) |
Net Unrealized Gains (Losses) | 7,805,082 | |
As of September 30, 2019, gross unrealized appreciation and depreciation for investments based on cost for U.S. federal income tax purposes were as follows:
| | Amount | |
| | ($000 | ) |
Tax Cost | | 18,891,662 | |
Gross Unrealized Appreciation | | 7,941,267 | |
Gross Unrealized Depreciation | | (136,185 | ) |
Net Unrealized Appreciation (Depreciation) | | 7,805,082 | |
E. Capital shares issued and redeemed were:
| | Year Ended September 30, | |
| | 2019 | | 2018 | |
| | Shares | | Shares | |
| | (000 | ) | (000 | ) |
Issued | | 236,957 | | 248,564 | |
Issued in Lieu of Cash Distributions | | 26,255 | | 18,469 | |
Redeemed | | (158,490 | ) | (167,394 | ) |
Net Increase (Decrease) in Shares Outstanding | | 104,722 | | 99,639 | |
25
Target Retirement 2045 Fund
F. Transactions during the period in affiliated underlying Vanguard funds were as follows:
| | | | Current Period Transactions | | | |
| | Sept. 30, | | | | Proceeds | | Realized | | | | | | | | Sept. 30, | |
| | 2018 | | | | from | | Net | | Change in | | | | Capital Gain | | 2019 | |
| | Market | | Purchases | | Securities | | Gain | | Unrealized | | | | Distributions | | Market | |
| | Value | | at Cost | | Sold | | (Loss | ) | App. (Dep. | ) | Income | | Received | | Value | |
| | ($000 | ) | ($000 | ) | ($000 | ) | ($000 | ) | ($000 | ) | ($000 | ) | ($000 | ) | ($000 | ) |
Vanguard Market Liquidity Fund | | 6 | | NA1 | | NA1 | | (3 | ) | — | | 179 | | — | | 12,586 | |
Vanguard Total Bond Market II Index Fund | | 1,723,362 | | 503,579 | | 445,655 | | (6,470 | ) | 132,207 | | 50,108 | | — | | 1,907,023 | |
Vanguard Total International Bond Index Fund | | 711,242 | | 116,342 | | 78,362 | | (398 | ) | 58,392 | | 21,008 | | — | | 807,216 | |
Vanguard Total International Stock Index Fund | | 8,735,702 | | 1,395,253 | | 151,895 | | 506 | | (396,520 | ) | 264,979 | | — | | 9,583,046 | |
Vanguard Total Stock Market Index Fund | | 13,160,195 | | 1,336,110 | | 321,044 | | 638 | | 210,974 | | 239,008 | | — | | 14,386,873 | |
Total | | 24,330,507 | | 3,351,284 | | 996,956 | | (5,727 | ) | 5,053 | | 575,282 | | — | | 26,696,744 | |
1 Not applicable—purchases and sales are for temporary cash investment purposes.
G. Management has determined that no events or transactions occurred subsequent to September 30, 2019, that would require recognition or disclosure in these financial statements.
26
Target Retirement 2050 Fund
Performance Summary
All of the returns in this report represent past performance, which is not a guarantee of future results that may be achieved by the fund. (Current performance may be lower or higher than the performance data cited. For performance data current to the most recent month-end, visit our website at vanguard.com/performance.) Note, too, that both investment returns and principal value can fluctuate widely, so an investor’s shares, when sold, could be worth more or less than their original cost. The returns shown do not reflect taxes that a shareholder would pay on fund distributions or on the sale of fund shares.
Cumulative Performance: September 30, 2009, Through September 30, 2019
Initial Investment of $10,000
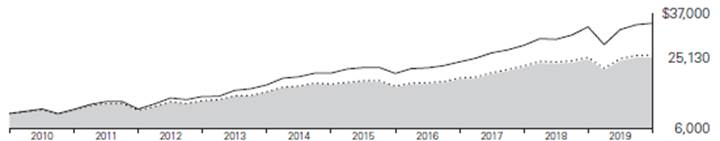
| | Average Annual Total Returns | |
| | Periods Ended September 30, 2019 | |
| | | | | Final Value |
| | One | Five | Ten | of a $10,000 |
| | Year | Years | Years | Investment |

| Target Retirement 2050 Fund | 2.07% | 7.24% | 9.65% | $25,130 |

| Target 2050 Composite Index | 2.32 | 7.49 | 9.92 | 25,752 |

| MSCI US Broad Market Index | 2.91 | 10.47 | 13.15 | 34,386 |
Target 2050 Composite Index: Derived by applying the fund’s target asset allocation to the results of the following benchmarks: for international stocks of developed markets, the MSCI EAFE Index through December 15, 2010, the MSCI ACWI ex USA IMI Index through June 2, 2013, and the FTSE Global All Cap ex US Index thereafter; for emerging-market stocks, the Select Emerging Markets Index through August 23, 2006, the MSCI Emerging Markets Index through December 15, 2010, the MSCI ACWI ex USA IMI Index through June 2, 2013, and the FTSE Global All Cap ex US Index thereafter; for U.S. bonds, the Bloomberg Barclays U.S. Aggregate Bond Index through December 31, 2009, and the Bloomberg Barclays U.S. Aggregate Float Adjusted Index thereafter; for international bonds, the Bloomberg Barclays Global Aggregate ex-USD Float Adjusted RIC Capped Index Hedged beginning June 3, 2013; and for U.S. stocks, the MSCI US Broad Market Index through June 2, 2013, and the CRSP US Total Market Index thereafter. International stock benchmark returns are adjusted for withholding taxes.
See Financial Highlights for dividend and capital gains information.
27
Target Retirement 2050 Fund
Underlying Vanguard Funds
As of September 30, 2019
Vanguard Total Stock Market Index Fund Investor Shares | 53.9% |
Vanguard Total International Stock Index Fund Investor Shares | 35.9 |
Vanguard Total Bond Market II Index Fund Investor Shares | 7.2 |
Vanguard Total International Bond Index Fund Investor Shares | 3.0 |
28
Target Retirement 2050 Fund
Financial Statements
Statement of Net Assets
As of September 30, 2019
The fund files its complete schedule of portfolio holdings with the Securities and Exchange Commission (SEC) for the first and third quarters of each fiscal year as an exhibit to its reports on Form N-PORT. The fund’s Form N-PORT reports are available on the SEC’s website at www.sec.gov.
| | | | Market | |
| | | | Value· | |
| | Shares | | ($000 | ) |
Investment Companies (100.0%) | | | | | |
U.S. Stock Fund (53.9%) | | | | | |
Vanguard Total Stock Market Index Fund Investor Shares | | 142,958,586 | | 10,504,597 | |
| | | | | |
International Stock Fund (35.9%) | | | | | |
Vanguard Total International Stock Index Fund Investor Shares | | 422,080,741 | | 6,993,878 | |
| | | | | |
U.S. Bond Fund (7.2%) | | | | | |
1 Vanguard Total Bond Market II Index Fund Investor Shares | | 125,970,557 | | 1,395,754 | |
| | | | | |
International Bond Fund (3.0%) | | | | | |
Vanguard Total International Bond Index Fund Investor Shares | | 49,670,990 | | 584,131 | |
Total Investment Companies (Cost $14,949,417) | | | | 19,478,360 | |
Temporary Cash Investment (0.1%) | | | | | |
Money Market Fund (0.1%) | | | | | |
1 Vanguard Market Liquidity Fund, 2.098% (Cost $14,171) | | 141,698 | | 14,171 | |
Total Investments (100.1%) (Cost $14,963,588) | | | | 19,492,531 | |
Other Assets and Liabilities (-0.1%) | | | | | |
Other Assets | | | | 23,473 | |
Liabilities | | | | (45,540 | ) |
| | | | (22,067 | ) |
Net Assets (100%) | | | | | |
Applicable to 517,409,423 outstanding $.001 par value shares of beneficial interest (unlimited authorization) | | | | 19,470,464 | |
Net Asset Value Per Share | | | | $37.63 | |
29
Target Retirement 2050 Fund
| | Amount | |
| | ($000 | ) |
Statement of Assets and Liabilities | | | |
Assets | | | |
Investments in Securities, at Value—Affiliated Funds | | 19,492,531 | |
Receivables for Accrued Income | | 3,489 | |
Receivables for Capital Shares Issued | | 19,984 | |
Total Assets | | 19,516,004 | |
Liabilities | | | |
Payables for Investment Securities Purchased | | 24,156 | |
Payables for Capital Shares Redeemed | | 21,384 | |
Total Liabilities | | 45,540 | |
Net Assets | | 19,470,464 | |
| | | |
| | | |
At September 30, 2019, net assets consisted of: | | | |
| | Amount | |
| | ($000 | ) |
Paid-in Capital | | 14,662,212 | |
Total Distributable Earnings (Loss) | | 4,808,252 | |
Net Assets | | 19,470,464 | |
· See Note A in Notes to Financial Statements.
1 Affiliated fund available only to Vanguard funds and certain trusts and accounts managed by Vanguard. Rate shown for Vanguard Market Liquidity Fund is the 7-day yield.
See accompanying Notes, which are an integral part of the Financial Statements.
30
Target Retirement 2050 Fund
Statement of Operations
| | Year Ended | |
| | September 30, 2019 | |
| | ($000 | ) |
Investment Income | | | |
Income | | | |
Income Distributions Received from Affiliated Funds | | 410,082 | |
Net Investment Income–Note B | | 410,082 | |
Realized Net Gain (Loss) | | | |
Capital Gain Distributions Received from Affiliated Funds | | — | |
Affiliated Funds Sold | | (5,109 | ) |
Futures Contracts | | (66 | ) |
Realized Net Gain (Loss) | | (5,175 | ) |
Change in Unrealized Appreciation (Depreciation) from Affiliated Funds | | 41,890 | |
Net Increase (Decrease) in Net Assets Resulting from Operations | | 446,797 | |
See accompanying Notes, which are an integral part of the Financial Statements.
31
Target Retirement 2050 Fund
Statement of Changes in Net Assets
| | Year Ended September 30, | |
| | 2019 | | 2018 | |
| | ($000 | ) | ($000 | ) |
Increase (Decrease) in Net Assets | | | | | |
Operations | | | | | |
Net Investment Income | | 410,082 | | 331,586 | |
Realized Net Gain (Loss) | | (5,175 | ) | 12,675 | |
Change in Unrealized Appreciation (Depreciation) | | 41,890 | | 1,053,045 | |
Net Increase (Decrease) in Net Assets Resulting from Operations | | 446,797 | | 1,397,306 | |
Distributions | | | | | |
Net Investment Income | | (358,542 | ) | (271,760 | ) |
Realized Capital Gain1 | | (12,729 | ) | (3,856 | ) |
Total Distributions | | (371,271 | ) | (275,616 | ) |
Capital Share Transactions | | | | | |
Issued | | 4,866,735 | | 4,834,564 | |
Issued in Lieu of Cash Distributions | | 364,259 | | 271,105 | |
Redeemed | | (2,640,064 | ) | (2,830,456 | ) |
Net Increase (Decrease) from Capital Share Transactions | | 2,590,930 | | 2,275,213 | |
Total Increase (Decrease) | | 2,666,456 | | 3,396,903 | |
Net Assets | | | | | |
Beginning of Period | | 16,804,008 | | 13,407,105 | |
End of Period | | 19,470,464 | | 16,804,008 | |
1 Includes fiscal 2019 and 2018 short-term gain distributions totaling $12,274,000 and $3,657,000, respectively. Short-term gain distributions are treated as ordinary income dividends for tax purposes.
See accompanying Notes, which are an integral part of the Financial Statements.
32
Target Retirement 2050 Fund
Financial Highlights
For a Share Outstanding | | Year Ended September 30, | |
Throughout Each Period | | 2019 | | 2018 | | 2017 | | 2016 | | 2015 | |
Net Asset Value, Beginning of Period | | $37.80 | | $35.07 | | $30.63 | | $27.95 | | $29.53 | |
Investment Operations | | | | | | | | | | | |
Net Investment Income | | .851 | 1 | .794 | 1 | .727 | 1 | .636 | | .623 | |
Capital Gain Distributions Received | | — | | .001 | 1 | .002 | 1 | .003 | | .006 | |
Net Realized and Unrealized Gain (Loss) on Investments | | (.204 | ) | 2.629 | | 4.332 | | 2.714 | | (1.609 | ) |
Total from Investment Operations | | .647 | | 3.424 | | 5.061 | | 3.353 | | (.980 | ) |
Distributions | | | | | | | | | | | |
Dividends from Net Investment Income | | (.789 | ) | (.684 | ) | (.587 | ) | (.585 | ) | (.596 | ) |
Distributions from Realized Capital Gains | | (.028 | ) | (.010 | ) | (.034 | ) | (.088 | ) | (.004 | ) |
Total Distributions | | (.817 | ) | (.694 | ) | (.621 | ) | (.673 | ) | (.600 | ) |
Net Asset Value, End of Period | | $37.63 | | $37.80 | | $35.07 | | $30.63 | | $27.95 | |
| | | | | | | | | | | |
Total Return2 | | 2.07% | | 9.84% | | 16.84% | | 12.14% | | -3.46% | |
| | | | | | | | | | | |
Ratios/Supplemental Data | | | | | | | | | | | |
Net Assets, End of Period (Millions) | | $19,470 | | $16,804 | | $13,407 | | $9,634 | | $7,893 | |
Ratio of Total Expenses to Average Net Assets | | — | | — | | — | | — | | — | |
Acquired Fund Fees and Expenses | | 0.15% | | 0.15% | | 0.15% | | 0.16% | | 0.16% | |
Ratio of Net Investment Income to Average Net Assets | | 2.36% | | 2.16% | | 2.24% | | 2.24% | | 2.11% | |
Portfolio Turnover Rate | | 3% | | 7% | | 6% | | 12% | | 18% | |
1 Calculated based on average shares outstanding.
2 Total returns do not include account service fees that may have applied in the periods shown. Fund prospectuses provide information about any applicable account service fees.
See accompanying Notes, which are an integral part of the Financial Statements.
33
Target Retirement 2050 Fund
Notes to Financial Statements
Vanguard Target Retirement 2050 Fund is registered under the Investment Company Act of 1940 as an open-end investment company, or mutual fund. The fund follows a balanced investment strategy by investing in selected Vanguard funds to achieve its targeted allocation of assets to U.S. and international stocks, and U.S. and international bonds. Financial statements and other information about each underlying fund are available on vanguard.com.
A. The following significant accounting policies conform to generally accepted accounting principles for U.S. investment companies. The fund consistently follows such policies in preparing its financial statements.
1. Security Valuation: Investments are valued at the net asset value of each underlying Vanguard fund determined as of the close of the New York Stock Exchange (generally 4 p.m., Eastern time) on the valuation date.
2. Futures Contracts: The fund uses stock and bond futures contracts to a limited extent, with the objectives of maintaining full exposure to the market and maintaining its target asset allocation. The primary risks associated with the use of futures contracts are imperfect correlation between changes in market values of investments held by the fund and the prices of futures contracts, and the possibility of an illiquid market. Counterparty risk involving futures is mitigated because a regulated clearinghouse is the counterparty instead of the clearing broker. To further mitigate counterparty risk, the fund trades futures contracts on an exchange, monitors the financial strength of its clearing brokers and clearinghouse, and has entered into clearing agreements with its clearing brokers. The clearinghouse imposes initial margin requirements to secure the fund’s performance and requires daily settlement of variation margin representing changes in the market value of each contract. Any assets pledged as initial margin for open contracts are noted in the Statement of Net Assets.
Futures contracts are valued at their quoted daily settlement prices. The notional amounts of the contracts are not recorded in the Statement of Net Assets. Fluctuations in the value of the contracts are recorded in the Statement of Assets and Liabilities as an asset (liability) and in the Statement of Operations as unrealized appreciation (depreciation) until the contracts are closed, when they are recorded as realized futures gains (losses).
During the year ended September 30, 2019, the fund’s average investments in long and short futures contracts represented less than 1% and 0% of net assets, respectively, based on the average of the notional amounts at each quarter-end during the period. The fund had no open futures contracts at September 30, 2019.
3. Federal Income Taxes: The fund intends to continue to qualify as a regulated investment company and distribute all of its taxable income. Management has analyzed the fund’s tax positions taken for all open federal income tax years (September 30, 2016–2019), and has concluded that no provision for federal income tax is required in the fund’s financial statements.
4. Distributions: Distributions to shareholders are recorded on the ex-dividend date. Distributions are determined on a tax basis and may differ from net investment income and realized capital gains for financial reporting purposes.
34
Target Retirement 2050 Fund
5. Credit Facility: The fund and certain other funds managed by The Vanguard Group (“Vanguard”) participate in a $4.3 billion committed credit facility provided by a syndicate of lenders pursuant to a credit agreement that may be renewed annually; each fund is individually liable for its borrowings, if any, under the credit facility. Borrowings may be utilized for temporary and emergency purposes, and are subject to the fund’s regulatory and contractual borrowing restrictions. The participating funds are charged administrative fees and an annual commitment fee of 0.10% of the undrawn amount of the facility; these fees are allocated to the funds based on a method approved by the fund’s board of trustees and borne by the funds in which the fund invests (see Note B). Any borrowings under this facility bear interest at a rate based upon the higher of the one-month London Interbank Offered Rate, federal funds effective rate, or overnight bank funding rate plus an agreed-upon spread.
The fund had no borrowings outstanding at September 30, 2019, or at any time during the period then ended.
6. Other: Income and capital gain distributions received are recorded on the ex-dividend date. Security transactions are accounted for on the date securities are bought or sold. Costs used to determine realized gains (losses) on the sale of investment securities are those of the specific securities sold.
B. In accordance with the terms of a Funds’ Service Agreement (the “FSA”) between Vanguard and the fund, Vanguard furnishes to the fund investment advisory, corporate management, administrative, marketing, and distribution services at Vanguard’s cost of operations (as defined by the FSA). These costs of operations are allocated to the fund based on methods and guidelines approved by the board of trustees. The FSA provides that expenses otherwise allocable to Vanguard funds-of-funds may be reduced or eliminated to the extent of savings realized by the underlying Vanguard funds by virtue of being part of a fund-of-funds. Accordingly, all expenses for services provided by Vanguard to the fund and all other expenses incurred by the fund during the period ended September 30, 2019, were borne by the underlying Vanguard funds in which the fund invests. The fund’s trustees and officers are also trustees and officers, respectively, of the underlying Vanguard funds, as well as directors and employees, respectively, of Vanguard.
C. Various inputs may be used to determine the value of the fund’s investments. These inputs are summarized in three broad levels for financial statement purposes. The inputs or methodologies used to value securities are not necessarily an indication of the risk associated with investing in those securities.
Level 1—Quoted prices in active markets for identical securities.
Level 2—Other significant observable inputs (including quoted prices for similar securities, interest rates, prepayment speeds, credit risk, etc.).
Level 3—Significant unobservable inputs (including the fund’s own assumptions used to determine the fair value of investments). Any investments valued with significant unobservable inputs are noted on the Statement of Net Assets.
At September 30, 2019, 100% of the market value of the fund’s investments was determined based on Level 1 inputs.
35
Target Retirement 2050 Fund
D. Permanent differences between book-basis and tax-basis components of net assets, if any, are reclassified among capital accounts in the financial statements to reflect their tax character. These reclassifications have no effect on net assets or net asset value per share.
Temporary differences between book-basis and tax-basis components of total distributable earnings (loss) arise when certain items of income, gain, or loss are recognized in different periods for financial statement and tax purposes; these differences will reverse at some time in the future. The differences are primarily related to the tax deferral of losses on wash sales. As of period end, the tax-basis components of total distributable earnings (loss) are detailed in the table as follows:
| Amount | |
| ($000 | ) |
Undistributed Ordinary Income | 285,505 | |
Undistributed Long-Term Gains | — | |
Capital Loss Carryforwards (Non-expiring) | (6,196 | ) |
Net Unrealized Gains (Losses) | 4,528,943 | |
As of September 30, 2019, gross unrealized appreciation and depreciation for investments based on cost for U.S. federal income tax purposes were as follows:
| | Amount | |
| | ($000 | ) |
Tax Cost | | 14,963,588 | |
Gross Unrealized Appreciation | | 4,654,832 | |
Gross Unrealized Depreciation | | (125,889 | ) |
Net Unrealized Appreciation (Depreciation) | | 4,528,943 | |
E. Capital shares issued and redeemed were:
| | Year Ended September 30, | |
| | 2019 | | 2018 | |
| | Shares | | Shares | |
| | (000 | ) | (000 | ) |
Issued | | 135,480 | | 131,840 | |
Issued in Lieu of Cash Distributions | | 11,274 | | 7,468 | |
Redeemed | | (73,930 | ) | (76,965 | ) |
Net Increase (Decrease) in Shares Outstanding | | 72,824 | | 62,343 | |
36
Target Retirement 2050 Fund
F. Transactions during the period in affiliated underlying Vanguard funds were as follows:
| | | | Current Period Transactions | | | |
| | Sept. 30, | | | | Proceeds | | Realized | | | | | | | | Sept. 30, | |
| | 2018 | | | | from | | Net | | Change in | | | | Capital Gain | | 2019 | |
| | Market | | Purchases | | Securities | | Gain | | Unrealized | | | | Distributions | | Market | |
| | Value | | at Cost | | Sold | | (Loss | ) | App. (Dep. | ) | Income | | Received | | Value | |
| | ($000 | ) | ($000 | ) | ($000 | ) | ($000 | ) | ($000 | ) | ($000 | ) | ($000 | ) | ($000 | ) |
Vanguard Market Liquidity Fund | | 1,188 | | NA1 | | NA1 | | (1 | ) | — | | 161 | | — | | 14,171 | |
Vanguard Total Bond Market II Index Fund | | 1,194,887 | | 426,169 | | 315,002 | | (4,912 | ) | 94,612 | | 35,601 | | — | | 1,395,754 | |
Vanguard Total International Bond Index Fund | | 489,291 | | 100,400 | | 47,192 | | (265 | ) | 41,897 | | 14,596 | | — | | 584,131 | |
Vanguard Total International Stock Index Fund | | 6,041,281 | | 1,316,928 | | 91,345 | | — | | (272,986 | ) | 189,386 | | — | | 6,993,878 | |
Vanguard Total Stock Market Index Fund | | 9,070,996 | | 1,412,131 | | 156,966 | | 69 | | 178,367 | | 170,338 | | — | | 10,504,597 | |
Total | | 16,797,643 | | 3,255,628 | | 610,505 | | (5,109 | ) | 41,890 | | 410,082 | | — | | 19,492,531 | |
1 Not applicable—purchases and sales are for temporary cash investment purposes.
G. Management has determined that no events or transactions occurred subsequent to September 30, 2019, that would require recognition or disclosure in these financial statements.
37
Target Retirement 2055 Fund
Performance Summary
All of the returns in this report represent past performance, which is not a guarantee of future results that may be achieved by the fund. (Current performance may be lower or higher than the performance data cited. For performance data current to the most recent month-end, visit our website at vanguard.com/performance.) Note, too, that both investment returns and principal value can fluctuate widely, so an investor’s shares, when sold, could be worth more or less than their original cost. The returns shown do not reflect taxes that a shareholder would pay on fund distributions or on the sale of fund shares.
Cumulative Performance: August 18, 2010, Through September 30, 2019
Initial Investment of $10,000
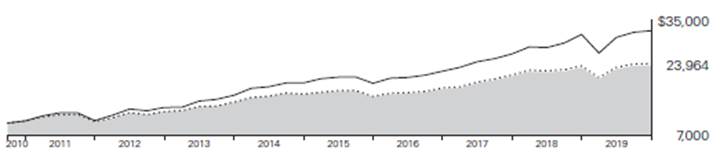
| | Average Annual Total Returns | |
| | Periods Ended September 30, 2019 | |
| | | | Since | Final Value |
| | One | Five | Inception | of a $10,000 |
| | Year | Years | (8/18/2010) | Investment |

| Target Retirement 2055 Fund | 2.09% | 7.21% | 10.06% | $23,964 |

| Target 2055 Composite Index | 2.32 | 7.49 | 10.31 | 24,466 |

| MSCI US Broad Market Index | 2.91 | 10.47 | 13.80 | 32,513 |
Target 2055 Composite Index: Derived by applying the fund’s target asset allocation to the results of the following benchmarks: for international stocks of developed markets, the MSCI EAFE Index through December 15, 2010, the MSCI ACWI ex USA IMI Index through June 2, 2013, and the FTSE Global All Cap ex US Index thereafter; for emerging-market stocks, the MSCI Emerging Markets Index through December 15, 2010, the MSCI ACWI ex USA IMI Index through June 2, 2013, and the FTSE Global All Cap ex US Index thereafter; for U.S. bonds, the Bloomberg Barclays U.S. Aggregate Float Adjusted Index; for international bonds, the Bloomberg Barclays Global Aggregate ex-USD Float Adjusted RIC Capped Index Hedged beginning June 3, 2013; and for U.S. stocks, the MSCI US Broad Market Index through June 2, 2013, and the CRSP US Total Market Index thereafter. International stock benchmark returns are adjusted for withholding taxes.
“Since Inception” performance is calculated from the inception date for both the fund and its comparative standards.
See Financial Highlights for dividend and capital gains information.
38
Target Retirement 2055 Fund
Underlying Vanguard Funds
As of September 30, 2019
Vanguard Total Stock Market Index Fund Investor Shares | 53.9% |
Vanguard Total International Stock Index Fund Investor Shares | 35.9 |
Vanguard Total Bond Market II Index Fund Investor Shares | 7.2 |
Vanguard Total International Bond Index Fund Investor Shares | 3.0 |
39
Target Retirement 2055 Fund
Financial Statements
Statement of Net Assets
As of September 30, 2019
The fund files its complete schedule of portfolio holdings with the Securities and Exchange Commission (SEC) for the first and third quarters of each fiscal year as an exhibit to its reports on Form N-PORT. The fund’s Form N-PORT reports are available on the SEC’s website at www.sec.gov.
| | | | Market | |
| | | | Value· | |
| | Shares | | ($000 | ) |
Investment Companies (100.0%) | | | | | |
U.S. Stock Fund (53.9%) | | | | | |
Vanguard Total Stock Market Index Fund Investor Shares | | 74,899,635 | | 5,503,625 | |
| | | | | |
International Stock Fund (35.9%) | | | | | |
Vanguard Total International Stock Index Fund Investor Shares | | 220,804,621 | | 3,658,733 | |
| | | | | |
U.S. Bond Fund (7.2%) | | | | | |
1 Vanguard Total Bond Market II Index Fund Investor Shares | | 66,064,567 | | 731,996 | |
| | | | | |
International Bond Fund (3.0%) | | | | | |
Vanguard Total International Bond Index Fund Investor Shares | | 25,658,954 | | 301,749 | |
Total Investment Companies (Cost $8,743,809) | | | | 10,196,103 | |
Temporary Cash Investment (0.1%) | | | | | |
Money Market Fund (0.1%) | | | | | |
1 Vanguard Market Liquidity Fund, 2.098% (Cost $13,725) | | 137,239 | | 13,725 | |
Total Investments (100.1%) (Cost $8,757,534) | | | | 10,209,828 | |
Other Assets and Liabilities (-0.1%) | | | | | |
Other Assets | | | | 15,779 | |
Liabilities | | | | (23,570 | ) |
| | | | (7,791 | ) |
Net Assets (100%) | | | | | |
Applicable to 249,775,465 outstanding $.001 par value shares of beneficial interest (unlimited authorization) | | | | 10,202,037 | |
Net Asset Value Per Share | | | | $40.84 | |
40
Target Retirement 2055 Fund
| | Amount | |
| | ($000 | ) |
Statement of Assets and Liabilities | | | |
Assets | | | |
Investments in Securities, at Value—Affiliated Funds | | 10,209,828 | |
Receivables for Accrued Income | | 1,819 | |
Receivables for Capital Shares Issued | | 13,960 | |
Total Assets | | 10,225,607 | |
Liabilities | | | |
Payables for Investment Securities Purchased | | 14,440 | |
Payables for Capital Shares Redeemed | | 9,130 | |
Total Liabilities | | 23,570 | |
Net Assets | | 10,202,037 | |
| | | |
| | | |
At September 30, 2019, net assets consisted of: | | | |
| | Amount | |
| | ($000 | ) |
Paid-in Capital | | 8,604,413 | |
Total Distributable Earnings (Loss) | | 1,597,624 | |
Net Assets | | 10,202,037 | |
· See Note A in Notes to Financial Statements.
1 Affiliated fund available only to Vanguard funds and certain trusts and accounts managed by Vanguard. Rate shown for Vanguard Market Liquidity Fund is the 7-day yield.
See accompanying Notes, which are an integral part of the Financial Statements.
41
Target Retirement 2055 Fund
Statement of Operations
| | Year Ended | |
| | September 30, 2019 | |
| | ($000 | ) |
Investment Income | | | |
Income | | | |
Income Distributions Received from Affiliated Funds | | 207,163 | |
Net Investment Income—Note B | | 207,163 | |
Realized Net Gain (Loss) | | | |
Capital Gain Distributions Received from Affiliated Funds | | — | |
Affiliated Funds Sold | | 432 | |
Realized Net Gain (Loss) | | 432 | |
Change in Unrealized Appreciation (Depreciation) from Affiliated Funds | | 55,011 | |
Net Increase (Decrease) in Net Assets Resulting from Operations | | 262,606 | |
See accompanying Notes, which are an integral part of the Financial Statements.
42
Target Retirement 2055 Fund
Statement of Changes in Net Assets
| | Year Ended September 30, | |
| | 2019 | | 2018 | |
| | ($000 | ) | ($000 | ) |
Increase (Decrease) in Net Assets | | | | | |
Operations | | | | | |
Net Investment Income | | 207,163 | | 151,249 | |
Realized Net Gain (Loss) | | 432 | | (672 | ) |
Change in Unrealized Appreciation (Depreciation) | | 55,011 | | 464,109 | |
Net Increase (Decrease) in Net Assets Resulting from Operations | | 262,606 | | 614,686 | |
Distributions | | | | | |
Net Investment Income | | (169,592 | ) | (113,882 | ) |
Realized Capital Gain | | — | | — | |
Total Distributions | | (169,592 | ) | (113,882 | ) |
Capital Share Transactions | | | | | |
Issued | | 3,278,128 | | 3,016,467 | |
Issued in Lieu of Cash Distributions | | 166,487 | | 111,895 | |
Redeemed | | (1,346,248 | ) | (1,218,478 | ) |
Net Increase (Decrease) from Capital Share Transactions | | 2,098,367 | | 1,909,884 | |
Total Increase (Decrease) | | 2,191,381 | | 2,410,688 | |
Net Assets | | | | | |
Beginning of Period | | 8,010,656 | | 5,599,968 | |
End of Period | | 10,202,037 | | 8,010,656 | |
See accompanying Notes, which are an integral part of the Financial Statements.
43
Target Retirement 2055 Fund
Financial Highlights
For a Share Outstanding | | Year Ended September 30, | |
Throughout Each Period | | 2019 | | 2018 | | 2017 | | 2016 | | 2015 | |
Net Asset Value, Beginning of Period | | $40.95 | | $37.98 | | $33.15 | | $30.14 | | $31.80 | |
Investment Operations | | | | | | | | | | | |
Net Investment Income | | .929 | 1 | .868 | 1 | .796 | 1 | .642 | | .631 | |
Capital Gain Distributions Received | | — | | .001 | 1 | .002 | 1 | .003 | | .005 | |
Net Realized and Unrealized Gain (Loss) on Investments | | (.209 | ) | 2.819 | | 4.688 | | 2.974 | | (1.736 | ) |
Total from Investment Operations | | .720 | | 3.688 | | 5.486 | | 3.619 | | (1.100 | ) |
Distributions | | | | | | | | | | | |
Dividends from Net Investment Income | | (.830 | ) | (.718 | ) | (.654 | ) | (.593 | ) | (.554 | ) |
Distributions from Realized Capital Gains | | — | | — | | (.002 | ) | (.016 | ) | (.006 | ) |
Total Distributions | | (.830 | ) | (.718 | ) | (.656 | ) | (.609 | ) | (.560 | ) |
Net Asset Value, End of Period | | $40.84 | | $40.95 | | $37.98 | | $33.15 | | $30.14 | |
| | | | | | | | | | | |
Total Return2 | | 2.09% | | 9.79% | | 16.86% | | 12.13% | | -3.58% | |
| | | | | | | | | | | |
Ratios/Supplemental Data | | | | | | | | | | | |
Net Assets, End of Period (Millions) | | $10,202 | | $8,011 | | $5,600 | | $3,399 | | $2,279 | |
Ratio of Total Expenses to Average Net Assets | | — | | — | | — | | — | | — | |
Acquired Fund Fees and Expenses | | 0.15% | | 0.15% | | 0.15% | | 0.16% | | 0.16% | |
Ratio of Net Investment Income to Average Net Assets | | 2.37% | | 2.18% | | 2.26% | | 2.27% | | 2.17% | |
Portfolio Turnover Rate | | 3% | | 5% | | 5% | | 8% | | 18% | |
1 Calculated based on average shares outstanding.
2 Total returns do not include account service fees that may have applied in the periods shown. Fund prospectuses provide information about any applicable account service fees.
See accompanying Notes, which are an integral part of the Financial Statements.
44
Target Retirement 2055 Fund
Notes to Financial Statements
Vanguard Target Retirement 2055 Fund is registered under the Investment Company Act of 1940 as an open-end investment company, or mutual fund. The fund follows a balanced investment strategy by investing in selected Vanguard funds to achieve its targeted allocation of assets to U.S. and international stocks, and U.S. and international bonds. Financial statements and other information about each underlying fund are available on vanguard.com.
A. The following significant accounting policies conform to generally accepted accounting principles for U.S. investment companies. The fund consistently follows such policies in preparing its financial statements.
1. Security Valuation: Investments are valued at the net asset value of each underlying Vanguard fund determined as of the close of the New York Stock Exchange (generally 4 p.m., Eastern time) on the valuation date.
2. Federal Income Taxes: The fund intends to continue to qualify as a regulated investment company and distribute all of its taxable income. Management has analyzed the fund’s tax positions taken for all open federal income tax years (September 30, 2016–2019), and has concluded that no provision for federal income tax is required in the fund’s financial statements.
3. Distributions: Distributions to shareholders are recorded on the ex-dividend date. Distributions are determined on a tax basis and may differ from net investment income and realized capital gains for financial reporting purposes.
4. Credit Facility: The fund and certain other funds managed by The Vanguard Group (“Vanguard”) participate in a $4.3 billion committed credit facility provided by a syndicate of lenders pursuant to a credit agreement that may be renewed annually; each fund is individually liable for its borrowings, if any, under the credit facility. Borrowings may be utilized for temporary and emergency purposes, and are subject to the fund’s regulatory and contractual borrowing restrictions. The participating funds are charged administrative fees and an annual commitment fee of 0.10% of the undrawn amount of the facility; these fees are allocated to the funds based on a method approved by the fund’s board of trustees and borne by the funds in which the fund invests (see Note B). Any borrowings under this facility bear interest at a rate based upon the higher of the one-month London Interbank Offered Rate, federal funds effective rate, or overnight bank funding rate plus an agreed-upon spread.
The fund had no borrowings outstanding at September 30, 2019, or at any time during the period then ended.
5. Other: Income and capital gain distributions received are recorded on the ex-dividend date. Security transactions are accounted for on the date securities are bought or sold. Costs used to determine realized gains (losses) on the sale of investment securities are those of the specific securities sold.
B. In accordance with the terms of a Funds’ Service Agreement (the “FSA”) between Vanguard and the fund, Vanguard furnishes to the fund investment advisory, corporate management, administrative, marketing, and distribution services at Vanguard’s cost of operations (as defined by the FSA). These costs of operations are allocated to the fund based on methods and guidelines approved by the board of trustees. The FSA provides that expenses otherwise allocable to Vanguard funds-of-funds may be reduced or eliminated to the extent of savings realized by the underlying
45
Target Retirement 2055 Fund
Vanguard funds by virtue of being part of a fund-of-funds. Accordingly, all expenses for services provided by Vanguard to the fund and all other expenses incurred by the fund during the period ended September 30, 2019, were borne by the underlying Vanguard funds in which the fund invests. The fund’s trustees and officers are also trustees and officers, respectively, of the underlying Vanguard funds, as well as directors and employees, respectively, of Vanguard.
C. Various inputs may be used to determine the value of the fund’s investments. These inputs are summarized in three broad levels for financial statement purposes. The inputs or methodologies used to value securities are not necessarily an indication of the risk associated with investing in those securities.
Level 1—Quoted prices in active markets for identical securities.
Level 2—Other significant observable inputs (including quoted prices for similar securities, interest rates, prepayment speeds, credit risk, etc.).
Level 3—Significant unobservable inputs (including the fund’s own assumptions used to determine the fair value of investments). Any investments valued with significant unobservable inputs are noted on the Statement of Net Assets.
At September 30, 2019, 100% of the market value of the fund’s investments was determined based on Level 1 inputs.
D. Permanent differences between book-basis and tax-basis components of net assets, if any, are reclassified among capital accounts in the financial statements to reflect their tax character. These reclassifications have no effect on net assets or net asset value per share.
Temporary differences between book-basis and tax-basis components of total distributable earnings (loss) arise when certain items of income, gain, or loss are recognized in different periods for financial statement and tax purposes; these differences will reverse at some time in the future. The differences are primarily related to the tax deferral of losses on wash sales. As of period end, the tax-basis components of total distributable earnings (loss) are detailed in the table as follows:
| Amount | |
| ($000 | ) |
Undistributed Ordinary Income | 146,714 | |
Undistributed Long-Term Gains | — | |
Capital Loss Carryforwards (Non-expiring) | (1,384 | ) |
Net Unrealized Gains (Losses) | 1,452,294 | |
As of September 30, 2019, gross unrealized appreciation and depreciation for investments based on cost for U.S. federal income tax purposes were as follows:
| | Amount | |
| | ($000 | ) |
Tax Cost | | 8,757,534 | |
Gross Unrealized Appreciation | | 1,543,223 | |
Gross Unrealized Depreciation | | (90,929 | ) |
Net Unrealized Appreciation (Depreciation) | | 1,452,294 | |
46
Target Retirement 2055 Fund
E. Capital shares issued and redeemed were:
| | Year Ended September 30, | |
| | 2019 | | 2018 | |
| | Shares | | Shares | |
| | (000 | ) | (000 | ) |
Issued | | 84,041 | | 75,923 | |
Issued in Lieu of Cash Distributions | | 4,747 | | 2,845 | |
Redeemed | | (34,610 | ) | (30,634 | ) |
Net Increase (Decrease) in Shares Outstanding | | 54,178 | | 48,134 | |
F. Transactions during the period in affiliated underlying Vanguard funds were as follows:
| | | | Current Period Transactions | | | |
| | Sept. 30, | | | | Proceeds | | Realized | | | | | | | | Sept. 30, | |
| | 2018 | | | | from | | Net | | Change in | | | | Capital Gain | | 2019 | |
| | Market | | Purchases | | Securities | | Gain | | Unrealized | | | | Distributions | | Market | |
| | Value | | at Cost | | Sold | | (Loss | ) | App. (Dep. | ) | Income | | Received | | Value | |
| | ($000 | ) | ($000 | ) | ($000 | ) | ($000 | ) | ($000 | ) | ($000 | ) | ($000 | ) | ($000 | ) |
Vanguard Market Liquidity Fund | | 3,066 | | NA1 | | NA1 | | (2 | ) | — | | 147 | | — | | 13,725 | |
Vanguard Total Bond Market II Index Fund | | 569,472 | | 245,752 | | 129,127 | | (179 | ) | 46,078 | | 17,932 | | — | | 731,996 | |
Vanguard Total International Bond Index Fund | | 231,600 | | 60,986 | | 11,870 | | (90 | ) | 21,123 | | 7,160 | | — | | 301,749 | |
Vanguard Total International Stock Index Fund | | 2,878,168 | | 929,594 | | 23,990 | | 626 | | (125,665 | ) | 95,821 | | — | | 3,658,733 | |
Vanguard Total Stock Market Index Fund | | 4,326,242 | | 1,142,798 | | 78,967 | | 77 | | 113,475 | | 86,103 | | — | | 5,503,625 | |
Total | | 8,008,548 | | 2,379,130 | | 243,954 | | 432 | | 55,011 | | 207,163 | | — | | 10,209,828 | |
1 Not applicable—purchases and sales are for temporary cash investment purposes.
G. Management has determined that no events or transactions occurred subsequent to September 30, 2019, that would require recognition or disclosure in these financial statements.
47
Target Retirement 2060 Fund
Performance Summary
All of the returns in this report represent past performance, which is not a guarantee of future results that may be achieved by the fund. (Current performance may be lower or higher than the performance data cited. For performance data current to the most recent month-end, visit our website at vanguard.com/performance.) Note, too, that both investment returns and principal value can fluctuate widely, so an investor’s shares, when sold, could be worth more or less than their original cost. The returns shown do not reflect taxes that a shareholder would pay on fund distributions or on the sale of fund shares.
Cumulative Performance: January 19, 2012, Through September 30, 2019
Initial Investment of $10,000

| | Average Annual Total Returns | |
| | Periods Ended September 30, 2019 | |
| | | | Since | Final Value |
| | One | Five | Inception | of a $10,000 |
| | Year | Years | (1/19/2012) | Investment |

| Target Retirement 2060 Fund | 2.07% | 7.20% | 9.72% | $20,413 |

| Target 2060 Composite Index | 2.32 | 7.49 | 9.99 | 20,804 |

| MSCI US Broad Market Index | 2.91 | 10.47 | 13.28 | 26,107 |
Target 2060 Composite Index: Derived by applying the fund’s target asset allocation to the results of the following benchmarks: for international stocks of developed markets, the MSCI ACWI ex USA IMI Index through June 2, 2013, and the FTSE Global All Cap ex US Index thereafter; for emerging-market stocks, the MSCI ACWI ex USA IMI Index through June 2, 2013, and the FTSE Global All Cap ex US Index thereafter; for U.S. bonds, the Bloomberg Barclays U.S. Aggregate Float Adjusted Index; for international bonds, the Bloomberg Barclays Global Aggregate ex-USD Float Adjusted RIC Capped Index Hedged beginning June 3, 2013; and for U.S. stocks, the MSCI US Broad Market Index through June 2, 2013, and the CRSP US Total Market Index thereafter. International stock benchmark returns are adjusted for withholding taxes.
“Since Inception” performance is calculated from the inception date for both the fund and its comparative standards.
See Financial Highlights for dividend and capital gains information.
48
Target Retirement 2060 Fund
Underlying Vanguard Funds
As of September 30, 2019
Vanguard Total Stock Market Index Fund Investor Shares | 54.1% |
Vanguard Total International Stock Index Fund Investor Shares | 35.8 |
Vanguard Total Bond Market II Index Fund Investor Shares | 7.2 |
Vanguard Total International Bond Index Fund Investor Shares | 2.9 |
49
Target Retirement 2060 Fund
Financial Statements
Statement of Net Assets
As of September 30, 2019
The fund files its complete schedule of portfolio holdings with the Securities and Exchange Commission (SEC) for the first and third quarters of each fiscal year as an exhibit to its reports on Form N-PORT. The fund’s Form N-PORT reports are available on the SEC’s website at www.sec.gov.
| | | | Market | |
| | | | Value· | |
| | Shares | | ($000 | ) |
Investment Companies (100.0%) | | | | | |
U.S. Stock Fund (54.1%) | | | | | |
Vanguard Total Stock Market Index Fund Investor Shares | | 32,058,465 | | 2,355,656 | |
| | | | | |
International Stock Fund (35.8%) | | | | | |
Vanguard Total International Stock Index Fund Investor Shares | | 94,258,098 | | 1,561,857 | |
| | | | | |
U.S. Bond Fund (7.2%) | | | | | |
1 Vanguard Total Bond Market II Index Fund Investor Shares | | 28,223,990 | | 312,722 | |
| | | | | |
International Bond Fund (2.9%) | | | | | |
Vanguard Total International Bond Index Fund Investor Shares | | 10,869,836 | | 127,829 | |
Total Investment Companies (Cost $3,854,727) | | | | 4,358,064 | |
Temporary Cash Investment (0.1%) | | | | | |
Money Market Fund (0.1%) | | | | | |
1 Vanguard Market Liquidity Fund, 2.098% (Cost $6,033) | | 60,329 | | 6,033 | |
Total Investments (100.1%) (Cost $3,860,760) | | | | 4,364,097 | |
Other Assets and Liabilities (-0.1%) | | | | | |
Other Assets | | | | 9,340 | |
Liabilities | | | | (14,726 | ) |
| | | | (5,386 | ) |
Net Assets (100%) | | | | | |
Applicable to 120,826,143 outstanding $.001 par value shares of beneficial interest (unlimited authorization) | | | | 4,358,711 | |
Net Asset Value Per Share | | | | $36.07 | |
50
Target Retirement 2060 Fund
| | Amount | |
| | ($000 | ) |
Statement of Assets and Liabilities | | | |
Assets | | | |
Investments in Securities, at Value—Affiliated Funds | | 4,364,097 | |
Receivables for Accrued Income | | 775 | |
Receivables for Capital Shares Issued | | 8,565 | |
Total Assets | | 4,373,437 | |
Liabilities | | | |
Payables for Investment Securities Purchased | | 10,003 | |
Payables for Capital Shares Redeemed | | 4,723 | |
Total Liabilities | | 14,726 | |
Net Assets | | 4,358,711 | |
| | | |
| | | |
At September 30, 2019, net assets consisted of: | | | |
| | Amount | |
| | ($000 | ) |
Paid-in Capital | | 3,794,353 | |
Total Distributable Earnings (Loss) | | 564,358 | |
Net Assets | | 4,358,711 | |
· See Note A in Notes to Financial Statements.
1 Affiliated fund available only to Vanguard funds and certain trusts and accounts managed by Vanguard. Rate shown for Vanguard Market Liquidity Fund is the 7-day yield.
See accompanying Notes, which are an integral part of the Financial Statements.
51
Target Retirement 2060 Fund
Statement of Operations
| | Year Ended | |
| | September 30, 2019 | |
| | ($000 | ) |
Investment Income | | | |
Income | | | |
Income Distributions Received from Affiliated Funds | | 86,239 | |
Net Investment Income—Note B | | 86,239 | |
Realized Net Gain (Loss) | | | |
Capital Gain Distributions Received from Affiliated Funds | | — | |
Affiliated Funds Sold | | (641 | ) |
Futures Contracts | | (15 | ) |
Realized Net Gain (Loss) | | (656 | ) |
Change in Unrealized Appreciation (Depreciation) from Affiliated Funds | | 29,171 | |
Net Increase (Decrease) in Net Assets Resulting from Operations | | 114,754 | |
See accompanying Notes, which are an integral part of the Financial Statements.
52
Target Retirement 2060 Fund
Statement of Changes in Net Assets
| | Year Ended September 30, | |
| | 2019 | | 2018 | |
| | ($000 | ) | ($000 | ) |
Increase (Decrease) in Net Assets | | | | | |
Operations | | | | | |
Net Investment Income | | 86,239 | | 59,150 | |
Realized Net Gain (Loss) | | (656 | ) | 457 | |
Change in Unrealized Appreciation (Depreciation) | | 29,171 | | 177,389 | |
Net Increase (Decrease) in Net Assets Resulting from Operations | | 114,754 | | 236,996 | |
Distributions | | | | | |
Net Investment Income | | (67,815 | ) | (41,761 | ) |
Realized Capital Gain1 | | (312 | ) | — | |
Total Distributions | | (68,127 | ) | (41,761 | ) |
Capital Share Transactions | | | | | |
Issued | | 1,629,071 | | 1,437,252 | |
Issued in Lieu of Cash Distributions | | 66,263 | | 40,758 | |
Redeemed | | (622,889 | ) | (514,124 | ) |
Net Increase (Decrease) from Capital Share Transactions | | 1,072,445 | | 963,886 | |
Total Increase (Decrease) | | 1,119,072 | | 1,159,121 | |
Net Assets | | | | | |
Beginning of Period | | 3,239,639 | | 2,080,518 | |
End of Period | | 4,358,711 | | 3,239,639 | |
1 Includes fiscal 2019 and 2018 short-term gain distributions totaling $293,000 and $0, respectively. Short-term gain distributions are treated as ordinary income dividends for tax purposes.
See accompanying Notes, which are an integral part of the Financial Statements.
53
Target Retirement 2060 Fund
Financial Highlights
For a Share Outstanding | | Year Ended September 30, | |
Throughout Each Period | | 2019 | | 2018 | | 2017 | | 2016 | | 2015 | |
Net Asset Value, Beginning of Period | | $36.16 | | $33.51 | | $29.25 | | $26.58 | | $28.03 | |
Investment Operations | | | | | | | | | | | |
Net Investment Income | | .822 | 1 | .768 | 1 | .708 | 1 | .555 | | .540 | |
Capital Gain Distributions Received | | — | | — | | .0021 | | .003 | | .004 | |
Net Realized and Unrealized Gain (Loss) on Investments | | (.192 | ) | 2.495 | | 4.126 | | 2.635 | | (1.523 | ) |
Total from Investment Operations | | .630 | | 3.263 | | 4.836 | | 3.193 | | (.979 | ) |
Distributions | | | | | | | | | | | |
Dividends from Net Investment Income | | (.717 | ) | (.613 | ) | (.574 | ) | (.503 | ) | (.464 | ) |
Distributions from Realized Capital Gains | | (.003 | ) | — | | (.002 | ) | (.020 | ) | (.007 | ) |
Total Distributions | | (.720 | ) | (.613 | ) | (.576 | ) | (.523 | ) | (.471 | ) |
Net Asset Value, End of Period | | $36.07 | | $36.16 | | $33.51 | | $29.25 | | $26.58 | |
| | | | | | | | | | | |
Total Return2 | | 2.07% | | 9.81% | | 16.84% | | 12.13% | | -3.61% | |
| | | | | | | | | | | |
Ratios/Supplemental Data | | | | | | | | | | | |
Net Assets, End of Period (Millions) | | $4,359 | | $3,240 | | $2,081 | | $1,143 | | $733 | |
Ratio of Total Expenses to Average Net Assets | | — | | — | | — | | — | | — | |
Acquired Fund Fees and Expenses | | 0.15% | | 0.15% | | 0.15% | | 0.16% | | 0.16% | |
Ratio of Net Investment Income to Average Net Assets | | 2.37% | | 2.19% | | 2.28% | | 2.28% | | 2.19% | |
Portfolio Turnover Rate | | 2% | | 3% | | 4% | | 6% | | 21% | |
1 Calculated based on average shares outstanding.
2 Total returns do not include account service fees that may have applied in the periods shown. Fund prospectuses provide information about any applicable account service fees.
See accompanying Notes, which are an integral part of the Financial Statements.
54
Target Retirement 2060 Fund
Notes to Financial Statements
Vanguard Target Retirement 2060 Fund is registered under the Investment Company Act of 1940 as an open-end investment company, or mutual fund. The fund follows a balanced investment strategy by investing in selected Vanguard funds to achieve its targeted allocation of assets to U.S. and international stocks, and U.S. and international bonds. Financial statements and other information about each underlying fund are available on vanguard.com.
A. The following significant accounting policies conform to generally accepted accounting principles for U.S. investment companies. The fund consistently follows such policies in preparing its financial statements.
1. Security Valuation: Investments are valued at the net asset value of each underlying Vanguard fund determined as of the close of the New York Stock Exchange (generally 4 p.m., Eastern time) on the valuation date.
2. Futures Contracts: The fund uses stock and bond futures contracts to a limited extent, with the objectives of maintaining full exposure to the market and maintaining its target asset allocation. The primary risks associated with the use of futures contracts are imperfect correlation between changes in market values of investments held by the fund and the prices of futures contracts, and the possibility of an illiquid market. Counterparty risk involving futures is mitigated because a regulated clearinghouse is the counterparty instead of the clearing broker. To further mitigate counterparty risk, the fund trades futures contracts on an exchange, monitors the financial strength of its clearing brokers and clearinghouse, and has entered into clearing agreements with its clearing brokers. The clearinghouse imposes initial margin requirements to secure the fund’s performance and requires daily settlement of variation margin representing changes in the market value of each contract. Any assets pledged as initial margin for open contracts are noted in the Statement of Net Assets.
Futures contracts are valued at their quoted daily settlement prices. The notional amounts of the contracts are not recorded in the Statement of Net Assets. Fluctuations in the value of the contracts are recorded in the Statement of Assets and Liabilities as an asset (liability) and in the Statement of Operations as unrealized appreciation (depreciation) until the contracts are closed, when they are recorded as realized futures gains (losses).
During the year ended September 30, 2019, the fund’s average investments in long and short futures contracts represented less than 1% and 0% of net assets, respectively, based on the average of the notional amounts at each quarter-end during the period. The fund had no open futures contracts at September 30, 2019.
3. Federal Income Taxes: The fund intends to continue to qualify as a regulated investment company and distribute all of its taxable income. Management has analyzed the fund’s tax positions taken for all open federal income tax years (September 30, 2016—2019), and has concluded that no provision for federal income tax is required in the fund’s financial statements.
4. Distributions: Distributions to shareholders are recorded on the ex-dividend date. Distributions are determined on a tax basis and may differ from net investment income and realized capital gains for financial reporting purposes.
55
Target Retirement 2060 Fund
5. Credit Facility: The fund and certain other funds managed by The Vanguard Group (“Vanguard”) participate in a $4.3 billion committed credit facility provided by a syndicate of lenders pursuant to a credit agreement that may be renewed annually; each fund is individually liable for its borrowings, if any, under the credit facility. Borrowings may be utilized for temporary and emergency purposes, and are subject to the fund’s regulatory and contractual borrowing restrictions. The participating funds are charged administrative fees and an annual commitment fee of 0.10% of the undrawn amount of the facility; these fees are allocated to the funds based on a method approved by the fund’s board of trustees and borne by the funds in which the fund invests (see Note B). Any borrowings under this facility bear interest at a rate based upon the higher of the one-month London Interbank Offered Rate, federal funds effective rate, or overnight bank funding rate plus an agreed-upon spread.
The fund had no borrowings outstanding at September 30, 2019, or at any time during the period then ended.
6. Other: Income and capital gain distributions received are recorded on the ex-dividend date. Security transactions are accounted for on the date securities are bought or sold. Costs used to determine realized gains (losses) on the sale of investment securities are those of the specific securities sold.
B. In accordance with the terms of a Funds’ Service Agreement (the “FSA”) between Vanguard and the fund, Vanguard furnishes to the fund investment advisory, corporate management, administrative, marketing, and distribution services at Vanguard’s cost of operations (as defined by the FSA). These costs of operations are allocated to the fund based on methods and guidelines approved by the board of trustees. The FSA provides that expenses otherwise allocable to Vanguard funds-of-funds may be reduced or eliminated to the extent of savings realized by the underlying Vanguard funds by virtue of being part of a fund-of-funds. Accordingly, all expenses for services provided by Vanguard to the fund and all other expenses incurred by the fund during the period ended September 30, 2019, were borne by the underlying Vanguard funds in which the fund invests. The fund’s trustees and officers are also trustees and officers, respectively, of the underlying Vanguard funds, as well as directors and employees, respectively, of Vanguard.
C. Various inputs may be used to determine the value of the fund’s investments. These inputs are summarized in three broad levels for financial statement purposes. The inputs or methodologies used to value securities are not necessarily an indication of the risk associated with investing in those securities.
Level 1—Quoted prices in active markets for identical securities.
Level 2—Other significant observable inputs (including quoted prices for similar securities, interest rates, prepayment speeds, credit risk, etc.).
Level 3—Significant unobservable inputs (including the fund’s own assumptions used to determine the fair value of investments). Any investments valued with significant unobservable inputs are noted on the Statement of Net Assets.
At September 30, 2019, 100% of the market value of the fund’s investments was determined based on Level 1 inputs.
56
Target Retirement 2060 Fund
D. Permanent differences between book-basis and tax-basis components of net assets, if any, are reclassified among capital accounts in the financial statements to reflect their tax character. These reclassifications have no effect on net assets or net asset value per share.
Temporary differences between book-basis and tax-basis components of total distributable earnings (loss) arise when certain items of income, gain, or loss are recognized in different periods for financial statement and tax purposes; these differences will reverse at some time in the future. The differences are primarily related to the tax deferral of losses on wash sales. As of period end, the tax-basis components of total distributable earnings (loss) are detailed in the table as follows:
| | Amount | |
| | ($000) | |
Undistributed Ordinary Income | | 61,677 | |
Undistributed Long-Term Gains | | — | |
Capital Loss Carryforwards (Non-expiring) | | (656) | |
Net Unrealized Gains (Losses) | | 503,337 | |
As of September 30, 2019, gross unrealized appreciation and depreciation for investments based on cost for U.S. federal income tax purposes were as follows:
| | Amount | |
| | ($000) | |
Tax Cost | | 3,860,760 | |
Gross Unrealized Appreciation | | 546,143 | |
Gross Unrealized Depreciation | | (42,806) | |
Net Unrealized Appreciation (Depreciation) | | 503,337 | |
E. Capital shares issued and redeemed were:
| | Year Ended September 30, | |
| | 2019 | | 2018 | |
| | Shares | | Shares | |
| | (000) | | (000) | |
Issued | | 47,218 | | 40,975 | |
Issued in Lieu of Cash Distributions | | 2,140 | | 1,174 | |
Redeemed | | (18,120) | | (14,643) | |
Net Increase (Decrease) in Shares Outstanding | | 31,238 | | 27,506 | |
57
Target Retirement 2060 Fund
F. Transactions during the period in affiliated underlying Vanguard funds were as follows:
| | | | | Current Period Transactions | |
| Sept. 30, | | Proceeds | Realized | | | | Sept. 30, |
| 2018 | | from | Net | Change in | | Capital Gain | 2019 |
| Market | Purchases | Securities | Gain | Unrealized | | Distributions | Market |
| Value | at Cost | Sold | (Loss) | App. (Dep.) | Income | Received | Value |
| ($000) | ($000) | ($000) | ($000) | ($000) | ($000) | ($000) | ($000) |
Vanguard Market Liquidity Fund | 578 | NA1 | NA1 | — | — | 48 | — | 6,033 |
Vanguard Total Bond Market II Index Fund | 230,347 | 116,721 | 53,365 | (641) | 19,660 | 7,417 | — | 312,722 |
Vanguard Total International Bond Index Fund | 94,517 | 27,855 | 3,401 | — | 8,858 | 2,971 | — | 127,829 |
Vanguard Total International Stock Index Fund | 1,161,838 | 452,774 | 3,096 | — | (49,659) | 39,906 | — | 1,561,857 |
Vanguard Total Stock Market Index Fund | 1,750,277 | 562,879 | 7,812 | — | 50,312 | 35,897 | — | 2,355,656 |
Total | 3,237,557 | 1,160,229 | 67,674 | (641) | 29,171 | 86,239 | — | 4,364,097 |
1 Not applicable—purchases and sales are for temporary cash investment purposes.
G. Management has determined that no events or transactions occurred subsequent to September 30, 2019, that would require recognition or disclosure in these financial statements.
58
Target Retirement 2065 Fund
Performance Summary
All of the returns in this report represent past performance, which is not a guarantee of future results that may be achieved by the fund. (Current performance may be lower or higher than the performance data cited. For performance data current to the most recent month-end, visit our website at vanguard.com/performance.) Note, too, that both investment returns and principal value can fluctuate widely, so an investor’s shares, when sold, could be worth more or less than their original cost. The returns shown do not reflect taxes that a shareholder would pay on fund distributions or on the sale of fund shares.
Cumulative Performance: July 12, 2017, Through September 30, 2019
Initial Investment of $10,000

| | | | Average Annual Total Returns | | | |
| | | | Periods Ended September 30, 2019 | | | |
| | | | | | | |
| | | | | Since | | Final Value | |
| | | | One | Inception | | of a $10,000 | |
| | | | Year | (7/12/2017) | | Investment | |

| | Target Retirement 2065 Fund | | 2.09% | 7.11% | | $11,647 | |

| | Target 2065 Composite Index | | 2.32 | 7.35 | | 11,704 | |

| | MSCI US Broad Market Index | | 2.91 | 10.77 | | 12,548 | |
Target 2065 Composite Index: Derived by applying the fund’s target asset allocation to the results of the following benchmarks: the FTSE Global All Cap ex US Index for international stocks, the Bloomberg Barclays U.S. Aggregate Float Adjusted Index for U.S. bonds, the Bloomberg Barclays Global Aggregate ex-USD Float Adjusted RIC Capped Index Hedged for international bonds, and the CRSP US Total Market Index for U.S. stocks. International stock benchmark returns are adjusted for withholding taxes.
“Since Inception” performance is calculated from the inception date for both the fund and its comparative standards.
See Financial Highlights for dividend and capital gains information.
59
Target Retirement 2065 Fund
Underlying Vanguard Funds
As of September 30, 2019
Vanguard Total Stock Market Index Fund Investor Shares | | 54.1% | |
Vanguard Total International Stock Index Fund Investor Shares | | 35.9 | |
Vanguard Total Bond Market II Index Fund Investor Shares | | 7.0 | |
Vanguard Total International Bond Index Fund Investor Shares | | 3.0 | |
60
Target Retirement 2065 Fund
Financial Statements
Statement of Net Assets
As of September 30, 2019
The fund files its complete schedule of portfolio holdings with the Securities and Exchange Commission (SEC) for the first and third quarters of each fiscal year as an exhibit to its reports on Form N-PORT. The fund’s Form N-PORT reports are available on the SEC’s website at www.sec.gov.
| | | | Market |
| | | | Value· |
| | Shares | | ($000) |
Investment Companies (99.9%) | | | | |
U.S. Stock Fund (54.0%) | | | | |
Vanguard Total Stock Market Index Fund Investor Shares | | 3,089,430 | | 227,011 |
| | | | |
International Stock Fund (35.9%) | | | | |
Vanguard Total International Stock Index Fund Investor Shares | | 9,090,580 | | 150,631 |
| | | | |
U.S. Bond Fund (7.0%) | | | | |
1 Vanguard Total Bond Market II Index Fund Investor Shares | | 2,668,216 | | 29,564 |
| | | | |
International Bond Fund (3.0%) | | | | |
Vanguard Total International Bond Index Fund Investor Shares | | 1,072,846 | | 12,616 |
Total Investment Companies (Cost $407,647) | | | | 419,822 |
Temporary Cash Investment (0.1%) | | | | |
Money Market Fund (0.1%) | | | | |
1 Vanguard Market Liquidity Fund, 2.098% (Cost $351) | | 3,507 | | 351 |
Total Investments (100.0%) (Cost $407,998) | | | | 420,173 |
Other Assets and Liabilities (0.0%) | | | | |
Other Assets | | | | 1,555 |
Liabilities | | | | (1,675) |
| | | | (120) |
Net Assets (100%) | | | | |
Applicable to 18,509,864 outstanding $.001 par value shares of beneficial interest (unlimited authorization) | | | | 420,053 |
Net Asset Value Per Share | | | | $22.69 |
61
Target Retirement 2065 Fund
| | Amount |
| | ($000) |
Statement of Assets and Liabilities | | |
Assets | | |
Investments in Securities, at Value—Affiliated Funds | | 420,173 |
Receivables for Accrued Income | | 82 |
Receivables for Capital Shares Issued | | 1,473 |
Total Assets | | 421,728 |
Liabilities | | |
Payables for Investment Securities Purchased | | 1,157 |
Payables for Capital Shares Redeemed | | 518 |
Total Liabilities | | 1,675 |
Net Assets | | 420,053 |
At September 30, 2019, net assets consisted of:
| | Amount |
| | ($000) |
Paid-in Capital | | 402,387 |
Total Distributable Earnings (Loss) | | 17,666 |
Net Assets | | 420,053 |
· See Note A in Notes to Financial Statements.
1 Affiliated fund available only to Vanguard funds and certain trusts and accounts managed by Vanguard. Rate shown for Vanguard Market Liquidity Fund is the 7-day yield.
See accompanying Notes, which are an integral part of the Financial Statements.
62
Target Retirement 2065 Fund
Statement of Operations
| | Year Ended | |
| | September 30, 2019 | |
| | ($000) | |
Investment Income | | | |
Income | | | |
Income Distributions Received from Affiliated Funds | | 7,234 | |
Other Income | | 9 | |
Net Investment Income – Note B | | 7,243 | |
Realized Net Gain (Loss) | | | |
Capital Gain Distributions Received from Affiliated Funds | | — | |
Affiliated Funds Sold | | — | |
Change in Unrealized Appreciation (Depreciation) from Affiliated Funds | | 7,079 | |
Net Increase (Decrease) in Net Assets Resulting from Operations | | 14,322 | |
See accompanying Notes, which are an integral part of the Financial Statements.
63
Target Retirement 2065 Fund
Statement of Changes in Net Assets
| | Year Ended September 30, |
| | 2019 | | 2018 |
| | ($000) | | ($000) |
Increase (Decrease) in Net Assets | | | | |
Operations | | | | |
Net Investment Income | | 7,243 | | 2,513 |
Realized Net Gain (Loss) | | — | | 14 |
Change in Unrealized Appreciation (Depreciation) | | 7,079 | | 4,758 |
Net Increase (Decrease) in Net Assets Resulting from Operations | | 14,322 | | 7,285 |
Distributions | | | | |
Net Investment Income | | (3,972) | | (366) |
Realized Capital Gain | | (4) | | — |
Total Distributions | | (3,976) | | (366) |
Capital Share Transactions | | | | |
Issued | | 295,477 | | 214,128 |
Issued in Lieu of Cash Distributions | | 3,802 | | 346 |
Redeemed | | (91,083) | | (38,875) |
Net Increase (Decrease) from Capital Share Transactions | | 208,196 | | 175,599 |
Total Increase (Decrease) | | 218,542 | | 182,518 |
Net Assets | | | | |
Beginning of Period | | 201,511 | | 18,993 |
End of Period | | 420,053 | | 201,511 |
See accompanying Notes, which are an integral part of the Financial Statements.
64
Target Retirement 2065 Fund
Financial Highlights
| | | | | | July 12, 20171 to Sept. 30, 2017 |
| | Year Ended | |
For a Share Outstanding | | September 30, | |
Throughout Each Period | | 2019 | | 2018 | |
Net Asset Value, Beginning of Period | | $22.64 | | $20.79 | | $20.00 |
Investment Operations | | | | | | |
Net Investment Income2 | | .529 | | .524 | | .150 |
Capital Gain Distributions Received2 | | — | | — | | — |
Net Realized and Unrealized Gain (Loss) on Investments | | (.116 | ) | 1.496 | | .640 |
Total from Investment Operations | | .413 | | 2.020 | | .790 |
Distributions | | | | | | |
Dividends from Net Investment Income | | (.363 | ) | (.170 | ) | — |
Distributions from Realized Capital Gains | | .000 | 3 | — | | — |
Total Distributions | | (.363 | ) | (.170 | ) | — |
Net Asset Value, End of Period | | $22.69 | | $22.64 | | $20.79 |
| | | | | | |
Total Return4 | | 2.09% | | 9.75% | | 3.95% |
| | | | | | |
Ratios/Supplemental Data | | | | | | |
Net Assets, End of Period (Millions) | | $420 | | $202 | | $19 |
Ratio of Total Expenses to Average Net Assets | | — | | — | | — |
Acquired Fund Fees and Expenses | | 0.15% | | 0.15% | | 0.15%5 |
Ratio of Net Investment Income to Average Net Assets | | 2.42% | | 2.37% | | 3.30%5 |
Portfolio Turnover Rate | | 2% | | 1% | | 29% |
1 Inception.
2 Calculated based on average shares outstanding.
3 Distribution was less than $.001 per share.
4 Total returns do not include account service fees that may have applied in the periods shown. Fund prospectuses provide information about any applicable account service fees.
5 Annualized.
See accompanying Notes, which are an integral part of the Financial Statements.
65
Target Retirement 2065 Fund
Notes to Financial Statements
Vanguard Target Retirement 2065 Fund is registered under the Investment Company Act of 1940 as an open-end investment company, or mutual fund. The fund follows a balanced investment strategy by investing in selected Vanguard funds to achieve its targeted allocation of assets to U.S. and international stocks, and U.S. and international bonds. Financial statements and other information about each underlying fund are available on vanguard.com.
A. The following significant accounting policies conform to generally accepted accounting principles for U.S. investment companies. The fund consistently follows such policies in preparing its financial statements.
1. Security Valuation: Investments are valued at the net asset value of each underlying Vanguard fund determined as of the close of the New York Stock Exchange (generally 4 p.m., Eastern time) on the valuation date.
2. Federal Income Taxes: The fund intends to continue to qualify as a regulated investment company and distribute all of its taxable income. Management has analyzed the fund’s tax positions taken for all open federal income tax years (September 30, 2017–2019), and has concluded that no provision for federal income tax is required in the fund’s financial statements.
3. Distributions: Distributions to shareholders are recorded on the ex-dividend date. Distributions are determined on a tax basis and may differ from net investment income and realized capital gains for financial reporting purposes.
4. Credit Facility: The fund and certain other funds managed by The Vanguard Group (“Vanguard”) participate in a $4.3 billion committed credit facility provided by a syndicate of lenders pursuant to a credit agreement that may be renewed annually; each fund is individually liable for its borrowings, if any, under the credit facility. Borrowings may be utilized for temporary and emergency purposes, and are subject to the fund’s regulatory and contractual borrowing restrictions. The participating funds are charged administrative fees and an annual commitment fee of 0.10% of the undrawn amount of the facility; these fees are allocated to the funds based on a method approved by the fund’s board of trustees and borne by the funds in which the fund invests (see Note B). Any borrowings under this facility bear interest at a rate based upon the higher of the one-month London Interbank Offered Rate, federal funds effective rate, or overnight bank funding rate plus an agreed-upon spread.
The fund had no borrowings outstanding at September 30, 2019, or at any time during the period then ended.
5. Other: Income and capital gain distributions received are recorded on the ex-dividend date. Security transactions are accounted for on the date securities are bought or sold. Costs used to determine realized gains (losses) on the sale of investment securities are those of the specific securities sold.
B. In accordance with the terms of a Funds’ Service Agreement (the “FSA”) between Vanguard and the fund, Vanguard furnishes to the fund investment advisory, corporate management, administrative, marketing, and distribution services at Vanguard’s cost of operations (as defined by the FSA). These costs of operations are allocated to the fund based on methods and guidelines approved by the board of trustees. The FSA provides that expenses otherwise allocable to Vanguard funds-of-funds may be reduced or eliminated to the extent of savings realized by the underlying
66
Target Retirement 2065 Fund
Vanguard funds by virtue of being part of a fund-of-funds. Accordingly, all expenses for services provided by Vanguard to the fund and all other expenses incurred by the fund during the period ended September 30, 2019, were borne by the underlying Vanguard funds in which the fund invests. The fund’s trustees and officers are also trustees and officers, respectively, of the underlying Vanguard funds, as well as directors and employees, respectively, of Vanguard.
C. Various inputs may be used to determine the value of the fund’s investments. These inputs are summarized in three broad levels for financial statement purposes. The inputs or methodologies used to value securities are not necessarily an indication of the risk associated with investing in those securities.
Level 1—Quoted prices in active markets for identical securities.
Level 2—Other significant observable inputs (including quoted prices for similar securities, interest rates, prepayment speeds, credit risk, etc.).
Level 3—Significant unobservable inputs (including the fund’s own assumptions used to determine the fair value of investments). Any investments valued with significant unobservable inputs are noted on the Statement of Net Assets.
At September 30, 2019, 100% of the market value of the fund’s investments was determined based on Level 1 inputs.
D. Permanent differences between book-basis and tax-basis components of net assets, if any, are reclassified among capital accounts in the financial statements to reflect their tax character. These reclassifications have no effect on net assets or net asset value per share.
Temporary differences between book-basis and tax-basis components of total distributable earnings (loss) arise when certain items of income, gain, or loss are recognized in different periods for financial statement and tax purposes; these differences will reverse at some time in the future. The differences are primarily related to the tax deferral of losses on wash sales. As of period end, the tax-basis components of total distributable earnings (loss) are detailed in the table as follows:
| | Amount |
| | ($000) |
Undistributed Ordinary Income | | 5,491 |
Undistributed Long-Term Gains | | — |
Capital Loss Carryforwards (Non-expiring) | | — |
Net Unrealized Gains (Losses) | | 12,175 |
As of September 30, 2019, gross unrealized appreciation and depreciation for investments based on cost for U.S. federal income tax purposes were as follows:
| | Amount |
| | ($000) |
Tax Cost | | 407,998 |
Gross Unrealized Appreciation | | 18,839 |
Gross Unrealized Depreciation | | (6,664) |
Net Unrealized Appreciation (Depreciation) | | 12,175 |
67
Target Retirement 2065 Fund
E. Capital shares issued and redeemed were:
| | Year Ended September 30, |
| | 2019 | | 2018 |
| | Shares | | Shares |
| | (000) | | (000) |
Issued | | 13,620 | | 9,733 |
Issued in Lieu of Cash Distributions | | 195 | | 16 |
Redeemed | | (4,206) | | (1,762) |
Net Increase (Decrease) in Shares Outstanding | | 9,609 | | 7,987 |
F. Transactions during the period in affiliated underlying Vanguard funds were as follows:
| | | | | Current Period Transactions | | |
| Sept. 30, | | Proceeds | Realized | | | | | Sept. 30, |
| 2018 | | from | Net | Change in | | Capital Gain | | 2019 |
| Market | Purchases | Securities | Gain | Unrealized | | Distributions | | Market |
| Value | at Cost | Sold | (Loss) | App. (Dep.) | Income | Received | | Value |
| ($000) | ($000) | ($000) | ($000) | ($000) | ($000) | ($000 | ) | ($000) |
Vanguard Market Liquidity Fund | 276 | NA1 | NA1 | — | — | 9 | — | | 351 |
Vanguard Total Bond Market II Index Fund | 14,105 | 16,551 | 2,708 | 2 | 1,614 | 596 | — | | 29,564 |
Vanguard Total International Bond Index Fund | 6,026 | 6,047 | 237 | (1) | 781 | 224 | — | | 12,616 |
Vanguard Total International Stock Index Fund | 72,016 | 82,311 | 1,020 | — | (2,676) | 3,387 | — | | 150,631 |
Vanguard Total Stock Market Index Fund | 109,011 | 112,644 | 2,003 | (1) | 7,360 | 3,018 | — | | 227,011 |
Total | 201,434 | 217,553 | 5,968 | — | 7,079 | 7,234 | — | | 420,173 |
1 Not applicable—purchases and sales are for temporary cash investment purposes.
G. Management has determined that no events or transactions occurred subsequent to September 30, 2019, that would require recognition or disclosure in these financial statements.
68
Report of Independent Registered Public Accounting Firm
To the Board of Trustees of Vanguard Chester Funds and Shareholders of Vanguard Target Retirement 2040 Fund, Vanguard Target Retirement 2045 Fund, Vanguard Target Retirement 2050 Fund, Vanguard Target Retirement 2055 Fund, Vanguard Target Retirement 2060 Fund and Vanguard Target Retirement 2065 Fund
Opinions on the Financial Statements
We have audited the accompanying statements of net assets and statements of assets and liabilities of Vanguard Target Retirement 2040 Fund, Vanguard Target Retirement 2045 Fund, Vanguard Target Retirement 2050 Fund, Vanguard Target Retirement 2055 Fund, Vanguard Target Retirement 2060 Fund and Vanguard Target Retirement 2065 Fund (six of the funds constituting Vanguard Chester Funds, hereafter collectively referred to as the “Funds”) as of September 30, 2019, the related statements of operations for the year ended September 30, 2019, the statements of changes in net assets for each of the two years in the period ended September 30, 2019, including the related notes, and the financial highlights for each of the periods indicated therein (collectively referred to as the “financial statements”). In our opinion, the financial statements present fairly, in all material respects, the financial position of each of the Funds as of September 30, 2019, the results of each of their operations for the year then ended, the changes in each of their net assets for each of the two years in the period ended September 30, 2019 and each of the financial highlights for each of the periods indicated therein in conformity with accounting principles generally accepted in the United States of America.
Basis for Opinions
These financial statements are the responsibility of the Funds’ management. Our responsibility is to express an opinion on the Funds’ financial statements based on our audits. We are a public accounting firm registered with the Public Company Accounting Oversight Board (United States) (“PCAOB”) and are required to be independent with respect to the Funds in accordance with the U.S. federal securities laws and the applicable rules and regulations of the Securities and Exchange Commission and the PCAOB.
We conducted our audits of these financial statements in accordance with the standards of the PCAOB. Those standards require that we plan and perform the audit to obtain reasonable assurance about whether the financial statements are free of material misstatement, whether due to error or fraud.
Our audits included performing procedures to assess the risks of material misstatement of the financial statements, whether due to error or fraud, and performing procedures that respond to those risks. Such procedures included examining, on a test basis, evidence regarding the amounts and disclosures in the financial statements. Our audits also included evaluating the accounting principles used and significant estimates made by management, as well as evaluating the overall
69
presentation of the financial statements. Our procedures included confirmation of securities owned as of September 30, 2019 by correspondence with the transfer agent. We believe that our audits provide a reasonable basis for our opinions.
/s/ PricewaterhouseCoopers LLP
Philadelphia, Pennsylvania
November 13, 2019
We have served as the auditor of one or more investment companies in The Vanguard Group of Funds since 1975.
Special 2019 tax information (unaudited) for Vanguard Target Retirement Funds
This information for the fiscal year ended September 30, 2019, is included pursuant to provisions of the Internal Revenue Code.
The funds distributed capital gain dividends (from net long-term capital gains) to shareholders during the fiscal year as follows:
Fund | | ($000) |
Target Retirement 2040 Fund | | 586 |
Target Retirement 2045 Fund | | 382 |
Target Retirement 2050 Fund | | 446 |
Target Retirement 2055 Fund | | — |
Target Retirement 2060 Fund | | 22 |
Target Retirement 2065 Fund | | 4 |
70
For nonresident alien shareholders, 100% of short-term capital gain dividends distributed by the funds are qualified short-term capital gains.
The funds distributed qualified dividend income to shareholders during the fiscal year as follows:
Fund | | ($000) |
Target Retirement 2040 Fund | | 396,553 |
Target Retirement 2045 Fund | | 385,571 |
Target Retirement 2050 Fund | | 272,412 |
Target Retirement 2055 Fund | | 128,814 |
Target Retirement 2060 Fund | | 51,541 |
Target Retirement 2065 Fund | | 3,027 |
For corporate shareholders, the percentage of investment income (dividend income plus short-term gains, if any) that qualifies for the dividends-received deduction is as follows:
Fund | | Percentage |
Target Retirement 2040 Fund | | 33.5% |
Target Retirement 2045 Fund | | 36.1 |
Target Retirement 2050 Fund | | 36.1 |
Target Retirement 2055 Fund | | 36.1 |
Target Retirement 2060 Fund | | 36.2 |
Target Retirement 2065 Fund | | 36.2 |
The funds designate to shareholders foreign source income and foreign taxes paid as follows:
| | Foreign Source Income | | Foreign Taxes Paid |
Fund | | ($000) | | ($000) |
Target Retirement 2040 Fund | | 326,687 | | 21,772 |
Target Retirement 2045 Fund | | 307,318 | | 21,343 |
Target Retirement 2050 Fund | | 219,202 | | 15,254 |
Target Retirement 2055 Fund | | 110,662 | | 7,717 |
Target Retirement 2060 Fund | | 46,073 | | 3,214 |
Target Retirement 2065 Fund | | 3,878 | | 273 |
Shareholders will receive more detailed information with their Form 1099-DIV in January 2020 to determine the calendar-year amounts to be included on their 2019 tax returns.
71
BLOOMBERG is a trademark and service mark of Bloomberg Finance L.P. BARCLAYS is a trademark and service mark of Barclays Bank Plc, used under license. Bloomberg Finance L.P. and its affiliates, including Bloomberg Index Services Limited (BISL) (collectively, Bloomberg), or Bloomberg’s licensors, own all proprietary rights in the Bloomberg Barclays U.S. Aggregate Bond Index, Bloomberg Barclays U.S. Aggregate Float Adjusted Index, and the Bloomberg Barclays Global Aggregate ex-USD Float Adjusted RIC Capped Index (USD Hedged) (the Indices or Bloomberg Barclays Indices).
Neither Barclays Bank Plc, Barclays Capital Inc., or any affiliate (collectively Barclays) or Bloomberg is the issuer or producer of the Target Retirement Funds (including the Total Bond Market II Index Fund and the Total International Bond Index Fund) and neither Bloomberg nor Barclays has any responsibilities, obligations or duties to investors in the Target Retirement Funds. The Indices are licensed for use by The Vanguard Group, Inc. (Vanguard) as the sponsor of the Target Retirement Funds. Bloomberg and Barclays’ only relationship with Vanguard in respect to the Indices is the licensing of the Indices, which is determined, composed and calculated by BISL, or any successor thereto, without regard to the Issuer or the Target Retirement Funds or the owners of the Target Retirement Funds.
Additionally, Vanguard may for itself execute transaction(s) with Barclays in or relating to the Indices in connection with the Target Retirement Funds. Investors acquire the Target Retirement Funds from Vanguard and investors neither acquire any interest in the Indices nor enter into any relationship of any kind whatsoever with Bloomberg or Barclays upon making an investment in the Target Retirement Funds. The Target Retirement Funds are not sponsored, endorsed, sold or promoted by Bloomberg or Barclays. Neither Bloomberg nor Barclays makes any representation or warranty, express or implied regarding the advisability of investing in the Target Retirement Funds or the advisability of investing in securities generally or the ability of the Indices to track corresponding or relative market performance. Neither Bloomberg nor Barclays has passed on the legality or suitability of the Target Retirement Funds with respect to any person or entity. Neither Bloomberg nor Barclays is responsible for and has not participated in the determination of the timing of, prices at, or quantities of the Target Retirement Funds to be issued. Neither Bloomberg nor Barclays has any obligation to take the needs of the Issuer or the owners of the Target Retirement Funds or any other third party into consideration in determining, composing or calculating the Indices. Neither Bloomberg nor Barclays has any obligation or liability in connection with administration, marketing or trading of the Target Retirement Funds.
The licensing agreement between Bloomberg and Barclays is solely for the benefit of Bloomberg and Barclays and not for the benefit of the owners of the Target Retirement Funds, investors or other third parties. In addition, the licensing agreement between Vanguard and Bloomberg is solely for the benefit of Vanguard and Bloomberg and not for the benefit of the owners of the Target Retirement Funds, investors or other third parties.
72
NEITHER BLOOMBERG NOR BARCLAYS SHALL HAVE ANY LIABILITY TO THE ISSUER, INVESTORS OR TO OTHER THIRD PARTIES FOR THE QUALITY, ACCURACY AND/OR COMPLETENESS OF THE BLOOMBERG BARCLAYS INDICES OR ANY DATA INCLUDED THEREIN OR FOR INTERRUPTIONS IN THE DELIVERY OF THE BLOOMBERG BARCLAYS INDICES. NEITHER BLOOMBERG NOR BARCLAYS MAKES ANY WARRANTY, EXPRESS OR IMPLIED, AS TO RESULTS TO BE OBTAINED BY THE ISSUER, THE INVESTORS OR ANY OTHER PERSON OR ENTITY FROM THE USE OF THE BLOOMBERG BARCLAYS INDICES OR ANY DATA INCLUDED THEREIN. NEITHER BLOOMBERG NOR BARCLAYS MAKES ANY EXPRESS OR IMPLIED WARRANTIES, AND EACH HEREBY EXPRESSLY DISCLAIMS ALL WARRANTIES OF MERCHANTABILITY OR FITNESS FOR A PARTICULAR PURPOSE OR USE WITH RESPECT TO BLOOMBERG BARCLAYS INDICES OR ANY DATA INCLUDED THEREIN. BLOOMBERG RESERVES THE RIGHT TO CHANGE THE METHODS OF CALCULATION OR PUBLICATION, OR TO CEASE THE CALCULATION OR PUBLICATION OF THE BLOOMBERG BARCLAYS INDICES, AND NEITHER BLOOMBERG NOR BARCLAYS SHALL BE LIABLE FOR ANY MISCALCULATION OF OR ANY INCORRECT, DELAYED OR INTERRUPTED PUBLICATION WITH RESPECT TO ANY OF THE BLOOMBERG BARCLAYS INDICES. NEITHER BLOOMBERG NOR BARCLAYS SHALL BE LIABLE FOR ANY DAMAGES, INCLUDING, WITHOUT LIMITATION, ANY SPECIAL, INDIRECT OR CONSEQUENTIAL DAMAGES, OR ANY LOST PROFITS AND EVEN IF ADVISED OF THE POSSIBILITY OF SUCH, RESULTING FROM THE USE OF BLOOMBERG BARCLAYS INDICES OR ANY DATA INCLUDED THEREIN OR WITH RESPECT TO THE TARGET RETIREMENT FUNDS.
None of the information supplied by Bloomberg or Barclays and used in this publication may be reproduced in any manner without the prior written permission of both Bloomberg and Barclays Capital, the investment banking division of Barclays Bank Plc. Barclays Bank Plc is registered in England No. 1026167. Registered office 1 Churchill Place London E14 5HP.
© 2019 Bloomberg. Used with Permission.
Source: Bloomberg Index Services Limited. Copyright 2019, Bloomberg. All rights reserved.
73
This page intentionally left blank.
The People Who Govern Your Fund
The trustees of your mutual fund are there to see that the fund is operated and managed in your best interests since, as a shareholder, you are a part owner of the fund. Your fund’s trustees also serve on the board of directors of The Vanguard Group, Inc., which is owned by the Vanguard funds and provides services to them.
A majority of Vanguard’s board members are independent, meaning that they have no affiliation with Vanguard or the funds they oversee, apart from the sizable personal investments they have made as private individuals. The independent board members have distinguished backgrounds in business, academia, and public service. Each of the trustees and executive officers oversees 212 Vanguard funds.
Information for each trustee and executive officer of the fund appears below. That information, as well as the Vanguard fund count, is as of the date on the cover of this fund report. The mailing address of the trustees and officers is P.O. Box 876, Valley Forge, PA 19482. More information about the trustees is in the Statement of Additional Information, which can be obtained, without charge, by contacting Vanguard at 800-662-7447, or online at vanguard.com.
Interested Trustee1
Mortimer J. Buckley
Born in 1969. Trustee since January 2018. Principal occupation(s) during the past five years and other experience: chairman of the board (January 2019–present) of Vanguard and of each of the investment companies served by Vanguard; chief executive officer (January 2018–present) of Vanguard; chief executive officer, president, and trustee (January 2018–present) of each of the investment companies served by Vanguard; president and director (2017–present) of Vanguard; and president (February 2018–present) of Vanguard Marketing Corporation. Chief investment officer (2013–2017), managing director (2002–2017), head of the Retail Investor Group (2006–2012), and chief information officer (2001–2006) of Vanguard. Chairman of the board (2011–2017) and trustee (2009–2017) of the Children’s Hospital of Philadelphia; trustee (2018–present) of The Shipley School.
Independent Trustees
Emerson U. Fullwood
Born in 1948. Trustee since January 2008. Principal occupation(s) during the past five years and other experience: executive chief staff and marketing officer for North America and corporate vice president (retired 2008) of Xerox Corporation (document management products and services). Former president of the Worldwide Channels Group, Latin America, and Worldwide Customer Service and executive chief staff officer of Developing Markets of Xerox. Executive in residence and 2009–2010 Distinguished Minett Professor at the Rochester Institute of Technology. Director of SPX FLOW, Inc. (multi-industry manufacturing). Director of the University of Rochester Medical Center, the Monroe Community College Foundation, the United Way of Rochester, North Carolina A&T University, and Roberts Wesleyan College. Trustee of the University of Rochester.
Amy Gutmann
Born in 1949. Trustee since June 2006. Principal occupation(s) during the past five years and other experience: president (2004–present) of the University of Pennsylvania. Christopher H. Browne Distinguished Professor of Political Science, School of Arts and Sciences, and professor of communication, Annenberg School for Communication, with secondary faculty appointments in the Department of Philosophy, School of Arts and Sciences, and at the Graduate School of Education, University of Pennsylvania. Trustee of the National Constitution Center.
F. Joseph Loughrey
Born in 1949. Trustee since October 2009. Principal occupation(s) during the past five years and other experience: president and chief operating officer (retired 2009) and vice chairman of the board (2008–2009) of Cummins Inc. (industrial machinery). Chairman of the board of Hillenbrand, Inc. (specialized consumer services), and the Lumina Foundation.
1 Mr. Buckley is considered an “interested person,” as defined in the Investment Company Act of 1940, because he is an officer of the Vanguard funds.
Director of the V Foundation and Oxfam America. Member of the advisory council for the College of Arts and Letters and chair of the advisory board to the Kellogg Institute for International Studies, both at the University of Notre Dame.
Mark Loughridge
Born in 1953. Trustee since March 2012. Principal occupation(s) during the past five years and other experience: senior vice president and chief financial officer (retired 2013) of IBM (information technology services). Fiduciary member of IBM’s Retirement Plan Committee (2004–2013), senior vice president and general manager (2002–2004) of IBM Global Financing, vice president and controller (1998–2002) of IBM, and a variety of other prior management roles at IBM. Member of the Council on Chicago Booth.
Scott C. Malpass
Born in 1962. Trustee since March 2012. Principal occupation(s) during the past five years and other experience: chief investment officer (1989–present) and vice president (1996–present) of the University of Notre Dame. Assistant professor of finance at the Mendoza College of Business, University of Notre Dame, and member of the Notre Dame 403(b) Investment Committee. Chairman of the board of TIFF Advisory Services, Inc. Member of the board of Catholic Investment Services, Inc. (investment advisors) and the board of superintendence of the Institute for the Works of Religion.
Deanna Mulligan
Born in 1963. Trustee since January 2018. Principal occupation(s) during the past five years and other experience: president (2010–present) and chief executive officer (2011–present) of The Guardian Life Insurance Company of America. Chief operating officer (2010–2011) and executive vice president (2008–2010) of Individual Life and Disability of The Guardian Life Insurance Company of America. Member of the board of The Guardian Life Insurance Company of America, the American Council of Life Insurers, the Partnership for New York City (business leadership), and the Committee Encouraging Corporate Philanthropy. Trustee of the Economic Club of New York and the Bruce Museum (arts and science). Member of the Advisory Council for the Stanford Graduate School of Business.
André F. Perold
Born in 1952. Trustee since December 2004. Principal occupation(s) during the past five years and other experience: George Gund Professor of Finance and Banking, Emeritus at the Harvard Business School (retired 2011). Chief investment officer and co-managing partner of HighVista Strategies LLC (private investment firm). Board of advisors and investment committee member of the Museum of Fine Arts Boston. Board member (2018–present) of RIT Capital Partners (investment firm); investment committee member of Partners Health Care System.
Sarah Bloom Raskin
Born in 1961. Trustee since January 2018. Principal occupation(s) during the past five years and other experience: deputy secretary (2014–2017) of the United States Department of the Treasury. Governor (2010–2014) of the Federal Reserve Board. Commissioner (2007–2010) of financial regulation for the State of Maryland. Member of the board of directors (2012–2014) of Neighborhood Reinvestment Corporation. Director (2017–present) of i(x) Investments, LLC; director (2017–present) of Reserve Trust. Rubinstein Fellow (2017–present) of Duke University; trustee (2017–present) of Amherst College.
Peter F. Volanakis
Born in 1955. Trustee since July 2009. Principal occupation(s) during the past five years and other experience: president and chief operating officer (retired 2010) of Corning Incorporated (communications equipment) and director of Corning Incorporated (2000–2010) and Dow Corning (2001–2010). Director (2012) of SPX Corporation (multi-industry manufacturing). Overseer of the Amos Tuck School of Business Administration, Dartmouth College (2001–2013). Chairman of the board of trustees of Colby-Sawyer College. Member of the board of Hypertherm Inc. (industrial cutting systems, software, and consumables).
Executive Officers
Glenn Booraem
Born in 1967. Principal occupation(s) during the past five years and other experience: principal of Vanguard. Investment stewardship officer (2017–present), treasurer (2015–2017), controller (2010–2015), and assistant controller (2001–2010) of each of the investment companies served by Vanguard.
Christine M. Buchanan
Born in 1970. Principal occupation(s) during the past five years and other experience: principal of Vanguard and global head of Fund Administration at Vanguard. Treasurer (2017–present) of each of the investment companies served by Vanguard. Partner (2005–2017) at KPMG LLP (audit, tax, and advisory services).
Thomas J. Higgins
Born in 1957. Principal occupation(s) during the past five years and other experience: principal of Vanguard. Chief financial officer (2008–present) and treasurer (1998–2008) of each of the investment companies served by Vanguard.
Peter Mahoney
Born in 1974. Principal occupation(s) during the past five years and other experience: principal of Vanguard. Controller (2015–present) of each of the investment companies served by Vanguard. Head of International Fund Services (2008–2014) at Vanguard.
Anne E. Robinson
Born in 1970. Principal occupation(s) during the past five years and other experience: general counsel (2016–present) of Vanguard. Secretary (2016–present) of Vanguard and of each of the investment companies served by Vanguard. Managing director (2016–present) of Vanguard. Director and senior vice president (2016–2018) of Vanguard Marketing Corporation. Managing director and general counsel of Global Cards and Consumer Services (2014–2016) at Citigroup. Counsel (2003–2014) at American Express.
Michael Rollings
Born in 1963. Principal occupation(s) during the past five years and other experience: finance director (2017–present) and treasurer (2017) of each of the investment companies served by Vanguard. Managing director (2016–present) of Vanguard. Chief financial officer (2016–present) of Vanguard. Director (2016–present) of Vanguard Marketing Corporation. Executive vice president and chief financial officer (2006–2016) of MassMutual Financial Group.
John E. Schadl
Born in 1972. Principal occupation(s) during the past five years and other experience: principal of Vanguard. Chief compliance officer (2019–present) of Vanguard and of each of the investment companies served by Vanguard. Assistant vice president (May 2019–present) of Vanguard Marketing Corporation.
Vanguard Senior Management Team
Joseph Brennan | Chris D. McIsaac |
Mortimer J. Buckley | James M. Norris |
Gregory Davis | Thomas M. Rampulla |
John James | Karin A. Risi |
Martha G. King | Anne E. Robinson |
John T. Marcante | Michael Rollings |

| P.O. Box 2600 |
| Valley Forge, PA 19482-2600 |
Connect with Vanguard® > vanguard.com
Fund Information > 800-662-7447
Direct Investor Account Services > 800-662-2739
Institutional Investor Services > 800-523-1036
Text Telephone for People
Who Are Deaf or Hard of Hearing > 800-749-7273
This material may be used in conjunction with the offering of shares of any Vanguard fund only if preceded or accompanied by the fund’s current prospectus.
All comparative mutual fund data are from Morningstar, Inc., unless otherwise noted.
You can obtain a free copy of Vanguard’s proxy voting guidelines by visiting vanguard.com/proxyreporting or by calling Vanguard at 800-662-2739. The guidelines are also available from the SEC’s website, www.sec.gov. In addition, you may obtain a free report on how your fund voted the proxies for securities it owned during the 12 months ended June 30. To get the report, visit either vanguard.com/proxyreporting or www.sec.gov.
You can review information about your fund on the SEC’s website, and you can receive copies of this information, for a fee, by sending a request via email addressed to publicinfo@sec.gov.
© 2019 The Vanguard Group, Inc.
All rights reserved.
Vanguard Marketing Corporation, Distributor.
Q3080B 112019

Annual Report | September 30, 2019 Vanguard Institutional Target Retirement Funds |
Vanguard Institutional Target Retirement Income Fund Vanguard Institutional Target Retirement 2015 Fund Vanguard Institutional Target Retirement 2020 Fund Vanguard Institutional Target Retirement 2025 Fund Vanguard Institutional Target Retirement 2030 Fund Vanguard Institutional Target Retirement 2035 Fund See the inside front cover for important information about access to your fund’s annual and semiannual shareholder reports. |
Important information about access to shareholder reports
Beginning on January 1, 2021, as permitted by regulations adopted by the Securities and Exchange Commission, paper copies of your fund’s annual and semiannual shareholder reports will no longer be sent to you by mail, unless you specifically request them. Instead, you will be notified by mail each time a report is posted on the website and will be provided with a link to access the report.
If you have already elected to receive shareholder reports electronically, you will not be affected by this change and do not need to take any action. You may elect to receive shareholder reports and other communications from the fund electronically by contacting your financial intermediary (such as a broker-dealer or bank) or, if you invest directly with the fund, by calling Vanguard at one of the phone numbers on the back cover of this report or by logging on to vanguard.com.
You may elect to receive paper copies of all future shareholder reports free of charge. If you invest through a financial intermediary, you can contact the intermediary to request that you continue to receive paper copies. If you invest directly with the fund, you can call Vanguard at one of the phone numbers on the back cover of this report or log on to vanguard.com. Your election to receive paper copies will apply to all the funds you hold through an intermediary or directly with Vanguard.
Contents | | |
| | |
A Note From Our Chairman | | 1 |
| | |
Your Fund’s Performance at a Glance | | 2 |
| | |
About Your Fund’s Expenses | | 3 |
| | |
Institutional Target Retirement Income Fund | | 5 |
| | |
Institutional Target Retirement 2015 Fund | | 16 |
| | |
Institutional Target Retirement 2020 Fund | | 27 |
| | |
Institutional Target Retirement 2025 Fund | | 38 |
| | |
Institutional Target Retirement 2030 Fund | | 49 |
| | |
Institutional Target Retirement 2035 Fund | | 60 |
Please note: The opinions expressed in this report are just that—informed opinions. They should not be considered promises or advice. Also, please keep in mind that the information and opinions cover the period through the date on the front of this report. Of course, the risks of investing in your fund are spelled out in the prospectus.
A Note From Our Chairman

Tim Buckley
Chairman and Chief Executive Officer
Dear Shareholder,
Recent volatility in financial markets—affecting stocks, bonds, and commodities—has been a good reminder of the wise old adage, “Never keep all your eggs in one basket.” Maintaining balance and diversification in your investment portfolio can help to both limit risk and set you up for long-term success.
It’s understandable why some investors might become complacent after a long market run-up like the one that lifted stock prices, especially U.S. stock prices, in the years following the global financial crisis. But failing to rebalance regularly can leave a portfolio with a much different mix of assets than intended and, often, more risk than intended.
Balance across and diversification within asset classes are powerful tools for managing risk and achieving your investment goals. A portfolio’s allocation will determine a large portion of its long-term return and also the majority of its volatility risk. A well-diversified portfolio is less vulnerable to significant swings in the performance of any one segment of the asset classes in which it invests.
Balance and diversification will never eliminate the risk of loss, nor will they guarantee positive returns in a declining market. But they should reduce the chance that you’ll suffer disproportionate losses in one particular high-flying asset class or sector when it comes back to earth. And exposure to all key market components should give you at least some participation in the sectors that are performing best at any given time.
Vanguard is committed to helping you achieve balance and diversification in your portfolios to help meet your investment goals. We thank you for your continued loyalty.
Sincerely,

Mortimer J. Buckley
Chairman and Chief Executive Officer
October 14, 2019
1
Your Fund’s Performance at a Glance
· For the 12 months ended September 30, 2019, the six Vanguard Institutional Target Retirement Funds covered in this report recorded returns ranging from 3.45% for the Institutional Target Retirement 2035 Fund to 6.73% for the Institutional Target Retirement Income Fund. (The funds with target dates of 2040 through 2065 are covered in a separate report.) The funds with a greater allocation to bonds performed best.
· Each fund performed in line with its composite benchmark after expenses. The Institutional Target Retirement Funds invest all of their assets in Vanguard index funds that seek to match the performance of broad stock and bond market indexes.
· Worries about the pace of global economic growth and plans by numerous central banks to loosen monetary policies encouraged investment in bonds, sending their yields lower and their prices markedly higher. Broad measures of both the U.S. and non-U.S. investment-grade bond markets returned about 10% during the funds’ fiscal year. Stocks, in contrast, cooled. The broad U.S. stock market gained about 3%, while international stocks returned roughly –1% in U.S. dollars.
· Vanguard Institutional Target Retirement Funds are designed to reach an allocation of 70% bonds and 30% stocks within seven years after their target dates.
· From their inception dates through September 30, the funds had average annual returns that ranged from 4.77% for the Institutional Target Retirement Income Fund to 6.64% for the Institutional Target Retirement 2035 Fund.
Market Barometer
| | Average Annual Total Returns | |
| | Periods Ended September 30, 2019 | |
| | One Year | | Three Years | | Five Years | |
Stocks | | | | | | | |
Russell 1000 Index (Large-caps) | | 3.87% | | 13.19% | | 10.62% | |
Russell 2000 Index (Small-caps) | | -8.89 | | 8.23 | | 8.19 | |
Russell 3000 Index (Broad U.S. market) | | 2.92 | | 12.83 | | 10.44 | |
FTSE All-World ex US Index (International) | | -1.12 | | 6.46 | | 3.24 | |
| | | | | | | |
Bonds | | | | | | | |
Bloomberg Barclays U.S. Aggregate Bond Index (Broad taxable market) | | 10.30% | | 2.92% | | 3.38% | |
Bloomberg Barclays Municipal Bond Index (Broad tax-exempt market) | | 8.55 | | 3.19 | | 3.66 | |
FTSE Three-Month U.S. Treasury Bill Index | | 2.36 | | 1.52 | | 0.95 | |
| | | | | | | |
CPI | | | | | | | |
Consumer Price Index | | 1.71% | | 2.07% | | 1.53% | |
2
About Your Fund’s Expenses
As a shareholder of the fund, you incur ongoing costs, which include costs for portfolio management, administrative services, and shareholder reports (like this one), among others. Operating expenses, which are deducted from a fund’s gross income, directly reduce the investment return of the fund.
A typical fund’s expenses are expressed as a percentage of its average net assets. The Institutional Target Retirement Funds have no direct expenses, but each fund bears its proportionate share of the costs for the underlying funds in which it invests. These indirect expenses make up the acquired fund fees and expenses, also expressed as a percentage of average net assets.
The following examples are intended to help you understand the ongoing cost (in dollars) of investing in your fund and to compare these costs with those of other mutual funds. The examples are based on an investment of $1,000 made at the beginning of the period shown and held for the entire period. The costs were calculated using the acquired fund fees and expenses for each Institutional Target Retirement Fund.
The accompanying table illustrates your fund’s costs in two ways:
· Based on actual fund return. This section helps you to estimate the actual expenses that you paid over the period. The “Ending Account Value” shown is derived from the fund’s actual return, and the third column shows the dollar amount that would have been paid by an investor who started with $1,000 in the fund. You may use the information here, together with the amount you invested, to estimate the expenses that you paid over the period.
To do so, simply divide your account value by $1,000 (for example, an $8,600 account value divided by $1,000 = 8.6), then multiply the result by the number given for your fund under the heading “Expenses Paid During Period.”
· Based on hypothetical 5% yearly return. This section is intended to help you compare your fund’s costs with those of other mutual funds. It assumes that the fund had a yearly return of 5% before expenses, but that the expense ratio is unchanged. In this case—because the return used is not the fund’s actual return—the results do not apply to your investment. The example is useful in making comparisons because the Securities and Exchange Commission requires all mutual funds to calculate expenses based on a 5% return. You can assess your fund’s costs by comparing this hypothetical example with the hypothetical examples that appear in shareholder reports of other funds.
Note that the expenses shown in the table are meant to highlight and help you compare ongoing costs only and do not reflect transaction costs incurred by the fund for buying and selling securities. Further, the expenses do not include any purchase, redemption, or account service fees described in the fund prospectus. If such fees were applied to your account, your costs would be higher. Your fund does not carry a “sales load.”
The calculations assume no shares were bought or sold during the period. Your actual costs may have been higher or lower, depending on the amount of your investment and the timing of any purchases or redemptions.
You can find more information about the fund’s expenses, including annual expense ratios, in the Financial Statements section of this report. For additional information on operating expenses and other shareholder costs, please refer to your fund’s current prospectus.
3
Six Months Ended September 30, 2019
| | Beginning | | Ending | | Expenses |
| | Account Value | | Account Value | | Paid During |
| | 3/31/2019 | | 9/30/2019 | | Period |
Based on Actual Fund Return | | | | | | |
Institutional Target Retirement Income Fund | | $1,000.00 | | $1,044.43 | | $0.46 |
Institutional Target Retirement 2015 Fund | | $1,000.00 | | $1,044.59 | | $0.46 |
Institutional Target Retirement 2020 Fund | | $1,000.00 | | $1,044.53 | | $0.46 |
Institutional Target Retirement 2025 Fund | | $1,000.00 | | $1,045.16 | | $0.46 |
Institutional Target Retirement 2030 Fund | | $1,000.00 | | $1,042.97 | | $0.46 |
Institutional Target Retirement 2035 Fund | | $1,000.00 | | $1,041.72 | | $0.46 |
Based on Hypothetical 5% Yearly Return | | | | | | |
Institutional Target Retirement Income Fund | | $1,000.00 | | $1,024.62 | | $0.46 |
Institutional Target Retirement 2015 Fund | | $1,000.00 | | $1,024.62 | | $0.46 |
Institutional Target Retirement 2020 Fund | | $1,000.00 | | $1,024.62 | | $0.46 |
Institutional Target Retirement 2025 Fund | | $1,000.00 | | $1,024.62 | | $0.46 |
Institutional Target Retirement 2030 Fund | | $1,000.00 | | $1,024.62 | | $0.46 |
Institutional Target Retirement 2035 Fund | | $1,000.00 | | $1,024.62 | | $0.46 |
The calculations are based on the acquired fund fees and expenses for the most recent six-month period. The funds’ annualized expense figures for that period are (in order as listed from top to bottom above) 0.09%, 0.09%, 0.09%, 0.09%, 0.09%, and 0.09%. The dollar amounts shown as “Expenses Paid” are equal to the annualized expense figures for the underlying funds multiplied by the average account value over the period, multiplied by the number of days in the most recent six-month period, then divided by the number of days in the most recent 12-month period (183/365).
4
Institutional Target Retirement Income Fund
Performance Summary
All of the returns in this report represent past performance, which is not a guarantee of future results that may be achieved by the fund. (Current performance may be lower or higher than the performance data cited. For performance data current to the most recent month-end, visit our website at vanguard.com/performance.) Note, too, that both investment returns and principal value can fluctuate widely, so an investor’s shares, when sold, could be worth more or less than their original cost. The returns shown do not reflect taxes that a shareholder would pay on fund distributions or on the sale of fund shares.
Cumulative Performance: June 26, 2015, Through September 30, 2019
Initial Investment of $100,000,000

| | | | Average Annual Total Returns | | |
| | | | Periods Ended September 30, 2019 | | |
| | | | | | Since | | Final Value |
| | | | One | | Inception | | of a $100,000,000 |
| | | | Year | | (6/26/2015) | | Investment |

| | Institutional Target Retirement Income Fund | | 6.73% | | 4.77% | | $121,982,132 |

| | Target Income Composite Index | | 6.83 | | 4.90 | | 122,598,767 |

| | Bloomberg Barclays U.S. Aggregate Bond Index | | 10.30 | | 3.72 | | 116,834,880 |
Target Income Composite Index: Derived by applying the fund’s target asset allocation to the results of the following benchmarks: for international stocks of developed markets, the MSCI EAFE Index through December 15, 2010, the MSCI ACWI ex USA IMI Index through June 2, 2013, and the FTSE Global All Cap ex US Index thereafter; for emerging-market stocks, the Select Emerging Markets Index through August 23, 2006, the MSCI Emerging Markets Index through December 15, 2010, the MSCI ACWI ex USA IMI Index through June 2, 2013, and the FTSE Global All Cap ex US Index thereafter; for U.S. bonds, the Bloomberg Barclays U.S. Aggregate Bond Index through December 31, 2009, and the Bloomberg Barclays U.S. Aggregate Float Adjusted Index thereafter, as well as the Bloomberg Barclays U.S. Treasury Inflation-Protected Securities Index through June 2, 2013, and the Bloomberg Barclays U.S. Treasury Inflation-Protected Securities (TIPS) 0–5 Year Index thereafter; for short-term reserves, the Citigroup Three-Month Treasury Bill Index through June 2, 2013; for international bonds, the Bloomberg Barclays Global Aggregate ex-USD Float Adjusted RIC Capped Index Hedged beginning June 3, 2013; and for U.S. stocks, the Dow Jones U.S. Total Stock Market Index (formerly known as the Dow Jones Wilshire 5000 Index) through April 22, 2005, the MSCI US Broad Market Index through June 2, 2013, and the CRSP US Total Market Index thereafter. International stock benchmark returns are adjusted for withholding taxes.
“Since Inception” performance is calculated from the fund’s inception date for both the fund and its comparative standards.
See Financial Highlights for dividend and capital gains information.
5
Institutional Target Retirement Income Fund
Underlying Vanguard Funds
As of September 30, 2019
Vanguard Total Bond Market II Index Fund Investor Shares | | 37.3% |
Vanguard Total Stock Market Index Fund Institutional Shares | | 18.0 |
Vanguard Short-Term Inflation-Protected Securities Index Fund Admiral Shares | | 16.7 |
Vanguard Total International Bond Index Fund Admiral Shares | | 16.0 |
Vanguard Total International Stock Index Fund Investor Shares | | 12.0 |
6
Institutional Target Retirement Income Fund
Financial Statements
Statement of Net Assets
As of September 30, 2019
The fund files its complete schedule of portfolio holdings with the Securities and Exchange Commission (SEC) for the first and third quarters of each fiscal year as an exhibit to its reports on Form N-PORT. The fund’s Form N-PORT reports are available on the SEC’s website at www.sec.gov.
| | | | | Market |
| | | | | Value· |
| | | Shares | | ($000) |
Investment Companies (100.0%) | | | | |
U.S. Stock Fund (18.0%) | | | | |
| Vanguard Total Stock Market Index Fund Institutional Shares | | 15,575,727 | | 1,144,972 |
| | | | | |
International Stock Fund (12.0%) | | | | |
| Vanguard Total International Stock Index Fund Investor Shares | | 45,895,918 | | 760,495 |
| | | | | |
U.S. Bond Funds (54.0%) | | | | |
1 | Vanguard Total Bond Market II Index Fund Investor Shares | | 213,582,706 | | 2,366,497 |
| Vanguard Short-Term Inflation-Protected Securities Index Fund Admiral Shares | | 43,070,705 | | 1,059,539 |
| | | | | 3,426,036 |
| | | | |
International Bond Fund (16.0%) | | | | |
| Vanguard Total International Bond Index Fund Admiral Shares | | 43,062,015 | | 1,011,957 |
Total Investment Companies (Cost $5,787,911) | | | | 6,343,460 |
Temporary Cash Investment (0.1%) | | | | |
Money Market Fund (0.1%) | | | | |
1 | Vanguard Market Liquidity Fund, 2.098% (Cost $3,648) | | 36,478 | | 3,648 |
Total Investments (100.1%) (Cost $5,791,559) | | | | 6,347,108 |
Other Assets and Liabilities (-0.1%) | | | | |
Other Assets | | | | 24,873 |
Liabilities | | | | (30,103) |
| | | | | (5,230) |
Net Assets (100%) | | | | |
Applicable to 284,709,292 outstanding $.001 par value shares of beneficial interest (unlimited authorization) | | | | 6,341,878 |
Net Asset Value Per Share | | | | $22.27 |
7
Institutional Target Retirement Income Fund
| | | | Amount |
| | | | ($000) |
Statement of Assets and Liabilities | | | | |
Assets | | | | |
Investments in Securities, at Value—Affiliated Funds | | | | 6,347,108 |
Receivables for Investment Securities Sold | | | | 16,762 |
Receivables for Accrued Income | | | | 5,926 |
Receivables for Capital Shares Issued | | | | 2,185 |
Total Assets | | | | 6,371,981 |
Liabilities | | | | |
Payables for Investment Securities Purchased | | | | 5,926 |
Payables for Capital Shares Redeemed | | | | 23,955 |
Payables for Distributions | | | | 222 |
Total Liabilities | | | | 30,103 |
Net Assets | | | | 6,341,878 |
| | | | |
| | | | |
At September 30, 2019, net assets consisted of: | | | | |
| | | | Amount |
| | | | ($000) |
Paid-in Capital | | | | 5,783,117 |
Total Distributable Earnings (Loss) | | | | 558,761 |
Net Assets | | | | 6,341,878 |
· See Note A in Notes to Financial Statements.
1 Affiliated fund available only to Vanguard funds and certain trusts and accounts managed by Vanguard. Rate shown for Vanguard Market Liquidity Fund is the 7-day yield.
See accompanying Notes, which are an integral part of the Financial Statements.
8
Institutional Target Retirement Income Fund
Statement of Operations
| | Year Ended |
| | September 30, 2019 |
| | ($000) |
Investment Income | | |
Income | | |
Income Distributions Received from Affiliated Funds | | 152,437 |
Net Investment Income—Note B | | 152,437 |
Realized Net Gain (Loss) | | |
Capital Gain Distributions Received from Affiliated Funds | | — |
Affiliated Funds Sold | | 3,112 |
Realized Net Gain (Loss) | | 3,112 |
Change in Unrealized Appreciation (Depreciation) from Affiliated Funds | | 247,509 |
Net Increase (Decrease) in Net Assets Resulting from Operations | | 403,058 |
See accompanying Notes, which are an integral part of the Financial Statements.
9
Institutional Target Retirement Income Fund
Statement of Changes in Net Assets
| | Year Ended September 30, | |
| | 2019 | | 2018 | |
| | ($000 | ) | ($000 | ) |
Increase (Decrease) in Net Assets | | | | | |
Operations | | | | | |
Net Investment Income | | 152,437 | | 136,244 | |
Realized Net Gain (Loss) | | 3,112 | | 8,114 | |
Change in Unrealized Appreciation (Depreciation) | | 247,509 | | 27,989 | |
Net Increase (Decrease) in Net Assets Resulting from Operations | | 403,058 | | 172,347 | |
Distributions | | | | | |
Net Investment Income | | (156,199 | ) | (132,299 | ) |
Realized Capital Gain1 | | (6,059 | ) | (931 | ) |
Total Distributions | | (162,258 | ) | (133,230 | ) |
Capital Share Transactions | | | | | |
Issued | | 1,303,756 | | 1,660,589 | |
Issued in Lieu of Cash Distributions | | 161,167 | | 132,093 | |
Redeemed | | (1,024,418 | ) | (1,210,217 | ) |
Net Increase (Decrease) from Capital Share Transactions | | 440,505 | | 582,465 | |
Total Increase (Decrease) | | 681,305 | | 621,582 | |
Net Assets | | | | | |
Beginning of Period | | 5,660,573 | | 5,038,991 | |
End of Period | | 6,341,878 | | 5,660,573 | |
1 Includes fiscal 2019 and 2018 short-term gain distributions totaling $4,431,000 and $539,000, respectively. Short-term gain distributions are treated as ordinary income dividends for tax purposes.
See accompanying Notes, which are an integral part of the Financial Statements.
10
Institutional Target Retirement Income Fund
Financial Highlights
| | | | | | | | | | June 26, | |
| | | | | | | | | | 20151 to | |
For a Share Outstanding | | | | Year Ended September 30, | | | Sept. 30, | |
Throughout Each Period | | 2019 | | 2018 | | 2017 | | 2016 | | 2015 | |
Net Asset Value, Beginning of Period | | $21.45 | | $21.27 | | $20.60 | | $19.46 | | $20.00 | |
Investment Operations | | | | | | | | | | | |
Net Investment Income | | .552 | 2 | .537 | 2 | .404 | 2 | .341 | | .111 | 2 |
Capital Gain Distributions Received | | — | | .002 | 2 | .006 | 2 | .010 | | — | |
Net Realized and Unrealized Gain (Loss) on Investments | | .860 | | .167 | | .667 | | 1.127 | | (.599 | ) |
Total from Investment Operations | | 1.412 | | .706 | | 1.077 | | 1.478 | | (.488 | ) |
Distributions | | | | | | | | | | | |
Dividends from Net Investment Income | | (.569 | ) | (.522 | ) | (.398 | ) | (.337 | ) | (.052 | ) |
Distributions from Realized Capital Gains | | (.023 | ) | (.004 | ) | (.009 | ) | (.001 | ) | — | |
Total Distributions | | (.592 | ) | (.526 | ) | (.407 | ) | (.338 | ) | (.052 | ) |
Net Asset Value, End of Period | | $22.27 | | $21.45 | | $21.27 | | $20.60 | | $19.46 | |
| | | | | | | | | | | |
Total Return | | 6.73% | | 3.34% | | 5.30% | | 7.66% | | -2.44% | |
| | | | | | | | | | | |
Ratios/Supplemental Data | | | | | | | | | | | |
Net Assets, End of Period (Millions) | | $6,342 | | $5,661 | | $5,039 | | $2,031 | | $843 | |
Ratio of Total Expenses to Average Net Assets | | — | | — | | — | | — | | — | |
Acquired Fund Fees and Expenses | | 0.09% | | 0.09% | | 0.09% | | 0.09% | | 0.10%3 | |
Ratio of Net Investment Income to Average Net Assets | | 2.56% | | 2.50% | | 1.94% | | 1.83% | | 1.99%3 | |
Portfolio Turnover Rate | | 12% | | 13% | | 7% | | 7% | | 1% | |
| | | | | | | | | | | | |
1 Inception.
2 Calculated based on average shares outstanding.
3 Annualized.
See accompanying Notes, which are an integral part of the Financial Statements.
11
Institutional Target Retirement Income Fund
Notes to Financial Statements
Vanguard Institutional Target Retirement Income Fund is registered under the Investment Company Act of 1940 as an open-end investment company, or mutual fund. The fund follows a balanced investment strategy by investing in selected Vanguard funds to achieve its targeted allocation of assets to U.S. and international stocks, and U.S. and international bonds. Financial statements and other information about each underlying fund are available on vanguard.com.
A. The following significant accounting policies conform to generally accepted accounting principles for U.S. investment companies. The fund consistently follows such policies in preparing its financial statements.
1. Security Valuation: Investments are valued at the net asset value of each underlying Vanguard fund determined as of the close of the New York Stock Exchange (generally 4 p.m., Eastern time) on the valuation date.
2. Federal Income Taxes: The fund intends to continue to qualify as a regulated investment company and distribute all of its taxable income. Management has analyzed the fund’s tax positions taken for all open federal income tax years (September 30, 2016–2019), and has concluded that no provision for federal income tax is required in the fund’s financial statements.
3. Distributions: Distributions to shareholders are recorded on the ex-dividend date. Distributions are determined on a tax basis and may differ from net investment income and realized capital gains for financial reporting purposes.
4. Credit Facility: The fund and certain other funds managed by The Vanguard Group (“Vanguard”) participate in a $4.3 billion committed credit facility provided by a syndicate of lenders pursuant to a credit agreement that may be renewed annually; each fund is individually liable for its borrowings, if any, under the credit facility. Borrowings may be utilized for temporary and emergency purposes, and are subject to the fund’s regulatory and contractual borrowing restrictions. The participating funds are charged administrative fees and an annual commitment fee of 0.10% of the undrawn amount of the facility; these fees are allocated to the funds based on a method approved by the fund’s board of trustees and borne by the funds in which the fund invests (see Note B). Any borrowings under this facility bear interest at a rate based upon the higher of the one-month London Interbank Offered Rate, federal funds effective rate, or overnight bank funding rate plus an agreed-upon spread.
The fund had no borrowings outstanding at September 30, 2019, or at any time during the period then ended.
5. Other: Income and capital gain distributions received are recorded on the ex-dividend date. Security transactions are accounted for on the date securities are bought or sold. Costs used to determine realized gains (losses) on the sale of investment securities are those of the specific securities sold.
B. In accordance with the terms of a Funds’ Service Agreement (the “FSA”) between Vanguard and the fund, Vanguard furnishes to the fund investment advisory, corporate management, administrative, marketing, and distribution services at Vanguard’s cost of operations (as defined by the FSA). These costs of operations are allocated to the fund based on methods and guidelines approved by the board of trustees. The FSA provides that expenses otherwise allocable to Vanguard funds-of-funds may be reduced or eliminated to the extent of savings realized by the underlying
12
Institutional Target Retirement Income Fund
Vanguard funds by virtue of being part of a fund-of-funds. Accordingly, all expenses for services provided by Vanguard to the fund and all other expenses incurred by the fund during the period ended September 30, 2019, were borne by the underlying Vanguard funds in which the fund invests. The fund’s trustees and officers are also trustees and officers, respectively, of the underlying Vanguard funds, as well as directors and employees, respectively, of Vanguard.
C. Various inputs may be used to determine the value of the fund’s investments. These inputs are summarized in three broad levels for financial statement purposes. The inputs or methodologies used to value securities are not necessarily an indication of the risk associated with investing in those securities.
Level 1—Quoted prices in active markets for identical securities.
Level 2—Other significant observable inputs (including quoted prices for similar securities, interest rates, prepayment speeds, credit risk, etc.).
Level 3—Significant unobservable inputs (including the fund’s own assumptions used to determine the fair value of investments). Any investments valued with significant unobservable inputs are noted on the Statement of Net Assets.
At September 30, 2019, 100% of the market value of the fund’s investments was determined based on Level 1 inputs.
D. Permanent differences between book-basis and tax-basis components of net assets are reclassified among capital accounts in the financial statements to reflect their tax character. These reclassifications have no effect on net assets or net asset value per share. As of period end, permanent differences primarily attributable to the accounting for distributions in connection with fund share redemptions were reclassified between the following accounts:
| | Amount | |
| | ($000 | ) |
Paid-in Capital | | 1,956 | |
Total Distributable Earnings (Loss) | | (1,956 | ) |
Temporary differences between book-basis and tax-basis components of total distributable earnings (loss) arise when certain items of income, gain, or loss are recognized in different periods for financial statement and tax purposes; these differences will reverse at some time in the future. The differences are primarily related to the tax deferral of losses on wash sales and payables for distributions. As of period end, the tax-basis components of total distributable earnings (loss) are detailed in the table as follows:
| | Amount | |
| | ($000 | ) |
Undistributed Ordinary Income | | 3,434 | |
Undistributed Long-Term Gains | | — | |
Capital Loss Carryforwards (Non-expiring) | | — | |
Net Unrealized Gains (Losses) | | 555,549 | |
13
Institutional Target Retirement Income Fund
As of September 30, 2019, gross unrealized appreciation and depreciation for investments based on cost for U.S. federal income tax purposes were as follows:
| | Amount | |
| | ($000 | ) |
Tax Cost | | 5,791,559 | |
Gross Unrealized Appreciation | | 561,589 | |
Gross Unrealized Depreciation | | (6,040 | ) |
Net Unrealized Appreciation (Depreciation) | | 555,549 | |
E. Capital shares issued and redeemed were:
| | Year Ended September 30, | |
| | 2019 | | 2018 | |
| | Shares | | Shares | |
| | (000 | ) | (000 | ) |
Issued | | 60,874 | | 77,323 | |
Issued in Lieu of Cash Distributions | | 7,555 | | 6,154 | |
Redeemed | | (47,640 | ) | (56,429 | ) |
Net Increase (Decrease) in Shares Outstanding | | 20,789 | | 27,048 | |
At September 30, 2019, one shareholder was the record or beneficial owner of 31% of the fund’s net assets. If the shareholder were to redeem its investment in the fund, the redemption might lead to the realization of taxable capital gains.
14
Institutional Target Retirement Income Fund
F. Transactions during the period in affiliated underlying Vanguard funds were as follows:
| | | | Current Period Transactions | | | |
| | Sept. 30, | | | | Proceeds | | Realized | | | | | | | | Sept. 30, | |
| | 2018 | | | | from | | Net | | Change in | | | | Capital Gain | | 2019 | |
| | Market | | Purchases | | Securities | | Gain | | Unrealized | | | | Distributions | | Market | |
| | Value | | at Cost | | Sold | | (Loss | ) | App. (Dep. | ) | Income | | Received | | Value | |
| | ($000 | ) | ($000 | ) | ($000 | ) | ($000 | ) | ($000 | ) | ($000 | ) | ($000 | ) | ($000 | ) |
Vanguard Market Liquidity Fund | | 1 | | NA1 | | NA1 | | — | | — | | 50 | | — | | 3,648 | |
Vanguard Short-Term Inflation-Protected Securities Index Fund | | 950,946 | | 147,677 | | 53,480 | | (2 | ) | 14,398 | | 19,782 | | — | | 1,059,539 | |
Vanguard Total Bond Market II Index Fund | | 2,109,256 | | 440,406 | | 341,544 | | 112 | | 158,267 | | 63,163 | | — | | 2,366,497 | |
Vanguard Total International Bond Index Fund | | 899,283 | | 76,025 | | 37,738 | | (125 | ) | 74,512 | | 27,256 | | — | | 1,011,957 | |
Vanguard Total International Stock Index Fund | | 680,543 | | 147,306 | | 42,045 | | (1,563 | ) | (23,746 | ) | 21,473 | | — | | 760,495 | |
Vanguard Total Stock Market Index Fund | | 1,019,112 | | 309,191 | | 212,099 | | 4,690 | | 24,078 | | 20,713 | | — | | 1,144,972 | |
Total | | 5,659,141 | | 1,120,605 | | 686,906 | | 3,112 | | 247,509 | | 152,437 | | — | | 6,347,108 | |
1 Not applicable—purchases and sales are for temporary cash investment purposes.
G. Management has determined that no events or transactions occurred subsequent to September 30, 2019, that would require recognition or disclosure in these financial statements.
15
Institutional Target Retirement 2015 Fund
Performance Summary
All of the returns in this report represent past performance, which is not a guarantee of future results that may be achieved by the fund. (Current performance may be lower or higher than the performance data cited. For performance data current to the most recent month-end, visit our website at vanguard.com/performance.) Note, too, that both investment returns and principal value can fluctuate widely, so an investor’s shares, when sold, could be worth more or less than their original cost. The returns shown do not reflect taxes that a shareholder would pay on fund distributions or on the sale of fund shares.
Cumulative Performance: June 26, 2015, Through September 30, 2019
Initial Investment of $100,000,000
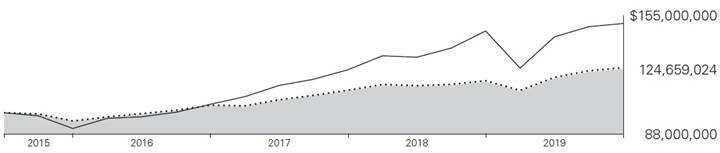
| | | | Average Annual Total Returns | | |
| | | | Periods Ended September 30, 2019 | | |
| | | | | | Since | | Final Value |
| | | | One | | Inception | | of a $100,000,000 |
| | | | Year | | (6/26/2015) | | Investment |

| | Institutional Target Retirement 2015 Fund | | 6.08% | | 5.31 | % | $124,659,024 |

| | Target 2015 Composite Index | | 6.17 | | 5.45 | | 125,386,156 |

| | MSCI US Broad Market Index | | 2.91 | | 10.06 | | 150,458,285 |
Target 2015 Composite Index: Derived by applying the fund’s target asset allocation to the results of the following benchmarks: for international stocks of developed markets, the MSCI EAFE Index through December 15, 2010, the MSCI ACWI ex USA IMI Index through June 2, 2013, and the FTSE Global All Cap ex US Index thereafter; for emerging-market stocks, the Select Emerging Markets Index through August 23, 2006, the MSCI Emerging Markets Index through December 15, 2010, the MSCI ACWI ex USA IMI Index through June 2, 2013, and the FTSE Global All Cap ex US Index thereafter; for U.S. bonds, the Bloomberg Barclays U.S. Aggregate Bond Index through December 31, 2009, and the Bloomberg Barclays U.S. Aggregate Float Adjusted Index thereafter, as well as the Bloomberg Barclays U.S. Treasury Inflation-Protected Securities Index through June 2, 2013, and the Bloomberg Barclays U.S. Treasury Inflation-Protected Securities (TIPS) 0–5 Year Index thereafter; for international bonds, the Bloomberg Barclays Global Aggregate ex-USD Float Adjusted RIC Capped Index Hedged beginning June 3, 2013; and for U.S. stocks, the Dow Jones U.S. Total Stock Market Index (formerly known as the Dow Jones Wilshire 5000 Index) through April 22, 2005, the MSCI US Broad Market Index through June 2, 2013, and the CRSP US Total Market Index thereafter. International stock benchmark returns are adjusted for withholding taxes.
“Since Inception” performance is calculated from the fund’s inception date for both the fund and its comparative standards.
See Financial Highlights for dividend and capital gains information.
16
Institutional Target Retirement 2015 Fund
Underlying Vanguard Funds
As of September 30, 2019
Vanguard Total Bond Market II Index Fund Investor Shares | | 34.6% |
Vanguard Total Stock Market Index Fund Institutional Shares | | 22.4 |
Vanguard Total International Stock Index Fund Investor Shares | | 14.9 |
Vanguard Total International Bond Index Fund Admiral Shares | | 14.8 |
Vanguard Short-Term Inflation-Protected Securities Index Fund Admiral Shares | | 13.3 |
17
Institutional Target Retirement 2015 Fund
Financial Statements
Statement of Net Assets
As of September 30, 2019
The fund files its complete schedule of portfolio holdings with the Securities and Exchange Commission (SEC) for the first and third quarters of each fiscal year as an exhibit to its reports on Form N-PORT. The fund’s Form N-PORT reports are available on the SEC’s website at www.sec.gov.
| | | | Market | |
| | | | Value· | |
| | Shares | | ($000 | ) |
Investment Companies (100.0%) | | | | | |
U.S. Stock Fund (22.4%) | | | | | |
Vanguard Total Stock Market Index Fund Institutional Shares | | 26,608,792 | | 1,956,012 | |
| | | | | |
International Stock Fund (14.9%) | | | | | |
Vanguard Total International Stock Index Fund Investor Shares | | 78,530,791 | | 1,301,255 | |
| | | | | |
U.S. Bond Funds (47.9%) | | | | | |
1 | Vanguard Total Bond Market II Index Fund Investor Shares | | 272,261,404 | | 3,016,657 | |
| Vanguard Short-Term Inflation-Protected Securities Index Fund Admiral Shares | | 47,328,946 | | 1,164,292 | |
| | | | 4,180,949 | |
International Bond Fund (14.8%) | | | | | |
Vanguard Total International Bond Index Fund Admiral Shares | | 54,770,892 | | 1,287,116 | |
Total Investment Companies (Cost $7,754,079) | | | | 8,725,332 | |
Temporary Cash Investment (0.0%) | | | | | |
Money Market Fund (0.0%) | | | | | |
1 | Vanguard Market Liquidity Fund, 2.098% (Cost $1,347) | | 13,466 | | 1,347 | |
Total Investments (100.0%) (Cost $7,755,426) | | | | 8,726,679 | |
Other Assets and Liabilities (0.0%) | | | | | |
Other Assets | | | | 71,139 | |
Liabilities | | | | (72,386 | ) |
| | | | (1,247 | ) |
Net Assets (100%) | | | | | |
Applicable to 379,982,758 outstanding $.001 par value shares of beneficial interest (unlimited authorization) | | | | 8,725,432 | |
Net Asset Value Per Share | | | | $22.96 | |
18
Institutional Target Retirement 2015 Fund
| | Amount | |
| | ($000 | ) |
Statement of Assets and Liabilities | | | |
Assets | | | |
Investments in Securities, at Value—Affiliated Funds | | 8,726,679 | |
Receivables for Investment Securities Sold | | 61,286 | |
Receivables for Accrued Income | | 7,533 | |
Receivables for Capital Shares Issued | | 2,320 | |
Total Assets | | 8,797,818 | |
Liabilities | | | |
Payables for Investment Securities Purchased | | 7,533 | |
Payables for Capital Shares Redeemed | | 64,853 | |
Total Liabilities | | 72,386 | |
Net Assets | | 8,725,432 | |
At September 30, 2019, net assets consisted of:
| | Amount | |
| | ($000 | ) |
Paid-in Capital | | 7,593,455 | |
Total Distributable Earnings (Loss) | | 1,131,977 | |
Net Assets | | 8,725,432 | |
· See Note A in Notes to Financial Statements.
1 Affiliated fund available only to Vanguard funds and certain trusts and accounts managed by Vanguard. Rate shown for Vanguard Market Liquidity Fund is the 7-day yield.
See accompanying Notes, which are an integral part of the Financial Statements.
19
Institutional Target Retirement 2015 Fund
Statement of Operations
| | Year Ended | |
| | September 30, 2019 | |
| | ($000 | ) |
Investment Income | | | |
Income | | | |
Income Distributions Received from Affiliated Funds | | 214,324 | |
Net Investment Income—Note B | | 214,324 | |
Realized Net Gain (Loss) | | | |
Capital Gain Distributions Received from Affiliated Funds | | — | |
Affiliated Funds Sold | | 34,124 | |
Realized Net Gain (Loss) | | 34,124 | |
Change in Unrealized Appreciation (Depreciation) from Affiliated Funds | | 268,085 | |
Net Increase (Decrease) in Net Assets Resulting from Operations | | 516,533 | |
See accompanying Notes, which are an integral part of the Financial Statements.
20
Institutional Target Retirement 2015 Fund
Statement of Changes in Net Assets
| | Year Ended September 30, | |
| | 2019 | | 2018 | |
| | ($000 | ) | ($000 | ) |
Increase (Decrease) in Net Assets | | | | | |
Operations | | | | | |
Net Investment Income | | 214,324 | | 195,779 | |
Realized Net Gain (Loss) | | 34,124 | | 69,727 | |
Change in Unrealized Appreciation (Depreciation) | | 268,085 | | 91,261 | |
Net Increase (Decrease) in Net Assets Resulting from Operations | | 516,533 | | 356,767 | |
Distributions | | | | | |
Net Investment Income | | (197,608 | ) | (158,721 | ) |
Realized Capital Gain1 | | (62,658 | ) | (9,936 | ) |
Total Distributions | | (260,266 | ) | (168,657 | ) |
Capital Share Transactions | | | | | |
Issued | | 1,475,692 | | 2,030,600 | |
Issued in Lieu of Cash Distributions | | 258,627 | | 167,397 | |
Redeemed | | (1,511,326 | ) | (1,754,155 | ) |
Net Increase (Decrease) from Capital Share Transactions | | 222,993 | | 443,842 | |
Total Increase (Decrease) | | 479,260 | | 631,952 | |
Net Assets | | | | | |
Beginning of Period | | 8,246,172 | | 7,614,220 | |
End of Period | | 8,725,432 | | 8,246,172 | |
1 Includes fiscal 2019 and 2018 short-term gain distributions totaling $13,605,000 and $5,056,000, respectively. Short-term gain distributions are treated as ordinary income dividends for tax purposes.
See accompanying Notes, which are an integral part of the Financial Statements.
21
Institutional Target Retirement 2015 Fund
Financial Highlights
| | | | | June 26, |
| | | | | 20151 to |
For a Share Outstanding | Year Ended September 30, | | Sept. 30, |
Throughout Each Period | 2019 | 2018 | 2017 | 2016 | | 2015 |
Net Asset Value, Beginning of Period | $22.39 | $21.87 | $20.64 | $19.06 | | $20.00 |
Investment Operations | | | | | |
Net Investment Income | .5612 | .5362 | .4332 | .345 | .1242 |
Capital Gain Distributions Received | — | .0022 | .0062 | .008 | — |
Net Realized and Unrealized Gain (Loss) on Investments | .716 | .459 | 1.182 | 1.380 | (1.064) |
Total from Investment Operations | 1.277 | .997 | 1.621 | 1.733 | (.940) |
Distributions | | | | | |
Dividends from Net Investment Income | (.537) | (.449) | (.381) | (.152) | — |
Distributions from Realized Capital Gains | (.170) | (.028) | (.010) | (.001) | — |
Total Distributions | (.707) | (.477) | (.391) | (.153) | — |
Net Asset Value, End of Period | $22.96 | $22.39 | $21.87 | $20.64 | $19.06 |
| | | | | |
Total Return | 6.08% | 4.60% | 8.02% | 9.14% | -4.70% |
| | | | | |
Ratios/Supplemental Data | | | | | |
Net Assets, End of Period (Millions) | $8,725 | $8,246 | $7,614 | $6,023 | $2,790 |
Ratio of Total Expenses to Average Net Assets | — | — | — | — | — |
Acquired Fund Fees and Expenses | 0.09% | 0.09% | 0.09% | 0.09% | 0.10%3 |
Ratio of Net Investment Income to Average Net Assets | 2.55% | 2.42% | 2.07% | 2.04% | 2.21%3 |
Portfolio Turnover Rate | 16% | 15% | 10% | 10% | 1% |
1 Inception.
2 Calculated based on average shares outstanding.
3 Annualized.
See accompanying Notes, which are an integral part of the Financial Statements.
22
Institutional Target Retirement 2015 Fund
Notes to Financial Statements
Vanguard Institutional Target Retirement 2015 Fund is registered under the Investment Company Act of 1940 as an open-end investment company, or mutual fund. The fund follows a balanced investment strategy by investing in selected Vanguard funds to achieve its targeted allocation of assets to U.S. and international stocks, and U.S. and international bonds. Financial statements and other information about each underlying fund are available on vanguard.com.
A. The following significant accounting policies conform to generally accepted accounting principles for U.S. investment companies. The fund consistently follows such policies in preparing its financial statements.
1. Security Valuation: Investments are valued at the net asset value of each underlying Vanguard fund determined as of the close of the New York Stock Exchange (generally 4 p.m., Eastern time) on the valuation date.
2. Federal Income Taxes: The fund intends to continue to qualify as a regulated investment company and distribute all of its taxable income. Management has analyzed the fund’s tax positions taken for all open federal income tax years (September 30, 2016-2019), and has concluded that no provision for federal income tax is required in the fund’s financial statements.
3. Distributions: Distributions to shareholders are recorded on the ex-dividend date. Distributions are determined on a tax basis and may differ from net investment income and realized capital gains for financial reporting purposes.
4. Credit Facility: The fund and certain other funds managed by The Vanguard Group (“Vanguard”) participate in a $4.3 billion committed credit facility provided by a syndicate of lenders pursuant to a credit agreement that may be renewed annually; each fund is individually liable for its borrowings, if any, under the credit facility. Borrowings may be utilized for temporary and emergency purposes, and are subject to the fund’s regulatory and contractual borrowing restrictions. The participating funds are charged administrative fees and an annual commitment fee of 0.10% of the undrawn amount of the facility; these fees are allocated to the funds based on a method approved by the fund’s board of trustees and borne by the funds in which the fund invests (see Note B). Any borrowings under this facility bear interest at a rate based upon the higher of the one-month London Interbank Offered Rate, federal funds effective rate, or overnight bank funding rate plus an agreed-upon spread.
The fund had no borrowings outstanding at September 30, 2019, or at any time during the period then ended.
5. Other: Income and capital gain distributions received are recorded on the ex-dividend date. Security transactions are accounted for on the date securities are bought or sold. Costs used to determine realized gains (losses) on the sale of investment securities are those of the specific securities sold.
B. In accordance with the terms of a Funds’ Service Agreement (the “FSA”) between Vanguard and the fund, Vanguard furnishes to the fund investment advisory, corporate management, administrative, marketing, and distribution services at Vanguard’s cost of operations (as defined by the FSA). These costs of operations are allocated to the fund based on methods and guidelines approved by the board of trustees. The FSA provides that expenses otherwise allocable to Vanguard
23
Institutional Target Retirement 2015 Fund
funds-of-funds may be reduced or eliminated to the extent of savings realized by the underlying Vanguard funds by virtue of being part of a fund-of-funds. Accordingly, all expenses for services provided by Vanguard to the fund and all other expenses incurred by the fund during the period ended September 30, 2019, were borne by the underlying Vanguard funds in which the fund invests. The fund’s trustees and officers are also trustees and officers, respectively, of the underlying Vanguard funds, as well as directors and employees, respectively, of Vanguard.
C. Various inputs may be used to determine the value of the fund’s investments. These inputs are summarized in three broad levels for financial statement purposes. The inputs or methodologies used to value securities are not necessarily an indication of the risk associated with investing in those securities.
Level 1—Quoted prices in active markets for identical securities.
Level 2—Other significant observable inputs (including quoted prices for similar securities, interest rates, prepayment speeds, credit risk, etc.).
Level 3—Significant unobservable inputs (including the fund’s own assumptions used to determine the fair value of investments). Any investments valued with significant unobservable inputs are noted on the Statement of Net Assets.
At September 30, 2019, 100% of the market value of the fund’s investments was determined based on Level 1 inputs.
D. Permanent differences between book-basis and tax-basis components of net assets are reclassified among capital accounts in the financial statements to reflect their tax character. These reclassifications have no effect on net assets or net asset value per share. As of period end, permanent differences primarily attributable to the accounting for distributions in connection with fund share redemptions were reclassified between the following accounts:
| | Amount | |
| | ($000 | ) |
Paid-in Capital | | 8,612 | |
Total Distributable Earnings (Loss) | | (8,612 | ) |
Temporary differences between book-basis and tax-basis components of total distributable earnings (loss) arise when certain items of income, gain, or loss are recognized in different periods for financial statement and tax purposes; these differences will reverse at some time in the future. The differences are primarily related to the tax deferral of losses on wash sales. As of period end, the tax-basis components of total distributable earnings (loss) are detailed in the table as follows:
| | Amount | |
| | ($000 | ) |
Undistributed Ordinary Income | | 148,490 | |
Undistributed Long-Term Gains | | 12,234 | |
Capital Loss Carryforwards | | — | |
Net Unrealized Gains (Losses) | | 971,253 | |
24
Institutional Target Retirement 2015 Fund
As of September 30, 2019, gross unrealized appreciation and depreciation for investments based on cost for U.S. federal income tax purposes were as follows:
| | Amount | |
| | ($000 | ) |
Tax Cost | | 7,755,426 | |
Gross Unrealized Appreciation | | 974,130 | |
Gross Unrealized Depreciation | | (2,877 | ) |
Net Unrealized Appreciation (Depreciation) | | 971,253 | |
E. Capital shares issued and redeemed were:
| | Year Ended September 30, | |
| | 2019 | | 2018 | |
| | Shares | | Shares | |
| | (000 | ) | (000 | ) |
Issued | | 67,681 | | 91,749 | |
Issued in Lieu of Cash Distributions | | 12,579 | | 7,606 | |
Redeemed | | (68,538 | ) | (79,251 | ) |
Net Increase (Decrease) in Shares Outstanding | | 11,722 | | 20,104 | |
At September 30, 2019, one shareholder was the record or beneficial owner of 33% of the fund’s net assets. If the shareholder were to redeem its investment in the fund, the redemption might lead to the realization of taxable capital gains.
25
Institutional Target Retirement 2015 Fund
F. Transactions during the period in affiliated underlying Vanguard funds were as follows:
| | | | Current Period Transactions | | | |
| | Sept. 30, | | | | Proceeds | | Realized | | | | | | | | Sept. 30, | |
| | 2018 | | | | from | | Net | | Change in | | | | Capital Gain | | 2019 | |
| | Market | | Purchases | | Securities | | Gain | | Unrealized | | | | Distributions | | Market | |
| | Value | | at Cost | | Sold | | (Loss | ) | App. (Dep. | ) | Income | | Received | | Value | |
| | ($000 | ) | ($000 | ) | ($000 | ) | ($000 | ) | ($000 | ) | ($000 | ) | ($000 | ) | ($000 | ) |
Vanguard Market Liquidity Fund | | 1,881 | | NA1 | | NA1 | | 1 | | — | | 55 | | — | | 1,347 | |
Vanguard Short-Term Inflation-Protected Securities Index Fund | | 1,003,272 | | 233,646 | | 88,669 | | (71 | ) | 16,114 | | 21,358 | | — | | 1,164,292 | |
Vanguard Total Bond Market II Index Fund | | 2,730,546 | | 618,908 | | 535,597 | | (2,092 | ) | 204,892 | | 81,039 | | — | | 3,016,657 | |
Vanguard Total International Bond Index Fund | | 1,166,774 | | 86,536 | | 62,221 | | 400 | | 95,627 | | 35,036 | | — | | 1,287,116 | |
Vanguard Total International Stock Index Fund | | 1,345,446 | | 154,466 | | 145,011 | | (2,900 | ) | (50,746 | ) | 39,120 | | — | | 1,301,255 | |
Vanguard Total Stock Market Index Fund | | 1,994,751 | | 416,023 | | 495,746 | | 38,786 | | 2,198 | | 37,716 | | — | | 1,956,012 | |
Total | | 8,242,670 | | 1,509,579 | | 1,327,244 | | 34,124 | | 268,085 | | 214,324 | | — | | 8,726,679 | |
1 Not applicable—purchases and sales are for temporary cash investment purposes.
G. Management has determined that no events or transactions occurred subsequent to September 30, 2019, that would require recognition or disclosure in these financial statements.
26
Institutional Target Retirement 2020 Fund
Performance Summary
All of the returns in this report represent past performance, which is not a guarantee of future results that may be achieved by the fund. (Current performance may be lower or higher than the performance data cited. For performance data current to the most recent month-end, visit our website at vanguard.com/performance.) Note, too, that both investment returns and principal value can fluctuate widely, so an investor’s shares, when sold, could be worth more or less than their original cost. The returns shown do not reflect taxes that a shareholder would pay on fund distributions or on the sale of fund shares.
Cumulative Performance: June 26, 2015, Through September 30, 2019
Initial Investment of $100,000,000
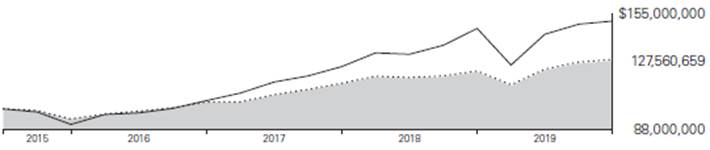
| | Average Annual Total Returns | |
| | Periods Ended September 30, 2019 | |
| | | Since | Final Value |
| | One | Inception | of a $100,000,000 |
| | Year | (6/26/2015) | Investment |

| Institutional Target Retirement 2020 Fund | 5.34% | 5.88% | $127,560,659 |

| Target 2020 Composite Index | 5.45 | 6.04 | 128,381,043 |

| MSCI US Broad Market Index | 2.91 | 10.06 | 150,458,285 |
Target 2020 Composite Index: Derived by applying the fund’s target asset allocation to the results of the following benchmarks: for international stocks of developed markets, the MSCI EAFE Index through December 15, 2010, the MSCI ACWI ex USA IMI Index through June 2, 2013, and the FTSE Global All Cap ex US Index thereafter; for emerging-market stocks, the Select Emerging Markets Index through August 23, 2006, the MSCI Emerging Markets Index through December 15, 2010, the MSCI ACWI ex USA IMI Index through June 2, 2013, and the FTSE Global All Cap ex US Index thereafter; for U.S. bonds, the Bloomberg Barclays U.S. Aggregate Bond Index through December 31, 2009, and the Bloomberg Barclays U.S. Aggregate Float Adjusted Index thereafter; for international bonds, the Bloomberg Barclays Global Aggregate ex-USD Float Adjusted RIC Capped Index Hedged beginning June 3, 2013; and for U.S. stocks, the MSCI US Broad Market Index through June 2, 2013, and the CRSP US Total Market Index thereafter. International stock benchmark returns are adjusted for withholding taxes.
“Since Inception” performance is calculated from the fund’s inception date for both the fund and its comparative standards.
See Financial Highlights for dividend and capital gains information.
27
Institutional Target Retirement 2020 Fund
Underlying Vanguard Funds
As of September 30, 2019
Vanguard Total Stock Market Index Fund Institutional Shares | 30.8% |
Vanguard Total Bond Market II Index Fund Investor Shares | 29.1 |
Vanguard Total International Stock Index Fund Investor Shares | 20.6 |
Vanguard Total International Bond Index Fund Admiral Shares | 12.7 |
Vanguard Short-Term Inflation-Protected Securities Index Fund Admiral Shares | 6.8 |
28
Institutional Target Retirement 2020 Fund
Financial Statements
Statement of Net Assets
As of September 30, 2019
The fund files its complete schedule of portfolio holdings with the Securities and Exchange Commission (SEC) for the first and third quarters of each fiscal year as an exhibit to its reports on Form N-PORT. The fund’s Form N-PORT reports are available on the SEC’s website at www.sec.gov.
| | | | Market | |
| | | | Value· | |
| | Shares | | ($000 | ) |
Investment Companies (100.1%) | | | | | |
U.S. Stock Fund (30.9%) | | | | | |
Vanguard Total Stock Market Index Fund Institutional Shares | | 101,257,154 | | 7,443,414 | |
| | | | | |
International Stock Fund (20.6%) | | | | | |
Vanguard Total International Stock Index Fund Investor Shares | | 299,525,398 | | 4,963,136 | |
| | | | | |
U.S. Bond Funds (35.9%) | | | | | |
1 Vanguard Total Bond Market II Index Fund Investor Shares | | 635,275,743 | | 7,038,855 | |
Vanguard Short-Term Inflation-Protected Securities Index Fund Admiral Shares | | 66,324,634 | | 1,631,586 | |
| | | | 8,670,441 | |
| | | | | |
International Bond Fund (12.7%) | | | | | |
Vanguard Total International Bond Index Fund Admiral Shares | | 130,896,651 | | 3,076,071 | |
Total Investment Companies (Cost $21,263,670) | | | | 24,153,062 | |
Temporary Cash Investment (0.0%) | | | | | |
Money Market Fund (0.0%) | | | | | |
1 Vanguard Market Liquidity Fund, 2.098% (Cost $7,341) | | 73,405 | | 7,341 | |
Total Investments (100.1%) (Cost $21,271,011) | | | | 24,160,403 | |
Other Assets and Liabilities (-0.1%) | | | | | |
Other Assets | | | | 151,783 | |
Liabilities | | | | (184,002 | ) |
| | | | (32,219 | ) |
Net Assets (100%) | | | | | |
Applicable to 1,018,630,073 outstanding $.001 par value shares of beneficial interest (unlimited authorization) | | | | 24,128,184 | |
Net Asset Value Per Share | | | | $23.69 | |
29
Institutional Target Retirement 2020 Fund
| | Amount | |
| | ($000 | ) |
Statement of Assets and Liabilities | | | |
Assets | | | |
Investments in Securities, at Value—Affiliated Funds | | 24,160,403 | |
Receivables for Investment Securities Sold | | 109,422 | |
Receivables for Accrued Income | | 17,639 | |
Receivables for Capital Shares Issued | | 24,722 | |
Total Assets | | 24,312,186 | |
Liabilities | | | |
Payables for Investment Securities Purchased | | 17,639 | |
Payables for Capital Shares Redeemed | | 166,363 | |
Total Liabilities | | 184,002 | |
Net Assets | | 24,128,184 | |
| | | |
At September 30, 2019, net assets consisted of: | | | |
| | | |
| | Amount | |
| | ($000 | ) |
Paid-in Capital | | 20,846,550 | |
Total Distributable Earnings (Loss) | | 3,281,634 | |
Net Assets | | 24,128,184 | |
· | See Note A in Notes to Financial Statements. |
| |
1 | Affiliated fund available only to Vanguard funds and certain trusts and accounts managed by Vanguard. Rate shown for Vanguard Market Liquidity Fund is the 7-day yield. |
See accompanying Notes, which are an integral part of the Financial Statements.
30
Institutional Target Retirement 2020 Fund
Statement of Operations
| | Year Ended | |
| | September 30, 2019 | |
| | ($000 | ) |
Investment Income | | | |
Income | | | |
Income Distributions Received from Affiliated Funds | | 579,085 | |
Net Investment Income—Note B | | 579,085 | |
Realized Net Gain (Loss) | | | |
Capital Gain Distributions Received from Affiliated Funds | | — | |
Affiliated Funds Sold | | 32,985 | |
Futures Contracts | | (33 | ) |
Realized Net Gain (Loss) | | 32,952 | |
Change in Unrealized Appreciation (Depreciation) from Affiliated Funds | | 669,129 | |
Net Increase (Decrease) in Net Assets Resulting from Operations | | 1,281,166 | |
See accompanying Notes, which are an integral part of the Financial Statements.
31
Institutional Target Retirement 2020 Fund
Statement of Changes in Net Assets
| | Year Ended September 30, | |
| | 2019 | | 2018 | |
| | ($000 | ) | ($000 | ) |
Increase (Decrease) in Net Assets | | | | | |
Operations | | | | | |
Net Investment Income | | 579,085 | | 469,905 | |
Realized Net Gain (Loss) | | 32,952 | | 19,141 | |
Change in Unrealized Appreciation (Depreciation) | | 669,129 | | 616,999 | |
Net Increase (Decrease) in Net Assets Resulting from Operations | | 1,281,166 | | 1,106,045 | |
Distributions | | | | | |
Net Investment Income | | (512,234 | ) | (371,348 | ) |
Realized Capital Gain1 | | (17,943 | ) | (6,294 | ) |
Total Distributions | | (530,177 | ) | (377,642 | ) |
Capital Share Transactions | | | | | |
Issued | | 4,175,722 | | 5,918,823 | |
Issued in Lieu of Cash Distributions | | 525,289 | | 373,108 | |
Redeemed | | (3,162,786 | ) | (2,768,170 | ) |
Net Increase (Decrease) from Capital Share Transactions | | 1,538,225 | | 3,523,761 | |
Total Increase (Decrease) | | 2,289,214 | | 4,252,164 | |
Net Assets | | | | | |
Beginning of Period | | 21,838,970 | | 17,586,806 | |
End of Period | | 24,128,184 | | 21,838,970 | |
1 | Includes fiscal 2019 and 2018 short-term gain distributions totaling $16,882,000 and $4,472,000, respectively. Short-term gain distributions are treated as ordinary income dividends for tax purposes. |
See accompanying Notes, which are an integral part of the Financial Statements.
32
Institutional Target Retirement 2020 Fund
Financial Highlights
For a Share Outstanding | Year Ended September 30, | | June 26, 20151 to Sept. 30, | |
Throughout Each Period | 2019 | | 2018 | | 2017 | | 2016 | | 2015 | |
Net Asset Value, Beginning of Period | $23.08 | | $22.23 | | $20.58 | | $18.84 | | $20.00 | |
Investment Operations | | | | | | | | | | |
Net Investment Income2 | .575 | | .532 | | .464 | | .444 | | .138 | |
Capital Gain Distributions Received2 | — | | .001 | | .005 | | .007 | | — | |
Net Realized and Unrealized Gain (Loss) on Investments | .585 | | .773 | | 1.582 | | 1.453 | | (1.298 | ) |
Total from Investment Operations | 1.160 | | 1.306 | | 2.051 | | 1.904 | | (1.160 | ) |
Distributions | | | | | | | | | | |
Dividends from Net Investment Income | (.531 | ) | (.448 | ) | (.391 | ) | (.162 | ) | — | |
Distributions from Realized Capital Gains | (.019 | ) | (.008 | ) | (.010 | ) | (.002 | ) | — | |
Total Distributions | (.550 | ) | (.456 | ) | (.401 | ) | (.164 | ) | — | |
Net Asset Value, End of Period | $23.69 | | $23.08 | | $22.23 | | $20.58 | | $18.84 | |
| | | | | | | | | | |
Total Return | 5.34% | | 5.92% | | 10.17% | | 10.16% | | -5.80% | |
| | | | | | | | | | |
Ratios/Supplemental Data | | | | | | | | | | |
Net Assets, End of Period (Millions) | $24,128 | | $21,839 | | $17,587 | | $11,613 | | $4,835 | |
Ratio of Total Expenses to Average Net Assets | — | | — | | — | | — | | — | |
Acquired Fund Fees and Expenses | 0.09% | | 0.09% | | 0.09% | | 0.10% | | 0.10%3 | |
Ratio of Net Investment Income to Average Net Assets | 2.54% | | 2.35% | | 2.20% | | 2.25% | | 2.48%3 | |
Portfolio Turnover Rate | 13% | | 8% | | 6% | | 5% | | 2% | |
1 | Inception. |
| |
2 | Calculated based on average shares outstanding. |
| |
3 | Annualized. |
See accompanying Notes, which are an integral part of the Financial Statements.
33
Institutional Target Retirement 2020 Fund
Notes to Financial Statements
Vanguard Institutional Target Retirement 2020 Fund is registered under the Investment Company Act of 1940 as an open-end investment company, or mutual fund. The fund follows a balanced investment strategy by investing in selected Vanguard funds to achieve its targeted allocation of assets to U.S. and international stocks, and U.S. and international bonds. Financial statements and other information about each underlying fund are available on vanguard.com.
A. The following significant accounting policies conform to generally accepted accounting principles for U.S. investment companies. The fund consistently follows such policies in preparing its financial statements.
1. Security Valuation: Investments are valued at the net asset value of each underlying Vanguard fund determined as of the close of the New York Stock Exchange (generally 4 p.m., Eastern time) on the valuation date.
2. Futures Contracts: The fund uses stock and bond futures contracts to a limited extent, with the objectives of maintaining full exposure to the market and maintaining its target asset allocation. The primary risks associated with the use of futures contracts are imperfect correlation between changes in market values of investments held by the fund and the prices of futures contracts, and the possibility of an illiquid market. Counterparty risk involving futures is mitigated because a regulated clearinghouse is the counterparty instead of the clearing broker. To further mitigate counterparty risk, the fund trades futures contracts on an exchange, monitors the financial strength of its clearing brokers and clearinghouse, and has entered into clearing agreements with its clearing brokers. The clearinghouse imposes initial margin requirements to secure the fund’s performance and requires daily settlement of variation margin representing changes in the market value of each contract. Any assets pledged as initial margin for open contracts are noted in the Statement of Net Assets.
Futures contracts are valued at their quoted daily settlement prices. The notional amounts of the contracts are not recorded in the Statement of Net Assets. Fluctuations in the value of the contracts are recorded in the Statement of Assets and Liabilities as an asset (liability) and in the Statement of Operations as unrealized appreciation (depreciation) until the contracts are closed, when they are recorded as realized futures gains (losses).
During the year ended September 30, 2019, the fund’s average investments in long and short futures contracts represented less than 1% and 0% of net assets, respectively, based on the average of the notional amounts at each quarter-end during the period. The fund had no open futures contracts at September 30, 2019.
3. Federal Income Taxes: The fund intends to continue to qualify as a regulated investment company and distribute all of its taxable income. Management has analyzed the fund’s tax positions taken for all open federal income tax years (September 30, 2016-2019), and has concluded that no provision for federal income tax is required in the fund’s financial statements.
4. Distributions: Distributions to shareholders are recorded on the ex-dividend date. Distributions are determined on a tax basis and may differ from net investment income and realized capital gains for financial reporting purposes.
5. Credit Facility: The fund and certain other funds managed by The Vanguard Group (“Vanguard”) participate in a $4.3 billion committed credit facility provided by a syndicate of lenders pursuant to a credit agreement that may be renewed annually; each fund is individually liable for its borrowings,
34
Institutional Target Retirement 2020 Fund
if any, under the credit facility. Borrowings may be utilized for temporary and emergency purposes, and are subject to the fund’s regulatory and contractual borrowing restrictions. The participating funds are charged administrative fees and an annual commitment fee of 0.10% of the undrawn amount of the facility; these fees are allocated to the funds based on a method approved by the fund’s board of trustees and borne by the funds in which the fund invests (see Note B). Any borrowings under this facility bear interest at a rate based upon the higher of the one-month London Interbank Offered Rate, federal funds effective rate, or overnight bank funding rate plus an agreed-upon spread.
The fund had no borrowings outstanding at September 30, 2019, or at any time during the period then ended.
6. Other: Income and capital gain distributions received are recorded on the ex-dividend date. Security transactions are accounted for on the date securities are bought or sold. Costs used to determine realized gains (losses) on the sale of investment securities are those of the specific securities sold.
B. In accordance with the terms of a Funds’ Service Agreement (the “FSA”) between Vanguard and the fund, Vanguard furnishes to the fund investment advisory, corporate management, administrative, marketing, and distribution services at Vanguard’s cost of operations (as defined by the FSA). These costs of operations are allocated to the fund based on methods and guidelines approved by the board of trustees. The FSA provides that expenses otherwise allocable to Vanguard funds-of-funds may be reduced or eliminated to the extent of savings realized by the underlying Vanguard funds by virtue of being part of a fund-of-funds. Accordingly, all expenses for services provided by Vanguard to the fund and all other expenses incurred by the fund during the period ended September 30, 2019, were borne by the underlying Vanguard funds in which the fund invests. The fund’s trustees and officers are also trustees and officers, respectively, of the underlying Vanguard funds, as well as directors and employees, respectively, of Vanguard.
C. Various inputs may be used to determine the value of the fund’s investments. These inputs are summarized in three broad levels for financial statement purposes. The inputs or methodologies used to value securities are not necessarily an indication of the risk associated with investing in those securities.
Level 1—Quoted prices in active markets for identical securities.
Level 2—Other significant observable inputs (including quoted prices for similar securities, interest rates, prepayment speeds, credit risk, etc.).
Level 3—Significant unobservable inputs (including the fund’s own assumptions used to determine the fair value of investments). Any investments valued with significant unobservable inputs are noted on the Statement of Net Assets.
At September 30, 2019, 100% of the market value of the fund’s investments was determined based on Level 1 inputs.
35
Institutional Target Retirement 2020 Fund
D. Permanent differences between book-basis and tax-basis components of net assets are reclassified among capital accounts in the financial statements to reflect their tax character. These reclassifications have no effect on net assets or net asset value per share. As of period end, permanent differences primarily attributable to the accounting for distributions in connection with fund share redemptions were reclassified between the following accounts:
| | Amount | |
| | ($000 | ) |
Paid-in Capital | | 17,229 | |
Total Distributable Earnings (Loss) | | (17,229 | ) |
Temporary differences between book-basis and tax-basis components of total distributable earnings (loss) arise when certain items of income, gain, or loss are recognized in different periods for financial statement and tax purposes; these differences will reverse at some time in the future. The differences are primarily related to the tax deferral of losses on wash sales. As of period end, the tax-basis components of total distributable earnings (loss) are detailed in the table as follows:
| | Amount | |
| | ($000 | ) |
Undistributed Ordinary Income | | 391,261 | |
Undistributed Long-Term Gains | | 981 | |
Capital Loss Carryforwards (Non-expiring) | | — | |
Net Unrealized Gains (Losses) | | 2,889,392 | |
As of September 30, 2019, gross unrealized appreciation and depreciation for investments based on cost for U.S. federal income tax purposes were as follows:
| | Amount | |
| | ($000 | ) |
Tax Cost | | 21,271,011 | |
Gross Unrealized Appreciation | | 2,948,368 | |
Gross Unrealized Depreciation | | (58,976 | ) |
Net Unrealized Appreciation (Depreciation) | | 2,889,392 | |
E. Capital shares issued and redeemed were:
| | Year Ended September 30, | |
| | 2019 | | 2018 | |
| | Shares | | Shares | |
| | (000 | ) | (000 | ) |
Issued | | 186,336 | | 260,732 | |
Issued in Lieu of Cash Distributions | | 25,097 | | 16,538 | |
Redeemed | | (139,093 | ) | (122,044 | ) |
Net Increase (Decrease) in Shares Outstanding | | 72,340 | | 155,226 | |
36
Institutional Target Retirement 2020 Fund
At September 30, 2019, one shareholder was the record or beneficial owner of 38% of the fund’s net assets. If the shareholder were to redeem its investment in the fund, the redemption might lead to the realization of taxable capital gains.
F. Transactions during the period in affiliated underlying Vanguard funds were as follows:
| | | | Current Period Transactions | | |
| | Sept. 30, | | | | Proceeds | | Realized | | | | | | | | Sept. 30, |
| | 2018 | | | | from | | Net | | Change in | | | | Capital Gain | | 2019 |
| | Market | | Purchases | | Securities | | Gain | | Unrealized | | | | Distributions | | Market |
| | Value | | at Cost | | Sold | | (Loss | ) | App. (Dep. | ) | Income | | Received | | Value |
| | ($000 | ) | ($000 | ) | ($000 | ) | ($000 | ) | ($000 | ) | ($000 | ) | ($000 | ) | ($000) |
Vanguard Market Liquidity Fund | | — | | NA1 | | NA1 | | 1 | | — | | 58 | | — | | 7,341 |
Vanguard Short-Term Inflation-Protected Securities Index Fund | | 1,132,233 | | 578,902 | | 100,553 | | — | | 21,004 | | 28,164 | | — | | 1,631,586 |
Vanguard Total Bond Market II Index Fund | | 6,311,465 | | 1,768,334 | | 1,516,737 | | (3,704 | ) | 479,497 | | 189,010 | | — | | 7,038,855 |
Vanguard Total International Bond Index Fund | | 2,676,627 | | 303,513 | | 128,513 | | (861 | ) | 225,305 | | 81,538 | | — | | 3,076,071 |
Vanguard Total International Stock Index Fund | | 4,634,461 | | 671,206 | | 161,901 | | (3,088 | ) | (177,542 | ) | 142,397 | | — | | 4,963,136 |
Vanguard Total Stock Market Index Fund | | 7,075,179 | | 1,322,087 | | 1,115,354 | | 40,637 | | 120,865 | | 137,918 | | — | | 7,443,414 |
Total | | 21,829,965 | | 4,644,042 | | 3,023,058 | | 32,985 | | 669,129 | | 579,085 | | — | | 24,160,403 |
1 | Not applicable—purchases and sales are for temporary cash investment purposes. |
G. Management has determined that no events or transactions occurred subsequent to September 30, 2019, that would require recognition or disclosure in these financial statements.
37
Institutional Target Retirement 2025 Fund
Performance Summary
All of the returns in this report represent past performance, which is not a guarantee of future results that may be achieved by the fund. (Current performance may be lower or higher than the performance data cited. For performance data current to the most recent month-end, visit our website at vanguard.com/performance.) Note, too, that both investment returns and principal value can fluctuate widely, so an investor’s shares, when sold, could be worth more or less than their original cost. The returns shown do not reflect taxes that a shareholder would pay on fund distributions or on the sale of fund shares.
Cumulative Performance: June 26, 2015, Through September 30, 2019
Initial Investment of $100,000,000
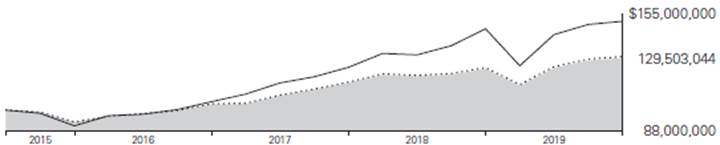
| | Average Annual Total Returns | | |
| | Periods Ended September 30, 2019 | | |
| | | Since | | Final Value |
| | One | Inception | | of a $100,000,000 |
| | Year | (6/26/2015) | | Investment |

| Institutional Target Retirement 2025 Fund | | 4.91% | 6.25% | | $129,503,044 |

| Target 2025 Composite Index | | 5.02 | 6.41 | | 130,345,578 |

| MSCI US Broad Market Index | | 2.91 | 10.06 | | 150,458,285 |
Target 2025 Composite Index: Derived by applying the fund’s target asset allocation to the results of the following benchmarks: for international stocks of developed markets, the MSCI EAFE Index through December 15, 2010, the MSCI ACWI ex USA IMI Index through June 2, 2013, and the FTSE Global All Cap ex US Index thereafter; for emerging-market stocks, the Select Emerging Markets Index through August 23, 2006, the MSCI Emerging Markets Index through December 15, 2010, the MSCI ACWI ex USA IMI Index through June 2, 2013, and the FTSE Global All Cap ex US Index thereafter; for U.S. bonds, the Bloomberg Barclays U.S. Aggregate Bond Index through December 31, 2009, and the Bloomberg Barclays U.S. Aggregate Float Adjusted Index thereafter; for international bonds, the Bloomberg Barclays Global Aggregate ex-USD Float Adjusted RIC Capped Index Hedged beginning June 3, 2013; and for U.S. stocks, the Dow Jones U.S. Total Stock Market Index (formerly known as the Dow Jones Wilshire 5000 Index) through April 22, 2005, the MSCI US Broad Market Index through June 2, 2013, and the CRSP US Total Market Index thereafter. International stock benchmark returns are adjusted for withholding taxes.
“Since Inception” performance is calculated from the fund’s inception date for both the fund and its comparative standards.
See Financial Highlights for dividend and capital gains information.
38
Institutional Target Retirement 2025 Fund
Underlying Vanguard Funds
As of September 30, 2019
Vanguard Total Stock Market Index Fund Institutional Shares | | 36.7% |
Vanguard Total Bond Market II Index Fund Investor Shares | | 27.2 |
Vanguard Total International Stock Index Fund Investor Shares | | 24.4 |
Vanguard Total International Bond Index Fund Admiral Shares | | 11.7 |
39
Institutional Target Retirement 2025 Fund
Financial Statements
Statement of Net Assets
As of September 30, 2019
The fund files its complete schedule of portfolio holdings with the Securities and Exchange Commission (SEC) for the first and third quarters of each fiscal year as an exhibit to its reports on Form N-PORT. The fund’s Form N-PORT reports are available on the SEC’s website at www.sec.gov.
| | | | Market | |
| | | | Value· | |
| | Shares | | ($000 | ) |
Investment Companies (100.0%) | | | | | |
U.S. Stock Fund (36.7%) | | | | | |
| Vanguard Total Stock Market Index Fund Institutional Shares | | 166,264,401 | | 12,222,096 | |
| | | | | |
International Stock Fund (24.4%) | | | | | |
| Vanguard Total International Stock Index Fund Investor Shares | | 490,781,505 | | 8,132,250 | |
| | | | | |
U.S. Bond Fund (27.2%) | | | | | |
1 | Vanguard Total Bond Market II Index Fund Investor Shares | | 819,046,246 | | 9,075,032 | |
| | | | | |
International Bond Fund (11.7%) | | | | | |
| Vanguard Total International Bond Index Fund Admiral Shares | | 166,358,304 | | 3,909,420 | |
Total Investment Companies (Cost $29,289,693) | | | | 33,338,798 | |
Temporary Cash Investment (0.0%) | | | | | |
Money Market Fund (0.0%) | | | | | |
1 | Vanguard Market Liquidity Fund, 2.098% (Cost $10,018) | | 100,168 | | 10,018 | |
Total Investments (100.0%) (Cost $29,299,711) | | | | 33,348,816 | |
Other Assets and Liabilities (0.0%) | | | | | |
Other Assets | | | | 187,353 | |
Liabilities | | | | (201,637 | ) |
| | | | (14,284 | ) |
Net Assets (100%) | | | | | |
Applicable to 1,385,002,271 outstanding $.001 par value shares of beneficial interest (unlimited authorization) | | | | 33,334,532 | |
Net Asset Value Per Share | | | | $24.07 | |
40
Institutional Target Retirement 2025 Fund
| | Amount | |
| | ($000 | ) |
Statement of Assets and Liabilities | | | |
Assets | | | |
Investments in Securities, at Value—Affiliated Funds | | 33,348,816 | |
Receivables for Investment Securities Sold | | 127,003 | |
Receivables for Accrued Income | | 22,562 | |
Receivables for Capital Shares Issued | | 37,788 | |
Total Assets | | 33,536,169 | |
Liabilities | | | |
Payables for Investment Securities Purchased | | 22,562 | |
Payables for Capital Shares Redeemed | | 179,075 | |
Total Liabilities | | 201,637 | |
Net Assets | | 33,334,532 | |
| | | |
| | | |
At September 30, 2019, net assets consisted of: | | | |
| | | |
| | Amount | |
| | ($000 | ) |
Paid-in Capital | | 28,780,298 | |
Total Distributable Earnings (Loss) | | 4,554,234 | |
Net Assets | | 33,334,532 | |
· See Note A in Notes to Financial Statements.
1 Affiliated fund available only to Vanguard funds and certain trusts and accounts managed by Vanguard. Rate shown for Vanguard Market Liquidity Fund is the 7-day yield.
See accompanying Notes, which are an integral part of the Financial Statements.
41
Institutional Target Retirement 2025 Fund
Statement of Operations
| | Year Ended | |
| | September 30, 2019 | |
| | ($000 | ) |
Investment Income | | | |
Income | | | |
Income Distributions Received from Affiliated Funds | | 767,992 | |
Net Investment Income—Note B | | 767,992 | |
Realized Net Gain (Loss) | | | |
Capital Gain Distributions Received from Affiliated Funds | | — | |
Affiliated Funds Sold | | 7,451 | |
Futures Contracts | | (39 | ) |
Realized Net Gain (Loss) | | 7,412 | |
Change in Unrealized Appreciation (Depreciation) From Affiliated Funds | | 864,318 | |
Net Increase (Decrease) in Net Assets Resulting from Operations | | 1,639,722 | |
See accompanying Notes, which are an integral part of the Financial Statements.
42
Institutional Target Retirement 2025 Fund
Statement of Changes in Net Assets
| | Year Ended September 30, | |
| | 2019 | | 2018 | |
| | ($000 | ) | ($000 | ) |
Increase (Decrease) in Net Assets | | | | | |
Operations | | | | | |
Net Investment Income | | 767,992 | | 578,823 | |
Realized Net Gain (Loss) | | 7,412 | | 16,238 | |
Change in Unrealized Appreciation (Depreciation) | | 864,318 | | 1,005,931 | |
Net Increase (Decrease) in Net Assets Resulting from Operations | | 1,639,722 | | 1,600,992 | |
Distributions | | | | | |
Net Investment Income | | (645,598 | ) | (458,573 | ) |
Realized Capital Gain1 | | (14,581 | ) | (4,467 | ) |
Total Distributions | | (660,179 | ) | (463,040 | ) |
Capital Share Transactions | | | | | |
Issued | | 6,425,739 | | 7,898,313 | |
Issued in Lieu of Cash Distributions | | 653,036 | | 456,899 | |
Redeemed | | (2,782,280 | ) | (3,044,748 | ) |
Net Increase (Decrease) from Capital Share Transactions | | 4,296,495 | | 5,310,464 | |
Total Increase (Decrease) | | 5,276,038 | | 6,448,416 | |
Net Assets | | | | | |
Beginning of Period | | 28,058,494 | | 21,610,078 | |
End of Period | | 33,334,532 | | 28,058,494 | |
1 Includes fiscal 2019 and 2018 short-term gain distributions totaling $13,478,000 and $3,350,000, respectively. Short-term gain distributions are treated as ordinary income dividends for tax purposes.
See accompanying Notes, which are an integral part of the Financial Statements.
43
Institutional Target Retirement 2025 Fund
Financial Highlights
| | | | | | | | | | June 26, | |
| | | | | | | | | | 20151 to | |
For a Share Outstanding | | Year Ended September 30, | | | Sept. 30, | |
Throughout Each Period | | 2019 | | 2018 | | 2017 | | 2016 | | 2015 | |
Net Asset Value, Beginning of Period | | $23.53 | | $22.46 | | $20.48 | | $18.65 | | $20.00 | |
Investment Operations | | | | | | | | | | | |
Net Investment Income2 | | .585 | | .528 | | .480 | | .452 | | .140 | |
Capital Gain Distributions Received2 | | — | | .001 | | .005 | | .006 | | — | |
Net Realized and Unrealized Gain (Loss) on Investments | | .494 | | .997 | | 1.895 | | 1.538 | | (1.490 | ) |
Total from Investment Operations | | 1.079 | | 1.526 | | 2.380 | | 1.996 | | (1.350 | ) |
Distributions | | | | | | | | | | | |
Dividends from Net Investment Income | | (.527 | ) | (.452 | ) | (.392 | ) | (.165 | ) | — | |
Distributions from Realized Capital Gains | | (.012 | ) | (.004 | ) | (.008 | ) | (.001 | ) | — | |
Total Distributions | | (.539 | ) | (.456 | ) | (.400 | ) | (.166 | ) | — | |
Net Asset Value, End of Period | | $24.07 | | $23.53 | | $22.46 | | $20.48 | | $18.65 | |
| | | | | | | | | | | |
Total Return | | 4.91% | | 6.85% | | 11.85% | | 10.76% | | -6.75% | |
| | | | | | | | | | | |
Ratios/Supplemental Data | | | | | | | | | | | |
Net Assets, End of Period (Millions) | | $33,335 | | $28,058 | | $21,610 | | $13,626 | | $5,362 | |
Ratio of Total Expenses to Average Net Assets | | — | | — | | — | | — | | — | |
Acquired Fund Fees and Expenses | | 0.09% | | 0.09% | | 0.09% | | 0.10% | | 0.10%3 | |
Ratio of Net Investment Income to Average Net Assets | | 2.54% | | 2.29% | | 2.27% | | 2.30% | | 2.52%3 | |
Portfolio Turnover Rate | | 9% | | 9% | | 4% | | 4% | | 1% | |
| | | | | | | | | | | | |
1 Inception.
2 Calculation based on average shares outstanding.
3 Annualized.
See accompanying Notes, which are an integral part of the Financial Statements.
44
Institutional Target Retirement 2025 Fund
Notes to Financial Statements
Vanguard Institutional Target Retirement 2025 Fund is registered under the Investment Company Act of 1940 as an open-end investment company, or mutual fund. The fund follows a balanced investment strategy by investing in selected Vanguard funds to achieve its targeted allocation of assets to U.S. and international stocks, and U.S. and international bonds. Financial statements and other information about each underlying fund are available on vanguard.com.
A. The following significant accounting policies conform to generally accepted accounting principles for U.S. investment companies. The fund consistently follows such policies in preparing its financial statements.
1. Security Valuation: Investments are valued at the net asset value of each underlying Vanguard fund determined as of the close of the New York Stock Exchange (generally 4 p.m., Eastern time) on the valuation date.
2. Futures Contracts: The fund uses stock and bond futures contracts to a limited extent, with the objectives of maintaining full exposure to the market and maintaining its target asset allocation. The primary risks associated with the use of futures contracts are imperfect correlation between changes in market values of investments held by the fund and the prices of futures contracts, and the possibility of an illiquid market. Counterparty risk involving futures is mitigated because a regulated clearinghouse is the counterparty instead of the clearing broker. To further mitigate counterparty risk, the fund trades futures contracts on an exchange, monitors the financial strength of its clearing brokers and clearinghouse, and has entered into clearing agreements with its clearing brokers. The clearinghouse imposes initial margin requirements to secure the fund’s performance and requires daily settlement of variation margin representing changes in the market value of each contract. Any assets pledged as initial margin for open contracts are noted in the Statement of Net Assets.
Futures contracts are valued at their quoted daily settlement prices. The notional amounts of the contracts are not recorded in the Statement of Net Assets. Fluctuations in the value of the contracts are recorded in the Statement of Assets and Liabilities as an asset (liability) and in the Statement of Operations as unrealized appreciation (depreciation) until the contracts are closed, when they are recorded as realized futures gains (losses).
During the year ended September 30, 2019, the fund’s average investments in long and short futures contracts represented less than 1% and 0% of net assets, respectively, based on the average of the notional amounts at each quarter-end during the period. The fund had no open futures contracts at September 30, 2019.
3. Federal Income Taxes: The fund intends to continue to qualify as a regulated investment company and distribute all of its taxable income. Management has analyzed the fund’s tax positions taken for all open federal income tax years (September 30, 2016-2019), and has concluded that no provision for federal income tax is required in the fund’s financial statements.
4. Distributions: Distributions to shareholders are recorded on the ex-dividend date. Distributions are determined on a tax basis and may differ from net investment income and realized capital gains for financial reporting purposes.
5. Credit Facility: The fund and certain other funds managed by The Vanguard Group (“Vanguard”) participate in a $4.3 billion committed credit facility provided by a syndicate of lenders pursuant to a credit agreement that may be renewed annually; each fund is individually liable for its borrowings,
45
Institutional Target Retirement 2025 Fund
if any, under the credit facility. Borrowings may be utilized for temporary and emergency purposes, and are subject to the fund’s regulatory and contractual borrowing restrictions. The participating funds are charged administrative fees and an annual commitment fee of 0.10% of the undrawn amount of the facility; these fees are allocated to the funds based on a method approved by the fund’s board of trustees and borne by the funds in which the fund invests (see Note B). Any borrowings under this facility bear interest at a rate based upon the higher of the one-month London Interbank Offered Rate, federal funds effective rate, or overnight bank funding rate plus an agreed-upon spread.
The fund had no borrowings outstanding at September 30, 2019, or at any time during the period then ended.
6. Other: Income and capital gain distributions received are recorded on the ex-dividend date. Security transactions are accounted for on the date securities are bought or sold. Costs used to determine realized gains (losses) on the sale of investment securities are those of the specific securities sold.
B. In accordance with the terms of a Funds’ Service Agreement (the “FSA”) between Vanguard and the fund, Vanguard furnishes to the fund investment advisory, corporate management, administrative, marketing, and distribution services at Vanguard’s cost of operations (as defined by the FSA). These costs of operations are allocated to the fund based on methods and guidelines approved by the board of trustees. The FSA provides that expenses otherwise allocable to Vanguard funds-of-funds may be reduced or eliminated to the extent of savings realized by the underlying Vanguard funds by virtue of being part of a fund-of-funds. Accordingly, all expenses for services provided by Vanguard to the fund and all other expenses incurred by the fund during the period ended September 30, 2019, were borne by the underlying Vanguard funds in which the fund invests. The fund’s trustees and officers are also trustees and officers, respectively, of the underlying Vanguard funds, as well as directors and employees, respectively, of Vanguard.
C. Various inputs may be used to determine the value of the fund’s investments. These inputs are summarized in three broad levels for financial statement purposes. The inputs or methodologies used to value securities are not necessarily an indication of the risk associated with investing in those securities.
Level 1—Quoted prices in active markets for identical securities.
Level 2—Other significant observable inputs (including quoted prices for similar securities, interest rates, prepayment speeds, credit risk, etc.).
Level 3—Significant unobservable inputs (including the fund’s own assumptions used to determine the fair value of investments). Any investments valued with significant unobservable inputs are noted on the Statement of Net Assets.
At September 30, 2019, 100% of the market value of the fund’s investments was determined based on Level 1 inputs.
46
Institutional Target Retirement 2025 Fund
D. Permanent differences between book-basis and tax-basis components of net assets are reclassified among capital accounts in the financial statements to reflect their tax character. These reclassifications have no effect on net assets or net asset value per share. As of period end, permanent differences primarily attributable to the accounting for distributions in connection with fund share redemptions were reclassified between the following accounts:
| | Amount | |
| | ($000 | ) |
Paid-in Capital | | 15,462 | |
Total Distributable Earnings (Loss) | | (15,462 | ) |
Temporary differences between book-basis and tax-basis components of total distributable earnings (loss) arise when certain items of income, gain, or loss are recognized in different periods for financial statement and tax purposes; these differences will reverse at some time in the future. The differences are primarily related to the tax deferral of losses on wash sales. As of period end, the tax-basis components of total distributable earnings (loss) are detailed in the table as follows:
| | Amount | |
| | ($000 | ) |
Undistributed Ordinary Income | | 505,129 | |
Undistributed Long-Term Gains | | — | |
Capital Loss Carryforwards (Non-expiring) | | — | |
Net Unrealized Gains (Losses) | | 4,049,105 | |
As of September 30, 2019, gross unrealized appreciation and depreciation for investments based on cost for U.S. federal income tax purposes were as follows:
| | Amount | |
| | ($000 | ) |
Tax Cost | | 29,299,711 | |
Gross Unrealized Appreciation | | 4,175,283 | |
Gross Unrealized Depreciation | | (126,178 | ) |
Net Unrealized Appreciation (Depreciation) | | 4,049,105 | |
E. Capital shares issued and redeemed were:
| | Year Ended September 30, | |
| | 2019 | | 2018 | |
| | Shares | | Shares | |
| | (000 | ) | (000 | ) |
Issued | | 281,963 | | 342,345 | |
Issued in Lieu of Cash Distributions | | 31,008 | | 19,952 | |
Redeemed | | (120,506 | ) | (132,010 | ) |
Net Increase (Decrease) in Shares Outstanding | | 192,465 | | 230,287 | |
47
Institutional Target Retirement 2025 Fund
At September 30, 2019, one shareholder was the record or beneficial owner of 34% of the fund’s net assets. If the shareholder were to redeem its investment in the fund, the redemption might lead to the realization of taxable capital gains.
F. Transactions during the period in affiliated underlying Vanguard funds were as follows:
| | | | Current Period Transactions | | | |
| | Sept. 30, | | | | Proceeds | | Realized | | | | | | | | Sept. 30, | |
| | 2018 | | | | from | | Net | | Change in | | | | Capital Gain | | 2019 | |
| | Market | | Purchases | | Securities | | Gain | | Unrealized | | | | Distributions | | Market | |
| | Value | | at Cost | | Sold | | (Loss | ) | App. (Dep. | ) | Income | | Received | | Value | |
| | ($000 | ) | ($000 | ) | ($000 | ) | ($000 | ) | ($000 | ) | ($000 | ) | ($000 | ) | ($000 | ) |
Vanguard Market Liquidity Fund | | 5 | | NA1 | | NA1 | | (1 | ) | — | | 179 | | — | | 10,018 | |
Vanguard Total Bond Market II Index Fund | | 7,360,128 | | 3,126,600 | | 2,001,195 | | (577 | ) | 590,076 | | 231,588 | | — | | 9,075,032 | |
Vanguard Total International Bond Index Fund | | 3,084,225 | | 681,253 | | 132,419 | | — | | 276,361 | | 96,792 | | — | | 3,909,420 | |
Vanguard Total International Stock Index Fund | | 7,003,894 | | 1,413,417 | | 12,502 | | (1,988 | ) | (270,571 | ) | 223,278 | | — | | 8,132,250 | |
Vanguard Total Stock Market Index Fund | | 10,592,853 | | 2,044,244 | | 693,470 | | 10,017 | | 268,452 | | 216,155 | | — | | 12,222,096 | |
Total | | 28,041,105 | | 7,265,514 | | 2,839,586 | | 7,451 | | 864,318 | | 767,992 | | — | | 33,348,816 | |
1 Not applicable—purchases and sales are for temporary cash investment purposes.
G. Management has determined that no events or transactions occurred subsequent to September 30, 2019, that would require recognition or disclosure in these financial statements.
48
Institutional Target Retirement 2030 Fund
Performance Summary
All of the returns in this report represent past performance, which is not a guarantee of future results that may be achieved by the fund. (Current performance may be lower or higher than the performance data cited. For performance data current to the most recent month-end, visit our website at vanguard.com/performance.) Note, too, that both investment returns and principal value can fluctuate widely, so an investor’s shares, when sold, could be worth more or less than their original cost. The returns shown do not reflect taxes that a shareholder would pay on fund distributions or on the sale of fund shares.
Cumulative Performance: June 26, 2015, Through September 30, 2019
Initial Investment of $100,000,000
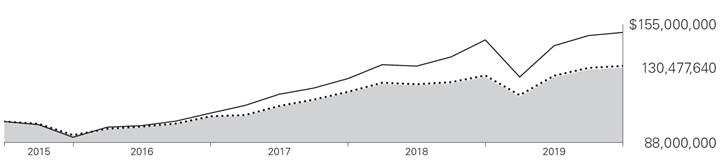
| | | | Average Annual Total Returns | | |
| | | | Periods Ended September 30, 2019 | | |
| | | | | | Since | | Final Value |
| | | | One | | Inception | | of a $100,000,000 |
| | | | Year | | (6/26/2015) | | Investment |

| | Institutional Target Retirement 2030 Fund | | 4.15% | | 6.44% | | $130,477,640 |

| | Target 2030 Composite Index | | 4.30 | | 6.63 | | 131,478,647 |

| | MSCI US Broad Market Index | | 2.91 | | 10.06 | | 150,458,285 |
Target 2030 Composite Index: Derived by applying the fund’s target asset allocation to the results of the following benchmarks: for international stocks of developed markets, the MSCI EAFE Index through December 15, 2010, the MSCI ACWI ex USA IMI Index through June 2, 2013, and the FTSE Global All Cap ex US Index thereafter; for emerging-market stocks, the Select Emerging Markets Index through August 23, 2006, the MSCI Emerging Markets Index through December 15, 2010, the MSCI ACWI ex USA IMI Index through June 2, 2013, and the FTSE Global All Cap ex US Index thereafter; for U.S. bonds, the Bloomberg Barclays U.S. Aggregate Bond Index through December 31, 2009, and the Bloomberg Barclays U.S. Aggregate Float Adjusted Index thereafter; for international bonds, the Bloomberg Barclays Global Aggregate ex-USD Float Adjusted RIC Capped Index Hedged beginning June 3, 2013; and for U.S. stocks, the MSCI US Broad Market Index through June 2, 2013, and the CRSP US Total Market Index thereafter. International stock benchmark returns are adjusted for withholding taxes.
“Since Inception” performance is calculated from the fund’s inception date for both the fund and its comparative standards.
See Financial Highlights for dividend and capital gains information.
49
Institutional Target Retirement 2030 Fund
Underlying Vanguard Funds
As of September 30, 2019
Vanguard Total Stock Market Index Fund Institutional Shares | | 41.3% |
Vanguard Total International Stock Index Fund Investor Shares | | 27.3 |
Vanguard Total Bond Market II Index Fund Investor Shares | | 22.0 |
Vanguard Total International Bond Index Fund Admiral Shares | | 9.4 |
50
Institutional Target Retirement 2030 Fund
Financial Statements
Statement of Net Assets
As of September 30, 2019
The fund files its complete schedule of portfolio holdings with the Securities and Exchange Commission (SEC) for the first and third quarters of each fiscal year as an exhibit to its reports on Form N-PORT. The fund’s Form N-PORT reports are available on the SEC’s website at www.sec.gov.
| | | | Market | |
| | | | Value· | |
| | Shares | | ($000 | ) |
Investment Companies (100.0%) | | | | | |
U.S. Stock Fund (41.3%) | | | | | |
Vanguard Total Stock Market Index Fund Institutional Shares | | 175,436,817 | | 12,896,361 | |
| | | | | |
International Stock Fund (27.3%) | | | | | |
Vanguard Total International Stock Index Fund Investor Shares | | 515,498,304 | | 8,541,807 | |
| | | | | |
U.S. Bond Fund (22.0%) | | | | | |
1 | Vanguard Total Bond Market II Index Fund Investor Shares | | 620,553,097 | | 6,875,728 | |
| | | | | |
International Bond Fund (9.4%) | | | | | |
Vanguard Total International Bond Index Fund Admiral Shares | | 125,634,814 | | 2,952,418 | |
Total Investment Companies (Cost $27,419,710) | | | | 31,266,314 | |
Temporary Cash Investment (0.1%) | | | | | |
Money Market Fund (0.1%) | | | | | |
1 | Vanguard Market Liquidity Fund, 2.098% (Cost $15,684) | | 156,825 | | 15,684 | |
Total Investments (100.1%) (Cost $27,435,394) | | | | 31,281,998 | |
Other Assets and Liabilities (-0.1%) | | | | | |
Other Assets | | | | 149,867 | |
Liabilities | | | | (192,204 | ) |
| | | | (42,337 | ) |
Net Assets (100%) | | | | | |
Applicable to 1,286,907,826 outstanding $.001 par value shares of beneficial interest (unlimited authorization) | | | | 31,239,661 | |
Net Asset Value Per Share | | | | $24.27 | |
51
Institutional Target Retirement 2030 Fund
| | Amount | |
| | ($000 | ) |
Statement of Assets and Liabilities | | | |
Assets | | | |
Investments in Securities, at Value—Affiliated Funds | | 31,281,998 | |
Receivables for Investment Securities Sold | | 93,205 | |
Receivables for Accrued Income | | 17,051 | |
Receivables for Capital Shares Issued | | 39,611 | |
Total Assets | | 31,431,865 | |
Liabilities | | | |
Payables for Investment Securities Purchased | | 17,051 | |
Payables for Capital Shares Redeemed | | 175,153 | |
Total Liabilities | | 192,204 | |
Net Assets | | 31,239,661 | |
| | | |
At September 30, 2019, net assets consisted of: | | | |
| | Amount | |
| | ($000 | ) |
Paid-in Capital | | 26,908,314 | |
Total Distributable Earnings (Loss) | | 4,331,347 | |
Net Assets | | 31,239,661 | |
· See Note A in Notes to Financial Statements.
1 Affiliated money market fund available only to Vanguard funds and certain trusts and accounts managed by Vanguard. Rate shown is the 7-day yield.
See accompanying Notes, which are an integral part of the Financial Statements.
52
Institutional Target Retirement 2030 Fund
Statement of Operations
| | Year Ended | |
| | September 30, 2019 | |
| | ($000 | ) |
Investment Income | | | |
Income | | | |
Income Distributions Received from Affiliated Funds | | 704,886 | |
Net Investment Income—Note B | | 704,886 | |
Realized Net Gain (Loss) | | | |
Capital Gain Distributions Received from Affiliated Funds | | — | |
Affiliated Funds Sold | | 6,327 | |
Futures Contracts | | (43 | ) |
Realized Net Gain (Loss) | | 6,284 | |
Change in Unrealized Appreciation (Depreciation) from Affiliated Funds | | 663,899 | |
Net Increase (Decrease) in Net Assets Resulting from Operations | | 1,375,069 | |
See accompanying Notes, which are an integral part of the Financial Statements.
53
Institutional Target Retirement 2030 Fund
Statement of Changes in Net Assets
| | Year Ended September 30, | |
| | 2019 | | 2018 | |
| | ($000 | ) | ($000 | ) |
Increase (Decrease) in Net Assets | | | | | |
Operations | | | | | |
Net Investment Income | | 704,886 | | 518,266 | |
Realized Net Gain (Loss) | | 6,284 | | 3,168 | |
Change in Unrealized Appreciation (Depreciation) | | 663,899 | | 1,088,192 | |
Net Increase (Decrease) in Net Assets Resulting from Operations | | 1,375,069 | | 1,609,626 | |
Distributions | | | | | |
Net Investment Income | | (594,299 | ) | (402,466 | ) |
Realized Capital Gain1 | | (3,593 | ) | (2,865 | ) |
Total Distributions | | (597,892 | ) | (405,331 | ) |
Capital Share Transactions | | | | | |
Issued | | 6,417,870 | | 7,621,180 | |
Issued in Lieu of Cash Distributions | | 590,618 | | 399,201 | |
Redeemed | | (2,365,021 | ) | (2,547,464 | ) |
Net Increase (Decrease) from Capital Share Transactions | | 4,643,467 | | 5,472,917 | |
Total Increase (Decrease) | | 5,420,644 | | 6,677,212 | |
Net Assets | | | | | |
Beginning of Period | | 25,819,017 | | 19,141,805 | |
End of Period | | 31,239,661 | | 25,819,017 | |
1 Includes fiscal 2019 and 2018 short-term gain distributions totaling $2,919,000 and $2,148,000, respectively. Short-term gain distributions are treated as ordinary income dividends for tax purposes.
See accompanying Notes, which are an integral part of the Financial Statements.
54
Institutional Target Retirement 2030 Fund
Financial Highlights
| | | | | June 26, |
| | | | | 20151 to |
For a Share Outstanding | Year Ended September 30, | | Sept. 30, |
Throughout Each Period | 2019 | 2018 | 2017 | 2016 | 2015 |
Net Asset Value, Beginning of Period | $23.89 | $22.61 | $20.36 | $18.45 | $20.00 |
Investment Operations | | | | | |
Net Investment Income2 | .582 | .531 | .485 | .455 | .145 |
Capital Gain Distributions Received2 | — | .001 | .004 | .004 | — |
Net Realized and Unrealized Gain (Loss) on Investments | .330 | 1.201 | 2.160 | 1.615 | (1.695) |
Total from Investment Operations | .912 | 1.733 | 2.649 | 2.074 | (1.550) |
Distributions | | | | | |
Dividends from Net Investment Income | (.529) | (.450) | (.393) | (.163) | — |
Distributions from Realized Capital Gains | (.003) | (.003) | (.006) | (.001) | — |
Total Distributions | (.532) | (.453) | (.399) | (.164) | — |
Net Asset Value, End of Period | $24.27 | $23.89 | $22.61 | $20.36 | $18.45 |
| | | | | |
Total Return | 4.15% | 7.73% | 13.27% | 11.30% | -7.75% |
| | | | | |
Ratios/Supplemental Data | | | | | |
Net Assets, End of Period (Millions) | $31,240 | $25,819 | $19,142 | $11,486 | $4,431 |
Ratio of Total Expenses to Average Net Assets | — | — | — | — | — |
Acquired Fund Fees and Expenses | 0.09% | 0.09% | 0.09% | 0.10% | 0.10%3 |
Ratio of Net Investment Income to Average Net Assets | 2.51% | 2.27% | 2.29% | 2.34% | 2.64%3 |
Portfolio Turnover Rate | 8% | 7% | 4% | 3% | 1% |
| | | | | | |
1 Inception.
2 Calculated based on average shares outstanding.
3 Annualized.
See accompanying Notes, which are an integral part of the Financial Statements.
55
Institutional Target Retirement 2030 Fund
Notes to Financial Statements
Vanguard Institutional Target Retirement 2030 Fund is registered under the Investment Company Act of 1940 as an open-end investment company, or mutual fund. The fund follows a balanced investment strategy by investing in selected Vanguard funds to achieve its targeted allocation of assets to U.S. and international stocks, and U.S. and international bonds. Financial statements and other information about each underlying fund are available on vanguard.com.
A. The following significant accounting policies conform to generally accepted accounting principles for U.S. investment companies. The fund consistently follows such policies in preparing its financial statements.
1. Security Valuation: Investments are valued at the net asset value of each underlying Vanguard fund determined as of the close of the New York Stock Exchange (generally 4 p.m., Eastern time) on the valuation date.
2. Futures Contracts: The fund uses stock and bond futures contracts to a limited extent, with the objectives of maintaining full exposure to the market and maintaining its target asset allocation. The primary risks associated with the use of futures contracts are imperfect correlation between changes in market values of investments held by the fund and the prices of futures contracts, and the possibility of an illiquid market. Counterparty risk involving futures is mitigated because a regulated clearinghouse is the counterparty instead of the clearing broker. To further mitigate counterparty risk, the fund trades futures contracts on an exchange, monitors the financial strength of its clearing brokers and clearinghouse, and has entered into clearing agreements with its clearing brokers. The clearinghouse imposes initial margin requirements to secure the fund’s performance and requires daily settlement of variation margin representing changes in the market value of each contract. Any assets pledged as initial margin for open contracts are noted in the Statement of Net Assets.
Futures contracts are valued at their quoted daily settlement prices. The notional amounts of the contracts are not recorded in the Statement of Net Assets. Fluctuations in the value of the contracts are recorded in the Statement of Assets and Liabilities as an asset (liability) and in the Statement of Operations as unrealized appreciation (depreciation) until the contracts are closed, when they are recorded as realized futures gains (losses).
During the year ended September 30, 2019, the fund’s average investments in long and short futures contracts each represented less than 1% and 0% of net assets, respectively, based on the average of the notional amounts at each quarter-end during the period. The fund had no open futures contracts at September 30, 2019.
3. Federal Income Taxes: The fund intends to continue to qualify as a regulated investment company and distribute all of its taxable income. Management has analyzed the fund’s tax positions taken for all open federal income tax years (September 30, 2016-2019), and has concluded that no provision for federal income tax is required in the fund’s financial statements.
4. Distributions: Distributions to shareholders are recorded on the ex-dividend date. Distributions are determined on a tax basis and may differ from net investment income and realized capital gains for financial reporting purposes.
5. Credit Facility: The fund and certain other funds managed by The Vanguard Group (“Vanguard”) participate in a $4.3 billion committed credit facility provided by a syndicate of lenders pursuant to a credit agreement that may be renewed annually; each fund is individually liable for its borrowings, if any, under the credit facility. Borrowings may be utilized for temporary and emergency purposes,
56
Institutional Target Retirement 2030 Fund
and are subject to the fund’s regulatory and contractual borrowing restrictions. The participating funds are charged administrative fees and an annual commitment fee of 0.10% of the undrawn amount of the facility; these fees are allocated to the funds based on a method approved by the fund’s board of trustees and borne by the funds in which the fund invests (see Note B). Any borrowings under this facility bear interest at a rate based upon the higher of the one-month London Interbank Offered Rate, federal funds effective rate, or overnight bank funding rate plus an agreed-upon spread.
The fund had no borrowings outstanding at September 30, 2019, or at any time during the period then ended.
6. Other: Income and capital gain distributions received are recorded on the ex-dividend date. Security transactions are accounted for on the date securities are bought or sold. Costs used to determine realized gains (losses) on the sale of investment securities are those of the specific securities sold.
B. In accordance with the terms of a Funds’ Service Agreement (the “FSA”) between Vanguard and the fund, Vanguard furnishes to the fund investment advisory, corporate management, administrative, marketing, and distribution services at Vanguard’s cost of operations (as defined by the FSA). These costs of operations are allocated to the fund based on methods and guidelines approved by the board of trustees. The FSA provides that expenses otherwise allocable to Vanguard funds-of-funds may be reduced or eliminated to the extent of savings realized by the underlying Vanguard funds by virtue of being part of a fund-of-funds. Accordingly, all expenses for services provided by Vanguard to the fund and all other expenses incurred by the fund during the period ended September 30, 2019, were borne by the underlying Vanguard funds in which the fund invests. The fund’s trustees and officers are also trustees and officers, respectively, of the underlying Vanguard funds, as well as directors and employees, respectively, of Vanguard.
C. Various inputs may be used to determine the value of the fund’s investments. These inputs are summarized in three broad levels for financial statement purposes. The inputs or methodologies used to value securities are not necessarily an indication of the risk associated with investing in those securities.
Level 1—Quoted prices in active markets for identical securities.
Level 2—Other significant observable inputs (including quoted prices for similar securities, interest rates, prepayment speeds, credit risk, etc.).
Level 3—Significant unobservable inputs (including the fund’s own assumptions used to determine the fair value of investments). Any investments valued with significant unobservable inputs are noted on the Statement of Net Assets.
At September 30, 2019, 100% of the market value of the fund’s investments was determined based on Level 1 inputs.
D. Permanent differences between book-basis and tax-basis components of net assets, if any, are reclassified among capital accounts in the financial statements to reflect their tax character. These reclassifications have no effect on net assets or net asset value per share.
57
Institutional Target Retirement 2030 Fund
Temporary differences between book-basis and tax-basis components of total distributable earnings (loss) arise when certain items of income, gain, or loss are recognized in different periods for financial statement and tax purposes; these differences will reverse at some time in the future. The differences are primarily related to the tax deferral of losses on wash sales. As of period end, the tax-basis components of total distributable earnings (loss) are detailed in the table as follows:
| | Amount | |
| | ($000 | ) |
Undistributed Ordinary Income | | 484,743 | |
Undistributed Long-Term Gains | | — | |
Capital Loss Carryforwards (Non-expiring) | | — | |
Net Unrealized Gains (Losses) | | 3,846,604 | |
As of September 30, 2019, gross unrealized appreciation and depreciation for investments based on cost for U.S. federal income tax purposes were as follows:
| | Amount | |
| | ($000 | ) |
Tax Cost | | 27,435,394 | |
Gross Unrealized Appreciation | | 3,997,087 | |
Gross Unrealized Depreciation | | (150,483 | ) |
Net Unrealized Appreciation (Depreciation) | | 3,846,604 | |
E. Capital shares issued and redeemed were:
| | Year Ended September 30, | |
| | 2019 | | 2018 | |
| | Shares | | Shares | |
| | (000 | ) | (000 | ) |
Issued | | 279,267 | | 326,284 | |
Issued in Lieu of Cash Distributions | | 27,952 | | 17,237 | |
Redeemed | | (101,098 | ) | (109,186 | ) |
Net Increase (Decrease) in Shares Outstanding | | 206,121 | | 234,335 | |
At September 30, 2019, one shareholder was the record or beneficial owner of 35% of the fund’s net assets. If the shareholder were to redeem its investment in the fund, the redemption might lead to the realization of taxable capital gains.
58
Institutional Target Retirement 2030 Fund
F. Transactions during the period in affiliated underlying Vanguard funds were as follows:
| | | | Current Period Transactions | | |
| | Sept. 30, | | | | Proceeds | | Realized | | | | | | | | Sept. 30, |
| | 2018 | | | | from | | Net | | Change in | | | | Capital Gain | | 2019 |
| | Market | | Purchases | | Securities | | Gain | | Unrealized | | | | Distributions | | Market |
| | Value | | at Cost | | Sold | | (Loss | ) | App. (Dep. | ) | Income | | Received | | Value |
| | ($000 | ) | ($000 | ) | ($000 | ) | ($000 | ) | ($000 | ) | ($000 | ) | ($000 | ) | ($000) |
Vanguard Market Liquidity Fund | | 1,144 | | NA1 | | NA1 | | 1 | | — | | 200 | | — | | 15,684 |
Vanguard Total Bond Market II Index Fund | | 5,444,802 | | 2,624,668 | | 1,638,153 | | (640 | ) | 445,051 | | 173,732 | | — | | 6,875,728 |
Vanguard Total International Bond Index Fund | | 2,255,025 | | 587,113 | | 97,774 | | — | | 208,054 | | 71,971 | | — | | 2,952,418 |
Vanguard Total International Stock Index Fund | | 7,206,991 | | 1,620,041 | | 3,624 | | 475 | | (282,076 | ) | 233,179 | | — | | 8,541,807 |
Vanguard Total Stock Market Index Fund | | 10,890,848 | | 2,231,135 | | 524,983 | | 6,491 | | 292,870 | | 225,804 | | — | | 12,896,361 |
Total | | 25,798,810 | | 7,062,957 | | 2,264,534 | | 6,327 | | 663,899 | | 704,886 | | — | | 31,281,998 |
1 Not applicable—purchases and sales are for temporary cash investment purposes.
G. Management has determined that no events or transactions occurred subsequent to September 30, 2019, that would require recognition or disclosure in these financial statements.
59
Institutional Target Retirement 2035 Fund
Performance Summary
All of the returns in this report represent past performance, which is not a guarantee of future results that may be achieved by the fund. (Current performance may be lower or higher than the performance data cited. For performance data current to the most recent month-end, visit our website at vanguard.com/performance.) Note, too, that both investment returns and principal value can fluctuate widely, so an investor’s shares, when sold, could be worth more or less than their original cost. The returns shown do not reflect taxes that a shareholder would pay on fund distributions or on the sale of fund shares.
Cumulative Performance: June 26, 2015, Through September 30, 2019
Initial Investment of $100,000,000

| | Average Annual Total Returns | |
| | Periods Ended September 30, 2019 | |
| | | Since | Final Value |
| | One | Inception | of a $100,000,000 |
| | Year | (6/26/2015) | Investment |

| Institutional Target Retirement 2035 Fund | 3.45% | 6.64% | $131,554,684 |

| Target 2035 Composite Index | 3.57 | 6.84 | 132,566,412 |

| MSCI US Broad Market Index | 2.91 | 10.06 | 150,458,285 |
Target 2035 Composite Index: Derived by applying the fund’s target asset allocation to the results of the following benchmarks: for international stocks of developed markets, the MSCI EAFE Index through December 15, 2010, the MSCI ACWI ex USA IMI Index through June 2, 2013, and the FTSE Global All Cap ex US Index thereafter; for emerging-market stocks, the Select Emerging Markets Index through August 23, 2006, the MSCI Emerging Markets Index through December 15, 2010, the MSCI ACWI ex USA IMI Index through June 2, 2013, and the FTSE Global All Cap ex US Index thereafter; for U.S. bonds, the Bloomberg Barclays U.S. Aggregate Bond Index through December 31, 2009, and the Bloomberg Barclays U.S. Aggregate Float Adjusted Index thereafter; for international bonds, the Bloomberg Barclays Global Aggregate ex-USD Float Adjusted RIC Capped Index Hedged beginning June 3, 2013; and for U.S. stocks, the Dow Jones U.S. Total Stock Market Index (formerly known as the Dow Jones Wilshire 5000 Index) through April 22, 2005, the MSCI US Broad Market Index through June 2, 2013, and the CRSP US Total Market Index thereafter. International stock benchmark returns are adjusted for withholding taxes.
“Since Inception” performance is calculated from the fund’s inception date for both the fund and its comparative standards.
See Financial Highlights for dividend and capital gains information.
60
Institutional Target Retirement 2035 Fund
Underlying Vanguard Funds
As of September 30, 2019
Vanguard Total Stock Market Index Fund Institutional Shares | 45.6% |
Vanguard Total International Stock Index Fund Investor Shares | 30.3 |
Vanguard Total Bond Market II Index Fund Investor Shares | 16.9 |
Vanguard Total International Bond Index Fund Admiral Shares | 7.2 |
61
Institutional Target Retirement 2035 Fund
Financial Statements
Statement of Net Assets
As of September 30, 2019
The fund files its complete schedule of portfolio holdings with the Securities and Exchange Commission (SEC) for the first and third quarters of each fiscal year as an exhibit to its reports on Form N-PORT. The fund’s Form N-PORT reports are available on the SEC’s website at www.sec.gov.
| | | | | Market |
| | | | | Value· |
| | | Shares | | ($000) |
Investment Companies (100.0%) | | | | |
U.S. Stock Fund (45.6%) | | | | |
| Vanguard Total Stock Market Index Fund Institutional Shares | | 177,312,551 | | 13,034,246 |
| | | | | |
International Stock Fund (30.3%) | | | | |
| Vanguard Total International Stock Index Fund Investor Shares | | 522,764,207 | | 8,662,203 |
| | | | | |
U.S. Bond Fund (16.9%) | | | | |
1 | Vanguard Total Bond Market II Index Fund Investor Shares | | 436,334,233 | | 4,834,583 |
| | | | | |
International Bond Fund (7.2%) | | | | |
| Vanguard Total International Bond Index Fund Admiral Shares | | 87,613,114 | | 2,058,908 |
Total Investment Companies (Cost $24,866,098) | | | | 28,589,940 |
Temporary Cash Investment (0.1%) | | | | |
Money Market Fund (0.1%) | | | | |
1 | Vanguard Market Liquidity Fund, 2.098% (Cost $11,647) | | 116,454 | | 11,647 |
Total Investments (100.1%) (Cost $24,877,745) | | | | 28,601,587 |
Other Assets and Liabilities (-0.1%) | | | | |
Other Assets | | | | 139,052 |
Liabilities | | | | (156,159) |
| | | | | (17,107) |
Net Assets (100%) | | | | |
Applicable to 1,168,338,126 outstanding $.001 par value shares of beneficial interest (unlimited authorization) | | | | 28,584,480 |
Net Asset Value Per Share | | | | $24.47 |
62
Institutional Target Retirement 2035 Fund
| | | | Amount |
| | | | ($000) |
Statement of Assets and Liabilities | | | | |
Assets | | | | |
Investments in Securities, at Value—Affiliated Funds | | | | 28,601,587 |
Receivables for Investment Securities Sold | | | | 95,943 |
Receivables for Accrued Income | | | | 11,912 |
Receivables for Capital Shares Issued | | | | 31,197 |
Total Assets | | | | 28,740,639 |
Liabilities | | | | |
Payables for Investment Securities Purchased | | | | 11,912 |
Payables for Capital Shares Redeemed | | | | 144,247 |
Total Liabilities | | | | 156,159 |
Net Assets | | | | 28,584,480 |
| | | | |
| | | | |
At September 30, 2019, net assets consisted of: | | | | |
| | | | Amount |
| | | | ($000) |
Paid-in Capital | | | | 24,428,528 |
Total Distributable Earnings (Loss) | | | | 4,155,952 |
Net Assets | | | | 28,584,480 |
· See Note A in Notes to Financial Statements.
1 Affiliated fund available only to Vanguard funds and certain trusts and accounts managed by Vanguard. Rate shown for Vanguard Market Liquidity Fund is the 7-day yield.
See accompanying Notes, which are an integral part of the Financial Statements.
63
Institutional Target Retirement 2035 Fund
Statement of Operations
| | Year Ended |
| | September 30, 2019 |
| | ($000) |
Investment Income | | |
Income | | |
Income Distributions Received from Affiliated Funds | | 634,079 |
Net Investment Income—Note B | | 634,079 |
Realized Net Gain (Loss) | | |
Capital Gain Distributions Received from Affiliated Funds | | — |
Affiliated Funds Sold | | (2,426) |
Futures Contracts | | (38) |
Realized Net Gain (Loss) | | (2,464) |
Change in Unrealized Appreciation (Depreciation) from Affiliated Funds | | 444,387 |
Net Increase (Decrease) in Net Assets Resulting from Operations | | 1,076,002 |
See accompanying Notes, which are an integral part of the Financial Statements.
64
Institutional Target Retirement 2035 Fund
Statement of Changes in Net Assets
| | Year Ended September 30, | |
| | 2019 | | 2018 | |
| | ($000 | ) | ($000 | ) |
Increase (Decrease) in Net Assets | | | | | |
Operations | | | | | |
Net Investment Income | | 634,079 | | 473,598 | |
Realized Net Gain (Loss) | | (2,464 | ) | 3,183 | |
Change in Unrealized Appreciation (Depreciation) | | 444,387 | | 1,161,459 | |
Net Increase (Decrease) in Net Assets Resulting from Operations | | 1,076,002 | | 1,638,240 | |
Distributions | | | | | |
Net Investment Income | | (535,746 | ) | (370,634 | ) |
Realized Capital Gain1 | | (4,869 | ) | (2,936 | ) |
Total Distributions | | (540,615 | ) | (373,570 | ) |
Capital Share Transactions | | | | | |
Issued | | 5,824,878 | | 7,041,221 | |
Issued in Lieu of Cash Distributions | | 534,790 | | 368,487 | |
Redeemed | | (2,072,971 | ) | (2,487,936 | ) |
Net Increase (Decrease) from Capital Share Transactions | | 4,286,697 | | 4,921,772 | |
Total Increase (Decrease) | | 4,822,084 | | 6,186,442 | |
Net Assets | | | | | |
Beginning of Period | | 23,762,396 | | 17,575,954 | |
End of Period | | 28,584,480 | | 23,762,396 | |
1 Includes fiscal 2019 and 2018 short-term gain distributions totaling $4,565,000 and $2,446,000, respectively. Short-term gain distributions are treated as ordinary income dividends for tax purposes.
See accompanying Notes, which are an integral part of the Financial Statements.
65
Institutional Target Retirement 2035 Fund
Financial Highlights
| | | | | | | | | | June 26, | |
| | | | | | | | | | 20151 to | |
For a Share Outstanding | | Year Ended September 30, | | | Sept. 30, | |
Throughout Each Period | | 2019 | | 2018 | | 2017 | | 2016 | | 2015 | |
Net Asset Value, Beginning of Period | | $24.25 | | $22.78 | | $20.23 | | $18.27 | | $20.00 | |
Investment Operations | | | | | | | | | | | |
Net Investment Income2 | | .579 | | .533 | | .489 | | .457 | | .142 | |
Capital Gain Distributions Received2 | | — | | .001 | | .003 | | .003 | | — | |
Net Realized and Unrealized Gain (Loss) on Investments | | .174 | | 1.394 | | 2.457 | | 1.664 | | (1.872 | ) |
Total from Investment Operations | | .753 | | 1.928 | | 2.949 | | 2.124 | | (1.730 | ) |
Distributions | | | | | | | | | | | |
Dividends from Net Investment Income | | (.528 | ) | (.454 | ) | (.394 | ) | (.164 | ) | — | |
Distributions from Realized Capital Gains | | (.005 | ) | (.004 | ) | (.005 | ) | — | | — | |
Total Distributions | | (.533 | ) | (.458 | ) | (.399 | ) | (.164 | ) | — | |
Net Asset Value, End of Period | | $24.47 | | $24.25 | | $22.78 | | $20.23 | | $18.27 | |
| | | | | | | | | | | |
Total Return | | 3.45% | | 8.54% | | 14.85% | | 11.68% | | -8.65% | |
| | | | | | | | | | | |
Ratios/Supplemental Data | | | | | | | | | | | |
Net Assets, End of Period (Millions) | | $28,584 | | $23,762 | | $17,576 | | $10,702 | | $4,037 | |
Ratio of Total Expenses to Average Net Assets | | — | | — | | — | | — | | — | |
Acquired Fund Fees and Expenses | | 0.09% | | 0.09% | | 0.09% | | 0.10% | | 0.10%3 | |
Ratio of Net Investment Income to Average Net Assets | | 2.47% | | 2.25% | | 2.30% | | 2.37% | | 2.62%3 | |
Portfolio Turnover Rate | | 7% | | 8% | | 4% | | 2% | | 0% | |
| | | | | | | | | | | | |
1 Inception.
2 Calculated based on average shares outstanding.
3 Annualized.
See accompanying Notes, which are an integral part of the Financial Statements.
66
Institutional Target Retirement 2035 Fund
Notes to Financial Statements
Vanguard Institutional Target Retirement 2035 Fund is registered under the Investment Company Act of 1940 as an open-end investment company, or mutual fund. The fund follows a balanced investment strategy by investing in selected Vanguard funds to achieve its targeted allocation of assets to U.S. and international stocks, and U.S. and international bonds. Financial statements and other information about each underlying fund are available on vanguard.com.
A. The following significant accounting policies conform to generally accepted accounting principles for U.S. investment companies. The fund consistently follows such policies in preparing its financial statements.
1. Security Valuation: Investments are valued at the net asset value of each underlying Vanguard fund determined as of the close of the New York Stock Exchange (generally 4 p.m., Eastern time) on the valuation date.
2. Futures Contracts: The fund uses stock and bond futures contracts to a limited extent, with the objectives of maintaining full exposure to the market and maintaining its target asset allocation. The primary risks associated with the use of futures contracts are imperfect correlation between changes in market values of investments held by the fund and the prices of futures contracts, and the possibility of an illiquid market. Counterparty risk involving futures is mitigated because a regulated clearinghouse is the counterparty instead of the clearing broker. To further mitigate counterparty risk, the fund trades futures contracts on an exchange, monitors the financial strength of its clearing brokers and clearinghouse, and has entered into clearing agreements with its clearing brokers. The clearinghouse imposes initial margin requirements to secure the fund’s performance and requires daily settlement of variation margin representing changes in the market value of each contract. Any assets pledged as initial margin for open contracts are noted in the Statement of Net Assets.
Futures contracts are valued at their quoted daily settlement prices. The notional amounts of the contracts are not recorded in the Statement of Net Assets. Fluctuations in the value of the contracts are recorded in the Statement of Assets and Liabilities as an asset (liability) and in the Statement of Operations as unrealized appreciation (depreciation) until the contracts are closed, when they are recorded as realized futures gains (losses).
During the year ended September 30, 2019, the fund’s average investments in long and short futures contracts represented less than 1% and 0% of net assets, respectively, based on the average of the notional amounts at each quarter-end during the period. The fund had no open futures contracts at September 30, 2019.
3. Federal Income Taxes: The fund intends to continue to qualify as a regulated investment company and distribute all of its taxable income. Management has analyzed the fund’s tax positions taken for all open federal income tax years (September 30, 2016-2019), and has concluded that no provision for federal income tax is required in the fund’s financial statements.
4. Distributions: Distributions to shareholders are recorded on the ex-dividend date. Distributions are determined on a tax basis and may differ from net investment income and realized capital gains for financial reporting purposes.
5. Credit Facility: The fund and certain other funds managed by The Vanguard Group (“Vanguard”) participate in a $4.3 billion committed credit facility provided by a syndicate of lenders pursuant to a credit agreement that may be renewed annually; each fund is individually liable for its borrowings,
67
Institutional Target Retirement 2035 Fund
if any, under the credit facility. Borrowings may be utilized for temporary and emergency purposes, and are subject to the fund’s regulatory and contractual borrowing restrictions. The participating funds are charged administrative fees and an annual commitment fee of 0.10% of the undrawn amount of the facility; these fees are allocated to the funds based on a method approved by the fund’s board of trustees and borne by the funds in which the fund invests (see Note B). Any borrowings under this facility bear interest at a rate based upon the higher of the one-month London Interbank Offered Rate, federal funds effective rate, or overnight bank funding rate plus an agreed-upon spread.
The fund had no borrowings outstanding at September 30, 2019, or at any time during the period then ended.
6. Other: Income and capital gain distributions received are recorded on the ex-dividend date. Security transactions are accounted for on the date securities are bought or sold. Costs used to determine realized gains (losses) on the sale of investment securities are those of the specific securities sold.
B. In accordance with the terms of a Funds’ Service Agreement (the “FSA”) between Vanguard and the fund, Vanguard furnishes to the fund investment advisory, corporate management, administrative, marketing, and distribution services at Vanguard’s cost of operations (as defined by the FSA). These costs of operations are allocated to the fund based on methods and guidelines approved by the board of trustees. The FSA provides that expenses otherwise allocable to Vanguard funds-of-funds may be reduced or eliminated to the extent of savings realized by the underlying Vanguard funds by virtue of being part of a fund-of-funds. Accordingly, all expenses for services provided by Vanguard to the fund and all other expenses incurred by the fund during the period ended September 30, 2019, were borne by the underlying Vanguard funds in which the fund invests. The fund’s trustees and officers are also trustees and officers, respectively, of the underlying Vanguard funds, as well as directors and employees, respectively, of Vanguard.
C. Various inputs may be used to determine the value of the fund’s investments. These inputs are summarized in three broad levels for financial statement purposes. The inputs or methodologies used to value securities are not necessarily an indication of the risk associated with investing in those securities.
Level 1—Quoted prices in active markets for identical securities.
Level 2—Other significant observable inputs (including quoted prices for similar securities, interest rates, prepayment speeds, credit risk, etc.).
Level 3—Significant unobservable inputs (including the fund’s own assumptions used to determine the fair value of investments). Any investments valued with significant unobservable inputs are noted on the Statement of Net Assets.
At September 30, 2019, 100% of the market value of the fund’s investments was determined based on Level 1 inputs.
D. Permanent differences between book-basis and tax-basis components of net assets, if any, are reclassified among capital accounts in the financial statements to reflect their tax character. These reclassifications have no effect on net assets or net asset value per share.
68
Institutional Target Retirement 2035 Fund
Temporary differences between book-basis and tax-basis components of total distributable earnings (loss) arise when certain items of income, gain, or loss are recognized in different periods for financial statement and tax purposes; these differences will reverse at some time in the future. The differences are primarily related to the tax deferral of losses on wash sales. As of period end, the tax-basis components of total distributable earnings (loss) are detailed in the table as follows:
| | Amount | |
| | ($000 | ) |
Undistributed Ordinary Income | | 437,194 | |
Undistributed Long-Term Gains | | — | |
Capital Loss Carryforwards (Non-expiring) | | — | |
Net Unrealized Gains (Losses) | | 3,718,758 | |
As of September 30, 2019, gross unrealized appreciation and depreciation for investments based on cost for U.S. federal income tax purposes were as follows:
| | Amount | |
| | ($000 | ) |
Tax Cost | | 24,882,829 | |
Gross Unrealized Appreciation | | 3,882,513 | |
Gross Unrealized Depreciation | | (163,755 | ) |
Net Unrealized Appreciation (Depreciation) | | 3,718,758 | |
E. Capital shares issued and redeemed were:
| | Year Ended September 30, | |
| | 2019 | | 2018 | |
| | Shares | | Shares | |
| | (000 | ) | (000 | ) |
Issued | | 251,112 | | 297,648 | |
Issued in Lieu of Cash Distributions | | 25,250 | | 15,734 | |
Redeemed | | (87,855 | ) | (105,226 | ) |
Net Increase (Decrease) in Shares Outstanding | | 188,507 | | 208,156 | |
At September 30, 2019, one shareholder was the record or beneficial owner of 33% of the fund’s net assets. If the shareholder were to redeem its investment in the fund, the redemption might lead to the realization of taxable capital gains.
69
Institutional Target Retirement 2035 Fund
F. Transactions during the period in affiliated underlying Vanguard funds were as follows:
| | | | Current Period Transactions | | | |
| | Sept. 30, | | | | Proceeds | | Realized | | | | | | | | Sept. 30, | |
| | 2018 | | | | from | | Net | | Change in | | | | Capital Gain | | 2019 | |
| | Market | | Purchases | | Securities | | Gain | | Unrealized | | | | Distributions | | Market | |
| | Value | | at Cost | | Sold | | (Loss | ) | App. (Dep. | ) | Income | | Received | | Value | |
| | ($000 | ) | ($000 | ) | ($000 | ) | ($000 | ) | ($000 | ) | ($000 | ) | ($000 | ) | ($000 | ) |
Vanguard Market Liquidity Fund | | 4 | | NA1 | | NA1 | | 2 | | — | | 177 | | — | | 11,647 | |
Vanguard Total Bond Market II Index Fund | | 3,759,511 | | 1,952,640 | | 1,185,834 | | (1,343 | ) | 309,609 | | 120,701 | | — | | 4,834,583 | |
Vanguard Total International Bond Index Fund | | 1,556,304 | | 427,336 | | 68,897 | | 22 | | 144,143 | | 49,478 | | — | | 2,058,908 | |
Vanguard Total International Stock Index Fund | | 7,344,889 | | 1,640,457 | | 27,943 | | (3,016 | ) | (292,184 | ) | 235,638 | | — | | 8,662,203 | |
Vanguard Total Stock Market Index Fund | | 11,084,774 | | 2,089,395 | | 424,651 | | 1,909 | | 282,819 | | 228,085 | | — | | 13,034,246 | |
Total | | 23,745,482 | | 6,109,828 | | 1,707,325 | | (2,426 | ) | 444,387 | | 634,079 | | — | | 28,601,587 | |
1 Not applicable—purchases and sales are for temporary cash investment purposes.
G. Management has determined that no events or transactions occurred subsequent to September 30, 2019, that would require recognition or disclosure in these financial statements.
70
Report of Independent Registered Public Accounting Firm
To the Board of Trustees of Vanguard Chester Funds and Shareholders of Vanguard Institutional Target Retirement Income Fund, Vanguard Institutional Target Retirement 2015 Fund, Vanguard Institutional Target Retirement 2020 Fund, Vanguard Institutional Target Retirement 2025 Fund, Vanguard Institutional Target Retirement 2030 Fund and Vanguard Institutional Target Retirement 2035 Fund
Opinions on the Financial Statements
We have audited the accompanying statements of net assets and statements of assets and liabilities of Vanguard Institutional Target Retirement Income Fund, Vanguard Institutional Target Retirement 2015 Fund, Vanguard Institutional Target Retirement 2020 Fund, Vanguard Institutional Target Retirement 2025 Fund, Vanguard Institutional Target Retirement 2030 Fund and Vanguard Institutional Target Retirement 2035 Fund (six of the funds constituting Vanguard Chester Funds, hereafter collectively referred to as the “Funds”) as of September 30, 2019, the related statements of operations for the year ended September 30, 2019, the statements of changes in net assets for each of the two years in the period ended September 30, 2019, including the related notes, and the financial highlights for each of the periods indicated therein (collectively referred to as the “financial statements”). In our opinion, the financial statements present fairly, in all material respects, the financial position of each of the Funds as of September 30, 2019, the results of each of their operations for the year then ended, the changes in each of their net assets for each of the two years in the period ended September 30, 2019 and each of the financial highlights for each of the periods indicated therein in conformity with accounting principles generally accepted in the United States of America.
Basis for Opinions
These financial statements are the responsibility of the Funds’ management. Our responsibility is to express an opinion on the Funds’ financial statements based on our audits. We are a public accounting firm registered with the Public Company Accounting Oversight Board (United States) (“PCAOB”) and are required to be independent with respect to the Funds in accordance with the U.S. federal securities laws and the applicable rules and regulations of the Securities and Exchange Commission and the PCAOB.
We conducted our audits of these financial statements in accordance with the standards of the PCAOB. Those standards require that we plan and perform the audit to obtain reasonable assurance about whether the financial statements are free of material misstatement, whether due to error or fraud.
Our audits included performing procedures to assess the risks of material misstatement of the financial statements, whether due to error or fraud, and performing procedures that respond to those risks. Such procedures included examining, on a test basis, evidence regarding the amounts and disclosures in the financial statements. Our audits also included evaluating the accounting principles used and significant estimates made by management, as well as evaluating the overall presentation of the financial statements. Our procedures included confirmation of securities owned as of September 30, 2019 by correspondence with the transfer agent. We believe that our audits provide a reasonable basis for our opinions.
/s/PricewaterhouseCoopers LLP
Philadelphia, Pennsylvania
November 13, 2019
We have served as the auditor of one or more investment companies in The Vanguard Group of Funds since 1975.
71
|
Special 2019 tax information (unaudited) for Vanguard Institutional Target Retirement Funds |
This information for the fiscal year ended September 30, 2019, is included pursuant to provisions of the Internal Revenue Code.
The funds distributed capital gain dividends (20% rate gain distributions) to shareholders during the fiscal year as follows:
Fund | | ($000 | ) |
Institutional Target Retirement Income Fund | | 1,628 | |
Institutional Target Retirement 2015 Fund | | 49,495 | |
Institutional Target Retirement 2020 Fund | | 1,091 | |
Institutional Target Retirement 2025 Fund | | 1,111 | |
Institutional Target Retirement 2030 Fund | | 680 | |
Institutional Target Retirement 2035 Fund | | 267 | |
For nonresident alien shareholders, 100% of short-term capital gain dividends distributed by the funds are qualified short-term capital gains.
The funds distributed qualified dividend income to shareholders during the fiscal year as follows:
Fund | | ($000 | ) |
Institutional Target Retirement Income Fund | | 36,006 | |
Institutional Target Retirement 2015 Fund | | 61,645 | |
Institutional Target Retirement 2020 Fund | | 213,265 | |
Institutional Target Retirement 2025 Fund | | 320,985 | |
Institutional Target Retirement 2030 Fund | | 336,703 | |
Institutional Target Retirement 2035 Fund | | 342,157 | |
For corporate shareholders, the percentage of investment income (dividend income plus short-term gains, if any) that qualifies for the dividends-received deduction is as follows:
Fund | | Percentage | |
Institutional Target Retirement Income Fund | | 11.8% | |
Institutional Target Retirement 2015 Fund | | 14.2 | |
Institutional Target Retirement 2020 Fund | | 19.9 | |
Institutional Target Retirement 2025 Fund | | 38.6 | |
Institutional Target Retirement 2030 Fund | | 27.9 | |
Institutional Target Retirement 2035 Fund | | 31.5 | |
72
The funds designate to shareholders foreign source income and foreign taxes paid as follows:
| | Foreign Source Income | | Foreign Taxes Paid | |
Fund | | ($000 | ) | ($000 | ) |
Institutional Target Retirement Income Fund | | 50,519 | | 1,780 | |
Institutional Target Retirement 2015 Fund | | 77,409 | | 3,215 | |
Institutional Target Retirement 2020 Fund | | 235,527 | | 11,609 | |
Institutional Target Retirement 2025 Fund | | 337,886 | | 18,141 | |
Institutional Target Retirement 2030 Fund | | 323,720 | | 18,888 | |
Institutional Target Retirement 2035 Fund | | 303,919 | | 19,041 | |
Shareholders will receive more detailed information with their Form 1099-DIV in January 2020 to determine the calendar-year amounts to be included on their 2019 tax returns.
73
BLOOMBERG is a trademark and service mark of Bloomberg Finance L.P. BARCLAYS is a trademark and service mark of Barclays Bank Plc, used under license. Bloomberg Finance L.P. and its affiliates, including Bloomberg Index Services Limited (BISL) (collectively, Bloomberg), or Bloomberg’s licensors, own all proprietary rights in the Bloomberg Barclays U.S. Aggregate Bond Index, Bloomberg Barclays U.S. Aggregate Float Adjusted Index, Bloomberg Barclays U.S. Treasury Inflation Protected Securities Index, Bloomberg Barclays U.S. Treasury Inflation-Protected Securities (TIPS) 0–5 Year Index, and the Bloomberg Barclays Global Aggregate ex-USD Float Adjusted RIC Capped Index (USD Hedged) (the Indices or Bloomberg Barclays Indices).
Neither Barclays Bank Plc, Barclays Capital Inc., or any affiliate (collectively Barclays) or Bloomberg is the issuer or producer of the Institutional Target Retirement Funds (including the Total Bond Market II Index Fund, the Total International Bond Index Fund, and the Short-Term Inflation-Protected Securities Index Fund) and neither Bloomberg nor Barclays has any responsibilities, obligations or duties to investors in the Institutional Target Retirement Funds. The Indices are licensed for use by The Vanguard Group, Inc. (Vanguard) as the sponsor of the Institutional Target Retirement Funds. Bloomberg and Barclays’ only relationship with Vanguard in respect to the Indices is the licensing of the Indices, which is determined, composed and calculated by BISL, or any successor thereto, without regard to the Issuer or the Institutional Target Retirement Funds or the owners of the Institutional Target Retirement Funds.
Additionally, Vanguard may for itself execute transaction(s) with Barclays in or relating to the Indices in connection with the Institutional Target Retirement Funds. Investors acquire the Institutional Target Retirement Funds from Vanguard and investors neither acquire any interest in the Indices nor enter into any relationship of any kind whatsoever with Bloomberg or Barclays upon making an investment in the Institutional Target Retirement Funds. The Institutional Target Retirement Funds are not sponsored, endorsed, sold or promoted by Bloomberg or Barclays. Neither Bloomberg nor Barclays makes any representation or warranty, express or implied regarding the advisability of investing in the Institutional Target Retirement Funds or the advisability of investing in securities generally or the ability of the Indices to track corresponding or relative market performance. Neither Bloomberg nor Barclays has passed on the legality or suitability of the Institutional Target Retirement Funds with respect to any person or entity. Neither Bloomberg nor Barclays is responsible for and has not participated in the determination of the timing of, prices at, or quantities of the Institutional Target Retirement Funds to be issued. Neither Bloomberg nor Barclays has any obligation to take the needs of the Issuer or the owners of the Institutional Target Retirement Funds or any other third party into consideration in determining, composing or calculating the Indices. Neither Bloomberg nor Barclays has any obligation or liability in connection with administration, marketing or trading of the Institutional Target Retirement Funds.
74
The licensing agreement between Bloomberg and Barclays is solely for the benefit of Bloomberg and Barclays and not for the benefit of the owners of the Institutional Target Retirement Funds, investors or other third parties. In addition, the licensing agreement between Vanguard and Bloomberg is solely for the benefit of Vanguard and Bloomberg and not for the benefit of the owners of the Institutional Target Retirement Funds, investors or other third parties.
NEITHER BLOOMBERG NOR BARCLAYS SHALL HAVE ANY LIABILITY TO THE ISSUER, INVESTORS OR TO OTHER THIRD PARTIES FOR THE QUALITY, ACCURACY AND/OR COMPLETENESS OF THE BLOOMBERG BARCLAYS INDICES OR ANY DATA INCLUDED THEREIN OR FOR INTERRUPTIONS IN THE DELIVERY OF THE BLOOMBERG BARCLAYS INDICES. NEITHER BLOOMBERG NOR BARCLAYS MAKES ANY WARRANTY, EXPRESS OR IMPLIED, AS TO RESULTS TO BE OBTAINED BY THE ISSUER, THE INVESTORS OR ANY OTHER PERSON OR ENTITY FROM THE USE OF THE BLOOMBERG BARCLAYS INDICES OR ANY DATA INCLUDED THEREIN. NEITHER BLOOMBERG NOR BARCLAYS MAKES ANY EXPRESS OR IMPLIED WARRANTIES, AND EACH HEREBY EXPRESSLY DISCLAIMS ALL WARRANTIES OF MERCHANTABILITY OR FITNESS FOR A PARTICULAR PURPOSE OR USE WITH RESPECT TO BLOOMBERG BARCLAYS INDICES OR ANY DATA INCLUDED THEREIN. BLOOMBERG RESERVES THE RIGHT TO CHANGE THE METHODS OF CALCULATION OR PUBLICATION, OR TO CEASE THE CALCULATION OR PUBLICATION OF THE BLOOMBERG BARCLAYS INDICES, AND NEITHER BLOOMBERG NOR BARCLAYS SHALL BE LIABLE FOR ANY MISCALCULATION OF OR ANY INCORRECT, DELAYED OR INTERRUPTED PUBLICATION WITH RESPECT TO ANY OF THE BLOOMBERG BARCLAYS INDICES. NEITHER BLOOMBERG NOR BARCLAYS SHALL BE LIABLE FOR ANY DAMAGES, INCLUDING, WITHOUT LIMITATION, ANY SPECIAL, INDIRECT OR CONSEQUENTIAL DAMAGES, OR ANY LOST PROFITS AND EVEN IF ADVISED OF THE POSSIBILITY OF SUCH, RESULTING FROM THE USE OF BLOOMBERG BARCLAYS INDICES OR ANY DATA INCLUDED THEREIN OR WITH RESPECT TO THE INSTITUTIONAL TARGET RETIREMENT FUNDS.
None of the information supplied by Bloomberg or Barclays and used in this publication may be reproduced in any manner without the prior written permission of both Bloomberg and Barclays Capital, the investment banking division of Barclays Bank Plc. Barclays Bank Plc is registered in England No. 1026167. Registered office 1 Churchill Place London E14 5HP.
© 2019 Bloomberg. Used with Permission.
Source: Bloomberg Index Services Limited. Copyright 2019, Bloomberg. All rights reserved.
75
This page intentionally left blank.
This page intentionally left blank.
This page intentionally left blank.
This page intentionally left blank.
This page intentionally left blank.
This page intentionally left blank.
This page intentionally left blank.
The People Who Govern Your Fund
The trustees of your mutual fund are there to see that the fund is operated and managed in your best interests since, as a shareholder, you are a part owner of the fund. Your fund’s trustees also serve on the board of directors of The Vanguard Group, Inc., which is owned by the Vanguard funds and provides services to them.
A majority of Vanguard’s board members are independent, meaning that they have no affiliation with Vanguard or the funds they oversee, apart from the sizable personal investments they have made as private individuals. The independent board members have distinguished backgrounds in business, academia, and public service. Each of the trustees and executive officers oversees 212 Vanguard funds.
Information for each trustee and executive officer of the fund appears below. That information, as well as the Vanguard fund count, is as of the date on the cover of this fund report. The mailing address of the trustees and officers is P.O. Box 876, Valley Forge, PA 19482. More information about the trustees is in the Statement of Additional Information, which can be obtained, without charge, by contacting Vanguard at 800-662-7447, or online at vanguard.com.
Interested Trustee1
Mortimer J. Buckley
Born in 1969. Trustee since January 2018. Principal occupation(s) during the past five years and other experience: chairman of the board (January 2019–present) of Vanguard and of each of the investment companies served by Vanguard; chief executive officer (January 2018–present) of Vanguard; chief executive officer, president, and trustee (January 2018–present) of each of the investment companies served by Vanguard; president and director (2017–present) of Vanguard; and president (February 2018–present) of Vanguard Marketing Corporation. Chief investment officer (2013–2017), managing director (2002–2017), head of the Retail Investor Group (2006–2012), and chief information officer (2001–2006) of Vanguard. Chairman of the board (2011–2017) and trustee (2009–2017) of the Children’s Hospital of Philadelphia; trustee (2018–present) of The Shipley School.
Independent Trustees
Emerson U. Fullwood
Born in 1948. Trustee since January 2008. Principal occupation(s) during the past five years and other experience: executive chief staff and marketing officer for North America and corporate vice president (retired 2008) of Xerox Corporation (document management products and services). Former president of the Worldwide Channels Group, Latin America, and Worldwide Customer Service and executive chief staff officer of Developing Markets of Xerox. Executive in residence and 2009—2010 Distinguished Minett Professor at the Rochester Institute of Technology. Director of SPX FLOW, Inc. (multi-industry manufacturing). Director of the University of Rochester Medical Center, the Monroe Community College Foundation, the United Way of Rochester, North Carolina A&T University, and Roberts Wesleyan College. Trustee of the University of Rochester.
Amy Gutmann
Born in 1949. Trustee since June 2006. Principal occupation(s) during the past five years and other experience: president (2004–present) of the University of Pennsylvania. Christopher H. Browne Distinguished Professor of Political Science, School of Arts and Sciences, and professor of communication, Annenberg School for Communication, with secondary faculty appointments in the Department of Philosophy, School of Arts and Sciences, and at the Graduate School of Education, University of Pennsylvania. Trustee of the National Constitution Center.
F. Joseph Loughrey
Born in 1949. Trustee since October 2009. Principal occupation(s) during the past five years and other experience: president and chief operating officer (retired 2009) and vice chairman of the board (2008–2009) of Cummins Inc. (industrial machinery). Chairman of the board of Hillenbrand, Inc. (specialized consumer services), and the Lumina Foundation.
1 Mr. Buckley is considered an “interested person,” as defined in the Investment Company Act of 1940, because he is an officer of the Vanguard funds.
Director of the V Foundation and Oxfam America. Member of the advisory council for the College of Arts and Letters and chair of the advisory board to the Kellogg Institute for International Studies, both at the University of Notre Dame.
Mark Loughridge
Born in 1953. Trustee since March 2012. Principal occupation(s) during the past five years and other experience: senior vice president and chief financial officer (retired 2013) of IBM (information technology services). Fiduciary member of IBM’s Retirement Plan Committee (2004–2013), senior vice president and general manager (2002–2004) of IBM Global Financing, vice president and controller (1998–2002) of IBM, and a variety of other prior management roles at IBM. Member of the Council on Chicago Booth.
Scott C. Malpass
Born in 1962. Trustee since March 2012. Principal occupation(s) during the past five years and other experience: chief investment officer (1989–present) and vice president (1996–present) of the University of Notre Dame. Assistant professor of finance at the Mendoza College of Business, University of Notre Dame, and member of the Notre Dame 403(b) Investment Committee. Chairman of the board of TIFF Advisory Services, Inc. Member of the board of Catholic Investment Services, Inc. (investment advisors) and the board of superintendence of the Institute for the Works of Religion.
Deanna Mulligan
Born in 1963. Trustee since January 2018. Principal occupation(s) during the past five years and other experience: president (2010–present) and chief executive officer (2011–present) of The Guardian Life Insurance Company of America. Chief operating officer (2010–2011) and executive vice president (2008–2010) of Individual Life and Disability of The Guardian Life Insurance Company of America. Member of the board of The Guardian Life Insurance Company of America, the American Council of Life Insurers, the Partnership for New York City (business leadership), and the Committee Encouraging Corporate Philanthropy. Trustee of the Economic Club of New York and the Bruce Museum (arts and science). Member of the Advisory Council for the Stanford Graduate School of Business.
André F. Perold
Born in 1952. Trustee since December 2004. Principal occupation(s) during the past five years and other experience: George Gund Professor of Finance and Banking, Emeritus at the Harvard Business School (retired 2011). Chief investment officer and co-managing partner of HighVista Strategies LLC (private investment firm). Board of advisors and investment committee member of the Museum of Fine Arts Boston. Board member (2018–present) of RIT Capital Partners (investment firm); investment committee member of Partners Health Care System.
Sarah Bloom Raskin
Born in 1961. Trustee since January 2018. Principal occupation(s) during the past five years and other experience: deputy secretary (2014–2017) of the United States Department of the Treasury. Governor (2010–2014) of the Federal Reserve Board. Commissioner (2007–2010) of financial regulation for the State of Maryland. Member of the board of directors (2012–2014) of Neighborhood Reinvestment Corporation. Director (2017–present) of i(x) Investments, LLC; director (2017–present) of Reserve Trust. Rubinstein Fellow (2017–present) of Duke University; trustee (2017–present) of Amherst College.
Peter F. Volanakis
Born in 1955. Trustee since July 2009. Principal occupation(s) during the past five years and other experience: president and chief operating officer (retired 2010) of Corning Incorporated (communications equipment) and director of Corning Incorporated (2000–2010) and Dow Corning (2001–2010). Director (2012) of SPX Corporation (multi-industry manufacturing). Overseer of the Amos Tuck School of Business Administration, Dartmouth College (2001–2013). Chairman of the board of trustees of Colby-Sawyer College. Member of the board of Hypertherm Inc. (industrial cutting systems, software, and consumables).
Executive Officers
Glenn Booraem
Born in 1967. Principal occupation(s) during the past five years and other experience: principal of Vanguard. Investment stewardship officer (2017–present), treasurer (2015–2017), controller (2010–2015), and assistant controller (2001—2010) of each of the investment companies served by Vanguard.
Christine M. Buchanan
Born in 1970. Principal occupation(s) during the past five years and other experience: principal of Vanguard and global head of Fund Administration at Vanguard. Treasurer (2017–present) of each of the investment companies served by Vanguard. Partner (2005–2017) at KPMG LLP (audit, tax, and advisory services).
Thomas J. Higgins
Born in 1957. Principal occupation(s) during the past five years and other experience: principal of Vanguard. Chief financial officer (2008–present) and treasurer (1998–2008) of each of the investment companies served by Vanguard.
Peter Mahoney
Born in 1974. Principal occupation(s) during the past five years and other experience: principal of Vanguard. Controller (2015–present) of each of the investment companies served by Vanguard. Head of International Fund Services (2008–2014) at Vanguard.
Anne E. Robinson
Born in 1970. Principal occupation(s) during the past five years and other experience: general counsel (2016–present) of Vanguard. Secretary (2016–present) of Vanguard and of each of the investment companies served by Vanguard. Managing director (2016–present) of Vanguard. Director and senior vice president (2016–2018) of Vanguard Marketing Corporation. Managing director and general counsel of Global Cards and Consumer Services (2014–2016) at Citigroup. Counsel (2003–2014) at American Express.
Michael Rollings
Born in 1963. Principal occupation(s) during the past five years and other experience: finance director (2017–present) and treasurer (2017) of each of the investment companies served by Vanguard. Managing director (2016–present) of Vanguard. Chief financial officer (2016–present) of Vanguard. Director (2016–present) of Vanguard Marketing Corporation. Executive vice president and chief financial officer (2006–2016) of MassMutual Financial Group.
John E. Schadl
Born in 1972. Principal occupation(s) during the past five years and other experience: principal of Vanguard. Chief compliance officer (2019–present) of Vanguard and of each of the investment companies served by Vanguard. Assistant vice president (May 2019–present) of Vanguard Marketing Corporation.
Vanguard Senior Management Team
Joseph Brennan | Chris D. McIsaac |
Mortimer J. Buckley | James M. Norris |
Gregory Davis | Thomas M. Rampulla |
John James | Karin A. Risi |
Martha G. King | Anne E. Robinson |
John T. Marcante | Michael Rollings |
| 
|
| |
| |
| P.O. Box 2600 |
| Valley Forge, PA 19482-2600 |
Connect with Vanguard® > vanguard.com
Fund Information > 800-662-7447
Direct Investor Account Services > 800-662-2739
Institutional Investor Services > 800-523-1036
Text Telephone for People
Who Are Deaf or Hard of Hearing > 800-749-7273
This material may be used in conjunction with the offering of shares of any Vanguard fund only if preceded or accompanied by the fund’s current prospectus.
All comparative mutual fund data are from Morningstar, Inc., unless otherwise noted.
You can obtain a free copy of Vanguard’s proxy voting guidelines by visiting vanguard.com/proxyreporting or by calling Vanguard at 800-662-2739. The guidelines are also available from the SEC’s website, www.sec.gov. In addition, you may obtain a free report on how your fund voted the proxies for securities it owned during the 12 months ended June 30. To get the report, visit either vanguard.com/proxyreporting or www.sec.gov.
You can review information about your fund on the SEC’s website, and you can receive copies of this information, for a fee, by sending a request via email addressed to publicinfo@sec.gov.
| © 2019 The Vanguard Group, Inc. |
| All rights reserved. |
| Vanguard Marketing Corporation, Distributor. |
| |
| Q6730 112019 |

Annual Report | September 30, 2019 Vanguard Institutional Target Retirement Funds |
Vanguard Institutional Target Retirement 2040 Fund Vanguard Institutional Target Retirement 2045 Fund Vanguard Institutional Target Retirement 2050 Fund Vanguard Institutional Target Retirement 2055 Fund Vanguard Institutional Target Retirement 2060 Fund Vanguard Institutional Target Retirement 2065 Fund See the inside front cover for important information about access to your fund’s annual and semiannual shareholder reports. |
Important information about access to shareholder reports
Beginning on January 1, 2021, as permitted by regulations adopted by the Securities and Exchange Commission, paper copies of your fund’s annual and semiannual shareholder reports will no longer be sent to you by mail, unless you specifically request them. Instead, you will be notified by mail each time a report is posted on the website and will be provided with a link to access the report.
If you have already elected to receive shareholder reports electronically, you will not be affected by this change and do not need to take any action. You may elect to receive shareholder reports and other communications from the fund electronically by contacting your financial intermediary (such as a broker-dealer or bank) or, if you invest directly with the fund, by calling Vanguard at one of the phone numbers on the back cover of this report or by logging on to vanguard.com.
You may elect to receive paper copies of all future shareholder reports free of charge. If you invest through a financial intermediary, you can contact the intermediary to request that you continue to receive paper copies. If you invest directly with the fund, you can call Vanguard at one of the phone numbers on the back cover of this report or log on to vanguard.com. Your election to receive paper copies will apply to all the funds you hold through an intermediary or directly with Vanguard.
Contents | |
| |
| |
A Note From Our Chairman | 1 |
| |
Your Fund’s Performance at a Glance | 2 |
| |
About Your Fund’s Expenses | 3 |
| |
Institutional Target Retirement 2040 Fund | 5 |
| |
Institutional Target Retirement 2045 Fund | 16 |
| |
Institutional Target Retirement 2050 Fund | 26 |
| |
Institutional Target Retirement 2055 Fund | 37 |
| |
Institutional Target Retirement 2060 Fund | 47 |
| |
Institutional Target Retirement 2065 Fund | 58 |
Please note: The opinions expressed in this report are just that—informed opinions. They should not be considered promises or advice. Also, please keep in mind that the information and opinions cover the period through the date on the front of this report. Of course, the risks of investing in your fund are spelled out in the prospectus.
A Note From Our Chairman

Tim Buckley
Chairman and Chief Executive Officer
Dear Shareholder,
Recent volatility in financial markets—affecting stocks, bonds, and commodities—has been a good reminder of the wise old adage, “Never keep all your eggs in one basket.” Maintaining balance and diversification in your investment portfolio can help to both limit risk and set you up for long-term success.
It’s understandable why some investors might become complacent after a long market run-up like the one that lifted stock prices, especially U.S. stock prices, in the years following the global financial crisis. But failing to rebalance regularly can leave a portfolio with a much different mix of assets than intended and, often, more risk than intended.
Balance across and diversification within asset classes are powerful tools for managing risk and achieving your investment goals. A portfolio’s allocation will determine a large portion of its long-term return and also the majority of its volatility risk. A well-diversified portfolio is less vulnerable to significant swings in the performance of any one segment of the asset classes in which it invests.
Balance and diversification will never eliminate the risk of loss, nor will they guarantee positive returns in a declining market. But they should reduce the chance that you’ll suffer disproportionate losses in one particular high-flying asset class or sector when it comes back to earth. And exposure to all key market components should give you at least some participation in the sectors that are performing best at any given time.
Vanguard is committed to helping you achieve balance and diversification in your portfolios to help meet your investment goals. We thank you for your continued loyalty.
Sincerely

Mortimer J. Buckley
Chairman and Chief Executive Officer
October 14, 2019
1
Your Fund’s Performance at a Glance
· For the 12 months ended September 30, 2019, the six Vanguard Institutional Target Retirement Funds covered in this report recorded returns ranging from 2.11% for the Institutional Target Retirement 2050 Fund to 2.65% for the Institutional Target Retirement 2040 Fund. (The funds with target dates of 2015 through 2035, as well as the Institutional Target Retirement Income Fund, are covered in a separate report.)
· Each fund performed in line with its composite benchmark after expenses. The Institutional Target Retirement Funds invest all their assets in Vanguard index funds that seek to match the performance of broad stock and bond market indexes.
· Global stock markets cooled during the funds’ fiscal year. U.S. shares gained less than 3% while non-U.S. shares returned roughly –1% in U.S. dollars. Worries about the pace of global economic growth and central bank plans to loosen monetary policies virtually worldwide encouraged investment in bonds. That sent their yields lower and their prices markedly higher. Broad measures of both the U.S. and non-U.S. investment-grade bond markets returned more than 10%.
· Vanguard Institutional Target Retirement Funds are designed to reach an allocation of 70% bonds and 30% stocks within seven years after their target dates.
· From their inception dates through September 30, the funds had average annual returns that ranged from 6.81% for the Institutional Target Retirement 2040 Fund to 7.28% for the Institutional Target Retirement 2065 Fund.
Market Barometer
| | Average Annual Total Returns | |
| | Periods Ended September 30, 2019 | |
| | One Year | | Three Years | | Five Years | |
Stocks | | | | | | | |
Russell 1000 Index (Large-caps) | | 3.87% | | 13.19% | | 10.62% | |
Russell 2000 Index (Small-caps) | | -8.89 | | 8.23 | | 8.19 | |
Russell 3000 Index (Broad U.S. market) | | 2.92 | | 12.83 | | 10.44 | |
FTSE All-World ex US Index (International) | | -1.12 | | 6.46 | | 3.24 | |
| | | | | | | |
Bonds | | | | | | | |
Bloomberg Barclays U.S. Aggregate Bond Index (Broad taxable market) | | 10.30% | | 2.92% | | 3.38% | |
Bloomberg Barclays Municipal Bond Index (Broad tax-exempt market) | | 8.55 | | 3.19 | | 3.66 | |
FTSE Three-Month U.S. Treasury Bill Index | | 2.36 | | 1.52 | | 0.95 | |
| | | | | | | |
CPI | | | | | | | |
Consumer Price Index | | 1.71% | | 2.07% | | 1.53% | |
2
About Your Fund’s Expenses
As a shareholder of the fund, you incur ongoing costs, which include costs for portfolio management, administrative services, and shareholder reports (like this one), among others. Operating expenses, which are deducted from a fund’s gross income, directly reduce the investment return of the fund.
A typical fund’s expenses are expressed as a percentage of its average net assets. The Institutional Target Retirement Funds have no direct expenses, but each fund bears its proportionate share of the costs for the underlying funds in which it invests. These indirect expenses make up the acquired fund fees and expenses, also expressed as a percentage of average net assets.
The following examples are intended to help you understand the ongoing cost (in dollars) of investing in your fund and to compare these costs with those of other mutual funds. The examples are based on an investment of $1,000 made at the beginning of the period shown and held for the entire period. The costs were calculated using the acquired fund fees and expenses for each Institutional Target Retirement Fund.
The accompanying table illustrates your fund’s costs in two ways:
· Based on actual fund return. This section helps you to estimate the actual expenses that you paid over the period. The “Ending Account Value” shown is derived from the fund’s actual return, and the third column shows the dollar amount that would have been paid by an investor who started with $1,000 in the fund. You may use the information here, together with the amount you invested, to estimate the expenses that you paid over the period.
To do so, simply divide your account value by $1,000 (for example, an $8,600 account value divided by $1,000 = 8.6), then multiply the result by the number given for your fund under the heading “Expenses Paid During Period.”
· Based on hypothetical 5% yearly return. This section is intended to help you compare your fund’s costs with those of other mutual funds. It assumes that the fund had a yearly return of 5% before expenses, but that the expense ratio is unchanged. In this case—because the return used is not the fund’s actual return—the results do not apply to your investment. The example is useful in making comparisons because the Securities and Exchange Commission requires all mutual funds to calculate expenses based on a 5% return. You can assess your fund’s costs by comparing this hypothetical example with the hypothetical examples that appear in shareholder reports of other funds.
Note that the expenses shown in the table are meant to highlight and help you compare ongoing costs only and do not reflect transaction costs incurred by the fund for buying and selling securities. Further, the expenses do not include any purchase, redemption, or account service fees described in the fund prospectus. If such fees were applied to your account, your costs would be higher. Your fund does not carry a “sales load.”
The calculations assume no shares were bought or sold during the period. Your actual costs may have been higher or lower, depending on the amount of your investment and the timing of any purchases or redemptions.
You can find more information about the fund’s expenses, including annual expense ratios, in the Financial Statements section of this report. For additional information on operating expenses and other shareholder costs, please refer to your fund’s current prospectus.
3
Six Months Ended September 30, 2019
| | Beginning | | Ending | | Expenses |
| | Account Value | | Account Value | | Paid During |
| | 3/31/2019 | | 9/30/2019 | | Period |
Based on Actual Fund Return | | | | | | |
Institutional Target Retirement 2040 Fund | | $1,000.00 | | $1,039.63 | | $0.46 |
Institutional Target Retirement 2045 Fund | | $1,000.00 | | $1,038.11 | | $0.46 |
Institutional Target Retirement 2050 Fund | | $1,000.00 | | $1,038.06 | | $0.46 |
Institutional Target Retirement 2055 Fund | | $1,000.00 | | $1,037.95 | | $0.46 |
Institutional Target Retirement 2060 Fund | | $1,000.00 | | $1,038.37 | | $0.46 |
Institutional Target Retirement 2065 Fund | | $1,000.00 | | $1,038.76 | | $0.46 |
Based on Hypothetical 5% Yearly Return | | | | | | |
Institutional Target Retirement 2040 Fund | | $1,000.00 | | $1,024.62 | | $0.46 |
Institutional Target Retirement 2045 Fund | | $1,000.00 | | $1,024.62 | | $0.46 |
Institutional Target Retirement 2050 Fund | | $1,000.00 | | $1,024.62 | | $0.46 |
Institutional Target Retirement 2055 Fund | | $1,000.00 | | $1,024.62 | | $0.46 |
Institutional Target Retirement 2060 Fund | | $1,000.00 | | $1,024.62 | | $0.46 |
Institutional Target Retirement 2065 Fund | | $1,000.00 | | $1,024.62 | | $0.46 |
The calculations are based on the acquired fund fees and expenses for the most recent six-month period. The funds’ annualized expense figures for that period are (in order as listed from top to bottom above) 0.09%, 0.09%, 0.09%, 0.09%, 0.09%, and 0.09%. The dollar amounts shown as “Expenses Paid” are equal to the annualized average weighted expense ratio for the underlying funds multiplied by the average account value over the period, multiplied by the number of days in the most recent six-month period, then divided by the number of days in the most recent 12-month period (183/365).
4
Institutional Target Retirement 2040 Fund
Performance Summary
All of the returns in this report represent past performance, which is not a guarantee of future results that may be achieved by the fund. (Current performance may be lower or higher than the performance data cited. For performance data current to the most recent month-end, visit our website at vanguard.com/performance.) Note, too, that both investment returns and principal value can fluctuate widely, so an investor’s shares, when sold, could be worth more or less than their original cost. The returns shown do not reflect taxes that a shareholder would pay on fund distributions or on the sale of fund shares.
Cumulative Performance: June 26, 2015, Through September 30, 2019
Initial Investment of $100,000,000
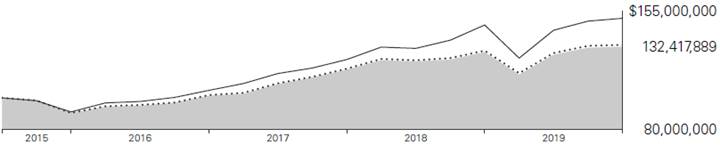
| | | | Average Annual Total Returns | | |
| | | | Periods Ended September 30, 2019 | | |
| | | | | | Since | | Final Value |
| | | | One | | Inception | | of a $100,000,000 |
| | | | Year | | (6/26/2015) | | Investment |

| | Institutional Target Retirement 2040 Fund | | 2.65% | | 6.81% | | $132,417,889 |

| | Target 2040 Composite Index | | 2.83 | | 7.03 | | 133,616,586 |

| | MSCI US Broad Market Index | | 2.91 | | 10.06 | | 150,458,285 |
Target 2040 Composite Index: Derived by applying the fund’s target asset allocation to the results of the following benchmarks: for international stocks of developed markets, the MSCI EAFE Index through December 15, 2010, the MSCI ACWI ex USA IMI Index through June 2, 2013, and the FTSE Global All Cap ex US Index thereafter; for emerging-market stocks, the Select Emerging Markets Index through August 23, 2006, the MSCI Emerging Markets Index through December 15, 2010, the MSCI ACWI ex USA IMI Index through June 2, 2013, and the FTSE Global All Cap ex US Index thereafter; for U.S. bonds, the Bloomberg Barclays U.S. Aggregate Bond Index through December 31, 2009, and the Bloomberg Barclays U.S. Aggregate Float Adjusted Index thereafter; for international bonds, the Bloomberg Barclays Global Aggregate ex-USD Float Adjusted RIC Capped Index Hedged beginning June 3, 2013; and for U.S. stocks, the MSCI US Broad Market Index through June 2, 2013, and the CRSP US Total Market Index thereafter. International stock benchmark returns are adjusted for withholding taxes.
“Since Inception” performance is calculated from the fund’s inception date for both the fund and its comparative standards.
See Financial Highlights for dividend and capital gains information.
5
Institutional Target Retirement 2040 Fund
Underlying Vanguard Funds
As of September 30, 2019
Vanguard Total Stock Market Index Fund Institutional Shares | | 50.1% |
Vanguard Total International Stock Index Fund Investor Shares | | 33.2 |
Vanguard Total Bond Market II Index Fund Investor Shares | | 11.8 |
Vanguard Total International Bond Index Fund Admiral Shares | | 4.9 |
6
Institutional Target Retirement 2040 Fund
Financial Statements
Statement of Net Assets
As of September 30, 2019
The fund files its complete schedule of portfolio holdings with the Securities and Exchange Commission (SEC) for the first and third quarters of each fiscal year as an exhibit to its reports on Form N-PORT. The fund’s Form N-PORT reports are available on the SEC’s website at www.sec.gov.
| | | | | Market | |
| | | | | Value· | |
| | | Shares | | ($000 | ) |
Investment Companies (100.0%) | | | | | |
U.S. Stock Fund (50.1%) | | | | | |
| Vanguard Total Stock Market Index Fund Institutional Shares | | 170,659,051 | | 12,545,147 | |
| | | | | | |
International Stock Fund (33.2%) | | | | | |
| Vanguard Total International Stock Index Fund Investor Shares | | 502,866,952 | | 8,332,505 | |
| | | | | | |
U.S. Bond Fund (11.8%) | | | | | |
1 | Vanguard Total Bond Market II Index Fund Investor Shares | | 266,937,010 | | 2,957,662 | |
| | | | | |
International Bond Fund (4.9%) | | | | | |
| Vanguard Total International Bond Index Fund Admiral Shares | | 52,634,296 | | 1,236,906 | |
Total Investment Companies (Cost $21,767,870) | | | | 25,072,220 | |
Temporary Cash Investment (0.1%) | | | | | |
Money Market Fund (0.1%) | | | | | |
1 | Vanguard Market Liquidity Fund, 2.098% (Cost $13,655) | | 136,535 | | 13,655 | |
Total Investments (100.1%) (Cost $21,781,525) | | | | 25,085,875 | |
Other Assets and Liabilities (-0.1%) | | | | | |
Other Assets | | | | 111,073 | |
Liabilities | | | | (139,557 | ) |
| | | | | (28,484 | ) |
Net Assets (100%) | | | | | |
Applicable to 1,015,951,439 outstanding $.001 par value shares of beneficial interest (unlimited authorization) | | | | 25,057,391 | |
Net Asset Value Per Share | | | | $24.66 | |
7
Institutional Target Retirement 2040 Fund
| | Amount | |
| | ($000 | ) |
Statement of Assets and Liabilities | | | |
Assets | | | |
Investments in Securities, at Value—Affiliated Funds | | 25,085,875 | |
Receivables for Investment Securities Sold | | 76,374 | |
Receivables for Accrued Income | | 7,261 | |
Receivables for Capital Shares Issued | | 27,438 | |
Total Assets | | 25,196,948 | |
Liabilities | | | |
Payables for Investment Securities Purchased | | 7,261 | |
Payables for Capital Shares Redeemed | | 132,296 | |
Total Liabilities | | 139,557 | |
Net Assets | | 25,057,391 | |
At September 30, 2019, net assets consisted of:
| | Amount | |
| | ($000 | ) |
Paid-in Capital | | 21,375,356 | |
Total Distributable Earnings (Loss) | | 3,682,035 | |
Net Assets | | 25,057,391 | |
· See Note A in Notes to Financial Statements.
1 Affiliated fund available only to Vanguard funds and certain trusts and accounts managed by Vanguard. Rate shown for Vanguard Market Liquidity Fund is the 7-day yield.
See accompanying Notes, which are an integral part of the Financial Statements.
8
Institutional Target Retirement 2040 Fund
Statement of Operations
| | Year Ended | |
| | September 30, 2019 | |
| | ($000 | ) |
Investment Income | | | |
Income | | | |
Income Distributions Received from Affiliated Funds | | 545,029 | |
Net Investment Income—Note B | | 545,029 | |
Realized Net Gain (Loss) | | | |
Capital Gain Distributions Received from Affiliated Funds | | — | |
Affiliated Funds Sold | | 1,147 | |
Futures Contracts | | (48 | ) |
Realized Net Gain (Loss) | | 1,099 | |
Change in Unrealized Appreciation (Depreciation) from Affiliated Funds | | 244,321 | |
Net Increase (Decrease) in Net Assets Resulting from Operations | | 790,449 | |
See accompanying Notes, which are an integral part of the Financial Statements.
9
Institutional Target Retirement 2040 Fund
Statement of Changes in Net Assets
| | Year Ended September 30, | |
| | 2019 | | 2018 | |
| | ($000 | ) | ($000 | ) |
Increase (Decrease) in Net Assets | | | | | |
Operations | | | | | |
Net Investment Income | | 545,029 | | 403,495 | |
Realized Net Gain (Loss) | | 1,099 | | (2,764 | ) |
Change in Unrealized Appreciation (Depreciation) | | 244,321 | | 1,133,364 | |
Net Increase (Decrease) in Net Assets Resulting from Operations | | 790,449 | | 1,534,095 | |
Distributions | | | | | |
Net Investment Income | | (454,943 | ) | (310,516 | ) |
Realized Capital Gain1 | | (965 | ) | (2,059 | ) |
Total Distributions | | (455,908 | ) | (312,575 | ) |
Capital Share Transactions | | | | | |
Issued | | 5,254,578 | | 6,519,462 | |
Issued in Lieu of Cash Distributions | | 450,585 | | 307,832 | |
Redeemed | | (1,780,334 | ) | (2,113,307 | ) |
Net Increase (Decrease) from Capital Share Transactions | | 3,924,829 | | 4,713,987 | |
Total Increase (Decrease) | | 4,259,370 | | 5,935,507 | |
Net Assets | | | | | |
Beginning of Period | | 20,798,021 | | 14,862,514 | |
End of Period | | 25,057,391 | | 20,798,021 | |
1 Includes fiscal 2019 and 2018 short-term gain distributions totaling $965,000 and $1,716,000, respectively. Short-term gain distributions are treated as ordinary income dividends for tax purposes.
See accompanying Notes, which are an integral part of the Financial Statements.
10
Institutional Target Retirement 2040 Fund
Financial Highlights
| | | | | | | | | | June 26, | |
| | | | | | | | | | 20151 to | |
For a Share Outstanding | | Year Ended September 30, | | | Sept. 30, | |
Throughout Each Period | | 2019 | | 2018 | | 2017 | | 2016 | | 2015 | |
Net Asset Value, Beginning of Period | | $24.61 | | $22.93 | | $20.10 | | $18.08 | | $20.00 | |
Investment Operations | | | | | | | | | | | |
Net Investment Income2 | | .575 | | .535 | | .494 | | .461 | | .151 | |
Capital Gain Distributions Received2 | | — | | — | | .002 | | .002 | | — | |
Net Realized and Unrealized Gain (Loss) on Investments | | (.005 | ) | 1.601 | | 2.730 | | 1.718 | | (2.071 | ) |
Total from Investment Operations | | .570 | | 2.136 | | 3.226 | | 2.181 | | (1.920 | ) |
Distributions | | | | | | | | | | | |
Dividends from Net Investment Income | | (.519 | ) | (.453 | ) | (.393 | ) | (.161 | ) | — | |
Distributions from Realized Capital Gains | | (.001 | ) | (.003 | ) | (.003 | ) | — | | — | |
Total Distributions | | (.520 | ) | (.456 | ) | (.396 | ) | (.161 | ) | — | |
Net Asset Value, End of Period | | $24.66 | | $24.61 | | $22.93 | | $20.10 | | $18.08 | |
| | | | | | | | | | | |
Total Return | | 2.65% | | 9.39% | | 16.35% | | 12.12% | | -9.60% | |
| | | | | | | | | | | |
Ratios/Supplemental Data | | | | | | | | | | | |
Net Assets, End of Period (Millions) | | $25,057 | | $20,798 | | $14,863 | | $8,724 | | $3,032 | |
Ratio of Total Expenses to Average Net Assets | | — | | — | | — | | — | | — | |
Acquired Fund Fees and Expenses | | 0.09% | | 0.09% | | 0.09% | | 0.10% | | 0.10%3 | |
Ratio of Net Investment Income to Average Net Assets | | 2.43% | | 2.24% | | 2.32% | | 2.62% | | 2.81%3 | |
Portfolio Turnover Rate | | 5% | | 7% | | 5% | | 0% | | 1% | |
| | | | | | | | | | | | |
1 Inception.
2 Calculated based on average shares outstanding.
3 Annualized.
See accompanying Notes, which are an integral part of the Financial Statements.
11
Institutional Target Retirement 2040 Fund
Notes to Financial Statements
Vanguard Institutional Target Retirement 2040 Fund is registered under the Investment Company Act of 1940 as an open-end investment company, or mutual fund. The fund follows a balanced investment strategy by investing in selected Vanguard funds to achieve its targeted allocation of assets to U.S. and international stocks, and U.S. and international bonds. Financial statements and other information about each underlying fund are available on vanguard.com.
A. The following significant accounting policies conform to generally accepted accounting principles for U.S. investment companies. The fund consistently follows such policies in preparing its financial statements.
1. Security Valuation: Investments are valued at the net asset value of each underlying Vanguard fund determined as of the close of the New York Stock Exchange (generally 4 p.m., Eastern time) on the valuation date.
2. Futures Contracts: The fund uses stock and bond futures contracts to a limited extent, with the objectives of maintaining full exposure to the market and maintaining its target asset allocation. The primary risks associated with the use of futures contracts are imperfect correlation between changes in market values of investments held by the fund and the prices of futures contracts, and the possibility of an illiquid market. Counterparty risk involving futures is mitigated because a regulated clearinghouse is the counterparty instead of the clearing broker. To further mitigate counterparty risk, the fund trades futures contracts on an exchange, monitors the financial strength of its clearing brokers and clearinghouse, and has entered into clearing agreements with its clearing brokers. The clearinghouse imposes initial margin requirements to secure the fund’s performance and requires daily settlement of variation margin representing changes in the market value of each contract. Any assets pledged as initial margin for open contracts are noted in the Statement of Net Assets.
Futures contracts are valued at their quoted daily settlement prices. The notional amounts of the contracts are not recorded in the Statement of Net Assets. Fluctuations in the value of the contracts are recorded in the Statement of Assets and Liabilities as an asset (liability) and in the Statement of Operations as unrealized appreciation (depreciation) until the contracts are closed, when they are recorded as realized futures gains (losses).
During the year ended September 30, 2019, the fund’s average investments in long and short futures contracts represented less than 1% and 0% of net assets, respectively, based on the average of the notional amounts at each quarter-end during the period. The fund had no open futures contracts at September 30, 2019.
3. Federal Income Taxes: The fund intends to continue to qualify as a regulated investment company and distribute all of its taxable income. Management has analyzed the fund’s tax positions taken for all open federal income tax years (September 30, 2016–2019), and has concluded that no provision for federal income tax is required in the fund’s financial statements.
4. Distributions: Distributions to shareholders are recorded on the ex-dividend date. Distributions are determined on a tax basis and may differ from net investment income and realized capital gains for financial reporting purposes.
12
Institutional Target Retirement 2040 Fund
5. Credit Facility: The fund and certain other funds managed by The Vanguard Group (“Vanguard”) participate in a $4.3 billion committed credit facility provided by a syndicate of lenders pursuant to a credit agreement that may be renewed annually; each fund is individually liable for its borrowings, if any, under the credit facility. Borrowings may be utilized for temporary and emergency purposes, and are subject to the fund’s regulatory and contractual borrowing restrictions. The participating funds are charged administrative fees and an annual commitment fee of 0.10% of the undrawn amount of the facility; these fees are allocated to the funds based on a method approved by the fund’s board of trustees and borne by the funds in which the fund invests (see Note B). Any borrowings under this facility bear interest at a rate based upon the higher of the one-month London Interbank Offered Rate, federal funds effective rate, or overnight bank funding rate plus an agreed-upon spread.
The fund had no borrowings outstanding at September 30, 2019, or at any time during the period then ended.
6. Other: Income and capital gain distributions received are recorded on the ex-dividend date. Security transactions are accounted for on the date securities are bought or sold. Costs used to determine realized gains (losses) on the sale of investment securities are those of the specific securities sold.
B. In accordance with the terms of a Funds’ Service Agreement (the “FSA”) between Vanguard and the fund, Vanguard furnishes to the fund investment advisory, corporate management, administrative, marketing, and distribution services at Vanguard’s cost of operations (as defined by the FSA). These costs of operations are allocated to the fund based on methods and guidelines approved by the board of trustees. The FSA provides that expenses otherwise allocable to Vanguard funds-of-funds may be reduced or eliminated to the extent of savings realized by the underlying Vanguard funds by virtue of being part of a fund-of-funds. Accordingly, all expenses for services provided by Vanguard to the fund and all other expenses incurred by the fund during the period ended September 30, 2019, were borne by the underlying Vanguard funds in which the fund invests. The fund’s trustees and officers are also trustees and officers, respectively, of the underlying Vanguard funds, as well as directors and employees, respectively, of Vanguard.
C. Various inputs may be used to determine the value of the fund’s investments. These inputs are summarized in three broad levels for financial statement purposes. The inputs or methodologies used to value securities are not necessarily an indication of the risk associated with investing in those securities.
Level 1—Quoted prices in active markets for identical securities.
Level 2—Other significant observable inputs (including quoted prices for similar securities, interest rates, prepayment speeds, credit risk, etc.).
Level 3—Significant unobservable inputs (including the fund’s own assumptions used to determine the fair value of investments). Any investments valued with significant unobservable inputs are noted on the Statement of Net Assets.
At September 30, 2019, 100% of the market value of the fund’s investments was determined based on Level 1 inputs.
13
Institutional Target Retirement 2040 Fund
D. Permanent differences between book-basis and tax-basis components of net assets, if any, are reclassified among capital accounts in the financial statements to reflect their tax character. These reclassifications have no effect on net assets or net asset value per share.
Temporary differences between book-basis and tax-basis components of total distributable earnings (loss) arise when certain items of income, gain, or loss are recognized in different periods for financial statement and tax purposes; these differences will reverse at some time in the future. The differences are primarily related to the tax deferral of losses on wash sales. As of period end, the tax-basis components of total distributable earnings (loss) are detailed in the table as follows:
| | Amount | |
| | ($000 | ) |
Undistributed Ordinary Income | | 382,984 | |
Undistributed Long-Term Gains | | — | |
Capital Loss Carryforwards (Non-expiring) | | — | |
Net Unrealized Gains (Losses) | | 3,299,051 | |
As of September 30, 2019, gross unrealized appreciation and depreciation for investments based on cost for U.S. federal income tax purposes were as follows:
| | Amount | |
| | ($000 | ) |
Tax Cost | | 21,786,824 | |
Gross Unrealized Appreciation | | 3,476,237 | |
Gross Unrealized Depreciation | | (177,186 | ) |
Net Unrealized Appreciation (Depreciation) | | 3,299,051 | |
E. Capital shares issued and redeemed were:
| | Year Ended September 30, | |
| | 2019 | | 2018 | |
| | Shares | | Shares | |
| | (000 | ) | (000 | ) |
Issued | | 224,272 | | 272,240 | |
Issued in Lieu of Cash Distributions | | 21,214 | | 13,000 | |
Redeemed | | (74,584 | ) | (88,336 | ) |
Net Increase (Decrease) in Shares Outstanding | | 170,902 | | 196,904 | |
At September 30, 2019, one shareholder was the record or beneficial owner of 34% of the fund’s net assets. If the shareholder were to redeem its investment in the fund, the redemption might lead to the realization of taxable capital gains.
14
Institutional Target Retirement 2040 Fund
F. Transactions during the period in affiliated underlying Vanguard funds were as follows:
| | | | Current Period Transactions | | | |
| | Sept. 30, | | | | Proceeds | | Realized | | | | | | | | Sept. 30, | |
| | 2018 | | | | from | | Net | | Change in | | | | Capital Gain | | 2019 | |
| | Market | | Purchases | | Securities | | Gain | | Unrealized | | | | Distributions | | Market | |
| | Value | | at Cost | | Sold | | (Loss | ) | App. (Dep. | ) | Income | | Received | | Value | |
| | ($000 | ) | ($000 | ) | ($000 | ) | ($000 | ) | ($000 | ) | ($000 | ) | ($000 | ) | ($000 | ) |
Vanguard Market Liquidity Fund | | 748 | | NA1 | | NA1 | | (4 | ) | — | | 165 | | — | | 13,655 | |
Vanguard Total Bond Market II Index Fund | | 2,210,728 | | 1,230,149 | | 667,686 | | (573 | ) | 185,044 | | 71,935 | | — | | 2,957,662 | |
Vanguard Total International Bond Index Fund | | 894,371 | | 274,803 | | 18,000 | | — | | 85,732 | | 29,010 | | — | | 1,236,906 | |
Vanguard Total International Stock Index Fund | | 7,051,470 | | 1,596,984 | | 26,188 | | (692 | ) | (289,069 | ) | 225,543 | | — | | 8,332,505 | |
Vanguard Total Stock Market Index Fund | | 10,623,941 | | 1,982,938 | | 326,762 | | 2,416 | | 262,614 | | 218,376 | | — | | 12,545,147 | |
Total | | 20,781,258 | | 5,084,874 | | 1,038,636 | | 1,147 | | 244,321 | | 545,029 | | — | | 25,085,875 | |
1 Not applicable—purchases and sales are for temporary cash investment purposes.
G. Management has determined that no events or transactions occurred subsequent to September 30, 2019, that would require recognition or disclosure in these financial statements.
15
Institutional Target Retirement 2045 Fund
Performance Summary
All of the returns in this report represent past performance, which is not a guarantee of future results that may be achieved by the fund. (Current performance may be lower or higher than the performance data cited. For performance data current to the most recent month-end, visit our website at vanguard.com/performance.) Note, too, that both investment returns and principal value can fluctuate widely, so an investor’s shares, when sold, could be worth more or less than their original cost. The returns shown do not reflect taxes that a shareholder would pay on fund distributions or on the sale of fund shares.
Cumulative Performance: June 26, 2015, Through September 30, 2019
Initial Investment of $100,000,000
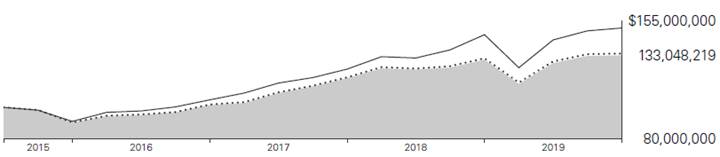
| | | | Average Annual Total Returns | | |
| | | | Periods Ended September 30, 2019 | | |
| | | | | | Since | | Final Value |
| | | | One | | Inception | | of a $100,000,000 |
| | | | Year | | (6/26/2015) | | Investment |

| | Institutional Target Retirement 2045 Fund | | 2.13% | | 6.93% | | $133,048,219 |

| | Target 2045 Composite Index | | 2.32 | | 7.15 | | 134,233,361 |

| | MSCI US Broad Market Index | | 2.91 | | 10.06 | | 150,458,285 |
Target 2045 Composite Index: Derived by applying the fund’s target asset allocation to the results of the following benchmarks: for international stocks of developed markets, the MSCI EAFE Index through December 15, 2010, the MSCI ACWI ex USA IMI Index through June 2, 2013, and the FTSE Global All Cap ex US Index thereafter; for emerging-market stocks, the Select Emerging Markets Index through August 23, 2006, the MSCI Emerging Markets Index through December 15, 2010, the MSCI ACWI ex USA IMI Index through June 2, 2013, and the FTSE Global All Cap ex US Index thereafter; for U.S. bonds, the Bloomberg Barclays U.S. Aggregate Bond Index through December 31, 2009, and the Bloomberg Barclays U.S. Aggregate Float Adjusted Index thereafter; for international bonds, the Bloomberg Barclays Global Aggregate ex-USD Float Adjusted RIC Capped Index Hedged beginning June 3, 2013; and for U.S. stocks, the Dow Jones U.S. Total Stock Market Index (formerly known as the Dow Jones Wilshire 5000 Index) through April 22, 2005, the MSCI US Broad Market Index through June 2, 2013, and the CRSP US Total Market Index thereafter. International stock benchmark returns are adjusted for withholding taxes.
“Since Inception” performance is calculated from the fund’s inception date for both the fund and its comparative standards.
See Financial Highlights for dividend and capital gains information.
16
Institutional Target Retirement 2045 Fund
Underlying Vanguard Funds
As of September 30, 2019
Vanguard Total Stock Market Index Fund Institutional Shares | | 54.0% |
Vanguard Total International Stock Index Fund Investor Shares | | 36.0 |
Vanguard Total Bond Market II Index Fund Investor Shares | | 7.0 |
Vanguard Total International Bond Index Fund Admiral Shares | | 3.0 |
17
Institutional Target Retirement 2045 Fund
Financial Statements
Statement of Net Assets
As of September 30, 2019
The fund files its complete schedule of portfolio holdings with the Securities and Exchange Commission (SEC) for the first and third quarters of each fiscal year as an exhibit to its reports on Form N-PORT. The fund’s Form N-PORT reports are available on the SEC’s website at www.sec.gov.
| | | | Market | |
| | | | Value· | |
| | Shares | | ($000 | ) |
Investment Companies (100.0%) | | | | | |
U.S. Stock Fund (54.0%) | | | | | |
| Vanguard Total Stock Market Index Fund Institutional Shares | | 156,600,378 | | 11,511,694 | |
| | | | | |
International Stock Fund (36.0%) | | | | | |
| Vanguard Total International Stock Index Fund Investor Shares | | 463,365,758 | | 7,677,971 | |
| | | | | |
U.S. Bond Fund (7.0%) | | | | | |
1 | Vanguard Total Bond Market II Index Fund Investor Shares | | 134,658,580 | | 1,492,017 | |
| | | | | |
International Bond Fund (3.0%) | | | | | |
| Vanguard Total International Bond Index Fund Admiral Shares | | 27,114,443 | | 637,189 | |
Total Investment Companies (Cost $18,592,753) | | | | 21,318,871 | |
Temporary Cash Investment (0.1%) | | | | | |
Money Market Fund (0.1%) | | | | | |
1 | Vanguard Market Liquidity Fund, 2.098% (Cost $11,719) | | 117,181 | | 11,719 | |
Total Investments (100.1%) (Cost $18,604,472) | | | | 21,330,590 | |
Other Assets and Liabilities (-0.1%) | | | | | |
Other Assets | | | | 80,850 | |
Liabilities | | | | (103,518 | ) |
| | | | (22,668 | ) |
Net Assets (100%) | | | | | |
Applicable to 859,706,933 outstanding $.001 par value shares of beneficial interest (unlimited authorization) | | | | 21,307,922 | |
|
Net Asset Value Per Share | | | | $24.79 | |
18
Institutional Target Retirement 2045 Fund
| | Amount | |
| | ($000 | ) |
Statement of Assets and Liabilities | | | |
Assets | | | |
Investments in Securities, at Value—Affiliated Funds | | 21,330,590 | |
Receivables for Investment Securities Sold | | 55,183 | |
Receivables for Accrued Income | | 3,778 | |
Receivables for Capital Shares Issued | | 21,889 | |
Total Assets | | 21,411,440 | |
Liabilities | | | |
Payables for Investment Securities Purchased | | 3,778 | |
Payables for Capital Shares Redeemed | | 99,740 | |
Total Liabilities | | 103,518 | |
Net Assets | | 21,307,922 | |
| | | |
At September 30, 2019, net assets consisted of: | | | |
| | Amount | |
| | ($000 | ) |
Paid-in Capital | | 18,264,858 | |
Total Distributable Earnings (Loss) | | 3,043,064 | |
Net Assets | | 21,307,922 | |
· See Note A in Notes to Financial Statements.
1 Affiliated fund available only to Vanguard funds and certain trusts and accounts managed by Vanguard. Rate shown for Vanguard Market Liquidity Fund is the 7-day yield.
See accompanying Notes, which are an integral part of the Financial Statements.
19
Institutional Target Retirement 2045 Fund
Statement of Operations
| | Year Ended | |
| | September 30, 2019 | |
| | ($000 | ) |
Investment Income | | | |
Income | | | |
Income Distributions Received from Affiliated Funds | | 455,897 | |
Net Investment Income – Note B | | 455,897 | |
Realized Net Gain (Loss) | | | |
Capital Gain Distributions Received from Affiliated Funds | | — | |
Affiliated Funds Sold | | (1,387 | ) |
Realized Net Gain (Loss) | | (1,387 | ) |
Change in Unrealized Appreciation (Depreciation) from Affiliated Funds | | 132,234 | |
Net Increase (Decrease) in Net Assets Resulting from Operations | | 586,744 | |
See accompanying Notes, which are an integral part of the Financial Statements.
20
Institutional Target Retirement 2045 Fund
Statement of Changes in Net Assets
| | Year Ended September 30, | |
| | 2019 | | 2018 | |
| | ($000 | ) | ($000 | ) |
Increase (Decrease) in Net Assets | | | | | |
Operations | | | | | |
Net Investment Income | | 455,897 | | 331,939 | |
Realized Net Gain (Loss) | | (1,387 | ) | (2,473 | ) |
Change in Unrealized Appreciation (Depreciation) | | 132,234 | | 990,917 | |
Net Increase (Decrease) in Net Assets Resulting from Operations | | 586,744 | | 1,320,383 | |
Distributions | | | | | |
Net Investment Income | | (373,915 | ) | (252,433 | ) |
Realized Capital Gain1 | | (1,606 | ) | (2,112 | ) |
Total Distributions | | (375,521 | ) | (254,545 | ) |
Capital Share Transactions | | | | | |
Issued | | 4,892,911 | | 5,744,083 | |
Issued in Lieu of Cash Distributions | | 371,618 | | 251,301 | |
Redeemed | | (1,551,129 | ) | (1,731,660 | ) |
Net Increase (Decrease) from Capital Share Transactions | | 3,713,400 | | 4,263,724 | |
Total Increase (Decrease) | | 3,924,623 | | 5,329,562 | |
Net Assets | | | | | |
Beginning of Period | | 17,383,299 | | 12,053,737 | |
End of Period | | 21,307,922 | | 17,383,299 | |
1 Includes fiscal 2019 and 2018 short-term gain distributions totaling $1,606,000 and $1,946,000, respectively. Short-term gain distributions are treated as ordinary income dividends for tax purposes.
See accompanying Notes, which are an integral part of the Financial Statements.
21
Institutional Target Retirement 2045 Fund
Financial Highlights
| | | | | June 26, |
| | | | | 20151 to |
For a Share Outstanding | Year Ended September 30, | | Sept. 30, |
Throughout Each Period | 2019 | 2018 | 2017 | 2016 | 2015 |
Net Asset Value, Beginning of Period | $24.86 | $23.05 | $20.11 | $18.07 | $20.00 |
Investment Operations | | | | | |
Net Investment Income2 | .574 | .538 | .497 | .464 | .149 |
Capital Gain Distributions Received2 | — | — | .001 | .002 | — |
Net Realized and Unrealized Gain (Loss) on Investments | (.130) | 1.730 | 2.833 | 1.736 | (2.079) |
Total from Investment Operations | .444 | 2.268 | 3.331 | 2.202 | (1.930) |
Distributions | | | | | |
Dividends from Net Investment Income | (.512) | (.454) | (.389) | (.162) | — |
Distributions from Realized Capital Gains | (.002) | (.004) | (.002) | — | — |
Total Distributions | (.514) | (.458) | (.391) | (.162) | — |
Net Asset Value, End of Period | $24.79 | $24.86 | $23.05 | $20.11 | $18.07 |
| | | | | |
Total Return | 2.13% | 9.92% | 16.87% | 12.24% | -9.65% |
| | | | | |
Ratios/Supplemental Data | | | | | |
Net Assets, End of Period (Millions) | $21,308 | $17,383 | $12,054 | $6,989 | $2,317 |
Ratio of Total Expenses to Average Net Assets | — | — | — | — | — |
Acquired Fund Fees and Expenses | 0.09% | 0.09% | 0.09% | 0.10% | 0.10%3 |
Ratio of Net Investment Income to Average Net Assets | 2.41% | 2.23% | 2.33% | 2.42% | 2.79%3 |
Portfolio Turnover Rate | 4% | 6% | 5% | 1% | 0% |
| | | | | | |
1 Inception.
2 Calculated based on average shares outstanding.
3 Annualized.
See accompanying Notes, which are an integral part of the Financial Statements.
22
Institutional Target Retirement 2045 Fund
Notes to Financial Statements
Vanguard Institutional Target Retirement 2045 Fund is registered under the Investment Company Act of 1940 as an open-end investment company, or mutual fund. The fund follows a balanced investment strategy by investing in selected Vanguard funds to achieve its targeted allocation of assets to U.S. and international stocks, and U.S. and international bonds. Financial statements and other information about each underlying fund are available on vanguard.com.
A. The following significant accounting policies conform to generally accepted accounting principles for U.S. investment companies. The fund consistently follows such policies in preparing its financial statements.
1. Security Valuation: Investments are valued at the net asset value of each underlying Vanguard fund determined as of the close of the New York Stock Exchange (generally 4 p.m., Eastern time) on the valuation date.
2. Federal Income Taxes: The fund intends to continue to qualify as a regulated investment company and distribute all of its taxable income. Management has analyzed the fund’s tax positions taken for all open federal income tax years (September 30, 2016–2019), and has concluded that no provision for federal income tax is required in the fund’s financial statements.
3. Distributions: Distributions to shareholders are recorded on the ex-dividend date. Distributions are determined on a tax basis and may differ from net investment income and realized capital gains for financial reporting purposes.
4. Credit Facility: The fund and certain other funds managed by The Vanguard Group (“Vanguard”) participate in a $4.3 billion committed credit facility provided by a syndicate of lenders pursuant to a credit agreement that may be renewed annually; each fund is individually liable for its borrowings, if any, under the credit facility. Borrowings may be utilized for temporary and emergency purposes, and are subject to the fund’s regulatory and contractual borrowing restrictions. The participating funds are charged administrative fees and an annual commitment fee of 0.10% of the undrawn amount of the facility; these fees are allocated to the funds based on a method approved by the fund’s board of trustees and borne by the funds in which the fund invests (see Note B). Any borrowings under this facility bear interest at a rate based upon the higher of the one-month London Interbank Offered Rate, federal funds effective rate, or overnight bank funding rate plus an agreed-upon spread.
The fund had no borrowings outstanding at September 30, 2019, or at any time during the period then ended.
5. Other: Income and capital gain distributions received are recorded on the ex-dividend date. Security transactions are accounted for on the date securities are bought or sold. Costs used to determine realized gains (losses) on the sale of investment securities are those of the specific securities sold.
B. In accordance with the terms of a Funds’ Service Agreement (the “FSA”) between Vanguard and the fund, Vanguard furnishes to the fund investment advisory, corporate management, administrative, marketing, and distribution services at Vanguard’s cost of operations (as defined by the FSA). These costs of operations are allocated to the fund based on methods and guidelines approved by the board of trustees. The FSA provides that expenses otherwise allocable to Vanguard funds-of-funds may be reduced or eliminated to the extent of savings realized by the underlying Vanguard funds by virtue of being part of a fund-of-funds. Accordingly, all expenses for services provided by Vanguard to the fund and all other expenses incurred by the fund during the period ended September 30, 2019, were borne
23
Institutional Target Retirement 2045 Fund
by the underlying Vanguard funds in which the fund invests. The fund’s trustees and officers are also trustees and officers, respectively, of the underlying Vanguard funds, as well as directors and employees, respectively, of Vanguard.
C. Various inputs may be used to determine the value of the fund’s investments. These inputs are summarized in three broad levels for financial statement purposes. The inputs or methodologies used to value securities are not necessarily an indication of the risk associated with investing in those securities.
Level 1—Quoted prices in active markets for identical securities.
Level 2—Other significant observable inputs (including quoted prices for similar securities, interest rates, prepayment speeds, credit risk, etc.).
Level 3—Significant unobservable inputs (including the fund’s own assumptions used to determine the fair value of investments). Any investments valued with significant unobservable inputs are noted on the Statement of Net Assets.
At September 30, 2019, 100% of the market value of the fund’s investments was determined based on Level 1 inputs.
D. Permanent differences between book-basis and tax-basis components of net assets, if any, are reclassified among capital accounts in the financial statements to reflect their tax character. These reclassifications have no effect on net assets or net asset value per share.
Temporary differences between book-basis and tax-basis components of total distributable earnings (loss) arise when certain items of income, gain, or loss are recognized in different periods for financial statement and tax purposes; these differences will reverse at some time in the future. The differences are primarily related to the tax deferral of losses on wash sales. As of period end, the tax-basis components of total distributable earnings (loss) are detailed in the table as follows:
| | Amount | |
| | ($000 | ) |
Undistributed Ordinary Income | | 322,421 | |
Undistributed Long-Term Gains | | — | |
Capital Loss Carryforwards (Non-expiring) | | (5,475 | ) |
Net Unrealized Gains (Losses) | | 2,726,118 | |
As of September 30, 2019, gross unrealized appreciation and depreciation for investments based on cost for U.S. federal income tax purposes were as follows:
| | Amount | |
| | ($000 | ) |
Tax Cost | | 18,604,472 | |
Gross Unrealized Appreciation | | 2,902,978 | |
Gross Unrealized Depreciation | | (176,860 | ) |
Net Unrealized Appreciation (Depreciation) | | 2,726,118 | |
24
Institutional Target Retirement 2045 Fund
E. Capital shares issued and redeemed were:
| | Year Ended September 30, | |
| | 2019 | | 2018 | |
| | Shares | | Shares | |
| | (000 | ) | (000 | ) |
Issued | | 207,342 | | 237,715 | |
Issued in Lieu of Cash Distributions | | 17,471 | | 10,532 | |
Redeemed | | (64,485 | ) | (71,706 | ) |
Net Increase (Decrease) in Shares Outstanding | | 160,328 | | 176,541 | |
At September 30, 2019, one shareholder was the record or beneficial owner of 32% of the fund’s net assets. If the shareholder were to redeem its investment in the fund, the redemption might lead to the realization of taxable capital gains.
F. Transactions during the period in affiliated underlying Vanguard funds were as follows:
| | | | Current Period Transactions | | | |
| | Sept. 30, | | | | Proceeds | | Realized | | | | | | | | Sept. 30, | |
| | 2018 | | | | from | | Net | | Change in | | | | Capital Gain | | 2019 | |
| | Market | | Purchases | | Securities | | Gain | | Unrealized | | | | Distributions | | Market | |
| | Value | | at Cost | | Sold | | (Loss | ) | App. (Dep. | ) | Income | | Received | | Value | |
| | ($000 | ) | ($000 | ) | ($000 | ) | ($000 | ) | ($000 | ) | ($000 | ) | ($000 | ) | ($000 | ) |
Vanguard Market Liquidity Fund | | 866 | | NA1 | | NA1 | | 1 | | — | | 190 | | — | | 11,719 | |
Vanguard Total Bond Market II Index Fund | | 1,232,300 | | 540,347 | | 379,825 | | (1,296 | ) | 100,491 | | 38,657 | | — | | 1,492,017 | |
Vanguard Total International Bond Index Fund | | 506,111 | | 122,930 | | 36,811 | | (448 | ) | 45,407 | | 15,792 | | — | | 637,189 | |
Vanguard Total International Stock Index Fund | | 6,239,763 | | 1,722,956 | | 21,772 | | (646 | ) | (262,330 | ) | 204,738 | | — | | 7,677,971 | |
Vanguard Total Stock Market Index Fund | | 9,387,244 | | 2,139,887 | | 265,105 | | 1,002 | | 248,666 | | 196,520 | | — | | 11,511,694 | |
Total | | 17,366,284 | | 4,526,120 | | 703,513 | | (1,387 | ) | 132,234 | | 455,897 | | — | | 21,330,590 | |
1 Not applicable—purchases and sales are for temporary cash investment purposes.
G. Management has determined that no events or transactions occurred subsequent to September 30, 2019, that would require recognition or disclosure in these financial statements.
25
Institutional Target Retirement 2050 Fund
Performance Summary
All of the returns in this report represent past performance, which is not a guarantee of future results that may be achieved by the fund. (Current performance may be lower or higher than the performance data cited. For performance data current to the most recent month-end, visit our website at vanguard.com/performance.) Note, too, that both investment returns and principal value can fluctuate widely, so an investor’s shares, when sold, could be worth more or less than their original cost. The returns shown do not reflect taxes that a shareholder would pay on fund distributions or on the sale of fund shares.
Cumulative Performance: June 26, 2015, Through September 30, 2019
Initial Investment of $100,000,000
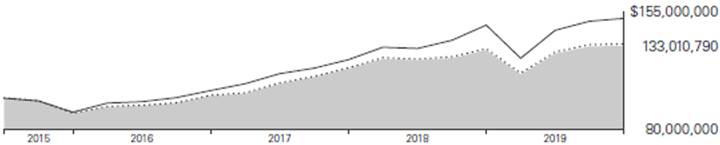
| | Average Annual Total Returns | |
| | Periods Ended September 30, 2019 | |
| | | Since | Final Value |
| | One | Inception | of a $100,000,000 |
| | Year | (6/26/2015) | Investment |

| Institutional Target Retirement 2050 Fund | 2.11% | 6.92% | $133,010,790 |

| Target 2050 Composite Index | 2.32 | 7.15 | 134,233,361 |

| MSCI US Broad Market Index | 2.91 | 10.06 | 150,458,285 |
Target 2050 Composite Index: Derived by applying the fund’s target asset allocation to the results of the following benchmarks: for international stocks of developed markets, the MSCI EAFE Index through December 15, 2010, the MSCI ACWI ex USA IMI Index through June 2, 2013, and the FTSE Global All Cap ex US Index thereafter; for emerging-market stocks, the Select Emerging Markets Index through August 23, 2006, the MSCI Emerging Markets Index through December 15, 2010, the MSCI ACWI ex USA IMI Index through June 2, 2013, and the FTSE Global All Cap ex US Index thereafter; for U.S. bonds, the Bloomberg Barclays U.S. Aggregate Bond Index through December 31, 2009, and the Bloomberg Barclays U.S. Aggregate Float Adjusted Index thereafter; for international bonds, the Bloomberg Barclays Global Aggregate ex-USD Float Adjusted RIC Capped Index Hedged beginning June 3, 2013; and for U.S. stocks, the MSCI US Broad Market Index through June 2, 2013, and the CRSP US Total Market Index thereafter. International stock benchmark returns are adjusted for withholding taxes.
“Since Inception” performance is calculated from the fund’s inception date for both the fund and its comparative standards.
See Financial Highlights for dividend and capital gains information.
26
Institutional Target Retirement 2050 Fund
Underlying Vanguard Funds
As of September 30, 2019
Vanguard Total Stock Market Index Fund Institutional Shares | 54.0% |
Vanguard Total International Stock Index Fund Investor Shares | 36.0 |
Vanguard Total Bond Market II Index Fund Investor Shares | 7.0 |
Vanguard Total International Bond Index Fund Admiral Shares | 3.0 |
27
Institutional Target Retirement 2050 Fund
Financial Statements
Statement of Net Assets
As of September 30, 2019
The fund files its complete schedule of portfolio holdings with the Securities and Exchange Commission (SEC) for the first and third quarters of each fiscal year as an exhibit to its reports on Form N-PORT. The fund’s Form N-PORT reports are available on the SEC’s website at www.sec.gov.
| | | | Market | |
| | | | Value· | |
| | Shares | | ($000 | ) |
Investment Companies (100.0%) | | | | | |
U.S. Stock Fund (54.0%) | | | | | |
| Vanguard Total Stock Market Index Fund Institutional Shares | | 117,473,967 | | 8,635,511 | |
| | | | | |
International Stock Fund (36.0%) | | | | | |
| Vanguard Total International Stock Index Fund Investor Shares | | 347,745,011 | | 5,762,135 | |
| | | | | |
U.S. Bond Fund (7.0%) | | | | | |
1 | Vanguard Total Bond Market II Index Fund Investor Shares | | 101,228,994 | | 1,121,617 | |
| | | | | |
International Bond Fund (3.0%) | | | | | |
| Vanguard Total International Bond Index Fund Admiral Shares | | 20,297,560 | | 476,993 | |
Total Investment Companies (Cost $14,173,362) | | | | 15,996,256 | |
Temporary Cash Investment (0.1%) | | | | | |
Money Market Fund (0.1%) | | | | | |
1 | Vanguard Market Liquidity Fund, 2.098% (Cost $11,719) | | 117,181 | | 11,719 | |
Total Investments (100.1%) (Cost $14,185,081) | | | | 16,007,975 | |
Other Assets and Liabilities (-0.1%) | | | | | |
Other Assets | | | | 46,832 | |
Liabilities | | | | (67,961 | ) |
| | | | (21,129 | ) |
Net Assets (100%) | | | | | |
Applicable to 644,141,732 outstanding $.001 par value shares of beneficial interest (unlimited authorization) | | | | 15,986,846 | |
Net Asset Value Per Share | | | | $24.82 | |
28
Institutional Target Retirement 2050 Fund
| | Amount | |
| | ($000 | ) |
Statement of Assets and Liabilities | | | |
Assets | | | |
Investments in Securities, at Value—Affiliated Funds | | 16,007,975 | |
Receivables for Investment Securities Sold | | 24,579 | |
Receivables for Accrued Income | | 2,853 | |
Receivables for Capital Shares Issued | | 19,400 | |
Total Assets | | 16,054,807 | |
Liabilities | | | |
Payables for Investment Securities Purchased | | 2,853 | |
Payables for Capital Shares Redeemed | | 65,108 | |
Total Liabilities | | 67,961 | |
Net Assets | | 15,986,846 | |
| | | |
| | | |
At September 30, 2019, net assets consisted of: | | | |
| | Amount | |
| | ($000 | ) |
Paid-in Capital | | 13,927,710 | |
Total Distributable Earnings (Loss) | | 2,059,136 | |
Net Assets | | 15,986,846 | |
· See Note A in Notes to Financial Statements.
1 Affiliated fund available only to Vanguard funds and certain trusts and accounts managed by Vanguard. Rate shown for Vanguard Market Liquidity Fund is the 7-day yield.
See accompanying Notes, which are an integral part of the Financial Statements.
29
Institutional Target Retirement 2050 Fund
Statement of Operations
| | Year Ended | |
| | September 30, 2019 | |
| | ($000 | ) |
Investment Income | | | |
Income | | | |
Income Distributions Received from Affiliated Funds | | 334,430 | |
Net Investment Income – Note B | | 334,430 | |
Realized Net Gain (Loss) | | | |
Capital Gain Distributions Received from Affiliated Funds | | — | |
Affiliated Funds Sold | | 2,294 | |
Futures Contracts | | (37 | ) |
Realized Net Gain (Loss) | | 2,257 | |
Change in Unrealized Appreciation (Depreciation) from Affiliated Funds | | 120,178 | |
Net Increase (Decrease) in Net Assets Resulting from Operations | | 456,865 | |
See accompanying Notes, which are an integral part of the Financial Statements.
30
Institutional Target Retirement 2050 Fund
Statement of Changes in Net Assets
| | Year Ended September 30, | |
| | 2019 | | 2018 | |
| | ($000 | ) | ($000 | ) |
Increase (Decrease) in Net Assets | | | | | |
Operations | | | | | |
Net Investment Income | | 334,430 | | 228,922 | |
Realized Net Gain (Loss) | | 2,257 | | (3,969 | ) |
Change in Unrealized Appreciation (Depreciation) | | 120,178 | | 672,212 | |
Net Increase (Decrease) in Net Assets Resulting from Operations | | 456,865 | | 897,165 | |
Distributions | | | | | |
Net Investment Income | | (263,732 | ) | (165,211 | ) |
Realized Capital Gain1 | | (315 | ) | (1,818 | ) |
Total Distributions | | (264,047 | ) | (167,029 | ) |
Capital Share Transactions | | | | | |
Issued | | 4,332,507 | | 4,756,671 | |
Issued in Lieu of Cash Distributions | | 261,168 | | 164,754 | |
Redeemed | | (1,150,088 | ) | (1,251,343 | ) |
Net Increase (Decrease) from Capital Share Transactions | | 3,443,587 | | 3,670,082 | |
Total Increase (Decrease) | | 3,636,405 | | 4,400,218 | |
Net Assets | | | | | |
Beginning of Period | | 12,350,441 | | 7,950,223 | |
End of Period | | 15,986,846 | | 12,350,441 | |
1 Includes fiscal 2019 and 2018 short-term gain distributions totaling $315,000 and $1,707,000, respectively. Short-term gain distributions are treated as ordinary income dividends for tax purposes.
See accompanying Notes, which are an integral part of the Financial Statements.
31
Institutional Target Retirement 2050 Fund
Financial Highlights
| | | | | June 26, |
| | | | | 20151 to |
For a Share Outstanding | Year Ended September 30, | | Sept. 30, |
Throughout Each Period | 2019 | 2018 | 2017 | 2016 | 2015 |
Net Asset Value, Beginning of Period | $24.88 | $23.07 | $20.11 | $18.07 | $20.00 |
Investment Operations | | | | | |
Net Investment Income2 | .577 | .542 | .503 | .466 | .149 |
Capital Gain Distributions Received2 | — | — | .001 | .002 | — |
Net Realized and Unrealized Gain (Loss) on Investments | (.134) | 1.718 | 2.838 | 1.732 | (2.079) |
Total from Investment Operations | .443 | 2.260 | 3.342 | 2.200 | (1.930) |
Distributions | | | | | |
Dividends from Net Investment Income | (.502) | (.445) | (.380) | (.160) | — |
Distributions from Realized Capital Gains | (.001) | (.005) | (.002) | — | — |
Total Distributions | (.503) | (.450) | (.382) | (.160) | — |
Net Asset Value, End of Period | $24.82 | $24.88 | $23.07 | $20.11 | $18.07 |
| | | | | |
Total Return | 2.11% | 9.88% | 16.92% | 12.23% | -9.65% |
| | | | | |
Ratios/Supplemental Data | | | | | |
Net Assets, End of Period (Millions) | $15,987 | $12,350 | $7,950 | $4,329 | $1,259 |
Ratio of Total Expenses to Average Net Assets | — | — | — | — | — |
Acquired Fund Fees and Expenses | 0.09% | 0.09% | 0.09% | 0.10% | 0.10%3 |
Ratio of Net Investment Income to Average Net Assets | 2.42% | 2.24% | 2.34% | 2.43% | 2.81%3 |
Portfolio Turnover Rate | 3% | 5% | 5% | 1% | 1% |
| | | | | | |
1 Inception.
2 Calculated based on average shares outstanding.
3 Annualized.
See accompanying Notes, which are an integral part of the Financial Statements.
32
Institutional Target Retirement 2050 Fund
Notes to Financial Statements
Vanguard Institutional Target Retirement 2050 Fund is registered under the Investment Company Act of 1940 as an open-end investment company, or mutual fund. The fund follows a balanced investment strategy by investing in selected Vanguard funds to achieve its targeted allocation of assets to U.S. and international stocks, and U.S. and international bonds. Financial statements and other information about each underlying fund are available on vanguard.com.
A. The following significant accounting policies conform to generally accepted accounting principles for U.S. investment companies. The fund consistently follows such policies in preparing its financial statements.
1. Security Valuation: Investments are valued at the net asset value of each underlying Vanguard fund determined as of the close of the New York Stock Exchange (generally 4 p.m., Eastern time) on the valuation date.
2. Futures Contracts: The fund uses stock and bond futures contracts to a limited extent, with the objectives of maintaining full exposure to the market and maintaining its target asset allocation. The primary risks associated with the use of futures contracts are imperfect correlation between changes in market values of investments held by the fund and the prices of futures contracts, and the possibility of an illiquid market. Counterparty risk involving futures is mitigated because a regulated clearinghouse is the counterparty instead of the clearing broker. To further mitigate counterparty risk, the fund trades futures contracts on an exchange, monitors the financial strength of its clearing brokers and clearinghouse, and has entered into clearing agreements with its clearing brokers. The clearinghouse imposes initial margin requirements to secure the fund’s performance and requires daily settlement of variation margin representing changes in the market value of each contract. Any assets pledged as initial margin for open contracts are noted in the Statement of Net Assets.
Futures contracts are valued at their quoted daily settlement prices. The notional amounts of the contracts are not recorded in the Statement of Net Assets. Fluctuations in the value of the contracts are recorded in the Statement of Assets and Liabilities as an asset (liability) and in the Statement of Operations as unrealized appreciation (depreciation) until the contracts are closed, when they are recorded as realized futures gains (losses).
During the year ended September 30, 2019, the fund’s average investments in long and short futures contracts represented less than 1% and 0% of net assets, respectively, based on the average of the notional amounts at each quarter-end during the period. The fund had no open futures contracts at September 30, 2019.
3. Federal Income Taxes: The fund intends to continue to qualify as a regulated investment company and distribute all of its taxable income. Management has analyzed the fund’s tax positions taken for all open federal income tax years (September 30, 2016—2019), and has concluded that no provision for federal income tax is required in the fund’s financial statements.
4. Distributions: Distributions to shareholders are recorded on the ex-dividend date. Distributions are determined on a tax basis and may differ from net investment income and realized capital gains for financial reporting purposes.
33
Institutional Target Retirement 2050 Fund
5. Credit Facility: The fund and certain other funds managed by The Vanguard Group (“Vanguard”) participate in a $4.3 billion committed credit facility provided by a syndicate of lenders pursuant to a credit agreement that may be renewed annually; each fund is individually liable for its borrowings, if any, under the credit facility. Borrowings may be utilized for temporary and emergency purposes, and are subject to the fund’s regulatory and contractual borrowing restrictions. The participating funds are charged administrative fees and an annual commitment fee of 0.10% of the undrawn amount of the facility; these fees are allocated to the funds based on a method approved by the fund’s board of trustees and borne by the funds in which the fund invests (see Note B). Any borrowings under this facility bear interest at a rate based upon the higher of the one-month London Interbank Offered Rate, federal funds effective rate, or overnight bank funding rate plus an agreed-upon spread.
The fund had no borrowings outstanding at September 30, 2019, or at any time during the period then ended.
6. Other: Income and capital gain distributions received are recorded on the ex-dividend date. Security transactions are accounted for on the date securities are bought or sold. Costs used to determine realized gains (losses) on the sale of investment securities are those of the specific securities sold.
B. In accordance with the terms of a Funds’ Service Agreement (the “FSA”) between Vanguard and the fund, Vanguard furnishes to the fund investment advisory, corporate management, administrative, marketing, and distribution services at Vanguard’s cost of operations (as defined by the FSA). These costs of operations are allocated to the fund based on methods and guidelines approved by the board of trustees. The FSA provides that expenses otherwise allocable to Vanguard funds-of-funds may be reduced or eliminated to the extent of savings realized by the underlying Vanguard funds by virtue of being part of a fund-of-funds. Accordingly, all expenses for services provided by Vanguard to the fund and all other expenses incurred by the fund during the period ended September 30, 2019, were borne by the underlying Vanguard funds in which the fund invests. The fund’s trustees and officers are also trustees and officers, respectively, of the underlying Vanguard funds, as well as directors and employees, respectively, of Vanguard.
C. Various inputs may be used to determine the value of the fund’s investments. These inputs are summarized in three broad levels for financial statement purposes. The inputs or methodologies used to value securities are not necessarily an indication of the risk associated with investing in those securities.
Level 1—Quoted prices in active markets for identical securities.
Level 2—Other significant observable inputs (including quoted prices for similar securities, interest rates, prepayment speeds, credit risk, etc.).
Level 3—Significant unobservable inputs (including the fund’s own assumptions used to determine the fair value of investments). Any investments valued with significant unobservable inputs are noted on the Statement of Net Assets.
At September 30, 2019, 100% of the market value of the fund’s investments was determined based on Level 1 inputs.
34
Institutional Target Retirement 2050 Fund
D. Permanent differences between book-basis and tax-basis components of net assets, if any, are reclassified among capital accounts in the financial statements to reflect their tax character. These reclassifications have no effect on net assets or net asset value per share.
Temporary differences between book-basis and tax-basis components of total distributable earnings (loss) arise when certain items of income, gain, or loss are recognized in different periods for financial statement and tax purposes; these differences will reverse at some time in the future. The differences are primarily related to the tax deferral of losses on wash sales. As of period end, the tax-basis components of total distributable earnings (loss) are detailed in the table as follows:
| | Amount | |
| | ($000 | ) |
Undistributed Ordinary Income | | 238,498 | |
Undistributed Long-Term Gains | | — | |
Capital Loss Carryforwards (Non-expiring) | | (2,256 | ) |
Net Unrealized Gains (Losses) | | 1,822,894 | |
As of September 30, 2019, gross unrealized appreciation and depreciation for investments based on cost for U.S. federal income tax purposes were as follows:
| | Amount | |
| | ($000 | ) |
Tax Cost | | 14,185,081 | |
Gross Unrealized Appreciation | | 1,970,992 | |
Gross Unrealized Depreciation | | (148,098 | ) |
Net Unrealized Appreciation (Depreciation) | | 1,822,894 | |
E. Capital shares issued and redeemed were:
| | Year Ended September 30, | |
| | 2019 | | 2018 | |
| | Shares | | Shares | |
| | (000 | ) | (000 | ) |
Issued | | 183,192 | | 196,601 | |
Issued in Lieu of Cash Distributions | | 12,261 | | 6,899 | |
Redeemed | | (47,748 | ) | (51,709 | ) |
Net Increase (Decrease) in Shares Outstanding | | 147,705 | | 151,791 | |
At September 30, 2019, one shareholder was the record or beneficial owner of 31% of the fund’s net assets. If the shareholder were to redeem its investment in the fund, the redemption might lead to the realization of taxable capital gains.
35
Institutional Target Retirement 2050 Fund
F. Transactions during the period in affiliated underlying Vanguard funds were as follows:
| | | | Current Period Transactions | | | |
| | Sept. 30, | | | | Proceeds | | Realized | | | | | | | | Sept. 30, | |
| | 2018 | | | | from | | Net | | Change in | | | | Capital Gain | | 2019 | |
| | Market | | Purchases | | Securities | | Gain | | Unrealized | | | | Distributions | | Market | |
| | Value | | at Cost | | Sold | | (Loss | ) | App. (Dep. | ) | Income | | Received | | Value | |
| | ($000 | ) | ($000 | ) | ($000 | ) | ($000 | ) | ($000 | ) | ($000 | ) | ($000 | ) | ($000 | ) |
Vanguard Market Liquidity Fund | | 681 | | NA1 | | NA1 | | (1 | ) | — | | 159 | | — | | 11,719 | |
Vanguard Total Bond Market II Index Fund | | 876,026 | | 374,916 | | 201,890 | | (1,150 | ) | 73,715 | | 28,287 | | — | | 1,121,617 | |
Vanguard Total International Bond Index Fund | | 358,043 | | 100,706 | | 14,813 | | (119 | ) | 33,176 | | 11,324 | | — | | 476,993 | |
Vanguard Total International Stock Index Fund | | 4,437,779 | | 1,507,495 | | 1,791 | | 3,121 | | (184,469 | ) | 150,423 | | — | | 5,762,135 | |
Vanguard Total Stock Market Index Fund | | 6,661,087 | | 1,939,440 | | 163,215 | | 443 | | 197,756 | | 144,237 | | — | | 8,635,511 | |
Total | | 12,333,616 | | 3,922,557 | | 381,709 | | 2,294 | | 120,178 | | 334,430 | | — | | 16,007,975 | |
1 Not applicable—purchases and sales are for temporary cash investment purposes.
G. Management has determined that no events or transactions occurred subsequent to September 30, 2019, that would require recognition or disclosure in these financial statements.
36
Institutional Target Retirement 2055 Fund
Performance Summary
All of the returns in this report represent past performance, which is not a guarantee of future results that may be achieved by the fund. (Current performance may be lower or higher than the performance data cited. For performance data current to the most recent month-end, visit our website at vanguard.com/performance.) Note, too, that both investment returns and principal value can fluctuate widely, so an investor’s shares, when sold, could be worth more or less than their original cost. The returns shown do not reflect taxes that a shareholder would pay on fund distributions or on the sale of fund shares.
Cumulative Performance: June 26, 2015, Through September 30, 2019
Initial Investment of $100,000,000

| | Average Annual Total Returns | |
| | Periods Ended September 30, 2019 | |
| | | Since | Final Value |
| | One | Inception | of a $100,000,000 |
| | Year | (6/26/2015) | Investment |

| Institutional Target Retirement 2055 Fund | 2.16% | 6.93% | $133,056,948 |

| Target 2055 Composite Index | 2.32 | 7.15 | 134,233,361 |

| MSCI US Broad Market Index | 2.91 | 10.06 | 150,458,285 |
Target 2055 Composite Index: Derived by applying the fund’s target asset allocation to the results of the following benchmarks: for international stocks of developed markets, the MSCI EAFE Index through December 15, 2010, the MSCI ACWI ex USA IMI Index through June 2, 2013, and the FTSE Global All Cap ex US Index thereafter; for emerging-market stocks, the MSCI Emerging Markets Index through December 15, 2010, the MSCI ACWI ex USA IMI Index through June 2, 2013, and the FTSE Global All Cap ex US Index thereafter; for U.S. bonds, the Bloomberg Barclays U.S. Aggregate Float Adjusted Index; for international bonds, the Bloomberg Barclays Global Aggregate ex-USD Float Adjusted RIC Capped Index Hedged beginning June 3, 2013; and for U.S. stocks, the MSCI US Broad Market Index through June 2, 2013, and the CRSP US Total Market Index thereafter. International stock benchmark returns are adjusted for withholding taxes.
“Since Inception” performance is calculated from the fund’s inception date for both the fund and its comparative standards.
See Financial Highlights for dividend and capital gains information.
37
Institutional Target Retirement 2055 Fund
Underlying Vanguard Funds
As of September 30, 2019
Vanguard Total Stock Market Index Fund Institutional Shares | 54.0% |
Vanguard Total International Stock Index Fund Investor Shares | 35.9 |
Vanguard Total Bond Market II Index Fund Investor Shares | 7.2 |
Vanguard Total International Bond Index Fund Admiral Shares | 2.9 |
38
Institutional Target Retirement 2055 Fund
Financial Statements
Statement of Net Assets
As of September 30, 2019
The fund files its complete schedule of portfolio holdings with the Securities and Exchange Commission (SEC) for the first and third quarters of each fiscal year as an exhibit to its reports on Form N-PORT. The fund’s Form N-PORT reports are available on the SEC’s website at www.sec.gov.
| | | | Market | |
| | | | Value· | |
| | Shares | | ($000 | ) |
Investment Companies (100.1%) | | | | | |
U.S. Stock Fund (54.1%) | | | | | |
| Vanguard Total Stock Market Index Fund Institutional Shares | | 58,548,189 | | 4,303,877 | |
| | | | | |
International Stock Fund (35.9%) | | | | | |
| Vanguard Total International Stock Index Fund Investor Shares | | 172,590,983 | | 2,859,833 | |
| | | | | |
U.S. Bond Fund (7.2%) | | | | | |
1 | Vanguard Total Bond Market II Index Fund Investor Shares | | 51,818,017 | | 574,144 | |
| | | | | |
International Bond Fund (2.9%) | | | | | |
| Vanguard Total International Bond Index Fund Admiral Shares | | 9,889,534 | | 232,404 | |
Total Investment Companies (Cost $7,212,612) | | | | 7,970,258 | |
Temporary Cash Investment (0.1%) | | | | | |
Money Market Fund (0.1%) | | | | | |
1 | Vanguard Market Liquidity Fund, 2.098% (Cost $9,364) | | 93,634 | | 9,364 | |
Total Investments (100.2%) (Cost $7,221,976) | | | | 7,979,622 | |
Other Assets and Liabilities (-0.2%) | | | | | |
Other Assets | | | | 16,297 | |
Liabilities | | | | (31,622 | ) |
| | | | (15,325 | ) |
Net Assets (100%) | | | | | |
Applicable to 319,967,608 outstanding $.001 par value shares of beneficial interest (unlimited authorization) | | | | 7,964,297 | |
|
Net Asset Value Per Share | | | | $24.89 | |
39
Institutional Target Retirement 2055 Fund
| | Amount | |
| | ($000 | ) |
Statement of Assets and Liabilities | | | |
Assets | | | |
Investments in Securities, at Value—Affiliated Funds | | 7,979,622 | |
Receivables for Accrued Income | | 1,415 | |
Receivables for Capital Shares Issued | | 14,882 | |
Total Assets | | 7,995,919 | |
Liabilities | | | |
Payables for Investment Securities Purchased | | 9,392 | |
Payables for Capital Shares Redeemed | | 22,230 | |
Total Liabilities | | 31,622 | |
Net Assets | | 7,964,297 | |
| | | |
At September 30, 2019, net assets consisted of: | | | |
| | Amount | |
| | ($000 | ) |
Paid-in Capital | | 7,091,656 | |
Total Distributable Earnings (Loss) | | 872,641 | |
Net Assets | | 7,964,297 | |
· See Note A in Notes to Financial Statements.
1 Affiliated fund available only to Vanguard funds and certain trusts and accounts managed by Vanguard. Rate shown for Vanguard Market Liquidity Fund is the 7-day yield.
See accompanying Notes, which are an integral part of the Financial Statements.
40
Institutional Target Retirement 2055 Fund
Statement of Operations
| | Year Ended | |
| | September 30, 2019 | |
| | ($000 | ) |
Investment Income | | | |
Income | | | |
Income Distributions Received from Affiliated Funds | | 158,297 | |
Net Investment Income—Note B | | 158,297 | |
Realized Net Gain (Loss) | | | |
Capital Gain Distributions Received from Affiliated Funds | | — | |
Affiliated Funds Sold | | 2,477 | |
Realized Net Gain (Loss) | | 2,477 | |
Change in Unrealized Appreciation (Depreciation) from Affiliated Funds | | 77,656 | |
Net Increase (Decrease) in Net Assets Resulting from Operations | | 238,430 | |
See accompanying Notes, which are an integral part of the Financial Statements.
41
Institutional Target Retirement 2055 Fund
Statement of Changes in Net Assets
| | Year Ended September 30, | |
| | 2019 | | 2018 | |
| | ($000 | ) | ($000 | ) |
Increase (Decrease) in Net Assets | | | | | |
Operations | | | | | |
Net Investment Income | | 158,297 | | 97,893 | |
Realized Net Gain (Loss) | | 2,477 | | (2,031 | ) |
Change in Unrealized Appreciation (Depreciation) | | 77,656 | | 285,834 | |
Net Increase (Decrease) in Net Assets Resulting from Operations | | 238,430 | | 381,696 | |
Distributions | | | | | |
Net Investment Income | | (115,930 | ) | (66,180 | ) |
Realized Capital Gain1 | | (238 | ) | (970 | ) |
Total Distributions | | (116,168 | ) | (67,150 | ) |
Capital Share Transactions | | | | | |
Issued | | 2,789,307 | | 2,472,995 | |
Issued in Lieu of Cash Distributions | | 114,709 | | 66,096 | |
Redeemed | | (550,492 | ) | (577,670 | ) |
Net Increase (Decrease) from Capital Share Transactions | | 2,353,524 | | 1,961,421 | |
Total Increase (Decrease) | | 2,475,786 | | 2,275,967 | |
Net Assets | | | | | |
Beginning of Period | | 5,488,511 | | 3,212,544 | |
End of Period | | 7,964,297 | | 5,488,511 | |
1 Includes fiscal 2019 and 2018 short-term gain distributions totaling $214,000 and $939,000, respectively. Short-term gain distributions are treated as ordinary income dividends for tax purposes.
See accompanying Notes, which are an integral part of the Financial Statements.
42
Institutional Target Retirement 2055 Fund
Financial Highlights
| | | | | June 26, |
| | | | | 20151 to |
For a Share Outstanding | Year Ended September 30, | | Sept. 30, |
Throughout Each Period | 2019 | 2018 | 2017 | 2016 | 2015 |
Net Asset Value, Beginning of Period | $24.92 | $23.10 | $20.11 | $18.08 | $20.00 |
Investment Operations | | | | | |
Net Investment Income2 | .582 | .547 | .506 | .470 | .157 |
Capital Gain Distributions Received2 | — | — | .001 | .001 | — |
Net Realized and Unrealized Gain (Loss) on Investments | (.125) | 1.709 | 2.845 | 1.718 | (2.077) |
Total from Investment Operations | .457 | 2.256 | 3.352 | 2.189 | (1.920) |
Distributions | | | | | |
Dividends from Net Investment Income | (.486) | (.430) | (.360) | (.158) | — |
Distributions from Realized Capital Gains | (.001) | (.006) | (.002) | (.001) | — |
Total Distributions | (.487) | (.436) | (.362) | (.159) | — |
Net Asset Value, End of Period | $24.89 | $24.92 | $23.10 | $20.11 | $18.08 |
| | | | | |
Total Return | 2.16% | 9.84% | 16.95% | 12.16% | -9.60% |
| | | | | |
Ratios/Supplemental Data | | | | | |
Net Assets, End of Period (Millions) | $7,964 | $5,489 | $3,213 | $1,527 | $373 |
Ratio of Total Expenses to Average Net Assets | — | — | — | — | — |
Acquired Fund Fees and Expenses | 0.09% | 0.09% | 0.09% | 0.10% | 0.10%3 |
Ratio of Net Investment Income to Average Net Assets | 2.44% | 2.26% | 2.36% | 2.47% | 3.05%3 |
Portfolio Turnover Rate | 3% | 5% | 6% | 1% | 1% |
| | | | | | |
1 Inception.
2 Calculated based on average shares outstanding.
3 Annualized.
See accompanying Notes, which are an integral part of the Financial Statements.
43
Institutional Target Retirement 2055 Fund
Notes to Financial Statements
Vanguard Institutional Target Retirement 2055 Fund is registered under the Investment Company Act of 1940 as an open-end investment company, or mutual fund. The fund follows a balanced investment strategy by investing in selected Vanguard funds to achieve its targeted allocation of assets to U.S. and international stocks, and U.S. and international bonds. Financial statements and other information about each underlying fund are available on vanguard.com.
A. The following significant accounting policies conform to generally accepted accounting principles for U.S. investment companies. The fund consistently follows such policies in preparing its financial statements.
1. Security Valuation: Investments are valued at the net asset value of each underlying Vanguard fund determined as of the close of the New York Stock Exchange (generally 4 p.m., Eastern time) on the valuation date.
2. Federal Income Taxes: The fund intends to continue to qualify as a regulated investment company and distribute all of its taxable income. Management has analyzed the fund’s tax positions taken for all open federal income tax years (September 30, 2016–2019), and has concluded that no provision for federal income tax is required in the fund’s financial statements.
3. Distributions: Distributions to shareholders are recorded on the ex-dividend date. Distributions are determined on a tax basis and may differ from net investment income and realized capital gains for financial reporting purposes.
4. Credit Facility: The fund and certain other funds managed by The Vanguard Group (“Vanguard”) participate in a $4.3 billion committed credit facility provided by a syndicate of lenders pursuant to a credit agreement that may be renewed annually; each fund is individually liable for its borrowings, if any, under the credit facility. Borrowings may be utilized for temporary and emergency purposes, and are subject to the fund’s regulatory and contractual borrowing restrictions. The participating funds are charged administrative fees and an annual commitment fee of 0.10% of the undrawn amount of the facility; these fees are allocated to the funds based on a method approved by the fund’s board of trustees and borne by the funds in which the fund invests (see Note B). Any borrowings under this facility bear interest at a rate based upon the higher of the one-month London Interbank Offered Rate, federal funds effective rate, or overnight bank funding rate plus an agreed-upon spread.
The fund had no borrowings outstanding at September 30, 2019, or at any time during the period then ended.
5. Other: Income and capital gain distributions received are recorded on the ex-dividend date. Security transactions are accounted for on the date securities are bought or sold. Costs used to determine realized gains (losses) on the sale of investment securities are those of the specific securities sold.
B. In accordance with the terms of a Funds’ Service Agreement (the “FSA”) between Vanguard and the fund, Vanguard furnishes to the fund investment advisory, corporate management, administrative, marketing, and distribution services at Vanguard’s cost of operations (as defined by the FSA). These costs of operations are allocated to the fund based on methods and guidelines approved by the board of trustees. The FSA provides that expenses otherwise allocable to Vanguard funds-of-funds may be reduced or eliminated to the extent of savings realized by the underlying Vanguard funds by virtue of being part of a fund-of-funds. Accordingly, all expenses for services provided by Vanguard to the fund
44
Institutional Target Retirement 2055 Fund
and all other expenses incurred by the fund during the period ended September 30, 2019, were borne by the underlying Vanguard funds in which the fund invests. The fund’s trustees and officers are also trustees and officers, respectively, of the underlying Vanguard funds, as well as directors and employees, respectively, of Vanguard.
C. Various inputs may be used to determine the value of the fund’s investments. These inputs are summarized in three broad levels for financial statement purposes. The inputs or methodologies used to value securities are not necessarily an indication of the risk associated with investing in those securities.
Level 1—Quoted prices in active markets for identical securities.
Level 2—Other significant observable inputs (including quoted prices for similar securities, interest rates, prepayment speeds, credit risk, etc.).
Level 3—Significant unobservable inputs (including the fund’s own assumptions used to determine the fair value of investments). Any investments valued with significant unobservable inputs are noted on the Statement of Net Assets.
At September 30, 2019, 100% of the market value of the fund’s investments was determined based on Level 1 inputs.
D. Permanent differences between book-basis and tax-basis components of net assets, if any, are reclassified among capital accounts in the financial statements to reflect their tax character. These reclassifications have no effect on net assets or net asset value per share.
Temporary differences between book-basis and tax-basis components of total distributable earnings (loss) arise when certain items of income, gain, or loss are recognized in different periods for financial statement and tax purposes; these differences will reverse at some time in the future. The differences are primarily related to the tax deferral of losses on wash sales. As of period end, the tax-basis components of total distributable earnings (loss) are detailed in the table as follows:
| | Amount | |
| | ($000 | ) |
Undistributed Ordinary Income | | 114,995 | |
Undistributed Long-Term Gains | | — | |
Capital Loss Carryforwards (Non-expiring) | | — | |
Net Unrealized Gains (Losses) | | 757,646 | |
As of September 30, 2019, gross unrealized appreciation and depreciation for investments based on cost for U.S. federal income tax purposes were as follows:
| | Amount | |
| | ($000 | ) |
Tax Cost | | 7,221,976 | |
Gross Unrealized Appreciation | | 833,671 | |
Gross Unrealized Depreciation | | (76,025 | ) |
Net Unrealized Appreciation (Depreciation) | | 757,646 | |
45
Institutional Target Retirement 2055 Fund
E. Capital shares issued and redeemed were:
| | Year Ended September 30, | |
| | 2019 | | 2018 | |
| | Shares | | Shares | |
| | (000 | ) | (000 | ) |
Issued | | 117,144 | | 102,186 | |
Issued in Lieu of Cash Distributions | | 5,370 | | 2,762 | |
Redeemed | | (22,775 | ) | (23,816 | ) |
Net Increase (Decrease) in Shares Outstanding | | 99,739 | | 81,132 | |
At September 30, 2019, one shareholder was the record or beneficial owner of 29% of the fund’s net assets. If the shareholder were to redeem its investment in the fund, the redemption might lead to the realization of taxable capital gains.
F. Transactions during the period in affiliated underlying Vanguard funds were as follows:
| | | | Current Period Transactions | | |
| | Sept. 30, | | | Proceeds | Realized | | | | | Sept. 30, |
| | 2018 | | | from | Net | Change in | | Capital Gain | | 2019 |
| | Market | | Purchases | Securities | Gain | Unrealized | | Distributions | | Market |
| | Value | | at Cost | Sold | (Loss) | App. (Dep.) | Income | Received | | Value |
| | ($000 | ) | ($000) | ($000) | ($000) | ($000) | ($000) | ($000 | ) | ($000) |
Vanguard Market Liquidity Fund | | 1,254 | | NA1 | NA1 | — | — | 91 | — | | 9,364 |
Vanguard Total Bond Market II Index Fund | | 389,697 | | 236,880 | 87,077 | 583 | 34,061 | 13,315 | — | | 574,144 |
Vanguard Total International Bond Index Fund | | 158,470 | | 59,208 | 1,000 | — | 15,726 | 5,154 | — | | 232,404 |
Vanguard Total International Stock Index Fund | | 1,970,859 | | 972,785 | 4,589 | 1,797 | (81,019) | 71,373 | — | | 2,859,833 |
Vanguard Total Stock Market Index Fund | | 2,959,172 | | 1,315,584 | 79,864 | 97 | 108,888 | 68,364 | — | | 4,303,877 |
Total | | 5,479,452 | | 2,584,457 | 172,530 | 2,477 | 77,656 | 158,297 | — | | 7,979,622 |
1 Not applicable—purchases and sales are for temporary cash investment purposes.
G. Management has determined that no events or transactions occurred subsequent to September 30, 2019, that would require recognition or disclosure in these financial statements.
46
Institutional Target Retirement 2060 Fund
Performance Summary
All of the returns in this report represent past performance, which is not a guarantee of future results that may be achieved by the fund. (Current performance may be lower or higher than the performance data cited. For performance data current to the most recent month-end, visit our website at vanguard.com/performance.) Note, too, that both investment returns and principal value can fluctuate widely, so an investor’s shares, when sold, could be worth more or less than their original cost. The returns shown do not reflect taxes that a shareholder would pay on fund distributions or on the sale of fund shares.
Cumulative Performance: June 26, 2015, Through September 30, 2019
Initial Investment of $100,000,000
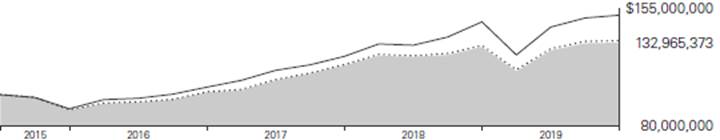
| | | | Average Annual Total Returns | | |
| | | | Periods Ended September 30, 2019 | | |
| | | | | | Since | | Final Value |
| | | | One | | Inception | | of a $100,000,000 |
| | | | Year | | (6/26/2015) | | Investment |

| | Institutional Target Retirement 2060 Fund | | 2.15% | | 6.91% | | $132,965,373 |

| | Target 2060 Composite Index | | 2.32 | | 7.15 | | 134,233,361 |

| | MSCI US Broad Market Index | | 2.91 | | 10.06 | | 150,458,285 |
Target 2060 Composite Index: Derived by applying the fund’s target asset allocation to the results of the following benchmarks: for international stocks of developed markets, the MSCI ACWI ex USA IMI Index through June 2, 2013, and the FTSE Global All Cap ex US Index thereafter; for emerging-market stocks, the MSCI ACWI ex USA IMI Index through June 2, 2013, and the FTSE Global All Cap ex US Index thereafter; for U.S. bonds, the Bloomberg Barclays U.S. Aggregate Float Adjusted Index; for international bonds, the Bloomberg Barclays Global Aggregate ex-USD Float Adjusted RIC Capped Index Hedged beginning June 3, 2013; and for U.S. stocks, the MSCI US Broad Market Index through June 2, 2013, and the CRSP US Total Market Index thereafter. International stock benchmark returns are adjusted for withholding taxes.
“Since Inception” performance is calculated from the fund’s inception date for both the fund and its comparative standards.
See Financial Highlights for dividend and capital gains information.
47
Institutional Target Retirement 2060 Fund
Underlying Vanguard Funds
As of September 30, 2019
Vanguard Total Stock Market Index Fund Institutional Shares | | 54.2% |
Vanguard Total International Stock Index Fund Investor Shares | | 35.8 |
Vanguard Total Bond Market II Index Fund Investor Shares | | 7.2 |
Vanguard Total International Bond Index Fund Admiral Shares | | 2.8 |
48
Institutional Target Retirement 2060 Fund
Financial Statements
Statement of Net Assets
As of September 30, 2019
The fund files its complete schedule of portfolio holdings with the Securities and Exchange Commission (SEC) for the first and third quarters of each fiscal year as an exhibit to its reports on Form N-PORT. The fund’s Form N-PORT reports are available on the SEC’s website at www.sec.gov.
| | | | Market | |
| | | | Value· | |
| | Shares | | ($000 | ) |
Investment Companies (99.9%) | | | | | |
U.S. Stock Fund (54.0%) | | | | | |
Vanguard Total Stock Market Index Fund Institutional Shares | | 18,761,750 | | 1,379,176 | |
| | | | | |
International Stock Fund (35.8%) | | | | | |
Vanguard Total International Stock Index Fund Investor Shares | | 55,170,465 | | 914,175 | |
| | | | | |
U.S. Bond Fund (7.3%) | | | | | |
1 | Vanguard Total Bond Market II Index Fund Investor Shares | | 16,678,261 | | 184,795 | |
| | | | | |
International Bond Fund (2.8%) | | | | | |
Vanguard Total International Bond Index Fund Admiral Shares | | 3,072,406 | | 72,202 | |
Total Investment Companies (Cost $2,353,644) | | | | 2,550,348 | |
Temporary Cash Investment (0.2%) | | | | | |
Money Market Fund (0.2%) | | | | | |
1 | Vanguard Market Liquidity Fund, 2.098% (Cost $4,930) | | 49,296 | | 4,930 | |
Total Investments (100.1%) (Cost $2,358,574) | | | | 2,555,278 | |
Other Assets and Liabilities (-0.1%) | | | | | |
Other Assets | | | | 6,602 | |
Liabilities | | | | (9,373 | ) |
| | | | (2,771 | ) |
Net Assets (100%) | | | | | |
Applicable to 102,515,401 outstanding $.001 par value shares of beneficial interest (unlimited authorization) | | | | 2,552,507 | |
|
Net Asset Value Per Share | | | | $24.90 | |
49
Institutional Target Retirement 2060 Fund
| | Amount | |
| | ($000 | ) |
Statement of Assets and Liabilities | | | |
Assets | | | |
Investments in Securities, at Value—Affiliated Funds | | 2,555,278 | |
Receivables for Accrued Income | | 501 | |
Receivables for Capital Shares Issued | | 6,101 | |
Total Assets | | 2,561,880 | |
Liabilities | | | |
Payables for Investment Securities Purchased | | 6,241 | |
Payables for Capital Shares Redeemed | | 3,132 | |
Total Liabilities | | 9,373 | |
Net Assets | | 2,552,507 | |
| | | |
At September 30, 2019, net assets consisted of: | | | |
| | Amount | |
| | ($000 | ) |
Paid-in Capital | | 2,320,279 | |
Total Distributable Earnings (Loss) | | 232,228 | |
Net Assets | | 2,552,507 | |
· See Note A in Notes to Financial Statements.
1 Affiliated fund available only to Vanguard funds and certain trusts and accounts managed by Vanguard. Rate shown for Vanguard Market Liquidity Fund is the 7-day yield.
See accompanying Notes, which are an integral part of the Financial Statements.
50
Institutional Target Retirement 2060 Fund
Statement of Operations
| | Year Ended | |
| | September 30, 2019 | |
| | ($000 | ) |
Investment Income | | | |
Income | | | |
Income Distributions Received from Affiliated Funds | | 47,932 | |
Other Income | | 51 | |
Net Investment Income–Note B | | 47,983 | |
Realized Net Gain (Loss) | | | |
Capital Gain Distributions Received from Affiliated Funds | | — | |
Affiliated Funds Sold | | 930 | |
Futures Contracts | | (9 | ) |
Realized Net Gain (Loss) | | 921 | |
Change in Unrealized Appreciation (Depreciation) From Affiliated Funds | | 31,421 | |
Net Increase (Decrease) in Net Assets Resulting from Operations | | 80,325 | |
See accompanying Notes, which are an integral part of the Financial Statements.
51
Institutional Target Retirement 2060 Fund
Statement of Changes in Net Assets
| | Year Ended September 30, | |
| | 2019 | | 2018 | |
| | ($000 | ) | ($000 | ) |
Increase (Decrease) in Net Assets | | | | | |
Operations | | | | | |
Net Investment Income | | 47,983 | | 26,781 | |
Realized Net Gain (Loss) | | 921 | | (807 | ) |
Change in Unrealized Appreciation (Depreciation) | | 31,421 | | 74,473 | |
Net Increase (Decrease) in Net Assets Resulting from Operations | | 80,325 | | 100,447 | |
Distributions | | | | | |
Net Investment Income | | (32,688 | ) | (16,365 | ) |
Realized Capital Gain1 | | (55 | ) | (152 | ) |
Total Distributions | | (32,743 | ) | (16,517 | ) |
Capital Share Transactions | | | | | |
Issued | | 1,187,527 | | 821,039 | |
Issued in Lieu of Cash Distributions | | 32,169 | | 16,151 | |
Redeemed | | (249,768 | ) | (195,143 | ) |
Net Increase (Decrease) from Capital Share Transactions | | 969,928 | | 642,047 | |
Total Increase (Decrease) | | 1,017,510 | | 725,977 | |
Net Assets | | | | | |
Beginning of Period | | 1,534,997 | | 809,020 | |
End of Period | | 2,552,507 | | 1,534,997 | |
1 Includes fiscal 2019 and 2018 short-term gain distributions totaling $41,000 and $144,000, respectively. Short-term gain distributions are treated as ordinary income dividends for tax purposes.
See accompanying Notes, which are an integral part of the Financial Statements.
52
Institutional Target Retirement 2060 Fund
Financial Highlights
| | | | | June 26, |
| | | | | 20151 to |
For a Share Outstanding | Year Ended September 30, | | Sept. 30, |
Throughout Each Period | 2019 | 2018 | 2017 | 2016 | 2015 |
Net Asset Value, Beginning of Period | $24.92 | $23.08 | $20.10 | $18.07 | $20.00 |
Investment Operations | | | | | |
Net Investment Income2 | .589 | .554 | .511 | .466 | .135 |
Capital Gain Distributions Received2 | — | — | .001 | .001 | — |
Net Realized and Unrealized Gain (Loss) on Investments | (.132) | 1.699 | 2.828 | 1.729 | (2.065) |
Total from Investment Operations | .457 | 2.253 | 3.340 | 2.196 | (1.930) |
Distributions | | | | | |
Dividends from Net Investment Income | (.476) | (.409) | (.359) | (.165) | — |
Distributions from Realized Capital Gains | (.001) | (.004) | (.001) | (.001) | — |
Total Distributions | (.477) | (.413) | (.360) | (.166) | — |
Net Asset Value, End of Period | $24.90 | $24.92 | $23.08 | $20.10 | $18.07 |
| | | | | |
Total Return | 2.15% | 9.83% | 16.90% | 12.21% | -9.65% |
| | | | | |
Ratios/Supplemental Data | | | | | |
Net Assets, End of Period (Millions) | $2,553 | $1,535 | $809 | $334 | $95 |
Ratio of Total Expenses to Average Net Assets | — | — | — | — | — |
Acquired Fund Fees and Expenses | 0.09% | 0.09% | 0.09% | 0.10% | 0.10%3 |
Ratio of Net Investment Income to Average Net Assets | 2.46% | 2.29% | 2.38% | 2.45% | 2.53%3 |
Portfolio Turnover Rate | 3% | 5% | 7% | 4% | 4% |
| | | | | | |
1 Inception.
2 Calculated based on average shares outstanding.
3 Annualized.
See accompanying Notes, which are an integral part of the Financial Statements.
53
Institutional Target Retirement 2060 Fund
Notes to Financial Statements
Vanguard Institutional Target Retirement 2060 Fund is registered under the Investment Company Act of 1940 as an open-end investment company, or mutual fund. The fund follows a balanced investment strategy by investing in selected Vanguard funds to achieve its targeted allocation of assets to U.S. and international stocks, and U.S. and international bonds. Financial statements and other information about each underlying fund are available on vanguard.com.
A. The following significant accounting policies conform to generally accepted accounting principles for U.S. investment companies. The fund consistently follows such policies in preparing its financial statements.
1. Security Valuation: Investments are valued at the net asset value of each underlying Vanguard fund determined as of the close of the New York Stock Exchange (generally 4 p.m., Eastern time) on the valuation date.
2. Futures Contracts: The fund uses stock and bond futures contracts to a limited extent, with the objectives of maintaining full exposure to the market and maintaining its target asset allocation. The primary risks associated with the use of futures contracts are imperfect correlation between changes in market values of investments held by the fund and the prices of futures contracts, and the possibility of an illiquid market. Counterparty risk involving futures is mitigated because a regulated clearinghouse is the counterparty instead of the clearing broker. To further mitigate counterparty risk, the fund trades futures contracts on an exchange, monitors the financial strength of its clearing brokers and clearinghouse, and has entered into clearing agreements with its clearing brokers. The clearinghouse imposes initial margin requirements to secure the fund’s performance and requires daily settlement of variation margin representing changes in the market value of each contract. Any assets pledged as initial margin for open contracts are noted in the Statement of Net Assets.
Futures contracts are valued at their quoted daily settlement prices. The notional amounts of the contracts are not recorded in the Statement of Net Assets. Fluctuations in the value of the contracts are recorded in the Statement of Assets and Liabilities as an asset (liability) and in the Statement of Operations as unrealized appreciation (depreciation) until the contracts are closed, when they are recorded as realized futures gains (losses).
During the year ended September 30, 2019, the fund’s average investments in long and short futures contracts represented less than 1% and 0% of net assets, respectively, based on the average of the notional amounts at each quarter-end during the period. The fund had no open futures contracts at September 30, 2019.
3. Federal Income Taxes: The fund intends to continue to qualify as a regulated investment company and distribute all of its taxable income. Management has analyzed the fund’s tax positions taken for all open federal income tax years (September 30, 2016–2019), and has concluded that no provision for federal income tax is required in the fund’s financial statements.
4. Distributions: Distributions to shareholders are recorded on the ex-dividend date. Distributions are determined on a tax basis and may differ from net investment income and realized capital gains for financial reporting purposes.
54
Institutional Target Retirement 2060 Fund
5. Credit Facility: The fund and certain other funds managed by The Vanguard Group (“Vanguard”) participate in a $4.3 billion committed credit facility provided by a syndicate of lenders pursuant to a credit agreement that may be renewed annually; each fund is individually liable for its borrowings, if any, under the credit facility. Borrowings may be utilized for temporary and emergency purposes, and are subject to the fund’s regulatory and contractual borrowing restrictions. The participating funds are charged administrative fees and an annual commitment fee of 0.10% of the undrawn amount of the facility; these fees are allocated to the funds based on a method approved by the fund’s board of trustees and borne by the funds in which the fund invests (see Note B). Any borrowings under this facility bear interest at a rate based upon the higher of the one-month London Interbank Offered Rate, federal funds effective rate, or overnight bank funding rate plus an agreed-upon spread.
The fund had no borrowings outstanding at September 30, 2019, or at any time during the period then ended.
6. Other: Income and capital gain distributions received are recorded on the ex-dividend date. Security transactions are accounted for on the date securities are bought or sold. Costs used to determine realized gains (losses) on the sale of investment securities are those of the specific securities sold.
B. In accordance with the terms of a Funds’ Service Agreement (the “FSA”) between Vanguard and the fund, Vanguard furnishes to the fund investment advisory, corporate management, administrative, marketing, and distribution services at Vanguard’s cost of operations (as defined by the FSA). These costs of operations are allocated to the fund based on methods and guidelines approved by the board of trustees. The FSA provides that expenses otherwise allocable to Vanguard funds-of-funds may be reduced or eliminated to the extent of savings realized by the underlying Vanguard funds by virtue of being part of a fund-of-funds. Accordingly, all expenses for services provided by Vanguard to the fund and all other expenses incurred by the fund during the period ended September 30, 2019, were borne by the underlying Vanguard funds in which the fund invests. The fund’s trustees and officers are also trustees and officers, respectively, of the underlying Vanguard funds, as well as directors and employees, respectively, of Vanguard.
C. Various inputs may be used to determine the value of the fund’s investments. These inputs are summarized in three broad levels for financial statement purposes. The inputs or methodologies used to value securities are not necessarily an indication of the risk associated with investing in those securities.
Level 1—Quoted prices in active markets for identical securities.
Level 2—Other significant observable inputs (including quoted prices for similar securities, interest rates, prepayment speeds, credit risk, etc.).
Level 3—Significant unobservable inputs (including the fund’s own assumptions used to determine the fair value of investments). Any investments valued with significant unobservable inputs are noted on the Statement of Net Assets.
At September 30, 2019, 100% of the market value of the fund’s investments was determined based on Level 1 inputs.
55
Institutional Target Retirement 2060 Fund
D. Permanent differences between book-basis and tax-basis components of net assets, if any, are reclassified among capital accounts in the financial statements to reflect their tax character. These reclassifications have no effect on net assets or net asset value per share.
Temporary differences between book-basis and tax-basis components of total distributable earnings (loss) arise when certain items of income, gain, or loss are recognized in different periods for financial statement and tax purposes; these differences will reverse at some time in the future. The differences are primarily related to the tax deferral of losses on wash sales. As of period end, the tax-basis components of total distributable earnings (loss) are detailed in the table as follows:
| | Amount | |
| | ($000 | ) |
Undistributed Ordinary Income | | 35,524 | |
Undistributed Long-Term Gains | | — | |
Capital Loss Carryforwards (Non-expiring) | | — | |
Net Unrealized Gains (Losses) | | 196,704 | |
As of September 30, 2019, gross unrealized appreciation and depreciation for investments based on cost for U.S. federal income tax purposes were as follows:
| | Amount | |
| | ($000 | ) |
Tax Cost | | 2,358,574 | |
Gross Unrealized Appreciation | | 222,360 | |
Gross Unrealized Depreciation | | (25,656 | ) |
Net Unrealized Appreciation (Depreciation) | | 196,704 | |
E. Capital shares issued and redeemed were:
| | Year Ended September 30, | |
| | 2019 | | 2018 | |
| | Shares | | Shares | |
| | (000 | ) | (000 | ) |
Issued | | 49,788 | | 33,921 | |
Issued in Lieu of Cash Distributions | | 1,505 | | 675 | |
Redeemed | | (10,382 | ) | (8,051 | ) |
Net Increase (Decrease) in Shares Outstanding | | 40,911 | | 26,545 | |
At September 30, 2019, one shareholder was the record or beneficial owner of 27% of the fund’s net assets. If the shareholder were to redeem its investment in the fund, the redemption might lead to the realization of taxable capital gains.
56
Institutional Target Retirement 2060 Fund
F. Transactions during the period in affiliated underlying Vanguard funds were as follows:
| | | | Current Period Transactions | | | |
| | Sept. 30, | | | | Proceeds | | Realized | | | | | | | | Sept. 30, | |
| | 2018 | | | | from | | Net | | Change in | | | | Capital Gain | | 2019 | |
| | Market | | Purchases | | Securities | | Gain | | Unrealized | | | | Distributions | | Market | |
| | Value | | at Cost | | Sold | | (Loss | ) | App. (Dep. | ) | Income | | Received | | Value | |
| | ($000 | ) | ($000 | ) | ($000 | ) | ($000 | ) | ($000 | ) | ($000 | ) | ($000 | ) | ($000 | ) |
Vanguard Market Liquidity Fund | | 168 | | NA1 | | NA1 | | — | | — | | 43 | | — | | 4,930 | |
Vanguard Total Bond Market II Index Fund | | 107,292 | | 98,338 | | 31,304 | | 174 | | 10,295 | | 3,956 | | — | | 184,795 | |
Vanguard Total International Bond Index Fund | | 45,856 | | 23,149 | | 1,621 | | 22 | | 4,796 | | 1,522 | | — | | 72,202 | |
Vanguard Total International Stock Index Fund | | 551,024 | | 386,791 | | 2,787 | | 685 | | (21,538 | ) | 21,702 | | — | | 914,175 | |
Vanguard Total Stock Market Index Fund | | 826,369 | | 537,524 | | 22,634 | | 49 | | 37,868 | | 20,709 | | — | | 1,379,176 | |
Total | | 1,530,709 | | 1,045,802 | | 58,346 | | 930 | | 31,421 | | 47,932 | | — | | 2,555,278 | |
1 Not applicable—purchases and sales are for temporary cash investment purposes.
G. Management has determined that no events or transactions occurred subsequent to September 30, 2019, that would require recognition or disclosure in these financial statements.
57
Institutional Target Retirement 2065 Fund
Performance Summary
All of the returns in this report represent past performance, which is not a guarantee of future results that may be achieved by the fund. (Current performance may be lower or higher than the performance data cited. For performance data current to the most recent month-end, visit our website at vanguard.com/performance.) Note, too, that both investment returns and principal value can fluctuate widely, so an investor’s shares, when sold, could be worth more or less than their original cost. The returns shown do not reflect taxes that a shareholder would pay on fund distributions or on the sale of fund shares.
Cumulative Performance: July 12, 2017, Through September 30, 2019
Initial Investment of $100,000,000
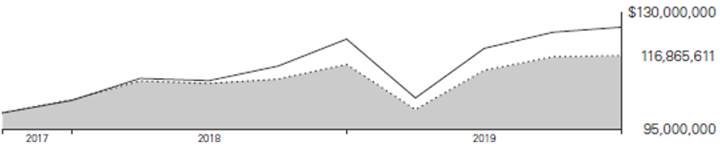
| | Average Annual Total Returns | |
| | Periods Ended September 30, 2019 | |
| | | Since | Final Value |
| | One | Inception | of a $100,000,000 |
| | Year | (7/12/2017) | Investment |

| Institutional Target Retirement 2065 Fund | 2.22% | 7.28% | $116,865,611 |

| Target 2065 Composite Index | 2.32 | 7.35 | 117,038,501 |

| MSCI US Broad Market Index | 2.91 | 10.77 | 125,479,589 |
Target 2065 Composite Index: Derived by applying the fund’s target asset allocation to the results of the following benchmarks: the FTSE Global All Cap ex US Index for international stocks, the Bloomberg Barclays U.S. Aggregate Float Adjusted Index for U.S. bonds, the Bloomberg Barclays Global Aggregate ex-USD Float Adjusted RIC Capped Index Hedged for international bonds, and the CRSP US Total Market Index for U.S. stocks. International stock benchmark returns are adjusted for withholding taxes.
“Since Inception” performance is calculated from the fund’s inception date for both the fund and its comparative standards.
See Financial Highlights for dividend and capital gains information.
58
Institutional Target Retirement 2065 Fund
Underlying Vanguard Funds
As of September 30, 2019
Vanguard Total Stock Market Index Fund Institutional Shares | 54.1% |
Vanguard Total International Stock Index Fund Investor Shares | 35.9 |
Vanguard Total Bond Market II Index Fund Investor Shares | 7.0 |
Vanguard Total International Bond Index Fund Admiral Shares | 3.0 |
59
Institutional Target Retirement 2065 Fund
Financial Statements
Statement of Net Assets
As of September 30, 2019
The fund files its complete schedule of portfolio holdings with the Securities and Exchange Commission (SEC) for the first and third quarters of each fiscal year as an exhibit to its reports on Form N-PORT. The fund’s Form N-PORT reports are available on the SEC’s website at www.sec.gov.
| | | | Market | |
| | | | Value· | |
| | Shares | | ($000) | |
Investment Companies (100.2%) | | | | | |
U.S. Stock Fund (54.2%) | | | | | |
Vanguard Total Stock Market Index Fund Institutional Shares | | 1,810,816 | | 133,113 | |
| | | | | |
International Stock Fund (36.0%) | | | | | |
Vanguard Total International Stock Index Fund Investor Shares | | 5,334,970 | | 88,401 | |
| | | | | |
U.S. Bond Fund (7.0%) | | | | | |
1 Vanguard Total Bond Market II Index Fund Investor Shares | | 1,561,592 | | 17,302 | |
| | | | | |
International Bond Fund (3.0%) | | | | | |
Vanguard Total International Bond Index Fund Admiral Shares | | 314,041 | | 7,380 | |
Total Investment Companies (Cost $239,241) | | | | 246,196 | |
Temporary Cash Investment (0.2%) | | | | | |
Money Market Fund (0.2%) | | | | | |
1 Vanguard Market Liquidity Fund, 2.098% (Cost $543) | | 5,426 | | 543 | |
Total Investments (100.4%) (Cost $239,784) | | | | 246,739 | |
Other Assets and Liabilities (-0.4%) | | | | | |
Other Assets | | | | 327 | |
Liabilities | | | | (1,261) | |
| | | | (934) | |
Net Assets (100%) | | | | | |
Applicable to 10,791,358 outstanding $.001 par value shares of beneficial interest (unlimited authorization) | | | | 245,805 | |
Net Asset Value Per Share | | | | $22.78 | |
60
Institutional Target Retirement 2065 Fund
| | Amount | |
| | ($000) | |
Statement of Assets and Liabilities | | | |
Assets | | | |
Investments in Securities, at Value—Affiliated Funds | | 246,739 | |
Receivables for Accrued Income | | 43 | |
Receivables for Capital Shares Issued | | 284 | |
Total Assets | | 247,066 | |
Liabilities | | | |
Payables for Investment Securities Purchased | | 371 | |
Payables for Capital Shares Redeemed | | 890 | |
Total Liabilities | | 1,261 | |
Net Assets | | 245,805 | |
| | | |
| | | |
At September 30, 2019, net assets consisted of: | | | |
| | Amount | |
| | ($000) | |
Paid-in Capital | | 235,654 | |
Total Distributable Earnings (Loss) | | 10,151 | |
Net Assets | | 245,805 | |
· See Note A in Notes to Financial Statements.
1 Affiliated fund available only to Vanguard funds and certain trusts and accounts managed by Vanguard. Rate shown for Vanguard Market Liquidity Fund is the 7-day yield.
See accompanying Notes, which are an integral part of the Financial Statements.
61
Institutional Target Retirement 2065 Fund
Statement of Operations
| | Year Ended | |
| | September 30, 2019 | |
| | ($000 | ) |
Investment Income | | | |
Income | | | |
Income Distributions Received from Affiliated Funds | | 4,124 | |
Net Investment Income—Note B | | 4,124 | |
Realized Net Gain (Loss) | | | |
Capital Gain Distributions Received from Affiliated Funds | | — | |
Affiliated Funds Sold | | 22 | |
Futures Contracts | | 4 | |
Realized Net Gain (Loss) | | 26 | |
Change in Unrealized Appreciation (Depreciation) from Affiliated Funds | | 4,738 | |
Net Increase (Decrease) in Net Assets Resulting from Operations | | 8,888 | |
See accompanying Notes, which are an integral part of the Financial Statements.
62
Institutional Target Retirement 2065 Fund
Statement of Changes in Net Assets
| | Year Ended September 30, | |
| | 2019 | | 2018 | |
| | ($000 | ) | ($000) | |
Increase (Decrease) in Net Assets | | | | | |
Operations | | | | | |
Net Investment Income | | 4,124 | | 1,185 | |
Realized Net Gain (Loss) | | 26 | | (44) | |
Change in Unrealized Appreciation (Depreciation) | | 4,738 | | 2,145 | |
Net Increase (Decrease) in Net Assets Resulting from Operations | | 8,888 | | 3,286 | |
Distributions | | | | | |
Net Investment Income | | (1,981 | ) | (131) | |
Realized Capital Gain1 | | — | | (3) | |
Total Distributions | | (1,981 | ) | (134) | |
Capital Share Transactions | | | | | |
Issued | | 208,214 | | 125,010 | |
Issued in Lieu of Cash Distributions | | 1,977 | | 133 | |
Redeemed | | (68,197 | ) | (36,854) | |
Net Increase (Decrease) from Capital Share Transactions | | 141,994 | | 88,289 | |
Total Increase (Decrease) | | 148,901 | | 91,441 | |
Net Assets | | | | | |
Beginning of Period | | 96,904 | | 5,463 | |
End of Period | | 245,805 | | 96,904 | |
1 Includes fiscal 2019 and 2018 short-term gain distributions totaling $0 and $3,000, respectively. Short-term gain distributions are treated as ordinary income dividends for tax purposes.
See accompanying Notes, which are an integral part of the Financial Statements.
63
Institutional Target Retirement 2065 Fund
Financial Highlights
| | | | | | July 12, | |
| | Year Ended | | 20171 to | |
| | September 30, | | Sept. 30, | |
For a Share Outstanding Throughout Each Period | | 2019 | | 2018 | | 2017 | |
Net Asset Value, Beginning of Period | | $22.69 | | $20.80 | | $20.00 | |
Investment Operations | | | | | | | |
Net Investment Income2 | | .552 | | .555 | | .197 | |
Capital Gain Distributions Received2 | | — | | — | | — | |
Net Realized and Unrealized Gain (Loss) on Investments | | (.107) | | 1.503 | | .603 | |
Total from Investment Operations | | .445 | | 2.058 | | .800 | |
Distributions | | | | | | | |
Dividends from Net Investment Income | | (.355) | | (.165) | | — | |
Distributions from Realized Capital Gains | | — | | (.003) | | — | |
Total Distributions | | (.355) | | (.168) | | — | |
Net Asset Value, End of Period | | $22.78 | | $22.69 | | $20.80 | |
| | | | | | | |
Total Return | | 2.22% | | 9.93% | | 4.00% | |
| | | | | | | |
Ratios/Supplemental Data | | | | | | | |
Net Assets, End of Period (Millions) | | $246 | | $97 | | $5 | |
Ratio of Total Expenses to Average Net Assets | | — | | — | | — | |
Acquired Fund Fees and Expenses | | 0.09% | | 0.09% | | 0.09%3 | |
Ratio of Net Investment Income to Average Net Assets | | 2.51% | | 2.51% | | 4.33%3 | |
Portfolio Turnover Rate | | 8% | | 28% | | 133% | |
| | | | | | | | |
1 Inception.
2 Calculated based on average shares outstanding.
3 Annualized.
See accompanying Notes, which are an integral part of the Financial Statements.
64
Institutional Target Retirement 2065 Fund
Notes to Financial Statements
Vanguard Institutional Target Retirement 2065 Fund is registered under the Investment Company Act of 1940 as an open-end investment company, or mutual fund. The fund follows a balanced investment strategy by investing in selected Vanguard funds to achieve its targeted allocation of assets to U.S. and international stocks, and U.S. and international bonds. Financial statements and other information about each underlying fund are available on vanguard.com.
A. The following significant accounting policies conform to generally accepted accounting principles for U.S. investment companies. The fund consistently follows such policies in preparing its financial statements.
1. Security Valuation: Investments are valued at the net asset value of each underlying Vanguard fund determined as of the close of the New York Stock Exchange (generally 4 p.m., Eastern time) on the valuation date.
2. Futures Contracts: The fund uses stock and bond futures contracts to a limited extent, with the objectives of maintaining full exposure to the market and maintaining its target asset allocation. The primary risks associated with the use of futures contracts are imperfect correlation between changes in market values of investments held by the fund and the prices of futures contracts, and the possibility of an illiquid market. Counterparty risk involving futures is mitigated because a regulated clearinghouse is the counterparty instead of the clearing broker. To further mitigate counterparty risk, the fund trades futures contracts on an exchange, monitors the financial strength of its clearing brokers and clearinghouse, and has entered into clearing agreements with its clearing brokers. The clearinghouse imposes initial margin requirements to secure the fund’s performance and requires daily settlement of variation margin representing changes in the market value of each contract. Any assets pledged as initial margin for open contracts are noted in the Statement of Net Assets.
Futures contracts are valued at their quoted daily settlement prices. The notional amounts of the contracts are not recorded in the Statement of Net Assets. Fluctuations in the value of the contracts are recorded in the Statement of Assets and Liabilities as an asset (liability) and in the Statement of Operations as unrealized appreciation (depreciation) until the contracts are closed, when they are recorded as realized futures gains (losses).
During the year ended September 30, 2019, the fund’s average investments in long and short futures contracts represented less than 1% and 0% of net assets, respectively, based on the average of the notional amounts at each quarter-end during the period. The fund had no open futures contracts at September 30, 2019.
3. Federal Income Taxes: The fund intends to continue to qualify as a regulated investment company and distribute all of its taxable income. Management has analyzed the fund’s tax positions taken for all open federal income tax years (September 30, 2017–2019), and has concluded that no provision for federal income tax is required in the fund’s financial statements.
4. Distributions: Distributions to shareholders are recorded on the ex-dividend date. Distributions are determined on a tax basis and may differ from net investment income and realized capital gains for financial reporting purposes.
65
Institutional Target Retirement 2065 Fund
5. Credit Facility: The fund and certain other funds managed by The Vanguard Group (“Vanguard”) participate in a $4.3 billion committed credit facility provided by a syndicate of lenders pursuant to a credit agreement that may be renewed annually; each fund is individually liable for its borrowings, if any, under the credit facility. Borrowings may be utilized for temporary and emergency purposes, and are subject to the fund’s regulatory and contractual borrowing restrictions. The participating funds are charged administrative fees and an annual commitment fee of 0.10% of the undrawn amount of the facility; these fees are allocated to the funds based on a method approved by the fund’s board of trustees and borne by the funds in which the fund invests (see Note B). Any borrowings under this facility bear interest at a rate based upon the higher of the one-month London Interbank Offered Rate, federal funds effective rate, or overnight bank funding rate plus an agreed-upon spread.
The fund had no borrowings outstanding at September 30, 2019, or at any time during the period then ended.
6. Other: Income and capital gain distributions received are recorded on the ex-dividend date. Security transactions are accounted for on the date securities are bought or sold. Costs used to determine realized gains (losses) on the sale of investment securities are those of the specific securities sold.
B. In accordance with the terms of a Funds’ Service Agreement (the “FSA”) between Vanguard and the fund, Vanguard furnishes to the fund investment advisory, corporate management, administrative, marketing, and distribution services at Vanguard’s cost of operations (as defined by the FSA). These costs of operations are allocated to the fund based on methods and guidelines approved by the board of trustees. The FSA provides that expenses otherwise allocable to Vanguard funds-of-funds may be reduced or eliminated to the extent of savings realized by the underlying Vanguard funds by virtue of being part of a fund-of-funds. Accordingly, all expenses for services provided by Vanguard to the fund and all other expenses incurred by the fund during the period ended September 30, 2019, were borne by the underlying Vanguard funds in which the fund invests. The fund’s trustees and officers are also trustees and officers, respectively, of the underlying Vanguard funds, as well as directors and employees, respectively, of Vanguard.
C. Various inputs may be used to determine the value of the fund’s investments. These inputs are summarized in three broad levels for financial statement purposes. The inputs or methodologies used to value securities are not necessarily an indication of the risk associated with investing in those securities.
Level 1—Quoted prices in active markets for identical securities.
Level 2—Other significant observable inputs (including quoted prices for similar securities, interest rates, prepayment speeds, credit risk, etc.).
Level 3—Significant unobservable inputs (including the fund’s own assumptions used to determine the fair value of investments). Any investments valued with significant unobservable inputs are noted on the Statement of Net Assets.
At September 30, 2019, 100% of the market value of the fund’s investments was determined based on Level 1 inputs.
66
Institutional Target Retirement 2065 Fund
D. Permanent differences between book-basis and tax-basis components of net assets, if any, are reclassified among capital accounts in the financial statements to reflect their tax character. These reclassifications have no effect on net assets or net asset value per share.
Temporary differences between book-basis and tax-basis components of total distributable earnings (loss) arise when certain items of income, gain, or loss are recognized in different periods for financial statement and tax purposes; these differences will reverse at some time in the future. The differences are primarily related to the tax deferral of losses on wash sales. As of period end, the tax-basis components of total distributable earnings (loss) are detailed in the table as follows:
| | Amount | |
| | ($000 | ) |
Undistributed Ordinary Income | | 3,222 | |
Undistributed Long-Term Gains | | 1 | |
Capital Loss Carryforwards (Non-expiring) | | — | |
Net Unrealized Gains (Losses) | | 6,928 | |
As of September 30, 2019, gross unrealized appreciation and depreciation for investments based on cost for U.S. federal income tax purposes were as follows:
| | Amount | |
| | ($000 | ) |
Tax Cost | | 239,811 | |
Gross Unrealized Appreciation | | 10,221 | |
Gross Unrealized Depreciation | | (3,293 | ) |
Net Unrealized Appreciation (Depreciation) | | 6,928 | |
E. Capital shares issued and redeemed were:
| | Year Ended September 30, | |
| | 2019 | | 2018 | |
| | Shares | | Shares | |
| | (000 | ) | (000 | ) |
Issued | | 9,534 | | 5,679 | |
Issued in Lieu of Cash Distributions | | 101 | | 6 | |
Redeemed | | (3,114 | ) | (1,677 | ) |
Net Increase (Decrease) in Shares Outstanding | | 6,521 | | 4,008 | |
67
Institutional Target Retirement 2065 Fund
F. Transactions during the period in affiliated underlying Vanguard funds were as follows:
| | | | Current Period Transactions | | | |
| | Sept. 30, | | | | Proceeds | | Realized | | | | | | | | Sept. 30, | |
| | 2018 | | | | from | | Net | | Change in | | | | Capital Gain | | 2019 | |
| | Market | | Purchases | | Securities | | Gain | | Unrealized | | | | Distributions | | Market | |
| | Value | | at Cost | | Sold | | (Loss | ) | App. (Dep. | ) | Income | | Received | | Value | |
| | ($000 | ) | ($000 | ) | ($000 | ) | ($000 | ) | ($000 | ) | ($000 | ) | ($000 | ) | ($000 | ) |
Vanguard Market Liquidity Fund | | 1 | | NA1 | | NA1 | | 1 | | — | | 7 | | — | | 543 | |
Vanguard Total Bond Market II Index Fund | | 6,766 | | 12,702 | | 3,054 | | 2 | | 886 | | 326 | | — | | 17,302 | |
Vanguard Total International Bond Index Fund | | 2,892 | | 4,998 | | 936 | | — | | 426 | | 117 | | — | | 7,380 | |
Vanguard Total International Stock Index Fund | | 34,517 | | 58,723 | | 3,791 | | 16 | | (1,064 | ) | 1,883 | | — | | 88,401 | |
Vanguard Total Stock Market Index Fund | | 52,345 | | 81,291 | | 5,016 | | 3 | | 4,490 | | 1,791 | | — | | 133,113 | |
Total | | 96,521 | | 157,714 | | 12,797 | | 22 | | 4,738 | | 4,124 | | — | | 246,739 | |
1 Not applicable—purchases and sales are for temporary cash investment purposes.
G. Management has determined that no events or transactions occurred subsequent to September 30, 2019, that would require recognition or disclosure in these financial statements.
68
Report of Independent Registered Public Accounting Firm
To the Board of Trustees of Vanguard Chester Funds and Shareholders of Vanguard Institutional Target Retirement 2040 Fund, Vanguard Institutional Target Retirement 2045 Fund, Vanguard Institutional Target Retirement 2050 Fund, Vanguard Institutional Target Retirement 2055 Fund, Vanguard Institutional Target Retirement 2060 Fund and Vanguard Institutional Target Retirement 2065 Fund
Opinions on the Financial Statements
We have audited the accompanying statements of net assets and statements of assets and liabilities of Vanguard Institutional Target Retirement 2040 Fund, Vanguard Institutional Target Retirement 2045 Fund, Vanguard Institutional Target Retirement 2050 Fund, Vanguard Institutional Target Retirement 2055 Fund, Vanguard Institutional Target Retirement 2060 Fund and Vanguard Institutional Target Retirement 2065 Fund (six of the funds constituting Vanguard Chester Funds, hereafter collectively referred to as the “Funds”) as of September 30, 2019, the related statements of operations for the year ended September 30, 2019, the statements of changes in net assets for each of the two years in the period ended September 30, 2019, including the related notes, and the financial highlights for each of the periods indicated therein (collectively referred to as the “financial statements”). In our opinion, the financial statements present fairly, in all material respects, the financial position of each of the Funds as of September 30, 2019, the results of each of their operations for the year then ended, the changes in each of their net assets for each of the two years in the period ended September 30, 2019 and each of the financial highlights for each of the periods indicated therein in conformity with accounting principles generally accepted in the United States of America.
Basis for Opinions
These financial statements are the responsibility of the Funds’ management. Our responsibility is to express an opinion on the Funds’ financial statements based on our audits. We are a public accounting firm registered with the Public Company Accounting Oversight Board (United States) (“PCAOB”) and are required to be independent with respect to the Funds in accordance with the U.S. federal securities laws and the applicable rules and regulations of the Securities and Exchange Commission and the PCAOB.
We conducted our audits of these financial statements in accordance with the standards of the PCAOB. Those standards require that we plan and perform the audit to obtain reasonable assurance about whether the financial statements are free of material misstatement, whether due to error or fraud.
Our audits included performing procedures to assess the risks of material misstatement of the financial statements, whether due to error or fraud, and performing procedures that respond to those risks. Such procedures included examining, on a test basis, evidence regarding the amounts and disclosures in the financial statements. Our audits also included evaluating the accounting principles used and significant estimates made by management, as well as evaluating the overall presentation of the financial statements. Our procedures included confirmation of securities owned as of September 30, 2019 by correspondence with the transfer agent. We believe that our audits provide a reasonable basis for our opinions.
/s/ PricewaterhouseCoopers LLP
Philadelphia, Pennsylvania
November 13, 2019
We have served as the auditor of one or more investment companies in The Vanguard Group of Funds since 1975.
69
Special 2019 tax information (unaudited) for Vanguard Institutional Target Retirement Funds
This information for the fiscal year ended September 30, 2019, is included pursuant to provisions of the Internal Revenue Code.
The funds distributed capital gain dividends (20% rate gain distributions) to shareholders during the fiscal year as follows:
Fund | | ($000) |
Institutional Target Retirement 2040 Fund | | — |
Institutional Target Retirement 2045 Fund | | — |
Institutional Target Retirement 2050 Fund | | — |
Institutional Target Retirement 2055 Fund | | 30 |
Institutional Target Retirement 2060 Fund | | 11 |
Institutional Target Retirement 2065 Fund | | — |
For nonresident alien shareholders, 100% of short-term capital gain dividends distributed by the funds are qualified short-term capital gains.
The funds distributed qualified dividend income to shareholders during the fiscal year as follows:
Fund | | ($000) |
Institutional Target Retirement 2040 Fund | | 324,871 |
Institutional Target Retirement 2045 Fund | | 285,550 |
Institutional Target Retirement 2050 Fund | | 201,314 |
Institutional Target Retirement 2055 Fund | | 88,558 |
Institutional Target Retirement 2060 Fund | | 24,891 |
Institutional Target Retirement 2065 Fund | | 1,510 |
For corporate shareholders, the percentage of investment income (dividend income plus short-term gains, if any) that qualifies for the dividends-received deduction is as follows:
Fund | | Percentage |
Institutional Target Retirement 2040 Fund | | 34.9% |
Institutional Target Retirement 2045 Fund | | 37.5 |
Institutional Target Retirement 2050 Fund | | 37.5 |
Institutional Target Retirement 2055 Fund | | 37.6 |
Institutional Target Retirement 2060 Fund | | 37.6 |
Institutional Target Retirement 2065 Fund | | 37.8 |
70
The funds designate to shareholders foreign source income and foreign taxes paid as follows:
| | Foreign Source Income | | Foreign Taxes Paid | |
Fund | | ($000 | ) | ($000 | ) |
Institutional Target Retirement 2040 Fund | | 272,559 | | 18,189 | |
Institutional Target Retirement 2045 Fund | | 236,963 | | 16,490 | |
Institutional Target Retirement 2050 Fund | | 173,802 | | 12,115 | |
Institutional Target Retirement 2055 Fund | | 82,230 | | 5,748 | |
Institutional Target Retirement 2060 Fund | | 24,956 | | 1,748 | |
Institutional Target Retirement 2065 Fund | | 2,149 | | 152 | |
Shareholders will receive more detailed information with their Form 1099-DIV in January 2020 to determine the calendar-year amounts to be included on their 2019 tax returns.
71
BLOOMBERG is a trademark and service mark of Bloomberg Finance L.P. BARCLAYS is a trademark and service mark of Barclays Bank Plc, used under license. Bloomberg Finance L.P. and its affiliates, including Bloomberg Index Services Limited (BISL) (collectively, Bloomberg), or Bloomberg’s licensors, own all proprietary rights in the Bloomberg Barclays U.S. Aggregate Bond Index, Bloomberg Barclays U.S. Aggregate Float Adjusted Index, and the Bloomberg Barclays Global Aggregate ex-USD Float Adjusted RIC Capped Index (USD Hedged) (the Indices or Bloomberg Barclays Indices).
Neither Barclays Bank Plc, Barclays Capital Inc., or any affiliate (collectively Barclays) or Bloomberg is the issuer or producer of the Institutional Target Retirement Funds (including the Total Bond Market II Index Fund and the Total International Bond Index Fund) and neither Bloomberg nor Barclays has any responsibilities, obligations or duties to investors in the Institutional Target Retirement Funds. The Indices are licensed for use by The Vanguard Group, Inc. (Vanguard) as the sponsor of the Institutional Target Retirement Funds. Bloomberg and Barclays’ only relationship with Vanguard in respect to the Indices is the licensing of the Indices, which is determined, composed and calculated by BISL, or any successor thereto, without regard to the Issuer or the Institutional Target Retirement Funds or the owners of the Institutional Target Retirement Funds.
Additionally, Vanguard may for itself execute transaction(s) with Barclays in or relating to the Indices in connection with the Institutional Target Retirement Funds. Investors acquire the Institutional Target Retirement Funds from Vanguard and investors neither acquire any interest in the Indices nor enter into any relationship of any kind whatsoever with Bloomberg or Barclays upon making an investment in the Institutional Target Retirement Funds. The Institutional Target Retirement Funds are not sponsored, endorsed, sold or promoted by Bloomberg or Barclays. Neither Bloomberg nor Barclays makes any representation or warranty, express or implied regarding the advisability of investing in the Institutional Target Retirement Funds or the advisability of investing in securities generally or the ability of the Indices to track corresponding or relative market performance. Neither Bloomberg nor Barclays has passed on the legality or suitability of the Institutional Target Retirement Funds with respect to any person or entity. Neither Bloomberg nor Barclays is responsible for and has not participated in the determination of the timing of, prices at, or quantities of the Institutional Target Retirement Funds to be issued. Neither Bloomberg nor Barclays has any obligation to take the needs of the Issuer or the owners of the Institutional Target Retirement Funds or any other third party into consideration in determining, composing or calculating the Indices. Neither Bloomberg nor Barclays has any obligation or liability in connection with administration, marketing or trading of the Institutional Target Retirement Funds.
72
The licensing agreement between Bloomberg and Barclays is solely for the benefit of Bloomberg and Barclays and not for the benefit of the owners of the Institutional Target Retirement Funds, investors or other third parties. In addition, the licensing agreement between Vanguard and Bloomberg is solely for the benefit of Vanguard and Bloomberg and not for the benefit of the owners of the Institutional Target Retirement Funds, investors or other third parties.
NEITHER BLOOMBERG NOR BARCLAYS SHALL HAVE ANY LIABILITY TO THE ISSUER, INVESTORS OR TO OTHER THIRD PARTIES FOR THE QUALITY, ACCURACY AND/OR COMPLETENESS OF THE BLOOMBERG BARCLAYS INDICES OR ANY DATA INCLUDED THEREIN OR FOR INTERRUPTIONS IN THE DELIVERY OF THE BLOOMBERG BARCLAYS INDICES. NEITHER BLOOMBERG NOR BARCLAYS MAKES ANY WARRANTY, EXPRESS OR IMPLIED, AS TO RESULTS TO BE OBTAINED BY THE ISSUER, THE INVESTORS OR ANY OTHER PERSON OR ENTITY FROM THE USE OF THE BLOOMBERG BARCLAYS INDICES OR ANY DATA INCLUDED THEREIN. NEITHER BLOOMBERG NOR BARCLAYS MAKES ANY EXPRESS OR IMPLIED WARRANTIES, AND EACH HEREBY EXPRESSLY DISCLAIMS ALL WARRANTIES OF MERCHANTABILITY OR FITNESS FOR A PARTICULAR PURPOSE OR USE WITH RESPECT TO BLOOMBERG BARCLAYS INDICES OR ANY DATA INCLUDED THEREIN. BLOOMBERG RESERVES THE RIGHT TO CHANGE THE METHODS OF CALCULATION OR PUBLICATION, OR TO CEASE THE CALCULATION OR PUBLICATION OF THE BLOOMBERG BARCLAYS INDICES, AND NEITHER BLOOMBERG NOR BARCLAYS SHALL BE LIABLE FOR ANY MISCALCULATION OF OR ANY INCORRECT, DELAYED OR INTERRUPTED PUBLICATION WITH RESPECT TO ANY OF THE BLOOMBERG BARCLAYS INDICES. NEITHER BLOOMBERG NOR BARCLAYS SHALL BE LIABLE FOR ANY DAMAGES, INCLUDING, WITHOUT LIMITATION, ANY SPECIAL, INDIRECT OR CONSEQUENTIAL DAMAGES, OR ANY LOST PROFITS AND EVEN IF ADVISED OF THE POSSIBILITY OF SUCH, RESULTING FROM THE USE OF BLOOMBERG BARCLAYS INDICES OR ANY DATA INCLUDED THEREIN OR WITH RESPECT TO THE INSTITUTIONAL TARGET RETIREMENT FUNDS.
None of the information supplied by Bloomberg or Barclays and used in this publication may be reproduced in any manner without the prior written permission of both Bloomberg and Barclays Capital, the investment banking division of Barclays Bank Plc. Barclays Bank Plc is registered in England No. 1026167. Registered office 1 Churchill Place London E14 5HP.
© 2019 Bloomberg. Used with Permission.
Source: Bloomberg Index Services Limited. Copyright 2019, Bloomberg. All rights reserved.
73
This page intentionally left blank.
The People Who Govern Your Fund
The trustees of your mutual fund are there to see that the fund is operated and managed in your best interests since, as a shareholder, you are a part owner of the fund. Your fund’s trustees also serve on the board of directors of The Vanguard Group, Inc., which is owned by the Vanguard funds and provides services to them.
A majority of Vanguard’s board members are independent, meaning that they have no affiliation with Vanguard or the funds they oversee, apart from the sizable personal investments they have made as private individuals. The independent board members have distinguished backgrounds in business, academia, and public service. Each of the trustees and executive officers oversees 212 Vanguard funds.
Information for each trustee and executive officer of the fund appears below. That information, as well as the Vanguard fund count, is as of the date on the cover of this fund report. The mailing address of the trustees and officers is P.O. Box 876, Valley Forge, PA 19482. More information about the trustees is in the Statement of Additional Information, which can be obtained, without charge, by contacting Vanguard at 800-662-7447, or online at vanguard.com.
Interested Trustee1
Mortimer J. Buckley
Born in 1969. Trustee since January 2018. Principal occupation(s) during the past five years and other experience: chairman of the board (January 2019– present) of Vanguard and of each of the investment companies served by Vanguard; chief executive officer (January 2018–present) of Vanguard; chief executive officer, president, and trustee (January 2018–present) of each of the investment companies served by Vanguard; president and director (2017–present) of Vanguard; and president (February 2018–present) of Vanguard Marketing Corporation. Chief investment officer (2013–2017), managing director (2002–2017), head of the Retail Investor Group (2006–2012), and chief information officer (2001–2006) of Vanguard. Chairman of the board (2011–2017) and trustee (2009–2017) of the Children’s Hospital of Philadelphia; trustee (2018–present) of The Shipley School.
Independent Trustees
Emerson U. Fullwood
Born in 1948. Trustee since January 2008. Principal occupation(s) during the past five years and other experience: executive chief staff and marketing officer for North America and corporate vice president (retired 2008) of Xerox Corporation (document management products and services). Former president of the Worldwide Channels Group, Latin America, and Worldwide Customer Service and executive chief staff officer of Developing Markets of Xerox. Executive in residence and 2009–2010 Distinguished Minett Professor at the Rochester Institute of Technology. Director of SPX FLOW, Inc. (multi-industry manufacturing). Director of the University of Rochester Medical Center, the Monroe Community College Foundation, the United Way of Rochester, North Carolina A&T University, and Roberts Wesleyan College. Trustee of the University of Rochester.
Amy Gutmann
Born in 1949. Trustee since June 2006. Principal occupation(s) during the past five years and other experience: president (2004–present) of the University of Pennsylvania. Christopher H. Browne Distinguished Professor of Political Science, School of Arts and Sciences, and professor of communication, Annenberg School for Communication, with secondary faculty appointments in the Department of Philosophy, School of Arts and Sciences, and at the Graduate School of Education, University of Pennsylvania. Trustee of the National Constitution Center.
F. Joseph Loughrey
Born in 1949. Trustee since October 2009. Principal occupation(s) during the past five years and other experience: president and chief operating officer (retired 2009) and vice chairman of the board (2008–2009) of Cummins Inc. (industrial machinery). Chairman of the board of Hillenbrand, Inc. (specialized consumer services), and the Lumina Foundation.
1 Mr. Buckley is considered an “interested person,” as defined in the Investment Company Act of 1940, because he is an officer of the Vanguard funds.
Director of the V Foundation and Oxfam America. Member of the advisory council for the College of Arts and Letters and chair of the advisory board to the Kellogg Institute for International Studies, both at the University of Notre Dame.
Mark Loughridge
Born in 1953. Trustee since March 2012. Principal occupation(s) during the past five years and other experience: senior vice president and chief financial officer (retired 2013) of IBM (information technology services). Fiduciary member of IBM’s Retirement Plan Committee (2004–2013), senior vice president and general manager (2002–2004) of IBM Global Financing, vice president and controller (1998–2002) of IBM, and a variety of other prior management roles at IBM. Member of the Council on Chicago Booth.
Scott C. Malpass
Born in 1962. Trustee since March 2012. Principal occupation(s) during the past five years and other experience: chief investment officer (1989–present) and vice president (1996–present) of the University of Notre Dame. Assistant professor of finance at the Mendoza College of Business, University of Notre Dame, and member of the Notre Dame 403(b) Investment Committee. Chairman of the board of TIFF Advisory Services, Inc. Member of the board of Catholic Investment Services, Inc. (investment advisors) and the board of superintendence of the Institute for the Works of Religion.
Deanna Mulligan
Born in 1963. Trustee since January 2018. Principal occupation(s) during the past five years and other experience: president (2010–present) and chief executive officer (2011–present) of The Guardian Life Insurance Company of America. Chief operating officer (2010–2011) and executive vice president (2008–2010) of Individual Life and Disability of The Guardian Life Insurance Company of America. Member of the board of The Guardian Life Insurance Company of America, the American Council of Life Insurers, the Partnership for New York City (business leadership), and the Committee Encouraging Corporate Philanthropy. Trustee of the Economic Club of New York and the Bruce Museum (arts and science). Member of the Advisory Council for the Stanford Graduate School of Business.
André F. Perold
Born in 1952. Trustee since December 2004. Principal occupation(s) during the past five years and other experience: George Gund Professor of Finance and Banking, Emeritus at the Harvard Business School (retired 2011). Chief investment officer and co-managing partner of HighVista Strategies LLC (private investment firm). Board of advisors and investment committee member of the Museum of Fine Arts Boston. Board member (2018–present) of RIT Capital Partners (investment firm); investment committee member of Partners Health Care System.
Sarah Bloom Raskin
Born in 1961. Trustee since January 2018. Principal occupation(s) during the past five years and other experience: deputy secretary (2014–2017) of the United States Department of the Treasury. Governor (2010–2014) of the Federal Reserve Board. Commissioner (2007–2010) of financial regulation for the State of Maryland. Member of the board of directors (2012–2014) of Neighborhood Reinvestment Corporation. Director (2017–present) of i(x) Investments, LLC; director (2017–present) of Reserve Trust. Rubinstein Fellow (2017–present) of Duke University; trustee (2017–present) of Amherst College.
Peter F. Volanakis
Born in 1955. Trustee since July 2009. Principal occupation(s) during the past five years and other experience: president and chief operating officer (retired 2010) of Corning Incorporated (communications equipment) and director of Corning Incorporated (2000–2010) and Dow Corning (2001–2010). Director (2012) of SPX Corporation (multi-industry manufacturing). Overseer of the Amos Tuck School of Business Administration, Dartmouth College (2001–2013). Chairman of the board of trustees of Colby-Sawyer College. Member of the board of Hypertherm Inc. (industrial cutting systems, software, and consumables).
Executive Officers
Glenn Booraem
Born in 1967. Principal occupation(s) during the past five years and other experience: principal of Vanguard. Investment stewardship officer (2017–present), treasurer (2015–2017), controller (2010–2015), and assistant controller (2001–2010) of each of the investment companies served by Vanguard.
Christine M. Buchanan
Born in 1970. Principal occupation(s) during the past five years and other experience: principal of Vanguard and global head of Fund Administration at Vanguard. Treasurer (2017–present) of each of the investment companies served by Vanguard. Partner (2005–2017) at KPMG LLP (audit, tax, and advisory services).
Thomas J. Higgins
Born in 1957. Principal occupation(s) during the past five years and other experience: principal of Vanguard. Chief financial officer (2008–present) and treasurer (1998–2008) of each of the investment companies served by Vanguard.
Peter Mahoney
Born in 1974. Principal occupation(s) during the past five years and other experience: principal of Vanguard. Controller (2015–present) of each of the investment companies served by Vanguard. Head of International Fund Services (2008–2014) at Vanguard.
Anne E. Robinson
Born in 1970. Principal occupation(s) during the past five years and other experience: general counsel (2016–present) of Vanguard. Secretary (2016–present) of Vanguard and of each of the investment companies served by Vanguard. Managing director (2016–present) of Vanguard. Director and senior vice president (2016–2018) of Vanguard Marketing Corporation. Managing director and general counsel of Global Cards and Consumer Services (2014–2016) at Citigroup. Counsel (2003–2014) at American Express.
Michael Rollings
Born in 1963. Principal occupation(s) during the past five years and other experience: finance director (2017–present) and treasurer (2017) of each of the investment companies served by Vanguard. Managing director (2016–present) of Vanguard. Chief financial officer (2016–present) of Vanguard. Director (2016–present) of Vanguard Marketing Corporation. Executive vice president and chief financial officer (2006–2016) of MassMutual Financial Group.
John E. Schadl
Born in 1972. Principal occupation(s) during the past five years and other experience: principal of Vanguard. Chief compliance officer (2019–present) of Vanguard and of each of the investment companies served by Vanguard. Assistant vice president (May 2019–present) of Vanguard Marketing Corporation.
Vanguard Senior Management Team |
| |
Joseph Brennan | Chris D. McIsaac |
Mortimer J. Buckley | James M. Norris |
Gregory Davis | Thomas M. Rampulla |
John James | Karin A. Risi |
Martha G. King | Anne E. Robinson |
John T. Marcante | Michael Rollings |
| 
|
| |
| P.O. Box 2600 |
| Valley Forge, PA 19482-2600 |
Connect with Vanguard® > vanguard.com
Fund Information > 800-662-7447
Direct Investor Account Services > 800-662-2739
Institutional Investor Services > 800-523-1036
Text Telephone for People
Who Are Deaf or Hard of Hearing > 800-749-7273
This material may be used in conjunction with the offering of shares of any Vanguard fund only if preceded or accompanied by the fund’s current prospectus.
All comparative mutual fund data are from Morningstar, Inc., unless otherwise noted.
You can obtain a free copy of Vanguard’s proxy voting guidelines by visiting vanguard.com/proxyreporting or by calling Vanguard at 800-662-2739. The guidelines are also available from the SEC’s website, www.sec.gov. In addition, you may obtain a free report on how your fund voted the proxies for securities it owned during the 12 months ended June 30. To get the report, visit either vanguard.com/proxyreporting or www.sec.gov.
You can review information about your fund on the SEC’s website, and you can receive copies of this information, for a fee, by sending a request via email addressed to publicinfo@sec.gov.
| © 2019 The Vanguard Group, Inc. |
| All rights reserved. |
| Vanguard Marketing Corporation, Distributor. |
| |
| Q6730B 112019 |
Item 2: Code of Ethics. The Registrant has adopted a code of ethics that applies to the Registrant’s principal executive officer, principal financial officer, principal accounting officer or controller or persons performing similar functions. The Code of Ethics was amended during the reporting period covered by this report to make certain technical, non-material changes.
Item 3: Audit Committee Financial Expert. All members of the Audit Committee have been determined by the Registrant’s Board of Trustees to be Audit Committee Financial Experts and to be independent: F. Joseph Loughrey, Mark Loughridge, Sarah Bloom Raskin, and Peter F. Volanakis.
Item 4: Principal Accountant Fees and Services.
(a) Audit Fees.
Audit Fees of the Registrant.
Fiscal Year Ended September 30, 2019: $31,000
Fiscal Year Ended September 30, 2018: $34,000
Aggregate Audit Fees of Registered Investment Companies in the Vanguard Group.
Fiscal Year Ended September 30, 2019: $9,568,215
Fiscal Year Ended September 30, 2018: $9,734,277
Includes fees billed in connection with audits of the Registrant, other registered investment companies in the Vanguard complex, The Vanguard Group, Inc., and Vanguard Marketing Corporation.
(b) Audit-Related Fees.
Fiscal Year Ended September 30, 2019: $3,012,031
Fiscal Year Ended September 30, 2018: $5,581,336
Includes fees billed in connection with assurance and related services provided to the Registrant, other registered investment companies in the Vanguard complex, The Vanguard Group, Inc., and Vanguard Marketing Corporation.
(c) Tax Fees.
Fiscal Year Ended September 30, 2019: $357,238
Fiscal Year Ended September 30, 2018: $347,985
Includes fees billed in connection with tax compliance, planning, and advice services provided to the Registrant, other registered investment companies in the Vanguard complex, The Vanguard Group, Inc., and Vanguard Marketing Corporation.
(d) All Other Fees.
Fiscal Year Ended September 30, 2019: $0
Fiscal Year Ended September 30, 2018: $0
Includes fees billed for services related to tax reported information provided to the Registrant, other registered investment companies in the Vanguard complex, The Vanguard Group, Inc., and Vanguard Marketing Corporation.
(e) (1) Pre-Approval Policies. The policy of the Registrant’s Audit Committee is to consider, and, if appropriate, approve before the principal accountant is engaged for such services, all specific audit and non-audit services provided to: the Registrant, other registered investment companies in the Vanguard complex, The Vanguard Group, Inc., and entities controlled by The Vanguard Group, Inc. that provide ongoing services to the Registrant. In making a determination, the Audit Committee considers whether the services are consistent with maintaining the principal accountant’s independence.
In the event of a contingency situation in which the principal accountant is needed to provide services in between scheduled Audit Committee meetings, the Chairman of the Audit Committee would be called on to consider and, if appropriate, pre-approve audit or permitted non-audit services in an amount sufficient to complete services through the next Audit Committee meeting, and to determine if such services would be consistent with maintaining the accountant’s independence. At the next scheduled Audit Committee meeting, services and fees would be presented to the Audit Committee for formal consideration, and, if appropriate, approval by the entire Audit Committee. The Audit Committee would again consider whether such services and fees are consistent with maintaining the principal accountant’s independence.
The Registrant’s Audit Committee is informed at least annually of all audit and non-audit services provided by the principal accountant to the Vanguard complex, whether such services are provided to: the Registrant, other registered investment companies in the Vanguard complex, The Vanguard Group, Inc., or other entities controlled by The Vanguard Group, Inc. that provide ongoing services to the Registrant.
(2) No percentage of the principal accountant’s fees or services were approved pursuant to the waiver provision of paragraph (c)(7)(i)(C) of Rule 2-01 of Regulation S-X.
(f) For the most recent fiscal year, over 50% of the hours worked under the principal accountant’s engagement were not performed by persons other than full-time, permanent employees of the principal accountant.
(g) Aggregate Non-Audit Fees.
Fiscal Year Ended September 30, 2019: $357,238
Fiscal Year Ended September 30, 2018: $347,985
Includes fees billed for non-audit services provided to the Registrant, other registered investment companies in the Vanguard complex, The Vanguard Group, Inc., and Vanguard Marketing Corporation.
(h) For the most recent fiscal year, the Audit Committee has determined that the provision of all non-audit services was consistent with maintaining the principal accountant’s independence.
Item 5: Audit Committee of Listed Registrants.
The Registrant is a listed issuer as defined in rule 10A-3 under the Securities Exchange Act of 1934 (“Exchange Act”). The Registrant has a separately-designated standing audit committee established in accordance with Section 3(a)(58)(A) of the Exchange Act. The Registrant’s audit committee members are: F. Joseph Loughrey, Mark Loughridge, Sarah Bloom Raskin, and Peter F. Volanakis.
Item 6: Investments.
Not applicable.
Item 7: Disclosure of Proxy Voting Policies and Procedures for Closed-End Management Investment Companies.
Not applicable.
Item 8: Portfolio Managers of Closed-End Management Investment Companies.
Not applicable.
Item 9: Purchase of Equity Securities by Closed-End Management Investment Company and Affiliated Purchasers.
Not applicable.
Item 10: Submission of Matters to a Vote of Security Holders.
Not applicable.
Item 11: Controls and Procedures.
(a) Disclosure Controls and Procedures. The Principal Executive and Financial Officers concluded that the Registrant’s Disclosure Controls and Procedures are effective based on their evaluation of the Disclosure Controls and Procedures as of a date within 90 days of the filing date of this report.
(b) Internal Control Over Financial Reporting. There were no significant changes in Registrant’s Internal Control Over Financial Reporting or in other factors that could significantly affect this control subsequent to the date of the evaluation, including any corrective actions with regard to significant deficiencies and material weaknesses.
Item 12: Disclosure of Securities Lending Activities for Closed-End Management Investment Companies.
Not applicable.
Item 13: Exhibits.
(a) Code of Ethics.
(b) Certifications.
Pursuant to the requirements of the Securities Exchange Act of 1934 and the Investment Company Act of 1940, the registrant has duly caused this report to be signed on its behalf by the undersigned, thereunto duly authorized.
| VANGUARD CHESTER FUNDS |
| |
BY: | /s/ MORTIMER J. BUCKLEY* | |
| | |
| MORTIMER J. BUCKLEY | |
| CHIEF EXECUTIVE OFFICER | |
Date: November 15, 2019
Pursuant to the requirements of the Securities Exchange Act of 1934 and the Investment Company Act of 1940, this report has been signed below by the following persons on behalf of the registrant and in the capacities and on the dates indicated.
| VANGUARD CHESTER FUNDS |
| |
BY: | /s/ MORTIMER J. BUCKLEY* | |
| | |
| MORTIMER J. BUCKLEY | |
| CHIEF EXECUTIVE OFFICER | |
|
Date: November 15, 2019 |
|
| VANGUARD CHESTER FUNDS |
| |
BY: | /s/ JOHN BENDL* | |
| | |
| JOHN BENDL | |
| CHIEF FINANCIAL OFFICER | |
| |
Date: November 15, 2019 | |
* By: /s/ Anne E. Robinson
Anne E. Robinson, pursuant to a Power of Attorney filed on January 18, 2018 (see file Number 33-32216) and a Power of Attorney filed on October 30, 2019 (see file Number 811-02554), Incorporated by Reference.