UNITED STATES
SECURITIES AND EXCHANGE COMMISSION
Washington, D.C. 20549
FORM N-CSR
CERTIFIED SHAREHOLDER REPORT
OF
REGISTERED MANAGEMENT INVESTMENT COMPANIES
Investment Company Act file number: 811-04098
Name of Registrant: Vanguard Chester Funds
Address of Registrant:
P.O. Box 2600
Valley Forge, PA 19482
Name and address of agent for service:
Anne E. Robinson, Esquire
P.O. Box 876
Valley Forge, PA 19482
Registrant’s telephone number, including area code: (610) 669-1000
Date of fiscal year end: September 30
Date of reporting period: October 1, 2015 – September 30, 2016
Item 1: Reports to Shareholders

Annual Report | September 30, 2016
Vanguard PRIMECAP Fund
A new format, unwavering commitment
As you begin reading this report, you’ll notice that we’ve made some improvements to the opening sections—based on feedback from you, our clients.
Page 1 starts with a new ”Your Fund’s Performance at a Glance,” a concise, handy summary of how your fund performed during the period.
In the renamed ”Chairman’s Perspective,” Bill McNabb will focus on enduring principles and investment insights.
We’ve modified some tables, and eliminated some redundancy, but we haven’t removed any information.
At Vanguard, we’re always looking for better ways to communicate and to help you make sound investment decisions. Thank you for entrusting your assets to us.
| |
| Contents | |
| Your Fund’s Performance at a Glance. | 1 |
| Chairman’s Perspective. | 3 |
| Advisor’s Report. | 6 |
| Fund Profile. | 9 |
| Performance Summary. | 10 |
| Financial Statements. | 12 |
| Your Fund’s After-Tax Returns. | 25 |
| About Your Fund’s Expenses. | 26 |
| Trustees Approve Advisory Arrangement. | 28 |
| Glossary. | 30 |
Please note: The opinions expressed in this report are just that—informed opinions. They should not be considered promises or advice. Also, please keep in mind that the information and opinions cover the period through the date on the front of this report. Of course, the risks of investing in your fund are spelled out in the prospectus.
See the Glossary for definitions of investment terms used in this report.
About the cover: No matter what language you speak, Vanguard has one consistent message and set of principles. Our primary focus is on you, our clients. We conduct our business with integrity as a faithful steward of your assets. This message is shown translated into seven languages, reflecting our expanding global presence.
Your Fund’s Performance at a Glance
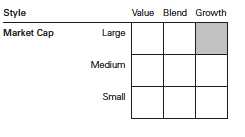
• Vanguard PRIMECAP Fund returned about 17% for the 12 months ended September 30, 2016, exceeding the benchmark Standard and Poor’s 500 Index return of about 15% and the nearly 9% average return of its multi-capitalization growth fund peers.
• Value stocks outpaced their growth counterparts for the period. All of PRIMECAP’s industry sectors posted gains, six of them double digits.
• PRIMECAP Management Company, the fund’s advisor, traditionally invests most heavily in the information technology and health care sectors. The fund’s technology stocks advanced more than 36%, well ahead of those in the benchmark, and contributed about 12 percentage points to results. Health care stocks returned 10% and added about 3 percentage points to results.
| |
| Total Returns: Fiscal Year Ended September 30, 2016 | |
| | Total |
| | Returns |
| Vanguard PRIMECAP Fund | |
| Investor Shares | 17.40% |
| Admiral™ Shares | 17.48 |
| S&P 500 Index | 15.43 |
| Multi-Cap Growth Funds Average | 8.91 |
| Multi-Cap Growth Funds Average: Derived from data provided by Lipper, a Thomson Reuters Company. | |
| Admiral Shares carry lower expenses and are available to investors who meet certain account-balance requirements. | |
| |
| |
| Total Returns: Ten Years Ended September 30, 2016 | |
| | Average |
| | Annual Return |
| PRIMECAP Fund Investor Shares | 9.51% |
| S&P 500 Index | 7.24 |
| Multi-Cap Growth Funds Average | 6.81 |
| Multi-Cap Growth Funds Average: Derived from data provided by Lipper, a Thomson Reuters Company. | |
The figures shown represent past performance, which is not a guarantee of future results. (Current performance may be lower or higher than the performance data cited. For performance data current to the most recent month-end, visit our website at vanguard.com/performance.) Note, too, that both investment returns and principal value can fluctuate widely, so an investor’s shares, when sold, could be worth more or less than their original cost.
1
| | | |
| Expense Ratios | | | |
| Your Fund Compared With Its Peer Group | | | |
| | Investor | Admiral | Peer Group |
| | Shares | Shares | Average |
| PRIMECAP Fund | 0.40% | 0.34% | 1.25% |
The fund expense ratios shown are from the prospectus dated January 28, 2016, and represent estimated costs for the current fiscal year. For the fiscal year ended September 30, 2016, the fund’s expense ratios were 0.39% for Investor Shares and 0.33% for Admiral Shares. The peer-group expense ratio is derived from data provided by Lipper, a Thomson Reuters Company, and captures information through year-end 2015.
Peer group: Multi-Cap Growth Funds.
2
Chairman’s Perspective

Bill McNabb
Chairman and Chief Executive Officer
Dear Shareholder,
If you think you’ve had reason to feel uneasy about the investment environment lately, you’re not imagining things. In just the past few months, we’ve seen economic uncertainty, intense political polarization, and super-low bond yields. Yet at the same time, the stock market kept pushing higher.
In this confusing and sometimes contradictory climate, you may be asking yourself a question that I hear often: How do I make sense of all this, keep investing, and still get a good night’s sleep?
As with any problem, there are multiple ways to go at it. But there’s one approach in particular that is simple, straightforward, and nearly foolproof: Save more money. Not only can saving more give you a greater sense of control over your investment plan, it can help compensate for long-term returns that, in our estimation, could fall short of historical averages.
I love the way one of our investment pros put it. Fran Kinniry this summer told The Wall Street Journal, “Investing is always a partnership between you and the markets.” He explained that the markets carried more than their fair share of the weight for a couple of decades, through the 1990s, providing outsized returns that made the investor’s half of the partnership relatively light work. “But now you are going to have to be the majority partner.”
Sobering? Sure. Hopeless? Definitely not.
3
Over the 12 months since last September, U.S. stocks returned 15%, though the rise has not been a one-way ticket straight up. International markets have also posted strong returns, but lower than those of the broad U.S. market. The decision by United Kingdom voters in June to exit the European Union came as a surprise but caused market heartburn for only a few days.
In fixed income, yields remained extremely low—about 1.60% on the 10-year U.S. Treasury note at the end of September, after dipping below 1.40% over the summer. And bond yields in some international markets were negative.
Even this relatively small window of time illustrates a truism of the financial markets: There will always be segments that perform well and others that don’t. Saving more saves you from trying to control the uncontrollable—how economies and the markets perform. And it keeps you in control of one of the most vital parts of your investment program.
Although the “save more” logic is easy to grasp, it’s not always easy to follow. Bills, illness, the loss of a job—these can affect any of us.
But whatever our circumstances, figuring out how to save more is worth the effort. It requires that we make difficult decisions to forgo some consumption today to increase the likelihood of consuming (or consuming more) in the future. This is the very heart of investing. Sacrifices are never fun, so consider carrying them out systematically and in doses that you
| | | |
| Market Barometer | | | |
| | | Average Annual Total Returns |
| | | Periods Ended September 30, 2016 |
| | One | Three | Five |
| | Year | Years | Years |
| Stocks | | | |
| Russell 1000 Index (Large-caps) | 14.93% | 10.78% | 16.41% |
| Russell 2000 Index (Small-caps) | 15.47 | 6.71 | 15.82 |
| Russell 3000 Index (Broad U.S. market) | 14.96 | 10.44 | 16.36 |
| FTSE All-World ex US Index (International) | 9.62 | 0.71 | 6.50 |
| |
| Bonds | | | |
| Bloomberg Barclays U.S. Aggregate Bond Index | | | |
| (Broad taxable market) | 5.19% | 4.03% | 3.08% |
| Bloomberg Barclays Municipal Bond Index | | | |
| (Broad tax-exempt market) | 5.58 | 5.54 | 4.48 |
| Citigroup Three-Month U.S. Treasury Bill Index | 0.20 | 0.06 | 0.06 |
| |
| CPI | | | |
| Consumer Price Index | 1.46% | 1.03% | 1.25% |
4
can be comfortable with—for instance, gradually getting up to the max in your IRA, or adding a percentage point or so to the amount you stash in your employer’s retirement plan. As a point of reference, we generally suggest that investors strive for a retirement savings rate of 12%–15%, including any employer contributions.
If you need more convincing about the wisdom of the “save more” course of action, it might be helpful to examine your alternatives. This list is by no means exhaustive, but it hits on a few of the big ones, and none are without risk.
• Reach for yield. With yields so low on many types of bonds, it’s tempting to find the corners of the fixed income market where payouts are juicier. But with the juice comes considerable risk. You need to be aware that you’d be taking on more risk—and how much more.
• Go all-in on a hot-performing asset class or fund. By now, you know better than that, right?
• Sit tight. This approach isn’t a terrible idea; it’s better than panicking and deciding to just “do something,” particularly if that means changing your approach in response to the market’s movements.
Here’s the inescapably challenging part of your partnership with the markets: In the short run, your “partner” is fickle, emotional, and wildly unpredictable. But in the long run, your partner is mostly rational and extremely helpful.
The best way to minimize your vulnerability to the market’s mood swings, and to maximize the benefit of your partner’s longer-term strengths, is to expect less and save more. Maybe the markets will deliver better-than-expected returns. Maybe they’ll be consistent with our more modest expectations. In either case, a higher savings rate can help put you in a better position to reach your goals.
As always, thank you for investing with Vanguard.
Sincerely,

F. William McNabb III
Chairman and Chief Executive Officer
October 18, 2016
5
Advisor’s Report
For the fiscal year ended September 30, 2016, Vanguard PRIMECAP Fund returned 17.40% for Investor Shares and 17.48% for Admiral Shares. These exceeded both the 15.43% return of the fund’s benchmark, the unmanaged Standard & Poor’s 500 Index, and the 8.91% average return of its multi-capitalization growth fund competitors. The fund’s information technology portfolio was the most significant contributor to its absolute and relative results, returning 36%, compared with the 23% return of the S&P 500 Information Technology Index. The fund’s overweight position in health care detracted from relative returns, as did the poor relative performance of its industrial holdings, which returned 9%, compared with the 19% return of the S&P 500 Industrials Index. Financials were a bright spot for the fund thanks to the combined benefit of an underweight position (financials were the worst-performing sector over the period) and favorable stock selection.
The investment environment
The investment environment has been inhospitable for active managers recently, with the vast majority of large-cap growth stock funds underperforming their benchmarks in calendar year 2016. The dispersion of sector returns has been extreme, as have the pace and magnitude of changes in market leadership.
For example, during the first quarter, the best-performing sector in the S&P 500 Index, telecommunication services (+17%), returned nearly 22 percentage points more than the worst-performing sector, financial services (–5%). Telecommunication services (+25%) and utilities (+23%), which led the market for the first six months of the calendar year (compared with the 4% total return of the S&P 500 Index), were the worst-performing sectors during the third quarter, when each returned –6% (compared with the 4% total return of the S&P 500 Index). Conversely, information technology, which had a slightly negative total return in the first half of the year, far exceeded all other sectors during the third quarter, returning 12%.
Portfolio update
The portfolio remained heavily overweighted in information technology and health care stocks, which had a combined ending weight of 64%, compared with 36% in the S&P 500 Index. The portfolio’s most significant underweights were in consumer staples, energy, real estate, and utilities; those sectors’ combined ending weight was 2%, compared with 24% in the S&P 500 Index. The portfolio also was underweighted in consumer discretionary, financials, materials, and telecommunication services. Combined, they represented 18% of assets at the end of the period, compared with 31% in the S&P 500 Index.
In information technology, the fund is most overweighted in semiconductors and semiconductor equipment stocks (12% versus 3% for the S&P 500 Index) and software (11% versus 4% for the index). During the past fiscal year, semiconductors were the sector’s best-performing industry for both the fund (+48%) and the index (+39%), with the
6
fund’s outperformance driven by Texas Instruments (+45%) and NVIDIA (+181%). The fund’s software holdings returned 31%, led by Adobe Systems (+32%) and Microsoft (+34%). The portfolio’s internet holdings returned 38%, led by Alibaba (+79%), and its hardware holdings returned +37%, primarily due to Hewlett Packard Enterprise (+59%) and HP Inc. (+30%). In communications equipment, the fund’s poor relative performance (+2%) was driven by Ericsson (–24%).
In health care, the fund is most overweighted in biotechnology and pharmaceutical stocks, whose 22% combined weighting was nearly triple their weighting in the S&P 500 Index. The portfolio’s biotech holdings returned 15%, exceeding the index return, thanks to Amgen (+24%) and Biogen (+7%). Biogen rebounded dramatically during the third quarter, returning 29%, in part on rumors that the company could be acquired. The fund’s pharmaceutical holdings returned –1%, below the index return, as Eli Lilly (–2%), Roche (–2%), and Novartis (–11%) underperformed.
The fund is also significantly overweighted in industrial stocks (16% versus 10% for the S&P 500 Index) notably, airlines (6% versus 1% for the index) and air freight & logistics companies (4% versus 1%). Airline stocks were the worst-performing group in industrials, and their –3% return accounted for most of the fund’s under-performance in that sector.
As of September 30, 2016, the fund’s top 10 holdings represented about 42% of assets.
Advisor perspectives
Our search for new investments often begins with research on out-of-favor companies and industries. Over the last several years, the information technology industry has been disrupted by cloud computing and the associated shift to subscription-based pricing models, the rise of smartphones and concomitant erosion of the personal computer market, and the advent of social networking. The industry has always been characterized by such disruptive innovations, which force incumbents to internally develop or acquire next-generation technologies in order to survive. Although such transitions carry significant risks, investors who focus solely on the threats posed by next-generation technologies often ignore the significant intellectual capital, established sales and distribution channels, and sizeable cash flows the “old technology” incumbents bring to bear.
Several years ago, Adobe and Microsoft were dismissed as “old technology” companies tied to legacy business models. Their software was delivered from locally deployed servers or personal computers and sold as perpetual licenses with annual maintenance contracts, whereas next-generation competitors delivered their software from the cloud and sold monthly subscriptions.
At the end of 2011, Adobe traded for $28 per share, or 11.5 times the 2012 estimated earnings per share (EPS) of $2.45, while at the end of 2012, Microsoft sold for $27 per share, or 8.8 times the 2013 estimated EPS of $3.04. In Adobe’s
7
case, as it became clear that the company’s transition to a software-as-a-service (SaaS) model would be successful, investors overlooked the negative near-term financial impact of the transition and began to value the stock based on its long-term earnings potential. Adobe currently trades for $107, or 27.3 times the 2017 estimated EPS of $3.97. In Microsoft’s case, the transitioning of its existing software to a SaaS model was accompanied by the creation of entirely new cloud computing businesses, which gave investors confidence that the company would remain a valued partner to its business customers as they shifted their internal IT environments to the cloud. Microsoft currently sells for $57, or 18.7 times the 2017 estimated EPS of $3.06.
The portfolio contains a number of stocks of “old technology” companies, including Cisco (12.5 times the 2017 estimated EPS), Intel (13.3 times), Hewlett Packard Enterprise (10.6 times), HP Inc. (9.6 times), Micron (13.1 times), NetApp (13.2 times), Oracle (13.7 times), and Qualcomm (13.8 times). Each company faces unique challenges, but each possesses significant competitive advantages and has the potential to exceed the market’s modest expectations.
Outside of information technology, we remain enthusiastic about the fund’s airline holdings, whose extraordinarily low valuation multiples reflect a high degree of skepticism about their ability to sustain current profits. We are more sanguine about the outlook for airline industry profitability, as we believe industry supply and demand dynamics are favorable.
We also find many financials to be attractively valued, particularly large banks that are trading near book value and could benefit significantly from rising interest rates. Finally, we are excited by the prospects for our health care holdings, many of which are trading at or below the S&P 500 Index forward price/earnings multiple in spite of superior secular growth prospects. In the short term, however, we expect significant volatility in this area, as two of the fund’s largest holdings, Biogen and Eli Lilly, present data related to their respective Alzheimer’s drugs later this year.
Conclusion
As bottom-up stock pickers, we spend our time searching for stocks with long-term prospects we find to be materially better than market prices would seem to imply. Our approach often results in portfolios that bear little resemblance to market indices, creating the possibility for substantial deviations in relative performance. For example, our relative returns were significantly negative during the first half of calendar 2016, when the fund’s overweighted sectors and industries underperformed, and we expect to experience similar conditions in the future. We nonetheless believe that this approach can generate superior results for shareholders over the long term.
PRIMECAP Management Company
October 18, 2016
8
| | | |
| PRIMECAP Fund | | |
| |
| |
| Fund Profile | | | |
| As of September 30, 2016 | | |
| |
| Share-Class Characteristics | | |
| | Investor | | Admiral |
| | Shares | | Shares |
| Ticker Symbol | VPMCX | | VPMAX |
| Expense Ratio1 | 0.40% | | 0.34% |
| 30-Day SEC Yield | 1.41% | | 1.39% |
| |
| Portfolio Characteristics | | |
| | | | DJ |
| | | | U.S. |
| | | | Total |
| | | | Market |
| | | S&P 500 | FA |
| | Fund | Index | Index |
| Number of Stocks | 131 | 505 | 3,850 |
| Median Market Cap | $68.6B | $81.0B | $51.8B |
| Price/Earnings Ratio | 20.4x | 22.2x | 23.7x |
| Price/Book Ratio | 3.8x | 2.9x | 2.8x |
| Return on Equity | 18.0% | 17.5% | 16.6% |
| Earnings Growth | | | |
| Rate | 8.0% | 7.3% | 7.6% |
| Dividend Yield | 1.7% | 2.1% | 2.0% |
| Foreign Holdings | 9.7% | 0.0% | 0.0% |
| Turnover Rate | 6% | — | — |
| Short-Term | | | |
| Reserves | 3.7% | — | — |
Sector Diversification (% of equity exposure)
| | | |
| | | | DJ |
| | | | U.S. Total |
| | | S&P 500 | Market |
| | Fund | Index | FA Index |
| Consumer | | | |
| Discretionary | 8.2% | 12.5% | 12.8% |
| Consumer Staples | 0.4 | 9.9 | 8.7 |
| Energy | 1.5 | 7.3 | 6.7 |
| Financials | 6.8 | 12.8 | 13.3 |
| Health Care | 27.4 | 14.7 | 14.2 |
| Industrials | 16.1 | 9.7 | 10.3 |
| Information | | | |
| Technology | 36.8 | 21.2 | 20.7 |
| Materials | 1.8 | 2.9 | 3.3 |
| Real Estate | 0.0 | 3.1 | 4.3 |
| Telecommunication | | | |
| Services | 1.0 | 2.6 | 2.4 |
| Utilities | 0.0 | 3.3 | 3.3 |
| | |
| Volatility Measures | | |
| | | DJ |
| | | U.S. Total |
| | S&P 500 | Market |
| | Index | FA Index |
| R-Squared | 0.87 | 0.88 |
| Beta | 0.99 | 0.99 |
These measures show the degree and timing of the fund’s fluctuations compared with the indexes over 36 months.
Ten Largest Holdings (% of total net assets)
| | |
| Biogen Inc. | Biotechnology | 6.1% |
| Amgen Inc. | Biotechnology | 5.0 |
| Eli Lilly & Co. | Pharmaceuticals | 4.8 |
| Alphabet Inc. | Internet Software & | |
| | Services | 4.5 |
| Microsoft Corp. | Systems Software | 4.5 |
| Texas Instruments Inc. | Semiconductors | 4.4 |
| Adobe Systems Inc. | Application Software | 4.0 |
| FedEx Corp. | Air Freight & | |
| | Logistics | 3.5 |
| Roche Holding AG | Pharmaceuticals | 2.8 |
| Southwest Airlines Co. | Airlines | 2.8 |
| Top Ten | | 42.4% |
The holdings listed exclude any temporary cash investments and equity index products.
Investment Focus
1 The expense ratios shown are from the prospectus dated January 28, 2016, and represent estimated costs for the current fiscal year. For the fiscal year ended September 30, 2016, the expense ratios were 0.39% for Investor Shares and 0.33% for Admiral Shares.
9
PRIMECAP Fund
Performance Summary
All of the returns in this report represent past performance, which is not a guarantee of future results that may be achieved by the fund. (Current performance may be lower or higher than the performance data cited. For performance data current to the most recent month-end, visit our website at vanguard.com/performance.) Note, too, that both investment returns and principal value can fluctuate widely, so an investor’s shares, when sold, could be worth more or less than their original cost. The returns shown do not reflect taxes that a shareholder would pay on fund distributions or on the sale of fund shares.
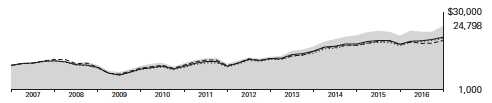
Cumulative Performance: September 30, 2006, Through September 30, 2016
Initial Investment of $10,000
| | | | | |
| | | | Average Annual Total Returns | |
| | | Periods Ended September 30, 2016 | |
| | | | | | Final Value |
| | | One | Five | Ten | of a $10,000 |
| | | Year | Years | Years | Investment |
| | PRIMECAP Fund*Investor Shares | 17.40% | 18.52% | 9.51% | $24,798 |
| •••••••• | S&P 500 Index | 15.43 | 16.37 | 7.24 | 20,114 |
| – – – – | Multi-Cap Growth Funds Average | 8.91 | 14.29 | 6.81 | 19,332 |
| | Dow Jones U.S. Total Stock Market | | | | |
| | Float Adjusted Index | 14.93 | 16.30 | 7.49 | 20,592 |
| Multi-Cap Growth Funds Average: Derived from data provided by Lipper, a Thomson Reuters Company. | | |
| | | | |
| | | | | Final Value |
| | One | Five | Ten | of a $50,000 |
| | Year | Years | Years | Investment |
| PRIMECAP Fund Admiral Shares | 17.48% | 18.62% | 9.61% | $125,178 |
| S&P 500 Index | 15.43 | 16.37 | 7.24 | 100,568 |
| Dow Jones U.S. Total Stock Market Float | | | | |
| Adjusted Index | 14.93 | 16.30 | 7.49 | 102,961 |
See Financial Highlights for dividend and capital gains information.
10
PRIMECAP Fund
Fiscal-Year Total Returns (%): September 30, 2006, Through September 30, 2016
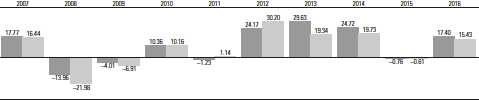
PRIMECAP Fund Investor Shares
S&P 500 Index
11
PRIMECAP Fund
Financial Statements
Statement of Net Assets
As of September 30, 2016
The fund reports a complete list of its holdings in regulatory filings four times in each fiscal year, at the quarter-ends. For the second and fourth fiscal quarters, the lists appear in the fund’s semiannual and annual reports to shareholders. For the first and third fiscal quarters, the fund files the lists with the Securities and Exchange Commission on Form N-Q. Shareholders can look up the fund’s Forms N-Q on the SEC’s website at sec.gov. Forms N-Q may also be reviewed and copied at the SEC’s Public Reference Room (see the back cover of this report for further information).
| | | |
| | | | Market |
| | | | Value• |
| | | Shares | ($000) |
| Common Stocks (96.4%) | | |
| Consumer Discretionary (7.9%) | |
| | L Brands Inc. | 8,494,543 | 601,159 |
| | Ross Stores Inc. | 9,009,800 | 579,330 |
| ^ | Sony Corp. ADR | 17,197,700 | 571,136 |
| | TJX Cos. Inc. | 6,945,900 | 519,414 |
| | Walt Disney Co. | 4,008,600 | 372,239 |
| | Carnival Corp. | 7,065,400 | 344,933 |
| | Royal Caribbean | | |
| | Cruises Ltd. | 2,810,333 | 210,634 |
| * | Amazon.com Inc. | 187,965 | 157,385 |
| | Bed Bath & Beyond Inc. | 2,249,675 | 96,983 |
| | Comcast Corp. Class A | 691,600 | 45,881 |
| | VF Corp. | 755,200 | 42,329 |
| | Lowe’s Cos. Inc. | 533,400 | 38,517 |
| * | Charter | | |
| | Communications Inc. | | |
| | Class A | 138,500 | 37,391 |
| | Newell Brands Inc. | 493,700 | 25,998 |
| | Las Vegas Sands Corp. | 391,100 | 22,504 |
| | Marriott International Inc. | | |
| | Class A | 293,300 | 19,748 |
| | Whirlpool Corp. | 60,000 | 9,730 |
| * | AutoZone Inc. | 11,800 | 9,066 |
| * | CarMax Inc. | 157,500 | 8,403 |
| * | MGM Resorts International 300,000 | 7,809 |
| | Hilton Worldwide | | |
| | Holdings Inc. | 273,800 | 6,278 |
| | | | 3,726,867 |
| Consumer Staples (0.4%) | | |
| | CVS Health Corp. | 2,174,465 | 193,506 |
| |
| Energy (1.5%) | | |
| | Schlumberger Ltd. | 2,985,819 | 234,805 |
| | EOG Resources Inc. | 1,926,100 | 186,273 |
| ^,* | Transocean Ltd. | 8,659,579 | 92,311 |
| | Noble Energy Inc. | 2,199,800 | 78,621 |
| | Exxon Mobil Corp. | 601,300 | 52,482 |
| | National Oilwell Varco Inc. | 567,100 | 20,835 |
| | | |
| | | | Market |
| | | | Value• |
| | | Shares | ($000) |
| * | Southwestern Energy Co. | 684,400 | 9,472 |
| | Cabot Oil & Gas Corp. | 283,500 | 7,314 |
| * | Petroleo Brasileiro SA | | |
| | ADR Preference Shares | 586,600 | 4,875 |
| * | Petroleo Brasileiro SA | | |
| | ADR | 391,100 | 3,649 |
| | Range Resources Corp. | 75,000 | 2,906 |
| | | | 693,543 |
| Financials (6.5%) | | |
| | Charles Schwab Corp. | 25,134,400 | 793,493 |
| | JPMorgan Chase & Co. | 10,933,901 | 728,088 |
| | Marsh & McLennan | | |
| | Cos. Inc. | 7,703,045 | 518,030 |
| | Wells Fargo & Co. | 10,987,400 | 486,522 |
| | Progressive Corp. | 5,583,200 | 175,871 |
| | US Bancorp | 3,425,000 | 146,898 |
| | CME Group Inc. | 844,850 | 88,304 |
| | Discover Financial | | |
| | Services | 1,484,300 | 83,937 |
| | Travelers Cos. Inc. | 244,400 | 27,996 |
| | American Express Co. | 412,700 | 26,429 |
| | Chubb Ltd. | 41,233 | 5,181 |
| | | | 3,080,749 |
| Health Care (26.4%) | | |
| * | Biogen Inc. | 9,199,800 | 2,879,813 |
| | Amgen Inc. | 14,224,800 | 2,372,839 |
| | Eli Lilly & Co. | 28,461,400 | 2,284,312 |
| | Roche Holding AG | 5,438,500 | 1,347,313 |
| | Novartis AG ADR | 12,147,865 | 959,195 |
| | Medtronic plc | 8,379,552 | 723,993 |
| * | Boston Scientific Corp. | 27,029,460 | 643,301 |
| | Thermo Fisher | | |
| | Scientific Inc. | 2,577,200 | 409,929 |
| ^ | AstraZeneca plc ADR | 10,057,000 | 330,473 |
| | Abbott Laboratories | 6,468,068 | 273,535 |
| | Johnson & Johnson | 950,000 | 112,223 |
| | Agilent Technologies Inc. | 860,900 | 40,540 |
| | Sanofi ADR | 1,046,100 | 39,951 |
| | AbbVie Inc. | 523,100 | 32,992 |
12
| | | |
| PRIMECAP Fund | | |
| |
| |
| |
| | | | Market |
| | | | Value• |
| | | Shares | ($000) |
| | Zimmer Biomet | | |
| | Holdings Inc. | 230,000 | 29,905 |
| | GlaxoSmithKline plc ADR | 586,600 | 25,300 |
| | Stryker Corp. | 180,900 | 21,059 |
| | | | 12,526,673 |
| Industrials (15.6%) | | |
| | FedEx Corp. | 9,502,168 | 1,659,839 |
| 1 | Southwest Airlines Co. | 33,597,600 | 1,306,611 |
| | Airbus Group SE | 11,557,658 | 699,112 |
| | American Airlines | | |
| | Group Inc. | 16,059,200 | 587,927 |
| | Alaska Air Group Inc. | 6,082,735 | 400,609 |
| | Honeywell | | |
| | International Inc. | 3,314,400 | 386,426 |
| | Caterpillar Inc. | 4,210,700 | 373,784 |
| | Union Pacific Corp. | 3,546,500 | 345,890 |
| * | United Continental | | |
| | Holdings Inc. | 5,801,500 | 304,405 |
| | Deere & Co. | 3,015,200 | 257,347 |
| | United Parcel Service Inc. | | |
| | Class B | 2,132,470 | 233,207 |
| | Delta Air Lines Inc. | 5,123,000 | 201,641 |
| | United Technologies | | |
| | Corp. | 1,153,700 | 117,216 |
| | Boeing Co. | 861,600 | 113,507 |
| | CSX Corp. | 2,630,000 | 80,215 |
| | Pentair plc | 1,246,600 | 80,082 |
| | Safran SA | 1,031,800 | 74,190 |
| * | Johnson Controls | | |
| | International plc | 700,000 | 32,571 |
| | CH Robinson | | |
| | Worldwide Inc. | 430,000 | 30,298 |
| | Textron Inc. | 733,800 | 29,168 |
| | Expeditors International | | |
| | of Washington Inc. | 425,000 | 21,896 |
| | Siemens AG | 170,000 | 19,901 |
| | Rockwell Automation Inc. | 153,500 | 18,779 |
| * | Hertz Global Holdings Inc. | 447,800 | 17,984 |
| * | Herc Holdings Inc. | 142,699 | 4,809 |
| | Republic Services Inc. | | |
| | Class A | 16,600 | 837 |
| | | | 7,398,251 |
| Information Technology (35.5%) | |
| | Microsoft Corp. | 36,942,900 | 2,127,911 |
| | Texas Instruments Inc. | 29,504,700 | 2,070,640 |
| * | Adobe Systems Inc. | 17,616,670 | 1,912,113 |
| * | Alphabet Inc. Class A | 1,339,875 | 1,077,340 |
| * | Alphabet Inc. Class C | 1,369,411 | 1,064,429 |
| * | Alibaba Group | | |
| | Holding Ltd. ADR | 8,184,300 | 865,817 |
| | NVIDIA Corp. | 12,146,200 | 832,258 |
| | Intel Corp. | 18,690,000 | 705,547 |
| | Hewlett Packard | | |
| | Enterprise Co. | 27,686,085 | 629,858 |
| | | |
| | | | Market |
| | | | Value• |
| | | Shares | ($000) |
| | QUALCOMM Inc. | 9,145,550 | 626,470 |
| * | Micron Technology Inc. | 32,115,000 | 571,005 |
| 1 | NetApp Inc. | 14,105,600 | 505,263 |
| | HP Inc. | 31,453,585 | 488,474 |
| | Intuit Inc. | 4,378,900 | 481,723 |
| | Cisco Systems Inc. | 14,871,150 | 471,713 |
| | KLA-Tencor Corp. | 6,489,500 | 452,383 |
| ^ | Telefonaktiebolaget LM | | |
| | Ericsson ADR | 36,388,304 | 262,360 |
| | Activision Blizzard Inc. | 5,752,100 | 254,818 |
| | Oracle Corp. | 6,277,700 | 246,588 |
| 1 | Plantronics Inc. | 3,619,000 | 188,043 |
| | Analog Devices Inc. | 2,204,700 | 142,093 |
| | Visa Inc. Class A | 1,701,200 | 140,689 |
| | Corning Inc. | 5,126,300 | 121,237 |
| * | Dell Technologies Inc - | | |
| | VMware Inc | 1,979,369 | 94,614 |
| ^,* | BlackBerry Ltd. | 10,205,900 | 81,443 |
| | Apple Inc. | 539,700 | 61,013 |
| * | Yahoo! Inc. | 1,363,100 | 58,750 |
| * | eBay Inc. | 1,784,600 | 58,713 |
| * | PayPal Holdings Inc. | 1,150,000 | 47,115 |
| * | Entegris Inc. | 2,525,872 | 44,001 |
| * | salesforce.com Inc. | 583,000 | 41,585 |
| | Applied Materials Inc. | 1,097,500 | 33,090 |
| * | Rambus Inc. | 2,625,100 | 32,814 |
| * | Keysight | | |
| | Technologies Inc. | 332,400 | 10,534 |
| | ASML Holding NV | 95,975 | 10,517 |
| | Western Digital Corp. | 116,650 | 6,821 |
| | Mastercard Inc. | 29,300 | 2,982 |
| | | | 16,822,764 |
| Materials (1.7%) | | |
| | Monsanto Co. | 5,900,625 | 603,044 |
| | Praxair Inc. | 904,400 | 109,279 |
| ^ | Potash Corp. of | | |
| | Saskatchewan Inc. | 4,809,500 | 78,491 |
| | Celanese Corp. Class A | 408,000 | 27,156 |
| | Dow Chemical Co. | 156,400 | 8,106 |
| | LyondellBasell Industries | | |
| | NV Class A | 9,200 | 742 |
| | | | 826,818 |
| Telecommunication Services (0.9%) | |
| | AT&T Inc. | 11,095,842 | 450,602 |
| Total Common Stocks | | |
| (Cost $21,334,150) | | 45,719,773 |
| Temporary Cash Investment (4.0%) | |
| Money Market Fund (4.0%) | | |
| 2,3 | Vanguard Market | | |
| | Liquidity Fund, 0.640% | | |
| | (Cost $1,902,468) | 19,024,280 | 1,902,618 |
| Total Investments (100.4%) | | |
| (Cost $23,236,618) | | 47,622,391 |
13
| |
| PRIMECAP Fund | |
| |
| |
| |
| |
| | Amount |
| | ($000) |
| Other Assets and Liabilities (-0.4%) | |
| Other Assets | |
| Investment in Vanguard | 3,594 |
| Receivables for Investment Securities Sold 29,616 |
| Receivables for Accrued Income | 49,996 |
| Receivables for Capital Shares Issued | 171,536 |
| Other Assets | 14,892 |
| Total Other Assets | 269,634 |
| Liabilities | |
| Payables for Investment Securities | |
| Purchased | (43,844) |
| Collateral for Securities on Loan | (123,264) |
| Payables to Investment Advisor | (22,660) |
| Payables for Capital Shares Redeemed | (190,372) |
| Payables to Vanguard | (57,349) |
| Other Liabilities | (13,836) |
| Total Liabilities | (451,325) |
| Net Assets (100%) | 47,440,700 |
| |
| At September 30, 2016, net assets consisted of: |
| | Amount |
| | ($000) |
| Paid-in Capital | 20,985,172 |
| Undistributed Net Investment Income | 425,507 |
| Accumulated Net Realized Gains | 1,644,579 |
| Unrealized Appreciation (Depreciation) | |
| Investment Securities | 24,385,773 |
| Foreign Currencies | (331) |
| Net Assets | 47,440,700 |
| |
| |
| Investor Shares—Net Assets | |
| Applicable to 70,520,819 outstanding | |
| $.001 par value shares of beneficial | |
| interest (unlimited authorization) | 7,588,311 |
| Net Asset Value Per Share— | |
| Investor Shares | $107.60 |
| |
| |
| Admiral Shares—Net Assets | |
| Applicable to 357,366,939 outstanding | |
| $.001 par value shares of beneficial | |
| interest (unlimited authorization) | 39,852,389 |
| Net Asset Value Per Share— | |
| Admiral Shares | $111.52 |
• See Note A in Notes to Financial Statements.
^ Includes partial security positions on loan to broker-dealers. The total value of securities on loan is $118,344,000.
* Non-income-producing security.
1 Considered an affiliated company of the fund as the fund owns more than 5% of the outstanding voting securities of such company.
2 Affiliated money market fund available only to Vanguard funds and certain trusts and accounts managed by Vanguard. Rate shown is
the 7-day yield.
3 Includes $123,264,000 of collateral received for securities on loan.
ADR—American Depositary Receipt.
See accompanying Notes, which are an integral part of the Financial Statements.
14
| |
| PRIMECAP Fund | |
| |
| |
| Statement of Operations | |
| |
| | Year Ended |
| | September 30, 2016 |
| | ($000) |
| Investment Income | |
| Income | |
| Dividends1 | 784,212 |
| Interest | 7,265 |
| Securities Lending—Net | 3,640 |
| Total Income | 795,117 |
| Expenses | |
| Investment Advisory Fees—Note B | 88,621 |
| The Vanguard Group—Note C | |
| Management and Administrative—Investor Shares | 13,512 |
| Management and Administrative—Admiral Shares | 45,866 |
| Marketing and Distribution—Investor Shares | 1,414 |
| Marketing and Distribution—Admiral Shares | 2,554 |
| Custodian Fees | 1,032 |
| Auditing Fees | 35 |
| Shareholders’ Reports—Investor Shares | 60 |
| Shareholders’ Reports—Admiral Shares | 130 |
| Trustees’ Fees and Expenses | 54 |
| Total Expenses | 153,278 |
| Net Investment Income | 641,839 |
| Realized Net Gain (Loss) | |
| Investment Securities Sold | 2,232,640 |
| Foreign Currencies | (395) |
| Realized Net Gain (Loss) | 2,232,245 |
| Change in Unrealized Appreciation (Depreciation) | |
| Investment Securities | 4,415,966 |
| Foreign Currencies | 472 |
| Change in Unrealized Appreciation (Depreciation) | 4,416,438 |
| Net Increase (Decrease) in Net Assets Resulting from Operations | 7,290,522 |
| 1 Dividends are net of foreign withholding taxes of $18,913,000. | |
See accompanying Notes, which are an integral part of the Financial Statements.
15
| | |
| PRIMECAP Fund | | |
| |
| |
| Statement of Changes in Net Assets | | |
| |
| | Year Ended September 30, |
| | 2016 | 2015 |
| | ($000) | ($000) |
| Increase (Decrease) in Net Assets | | |
| Operations | | |
| Net Investment Income | 641,839 | 635,434 |
| Realized Net Gain (Loss) | 2,232,245 | 2,665,957 |
| Change in Unrealized Appreciation (Depreciation) | 4,416,438 | (3,527,529) |
| Net Increase (Decrease) in Net Assets Resulting from Operations | 7,290,522 | (226,138) |
| Distributions | | |
| Net Investment Income | | |
| Investor Shares | (86,405) | (107,352) |
| Admiral Shares | (426,673) | (448,560) |
| Realized Capital Gain1 | | |
| Investor Shares | (370,752) | (528,247) |
| Admiral Shares | (1,709,108) | (1,890,474) |
| Total Distributions | (2,592,938) | (2,974,633) |
| Capital Share Transactions | | |
| Investor Shares | (945,771) | (5,130,078) |
| Admiral Shares | 1,174,655 | 6,589,734 |
| Net Increase (Decrease) from Capital Share Transactions | 228,884 | 1,459,656 |
| Total Increase (Decrease) | 4,926,468 | (1,741,115) |
| Net Assets | | |
| Beginning of Period | 42,514,232 | 44,255,347 |
| End of Period2 | 47,440,700 | 42,514,232 |
1 Includes fiscal 2016 and 2015 short-term gain distributions totaling $0 and $17,373,000, respectively. Short-term gain distributions are treated as ordinary income dividends for tax purposes.
2 Net Assets—End of Period includes undistributed (overdistributed) net investment income of $425,507,000 and $333,810,000.
See accompanying Notes, which are an integral part of the Financial Statements.
16
| | | | | |
| PRIMECAP Fund | | | | | |
| |
| |
| Financial Highlights | | | | | |
| |
| |
| Investor Shares | | | | | |
| |
| For a Share Outstanding | | | Year Ended September 30, |
| Throughout Each Period | 2016 | 2015 | 2014 | 2013 | 2012 |
| Net Asset Value, Beginning of Period | $96.99 | $104.16 | $87.83 | $69.39 | $58.46 |
| Investment Operations | | | | | |
| Net Investment Income | 1.401 | 1.329 | 1.124 | 1.033 | .866 |
| Net Realized and Unrealized Gain (Loss) | | | | | |
| on Investments | 15.103 | (1.631) | 19.812 | 19.093 | 12.857 |
| Total from Investment Operations | 16.504 | (. 302) | 20.936 | 20.126 | 13.723 |
| Distributions | | | | | |
| Dividends from Net Investment Income | (1.114) | (1.160) | (.836) | (.965) | (.689) |
| Distributions from Realized Capital Gains | (4.780) | (5.708) | (3.770) | (.721) | (2.104) |
| Total Distributions | (5.894) | (6.868) | (4.606) | (1.686) | (2.793) |
| Net Asset Value, End of Period | $107.60 | $96.99 | $104.16 | $87.83 | $69.39 |
| |
| Total Return1 | 17.40% | -0.76% | 24.72% | 29.63% | 24.17% |
| |
| Ratios/Supplemental Data | | | | | |
| Net Assets, End of Period (Millions) | $7,588 | $7,741 | $13,273 | $13,059 | $13,632 |
| Ratio of Total Expenses to Average Net Assets | 0.39% | 0.40% | 0.44% | 0.45% | 0.45% |
| Ratio of Net Investment Income to | | | | | |
| Average Net Assets | 1.37% | 1.33% | 1.17% | 1.32% | 1.30% |
| Portfolio Turnover Rate | 6% | 9% | 11% | 5% | 6% |
1 Total returns do not include transaction or account service fees that may have applied in the periods shown. Fund prospectuses provide information about any applicable transaction and account service fees.
See accompanying Notes, which are an integral part of the Financial Statements.
17
| | | | | |
| PRIMECAP Fund | | | | | |
| |
| |
| Financial Highlights | | | | | |
| |
| Admiral Shares | | | | | |
| |
| For a Share Outstanding | | | Year Ended September 30, |
| Throughout Each Period | 2016 | 2015 | 2014 | 2013 | 2012 |
| Net Asset Value, Beginning of Period | $100.53 | $108.08 | $91.15 | $72.03 | $60.69 |
| Investment Operations | | | | | |
| Net Investment Income | 1.532 | 1.550 | 1.286 | 1.178 | .974 |
| Net Realized and Unrealized Gain (Loss) | | | | | |
| on Investments | 15.645 | (1.784) | 20.536 | 19.769 | 13.333 |
| Total from Investment Operations | 17.177 | (.234) | 21.822 | 20.947 | 14.307 |
| Distributions | | | | | |
| Dividends from Net Investment Income | (1.236) | (1.403) | (.983) | (1.079) | (.785) |
| Distributions from Realized Capital Gains | (4.951) | (5.913) | (3.909) | (.748) | (2.182) |
| Total Distributions | (6.187) | (7.316) | (4.892) | (1.827) | (2.967) |
| Net Asset Value, End of Period | $111.52 | $100.53 | $108.08 | $91.15 | $72.03 |
| |
| Total Return1 | 17.48% | -0.69% | 24.85% | 29.73% | 24.29% |
| |
| Ratios/Supplemental Data | | | | | |
| Net Assets, End of Period (Millions) | $39,852 | $34,773 | $30,982 | $23,129 | $15,978 |
| Ratio of Total Expenses to Average Net Assets | 0.33% | 0.34% | 0.35% | 0.36% | 0.36% |
| Ratio of Net Investment Income to | | | | | |
| Average Net Assets | 1.43% | 1.39% | 1.26% | 1.41% | 1.39% |
| Portfolio Turnover Rate | 6% | 9% | 11% | 5% | 6% |
1 Total returns do not include transaction or account service fees that may have applied in the periods shown. Fund prospectuses provide information about any applicable transaction and account service fees.
See accompanying Notes, which are an integral part of the Financial Statements.
18
PRIMECAP Fund
Notes to Financial Statements
Vanguard PRIMECAP Fund is registered under the Investment Company Act of 1940 as an open-end investment company, or mutual fund. The fund offers two classes of shares: Investor Shares and Admiral Shares. Investor Shares are available to any investor who meets the fund’s minimum purchase requirements. Admiral Shares are designed for investors who meet certain administrative, service, and account-size criteria.
A. The following significant accounting policies conform to generally accepted accounting principles for U.S. investment companies. The fund consistently follows such policies in preparing its financial statements.
1. Security Valuation: Securities are valued as of the close of trading on the New York Stock Exchange (generally 4 p.m., Eastern time) on the valuation date. Equity securities are valued at the latest quoted sales prices or official closing prices taken from the primary market in which each security trades; such securities not traded on the valuation date are valued at the mean of the latest quoted bid and asked prices. Securities for which market quotations are not readily available, or whose values have been affected by events occurring before the fund’s pricing time but after the close of the securities’ primary markets, are valued at their fair values calculated according to procedures adopted by the board of trustees. These procedures include obtaining quotations from an independent pricing service, monitoring news to identify significant market- or security-specific events, and evaluating changes in the values of foreign market proxies (for example, ADRs, futures contracts, or exchange-traded funds), between the time the foreign markets close and the fund’s pricing time. When fair-value pricing is employed, the prices of securities used by a fund to calculate its net asset value may differ from quoted or published prices for the same securities. Investments in Vanguard Market Liquidity Fund are valued at that fund’s net asset value.
2. Foreign Currency: Securities and other assets and liabilities denominated in foreign currencies are translated into U.S. dollars using exchange rates obtained from an independent third party as of the fund’s pricing time on the valuation date. Realized gains (losses) and unrealized appreciation (depreciation) on investment securities include the effects of changes in exchange rates since the securities were purchased, combined with the effects of changes in security prices. Fluctuations in the value of other assets and liabilities resulting from changes in exchange rates are recorded as unrealized foreign currency gains (losses) until the assets or liabilities are settled in cash, at which time they are recorded as realized foreign currency gains (losses).
3. Federal Income Taxes: The fund intends to continue to qualify as a regulated investment company and distribute all of its taxable income. Management has analyzed the fund’s tax positions taken for all open federal income tax years (September 30, 2013–2016), and has concluded that no provision for federal income tax is required in the fund’s financial statements.
4. Distributions: Distributions to shareholders are recorded on the ex-dividend date.
5. Securities Lending: To earn additional income, the fund lends its securities to qualified institutional borrowers. Security loans are subject to termination by the fund at any time, and are required to be secured at all times by collateral in an amount at least equal to the market value of securities loaned. Daily market fluctuations could cause the value of loaned securities to be more or less than the value of the collateral received. When this occurs, the collateral is adjusted and settled on the next business
19
PRIMECAP Fund
day. The fund further mitigates its counterparty risk by entering into securities lending transactions only with a diverse group of prequalified counterparties, monitoring their financial strength, and entering into master securities lending agreements with its counterparties. The master securities lending agreements provide that, in the event of a counterparty’s default (including bankruptcy), the fund may terminate any loans with that borrower, determine the net amount owed, and sell or retain the collateral up to the net amount owed to the fund; however, such actions may be subject to legal proceedings. While collateral mitigates counterparty risk, in the absence of a default the fund may experience delays and costs in recovering the securities loaned. The fund invests cash collateral received in Vanguard Market Liquidity Fund, and records a liability in the Statement of Net Assets for the return of the collateral, during the period the securities are on loan. Securities lending income represents fees charged to borrowers plus income earned on invested cash collateral, less expenses associated with the loan. During the term of the loan, the fund is entitled to all distributions made on or in respect of the loaned securities.
6. Credit Facility: The fund and certain other funds managed by The Vanguard Group (“Vanguard”) participate in a $3.1 billion committed credit facility provided by a syndicate of lenders pursuant to a credit agreement that may be renewed annually; each fund is individually liable for its borrowings, if any, under the credit facility. Borrowings may be utilized for temporary and emergency purposes, and are subject to the fund’s regulatory and contractual borrowing restrictions. The participating funds are charged administrative fees and an annual commitment fee of 0.10% of the undrawn amount of the facility; these fees are allocated to the funds based on a method approved by the fund’s board of trustees and included in Management and Administrative expenses on the fund’s Statement of Operations. Any borrowings under this facility bear interest at a rate based upon the higher of the one-month London Interbank Offered Rate, federal funds effective rate, or overnight bank funding rate plus an agreed-upon spread.
The fund had no borrowings outstanding at September 30, 2016, or at any time during the period then ended.
7. Other: Dividend income is recorded on the ex-dividend date. Interest income includes income distributions received from Vanguard Market Liquidity Fund and is accrued daily. Security transactions are accounted for on the date securities are bought or sold. Costs used to determine realized gains (losses) on the sale of investment securities are those of the specific securities sold.
Each class of shares has equal rights as to assets and earnings, except that each class separately bears certain class-specific expenses related to maintenance of shareholder accounts (included in Management and Administrative expenses) and shareholder reporting. Marketing and distribution expenses are allocated to each class of shares based on a method approved by the board of trustees. Income, other non-class-specific expenses, and gains and losses on investments are allocated to each class of shares based on its relative net assets.
B. PRIMECAP Management Company provides investment advisory services to the fund for a fee calculated at an annual percentage rate of average net assets. For the year ended September 30, 2016, the investment advisory fee represented an effective annual rate of 0.20% of the fund’s average net assets.
20
PRIMECAP Fund
C. In accordance with the terms of a Funds’ Service Agreement (the “FSA”) between Vanguard and the fund, Vanguard furnishes to the fund corporate management, administrative, marketing, and distribution services at Vanguard’s cost of operations (as defined by the FSA). These costs of operations are allocated to the fund based on methods and guidelines approved by the board of trustees. Vanguard does not require reimbursement in the current period for certain costs of operations (such as deferred compensation/benefits and risk/insurance costs); the fund’s liability for these costs of operations is included in Payables to Vanguard on the Statement of Net Assets.
Upon the request of Vanguard, the fund may invest up to 0.40% of its net assets as capital in Vanguard. At September 30, 2016, the fund had contributed to Vanguard capital in the amount of $3,594,000, representing 0.01% of the fund’s net assets and 1.44% of Vanguard’s capitalization. The fund’s trustees and officers are also directors and employees, respectively, of Vanguard.
D. Various inputs may be used to determine the value of the fund’s investments. These inputs are summarized in three broad levels for financial statement purposes. The inputs or methodologies used to value securities are not necessarily an indication of the risk associated with investing in those securities.
Level 1—Quoted prices in active markets for identical securities.
Level 2—Other significant observable inputs (including quoted prices for similar securities, interest rates, prepayment speeds, credit risk, etc.).
Level 3—Significant unobservable inputs (including the fund’s own assumptions used to determine the fair value of investments).
The following table summarizes the market value of the fund’s investments as of September 30, 2016, based on the inputs used to value them:
| | | |
| | Level 1 | Level 2 | Level 3 |
| Investments | ($000) | ($000) | ($000) |
| Common Stocks | 43,579,257 | 2,140,516 | — |
| Temporary Cash Investments | 1,902,618 | — | — |
| Total | 45,481,875 | 2,140,516 | — |
E. Distributions are determined on a tax basis and may differ from net investment income and realized capital gains for financial reporting purposes. Differences may be permanent or temporary. Permanent differences are reclassified among capital accounts in the financial statements to reflect their tax character. Temporary differences arise when certain items of income, expense, gain, or loss are recognized in different periods for financial statement and tax purposes. These differences will reverse at some time in the future. Differences in classification may also result from the treatment of short-term gains as ordinary income for tax purposes.
During the year ended September 30, 2016, the fund realized net foreign currency losses of $395,000, which decreased distributable net income for tax purposes; accordingly, such losses have been reclassified from accumulated net realized gains to undistributed net investment income.
21
PRIMECAP Fund
During the year ended September 30, 2016, the fund realized $309,406,000 of net capital gains resulting from in-kind redemptions—in which shareholders exchanged fund shares for securities held by the fund rather than for cash. Because such gains are not taxable to the fund, and are not distributed to shareholders, they have been reclassified from accumulated net realized gains to paid-in capital.
The fund used a tax accounting practice to treat a portion of the price of capital shares redeemed during the year as distributions from net investment income and realized capital gains. Accordingly, the fund has reclassified $36,669,000 from undistributed net investment income, and $110,050,000 from accumulated net realized gains, to paid-in capital.
For tax purposes, at September 30, 2016, the fund had $535,659,000 of ordinary income and $1,590,242,000 of long-term capital gains available for distribution.
At September 30, 2016, the cost of investment securities for tax purposes was $23,236,618,000. Net unrealized appreciation of investment securities for tax purposes was $24,385,773,000, consisting of unrealized gains of $25,258,483,000 on securities that had risen in value since their purchase and $872,710,000 in unrealized losses on securities that had fallen in value since their purchase.
F. During the year ended September 30, 2016, the fund purchased $2,798,500,000 of investment securities and sold $4,962,837,000 of investment securities, other than temporary cash investments. Purchases and sales include $0 and $1,004,080,000, respectively, in connection with in-kind purchases and redemptions of the fund’s capital shares.
| | | | |
| G. Capital share transactions for each class of shares were: | | | |
| | | | Year Ended September 30 |
| | | 2016 | | 2015 |
| | Amount | Shares | Amount | Shares |
| | ($000) | (000) | ($000) | (000) |
| Investor Shares | | | | |
| Issued | 501,353 | 5,081 | 736,805 | 7,078 |
| Issued in Lieu of Cash Distributions | 448,254 | 4,430 | 625,187 | 5,989 |
| Redeemed | (1,895,378) | (18,802) | (6,492,070) | (60,686) |
| Net Increase (Decrease)—Investor Shares | (945,771) | (9,291) | (5,130,078) | (47,619) |
| Admiral Shares | | | | |
| Issued | 3,167,275 | 30,714 | 7,079,989 | 63,906 |
| Issued in Lieu of Cash Distributions | 2,027,098 | 19,341 | 2,216,430 | 20,496 |
| Redeemed | (4,019,718) | (38,593) | (2,706,685) | (25,167) |
| Net Increase (Decrease)—Admiral Shares | 1,174,655 | 11,462 | 6,589,734 | 59,235 |
22
PRIMECAP Fund
H. Certain of the fund’s investments are in companies that are considered to be affiliated companies of the fund because the fund owns more than 5% of the outstanding voting securities of the company or the issuer is another member of The Vanguard Group. Transactions during the period in securities of these companies were as follows:
| | | | | | |
| | | | Current Period Transactions | |
| | Sept. 30, | | Proceeds | | | Sept. 30, |
| | 2015 | | from | | Capital Gain | 2016 |
| | Market | Purchases | Securities | | Distributions | Market |
| | Value | at Cost | Sold1 | Income | Received | Value |
| | ($000) | ($000) | ($000) | ($000) | ($000) | ($000) |
| Alaska Air Group Inc. | 528,883 | — | 40,083 | 6,573 | — | NA2 |
| NetApp Inc. | NA 3 | 31,521 | 8,329 | 10,327 | — | 505,263 |
| Plantronics Inc. | 188,221 | — | 3,883 | 2,209 | — | 188,043 |
| Southwest Airlines Co. | 1,300,903 | 6,136 | 32,056 | 11,896 | — | 1,306,611 |
| Vanguard Market Liquidity Fund | 1,481,214 | NA4 | NA 4 | 7,265 | — | 1,902,618 |
| Total | 3,499,221 | | | 38,270 | — | 3,902,535 |
1 Includes net realized gain (loss) on affiliated investment securities sold of $14,204,000.
2 Not applicable—at September 30, 2016, the security was still held, but the issuer was no longer an affiliated company of the fund.
3 Not applicable—at September 30, 2015, the issuer was not an affiliated company of the fund.
4 Not applicable—purchases and sales are for temporary cash investment purposes.
I. Management has determined that no material events or transactions occurred subsequent to September 30, 2016, that would require recognition or disclosure in these financial statements.
23
Report of Independent Registered Public Accounting Firm
To the Board of Trustees of Vanguard Chester Funds and the Shareholders of Vanguard PRIMECAP Fund:
In our opinion, the accompanying statement of net assets and the related statements of operations and of changes in net assets and the financial highlights present fairly, in all material respects, the financial position of Vanguard PRIMECAP Fund (constituting a separate portfolio of Vanguard Chester Funds, hereafter referred to as the “Fund”) at September 30, 2016, the results of its operations for the year then ended, the changes in its net assets for each of the two years in the period then ended, and the financial highlights for each of the five years in the period then ended, in conformity with accounting principles generally accepted in the United States of America. These financial statements and financial highlights (hereafter referred to as “financial statements”) are the responsibility of the Fund’s management. Our responsibility is to express an opinion on these financial statements based on our audits. We conducted our audits of these financial statements in accordance with the standards of the Public Company Accounting Oversight Board (United States). Those standards require that we plan and perform the audit to obtain reasonable assurance about whether the financial statements are free of material misstatement. An audit includes examining, on a test basis, evidence supporting the amounts and disclosures in the financial statements, assessing the accounting principles used and significant estimates made by management, and evaluating the overall financial statement presentation. We believe that our audits, which included confirmation of securities at September 30, 2016 by correspondence with the custodian and brokers and by agreement to the underlying ownership records of the transfer agent, provide a reasonable basis for our opinion.
/s/PricewaterhouseCoopers LLP
Philadelphia, Pennsylvania
November 10, 2016
Special 2016 tax information (unaudited) for Vanguard PRIMECAP Fund
This information for the fiscal year ended September 30, 2016, is included pursuant to provisions of the Internal Revenue Code.
The fund distributed $2,186,536,000 as capital gain dividends (20% rate gain distributions) to shareholders during the fiscal year.
The fund distributed $513,078,000 of qualified dividend income to shareholders during the fiscal year.
For corporate shareholders, 91.1% of investment income (dividend income plus short-term gains, if any) qualifies for the dividends-received deduction.
24
Your Fund’s After-Tax Returns
This table presents returns for your fund both before and after taxes. The after-tax returns are shown in two ways: (1) assuming that an investor owned the fund during the entire period and paid taxes on the fund’s distributions, and (2) assuming that an investor paid taxes on the fund’s distributions and sold all shares at the end of each period.
Calculations are based on the highest individual federal income tax and capital gains tax rates in effect at the times of the distributions and the hypothetical sales. State and local taxes were not considered. After-tax returns reflect any qualified dividend income, using actual prior-year figures and estimates for 2016. (In the example, returns after the sale of fund shares may be higher than those assuming no sale. This occurs when the sale would have produced a capital loss. The calculation assumes that the investor received a tax deduction for the loss.)
The table shows returns for Investor Shares only; returns for other share classes will differ. Please note that your actual after-tax returns will depend on your tax situation and may differ from those shown. Also note that if you own the fund in a tax-deferred account, such as an individual retirement account or a 401(k) plan, this information does not apply to you. Such accounts are not subject to current taxes.
Finally, keep in mind that a fund’s performance—whether before or after taxes—does not guarantee future results.
Average Annual Total Returns: PRIMECAP Fund Investor Shares
Periods Ended September 30, 2016
| | | |
| | One | Five | Ten |
| | Year | Years | Years |
| Returns Before Taxes | 17.40% | 18.52% | 9.51% |
| Returns After Taxes on Distributions | 15.86 | 17.35 | 8.58 |
| Returns After Taxes on Distributions and Sale of Fund Shares | 10.99 | 14.96 | 7.68 |
25
About Your Fund’s Expenses
As a shareholder of the fund, you incur ongoing costs, which include costs for portfolio management, administrative services, and shareholder reports (like this one), among others. Operating expenses, which are deducted from a fund’s gross income, directly reduce the investment return of the fund.
A fund’s expenses are expressed as a percentage of its average net assets. This figure is known as the expense ratio. The following examples are intended to help you understand the ongoing costs (in dollars) of investing in your fund and to compare these costs with those of other mutual funds. The examples are based on an investment of $1,000 made at the beginning of the period shown and held for the entire period.
The accompanying table illustrates your fund’s costs in two ways:
• Based on actual fund return. This section helps you to estimate the actual expenses that you paid over the period. The ”Ending Account Value“ shown is derived from the fund‘s actual return, and the third column shows the dollar amount that would have been paid by an investor who started with $1,000 in the fund. You may use the information here, together with the amount you invested, to estimate the expenses that you paid over the period.
To do so, simply divide your account value by $1,000 (for example, an $8,600 account value divided by $1,000 = 8.6), then multiply the result by the number given for your fund under the heading ”Expenses Paid During Period.“
• Based on hypothetical 5% yearly return. This section is intended to help you compare your fund‘s costs with those of other mutual funds. It assumes that the fund had a yearly return of 5% before expenses, but that the expense ratio is unchanged. In this case—because the return used is not the fund’s actual return—the results do not apply to your investment. The example is useful in making comparisons because the Securities and Exchange Commission requires all mutual funds to calculate expenses based on a 5% return. You can assess your fund’s costs by comparing this hypothetical example with the hypothetical examples that appear in shareholder reports of other funds.
Note that the expenses shown in the table are meant to highlight and help you compare ongoing costs only and do not reflect transaction costs incurred by the fund for buying and selling securities. Further, the expenses do not include any purchase, redemption, or account service fees described in the fund prospectus. If such fees were applied to your account, your costs would be higher. Your fund does not carry a “sales load.”
The calculations assume no shares were bought or sold during the period. Your actual costs may have been higher or lower, depending on the amount of your investment and the timing of any purchases or redemptions.
You can find more information about the fund’s expenses, including annual expense ratios, in the Financial Statements section of this report. For additional information on operating expenses and other shareholder costs, please refer to your fund’s current prospectus.
26
| | | |
| Six Months Ended September 30, 2016 | | | |
| | Beginning | Ending | Expenses |
| | Account Value | Account Value | Paid During |
| PRIMECAP Fund | 3/31/2016 | 9/30/2016 | Period |
| Based on Actual Fund Return | | | |
| Investor Shares | $1,000.00 | $1,100.88 | $2.10 |
| Admiral Shares | 1,000.00 | 1,101.32 | 1.79 |
| Based on Hypothetical 5% Yearly Return | | | |
| Investor Shares | $1,000.00 | $1,023.00 | $2.02 |
| Admiral Shares | 1,000.00 | 1,023.30 | 1.72 |
The calculations are based on expenses incurred in the most recent six-month period. The fund’s annualized six-month expense ratios for that period are 0.40% for Investor Shares and 0.34% for Admiral Shares. The dollar amounts shown as “Expenses Paid” are equal to the annualized expense ratio multiplied by the average account value over the period, multiplied by the number of days in the most recent six-month period, then divided by the number of days in the most recent 12-month period (183/366).
27
Trustees Approve Advisory Arrangement
The board of trustees of Vanguard PRIMECAP Fund has renewed the fund’s investment advisory arrangement with PRIMECAP Management Company (PRIMECAP). The board determined that renewing the fund’s advisory arrangement was in the best interests of the fund and its shareholders.
The board based its decision upon an evaluation of the advisor’s investment staff, portfolio management process, and performance. This evaluation included information provided to the board by Vanguard’s Portfolio Review Department, which is responsible for fund and advisory oversight and product management. The Portfolio Review Department met regularly with the advisors and made monthly presentations to the board during the fiscal year directing the board’s focus to relevant information and topics.
The board, or an investment committee made up of board members, also received information throughout the year during advisor presentations. For each advisor presentation, the board was provided with letters and reports that included information about, among other things, the advisory firm and the advisor’s assessment of the investment environment, portfolio performance, and portfolio characteristics.
In addition, the board received monthly reports, which included a Market and Economic Report, a Fund Dashboard Monthly Summary, and a Fund Performance Report.
Prior to their meeting, the trustees were provided with a memo and material that summarized the information they received over the course of the year. They also considered the factors discussed below, among others. However, no single factor determined whether the board approved the arrangement. Rather, it was the totality of the circumstances that drove the board’s decision.
Nature, extent, and quality of services
The board reviewed the quality of the fund’s investment management services over both the short and long term, and took into account the organizational depth and stability of the advisor. The board considered that PRIMECAP, founded in 1983, is recognized for its long-term approach to growth equity investing. Five experienced portfolio managers are responsible for separate subportfolios, and each portfolio manager employs a fundamental, research-driven approach in seeking to identify companies with long-term growth potential that the market has yet to appreciate. The multi-counselor approach employed by PRIMECAP is designed to emphasize individual decision-making and enable the portfolio managers to invest in their highest-conviction ideas. The firm’s fundamental research focuses on developing opinions independent from Wall Street’s consensus and maintaining a long-term horizon. PRIMECAP has managed the fund since its inception in 1984.
The board concluded that the advisor’s experience, stability, depth, and performance, among other factors, warranted continuation of the advisory arrangement.
Investment performance
The board considered the short- and long-term performance of the fund, including any periods of outperformance or underperformance compared with a relevant benchmark index and peer group. The board concluded that the performance was such that the advisory arrangement should continue. Information about the fund’s most recent performance can be found in the Performance Summary section of this report.
28
Cost
The board concluded that the fund’s expense ratio was well below the average expense ratio charged by funds in its peer group and that the fund’s advisory fee rate was also well below its peer-group average. Information about the fund’s expenses appears in the About Your Fund’s Expenses section of this report as well as in the Financial Statements section, which also includes information about the fund’s advisory fee rate.
The board did not consider profitability of PRIMECAP in determining whether to approve the advisory fee, because PRIMECAP is independent of Vanguard and the advisory fee is the result of arm’s-length negotiations.
The benefit of economies of scale
The board concluded that the fund’s shareholders benefit from economies of scale because of breakpoints in the advisory fee schedule. The breakpoints reduce the effective rate of the fee as the fund’s assets increase.
The board will consider whether to renew the advisory arrangement again after a one-year period.
29
Glossary
30-Day SEC Yield. A fund’s 30-day SEC yield is derived using a formula specified by the U.S. Securities and Exchange Commission. Under the formula, data related to the fund’s security holdings in the previous 30 days are used to calculate the fund’s hypothetical net income for that period, which is then annualized and divided by the fund’s estimated average net assets over the calculation period. For the purposes of this calculation, a security’s income is based on its current market yield to maturity (for bonds), its actual income (for asset-backed securities), or its projected dividend yield (for stocks). Because the SEC yield represents hypothetical annualized income, it will differ—at times significantly—from the fund’s actual experience. As a result, the fund’s income distributions may be higher or lower than implied by the SEC yield.
Beta. A measure of the magnitude of a fund’s past share-price fluctuations in relation to the ups and downs of a given market index. The index is assigned a beta of 1.00. Compared with a given index, a fund with a beta of 1.20 typically would have seen its share price rise or fall by 12% when the index rose or fell by 10%. For this report, beta is based on returns over the past 36 months for both the fund and the index. Note that a fund’s beta should be reviewed in conjunction with its R-squared (see definition). The lower the R-squared, the less correlation there is between the fund and the index, and the less reliable beta is as an indicator of volatility.
Dividend Yield. Dividend income earned by stocks, expressed as a percentage of the aggregate market value (or of net asset value, for a fund). The yield is determined by dividing the amount of the annual dividends by the aggregate value (or net asset value) at the end of the period. For a fund, the dividend yield is based solely on stock holdings and does not include any income produced by other investments.
Earnings Growth Rate. The average annual rate of growth in earnings over the past five years for the stocks now in a fund.
Equity Exposure. A measure that reflects a fund’s investments in stocks and stock futures. Any holdings in short-term reserves are excluded.
Expense Ratio. A fund’s total annual operating expenses expressed as a percentage of the fund’s average net assets. The expense ratio includes management and administrative expenses, but does not include the transaction costs of buying and selling portfolio securities.
Foreign Holdings. The percentage of a fund represented by securities or depositary receipts of companies based outside the United States.
Inception Date. The date on which the assets of a fund (or one of its share classes) are first invested in accordance with the fund’s investment objective. For funds with a subscription period, the inception date is the day after that period ends. Investment performance is measured from the inception date.
Median Market Cap. An indicator of the size of companies in which a fund invests; the midpoint of market capitalization (market price x shares outstanding) of a fund’s stocks, weighted by the proportion of the fund’s assets invested in each stock. Stocks representing half of the fund’s assets have market capitalizations above the median, and the rest are below it.
Price/Book Ratio. The share price of a stock divided by its net worth, or book value, per share. For a fund, the weighted average price/book ratio of the stocks it holds.
30
Price/Earnings Ratio. The ratio of a stock’s current price to its per-share earnings over the past year. For a fund, the weighted average P/E of the stocks it holds. P/E is an indicator of market expectations about corporate prospects; the higher the P/E, the greater the expectations for a company’s future growth.
R-Squared. A measure of how much of a fund’s past returns can be explained by the returns from the market in general, as measured by a given index. If a fund’s total returns were precisely synchronized with an index’s returns, its R-squared would be 1.00. If the fund’s returns bore no relationship to the index’s returns, its R-squared would be 0. For this report, R-squared is based on returns over the past 36 months for both the fund and the index.
Return on Equity. The annual average rate of return generated by a company during the past five years for each dollar of shareholder’s equity (net income divided by shareholder’s equity). For a fund, the weighted average return on equity for the companies whose stocks it holds.
Short-Term Reserves. The percentage of a fund invested in highly liquid, short-term securities that can be readily converted to cash.
Turnover Rate. An indication of the fund’s trading activity. Funds with high turnover rates incur higher transaction costs and may be more likely to distribute capital gains (which may be taxable to investors). The turnover rate excludes in-kind transactions, which have minimal impact on costs.
31
The People Who Govern Your Fund
The trustees of your mutual fund are there to see that the fund is operated and managed in your best interests since, as a shareholder, you are a part owner of the fund. Your fund’s trustees also serve on the board of directors of The Vanguard Group, Inc., which is owned by the Vanguard funds and provides services to them on an at-cost basis.
A majority of Vanguard’s board members are independent, meaning that they have no affiliation with Vanguard or the funds they oversee, apart from the sizable personal investments they have made as private individuals. The independent board members have distinguished backgrounds in business, academia, and public service. Each of the trustees and executive officers oversees 198 Vanguard funds.
The following table provides information for each trustee and executive officer of the fund. The mailing address of the trustees and officers is P.O. Box 876, Valley Forge, PA 19482. More information about the trustees is in the Statement of Additional Information, which can be obtained, without charge, by contacting Vanguard at 800-662-7447, or online at vanguard.com.
InterestedTrustee1
F. William McNabb III
Born 1957. Trustee Since July 2009. Chairman of the Board. Principal Occupation(s) During the Past Five Years and Other Experience: Chairman of the Board of The Vanguard Group, Inc., and of each of the investment companies served by The Vanguard Group, since January 2010; Director of The Vanguard Group since 2008; Chief Executive Officer and President of The Vanguard Group, and of each of the investment companies served by The Vanguard Group, since 2008; Director of Vanguard Marketing Corporation; Managing Director of The Vanguard Group (1995–2008).
IndependentTrustees
Emerson U. Fullwood
Born 1948. Trustee Since January 2008. Principal Occupation(s) During the Past Five Years and Other Experience: Executive Chief Staff and Marketing Officer for North America and Corporate Vice President (retired 2008) of Xerox Corporation (document management products and services); Executive in Residence and 2009–2010 Distinguished Minett Professor at the Rochester Institute of Technology; Lead Director of SPX FLOW, Inc. (multi-industry manufacturing); Director of the United Way of Rochester, the University of Rochester Medical Center, Monroe Community College Foundation, North Carolina A&T University, and Roberts Wesleyan College.
Rajiv L. Gupta
Born 1945. Trustee Since December 2001.2 Principal Occupation(s) During the Past Five Years and Other Experience: Chairman and Chief Executive Officer (retired 2009) and President (2006–2008) of Rohm and Haas Co. (chemicals); Director of Tyco International plc (diversified manufacturing and services), HP Inc. (printer and personal computer manufacturing), and Delphi Automotive plc (automotive components); Senior Advisor at New Mountain Capital.
Amy Gutmann
Born 1949. Trustee Since June 2006. Principal Occupation(s) During the Past Five Years and Other Experience: President of the University of Pennsylvania; Christopher H. Browne Distinguished Professor of Political Science, School of Arts and Sciences, and Professor of Communication, Annenberg School for Communication, with secondary faculty appointments in the Department of Philosophy, School of Arts and Sciences, and at the Graduate School of Education, University of Pennsylvania; Trustee of the National Constitution Center; Chair of the Presidential Commission for the Study of Bioethical Issues.
JoAnn Heffernan Heisen
Born 1950. Trustee Since July 1998. Principal Occupation(s) During the Past Five Years and Other Experience: Corporate Vice President and Chief Global Diversity Officer (retired 2008) and Member of the Executive Committee (1997–2008) of Johnson & Johnson (pharmaceuticals/medical devices/consumer products); Director of Skytop Lodge Corporation (hotels) and the Robert Wood Johnson Foundation; Member of the Advisory Board of the Institute for Women’s Leadership at Rutgers University.
F. Joseph Loughrey
Born 1949. Trustee Since October 2009. Principal Occupation(s) During the Past Five Years and Other Experience: President and Chief Operating Officer (retired 2009) of Cummins Inc. (industrial machinery); Chairman of the Board of Hillenbrand, Inc. (specialized consumer services), and of Oxfam America; Director of SKF AB (industrial machinery), Hyster-Yale Materials Handling, Inc. (forklift trucks), the Lumina Foundation for Education, and the V Foundation for Cancer Research; Member of the Advisory Council for the College of Arts and Letters and of the Advisory Board to the Kellogg Institute for International Studies, both at the University of Notre Dame.
Mark Loughridge
Born 1953. Trustee Since March 2012. Principal Occupation(s) During the Past Five Years and Other Experience: Senior Vice President and Chief Financial Officer (retired 2013) at IBM (information technology services); Fiduciary Member of IBM’s Retirement Plan Committee (2004–2013); Director of the Dow Chemical Company; Member of the Council on Chicago Booth.
Scott C. Malpass
Born 1962. Trustee Since March 2012. Principal Occupation(s) During the Past Five Years and Other Experience: Chief Investment Officer and Vice President at the University of Notre Dame; Assistant Professor of Finance at the Mendoza College of Business at Notre Dame; Member of the Notre Dame 403(b) Investment Committee, the Board of Advisors for Spruceview Capital Partners, and the Investment Advisory Committee of Major League Baseball; Board Member of TIFF Advisory Services, Inc., and Catholic Investment Services, Inc. (investment advisors).
André F. Perold
Born 1952. Trustee Since December 2004. Principal Occupation(s) During the Past Five Years and Other Experience: George Gund Professor of Finance and Banking, Emeritus at the Harvard Business School (retired 2011); Chief Investment Officer and Managing Partner of HighVista Strategies LLC (private investment firm); Director of Rand Merchant Bank; Overseer of the Museum of Fine Arts Boston.
Peter F. Volanakis
Born 1955. Trustee Since July 2009. Principal Occupation(s) During the Past Five Years and Other Experience: President and Chief Operating Officer (retired 2010) of Corning Incorporated (communications equipment); Chairman of the Board of Trustees of Colby-Sawyer College; Member of the Advisory Board of the Norris Cotton Cancer Center.
Executive Officers
Glenn Booraem
Born 1967. Treasurer Since May 2015. Principal Occupation(s) During the Past Five Years and Other Experience: Principal of The Vanguard Group, Inc.; Treasurer of each of the investment companies served by The Vanguard Group; Controller of each of the investment companies served by The Vanguard Group (2010–2015); Assistant Controller of each of the investment companies served by The Vanguard Group (2001–2010).
Thomas J. Higgins
Born 1957. Chief Financial Officer Since September 2008. Principal Occupation(s) During the Past Five Years and Other Experience: Principal of The Vanguard Group, Inc.; Chief Financial Officer of each of the investment companies served by The Vanguard Group; Treasurer of each of the investment companies served by The Vanguard Group (1998–2008).
Peter Mahoney
Born 1974. Controller Since May 2015. Principal Occupation(s) During the Past Five Years and Other Experience: Head of Global Fund Accounting at The Vanguard Group, Inc.; Controller of each of the investment companies served by The Vanguard Group; Head of International Fund Services at The Vanguard Group (2008–2014).
Anne E. Robinson
Born 1970. Secretary Since September 2016. Principal Occupation(s) During the Past Five Years and Other Experience: Managing Director of The Vanguard Group, Inc.; General Counsel of The Vanguard Group; Secretary of The Vanguard Group and of each of the investment companies served by The Vanguard Group; Director and Senior Vice President of Vanguard Marketing Corporation; Managing Director and General Counsel of Global Cards and Consumer Services at Citigroup (2014–2016); Counsel at American Express (2003–2014).
Vanguard Senior Management Team
| |
Mortimer J. Buckley Kathleen C. Gubanich Martha G. King John T. Marcante Chris D. McIsaac | James M. Norris Thomas M. Rampulla Glenn W. Reed Karin A. Risi Michael Rollings |
Chairman Emeritus and Senior Advisor John J. Brennan
Chairman, 1996–2009
Chief Executive Officer and President, 1996–2008
Founder
John C. Bogle
Chairman and Chief Executive Officer, 1974–1996
1 Mr. McNabb is considered an “interested person,” as defined in the Investment Company Act of 1940, because he is an officer of the Vanguard funds.
2 December 2002 for Vanguard Equity Income Fund, the Vanguard Municipal Bond Funds, and the Vanguard State Tax-Exempt Funds.
 |
| P.O. Box 2600 |
| Valley Forge, PA 19482-2600 |
Connect with Vanguard® > vanguard.com
| |
| Fund Information > 800-662-7447 | |
| Direct Investor Account Services > 800-662-2739 | |
| Institutional Investor Services > 800-523-1036 | |
| Text Telephone for People | |
| Who Are Deaf or Hard of Hearing> 800-749-7273 | |
| |
| This material may be used in conjunction | |
| with the offering of shares of any Vanguard | |
| fund only if preceded or accompanied by | |
| the fund’s current prospectus. | |
| |
| All comparative mutual fund data are from Lipper, a | |
| Thomson Reuters Company, or Morningstar, Inc., unless | |
| otherwise noted. | |
| |
| You can obtain a free copy of Vanguard’s proxy voting | |
| guidelines by visiting vanguard.com/proxyreporting or by | |
| calling Vanguard at 800-662-2739. The guidelines are | |
| also available from the SEC’s website, sec.gov. In | |
| addition, you may obtain a free report on how your fund | |
| voted the proxies for securities it owned during the 12 | |
| months ended June 30. To get the report, visit either | |
| vanguard.com/proxyreporting or sec.gov. | |
| |
| You can review and copy information about your fund at | |
| the SEC’s Public Reference Room in Washington, D.C. To | |
| find out more about this public service, call the SEC at | |
| 202-551-8090. Information about your fund is also | |
| available on the SEC’s website, and you can receive | |
| copies of this information, for a fee, by sending a | |
| request in either of two ways: via email addressed to | |
| publicinfo@sec.gov or via regular mail addressed to the | |
| Public Reference Section, Securities and Exchange | |
| Commission, Washington, DC 20549-1520. | |
| |
| | © 2016 The Vanguard Group, Inc. |
| | All rights reserved. |
| | Vanguard Marketing Corporation, Distributor. |
| |
| | Q590 112016 |

Annual Report | September 30, 2016
Vanguard Target Retirement Funds
Vanguard Target Retirement Income Fund
Vanguard Target Retirement 2010 Fund
Vanguard Target Retirement 2015 Fund
Vanguard Target Retirement 2020 Fund
Vanguard Target Retirement 2025 Fund
Vanguard Target Retirement 2030 Fund
A new format, unwavering commitment
As you begin reading this report, you’ll notice that we’ve made some improvements to the opening sections—based on feedback from you, our clients.
Page 1 starts with a new ”Your Fund’s Performance at a Glance,” a concise, handy summary of how your fund performed during the period.
In the renamed ”Chairman’s Perspective,” Bill McNabb will focus on enduring principles and investment insights.
We’ve modified some tables, and eliminated some redundancy, but we haven’t removed any information.
At Vanguard, we’re always looking for better ways to communicate and to help you make sound investment decisions. Thank you for entrusting your assets to us.
| |
| Contents | |
| Your Fund’s Performance at a Glance. | 1 |
| Chairman’s Perspective. | 4 |
| Target Retirement Income Fund. | 7 |
| Target Retirement 2010 Fund. | 18 |
| Target Retirement 2015 Fund. | 29 |
| Target Retirement 2020 Fund. | 40 |
| Target Retirement 2025 Fund. | 51 |
| Target Retirement 2030 Fund. | 62 |
| Your Fund’s After-Tax Returns. | 75 |
| About Your Fund’s Expenses. | 77 |
| Glossary. | 79 |
Please note: The opinions expressed in this report are just that—informed opinions. They should not be considered promises or advice. Also, please keep in mind that the information and opinions cover the period through the date on the front of this report. Of course, the risks of investing in your fund are spelled out in the prospectus.
See the Glossary for definitions of investment terms used in this report.
About the cover: No matter what language you speak, Vanguard has one consistent message and set of principles. Our primary focus is on you, our clients. We conduct our business with integrity as a faithful steward of your assets. This message is shown translated into seven languages, reflecting our expanding global presence.
Your Fund’s Performance at a Glance
• For the 12 months ended September 30, 2016 domestic and international stock markets made strong gains, returning about 15% and about 9%, respectively.
• Global fixed income markets also turned in solid results. U.S. bonds returned about 5%; international bonds returned about 8% for U.S.-based investors.
• Against this backdrop, the six Vanguard Target Retirement Funds covered in this report produced returns ranging from 7.54% for the Target Retirement Income Fund to 11.15% for the Target Retirement 2030 Fund. (The funds with retirement dates of 2035 through 2060 are covered in a separate report.) The funds with a greater allocation to stocks performed best.
• Each fund posted returns that were in line with those of its composite benchmark after expenses. Five surpassed the average return of their peers.
• For the ten years ended September 30, the funds’ average annual returns ranged from 5.21% for the Target Retirement 2010 Fund to 5.65% for the Target Retirement 2025 fund.
| |
| Total Returns: Fiscal Year Ended September 30, 2016 | |
| | Total |
| | Returns |
| Vanguard Target Retirement Income Fund | 7.54% |
| Target Income Composite Index | 7.79 |
| Mixed-Asset Target Today Funds Average | 7.25 |
| Mixed-Asset Target Today Funds Average: Derived from data provided by Lipper, a Thomson Reuters Company. | |
| |
| Vanguard Target Retirement 2010 Fund | 7.82% |
| Target 2010 Composite Index | 8.08 |
| Mixed-Asset Target 2010 Funds Average | 8.13 |
| Mixed-Asset Target 2010 Funds Average: Derived from data provided by Lipper, a Thomson Reuters Company. | |
| |
| Vanguard Target Retirement 2015 Fund | 9.03% |
| Target 2015 Composite Index | 9.36 |
| Mixed-Asset Target 2015 Funds Average | 8.32 |
| Mixed-Asset Target 2015 Funds Average: Derived from data provided by Lipper, a Thomson Reuters Company. | |
| |
| Vanguard Target Retirement 2020 Fund | 10.05% |
| Target 2020 Composite Index | 10.40 |
| Mixed-Asset Target 2020 Funds Average | 8.50 |
| Mixed-Asset Target 2020 Funds Average: Derived from data provided by Lipper, a Thomson Reuters Company. | |
1
| |
| | Total |
| | Returns |
| Vanguard Target Retirement 2025 Fund | 10.67% |
| Target 2025 Composite Index | 11.01 |
| Mixed-Asset Target 2025 Funds Average | 9.47 |
| Mixed-Asset Target 2025 Funds Average: Derived from data provided by Lipper, a Thomson Reuters Company. | |
| |
| Vanguard Target Retirement 2030 Fund | 11.15% |
| Target 2030 Composite Index | 11.52 |
| Mixed-Asset Target 2030 Funds Average | 10.19 |
| Mixed-Asset Target 2030 Funds Average: Derived from data provided by Lipper, a Thomson Reuters Company. | |
| For a benchmark description, see the Glossary. | |
Investments in Target Retirement Funds are subject to the risks of their underlying funds. The year in the fund name refers to the approximate year (the target date) when an investor in the fund would retire and leave the work force. The fund will gradually shift its emphasis from more aggressive investments to more conservative ones based on its target date. An investment in a Target Retirement Fund is not guaranteed at any time, including on or after the target date.
| |
| Total Returns: Ten Years Ended September 30, 2016 | |
| | Average |
| | Annual Return |
| Target Retirement Income Fund | 5.27% |
| Target Income Composite Index | 5.31 |
| Spliced Mixed-Asset Target Today Funds Average | 3.86 |
| Spliced Mixed-Asset Target Today Funds Average: Derived from data provided by Lipper, a Thomson Reuters Company. | |
| |
| Target Retirement 2010 Fund | 5.21% |
| Target 2010 Composite Index | 5.25 |
| Mixed-Asset Target 2010 Funds Average | 3.95 |
| Mixed-Asset Target 2010 Funds Average: Derived from data provided by Lipper, a Thomson Reuters Company. | |
| |
| Target Retirement 2015 Fund | 5.48% |
| Target 2015 Composite Index | 5.50 |
| Mixed-Asset Target 2015 Funds Average | 3.85 |
| Mixed-Asset Target 2015 Funds Average: Derived from data provided by Lipper, a Thomson Reuters Company. | |
| |
| Target Retirement 2020 Fund | 5.62% |
| Target 2020 Composite Index | 5.75 |
| Mixed-Asset Target 2020 Funds Average | 4.13 |
| Mixed-Asset Target 2020 Funds Average: Derived from data provided by Lipper, a Thomson Reuters Company. | |
| |
| Target Retirement 2025 Fund | 5.65% |
| Target 2025 Composite Index | 5.79 |
| Mixed-Asset Target 2025 Funds Average | 4.49 |
| Mixed-Asset Target 2025 Funds Average: Derived from data provided by Lipper, a Thomson Reuters Company. | |
2
| |
| | Average |
| | Annual Return |
| Target Retirement 2030 Fund | 5.64% |
| Target 2030 Composite Index | 5.79 |
| Mixed-Asset Target 2030 Funds Average | 4.41 |
| Mixed-Asset Target 2030 Funds Average: Derived from data provided by Lipper, a Thomson Reuters Company. | |
For a benchmark description, see the Glossary.
The figures shown represent past performance, which is not a guarantee of future results. (Current performance may be lower or higher than the performance data cited. For performance data current to the most recent month-end, visit our website at vanguard.com/performance.) Note, too, that both investment returns and principal value can fluctuate widely, so an investor’s shares, when sold, could be worth more or less than their original cost.
| | |
| Expense Ratios | | |
| Your Fund Compared With Its Peer Group | | |
| |
| | Acquired Fund Fees | Peer Group |
| | and Expenses | Average |
| Target Retirement Income Fund | 0.14% | 0.53% |
| Target Retirement 2010 Fund | 0.14 | 0.41 |
| Target Retirement 2015 Fund | 0.14 | 0.41 |
| Target Retirement 2020 Fund | 0.14 | 0.49 |
| Target Retirement 2025 Fund | 0.15 | 0.43 |
| Target Retirement 2030 Fund | 0.15 | 0.48 |
The fund expense figures shown—drawn from the prospectus dated January 28, 2016—represent an estimate of the weighted average of the expense ratios and any transaction fees charged by the underlying mutual funds (the ”acquired” funds) in which the Target Retirement Funds invest. The Target Retirement Funds do not charge any expenses or fees of their own. For the fiscal year ended September 30, 2016, the acquired fund fees and expenses were 0.13% for the Income Fund, 0.13% for the 2010 Fund, 0.14% for the 2015 Fund, 0.14% for the 2020 Fund, 0.14% for the 2025 Fund, and 0.15% for the 2030 Fund. Peer-group expense ratios are derived from data provided by Lipper, a Thomson Reuters Company, and capture information through year-end 2015.
Peer groups: For the Income Fund, Mixed-Asset Target Today Funds Average; for the 2010 Fund, Mixed-Asset Target 2010 Funds; for the 2015 Fund, Mixed-Asset Target 2015 Funds; for the 2020 Fund, Mixed-Asset Target 2020 Funds; for the 2025 Fund, Mixed-Asset Target 2025 Funds; and for the Target Retirement 2030 Fund, Mixed-Asset Target 2030 Funds.
3
Chairman’s Perspective

Bill McNabb
Chairman and Chief Executive Officer
Dear Shareholder,
If you think you’ve had reason to feel uneasy about the investment environment lately, you’re not imagining things. In just the past few months, we’ve seen economic uncertainty, intense political polarization, and super-low bond yields. Yet at the same time, the stock market kept pushing higher.
In this confusing and sometimes contradictory climate, you may be asking yourself a question that I hear often: How do I make sense of all this, keep investing, and still get a good night’s sleep?
As with any problem, there are multiple ways to go at it. But there’s one approach in particular that is simple, straightforward, and nearly foolproof: Save more money. Not only can saving more give you a greater sense of control over your investment plan, it can help compensate for long-term returns that, in our estimation, could fall short of historical averages.
I love the way one of our investment pros put it. Fran Kinniry this summer told The Wall Street Journal, “Investing is always a partnership between you and the markets.” He explained that the markets carried more than their fair share of the weight for a couple of decades, through the 1990s, providing outsized returns that made the investor’s half of the partnership relatively light work. “But now you are going to have to be the majority partner.”
Sobering? Sure. Hopeless? Definitely not.
4
Over the 12 months since last September, U.S. stocks returned 15%, though the rise has not been a one-way ticket straight up. International markets have also posted strong returns, but lower than those of the broad U.S. market. The decision by United Kingdom voters in June to exit the European Union came as a surprise but caused market heartburn for only a few days.
In fixed income, yields remained extremely low—about 1.60% on the 10-year U.S. Treasury note at the end of September, after dipping below 1.40% over the summer. And bond yields in some international markets were negative.
Even this relatively small window of time illustrates a truism of the financial markets: There will always be segments that perform well and others that don’t. Saving more saves you from trying to control the uncontrollable—how economies and the markets perform. And it keeps you in control of one of the most vital parts of your investment program.
Although the “save more” logic is easy to grasp, it’s not always easy to follow. Bills, illness, the loss of a job—these can affect any of us.
But whatever our circumstances, figuring out how to save more is worth the effort. It requires that we make difficult decisions to forgo some consumption today to increase the likelihood of consuming (or consuming more) in the future. This is the very heart of investing. Sacrifices are never fun, so consider carrying them out systematically and in doses that you
| | | |
| Market Barometer | | | |
| | | Average Annual Total Returns |
| | | Periods Ended September 30, 2016 |
| | One | Three | Five |
| | Year | Years | Years |
| Stocks | | | |
| Russell 1000 Index (Large-caps) | 14.93% | 10.78% | 16.41% |
| Russell 2000 Index (Small-caps) | 15.47 | 6.71 | 15.82 |
| Russell 3000 Index (Broad U.S. market) | 14.96 | 10.44 | 16.36 |
| FTSE All-World ex US Index (International) | 9.62 | 0.71 | 6.50 |
| |
| Bonds | | | |
| Bloomberg Barclays U.S. Aggregate Bond Index | | | |
| (Broad taxable market) | 5.19% | 4.03% | 3.08% |
| Bloomberg Barclays Municipal Bond Index | | | |
| (Broad tax-exempt market) | 5.58 | 5.54 | 4.48 |
| Citigroup Three-Month U.S. Treasury Bill Index | 0.20 | 0.06 | 0.06 |
| |
| CPI | | | |
| Consumer Price Index | 1.46% | 1.03% | 1.25% |
5
can be comfortable with—for instance, gradually getting up to the max in your IRA, or adding a percentage point or so to the amount you stash in your employer’s retirement plan. As a point of reference, we generally suggest that investors strive for a retirement savings rate of 12%–15%, including any employer contributions.
If you need more convincing about the wisdom of the “save more” course of action, it might be helpful to examine your alternatives. This list is by no means exhaustive, but it hits on a few of the big ones, and none are without risk.
• Reach for yield. With yields so low on many types of bonds, it’s tempting to find the corners of the fixed income market where payouts are juicier. But with the juice comes considerable risk. You need to be aware that you’d be taking on more risk—and how much more.
• Go all-in on a hot-performing asset class or fund. By now, you know better than that, right?
• Sit tight. This approach isn’t a terrible idea; it’s better than panicking and deciding to just “do something,” particularly if that means changing your approach in response to the market’s movements.
Here’s the inescapably challenging part of your partnership with the markets: In the short run, your “partner” is fickle, emotional, and wildly unpredictable. But in the long run, your partner is mostly rational and extremely helpful.
The best way to minimize your vulnerability to the market’s mood swings, and to maximize the benefit of your partner’s longer-term strengths, is to expect less and save more. Maybe the markets will deliver better-than-expected returns. Maybe they’ll be consistent with our more modest expectations. In either case, a higher savings rate can help put you in a better position to reach your goals.
As always, thank you for investing with Vanguard.
Sincerely,

F. William McNabb III
Chairman and Chief Executive Officer
October 18, 2016
6
Target Retirement Income Fund
| |
| Fund Profile | |
| As of September 30, 2016 | |
| |
| Total Fund Characteristics | |
| |
| Ticker Symbol | VTINX |
| 30-Day SEC Yield | 1.78% |
| Acquired Fund Fees and Expenses1 | 0.14% |
| |
| Allocation to Underlying Vanguard Funds | |
| Vanguard Total Bond Market II Index Fund | |
| Investor Shares | 37.1% |
| Vanguard Total Stock Market Index Fund | |
| Investor Shares | 18.1 |
| Vanguard Short-Term Inflation-Protected | |
| Securities Index Fund Investor Shares | 16.8 |
| Vanguard Total International Bond Index | |
| Fund Investor Shares | 15.9 |
| Vanguard Total International Stock Index | |
| Fund Investor Shares | 12.1 |
| | |
| Total Fund Volatility Measures | |
| | Target | Bloomberg |
| | Income | Barclays US |
| | Composite | Aggregate Bond |
| | Index | Index |
| R-Squared | 0.99 | 0.15 |
| Beta | 0.98 | 0.54 |
These measures show the degree and timing of the fund’s fluctuations compared with the indexes over 36 months.
Fund Asset Allocation
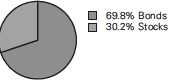
1 This figure—drawn from the prospectus dated January 28, 2016—represents an estimate of the weighted average of the expense ratios and any transaction fees charged by the underlying mutual funds (the ”acquired” funds) in which the Target Retirement Income Fund invests. The fund does not charge any expenses or fees of its own. For the fiscal year ended September 30, 2016, the acquired fund fees and expenses were 0.13%.
7
Target Retirement Income Fund
Performance Summary
All of the returns in this report represent past performance, which is not a guarantee of future results that may be achieved by the fund. (Current performance may be lower or higher than the performance data cited. For performance data current to the most recent month-end, visit our website at vanguard.com/performance.) Note, too, that both investment returns and principal value can fluctuate widely, so an investor’s shares, when sold, could be worth more or less than their original cost. The returns shown do not reflect taxes that a shareholder would pay on fund distributions or on the sale of fund shares.
Cumulative Performance: September 30, 2006, Through September 30, 2016
Initial Investment of $10,000
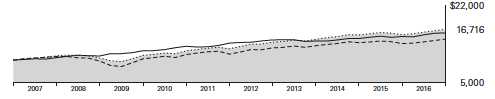
| | | | | |
| | | Average Annual Total Returns | |
| | | Periods Ended September 30, 2016 | |
| |
| | | | | | Final Value |
| | | One | Five | Ten | of a $10,000 |
| | | Year | Years | Years | Investment |
| |
| | Target Retirement Income Fund | 7.54% | 5.94% | 5.27% | $16,716 |
| |
| •••••••• | Target Income Composite Index | 7.79 | 6.11 | 5.31 | 16,783 |
| |
| – – – – | Spliced Mixed-Asset Target Today | | | | |
| | Funds Average | 7.25 | 5.27 | 3.86 | 14,601 |
| |
| | Bloomberg Barclays U.S. Aggregate | | | | |
| | Bond Index | 5.19 | 3.08 | 4.79 | 15,965 |
For a benchmark description, see the Glossary.
Spliced Mixed-Asset Target Today Funds Average: Derived from data provided by Lipper, a Thomson Reuters Company.
See Financial Highlights for dividend and capital gains information.
8
Target Retirement Income Fund
Fiscal-Year Total Returns (%): September 30, 2006, Through September 30, 2016
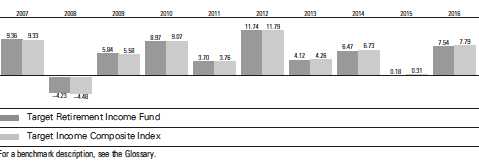
9
Target Retirement Income Fund
Financial Statements
Statement of Net Assets
As of September 30, 2016
The fund reports a complete list of its holdings in regulatory filings four times in each fiscal year, at the quarter-ends. For the second and fourth fiscal quarters, the lists appear in the fund’s semiannual and annual reports to shareholders. For the first and third fiscal quarters, the fund files the lists with the Securities and Exchange Commission on Form N-Q. Shareholders can look up the fund’s Forms N-Q on the SEC’s website at sec.gov. Forms N-Q may also be reviewed and copied at the SEC’s Public Reference Room (see the back cover of this report for further information).
| | |
| | | Market |
| | | Value• |
| | Shares | ($000) |
| Investment Companies (100.1%) | | |
| U.S. Stock Fund (18.1%) | | |
| Vanguard Total Stock Market Index Fund Investor Shares | 36,021,073 | 1,951,622 |
| |
| International Stock Fund (12.1%) | | |
| Vanguard Total International Stock Index Fund Investor Shares | 86,120,683 | 1,303,867 |
| |
| U.S. Bond Funds (54.0%) | | |
| 1 Vanguard Total Bond Market II Index Fund Investor Shares | 363,893,006 | 4,017,379 |
| Vanguard Short-Term Inflation-Protected Securities Index Fund Investor Shares | 73,012,562 | 1,812,902 |
| | | 5,830,281 |
| International Bond Fund (15.9%) | | |
| Vanguard Total International Bond Index Fund Investor Shares | 153,884,392 | 1,718,889 |
| Total Investment Companies (Cost $9,332,088) | | 10,804,659 |
| Temporary Cash Investment (0.0%) | | |
| Money Market Fund (0.0%) | | |
| 1 Vanguard Market Liquidity Fund, 0.640% (Cost $371) | 3,713 | 371 |
| Total Investments (100.1%) (Cost $9,332,459) | | 10,805,030 |
| Other Assets and Liabilities (-0.1%) | | |
| Other Assets | | 55,540 |
| Liabilities | | (70,739) |
| | | (15,199) |
| Net Assets (100%) | | |
| Applicable to 824,640,454 outstanding $.001 par value shares of | | |
| beneficial interest (unlimited authorization) | | 10,789,831 |
| Net Asset Value Per Share | | $13.08 |
10
| |
| Target Retirement Income Fund | |
| |
| |
| |
| |
| | Amount |
| | ($000) |
| Statement of Assets and Liabilities | |
| Assets | |
| Investments in Securities, at Value—Affiliated Vanguard Funds | 10,805,030 |
| Receivables for Investment Securities Sold | 38,860 |
| Receivables for Accrued Income | 9,043 |
| Receivables for Capital Shares Issued | 7,637 |
| Total Assets | 10,860,570 |
| Liabilities | |
| Payables for Investment Securities Purchased | 25,164 |
| Payables for Capital Shares Redeemed | 45,575 |
| Total Liabilities | 70,739 |
| Net Assets | 10,789,831 |
| |
| |
| At September 30, 2016, net assets consisted of: | |
| | Amount |
| | ($000) |
| Paid-in Capital | 9,281,148 |
| Undistributed Net Investment Income | 9,513 |
| Accumulated Net Realized Gains | 26,599 |
| Unrealized Appreciation (Depreciation) | 1,472,571 |
| Net Assets | 10,789,831 |
• See Note A in Notes to Financial Statements.
1 Affiliated fund available only to Vanguard funds and certain trusts and accounts managed by Vanguard. Rate shown for Vanguard Market Liquidity Fund is the 7-day yield.
See accompanying Notes, which are an integral part of the Financial Statements.
11
| |
| Target Retirement Income Fund | |
| |
| |
| Statement of Operations | |
| |
| | Year Ended |
| | September 30, 2016 |
| | ($000) |
| Investment Income | |
| Income | |
| Income Distributions Received from Affiliated Funds | 186,631 |
| Other Income | 32 |
| Net Investment Income—Note B | 186,663 |
| Realized Net Gain (Loss) | |
| Capital Gain Distributions Received from Affiliated Funds | 5,925 |
| Affiliated Investment Securities Sold | 62,799 |
| Realized Net Gain (Loss) | 68,724 |
| Change in Unrealized Appreciation (Depreciation) of Investment Securities | 510,311 |
| Net Increase (Decrease) in Net Assets Resulting from Operations | 765,698 |
See accompanying Notes, which are an integral part of the Financial Statements.
12
| | |
| Target Retirement Income Fund | | |
| |
| |
| Statement of Changes in Net Assets | | |
| |
| | Year Ended September 30, |
| | 2016 | 2015 |
| | ($000) | ($000) |
| Increase (Decrease) in Net Assets | | |
| Operations | | |
| Net Investment Income | 186,663 | 209,351 |
| Realized Net Gain (Loss) | 68,724 | 188,014 |
| Change in Unrealized Appreciation (Depreciation) | 510,311 | (371,136) |
| Net Increase (Decrease) in Net Assets Resulting from Operations | 765,698 | 26,229 |
| Distributions | | |
| Net Investment Income | (185,318) | (207,968) |
| Realized Capital Gain1 | (171,451) | (36,816) |
| Total Distributions | (356,769) | (244,784) |
| Capital Share Transactions | | |
| Issued | 2,074,919 | 2,628,108 |
| Issued in Lieu of Cash Distributions | 340,239 | 234,102 |
| Redeemed | (2,667,677) | (3,224,763) |
| Net Increase (Decrease) from Capital Share Transactions | (252,519) | (362,553) |
| Total Increase (Decrease) | 156,410 | (581,108) |
| Net Assets | | |
| Beginning of Period | 10,633,421 | 11,214,529 |
| End of Period2 | 10,789,831 | 10,633,421 |
1 Includes fiscal 2016 and 2015 short-term gain distributions totaling $8,126,000 and $14,025,000, respectively. Short-term gain distributions are treated as ordinary income dividends for tax purposes.
2 Net Assets—End of Period includes undistributed (overdistributed) net investment income of $9,513,000 and $8,168,000.
See accompanying Notes, which are an integral part of the Financial Statements.
13
| | | | | |
| Target Retirement Income Fund | | | | | |
| |
| |
| Financial Highlights | | | | | |
| |
| |
| For a Share Outstanding | | | Year Ended September 30, |
| Throughout Each Period | 2016 | 2015 | 2014 | 2013 | 2012 |
| Net Asset Value, Beginning of Period | $12.59 | $12.84 | $12.46 | $12.23 | $11.22 |
| Investment Operations | | | | | |
| Net Investment Income | .229 | .238 | .220 | .246 | .275 |
| Capital Gain Distributions Received | .007 | .015 | .002 | .067 | .052 |
| Net Realized and Unrealized Gain (Loss) | | | | | |
| on Investments | .692 | (.225) | .572 | .185 | .977 |
| Total from Investment Operations | . 928 | .028 | .794 | .498 | 1.304 |
| Distributions | | | | | |
| Dividends from Net Investment Income | (. 227) | (. 236) | (. 218) | (. 247) | (. 273) |
| Distributions from Realized Capital Gains | (. 211) | (. 042) | (.196) | (. 021) | (. 021) |
| Total Distributions | (. 438) | (. 278) | (. 414) | (. 268) | (. 294) |
| Net Asset Value, End of Period | $13.08 | $12.59 | $12.84 | $12.46 | $12.23 |
| |
| Total Return1 | 7.54% | 0.18% | 6.47% | 4.12% | 11.74% |
| |
| Ratios/Supplemental Data | | | | | |
| Net Assets, End of Period (Millions) | $10,790 | $10,633 | $11,215 | $10,163 | $9,382 |
| Ratio of Total Expenses to | | | | | |
| Average Net Assets | — | — | — | — | — |
| Acquired Fund Fees and Expenses | 0.13% | 0.14% | 0.16% | 0.16% | 0.16% |
| Ratio of Net Investment Income to | | | | | |
| Average Net Assets | 1.78% | 1.83% | 1.74% | 1.99% | 2.31% |
| Portfolio Turnover Rate | 11% | 14% | 6% | 40% | 7% |
1 Total returns do not include account service fees that may have applied in the periods shown. Fund prospectuses provide information about any applicable account service fees.
See accompanying Notes, which are an integral part of the Financial Statements.
14
Target Retirement Income Fund
Notes to Financial Statements
Vanguard Target Retirement Income Fund is registered under the Investment Company Act of 1940 as an open-end investment company, or mutual fund. The fund follows a balanced investment strategy by investing in selected Vanguard funds to achieve its targeted allocation of assets to U.S. and international stocks, and U.S. and international bonds. Financial statements and other information about each underlying fund are available on vanguard.com.
A. The following significant accounting policies conform to generally accepted accounting principles for U.S. investment companies. The fund consistently follows such policies in preparing its financial statements.
1. Security Valuation: Investments are valued at the net asset value of each underlying Vanguard fund determined as of the close of the New York Stock Exchange (generally 4 p.m., Eastern time) on the valuation date.
2. Federal Income Taxes: The fund intends to continue to qualify as a regulated investment company and distribute all of its taxable income. Management has analyzed the fund’s tax positions taken for all open federal income tax years (September 30, 2013–2016), and has concluded that no provision for federal income tax is required in the fund’s financial statements.
3. Distributions: Distributions to shareholders are recorded on the ex-dividend date.
4. Credit Facility: The fund and certain other funds managed by The Vanguard Group (“Vanguard”) participate in a $3.1 billion committed credit facility provided by a syndicate of lenders pursuant to a credit agreement that may be renewed annually; each fund is individually liable for its borrowings, if any, under the credit facility. Borrowings may be utilized for temporary and emergency purposes, and are subject to the fund’s regulatory and contractual borrowing restrictions. The participating funds are charged administrative fees and an annual commitment fee of 0.10% of the undrawn amount of the facility; these fees are allocated to the funds based on a method approved by the fund’s board of trustees and borne by the funds in which the fund invests (see Note B). Any borrowings under this facility bear interest at a rate based upon the higher of the one-month London Interbank Offered Rate, federal funds effective rate, or overnight bank funding rate plus an agreed-upon spread.
The fund had no borrowings outstanding at September 30, 2016, or at any time during the period then ended.
5. Other: Income and capital gain distributions received are recorded on the ex-dividend date. Security transactions are accounted for on the date securities are bought or sold. Costs used to determine realized gains (losses) on the sale of investment securities are those of the specific securities sold.
B. In accordance with the terms of a Funds’ Service Agreement (the “FSA”) between Vanguard and the fund, Vanguard furnishes to the fund investment advisory, corporate management, administrative, marketing, and distribution services at Vanguard’s cost of operations (as defined by the FSA). These costs of operations are allocated to the fund based on methods and guidelines approved by the board of trustees. The FSA provides that expenses otherwise allocable to Vanguard funds-of-funds may be reduced or eliminated to the extent of savings realized by the underlying Vanguard funds by virtue of being part of a fund-of-funds. Accordingly, all expenses for services provided by Vanguard to the fund and all other expenses incurred by the fund during the period ended September 30, 2016, were borne by the underlying Vanguard funds in which the fund invests. The fund’s trustees and officers are also trustees and officers, respectively, of the underlying Vanguard funds, as well as directors and employees, respectively, of Vanguard.
15
Target Retirement Income Fund
C. Various inputs may be used to determine the value of the fund’s investments. These inputs are summarized in three broad levels for financial statement purposes. The inputs or methodologies used to value securities are not necessarily an indication of the risk associated with investing in those securities.
Level 1—Quoted prices in active markets for identical securities.
Level 2—Other significant observable inputs (including quoted prices for similar securities, interest rates, prepayment speeds, credit risk, etc.).
Level 3—Significant unobservable inputs (including the fund’s own assumptions used to determine the fair value of investments).
At September 30, 2016, 100% of the market value of the fund’s investments was determined based on Level 1 inputs.
D. Distributions are determined on a tax basis and may differ from net investment income and realized capital gains for financial reporting purposes. Differences may be permanent or temporary. Permanent differences are reclassified among capital accounts in the financial statements to reflect their tax character. Temporary differences arise when certain items of income, expense, gain, or loss are recognized in different periods for financial statement and tax purposes. These differences will reverse at some time in the future. Differences in classification may also result from the treatment of short-term gains as ordinary income for tax purposes.
The fund used a tax accounting practice to treat a portion of the price of capital shares redeemed during the year as distributions from realized capital gains. Accordingly, the fund has reclassified $20,584,000 from accumulated net realized gains to paid-in capital.
For tax purposes, at September 30, 2016, the fund had $9,891,000 of ordinary income and $26,220,000 of long-term capital gains available for distribution.
At September 30, 2016, the cost of investment securities for tax purposes was $9,332,459,000. Net unrealized appreciation of investment securities for tax purposes was $1,472,571,000, consisting entirely of unrealized gains on securities that had risen in value since their purchase.
E. Capital shares issued and redeemed were:
| | |
| | Year Ended September 30, |
| | 2016 | 2015 |
| | Shares | Shares |
| | (000) | (000) |
| Issued | 162,780 | 202,353 |
| Issued in Lieu of Cash Distributions | 26,995 | 18,131 |
| Redeemed | (209,799) | (249,340) |
| Net Increase (Decrease) in Shares Outstanding | (20,024) | (28,856) |
16
Target Retirement Income Fund
| | | | | | |
| F. Transactions during the period in affiliated underlying Vanguard funds were as follows: | |
| | | | Current Period Transactions | |
| | Sept. 30, | | Proceeds | | | Sept. 30, |
| | 2015 | | from | | Capital Gain | 2016 |
| | Market | Purchases | Securities | | Distributions | Market |
| | Value | at Cost | Sold | Income | Received | Value |
| | ($000) | ($000) | ($000) | ($000) | ($000) | ($000) |
| Vanguard Market Liquidity Fund | — | NA1 | NA1 | 7 | — | 371 |
| Vanguard Short-Term Inflation- | | | | | | |
| Protected Securities Index Fund | 1,779,726 | 134,289 | 143,367 | — | — | 1,812,902 |
| Vanguard Total Bond Market II | | | | | | |
| Index Fund | 4,004,448 | 424,317 | 509,700 | 91,376 | 5,925 | 4,017,379 |
| Vanguard Total International | | | | | | |
| Bond Index Fund | 1,687,462 | 59,326 | 118,939 | 24,965 | — | 1,718,889 |
| Vanguard Total International | | | | | | |
| Stock Index Fund | 1,233,178 | 181,629 | 203,755 | 35,367 | — | 1,303,867 |
| Vanguard Total Stock Market | | | | | | |
| Index Fund | 1,935,693 | 305,589 | 538,347 | 34,916 | — | 1,951,622 |
| Total | 10,640,507 | 1,105,150 | 1,514,108 | 186,631 | 5,925 | 10,805,030 |
| 1 Not applicable—purchases and sales are for temporary cash investment purposes. | | | |
G. Management has determined that no material events or transactions occurred subsequent to September 30, 2016, that would require recognition or disclosure in these financial statements.
17
Target Retirement 2010 Fund
Fund Profile
As of September 30, 2016
| |
| Total Fund Characteristics | |
| |
| Ticker Symbol | VTENX |
| 30-Day SEC Yield | 1.79% |
| Acquired Fund Fees and Expenses1 | 0.14% |
| |
| Allocation to Underlying Vanguard Funds | |
| Vanguard Total Bond Market II Index Fund | |
| Investor Shares | 36.4% |
| Vanguard Total Stock Market Index Fund | |
| Investor Shares | 19.3 |
| Vanguard Short-Term Inflation-Protected | |
| Securities Index Fund Investor Shares | 15.8 |
| Vanguard Total International Bond Index | |
| Fund Investor Shares | 15.6 |
| Vanguard Total International Stock Index | |
| Fund Investor Shares | 12.9 |
| | |
| Total Fund Volatility Measures | |
| | Target 2010 | MSCI US |
| | Composite | Broad Market |
| | Index | Index |
| R-Squared | 1.00 | 0.82 |
| Beta | 0.99 | 0.34 |
These measures show the degree and timing of the fund’s fluctuations compared with the indexes over 36 months.
Fund Asset Allocation
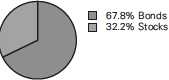
1 This figure—drawn from the prospectus dated January 28, 2016—represents an estimate of the weighted average of the expense ratios and any transaction fees charged by the underlying mutual funds (the ”acquired” funds) in which the Target Retirement 2010 Fund invests. The fund does not charge any expenses or fees of its own. For the fiscal year ended September 30, 2016, the acquired fund fees and expenses were 0.13%.
18
Target Retirement 2010 Fund
Performance Summary
All of the returns in this report represent past performance, which is not a guarantee of future results that may be achieved by the fund. (Current performance may be lower or higher than the performance data cited. For performance data current to the most recent month-end, visit our website at vanguard.com/performance.) Note, too, that both investment returns and principal value can fluctuate widely, so an investor’s shares, when sold, could be worth more or less than their original cost. The returns shown do not reflect taxes that a shareholder would pay on fund distributions or on the sale of fund shares.
Cumulative Performance: September 30, 2006, Through September 30, 2016
Initial Investment of $10,000
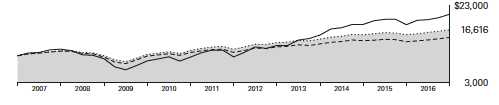
| | | | | |
| | | Average Annual Total Returns | |
| | | Periods Ended September 30, 2016 | |
| | | | | | Final Value |
| | | One | Five | Ten | of a $10,000 |
| | | Year | Years | Years | Investment |
| | Target Retirement 2010 Fund | 7.82% | 7.28% | 5.21% | $16,616 |
| •••••••• | Target 2010 Composite Index | 8.08 | 7.42 | 5.25 | 16,684 |
| – – – – | Mixed-Asset Target 2010 Funds | | | | |
| |
| | MSCI Average US Broad Market Index | 15.02 8.13 | 16.42 6.29 | 7.56 3.95 | 20,734 14,732 |
| For a benchmark description, see the Glossary. | | | | |
| Mixed-Asset Target 2010 Funds Average: Derived from data provided by Lipper, a Thomson Reuters Company. | |
See Financial Highlights for dividend and capital gains information.
19
Target Retirement 2010 Fund
Fiscal-Year Total Returns (%): September 30, 2006, Through September 30, 2016
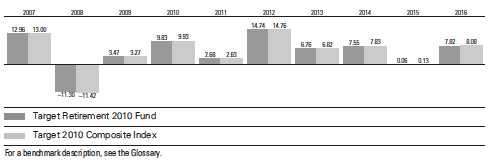
20
Target Retirement 2010 Fund
Financial Statements
Statement of Net Assets
As of September 30, 2016
The fund reports a complete list of its holdings in regulatory filings four times in each fiscal year, at the quarter-ends. For the second and fourth fiscal quarters, the lists appear in the fund’s semiannual and annual reports to shareholders. For the first and third fiscal quarters, the fund files the lists with the Securities and Exchange Commission on Form N-Q. Shareholders can look up the fund’s Forms N-Q on the SEC’s website at sec.gov. Forms N-Q may also be reviewed and copied at the SEC’s Public Reference Room (see the back cover of this report for further information).
| | |
| | | Market |
| | | Value• |
| | Shares | ($000) |
| Investment Companies (100.2%) | | |
| U.S. Stock Fund (19.3%) | | |
| Vanguard Total Stock Market Index Fund Investor Shares | 20,723,111 | 1,122,778 |
| |
| International Stock Fund (12.9%) | | |
| Vanguard Total International Stock Index Fund Investor Shares | 49,617,609 | 751,211 |
| |
| U.S. Bond Funds (52.3%) | | |
| 1 Vanguard Total Bond Market II Index Fund Investor Shares | 191,667,321 | 2,116,007 |
| Vanguard Short-Term Inflation-Protected Securities Index Fund Investor Shares | 37,053,880 | 920,048 |
| | | 3,036,055 |
| International Bond Fund (15.7%) | | |
| Vanguard Total International Bond Index Fund Investor Shares | 81,398,469 | 909,221 |
| Total Investment Companies (Cost $4,930,468) | | 5,819,265 |
| Temporary Cash Investment (0.1%) | | |
| Money Market Fund (0.1%) | | |
| 1 Vanguard Market Liquidity Fund, 0.640% (Cost $7,173) | 71,722 | 7,173 |
| Total Investments (100.3%) (Cost $4,937,641) | | 5,826,438 |
| Other Assets and Liabilities (-0.3%) | | |
| Other Assets | | 12,620 |
| Liabilities | | (31,565) |
| | | (18,945) |
| Net Assets (100%) | | |
| Applicable to 219,592,273 outstanding $.001 par value shares of | | |
| beneficial interest (unlimited authorization) | | 5,807,493 |
| Net Asset Value Per Share | | $26.45 |
21
| |
| Target Retirement 2010 Fund | |
| |
| |
| |
| |
| | Amount |
| | ($000) |
| Statement of Assets and Liabilities | |
| Assets | |
| Investments in Securities, at Value—Affiliated Vanguard Funds | 5,826,438 |
| Receivables for Investment Securities Sold | 4,829 |
| Receivables for Accrued Income | 4,809 |
| Receivables for Capital Shares Issued | 2,982 |
| Total Assets | 5,839,058 |
| Liabilities | |
| Payables for Investment Securities Purchased | 4,753 |
| Payables for Capital Shares Redeemed | 26,811 |
| Total Liabilities | 31,565 |
| Net Assets | 5,807,493 |
| |
| |
| At September 30, 2016, net assets consisted of: | |
| | Amount |
| | ($000) |
| Paid-in Capital | 4,789,676 |
| Undistributed Net Investment Income | 63,817 |
| Accumulated Net Realized Gains | 65,203 |
| Unrealized Appreciation (Depreciation) | 888,797 |
| Net Assets | 5,807,493 |
• See Note A in Notes to Financial Statements.
1 Affiliated fund available only to Vanguard funds and certain trusts and accounts managed by Vanguard. Rate shown for Vanguard Market Liquidity Fund is the 7-day yield.
See accompanying Notes, which are an integral part of the Financial Statements.
22
| |
| Target Retirement 2010 Fund | |
| |
| |
| Statement of Operations | |
| |
| | Year Ended |
| | September 30, 2016 |
| | ($000) |
| Investment Income | |
| Income | |
| Income Distributions Received from Affiliated Funds | 105,394 |
| Other Income | 56 |
| Net Investment Income—Note B | 105,450 |
| Realized Net Gain (Loss) | |
| Capital Gain Distributions Received from Affiliated Funds | 3,197 |
| Affiliated Investment Securities Sold | 114,326 |
| Realized Net Gain (Loss) | 117,523 |
| Change in Unrealized Appreciation (Depreciation) of Investment Securities | 216,049 |
| Net Increase (Decrease) in Net Assets Resulting from Operations | 439,022 |
See accompanying Notes, which are an integral part of the Financial Statements.
23
| | |
| Target Retirement 2010 Fund | | |
| |
| |
| Statement of Changes in Net Assets | | |
| |
| | Year Ended September 30, |
| | 2016 | 2015 |
| | ($000) | ($000) |
| Increase (Decrease) in Net Assets | | |
| Operations | | |
| Net Investment Income | 105,450 | 129,088 |
| Realized Net Gain (Loss) | 117,523 | 234,006 |
| Change in Unrealized Appreciation (Depreciation) | 216,049 | (342,401) |
| Net Increase (Decrease) in Net Assets Resulting from Operations | 439,022 | 20,693 |
| Distributions | | |
| Net Investment Income | (106,386) | (120,953) |
| Realized Capital Gain1 | (204,297) | (87,847) |
| Total Distributions | (310,683) | (208,800) |
| Capital Share Transactions | | |
| Issued | 1,092,650 | 1,543,822 |
| Issued in Lieu of Cash Distributions | 304,528 | 204,793 |
| Redeemed | (1,860,505) | (2,370,440) |
| Net Increase (Decrease) from Capital Share Transactions | (463,327) | (621,825) |
| Total Increase (Decrease) | (334,988) | (809,932) |
| Net Assets | | |
| Beginning of Period | 6,142,481 | 6,952,413 |
| End of Period2 | 5,807,493 | 6,142,481 |
1 Includes fiscal 2016 and 2015 short-term gain distributions totaling $3,122,000 and $9,384,000, respectively. Short-term gain distributions are treated as ordinary income dividends for tax purposes.
2 Net Assets—End of Period includes undistributed (overdistributed) net investment income of $63,817,000 and $75,298,000.
See accompanying Notes, which are an integral part of the Financial Statements.
24
| | | | | |
| Target Retirement 2010 Fund | | | | | |
| |
| |
| Financial Highlights | | | | | |
| |
| |
| For a Share Outstanding | | | Year Ended September 30, |
| Throughout Each Period | 2016 | 2015 | 2014 | 2013 | 2012 |
| Net Asset Value, Beginning of Period | $25.90 | $26.67 | $25.50 | $24.45 | $21.91 |
| Investment Operations | | | | | |
| Net Investment Income | .498 | .529 | .487 | .516 | .571 |
| Capital Gain Distributions Received | .014 | .036 | .004 | .103 | .100 |
| Net Realized and Unrealized Gain (Loss) | | | | | |
| on Investments | 1.431 | (.534) | 1.402 | .999 | 2.502 |
| Total from Investment Operations | 1.943 | .031 | 1.893 | 1.618 | 3.173 |
| Distributions | | | | | |
| Dividends from Net Investment Income | (. 477) | (. 464) | (. 422) | (. 531) | (. 596) |
| Distributions from Realized Capital Gains | (. 916) | (. 337) | (. 301) | (. 037) | (. 037) |
| Total Distributions | (1.393) | (. 801) | (.723) | (. 568) | (. 633) |
| Net Asset Value, End of Period | $26.45 | $25.90 | $26.67 | $25.50 | $24.45 |
| |
| Total Return1 | 7.82% | 0.06% | 7.55% | 6.76% | 14.74% |
| |
| Ratios/Supplemental Data | | | | | |
| Net Assets, End of Period (Millions) | $5,807 | $6,142 | $6,952 | $6,679 | $6,155 |
| Ratio of Total Expenses to | | | | | |
| Average Net Assets | — | — | — | — | — |
| Acquired Fund Fees and Expenses | 0.13% | 0.14% | 0.16% | 0.16% | 0.16% |
| Ratio of Net Investment Income to | | | | | |
| Average Net Assets | 1.81% | 1.86% | 1.83% | 2.08% | 2.51% |
| Portfolio Turnover Rate | 8% | 15% | 13% | 38% | 12% |
1 Total returns do not include account service fees that may have applied in the periods shown. Fund prospectuses provide information about any applicable account service fees.
See accompanying Notes, which are an integral part of the Financial Statements.
25
Target Retirement 2010 Fund
Notes to Financial Statements
Vanguard Target Retirement 2010 Fund is registered under the Investment Company Act of 1940 as an open-end investment company, or mutual fund. The fund follows a balanced investment strategy by investing in selected Vanguard funds to achieve its targeted allocation of assets to U.S. and international stocks, and U.S. and international bonds. Financial statements and other information about each underlying fund are available on vanguard.com.
A. The following significant accounting policies conform to generally accepted accounting principles for U.S. investment companies. The fund consistently follows such policies in preparing its financial statements.
1. Security Valuation: Investments are valued at the net asset value of each underlying Vanguard fund determined as of the close of the New York Stock Exchange (generally 4 p.m., Eastern time) on the valuation date.
2. Federal Income Taxes: The fund intends to continue to qualify as a regulated investment company and distribute all of its taxable income. Management has analyzed the fund’s tax positions taken for all open federal income tax years (September 30, 2013–2016), and has concluded that no provision for federal income tax is required in the fund’s financial statements.
3. Distributions: Distributions to shareholders are recorded on the ex-dividend date.
4. Credit Facility: The fund and certain other funds managed by The Vanguard Group (“Vanguard”) participate in a $3.1 billion committed credit facility provided by a syndicate of lenders pursuant to a credit agreement that may be renewed annually; each fund is individually liable for its borrowings, if any, under the credit facility. Borrowings may be utilized for temporary and emergency purposes, and are subject to the fund’s regulatory and contractual borrowing restrictions. The participating funds are charged administrative fees and an annual commitment fee of 0.10% of the undrawn amount of the facility; these fees are allocated to the funds based on a method approved by the fund’s board of trustees and borne by the funds in which the fund invests (see Note B). Any borrowings under this facility bear interest at a rate based upon the higher of the one-month London Interbank Offered Rate, federal funds effective rate, or overnight bank funding rate plus an agreed-upon spread.
The fund had no borrowings outstanding at September 30, 2016, or at any time during the period then ended.
5. Other: Income and capital gain distributions received are recorded on the ex-dividend date. Security transactions are accounted for on the date securities are bought or sold. Costs used to determine realized gains (losses) on the sale of investment securities are those of the specific securities sold.
B. In accordance with the terms of a Funds’ Service Agreement (the “FSA”) between Vanguard and the fund, Vanguard furnishes to the fund investment advisory, corporate management, administrative, marketing, and distribution services at Vanguard’s cost of operations (as defined by the FSA). These costs of operations are allocated to the fund based on methods and guidelines approved by the board of trustees. The FSA provides that expenses otherwise allocable to Vanguard funds-of-funds may be reduced or eliminated to the extent of savings realized by the underlying Vanguard funds by virtue of being part of a fund-of-funds. Accordingly, all expenses for services provided by Vanguard to the fund and all other expenses incurred by the fund during the period ended September 30, 2016, were borne by the underlying Vanguard funds in which the fund invests. The fund’s trustees and officers are also trustees and officers, respectively, of the underlying Vanguard funds, as well as directors and employees, respectively, of Vanguard.
26
Target Retirement 2010 Fund
C. Various inputs may be used to determine the value of the fund’s investments. These inputs are summarized in three broad levels for financial statement purposes. The inputs or methodologies used to value securities are not necessarily an indication of the risk associated with investing in those securities.
Level 1—Quoted prices in active markets for identical securities.
Level 2—Other significant observable inputs (including quoted prices for similar securities, interest rates, prepayment speeds, credit risk, etc.).
Level 3—Significant unobservable inputs (including the fund’s own assumptions used to determine the fair value of investments).
At September 30, 2016, 100% of the market value of the fund’s investments was determined based on Level 1 inputs.
D. Distributions are determined on a tax basis and may differ from net investment income and realized capital gains for financial reporting purposes. Differences may be permanent or temporary. Permanent differences are reclassified among capital accounts in the financial statements to reflect their tax character. Temporary differences arise when certain items of income, expense, gain, or loss are recognized in different periods for financial statement and tax purposes. These differences will reverse at some time in the future. Differences in classification may also result from the treatment of short-term gains as ordinary income for tax purposes.
The fund used a tax accounting practice to treat a portion of the price of capital shares redeemed during the year as distributions from net investment income and realized capital gains. Accordingly, the fund has reclassified $10,545,000 from undistributed net investment income, and $27,885,000 from accumulated net realized gains, to paid-in capital.
For tax purposes, at September 30, 2016, the fund had $63,951,000 of ordinary income and $65,069,000 of long-term capital gains available for distribution.
At September 30, 2016, the cost of investment securities for tax purposes was $4,937,641,000. Net unrealized appreciation of investment securities for tax purposes was $888,797,000, consisting entirely of unrealized gains on securities that had risen in value since their purchase.
E. Capital shares issued and redeemed were:
| | |
| | Year Ended September 30, |
| | 2016 | 2015 |
| | Shares | Shares |
| | (000) | (000) |
| Issued | 42,556 | 57,848 |
| Issued in Lieu of Cash Distributions | 12,186 | 7,751 |
| Redeemed | (72,302) | (89,126) |
| Net Increase (Decrease) in Shares Outstanding | (17,560) | (23,527) |
27
Target Retirement 2010 Fund
| | | | | | |
| F. Transactions during the period in affiliated underlying Vanguard funds were as follows: | |
| |
| | | | Current Period Transactions | |
| | Sept. 30, | | Proceeds | | | Sept. 30, |
| | 2015 | | from | | Capital Gain | 2016 |
| | Market | Purchases | Securities | | Distributions | Market |
| | Value | at Cost | Sold | Income | Received | Value |
| | ($000) | ($000) | ($000) | ($000) | ($000) | ($000) |
| Vanguard Market Liquidity Fund | 2,851 | NA1 | NA1 | 4 | — | 7,173 |
| Vanguard Short-Term | | | | | | |
| Inflation-Protected Securities | | | | | | |
| Index Fund | 914,950 | 63,197 | 79,498 | — | — | 920,048 |
| Vanguard Total Bond Market II | | | | | | |
| Index Fund | 2,183,777 | 193,678 | 313,548 | 49,153 | 3,197 | 2,116,007 |
| Vanguard Total International | | | | | | |
| Bond Index Fund | 927,963 | 16,910 | 85,006 | 13,558 | — | 909,221 |
| Vanguard Total International | | | | | | |
| Stock Index Fund | 835,177 | 65,302 | 204,987 | 21,395 | — | 751,211 |
| Vanguard Total Stock Market | | | | | | |
| Index Fund | 1,286,888 | 144,064 | 459,977 | 21,284 | — | 1,122,778 |
| Total | 6,151,606 | 483,151 | 1,143,016 | 105,394 | 3,197 | 5,826,438 |
| 1 Not applicable—purchases and sales are for temporary cash investment purposes. | | | |
G. Management has determined that no material events or transactions occurred subsequent to September 30, 2016, that would require recognition or disclosure in these financial statements.
28
Target Retirement 2015 Fund
Fund Profile
As of September 30, 2016
| |
| Total Fund Characteristics | |
| |
| Ticker Symbol | VTXVX |
| 30-Day SEC Yield | 1.90% |
| Acquired Fund Fees and Expenses1 | 0.14% |
| |
| Allocation to Underlying Vanguard Funds | |
| Vanguard Total Bond Market II Index Fund | |
| Investor Shares | 30.8% |
| Vanguard Total Stock Market Index Fund | |
| Investor Shares | 27.8 |
| Vanguard Total International Stock Index | |
| Fund Investor Shares | 18.6 |
| Vanguard Total International Bond Index | |
| Fund Investor Shares | 13.3 |
| Vanguard Short-Term Inflation-Protected | |
| Securities Index Fund Investor Shares | 9.5 |
| | |
| Total Fund Volatility Measures | |
| | Target 2015 | MSCI US |
| | Composite | Broad Market |
| | Index | Index |
| R-Squared | 1.00 | 0.91 |
| Beta | 0.98 | 0.48 |
These measures show the degree and timing of the fund’s fluctuations compared with the indexes over 36 months.
Fund Asset Allocation

1 This figure—drawn from the prospectus dated January 28, 2016—represents an estimate of the weighted average of the expense ratios and any transaction fees charged by the underlying mutual funds (the ”acquired” funds) in which the Target Retirement 2015 Fund invests. The fund does not charge any expenses or fees of its own. For the fiscal year ended September 30, 2016, the acquired fund fees and expenses were 0.14%.
29
Target Retirement 2015 Fund
Performance Summary
All of the returns in this report represent past performance, which is not a guarantee of future results that may be achieved by the fund. (Current performance may be lower or higher than the performance data cited. For performance data current to the most recent month-end, visit our website at vanguard.com/performance.) Note, too, that both investment returns and principal value can fluctuate widely, so an investor’s shares, when sold, could be worth more or less than their original cost. The returns shown do not reflect taxes that a shareholder would pay on fund distributions or on the sale of fund shares.
Cumulative Performance: September 30, 2006, Through September 30, 2016
Initial Investment of $10,000
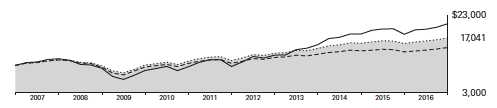
| | | | | |
| | | Average Annual Total Returns | |
| | | Periods Ended September 30, 2016 | |
| | | | | | Final Value |
| | | One | Five | Ten | of a $10,000 |
| | | Year | Years | Years | Investment |
| | Target Retirement 2015 Fund | 9.03% | 8.61% | 5.48% | $17,041 |
| •••••••• | Target 2015 Composite Index | 9.36 | 8.76 | 5.50 | 17,085 |
| – – – – | Mixed-Asset Target 2015 Funds | | | | |
| |
| | MSCI Average US Broad Market Index | 15.02 8.32 | 16.42 6.77 | 7.56 3.85 | 20,734 14,593 |
| For a benchmark description, see the Glossary. | | | | |
| Mixed-Asset Target 2015 Funds Average: Derived from data provided by Lipper, a Thomson Reuters Company. | |
See Financial Highlights for dividend and capital gains information.
30
Target Retirement 2015 Fund
Fiscal-Year Total Returns (%): September 30, 2006, Through September 30, 2016
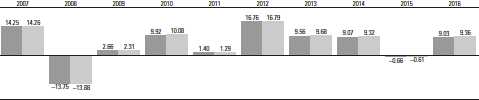
Target Retirement 2015 Fund
Target 2015 Composite Index
For a benchmark description, see the Glossary.
31
Target Retirement 2015 Fund
Financial Statements
Statement of Net Assets
As of September 30, 2016
The fund reports a complete list of its holdings in regulatory filings four times in each fiscal year, at the quarter-ends. For the second and fourth fiscal quarters, the lists appear in the fund’s semiannual and annual reports to shareholders. For the first and third fiscal quarters, the fund files the lists with the Securities and Exchange Commission on Form N-Q. Shareholders can look up the fund’s Forms N-Q on the SEC’s website at sec.gov. Forms N-Q may also be reviewed and copied at the SEC’s Public Reference Room (see the back cover of this report for further information).
| | |
| | | Market |
| | | Value• |
| | Shares | ($000) |
| Investment Companies (100.1%) | | |
| U.S. Stock Fund (27.8%) | | |
| Vanguard Total Stock Market Index Fund Investor Shares | 89,837,792 | 4,867,412 |
| |
| International Stock Fund (18.6%) | | |
| Vanguard Total International Stock Index Fund Investor Shares | 214,378,566 | 3,245,691 |
| |
| U.S. Bond Funds (40.4%) | | |
| 1 Vanguard Total Bond Market II Index Fund Investor Shares | 488,027,054 | 5,387,819 |
| Vanguard Short-Term Inflation-Protected Securities Index Fund Investor Shares | 67,226,063 | 1,669,223 |
| | | 7,057,042 |
| International Bond Fund (13.3%) | | |
| Vanguard Total International Bond Index Fund Investor Shares | 208,280,424 | 2,326,492 |
| Total Investment Companies (Cost $14,061,070) | | 17,496,637 |
| Temporary Cash Investment (0.0%) | | |
| Money Market Fund (0.0%) | | |
| 1 Vanguard Market Liquidity Fund, 0.640% (Cost $5,362) | 53,610 | 5,362 |
| Total Investments (100.1%) (Cost $14,066,432) | | 17,501,999 |
| Other Assets and Liabilities (-0.1%) | | |
| Other Assets | | 94,491 |
| Liabilities | | (117,887) |
| | | (23,396) |
| Net Assets (100%) | | |
| Applicable to 1,150,922,276 outstanding $.001 par value shares of | | |
| beneficial interest (unlimited authorization) | | 17,478,603 |
| Net Asset Value Per Share | | $15.19 |
32
| |
| Target Retirement 2015 Fund | |
| |
| |
| |
| |
| | Amount |
| | ($000) |
| Statement of Assets and Liabilities | |
| Assets | |
| Investments in Securities, at Value—Affiliated Vanguard Funds | 17,501,999 |
| Receivables for Investment Securities Sold | 72,540 |
| Receivables for Accrued Income | 12,256 |
| Receivables for Capital Shares Issued | 9,695 |
| Total Assets | 17,596,490 |
| Liabilities | |
| Payables for Investment Securities Purchased | 12,130 |
| Payables for Capital Shares Redeemed | 105,757 |
| Total Liabilities | 117,887 |
| Net Assets | 17,478,603 |
| |
| |
| At September 30, 2016, net assets consisted of: | |
| | Amount |
| | ($000) |
| Paid-in Capital | 13,524,059 |
| Undistributed Net Investment Income | 211,340 |
| Accumulated Net Realized Gains | 307,637 |
| Unrealized Appreciation (Depreciation) | 3,435,567 |
| Net Assets | 17,478,603 |
• See Note A in Notes to Financial Statements.
1 Affiliated fund available only to Vanguard funds and certain trusts and accounts managed by Vanguard. Rate shown for Vanguard Market Liquidity Fund is the 7-day yield.
See accompanying Notes, which are an integral part of the Financial Statements.
33
| |
| Target Retirement 2015 Fund | |
| |
| |
| Statement of Operations | |
| |
| | Year Ended |
| | September 30, 2016 |
| | ($000) |
| Investment Income | |
| Income | |
| Income Distributions Received from Affiliated Funds | 349,369 |
| Other Income | 126 |
| Net Investment Income—Note B | 349,495 |
| Realized Net Gain (Loss) | |
| Capital Gain Distributions Received from Affiliated Funds | 8,381 |
| Affiliated Investment Securities Sold | 502,399 |
| Realized Net Gain (Loss) | 510,780 |
| Change in Unrealized Appreciation (Depreciation) of Investment Securities | 681,539 |
| Net Increase (Decrease) in Net Assets Resulting from Operations | 1,541,814 |
See accompanying Notes, which are an integral part of the Financial Statements.
34
| | |
| Target Retirement 2015 Fund | | |
| |
| |
| Statement of Changes in Net Assets | | |
| |
| | Year Ended September 30, |
| | 2016 | 2015 |
| | ($000) | ($000) |
| Increase (Decrease) in Net Assets | | |
| Operations | | |
| Net Investment Income | 349,495 | 424,842 |
| Realized Net Gain (Loss) | 510,780 | 960,256 |
| Change in Unrealized Appreciation (Depreciation) | 681,539 | (1,454,776) |
| Net Increase (Decrease) in Net Assets Resulting from Operations | 1,541,814 | (69,678) |
| Distributions | | |
| Net Investment Income | (358,456) | (397,934) |
| Realized Capital Gain1 | (835,597) | (235,397) |
| Total Distributions | (1,194,053) | (633,331) |
| Capital Share Transactions | | |
| Issued | 3,035,107 | 4,554,230 |
| Issued in Lieu of Cash Distributions | 1,169,881 | 621,730 |
| Redeemed | (5,932,510) | (7,355,716) |
| Net Increase (Decrease) from Capital Share Transactions | (1,727,522) | (2,179,756) |
| Total Increase (Decrease) | (1,379,761) | (2,882,765) |
| Net Assets | | |
| Beginning of Period | 18,858,364 | 21,741,129 |
| End of Period2 | 17,478,603 | 18,858,364 |
1 Includes fiscal 2016 and 2015 short-term gain distributions totaling $10,790,000 and $35,029,000, respectively. Short-term gain distributions are treated as ordinary income dividends for tax purposes.
2 Net Assets—End of Period includes undistributed (overdistributed) net investment income of $211,340,000 and $255,250,000.
See accompanying Notes, which are an integral part of the Financial Statements.
35
| | | | | |
| Target Retirement 2015 Fund | | | | | |
| |
| |
| Financial Highlights | | | | | |
| |
| |
| For a Share Outstanding | | | Year Ended September 30, |
| Throughout Each Period | 2016 | 2015 | 2014 | 2013 | 2012 |
| Net Asset Value, Beginning of Period | $14.90 | $15.44 | $14.49 | $13.54 | $11.91 |
| Investment Operations | | | | | |
| Net Investment Income | .311 | .327 | .300 | .298 | .327 |
| Capital Gain Distributions Received | .007 | .018 | .002 | .039 | .053 |
| Net Realized and Unrealized Gain (Loss) | | | | | |
| on Investments | .968 | (.433) | .996 | .929 | 1.583 |
| Total from Investment Operations | 1.286 | (.088) | 1.298 | 1.266 | 1.963 |
| Distributions | | | | | |
| Dividends from Net Investment Income | (. 299) | (. 284) | (. 261) | (. 298) | (. 313) |
| Distributions from Realized Capital Gains | (. 697) | (.168) | (. 087) | (. 018) | (. 020) |
| Total Distributions | (. 996) | (. 452) | (. 348) | (. 316) | (. 333) |
| Net Asset Value, End of Period | $15.19 | $14.90 | $15.44 | $14.49 | $13.54 |
| |
| Total Return1 | 9.03% | -0.66% | 9.07% | 9.56% | 16.76% |
| |
| Ratios/Supplemental Data | | | | | |
| Net Assets, End of Period (Millions) | $17,479 | $18,858 | $21,741 | $19,739 | $16,838 |
| Ratio of Total Expenses to | | | | | |
| Average Net Assets | — | — | — | — | — |
| Acquired Fund Fees and Expenses | 0.14% | 0.14% | 0.16% | 0.16% | 0.16% |
| Ratio of Net Investment Income to | | | | | |
| Average Net Assets | 1.96% | 1.95% | 1.99% | 2.17% | 2.59% |
| Portfolio Turnover Rate | 9% | 16% | 10% | 26% | 13% |
1 Total returns do not include account service fees that may have applied in the periods shown. Fund prospectuses provide information about any applicable account service fees.
See accompanying Notes, which are an integral part of the Financial Statements.
36
Target Retirement 2015 Fund
Notes to Financial Statements
Vanguard Target Retirement 2015 Fund is registered under the Investment Company Act of 1940 as an open-end investment company, or mutual fund. The fund follows a balanced investment strategy by investing in selected Vanguard funds to achieve its targeted allocation of assets to U.S. and international stocks, and U.S. and international bonds. Financial statements and other information about each underlying fund are available on vanguard.com.
A. The following significant accounting policies conform to generally accepted accounting principles for U.S. investment companies. The fund consistently follows such policies in preparing its financial statements.
1. Security Valuation: Investments are valued at the net asset value of each underlying Vanguard fund determined as of the close of the New York Stock Exchange (generally 4 p.m., Eastern time) on the valuation date.
2. Federal Income Taxes: The fund intends to continue to qualify as a regulated investment company and distribute all of its taxable income. Management has analyzed the fund’s tax positions taken for all open federal income tax years (September 30, 2013–2016), and has concluded that no provision for federal income tax is required in the fund’s financial statements.
3. Distributions: Distributions to shareholders are recorded on the ex-dividend date.
4. Credit Facility: The fund and certain other funds managed by The Vanguard Group (“Vanguard”) participate in a $3.1 billion committed credit facility provided by a syndicate of lenders pursuant to a credit agreement that may be renewed annually; each fund is individually liable for its borrowings, if any, under the credit facility. Borrowings may be utilized for temporary and emergency purposes, and are subject to the fund’s regulatory and contractual borrowing restrictions. The participating funds are charged administrative fees and an annual commitment fee of 0.10% of the undrawn amount of the facility; these fees are allocated to the funds based on a method approved by the fund’s board of trustees and borne by the funds in which the fund invests (see Note B). Any borrowings under this facility bear interest at a rate based upon the higher of the one-month London Interbank Offered Rate, federal funds effective rate, or overnight bank funding rate plus an agreed-upon spread.
The fund had no borrowings outstanding at September 30, 2016, or at any time during the period then ended.
5. Other: Income and capital gain distributions received are recorded on the ex-dividend date. Security transactions are accounted for on the date securities are bought or sold. Costs used to determine realized gains (losses) on the sale of investment securities are those of the specific securities sold.
B. In accordance with the terms of a Funds’ Service Agreement (the “FSA”) between Vanguard and the fund, Vanguard furnishes to the fund investment advisory, corporate management, administrative, marketing, and distribution services at Vanguard’s cost of operations (as defined by the FSA). These costs of operations are allocated to the fund based on methods and guidelines approved by the board of trustees. The FSA provides that expenses otherwise allocable to Vanguard funds-of-funds may be reduced or eliminated to the extent of savings realized by the underlying Vanguard funds by virtue of being part of a fund-of-funds. Accordingly, all expenses for services provided by Vanguard to the fund and all other expenses incurred by the fund during the period ended September 30, 2016, were borne by the underlying Vanguard funds in which the fund invests. The fund’s trustees and officers are also trustees and officers, respectively, of the underlying Vanguard funds, as well as directors and employees, respectively, of Vanguard.
37
Target Retirement 2015 Fund
C. Various inputs may be used to determine the value of the fund’s investments. These inputs are summarized in three broad levels for financial statement purposes. The inputs or methodologies used to value securities are not necessarily an indication of the risk associated with investing in those securities.
Level 1—Quoted prices in active markets for identical securities.
Level 2—Other significant observable inputs (including quoted prices for similar securities, interest rates, prepayment speeds, credit risk, etc.).
Level 3—Significant unobservable inputs (including the fund’s own assumptions used to determine the fair value of investments).
At September 30, 2016, 100% of the market value of the fund’s investments was determined based on Level 1 inputs.
D. Distributions are determined on a tax basis and may differ from net investment income and realized capital gains for financial reporting purposes. Differences may be permanent or temporary. Permanent differences are reclassified among capital accounts in the financial statements to reflect their tax character. Temporary differences arise when certain items of income, expense, gain, or loss are recognized in different periods for financial statement and tax purposes. These differences will reverse at some time in the future. Differences in classification may also result from the treatment of short-term gains as ordinary income for tax purposes.
The fund used a tax accounting practice to treat a portion of the price of capital shares redeemed during the year as distributions from net investment income and realized capital gains. Accordingly, the fund has reclassified $34,949,000 from undistributed net investment income, and $113,111,000 from accumulated net realized gains, to paid-in capital.
For tax purposes, at September 30, 2016, the fund had $210,885,000 of ordinary income and $308,092,000 of long-term capital gains available for distribution.
At September 30, 2016, the cost of investment securities for tax purposes was $14,066,432,000. Net unrealized appreciation of investment securities for tax purposes was $3,435,567,000, consisting entirely of unrealized gains on securities that had risen in value since their purchase.
E. Capital shares issued and redeemed were:
| | |
| | Year Ended September 30, |
| | 2016 | 2015 |
| | Shares | Shares |
| | (000) | (000) |
| Issued | 206,486 | 293,455 |
| Issued in Lieu of Cash Distributions | 81,639 | 40,425 |
| Redeemed | (403,033) | (476,492) |
| Net Increase (Decrease) in Shares Outstanding | (114,908) | (142,612) |
38
Target Retirement 2015 Fund
| | | | | | |
| F. Transactions during the period in affiliated underlying Vanguard funds were as follows: | |
| | | | Current Period Transactions | |
| | Sept. 30, | | Proceeds | | | Sept. 30, |
| | 2015 | | from | | Capital Gain | 2016 |
| | Market | Purchases | Securities | | Distributions | Market |
| | Value | at Cost | Sold | Income | Received | Value |
| | ($000) | ($000) | ($000) | ($000) | ($000) | ($000) |
| Vanguard Market Liquidity Fund | — | NA1 | NA1 | 6 | — | 5,362 |
| Vanguard Short-Term Inflation- | | | | | | |
| Protected Securities Index Fund | 1,611,487 | 165,132 | 145,946 | — | — | 1,669,223 |
| Vanguard Total Bond Market II | | | | | | |
| Index Fund | 5,651,159 | 558,042 | 955,168 | 126,665 | 8,381 | 5,387,819 |
| Vanguard Total International | | | | | | |
| Bond Index Fund | 2,410,427 | 169,764 | 381,360 | 35,174 | — | 2,326,492 |
| Vanguard Total International | | | | | | |
| Stock Index Fund | 3,664,850 | 255,195 | 912,791 | 94,069 | — | 3,245,691 |
| Vanguard Total Stock Market | | | | | | |
| Index Fund | 5,530,138 | 416,530 | 1,724,760 | 93,455 | — | 4,867,412 |
| Total | 18,868,061 | 1,564,663 | 4,120,025 | 349,369 | 8,381 | 17,501,999 |
| 1 Not applicable—purchases and sales are for temporary cash investment purposes. | | | |
G. Management has determined that no material events or transactions occurred subsequent to September 30, 2016, that would require recognition or disclosure in these financial statements.
39
Target Retirement 2020 Fund
Fund Profile
As of September 30, 2016
| |
| Total Fund Characteristics | |
| Ticker Symbol | VTWNX |
| 30-Day SEC Yield | 2.02% |
| Acquired Fund Fees and Expenses1 | 0.14% |
| |
| Allocation to Underlying Vanguard Funds | |
| Vanguard Total Stock Market Index Fund | |
| Investor Shares | 34.5% |
| Vanguard Total Bond Market II Index Fund | |
| Investor Shares | 28.5 |
| Vanguard Total International Stock Index | |
| Fund Investor Shares | 22.9 |
| Vanguard Total International Bond Index | |
| Fund Investor Shares | 12.0 |
| Vanguard Short-Term Inflation-Protected | |
| Securities Index Fund Investor Shares | 2.1 |
| | |
| Total Fund Volatility Measures | |
| | Target 2020 | MSCI US |
| | Composite | Broad Market |
| | Index | Index |
| R-Squared | 1.00 | 0.94 |
| Beta | 0.98 | 0.58 |
These measures show the degree and timing of the fund’s fluctuations compared with the indexes over 36 months.
Fund Asset Allocation
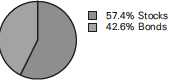
1 This figure—drawn from the prospectus dated January 28, 2016—represents an estimate of the weighted average of the expense ratios and any transaction fees charged by the underlying mutual funds (the ”acquired” funds) in which the Target Retirement 2020 Fund invests. The fund does not charge any expenses or fees of its own. For the fiscal year ended September 30, 2016, the acquired fund fees and expenses were 0.14%.
40
Target Retirement 2020 Fund
Performance Summary
All of the returns in this report represent past performance, which is not a guarantee of future results that may be achieved by the fund. (Current performance may be lower or higher than the performance data cited. For performance data current to the most recent month-end, visit our website at vanguard.com/performance.) Note, too, that both investment returns and principal value can fluctuate widely, so an investor’s shares, when sold, could be worth more or less than their original cost. The returns shown do not reflect taxes that a shareholder would pay on fund distributions or on the sale of fund shares.
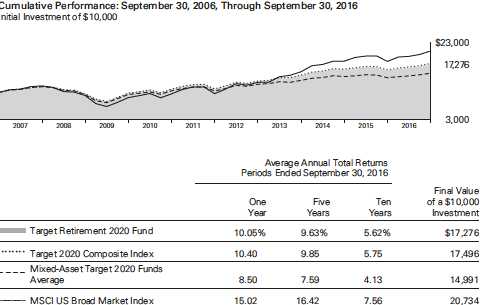
For a benchmark description, see the Glossary.
Mixed-Asset Target 2020 Funds Average: Derived from data provided by Lipper, a Thomson Reuters Company.
See Financial Highlights for dividend and capital gains information.
41
Target Retirement 2020 Fund
Fiscal-Year Total Returns (%): September 30, 2006, Through September 30, 2016
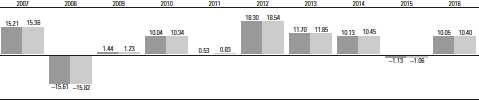
Target Retirement 2020 Fund
Target 2020 Composite Index
For a benchmark description, see the Glossary.
42
Target Retirement 2020 Fund
Financial Statements
Statement of Net Assets
As of September 30, 2016
The fund reports a complete list of its holdings in regulatory filings four times in each fiscal year, at the quarter-ends. For the second and fourth fiscal quarters, the lists appear in the fund’s semiannual and annual reports to shareholders. For the first and third fiscal quarters, the fund files the lists with the Securities and Exchange Commission on Form N-Q. Shareholders can look up the fund’s Forms N-Q on the SEC’s website at sec.gov. Forms N-Q may also be reviewed and copied at the SEC’s Public Reference Room (see the back cover of this report for further information).
| | |
| | | Market |
| | | Value• |
| | Shares | ($000) |
| Investment Companies (100.1%) | | |
| U.S. Stock Fund (34.5%) | | |
| Vanguard Total Stock Market Index Fund Investor Shares | 175,268,719 | 9,496,059 |
| |
| International Stock Fund (22.9%) | | |
| Vanguard Total International Stock Index Fund Investor Shares | 416,947,586 | 6,312,587 |
| |
| U.S. Bond Funds (30.7%) | | |
| 1 Vanguard Total Bond Market II Index Fund Investor Shares | 712,011,296 | 7,860,605 |
| Vanguard Short-Term Inflation-Protected Securities Index Fund Investor Shares | 23,680,542 | 587,988 |
| | | 8,448,593 |
| International Bond Fund (12.0%) | | |
| Vanguard Total International Bond Index Fund Investor Shares | 296,373,774 | 3,310,495 |
| Total Investment Companies (Cost $22,376,544) | | 27,567,734 |
| Temporary Cash Investment (0.1%) | | |
| Money Market Fund (0.1%) | | |
| 1 Vanguard Market Liquidity Fund, 0.640% (Cost $24,057) | 240,548 | 24,057 |
| Total Investments (100.2%) (Cost $22,400,601) | | 27,591,791 |
| Other Assets and Liabilities (-0.2%) | | |
| Other Assets | | 166,144 |
| Liabilities | | (215,717) |
| | | (49,573) |
| Net Assets (100%) | | |
| Applicable to 946,651,537 outstanding $.001 par value shares of | | |
| beneficial interest (unlimited authorization) | | 27,542,218 |
| Net Asset Value Per Share | | $29.09 |
43
| |
| Target Retirement 2020 Fund | |
| |
| |
| |
| |
| | Amount |
| | ($000) |
| Statement of Assets and Liabilities | |
| Assets | |
| Investments in Securities, at Value-Affiliated Vanguard Funds | 27,591,791 |
| Receivables for Investment Securities Sold | 120,101 |
| Receivables for Accrued Income | 17,964 |
| Receivables for Capital Shares Issued | 28,079 |
| Total Assets | 27,757,935 |
| Liabilities | |
| Payables for Investment Securities Purchased | 21,577 |
| Payables for Capital Shares Redeemed | 194,140 |
| Total Liabilities | 215,717 |
| Net Assets | 27,542,218 |
| |
| |
| At September 30, 2016, net assets consisted of: | |
| | Amount |
| | ($000) |
| Paid-in Capital | 21,805,598 |
| Undistributed Net Investment Income | 350,668 |
| Accumulated Net Realized Gains | 194,762 |
| Unrealized Appreciation (Depreciation) | 5,191,190 |
| Net Assets | 27,542,218 |
• See Note A in Notes to Financial Statements.
1 Affiliated fund available only to Vanguard funds and certain trusts and accounts managed by Vanguard. Rate shown for Vanguard Market Liquidity Fund is the 7-day yield.
See accompanying Notes, which are an integral part of the Financial Statements.
44
| |
| Target Retirement 2020 Fund | |
| |
| |
| Statement of Operations | |
| |
| | Year Ended |
| | September 30, 2016 |
| | ($000) |
| Investment Income | |
| Income | |
| Income Distributions Received from Affiliated Funds | 568,202 |
| Other Income | 388 |
| Net Investment Income—Note B | 568,590 |
| Realized Net Gain (Loss) | |
| Capital Gain Distributions Received from Affiliated Funds | 11,341 |
| Affiliated Investment Securities Sold | 391,187 |
| Realized Net Gain (Loss) | 402,528 |
| Change in Unrealized Appreciation (Depreciation) of Investment Securities | 1,587,346 |
| Net Increase (Decrease) in Net Assets Resulting from Operations | 2,558,464 |
See accompanying Notes, which are an integral part of the Financial Statements.
45
| | |
| Target Retirement 2020 Fund | | |
| |
| |
| Statement of Changes in Net Assets | | |
| |
| | Year Ended September 30, |
| | 2016 | 2015 |
| | ($000) | ($000) |
| Increase (Decrease) in Net Assets | | |
| Operations | | |
| Net Investment Income | 568,590 | 613,993 |
| Realized Net Gain (Loss) | 402,528 | 438,274 |
| Change in Unrealized Appreciation (Depreciation) | 1,587,346 | (1,397,892) |
| Net Increase (Decrease) in Net Assets Resulting from Operations | 2,558,464 | (345,625) |
| Distributions | | |
| Net Investment Income | (550,582) | (534,873) |
| Realized Capital Gain1 | (498,411) | (40,536) |
| Total Distributions | (1,048,993) | (575,409) |
| Capital Share Transactions | | |
| Issued | 6,393,675 | 8,676,675 |
| Issued in Lieu of Cash Distributions | 1,028,442 | 564,612 |
| Redeemed | (8,082,609) | (9,114,649) |
| Net Increase (Decrease) from Capital Share Transactions | (660,492) | 126,638 |
| Total Increase (Decrease) | 848,979 | (794,396) |
| Net Assets | | |
| Beginning of Period | 26,693,239 | 27,487,635 |
| End of Period2 | 27,542,218 | 26,693,239 |
1 Includes fiscal 2016 and 2015 short-term gain distributions totaling $47,512,000 and $36,581,000, respectively. Short-term gain distributions are treated as ordinary income dividends for tax purposes.
2 Net Assets—End of Period includes undistributed (overdistributed) net investment income of $350,668,000 and $389,519,000.
See accompanying Notes, which are an integral part of the Financial Statements.
46
| | | | | |
| Target Retirement 2020 Fund | | | | | |
| |
| |
| Financial Highlights | | | | | |
| |
| |
| For a Share Outstanding | | | Year Ended September 30, |
| Throughout Each Period | 2016 | 2015 | 2014 | 2013 | 2012 |
| Net Asset Value, Beginning of Period | $27.52 | $28.40 | $26.26 | $24.04 | $20.83 |
| Investment Operations | | | | | |
| Net Investment Income | .619 | .662 | .577 | .528 | .569 |
| Capital Gain Distributions Received | .012 | .026 | .004 | .047 | .079 |
| Net Realized and Unrealized Gain (Loss) | | | | | |
| on Investments | 2.065 | (.946) | 2.054 | 2.179 | 3.106 |
| Total from Investment Operations | 2.696 | (.298) | 2.635 | 2.754 | 3.754 |
| Distributions | | | | | |
| Dividends from Net Investment Income | (. 591) | (. 541) | (. 484) | (. 508) | (. 513) |
| Distributions from Realized Capital Gains | (. 535) | (. 041) | (. 011) | (. 026) | (. 031) |
| Total Distributions | (1.126) | (.582) | (.495) | (.534) | (.544) |
| Net Asset Value, End of Period | $29.09 | $27.52 | $28.40 | $26.26 | $24.04 |
| |
| Total Return1 | 10.05% | -1.13% | 10.13% | 11.70% | 18.30% |
| |
| Ratios/Supplemental Data | | | | | |
| Net Assets, End of Period (Millions) | $27,542 | $26,693 | $27,488 | $21,785 | $16,078 |
| Ratio of Total Expenses to | | | | | |
| Average Net Assets | — | — | — | — | — |
| Acquired Fund Fees and Expenses | 0.14% | 0.14% | 0.16% | 0.16% | 0.16% |
| Ratio of Net Investment Income to | | | | | |
| Average Net Assets | 2.14% | 2.07% | 2.14% | 2.23% | 2.62% |
| Portfolio Turnover Rate | 15% | 25% | 7% | 17% | 8% |
1 Total returns do not include account service fees that may have applied in the periods shown. Fund prospectuses provide information about any applicable account service fees.
See accompanying Notes, which are an integral part of the Financial Statements.
47
Target Retirement 2020 Fund
Notes to Financial Statements
Vanguard Target Retirement 2020 Fund is registered under the Investment Company Act of 1940 as an open-end investment company, or mutual fund. The fund follows a balanced investment strategy by investing in selected Vanguard funds to achieve its targeted allocation of assets to U.S. and international stocks, and U.S. and international bonds. Financial statements and other information about each underlying fund are available on vanguard.com.
A. The following significant accounting policies conform to generally accepted accounting principles for U.S. investment companies. The fund consistently follows such policies in preparing its financial statements.
1. Security Valuation: Investments are valued at the net asset value of each underlying Vanguard fund determined as of the close of the New York Stock Exchange (generally 4 p.m., Eastern time) on the valuation date.
2. Federal Income Taxes: The fund intends to continue to qualify as a regulated investment company and distribute all of its taxable income. Management has analyzed the fund’s tax positions taken for all open federal income tax years (September 30, 2013–2016), and has concluded that no provision for federal income tax is required in the fund’s financial statements.
3. Distributions: Distributions to shareholders are recorded on the ex-dividend date.
4. Credit Facility: The fund and certain other funds managed by The Vanguard Group (“Vanguard”) participate in a $3.1 billion committed credit facility provided by a syndicate of lenders pursuant to a credit agreement that may be renewed annually; each fund is individually liable for its borrowings, if any, under the credit facility. Borrowings may be utilized for temporary and emergency purposes, and are subject to the fund’s regulatory and contractual borrowing restrictions. The participating funds are charged administrative fees and an annual commitment fee of 0.10% of the undrawn amount of the facility; these fees are allocated to the funds based on a method approved by the fund’s board of trustees and borne by the funds in which the fund invests (see Note B). Any borrowings under this facility bear interest at a rate based upon the higher of the one-month London Interbank Offered Rate, federal funds effective rate, or overnight bank funding rate plus an agreed-upon spread.
The fund had no borrowings outstanding at September 30, 2016, or at any time during the period then ended.
5. Other: Income and capital gain distributions received are recorded on the ex-dividend date. Security transactions are accounted for on the date securities are bought or sold. Costs used to determine realized gains (losses) on the sale of investment securities are those of the specific securities sold.
B. In accordance with the terms of a Funds’ Service Agreement (the “FSA”) between Vanguard and the fund, Vanguard furnishes to the fund investment advisory, corporate management, administrative, marketing, and distribution services at Vanguard’s cost of operations (as defined by the FSA). These costs of operations are allocated to the fund based on methods and guidelines approved by the board of trustees. The FSA provides that expenses otherwise allocable to Vanguard funds-of-funds may be reduced or eliminated to the extent of savings realized by the underlying Vanguard funds by virtue of being part of a fund-of-funds. Accordingly, all expenses for services provided by Vanguard to the fund and all other expenses incurred by the fund during the period ended September 30, 2016, were borne by the underlying Vanguard funds in which the fund invests. The fund’s trustees and officers are also trustees and officers, respectively, of the underlying Vanguard funds, as well as directors and employees, respectively, of Vanguard.
48
Target Retirement 2020 Fund
C. Various inputs may be used to determine the value of the fund’s investments. These inputs are summarized in three broad levels for financial statement purposes. The inputs or methodologies used to value securities are not necessarily an indication of the risk associated with investing in those securities.
Level 1—Quoted prices in active markets for identical securities.
Level 2—Other significant observable inputs (including quoted prices for similar securities, interest rates, prepayment speeds, credit risk, etc.).
Level 3—Significant unobservable inputs (including the fund’s own assumptions used to determine the fair value of investments).
At September 30, 2016, 100% of the market value of the fund’s investments was determined based on Level 1 inputs.
D. Distributions are determined on a tax basis and may differ from net investment income and realized capital gains for financial reporting purposes. Differences may be permanent or temporary. Permanent differences are reclassified among capital accounts in the financial statements to reflect their tax character. Temporary differences arise when certain items of income, expense, gain, or loss are recognized in different periods for financial statement and tax purposes. These differences will reverse at some time in the future. Differences in classification may also result from the treatment of short-term gains as ordinary income for tax purposes.
The fund used a tax accounting practice to treat a portion of the price of capital shares redeemed during the year as distributions from net investment income and realized capital gains. Accordingly, the fund has reclassified $56,859,000 from undistributed net investment income, and $70,450,000 from accumulated net realized gains, to paid-in capital.
For tax purposes, at September 30, 2016, the fund had $350,795,000 of ordinary income and $194,635,000 of long-term capital gains available for distribution.
At September 30, 2016, the cost of investment securities for tax purposes was $22,400,601,000. Net unrealized appreciation of investment securities for tax purposes was $5,191,190,000, consisting of unrealized gains of $5,210,657,000 on securities that had risen in value since their purchase and $19,467,000 in unrealized losses on securities that had fallen in value since their purchase.
| E. | Capital shares issued and redeemed were: |
| | |
| | Year Ended September 30, |
| | 2016 | 2015 |
| | Shares | Shares |
| | (000) | (000) |
| Issued | 229,362 | 300,789 |
| Issued in Lieu of Cash Distributions | 37,534 | 19,693 |
| Redeemed | (290,081) | (318,675) |
| Net Increase (Decrease) in Shares Outstanding | (23,185) | 1,807 |
49
Target Retirement 2020 Fund
| | | | | | |
| F. Transactions during the period in affiliated underlying Vanguard funds were as follows: | |
| | | | Current Period Transactions | |
| | Sept. 30, | | Proceeds | | | Sept. 30, |
| | 2015 | | from | | Capital Gain | 2016 |
| | Market | Purchases | Securities | | Distributions | Market |
| | Value | at Cost | Sold | Income | Received | Value |
| | ($000) | ($000) | ($000) | ($000) | ($000) | ($000) |
| Vanguard Market Liquidity Fund | 3,128 | NA1 | NA1 | 27 | — | 24,057 |
| Vanguard Short- Term Inflation- | | | | | | |
| Protected Securities Index Fund | 121,747 | 468,249 | 11,171 | — | — | 587,988 |
| Vanguard Total Bond Market II | | | | | | |
| Index Fund | 7,500,945 | 1,480,623 | 1,309,077 | 175,704 | 11,341 | 7,860,605 |
| Vanguard Total International | | | | | | |
| Bond Index Fund | 3,197,336 | 285,732 | 347,903 | 48,108 | — | 3,310,495 |
| Vanguard Total International | | | | | | |
| Stock Index Fund | 6,286,631 | 653,587 | 1,064,451 | 173,317 | — | 6,312,587 |
| Vanguard Total Stock Market | | | | | | |
| Index Fund | 9,578,982 | 1,010,040 | 2,262,069 | 171,046 | — | 9,496,059 |
| Total | 26,688,769 | 3,898,231 | 4,994,671 | 568,202 | 11,341 | 27,591,791 |
| 1 Not applicable—purchased and sales are for temporary cash investment purposes. | | | |
G. Management has determined that no material events or transactions occurred subsequent to September 30, 2016, that would require recognition or disclosure in these financial statements.
50
Target Retirement 2025 Fund
Fund Profile
As of September 30, 2016
| |
| Total Fund Characteristics | |
| |
| Ticker Symbol | VTTVX |
| 30-Day SEC Yield | 2.06% |
| Acquired Fund Fees and Expenses1 | 0.15% |
| |
| Allocation to Underlying Vanguard Funds | |
| Vanguard Total Stock Market Index Fund | |
| Investor Shares | 39.3% |
| Vanguard Total International Stock Index | |
| Fund Investor Shares | 26.1 |
| Vanguard Total Bond Market II Index Fund | |
| Investor Shares | 24.5 |
| Vanguard Total International Bond Index | |
| Fund Investor Shares | 10.1 |
| | |
| Total Fund Volatility Measures | |
| | Target 2025 | MSCI US |
| | Composite | Broad Market |
| | Index | Index |
| R-Squared | 1.00 | 0.95 |
| Beta | 0.98 | 0.65 |
These measures show the degree and timing of the fund’s fluctuations compared with the indexes over 36 months.
Fund Asset Allocation
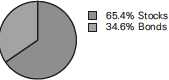
1 This figure—drawn from the prospectus dated January 28, 2016—represents an estimate of the weighted average of the expense ratios and any transaction fees charged by the underlying mutual funds (the ”acquired” funds) in which the Target Retirement 2025 Fund invests. The fund does not charge any expenses or fees of its own. For the fiscal year ended September 30, 2016, the acquired fund fees and expenses were 0.14%.
51
Target Retirement 2025 Fund
Performance Summary
All of the returns in this report represent past performance, which is not a guarantee of future results that may be achieved by the fund. (Current performance may be lower or higher than the performance data cited. For performance data current to the most recent month-end, visit our website at vanguard.com/performance.) Note, too, that both investment returns and principal value can fluctuate widely, so an investor’s shares, when sold, could be worth more or less than their original cost. The returns shown do not reflect taxes that a shareholder would pay on fund distributions or on the sale of fund shares.
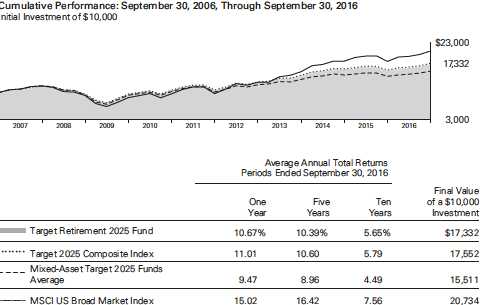
For a benchmark description, see the Glossary.
Mixed-Asset Target 2025 Funds Average: Derived from data provided by Lipper, a Thomson Reuters Company.
See Financial Highlights for dividend and capital gains information.
52
Target Retirement 2025 Fund
Fiscal-Year Total Returns (%): September 30, 2006, Through September 30, 2016
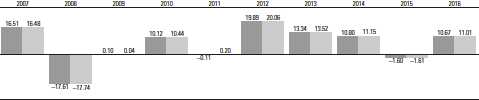
Target Retirement 2025 Fund
Target 2025 Composite Index
For a benchmark description, see the Glossary.
53
Target Retirement 2025 Fund
Financial Statements
Statement of Net Assets
As of September 30, 2016
The fund reports a complete list of its holdings in regulatory filings four times in each fiscal year, at the quarter-ends. For the second and fourth fiscal quarters, the lists appear in the fund’s semiannual and annual reports to shareholders. For the first and third fiscal quarters, the fund files the lists with the Securities and Exchange Commission on Form N-Q. Shareholders can look up the fund’s Forms N-Q on the SEC’s website at sec.gov. Forms N-Q may also be reviewed and copied at the SEC’s Public Reference Room (see the back cover of this report for further information).
| | |
| | | Market |
| | | Value• |
| | Shares | ($000) |
| Investment Companies (100.1%) | | |
| U.S. Stock Fund (39.3%) | | |
| Vanguard Total Stock Market Index Fund Investor Shares | 230,009,332 | 12,461,906 |
| |
| International Stock Fund (26.1%) | | |
| Vanguard Total International Stock Index Fund Investor Shares | 547,547,698 | 8,289,872 |
| |
| U.S. Bond Fund (24.5%) | | |
| 1 Vanguard Total Bond Market II Index Fund Investor Shares | 702,847,112 | 7,759,432 |
| |
| International Bond Fund (10.2%) | | |
| Vanguard Total International Bond Index Fund Investor Shares | 288,193,079 | 3,219,117 |
| Total Investment Companies (Cost $24,884,402) | | 31,730,327 |
| Temporary Cash Investment (0.0%) | | |
| Money Market Fund (0.0%) | | |
| 1 Vanguard Market Liquidity Fund, 0.640% (Cost $4,263) | 42,629 | 4,263 |
| Total Investments (100.1%) (Cost $24,888,665) | | 31,734,590 |
| Other Assets and Liabilities (-0.1%) | | |
| Other Assets | | 225,435 |
| Liabilities | | (253,591) |
| | | (28,156) |
| Net Assets (100%) | | |
| Applicable to 1,891,088,197 outstanding $.001 par value shares of | | |
| beneficial interest (unlimited authorization) | | 31,706,434 |
| Net Asset Value Per Share | | $16.77 |
54
| |
| Target Retirement 2025 Fund | |
| |
| |
| |
| |
| | Amount |
| | ($000) |
| Statement of Assets and Liabilities | |
| Assets | |
| Investments in Securities, at Value—Affiliated Vanguard Funds | 31,734,590 |
| Receivables for Investment Securities Sold | 185,441 |
| Receivables for Accrued Income | 17,633 |
| Receivables for Capital Shares Issued | 22,361 |
| Total Assets | 31,960,025 |
| Liabilities | |
| Payables for Investment Securities Purchased | 20,353 |
| Payables for Capital Shares Redeemed | 233,238 |
| Total Liabilities | 253,591 |
| Net Assets | 31,706,434 |
| |
| |
| At September 30, 2016, net assets consisted of: | |
| | Amount |
| | ($000) |
| Paid-in Capital | 24,251,155 |
| Undistributed Net Investment Income | 410,138 |
| Accumulated Net Realized Gains | 199,216 |
| Unrealized Appreciation (Depreciation) | 6,845,925 |
| Net Assets | 31,706,434 |
• See Note A in Notes to Financial Statements.
1 Affiliated fund available only to Vanguard funds and certain trusts and accounts managed by Vanguard. Rate shown for Vanguard Market Liquidity Fund is the 7-day yield.
See accompanying Notes, which are an integral part of the Financial Statements.
55
| |
| Target Retirement 2025 Fund | |
| |
| |
| Statement of Operations | |
| |
| | Year Ended |
| | September 30, 2016 |
| | ($000) |
| Investment Income | |
| Income | |
| Income Distributions Received from Affiliated Funds | 661,667 |
| Other Income | 423 |
| Net Investment Income—Note B | 662,090 |
| Realized Net Gain (Loss) | |
| Capital Gain Distributions Received from Affiliated Funds | 10,684 |
| Affiliated Investment Securities Sold | 398,032 |
| Realized Net Gain (Loss) | 408,716 |
| Change in Unrealized Appreciation (Depreciation) of Investment Securities | 2,032,698 |
| Net Increase (Decrease) in Net Assets Resulting from Operations | 3,103,504 |
See accompanying Notes, which are an integral part of the Financial Statements.
56
| | |
| Target Retirement 2025 Fund | | |
| |
| |
| Statement of Changes in Net Assets | | |
| |
| | Year Ended September 30, |
| | 2016 | 2015 |
| | ($000) | ($000) |
| Increase (Decrease) in Net Assets | | |
| Operations | | |
| Net Investment Income | 662,090 | 694,304 |
| Realized Net Gain (Loss) | 408,716 | 764,620 |
| Change in Unrealized Appreciation (Depreciation) | 2,032,698 | (1,996,620) |
| Net Increase (Decrease) in Net Assets Resulting from Operations | 3,103,504 | (537,696) |
| Distributions | | |
| Net Investment Income | (624,626) | (619,150) |
| Realized Capital Gain1 | (796,306) | (57,685) |
| Total Distributions | (1,420,932) | (676,835) |
| Capital Share Transactions | | |
| Issued | 6,760,157 | 8,666,183 |
| Issued in Lieu of Cash Distributions | 1,393,339 | 664,059 |
| Redeemed | (8,177,173) | (9,496,257) |
| Net Increase (Decrease) from Capital Share Transactions | (23,677) | (166,015) |
| Total Increase (Decrease) | 1,658,895 | (1,380,546) |
| Net Assets | | |
| Beginning of Period | 30,047,539 | 31,428,085 |
| End of Period2 | 31,706,434 | 30,047,539 |
1 Includes fiscal 2016 and 2015 short-term gain distributions totaling $69,403,000 and $40,379,000. Short-term gain distributions are treated as ordinary income dividends for tax purposes.
2 Net Assets—End of Period includes undistributed (overdistributed) net investment income of $410,138,000 and $438,883,000.
See accompanying Notes, which are an integral part of the Financial Statements.
57
| | | | | |
| Target Retirement 2025 Fund | | | | | |
| |
| |
| Financial Highlights | | | | | |
| |
| |
| For a Share Outstanding | | | Year Ended September 30, |
| Throughout Each Period | 2016 | 2015 | 2014 | 2013 | 2012 |
| Net Asset Value, Beginning of Period | $15.90 | $16.50 | $15.18 | $13.70 | $11.71 |
| Investment Operations | | | | | |
| Net Investment Income | . 362 | . 364 | .350 | .316 | .331 |
| Capital Gain Distributions Received | .006 | .012 | .002 | .021 | .036 |
| Net Realized and Unrealized Gain (Loss) | | | | | |
| on Investments | 1.280 | (.624) | 1.272 | 1.451 | 1.927 |
| Total from Investment Operations | 1.648 | (. 248) | 1.624 | 1.788 | 2.294 |
| Distributions | | | | | |
| Dividends from Net Investment Income | (.342) | (. 322) | (.287) | (. 296) | (. 291) |
| Distributions from Realized Capital Gains | (.436) | (.030) | (.017) | (.012) | (. 013) |
| Total Distributions | (.778) | (.352) | (. 304) | (.308) | (.304) |
| Net Asset Value, End of Period | $16.77 | $15.90 | $16.50 | $15.18 | $13.70 |
| |
| Total Return1 | 10.67% | -1.60% | 10.80% | 13.34% | 19.89% |
| |
| Ratios/Supplemental Data | | | | | |
| Net Assets, End of Period (Millions) | $31,706 | $30,048 | $31,428 | $25,642 | $20,022 |
| Ratio of Total Expenses to | | | | | |
| Average Net Assets | — | — | — | — | — |
| Acquired Fund Fees and Expenses | 0.14% | 0.15% | 0.17% | 0.17% | 0.17% |
| Ratio of Net Investment Income to | | | | | |
| Average Net Assets | 2.18% | 2.07% | 2.15% | 2.27% | 2.64% |
| Portfolio Turnover Rate | 15% | 24% | 7% | 16% | 9% |
1 Total returns do not include account service fees that may have applied in the periods shown. Fund prospectuses provide information about any applicable account service fees.
See accompanying Notes, which are an integral part of the Financial Statements.
58
Target Retirement 2025 Fund
Notes to Financial Statements
Vanguard Target Retirement 2025 Fund is registered under the Investment Company Act of 1940 as an open-end investment company, or mutual fund. The fund follows a balanced investment strategy by investing in selected Vanguard funds to achieve its targeted allocation of assets to U.S. and international stocks, and U.S. and international bonds. Financial statements and other information about each underlying fund are available on vanguard.com.
A. The following significant accounting policies conform to generally accepted accounting principles for U.S. investment companies. The fund consistently follows such policies in preparing its financial statements.
1. Security Valuation: Investments are valued at the net asset value of each underlying Vanguard fund determined as of the close of the New York Stock Exchange (generally 4 p.m., Eastern time) on the valuation date.
2. Federal Income Taxes: The fund intends to continue to qualify as a regulated investment company and distribute all of its taxable income. Management has analyzed the fund’s tax positions taken for all open federal income tax years (September 30, 2013–2016), and has concluded that no provision for federal income tax is required in the fund’s financial statements.
3. Distributions: Distributions to shareholders are recorded on the ex-dividend date.
4. Credit Facility: The fund and certain other funds managed by The Vanguard Group (“Vanguard”) participate in a $3.1 billion committed credit facility provided by a syndicate of lenders pursuant to a credit agreement that may be renewed annually; each fund is individually liable for its borrowings, if any, under the credit facility. Borrowings may be utilized for temporary and emergency purposes, and are subject to the fund’s regulatory and contractual borrowing restrictions. The participating funds are charged administrative fees and an annual commitment fee of 0.10% of the undrawn amount of the facility; these fees are allocated to the funds based on a method approved by the fund’s board of trustees and borne by the funds in which the fund invests (see Note B). Any borrowings under this facility bear interest at a rate based upon the higher of the one-month London Interbank Offered Rate, federal funds effective rate, or overnight bank funding rate plus an agreed-upon spread.
The fund had no borrowings outstanding at September 30, 2016, or at any time during the period then ended.
5. Other: Income and capital gain distributions received are recorded on the ex-dividend date. Security transactions are accounted for on the date securities are bought or sold. Costs used to determine realized gains (losses) on the sale of investment securities are those of the specific securities sold.
B. In accordance with the terms of a Funds’ Service Agreement (the “FSA”) between Vanguard and the fund, Vanguard furnishes to the fund investment advisory, corporate management, administrative, marketing, and distribution services at Vanguard’s cost of operations (as defined by the FSA). These costs of operations are allocated to the fund based on methods and guidelines approved by the board of trustees. The FSA provides that expenses otherwise allocable to Vanguard funds-of-funds may be reduced or eliminated to the extent of savings realized by the underlying Vanguard funds by virtue of being part of a fund-of-funds. Accordingly, all expenses for services provided by Vanguard to the fund and all other expenses incurred by the fund during the period ended September 30, 2016, were borne by the underlying Vanguard funds in which the fund invests. The fund’s trustees and officers are also trustees and officers, respectively, of the underlying Vanguard funds, as well as directors and employees, respectively, of Vanguard.
59
Target Retirement 2025 Fund
C. Various inputs may be used to determine the value of the fund’s investments. These inputs are summarized in three broad levels for financial statement purposes. The inputs or methodologies used to value securities are not necessarily an indication of the risk associated with investing in those securities.
Level 1—Quoted prices in active markets for identical securities.
Level 2—Other significant observable inputs (including quoted prices for similar securities, interest rates, prepayment speeds, credit risk, etc.).
Level 3—Significant unobservable inputs (including the fund’s own assumptions used to determine the fair value of investments).
At September 30, 2016, 100% of the market value of the fund’s investments was determined based on Level 1 inputs.
D. Distributions are determined on a tax basis and may differ from net investment income and realized capital gains for financial reporting purposes. Differences may be permanent or temporary. Permanent differences are reclassified among capital accounts in the financial statements to reflect their tax character. Temporary differences arise when certain items of income, expense, gain, or loss are recognized in different periods for financial statement and tax purposes. These differences will reverse at some time in the future. Differences in classification may also result from the treatment of short-term gains as ordinary income for tax purposes.
The fund used a tax accounting practice to treat a portion of the price of capital shares redeemed during the year as distributions from net investment income and realized capital gains. Accordingly, the fund has reclassified $66,209,000 from undistributed net investment income, and $76,667,000 from accumulated net realized gains, to paid-in capital.
For tax purposes, at September 30, 2016, the fund had $409,726,000 of ordinary income and $199,629,000 of long-term capital gains available for distribution.
At September 30, 2016, the cost of investment securities for tax purposes was $24,888,665,000. Net unrealized appreciation of investment securities for tax purposes was $6,845,925,000, consisting of unrealized gains of $6,895,176,000 on securities that had risen in value since their purchase and $49,251,000 in unrealized losses on securities that had fallen in value since their purchase.
| E. | Capital shares issued and redeemed were: |
| | |
| | Year Ended September 30, |
| | 2016 | 2015 |
| | Shares | Shares |
| | (000) | (000) |
| Issued | 422,218 | 516,906 |
| Issued in Lieu of Cash Distributions | 88,242 | 39,836 |
| Redeemed | (509,271) | (571,576) |
| Net Increase (Decrease) in Shares Outstanding | 1,189 | (14,834) |
60
Target Retirement 2025 Fund
| | | | | | |
| F. Transactions during the period in affiliated underlying Vanguard funds were as follows: | |
| | | | Current Period Transactions | |
| | Sept. 30, | | Proceeds | | | Sept. 30, |
| | 2015 | | from | | Capital Gain | 2016 |
| | Market | Purchases | Securities | | Distributions | Market |
| | Value | at Cost | Sold | Income | Received | Value |
| | ($000) | ($000) | ($000) | ($000) | ($000) | ($000) |
| Vanguard Market Liquidity Fund | 6,905 | NA1 | NA1 | 35 | — | 4,263 |
| Vanguard Total Bond Market II | | | | | | |
| Index Fund | 6,992,554 | 2,080,901 | 1,496,413 | 167,882 | 10,684 | 7,759,432 |
| Vanguard Total International | | | | | | |
| Bond Index Fund | 2,969,760 | 358,611 | 276,833 | 45,526 | — | 3,219,117 |
| Vanguard Total International | | | | | | |
| Stock Index Fund | 8,033,865 | 854,968 | 1,165,290 | 225,270 | — | 8,289,872 |
| Vanguard Total Stock Market | | | | | | |
| Index Fund | 12,055,309 | 1,130,078 | 2,237,913 | 222,954 | — | 12,461,906 |
| Total | 30,058,393 | 4,424,558 | 5,176,449 | 661,667 | 10,684 | 31,734,590 |
| 1 Not applicable—purchases and sales are for temporary cash investment purposes. | | | |
G. Management has determined that no material events or transactions occurred subsequent to September 30, 2016, that would require recognition or disclosure in these financial statements.
61
Target Retirement 2030 Fund
Fund Profile
As of September 30, 2016
| |
| Total Fund Characteristics | |
| |
| Ticker Symbol | VTHRX |
| 30-Day SEC Yield | 2.08% |
| Acquired Fund Fees and Expenses1 | 0.15% |
| |
| Allocation to Underlying Vanguard Funds | |
| Vanguard Total Stock Market Index Fund | |
| Investor Shares | 43.8% |
| Vanguard Total International Stock Index | |
| Fund Investor Shares | 29.1 |
| Vanguard Total Bond Market II Index Fund | |
| Investor Shares | 19.2 |
| Vanguard Total International Bond Index | |
| Fund Investor Shares | 7.9 |
| | |
| Total Fund Volatility Measures | |
| | Target 2030 | MSCI US |
| | Composite | Broad Market |
| | Index | Index |
| R-Squared | 1.00 | 0.96 |
| Beta | 0.98 | 0.73 |
These measures show the degree and timing of the fund’s fluctuations compared with the indexes over 36 months.
Fund Asset Allocation
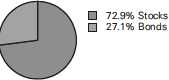
1 This figure—drawn from the prospectus dated January 28, 2016—represents an estimate of the weighted average of the expense ratios and any transaction fees charged by the underlying mutual funds (the ”acquired” funds) in which the Target Retirement 2030 Fund invests. The fund does not charge any expenses or fees of its own. For the fiscal year ended September 30, 2016, the acquired fund fees and expenses were 0.15%.
62
Target Retirement 2030 Fund
Performance Summary
All of the returns in this report represent past performance, which is not a guarantee of future results that may be achieved by the fund. (Current performance may be lower or higher than the performance data cited. For performance data current to the most recent month-end, visit our website at vanguard.com/performance.) Note, too, that both investment returns and principal value can fluctuate widely, so an investor’s shares, when sold, could be worth more or less than their original cost. The returns shown do not reflect taxes that a shareholder would pay on fund distributions or on the sale of fund shares.

For a benchmark description, see the Glossary.
Mixed-Asset Target 2030 Funds Average: Derived from data provided by Lipper, a Thomson Reuters Company.
See Financial Highlights for dividend and capital gains information.
63
Target Retirement 2030 Fund
Fiscal-Year Total Returns (%): September 30, 2006, Through September 30, 2016
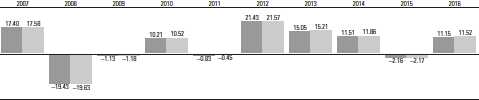
Target Retirement 2030 Fund
Target 2030 Composite Index
For a benchmark description, see the Glossary.
64
Target Retirement 2030 Fund
Financial Statements
Statement of Net Assets
As of September 30, 2016
The fund reports a complete list of its holdings in regulatory filings four times in each fiscal year, at the quarter-ends. For the second and fourth fiscal quarters, the lists appear in the fund’s semiannual and annual reports to shareholders. For the first and third fiscal quarters, the fund files the lists with the Securities and Exchange Commission on Form N-Q. Shareholders can look up the fund’s Forms N-Q on the SEC’s website at sec.gov. Forms N-Q may also be reviewed and copied at the SEC’s Public Reference Room (see the back cover of this report for further information).
| | |
| | | Market |
| | | Value• |
| | Shares | ($000) |
| Investment Companies (100.1%) | | |
| U.S. Stock Fund (43.9%) | | |
| Vanguard Total Stock Market Index Fund Investor Shares | 202,200,327 | 10,955,214 |
| |
| International Stock Fund (29.1%) | | |
| Vanguard Total International Stock Index Fund Investor Shares | 480,196,894 | 7,270,181 |
| |
| U.S. Bond Fund (19.2%) | | |
| 1 Vanguard Total Bond Market II Index Fund Investor Shares | 434,123,406 | 4,792,722 |
| |
| International Bond Fund (7.9%) | | |
| Vanguard Total International Bond Index Fund Investor Shares | 176,209,920 | 1,968,265 |
| Total Investment Companies (Cost $19,759,682) | | 24,986,382 |
| Temporary Cash Investment (0.1%) | | |
| Money Market Fund (0.1%) | | |
| 1 Vanguard Market Liquidity Fund, 0.640% (Cost $18,778) | 187,765 | 18,778 |
| Total Investments (100.2%) (Cost $19,778,460) | | 25,005,160 |
| Other Assets and Liabilities (-0.2%) | | |
| Other Assets | | 147,752 |
| Liabilities | | (187,228) |
| | | (39,476) |
| Net Assets (100%) | | |
| Applicable to 838,755,482 outstanding $.001 par value shares of | | |
| beneficial interest (unlimited authorization) | | 24,965,684 |
| Net Asset Value Per Share | | $29.77 |
65
| |
| Target Retirement 2030 Fund | |
| |
| |
| |
| |
| | Amount |
| | ($000) |
| Statement of Assets and Liabilities | |
| Assets | |
| Investments in Securities, at Value—Affiliated Vanguard Funds | 25,005,160 |
| Receivables for Investment Securities Sold | 105,469 |
| Receivables for Accrued Income | 10,653 |
| Receivables for Capital Shares Issued | 31,630 |
| Total Assets | 25,152,912 |
| Liabilities | |
| Payables for Investment Securities Purchased | 14,598 |
| Payables for Capital Shares Redeemed | 172,630 |
| Total Liabilities | 187,228 |
| Net Assets | 24,965,684 |
| |
| |
| At September 30, 2016, net assets consisted of: | |
| | Amount |
| | ($000) |
| Paid-in Capital | 19,329,054 |
| Undistributed Net Investment Income | 320,604 |
| Accumulated Net Realized Gains | 89,326 |
| Unrealized Appreciation (Depreciation) | 5,226,700 |
| Net Assets | 24,965,684 |
• See Note A in Notes to Financial Statements.
1 Affiliated fund available only to Vanguard funds and certain trusts and accounts managed by Vanguard. Rate shown for Vanguard Market Liquidity Fund is the 7-day yield.
See accompanying Notes, which are an integral part of the Financial Statements.
66
| |
| Target Retirement 2030 Fund | |
| |
| |
| Statement of Operations | |
| |
| | Year Ended |
| | September 30, 2016 |
| | ($000) |
| Investment Income | |
| Income | |
| Income Distributions Received from Affiliated Funds | 512,194 |
| Other Income | 54 |
| Net Investment Income—Note B | 512,248 |
| Realized Net Gain (Loss) | |
| Capital Gain Distributions Received from Affiliated Funds | 6,272 |
| Affiliated Investment Securities Sold | 231,432 |
| Realized Net Gain (Loss) | 237,704 |
| Change in Unrealized Appreciation (Depreciation) of Investment Securities | 1,747,746 |
| Net Increase (Decrease) in Net Assets Resulting from Operations | 2,497,698 |
See accompanying Notes, which are an integral part of the Financial Statements.
67
| | |
| Target Retirement 2030 Fund | | |
| |
| |
| Statement of Changes in Net Assets | | |
| |
| | Year Ended September 30, |
| | 2016 | 2015 |
| | ($000) | ($000) |
| Increase (Decrease) in Net Assets | | |
| Operations | | |
| Net Investment Income | 512,248 | 521,844 |
| Realized Net Gain (Loss) | 237,704 | 285,257 |
| Change in Unrealized Appreciation (Depreciation) | 1,747,746 | (1,391,581) |
| Net Increase (Decrease) in Net Assets Resulting from Operations | 2,497,698 | (584,480) |
| Distributions | | |
| Net Investment Income | (471,700) | (452,597) |
| Realized Capital Gain1 | (343,700) | (23,522) |
| Total Distributions | (815,400) | (476,119) |
| Capital Share Transactions | | |
| Issued | 6,307,641 | 7,676,431 |
| Issued in Lieu of Cash Distributions | 798,019 | 466,220 |
| Redeemed | (6,506,588) | (7,482,627) |
| Net Increase (Decrease) from Capital Share Transactions | 599,072 | 660,024 |
| Total Increase (Decrease) | 2,281,370 | (400,575) |
| Net Assets | | |
| Beginning of Period | 22,684,314 | 23,084,889 |
| End of Period2 | 24,965,684 | 22,684,314 |
1 Includes fiscal 2016 and 2015 short-term gain distributions totaling $40,296,000 and $21,900,000, respectively. Short-term gain distributions are treated as ordinary income dividends for tax purposes.
2 Net Assets—End of Period includes undistributed (overdistributed) net investment income of $320,604,000 and $331,281,000.
See accompanying Notes, which are an integral part of the Financial Statements.
68
| | | | | |
| Target Retirement 2030 Fund | | | | | |
| |
| |
| Financial Highlights | | | | | |
| |
| |
| For a Share Outstanding | | | Year Ended September 30, |
| Throughout Each Period | 2016 | 2015 | 2014 | 2013 | 2012 |
| Net Asset Value, Beginning of Period | $27.77 | $28.95 | $26.46 | $23.51 | $19.81 |
| Investment Operations | | | | | |
| Net Investment Income | .634 | .633 | .613 | . 540 | . 561 |
| Capital Gain Distributions Received | .008 | .016 | .002 | .027 | .044 |
| Net Realized and Unrealized Gain (Loss) | | | | | |
| on Investments | 2.390 | (1.242) | 2.402 | 2.897 | 3.580 |
| Total from Investment Operations | 3.032 | (.593) | 3.017 | 3.464 | 4.185 |
| Distributions | | | | | |
| Dividends from Net Investment Income | (. 597) | (. 558) | (. 491) | (. 499) | (. 468) |
| Distributions from Realized Capital Gains | (. 435) | (. 029) | (. 036) | (. 015) | (. 017) |
| Total Distributions | (1.032) | (. 587) | (. 527) | (. 514) | (. 485) |
| Net Asset Value, End of Period | $29.77 | $27.77 | $28.95 | $26.46 | $23.51 |
| |
| Total Return1 | 11.15% | -2.16% | 11.51% | 15.05% | 21.43% |
| |
| Ratios/Supplemental Data | | | | | |
| Net Assets, End of Period (Millions) | $24,966 | $22,684 | $23,085 | $17,795 | $12,647 |
| Ratio of Total Expenses to | | | | | |
| Average Net Assets | — | — | — | — | — |
| Acquired Fund Fees and Expenses | 0.15% | 0.15% | 0.17% | 0.17% | 0.17% |
| Ratio of Net Investment Income to | | | | | |
| Average Net Assets | 2.20% | 2.08% | 2.16% | 2.30% | 2.66% |
| Portfolio Turnover Rate | 16% | 24% | 7% | 14% | 4% |
1 Total returns do not include account service fees that may have applied in the periods shown. Fund prospectuses provide information about any applicable account service fees.
See accompanying Notes, which are an integral part of the Financial Statements.
69
Target Retirement 2030 Fund
Notes to Financial Statements
Vanguard Target Retirement 2030 Fund is registered under the Investment Company Act of 1940 as an open-end investment company, or mutual fund. The fund follows a balanced investment strategy by investing in selected Vanguard funds to achieve its targeted allocation of assets to U.S. and international stocks, and U.S. and international bonds. Financial statements and other information about each underlying fund are available on vanguard.com.
A. The following significant accounting policies conform to generally accepted accounting principles for U.S. investment companies. The fund consistently follows such policies in preparing its financial statements.
1. Security Valuation: Investments are valued at the net asset value of each underlying Vanguard fund determined as of the close of the New York Stock Exchange (generally 4 p.m., Eastern time) on the valuation date.
2. Federal Income Taxes: The fund intends to continue to qualify as a regulated investment company and distribute all of its taxable income. Management has analyzed the fund’s tax positions taken for all open federal income tax years (September 30, 2013–2016), and has concluded that no provision for federal income tax is required in the fund’s financial statements.
3. Distributions: Distributions to shareholders are recorded on the ex-dividend date.
4. Credit Facility: The fund and certain other funds managed by The Vanguard Group (“Vanguard”) participate in a $3.1 billion committed credit facility provided by a syndicate of lenders pursuant to a credit agreement that may be renewed annually; each fund is individually liable for its borrowings, if any, under the credit facility. Borrowings may be utilized for temporary and emergency purposes, and are subject to the fund’s regulatory and contractual borrowing restrictions. The participating funds are charged administrative fees and an annual commitment fee of 0.10% of the undrawn amount of the facility; these fees are allocated to the funds based on a method approved by the fund’s board of trustees and borne by the funds in which the fund invests (see Note B). Any borrowings under this facility bear interest at a rate based upon the higher of the one-month London Interbank Offered Rate, federal funds effective rate, or overnight bank funding rate plus an agreed-upon spread.
The fund had no borrowings outstanding at September 30, 2016, or at any time during the period then ended.
5. Other: Income and capital gain distributions received are recorded on the ex-dividend date. Security transactions are accounted for on the date securities are bought or sold. Costs used to determine realized gains (losses) on the sale of investment securities are those of the specific securities sold.
B. In accordance with the terms of a Funds’ Service Agreement (the “FSA”) between Vanguard and the fund, Vanguard furnishes to the fund investment advisory, corporate management, administrative, marketing, and distribution services at Vanguard’s cost of operations (as defined by the FSA). These costs of operations are allocated to the fund based on methods and guidelines approved by the board of trustees. The FSA provides that expenses otherwise allocable to Vanguard funds-of-funds may be reduced or eliminated to the extent of savings realized by the underlying Vanguard funds by virtue of being part of a fund-of-funds. Accordingly, all expenses for services provided by Vanguard to the fund and all other expenses incurred by the fund during the period ended September 30, 2016, were borne by the underlying Vanguard funds in which the fund invests. The fund’s trustees and officers are also trustees and officers, respectively, of the underlying Vanguard funds, as well as directors and employees, respectively, of Vanguard.
70
Target Retirement 2030 Fund
C. Various inputs may be used to determine the value of the fund’s investments. These inputs are summarized in three broad levels for financial statement purposes. The inputs or methodologies used to value securities are not necessarily an indication of the risk associated with investing in those securities.
Level 1—Quoted prices in active markets for identical securities.
Level 2—Other significant observable inputs (including quoted prices for similar securities, interest rates, prepayment speeds, credit risk, etc.).
Level 3—Significant unobservable inputs (including the fund’s own assumptions used to determine the fair value of investments).
At September 30, 2016, 100% of the market value of the fund’s investments was determined based on Level 1 inputs.
D. Distributions are determined on a tax basis and may differ from net investment income and realized capital gains for financial reporting purposes. Differences may be permanent or temporary. Permanent differences are reclassified among capital accounts in the financial statements to reflect their tax character. Temporary differences arise when certain items of income, expense, gain, or loss are recognized in different periods for financial statement and tax purposes. These differences will reverse at some time in the future. Differences in classification may also result from the treatment of short-term gains as ordinary income for tax purposes.
The fund used a tax accounting practice to treat a portion of the price of capital shares redeemed during the year as distributions from net investment income and realized capital gains. Accordingly, the fund has reclassified $51,225,000 from undistributed net investment income, and $41,178,000 from accumulated net realized gains, to paid-in capital.
For tax purposes, at September 30, 2016, the fund had $349,996,000 of ordinary income and $59,933,000 of long-term capital gains available for distribution.
At September 30, 2016, the cost of investment securities for tax purposes was $19,778,460,000. Net unrealized appreciation of investment securities for tax purposes was $5,226,700,000 consisting of unrealized gains of $5,344,082,000 on securities that had risen in value since their purchase and $117,382,000 in unrealized losses on securities that had fallen in value since their purchase.
| E. | Capital shares issued and redeemed were: |
| | |
| | Year Ended September 30, |
| | 2016 | 2015 |
| | Shares | Shares |
| | (000) | (000) |
| Issued | 222,843 | 260,591 |
| Issued in Lieu of Cash Distributions | 28,460 | 15,901 |
| Redeemed | (229,481) | (256,833) |
| Net Increase (Decrease) in Shares Outstanding | 21,822 | 19,659 |
71
Target Retirement 2030 Fund
| | | | | | |
| F. Transactions during the period in affiliated underlying Vanguard funds were as follows: | |
| | | | Current Period Transactions | |
| | Sept. 30, | | Proceeds | | | Sept. 30, |
| | 2015 | | from | | Capital Gain | 2016 |
| | Market | Purchases | Securities | | Distributions | Market |
| | Value | at Cost | Sold | Income | Received | Value |
| | ($000) | ($000) | ($000) | ($000) | ($000) | ($000) |
| Vanguard Market Liquidity Fund | — | NA1 | NA1 | 38 | — | 18,778 |
| Vanguard Total Bond Market II | | | | | | |
| Index Fund | 4,079,108 | 1,722,733 | 1,119,381 | 100,700 | 6,272 | 4,792,722 |
| Vanguard Total International | | | | | | |
| Bond Index Fund | 1,729,322 | 331,777 | 192,448 | 27,140 | — | 1,968,265 |
| Vanguard Total International | | | | | | |
| Stock Index Fund | 6,746,275 | 854,256 | 811,396 | 193,190 | — | 7,270,181 |
| Vanguard Total Stock Market | | | | | | |
| Index Fund | 10,120,273 | 1,156,619 | 1,609,934 | 191,126 | — | 10,955,214 |
| Total | 22,674,978 | 4,065,385 | 3,733,159 | 512,194 | 6,272 | 25,005,160 |
| 1 Not applicable—purchases and sales are for temporary cash investment purposes. | | | |
G. Management has determined that no material events or transactions occurred subsequent to September 30, 2016, that would require recognition or disclosure in these financial statements.
72
Report of Independent Registered Public Accounting Firm
To the Board of Trustees of Vanguard Chester Funds and the Shareholders of Vanguard Target Retirement Income Fund, Vanguard Target Retirement 2010 Fund, Vanguard Target Retirement 2015 Fund, Vanguard Target Retirement 2020 Fund, Vanguard Target Retirement 2025 Fund and Vanguard Target Retirement 2030 Fund: In our opinion, the accompanying statements of net assets and statements of assets and liabilities, and the related statements of operations and of changes in net assets and the financial highlights present fairly, in all material respects, the financial position of Vanguard Target Retirement Income Fund, Vanguard Target Retirement 2010 Fund, Vanguard Target Retirement 2015 Fund, Vanguard Target Retirement 2020 Fund, Vanguard Target Retirement 2025 Fund and Vanguard Target Retirement 2030 Fund (constituting separate portfolios of Vanguard Chester Funds, hereafter referred to as the “Funds”) at September 30, 2016, the results of each of their operations for the year then ended, the changes in each of their net assets for each of the two years in the period then ended, and the financial highlights for each of the five years in the period then ended, in conformity with accounting principles generally accepted in the United States of America. These financial statements and financial highlights (hereafter referred to as “financial statements”) are the responsibility of the Funds’ management. Our responsibility is to express an opinion on these financial statements based on our audits. We conducted our audits of these financial statements in accordance with the standards of the Public Company Accounting Oversight Board (United States). Those standards require that we plan and perform the audit to obtain reasonable assurance about whether the financial statements are free of material misstatement. An audit includes examining, on a test basis, evidence supporting the amounts and disclosures in the financial statements, assessing the accounting principles used and significant estimates made by management, and evaluating the overall financial statement presentation. We believe that our audits, which included confirmation of securities at September 30, 2016 by agreement to the underlying ownership records of the transfer agent, provide a reasonable basis for our opinion.
/s/PricewaterhouseCoopers LLP Philadelphia, Pennsylvania November 10, 2016
Special 2016 tax information (unaudited) for Vanguard Target Retirement Funds
This information for the fiscal year ended September 30, 2016, is included pursuant to provisions of the Internal Revenue Code.
The funds distributed capital gain dividends (from net long-term capital gains) to shareholders during the fiscal year as follows:
| |
| Fund | ($000) |
| Target Retirement Income Fund | 182,240 |
| Target Retirement 2010 Fund | 229,059 |
| Target Retirement 2015 Fund | 937,919 |
| Target Retirement 2020 Fund | 521,349 |
| Target Retirement 2025 Fund | 803,570 |
| Target Retirement 2030 Fund | 341,316 |
73
For nonresident alien shareholders, 100% of short-term capital gain dividends distributed by the funds are qualified short-term capital gains.
The funds distributed qualified dividend income to shareholders during the fiscal year as follows:
| |
| Fund | ($000) |
| Target Retirement Income Fund | 58,382 |
| Target Retirement 2010 Fund | 37,852 |
| Target Retirement 2015 Fund | 166,682 |
| Target Retirement 2020 Fund | 283,990 |
| Target Retirement 2025 Fund | 362,470 |
| Target Retirement 2030 Fund | 303,398 |
For corporate shareholders, the percentage of investment income (dividend income plus short-term gains, if any) that qualifies for the dividends-received deduction is as follows:
| |
| Fund | Percentage |
| Target Retirement Income Fund | 16.3% |
| Target Retirement 2010 Fund | 18.1 |
| Target Retirement 2015 Fund | 23.9 |
| Target Retirement 2020 Fund | 26.8 |
| Target Retirement 2025 Fund | 30.0 |
| Target Retirement 2030 Fund | 31.2 |
The funds designate to shareholders foreign source income and foreign taxes paid as follows:
| | |
| | Foreign Source Income | Foreign Taxes Paid |
| Fund | ($000) | ($000) |
| Target Retirement Income Fund | 59,736 | 2,411 |
| Target Retirement 2010 Fund | 34,652 | 1,450 |
| Target Retirement 2015 Fund | 128,499 | 6,252 |
| Target Retirement 2020 Fund | 220,302 | 11,433 |
| Target Retirement 2025 Fund | 269,507 | 14,771 |
| Target Retirement 2030 Fund | 219,488 | 12,607 |
Shareholders will receive more detailed information with their Form 1099-DIV in January 2017 to determine the calendar-year amounts to be included on their 2016 tax returns.
74
Your Fund’s After-Tax Returns
This table presents returns for your fund both before and after taxes. The after-tax returns are shown in two ways: (1) assuming that an investor owned the fund during the entire period and paid taxes on the fund’s distributions, and (2) assuming that an investor paid taxes on the fund’s distributions and sold all shares at the end of each period.
Calculations are based on the highest individual federal income tax and capital gains tax rates in effect at the times of the distributions and the hypothetical sales. State and local taxes were not considered. After-tax returns reflect any qualified dividend income, using actual prior-year figures and estimates for 2016. (In the example, returns after the sale of fund shares may be higher than those assuming no sale. This occurs when the sale would have produced a capital loss. The calculation assumes that the investor received a tax deduction for the loss.)
Please note that your actual after-tax returns will depend on your tax situation and may differ from those shown. Also note that if you own the fund in a tax-deferred account, such as an individual retirement account or a 401(k) plan, this information does not apply to you. Such accounts are not subject to current taxes.
Finally, keep in mind that a fund’s performance—whether before or after taxes—does not guarantee future results.
| | | |
| Average Annual Total Returns: Target Retirement Funds | | | |
| Periods Ended September 30, 2016 | | | |
| | One | Five | Ten |
| | Year | Years | Years |
| Target Retirement Income Fund | | | |
| Returns Before Taxes | 7.54% | 5.94% | 5.27% |
| Returns After Taxes on Distributions | 6.40 | 5.03 | 4.30 |
| Returns After Taxes on Distributions and Sale of Fund Shares | 4.67 | 4.35 | 3.83 |
| |
| |
| | One | Five | Ten |
| | Year | Years | Years |
| Target Retirement 2010 Fund | | | |
| Returns Before Taxes | 7.82% | 7.28% | 5.21% |
| Returns After Taxes on Distributions | 6.22 | 6.29 | 4.39 |
| Returns After Taxes on Distributions and Sale of Fund Shares | 5.20 | 5.46 | 3.90 |
| |
| |
| | One | Five | Ten |
| | Year | Years | Years |
| Target Retirement 2015 Fund | | | |
| Returns Before Taxes | 9.03% | 8.61% | 5.48% |
| Returns After Taxes on Distributions | 7.13 | 7.61 | 4.61 |
| Returns After Taxes on Distributions and Sale of Fund Shares | 6.16 | 6.55 | 4.12 |
75
| | | |
| Average Annual Total Returns: Target Retirement Funds | | | |
| Periods Ended September 30, 2016 | | | |
| |
| | One | Five | Ten |
| | Year | Years | Years |
| Target Retirement 2020 Fund | | | |
| |
| Returns Before Taxes | 10.05% | 9.63% | 5.62% |
| Returns After Taxes on Distributions | 8.79 | 8.86 | 4.99 |
| Returns After Taxes on Distributions and Sale of Fund Shares | 6.23 | 7.42 | 4.31 |
| |
| | One | Five | Ten |
| | Year | Years | Years |
| Target Retirement 2025 Fund | | | |
| Returns Before Taxes | 10.67% | 10.39% | 5.65% |
| Returns After Taxes on Distributions | 9.22 | 9.60 | 4.97 |
| Returns After Taxes on Distributions and Sale of Fund Shares | 6.75 | 8.06 | 4.34 |
| |
| | One | Five | Ten |
| | Year | Years | Years |
| Target Retirement 2030 Fund | | | |
| Returns Before Taxes | 11.15% | 11.12% | 5.64% |
| Returns After Taxes on Distributions | 10.04 | 10.43 | 5.12 |
| Returns After Taxes on Distributions and Sale of Fund Shares | 6.84 | 8.70 | 4.40 |
76
About Your Fund’s Expenses
As a shareholder of the fund, you incur ongoing costs, which include costs for portfolio management, administrative services, and shareholder reports (like this one), among others. Operating expenses, which are deducted from a fund’s gross income, directly reduce the investment return of the fund.
A typical fund’s expenses are expressed as a percentage of its average net assets. The Target Retirement Funds have no direct expenses, but each fund bears its proportionate share of the costs for the underlying funds in which it invests. These indirect expenses make up the acquired fund fees and expenses, also expressed as a percentage of average net assets.
The following examples are intended to help you understand the ongoing cost (in dollars) of investing in your fund and to compare these costs with those of other mutual funds. The examples are based on an investment of $1,000 made at the beginning of the period shown and held for the entire period. The costs were calculated using the acquired fund fees and expenses for each Target Retirement Fund.
The accompanying table illustrates your fund’s costs in two ways:
• Based on actual fund return. This section helps you to estimate the actual expenses that you paid over the period. The ”Ending Account Value“ shown is derived from the fund‘s actual return, and the third column shows the dollar amount that would have been paid by an investor who started with $1,000 in the fund. You may use the information here, together with the amount you invested, to estimate the expenses that you paid over the period.
To do so, simply divide your account value by $1,000 (for example, an $8,600 account value divided by $1,000 = 8.6), then multiply the result by the number given for your fund under the heading ”Expenses Paid During Period.“
• Based on hypothetical 5% yearly return. This section is intended to help you compare your fund‘s costs with those of other mutual funds. It assumes that the fund had a yearly return of 5% before expenses, but that the expense ratio is unchanged. In this case—because the return used is not the fund’s actual return—the results do not apply to your investment. The example is useful in making comparisons because the Securities and Exchange Commission requires all mutual funds to calculate expenses based on a 5% return. You can assess your fund’s costs by comparing this hypothetical example with the hypothetical examples that appear in shareholder reports of other funds.
Note that the expenses shown in the table are meant to highlight and help you compare ongoing costs only and do not reflect transaction costs incurred by the fund for buying and selling securities. Further, the expenses do not include any purchase, redemption, or account service fees described in the fund prospectus. If such fees were applied to your account, your costs would be higher. Your fund does not carry a “sales load.”
The calculations assume no shares were bought or sold during the period. Your actual costs may have been higher or lower, depending on the amount of your investment and the timing of any purchases or redemptions.
You can find more information about the fund’s expenses, including annual expense ratios, in the Financial Statements section of this report. For additional information on operating expenses and other shareholder costs, please refer to your fund’s current prospectus.
77
| | | |
| Six Months Ended September 30, 2016 | | | |
| | Beginning | Ending | Expenses |
| | Account Value | Account Value | Paid During |
| | 3/31/2016 | 9/30/2016 | Period |
| Based on Actual Fund Return | | | |
| Target Retirement Income Fund | $1,000.00 | $1,038.66 | $0.66 |
| Target Retirement 2010 Fund | $1,000.00 | $1,040.11 | $0.66 |
| Target Retirement 2015 Fund | $1,000.00 | $1,047.59 | $0.72 |
| Target Retirement 2020 Fund | $1,000.00 | $1,053.22 | $0.72 |
| Target Retirement 2025 Fund | $1,000.00 | $1,057.38 | $0.72 |
| Target Retirement 2030 Fund | $1,000.00 | $1,060.19 | $0.77 |
| Based on Hypothetical 5% Yearly Return | | | |
| Target Retirement Income Fund | $1,000.00 | $1,024.35 | $0.66 |
| Target Retirement 2010 Fund | $1,000.00 | $1,024.35 | $0.66 |
| Target Retirement 2015 Fund | $1,000.00 | $1,024.30 | $0.71 |
| Target Retirement 2020 Fund | $1,000.00 | $1,024.30 | $0.71 |
| Target Retirement 2025 Fund | $1,000.00 | $1,024.30 | $0.71 |
| Target Retirement 2030 Fund | $1,000.00 | $1,024.25 | $0.76 |
The calculations are based on the acquired fund fees and expenses for the most recent six-month period. The funds’ annualized expense figures for that period are (in order as listed from top to bottom above) 0.13%, 0.13%, 0.14%, 0.14%, 0.14%, and 0.15%. The dollar amounts shown as ”Expenses Paid” are equal to the annualized expense figures for the underlying funds multiplied by the average account value over the period, multiplied by the number of days in the most recent six-month period, then divided by the number of days in the most recent 12-month period (183/366).
78
Glossary
30-Day SEC Yield. A fund’s 30-day SEC yield is derived using a formula specified by the U.S. Securities and Exchange Commission. Under the formula, data related to the fund’s security holdings in the previous 30 days are used to calculate the fund’s hypothetical net income for that period, which is then annualized and divided by the fund’s estimated average net assets over the calculation period. For the purposes of this calculation, a security’s income is based on its current market yield to maturity (for bonds), its actual income (for asset-backed securities), or its projected dividend yield (for stocks). Because the SEC yield represents hypothetical annualized income, it will differ—at times significantly—from the fund’s actual experience. As a result, the fund’s income distributions may be higher or lower than implied by the SEC yield.
Acquired Fund Fees and Expenses. Funds that invest in other Vanguard funds incur no direct expenses, but they do bear proportionate shares of the operating, administrative, and advisory expenses of the underlying funds, and they must pay any fees charged by those funds. The figure for acquired fund fees and expenses represents a weighted average of these underlying costs.
Acquired is a term that the Securities and Exchange Commission applies to any mutual fund whose shares are owned by another fund.
Beta. A measure of the magnitude of a fund’s past share-price fluctuations in relation to the ups and downs of a given market index. The index is assigned a beta of 1.00. Compared with a given index, a fund with a beta of 1.20 typically would have seen its share price rise or fall by 12% when the index rose or fell by 10%. For this report, beta is based on returns over the past 36 months for both the fund and the index. Note that a fund’s beta should be reviewed in conjunction with its R-squared (see definition). The lower the R-squared, the less correlation there is between the fund and the index, and the less reliable beta is as an indicator of volatility.
Expense Ratio. A fund’s total annual operating expenses expressed as a percentage of the fund’s average net assets. The expense ratio includes management and administrative expenses, but does not include the transaction costs of buying and selling portfolio securities.
Inception Date. The date on which the assets of a fund (or one of its share classes) are first invested in accordance with the fund’s investment objective. For funds with a subscription period, the inception date is the day after that period ends. Investment performance is measured from the inception date.
R-Squared. A measure of how much of a fund’s past returns can be explained by the returns from the market in general, as measured by a given index. If a fund’s total returns were precisely synchronized with an index’s returns, its R-squared would be 1.00. If the fund’s returns bore no relationship to the index’s returns, its R-squared would be 0. For this report, R-squared is based on returns over the past 36 months for both the fund and the index.
Benchmark Information
Spliced Mixed-Asset Target Today Funds Average: Mixed-Asset Target Conservative Funds Average though June 30, 2012; Mixed-Asset Target Today Funds Average thereafter.
79
Target 2010 Composite Index: Derived by applying the fund’s target asset allocation to the results of the following benchmarks: for international stocks of developed markets, the MSCI EAFE Index through December 15, 2010, the MSCI ACWI ex USA IMI Index through June 2, 2013, and the FTSE Global All Cap ex US Index thereafter; for emerging-market stocks, the Select Emerging Markets Index through August 23, 2006, the MSCI Emerging Markets Index through December 15, 2010, the MSCI ACWI ex USA IMI Index through June 2, 2013, and the FTSE Global All Cap ex US Index thereafter; for U.S. bonds, the Bloomberg Barclays U.S. Aggregate Bond Index through December 31, 2009, and the Bloomberg Barclays U.S. Aggregate Float Adjusted Index thereafter, as well as the Bloomberg Barclays U.S. Treasury Inflation Protected Securities Index through June 2, 2013, and the Bloomberg Barclays U.S. Treasury Inflation-Protected Securities (TIPS) 0-5 Year Index thereafter; for short-term reserves, the Citigroup Three-Month Treasury Bill Index through June 2, 2013; for international bonds, the Bloomberg Barclays Global Aggregate ex-USD Float Adjusted RIC Capped Index beginning June 3, 2013; and for U.S. stocks, the MSCI US Broad Market Index through June 2, 2013, and the CRSP US Total Market Index thereafter. International stock benchmark returns are adjusted for withholding taxes.
Target 2015 Composite Index: Derived by applying the fund’s target asset allocation to the results of the following benchmarks: for international stocks of developed markets, the MSCI EAFE Index through December 15, 2010, the MSCI ACWI ex USA IMI Index through June 2, 2013, and the FTSE Global All Cap ex US Index thereafter; for emerging-market stocks, the Select Emerging Markets Index through August 23, 2006, the MSCI Emerging Markets Index through December 15, 2010, the MSCI ACWI ex USA IMI Index through June 2, 2013, and the FTSE Global All Cap ex US Index thereafter; for U.S. bonds, the Bloomberg Barclays U.S. Aggregate Bond Index through December 31, 2009, and the Bloomberg Barclays U.S. Aggregate Float Adjusted Index thereafter, as well as the Bloomberg Barclays U.S. Treasury Inflation Protected Securities Index through June 2, 2013, and the Bloomberg Barclays U.S. Treasury Inflation-Protected Securities (TIPS) 0-5 Year Index thereafter; for international bonds, the Bloomberg Barclays Global Aggregate ex-USD Float Adjusted RIC Capped Index beginning June 3, 2013; and for U.S. stocks, the Dow Jones U.S. Total Stock Market Index (formerly known as the Dow Jones Wilshire 5000 Index) through April 22, 2005, the MSCI US Broad Market Index through June 2, 2013, and the CRSP US Total Market Index thereafter. International stock benchmark returns are adjusted for withholding taxes.
Target 2020 Composite Index: Derived by applying the fund’s target asset allocation to the results of the following benchmarks: for international stocks of developed markets, the MSCI EAFE Index through December 15, 2010, the MSCI ACWI ex USA IMI Index through June 2, 2013, and the FTSE Global All Cap ex US Index thereafter; for emerging-market stocks, the Select Emerging Markets Index through August 23, 2006, the MSCI Emerging Markets Index through December 15, 2010, the MSCI ACWI ex USA IMI Index through June 2, 2013, and the FTSE Global All Cap ex US Index thereafter; for U.S. bonds, the Bloomberg Barclays U.S. Aggregate Bond Index through December 31, 2009, and the Bloomberg Barclays U.S. Aggregate Float Adjusted Index thereafter; for international bonds, the Bloomberg Barclays Global Aggregate ex-USD Float Adjusted RIC Capped Index beginning June 3, 2013; and for U.S. stocks, the MSCI US Broad Market Index through June 2, 2013, and the CRSP US Total Market Index thereafter. International stock benchmark returns are adjusted for withholding taxes.
80
Target 2025 Composite Index: Derived by applying the fund’s target asset allocation to the results of the following benchmarks: for international stocks of developed markets, the MSCI EAFE Index through December 15, 2010, the MSCI ACWI ex USA IMI Index through June 2, 2013, and the FTSE Global All Cap ex US Index thereafter; for emerging-market stocks, the Select Emerging Markets Index through August 23, 2006, the MSCI Emerging Markets Index through December 15, 2010, the MSCI ACWI ex USA IMI Index through June 2, 2013, and the FTSE Global All Cap ex US Index thereafter; for U.S. bonds, the Bloomberg Barclays U.S. Aggregate Bond Index through December 31, 2009, and the Bloomberg Barclays U.S. Aggregate Float Adjusted Index thereafter; for international bonds, the Bloomberg Barclays Global Aggregate ex-USD Float Adjusted RIC Capped Index beginning June 3, 2013; and for U.S. stocks, the Dow Jones U.S. Total Stock Market Index (formerly known as the Dow Jones Wilshire 5000 Index) through April 22, 2005, the MSCI US Broad Market Index through June 2, 2013, and the CRSP US Total Market Index thereafter. International stock benchmark returns are adjusted for withholding taxes.
Target 2030 Composite Index: Derived by applying the fund’s target asset allocation to the results of the following benchmarks: for international stocks of developed markets, the MSCI EAFE Index through December 15, 2010, the MSCI ACWI ex USA IMI Index through June 2, 2013, and the FTSE Global All Cap ex US Index thereafter; for emerging-market stocks, the Select Emerging Markets Index through August 23, 2006, the MSCI Emerging Markets Index through December 15, 2010, the MSCI ACWI ex USA IMI Index through June 2, 2013, and the FTSE Global All Cap ex US Index thereafter; for U.S. bonds, the Bloomberg Barclays U.S. Aggregate Bond Index through December 31, 2009, and the Bloomberg Barclays U.S. Aggregate Float Adjusted Index thereafter; for international bonds, the Bloomberg Barclays Global Aggregate ex-USD Float Adjusted RIC Capped Index beginning June 3, 2013; and for U.S. stocks, the MSCI US Broad Market Index through June 2, 2013, and the CRSP US Total Market Index thereafter. International stock benchmark returns are adjusted for withholding taxes.
Target Income Composite Index: Derived by applying the fund’s target asset allocation to the results of the following benchmarks: for international stocks of developed markets, the MSCI EAFE Index through December 15, 2010, the MSCI ACWI ex USA IMI Index through June 2, 2013, and the FTSE Global All Cap ex US Index thereafter; for emerging-market stocks, the Select Emerging Markets Index through August 23, 2006, the MSCI Emerging Markets Index through December 15, 2010, the MSCI ACWI ex USA IMI Index through June 2, 2013, and the FTSE Global All Cap ex US Index thereafter; for U.S. bonds, the Bloomberg Barclays U.S. Aggregate Bond Index through December 31, 2009, and the Bloomberg Barclays U.S. Aggregate Float Adjusted Index thereafter, as well as the Bloomberg Barclays U.S. Treasury Inflation Protected Securities Index through June 2, 2013, and the Bloomberg Barclays U.S. Treasury Inflation-Protected Securities (TIPS) 0-5 Year Index thereafter; for short-term reserves, the Citigroup Three-Month Treasury Bill Index through June 2, 2013; for international bonds, the Bloomberg Barclays Global Aggregate ex-USD Float Adjusted RIC Capped Index beginning June 3, 2013; and for U.S. stocks, the Dow Jones U.S. Total Stock Market Index (formerly known as the Dow Jones Wilshire 5000 Index) through April 22, 2005, the MSCI US Broad Market Index through June 2, 2013, and the CRSP US Total Market Index thereafter. International stock benchmark returns are adjusted for withholding taxes.
81
This page intentionally left blank.
This page intentionally left blank.
This page intentionally left blank.
This page intentionally left blank.
This page intentionally left blank.
This page intentionally left blank.
The People Who Govern Your Fund
The trustees of your mutual fund are there to see that the fund is operated and managed in your best interests since, as a shareholder, you are a part owner of the fund. Your fund’s trustees also serve on the board of directors of The Vanguard Group, Inc., which is owned by the Vanguard funds and provides services to them on an at-cost basis.
A majority of Vanguard’s board members are independent, meaning that they have no affiliation with Vanguard or the funds they oversee, apart from the sizable personal investments they have made as private individuals. The independent board members have distinguished backgrounds in business, academia, and public service. Each of the trustees and executive officers oversees 198 Vanguard funds.
The following table provides information for each trustee and executive officer of the fund. The mailing address of the trustees and officers is P.O. Box 876, Valley Forge, PA 19482. More information about the trustees is in the Statement of Additional Information, which can be obtained, without charge, by contacting Vanguard at 800-662-7447, or online at vanguard.com.
InterestedTrustee1
F. William McNabb III
Born 1957. Trustee Since July 2009. Chairman of the Board. Principal Occupation(s) During the Past Five Years and Other Experience: Chairman of the Board of The Vanguard Group, Inc., and of each of the investment companies served by The Vanguard Group, since January 2010; Director of The Vanguard Group since 2008; Chief Executive Officer and President of The Vanguard Group, and of each of the investment companies served by The Vanguard Group, since 2008; Director of Vanguard Marketing Corporation; Managing Director of The Vanguard Group (1995–2008).
IndependentTrustees
Emerson U. Fullwood
Born 1948. Trustee Since January 2008. Principal Occupation(s) During the Past Five Years and Other Experience: Executive Chief Staff and Marketing Officer for North America and Corporate Vice President (retired 2008) of Xerox Corporation (document management products and services); Executive in Residence and 2009–2010 Distinguished Minett Professor at the Rochester Institute of Technology; Lead Director of SPX FLOW, Inc. (multi-industry manufacturing); Director of the United Way of Rochester, the University of Rochester Medical Center, Monroe Community College Foundation, North Carolina A&T University, and Roberts Wesleyan College.
Rajiv L. Gupta
Born 1945. Trustee Since December 2001.2 Principal Occupation(s) During the Past Five Years and Other Experience: Chairman and Chief Executive Officer (retired 2009) and President (2006–2008) of Rohm and Haas Co. (chemicals); Director of Tyco International plc (diversified manufacturing and services), HP Inc. (printer and personal computer manufacturing), and Delphi Automotive plc (automotive components); Senior Advisor at New Mountain Capital.
Amy Gutmann
Born 1949. Trustee Since June 2006. Principal Occupation(s) During the Past Five Years and Other Experience: President of the University of Pennsylvania; Christopher H. Browne Distinguished Professor of Political Science, School of Arts and Sciences, and Professor of Communication, Annenberg School for Communication, with secondary faculty appointments in the Department of Philosophy, School of Arts and Sciences, and at the Graduate School of Education, University of Pennsylvania; Trustee of the National Constitution Center; Chair of the Presidential Commission for the Study of Bioethical Issues.
JoAnn Heffernan Heisen
Born 1950. Trustee Since July 1998. Principal Occupation(s) During the Past Five Years and Other Experience: Corporate Vice President and Chief Global Diversity Officer (retired 2008) and Member of the Executive Committee (1997–2008) of Johnson & Johnson (pharmaceuticals/medical devices/consumer products); Director of Skytop Lodge Corporation (hotels) and the Robert Wood Johnson Foundation; Member of the Advisory Board of the Institute for Women’s Leadership at Rutgers University.
F. Joseph Loughrey
Born 1949. Trustee Since October 2009. Principal Occupation(s) During the Past Five Years and Other Experience: President and Chief Operating Officer (retired 2009) of Cummins Inc. (industrial machinery); Chairman of the Board of Hillenbrand, Inc. (specialized consumer services), and of Oxfam America; Director of SKF AB (industrial machinery), Hyster-Yale Materials Handling, Inc. (forklift trucks), the Lumina Foundation for Education, and the V Foundation for Cancer Research; Member of the Advisory Council for the College of Arts and Letters and of the Advisory Board to the Kellogg Institute for International Studies, both at the University of Notre Dame.
Mark Loughridge
Born 1953. Trustee Since March 2012. Principal Occupation(s) During the Past Five Years and Other Experience: Senior Vice President and Chief Financial Officer (retired 2013) at IBM (information technology services); Fiduciary Member of IBM’s Retirement Plan Committee (2004–2013); Director of the Dow Chemical Company; Member of the Council on Chicago Booth.
Scott C. Malpass
Born 1962. Trustee Since March 2012. Principal Occupation(s) During the Past Five Years and Other Experience: Chief Investment Officer and Vice President at the University of Notre Dame; Assistant Professor of Finance at the Mendoza College of Business at Notre Dame; Member of the Notre Dame 403(b) Investment Committee, the Board of Advisors for Spruceview Capital Partners, and the Investment Advisory Committee of Major League Baseball; Board Member of TIFF Advisory Services, Inc., and Catholic Investment Services, Inc. (investment advisors).
André F. Perold
Born 1952. Trustee Since December 2004. Principal Occupation(s) During the Past Five Years and Other Experience: George Gund Professor of Finance and Banking, Emeritus at the Harvard Business School (retired 2011); Chief Investment Officer and Managing Partner of HighVista Strategies LLC (private investment firm); Director of Rand Merchant Bank; Overseer of the Museum of Fine Arts Boston.
Peter F. Volanakis
Born 1955. Trustee Since July 2009. Principal Occupation(s) During the Past Five Years and Other Experience: President and Chief Operating Officer (retired 2010) of Corning Incorporated (communications equipment); Chairman of the Board of Trustees of Colby-Sawyer College; Member of the Advisory Board of the Norris Cotton Cancer Center.
Executive Officers
Glenn Booraem
Born 1967. Treasurer Since May 2015. Principal Occupation(s) During the Past Five Years and Other Experience: Principal of The Vanguard Group, Inc.; Treasurer of each of the investment companies served by The Vanguard Group; Controller of each of the investment companies served by The Vanguard Group (2010–2015); Assistant Controller of each of the investment companies served by The Vanguard Group (2001–2010).
Thomas J. Higgins
Born 1957. Chief Financial Officer Since September 2008. Principal Occupation(s) During the Past Five Years and Other Experience: Principal of The Vanguard Group, Inc.; Chief Financial Officer of each of the investment companies served by The Vanguard Group; Treasurer of each of the investment companies served by The Vanguard Group (1998–2008).
Peter Mahoney
Born 1974. Controller Since May 2015. Principal Occupation(s) During the Past Five Years and Other Experience: Head of Global Fund Accounting at The Vanguard Group, Inc.; Controller of each of the investment companies served by The Vanguard Group; Head of International Fund Services at The Vanguard Group (2008–2014).
Anne E. Robinson
Born 1970. Secretary Since September 2016. Principal Occupation(s) During the Past Five Years and Other Experience: Managing Director of The Vanguard Group, Inc.; General Counsel of The Vanguard Group; Secretary of The Vanguard Group and of each of the investment companies served by The Vanguard Group; Director and Senior Vice President of Vanguard Marketing Corporation; Managing Director and General Counsel of Global Cards and Consumer Services at Citigroup (2014–2016); Counsel at American Express (2003–2014).
Vanguard Senior Management Team
| |
Mortimer J. Buckley Kathleen C. Gubanich Martha G. King John T. Marcante Chris D. McIsaac | James M. Norris Thomas M. Rampulla Glenn W. Reed Karin A. Risi Michael Rollings |
Chairman Emeritus and Senior Advisor John J. Brennan
Chairman, 1996–2009
Chief Executive Officer and President, 1996–2008
Founder
John C. Bogle
Chairman and Chief Executive Officer, 1974–1996
1 Mr. McNabb is considered an “interested person,” as defined in the Investment Company Act of 1940, because he is an officer of the Vanguard funds.
2 December 2002 for Vanguard Equity Income Fund, the Vanguard Municipal Bond Funds, and the Vanguard State Tax-Exempt Funds.

| |
| | P.O. Box 2600 |
| | Valley Forge, PA 19482-2600 |
| |
| |
| |
| Connect with Vanguard® > vanguard.com | |
| |
| |
| |
| Fund Information > 800-662-7447 | |
| Direct Investor Account Services > 800-662-2739 | |
| Institutional Investor Services > 800-523-1036 | |
| Text Telephone for People | |
| Who Are Deaf or Hard of Hearing> 800-749-7273 | |
| |
| This material may be used in conjunction | |
| with the offering of shares of any Vanguard | |
| fund only if preceded or accompanied by | |
| the fund’s current prospectus. | |
| |
| All comparative mutual fund data are from Lipper, a | |
| Thomson Reuters Company, or Morningstar, Inc., unless | |
| otherwise noted. | |
| |
| You can obtain a free copy of Vanguard’s proxy voting | |
| guidelines by visiting vanguard.com/proxyreporting or by | |
| calling Vanguard at 800-662-2739. The guidelines are | |
| also available from the SEC’s website, sec.gov. In | |
| addition, you may obtain a free report on how your fund | |
| voted the proxies for securities it owned during the 12 | |
| months ended June 30. To get the report, visit either | |
| vanguard.com/proxyreporting or sec.gov. | |
| |
| You can review and copy information about your fund at | |
| the SEC’s Public Reference Room in Washington, D.C. To | |
| find out more about this public service, call the SEC at | |
| 202-551-8090. Information about your fund is also | |
| available on the SEC’s website, and you can receive | |
| copies of this information, for a fee, by sending a | |
| request in either of two ways: via email addressed to | |
| publicinfo@sec.gov or via regular mail addressed to the | |
| Public Reference Section, Securities and Exchange | |
| Commission, Washington, DC 20549-1520. | |
| |
| | © 2016 The Vanguard Group, Inc. |
| | All rights reserved. |
| | Vanguard Marketing Corporation, Distributor. |
| |
| | Q3080 112016 |

Annual Report | September 30, 2016
Vanguard Target Retirement Funds
Vanguard Target Retirement 2035 Fund
Vanguard Target Retirement 2040 Fund
Vanguard Target Retirement 2045 Fund
Vanguard Target Retirement 2050 Fund
Vanguard Target Retirement 2055 Fund
Vanguard Target Retirement 2060 Fund
A new format, unwavering commitment
As you begin reading this report, you’ll notice that we’ve made some improvements to the opening sections—based on feedback from you, our clients.
Page 1 starts with a new ”Your Fund’s Performance at a Glance,” a concise, handy summary of how your fund performed during the period.
In the renamed ”Chairman’s Perspective,” Bill McNabb will focus on enduring principles and investment insights.
We’ve modified some tables, and eliminated some redundancy, but we haven’t removed any information.
At Vanguard, we’re always looking for better ways to communicate and to help you make sound investment decisions. Thank you for entrusting your assets to us.
| |
| Contents | |
| Your Fund’s Performance at a Glance. | 1 |
| Chairman’s Perspective. | 4 |
| Target Retirement 2035 Fund. | 7 |
| Target Retirement 2040 Fund. | 18 |
| Target Retirement 2045 Fund. | 29 |
| Target Retirement 2050 Fund. | 40 |
| Target Retirement 2055 Fund. | 51 |
| Target Retirement 2060 Fund. | 62 |
| Your Fund’s After-Tax Returns. | 75 |
| About Your Fund’s Expenses. | 77 |
| Glossary. | 79 |
Please note: The opinions expressed in this report are just that—informed opinions. They should not be considered promises or advice. Also, please keep in mind that the information and opinions cover the period through the date on the front of this report. Of course, the risks of investing in your fund are spelled out in the prospectus.
See the Glossary for definitions of investment terms used in this report.
About the cover: No matter what language you speak, Vanguard has one consistent message and set of principles. Our primary focus is on you, our clients. We conduct our business with integrity as a faithful steward of your assets. This message is shown translated into seven languages, reflecting our expanding global presence.
Your Fund’s Performance at a Glance
• For the 12 months ended September 30, 2016, both domestic and international stock markets made strong gains, returning about 15% and about 9%, respectively.
• Global fixed income markets also turned in solid results: U.S. bonds returned about 5%; international bonds returned about 8% for U.S.-based investors.
• Against this backdrop, the six Vanguard Target Retirement Funds covered in this report produced returns ranging from 11.64% for the Target Retirement 2035 Fund to 12.16% for the Target Retirement 2045 Fund. (Funds with retirement dates of 2010 through 2030, as well as the Target Retirement Income Fund, are covered in a separate report.)
• Each fund posted returns that were in line with those of its composite benchmark after expenses. All of the funds surpassed the average return of their respective peer groups.
| |
| Total Returns: Fiscal Year Ended September 30, 2016 | |
| | Total |
| | Returns |
| Vanguard Target Retirement 2035 Fund | 11.64% |
| Target 2035 Composite Index | 12.02 |
| Mixed-Asset Target 2035 Funds Average | 10.74 |
| Mixed-Asset Target 2035 Funds Average: Derived from data provided by Lipper, a Thomson Reuters Company. | |
| |
| Vanguard Target Retirement 2040 Fund | 12.11% |
| Target 2040 Composite Index | 12.51 |
| Mixed-Asset Target 2040 Funds Average | 11.06 |
| Mixed-Asset Target 2040 Funds Average: Derived from data provided by Lipper, a Thomson Reuters Company. | |
| |
| Vanguard Target Retirement 2045 Fund | 12.16% |
| Target 2045 Composite Index | 12.59 |
| Mixed-Asset Target 2045 Funds Average | 11.23 |
| Mixed-Asset Target 2045 Funds Average: Derived from data provided by Lipper, a Thomson Reuters Company. | |
| |
| Vanguard Target Retirement 2050 Fund | 12.14% |
| Target 2050 Composite Index | 12.59 |
| Mixed-Asset Target 2050 Funds Average | 11.48 |
| Mixed-Asset Target 2050 Funds Average: Derived from data provided by Lipper, a Thomson Reuters Company. | |
1
| |
| | Total |
| | Returns |
| Vanguard Target Retirement 2055 Fund | 12.13% |
| Target 2055 Composite Index | 12.59 |
| Mixed-Asset Target 2055+ Funds Average | 11.26 |
| Mixed-Asset Target 2055+ Funds Average: Derived from data provided by Lipper, a Thomson Reuters Company. | |
| |
| Vanguard Target Retirement 2060 Fund | 12.13% |
| Target 2060 Composite Index | 12.59 |
| Mixed-Asset Target 2055+ Funds Average | 11.26 |
| Mixed-Asset Target 2055+ Funds Average: Derived from data provided by Lipper, a Thomson Reuters Company. | |
| For a benchmark description, see the Glossary. | |
Investments in Target Retirement Funds are subject to the risks of their underlying funds. The year in the fund name refers to the approximate year (the target date) when an investor in the fund would retire and leave the work force. The fund will gradually shift its emphasis from more aggressive investments to more conservative ones based on its target date. An investment in a Target Retirement Fund is not guaranteed at any time, including on or after the target date.
| |
| Total Returns: Ten Years Ended September 30, 2016 | |
| | Average |
| | Annual Return |
| Target Retirement 2035 Fund | 5.74% |
| Target 2035 Composite Index | 5.88 |
| Mixed-Asset Target 2035 Funds Average | 4.77 |
| Mixed-Asset Target 2035 Funds Average: Derived from data provided by Lipper, a Thomson Reuters Company. | |
| |
| Target Retirement 2040 Fund | 5.87% |
| Target 2040 Composite Index | 6.01 |
| Mixed-Asset Target 2040 Funds Average | 4.56 |
| Mixed-Asset Target 2040 Funds Average: Derived from data provided by Lipper, a Thomson Reuters Company. | |
| |
| Target Retirement 2045 Fund | 5.87% |
| Target 2045 Composite Index | 6.01 |
| Mixed-Asset Target 2045 Funds Average | 4.91 |
| Mixed-Asset Target 2045 Funds Average: Derived from data provided by Lipper, a Thomson Reuters Company. | |
| |
| Target Retirement 2050 Fund | 5.87% |
| Target 2050 Composite Index | 6.01 |
| Mixed-Asset Target 2050 Funds Average | 4.79 |
| Mixed-Asset Target 2050 Funds Average: Derived from data provided by Lipper, a Thomson Reuters Company. | |
| |
| Target Retirement 2055 Fund (Returns since inception: 8/18/2010) | 10.38% |
| Target 2055 Composite Index | 10.63 |
| Spliced Mixed-Asset Target 2055+ Funds Average | 9.27 |
| Spliced Mixed-Asset Target 2055+ Funds Average: Derived from data provided by Lipper, a Thomson Reuters Company. | |
2
| |
| | Average |
| | Annual Return |
| Target Retirement 2060 Fund (Returns since inception: 1/19/2012) | 9.91% |
| Target 2060 Composite Index | 10.19 |
| Spliced Mixed-Asset Target 2055+ Funds Average | 8.99 |
| Spliced Mixed-Asset Target 2055+ Funds Average: Derived from data provided by Lipper, a Thomson Reuters Company. | |
For a benchmark description, see the Glossary.
The figures shown represent past performance, which is not a guarantee of future results. (Current performance may be lower or higher than the performance data cited. For performance data current to the most recent month-end, visit our website at vanguard.com/performance.) Note, too, that both investment returns and principal value can fluctuate widely, so an investor’s shares, when sold, could be worth more or less than their original cost.
| | |
| Expense Ratios | | |
| Your Fund Compared With Its Peer Group | | |
| |
| | Acquired Fund Fees | Peer Group |
| | and Expenses | Average |
| Target Retirement 2035 Fund | 0.15% | 0.41% |
| Target Retirement 2040 Fund | 0.16 | 0.46 |
| Target Retirement 2045 Fund | 0.16 | 0.41 |
| Target Retirement 2050 Fund | 0.16 | 0.43 |
| Target Retirement 2055 Fund | 0.16 | 0.37 |
| Target Retirement 2060 Fund | 0.16 | 0.37 |
The fund expense figures shown—drawn from the prospectus dated January 28, 2016—represent an estimate of the weighted average of the expense ratios and any transaction fees charged by the underlying mutual funds (the ”acquired” funds) in which the Target Retirement Funds invest. The Target Retirement Funds do not charge any expenses or fees of their own. For the fiscal year ended September 30, 2016, the acquired fund fees and expenses were 0.15% for the 2035 Fund, 0.16% for the 2040 Fund, 0.16% for the 2045 Fund, 0.16% for the 2050 Fund, 0.16% for the 2055 Fund, and 0.16% for the 2060 Fund. Peer-group expense ratios are derived from data provided by Lipper, a Thomson Reuters Company, and capture information through year-end 2015.
Peer groups: For the 2035 Fund, Mixed-Asset Target 2035 Funds; for the 2040 Fund, Mixed-Asset Target 2040 Funds; for the 2045 Fund, Mixed-Asset Target 2045 Funds; for the 2050 Fund, Mixed-Asset Target 2050 Funds; for the 2055 and 2060 Funds, Mixed-Asset Target 2055+ Funds.
3
Chairman’s Perspective

Bill McNabb
Chairman and Chief Executive Officer
Dear Shareholder,
If you think you’ve had reason to feel uneasy about the investment environment lately, you’re not imagining things. In just the past few months, we’ve seen economic uncertainty, intense political polarization, and super-low bond yields. Yet at the same time, the stock market kept pushing higher.
In this confusing and sometimes contradictory climate, you may be asking yourself a question that I hear often: How do I make sense of all this, keep investing, and still get a good night’s sleep?
As with any problem, there are multiple ways to go at it. But there’s one approach in particular that is simple, straightforward, and nearly foolproof: Save more money. Not only can saving more give you a greater sense of control over your investment plan, it can help compensate for long-term returns that, in our estimation, could fall short of historical averages.
I love the way one of our investment pros put it. Fran Kinniry this summer told The Wall Street Journal, “Investing is always a partnership between you and the markets.” He explained that the markets carried more than their fair share of the weight for a couple of decades, through the 1990s, providing outsized returns that made the investor’s half of the partnership relatively light work. “But now you are going to have to be the majority partner.”
Sobering? Sure. Hopeless? Definitely not.
4
Over the 12 months since last September, U.S. stocks returned 15%, though the rise has not been a one-way ticket straight up. International markets have also posted strong returns, but lower than those of the broad U.S. market. The decision by United Kingdom voters in June to exit the European Union came as a surprise but caused market heartburn for only a few days.
In fixed income, yields remained extremely low—about 1.60% on the 10-year U.S. Treasury note at the end of September, after dipping below 1.40% over the summer. And bond yields in some international markets were negative.
Even this relatively small window of time illustrates a truism of the financial markets: There will always be segments that perform well and others that don’t. Saving more saves you from trying to control the uncontrollable—how economies and the markets perform. And it keeps you in control of one of the most vital parts of your investment program.
Although the “save more” logic is easy to grasp, it’s not always easy to follow. Bills, illness, the loss of a job—these can affect any of us.
But whatever our circumstances, figuring out how to save more is worth the effort. It requires that we make difficult decisions to forgo some consumption today to increase the likelihood of consuming (or consuming more) in the future. This is the very heart of investing. Sacrifices are never fun, so consider carrying them out systematically and in doses that you
| | | |
| Market Barometer | | | |
| | | Average Annual Total Returns |
| | | Periods Ended September 30, 2016 |
| | One | Three | Five |
| | Year | Years | Years |
| Stocks | | | |
| Russell 1000 Index (Large-caps) | 14.93% | 10.78% | 16.41% |
| Russell 2000 Index (Small-caps) | 15.47 | 6.71 | 15.82 |
| Russell 3000 Index (Broad U.S. market) | 14.96 | 10.44 | 16.36 |
| FTSE All-World ex US Index (International) | 9.62 | 0.71 | 6.50 |
| |
| Bonds | | | |
| Bloomberg Barclays U.S. Aggregate Bond Index | | | |
| (Broad taxable market) | 5.19% | 4.03% | 3.08% |
| Bloomberg Barclays Municipal Bond Index | | | |
| (Broad tax-exempt market) | 5.58 | 5.54 | 4.48 |
| Citigroup Three-Month U.S. Treasury Bill Index | 0.20 | 0.06 | 0.06 |
| |
| CPI | | | |
| Consumer Price Index | 1.46% | 1.03% | 1.25% |
5
can be comfortable with—for instance, gradually getting up to the max in your IRA, or adding a percentage point or so to the amount you stash in your employer’s retirement plan. As a point of reference, we generally suggest that investors strive for a retirement savings rate of 12%–15%, including any employer contributions.
If you need more convincing about the wisdom of the “save more” course of action, it might be helpful to examine your alternatives. This list is by no means exhaustive, but it hits on a few of the big ones, and none are without risk.
• Reach for yield. With yields so low on many types of bonds, it’s tempting to find the corners of the fixed income market where payouts are juicier. But with the juice comes considerable risk. You need to be aware that you’d be taking on more risk—and how much more.
• Go all-in on a hot-performing asset class or fund. By now, you know better than that, right?
• Sit tight. This approach isn’t a terrible idea; it’s better than panicking and deciding to just “do something,” particularly if that means changing your approach in response to the market’s movements.
Here’s the inescapably challenging part of your partnership with the markets: In the short run, your “partner” is fickle, emotional, and wildly unpredictable. But in the long run, your partner is mostly rational and extremely helpful.
The best way to minimize your vulnerability to the market’s mood swings, and to maximize the benefit of your partner’s longer-term strengths, is to expect less and save more. Maybe the markets will deliver better-than-expected returns. Maybe they’ll be consistent with our more modest expectations. In either case, a higher savings rate can help put you in a better position to reach your goals.
As always, thank you for investing with Vanguard.
Sincerely,

F. William McNabb III
Chairman and Chief Executive Officer
October 18, 2016
6
Target Retirement 2035 Fund
Fund Profile
As of September 30, 2016
| |
| Total Fund Characteristics | |
| |
| Ticker Symbol | VTTHX |
| 30-Day SEC Yield | 2.10% |
| Acquired Fund Fees and Expenses1 | 0.15% |
| |
| Allocation to Underlying Vanguard Funds | |
| Vanguard Total Stock Market Index Fund | |
| Investor Shares | 48.3% |
| Vanguard Total International Stock Index | |
| Fund Investor Shares | 32.1 |
| Vanguard Total Bond Market II Index Fund | |
| Investor Shares | 14.0 |
| Vanguard Total International Bond Index | |
| Fund Investor Shares | 5.6 |
| | |
| Total Fund Volatility Measures | |
| | Target 2035 | MSCI US |
| | Composite | Broad Market |
| | Index | Index |
| R-Squared | 1.00 | 0.96 |
| Beta | 0.99 | 0.81 |
These measures show the degree and timing of the fund’s fluctuations compared with the indexes over 36 months.
Fund Asset Allocation
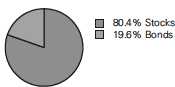
1 This figure—drawn from the prospectus dated January 28, 2016—represents an estimate of the weighted average of the expense ratios and any transaction fees charged by the underlying mutual funds (the ”acquired” funds) in which the Target Retirement 2035 Fund invests. The fund does not charge any expenses or fees of its own. For the fiscal year ended September 30, 2016, the acquired fund fees and expenses were 0.15%.
7
Target Retirement 2035 Fund
Performance Summary
All of the returns in this report represent past performance, which is not a guarantee of future results that may be achieved by the fund. (Current performance may be lower or higher than the performance data cited. For performance data current to the most recent month-end, visit our website at vanguard.com/performance.) Note, too, that both investment returns and principal value can fluctuate widely, so an investor’s shares, when sold, could be worth more or less than their original cost. The returns shown do not reflect taxes that a shareholder would pay on fund distributions or on the sale of fund shares.
Cumulative Performance: September 30, 2006, Through September 30, 2016
Initial Investment of $10,000
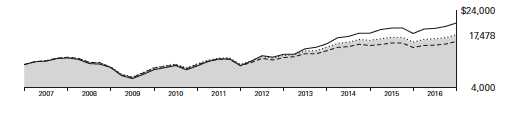
| | | | | |
| | | Average Annual Total Returns | |
| | | Periods Ended September 30, 2016 | |
| | | | | | Final Value |
| | | One | Five | Ten | of a $10,000 |
| | | Year | Years | Years | Investment |
| | Target Retirement 2035 Fund | 11.64% | 11.83% | 5.74% | $17,478 |
| •••••••• | Target 2035 Composite Index | 12.02 | 12.03 | 5.88 | 17,706 |
| – – – – | Mixed-Asset Target 2035 Funds | | | | |
| |
| | MSCI Average US Broad Market Index | 15.02 10.74 | 16.42 10.43 | 7.56 4.77 | 20,734 15,941 |
| For a benchmark description, see the Glossary. | | | | |
| Mixed-Asset Target 2035 Funds Average: Derived from data provided by Lipper, a Thomson Reuters Company. | |
See Financial Highlights for dividend and capital gains information.
8
Target Retirement 2035 Fund
Fiscal-Year Total Returns (%): September 30, 2006, Through September 30, 2016
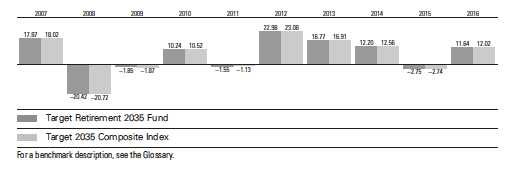
9
Target Retirement 2035 Fund
Financial Statements
Statement of Net Assets
As of September 30, 2016
The fund reports a complete list of its holdings in regulatory filings four times in each fiscal year, at the quarter-ends. For the second and fourth fiscal quarters, the lists appear in the fund’s semiannual and annual reports to shareholders. For the first and third fiscal quarters, the fund files the lists with the Securities and Exchange Commission on Form N-Q. Shareholders can look up the fund’s Forms N-Q on the SEC’s website at sec.gov. Forms N-Q may also be reviewed and copied at the SEC’s Public Reference Room (see the back cover of this report for further information).
| | |
| | | Market |
| | | Value• |
| | Shares | ($000) |
| Investment Companies (100.0%) | | |
| U.S. Stock Fund (48.3%) | | |
| Vanguard Total Stock Market Index Fund Investor Shares | 218,510,832 | 11,838,917 |
| |
| International Stock Fund (32.1%) | | |
| Vanguard Total International Stock Index Fund Investor Shares | 520,026,585 | 7,873,202 |
| |
| U.S. Bond Fund (14.0%) | | |
| 1 Vanguard Total Bond Market II Index Fund Investor Shares | 311,037,868 | 3,433,858 |
| |
| International Bond Fund (5.6%) | | |
| Vanguard Total International Bond Index Fund Investor Shares | 124,021,897 | 1,385,325 |
| Total Investment Companies (Cost $18,690,703) | | 24,531,302 |
| Temporary Cash Investment (0.0%) | | |
| Money Market Fund (0.0%) | | |
| 1 Vanguard Market Liquidity Fund, 0.640% (Cost $10,393) | 103,918 | 10,393 |
| Total Investments (100.0%) (Cost $18,701,096) | | 24,541,695 |
| Other Assets and Liabilities (0.0%) | | |
| Other Assets | | 168,523 |
| Liabilities | | (179,612) |
| | | (11,089) |
| Net Assets (100%) | | |
| Applicable to 1,356,156,227 outstanding $.001 par value shares of | | |
| beneficial interest (unlimited authorization) | | 24,530,606 |
| Net Asset Value Per Share | | $18.09 |
10
| |
| Target Retirement 2035 Fund | |
| |
| |
| |
| |
| | Amount |
| | ($000) |
| Statement of Assets and Liabilities | |
| Assets | |
| Investments in Securities, at Value—Affiliated Vanguard Funds | 24,541,695 |
| Receivables for Investment Securities Sold | 134,069 |
| Receivables for Accrued Income | 7,778 |
| Receivables for Capital Shares Issued | 26,676 |
| Total Assets | 24,710,218 |
| Liabilities | |
| Payables for Investment Securities Purchased | 10,692 |
| Payables for Capital Shares Redeemed | 168,920 |
| Total Liabilities | 179,612 |
| Net Assets | 24,530,606 |
| |
| |
| At September 30, 2016, net assets consisted of: | |
| | Amount |
| | ($000) |
| Paid-in Capital | 18,195,292 |
| Undistributed Net Investment Income | 319,758 |
| Accumulated Net Realized Gains | 174,957 |
| Unrealized Appreciation (Depreciation) | 5,840,599 |
| Net Assets | 24,530,606 |
• See Note A in Notes to Financial Statements.
1 Affiliated fund available only to Vanguard funds and certain trusts and accounts managed by Vanguard. Rate shown for Vanguard Market
Liquidity Fund is the 7-day yield.
See accompanying Notes, which are an integral part of the Financial Statements.
11
| |
| Target Retirement 2035 Fund | |
| |
| |
| Statement of Operations | |
| |
| | Year Ended |
| | September 30, 2016 |
| | ($000) |
| Investment Income | |
| Income | |
| Income Distributions Received from Affiliated Funds | 512,016 |
| Other Income | 251 |
| Net Investment Income—Note B | 512,267 |
| Realized Net Gain (Loss) | |
| Capital Gain Distributions Received from Affiliated Funds | 4,448 |
| Affiliated Investment Securities Sold | 314,236 |
| Realized Net Gain (Loss) | 318,684 |
| Change in Unrealized Appreciation (Depreciation) of Investment Securities | 1,756,197 |
| Net Increase (Decrease) in Net Assets Resulting from Operations | 2,587,148 |
See accompanying Notes, which are an integral part of the Financial Statements.
12
| | |
| Target Retirement 2035 Fund | | |
| |
| |
| Statement of Changes in Net Assets | | |
| |
| | Year Ended September 30, |
| | 2016 | 2015 |
| | ($000) | ($000) |
| Increase (Decrease) in Net Assets | | |
| Operations | | |
| Net Investment Income | 512,267 | 529,949 |
| Realized Net Gain (Loss) | 318,684 | 524,472 |
| Change in Unrealized Appreciation (Depreciation) | 1,756,197 | (1,751,937) |
| Net Increase (Decrease) in Net Assets Resulting from Operations | 2,587,148 | (697,516) |
| Distributions | | |
| Net Investment Income | (480,079) | (497,432) |
| Realized Capital Gain1 | (537,016) | (6,759) |
| Total Distributions | (1,017,095) | (504,191) |
| Capital Share Transactions | | |
| Issued | 5,337,665 | 6,526,703 |
| Issued in Lieu of Cash Distributions | 999,667 | 495,804 |
| Redeemed | (6,177,230) | (6,846,464) |
| Net Increase (Decrease) from Capital Share Transactions | 160,102 | 176,043 |
| Total Increase (Decrease) | 1,730,155 | (1,025,664) |
| Net Assets | | |
| Beginning of Period | 22,800,451 | 23,826,115 |
| End of Period2 | 24,530,606 | 22,800,451 |
1 Includes fiscal 2016 and 2015 short-term gain distributions totaling $36,232,000 and $6,759,000, respectively. Short-term gain distributions are treated as ordinary income dividends for tax purposes.
2 Net Assets—End of Period includes undistributed (overdistributed) net investment income of $319,758,000 and $338,797,000.
See accompanying Notes, which are an integral part of the Financial Statements.
13
| | | | | |
| Target Retirement 2035 Fund | | | | | |
| |
| |
| Financial Highlights | | | | | |
| |
| |
| For a Share Outstanding | | | Year Ended September 30, |
| Throughout Each Period | 2016 | 2015 | 2014 | 2013 | 2012 |
| Net Asset Value, Beginning of Period | $16.95 | $17.79 | $16.16 | $14.15 | $11.77 |
| Investment Operations | | | | | |
| Net Investment Income | .393 | .391 | .359 | .340 | .344 |
| Capital Gain Distributions Received | .003 | .007 | .001 | .011 | .016 |
| Net Realized and Unrealized Gain (Loss) | | | | | |
| on Investments | 1.530 | (.865) | 1.594 | 1.972 | 2.307 |
| Total from Investment Operations | 1.926 | (.467) | 1.954 | 2.323 | 2.667 |
| Distributions | | | | | |
| Dividends from Net Investment Income | (. 371) | (. 368) | (. 324) | (. 307) | (. 281) |
| Distributions from Realized Capital Gains | (. 415) | (. 005) | — | (. 006) | (. 006) |
| Total Distributions | (.786) | (. 373) | (. 324) | (. 313) | (. 287) |
| Net Asset Value, End of Period | $18.09 | $16.95 | $17.79 | $16.16 | $14.15 |
| |
| Total Return1 | 11.64% | -2.75% | 12.20% | 16.77% | 22.98% |
| |
| Ratios/Supplemental Data | | | | | |
| Net Assets, End of Period (Millions) | $24,531 | $22,800 | $23,826 | $19,026 | $14,220 |
| Ratio of Total Expenses to Average Net Assets | — | — | — | — | — |
| Acquired Fund Fees and Expenses | 0.15% | 0.15% | 0.18% | 0.18% | 0.18% |
| Ratio of Net Investment Income to | | | | | |
| Average Net Assets | 2.21% | 2.07% | 2.17% | 2.33% | 2.68% |
| Portfolio Turnover Rate | 14% | 23% | 6% | 12% | 6% |
1 Total returns do not include account service fees that may have applied in the periods shown. Fund prospectuses provide information about any applicable account service fees.
See accompanying Notes, which are an integral part of the Financial Statements.
14
Target Retirement 2035 Fund
Notes to Financial Statements
Vanguard Target Retirement 2035 Fund is registered under the Investment Company Act of 1940 as an open-end investment company, or mutual fund. The fund follows a balanced investment strategy by investing in selected Vanguard funds to achieve its targeted allocation of assets to U.S. and international stocks, and U.S. and international bonds. Financial statements and other information about each underlying fund are available on vanguard.com.
A. The following significant accounting policies conform to generally accepted accounting principles for U.S. investment companies. The fund consistently follows such policies in preparing its financial statements.
1. Security Valuation: Investments are valued at the net asset value of each underlying Vanguard fund determined as of the close of the New York Stock Exchange (generally 4 p.m., Eastern time) on the valuation date.
2. Federal Income Taxes: The fund intends to continue to qualify as a regulated investment company and distribute all of its taxable income. Management has analyzed the fund’s tax positions taken for all open federal income tax years (September 30, 2013–2016), and has concluded that no provision for federal income tax is required in the fund’s financial statements.
3. Distributions: Distributions to shareholders are recorded on the ex-dividend date.
4. Credit Facility: The fund and certain other funds managed by The Vanguard Group (“Vanguard”) participate in a $3.1 billion committed credit facility provided by a syndicate of lenders pursuant to a credit agreement that may be renewed annually; each fund is individually liable for its borrowings, if any, under the credit facility. Borrowings may be utilized for temporary and emergency purposes, and are subject to the fund’s regulatory and contractual borrowing restrictions. The participating funds are charged administrative fees and an annual commitment fee of 0.10% of the undrawn amount of the facility; these fees are allocated to the funds based on a method approved by the fund’s board of trustees and borne by the funds in which the fund invests (see Note B). Any borrowings under this facility bear interest at a rate based upon the higher of the one-month London Interbank Offered Rate, federal funds effective rate, or overnight bank funding rate plus an agreed-upon spread.
The fund had no borrowings outstanding at September 30, 2016, or at any time during the period then ended.
5. Other: Income and capital gain distributions received are recorded on the ex-dividend date. Security transactions are accounted for on the date securities are bought or sold. Costs used to determine realized gains (losses) on the sale of investment securities are those of the specific securities sold.
B. In accordance with the terms of a Funds’ Service Agreement (the “FSA”) between Vanguard and the fund, Vanguard furnishes to the fund investment advisory, corporate management, administrative, marketing, and distribution services at Vanguard’s cost of operations (as defined by the FSA). These costs of operations are allocated to the fund based on methods and guidelines approved by the board of trustees. The FSA provides that expenses otherwise allocable to Vanguard funds-of-funds may be reduced or eliminated to the extent of savings realized by the underlying Vanguard funds by virtue of being part of a fund-of-funds. Accordingly, all expenses for services provided by Vanguard to the fund and all other expenses incurred by the fund during the period ended September 30, 2016, were borne by the underlying Vanguard funds in which the fund invests. The fund’s trustees and officers are also trustees and officers, respectively, of the underlying Vanguard funds, as well as directors and employees, respectively, of Vanguard.
15
Target Retirement 2035 Fund
C. Various inputs may be used to determine the value of the fund’s investments. These inputs are summarized in three broad levels for financial statement purposes. The inputs or methodologies used to value securities are not necessarily an indication of the risk associated with investing in those securities.
Level 1—Quoted prices in active markets for identical securities.
Level 2—Other significant observable inputs (including quoted prices for similar securities, interest rates, prepayment speeds, credit risk, etc.).
Level 3—Significant unobservable inputs (including the fund’s own assumptions used to determine the fair value of investments).
At September 30, 2016, 100% of the market value of the fund’s investments was determined based on Level 1 inputs.
D. Distributions are determined on a tax basis and may differ from net investment income and realized capital gains for financial reporting purposes. Differences may be permanent or temporary. Permanent differences are reclassified among capital accounts in the financial statements to reflect their tax character. Temporary differences arise when certain items of income, expense, gain, or loss are recognized in different periods for financial statement and tax purposes. These differences will reverse at some time in the future. Differences in classification may also result from the treatment of short-term gains as ordinary income for tax purposes.
The fund used a tax accounting practice to treat a portion of the price of capital shares redeemed during the year as distributions from net investment income and realized capital gains. Accordingly, the fund has reclassified $51,227,000 from undistributed net investment income, and $61,131,000 from accumulated net realized gains, to paid-in capital.
For tax purposes, at September 30, 2016, the fund had $321,781,000 of ordinary income and $172,933,000 of long-term capital gains available for distribution.
At September 30, 2016, the cost of investment securities for tax purposes was $18,701,096,000. Net unrealized appreciation of investment securities for tax purposes was $5,840,599,000, consisting of unrealized gains of $5,974,939,000 on securities that had risen in value since their purchase and $134,340,000 in unrealized losses on securities that had fallen in value since their purchase.
| E. | Capital shares issued and redeemed were: |
| | |
| | Year Ended September 30, |
| | 2016 | 2015 |
| | Shares | Shares |
| | (000) | (000) |
| Issued | 311,062 | 360,451 |
| Issued in Lieu of Cash Distributions | 58,597 | 27,499 |
| Redeemed | (358,384) | (382,190) |
| Net Increase (Decrease) in Shares Outstanding | 11,275 | 5,760 |
16
Target Retirement 2035 Fund
| | | | | | |
| F. Transactions during the period in affiliated underlying Vanguard funds were as follows: | |
| | | | Current Period Transactions | |
| | Sept. 30, | | Proceeds | | | Sept. 30, |
| | 2015 | | from | | Capital Gain | 2016 |
| | Market | Purchases | Securities | | Distributions | Market |
| | Value | at Cost | Sold | Income | Received | Value |
| | ($000) | ($000) | ($000) | ($000) | ($000) | ($000) |
| Vanguard Market Liquidity Fund | 9,770 | NA1 | NA1 | 31 | — | 10,393 |
| Vanguard Total Bond Market II | | | | | | |
| Index Fund | 2,902,432 | 1,256,060 | 803,521 | 71,618 | 4,448 | 3,433,858 |
| Vanguard Total International | | | | | | |
| Bond Index Fund | 1,226,912 | 247,607 | 160,733 | 19,276 | — | 1,385,325 |
| Vanguard Total International | | | | | | |
| Stock Index Fund | 7,467,258 | 781,893 | 897,404 | 211,773 | — | 7,873,202 |
| Vanguard Total Stock Market | | | | | | |
| Index Fund | 11,210,334 | 897,358 | 1,667,327 | 209,318 | — | 11,838,917 |
| Total | 22,816,706 | 3,182,918 | 3,528,985 | 512,016 | 4,448 | 24,541,695 |
| 1 Not applicable—purchases and sales are for temporary cash investment purposes. | | | |
G. Management has determined that no material events or transactions occurred subsequent to September 30, 2016, that would require recognition or disclosure in these financial statements.
17
Target Retirement 2040 Fund
Fund Profile
As of September 30, 2016
| |
| Total Fund Characteristics | |
| |
| Ticker Symbol | VFORX |
| 30-Day SEC Yield | 2.12% |
| Acquired Fund Fees and Expenses1 | 0.16% |
| |
| Allocation to Underlying Vanguard Funds | |
| Vanguard Total Stock Market Index Fund | |
| Investor Shares | 52.8% |
| Vanguard Total International Stock Index | |
| Fund Investor Shares | 35.1 |
| Vanguard Total Bond Market II Index Fund | |
| Investor Shares | 8.7 |
| Vanguard Total International Bond Index | |
| Fund Investor Shares | 3.4 |
| | |
| Total Fund Volatility Measures | |
| | Target 2040 | MSCI US |
| | Composite | Broad Market |
| | Index | Index |
| R-Squared | 1.00 | 0.96 |
| Beta | 0.98 | 0.88 |
These measures show the degree and timing of the fund’s fluctuations compared with the indexes over 36 months.
Fund Asset Allocation
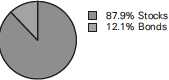
1 This figure—drawn from the prospectus dated January 28, 2016—represents an estimate of the weighted average of the expense ratios and any transaction fees charged by the underlying mutual funds (the ”acquired” funds) in which the Target Retirement 2040 Fund invests. The fund does not charge any expenses or fees of its own. For the fiscal year ended September 30, 2016, the acquired fund fees and expenses were 0.16%.
18
Target Retirement 2040 Fund
Performance Summary
All of the returns in this report represent past performance, which is not a guarantee of future results that may be achieved by the fund. (Current performance may be lower or higher than the performance data cited. For performance data current to the most recent month-end, visit our website at vanguard.com/performance.) Note, too, that both investment returns and principal value can fluctuate widely, so an investor’s shares, when sold, could be worth more or less than their original cost. The returns shown do not reflect taxes that a shareholder would pay on fund distributions or on the sale of fund shares.
Cumulative Performance: September 30, 2006, Through September 30, 2016
Initial Investment of $10,000
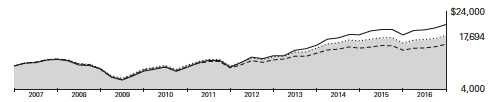
| | | | | |
| | | Average Annual Total Returns | |
| | | Periods Ended September 30, 2016 | |
| | | | | | Final Value |
| | | One | Five | Ten | of a $10,000 |
| | | Year | Years | Years | Investment |
| | Target Retirement 2040 Fund | 12.11% | 12.13% | 5.87% | $17,694 |
| •••••••• | Target 2040 Composite Index | 12.51 | 12.37 | 6.01 | 17,926 |
| – – – – | Mixed-Asset Target 2040 Funds | | | | |
| |
| | MSCI Average US Broad Market Index | 15.02 11.06 | 16.42 10.43 | 7.56 4.56 | 20,734 15,624 |
| For a benchmark description, see the Glossary. | | | | |
| Mixed-Asset Target 2040 Funds Average: Derived from data provided by Lipper, a Thomson Reuters Company. | |
See Financial Highlights for dividend and capital gains information.
19
Target Retirement 2040 Fund
Fiscal-Year Total Returns (%): September 30, 2006, Through September 30, 2016
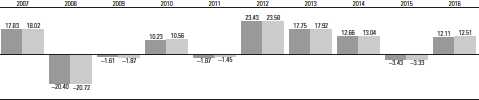
Target Retirement 2040 Fund
Target 2040 Composite Index
For a benchmark description, see the Glossary.
20
Target Retirement 2040 Fund
Financial Statements
Statement of Net Assets
As of September 30, 2016
The fund reports a complete list of its holdings in regulatory filings four times in each fiscal year, at the quarter-ends. For the second and fourth fiscal quarters, the lists appear in the fund’s semiannual and annual reports to shareholders. For the first and third fiscal quarters, the fund files the lists with the Securities and Exchange Commission on Form N-Q. Shareholders can look up the fund’s Forms N-Q on the SEC’s website at sec.gov. Forms N-Q may also be reviewed and copied at the SEC’s Public Reference Room (see the back cover of this report for further information).
| | |
| | | Market |
| | | Value• |
| | Shares | ($000) |
| Investment Companies (99.9%) | | |
| U.S. Stock Fund (52.8%) | | |
| Vanguard Total Stock Market Index Fund Investor Shares | 169,366,107 | 9,176,256 |
| |
| International Stock Fund (35.0%) | | |
| Vanguard Total International Stock Index Fund Investor Shares | 402,336,579 | 6,091,376 |
| |
| U.S. Bond Fund (8.7%) | | |
| 1 Vanguard Total Bond Market II Index Fund Investor Shares | 136,505,081 | 1,507,016 |
| |
| International Bond Fund (3.4%) | | |
| Vanguard Total International Bond Index Fund Investor Shares | 53,042,034 | 592,479 |
| Total Investment Companies (Cost $13,426,521) | | 17,367,127 |
| Temporary Cash Investment (0.1%) | | |
| Money Market Fund (0.1%) | | |
| 1 Vanguard Market Liquidity Fund, 0.640% (Cost $12,522) | 125,205 | 12,522 |
| Total Investments (100.0%) (Cost $13,439,043) | | 17,379,649 |
| Other Assets and Liabilities (0.0%) | | |
| Other Assets | | 107,305 |
| Liabilities | | (115,883) |
| | | (8,578) |
| Net Assets (100%) | | |
| Applicable to 567,938,217 outstanding $.001 par value shares of | | |
| beneficial interest (unlimited authorization) | | 17,371,071 |
| Net Asset Value Per Share | | $30.59 |
21
| |
| Target Retirement 2040 Fund | |
| |
| |
| |
| |
| | Amount |
| | ($000) |
| Statement of Assets and Liabilities | |
| Assets | |
| Investments in Securities, at Value—Affiliated Vanguard Funds | 17,379,649 |
| Receivables for Investment Securities Sold | 81,148 |
| Receivables for Accrued Income | 3,567 |
| Receivables for Capital Shares Issued | 22,590 |
| Total Assets | 17,486,954 |
| Liabilities | |
| Payables for Investment Securities Purchased | 3,266 |
| Payables for Capital Shares Redeemed | 112,617 |
| Total Liabilities | 115,883 |
| Net Assets | 17,371,071 |
| |
| |
| At September 30, 2016, net assets consisted of: | |
| | Amount |
| | ($000) |
| Paid-in Capital | 13,142,215 |
| Undistributed Net Investment Income | 225,359 |
| Accumulated Net Realized Gains | 62,891 |
| Unrealized Appreciation (Depreciation) | 3,940,606 |
| Net Assets | 17,371,071 |
• See Note A in Notes to Financial Statements.
1 Affiliated fund available only to Vanguard funds and certain trusts and accounts managed by Vanguard. Rate shown for Vanguard Market
Liquidity Fund is the 7-day yield.
See accompanying Notes, which are an integral part of the Financial Statements.
22
| |
| Target Retirement 2040 Fund | |
| |
| |
| Statement of Operations | |
| |
| | Year Ended |
| | September 30, 2016 |
| | ($000) |
| Investment Income | |
| Income | |
| Income Distributions Received from Affiliated Funds | 358,337 |
| Other Income | 301 |
| Net Investment Income—Note B | 358,638 |
| Realized Net Gain (Loss) | |
| Capital Gain Distributions Received from Affiliated Funds | 1,831 |
| Affiliated Investment Securities Sold | 132,625 |
| Realized Net Gain (Loss) | 134,456 |
| Change in Unrealized Appreciation (Depreciation) of Investment Securities | 1,383,092 |
| Net Increase (Decrease) in Net Assets Resulting from Operations | 1,876,186 |
See accompanying Notes, which are an integral part of the Financial Statements.
23
| | |
| Target Retirement 2040 Fund | | |
| |
| |
| Statement of Changes in Net Assets | | |
| |
| | Year Ended September 30, |
| | 2016 | 2015 |
| | ($000) | ($000) |
| Increase (Decrease) in Net Assets | | |
| Operations | | |
| Net Investment Income | 358,638 | 365,424 |
| Realized Net Gain (Loss) | 134,456 | 100,794 |
| Change in Unrealized Appreciation (Depreciation) | 1,383,092 | (1,099,235) |
| Net Increase (Decrease) in Net Assets Resulting from Operations | 1,876,186 | (633,017) |
| Distributions | | |
| Net Investment Income | (329,503) | (314,420) |
| Realized Capital Gain1 | (125,908) | (9,312) |
| Total Distributions | (455,411) | (323,732) |
| Capital Share Transactions | | |
| Issued | 4,604,224 | 5,442,252 |
| Issued in Lieu of Cash Distributions | 446,191 | 317,439 |
| Redeemed | (4,824,349) | (4,990,355) |
| Net Increase (Decrease) from Capital Share Transactions | 226,066 | 769,336 |
| Total Increase (Decrease) | 1,646,841 | (187,413) |
| Net Assets | | |
| Beginning of Period | 15,724,230 | 15,911,643 |
| End of Period2 | 17,371,071 | 15,724,230 |
1 Includes fiscal 2016 and 2015 short-term gain distributions totaling $24,110,000 and $8,764,000, respectively. Short-term gain distributions are treated as ordinary income dividends for tax purposes.
2 Net Assets—End of Period includes undistributed (overdistributed) net investment income of $225,359,000 and $232,088,000.
See accompanying Notes, which are an integral part of the Financial Statements.
24
| | | | | |
| Target Retirement 2040 Fund | | | | | |
| |
| |
| Financial Highlights | | | | | |
| |
| |
| For a Share Outstanding | | | Year Ended September 30, |
| Throughout Each Period | 2016 | 2015 | 2014 | 2013 | 2012 |
| Net Asset Value, Beginning of Period | $28.09 | $29.66 | $26.80 | $23.26 | $19.26 |
| Investment Operations | | | | | |
| Net Investment Income | .660 | .648 | .593 | .546 | .559 |
| Capital Gain Distributions Received | .003 | .007 | .001 | .012 | .022 |
| Net Realized and Unrealized Gain (Loss) | | | | | |
| on Investments | 2.687 | (1.634) | 2.773 | 3.485 | 3.872 |
| Total from Investment Operations | 3.350 | (.979) | 3.367 | 4.043 | 4.453 |
| Distributions | | | | | |
| Dividends from Net Investment Income | (. 615) | (. 574) | (. 500) | (. 496) | (. 444) |
| Distributions from Realized Capital Gains | (. 235) | (. 017) | (. 007) | (. 007) | (. 009) |
| Total Distributions | (. 850) | (. 591) | (. 507) | (. 503) | (. 453) |
| Net Asset Value, End of Period | $30.59 | $28.09 | $29.66 | $26.80 | $23.26 |
| |
| Total Return1 | 12.11% | -3.43% | 12.66% | 17.75% | 23.43% |
| |
| Ratios/Supplemental Data | | | | | |
| Net Assets, End of Period (Millions) | $17,371 | $15,724 | $15,912 | $12,013 | $7,982 |
| Ratio of Total Expenses to Average Net Assets | — | — | — | — | — |
| Acquired Fund Fees and Expenses | 0.16% | 0.16% | 0.18% | 0.18% | 0.18% |
| Ratio of Net Investment Income to | | | | | |
| Average Net Assets | 2.23% | 2.09% | 2.18% | 2.36% | 2.69% |
| Portfolio Turnover Rate | 16% | 21% | 6% | 9% | 3% |
1 Total returns do not include account service fees that may have applied in the periods shown. Fund prospectuses provide information about any applicable account service fees.
See accompanying Notes, which are an integral part of the Financial Statements.
25
Target Retirement 2040 Fund
Notes to Financial Statements
Vanguard Target Retirement 2040 Fund is registered under the Investment Company Act of 1940 as an open-end investment company, or mutual fund. The fund follows a balanced investment strategy by investing in selected Vanguard funds to achieve its targeted allocation of assets to U.S. and international stocks, and U.S. and international bonds. Financial statements and other information about each underlying fund are available on vanguard.com.
A. The following significant accounting policies conform to generally accepted accounting principles for U.S. investment companies. The fund consistently follows such policies in preparing its financial statements.
1. Security Valuation: Investments are valued at the net asset value of each underlying Vanguard fund determined as of the close of the New York Stock Exchange (generally 4 p.m., Eastern time) on the valuation date.
2. Federal Income Taxes: The fund intends to continue to qualify as a regulated investment company and distribute all of its taxable income. Management has analyzed the fund’s tax positions taken for all open federal income tax years (September 30, 2013–2016), and has concluded that no provision for federal income tax is required in the fund’s financial statements.
3. Distributions: Distributions to shareholders are recorded on the ex-dividend date.
4. Credit Facility: The fund and certain other funds managed by The Vanguard Group (“Vanguard”) participate in a $3.1 billion committed credit facility provided by a syndicate of lenders pursuant to a credit agreement that may be renewed annually; each fund is individually liable for its borrowings, if any, under the credit facility. Borrowings may be utilized for temporary and emergency purposes, and are subject to the fund’s regulatory and contractual borrowing restrictions. The participating funds are charged administrative fees and an annual commitment fee of 0.10% of the undrawn amount of the facility; these fees are allocated to the funds based on a method approved by the fund’s board of trustees and borne by the funds in which the fund invests (see Note B). Any borrowings under this facility bear interest at a rate based upon the higher of the one-month London Interbank Offered Rate, federal funds effective rate, or overnight bank funding rate plus an agreed-upon spread.
The fund had no borrowings outstanding at September 30, 2016, or at any time during the period then ended.
5. Other: Income and capital gain distributions received are recorded on the ex-dividend date. Security transactions are accounted for on the date securities are bought or sold. Costs used to determine realized gains (losses) on the sale of investment securities are those of the specific securities sold.
B. In accordance with the terms of a Funds’ Service Agreement (the “FSA”) between Vanguard and the fund, Vanguard furnishes to the fund investment advisory, corporate management, administrative, marketing, and distribution services at Vanguard’s cost of operations (as defined by the FSA). These costs of operations are allocated to the fund based on methods and guidelines approved by the board of trustees. The FSA provides that expenses otherwise allocable to Vanguard funds-of-funds may be reduced or eliminated to the extent of savings realized by the underlying Vanguard funds by virtue of being part of a fund-of-funds. Accordingly, all expenses for services provided by Vanguard to the fund and all other expenses incurred by the fund during the period ended September 30, 2016, were borne by the underlying Vanguard funds in which the fund invests. The fund’s trustees and officers are also trustees and officers, respectively, of the underlying Vanguard funds, as well as directors and employees, respectively, of Vanguard.
26
Target Retirement 2040 Fund
C. Various inputs may be used to determine the value of the fund’s investments. These inputs are summarized in three broad levels for financial statement purposes. The inputs or methodologies used to value securities are not necessarily an indication of the risk associated with investing in those securities.
Level 1—Quoted prices in active markets for identical securities.
Level 2—Other significant observable inputs (including quoted prices for similar securities, interest rates, prepayment speeds, credit risk, etc.).
Level 3—Significant unobservable inputs (including the fund’s own assumptions used to determine the fair value of investments).
At September 30, 2016, 100% of the market value of the fund’s investments was determined based on Level 1 inputs.
D. Distributions are determined on a tax basis and may differ from net investment income and realized capital gains for financial reporting purposes. Differences may be permanent or temporary. Permanent differences are reclassified among capital accounts in the financial statements to reflect their tax character. Temporary differences arise when certain items of income, expense, gain, or loss are recognized in different periods for financial statement and tax purposes. These differences will reverse at some time in the future. Differences in classification may also result from the treatment of short-term gains as ordinary income for tax purposes.
The fund used a tax accounting practice to treat a portion of the price of capital shares redeemed during the year as distributions from net investment income and realized capital gains. Accordingly, the fund has reclassified $35,864,000 from undistributed net investment income, and $25,224,000 from accumulated net realized gains, to paid-in capital.
For tax purposes, at September 30, 2016, the fund had $235,027,826 of ordinary income and $62,018,822 of long-term capital gains available for distribution.
At September 30, 2016, the cost of investment securities for tax purposes was $13,439,043,000. Net unrealized appreciation of investment securities for tax purposes was $3,940,606,000, consisting of unrealized gains of $4,096,162,000 on securities that had risen in value since their purchase and $155,556,000 in unrealized losses on securities that had fallen in value since their purchase.
| E. | Capital shares issued and redeemed were: |
| | |
| | Year Ended September 30, |
| | 2016 | 2015 |
| | Shares | Shares |
| | (000) | (000) |
| Issued | 159,514 | 180,154 |
| Issued in Lieu of Cash Distributions | 15,461 | 10,543 |
| Redeemed | (166,772) | (167,343) |
| Net Increase (Decrease) in Shares Outstanding | 8,203 | 23,354 |
27
Target Retirement 2040 Fund
| | | | | | |
| F. Transactions during the period in affiliated underlying Vanguard funds were as follows: | |
| | | | Current Period Transactions | |
| | Sept. 30, | | Proceeds | | | Sept. 30, |
| | 2015 | | from | | Capital Gain | 2016 |
| | Market | Purchases | Securities | | Distributions | Market |
| | Value | at Cost | Sold | Income | Received | Value |
| | ($000) | ($000) | ($000) | ($000) | ($000) | ($000) |
| Vanguard Market Liquidity Fund | 6,418 | NA1 | NA1 | 28 | — | 12,522 |
| Vanguard Total Bond Market II | | | | | | |
| Index Fund | 1,173,838 | 692,584 | 392,740 | 30,080 | 1,831 | 1,507,016 |
| Vanguard Total International | | | | | | |
| Bond Index Fund | 501,647 | 137,204 | 76,529 | 8,077 | — | 592,479 |
| Vanguard Total International | | | | | | |
| Stock Index Fund | 5,615,266 | 797,618 | 718,893 | 161,359 | — | 6,091,376 |
| Vanguard Total Stock Market | | | | | | |
| Index Fund | 8,429,903 | 1,045,822 | 1,354,310 | 158,793 | — | 9,176,256 |
| Total | 15,727,072 | 2,673,228 | 2,542,472 | 358,337 | 1,831 | 17,379,649 |
| 1 Not applicable—purchases and sales are for temporary cash investment purposes. | | | |
G. Management has determined that no material events or transactions occurred subsequent to September 30, 2016, that would require recognition or disclosure in these financial statements.
28
Target Retirement 2045 Fund
Fund Profile
As of September 30, 2016
| |
| Total Fund Characteristics | |
| |
| Ticker Symbol | VTIVX |
| 30-Day SEC Yield | 2.12% |
| Acquired Fund Fees and Expenses1 | 0.16% |
| |
| Allocation to Underlying Vanguard Funds | |
| Vanguard Total Stock Market Index Fund | |
| Investor Shares | 54.0% |
| Vanguard Total International Stock Index | |
| Fund Investor Shares | 36.0 |
| Vanguard Total Bond Market II Index Fund | |
| Investor Shares | 7.1 |
| Vanguard Total International Bond Index | |
| Fund Investor Shares | 2.9 |
| | |
| Total Fund Volatility Measures | |
| | Target 2045 | MSCI US |
| | Composite | Broad Market |
| | Index | Index |
| R-Squared | 1.00 | 0.96 |
| Beta | 0.98 | 0.88 |
These measures show the degree and timing of the fund’s fluctuations compared with the indexes over 36 months.
Fund Asset Allocation
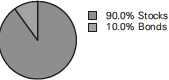
1 This figure—drawn from the prospectus dated January 28, 2016—represents an estimate of the weighted average of the expense ratios and any transaction fees charged by the underlying mutual funds (the ”acquired” funds) in which the Target Retirement 2045 Fund invests. The fund does not charge any expenses or fees of its own. For the fiscal year ended September 30, 2016, the acquired fund fees and expenses were 0.16%.
29
Target Retirement 2045 Fund
Performance Summary
All of the returns in this report represent past performance, which is not a guarantee of future results that may be achieved by the fund. (Current performance may be lower or higher than the performance data cited. For performance data current to the most recent month-end, visit our website at vanguard.com/performance.) Note, too, that both investment returns and principal value can fluctuate widely, so an investor’s shares, when sold, could be worth more or less than their original cost. The returns shown do not reflect taxes that a shareholder would pay on fund distributions or on the sale of fund shares.
Cumulative Performance: September 30, 2006, Through September 30, 2016
Initial Investment of $10,000
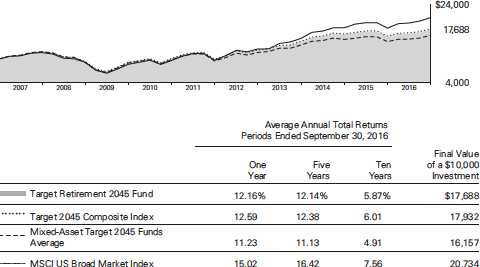
For a benchmark description, see the Glossary.
Mixed-Asset Target 2045 Funds Average: Derived from data provided by Lipper, a Thomson Reuters Company.
See Financial Highlights for dividend and capital gains information.
30
Target Retirement 2045 Fund
Fiscal-Year Total Returns (%): September 30, 2006, Through September 30, 2016

Target Retirement 2045 Fund
Target 2045 Composite Index
For a benchmark description, see the Glossary.
31
Target Retirement 2045 Fund
Financial Statements
Statement of Net Assets
As of September 30, 2016
The fund reports a complete list of its holdings in regulatory filings four times in each fiscal year, at the quarter-ends. For the second and fourth fiscal quarters, the lists appear in the fund’s semiannual and annual reports to shareholders. For the first and third fiscal quarters, the fund files the lists with the Securities and Exchange Commission on Form N-Q. Shareholders can look up the fund’s Forms N-Q on the SEC’s website at sec.gov. Forms N-Q may also be reviewed and copied at the SEC’s Public Reference Room (see the back cover of this report for further information).
| | |
| | | Market |
| | | Value• |
| | Shares | ($000) |
| Investment Companies (100.0%) | | |
| U.S. Stock Fund (54.1%) | | |
| Vanguard Total Stock Market Index Fund Investor Shares | 159,587,196 | 8,646,434 |
| |
| International Stock Fund (35.9%) | | |
| Vanguard Total International Stock Index Fund Investor Shares | 379,483,542 | 5,745,381 |
| |
| U.S. Bond Fund (7.1%) | | |
| 1 Vanguard Total Bond Market II Index Fund Investor Shares | 102,386,900 | 1,130,351 |
| |
| International Bond Fund (2.9%) | | |
| Vanguard Total International Bond Index Fund Investor Shares | 41,018,896 | 458,181 |
| Total Investment Companies (Cost $12,177,991) | | 15,980,347 |
| Temporary Cash Investment (0.0%) | | |
| Money Market Fund (0.0%) | | |
| 1 Vanguard Market Liquidity Fund, 0.640% (Cost $5,774) | 57,740 | 5,775 |
| Total Investments (100.0%) (Cost $12,183,765) | | 15,986,122 |
| Other Assets and Liabilities (0.0%) | | |
| Other Assets | | 106,961 |
| Liabilities | | (106,486) |
| | | 475 |
| Net Assets (100%) | | |
| Applicable to 836,031,492 outstanding $.001 par value shares of | | |
| beneficial interest (unlimited authorization) | | 15,986,597 |
| Net Asset Value Per Share | | $19.12 |
32
| |
| Target Retirement 2045 Fund | |
| |
| |
| |
| |
| | Amount |
| | ($000) |
| Statement of Assets and Liabilities | |
| Assets | |
| Investments in Securities, at Value—Affiliated Vanguard Funds | 15,986,122 |
| Receivables for Investment Securities Sold | 86,653 |
| Receivables for Accrued Income | 2,704 |
| Receivables for Capital Shares Issued | 17,604 |
| Total Assets | 16,093,083 |
| Liabilities | |
| Payables for Investment Securities Purchased | 2,533 |
| Payables for Capital Shares Redeemed | 103,953 |
| Total Liabilities | 106,486 |
| Net Assets | 15,986,597 |
| |
| |
| At September 30, 2016, net assets consisted of: | |
| | Amount |
| | ($000) |
| Paid-in Capital | 11,904,557 |
| Undistributed Net Investment Income | 207,956 |
| Accumulated Net Realized Gains | 71,727 |
| Unrealized Appreciation (Depreciation) | 3,802,357 |
| Net Assets | 15,986,597 |
• See Note A in Notes to Financial Statements.
1 Affiliated fund available only to Vanguard funds and certain trusts and accounts managed by Vanguard. Rate shown for Vanguard Market Liquidity Fund is the 7-day yield.
See accompanying Notes, which are an integral part of the Financial Statements.
33
| |
| Target Retirement 2045 Fund | |
| |
| |
| Statement of Operations | |
| |
| | Year Ended |
| | September 30, 2016 |
| | ($000) |
| Investment Income | |
| Income | |
| Income Distributions Received from Affiliated Funds | 330,342 |
| Other Income | 171 |
| Net Investment Income—Note B | 330,513 |
| Realized Net Gain (Loss) | |
| Capital Gain Distributions Received from Affiliated Funds | 1,552 |
| Affiliated Investment Securities Sold | 135,548 |
| Realized Net Gain (Loss) | 137,100 |
| Change in Unrealized Appreciation (Depreciation) of Investment Securities | 1,271,291 |
| Net Increase (Decrease) in Net Assets Resulting from Operations | 1,738,904 |
See accompanying Notes, which are an integral part of the Financial Statements.
34
| | |
| Target Retirement 2045 Fund | | |
| |
| |
| Statement of Changes in Net Assets | | |
| |
| | Year Ended September 30, |
| | 2016 | 2015 |
| | ($000) | ($000) |
| Increase (Decrease) in Net Assets | | |
| Operations | | |
| Net Investment Income | 330,513 | 330,942 |
| Realized Net Gain (Loss) | 137,100 | 146,296 |
| Change in Unrealized Appreciation (Depreciation) | 1,271,291 | (1,046,669) |
| Net Increase (Decrease) in Net Assets Resulting from Operations | 1,738,904 | (569,431) |
| Distributions | | |
| Net Investment Income | (302,945) | (303,599) |
| Realized Capital Gain1 | (156,182) | (2,378) |
| Total Distributions | (459,127) | (305,977) |
| Capital Share Transactions | | |
| Issued | 3,900,183 | 4,573,322 |
| Issued in Lieu of Cash Distributions | 451,577 | 301,446 |
| Redeemed | (3,927,553) | (4,208,051) |
| Net Increase (Decrease) from Capital Share Transactions | 424,207 | 666,717 |
| Total Increase (Decrease) | 1,703,984 | (208,691) |
| Net Assets | | |
| Beginning of Period | 14,282,613 | 14,491,304 |
| End of Period2 | 15,986,597 | 14,282,613 |
1 Includes fiscal 2016 and 2015 short-term gain distributions totaling $14,912,000 and $2,378,000, respectively. Short-term gain distributions are treated as ordinary income dividends for tax purposes.
2 Net Assets—End of Period includes undistributed (overdistributed) net investment income of $207,956,000 and $213,439,000.
See accompanying Notes, which are an integral part of the Financial Statements.
35
| | | | | |
| Target Retirement 2045 Fund | | | | | |
| |
| |
| Financial Highlights | | | | | |
| |
| |
| For a Share Outstanding | | | Year Ended September 30, |
| Throughout Each Period | 2016 | 2015 | 2014 | 2013 | 2012 |
| Net Asset Value, Beginning of Period | $17.60 | $18.61 | $16.82 | $14.61 | $12.10 |
| Investment Operations | | | | | |
| Net Investment Income | .411 | .406 | .376 | .350 | .354 |
| Capital Gain Distributions Received | .002 | .004 | .001 | .008 | .014 |
| Net Realized and Unrealized Gain (Loss) | | | | | |
| on Investments | 1.692 | (1.034) | 1.747 | 2.173 | 2.433 |
| Total from Investment Operations | 2.105 | (.624) | 2.124 | 2.531 | 2.801 |
| Distributions | | | | | |
| Dividends from Net Investment Income | (. 386) | (. 383) | (. 334) | (. 316) | (. 286) |
| Distributions from Realized Capital Gains | (.199) | (. 003) | — | (. 005) | (. 005) |
| Total Distributions | (. 585) | (. 386) | (. 334) | (. 321) | (. 291) |
| Net Asset Value, End of Period | $19.12 | $17.60 | $18.61 | $16.82 | $14.61 |
| |
| Total Return1 | 12.16% | -3.49% | 12.73% | 17.70% | 23.47% |
| |
| Ratios/Supplemental Data | | | | | |
| Net Assets, End of Period (Millions) | $15,987 | $14,283 | $14,491 | $11,441 | $8,163 |
| Ratio of Total Expenses to Average Net Assets | — | — | — | — | — |
| Acquired Fund Fees and Expenses | 0.16% | 0.16% | 0.18% | 0.18% | 0.18% |
| Ratio of Net Investment Income to | | | | | |
| Average Net Assets | 2.43% | 2.10% | 2.17% | 2.36% | 2.70% |
| Portfolio Turnover Rate | 13% | 20% | 7% | 10% | 7% |
1 Total returns do not include account service fees that may have applied in the periods shown. Fund prospectuses provide information about any applicable account service fees.
See accompanying Notes, which are an integral part of the Financial Statements.
36
Target Retirement 2045 Fund
Notes to Financial Statements
Vanguard Target Retirement 2045 Fund is registered under the Investment Company Act of 1940 as an open-end investment company, or mutual fund. The fund follows a balanced investment strategy by investing in selected Vanguard funds to achieve its targeted allocation of assets to U.S. and international stocks, and U.S. and international bonds. Financial statements and other information about each underlying fund are available on vanguard.com.
A. The following significant accounting policies conform to generally accepted accounting principles for U.S. investment companies. The fund consistently follows such policies in preparing its financial statements.
1. Security Valuation: Investments are valued at the net asset value of each underlying Vanguard fund determined as of the close of the New York Stock Exchange (generally 4 p.m., Eastern time) on the valuation date.
2. Federal Income Taxes: The fund intends to continue to qualify as a regulated investment company and distribute all of its taxable income. Management has analyzed the fund’s tax positions taken for all open federal income tax years (September 30, 2013–2016), and has concluded that no provision for federal income tax is required in the fund’s financial statements.
3. Distributions: Distributions to shareholders are recorded on the ex-dividend date.
4. Credit Facility: The fund and certain other funds managed by The Vanguard Group (“Vanguard”) participate in a $3.1 billion committed credit facility provided by a syndicate of lenders pursuant to a credit agreement that may be renewed annually; each fund is individually liable for its borrowings, if any, under the credit facility. Borrowings may be utilized for temporary and emergency purposes, and are subject to the fund’s regulatory and contractual borrowing restrictions. The participating funds are charged administrative fees and an annual commitment fee of 0.10% of the undrawn amount of the facility; these fees are allocated to the funds based on a method approved by the fund’s board of trustees and borne by the funds in which the fund invests (see Note B). Any borrowings under this facility bear interest at a rate based upon the higher of the one-month London Interbank Offered Rate, federal funds effective rate, or overnight bank funding rate plus an agreed-upon spread.
The fund had no borrowings outstanding at September 30, 2016, or at any time during the period then ended.
5. Other: Income and capital gain distributions received are recorded on the ex-dividend date. Security transactions are accounted for on the date securities are bought or sold. Costs used to determine realized gains (losses) on the sale of investment securities are those of the specific securities sold.
B. In accordance with the terms of a Funds’ Service Agreement (the “FSA”) between Vanguard and the fund, Vanguard furnishes to the fund investment advisory, corporate management, administrative, marketing, and distribution services at Vanguard’s cost of operations (as defined by the FSA). These costs of operations are allocated to the fund based on methods and guidelines approved by the board of trustees. The FSA provides that expenses otherwise allocable to Vanguard funds-of-funds may be reduced or eliminated to the extent of savings realized by the underlying Vanguard funds by virtue of being part of a fund-of-funds. Accordingly, all expenses for services provided by Vanguard to the fund and all other expenses incurred by the fund during the period ended September 30, 2016, were borne by the underlying Vanguard funds in which the fund invests. The fund’s trustees and officers are also trustees and officers, respectively, of the underlying Vanguard funds, as well as directors and employees, respectively, of Vanguard.
37
Target Retirement 2045 Fund
C. Various inputs may be used to determine the value of the fund’s investments. These inputs are summarized in three broad levels for financial statement purposes. The inputs or methodologies used to value securities are not necessarily an indication of the risk associated with investing in those securities.
Level 1—Quoted prices in active markets for identical securities.
Level 2—Other significant observable inputs (including quoted prices for similar securities, interest rates, prepayment speeds, credit risk, etc.).
Level 3—Significant unobservable inputs (including the fund’s own assumptions used to determine the fair value of investments).
At September 30, 2016, 100% of the market value of the fund’s investments was determined based on Level 1 inputs.
D. Distributions are determined on a tax basis and may differ from net investment income and realized capital gains for financial reporting purposes. Differences may be permanent or temporary. Permanent differences are reclassified among capital accounts in the financial statements to reflect their tax character. Temporary differences arise when certain items of income, expense, gain, or loss are recognized in different periods for financial statement and tax purposes. These differences will reverse at some time in the future. Differences in classification may also result from the treatment of short-term gains as ordinary income for tax purposes.
The fund used a tax accounting practice to treat a portion of the price of capital shares redeemed during the year as distributions from net investment income and realized capital gains. Accordingly, the fund has reclassified $33,051,000 from undistributed net investment income, and $22,280,000 from accumulated net realized gains, to paid-in capital.
For tax purposes, at September 30, 2016, the fund had $213,416,000 of ordinary income and $66,267,000 of long-term capital gains available for distribution.
At September 30, 2016, the cost of investment securities for tax purposes was $12,183,765,000. Net unrealized appreciation of investment securities for tax purposes was $3,802,357,000, consisting of unrealized gains of $3,955,042,000 on securities that had risen in value since their purchase and $152,685,000 in unrealized losses on securities that had fallen in value since their purchase.
| E. | Capital shares issued and redeemed were: |
| | |
| | Year Ended September 30, |
| | 2016 | 2015 |
| | Shares | Shares |
| | (000) | (000) |
| Issued | 216,385 | 241,435 |
| Issued in Lieu of Cash Distributions | 25,032 | 15,975 |
| Redeemed | (216,842) | (224,761) |
| Net Increase (Decrease) in Shares Outstanding | 24,575 | 32,649 |
38
Target Retirement 2045 Fund
| | | | | | |
| F. Transactions during the period in affiliated underlying Vanguard funds were as follows: | |
| | | | Current Period Transactions | |
| | Sept. 30, | | Proceeds | | | Sept. 30, |
| | 2015 | | from | | Capital Gain | 2016 |
| | Market | Purchases | Securities | | Distributions | Market |
| | Value | at Cost | Sold | Income | Received | Value |
| | ($000) | ($000) | ($000) | ($000) | ($000) | ($000) |
| Vanguard Market Liquidity Fund | 7,954 | NA1 | NA1 | 24 | — | 5,775 |
| Vanguard Total Bond Market II | | | | | | |
| Index Fund | 994,746 | 492,025 | 382,855 | 24,487 | 1,552 | 1,130,351 |
| Vanguard Total International | | | | | | |
| Bond Index Fund | 424,585 | 82,717 | 73,624 | 6,631 | — | 458,181 |
| Vanguard Total International | | | | | | |
| Stock Index Fund | 5,139,185 | 758,778 | 523,730 | 150,875 | — | 5,745,381 |
| Vanguard Total Stock Market | | | | | | |
| Index Fund | 7,719,752 | 918,078 | 976,148 | 148,325 | — | 8,646,434 |
| Total | 14,286,222 | 2,251,598 | 1,956,357 | 330,342 | 1,552 | 15,986,122 |
| 1 Not applicable—purchases and sales are for temporary cash investment purposes. | | | |
G. Management has determined that no material events or transactions occurred subsequent to September 30, 2016, that would require recognition or disclosure in these financial statements.
39
Target Retirement 2050 Fund
Fund Profile
As of September 30, 2016
| |
| Total Fund Characteristics | |
| |
| Ticker Symbol | VFIFX |
| 30-Day SEC Yield | 2.12% |
| Acquired Fund Fees and Expenses1 | 0.16% |
| |
| Allocation to Underlying Vanguard Funds | |
| Vanguard Total Stock Market Index Fund | |
| Investor Shares | 54.1% |
| Vanguard Total International Stock Index | |
| Fund Investor Shares | 36.0 |
| Vanguard Total Bond Market II Index Fund | |
| Investor Shares | 7.1 |
| Vanguard Total International Bond Index | |
| Fund Investor Shares | 2.8 |
| | |
| Total Fund Volatility Measures | |
| | Target 2050 | MSCI US |
| | Composite | Broad Market |
| | Index | Index |
| R-Squared | 1.00 | 0.96 |
| Beta | 0.98 | 0.88 |
These measures show the degree and timing of the fund’s fluctuations compared with the indexes over 36 months.
Fund Asset Allocation
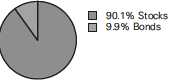
1 This figure—drawn from the prospectus dated January 28, 2016—represents an estimate of the weighted average of the expense ratios and any transaction fees charged by the underlying mutual funds (the ”acquired” funds) in which the Target Retirement 2050 Fund invests. The fund does not charge any expenses or fees of its own. For the fiscal year ended September 30, 2016, the acquired fund fees and expenses were 0.16%.
40
Target Retirement 2050 Fund
Performance Summary
All of the returns in this report represent past performance, which is not a guarantee of future results that may be achieved by the fund. (Current performance may be lower or higher than the performance data cited. For performance data current to the most recent month-end, visit our website at vanguard.com/performance.) Note, too, that both investment returns and principal value can fluctuate widely, so an investor’s shares, when sold, could be worth more or less than their original cost. The returns shown do not reflect taxes that a shareholder would pay on fund distributions or on the sale of fund shares.
Cumulative Performance: September 30, 2006, Through September 30, 2016
Initial Investment of $10,000
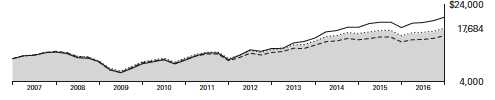
| | | | | |
| | | Average Annual Total Returns | |
| | | Periods Ended September 30, 2016 | |
| | | | | | Final Value |
| | | One | Five | Ten | of a $10,000 |
| | | Year | Years | Years | Investment |
| | Target Retirement 2050 Fund | 12.14% | 12.14% | 5.87% | $17,684 |
| •••••••• | Target 2050 Composite Index | 12.59 | 12.38 | 6.01 | 17,932 |
| – – – – | Mixed-Asset Target 2050 Funds | | | | |
| |
| | MSCI Average US Broad Market Index | 15.02 11.48 | 16.42 11.02 | 7.56 4.79 | 20,734 15,965 |
| For a benchmark description, see the Glossary. | | | | |
| Mixed-Asset Target 2050 Funds Average: Derived from data provided by Lipper, a Thomson Reuters Company. | |
See Financial Highlights for dividend and capital gains information.
41
Target Retirement 2050 Fund
Fiscal-Year Total Returns (%): September 30, 2006, Through September 30, 2016
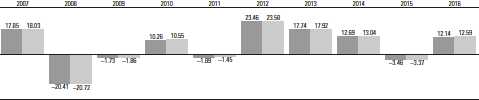
Target Retirement 2050 Fund
Target 2050 Composite Index
For a benchmark description, see the Glossary.
42
Target Retirement 2050 Fund
Financial Statements
Statement of Net Assets
As of September 30, 2016
The fund reports a complete list of its holdings in regulatory filings four times in each fiscal year, at the quarter-ends. For the second and fourth fiscal quarters, the lists appear in the fund’s semiannual and annual reports to shareholders. For the first and third fiscal quarters, the fund files the lists with the Securities and Exchange Commission on Form N-Q. Shareholders can look up the fund’s Forms N-Q on the SEC’s website at sec.gov. Forms N-Q may also be reviewed and copied at the SEC’s Public Reference Room (see the back cover of this report for further information).
| | |
| | | Market |
| | | Value• |
| | Shares | ($000) |
| Investment Companies (100.0%) | | |
| U.S. Stock Fund (54.1%) | | |
| Vanguard Total Stock Market Index Fund Investor Shares | 96,181,318 | 5,211,104 |
| |
| International Stock Fund (36.0%) | | |
| Vanguard Total International Stock Index Fund Investor Shares | 228,855,779 | 3,464,877 |
| |
| U.S. Bond Fund (7.1%) | | |
| 1 Vanguard Total Bond Market II Index Fund Investor Shares | 61,889,839 | 683,264 |
| |
| International Bond Fund (2.8%) | | |
| Vanguard Total International Bond Index Fund Investor Shares | 24,563,653 | 274,376 |
| Total Investment Companies (Cost $7,750,173) | | 9,633,621 |
| Temporary Cash Investment (0.1%) | | |
| Money Market Fund (0.1%) | | |
| 1 Vanguard Market Liquidity Fund, 0.640% (Cost $7,485) | 74,847 | 7,485 |
| Total Investments (100.1%) (Cost $7,757,658) | | 9,641,106 |
| Other Assets and Liabilities (-0.1%) | | |
| Other Assets | | 57,766 |
| Liabilities | | (65,077) |
| | | (7,311) |
| Net Assets (100%) | | |
| Applicable to 314,481,511 outstanding $.001 par value shares of | | |
| beneficial interest (unlimited authorization) | | 9,633,795 |
| Net Asset Value Per Share | | $30.63 |
43
| |
| Target Retirement 2050 Fund | |
| |
| |
| |
| |
| | Amount |
| | ($000) |
| Statement of Assets and Liabilities | |
| Assets | |
| Investments in Securities, at Value—Affiliated Vanguard Funds | 9,641,106 |
| Receivables for Investment Securities Sold | 39,847 |
| Receivables for Accrued Income | 1,523 |
| Receivables for Capital Shares Issued | 16,396 |
| Total Assets | 9,698,872 |
| Liabilities | |
| Payables for Investment Securities Purchased | 1,523 |
| Payables for Capital Shares Redeemed | 63,554 |
| Total Liabilities | 65,077 |
| Net Assets | 9,633,795 |
| |
| |
| At September 30, 2016, net assets consisted of: | |
| | Amount |
| | ($000) |
| Paid-in Capital | 7,621,499 |
| Undistributed Net Investment Income | 123,151 |
| Accumulated Net Realized Gains | 5,697 |
| Unrealized Appreciation (Depreciation) | 1,883,448 |
| Net Assets | 9,633,795 |
• See Note A in Notes to Financial Statements.
1 Affiliated fund available only to Vanguard funds and certain trusts and accounts managed by Vanguard. Rate shown for Vanguard Market Liquidity Fund is the 7-day yield.
See accompanying Notes, which are an integral part of the Financial Statements.
44
| |
| Target Retirement 2050 Fund | |
| |
| |
| Statement of Operations | |
| |
| | Year Ended |
| | September 30, 2016 |
| | ($000) |
| Investment Income | |
| Income | |
| Income Distributions Received from Affiliated Funds | 191,973 |
| Net Investment Income—Note B | 191,973 |
| Realized Net Gain (Loss) | |
| Capital Gain Distributions Received from Affiliated Funds | 870 |
| Affiliated Investment Securities Sold | 24,638 |
| Realized Net Gain (Loss) | 25,508 |
| Change in Unrealized Appreciation (Depreciation) of Investment Securities | 795,513 |
| Net Increase (Decrease) in Net Assets Resulting from Operations | 1,012,994 |
See accompanying Notes, which are an integral part of the Financial Statements.
45
| | |
| Target Retirement 2050 Fund | | |
| |
| |
| Statement of Changes in Net Assets | | |
| |
| | Year Ended September 30, |
| | 2016 | 2015 |
| | ($000) | ($000) |
| Increase (Decrease) in Net Assets | | |
| Operations | | |
| Net Investment Income | 191,973 | 175,377 |
| Realized Net Gain (Loss) | 25,508 | 14,172 |
| Change in Unrealized Appreciation (Depreciation) | 795,513 | (527,534) |
| Net Increase (Decrease) in Net Assets Resulting from Operations | 1,012,994 | (337,985) |
| Distributions | | |
| Net Investment Income | (163,313) | (153,721) |
| Realized Capital Gain1 | (24,567) | (1,032) |
| Total Distributions | (187,880) | (154,753) |
| Capital Share Transactions | | |
| Issued | 3,089,676 | 3,209,488 |
| Issued in Lieu of Cash Distributions | 184,437 | 151,750 |
| Redeemed | (2,358,228) | (2,364,964) |
| Net Increase (Decrease) from Capital Share Transactions | 915,885 | 996,274 |
| Total Increase (Decrease) | 1,740,999 | 503,536 |
| Net Assets | | |
| Beginning of Period | 7,892,796 | 7,389,260 |
| End of Period2 | 9,633,795 | 7,892,796 |
1 Includes fiscal 2016 and 2015 short-term gain distributions totaling $12,842,000 and 1,032,000 respectively. Short-term gain distributions are treated as ordinary income dividends for tax purposes.
2 Net Assets—End of Period includes undistributed (overdistributed) net investment income of $123,151,000 and $113,040,000.
See accompanying Notes, which are an integral part of the Financial Statements.
46
| | | | | |
| Target Retirement 2050 Fund | | | | | |
| |
| |
| Financial Highlights | | | | | |
| |
| |
| For a Share Outstanding | | | Year Ended September 30, |
| Throughout Each Period | 2016 | 2015 | 2014 | 2013 | 2012 |
| Net Asset Value, Beginning of Period | $27.95 | $29.53 | $26.69 | $23.16 | $19.17 |
| Investment Operations | | | | | |
| Net Investment Income | .636 | .623 | .586 | .539 | .549 |
| Capital Gain Distributions Received | .003 | .006 | .001 | .012 | .022 |
| Net Realized and Unrealized Gain (Loss) | | | | | |
| on Investments | 2.714 | (1.609) | 2.771 | 3.473 | 3.866 |
| Total from Investment Operations | 3.353 | (.980) | 3.358 | 4.024 | 4.437 |
| Distributions | | | | | |
| Dividends from Net Investment Income | (. 585) | (. 596) | (. 518) | (. 487) | (. 439) |
| Distributions from Realized Capital Gains | (. 088) | (. 004) | — | (. 007) | (. 008) |
| Total Distributions | (. 673) | (. 600) | (. 518) | (. 494) | (. 447) |
| Net Asset Value, End of Period | $30.63 | $27.95 | $29.53 | $26.69 | $23.16 |
| |
| Total Return1 | 12.14% | -3.46% | 12.69% | 17.74% | 23.46% |
| |
| Ratios/Supplemental Data | | | | | |
| Net Assets, End of Period (Millions) | $9,634 | $7,893 | $7,389 | $5,355 | $3,467 |
| Ratio of Total Expenses to Average Net Assets | — | — | — | — | — |
| Acquired Fund Fees and Expenses | 0.16% | 0.16% | 0.18% | 0.18% | 0.18% |
| Ratio of Net Investment Income to | | | | | |
| Average Net Assets | 2.24% | 2.11% | 2.19% | 2.36% | 2.70% |
| Portfolio Turnover Rate | 12% | 18% | 7% | 9% | 4% |
1 Total returns do not include account service fees that may have applied in the periods shown. Fund prospectuses provide information about any applicable account service fees.
See accompanying Notes, which are an integral part of the Financial Statements.
47
Target Retirement 2050 Fund
Notes to Financial Statements
Vanguard Target Retirement 2050 Fund is registered under the Investment Company Act of 1940 as an open-end investment company, or mutual fund. The fund follows a balanced investment strategy by investing in selected Vanguard funds to achieve its targeted allocation of assets to U.S. and international stocks, and U.S. and international bonds. Financial statements and other information about each underlying fund are available on vanguard.com.
A. The following significant accounting policies conform to generally accepted accounting principles for U.S. investment companies. The fund consistently follows such policies in preparing its financial statements.
1. Security Valuation: Investments are valued at the net asset value of each underlying Vanguard fund determined as of the close of the New York Stock Exchange (generally 4 p.m., Eastern time) on the valuation date.
2. Federal Income Taxes: The fund intends to continue to qualify as a regulated investment company and distribute all of its taxable income. Management has analyzed the fund’s tax positions taken for all open federal income tax years (September 30, 2013–2016), and has concluded that no provision for federal income tax is required in the fund’s financial statements.
3. Distributions: Distributions to shareholders are recorded on the ex-dividend date.
4. Credit Facility: The fund and certain other funds managed by The Vanguard Group (“Vanguard”) participate in a $3.1 billion committed credit facility provided by a syndicate of lenders pursuant to a credit agreement that may be renewed annually; each fund is individually liable for its borrowings, if any, under the credit facility. Borrowings may be utilized for temporary and emergency purposes, and are subject to the fund’s regulatory and contractual borrowing restrictions. The participating funds are charged administrative fees and an annual commitment fee of 0.10% of the undrawn amount of the facility; these fees are allocated to the funds based on a method approved by the fund’s board of trustees and borne by the funds in which the fund invests (see Note B). Any borrowings under this facility bear interest at a rate based upon the higher of the one-month London Interbank Offered Rate, federal funds effective rate, or overnight bank funding rate plus an agreed-upon spread.
The fund had no borrowings outstanding at September 30, 2016, or at any time during the period then ended.
5. Other: Income and capital gain distributions received are recorded on the ex-dividend date. Security transactions are accounted for on the date securities are bought or sold. Costs used to determine realized gains (losses) on the sale of investment securities are those of the specific securities sold.
B. In accordance with the terms of a Funds’ Service Agreement (the “FSA”) between Vanguard and the fund, Vanguard furnishes to the fund investment advisory, corporate management, administrative, marketing, and distribution services at Vanguard’s cost of operations (as defined by the FSA). These costs of operations are allocated to the fund based on methods and guidelines approved by the board of trustees. The FSA provides that expenses otherwise allocable to Vanguard funds-of-funds may be reduced or eliminated to the extent of savings realized by the underlying Vanguard funds by virtue of being part of a fund-of-funds. Accordingly, all expenses for services provided by Vanguard to the fund and all other expenses incurred by the fund during the period ended September 30, 2016, were borne by the underlying Vanguard funds in which the fund invests. The fund’s trustees and officers are also trustees and officers, respectively, of the underlying Vanguard funds, as well as directors and employees, respectively, of Vanguard.
48
Target Retirement 2050 Fund
C. Various inputs may be used to determine the value of the fund’s investments. These inputs are summarized in three broad levels for financial statement purposes. The inputs or methodologies used to value securities are not necessarily an indication of the risk associated with investing in those securities.
Level 1—Quoted prices in active markets for identical securities.
Level 2—Other significant observable inputs (including quoted prices for similar securities, interest rates, prepayment speeds, credit risk, etc.).
Level 3—Significant unobservable inputs (including the fund’s own assumptions used to determine the fair value of investments).
At September 30, 2016, 100% of the market value of the fund’s investments was determined based on Level 1 inputs.
D. Distributions are determined on a tax basis and may differ from net investment income and realized capital gains for financial reporting purposes. Differences may be permanent or temporary. Permanent differences are reclassified among capital accounts in the financial statements to reflect their tax character. Temporary differences arise when certain items of income, expense, gain, or loss are recognized in different periods for financial statement and tax purposes. These differences will reverse at some time in the future. Differences in classification may also result from the treatment of short-term gains as ordinary income for tax purposes.
The fund used a tax accounting practice to treat a portion of the price of capital shares redeemed during the year as distributions from net investment income and realized capital gains. Accordingly, the fund has reclassified $18,549,000 from undistributed net investment income, and $616,000 from accumulated net realized gains, to paid-in capital.
For tax purposes, at September 30, 2016, the fund had $125,098,000 of ordinary income and $8,745,000 of long-term capital gains available for distribution.
At September 30, 2016, the cost of investment securities for tax purposes was $7,757,658,000. Net unrealized appreciation of investment securities for tax purposes was $1,883,448,000, consisting of unrealized gains of $1,971,453,000 on securities that had risen in value since their purchase and $88,005,000 in unrealized losses on securities that had fallen in value since their purchase.
| E. | Capital shares issued and redeemed were: |
| | |
| | Year Ended September 30, |
| | 2016 | 2015 |
| | Shares | Shares |
| | (000) | (000) |
| Issued | 107,122 | 106,713 |
| Issued in Lieu of Cash Distributions | 6,382 | 5,063 |
| Redeemed | (81,445) | (79,571) |
| Net Increase (Decrease) in Shares Outstanding | 32,059 | 32,205 |
49
Target Retirement 2050 Fund
| | | | | | |
| F. Transactions during the period in affiliated underlying Vanguard funds were as follows: | |
| | | | Current Period Transactions | |
| | Sept. 30, | | Proceeds | | | Sept. 30, |
| | 2015 | | from | | Capital Gain | 2016 |
| | Market | Purchases | Securities | | Distributions | Market |
| | Value | at Cost | Sold | Income | Received | Value |
| | ($000) | ($000) | ($000) | ($000) | ($000) | ($000) |
| Vanguard Market Liquidity Fund | 7,079 | NA1 | NA1 | 21 | — | 7,485 |
| Vanguard Total Bond Market II | | | | | | |
| Index Fund | 547,705 | 344,432 | 224,440 | 14,132 | 870 | 683,264 |
| Vanguard Total International | | | | | | |
| Bond Index Fund | 238,108 | 48,579 | 26,546 | 3,838 | — | 274,376 |
| Vanguard Total International | | | | | | |
| Stock Index Fund | 2,839,964 | 638,960 | 235,281 | 87,802 | — | 3,464,877 |
| Vanguard Total Stock Market | | | | | | |
| Index Fund | 4,259,530 | 897,499 | 515,040 | 86,180 | — | 5,211,104 |
| Total | 7,892,386 | 1,929,470 | 1,001,307 | 191,973 | 870 | 9,641,106 |
| 1 Not applicable—purchases and sales are for temporary cash investment purposes. | | | |
H. Management has determined that no material events or transactions occurred subsequent to September 30, 2016, that would require recognition or disclosure in these financial statements.
50
Target Retirement 2055 Fund
Fund Profile
As of September 30, 2016
| |
| Total Fund Characteristics | |
| |
| Ticker Symbol | VFFVX |
| 30-Day SEC Yield | 2.12% |
| Acquired Fund Fees and Expenses1 | 0.16% |
| |
| Allocation to Underlying Vanguard Funds | |
| Vanguard Total Stock Market Index Fund | |
| Investor Shares | 54.1% |
| Vanguard Total International Stock Index | |
| Fund Investor Shares | 35.9 |
| Vanguard Total Bond Market II Index Fund | |
| Investor Shares | 7.2 |
| Vanguard Total International Bond Index | |
| Fund Investor Shares | 2.8 |
| | |
| Total Fund Volatility Measures | |
| | Target 2055 | MSCI US |
| | Composite | Broad Market |
| | Index | Index |
| R-Squared | 1.00 | 0.96 |
| Beta | 0.98 | 0.88 |
These measures show the degree and timing of the fund’s fluctuations compared with the indexes over 36 months.
Fund Asset Allocation

1 This figure—drawn from the prospectus dated January 28, 2016—represents an estimate of the weighted average of the expense ratios and any transaction fees charged by the underlying mutual funds (the ”acquired” funds) in which the Target Retirement 2055 Fund invests. The fund does not charge any expenses or fees of its own. For the fiscal year ended September 30, 2016, the acquired fund fees and expenses were 0.16%.
51
Target Retirement 2055 Fund
Performance Summary
All of the returns in this report represent past performance, which is not a guarantee of future results that may be achieved by the fund. (Current performance may be lower or higher than the performance data cited. For performance data current to the most recent month-end, visit our website at vanguard.com/performance.) Note, too, that both investment returns and principal value can fluctuate widely, so an investor’s shares, when sold, could be worth more or less than their original cost. The returns shown do not reflect taxes that a shareholder would pay on fund distributions or on the sale of fund shares.
Cumulative Performance: August 18, 2010, Through September 30, 2016
Initial Investment of $10,000
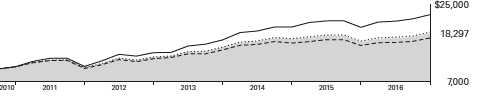
| | | | | |
| | | Average Annual Total Returns | |
| | | Periods Ended September 30, 2016 | |
| | | | | Since | Final Value |
| | | One | Five | Inception | of a $10,000 |
| | | Year | Years | (8/18/2010) | Investment |
| | Target Retirement 2055 Fund | 12.13% | 12.13% | 10.38% | $18,297 |
| •••••••• | Target 2055 Composite Index | 12.59 | 12.38 | 10.63 | 18,552 |
| – – – – | Spliced Mixed-Asset Target 2055+ | | | | |
| |
| | MSCI Funds US Average Broad Market Index | 15.02 11.26 | 16.42 11.21 | 14.28 9.27 | 22,634 17,206 |
| For a benchmark description, see the Glossary. | | | | |
| Spliced Mixed-Asset Target 2055+ Funds Average: Derived from data provided by Lipper, a Thomson Reuters Company. | |
| "Since Inception" performance is calculated from the inception date for both the fund and its comparative standards. | |
See Financial Highlights for dividend and capital gains information.
52
Target Retirement 2055 Fund
Fiscal-Year Total Returns (%): August 18, 2010, Through September 30, 2016
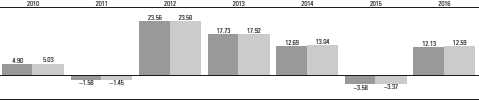
Target Retirement 2055 Fund
Target 2055 Composite Index
For a benchmark description, see the Glossary.
53
Target Retirement 2055 Fund
Financial Statements
Statement of Net Assets
As of September 30, 2016
The fund reports a complete list of its holdings in regulatory filings four times in each fiscal year, at the quarter-ends. For the second and fourth fiscal quarters, the lists appear in the fund’s semiannual and annual reports to shareholders. For the first and third fiscal quarters, the fund files the lists with the Securities and Exchange Commission on Form N-Q. Shareholders can look up the fund’s Forms N-Q on the SEC’s website at sec.gov. Forms N-Q may also be reviewed and copied at the SEC’s Public Reference Room (see the back cover of this report for further information).
| | |
| | | Market |
| | | Value• |
| | Shares | ($000) |
| Investment Companies (100.0%) | | |
| U.S. Stock Fund (54.1%) | | |
| Vanguard Total Stock Market Index Fund Investor Shares | 33,922,159 | 1,837,903 |
| |
| International Stock Fund (35.9%) | | |
| Vanguard Total International Stock Index Fund Investor Shares | 80,660,643 | 1,221,202 |
| |
| U.S. Bond Fund (7.2%) | | |
| 1 Vanguard Total Bond Market II Index Fund Investor Shares | 22,196,487 | 245,049 |
| |
| International Bond Fund (2.8%) | | |
| Vanguard Total International Bond Index Fund Investor Shares | 8,528,504 | 95,263 |
| Total Investment Companies (Cost $3,076,275) | | 3,399,417 |
| Temporary Cash Investment (0.1%) | | |
| Money Market Fund (0.1%) | | |
| 1 Vanguard Market Liquidity Fund, 0.640% (Cost $4,193) | 41,926 | 4,193 |
| Total Investments (100.1%) (Cost $3,080,468) | | 3,403,610 |
| Other Assets and Liabilities (-0.1%) | | |
| Other Assets | | 19,360 |
| Liabilities | | (23,970) |
| | | (4,610) |
| Net Assets (100%) | | |
| Applicable to 102,525,018 outstanding $.001 par value shares of | | |
| beneficial interest (unlimited authorization) | | 3,399,000 |
| Net Asset Value Per Share | | $33.15 |
54
| |
| Target Retirement 2055 Fund | |
| |
| |
| |
| |
| | Amount |
| | ($000) |
| Statement of Assets and Liabilities | |
| Assets | |
| Investments in Securities, at Value—Affiliated Vanguard Funds | 3,403,610 |
| Receivables for Accrued Income | 547 |
| Receivables for Capital Shares Issued | 18,813 |
| Total Assets | 3,422,970 |
| Liabilities | |
| Payables for Investment Securities Purchased | 4,726 |
| Payables for Capital Shares Redeemed | 19,244 |
| Total Liabilities | 23,970 |
| Net Assets | 3,399,000 |
| |
| |
| At September 30, 2016, net assets consisted of: | |
| | Amount |
| | ($000) |
| Paid-in Capital | 3,030,240 |
| Undistributed Net Investment Income | 47,624 |
| Accumulated Net Realized Losses | (2,006) |
| Unrealized Appreciation (Depreciation) | 323,142 |
| Net Assets | 3,399,000 |
• See Note A in Notes to Financial Statements.
1 Affiliated fund available only to Vanguard funds and certain trusts and accounts managed by Vanguard. Rate shown for Vanguard Market Liquidity Fund is the 7-day yield.
See accompanying Notes, which are an integral part of the Financial Statements.
55
| |
| Target Retirement 2055 Fund | |
| |
| |
| Statement of Operations | |
| |
| | Year Ended |
| | September 30, 2016 |
| | ($000) |
| Investment Income | |
| Income | |
| Income Distributions Received from Affiliated Funds | 62,683 |
| Other Income | 15 |
| Net Investment Income—Note B | 62,698 |
| Realized Net Gain (Loss) | |
| Capital Gain Distributions Received from Affiliated Funds | 265 |
| Affiliated Investment Securities Sold | 5,369 |
| Realized Net Gain (Loss) | 5,634 |
| Change in Unrealized Appreciation (Depreciation) of Investment Securities | 262,818 |
| Net Increase (Decrease) in Net Assets Resulting from Operations | 331,150 |
See accompanying Notes, which are an integral part of the Financial Statements.
56
| | |
| Target Retirement 2055 Fund | | |
| |
| |
| Statement of Changes in Net Assets | | |
| |
| | Year Ended September 30, |
| | 2016 | 2015 |
| | ($000) | ($000) |
| Increase (Decrease) in Net Assets | | |
| Operations | | |
| Net Investment Income | 62,698 | 47,079 |
| Realized Net Gain (Loss) | 5,634 | (5,205) |
| Change in Unrealized Appreciation (Depreciation) | 262,818 | (159,464) |
| Net Increase (Decrease) in Net Assets Resulting from Operations | 331,150 | (117,590) |
| Distributions | | |
| Net Investment Income | (46,523) | (31,961) |
| Realized Capital Gain1 | (1,255) | (346) |
| Total Distributions | (47,778) | (32,307) |
| Capital Share Transactions | | |
| Issued | 1,535,226 | 1,400,909 |
| Issued in Lieu of Cash Distributions | 46,827 | 31,653 |
| Redeemed | (745,024) | (673,689) |
| Net Increase (Decrease) from Capital Share Transactions | 837,029 | 758,873 |
| Total Increase (Decrease) | 1,120,401 | 608,976 |
| Net Assets | | |
| Beginning of Period | 2,278,599 | 1,669,623 |
| End of Period2 | 3,399,000 | 2,278,599 |
1 Includes fiscal 2016 and 2015 short-term gain distributions totaling $78,000 and $288,000 respectively. Short-term gain distributions are treated as ordinary income dividends for tax purposes.
2 Net Assets—End of Period includes undistributed (overdistributed) net investment income of $47,624,000 and $31,449,000.
See accompanying Notes, which are an integral part of the Financial Statements.
57
| | | | | |
| Target Retirement 2055 Fund | | | | | |
| |
| |
| Financial Highlights | | | | | |
| |
| |
| For a Share Outstanding | | | Year Ended September 30, |
| Throughout Each Period | 2016 | 2015 | 2014 | 2013 | 2012 |
| Net Asset Value, Beginning of Period | $30.14 | $31.80 | $28.67 | $24.81 | $20.45 |
| Investment Operations | | | | | |
| Net Investment Income | .642 | .631 | . 577 | .6411 | .540 |
| Capital Gain Distributions Received | .003 | .005 | .001 | .0111 | .022 |
| Net Realized and Unrealized Gain (Loss) | | | | | |
| on Investments | 2.974 | (1.736) | 3.033 | 3.668 | 4.202 |
| Total from Investment Operations | 3.619 | (1.100) | 3.611 | 4.320 | 4.764 |
| Distributions | | | | | |
| Dividends from Net Investment Income | (. 593) | (. 554) | (. 477) | (. 447) | (. 391) |
| Distributions from Realized Capital Gains | (. 016) | (. 006) | (. 004) | (. 013) | (. 013) |
| Total Distributions | (. 609) | (. 560) | (. 481) | (. 460) | (. 404) |
| Net Asset Value, End of Period | $33.15 | $30.14 | $31.80 | $28.67 | $24.81 |
| |
| Total Return2 | 12.13% | -3.58% | 12.69% | 17.73% | 23.56% |
| |
| Ratios/Supplemental Data | | | | | |
| Net Assets, End of Period (Millions) | $3,399 | $2,279 | $1,670 | $915 | $381 |
| Ratio of Total Expenses to Average Net Assets | — | — | — | — | — |
| Acquired Fund Fees and Expenses | 0.16% | 0.16% | 0.18% | 0.18% | 0.18% |
| Ratio of Net Investment Income to | | | | | |
| Average Net Assets | 2.27% | 2.17% | 2.22% | 2.39% | 2.76% |
| Portfolio Turnover Rate | 8% | 18% | 7% | 9% | 3% |
1 Calculated based on average shares outstanding.
2 Total returns do not include account service fees that may have applied in the periods shown. Fund prospectuses provide information about any applicable account service fees.
See accompanying Notes, which are an integral part of the Financial Statements.
58
Target Retirement 2055 Fund
Notes to Financial Statements
Vanguard Target Retirement 2055 Fund is registered under the Investment Company Act of 1940 as an open-end investment company, or mutual fund. The fund follows a balanced investment strategy by investing in selected Vanguard funds to achieve its targeted allocation of assets to U.S. and international stocks, and U.S. and international bonds. Financial statements and other information about each underlying fund are available on vanguard.com.
A. The following significant accounting policies conform to generally accepted accounting principles for U.S. investment companies. The fund consistently follows such policies in preparing its financial statements.
1. Security Valuation: Investments are valued at the net asset value of each underlying Vanguard fund determined as of the close of the New York Stock Exchange (generally 4 p.m., Eastern time) on the valuation date.
2. Federal Income Taxes: The fund intends to continue to qualify as a regulated investment company and distribute all of its taxable income. Management has analyzed the fund’s tax positions taken for all open federal income tax years (September 30, 2013–2016), and has concluded that no provision for federal income tax is required in the fund’s financial statements.
3. Distributions: Distributions to shareholders are recorded on the ex-dividend date.
4. Credit Facility: The fund and certain other funds managed by The Vanguard Group (“Vanguard”) participate in a $3.1 billion committed credit facility provided by a syndicate of lenders pursuant to a credit agreement that may be renewed annually; each fund is individually liable for its borrowings, if any, under the credit facility. Borrowings may be utilized for temporary and emergency purposes, and are subject to the fund’s regulatory and contractual borrowing restrictions. The participating funds are charged administrative fees and an annual commitment fee of 0.10% of the undrawn amount of the facility; these fees are allocated to the funds based on a method approved by the fund’s board of trustees and borne by the funds in which the fund invests (see Note B). Any borrowings under this facility bear interest at a rate based upon the higher of the one-month London Interbank Offered Rate, federal funds effective rate, or overnight bank funding rate plus an agreed-upon spread.
The fund had no borrowings outstanding at September 30, 2016, or at any time during the period then ended.
5. Other: Income and capital gain distributions received are recorded on the ex-dividend date. Security transactions are accounted for on the date securities are bought or sold. Costs used to determine realized gains (losses) on the sale of investment securities are those of the specific securities sold.
B. In accordance with the terms of a Funds’ Service Agreement (the “FSA”) between Vanguard and the fund, Vanguard furnishes to the fund investment advisory, corporate management, administrative, marketing, and distribution services at Vanguard’s cost of operations (as defined by the FSA). These costs of operations are allocated to the fund based on methods and guidelines approved by the board of trustees. The FSA provides that expenses otherwise allocable to Vanguard funds-of-funds may be reduced or eliminated to the extent of savings realized by the underlying Vanguard funds by virtue of being part of a fund-of-funds. Accordingly, all expenses for services provided by Vanguard to the fund and all other expenses incurred by the fund during the period ended September 30, 2016, were borne by the underlying Vanguard funds in which the fund invests. The fund’s trustees and officers are also trustees and officers, respectively, of the underlying Vanguard funds, as well as directors and employees, respectively, of Vanguard.
59
Target Retirement 2055 Fund
C. Various inputs may be used to determine the value of the fund’s investments. These inputs are summarized in three broad levels for financial statement purposes. The inputs or methodologies used to value securities are not necessarily an indication of the risk associated with investing in those securities.
Level 1—Quoted prices in active markets for identical securities.
Level 2—Other significant observable inputs (including quoted prices for similar securities, interest rates, prepayment speeds, credit risk, etc.).
Level 3—Significant unobservable inputs (including the fund’s own assumptions used to determine the fair value of investments).
At September 30, 2016, 100% of the market value of the fund’s investments was determined based on Level 1 inputs.
D. Distributions are determined on a tax basis and may differ from net investment income and realized capital gains for financial reporting purposes. Differences may be permanent or temporary. Permanent differences are reclassified among capital accounts in the financial statements to reflect their tax character. Temporary differences arise when certain items of income, expense, gain, or loss are recognized in different periods for financial statement and tax purposes. These differences will reverse at some time in the future. Differences in classification may also result from the treatment of short-term gains as ordinary income for tax purposes.
For tax purposes, at September 30, 2016, the fund had $47,647,000 of ordinary income available for distribution. The fund had available capital losses totaling $2,029,000 that may be carried forward indefinitely to offset future net capital gains.
At September 30, 2016, the cost of investment securities for tax purposes was $3,080,468,000. Net unrealized appreciation of investment securities for tax purposes was $323,142,000, consisting of unrealized gains of $355,600,000 on securities that had risen in value since their purchase and $32,458,000 in unrealized losses on securities that had fallen in value since their purchase.
E. Capital shares issued and redeemed were:
| | |
| | Year Ended September 30, |
| | 2016 | 2015 |
| | Shares | Shares |
| | (000) | (000) |
| Issued | 49,206 | 43,184 |
| Issued in Lieu of Cash Distributions | 1,497 | 978 |
| Redeemed | (23,777) | (21,062) |
| Net Increase (Decrease) in Shares Outstanding | 26,926 | 23,100 |
60
Target Retirement 2055 Fund
| | | | | | |
| F. Transactions during the period in affiliated underlying Vanguard funds were as follows: | |
| | | | Current Period Transactions | |
| | Sept. 30, | | Proceeds | | | Sept. 30, |
| | 2015 | | from | | Capital Gain | 2016 |
| | Market | Purchases | Securities | | Distributions | Market |
| | Value | at Cost | Sold | Income | Received | Value |
| | ($000) | ($000) | ($000) | ($000) | ($000) | ($000) |
| Vanguard Market Liquidity Fund | 3,549 | NA1 | NA1 | 13 | — | 4,193 |
| Vanguard Total Bond Market II | | | | | | |
| Index Fund | 160,740 | 126,093 | 46,988 | 4,582 | 265 | 245,049 |
| Vanguard Total International | | | | | | |
| Bond Index Fund | 68,563 | 29,491 | 7,338 | 1,210 | — | 95,263 |
| Vanguard Total International | | | | | | |
| Stock Index Fund | 819,490 | 385,045 | 58,767 | 28,729 | — | 1,221,202 |
| Vanguard Total Stock Market | | | | | | |
| Index Fund | 1,228,841 | 534,316 | 108,256 | 28,149 | — | 1,837,903 |
| Total | 2,281,183 | 1,074,945 | 221,349 | 62,683 | 265 | 3,403,610 |
| 1 Not applicable—purchases and sales are for temporary cash investment purposes. | | | |
G. Management has determined that no material events or transactions occurred subsequent to September 30, 2016, that would require recognition or disclosure in these financial statements.
61
Target Retirement 2060 Fund
Fund Profile
As of September 30, 2016
| |
| Total Fund Characteristics | |
| |
| Ticker Symbol | VTTSX |
| 30-Day SEC Yield | 2.12% |
| Acquired Fund Fees and Expenses1 | 0.16% |
| |
| Allocation to Underlying Vanguard Funds | |
| Vanguard Total Stock Market Index Fund | |
| Investor Shares | 54.0% |
| Vanguard Total International Stock Index | |
| Fund Investor Shares | 36.0 |
| Vanguard Total Bond Market II Index Fund | |
| Investor Shares | 7.2 |
| Vanguard Total International Bond Index | |
| Fund Investor Shares | 2.8 |
| | |
| Total Fund Volatility Measures | |
| | Target 2060 | MSCI US |
| | Composite | Broad Market |
| | Index | Index |
| R-Squared | 1.00 | 0.96 |
| Beta | 0.98 | 0.88 |
These measures show the degree and timing of the fund’s fluctuations compared with the indexes over 36 months.
Fund Asset Allocation

1 This figure—drawn from the prospectus dated January 28, 2016—represents an estimate of the weighted average of the expense ratios and any transaction fees charged by the underlying mutual funds (the ”acquired” funds) in which the Target Retirement 2060 Fund invests. The fund does not charge any expenses or fees of its own. For the fiscal year ended September 30, 2016, the acquired fund fees and expenses were 0.16%.
62
Target Retirement 2060 Fund
Performance Summary
All of the returns in this report represent past performance, which is not a guarantee of future results that may be achieved by the fund. (Current performance may be lower or higher than the performance data cited. For performance data current to the most recent month-end, visit our website at vanguard.com/performance.) Note, too, that both investment returns and principal value can fluctuate widely, so an investor’s shares, when sold, could be worth more or less than their original cost. The returns shown do not reflect taxes that a shareholder would pay on fund distributions or on the sale of fund shares.
Cumulative Performance: January 19, 2012, Through September 30, 2016
Initial Investment of $10,000
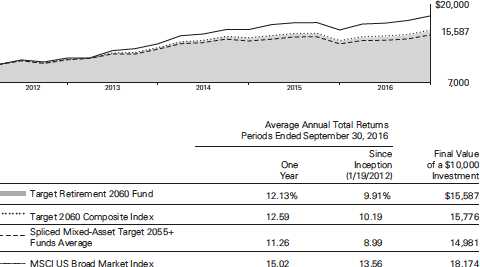
For a benchmark description, see the Glossary.
Spliced Mixed-Asset Target 2055+ Funds Average: Derived from data provided by Lipper, a Thomson Reuters Company.
"Since Inception" performance is calculated from the inception date for both the fund and its comparative standards.
See Financial Highlights for dividend and capital gains information.
63
Target Retirement 2060 Fund
Fiscal-Year Total Returns (%): January 19, 2012, Through September 30, 2016
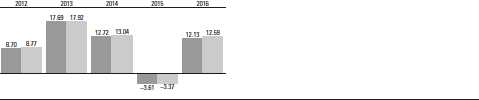
Target Retirement 2060 Fund
Target 2060 Composite Index
For a benchmark description, see the Glossary.
64
Target Retirement 2060 Fund
Financial Statements
Statement of Net Assets
As of September 30, 2016
The fund reports a complete list of its holdings in regulatory filings four times in each fiscal year, at the quarter-ends. For the second and fourth fiscal quarters, the lists appear in the fund’s semiannual and annual reports to shareholders. For the first and third fiscal quarters, the fund files the lists with the Securities and Exchange Commission on Form N-Q. Shareholders can look up the fund’s Forms N-Q on the SEC’s website at sec.gov. Forms N-Q may also be reviewed and copied at the SEC’s Public Reference Room (see the back cover of this report for further information).
| | |
| | | Market |
| | | Value• |
| | Shares | ($000) |
| Investment Companies (100.0%) | | |
| U.S. Stock Fund (54.0%) | | |
| Vanguard Total Stock Market Index Fund Investor Shares | 11,390,572 | 617,141 |
| |
| International Stock Fund (36.0%) | | |
| Vanguard Total International Stock Index Fund Investor Shares | 27,175,810 | 411,442 |
| |
| U.S. Bond Fund (7.2%) | | |
| 1 Vanguard Total Bond Market II Index Fund Investor Shares | 7,464,259 | 82,405 |
| |
| International Bond Fund (2.8%) | | |
| Vanguard Total International Bond Index Fund Investor Shares | 2,883,845 | 32,213 |
| Total Investment Companies (Cost $1,062,645) | | 1,143,201 |
| Temporary Cash Investment (0.1%) | | |
| Money Market Fund (0.1%) | | |
| 1 Vanguard Market Liquidity Fund, 0.640% (Cost $893) | 8,930 | 893 |
| Total Investments (100.1%) (Cost $1,063,538) | | 1,144,094 |
| Other Assets and Liabilities (-0.1%) | | |
| Other Assets | | 4,177 |
| Liabilities | | (5,330) |
| | | (1,153) |
| Net Assets (100%) | | |
| Applicable to 39,071,197 outstanding $.001 par value shares of | | |
| beneficial interest (unlimited authorization) | | 1,142,941 |
| Net Asset Value Per Share | | $29.25 |
65
| |
| Target Retirement 2060 Fund | |
| |
| |
| |
| |
| | Amount |
| | ($000) |
| Statement of Assets and Liabilities | |
| Assets | |
| Investments in Securities, at Value—Affiliated Vanguard Funds | 1,144,094 |
| Receivables for Accrued Income | 190 |
| Receivables for Capital Shares Issued | 3,987 |
| Total Assets | 1,148,271 |
| Liabilities | |
| Payables for Investment Securities Purchased | 184 |
| Payables for Capital Shares Redeemed | 5,146 |
| Total Liabilities | 5,330 |
| Net Assets | 1,142,941 |
| |
| |
| At September 30, 2016, net assets consisted of: | |
| | Amount |
| | ($000) |
| Paid-in Capital | 1,046,682 |
| Undistributed Net Investment Income | 15,940 |
| Accumulated Net Realized Losses | (237) |
| Unrealized Appreciation (Depreciation) | 80,556 |
| Net Assets | 1,142,941 |
• See Note A in Notes to Financial Statements.
1 Affiliated fund available only to Vanguard funds and certain trusts and accounts managed by Vanguard. Rate shown for Vanguard Market
Liquidity Fund is the 7-day yield.
See accompanying Notes, which are an integral part of the Financial Statements.
66
| |
| Target Retirement 2060 Fund | |
| |
| |
| Statement of Operations | |
| |
| | Year Ended |
| | September 30, 2016 |
| | ($000) |
| Investment Income | |
| Income | |
| Income Distributions Received from Affiliated Funds | 20,960 |
| Other Income | 11 |
| Net Investment Income—Note B | 20,971 |
| Realized Net Gain (Loss) | |
| Capital Gain Distributions Received from Affiliated Funds | 88 |
| Affiliated Investment Securities Sold | 805 |
| Realized Net Gain (Loss) | 893 |
| Change in Unrealized Appreciation (Depreciation) of Investment Securities | 88,315 |
| Net Increase (Decrease) in Net Assets Resulting from Operations | 110,179 |
See accompanying Notes, which are an integral part of the Financial Statements.
67
| | |
| Target Retirement 2060 Fund | | |
| |
| |
| Statement of Changes in Net Assets | | |
| |
| | Year Ended September 30, |
| | 2016 | 2015 |
| | ($000) | ($000) |
| Increase (Decrease) in Net Assets | | |
| Operations | | |
| Net Investment Income | 20,971 | 14,507 |
| Realized Net Gain (Loss) | 893 | (198) |
| Change in Unrealized Appreciation (Depreciation) | 88,315 | (52,110) |
| Net Increase (Decrease) in Net Assets Resulting from Operations | 110,179 | (37,801) |
| Distributions | | |
| Net Investment Income | (14,861) | (8,995) |
| Realized Capital Gain1 | (591) | (136) |
| Total Distributions | (15,452) | (9,131) |
| Capital Share Transactions | | |
| Issued | 553,901 | 523,888 |
| Issued in Lieu of Cash Distributions | 15,145 | 8,983 |
| Redeemed | (254,153) | (238,028) |
| Net Increase (Decrease) from Capital Share Transactions | 314,893 | 294,843 |
| Total Increase (Decrease) | 409,620 | 247,911 |
| Net Assets | | |
| Beginning of Period | 733,321 | 485,410 |
| End of Period2 | 1,142,941 | 733,321 |
1 Includes fiscal 2016 and 2015 short-term gain distributions totaling $325,000 and $116,000 respectively. Short-term gain distributions are treated as ordinary income dividends for tax purposes.
2 Net Assets—End of Period includes undistributed (overdistributed) net investment income of $15,940,000 and $9,830,000.
See accompanying Notes, which are an integral part of the Financial Statements.
68
| | | | | |
| Target Retirement 2060 Fund | | | | | |
| |
| |
| Financial Highlights | | | | | |
| |
| |
| | | | | | Jan. 19, |
| | | | | | 20121 to |
| | | Year Ended September 30, | |
| For a Share Outstanding | | | | | Sept. 30, |
| Throughout Each Period | 2016 | 2015 | 2014 | 2013 | 2012 |
| Net Asset Value, Beginning of Period | $26.58 | $28.03 | $25.21 | $21.74 | $20.00 |
| Investment Operations | | | | | |
| Net Investment Income | . 555 | . 540 | . 615 2 | .5812 | .218 |
| Capital Gain Distributions Received | .003 | .004 | .0012 | .007 2 | .002 |
| Net Realized and Unrealized Gain (Loss) | | | | | |
| on Investments | 2.635 | (1.523) | 2.572 | 3.203 | 1.520 |
| Total from Investment Operations | 3.193 | (.979) | 3.188 | 3.791 | 1.740 |
| Distributions | | | | | |
| Dividends from Net Investment Income | (.503) | (.464) | (.367) | (.315) | — |
| Distributions from Realized Capital Gains | (. 020) | (. 007) | (. 001) | (. 006) | — |
| Total Distributions | (. 523) | (. 471) | (. 368) | (. 321) | — |
| Net Asset Value, End of Period | $29.25 | $26.58 | $28.03 | $25.21 | $21.74 |
| |
| Total Return3 | 12.13% | -3.61% | 12.72% | 17.69% | 8.70% |
| |
| Ratios/Supplemental Data | | | | | |
| Net Assets, End of Period (Millions) | $1,143 | $733 | $485 | $217 | $33 |
| Ratio of Total Expenses to Average Net Assets | — | — | — | — | — |
| Acquired Fund Fees and Expenses | 0.16% | 0.16% | 0.18% | 0.18% | 0.18%4 |
| Ratio of Net Investment Income to | | | | | |
| Average Net Assets | 2.28% | 2.19% | 2.25% | 2.45% | 2.99%4 |
| Portfolio Turnover Rate | 6% | 21% | 11% | 10% | 40% |
| 1 | Inception. |
| 2 | Calculated based on average shares outstanding. |
| 3 | Total returns do not include account service fees that may have applied in the periods shown. Fund prospectuses provide information about any applicable account service fees. |
| 4 | Annualized. |
See accompanying Notes, which are an integral part of the Financial Statements.
69
Target Retirement 2060 Fund
Notes to Financial Statements
Vanguard Target Retirement 2060 Fund is registered under the Investment Company Act of 1940 as an open-end investment company, or mutual fund. The fund follows a balanced investment strategy by investing in selected Vanguard funds to achieve its targeted allocation of assets to U.S. and international stocks, and U.S. and international bonds. Financial statements and other information about each underlying fund are available on vanguard.com.
A. The following significant accounting policies conform to generally accepted accounting principles for U.S. investment companies. The fund consistently follows such policies in preparing its financial statements.
1. Security Valuation: Investments are valued at the net asset value of each underlying Vanguard fund determined as of the close of the New York Stock Exchange (generally 4 p.m., Eastern time) on the valuation date.
2. Federal Income Taxes: The fund intends to continue to qualify as a regulated investment company and distribute all of its income. Management has analyzed the fund’s tax positions taken for all open federal income tax years (September 30, 2013–2016), and has concluded that no provision for federal income tax is required in the fund’s financial statements.
3. Distributions: Distributions to shareholders are recorded on the ex-dividend date.
4. Credit Facility: The fund and certain other funds managed by The Vanguard Group (“Vanguard”) participate in a $3.1 billion committed credit facility provided by a syndicate of lenders pursuant to a credit agreement that may be renewed annually; each fund is individually liable for its borrowings, if any, under the credit facility. Borrowings may be utilized for temporary and emergency purposes, and are subject to the fund’s regulatory and contractual borrowing restrictions. The participating funds are charged administrative fees and an annual commitment fee of 0.10% of the undrawn amount of the facility; these fees are allocated to the funds based on a method approved by the fund’s board of trustees and borne by the funds in which the fund invests (see Note B). Any borrowings under this facility bear interest at a rate based upon the higher of the one-month London Interbank Offered Rate, federal funds effective rate, or overnight bank funding rate plus an agreed-upon spread.
The fund had no borrowings outstanding at September 30, 2016, or at any time during the period then ended.
5. Other: Income and capital gain distributions received are recorded on the ex-dividend date. Security transactions are accounted for on the date securities are bought or sold. Costs used to determine realized gains (losses) on the sale of investment securities are those of the specific securities sold.
B. In accordance with the terms of a Funds’ Service Agreement (the “FSA”) between Vanguard and the fund, Vanguard furnishes to the fund investment advisory, corporate management, administrative, marketing, and distribution services at Vanguard’s cost of operations (as defined by the FSA). These costs of operations are allocated to the fund based on methods and guidelines approved by the board of trustees. The FSA provides that expenses otherwise allocable to Vanguard funds-of-funds may be reduced or eliminated to the extent of savings realized by the underlying Vanguard funds by virtue of being part of a fund-of-funds. Accordingly, all expenses for services provided by Vanguard to the fund and all other expenses incurred by the fund during the period ended September 30, 2016, were borne by the underlying Vanguard funds in which the fund invests. The fund’s trustees and officers are also trustees and officers, respectively, of the underlying Vanguard funds, as well as directors and employees, respectively, of Vanguard.
70
Target Retirement 2060 Fund
C. Various inputs may be used to determine the value of the fund’s investments. These inputs are summarized in three broad levels for financial statement purposes. The inputs or methodologies used to value securities are not necessarily an indication of the risk associated with investing in those securities.
Level 1—Quoted prices in active markets for identical securities.
Level 2—Other significant observable inputs (including quoted prices for similar securities, interest rates, prepayment speeds, credit risk, etc.).
Level 3—Significant unobservable inputs (including the fund’s own assumptions used to determine the fair value of investments).
At September 30, 2016, 100% of the market value of the fund’s investments was determined based on Level 1 inputs.
D. Distributions are determined on a tax basis and may differ from net investment income and realized capital gains for financial reporting purposes. Differences may be permanent or temporary. Permanent differences are reclassified among capital accounts in the financial statements to reflect their tax character. Temporary differences arise when certain items of income, expense, gain, or loss are recognized in different periods for financial statement and tax purposes. These differences will reverse at some time in the future. Differences in classification may also result from the treatment of short-term gains as ordinary income for tax purposes.
For tax purposes, at September 30, 2016, the fund had $15,948,000 of ordinary income available for distribution. The fund had available capital losses totaling $245,000 that may be carried forward indefinitely to offset future net capital gains.
At September 30, 2016, the cost of investment securities for tax purposes was $1,063,538,000. Net unrealized appreciation of investment securities for tax purposes was $80,556,000, consisting of unrealized gains of $91,990,000 on securities that had risen in value since their purchase and $11,434,000 in unrealized losses on securities that had fallen in value since their purchase.
| E. | Capital shares issued and redeemed were: |
| | |
| | Year Ended September 30, |
| | 2016 | 2015 |
| | Shares | Shares |
| | (000) | (000) |
| Issued | 20,147 | 18,344 |
| Issued in Lieu of Cash Distributions | 549 | 315 |
| Redeemed | (9,210) | (8,394) |
| Net Increase (Decrease) in Shares Outstanding | 11,486 | 10,265 |
71
Target Retirement 2060 Fund
| | | | | | |
| F. Transactions during the period in affiliated underlying Vanguard funds were as follows: | |
| | | | Current Period Transactions | |
| | Sept. 30, | | Proceeds | | | Sept. 30, |
| | 2015 | | from | | Capital Gain | 2016 |
| | Market | Purchases | Securities | | Distributions | Market |
| | Value | at Cost | Sold | Income | Received | Value |
| | ($000) | ($000) | ($000) | ($000) | ($000) | ($000) |
| Vanguard Market Liquidity Fund | 1,082 | NA1 | NA1 | 4 | — | 893 |
| Vanguard Total Bond Market II | | | | | | |
| Index Fund | 50,649 | 43,139 | 13,120 | 1,525 | 88 | 82,405 |
| Vanguard Total International | | | | | | |
| Bond Index Fund | 21,629 | 10,752 | 1,690 | 403 | — | 32,213 |
| Vanguard Total International | | | | | | |
| Stock Index Fund | 264,553 | 134,098 | 12,306 | 9,605 | — | 411,442 |
| Vanguard Total Stock Market | | | | | | |
| Index Fund | 396,067 | 184,716 | 24,406 | 9,423 | — | 617,141 |
| Total | 733,980 | 372,705 | 51,522 | 20,960 | 88 | 1,144,094 |
| 1 Not applicable—purchases and sales are for temporary cash investment purposes. | | | |
G. Management has determined that no material events or transactions occurred subsequent to September 30, 2016, that would require recognition or disclosure in these financial statements.
72
Report of Independent Registered Public Accounting Firm
To the Board of Trustees of Vanguard Chester Funds and the Shareholders of Vanguard Target Retirement 2035 Fund, Vanguard Target Retirement 2040 Fund, Vanguard Target Retirement 2045 Fund, Vanguard Target Retirement 2050 Fund, Vanguard Target Retirement 2055 Fund and Vanguard Target Retirement 2060 Fund: In our opinion, the accompanying statements of net assets and statements of assets and liabilities, and the related statements of operations and of changes in net assets and the financial highlights present fairly, in all material respects, the financial position of Vanguard Target Retirement 2035 Fund, Vanguard Target Retirement 2040 Fund, Vanguard Target Retirement 2045 Fund, Vanguard Target Retirement 2050 Fund, Vanguard Target Retirement 2055 Fund and Vanguard Target Retirement 2060 Fund (constituting separate portfolios of Vanguard Chester Funds, hereafter referred to as the “Funds”) at September 30, 2016, the results of each of their operations for the year then ended, the changes in each of their net assets for each of the two years in the period then ended, and the financial highlights for each of the periods indicated, in conformity with accounting principles generally accepted in the United States of America. These financial statements and financial highlights (hereafter referred to as “financial statements”) are the responsibility of the Funds’ management. Our responsibility is to express an opinion on these financial statements based on our audits. We conducted our audits of these financial statements in accordance with the standards of the Public Company Accounting Oversight Board (United States). Those standards require that we plan and perform the audit to obtain reasonable assurance about whether the financial statements are free of material misstatement. An audit includes examining, on a test basis, evidence supporting the amounts and disclosures in the financial statements, assessing the accounting principles used and significant estimates made by management, and evaluating the overall financial statement presentation.
We believe that our audits, which included confirmation of securities at September 30, 2016 by agreement to the underlying ownership records of the transfer agent, provide a reasonable basis for our opinion.
/s/PricewaterhouseCoopers LLP Philadelphia, Pennsylvania November 10, 2016
Special 2016 tax information (unaudited) for Vanguard Target Retirement Funds
This information for the fiscal year ended September 30, 2016, is included pursuant to provisions of the Internal Revenue Code.
The funds distributed capital gain dividends (from net long-term capital gains) to shareholders during the fiscal year as follows:
| |
| Fund | ($000) |
| Target Retirement 2035 | 561,699 |
| Target Retirement 2040 | 125,963 |
| Target Retirement 2045 | 162,978 |
| Target Retirement 2050 | 12,605 |
| Target Retirement 2055 | 1,178 |
| Target Retirement 2060 | 270 |
73
For nonresident alien shareholders, 100% of short-term capital gain dividends distributed by the funds are qualified short-term capital gains.
The funds distributed qualified dividend income to shareholders during the fiscal year as follows:
| |
| Fund | ($000) |
| Target Retirement 2035 | 339,848 |
| Target Retirement 2040 | 252,663 |
| Target Retirement 2045 | 233,147 |
| Target Retirement 2050 | 125,670 |
| Target Retirement 2055 | 35,753 |
| Target Retirement 2060 | 11,411 |
For corporate shareholders, the percentage of investment income (dividend income plus short-term gains, if any) that qualifies for the dividends-received deduction is as follows:
| |
| Fund | Percentage |
| Target Retirement 2035 | 36.1% |
| Target Retirement 2040 | 38.1 |
| Target Retirement 2045 | 39.0 |
| Target Retirement 2050 | 39.3 |
| Target Retirement 2055 | 39.7 |
| Target Retirement 2060 | 39.7 |
The funds designate to shareholders foreign source income and foreign taxes paid as follows:
| | |
| | Foreign Source Income | Foreign Taxes Paid |
| Fund | ($000) | ($000) |
| Target Retirement 2035 | 230,480 | 13,766 |
| Target Retirement 2040 | 169,140 | 10,455 |
| Target Retirement 2045 | 157,303 | 9,771 |
| Target Retirement 2050 | 91,507 | 5,686 |
| Target Retirement 2055 | 29,881 | 1,860 |
| Target Retirement 2060 | 9,988 | 622 |
Shareholders will receive more detailed information with their Form 1099-DIV in January 2017 to determine the calendar-year amounts to be included on their 2016 tax returns.
74
Your Fund’s After-Tax Returns
This table presents returns for your fund both before and after taxes. The after-tax returns are shown in two ways: (1) assuming that an investor owned the fund during the entire period and paid taxes on the fund’s distributions, and (2) assuming that an investor paid taxes on the fund’s distributions and sold all shares at the end of each period.
Calculations are based on the highest individual federal income tax and capital gains tax rates in effect at the times of the distributions and the hypothetical sales. State and local taxes were not considered. After-tax returns reflect any qualified dividend income, using actual prior-year figures and estimates for 2016. (In the example, returns after the sale of fund shares may be higher than those assuming no sale. This occurs when the sale would have produced a capital loss. The calculation assumes that the investor received a tax deduction for the loss.)
Please note that your actual after-tax returns will depend on your tax situation and may differ from those shown. Also note that if you own the fund in a tax-deferred account, such as an individual retirement account or a 401(k) plan, this information does not apply to you. Such accounts are not subject to current taxes.
Finally, keep in mind that a fund’s performance—whether before or after taxes—does not guarantee future results.
| | | |
| Average Annual Total Returns: Target Retirement Funds | | | |
| Periods Ended September 30, 2016 | | | |
| | One | Five | Ten |
| | Year | Years | Years |
| Target Retirement 2035 Fund | | | |
| Returns Before Taxes | 11.64% | 11.83% | 5.74% |
| Returns After Taxes on Distributions | 10.34 | 11.13 | 5.17 |
| Returns After Taxes on Distributions and Sale of Fund Shares | 7.33 | 9.33 | 4.49 |
| |
| |
| | One | Five | Ten |
| | Year | Years | Years |
| Target Retirement 2040 Fund | | | |
| Returns Before Taxes | 12.11% | 12.13% | 5.87% |
| Returns After Taxes on Distributions | 11.24 | 11.55 | 5.41 |
| Returns After Taxes on Distributions and Sale of Fund Shares | 7.32 | 9.61 | 4.63 |
| |
| |
| | One | Five | Ten |
| | Year | Years | Years |
| Target Retirement 2045 Fund | | | |
| Returns Before Taxes | 12.16% | 12.14% | 5.87% |
| Returns After Taxes on Distributions | 11.23 | 11.53 | 5.34 |
| Returns After Taxes on Distributions and Sale of Fund Shares | 7.42 | 9.61 | 4.61 |
75
| | | | |
| Average Annual Total Returns: Target Retirement Funds | | | | |
| Periods Ended September 30, 2016 | | | | |
| |
| | One | | Five | Ten |
| | Year | | Years | Years |
| Target Retirement 2050 Fund | | | | |
| Returns Before Taxes | 12.14% | | 12.14% | 5.87% |
| Returns After Taxes on Distributions | 11.44 | | 11.58 | 5.39 |
| Returns After Taxes on Distributions and Sale of Fund Shares | 7.23 | | 9.61 | 4.62 |
| |
| | | | | Since |
| | One | | Five | Inception |
| | Year | | Years | (8/18/2010) |
| Target Retirement 2055 Fund | | | | |
| Returns Before Taxes | 12.13% | | 12.13% | 10.38% |
| Returns After Taxes on Distributions | 11.56 | | 11.66 | 9.96 |
| Returns After Taxes on Distributions and Sale of Fund Shares | 7.19 | | 9.62 | 8.27 |
| |
| | | | | Since |
| | | One | | Inception |
| | | Year | | (1/19/2012) |
| Target Retirement 2060 Fund | | | | |
| Returns Before Taxes | | 12.13% | | 9.91% |
| Returns After Taxes on Distributions | | 11.57 | | 9.54 |
| Returns After Taxes on Distributions and Sale of Fund Shares | | 7.17 | | 7.79 |
76
About Your Fund’s Expenses
As a shareholder of the fund, you incur ongoing costs, which include costs for portfolio management, administrative services, and shareholder reports (like this one), among others. Operating expenses, which are deducted from a fund’s gross income, directly reduce the investment return of the fund.
A typical fund’s expenses are expressed as a percentage of its average net assets. The Target Retirement Funds have no direct expenses, but each fund bears its proportionate share of the costs for the underlying funds in which it invests. These indirect expenses make up the acquired fund fees and expenses, also expressed as a percentage of average net assets.
The following examples are intended to help you understand the ongoing cost (in dollars) of investing in your fund and to compare these costs with those of other mutual funds. The examples are based on an investment of $1,000 made at the beginning of the period shown and held for the entire period. The costs were calculated using the acquired fund fees and expenses for each Target Retirement Fund.
The accompanying table illustrates your fund’s costs in two ways:
• Based on actual fund return. This section helps you to estimate the actual expenses that you paid over the period. The ”Ending Account Value“ shown is derived from the fund‘s actual return, and the third column shows the dollar amount that would have been paid by an investor who started with $1,000 in the fund. You may use the information here, together with the amount you invested, to estimate the expenses that you paid over the period.
To do so, simply divide your account value by $1,000 (for example, an $8,600 account value divided by $1,000 = 8.6), then multiply the result by the number given for your fund under the heading ”Expenses Paid During Period.“
• Based on hypothetical 5% yearly return. This section is intended to help you compare your fund‘s costs with those of other mutual funds. It assumes that the fund had a yearly return of 5% before expenses, but that the expense ratio is unchanged. In this case—because the return used is not the fund’s actual return—the results do not apply to your investment. The example is useful in making comparisons because the Securities and Exchange Commission requires all mutual funds to calculate expenses based on a 5% return. You can assess your fund’s costs by comparing this hypothetical example with the hypothetical examples that appear in shareholder reports of other funds.
Note that the expenses shown in the table are meant to highlight and help you compare ongoing costs only and do not reflect transaction costs incurred by the fund for buying and selling securities. Further, the expenses do not include any purchase, redemption, or account service fees described in the fund prospectus. If such fees were applied to your account, your costs would be higher. Your fund does not carry a “sales load.”
The calculations assume no shares were bought or sold during the period. Your actual costs may have been higher or lower, depending on the amount of your investment and the timing of any purchases or redemptions.
You can find more information about the fund’s expenses, including annual expense ratios, in the Financial Statements section of this report. For additional information on operating expenses and other shareholder costs, please refer to your fund’s current prospectus.
77
| | | |
| Six Months Ended September 30, 2016 | | | |
| | Beginning | Ending | Expenses |
| | Account Value | Account Value | Paid During |
| | 3/31/2016 | 9/30/2016 | Period |
| Based on Actual Fund Return | | | |
| Target Retirement 2035 Fund | $1,000.00 | $1,062.87 | $0.77 |
| Target Retirement 2040 Fund | $1,000.00 | $1,066.23 | $0.83 |
| Target Retirement 2045 Fund | $1,000.00 | $1,066.96 | $0.83 |
| Target Retirement 2050 Fund | $1,000.00 | $1,066.88 | $0.83 |
| Target Retirement 2055 Fund | $1,000.00 | $1,066.95 | $0.83 |
| Target Retirement 2060 Fund | $1,000.00 | $1,066.74 | $0.83 |
| Based on Hypothetical 5% Yearly Return | | | |
| Target Retirement 2035 Fund | $1,000.00 | $1,024.25 | $0.76 |
| Target Retirement 2040 Fund | $1,000.00 | $1,024.20 | $0.81 |
| Target Retirement 2045 Fund | $1,000.00 | $1,024.20 | $0.81 |
| Target Retirement 2050 Fund | $1,000.00 | $1,024.20 | $0.81 |
| Target Retirement 2055 Fund | $1,000.00 | $1,024.20 | $0.81 |
| Target Retirement 2060 Fund | $1,000.00 | $1,024.20 | $0.81 |
The calculations are based on the acquired fund fees and expenses for the most recent six-month period. The funds’ annualized expense figures for the period are (in order as listed from top to bottom above) 0.15%, 0.16%, 0.16%, 0.16%, 0.16%, and 0.16%. The dollar amounts shown as ”Expenses Paid” are equal to the annualized average weighted expense ratio for the underlying funds multiplied by the average account value over the period, multiplied by the number of days in the most recent six-month period, then divided by the number of days in the most recent 12-month period (183/366).
78
Glossary
30-Day SEC Yield. A fund’s 30-day SEC yield is derived using a formula specified by the U.S. Securities and Exchange Commission. Under the formula, data related to the fund’s security holdings in the previous 30 days are used to calculate the fund’s hypothetical net income for that period, which is then annualized and divided by the fund’s estimated average net assets over the calculation period. For the purposes of this calculation, a security’s income is based on its current market yield to maturity (for bonds), its actual income (for asset-backed securities), or its projected dividend yield (for stocks). Because the SEC yield represents hypothetical annualized income, it will differ—at times significantly—from the fund’s actual experience. As a result, the fund’s income distributions may be higher or lower than implied by the SEC yield.
Acquired Fund Fees and Expenses. Funds that invest in other Vanguard funds incur no direct expenses, but they do bear proportionate shares of the operating, administrative, and advisory expenses of the underlying funds, and they must pay any fees charged by those funds. The figure for acquired fund fees and expenses represents a weighted average of these underlying costs.
Acquired is a term that the Securities and Exchange Commission applies to any mutual fund whose shares are owned by another fund.
Beta. A measure of the magnitude of a fund’s past share-price fluctuations in relation to the ups and downs of a given market index. The index is assigned a beta of 1.00. Compared with a given index, a fund with a beta of 1.20 typically would have seen its share price rise or fall by 12% when the index rose or fell by 10%. For this report, beta is based on returns over the past 36 months for both the fund and the index. Note that a fund’s beta should be reviewed in conjunction with its R-squared (see definition). The lower the R-squared, the less correlation there is between the fund and the index, and the less reliable beta is as an indicator of volatility.
Expense Ratio. A fund’s total annual operating expenses expressed as a percentage of the fund’s average net assets. The expense ratio includes management and administrative expenses, but does not include the transaction costs of buying and selling portfolio securities.
Inception Date. The date on which the assets of a fund (or one of its share classes) are first invested in accordance with the fund’s investment objective. For funds with a subscription period, the inception date is the day after that period ends. Investment performance is measured from the inception date.
R-Squared. A measure of how much of a fund’s past returns can be explained by the returns from the market in general, as measured by a given index. If a fund’s total returns were precisely synchronized with an index’s returns, its R-squared would be 1.00. If the fund’s returns bore no relationship to the index’s returns, its R-squared would be 0. For this report, R-squared is based on returns over the past 36 months for both the fund and the index.
Benchmark Information
Spliced Mixed-Asset Target 2055+ Funds Average: Mixed-Asset Target 2050 Funds Average through August 31, 2013; Mixed-Asset Target 2055+ Funds Average thereafter.
79
Target 2035 Composite Index: Derived by applying the fund’s target asset allocation to the results of the following benchmarks: for international stocks of developed markets, the MSCI EAFE Index through December 15, 2010, the MSCI ACWI ex USA IMI Index through June 2, 2013, and the FTSE Global All Cap ex US Index thereafter; for emerging-market stocks, the Select Emerging Markets Index through August 23, 2006, the MSCI Emerging Markets Index through December 15, 2010, the MSCI ACWI ex USA IMI Index through June 2, 2013, and the FTSE Global All Cap ex US Index thereafter; for U.S. bonds, the Bloomberg Barclays U.S. Aggregate Bond Index through December 31, 2009, and the Bloomberg Barclays U.S. Aggregate Float Adjusted Index thereafter; for international bonds, the Bloomberg Barclays Global Aggregate ex-USD Float Adjusted RIC Capped Index beginning June 3, 2013; and for U.S. stocks, the Dow Jones U.S. Total Stock Market Index (formerly known as the Dow Jones Wilshire 5000 Index) through April 22, 2005, the MSCI US Broad Market Index through June 2, 2013, and the CRSP US Total Market Index thereafter. International stock benchmark returns are adjusted for withholding taxes.
Target 2040 Composite Index: Derived by applying the fund’s target asset allocation to the results of the following benchmarks: for international stocks of developed markets, the MSCI EAFE Index through December 15, 2010, the MSCI ACWI ex USA IMI Index through June 2, 2013, and the FTSE Global All Cap ex US Index thereafter; for emerging-market stocks, the Select Emerging Markets Index through August 23, 2006, the MSCI Emerging Markets Index through December 15, 2010, the MSCI ACWI ex USA IMI Index through June 2, 2013, and the FTSE Global All Cap ex US Index thereafter; for U.S. bonds, the Bloomberg Barclays U.S. Aggregate Bond Index through December 31, 2009, and the Bloomberg Barclays U.S. Aggregate Float Adjusted Index thereafter; for international bonds, the Bloomberg Barclays Global Aggregate ex-USD Float Adjusted RIC Capped Index beginning June 3, 2013; and for U.S. stocks, the MSCI US Broad Market Index through June 2, 2013, and the CRSP US Total Market Index thereafter. International stock benchmark returns are adjusted for withholding taxes.
Target 2045 Composite Index: Derived by applying the fund’s target asset allocation to the results of the following benchmarks: for international stocks of developed markets, the MSCI EAFE Index through December 15, 2010, the MSCI ACWI ex USA IMI Index through June 2, 2013, and the FTSE Global All Cap ex US Index thereafter; for emerging-market stocks, the Select Emerging Markets Index through August 23, 2006, the MSCI Emerging Markets Index through December 15, 2010, the MSCI ACWI ex USA IMI Index through June 2, 2013, and the FTSE Global All Cap ex US Index thereafter; for U.S. bonds, the Bloomberg Barclays U.S. Aggregate Bond Index through December 31, 2009, and the Bloomberg Barclays U.S. Aggregate Float Adjusted Index thereafter; for international bonds, the Bloomberg Barclays Global Aggregate ex-USD Float Adjusted RIC Capped Index beginning June 3, 2013; and for U.S. stocks, the Dow Jones U.S. Total Stock Market Index (formerly known as the Dow Jones Wilshire 5000 Index) through April 22, 2005, the MSCI US Broad Market Index through June 2, 2013, and the CRSP US Total Market Index thereafter. International stock benchmark returns are adjusted for withholding taxes.
80
Target 2050 Composite Index: Derived by applying the fund’s target asset allocation to the results of the following benchmarks: for international stocks of developed markets, the MSCI EAFE Index through December 15, 2010, the MSCI ACWI ex USA IMI Index through June 2, 2013, and the FTSE Global All Cap ex US Index thereafter; for emerging-market stocks, the Select Emerging Markets Index through August 23, 2006, the MSCI Emerging Markets Index through December 15, 2010, the MSCI ACWI ex USA IMI Index through June 2, 2013, and the FTSE Global All Cap ex US Index thereafter; for U.S. bonds, the Bloomberg Barclays U.S. Aggregate Bond Index through December 31, 2009, and the Bloomberg Barclays U.S. Aggregate Float Adjusted Index thereafter; for international bonds, the Bloomberg Barclays Global Aggregate ex-USD Float Adjusted RIC Capped Index beginning June 3, 2013; and for U.S. stocks, the MSCI US Broad Market Index through June 2, 2013, and the CRSP US Total Market Index thereafter. International stock benchmark returns are adjusted for withholding taxes.
Target 2055 Composite Index: Derived by applying the fund’s target asset allocation to the results of the following benchmarks: for international stocks of developed markets, the MSCI EAFE Index through December 15, 2010, the MSCI ACWI ex USA IMI Index through June 2, 2013, and the FTSE Global All Cap ex US Index thereafter; for emerging-market stocks, the MSCI Emerging Markets Index through December 15, 2010, the MSCI ACWI ex USA IMI Index through June 2, 2013, and the FTSE Global All Cap ex US Index thereafter; for U.S. bonds, the Bloomberg Barclays U.S. Aggregate Float Adjusted Index; for international bonds, the Bloomberg Barclays Global Aggregate ex-USD Float Adjusted RIC Capped Index beginning June 3, 2013; and for U.S. stocks, the MSCI US Broad Market Index through June 2, 2013, and the CRSP US Total Market Index thereafter. International stock benchmark returns are adjusted for withholding taxes.
Target 2060 Composite Index: Derived by applying the fund’s target asset allocation to the results of the following benchmarks: for international stocks of developed markets, the MSCI ACWI ex USA IMI Index through June 2, 2013, and the FTSE Global All Cap ex US Index thereafter; for emerging-market stocks, the MSCI ACWI ex USA IMI Index through June 2, 2013, and the FTSE Global All Cap ex US Index thereafter; for U.S. bonds, the Bloomberg Barclays U.S. Aggregate Float Adjusted Index; for international bonds, the Bloomberg Barclays Global Aggregate ex-USD Float Adjusted RIC Capped Index beginning June 3, 2013; and for U.S. stocks, the MSCI US Broad Market Index through June 2, 2013, and the CRSP US Total Market Index thereafter. International stock benchmark returns are adjusted for withholding taxes.
81
This page intentionally left blank.
This page intentionally left blank.
This page intentionally left blank.
This page intentionally left blank.
This page intentionally left blank.
This page intentionally left blank.
The People Who Govern Your Fund
The trustees of your mutual fund are there to see that the fund is operated and managed in your best interests since, as a shareholder, you are a part owner of the fund. Your fund’s trustees also serve on the board of directors of The Vanguard Group, Inc., which is owned by the Vanguard funds and provides services to them on an at-cost basis.
A majority of Vanguard’s board members are independent, meaning that they have no affiliation with Vanguard or the funds they oversee, apart from the sizable personal investments they have made as private individuals. The independent board members have distinguished backgrounds in business, academia, and public service. Each of the trustees and executive officers oversees 198 Vanguard funds.
The following table provides information for each trustee and executive officer of the fund. The mailing address of the trustees and officers is P.O. Box 876, Valley Forge, PA 19482. More information about the trustees is in the Statement of Additional Information, which can be obtained, without charge, by contacting Vanguard at 800-662-7447, or online at vanguard.com.
InterestedTrustee1
F. William McNabb III
Born 1957. Trustee Since July 2009. Chairman of the Board. Principal Occupation(s) During the Past Five Years and Other Experience: Chairman of the Board of The Vanguard Group, Inc., and of each of the investment companies served by The Vanguard Group, since January 2010; Director of The Vanguard Group since 2008; Chief Executive Officer and President of The Vanguard Group, and of each of the investment companies served by The Vanguard Group, since 2008; Director of Vanguard Marketing Corporation; Managing Director of The Vanguard Group (1995–2008).
IndependentTrustees
Emerson U. Fullwood
Born 1948. Trustee Since January 2008. Principal Occupation(s) During the Past Five Years and Other Experience: Executive Chief Staff and Marketing Officer for North America and Corporate Vice President (retired 2008) of Xerox Corporation (document management products and services); Executive in Residence and 2009–2010 Distinguished Minett Professor at the Rochester Institute of Technology; Lead Director of SPX FLOW, Inc. (multi-industry manufacturing); Director of the United Way of Rochester, the University of Rochester Medical Center, Monroe Community College Foundation, North Carolina A&T University, and Roberts Wesleyan College.
Rajiv L. Gupta
Born 1945. Trustee Since December 2001.2 Principal Occupation(s) During the Past Five Years and Other Experience: Chairman and Chief Executive Officer (retired 2009) and President (2006–2008) of Rohm and Haas Co. (chemicals); Director of Tyco International plc (diversified manufacturing and services), HP Inc. (printer and personal computer manufacturing), and Delphi Automotive plc (automotive components); Senior Advisor at New Mountain Capital.
Amy Gutmann
Born 1949. Trustee Since June 2006. Principal Occupation(s) During the Past Five Years and Other Experience: President of the University of Pennsylvania; Christopher H. Browne Distinguished Professor of Political Science, School of Arts and Sciences, and Professor of Communication, Annenberg School for Communication, with secondary faculty appointments in the Department of Philosophy, School of Arts and Sciences, and at the Graduate School of Education, University of Pennsylvania; Trustee of the National Constitution Center; Chair of the Presidential Commission for the Study of Bioethical Issues.
JoAnn Heffernan Heisen
Born 1950. Trustee Since July 1998. Principal Occupation(s) During the Past Five Years and Other Experience: Corporate Vice President and Chief Global Diversity Officer (retired 2008) and Member of the Executive Committee (1997–2008) of Johnson & Johnson (pharmaceuticals/medical devices/consumer products); Director of Skytop Lodge Corporation (hotels) and the Robert Wood Johnson Foundation; Member of the Advisory Board of the Institute for Women’s Leadership at Rutgers University.
F. Joseph Loughrey
Born 1949. Trustee Since October 2009. Principal Occupation(s) During the Past Five Years and Other Experience: President and Chief Operating Officer (retired 2009) of Cummins Inc. (industrial machinery); Chairman of the Board of Hillenbrand, Inc. (specialized consumer services), and of Oxfam America; Director of SKF AB (industrial machinery), Hyster-Yale Materials Handling, Inc. (forklift trucks), the Lumina Foundation for Education, and the V Foundation for Cancer Research; Member of the Advisory Council for the College of Arts and Letters and of the Advisory Board to the Kellogg Institute for International Studies, both at the University of Notre Dame.
Mark Loughridge
Born 1953. Trustee Since March 2012. Principal Occupation(s) During the Past Five Years and Other Experience: Senior Vice President and Chief Financial Officer (retired 2013) at IBM (information technology services); Fiduciary Member of IBM’s Retirement Plan Committee (2004–2013); Director of the Dow Chemical Company; Member of the Council on Chicago Booth.
Scott C. Malpass
Born 1962. Trustee Since March 2012. Principal Occupation(s) During the Past Five Years and Other Experience: Chief Investment Officer and Vice President at the University of Notre Dame; Assistant Professor of Finance at the Mendoza College of Business at Notre Dame; Member of the Notre Dame 403(b) Investment Committee, the Board of Advisors for Spruceview Capital Partners, and the Investment Advisory Committee of Major League Baseball; Board Member of TIFF Advisory Services, Inc., and Catholic Investment Services, Inc. (investment advisors).
André F. Perold
Born 1952. Trustee Since December 2004. Principal Occupation(s) During the Past Five Years and Other Experience: George Gund Professor of Finance and Banking, Emeritus at the Harvard Business School (retired 2011); Chief Investment Officer and Managing Partner of HighVista Strategies LLC (private investment firm); Director of Rand Merchant Bank; Overseer of the Museum of Fine Arts Boston.
Peter F. Volanakis
Born 1955. Trustee Since July 2009. Principal Occupation(s) During the Past Five Years and Other Experience: President and Chief Operating Officer (retired 2010) of Corning Incorporated (communications equipment); Chairman of the Board of Trustees of Colby-Sawyer College; Member of the Advisory Board of the Norris Cotton Cancer Center.
Executive Officers
Glenn Booraem
Born 1967. Treasurer Since May 2015. Principal Occupation(s) During the Past Five Years and Other Experience: Principal of The Vanguard Group, Inc.; Treasurer of each of the investment companies served by The Vanguard Group; Controller of each of the investment companies served by The Vanguard Group (2010–2015); Assistant Controller of each of the investment companies served by The Vanguard Group (2001–2010).
Thomas J. Higgins
Born 1957. Chief Financial Officer Since September 2008. Principal Occupation(s) During the Past Five Years and Other Experience: Principal of The Vanguard Group, Inc.; Chief Financial Officer of each of the investment companies served by The Vanguard Group; Treasurer of each of the investment companies served by The Vanguard Group (1998–2008).
Peter Mahoney
Born 1974. Controller Since May 2015. Principal Occupation(s) During the Past Five Years and Other Experience: Head of Global Fund Accounting at The Vanguard Group, Inc.; Controller of each of the investment companies served by The Vanguard Group; Head of International Fund Services at The Vanguard Group (2008–2014).
Anne E. Robinson
Born 1970. Secretary Since September 2016. Principal Occupation(s) During the Past Five Years and Other Experience: Managing Director of The Vanguard Group, Inc.; General Counsel of The Vanguard Group; Secretary of The Vanguard Group and of each of the investment companies served by The Vanguard Group; Director and Senior Vice President of Vanguard Marketing Corporation; Managing Director and General Counsel of Global Cards and Consumer Services at Citigroup (2014–2016); Counsel at American Express (2003–2014).
Vanguard Senior Management Team
| |
Mortimer J. Buckley Kathleen C. Gubanich Martha G. King John T. Marcante Chris D. McIsaac | James M. Norris Thomas M. Rampulla Glenn W. Reed Karin A. Risi Michael Rollings |
Chairman Emeritus and Senior Advisor John J. Brennan
Chairman, 1996–2009
Chief Executive Officer and President, 1996–2008
Founder
John C. Bogle
Chairman and Chief Executive Officer, 1974–1996
1 Mr. McNabb is considered an “interested person,” as defined in the Investment Company Act of 1940, because he is an officer of the Vanguard funds.
2 December 2002 for Vanguard Equity Income Fund, the Vanguard Municipal Bond Funds, and the Vanguard State Tax-Exempt Funds.
 |
| P.O. Box 2600 |
| Valley Forge, PA 19482-2600 |
Connect with Vanguard® > vanguard.com
| |
| Fund Information > 800-662-7447 | |
| Direct Investor Account Services > 800-662-2739 | |
| Institutional Investor Services > 800-523-1036 | |
| Text Telephone for People | |
| Who Are Deaf or Hard of Hearing> 800-749-7273 | |
| |
| This material may be used in conjunction | |
| with the offering of shares of any Vanguard | |
| fund only if preceded or accompanied by | |
| the fund’s current prospectus. | |
| |
| All comparative mutual fund data are from Lipper, a | |
| Thomson Reuters Company, or Morningstar, Inc., unless | |
| otherwise noted. | |
| |
| You can obtain a free copy of Vanguard’s proxy voting | |
| guidelines by visiting vanguard.com/proxyreporting or by | |
| calling Vanguard at 800-662-2739. The guidelines are | |
| also available from the SEC’s website, sec.gov. In | |
| addition, you may obtain a free report on how your fund | |
| voted the proxies for securities it owned during the 12 | |
| months ended June 30. To get the report, visit either | |
| vanguard.com/proxyreporting or sec.gov. | |
| |
| You can review and copy information about your fund at | |
| the SEC’s Public Reference Room in Washington, D.C. To | |
| find out more about this public service, call the SEC at | |
| 202-551-8090. Information about your fund is also | |
| available on the SEC’s website, and you can receive | |
| copies of this information, for a fee, by sending a | |
| request in either of two ways: via email addressed to | |
| publicinfo@sec.gov or via regular mail addressed to the | |
| Public Reference Section, Securities and Exchange | |
| Commission, Washington, DC 20549-1520. | |
| |
| | © 2016 The Vanguard Group, Inc. |
| | All rights reserved. |
| | Vanguard Marketing Corporation, Distributor. |
| |
| | Q3080B 112016 |
Annual Report | September 30, 2016
Vanguard Institutional Target Retirement Funds
Vanguard Institutional Target Retirement Income Fund
Vanguard Institutional Target Retirement 2010 Fund
Vanguard Institutional Target Retirement 2015 Fund
Vanguard Institutional Target Retirement 2020 Fund
Vanguard Institutional Target Retirement 2025 Fund
Vanguard Institutional Target Retirement 2030 Fund
A new format, unwavering commitment
As you begin reading this report, you’ll notice that we’ve made some improvements to the opening sections—based on feedback from you, our clients.
Page 1 starts with a new ”Your Fund’s Performance at a Glance,” a concise, handy summary of how your fund performed during the period.
In the renamed ”Chairman’s Perspective,” Bill McNabb will focus on enduring principles and investment insights.
We’ve modified some tables, and eliminated some redundancy, but we haven’t removed any information.
At Vanguard, we’re always looking for better ways to communicate and to help you make sound investment decisions. Thank you for entrusting your assets to us.
| |
| Contents | |
| Your Fund’s Performance at a Glance. | 1 |
| Chairman’s Perspective. | 3 |
| Institutional Target Retirement Income Fund. | 6 |
| Institutional Target Retirement 2010 Fund. | 17 |
| Institutional Target Retirement 2015 Fund. | 28 |
| Institutional Target Retirement 2020 Fund. | 39 |
| Institutional Target Retirement 2025 Fund. | 50 |
| Institutional Target Retirement 2030 Fund. | 61 |
| About Your Fund’s Expenses. | 74 |
| Glossary. | 76 |
Please note: The opinions expressed in this report are just that—informed opinions. They should not be considered promises or advice. Also, please keep in mind that the information and opinions cover the period through the date on the front of this report. Of course, the risks of investing in your fund are spelled out in the prospectus.
See the Glossary for definitions of investment terms used in this report.
About the cover: No matter what language you speak, Vanguard has one consistent message and set of principles. Our primary focus is on you, our clients. We conduct our business with integrity as a faithful steward of your assets. This message is shown translated into seven languages, reflecting our expanding global presence.
Your Fund’s Performance at a Glance
• For the 12 months ended September 30, 2016, both domestic and international stock markets made strong gains, returning about 15% and about 9%, respectively.
• Global fixed income markets also turned in solid results. U.S. bonds returned about 5%; international bonds returned about 8% for U.S.-based investors.
• Against this backdrop, the six Vanguard Institutional Target Retirement Funds covered in this report produced returns ranging from 7.66% for the Institutional Target Retirement Income Fund to 11.30% for the Institutional Target Retirement 2030 Fund. (The funds with retirement dates of 2035 through 2060 are covered in a separate report.)
- Not surprisingly, the funds with greater allocations to stocks performed best.
- Each fund posted returns that were in line with its composite benchmark index
after expenses. Five surpassed the average return of their peers. The only fund to lag its peer group, Institutional Target Retirement 2010 Fund, did so by less than half of a percentage point.
| |
| Total Returns: Fiscal Year Ended September 30, 2016 | |
| | Total |
| | Returns |
| Vanguard Institutional Target Retirement Income Fund | 7.66% |
| Target Income Composite Index | 7.79 |
| Mixed-Asset Target Today Funds Average | 7.25 |
| Mixed-Asset Target Today Funds Average: Derived from data provided by Lipper, a Thomson Reuters Company. | |
| |
| Vanguard Institutional Target Retirement 2010 Fund | 7.87% |
| Target 2010 Composite Index | 8.08 |
| Mixed-Asset Target 2010 Funds Average | 8.13 |
| Mixed-Asset Target 2010 Funds Average: Derived from data provided by Lipper, a Thomson Reuters Company. | |
| |
| Vanguard Institutional Target Retirement 2015 Fund | 9.14% |
| Target 2015 Composite Index | 9.36 |
| Mixed-Asset Target 2015 Funds Average | 8.32 |
| Mixed-Asset Target 2015 Funds Average: Derived from data provided by Lipper, a Thomson Reuters Company. | |
| |
| Vanguard Institutional Target Retirement 2020 Fund | 10.16% |
| Target 2020 Composite Index | 10.40 |
| Mixed-Asset Target 2020 Funds Average | 8.50 |
| Mixed-Asset Target 2020 Funds Average: Derived from data provided by Lipper, a Thomson Reuters Company. | |
1
| |
| | Total |
| | Returns |
| Vanguard Institutional Target Retirement 2025 Fund | 10.76% |
| Target 2025 Composite Index | 11.01 |
| Mixed-Asset Target 2025 Funds Average | 9.47 |
| Mixed-Asset Target 2025 Funds Average: Derived from data provided by Lipper, a Thomson Reuters Company. | |
| |
| Vanguard Institutional Target Retirement 2030 Fund | 11.30% |
| Target 2030 Composite Index | 11.52 |
| Mixed-Asset Target 2030 Funds Average | 10.19 |
| Mixed-Asset Target 2030 Funds Average: Derived from data provided by Lipper, a Thomson Reuters Company. | |
| For a benchmark description, see the Glossary. | |
Investments in Target Retirement Funds are subject to the risks of their underlying funds. The year in the fund name refers to the approximate year (the target date) when an investor in the fund would retire and leave the work force. The fund will gradually shift its emphasis from more aggressive investments to more conservative ones based on its target date. An investment in a Target Retirement Fund is not guaranteed at any time, including on or after the target date.
2
Chairman’s Perspective

Bill McNabb
Chairman and Chief Executive Officer
Dear Shareholder,
If you think you’ve had reason to feel uneasy about the investment environment lately, you’re not imagining things. In just the past few months, we’ve seen economic uncertainty, intense political polarization, and super-low bond yields. Yet at the same time, the stock market kept pushing higher.
In this confusing and sometimes contradictory climate, you may be asking yourself a question that I hear often: How do I make sense of all this, keep investing, and still get a good night’s sleep?
As with any problem, there are multiple ways to go at it. But there’s one approach in particular that is simple, straightforward, and nearly foolproof: Save more money. Not only can saving more give you a greater sense of control over your investment plan, it can help compensate for long-term returns that, in our estimation, could fall short of historical averages.
I love the way one of our investment pros put it. Fran Kinniry this summer told The Wall Street Journal, “Investing is always a partnership between you and the markets.” He explained that the markets carried more than their fair share of the weight for a couple of decades, through the 1990s, providing outsized returns that made the investor’s half of the partnership relatively light work. “But now you are going to have to be the majority partner.”
Sobering? Sure. Hopeless? Definitely not.
3
Over the 12 months since last September, U.S. stocks returned 15%, though the rise has not been a one-way ticket straight up. International markets have also posted strong returns, but lower than those of the broad U.S. market. The decision by United Kingdom voters in June to exit the European Union came as a surprise but caused market heartburn for only a few days.
In fixed income, yields remained extremely low—about 1.60% on the 10-year U.S. Treasury note at the end of September, after dipping below 1.40% over the summer. And bond yields in some international markets were negative.
Even this relatively small window of time illustrates a truism of the financial markets: There will always be segments that perform well and others that don’t. Saving more saves you from trying to control the uncontrollable—how economies and the markets perform. And it keeps you in control of one of the most vital parts of your investment program.
Although the “save more” logic is easy to grasp, it’s not always easy to follow. Bills, illness, the loss of a job—these can affect any of us.
But whatever our circumstances, figuring out how to save more is worth the effort. It requires that we make difficult decisions to forgo some consumption today to increase the likelihood of consuming (or consuming more) in the future. This is the very heart of investing. Sacrifices are never fun, so consider carrying them out systematically and in doses that you
| | | |
| Market Barometer | | | |
| | | Average Annual Total Returns |
| | | Periods Ended September 30, 2016 |
| | One | Three | Five |
| | Year | Years | Years |
| Stocks | | | |
| Russell 1000 Index (Large-caps) | 14.93% | 10.78% | 16.41% |
| Russell 2000 Index (Small-caps) | 15.47 | 6.71 | 15.82 |
| Russell 3000 Index (Broad U.S. market) | 14.96 | 10.44 | 16.36 |
| FTSE All-World ex US Index (International) | 9.62 | 0.71 | 6.50 |
| |
| Bonds | | | |
| Bloomberg Barclays U.S. Aggregate Bond Index | | | |
| (Broad taxable market) | 5.19% | 4.03% | 3.08% |
| Bloomberg Barclays Municipal Bond Index | | | |
| (Broad tax-exempt market) | 5.58 | 5.54 | 4.48 |
| Citigroup Three-Month U.S. Treasury Bill Index | 0.20 | 0.06 | 0.06 |
| |
| CPI | | | |
| Consumer Price Index | 1.46% | 1.03% | 1.25% |
4
can be comfortable with—for instance, gradually getting up to the max in your IRA, or adding a percentage point or so to the amount you stash in your employer’s retirement plan. As a point of reference, we generally suggest that investors strive for a retirement savings rate of 12%–15%, including any employer contributions.
If you need more convincing about the wisdom of the “save more” course of action, it might be helpful to examine your alternatives. This list is by no means exhaustive, but it hits on a few of the big ones, and none are without risk.
• Reach for yield. With yields so low on many types of bonds, it’s tempting to find the corners of the fixed income market where payouts are juicier. But with the juice comes considerable risk. You need to be aware that you’d be taking on more risk—and how much more.
• Go all-in on a hot-performing asset class or fund. By now, you know better than that, right?
• Sit tight. This approach isn’t a terrible idea; it’s better than panicking and deciding to just “do something,” particularly if that means changing your approach in response to the market’s movements.
Here’s the inescapably challenging part of your partnership with the markets: In the short run, your “partner” is fickle, emotional, and wildly unpredictable. But in the long run, your partner is mostly rational and extremely helpful.
The best way to minimize your vulnerability to the market’s mood swings, and to maximize the benefit of your partner’s longer-term strengths, is to expect less and save more. Maybe the markets will deliver better-than-expected returns. Maybe they’ll be consistent with our more modest expectations. In either case, a higher savings rate can help put you in a better position to reach your goals.
As always, thank you for investing with Vanguard.

F. William McNabb III
Chairman and Chief Executive Officer October 18, 2016
5
Institutional Target Retirement Income Fund
Fund Profile
As of September 30, 2016
| |
| Total Fund Characteristics | |
| |
| Ticker Symbol | VITRX |
| 30-Day SEC Yield | 1.82% |
| Acquired Fund Fees and Expenses1 | 0.10% |
| |
| Allocation to Underlying Vanguard Funds | |
| Vanguard Total Bond Market II Index Fund | |
| Investor Shares | 37.1% |
| Vanguard Total Stock Market Index Fund | |
| Institutional Shares | 18.0 |
| Vanguard Short-Term Inflation-Protected | |
| Securities Index Fund Admiral Shares | 16.7 |
| Vanguard Total International Bond Index | |
| Fund Admiral Shares | 16.2 |
| Vanguard Total International Stock Index | |
| Fund Investor Shares | 12.0 |

1 This figure—drawn from the prospectus dated January 28, 2016—represents an estimate of the weighted average of the expense ratios and any transaction fees charged by the underlying mutual funds (the ”acquired” funds) in which the Institutional Target Retirement Income Fund invests. The fund does not charge any expenses or fees of its own. For the fiscal year ended September 30, 2016, the annualized acquired fund fees and expenses were 0.09%.
6
Institutional Target Retirement Income Fund
Performance Summary
All of the returns in this report represent past performance, which is not a guarantee of future results that may be achieved by the fund. (Current performance may be lower or higher than the performance data cited. For performance data current to the most recent month-end, visit our website at vanguard.com/performance.) Note, too, that both investment returns and principal value can fluctuate widely, so an investor’s shares, when sold, could be worth more or less than their original cost. The returns shown do not reflect taxes that a shareholder would pay on fund distributions or on the sale of fund shares.
Cumulative Performance: June 26, 2015, Through September 30, 2016
Initial Investment of $100,000,000

For a benchmark description, see the Glossary.
Mixed-Asset Target Today Funds Average: Derived from data provided by Lipper, a Thomson Reuters Company.
"Since Inception" performance is calculated from the fund's inception date for both the fund and its comparative standards.
See Financial Highlights for dividend and capital gains information.
7
Institutional Target Retirement Income Fund
Fiscal-Year Total Returns (%): June 26, 2015, Through September 30, 2016
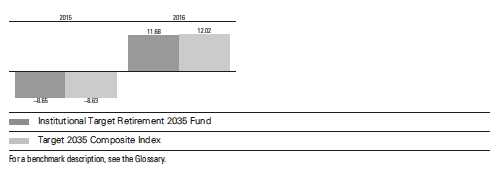
8
Institutional Target Retirement Income Fund
Financial Statements
Statement of Net Assets
As of September 30, 2016
The fund reports a complete list of its holdings in regulatory filings four times in each fiscal year, at the quarter-ends. For the second and fourth fiscal quarters, the lists appear in the fund’s semiannual and annual reports to shareholders. For the first and third fiscal quarters, the fund files the lists with the Securities and Exchange Commission on Form N-Q. Shareholders can look up the fund’s Forms N-Q on the SEC’s website at sec.gov. Forms N-Q may also be reviewed and copied at the SEC’s Public Reference Room (see the back cover of this report for further information).
| | |
| | | Market |
| | | Value• |
| | Shares | ($000) |
| Investment Companies (99.7%) | | |
| U.S. Stock Fund (18.0%) | | |
| Vanguard Total Stock Market Index Fund Institutional Shares | 6,738,855 | 365,313 |
| |
| International Stock Fund (11.9%) | | |
| Vanguard Total International Stock Index Fund Investor Shares | 16,034,495 | 242,762 |
| |
| U.S. Bond Funds (53.6%) | | |
| 1 Vanguard Total Bond Market II Index Fund Investor Shares | 67,938,313 | 750,039 |
| Vanguard Short-Term Inflation-Protected Securities Index Fund Admiral Shares | 13,587,406 | 338,055 |
| | | 1,088,094 |
| International Bond Fund (16.2%) | | |
| Vanguard Total International Bond Index Fund Admiral Shares | 14,700,448 | 328,408 |
| Total Investment Companies (Cost $1,954,651) | | 2,024,577 |
| Other Assets and Liabilities (0.3%) | | |
| Other Assets | | 28,221 |
| Liabilities | | (22,298) |
| | | 5,923 |
| Net Assets (100%) | | |
| Applicable to 98,546,255 outstanding $.001 par value shares of | | |
| beneficial interest (unlimited authorization) | | 2,030,500 |
| Net Asset Value Per Share | | $20.60 |
9
| |
| Institutional Target Retirement Income Fund | |
| |
| |
| |
| |
| | Amount |
| | ($000) |
| Statement of Assets and Liabilities | |
| Assets | |
| Investments in Securities, at Value—Affiliated Vanguard Funds | 2,024,577 |
| Receivables for Capital Shares Issued | 26,532 |
| Receivables for Accrued Income | 1,689 |
| Total Assets | 2,052,798 |
| Liabilities | |
| Payables for Investment Securities Purchased | 17,658 |
| Payables for Capital Shares Redeemed | 3,982 |
| Other Liabilities | 658 |
| Total Liabilities | 22,298 |
| Net Assets | 2,030,500 |
| |
| |
| At September 30, 2016, net assets consisted of: | |
| | Amount |
| | ($000) |
| Paid-in Capital | 1,958,825 |
| Undistributed Net Investment Income | 1,498 |
| Accumulated Net Realized Gains | 251 |
| Unrealized Appreciation (Depreciation) | 69,926 |
| Net Assets | 2,030,500 |
• See Note A in Notes to Financial Statements.
1 Affiliated fund available only to Vanguard funds and certain trusts and accounts managed by Vanguard.
See accompanying Notes, which are an integral part of the Financial Statements.
10
| |
| Institutional Target Retirement Income Fund | |
| |
| |
| Statement of Operations | |
| |
| | Year Ended |
| | September 30, 2016 |
| | ($000) |
| Investment Income | |
| Income | |
| Income Distributions Received from Affiliated Funds | 28,797 |
| Net Investment Income—Note B | 28,797 |
| Realized Net Gain (Loss) | |
| Capital Gain Distributions Received from Affiliated Funds | 765 |
| Affiliated Investment Securities Sold | (104) |
| Realized Net Gain (Loss) | 661 |
| Change in Unrealized Appreciation (Depreciation) of Investment Securities | 87,221 |
| Net Increase (Decrease) in Net Assets Resulting from Operations | 116,679 |
See accompanying Notes, which are an integral part of the Financial Statements.
11
| | |
| Institutional Target Retirement Income Fund | | |
| |
| |
| Statement of Changes in Net Assets | | |
| |
| | | June 26, |
| | Year Ended | 20151 to |
| | Sept. 30, | Sept. 30, |
| | 2016 | 2015 |
| | ($000) | ($000) |
| Increase (Decrease) in Net Assets | | |
| Operations | | |
| Net Investment Income | 28,797 | 2,561 |
| Realized Net Gain (Loss) | 661 | 4 |
| Change in Unrealized Appreciation (Depreciation) | 87,221 | (17,295) |
| Net Increase (Decrease) in Net Assets Resulting from Operations | 116,679 | (14,730) |
| Distributions | | |
| Net Investment Income | (27,795) | (2,065) |
| Realized Capital Gain2 | (68) | — |
| Total Distributions | (27,863) | (2,065) |
| Capital Share Transactions | | |
| Issued | 1,311,304 | 876,113 |
| Issued in Lieu of Cash Distributions | 27,701 | 2,065 |
| Redeemed | (240,274) | (18,430) |
| Net Increase (Decrease) from Capital Share Transactions | 1,098,731 | 859,748 |
| Total Increase (Decrease) | 1,187,547 | 842,953 |
| Net Assets | | |
| Beginning of Period | 842,953 | — |
| End of Period3 | 2,030,500 | 842,953 |
| 1 | Inception. |
| 2 | Includes fiscal 2016 and 2015 short-term gain distributions totaling $68,000 and $0, respectively. Short-term gain distributions are treated as ordinary income dividends for tax purposes. |
| 3 | Net Assets—End of Period includes undistributed (overdistributed) net investment income of $1,498,000 and $496,000. |
See accompanying Notes, which are an integral part of the Financial Statements.
12
| | |
| Institutional Target Retirement Income Fund | | |
| |
| |
| Financial Highlights | | |
| |
| | Year | June 26, |
| | Ended | 20151 to |
| | Sept. 30, | Sept. 30, |
| For a Share Outstanding Throughout Each Period | 2016 | 2015 |
| Net Asset Value, Beginning of Period | $19.46 | $20.00 |
| Investment Operations | | |
| Net Investment Income | . 341 | .1112 |
| Capital Gain Distributions Received | .010 | — |
| Net Realized and Unrealized Gain (Loss) on Investments | 1.127 | (.599) |
| Total from Investment Operations | 1.478 | (.488) |
| Distributions | | |
| Dividends from Net Investment Income | (.337) | (.052) |
| Distributions from Realized Capital Gains | (.001) | — |
| Total Distributions | (.338) | (.052) |
| Net Asset Value, End of Period | $20.60 | $19.46 |
| |
| Total Return | 7.66% | -2.44% |
| |
| Ratios/Supplemental Data | | |
| Net Assets, End of Period (Millions) | $2,031 | $843 |
| Ratio of Total Expenses to Average Net Assets | — | — |
| Acquired Fund Fees and Expenses | 0.09% | 0.10%3 |
| Ratio of Net Investment Income to Average Net Assets | 1.83% | 1.99%3 |
| Portfolio Turnover Rate | 7% | 1% |
| 1 | Inception. |
| 2 | Calculated based on average shares outstanding. |
| 3 | Annualized. |
See accompanying Notes, which are an integral part of the Financial Statements.
13
Institutional Target Retirement Income Fund
Notes to Financial Statements
Vanguard Institutional Target Retirement Income Fund is registered under the Investment Company Act of 1940 as an open-end investment company, or mutual fund. The fund follows a balanced investment strategy by investing in selected Vanguard funds to achieve its targeted allocation of assets to U.S. and international stocks, and U.S. and international bonds. Financial statements and other information about each underlying fund are available on vanguard.com.
A. The following significant accounting policies conform to generally accepted accounting principles for U.S. investment companies. The fund consistently follows such policies in preparing its financial statements.
1. Security Valuation: Investments are valued at the net asset value of each underlying Vanguard fund determined as of the close of the New York Stock Exchange (generally 4 p.m., Eastern time) on the valuation date.
2. Federal Income Taxes: The fund intends to continue to qualify as a regulated investment company and distribute all of its taxable income. Management has analyzed the fund’s tax positions taken for all open federal income tax years (September 30, 2015–2016), and has concluded that no provision for federal income tax is required in the fund’s financial statements.
3. Distributions: Distributions to shareholders are recorded on the ex-dividend date.
4. Credit Facility: The fund and certain other funds managed by The Vanguard Group (“Vanguard”) participate in a $3.1 billion committed credit facility provided by a syndicate of lenders pursuant to a credit agreement that may be renewed annually; each fund is individually liable for its borrowings, if any, under the credit facility. Borrowings may be utilized for temporary and emergency purposes, and are subject to the fund’s regulatory and contractual borrowing restrictions. The participating funds are charged administrative fees and an annual commitment fee of 0.10% of the undrawn amount of the facility; these fees are allocated to the funds based on a method approved by the fund’s board of trustees and borne by the funds in which the fund invests (see Note B). Any borrowings under this facility bear interest at a rate based upon the higher of the one-month London Interbank Offered Rate, federal funds effective rate, or overnight bank funding rate plus an agreed-upon spread.
The fund had no borrowings outstanding at September 30, 2016, or at any time during the period then ended.
5. Other: Income and capital gain distributions received are recorded on the ex-dividend date. Security transactions are accounted for on the date securities are bought or sold. Costs used to determine realized gains (losses) on the sale of investment securities are those of the specific securities sold.
B. In accordance with the terms of a Funds’ Service Agreement (the “FSA”) between Vanguard and the fund, Vanguard furnishes to the fund investment advisory, corporate management, administrative, marketing, and distribution services at Vanguard’s cost of operations (as defined by the FSA). These costs of operations are allocated to the fund based on methods and guidelines approved by the board of trustees. The FSA provides that expenses otherwise allocable to Vanguard funds-of-funds may be reduced or eliminated to the extent of savings realized by the underlying Vanguard funds by virtue of being part of a fund-of-funds. Accordingly, all expenses for services provided by Vanguard to the fund and all other expenses incurred by the fund during the year ended September 30, 2016, were borne by the underlying Vanguard funds in which the fund invests. The fund’s trustees and officers are also trustees and officers, respectively, of the underlying Vanguard funds, as well as directors and employees, respectively, of Vanguard.
14
Institutional Target Retirement Income Fund
C. Various inputs may be used to determine the value of the fund’s investments. These inputs are summarized in three broad levels for financial statement purposes. The inputs or methodologies used to value securities are not necessarily an indication of the risk associated with investing in those securities.
Level 1—Quoted prices in active markets for identical securities.
Level 2—Other significant observable inputs (including quoted prices for similar securities, interest rates, prepayment speeds, credit risk, etc.).
Level 3—Significant unobservable inputs (including the fund’s own assumptions used to determine the fair value of investments).
At September 30, 2016, 100% of the market value of the fund’s investments was determined based on Level 1 inputs.
D. Distributions are determined on a tax basis and may differ from net investment income and realized capital gains for financial reporting purposes. Differences may be permanent or temporary. Permanent differences are reclassified among capital accounts in the financial statements to reflect their tax character. Temporary differences arise when certain items of income, expense, gain, or loss are recognized in different periods for financial statement and tax purposes. These differences will reverse at some time in the future. Differences in classification may also result from the treatment of short-term gains as ordinary income for tax purposes.
The fund used a tax accounting practice to treat a portion of the price of capital shares redeemed during the year as distributions from realized capital gains. Accordingly, the fund has reclassified $330,000 from accumulated net realized gains to paid-in capital.
For tax purposes, at September 30, 2016, the fund had $1,564,000 of ordinary income and $184,000 of long-term capital gains available for distribution.
At September 30, 2016, the cost of investment securities for tax purposes was $1,954,651,000. Net unrealized appreciation of investment securities for tax purposes was $69,926,000, consisting entirely of unrealized gains on securities that had risen in value since their purchase.
| | |
| E. Capital shares issued and redeemed were: | | |
| | Year Ended | June 26, 20151 to |
| | September 30, 2016 | September 30, 2015 |
| | Shares | Shares |
| | (000) | (000) |
| Issued | 65,895 | 44,137 |
| Issued in Lieu of Cash Distributions | 1,381 | 106 |
| Redeemed | (12,038) | (934) |
| Net Increase (Decrease) in Shares Outstanding | 55,238 | 43,309 |
| 1 Inception. | | |
At September 30, 2016, one shareholder was the record or beneficial owner of 26% of the fund’s net assets. If the shareholder were to redeem its investment in the fund, the redemption might lead to the realization of taxable capital gains.
15
Institutional Target Retirement Income Fund
| | | | | | |
| F. Transactions during the period in affiliated underlying Vanguard funds were as follows: | |
| |
| | | | Current Period Transactions | |
| | Sept. 30, | | Proceeds | | | Sept. 30, |
| | 2015 | | from | | Capital Gain | 2016 |
| | Market | Purchases | Securities | | Distributions | Market |
| | Value | at Cost | Sold | Income | Received | Value |
| | ($000) | ($000) | ($000) | ($000) | ($000) | ($000) |
| Vanguard Market Liquidity Fund | — | NA1 | NA1 | 3 | — | — |
| Vanguard Short-Term | | | | | | |
| Inflation-Protected Securities | | | | | | |
| Index Fund | 141,569 | 192,834 | 3,535 | — | — | 338,055 |
| Vanguard Total Bond Market II | | | | | | |
| Index Fund | 313,346 | 466,406 | 47,457 | 13,718 | 765 | 750,039 |
| Vanguard Total International | | | | | | |
| Bond Index Fund | 133,965 | 184,052 | 4,000 | 3,676 | — | 328,408 |
| Vanguard Total International | | | | | | |
| Stock Index Fund | 101,436 | 141,123 | 14,100 | 5,639 | — | 242,762 |
| Vanguard Total Stock Market | | | | | | |
| Index Fund | 152,504 | 216,810 | 37,493 | 5,761 | — | 365,313 |
| Total | 842,820 | 1,201,225 | 106,585 | 28,797 | 765 | 2,024,577 |
| 1 Not applicable—purchases and sales are for temporary cash investment purposes. | | | |
G. Management has determined that no material events or transactions occurred subsequent to September 30, 2016, that would require recognition or disclosure in these financial statements.
16
Institutional Target Retirement 2010 Fund
Fund Profile
As of September 30, 2016
| |
| Total Fund Characteristics | |
| |
| Ticker Symbol | VIRTX |
| 30-Day SEC Yield | 1.83% |
| Acquired Fund Fees and Expenses1 | 0.10% |
| |
| Allocation to Underlying Vanguard Funds | |
| Vanguard Total Bond Market II Index Fund | |
| Investor Shares | 36.3% |
| Vanguard Total Stock Market Index Fund | |
| Institutional Shares | 19.1 |
| Vanguard Total International Bond Index | |
| Fund Admiral Shares | 16.0 |
| Vanguard Short-Term Inflation-Protected | |
| Securities Index Fund Admiral Shares | 15.8 |
| Vanguard Total International Stock Index | |
| Fund Investor Shares | 12.8 |
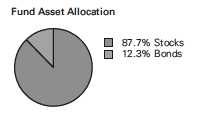
1 This figure—drawn from the prospectus dated January 28, 2016—represents an estimate of the weighted average of the expense ratios and any transaction fees charged by the underlying mutual funds (the ”acquired” funds) in which the Institutional Target Retirement 2010 Fund invests. The fund does not charge any expenses or fees of its own. For the fiscal year ended September 30, 2016, the annualized acquired fund fees and expenses were 0.09%.
17
Institutional Target Retirement 2010 Fund
Performance Summary
All of the returns in this report represent past performance, which is not a guarantee of future results that may be achieved by the fund. (Current performance may be lower or higher than the performance data cited. For performance data current to the most recent month-end, visit our website at vanguard.com/performance.) Note, too, that both investment returns and principal value can fluctuate widely, so an investor’s shares, when sold, could be worth more or less than their original cost. The returns shown do not reflect taxes that a shareholder would pay on fund distributions or on the sale of fund shares.
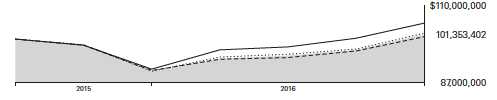
For a benchmark description, see the Glossary.
Mixed-Asset Target 2010 Funds Average: Derived from data provided by Lipper, a Thomson Reuters Company.
"Since Inception" performance is calculated from the fund's inception date for both the fund and its comparative standards.
See Financial Highlights for dividend and capital gains information.
18
Institutional Target Retirement 2010 Fund
Fiscal-Year Total Returns (%): June 26, 2015, Through September 30, 2016
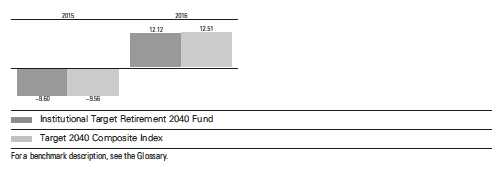
19
Institutional Target Retirement 2010 Fund
Financial Statements
Statement of Net Assets
As of September 30, 2016
The fund reports a complete list of its holdings in regulatory filings four times in each fiscal year, at the quarter-ends. For the second and fourth fiscal quarters, the lists appear in the fund’s semiannual and annual reports to shareholders. For the first and third fiscal quarters, the fund files the lists with the Securities and Exchange Commission on Form N-Q. Shareholders can look up the fund’s Forms N-Q on the SEC’s website at sec.gov. Forms N-Q may also be reviewed and copied at the SEC’s Public Reference Room (see the back cover of this report for further information).
| | |
| | | Market |
| | | Value• |
| | Shares | ($000) |
| Investment Companies (99.5%) | | |
| U.S. Stock Fund (19.0%) | | |
| Vanguard Total Stock Market Index Fund Institutional Shares | 6,452,013 | 349,764 |
| |
| International Stock Fund (12.7%) | | |
| Vanguard Total International Stock Index Fund Investor Shares | 15,479,680 | 234,362 |
| |
| U.S. Bond Funds (51.8%) | | |
| 1 Vanguard Total Bond Market II Index Fund Investor Shares | 60,098,374 | 663,486 |
| Vanguard Short-Term Inflation-Protected Securities Index Fund Admiral Shares | 11,596,323 | 288,516 |
| | | 952,002 |
| International Bond Fund (16.0%) | | |
| Vanguard Total International Bond Index Fund Admiral Shares | 13,132,850 | 293,388 |
| Total Investment Companies (Cost $1,766,346) | | 1,829,516 |
| Other Assets and Liabilities (0.5%) | | |
| Other Assets | | 24,667 |
| Liabilities | | (16,359) |
| | | 8,308 |
| Net Assets (100%) | | |
| Applicable to 88,426,935 outstanding $.001 par value shares of | | |
| beneficial interest (unlimited authorization) | | 1,837,824 |
| Net Asset Value Per Share | | $20.78 |
20
| |
| Institutional Target Retirement 2010 Fund | |
| |
| |
| |
| |
| | Amount |
| | ($000) |
| Statement of Assets and Liabilities | |
| Assets | |
| Investments in Securities, at Value—Affiliated Vanguard Funds | 1,829,516 |
| Receivables for Accrued Income | 1,498 |
| Receivables for Capital Shares Issued | 23,169 |
| Total Assets | 1,854,183 |
| Liabilities | |
| Payables for Investment Securities Purchased | 14,445 |
| Payables for Capital Shares Redeemed | 1,065 |
| Other Liabilities | 849 |
| Total Liabilities | 16,359 |
| Net Assets | 1,837,824 |
| |
| |
| At September 30, 2016, net assets consisted of: | |
| | Amount |
| | ($000) |
| Paid-in Capital | 1,754,755 |
| Undistributed Net Investment Income | 19,693 |
| Accumulated Net Realized Gains | 206 |
| Unrealized Appreciation (Depreciation) | 63,170 |
| Net Assets | 1,837,824 |
• See Note A in Notes to Financial Statements.
1 Affiliated fund available only to Vanguard funds and certain trusts and accounts managed by Vanguard.
See accompanying Notes, which are an integral part of the Financial Statements.
21
| |
| Institutional Target Retirement 2010 Fund | |
| |
| |
| Statement of Operations | |
| |
| | Year Ended |
| | September 30, 2016 |
| | ($000) |
| Investment Income | |
| Income | |
| Income Distributions Received from Affiliated Funds | 26,448 |
| Net Investment Income—Note B | 26,448 |
| Realized Net Gain (Loss) | |
| Capital Gain Distributions Received from Affiliated Funds | 644 |
| Affiliated Investment Securities Sold | (308) |
| Realized Net Gain (Loss) | 336 |
| Change in Unrealized Appreciation (Depreciation) of Investment Securities | 81,605 |
| Net Increase (Decrease) in Net Assets Resulting from Operations | 108,389 |
See accompanying Notes, which are an integral part of the Financial Statements.
22
| | |
| Institutional Target Retirement 2010 Fund | | |
| |
| |
| Statement of Changes in Net Assets | | |
| |
| | | June 26, |
| | Year Ended | 20151 to |
| | Sept. 30, | Sept. 30, |
| | 2016 | 2015 |
| | ($000) | ($000) |
| Increase (Decrease) in Net Assets | | |
| Operations | | |
| Net Investment Income | 26,448 | 2,379 |
| Realized Net Gain (Loss) | 336 | 58 |
| Change in Unrealized Appreciation (Depreciation) | 81,605 | (18,435) |
| Net Increase (Decrease) in Net Assets Resulting from Operations | 108,389 | (15,998) |
| Distributions | | |
| Net Investment Income | (8,112) | — |
| Realized Capital Gain2 | (179) | — |
| Total Distributions | (8,291) | — |
| Capital Share Transactions | | |
| Issued | 1,160,101 | 819,881 |
| Issued in Lieu of Cash Distributions | 8,286 | — |
| Redeemed | (215,491) | (19,053) |
| Net Increase (Decrease) from Capital Share Transactions | 952,896 | 800,828 |
| Total Increase (Decrease) | 1,052,994 | 784,830 |
| Net Assets | | |
| Beginning of Period | 784,830 | — |
| End of Period3 | 1,837,824 | 784,830 |
| 1 | Inception. |
| 2 | Includes fiscal 2016 and 2015 short-term gain distributions totaling $119,000 and $0, respectively. Short-term gain distributions are treated as ordinary income dividends for tax purposes. |
| 3 | Net Assets—End of Period includes undistributed (overdistributed) net investment income of $19,693,000 and $2,360,000. |
See accompanying Notes, which are an integral part of the Financial Statements.
23
| | |
| Institutional Target Retirement 2010 Fund | | |
| |
| |
| Financial Highlights | | |
| |
| | Year | June 26, |
| | Ended | 20151 to |
| | Sept. 30, | Sept. 30, |
| For a Share Outstanding Throughout Each Period | 2016 | 2015 |
| Net Asset Value, Beginning of Period | $19.40 | $20.00 |
| Investment Operations | | |
| Net Investment Income | . 376 2 | .1152 |
| Capital Gain Distributions Received | .009 2 | — |
| Net Realized and Unrealized Gain (Loss) on Investments | 1.134 | (.715) |
| Total from Investment Operations | 1.519 | (.600) |
| Distributions | | |
| Dividends from Net Investment Income | (.136) | — |
| Distributions from Realized Capital Gains | (.003) | — |
| Total Distributions | (.139) | — |
| Net Asset Value, End of Period | $20.78 | $19.40 |
| |
| Total Return | 7.87% | -3.00% |
| |
| Ratios/Supplemental Data | | |
| Net Assets, End of Period (Millions) | $1,838 | $785 |
| Ratio of Total Expenses to Average Net Assets | — | — |
| Acquired Fund Fees and Expenses | 0.09% | 0.10%3 |
| Ratio of Net Investment Income to Average Net Assets | 1.86% | 2.02%3 |
| Portfolio Turnover Rate | 8% | 3% |
| 1 | Inception. |
| 2 | Calculated based on average shares outstanding. |
| 3 | Annualized. |
See accompanying Notes, which are an integral part of the Financial Statements.
24
Institutional Target Retirement 2010 Fund
Notes to Financial Statements
Vanguard Institutional Target Retirement 2010 Fund is registered under the Investment Company Act of 1940 as an open-end investment company, or mutual fund. The fund follows a balanced investment strategy by investing in selected Vanguard funds to achieve its targeted allocation of assets to U.S. and international stocks, and U.S. and international bonds. Financial statements and other information about each underlying fund are available on vanguard.com.
A. The following significant accounting policies conform to generally accepted accounting principles for U.S. investment companies. The fund consistently follows such policies in preparing its financial statements.
1. Security Valuation: Investments are valued at the net asset value of each underlying Vanguard fund determined as of the close of the New York Stock Exchange (generally 4 p.m., Eastern time) on the valuation date.
2. Federal Income Taxes: The fund intends to continue to qualify as a regulated investment company and distribute all of its taxable income. Management has analyzed the fund’s tax positions taken for all open federal income tax years (September 30, 2015-2016), and has concluded that no provision for federal income tax is required in the fund’s financial statements.
3. Distributions: Distributions to shareholders are recorded on the ex-dividend date.
4. Credit Facility: The fund and certain other funds managed by The Vanguard Group (“Vanguard”) participate in a $3.1 billion committed credit facility provided by a syndicate of lenders pursuant to a credit agreement that may be renewed annually; each fund is individually liable for its borrowings, if any, under the credit facility. Borrowings may be utilized for temporary and emergency purposes, and are subject to the fund’s regulatory and contractual borrowing restrictions. The participating funds are charged administrative fees and an annual commitment fee of 0.10% of the undrawn amount of the facility; these fees are allocated to the funds based on a method approved by the fund’s board of trustees and borne by the funds in which the fund invests (see Note B). Any borrowings under this facility bear interest at a rate based upon the higher of the one-month London Interbank Offered Rate, federal funds effective rate, or overnight bank funding rate plus an agreed-upon spread.
The fund had no borrowings outstanding at September 30, 2016, or at any time during the period then ended.
5. Other: Income and capital gain distributions received are recorded on the ex-dividend date. Security transactions are accounted for on the date securities are bought or sold. Costs used to determine realized gains (losses) on the sale of investment securities are those of the specific securities sold.
B. In accordance with the terms of a Funds’ Service Agreement (the “FSA”) between Vanguard and the fund, Vanguard furnishes to the fund investment advisory, corporate management, administrative, marketing, and distribution services at Vanguard’s cost of operations (as defined by the FSA). These costs of operations are allocated to the fund based on methods and guidelines approved by the board of trustees. The FSA provides that expenses otherwise allocable to Vanguard funds-of-funds may be reduced or eliminated to the extent of savings realized by the underlying Vanguard funds by virtue of being part of a fund-of-funds. Accordingly, all expenses for services provided by Vanguard to the fund and all other expenses incurred by the fund during the year ended September 30, 2016, were borne by the underlying Vanguard funds in which the fund invests. The fund’s trustees and officers are also trustees and officers, respectively, of the underlying Vanguard funds, as well as directors and employees, respectively, of Vanguard.
25
Institutional Target Retirement 2010 Fund
C. Various inputs may be used to determine the value of the fund’s investments. These inputs are summarized in three broad levels for financial statement purposes. The inputs or methodologies used to value securities are not necessarily an indication of the risk associated with investing in those securities.
Level 1—Quoted prices in active markets for identical securities.
Level 2—Other significant observable inputs (including quoted prices for similar securities, interest rates, prepayment speeds, credit risk, etc.).
Level 3—Significant unobservable inputs (including the fund’s own assumptions used to determine the fair value of investments).
At September 30, 2016, 100% of the market value of the fund’s investments was determined based on Level 1 inputs.
D. Distributions are determined on a tax basis and may differ from net investment income and realized capital gains for financial reporting purposes. Differences may be permanent or temporary. Permanent differences are reclassified among capital accounts in the financial statements to reflect their tax character. Temporary differences arise when certain items of income, expense, gain, or loss are recognized in different periods for financial statement and tax purposes. These differences will reverse at some time in the future. Differences in classification may also result from the treatment of short-term gains as ordinary income for tax purposes.
The fund used a tax accounting practice to treat a portion of the price of capital shares redeemed during the year as distributions from net investment income and realized capital gains. Accordingly, the fund has reclassified $1,003,000 from undistributed net investment income, and $8,000 from accumulated net realized gains, to paid-in capital.
For tax purposes, at September 30, 2016, the fund had $19,723,000 of ordinary income and $176,000 of long-term capital gains available for distribution.
At September 30, 2016, the cost of investment securities for tax purposes was $1,766,346,000. Net unrealized appreciation of investment securities for tax purposes was $63,170,000, consisting entirely of unrealized gains on securities that had risen in value since their purchase.
| | |
| E. Capital shares issued and redeemed were: | | |
| | Year Ended | June 26, 20151 to |
| | September 30, 2016 | September 30, 2015 |
| | Shares | Shares |
| | (000) | (000) |
| Issued | 58,314 | 41,427 |
| Issued in Lieu of Cash Distributions | 422 | — |
| Redeemed | (10,770) | (966) |
| Net Increase (Decrease) in Shares Outstanding | 47,966 | 40,461 |
| 1 Inception. | | |
At September 30, 2016, one shareholder was the record or beneficial owner of 36% of the fund’s net assets. If the shareholder were to redeem its investment in the fund, the redemption might lead to the realization of taxable capital gains.
26
Institutional Target Retirement 2010 Fund
| | | | | | |
| F. Transactions during the period in affiliated underlying Vanguard funds were as follows: | |
| |
| | | | Current Period Transactions | |
| | Sept. 30, | | Proceeds | | | Sept. 30, |
| | 2015 | | from | | Capital Gain | 2016 |
| | Market | Purchases | Securities | | Distributions | Market |
| | Value | at Cost | Sold | Income | Received | Value |
| | ($000) | ($000) | ($000) | ($000) | ($000) | ($000) |
| Vanguard Market Liquidity Fund | — | NA1 | NA1 | 2 | — | — |
| Vanguard Short-Term | | | | | | |
| Inflation-Protected Securities | | | | | | |
| Index Fund | 116,769 | 173,733 | 7,883 | — | — | 288,516 |
| Vanguard Total Bond Market II | | | | | | |
| Index Fund | 278,485 | 410,545 | 40,821 | 11,937 | 644 | 663,486 |
| Vanguard Total International | | | | | | |
| Bond Index Fund | 119,137 | 162,810 | 1,017 | 3,190 | — | 293,388 |
| Vanguard Total International | | | | | | |
| Stock Index Fund | 107,919 | 133,851 | 21,814 | 5,576 | — | 234,362 |
| Vanguard Total Stock Market | | | | | | |
| Index Fund | 162,215 | 198,531 | 44,241 | 5,743 | — | 349,764 |
| Total | 784,525 | 1,079,470 | 115,776 | 26,448 | 644 | 1,829,516 |
| 1 Not applicable—purchases and sales are for temporary cash investment purposes. | | | |
G. Management has determined that no material events or transactions occurred subsequent to September 30, 2016, that would require recognition or disclosure in these financial statements.
27
Institutional Target Retirement 2015 Fund
Fund Profile
As of September 30, 2016
| |
| Total Fund Characteristics | |
| |
| Ticker Symbol | VITVX |
| 30-Day SEC Yield | 1.94% |
| Acquired Fund Fees and Expenses1 | 0.10% |
| |
| Allocation to Underlying Vanguard Funds | |
| Vanguard Total Bond Market II Index Fund | |
| Investor Shares | 30.8% |
| Vanguard Total Stock Market Index Fund | |
| Institutional Shares | 27.6 |
| Vanguard Total International Stock Index | |
| Fund Investor Shares | 18.4 |
| Vanguard Total International Bond Index | |
| Fund Admiral Shares | 13.5 |
| Vanguard Short-Term Inflation-Protected | |
| Securities Index Fund Admiral Shares | 9.7 |

1 This figure—drawn from the prospectus dated January 28, 2016—represents an estimate of the weighted average of the expense ratios and any transaction fees charged by the underlying mutual funds (the ”acquired” funds) in which the Institutional Target Retirement 2015 Fund invests. The fund does not charge any expenses or fees of its own. For the fiscal year ended September 30, 2016, the annualized acquired fund fees and expenses were 0.09%.
28
Institutional Target Retirement 2015 Fund
Performance Summary
All of the returns in this report represent past performance, which is not a guarantee of future results that may be achieved by the fund. (Current performance may be lower or higher than the performance data cited. For performance data current to the most recent month-end, visit our website at vanguard.com/performance.) Note, too, that both investment returns and principal value can fluctuate widely, so an investor’s shares, when sold, could be worth more or less than their original cost. The returns shown do not reflect taxes that a shareholder would pay on fund distributions or on the sale of fund shares.
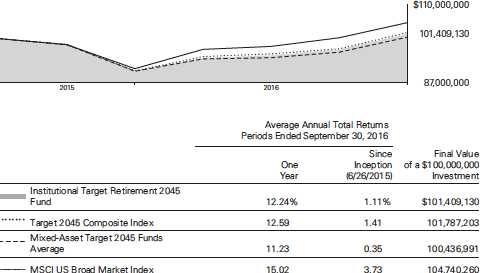
For a benchmark description, see the Glossary.
Mixed-Asset Target 2015 Funds Average: Derived from data provided by Lipper, a Thomson Reuters Company.
"Since Inception" performance is calculated from the fund's inception date for both the fund and its comparative standards.
See Financial Highlights for dividend and capital gains information.
29
Institutional Target Retirement 2015 Fund
Fiscal-Year Total Returns (%): June 26, 2015, Through September 30, 2016
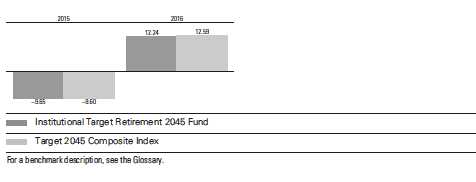
30
Institutional Target Retirement 2015 Fund
Financial Statements
Statement of Net Assets
As of September 30, 2016
The fund reports a complete list of its holdings in regulatory filings four times in each fiscal year, at the quarter-ends. For the second and fourth fiscal quarters, the lists appear in the fund’s semiannual and annual reports to shareholders. For the first and third fiscal quarters, the fund files the lists with the Securities and Exchange Commission on Form N-Q. Shareholders can look up the fund’s Forms N-Q on the SEC’s website at sec.gov. Forms N-Q may also be reviewed and copied at the SEC’s Public Reference Room (see the back cover of this report for further information).
| | |
| | | Market |
| | | Value• |
| | Shares | ($000) |
| Investment Companies (99.8%) | | |
| U.S. Stock Fund (27.5%) | | |
| Vanguard Total Stock Market Index Fund Institutional Shares | 30,560,894 | 1,656,707 |
| |
| International Stock Fund (18.4%) | | |
| Vanguard Total International Stock Index Fund Investor Shares | 73,102,573 | 1,106,773 |
| |
| U.S. Bond Funds (40.4%) | | |
| 1 Vanguard Total Bond Market II Index Fund Investor Shares | 167,781,219 | 1,852,305 |
| Vanguard Short-Term Inflation-Protected Securities Index Fund Admiral Shares | 23,461,437 | 583,720 |
| | | 2,436,025 |
| International Bond Fund (13.5%) | | |
| Vanguard Total International Bond Index Fund Admiral Shares | 36,433,441 | 813,923 |
| Total Investment Companies (Cost $5,794,751) | | 6,013,428 |
| Temporary Cash Investment (0.0%) | | |
| Money Market Fund (0.0%) | | |
| 1 Vanguard Market Liquidity Fund, 0.640% (Cost $56) | 562 | 56 |
| Total Investments (99.8%) (Cost $5,794,807) | | 6,013,484 |
| Other Assets and Liabilities (0.2%) | | |
| Other Assets | | 73,768 |
| Liabilities | | (64,505) |
| | | 9,263 |
| Net Assets (100%) | | |
| Applicable to 291,767,441 outstanding $.001 par value shares of | | |
| beneficial interest (unlimited authorization) | | 6,022,747 |
| Net Asset Value Per Share | | $20.64 |
31
| |
| Institutional Target Retirement 2015 Fund | |
| |
| |
| |
| |
| | Amount |
| | ($000) |
| Statement of Assets and Liabilities | |
| Assets | |
| Investments in Securities, at Value—Affiliated Vanguard Funds | 6,013,484 |
| Receivables for Accrued Income | 4,147 |
| Receivables for Capital Shares Issued | 69,621 |
| Total Assets | 6,087,252 |
| Liabilities | |
| Payables for Investment Securities Purchased | 62,202 |
| Payables for Capital Shares Redeemed | 2,303 |
| Total Liabilities | 64,505 |
| Net Assets | 6,022,747 |
| |
| |
| At September 30, 2016, net assets consisted of: | |
| | Amount |
| | ($000) |
| Paid-in Capital | 5,730,825 |
| Undistributed Net Investment Income | 72,225 |
| Accumulated Net Realized Gains | 1,020 |
| Unrealized Appreciation (Depreciation) | 218,677 |
| Net Assets | 6,022,747 |
• See Note A in Notes to Financial Statements.
1 Affiliated fund available only to Vanguard funds and certain trusts and accounts managed by Vanguard. Rate shown for Vanguard Market
Liquidity Fund is the 7-day yield.
See accompanying Notes, which are an integral part of the Financial Statements.
32
| |
| Institutional Target Retirement 2015 Fund | |
| |
| |
| Statement of Operations | |
| |
| | Year Ended |
| | September 30, 2016 |
| | ($000) |
| Investment Income | |
| Income | |
| Income Distributions Received from Affiliated Funds | 97,172 |
| Net Investment Income—Note B | 97,172 |
| Realized Net Gain (Loss) | |
| Capital Gain Distributions Received from Affiliated Funds | 1,859 |
| Affiliated Investment Securities Sold | (700) |
| Realized Net Gain (Loss) | 1,159 |
| Change in Unrealized Appreciation (Depreciation) of Investment Securities | 317,514 |
| Net Increase (Decrease) in Net Assets Resulting from Operations | 415,845 |
See accompanying Notes, which are an integral part of the Financial Statements.
33
| | |
| Institutional Target Retirement 2015 Fund | | |
| |
| |
| Statement of Changes in Net Assets | | |
| |
| | | June 26, |
| | Year Ended | 20151 to |
| | Sept. 30, | Sept. 30, |
| | 2016 | 2015 |
| | ($000) | ($000) |
| Increase (Decrease) in Net Assets | | |
| Operations | | |
| Net Investment Income | 97,172 | 9,769 |
| Realized Net Gain (Loss) | 1,159 | 100 |
| Change in Unrealized Appreciation (Depreciation) | 317,514 | (98,837) |
| Net Increase (Decrease) in Net Assets Resulting from Operations | 415,845 | (88,968) |
| Distributions | | |
| Net Investment Income | (31,436) | — |
| Realized Capital Gain2 | (207) | — |
| Total Distributions | (31,643) | — |
| Capital Share Transactions | | |
| Issued | 3,476,404 | 2,926,694 |
| Issued in Lieu of Cash Distributions | 31,604 | — |
| Redeemed | (659,666) | (47,523) |
| Net Increase (Decrease) from Capital Share Transactions | 2,848,342 | 2,879,171 |
| Total Increase (Decrease) | 3,232,544 | 2,790,203 |
| Net Assets | | |
| Beginning of Period | 2,790,203 | — |
| End of Period3 | 6,022,747 | 2,790,203 |
| 1 | Inception. |
| 2 | Includes fiscal 2016 and 2015 short-term gain distributions totaling $207,000 and $0, respectively. Short-term gain distributions are treated as ordinary income dividends for tax purposes. |
| 3 | Net Assets—End of Period includes undistributed (overdistributed) net investment income of $72,225,000 and $9,723,000. |
See accompanying Notes, which are an integral part of the Financial Statements.
34
| | |
| Institutional Target Retirement 2015 Fund | | |
| |
| |
| Financial Highlights | | |
| |
| | Year | June 26, |
| | Ended | 20151 to |
| | Sept. 30, | Sept. 30, |
| For a Share Outstanding Throughout Each Period | 2016 | 2015 |
| Net Asset Value, Beginning of Period | $19.06 | $20.00 |
| Investment Operations | | |
| Net Investment Income | . 345 | .124 2 |
| Capital Gain Distributions Received | .008 | — |
| Net Realized and Unrealized Gain (Loss) on Investments | 1.380 | (1.064) |
| Total from Investment Operations | 1.733 | (.940) |
| Distributions | | |
| Dividends from Net Investment Income | (.152) | — |
| Distributions from Realized Capital Gains | (.001) | — |
| Total Distributions | (.153) | — |
| Net Asset Value, End of Period | $20.64 | $19.06 |
| |
| Total Return | 9.14% | -4.70% |
| |
| Ratios/Supplemental Data | | |
| Net Assets, End of Period (Millions) | $6,023 | $2,790 |
| Ratio of Total Expenses to Average Net Assets | — | — |
| Acquired Fund Fees and Expenses | 0.09% | 0.10%3 |
| Ratio of Net Investment Income to Average Net Assets | 2.04% | 2.21%3 |
| Portfolio Turnover Rate | 10% | 1% |
| 1 | Inception. |
| 2 | Calculated based on average shares outstanding. |
| 3 | Annualized. |
See accompanying Notes, which are an integral part of the Financial Statements.
35
Institutional Target Retirement 2015 Fund
Notes to Financial Statements
Vanguard Institutional Target Retirement 2015 Fund is registered under the Investment Company Act of 1940 as an open-end investment company, or mutual fund. The fund follows a balanced investment strategy by investing in selected Vanguard funds to achieve its targeted allocation of assets to U.S. and international stocks, and U.S. and international bonds. Financial statements and other information about each underlying fund are available on vanguard.com.
A. The following significant accounting policies conform to generally accepted accounting principles for U.S. investment companies. The fund consistently follows such policies in preparing its financial statements.
1. Security Valuation: Investments are valued at the net asset value of each underlying Vanguard fund determined as of the close of the New York Stock Exchange (generally 4 p.m., Eastern time) on the valuation date.
2. Federal Income Taxes: The fund intends to continue to qualify as a regulated investment company and distribute all of its taxable income. Management has analyzed the fund’s tax positions taken for all open federal income tax years (September 30, 2015–2016), and has concluded that no provision for federal income tax is required in the fund’s financial statements.
3. Distributions: Distributions to shareholders are recorded on the ex-dividend date.
4. Credit Facility: The fund and certain other funds managed by The Vanguard Group (“Vanguard”) participate in a $3.1 billion committed credit facility provided by a syndicate of lenders pursuant to a credit agreement that may be renewed annually; each fund is individually liable for its borrowings, if any, under the credit facility. Borrowings may be utilized for temporary and emergency purposes, and are subject to the fund’s regulatory and contractual borrowing restrictions. The participating funds are charged administrative fees and an annual commitment fee of 0.10% of the undrawn amount of the facility; these fees are allocated to the funds based on a method approved by the fund’s board of trustees and borne by the funds in which the fund invests (see Note B). Any borrowings under this facility bear interest at a rate based upon the higher of the one-month London Interbank Offered Rate, federal funds effective rate, or overnight bank funding rate plus an agreed-upon spread.
The fund had no borrowings outstanding at September 30, 2016, or at any time during the period then ended.
5. Other: Income and capital gain distributions received are recorded on the ex-dividend date. Security transactions are accounted for on the date securities are bought or sold. Costs used to determine realized gains (losses) on the sale of investment securities are those of the specific securities sold.
B. In accordance with the terms of a Funds’ Service Agreement (the “FSA”) between Vanguard and the fund, Vanguard furnishes to the fund investment advisory, corporate management, administrative, marketing, and distribution services at Vanguard’s cost of operations (as defined by the FSA). These costs of operations are allocated to the fund based on methods and guidelines approved by the board of trustees. The FSA provides that expenses otherwise allocable to Vanguard funds-of-funds may be reduced or eliminated to the extent of savings realized by the underlying Vanguard funds by virtue of being part of a fund-of-funds. Accordingly, all expenses for services provided by Vanguard to the fund and all other expenses incurred by the fund during the year ended September 30, 2016, were borne by the underlying Vanguard funds in which the fund invests. The fund’s trustees and officers are also trustees and officers, respectively, of the underlying Vanguard funds, as well as directors and employees, respectively, of Vanguard.
36
Institutional Target Retirement 2015 Fund
C. Various inputs may be used to determine the value of the fund’s investments. These inputs are summarized in three broad levels for financial statement purposes. The inputs or methodologies used to value securities are not necessarily an indication of the risk associated with investing in those securities.
Level 1—Quoted prices in active markets for identical securities.
Level 2—Other significant observable inputs (including quoted prices for similar securities, interest rates, prepayment speeds, credit risk, etc.).
Level 3—Significant unobservable inputs (including the fund’s own assumptions used to determine the fair value of investments).
At September 30, 2016, 100% of the market value of the fund’s investments was determined based on Level 1 inputs.
D. Distributions are determined on a tax basis and may differ from net investment income and realized capital gains for financial reporting purposes. Differences may be permanent or temporary. Permanent differences are reclassified among capital accounts in the financial statements to reflect their tax character. Temporary differences arise when certain items of income, expense, gain, or loss are recognized in different periods for financial statement and tax purposes. These differences will reverse at some time in the future. Differences in classification may also result from the treatment of short-term gains as ordinary income for tax purposes.
The fund used a tax accounting practice to treat a portion of the price of capital shares redeemed during the year as distributions from net investment income and realized capital gains. Accordingly, the fund has reclassified $3,234,000 from undistributed net investment income, and $31,000 from accumulated net realized gains, to paid-in capital.
For tax purposes, at September 30, 2016, the fund had $72,524,000 of ordinary income and $721,000 of long-term capital gains available for distribution.
At September 30, 2016, the cost of investment securities for tax purposes was $5,794,807,000. Net unrealized appreciation of investment securities for tax purposes was $218,677,000, consisting entirely of unrealized gains on securities that had risen in value since their purchase.
| | |
| E. Capital shares issued and redeemed were: | | |
| | Year Ended | June 26, 20151 to |
| | September 30, 2016 | September 30, 2015 |
| | Shares | Shares |
| | (000) | (000) |
| Issued | 177,151 | 148,822 |
| Issued in Lieu of Cash Distributions | 1,623 | — |
| Redeemed | (33,396) | (2,433) |
| Net Increase (Decrease) in Shares Outstanding | 145,378 | 146,389 |
| 1 Inception. | | |
At September 30, 2016, one shareholder was the record or beneficial owner of 31% of the fund’s net assets. If the shareholder were to redeem its investment in the fund, the redemption might lead to the realization of taxable capital gains.
37
Institutional Target Retirement 2015 Fund
| | | | | | |
| F. Transactions during the period in affiliated underlying Vanguard funds were as follows: | |
| |
| | | | Current Period Transactions | |
| | Sept. 30, | | Proceeds | | | Sept. 30, |
| | 2015 | | from | | Capital Gain | 2016 |
| | Market | Purchases | Securities | | Distributions | Market |
| | Value | at Cost | Sold | Income | Received | Value |
| | ($000) | ($000) | ($000) | ($000) | ($000) | ($000) |
| Vanguard Market Liquidity Fund | — | NA1 | NA1 | 6 | — | 56 |
| Vanguard Short-Term | | | | | | |
| Inflation-Protected Securities | | | | | | |
| Index Fund | 239,804 | 364,264 | 32,130 | — | — | 583,720 |
| Vanguard Total Bond Market II | | | | | | |
| Index Fund | 833,132 | 1,132,935 | 156,989 | 33,861 | 1,859 | 1,852,305 |
| Vanguard Total International | | | | | | |
| Bond Index Fund | 356,208 | 431,963 | 9,615 | 9,077 | — | 813,923 |
| Vanguard Total International | | | | | | |
| Stock Index Fund | 542,515 | 589,445 | 90,443 | 26,725 | — | 1,106,773 |
| Vanguard Total Stock Market | | | | | | |
| Index Fund | 815,601 | 841,494 | 161,570 | 27,503 | — | 1,656,707 |
| Total | 2,787,260 | 3,360,101 | 450,747 | 97,172 | 1,859 | 6,013,484 |
| 1 Not applicable—purchases and sales are for temporary cash investment purposes. | | | |
G. Management has determined that no material events or transactions occurred subsequent to September 30, 2016, that would require recognition or disclosure in these financial statements.
38
Institutional Target Retirement 2020 Fund
Fund Profile
As of September 30, 2016
| |
| Total Fund Characteristics | |
| |
| Ticker Symbol | VITWX |
| 30-Day SEC Yield | 2.06% |
| Acquired Fund Fees and Expenses1 | 0.10% |
| |
| Allocation to Underlying Vanguard Funds | |
| Vanguard Total Stock Market Index Fund | |
| Institutional Shares | 34.4% |
| Vanguard Total Bond Market II Index Fund | |
| Investor Shares | 28.3 |
| Vanguard Total International Stock Index | |
| Fund Investor Shares | 22.8 |
| Vanguard Total International Bond Index | |
| Fund Admiral Shares | 12.3 |
| Vanguard Short-Term Inflation-Protected | |
| Securities Index Fund Admiral Shares | 2.2 |

1 This figure—drawn from the prospectus dated January 28, 2016—represents an estimate of the weighted average of the expense ratios and any transaction fees charged by the underlying mutual funds (the ”acquired” funds) in which the Institutional Target Retirement 2020 Fund invests. The fund does not charge any expenses or fees of its own. For the fiscal year ended September 30, 2016, the annualized acquired fund fees and expenses were 0.10%.
39
Institutional Target Retirement 2020 Fund
Performance Summary
All of the returns in this report represent past performance, which is not a guarantee of future results that may be achieved by the fund. (Current performance may be lower or higher than the performance data cited. For performance data current to the most recent month-end, visit our website at vanguard.com/performance.) Note, too, that both investment returns and principal value can fluctuate widely, so an investor’s shares, when sold, could be worth more or less than their original cost. The returns shown do not reflect taxes that a shareholder would pay on fund distributions or on the sale of fund shares.
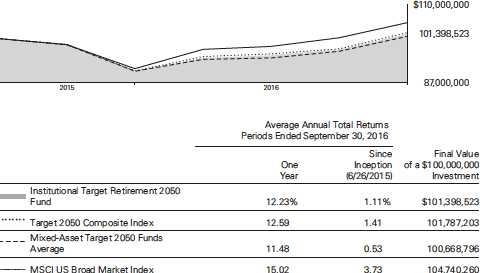
For a benchmark description, see the Glossary.
Mixed-Asset Target 2020 Funds Average: Derived from data provided by Lipper, a Thomson Reuters Company.
"Since Inception" performance is calculated from the fund's inception date for both the fund and its comparative standards.
See Financial Highlights for dividend and capital gains information.
40
Institutional Target Retirement 2020 Fund
Fiscal-Year Total Returns (%): June 26, 2015, Through September 30, 2016
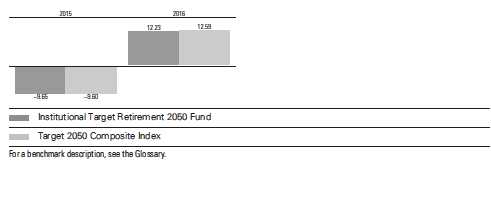
41
Institutional Target Retirement 2020 Fund
Financial Statements
Statement of Net Assets
As of September 30, 2016
The fund reports a complete list of its holdings in regulatory filings four times in each fiscal year, at the quarter-ends. For the second and fourth fiscal quarters, the lists appear in the fund’s semiannual and annual reports to shareholders. For the first and third fiscal quarters, the fund files the lists with the Securities and Exchange Commission on Form N-Q. Shareholders can look up the fund’s Forms N-Q on the SEC’s website at sec.gov. Forms N-Q may also be reviewed and copied at the SEC’s Public Reference Room (see the back cover of this report for further information).
| | |
| | | Market |
| | | Value• |
| | Shares | ($000) |
| Investment Companies (99.8%) | | |
| U.S. Stock Fund (34.3%) | | |
| Vanguard Total Stock Market Index Fund Institutional Shares | 73,441,253 | 3,981,250 |
| |
| International Stock Fund (22.7%) | | |
| Vanguard Total International Stock Index Fund Investor Shares | 174,504,168 | 2,641,993 |
| |
| U.S. Bond Funds (30.5%) | | |
| 1 Vanguard Total Bond Market II Index Fund Investor Shares | 296,986,461 | 3,278,731 |
| Vanguard Short-Term Inflation-Protected Securities Index Fund Admiral Shares | 10,422,467 | 259,311 |
| | | 3,538,042 |
| International Bond Fund (12.3%) | | |
| Vanguard Total International Bond Index Fund Admiral Shares | 63,877,503 | 1,427,024 |
| Total Investment Companies (Cost $11,133,607) | | 11,588,309 |
| Temporary Cash Investment (0.0%) | | |
| Money Market Fund (0.0%) | | |
| 1 Vanguard Market Liquidity Fund, 0.640% (Cost $2) | 21 | 2 |
| Total Investments (99.8%) (Cost $11,133,609) | | 11,588,311 |
| Other Assets and Liabilities (0.2%) | | |
| Other Assets | | 130,484 |
| Liabilities | | (105,296) |
| | | 25,188 |
| Net Assets (100%) | | |
| Applicable to 564,349,116 outstanding $.001 par value shares of | | |
| beneficial interest (unlimited authorization) | | 11,613,499 |
| Net Asset Value Per Share | | $20.58 |
42
| |
| Institutional Target Retirement 2020 Fund | |
| |
| |
| |
| |
| | Amount |
| | ($000) |
| Statement of Assets and Liabilities | |
| Assets | |
| Investments in Securities, at Value—Affiliated Vanguard Funds | 11,588,311 |
| Receivables for Accrued Income | 7,373 |
| Receivables for Capital Shares Issued | 123,111 |
| Total Assets | 11,718,795 |
| Liabilities | |
| Payables for Investment Securities Purchased | 101,460 |
| Payables for Capital Shares Redeemed | 2,388 |
| Other Liabilities | 1,448 |
| Total Liabilities | 105,296 |
| Net Assets | 11,613,499 |
| |
| |
| At September 30, 2016, net assets consisted of: | |
| | Amount |
| | ($000) |
| Paid-in Capital | 11,004,371 |
| Undistributed Net Investment Income | 151,271 |
| Accumulated Net Realized Gains | 3,155 |
| Unrealized Appreciation (Depreciation) | 454,702 |
| Net Assets | 11,613,499 |
• See Note A in Notes to Financial Statements.
1 Affiliated fund available only to Vanguard funds and certain trusts and accounts managed by Vanguard. Rate shown for Vanguard Market
Liquidity Fund is the 7-day yield.
See accompanying Notes, which are an integral part of the Financial Statements.
43
| |
| Institutional Target Retirement 2020 Fund | |
| |
| |
| Statement of Operations | |
| |
| | Year Ended |
| | September 30, 2016 |
| | ($000) |
| Investment Income | |
| Income | |
| Income Distributions Received from Affiliated Funds | 197,093 |
| Other Income | 62 |
| Net Investment Income—Note B | 197,155 |
| Realized Net Gain (Loss) | |
| Capital Gain Distributions Received from Affiliated Funds | 3,134 |
| Affiliated Investment Securities Sold | 514 |
| Realized Net Gain (Loss) | 3,648 |
| Change in Unrealized Appreciation (Depreciation) of Investment Securities | 650,773 |
| Net Increase (Decrease) in Net Assets Resulting from Operations | 851,576 |
See accompanying Notes, which are an integral part of the Financial Statements.
44
| | |
| Institutional Target Retirement 2020 Fund | | |
| |
| |
| Statement of Changes in Net Assets | | |
| |
| | | June 26, |
| | Year Ended | 20151 to |
| | Sept. 30, | Sept. 30, |
| | 2016 | 2015 |
| | ($000) | ($000) |
| Increase (Decrease) in Net Assets | | |
| Operations | | |
| Net Investment Income | 197,155 | 18,060 |
| Realized Net Gain (Loss) | 3,648 | 312 |
| Change in Unrealized Appreciation (Depreciation) | 650,773 | (196,071) |
| Net Increase (Decrease) in Net Assets Resulting from Operations | 851,576 | (177,699) |
| Distributions | | |
| Net Investment Income | (60,615) | — |
| Realized Capital Gain2 | (748) | — |
| Total Distributions | (61,363) | — |
| Capital Share Transactions | | |
| Issued | 6,547,919 | 5,067,821 |
| Issued in Lieu of Cash Distributions | 61,249 | — |
| Redeemed | (621,147) | (54,857) |
| Net Increase (Decrease) from Capital Share Transactions | 5,988,021 | 5,012,964 |
| Total Increase (Decrease) | 6,778,234 | 4,835,265 |
| Net Assets | | |
| Beginning of Period | 4,835,265 | — |
| End of Period3 | 11,613,499 | 4,835,265 |
| 1 | Inception. |
| 2 | Includes fiscal 2016 and 2015 short-term gain distributions totaling $374,000 and $0, respectively. Short-term gain distributions are treated as ordinary income dividends for tax purposes. |
| 3 | Net Assets—End of Period includes undistributed (overdistributed) net investment income of $151,271,000 and $17,994,000. |
See accompanying Notes, which are an integral part of the Financial Statements.
45
| | |
| Institutional Target Retirement 2020 Fund | | |
| |
| |
| Financial Highlights | | |
| |
| | Year | June 26, |
| | Ended | 20151 to |
| | Sept. 30, | Sept. 30, |
| For a Share Outstanding Throughout Each Period | 2016 | 2015 |
| Net Asset Value, Beginning of Period | $18.84 | $20.00 |
| Investment Operations | | |
| Net Investment Income | . 444 2 | .1382 |
| Capital Gain Distributions Received | .0072 | — |
| Net Realized and Unrealized Gain (Loss) on Investments | 1.453 | (1.298) |
| Total from Investment Operations | 1.904 | (1.160) |
| Distributions | | |
| Dividends from Net Investment Income | (.162) | — |
| Distributions from Realized Capital Gains | (.002) | — |
| Total Distributions | (.164) | — |
| Net Asset Value, End of Period | $20.58 | $18.84 |
| |
| Total Return | 10.16% | -5.80% |
| |
| Ratios/Supplemental Data | | |
| Net Assets, End of Period (Millions) | $11,613 | $4,835 |
| Ratio of Total Expenses to Average Net Assets | — | — |
| Acquired Fund Fees and Expenses | 0.10% | 0.10%3 |
| Ratio of Net Investment Income to Average Net Assets | 2.25% | 2.48%3 |
| Portfolio Turnover Rate | 5% | 2% |
| 1 | Inception. |
| 2 | Calculated based on average shares outstanding. |
| 3 | Annualized. |
See accompanying Notes, which are an integral part of the Financial Statements.
46
Institutional Target Retirement 2020 Fund
Notes to Financial Statements
Vanguard Institutional Target Retirement 2020 Fund is registered under the Investment Company Act of 1940 as an open-end investment company, or mutual fund. The fund follows a balanced investment strategy by investing in selected Vanguard funds to achieve its targeted allocation of assets to U.S. and international stocks, and U.S. and international bonds. Financial statements and other information about each underlying fund are available on vanguard.com.
A. The following significant accounting policies conform to generally accepted accounting principles for U.S. investment companies. The fund consistently follows such policies in preparing its financial statements.
1. Security Valuation: Investments are valued at the net asset value of each underlying Vanguard fund determined as of the close of the New York Stock Exchange (generally 4 p.m., Eastern time) on the valuation date.
2. Federal Income Taxes: The fund intends to continue to qualify as a regulated investment company and distribute all of its taxable income. Management has analyzed the fund’s tax positions taken for all open federal income tax years (September 30, 2015–2016), and has concluded that no provision for federal income tax is required in the fund’s financial statements.
3. Distributions: Distributions to shareholders are recorded on the ex-dividend date.
4. Credit Facility: The fund and certain other funds managed by The Vanguard Group (“Vanguard”) participate in a $3.1 billion committed credit facility provided by a syndicate of lenders pursuant to a credit agreement that may be renewed annually; each fund is individually liable for its borrowings, if any, under the credit facility. Borrowings may be utilized for temporary and emergency purposes, and are subject to the fund’s regulatory and contractual borrowing restrictions. The participating funds are charged administrative fees and an annual commitment fee of 0.10% of the undrawn amount of the facility; these fees are allocated to the funds based on a method approved by the fund’s board of trustees and borne by the funds in which the fund invests (see Note B). Any borrowings under this facility bear interest at a rate based upon the higher of the one-month London Interbank Offered Rate, federal funds effective rate, or overnight bank funding rate plus an agreed-upon spread.
The fund had no borrowings outstanding at September 30, 2016, or at any time during the period then ended.
5. Other: Income and capital gain distributions received are recorded on the ex-dividend date. Security transactions are accounted for on the date securities are bought or sold. Costs used to determine realized gains (losses) on the sale of investment securities are those of the specific securities sold.
B. In accordance with the terms of a Funds’ Service Agreement (the “FSA”) between Vanguard and the fund, Vanguard furnishes to the fund investment advisory, corporate management, administrative, marketing, and distribution services at Vanguard’s cost of operations (as defined by the FSA). These costs of operations are allocated to the fund based on methods and guidelines approved by the board of trustees. The FSA provides that expenses otherwise allocable to Vanguard funds-of-funds may be reduced or eliminated to the extent of savings realized by the underlying Vanguard funds by virtue of being part of a fund-of-funds. Accordingly, all expenses for services provided by Vanguard to the fund and all other expenses incurred by the fund during the year ended September 30, 2016, were borne by the underlying Vanguard funds in which the fund invests. The fund’s trustees and officers are also trustees and officers, respectively, of the underlying Vanguard funds, as well as directors and employees, respectively, of Vanguard.
47
Institutional Target Retirement 2020 Fund
C. Various inputs may be used to determine the value of the fund’s investments. These inputs are summarized in three broad levels for financial statement purposes. The inputs or methodologies used to value securities are not necessarily an indication of the risk associated with investing in those securities.
Level 1—Quoted prices in active markets for identical securities.
Level 2—Other significant observable inputs (including quoted prices for similar securities, interest rates, prepayment speeds, credit risk, etc.).
Level 3—Significant unobservable inputs (including the fund’s own assumptions used to determine the fair value of investments).
At September 30, 2016, 100% of the market value of the fund’s investments was determined based on Level 1 inputs.
D. Distributions are determined on a tax basis and may differ from net investment income and realized capital gains for financial reporting purposes. Differences may be permanent or temporary. Permanent differences are reclassified among capital accounts in the financial statements to reflect their tax character. Temporary differences arise when certain items of income, expense, gain, or loss are recognized in different periods for financial statement and tax purposes. These differences will reverse at some time in the future. Differences in classification may also result from the treatment of short-term gains as ordinary income for tax purposes.
The fund used a tax accounting practice to treat a portion of the price of capital shares redeemed during the year as distributions from net investment income and realized capital gains. Accordingly, the fund has reclassified $3,263,000 from undistributed net investment income, and $56,000 from accumulated net realized gains, to paid-in capital.
For tax purposes, at September 30, 2016, the fund had $151,757,000 of ordinary income and $2,669,000 of long-term capital gains available for distribution.
At September 30, 2016, the cost of investment securities for tax purposes was $11,133,607,000. Net unrealized appreciation of investment securities for tax purposes was $454,702,000, consisting entirely of unrealized gains on securities that had risen in value since their purchase.
| | |
| E. Capital shares issued and redeemed were: | | |
| | Year Ended | June 26, 20151 to |
| | September 30, 2016 | September 30, 2015 |
| | Shares | Shares |
| | (000) | (000) |
| Issued | 336,206 | 259,546 |
| Issued in Lieu of Cash Distributions | 3,164 | — |
| Redeemed | (31,724) | (2,843) |
| Net Increase (Decrease) in Shares Outstanding | 307,646 | 256,703 |
| 1 Inception. | | |
At September 30, 2016, one shareholder was the record or beneficial owner of 36% of the fund’s net assets. If the shareholder were to redeem its investment in the fund, the redemption might lead to the realization of taxable capital gains.
48
Institutional Target Retirement 2020 Fund
| | | | | | |
| F. Transactions during the period in affiliated underlying Vanguard funds were as follows: | |
| |
| | | | Current Period Transactions | |
| | Sept. 30, | | Proceeds | | | Sept. 30, |
| | 2015 | | from | | Capital Gain | 2016 |
| | Market | Purchases | Securities | | Distributions | Market |
| | Value | at Cost | Sold | Income | Received | Value |
| | ($000) | ($000) | ($000) | ($000) | ($000) | ($000) |
| Vanguard Market Liquidity Fund | — | NA1 | NA1 | 12 | — | 2 |
| Vanguard Short-Term | | | | | | |
| Inflation-Protected Securities | | | | | | |
| Index Fund | 38,623 | 263,720 | 46,855 | — | — | 259,311 |
| Vanguard Total Bond Market II | | | | | | |
| Index Fund | 1,354,847 | 2,079,672 | 230,104 | 58,046 | 3,134 | 3,278,731 |
| Vanguard Total International | | | | | | |
| Bond Index Fund | 579,463 | 794,888 | 7,299 | 15,441 | — | 1,427,024 |
| Vanguard Total International | | | | | | |
| Stock Index Fund | 1,141,341 | 1,408,735 | 61,049 | 60,928 | — | 2,641,993 |
| Vanguard Total Stock Market | | | | | | |
| Index Fund | 1,715,727 | 2,037,257 | 131,944 | 62,666 | — | 3,981,250 |
| Total | 4,830,001 | 6,584,272 | 477,251 | 197,093 | 3,134 | 11,588,311 |
| 1 Not applicable—purchases and sales are for temporary cash investment purposes. | | | |
G. Management has determined that no material events or transactions occurred subsequent to September 30, 2016, that would require recognition or disclosure in these financial statements.
49
Institutional Target Retirement 2025 Fund
Fund Profile
As of September 30, 2016
| |
| Total Fund Characteristics | |
| |
| Ticker Symbol | VRIVX |
| 30-Day SEC Yield | 2.11% |
| Acquired Fund Fees and Expenses1 | 0.10% |
| |
| Allocation to Underlying Vanguard Funds | |
| Vanguard Total Stock Market Index Fund | |
| Institutional Shares | 38.9% |
| Vanguard Total International Stock Index | |
| Fund Investor Shares | 26.1 |
| Vanguard Total Bond Market II Index Fund | |
| Investor Shares | 24.4 |
| Vanguard Total International Bond Index | |
| Fund Admiral Shares | 10.6 |
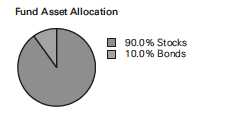
1 This figure—drawn from the prospectus dated January 28, 2016—represents an estimate of the weighted average of the expense ratios and any transaction fees charged by the underlying mutual funds (the ”acquired” funds) in which the Institutional Target Retirement 2025 Fund invests. The fund does not charge any expenses or fees of its own. For the fiscal year ended September 30, 2016, the annualized acquired fund fees and expenses were 0.10%.
50
Institutional Target Retirement 2025 Fund
Performance Summary
All of the returns in this report represent past performance, which is not a guarantee of future results that may be achieved by the fund. (Current performance may be lower or higher than the performance data cited. For performance data current to the most recent month-end, visit our website at vanguard.com/performance.) Note, too, that both investment returns and principal value can fluctuate widely, so an investor’s shares, when sold, could be worth more or less than their original cost. The returns shown do not reflect taxes that a shareholder would pay on fund distributions or on the sale of fund shares.
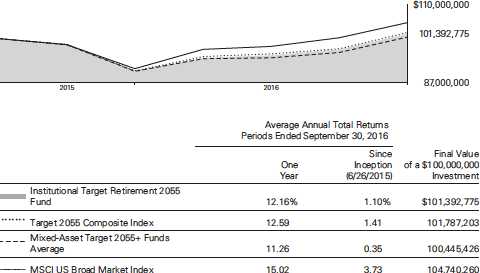
For a benchmark description, see the Glossary.
Mixed-Asset Target 2025 Funds Average: Derived from data provided by Lipper, a Thomson Reuters Company.
"Since Inception" performance is calculated from the fund's inception date for both the fund and its comparative standards.
See Financial Highlights for dividend and capital gains information.
51
Institutional Target Retirement 2025 Fund
Fiscal-Year Total Returns (%): June 26, 2015, Through September 30, 2016
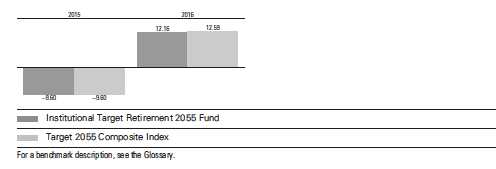
52
Institutional Target Retirement 2025 Fund
Financial Statements
Statement of Net Assets
As of September 30, 2016
The fund reports a complete list of its holdings in regulatory filings four times in each fiscal year, at the quarter-ends. For the second and fourth fiscal quarters, the lists appear in the fund’s semiannual and annual reports to shareholders. For the first and third fiscal quarters, the fund files the lists with the Securities and Exchange Commission on Form N-Q. Shareholders can look up the fund’s Forms N-Q on the SEC’s website at sec.gov. Forms N-Q may also be reviewed and copied at the SEC’s Public Reference Room (see the back cover of this report for further information).
| | |
| | | Market |
| | | Value• |
| | Shares | ($000) |
| Investment Companies (99.7%) | | |
| U.S. Stock Fund (38.9%) | | |
| Vanguard Total Stock Market Index Fund Institutional Shares | 97,758,334 | 5,299,479 |
| |
| International Stock Fund (26.0%) | | |
| Vanguard Total International Stock Index Fund Investor Shares | 233,958,739 | 3,542,135 |
| |
| U.S. Bond Fund (24.3%) | | |
| 1 Vanguard Total Bond Market II Index Fund Investor Shares | 300,006,564 | 3,312,072 |
| |
| International Bond Fund (10.5%) | | |
| Vanguard Total International Bond Index Fund Admiral Shares | 64,197,753 | 1,434,178 |
| Total Investment Companies (Cost $13,047,568) | | 13,587,864 |
| Temporary Cash Investment (0.0%) | | |
| Money Market Fund (0.0%) | | |
| 1 Vanguard Market Liquidity Fund, 0.640% (Cost $3,048) | 30,483 | 3,049 |
| Total Investments (99.7%) (Cost $13,050,616) | | 13,590,913 |
| Other Assets and Liabilities (0.3%) | | |
| Other Assets | | 153,734 |
| Liabilities | | (118,231) |
| | | 35,503 |
| Net Assets (100%) | | |
| Applicable to 665,267,464 outstanding $.001 par value shares of | | |
| beneficial interest (unlimited authorization) | | 13,626,416 |
| Net Asset Value Per Share | | $20.48 |
53
| |
| Institutional Target Retirement 2025 Fund | |
| |
| |
| |
| |
| | Amount |
| | ($000) |
| Statement of Assets and Liabilities | |
| Assets | |
| Investments in Securities, at Value—Affiliated Vanguard Funds | 13,590,913 |
| Receivables for Accrued Income | 7,299 |
| Receivables for Capital Shares Issued | 146,435 |
| Total Assets | 13,744,647 |
| Liabilities | |
| Payables for Investment Securities Purchased | 116,752 |
| Payables for Capital Shares Redeemed | 1,476 |
| Other Liabilities | 3 |
| Total Liabilities | 118,231 |
| Net Assets | 13,626,416 |
| |
| |
| At September 30, 2016, net assets consisted of: | |
| | Amount |
| | ($000) |
| Paid-in Capital | 12,902,795 |
| Undistributed Net Investment Income | 180,129 |
| Accumulated Net Realized Gains | 3,195 |
| Unrealized Appreciation (Depreciation) | 540,297 |
| Net Assets | 13,626,416 |
• See Note A in Notes to Financial Statements.
1 Affiliated fund available only to Vanguard funds and certain trusts and accounts managed by Vanguard. Rate shown for Vanguard Market
Liquidity Fund is the 7-day yield.
See accompanying Notes, which are an integral part of the Financial Statements.
54
| |
| Institutional Target Retirement 2025 Fund | |
| |
| |
| Statement of Operations | |
| |
| | Year Ended |
| | September 30, 2016 |
| | ($000) |
| Investment Income | |
| Income | |
| Income Distributions Received from Affiliated Funds | 230,756 |
| Net Investment Income—Note B | 230,756 |
| Realized Net Gain (Loss) | |
| Capital Gain Distributions Received from Affiliated Funds | 2,885 |
| Affiliated Investment Securities Sold | 636 |
| Realized Net Gain (Loss) | 3,521 |
| Change in Unrealized Appreciation (Depreciation) of Investment Securities | 798,617 |
| Net Increase (Decrease) in Net Assets Resulting from Operations | 1,032,894 |
See accompanying Notes, which are an integral part of the Financial Statements.
55
| | |
| Institutional Target Retirement 2025 Fund | | |
| |
| |
| Statement of Changes in Net Assets | | |
| |
| | | June 26, |
| | Year Ended | 20151 to |
| | Sept. 30, | Sept. 30, |
| | 2016 | 2015 |
| | ($000) | ($000) |
| Increase (Decrease) in Net Assets | | |
| Operations | | |
| Net Investment Income | 230,756 | 20,998 |
| Realized Net Gain (Loss) | 3,521 | 127 |
| Change in Unrealized Appreciation (Depreciation) | 798,617 | (258,320) |
| Net Increase (Decrease) in Net Assets Resulting from Operations | 1,032,894 | (237,195) |
| Distributions | | |
| Net Investment Income | (69,282) | — |
| Realized Capital Gain2 | (420) | — |
| Total Distributions | (69,702) | — |
| Capital Share Transactions | | |
| Issued | 7,657,545 | 5,632,871 |
| Issued in Lieu of Cash Distributions | 69,540 | — |
| Redeemed | (426,094) | (33,443) |
| Net Increase (Decrease) from Capital Share Transactions | 7,300,991 | 5,599,428 |
| Total Increase (Decrease) | 8,264,183 | 5,362,233 |
| Net Assets | | |
| Beginning of Period | 5,362,233 | — |
| End of Period3 | 13,626,416 | 5,362,233 |
| 1 | Inception. |
| 2 | Includes fiscal 2016 and 2015 short-term gain distributions totaling $420,000 and $0, respectively. Short-term gain distributions are treated as ordinary income dividends for tax purposes. |
| 3 | Net Assets—End of Period includes undistributed (overdistributed) net investment income of $180,129,000 and $20,968,000. |
See accompanying Notes, which are an integral part of the Financial Statements.
56
| | |
| Institutional Target Retirement 2025 Fund | | |
| |
| |
| Financial Highlights | | |
| |
| | Year | June 26, |
| | Ended | 20151 to |
| | Sept. 30, | Sept. 30, |
| For a Share Outstanding Throughout Each Period | 2016 | 2015 |
| Net Asset Value, Beginning of Period | $18.65 | $20.00 |
| Investment Operations | | |
| Net Investment Income | . 452 2 | .1402 |
| Capital Gain Distributions Received | .006 2 | — |
| Net Realized and Unrealized Gain (Loss) on Investments | 1.538 | (1.490) |
| Total from Investment Operations | 1.996 | (1.350) |
| Distributions | | |
| Dividends from Net Investment Income | (.165) | — |
| Distributions from Realized Capital Gains | (.001) | — |
| Total Distributions | (.166) | — |
| Net Asset Value, End of Period | $20.48 | $18.65 |
| |
| Total Return | 10.76% | -6.75% |
| |
| Ratios/Supplemental Data | | |
| Net Assets, End of Period (Millions) | $13,626 | $5,362 |
| Ratio of Total Expenses to Average Net Assets | — | — |
| Acquired Fund Fees and Expenses | 0.10% | 0.10%3 |
| Ratio of Net Investment Income to Average Net Assets | 2.30% | 2.52%3 |
| Portfolio Turnover Rate | 4% | 1% |
| 1 | Inception. |
| 2 | Calculated based on average shares outstanding. |
| 3 | Annualized. |
See accompanying Notes, which are an integral part of the Financial Statements.
57
Institutional Target Retirement 2025 Fund
Notes to Financial Statements
Vanguard Institutional Target Retirement 2025 Fund is registered under the Investment Company Act of 1940 as an open-end investment company, or mutual fund. The fund follows a balanced investment strategy by investing in selected Vanguard funds to achieve its targeted allocation of assets to U.S. and international stocks, and U.S. and international bonds. Financial statements and other information about each underlying fund are available on vanguard.com.
A. The following significant accounting policies conform to generally accepted accounting principles for U.S. investment companies. The fund consistently follows such policies in preparing its financial statements.
1. Security Valuation: Investments are valued at the net asset value of each underlying Vanguard fund determined as of the close of the New York Stock Exchange (generally 4 p.m., Eastern time) on the valuation date.
2. Federal Income Taxes: The fund intends to continue to qualify as a regulated investment company and distribute all of its taxable income. Management has analyzed the fund’s tax positions taken for all open federal income tax years (September 30, 2015–2016), and has concluded that no provision for federal income tax is required in the fund’s financial statements.
3. Distributions: Distributions to shareholders are recorded on the ex-dividend date.
4. Credit Facility: The fund and certain other funds managed by The Vanguard Group (“Vanguard”) participate in a $3.1 billion committed credit facility provided by a syndicate of lenders pursuant to a credit agreement that may be renewed annually; each fund is individually liable for its borrowings, if any, under the credit facility. Borrowings may be utilized for temporary and emergency purposes, and are subject to the fund’s regulatory and contractual borrowing restrictions. The participating funds are charged administrative fees and an annual commitment fee of 0.10% of the undrawn amount of the facility; these fees are allocated to the funds based on a method approved by the fund’s board of trustees and borne by the funds in which the fund invests (see Note B). Any borrowings under this facility bear interest at a rate based upon the higher of the one-month London Interbank Offered Rate, federal funds effective rate, or overnight bank funding rate plus an agreed-upon spread.
The fund had no borrowings outstanding at September 30, 2016, or at any time during the period then ended.
5. Other: Income and capital gain distributions received are recorded on the ex-dividend date. Security transactions are accounted for on the date securities are bought or sold. Costs used to determine realized gains (losses) on the sale of investment securities are those of the specific securities sold.
B. In accordance with the terms of a Funds’ Service Agreement (the “FSA”) between Vanguard and the fund, Vanguard furnishes to the fund investment advisory, corporate management, administrative, marketing, and distribution services at Vanguard’s cost of operations (as defined by the FSA). These costs of operations are allocated to the fund based on methods and guidelines approved by the board of trustees. The FSA provides that expenses otherwise allocable to Vanguard funds-of-funds may be reduced or eliminated to the extent of savings realized by the underlying Vanguard funds by virtue of being part of a fund-of-funds. Accordingly, all expenses for services provided by Vanguard to the fund and all other expenses incurred by the fund during the year ended September 30, 2016, were borne by the underlying Vanguard funds in which the fund invests. The fund’s trustees and officers are also trustees and officers, respectively, of the underlying Vanguard funds, as well as directors and employees, respectively, of Vanguard.
58
Institutional Target Retirement 2025 Fund
C. Various inputs may be used to determine the value of the fund’s investments. These inputs are summarized in three broad levels for financial statement purposes. The inputs or methodologies used to value securities are not necessarily an indication of the risk associated with investing in those securities.
Level 1—Quoted prices in active markets for identical securities.
Level 2—Other significant observable inputs (including quoted prices for similar securities, interest rates, prepayment speeds, credit risk, etc.).
Level 3—Significant unobservable inputs (including the fund’s own assumptions used to determine the fair value of investments).
At September 30, 2016, 100% of the market value of the fund’s investments was determined based on Level 1 inputs.
D. Distributions are determined on a tax basis and may differ from net investment income and realized capital gains for financial reporting purposes. Differences may be permanent or temporary. Permanent differences are reclassified among capital accounts in the financial statements to reflect their tax character. Temporary differences arise when certain items of income, expense, gain, or loss are recognized in different periods for financial statement and tax purposes. These differences will reverse at some time in the future. Differences in classification may also result from the treatment of short-term gains as ordinary income for tax purposes.
The fund used a tax accounting practice to treat a portion of the price of capital shares redeemed during the year as distributions from net investment income and realized capital gains. Accordingly, the fund has reclassified $2,313,000 from undistributed net investment income, and $33,000 from accumulated net realized gains, to paid-in capital.
For tax purposes, at September 30, 2016, the fund had $180,677,000 of ordinary income and $2,648,000 of long-term capital gains available for distribution.
At September 30, 2016, the cost of investment securities for tax purposes was $13,050,616,000. Net unrealized appreciation of investment securities for tax purposes was $540,297,000 consisting entirely of unrealized gains on securities that had risen in value since their purchase.
| | |
| E. Capital shares issued and redeemed were: | | |
| | Year Ended | June 26, 20151 to |
| | September 30, 2016 | September 30, 2015 |
| | Shares | Shares |
| | (000) | (000) |
| Issued | 396,056 | 289,240 |
| Issued in Lieu of Cash Distributions | 3,609 | — |
| Redeemed | (21,891) | (1,747) |
| Net Increase (Decrease) in Shares Outstanding | 377,774 | 287,493 |
| 1 Inception. | | |
At September 30, 2016, one shareholder was the record or beneficial owner of 31% of the fund’s net assets. If the shareholder were to redeem its investment in the fund, the redemption might lead to the realization of taxable capital gains.
59
Institutional Target Retirement 2025 Fund
| | | | | | |
| F. Transactions during the period in affiliated underlying Vanguard funds were as follows: | |
| | | | Current Period Transactions | |
| | Sept. 30, | | Proceeds | | | Sept. 30, |
| | 2015 | | from | | Capital Gain | 2016 |
| | Market | Purchases | Securities | | Distributions | Market |
| | Value | at Cost | Sold | Income | Received | Value |
| | ($000) | ($000) | ($000) | ($000) | ($000) | ($000) |
| Vanguard Market Liquidity Fund | 1,149 | NA1 | NA1 | 19 | — | 3,049 |
| Vanguard Total Bond Market II | | | | | | |
| Index Fund | 1,240,362 | 2,264,451 | 264,123 | 55,633 | 2,885 | 3,312,072 |
| Vanguard Total International | | | | | | |
| Bond Index Fund | 530,530 | 854,078 | 8,000 | 14,726 | — | 1,434,178 |
| Vanguard Total International | | | | | | |
| Stock Index Fund | 1,429,484 | 1,932,685 | 21,503 | 79,261 | — | 3,542,135 |
| Vanguard Total Stock Market | | | | | | |
| Index Fund | 2,148,480 | 2,766,770 | 84,602 | 81,117 | — | 5,299,479 |
| Total | 5,350,005 | 7,817,984 | 378,228 | 230,756 | 2,885 | 13,590,913 |
| 1 Not applicable—purchases and sales are for temporary cash investment purposes. | | | |
G. Management has determined that no material events or transactions occurred subsequent to September 30, 2016, that would require recognition or disclosure in these financial statements.
60
Institutional Target Retirement 2030 Fund
Fund Profile
As of September 30, 2016
| |
| Total Fund Characteristics | |
| |
| Ticker Symbol | VTTWX |
| 30-Day SEC Yield | 2.13% |
| Acquired Fund Fees and Expenses1 | 0.10% |
| |
| Allocation to Underlying Vanguard Funds | |
| Vanguard Total Stock Market Index Fund | |
| Institutional Shares | 43.6% |
| Vanguard Total International Stock Index | |
| Fund Investor Shares | 29.1 |
| Vanguard Total Bond Market II Index Fund | |
| Investor Shares | 19.0 |
| Vanguard Total International Bond Index | |
| Fund Admiral Shares | 8.3 |
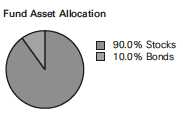
1 This figure—drawn from the prospectus dated January 28, 2016—represents an estimate of the weighted average of the expense ratios and any transaction fees charged by the underlying mutual funds (the ”acquired” funds) in which the Institutional Target Retirement 2030 Fund invests. The fund does not charge any expenses or fees of its own. For the fiscal year ended September 30, 2016, the annualized acquired fund fees and expenses were 0.10%.
61
Institutional Target Retirement 2030 Fund
Performance Summary
All of the returns in this report represent past performance, which is not a guarantee of future results that may be achieved by the fund. (Current performance may be lower or higher than the performance data cited. For performance data current to the most recent month-end, visit our website at vanguard.com/performance.) Note, too, that both investment returns and principal value can fluctuate widely, so an investor’s shares, when sold, could be worth more or less than their original cost. The returns shown do not reflect taxes that a shareholder would pay on fund distributions or on the sale of fund shares.
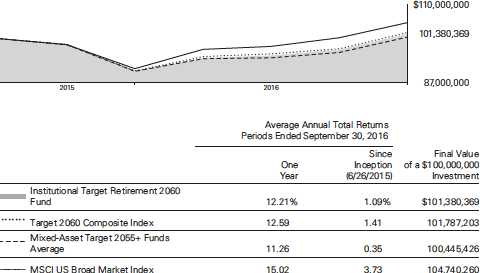
For a benchmark description, see the Glossary.
Mixed-Asset Target 2030 Funds Average: Derived from data provided by Lipper, a Thomson Reuters Company.
"Since Inception" performance is calculated from the fund's inception date for both the fund and its comparative standards.
See Financial Highlights for dividend and capital gains information.
62
Institutional Target Retirement 2030 Fund
Fiscal-Year Total Returns (%): June 26, 2015, Through September 30, 2016
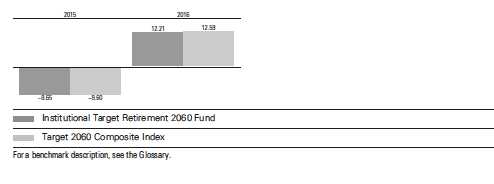
63
Institutional Target Retirement 2030 Fund
Financial Statements
Statement of Net Assets
As of September 30, 2016
The fund reports a complete list of its holdings in regulatory filings four times in each fiscal year, at the quarter-ends. For the second and fourth fiscal quarters, the lists appear in the fund’s semiannual and annual reports to shareholders. For the first and third fiscal quarters, the fund files the lists with the Securities and Exchange Commission on Form N-Q. Shareholders can look up the fund’s Forms N-Q on the SEC’s website at sec.gov. Forms N-Q may also be reviewed and copied at the SEC’s Public Reference Room (see the back cover of this report for further information).
| | |
| | | Market |
| | | Value• |
| | Shares | ($000) |
| Investment Companies (99.6%) | | |
| U.S. Stock Fund (43.4%) | | |
| Vanguard Total Stock Market Index Fund Institutional Shares | 91,935,700 | 4,983,834 |
| |
| International Stock Fund (29.0%) | | |
| Vanguard Total International Stock Index Fund Investor Shares | 220,171,419 | 3,333,395 |
| |
| U.S. Bond Fund (19.0%) | | |
| 1 Vanguard Total Bond Market II Index Fund Investor Shares | 197,437,741 | 2,179,713 |
| |
| International Bond Fund (8.2%) | | |
| Vanguard Total International Bond Index Fund Admiral Shares | 42,396,834 | 947,145 |
| Total Investment Companies (Cost $10,966,030) | | 11,444,087 |
| Temporary Cash Investment (0.0%) | | |
| Money Market Fund (0.0%) | | |
| 1 Vanguard Market Liquidity Fund, 0.640% (Cost $3) | 25 | 3 |
| Total Investments (99.6%) (Cost $10,966,033) | | 11,444,090 |
| Other Assets and Liabilities (0.4%) | | |
| Other Assets | | 116,672 |
| Liabilities | | (74,996) |
| | | 41,676 |
| Net Assets (100%) | | |
| Applicable to 564,269,320 outstanding $.001 par value shares of | | |
| beneficial interest (unlimited authorization) | | 11,485,766 |
| Net Asset Value Per Share | | $20.36 |
64
| |
| Institutional Target Retirement 2030 Fund | |
| |
| |
| |
| |
| | Amount |
| | ($000) |
| Statement of Assets and Liabilities | |
| Assets | |
| Investments in Securities, at Value—Affiliated Vanguard Funds | 11,444,090 |
| Receivables for Investment Securities Sold | 2,528 |
| Receivables for Accrued Income | 4,848 |
| Receivables for Capital Shares Issued | 109,296 |
| Total Assets | 11,560,762 |
| Liabilities | |
| Payables for Investment Securities Purchased | 68,729 |
| Payables for Capital Shares Redeemed | 4,951 |
| Other Liabilities | 1,316 |
| Total Liabilities | 74,996 |
| Net Assets | 11,485,766 |
| |
| |
| At September 30, 2016, net assets consisted of: | |
| | Amount |
| | ($000) |
| Paid-in Capital | 10,851,466 |
| Undistributed Net Investment Income | 154,293 |
| Accumulated Net Realized Gains | 1,950 |
| Unrealized Appreciation (Depreciation) | 478,057 |
| Net Assets | 11,485,766 |
• See Note A in Notes to Financial Statements.
1 Affiliated fund available only to Vanguard funds and certain trusts and accounts managed by Vanguard. Rate shown for Vanguard Market Liquidity Fund is the 7-day yield.
See accompanying Notes, which are an integral part of the Financial Statements.
65
| |
| Institutional Target Retirement 2030 Fund | |
| |
| |
| Statement of Operations | |
| |
| | Year Ended |
| | September 30, 2016 |
| | ($000) |
| Investment Income | |
| Income | |
| Income Distributions Received from Affiliated Funds | 197,138 |
| Other Income | 126 |
| Net Investment Income—Note B | 197,264 |
| Realized Net Gain (Loss) | |
| Capital Gain Distributions Received from Affiliated Funds | 1,888 |
| Affiliated Investment Securities Sold | 170 |
| Realized Net Gain (Loss) | 2,058 |
| Change in Unrealized Appreciation (Depreciation) of Investment Securities | 706,266 |
| Net Increase (Decrease) in Net Assets Resulting from Operations | 905,588 |
See accompanying Notes, which are an integral part of the Financial Statements.
66
| | |
| Institutional Target Retirement 2030 Fund | | |
| |
| |
| Statement of Changes in Net Assets | | |
| |
| | | June 26, |
| | Year Ended | 20151 to |
| | Sept. 30, | Sept. 30, |
| | 2016 | 2015 |
| | ($000) | ($000) |
| Increase (Decrease) in Net Assets | | |
| Operations | | |
| Net Investment Income | 197,264 | 17,322 |
| Realized Net Gain (Loss) | 2,058 | 269 |
| Change in Unrealized Appreciation (Depreciation) | 706,266 | (228,209) |
| Net Increase (Decrease) in Net Assets Resulting from Operations | 905,588 | (210,618) |
| Distributions | | |
| Net Investment Income | (58,300) | — |
| Realized Capital Gain2 | (358) | — |
| Total Distributions | (58,658) | — |
| Capital Share Transactions | | |
| Issued | 6,510,570 | 4,664,363 |
| Issued in Lieu of Cash Distributions | 58,472 | — |
| Redeemed | (361,459) | (22,492) |
| Net Increase (Decrease) from Capital Share Transactions | 6,207,583 | 4,641,871 |
| Total Increase (Decrease) | 7,054,513 | 4,431,253 |
| Net Assets | | |
| Beginning of Period | 4,431,253 | — |
| End of Period3 | 11,485,766 | 4,431,253 |
| 1 | Inception. |
| 2 | Includes fiscal 2016 and 2015 short-term gain distributions totaling $358,000 and $0, respectively. Short-term gain distributions are treated as ordinary income dividends for tax purposes. |
| 3 | Net Assets—End of Period includes undistributed (overdistributed) net investment income of $154,293,000 and $17,322,000. |
See accompanying Notes, which are an integral part of the Financial Statements.
67
| | |
| Institutional Target Retirement 2030 Fund | | |
| |
| |
| Financial Highlights | | |
| |
| | Year | June 26, |
| | Ended | 20151 to |
| | Sept. 30, | Sept. 30, |
| For a Share Outstanding Throughout Each Period | 2016 | 2015 |
| Net Asset Value, Beginning of Period | $18.45 | $20.00 |
| Investment Operations | | |
| Net Investment Income | . 455 2 | .1452 |
| Capital Gain Distributions Received | .0042 | — |
| Net Realized and Unrealized Gain (Loss) on Investments | 1.615 | (1.695) |
| Total from Investment Operations | 2.074 | (1.550) |
| Distributions | | |
| Dividends from Net Investment Income | (.163) | — |
| Distributions from Realized Capital Gains | (.001) | — |
| Total Distributions | (.164) | — |
| Net Asset Value, End of Period | $20.36 | $18.45 |
| |
| Total Return | 11.30% | -7.75% |
| |
| Ratios/Supplemental Data | | |
| Net Assets, End of Period (Millions) | $11,486 | $4,431 |
| Ratio of Total Expenses to Average Net Assets | — | — |
| Acquired Fund Fees and Expenses | 0.10% | 0.10%3 |
| Ratio of Net Investment Income to Average Net Assets | 2.34% | 2.64%3 |
| Portfolio Turnover Rate | 3% | 1% |
| 1 | Inception. |
| 2 | Calculated based on average shares outstanding. |
| 3 | Annualized. |
See accompanying Notes, which are an integral part of the Financial Statements.
68
Institutional Target Retirement 2030 Fund
Notes to Financial Statements
Vanguard Institutional Target Retirement 2030 Fund is registered under the Investment Company Act of 1940 as an open-end investment company, or mutual fund. The fund follows a balanced investment strategy by investing in selected Vanguard funds to achieve its targeted allocation of assets to U.S. and international stocks, and U.S. and international bonds. Financial statements and other information about each underlying fund are available on vanguard.com.
A. The following significant accounting policies conform to generally accepted accounting principles for U.S. investment companies. The fund consistently follows such policies in preparing its financial statements.
1. Security Valuation: Investments are valued at the net asset value of each underlying Vanguard fund determined as of the close of the New York Stock Exchange (generally 4 p.m., Eastern time) on the valuation date.
2. Federal Income Taxes: The fund intends to continue to qualify as a regulated investment company and distribute all of its taxable income. Management has analyzed the fund’s tax positions taken for all open federal income tax years (September 30, 2015–2016), and has concluded that no provision for federal income tax is required in the fund’s financial statements.
3. Distributions: Distributions to shareholders are recorded on the ex-dividend date.
4. Credit Facility: The fund and certain other funds managed by The Vanguard Group (“Vanguard”) participate in a $3.1 billion committed credit facility provided by a syndicate of lenders pursuant to a credit agreement that may be renewed annually; each fund is individually liable for its borrowings, if any, under the credit facility. Borrowings may be utilized for temporary and emergency purposes, and are subject to the fund’s regulatory and contractual borrowing restrictions. The participating funds are charged administrative fees and an annual commitment fee of 0.10% of the undrawn amount of the facility; these fees are allocated to the funds based on a method approved by the fund’s board of trustees and borne by the funds in which the fund invests (see Note B). Any borrowings under this facility bear interest at a rate based upon the higher of the one-month London Interbank Offered Rate, federal funds effective rate, or overnight bank funding rate plus an agreed-upon spread.
The fund had no borrowings outstanding at September 30, 2016, or at any time during the period then ended.
5. Other: Income and capital gain distributions received are recorded on the ex-dividend date. Security transactions are accounted for on the date securities are bought or sold. Costs used to determine realized gains (losses) on the sale of investment securities are those of the specific securities sold.
B. In accordance with the terms of a Funds’ Service Agreement (the “FSA”) between Vanguard and the fund, Vanguard furnishes to the fund investment advisory, corporate management, administrative, marketing, and distribution services at Vanguard’s cost of operations (as defined by the FSA). These costs of operations are allocated to the fund based on methods and guidelines approved by the board of trustees. The FSA provides that expenses otherwise allocable to Vanguard funds-of-funds may be reduced or eliminated to the extent of savings realized by the underlying Vanguard funds by virtue of being part of a fund-of-funds. Accordingly, all expenses for services provided by Vanguard to the fund and all other expenses incurred by the fund during the year ended September 30, 2016, were borne by the underlying Vanguard funds in which the fund invests. The fund’s trustees and officers are also trustees and officers, respectively, of the underlying Vanguard funds, as well as directors and employees, respectively, of Vanguard.
69
Institutional Target Retirement 2030 Fund
C. Various inputs may be used to determine the value of the fund’s investments. These inputs are summarized in three broad levels for financial statement purposes. The inputs or methodologies used to value securities are not necessarily an indication of the risk associated with investing in those securities.
Level 1—Quoted prices in active markets for identical securities.
Level 2—Other significant observable inputs (including quoted prices for similar securities, interest rates, prepayment speeds, credit risk, etc.).
Level 3—Significant unobservable inputs (including the fund’s own assumptions used to determine the fair value of investments).
At September 30, 2016, 100% of the market value of the fund’s investments was determined based on Level 1 inputs.
D. Distributions are determined on a tax basis and may differ from net investment income and realized capital gains for financial reporting purposes. Differences may be permanent or temporary. Permanent differences are reclassified among capital accounts in the financial statements to reflect their tax character. Temporary differences arise when certain items of income, expense, gain, or loss are recognized in different periods for financial statement and tax purposes. These differences will reverse at some time in the future. Differences in classification may also result from the treatment of short-term gains as ordinary income for tax purposes.
The fund used a tax accounting practice to treat a portion of the price of capital shares redeemed during the year as distributions from net investment income and realized capital gains. Accordingly, the fund has reclassified $1,993,000 from undistributed net investment income, and $19,000 from accumulated net realized gains, to paid-in capital.
For tax purposes, at September 30, 2016, the fund had $154,551,000 of ordinary income and $1,692,000 of long-term capital gains available for distribution.
At September 30, 2016, the cost of investment securities for tax purposes was $10,966,033,000. Net unrealized appreciation of investment securities for tax purposes was $478,057,000, consisting entirely of unrealized gains on securities that had risen in value since their purchase.
| | |
| E. Capital shares issued and redeemed were: | | |
| | Year Ended | June 26, 20151 to |
| | September 30, 2016 | September 30, 2015 |
| | Shares | Shares |
| | (000) | (000) |
| Issued | 339,804 | 241,310 |
| Issued in Lieu of Cash Distributions | 3,052 | — |
| Redeemed | (18,710) | (1,186) |
| Net Increase (Decrease) in Shares Outstanding | 324,146 | 240,124 |
| 1 Inception. | | |
At September 30, 2016, one shareholder was the record or beneficial owner of 35% of the fund’s net assets. If the shareholder were to redeem its investment in the fund, the redemption might lead to the realization of taxable capital gains.
70
Institutional Target Retirement 2030 Fund
| | | | | | |
| F. Transactions during the period in affiliated underlying Vanguard funds were as follows: | |
| | | | Current Period Transactions | |
| | Sept. 30, | | Proceeds | | | Sept. 30, |
| | 2015 | | from | | Capital Gain | 2016 |
| | Market | Purchases | Securities | | Distributions | Market |
| | Value | at Cost | Sold | Income | Received | Value |
| | ($000) | ($000) | ($000) | ($000) | ($000) | ($000) |
| Vanguard Market Liquidity Fund | 1,392 | NA1 | NA1 | 15 | — | 3 |
| Vanguard Total Bond Market II | | | | | | |
| Index Fund | 793,825 | 1,500,488 | 161,862 | 36,546 | 1,888 | 2,179,713 |
| Vanguard Total International | | | | | | |
| Bond Index Fund | 339,132 | 581,767 | 11,576 | 9,648 | — | 947,145 |
| Vanguard Total International | | | | | | |
| Stock Index Fund | 1,313,362 | 1,840,829 | 10,198 | 74,601 | — | 3,333,395 |
| Vanguard Total Stock Market | | | | | | |
| Index Fund | 1,974,456 | 2,619,987 | 42,559 | 76,328 | — | 4,983,834 |
| Total | 4,422,167 | 6,543,071 | 226,195 | 197,138 | 1,888 | 11,444,090 |
| 1 Not applicable—purchases and sales are for temporary cash investment purposes. | | | |
G. Management has determined that no material events or transactions occurred subsequent to September 30, 2016, that would require recognition or disclosure in these financial statements.
71
Report of Independent Registered Public Accounting Firm
To the Board of Trustees of Vanguard Chester Funds and the Shareholders of Vanguard Institutional Target Retirement Income Fund, Vanguard Institutional Target Retirement 2010 Fund, Vanguard Institutional Target Retirement 2015 Fund, Vanguard Institutional Target Retirement 2020 Fund, Vanguard Institutional Target Retirement 2025 Fund and Vanguard Institutional Target Retirement 2030 Fund: In our opinion, the accompanying statements of net assets and statements of assets and liabilities, and the related statements of operations and of changes in net assets and the financial highlights present fairly, in all material respects, the financial position of Vanguard Institutional Target Retirement Income Fund, Vanguard Institutional Target Retirement 2010 Fund, Vanguard Institutional Target Retirement 2015 Fund, Vanguard Institutional Target Retirement 2020 Fund, Vanguard Institutional Target Retirement 2025 Fund and Vanguard Institutional Target Retirement 2030 Fund (constituting separate portfolios of Vanguard Chester Funds, hereafter referred to as the “Funds”) at September 30, 2016, and the results of each of their operations for the year then ended, and the changes in each of their net assets and the financial highlights for the periods indicated, in conformity with accounting principles generally accepted in the United States of America. These financial statements and financial highlights (hereafter referred to as “financial statements”) are the responsibility of the Funds’ management. Our responsibility is to express an opinion on these financial statements based on our audits. We conducted our audits of these financial statements in accordance with the standards of the Public Company Accounting Oversight Board (United States). Those standards require that we plan and perform the audit to obtain reasonable assurance about whether the financial statements are free of material misstatement. An audit includes examining, on a test basis, evidence supporting the amounts and disclosures in the financial statements, assessing the accounting principles used and significant estimates made by management, and evaluating the overall financial statement presentation. We believe that our audits, which included confirmation of securities at September 30, 2016 by agreement to the underlying ownership records of the transfer agent, provide a reasonable basis for our opinion.
/s/PricewaterhouseCoopers LLP
Philadelphia, Pennsylvania
November 15, 2016
Special 2016 tax information (unaudited) for Vanguard Institutional Target Retirement Funds
This information for the fiscal year ended September 30, 2016, is included pursuant to provisions of the Internal Revenue Code.
The funds distributed capital gain dividends (from net long-term capital gains) to shareholders during the fiscal year as follows:
| |
| Fund | ($000) |
| Institutional Target Retirement Income | 302 |
| Institutional Target Retirement 2010 | 68 |
| Institutional Target Retirement 2015 | 73 |
| Institutional Target Retirement 2020 | 423 |
| Institutional Target Retirement 2025 | 71 |
| Institutional Target Retirement 2030 | 146 |
72
The funds distributed qualified dividend income to shareholders during the fiscal year as follows:
| |
| Fund | ($000) |
| Institutional Target Retirement Income | 9,211 |
| Institutional Target Retirement 2010 | 3,243 |
| Institutional Target Retirement 2015 | 15,838 |
| Institutional Target Retirement 2020 | 33,793 |
| Institutional Target Retirement 2025 | 42,539 |
| Institutional Target Retirement 2030 | 39,300 |
For corporate shareholders, the percentage of investment income (dividend income plus short-term gains, if any) that qualifies for the dividends-received deduction is as follows:
| |
| Fund | Percentage |
| Institutional Target Retirement Income | 17.9% |
| Institutional Target Retirement 2010 | 19.5 |
| Institutional Target Retirement 2015 | 25.2 |
| Institutional Target Retirement 2020 | 28.3 |
| Institutional Target Retirement 2025 | 31.2 |
| Institutional Target Retirement 2030 | 34.3 |
The funds designate to shareholders foreign source income and foreign taxes paid as follows:
| | |
| | Foreign Source Income | Foreign Taxes Paid |
| Fund | ($000) | ($000) |
| Institutional Target Retirement Income | 9,014 | 382 |
| Institutional Target Retirement 2010 | 8,500 | 375 |
| Institutional Target Retirement 2015 | 35,088 | 1,769 |
| Institutional Target Retirement 2020 | 75,081 | 4,007 |
| Institutional Target Retirement 2025 | 92,696 | 5,186 |
| Institutional Target Retirement 2030 | 83,389 | 4,861 |
Shareholders will receive more detailed information with their Form 1099-DIV in January 2017 to determine the calendar-year amounts to be included on their 2016 tax returns.
73
About Your Fund’s Expenses
As a shareholder of the fund, you incur ongoing costs, which include costs for portfolio management, administrative services, and shareholder reports (like this one), among others. Operating expenses, which are deducted from a fund’s gross income, directly reduce the investment return of the fund.
A typical fund’s expenses are expressed as a percentage of its average net assets. The Institutional Target Retirement Funds have no direct expenses, but each fund bears its proportionate share of the costs for the underlying funds in which it invests. These indirect expenses make up the acquired fund fees and expenses, also expressed as a percentage of average net assets.
The following examples are intended to help you understand the ongoing cost (in dollars) of investing in your fund and to compare these costs with those of other mutual funds. The examples are based on an investment of $1,000 made at the beginning of the period shown and held for the entire period. The costs were calculated using the acquired fund fees and expenses for each Institutional Target Retirement Fund.
The accompanying table illustrates your fund’s costs in two ways:
• Based on actual fund return. This section helps you to estimate the actual expenses that you paid over the period. The ”Ending Account Value“ shown is derived from the fund‘s actual return, and the third column shows the dollar amount that would have been paid by an investor who started with $1,000 in the fund. You may use the information here, together with the amount you invested, to estimate the expenses that you paid over the period.
To do so, simply divide your account value by $1,000 (for example, an $8,600 account value divided by $1,000 = 8.6), then multiply the result by the number given for your fund under the heading ”Expenses Paid During Period.“
• Based on hypothetical 5% yearly return. This section is intended to help you compare your fund‘s costs with those of other mutual funds. It assumes that the fund had a yearly return of 5% before expenses, but that the expense ratio is unchanged. In this case—because the return used is not the fund’s actual return—the results do not apply to your investment. The example is useful in making comparisons because the Securities and Exchange Commission requires all mutual funds to calculate expenses based on a 5% return. You can assess your fund’s costs by comparing this hypothetical example with the hypothetical examples that appear in shareholder reports of other funds.
Note that the expenses shown in the table are meant to highlight and help you compare ongoing costs only and do not reflect transaction costs incurred by the fund for buying and selling securities. Further, the expenses do not include any purchase, redemption, or account service fees described in the fund prospectus. If such fees were applied to your account, your costs would be higher. Your fund does not carry a “sales load.”
The calculations assume no shares were bought or sold during the period. Your actual costs may have been higher or lower, depending on the amount of your investment and the timing of any purchases or redemptions.
You can find more information about the fund’s expenses, including annual expense ratios, in the Financial Statements section of this report. For additional information on operating expenses and other shareholder costs, please refer to your fund’s current prospectus.
74
| | | |
| Six Months Ended September 30, 2016 | | | |
| | Beginning | Ending | Expenses |
| | Account Value | Account Value | Paid During |
| | 3/31/2016 | 9/30/2016 | Period |
| Based on Actual Fund Return | | | |
| Institutional Target Retirement Income Fund | $1,000.00 | $1,039.75 | $0.46 |
| Institutional Target Retirement 2010 Fund | $1,000.00 | $1,040.56 | $0.46 |
| Institutional Target Retirement 2015 Fund | $1,000.00 | $1,047.72 | $0.46 |
| Institutional Target Retirement 2020 Fund | $1,000.00 | $1,053.76 | $0.51 |
| Institutional Target Retirement 2025 Fund | $1,000.00 | $1,057.31 | $0.51 |
| Institutional Target Retirement 2030 Fund | $1,000.00 | $1,060.42 | $0.52 |
| Based on Hypothetical 5% Yearly Return | | | |
| Institutional Target Retirement Income Fund | $1,000.00 | $1,024.55 | $0.46 |
| Institutional Target Retirement 2010 Fund | $1,000.00 | $1,024.55 | $0.46 |
| Institutional Target Retirement 2015 Fund | $1,000.00 | $1,024.55 | $0.46 |
| Institutional Target Retirement 2020 Fund | $1,000.00 | $1,024.50 | $0.51 |
| Institutional Target Retirement 2025 Fund | $1,000.00 | $1,024.50 | $0.51 |
| Institutional Target Retirement 2030 Fund | $1,000.00 | $1,024.50 | $0.51 |
The calculations are based on the acquired fund fees and expenses for the most recent six-month period. The funds’ annualized expense figures for that period are (in order as listed from top to bottom above) 0.09%, 0.09%, 0.09%, 0.10%, 0.10%, and 0.10%. The dollar amounts shown as ”Expenses Paid” are equal to the annualized expense figures for the underlying funds multiplied by the average account value over the period, multiplied by the number of days in the most recent six-month period, then divided by the number of days in the most recent 12-month period (183/366).
75
Glossary
30-Day SEC Yield. A fund’s 30-day SEC yield is derived using a formula specified by the U.S. Securities and Exchange Commission. Under the formula, data related to the fund’s security holdings in the previous 30 days are used to calculate the fund’s hypothetical net income for that period, which is then annualized and divided by the fund’s estimated average net assets over the calculation period. For the purposes of this calculation, a security’s income is based on its current market yield to maturity (for bonds), its actual income (for asset-backed securities), or its projected dividend yield (for stocks). Because the SEC yield represents hypothetical annualized income, it will differ—at times significantly—from the fund’s actual experience. As a result, the fund’s income distributions may be higher or lower than implied by the SEC yield.
Acquired Fund Fees and Expenses. Funds that invest in other Vanguard funds incur no direct expenses, but they do bear proportionate shares of the operating, administrative, and advisory expenses of the underlying funds, and they must pay any fees charged by those funds. The figure for acquired fund fees and expenses represents a weighted average of these underlying costs.
Acquired is a term that the Securities and Exchange Commission applies to any mutual fund whose shares are owned by another fund.
Expense Ratio. A fund’s total annual operating expenses expressed as a percentage of the fund’s average net assets. The expense ratio includes management and administrative expenses, but does not include the transaction costs of buying and selling portfolio securities.
Inception Date. The date on which the assets of a fund (or one of its share classes) are first invested in accordance with the fund’s investment objective. For funds with a subscription period, the inception date is the day after that period ends. Investment performance is measured from the inception date.
Benchmark Information
Target 2010 Composite Index: Derived by applying the fund’s target asset allocation to the results of the following benchmarks: for international stocks of developed markets, the MSCI EAFE Index through December 15, 2010, the MSCI ACWI ex USA IMI Index through June 2, 2013, and the FTSE Global All Cap ex US Index thereafter; for emerging-market stocks, the Select Emerging Markets Index through August 23, 2006, the MSCI Emerging Markets Index through December 15, 2010, the MSCI ACWI ex USA IMI Index through June 2, 2013, and the FTSE Global All Cap ex US Index thereafter; for U.S. bonds, the Bloomberg Barclays U.S. Aggregate Bond Index through December 31, 2009, and the Bloomberg Barclays U.S. Aggregate Float Adjusted Index thereafter, as well as the Bloomberg Barclays U.S. Treasury Inflation Protected Securities Index through June 2, 2013, and the Bloomberg Barclays U.S. Treasury Inflation-Protected Securities (TIPS) 0-5 Year Index thereafter; for short-term reserves, the Citigroup Three-Month Treasury Bill Index through June 2, 2013; for international bonds, the Bloomberg Barclays Global Aggregate ex-USD Float Adjusted RIC Capped Index beginning June 3, 2013; and for U.S. stocks, the MSCI US Broad Market Index through June 2, 2013, and the CRSP US Total Market Index thereafter. International stock benchmark returns are adjusted for withholding taxes.
76
Target 2015 Composite Index: Derived by applying the fund’s target asset allocation to the results of the following benchmarks: for international stocks of developed markets, the MSCI EAFE Index through December 15, 2010, the MSCI ACWI ex USA IMI Index through June 2, 2013, and the FTSE Global All Cap ex US Index thereafter; for emerging-market stocks, the Select Emerging Markets Index through August 23, 2006, the MSCI Emerging Markets Index through December 15, 2010, the MSCI ACWI ex USA IMI Index through June 2, 2013, and the FTSE Global All Cap ex US Index thereafter; for U.S. bonds, the Bloomberg Barclays U.S. Aggregate Bond Index through December 31, 2009, and the Bloomberg Barclays U.S. Aggregate Float Adjusted Index thereafter, as well as the Bloomberg Barclays U.S. Treasury Inflation Protected Securities Index through June 2, 2013, and the Bloomberg Barclays U.S. Treasury Inflation-Protected Securities (TIPS) 0-5 Year Index thereafter; for international bonds, the Bloomberg Barclays Global Aggregate ex-USD Float Adjusted RIC Capped Index beginning June 3, 2013; and for U.S. stocks, the Dow Jones U.S. Total Stock Market Index (formerly known as the Dow Jones Wilshire 5000 Index) through April 22, 2005, the MSCI US Broad Market Index through June 2, 2013, and the CRSP US Total Market Index thereafter. International stock benchmark returns are adjusted for withholding taxes.
Target 2020 Composite Index: Derived by applying the fund’s target asset allocation to the results of the following benchmarks: for international stocks of developed markets, the MSCI EAFE Index through December 15, 2010, the MSCI ACWI ex USA IMI Index through June 2, 2013, and the FTSE Global All Cap ex US Index thereafter; for emerging-market stocks, the Select Emerging Markets Index through August 23, 2006, the MSCI Emerging Markets Index through December 15, 2010, the MSCI ACWI ex USA IMI Index through June 2, 2013, and the FTSE Global All Cap ex US Index thereafter; for U.S. bonds, the Bloomberg Barclays U.S. Aggregate Bond Index through December 31, 2009, and the Bloomberg Barclays U.S. Aggregate Float Adjusted Index thereafter; for international bonds, the Bloomberg Barclays Global Aggregate ex-USD Float Adjusted RIC Capped Index beginning June 3, 2013; and for U.S. stocks, the MSCI US Broad Market Index through June 2, 2013, and the CRSP US Total Market Index thereafter. International stock benchmark returns are adjusted for withholding taxes.
Target 2025 Composite Index: Derived by applying the fund’s target asset allocation to the results of the following benchmarks: for international stocks of developed markets, the MSCI EAFE Index through December 15, 2010, the MSCI ACWI ex USA IMI Index through June 2, 2013, and the FTSE Global All Cap ex US Index thereafter; for emerging-market stocks, the Select Emerging Markets Index through August 23, 2006, the MSCI Emerging Markets Index through December 15, 2010, the MSCI ACWI ex USA IMI Index through June 2, 2013, and the FTSE Global All Cap ex US Index thereafter; for U.S. bonds, the Bloomberg Barclays U.S. Aggregate Bond Index through December 31, 2009, and the Bloomberg Barclays U.S. Aggregate Float Adjusted Index thereafter; for international bonds, the Bloomberg Barclays Global Aggregate ex-USD Float Adjusted RIC Capped Index beginning June 3, 2013; and for U.S. stocks, the Dow Jones U.S. Total Stock Market Index (formerly known as the Dow Jones Wilshire 5000 Index) through April 22, 2005, the MSCI US Broad Market Index through June 2, 2013, and the CRSP US Total Market Index thereafter. International stock benchmark returns are adjusted for withholding taxes.
77
Target 2030 Composite Index: Derived by applying the fund’s target asset allocation to the results of the following benchmarks: for international stocks of developed markets, the MSCI EAFE Index through December 15, 2010, the MSCI ACWI ex USA IMI Index through June 2, 2013, and the FTSE Global All Cap ex US Index thereafter; for emerging-market stocks, the Select Emerging Markets Index through August 23, 2006, the MSCI Emerging Markets Index through December 15, 2010, the MSCI ACWI ex USA IMI Index through June 2, 2013, and the FTSE Global All Cap ex US Index thereafter; for U.S. bonds, the Bloomberg Barclays U.S. Aggregate Bond Index through December 31, 2009, and the Bloomberg Barclays U.S. Aggregate Float Adjusted Index thereafter; for international bonds, the Bloomberg Barclays Global Aggregate ex-USD Float Adjusted RIC Capped Index beginning June 3, 2013; and for U.S. stocks, the MSCI US Broad Market Index through June 2, 2013, and the CRSP US Total Market Index thereafter. International stock benchmark returns are adjusted for withholding taxes.
Target Income Composite Index: Derived by applying the fund’s target asset allocation to the results of the following benchmarks: for international stocks of developed markets, the MSCI EAFE Index through December 15, 2010, the MSCI ACWI ex USA IMI Index through June 2, 2013, and the FTSE Global All Cap ex US Index thereafter; for emerging-market stocks, the Select Emerging Markets Index through August 23, 2006, the MSCI Emerging Markets Index through December 15, 2010, the MSCI ACWI ex USA IMI Index through June 2, 2013, and the FTSE Global All Cap ex US Index thereafter; for U.S. bonds, the Bloomberg Barclays U.S. Aggregate Bond Index through December 31, 2009, and the Bloomberg Barclays U.S. Aggregate Float Adjusted Index thereafter, as well as the Bloomberg Barclays U.S. Treasury Inflation Protected Securities Index through June 2, 2013, and the Bloomberg Barclays U.S. Treasury Inflation-Protected Securities (TIPS) 0-5 Year Index thereafter; for short-term reserves, the Citigroup Three-Month Treasury Bill Index through June 2, 2013; for international bonds, the Bloomberg Barclays Global Aggregate ex-USD Float Adjusted RIC Capped Index beginning June 3, 2013; and for U.S. stocks, the Dow Jones U.S. Total Stock Market Index (formerly known as the Dow Jones Wilshire 5000 Index) through April 22, 2005, the MSCI US Broad Market Index through June 2, 2013, and the CRSP US Total Market Index thereafter. International stock benchmark returns are adjusted for withholding taxes.
78
This page intentionally left blank.
The People Who Govern Your Fund
The trustees of your mutual fund are there to see that the fund is operated and managed in your best interests since, as a shareholder, you are a part owner of the fund. Your fund’s trustees also serve on the board of directors of The Vanguard Group, Inc., which is owned by the Vanguard funds and provides services to them on an at-cost basis.
A majority of Vanguard’s board members are independent, meaning that they have no affiliation with Vanguard or the funds they oversee, apart from the sizable personal investments they have made as private individuals. The independent board members have distinguished backgrounds in business, academia, and public service. Each of the trustees and executive officers oversees 198 Vanguard funds.
The following table provides information for each trustee and executive officer of the fund. The mailing address of the trustees and officers is P.O. Box 876, Valley Forge, PA 19482. More information about the trustees is in the Statement of Additional Information, which can be obtained, without charge, by contacting Vanguard at 800-662-7447, or online at vanguard.com.
InterestedTrustee1
F. William McNabb III
Born 1957. Trustee Since July 2009. Chairman of the Board. Principal Occupation(s) During the Past Five Years and Other Experience: Chairman of the Board of The Vanguard Group, Inc., and of each of the investment companies served by The Vanguard Group, since January 2010; Director of The Vanguard Group since 2008; Chief Executive Officer and President of The Vanguard Group, and of each of the investment companies served by The Vanguard Group, since 2008; Director of Vanguard Marketing Corporation; Managing Director of The Vanguard Group (1995–2008).
IndependentTrustees
Emerson U. Fullwood
Born 1948. Trustee Since January 2008. Principal Occupation(s) During the Past Five Years and Other Experience: Executive Chief Staff and Marketing Officer for North America and Corporate Vice President (retired 2008) of Xerox Corporation (document management products and services); Executive in Residence and 2009–2010 Distinguished Minett Professor at the Rochester Institute of Technology; Lead Director of SPX FLOW, Inc. (multi-industry manufacturing); Director of the United Way of Rochester, the University of Rochester Medical Center, Monroe Community College Foundation, North Carolina A&T University, and Roberts Wesleyan College.
Rajiv L. Gupta
Born 1945. Trustee Since December 2001.2 Principal Occupation(s) During the Past Five Years and Other Experience: Chairman and Chief Executive Officer (retired 2009) and President (2006–2008) of Rohm and Haas Co. (chemicals); Director of Tyco International plc (diversified manufacturing and services), HP Inc. (printer and personal computer manufacturing), and Delphi Automotive plc (automotive components); Senior Advisor at New Mountain Capital.
Amy Gutmann
Born 1949. Trustee Since June 2006. Principal Occupation(s) During the Past Five Years and Other Experience: President of the University of Pennsylvania; Christopher H. Browne Distinguished Professor of Political Science, School of Arts and Sciences, and Professor of Communication, Annenberg School for Communication, with secondary faculty appointments in the Department of Philosophy, School of Arts and Sciences, and at the Graduate School of Education, University of Pennsylvania; Trustee of the National Constitution Center; Chair of the Presidential Commission for the Study of Bioethical Issues.
JoAnn Heffernan Heisen
Born 1950. Trustee Since July 1998. Principal Occupation(s) During the Past Five Years and Other Experience: Corporate Vice President and Chief Global Diversity Officer (retired 2008) and Member of the Executive Committee (1997–2008) of Johnson & Johnson (pharmaceuticals/medical devices/consumer products); Director of Skytop Lodge Corporation (hotels) and the Robert Wood Johnson Foundation; Member of the Advisory Board of the Institute for Women’s Leadership at Rutgers University.
F. Joseph Loughrey
Born 1949. Trustee Since October 2009. Principal Occupation(s) During the Past Five Years and Other Experience: President and Chief Operating Officer (retired 2009) of Cummins Inc. (industrial machinery); Chairman of the Board of Hillenbrand, Inc. (specialized consumer services), and of Oxfam America; Director of SKF AB (industrial machinery), Hyster-Yale Materials Handling, Inc. (forklift trucks), the Lumina Foundation for Education, and the V Foundation for Cancer Research; Member of the Advisory Council for the College of Arts and Letters and of the Advisory Board to the Kellogg Institute for International Studies, both at the University of Notre Dame.
Mark Loughridge
Born 1953. Trustee Since March 2012. Principal Occupation(s) During the Past Five Years and Other Experience: Senior Vice President and Chief Financial Officer (retired 2013) at IBM (information technology services); Fiduciary Member of IBM’s Retirement Plan Committee (2004–2013); Director of the Dow Chemical Company; Member of the Council on Chicago Booth.
Scott C. Malpass
Born 1962. Trustee Since March 2012. Principal Occupation(s) During the Past Five Years and Other Experience: Chief Investment Officer and Vice President at the University of Notre Dame; Assistant Professor of Finance at the Mendoza College of Business at Notre Dame; Member of the Notre Dame 403(b) Investment Committee, the Board of Advisors for Spruceview Capital Partners, and the Investment Advisory Committee of Major League Baseball; Board Member of TIFF Advisory Services, Inc., and Catholic Investment Services, Inc. (investment advisors).
André F. Perold
Born 1952. Trustee Since December 2004. Principal Occupation(s) During the Past Five Years and Other Experience: George Gund Professor of Finance and Banking, Emeritus at the Harvard Business School (retired 2011); Chief Investment Officer and Managing Partner of HighVista Strategies LLC (private investment firm); Director of Rand Merchant Bank; Overseer of the Museum of Fine Arts Boston.
Peter F. Volanakis
Born 1955. Trustee Since July 2009. Principal Occupation(s) During the Past Five Years and Other Experience: President and Chief Operating Officer (retired 2010) of Corning Incorporated (communications equipment); Chairman of the Board of Trustees of Colby-Sawyer College; Member of the Advisory Board of the Norris Cotton Cancer Center.
Executive Officers
Glenn Booraem
Born 1967. Treasurer Since May 2015. Principal Occupation(s) During the Past Five Years and Other Experience: Principal of The Vanguard Group, Inc.; Treasurer of each of the investment companies served by The Vanguard Group; Controller of each of the investment companies served by The Vanguard Group (2010–2015); Assistant Controller of each of the investment companies served by The Vanguard Group (2001–2010).
Thomas J. Higgins
Born 1957. Chief Financial Officer Since September 2008. Principal Occupation(s) During the Past Five Years and Other Experience: Principal of The Vanguard Group, Inc.; Chief Financial Officer of each of the investment companies served by The Vanguard Group; Treasurer of each of the investment companies served by The Vanguard Group (1998–2008).
Peter Mahoney
Born 1974. Controller Since May 2015. Principal Occupation(s) During the Past Five Years and Other Experience: Head of Global Fund Accounting at The Vanguard Group, Inc.; Controller of each of the investment companies served by The Vanguard Group; Head of International Fund Services at The Vanguard Group (2008–2014).
Anne E. Robinson
Born 1970. Secretary Since September 2016. Principal Occupation(s) During the Past Five Years and Other Experience: Managing Director of The Vanguard Group, Inc.; General Counsel of The Vanguard Group; Secretary of The Vanguard Group and of each of the investment companies served by The Vanguard Group; Director and Senior Vice President of Vanguard Marketing Corporation; Managing Director and General Counsel of Global Cards and Consumer Services at Citigroup (2014–2016); Counsel at American Express (2003–2014).
Vanguard Senior Management Team
| |
Mortimer J. Buckley Kathleen C. Gubanich Martha G. King John T. Marcante Chris D. McIsaac | James M. Norris Thomas M. Rampulla Glenn W. Reed Karin A. Risi Michael Rollings |
Chairman Emeritus and Senior Advisor John J. Brennan
Chairman, 1996–2009
Chief Executive Officer and President, 1996–2008
Founder
John C. Bogle
Chairman and Chief Executive Officer, 1974–1996
1 Mr. McNabb is considered an “interested person,” as defined in the Investment Company Act of 1940, because he is an officer of the Vanguard funds.
2 December 2002 for Vanguard Equity Income Fund, the Vanguard Municipal Bond Funds, and the Vanguard State Tax-Exempt Funds.
 |
| P.O. Box 2600 |
| Valley Forge, PA 19482-2600 |
Connect with Vanguard® > vanguard.com
| |
| Fund Information > 800-662-7447 | |
| Direct Investor Account Services > 800-662-2739 | |
| Institutional Investor Services > 800-523-1036 | |
| Text Telephone for People | |
| Who Are Deaf or Hard of Hearing> 800-749-7273 | |
| |
| This material may be used in conjunction | |
| with the offering of shares of any Vanguard | |
| fund only if preceded or accompanied by | |
| the fund’s current prospectus. | |
| |
| All comparative mutual fund data are from Lipper, a | |
| Thomson Reuters Company, or Morningstar, Inc., unless | |
| otherwise noted. | |
| |
| You can obtain a free copy of Vanguard’s proxy voting | |
| guidelines by visiting vanguard.com/proxyreporting or by | |
| calling Vanguard at 800-662-2739. The guidelines are | |
| also available from the SEC’s website, sec.gov. In | |
| addition, you may obtain a free report on how your fund | |
| voted the proxies for securities it owned during the 12 | |
| months ended June 30. To get the report, visit either | |
| vanguard.com/proxyreporting or sec.gov. | |
| |
| You can review and copy information about your fund at | |
| the SEC’s Public Reference Room in Washington, D.C. To | |
| find out more about this public service, call the SEC at | |
| 202-551-8090. Information about your fund is also | |
| available on the SEC’s website, and you can receive | |
| copies of this information, for a fee, by sending a | |
| request in either of two ways: via email addressed to | |
| publicinfo@sec.gov or via regular mail addressed to the | |
| Public Reference Section, Securities and Exchange | |
| Commission, Washington, DC 20549-1520. | |
| |
| | © 2016 The Vanguard Group, Inc. |
| | All rights reserved. |
| | Vanguard Marketing Corporation, Distributor. |
| |
| | Q6730 112016 |
Annual Report | September 30, 2016
Vanguard Institutional Target Retirement Funds
Vanguard Institutional Target Retirement 2035 Fund
Vanguard Institutional Target Retirement 2040 Fund
Vanguard Institutional Target Retirement 2045 Fund
Vanguard Institutional Target Retirement 2050 Fund
Vanguard Institutional Target Retirement 2055 Fund
Vanguard Institutional Target Retirement 2060 Fund
A new format, unwavering commitment
As you begin reading this report, you’ll notice that we’ve made some improvements to the opening sections—based on feedback from you, our clients.
Page 1 starts with a new ”Your Fund’s Performance at a Glance,” a concise, handy summary of how your fund performed during the period.
In the renamed ”Chairman’s Perspective,” Bill McNabb will focus on enduring principles and investment insights.
We’ve modified some tables, and eliminated some redundancy, but we haven’t removed any information.
At Vanguard, we’re always looking for better ways to communicate and to help you make sound investment decisions. Thank you for entrusting your assets to us.
| |
| Contents | |
| Your Fund’s Performance at a Glance. | 1 |
| Chairman’s Perspective. | 3 |
| Institutional Target Retirement 2035 Fund. | 6 |
| Institutional Target Retirement 2040 Fund. | 17 |
| Institutional Target Retirement 2045 Fund. | 28 |
| Institutional Target Retirement 2050 Fund. | 39 |
| Institutional Target Retirement 2055 Fund. | 50 |
| Institutional Target Retirement 2060 Fund. | 61 |
| About Your Fund’s Expenses. | 74 |
| Glossary. | 76 |
Please note: The opinions expressed in this report are just that—informed opinions. They should not be considered promises or advice. Also, please keep in mind that the information and opinions cover the period through the date on the front of this report. Of course, the risks of investing in your fund are spelled out in the prospectus.
See the Glossary for definitions of investment terms used in this report.
About the cover: No matter what language you speak, Vanguard has one consistent message and set of principles. Our primary focus is on you, our clients. We conduct our business with integrity as a faithful steward of your assets. This message is shown translated into seven languages, reflecting our expanding global presence.
Your Fund’s Performance at a Glance
• For the 12 months ended September 30, 2016, both domestic and international stock markets made strong gains, with the former returning about 15% and the latter about 9%.
• Global fixed income markets also turned in solid results: U.S. bonds returned about 5%, and international bonds returned about 8% for U.S.-based investors.
• Against this backdrop, the six Vanguard Institutional Target Retirement Funds covered in this report produced returns ranging from 11.68% for the Institutional Target Retirement 2035 Fund to 12.24% for the Institutional Target Retirement 2045 Fund. (Funds with retirement dates of 2010 through 2030, as well as the Institutional Target Retirement Income Fund, are covered in a separate report.)
• Each fund posted returns that were in line with those of its composite benchmark index after expenses, and each one surpassed the average return of its peer group.
| |
| Total Returns: Fiscal Year Ended September 30, 2016 | |
| | Total |
| | Returns |
| Vanguard Institutional Target Retirement 2035 Fund | 11.68% |
| Target 2035 Composite Index | 12.02 |
| Mixed-Asset Target 2035 Funds Average | 10.74 |
| Mixed-Asset Target 2035 Funds Average: Derived from data provided by Lipper, a Thomson Reuters Company. | |
| |
| Vanguard Institutional Target Retirement 2040 Fund | 12.12% |
| Target 2040 Composite Index | 12.51 |
| Mixed-Asset Target 2040 Funds Average | 11.06 |
| Mixed-Asset Target 2040 Funds Average: Derived from data provided by Lipper, a Thomson Reuters Company. | |
| |
| Vanguard Institutional Target Retirement 2045 Fund | 12.24% |
| Target 2045 Composite Index | 12.59 |
| Mixed-Asset Target 2045 Funds Average | 11.23 |
| Mixed-Asset Target 2045 Funds Average: Derived from data provided by Lipper, a Thomson Reuters Company. | |
| |
| Vanguard Institutional Target Retirement 2050 Fund | 12.23% |
| Target 2050 Composite Index | 12.59 |
| Mixed-Asset Target 2050 Funds Average | 11.48 |
| Mixed-Asset Target 2050 Funds Average: Derived from data provided by Lipper, a Thomson Reuters Company. | |
1
| |
| | Total |
| | Returns |
| Vanguard Institutional Target Retirement 2055 Fund | 12.16% |
| Target 2055 Composite Index | 12.59 |
| Mixed-Asset Target 2055+ Funds Average | 11.26 |
| Mixed-Asset Target 2055+ Funds Average: Derived from data provided by Lipper, a Thomson Reuters Company. | |
| |
| Vanguard Institutional Target Retirement 2060 Fund | 12.21% |
| Target 2060 Composite Index | 12.59 |
| Mixed-Asset Target 2055+ Funds Average | 11.26 |
| Mixed-Asset Target 2055+ Funds Average: Derived from data provided by Lipper, a Thomson Reuters Company. | |
| For a benchmark description, see the Glossary. | |
Investments in Target Retirement Funds are subject to the risks of their underlying funds. The year in the fund name refers to the approximate year (the target date) when an investor in the fund would retire and leave the work force. The fund will gradually shift its emphasis from more aggressive investments to more conservative ones based on its target date. An investment in a Target Retirement Fund is not guaranteed at any time, including on or after the target date.
2
Chairman’s Perspective
Bill McNabb
Chairman and Chief Executive Officer
Dear Shareholder,
If you think you’ve had reason to feel uneasy about the investment environment lately, you’re not imagining things. In just the past few months, we’ve seen economic uncertainty, intense political polarization, and super-low bond yields. Yet at the same time, the stock market kept pushing higher.
In this confusing and sometimes contradictory climate, you may be asking yourself a question that I hear often: How do I make sense of all this, keep investing, and still get a good night’s sleep?
As with any problem, there are multiple ways to go at it. But there’s one approach in particular that is simple, straightforward, and nearly foolproof: Save more money. Not only can saving more give you a greater sense of control over your investment plan, it can help compensate for long-term returns that, in our estimation, could fall short of historical averages.
I love the way one of our investment pros put it. Fran Kinniry this summer told The Wall Street Journal, “Investing is always a partnership between you and the markets.” He explained that the markets carried more than their fair share of the weight for a couple of decades, through the 1990s, providing outsized returns that made the investor’s half of the partnership relatively light work. “But now you are going to have to be the majority partner.”
Sobering? Sure. Hopeless? Definitely not.
3
Over the 12 months since last September, U.S. stocks returned 15%, though the rise has not been a one-way ticket straight up. International markets have also posted strong returns, but lower than those of the broad U.S. market. The decision by United Kingdom voters in June to exit the European Union came as a surprise but caused market heartburn for only a few days.
In fixed income, yields remained extremely low—about 1.60% on the 10-year U.S. Treasury note at the end of September, after dipping below 1.40% over the summer. And bond yields in some international markets were negative.
Even this relatively small window of time illustrates a truism of the financial markets: There will always be segments that perform well and others that don’t. Saving more saves you from trying to control the uncontrollable—how economies and the markets perform. And it keeps you in control of one of the most vital parts of your investment program.
Although the “save more” logic is easy to grasp, it’s not always easy to follow. Bills, illness, the loss of a job—these can affect any of us.
But whatever our circumstances, figuring out how to save more is worth the effort. It requires that we make difficult decisions to forgo some consumption today to increase the likelihood of consuming (or consuming more) in the future. This is the very heart of investing. Sacrifices are never fun, so consider carrying them out systematically and in doses that you
| | | |
| Market Barometer | | | |
| | | Average Annual Total Returns |
| | | Periods Ended September 30, 2016 |
| | One | Three | Five |
| | Year | Years | Years |
| Stocks | | | |
| Russell 1000 Index (Large-caps) | 14.93% | 10.78% | 16.41% |
| Russell 2000 Index (Small-caps) | 15.47 | 6.71 | 15.82 |
| Russell 3000 Index (Broad U.S. market) | 14.96 | 10.44 | 16.36 |
| FTSE All-World ex US Index (International) | 9.62 | 0.71 | 6.50 |
| |
| Bonds | | | |
| Bloomberg Barclays U.S. Aggregate Bond Index | | | |
| (Broad taxable market) | 5.19% | 4.03% | 3.08% |
| Bloomberg Barclays Municipal Bond Index | | | |
| (Broad tax-exempt market) | 5.58 | 5.54 | 4.48 |
| Citigroup Three-Month U.S. Treasury Bill Index | 0.20 | 0.06 | 0.06 |
| |
| CPI | | | |
| Consumer Price Index | 1.46% | 1.03% | 1.25% |
4
can be comfortable with—for instance, gradually getting up to the max in your IRA, or adding a percentage point or so to the amount you stash in your employer’s retirement plan. As a point of reference, we generally suggest that investors strive for a retirement savings rate of 12%–15%, including any employer contributions.
If you need more convincing about the wisdom of the “save more” course of action, it might be helpful to examine your alternatives. This list is by no means exhaustive, but it hits on a few of the big ones, and none are without risk.
• Reach for yield. With yields so low on many types of bonds, it’s tempting to find the corners of the fixed income market where payouts are juicier. But with the juice comes considerable risk. You need to be aware that you’d be taking on more risk—and how much more.
• Go all-in on a hot-performing asset class or fund. By now, you know better than that, right?
• Sit tight. This approach isn’t a terrible idea; it’s better than panicking and deciding to just “do something,” particularly if that means changing your approach in response to the market’s movements.
Here’s the inescapably challenging part of your partnership with the markets: In the short run, your “partner” is fickle, emotional, and wildly unpredictable. But in the long run, your partner is mostly rational and extremely helpful.
The best way to minimize your vulnerability to the market’s mood swings, and to maximize the benefit of your partner’s longer-term strengths, is to expect less and save more. Maybe the markets will deliver better-than-expected returns. Maybe they’ll be consistent with our more modest expectations. In either case, a higher savings rate can help put you in a better position to reach your goals.
As always, thank you for investing with Vanguard.
Sincerely,
F. William McNabb III
Chairman and Chief Executive Officer
October 18, 2016
5
Institutional Target Retirement 2035 Fund
Fund Profile
As of September 30, 2016
| |
| Total Fund Characteristics | |
| |
| Ticker Symbol | VITFX |
| 30-Day SEC Yield | 2.15% |
| Acquired Fund Fees and Expenses1 | 0.10% |
| |
| Allocation to Underlying Vanguard Funds | |
| Vanguard Total Stock Market Index Fund | |
| Institutional Shares | 48.3% |
| Vanguard Total International Stock Index | |
| Fund Investor Shares | 31.9 |
| Vanguard Total Bond Market II Index Fund | |
| Investor Shares | 13.9 |
| Vanguard Total International Bond Index | |
| Fund Admiral Shares | 5.9 |
Fund Asset Allocation
1 This figure—drawn from the prospectus dated January 28, 2016—represents an estimate of the weighted average of the expense ratios and any transaction fees charged by the underlying mutual funds (the ”acquired” funds) in which the Institutional Target Retirement 2035 Fund invests. The fund does not charge any expenses or fees of its own. For the fiscal year ended September 30, 2016, the annualized acquired fund fees and expenses were 0.10%.
6
Institutional Target Retirement 2035 Fund
Performance Summary
All of the returns in this report represent past performance, which is not a guarantee of future results that may be achieved by the fund. (Current performance may be lower or higher than the performance data cited. For performance data current to the most recent month-end, visit our website at vanguard.com/performance.) Note, too, that both investment returns and principal value can fluctuate widely, so an investor’s shares, when sold, could be worth more or less than their original cost. The returns shown do not reflect taxes that a shareholder would pay on fund distributions or on the sale of fund shares.
Cumulative Performance: June 26, 2015, Through September 30, 2016
Initial Investment of $100,000,000
| | | | |
| | | Average Annual Total Returns | |
| | | Periods Ended September 30, 2016 | |
| | | | Since | Final Value |
| | | One | Inception | of a $100,000,000 |
| | | Year | (6/26/2015) | Investment |
| | Institutional Target Retirement 2035 | | | |
| | Fund | 11.68% | 1.60% | $102,020,336 |
| •••••••• | Target 2035 Composite Index | 12.02 | 1.86 | 102,355,937 |
| – – – – | Mixed-Asset Target 2035 Funds | | | |
| |
| | MSCI Average US Broad Market Index | 15.02 10.74 | 3.73 0.76 | 104,740,260 100,958,459 |
For a benchmark description, see the Glossary.
Mixed-Asset Target 2035 Funds Average: Derived from data provided by Lipper, a Thomson Reuters Company.
"Since Inception" performance is calculated from the fund's inception date for both the fund and its comparative standards.
See Financial Highlights for dividend and capital gains information.
7
Institutional Target Retirement 2035 Fund
Fiscal-Year Total Returns (%): June 26, 2015, Through September 30, 2016
8
Institutional Target Retirement 2035 Fund
Financial Statements
Statement of Net Assets
As of September 30, 2016
The fund reports a complete list of its holdings in regulatory filings four times in each fiscal year, at the quarter-ends. For the second and fourth fiscal quarters, the lists appear in the fund’s semiannual and annual reports to shareholders. For the first and third fiscal quarters, the fund files the lists with the Securities and Exchange Commission on Form N-Q. Shareholders can look up the fund’s Forms N-Q on the SEC’s website at sec.gov. Forms N-Q may also be reviewed and copied at the SEC’s Public Reference Room (see the back cover of this report for further information).
| | |
| | | Market |
| | | Value• |
| | Shares | ($000) |
| Investment Companies (99.7%) | | |
| U.S. Stock Fund (48.1%) | | |
| Vanguard Total Stock Market Index Fund Institutional Shares | 94,826,447 | 5,140,542 |
| International Stock Fund (31.8%) | | |
| Vanguard Total International Stock Index Fund Investor Shares | 225,018,653 | 3,406,782 |
| U.S. Bond Fund (13.9%) | | |
| 1 Vanguard Total Bond Market II Index Fund Investor Shares | 134,418,677 | 1,483,982 |
| International Bond Fund (5.9%) | | |
| Vanguard Total International Bond Index Fund Admiral Shares | 28,406,884 | 634,610 |
| Total Investment Companies (Cost $10,217,188) | | 10,665,916 |
| Temporary Cash Investment (0.0%) | | |
| Money Market Fund (0.0%) | | |
| 1 Vanguard Market Liquidity Fund, 0.640% (Cost $1,869) | 18,691 | 1,869 |
| Total Investments (99.7%) (Cost $10,219,057) | | 10,667,785 |
| Other Assets and Liabilities (0.3%) | | |
| Other Assets | | 128,860 |
| Liabilities | | (95,063) |
| | | 33,797 |
| Net Assets (100%) | | |
| Applicable to 528,905,205 outstanding $.001 par value shares of | | |
| beneficial interest (unlimited authorization) | | 10,701,582 |
| Net Asset Value Per Share | | $20.23 |
9
| |
| Institutional Target Retirement 2035 Fund | |
| |
| |
| |
| |
| | Amount |
| | ($000) |
| Statement of Assets and Liabilities | |
| Assets | |
| Investments in Securities, at Value—Affiliated Vanguard Funds | 10,667,785 |
| Receivables for Investment Securities Sold | 20,000 |
| Receivables for Accrued Income | 3,251 |
| Receivables for Capital Shares Issued | 105,609 |
| Total Assets | 10,796,645 |
| Liabilities | |
| Payables for Investment Securities Purchased | 93,464 |
| Payables for Capital Shares Redeemed | 1,598 |
| Other Liabilities | 1 |
| Total Liabilities | 95,063 |
| Net Assets | 10,701,582 |
| |
| |
| At September 30, 2016, net assets consisted of: | |
| | Amount |
| | ($000) |
| Paid-in Capital | 10,106,926 |
| Undistributed Net Investment Income | 144,710 |
| Accumulated Net Realized Gains | 1,218 |
| Unrealized Appreciation (Depreciation) | 448,728 |
| Net Assets | 10,701,582 |
• See Note A in Notes to Financial Statements.
1 Affiliated money market fund available only to Vanguard funds and certain trusts and accounts managed by Vanguard. Rate shown is the
7-day yield.
See accompanying Notes, which are an integral part of the Financial Statements.
10
| |
| Institutional Target Retirement 2035 Fund | |
| |
| |
| Statement of Operations | |
| |
| | Year Ended |
| | September 30, 2016 |
| | ($000) |
| Investment Income | |
| Income | |
| Income Distributions Received from Affiliated Funds | 184,298 |
| Net Investment Income—Note B | 184,298 |
| Realized Net Gain (Loss) | |
| Capital Gain Distributions Received from Affiliated Funds | 1,229 |
| Affiliated Investment Securities Sold | (12) |
| Realized Net Gain (Loss) | 1,217 |
| Change in Unrealized Appreciation (Depreciation) of Investment Securities | 688,907 |
| Net Increase (Decrease) in Net Assets Resulting from Operations | 874,422 |
See accompanying Notes, which are an integral part of the Financial Statements.
11
| | |
| Institutional Target Retirement 2035 Fund | | |
| |
| |
| Statement of Changes in Net Assets | | |
| |
| | | June 26, |
| | Year Ended | 20151 to |
| | September 30, | Sept. 30, |
| | 2016 | 2015 |
| | ($000) | ($000) |
| Increase (Decrease) in Net Assets | | |
| Operations | | |
| Net Investment Income | 184,298 | 16,206 |
| Realized Net Gain (Loss) | 1,217 | 11 |
| Change in Unrealized Appreciation (Depreciation) | 688,907 | (240,179) |
| Net Increase (Decrease) in Net Assets Resulting from Operations | 874,422 | (223,962) |
| Distributions | | |
| Net Investment Income | (54,138) | — |
| Realized Capital Gain | — | — |
| Total Distributions | (54,138) | — |
| Capital Share Transactions | | |
| Issued | 6,102,339 | 4,281,978 |
| Issued in Lieu of Cash Distributions | 53,955 | — |
| Redeemed | (311,926) | (21,086) |
| Net Increase (Decrease) from Capital Share Transactions | 5,844,368 | 4,260,892 |
| Total Increase (Decrease) | 6,664,652 | 4,036,930 |
| Net Assets | | |
| Beginning of Period | 4,036,930 | — |
| End of Period2 | 10,701,582 | 4,036,930 |
| 1 | Inception. |
| 2 | Net Assets—End of Period includes undistributed (overdistributed) net investment income of $144,710,000 and $16,206,000. |
See accompanying Notes, which are an integral part of the Financial Statements.
12
| | |
| Institutional Target Retirement 2035 Fund | | |
| |
| |
| Financial Highlights | | |
| |
| | Year | June 26, |
| | Ended | 20151 to |
| | Sept. 30, | Sept. 30, |
| For a Share Outstanding Throughout Each Period | 2016 | 2015 |
| Net Asset Value, Beginning of Period | $18.27 | $20.00 |
| Investment Operations | | |
| Net Investment Income | . 457 2 | .1422 |
| Capital Gain Distributions Received | .003 | — |
| Net Realized and Unrealized Gain (Loss) on Investments | 1.664 | (1.872) |
| Total from Investment Operations | 2.124 | (1.730) |
| Distributions | | |
| Dividends from Net Investment Income | (.164) | — |
| Distributions from Realized Capital Gains | — | — |
| Total Distributions | (.164) | — |
| Net Asset Value, End of Period | $20.23 | $18.27 |
| |
| Total Return | 11.68% | -8.65% |
| |
| Ratios/Supplemental Data | | |
| Net Assets, End of Period (Millions) | $10,702 | $4,037 |
| Ratio of Total Expenses to Average Net Assets | — | — |
| Acquired Fund Fees and Expenses | 0.10% | 0.10%3 |
| Ratio of Net Investment Income to Average Net Assets | 2.37% | 2.62%3 |
| Portfolio Turnover Rate | 2% | 0% |
| 1 | Inception. |
| 2 | Calculated based on average shares outstanding. |
| 3 | Annualized. |
See accompanying Notes, which are an integral part of the Financial Statements.
13
Institutional Target Retirement 2035 Fund
Notes to Financial Statements
Vanguard Institutional Target Retirement 2035 Fund is registered under the Investment Company Act of 1940 as an open-end investment company, or mutual fund. The fund follows a balanced investment strategy by investing in selected Vanguard funds to achieve its targeted allocation of assets to U.S. and international stocks, and U.S. and international bonds. Financial statements and other information about each underlying fund are available on vanguard.com.
A. The following significant accounting policies conform to generally accepted accounting principles for U.S. investment companies. The fund consistently follows such policies in preparing its financial statements.
1. Security Valuation: Investments are valued at the net asset value of each underlying Vanguard fund determined as of the close of the New York Stock Exchange (generally 4 p.m., Eastern time) on the valuation date.
2. Federal Income Taxes: The fund intends to continue to qualify as a regulated investment company and distribute all of its taxable income. Management has analyzed the fund’s tax positions taken for all open federal income tax years (September 30, 2015–2016), and has concluded that no provision for federal income tax is required in the fund’s financial statements.
3. Distributions: Distributions to shareholders are recorded on the ex-dividend date.
4. Credit Facility: The fund and certain other funds managed by The Vanguard Group (“Vanguard”) participate in a $3.1 billion committed credit facility provided by a syndicate of lenders pursuant to a credit agreement that may be renewed annually; each fund is individually liable for its borrowings, if any, under the credit facility. Borrowings may be utilized for temporary and emergency purposes, and are subject to the fund’s regulatory and contractual borrowing restrictions. The participating funds are charged administrative fees and an annual commitment fee of 0.10% of the undrawn amount of the facility; these fees are allocated to the funds based on a method approved by the fund’s board of trustees and borne by the funds in which the fund invests (see Note B). Any borrowings under this facility bear interest at a rate based upon the higher of the one-month London Interbank Offered Rate, federal funds effective rate, or overnight bank funding rate plus an agreed-upon spread.
The fund had no borrowings outstanding at September 30, 2016, or at any time during the period then ended.
5. Other: Income and capital gain distributions received are recorded on the ex-dividend date. Security transactions are accounted for on the date securities are bought or sold. Costs used to determine realized gains (losses) on the sale of investment securities are those of the specific securities sold.
B. In accordance with the terms of a Funds’ Service Agreement (the “FSA”) between Vanguard and the fund, Vanguard furnishes to the fund investment advisory, corporate management, administrative, marketing, and distribution services at Vanguard’s cost of operations (as defined by the FSA). These costs of operations are allocated to the fund based on methods and guidelines approved by the board of trustees. The FSA provides that expenses otherwise allocable to Vanguard funds-of-funds may be reduced or eliminated to the extent of savings realized by the underlying Vanguard funds by virtue of being part of a fund-of-funds. Accordingly, all expenses for services provided by Vanguard to the fund and all other expenses incurred by the fund during the period ended September 30, 2016, were borne by the underlying Vanguard funds in which the fund invests. The fund’s trustees and officers are also trustees and officers, respectively, of the underlying Vanguard funds, as well as directors and employees, respectively, of Vanguard.
14
Institutional Target Retirement 2035 Fund
C. Various inputs may be used to determine the value of the fund’s investments. These inputs are summarized in three broad levels for financial statement purposes. The inputs or methodologies used to value securities are not necessarily an indication of the risk associated with investing in those securities.
Level 1—Quoted prices in active markets for identical securities.
Level 2—Other significant observable inputs (including quoted prices for similar securities, interest rates, prepayment speeds, credit risk, etc.).
Level 3—Significant unobservable inputs (including the fund’s own assumptions used to determine the fair value of investments).
At September 30, 2016, 100% of the market value of the fund’s investments was determined based on Level 1 inputs.
D. Distributions are determined on a tax basis and may differ from net investment income and realized capital gains for financial reporting purposes. Differences may be permanent or temporary. Permanent differences are reclassified among capital accounts in the financial statements to reflect their tax character. Temporary differences arise when certain items of income, expense, gain, or loss are recognized in different periods for financial statement and tax purposes. These differences will reverse at some time in the future. Differences in classification may also result from the treatment of short-term gains as ordinary income for tax purposes.
The fund used a tax accounting practice to treat a portion of the price of capital shares redeemed during the year as distributions from net investment income and realized capital gains. Accordingly, the fund has reclassified $1,656,000 from undistributed net investment income, and $10,000 from accumulated net realized gains, to paid-in capital.
For tax purposes, at September 30, 2016, the fund had $144,832,000 of ordinary income and $1,096,000 of long-term capital gains available for distribution.
At September 30, 2016, the cost of investment securities for tax purposes was $10,219,057,000. Net unrealized appreciation of investment securities for tax purposes was $448,728,000, consisting entirely of unrealized gains of $448,728,000 on securities that had risen in value since their purchase.
| | |
| E. Capital shares issued and redeemed were: | | |
| | Year Ended | June 26, 20151 to |
| | September 30, 2016 | September 30, 2015 |
| | Shares | Shares |
| | (000) | (000) |
| Issued | 321,366 | 222,104 |
| Issued in Lieu of Cash Distributions | 2,831 | — |
| Redeemed | (16,279) | (1,117) |
| Net Increase (Decrease) in Shares Outstanding | 307,918 | 220,987 |
| 1 Inception. | | |
At September 30, 2016, one shareholder was the record or beneficial owner of 32% of the fund’s net assets. If the shareholder were to redeem its investment in the fund, the redemption might result in an increase in the fund’s expense ratio, cause the fund to incur higher transaction costs, or lead to the realization of taxable capital gains.
15
Institutional Target Retirement 2035 Fund
| | | | | | |
| F. Transactions during the period in affiliated underlying Vanguard funds were as follows: | |
| | | | Current Period Transactions | |
| | Sept. 30, | | Proceeds | | | Sept. 30, |
| | 2015 | | from | | Capital Gain | 2016 |
| | Market | Purchases | Securities | Dividend Distributions | Market |
| | Value | at Cost | Sold | Income | Received | Value |
| | ($000) | ($000) | ($000) | ($000) | ($000) | ($000) |
| Vanguard Market Liquidity Fund | 2,065 | NA1 | NA1 | 19 | — | 1,869 |
| Vanguard Total Bond Market II | | | | | | |
| Index Fund | 512,800 | 1,050,977 | 111,070 | 24,187 | 1,229 | 1,483,982 |
| Vanguard Total International Bond | | | | | |
| Index Fund | 218,725 | 394,327 | 3,551 | 6,372 | — | 634,610 |
| Vanguard Total International Stock | | | | | |
| Index Fund | 1,318,190 | 1,898,970 | 1,680 | 76,029 | — | 3,406,782 |
| Vanguard Total Stock Market | | | | | | |
| Index Fund | 1,980,900 | 2,722,585 | 4,152 | 77,691 | — | 5,140,542 |
| Total | 4,032,680 | 6,066,859 | 120,453 | 184,298 | 1,229 | 10,667,785 |
| 1 Not applicable—purchases and sales are for temporary cash investment purposes. | | | |
G. Management has determined that no material events or transactions occurred subsequent to September 30, 2016, that would require recognition or disclosure in these financial statements.
16
Institutional Target Retirement 2040 Fund
Fund Profile
As of September 30, 2016
| |
| Total Fund Characteristics | |
| |
| Ticker Symbol | VIRSX |
| 30-Day SEC Yield | 2.18% |
| Acquired Fund Fees and Expenses1 | 0.10% |
| |
| Allocation to Underlying Vanguard Funds | |
| Vanguard Total Stock Market Index Fund | |
| Institutional Shares | 52.7% |
| Vanguard Total International Stock Index | |
| Fund Investor Shares | 35.0 |
| Vanguard Total Bond Market II Index Fund | |
| Investor Shares | 8.6 |
| Vanguard Total International Bond Index | |
| Fund Admiral Shares | 3.7 |
1 This figure—drawn from the prospectus dated January 28, 2016—represents an estimate of the weighted average of the expense ratios and any transaction fees charged by the underlying mutual funds (the ”acquired” funds) in which the Institutional Target Retirement 2040 Fund invests. The fund does not charge any expenses or fees of its own. For the fiscal year ended September 30, 2016, the annualized acquired fund fees and expenses were 0.10%.
17
Institutional Target Retirement 2040 Fund
Performance Summary
All of the returns in this report represent past performance, which is not a guarantee of future results that may be achieved by the fund. (Current performance may be lower or higher than the performance data cited. For performance data current to the most recent month-end, visit our website at vanguard.com/performance.) Note, too, that both investment returns and principal value can fluctuate widely, so an investor’s shares, when sold, could be worth more or less than their original cost. The returns shown do not reflect taxes that a shareholder would pay on fund distributions or on the sale of fund shares.
Cumulative Performance: June 26, 2015, Through September 30, 2016
Initial Investment of $100,000,000
| | | | |
| | | Average Annual Total Returns | |
| | | Periods Ended September 30, 2016 | |
| | | | Since | Final Value |
| | | One | Inception | of a $100,000,000 |
| | | Year | (6/26/2015) | Investment |
| | Institutional Target Retirement 2040 | | | |
| | Fund | 12.12% | 1.07% | $101,353,402 |
| •••••••• | Target 2040 Composite Index | 12.51 | 1.38 | 101,752,930 |
| – – – – | Mixed-Asset Target 2040 Funds | | | |
| |
| | MSCI Average US Broad Market Index | 15.02 11.06 | 3.73 0.55 | 104,740,260 100,690,197 |
For a benchmark description, see the Glossary.
Mixed-Asset Target 2040 Funds Average: Derived from data provided by Lipper, a Thomson Reuters Company.
"Since Inception" performance is calculated from the fund's inception date for both the fund and its comparative standards.
See Financial Highlights for dividend and capital gains information.
18
Institutional Target Retirement 2040 Fund
Fiscal-Year Total Returns (%): June 26, 2015, Through September 30, 2016
19
Institutional Target Retirement 2040 Fund
Financial Statements
Statement of Net Assets
As of September 30, 2016
The fund reports a complete list of its holdings in regulatory filings four times in each fiscal year, at the quarter-ends. For the second and fourth fiscal quarters, the lists appear in the fund’s semiannual and annual reports to shareholders. For the first and third fiscal quarters, the fund files the lists with the Securities and Exchange Commission on Form N-Q. Shareholders can look up the fund’s Forms N-Q on the SEC’s website at sec.gov. Forms N-Q may also be reviewed and copied at the SEC’s Public Reference Room (see the back cover of this report for further information).
| | |
| | | Market |
| | | Value• |
| | Shares | ($000) |
| Investment Companies (99.8%) | | |
| U.S. Stock Fund (52.5%) | | |
| Vanguard Total Stock Market Index Fund Institutional Shares | 84,560,439 | 4,584,021 |
| International Stock Fund (35.0%) | | |
| Vanguard Total International Stock Index Fund Investor Shares | 201,420,292 | 3,049,503 |
| U.S. Bond Fund (8.6%) | | |
| 1 Vanguard Total Bond Market II Index Fund Investor Shares | 68,146,188 | 752,334 |
| International Bond Fund (3.7%) | | |
| Vanguard Total International Bond Index Fund Admiral Shares | 14,418,899 | 322,118 |
| Total Investment Companies (Cost $8,321,353) | | 8,707,976 |
| Temporary Cash Investment (0.0%) | | |
| Money Market Fund (0.0%) | | |
| 1 Vanguard Market Liquidity Fund, 0.640% (Cost $2) | 16 | 2 |
| Total Investments (99.8%) (Cost $8,321,355) | | 8,707,978 |
| Other Assets and Liabilities (0.2%) | | |
| Other Assets | | 80,786 |
| Liabilities | | (64,587) |
| | | 16,199 |
| Net Assets (100%) | | |
| Applicable to 433,975,478 outstanding $.001 par value shares of | | |
| beneficial interest (unlimited authorization) | | 8,724,177 |
| Net Asset Value Per Share | | $20.10 |
20
| |
| Institutional Target Retirement 2040 Fund | |
| |
| |
| |
| |
| | Amount |
| | ($000) |
| Statement of Assets and Liabilities | |
| Assets | |
| Investments in Securities, at Value—Affiliated Vanguard Funds | 8,707,978 |
| Receivables for Accrued Income | 1,634 |
| Receivables for Capital Shares Issued | 79,152 |
| Total Assets | 8,788,764 |
| Liabilities | |
| Payables for Investment Securities Purchased | 62,159 |
| Payables for Capital Shares Redeemed | 947 |
| Other Liabilities | 1,481 |
| Total Liabilities | 64,587 |
| Net Assets | 8,724,177 |
| |
| |
| At September 30, 2016, net assets consisted of: | |
| | Amount |
| | ($000) |
| Paid-in Capital | 8,218,124 |
| Undistributed Net Investment Income | 118,844 |
| Accumulated Net Realized Gains | 586 |
| Unrealized Appreciation (Depreciation) | 386,623 |
| Net Assets | 8,724,177 |
• See Note A in Notes to Financial Statements.
1 Affiliated fund available only to Vanguard funds and certain trusts and accounts managed by Vanguard. Rate shown for Vanguard Market
Liquidity Fund is the 7-day yield.
See accompanying Notes, which are an integral part of the Financial Statements.
21
| |
| Institutional Target Retirement 2040 Fund | |
| |
| |
| Statement of Operations | |
| |
| | Year Ended |
| | September 30, 2016 |
| | ($000) |
| Investment Income | |
| Income | |
| Income Distributions Received from Affiliated Funds | 150,878 |
| Net Investment Income—Note B | 150,878 |
| Realized Net Gain (Loss) | |
| Capital Gain Distributions Received from Affiliated Funds | 584 |
| Realized Net Gain (Loss) | 584 |
| Change in Unrealized Appreciation (Depreciation) of Investment Securities | 573,943 |
| Net Increase (Decrease) in Net Assets Resulting from Operations | 725,405 |
See accompanying Notes, which are an integral part of the Financial Statements.
22
| | |
| Institutional Target Retirement 2040 Fund | | |
| |
| |
| Statement of Changes in Net Assets | | |
| |
| | | June 26, |
| | Year Ended | 20151 to |
| | September 30, | Sept. 30, |
| | 2016 | 2015 |
| | ($000) | ($000) |
| Increase (Decrease) in Net Assets | | |
| Operations | | |
| Net Investment Income | 150,878 | 12,225 |
| Realized Net Gain (Loss) | 584 | 7 |
| Change in Unrealized Appreciation (Depreciation) | 573,943 | (187,320) |
| Net Increase (Decrease) in Net Assets Resulting from Operations | 725,405 | (175,088) |
| Distributions | | |
| Net Investment Income | (42,868) | — |
| Realized Capital Gain | — | — |
| Total Distributions | (42,868) | — |
| Capital Share Transactions | | |
| Issued | 5,238,013 | 3,224,917 |
| Issued in Lieu of Cash Distributions | 42,639 | — |
| Redeemed | (270,523) | (18,318) |
| Net Increase (Decrease) from Capital Share Transactions | 5,010,129 | 3,206,599 |
| Total Increase (Decrease) | 5,692,666 | 3,031,511 |
| Net Assets | | |
| Beginning of Period | 3,031,511 | — |
| End of Period2 | 8,724,177 | 3,031,511 |
| 1 | Inception. |
| 2 | Net Assets—End of Period includes undistributed (overdistributed) net investment income of $118,844,000 and $12,225,000. |
See accompanying Notes, which are an integral part of the Financial Statements.
23
| | |
| Institutional Target Retirement 2040 Fund | | |
| |
| |
| Financial Highlights | | |
| |
| | Year | June 26, |
| | Ended | 20151 to |
| | Sept. 30, | Sept. 30, |
| For a Share Outstanding Throughout Each Period | 2016 | 2015 |
| Net Asset Value, Beginning of Period | $18.08 | $20.00 |
| Investment Operations | | |
| Net Investment Income | . 4612 | .1512 |
| Capital Gain Distributions Received | .002 2 | — |
| Net Realized and Unrealized Gain (Loss) on Investments | 1.718 | (2.071) |
| Total from Investment Operations | 2.181 | (1.920) |
| Distributions | | |
| Dividends from Net Investment Income | (.161) | — |
| Distributions from Realized Capital Gains | — | — |
| Total Distributions | (.161) | — |
| Net Asset Value, End of Period | $20.10 | $18.08 |
| |
| Total Return | 12.12% | -9.60% |
| |
| Ratios/Supplemental Data | | |
| Net Assets, End of Period (Millions) | $8,724 | $3,032 |
| Ratio of Total Expenses to Average Net Assets | — | — |
| Acquired Fund Fees and Expenses | 0.10% | 0.10%3 |
| Ratio of Net Investment Income to Average Net Assets | 2.62% | 2.81%3 |
| Portfolio Turnover Rate | 0% | 1% |
| 1 | Inception. |
| 2 | Calculated based on average shares outstanding. |
| 3 | Annualized. |
See accompanying Notes, which are an integral part of the Financial Statements.
24
Institutional Target Retirement 2040 Fund
Notes to Financial Statements
Vanguard Institutional Target Retirement 2040 Fund is registered under the Investment Company Act of 1940 as an open-end investment company, or mutual fund. The fund follows a balanced investment strategy by investing in selected Vanguard funds to achieve its targeted allocation of assets to U.S. and international stocks, and U.S. and international bonds. Financial statements and other information about each underlying fund are available on vanguard.com.
A. The following significant accounting policies conform to generally accepted accounting principles for U.S. investment companies. The fund consistently follows such policies in preparing its financial statements.
1. Security Valuation: Investments are valued at the net asset value of each underlying Vanguard fund determined as of the close of the New York Stock Exchange (generally 4 p.m., Eastern time) on the valuation date.
2. Federal Income Taxes: The fund intends to continue to qualify as a regulated investment company and distribute all of its taxable income. Management has analyzed the fund’s tax positions taken for all open federal income tax years (September 30, 2015–2016), and has concluded that no provision for federal income tax is required in the fund’s financial statements.
3. Distributions: Distributions to shareholders are recorded on the ex-dividend date.
4. Credit Facility: The fund and certain other funds managed by The Vanguard Group (“Vanguard”) participate in a $3.1 billion committed credit facility provided by a syndicate of lenders pursuant to a credit agreement that may be renewed annually; each fund is individually liable for its borrowings, if any, under the credit facility. Borrowings may be utilized for temporary and emergency purposes, and are subject to the fund’s regulatory and contractual borrowing restrictions. The participating funds are charged administrative fees and an annual commitment fee of 0.10% of the undrawn amount of the facility; these fees are allocated to the funds based on a method approved by the fund’s board of trustees and borne by the funds in which the fund invests (see Note B). Any borrowings under this facility bear interest at a rate based upon the higher of the one-month London Interbank Offered Rate, federal funds effective rate, or overnight bank funding rate plus an agreed-upon spread.
The fund had no borrowings outstanding at September 30, 2016, or at any time during the period then ended.
5. Other: Income and capital gain distributions received are recorded on the ex-dividend date. Security transactions are accounted for on the date securities are bought or sold. Costs used to determine realized gains (losses) on the sale of investment securities are those of the specific securities sold.
B. In accordance with the terms of a Funds’ Service Agreement (the “FSA”) between Vanguard and the fund, Vanguard furnishes to the fund investment advisory, corporate management, administrative, marketing, and distribution services at Vanguard’s cost of operations (as defined by the FSA). These costs of operations are allocated to the fund based on methods and guidelines approved by the board of trustees. The FSA provides that expenses otherwise allocable to Vanguard funds-of-funds may be reduced or eliminated to the extent of savings realized by the underlying Vanguard funds by virtue of being part of a fund-of-funds. Accordingly, all expenses for services provided by Vanguard to the fund and all other expenses incurred by the fund during the period ended September 30, 2016, were borne by the underlying Vanguard funds in which the fund invests. The fund’s trustees and officers are also trustees and officers, respectively, of the underlying Vanguard funds, as well as directors and employees, respectively, of Vanguard.
25
Institutional Target Retirement 2040 Fund
C. Various inputs may be used to determine the value of the fund’s investments. These inputs are summarized in three broad levels for financial statement purposes. The inputs or methodologies used to value securities are not necessarily an indication of the risk associated with investing in those securities.
Level 1—Quoted prices in active markets for identical securities.
Level 2—Other significant observable inputs (including quoted prices for similar securities, interest rates, prepayment speeds, credit risk, etc.).
Level 3—Significant unobservable inputs (including the fund’s own assumptions used to determine the fair value of investments).
At September 30, 2016, 100% of the market value of the fund’s investments was determined based on Level 1 inputs.
D. Distributions are determined on a tax basis and may differ from net investment income and realized capital gains for financial reporting purposes. Differences may be permanent or temporary. Permanent differences are reclassified among capital accounts in the financial statements to reflect their tax character. Temporary differences arise when certain items of income, expense, gain, or loss are recognized in different periods for financial statement and tax purposes. These differences will reverse at some time in the future. Differences in classification may also result from the treatment of short-term gains as ordinary income for tax purposes.
The fund used a tax accounting practice to treat a portion of the price of capital shares redeemed during the year as distributions from net investment income and realized capital gains. Accordingly, the fund has reclassified $1,391,000 from undistributed net investment income, and $5,000 from accumulated net realized gains, to paid-in capital.
For tax purposes, at September 30, 2016, the fund had $118,904,000 of ordinary income and $525,000 of long-term capital gains available for distribution.
At September 30, 2016, the cost of investment securities for tax purposes was $8,321,355,000. Net unrealized appreciation of investment securities for tax purposes was $386,623,000, consisting entirely of unrealized gains on securities that had risen in value since their purchase.
| | |
| E. Capital shares issued and redeemed were: | | |
| | Year Ended | June 26, 20151 to |
| | September 30, 2016 | September 30, 2015 |
| | Shares | Shares |
| | (000) | (000) |
| Issued | 278,300 | 168,671 |
| Issued in Lieu of Cash Distributions | 2,249 | — |
| Redeemed | (14,266) | (979) |
| Net Increase (Decrease) in Shares Outstanding | 266,283 | 167,692 |
| 1 Inception. | | |
At September 30, 2016, one shareholder was the record or beneficial owner of 32% of the fund’s net assets. If the shareholder were to redeem its investment in the fund, the redemption might lead to the realization of taxable capital gains.
26
Institutional Target Retirement 2040 Fund
| | | | | | |
| F. Transactions during the period in affiliated underlying Vanguard funds were as follows: | |
| | | | Current Period Transactions | |
| | Sept. 30, | | Proceeds | | | Sept. 30, |
| | 2015 | | from | | Capital Gain | 2016 |
| | Market | Purchases | Securities | | Distributions | Market |
| | Value | at Cost | Sold | Income | Received | Value |
| | ($000) | ($000) | ($000) | ($000) | ($000) | ($000) |
| Vanguard Market Liquidity Fund | 346 | NA1 | NA1 | 15 | — | 2 |
| Vanguard Total Bond Market II | | | | | | |
| Index Fund | 226,547 | 521,061 | 10,634 | 11,807 | 584 | 752,334 |
| Vanguard Total International | | | | | | |
| Bond Index Fund | 96,424 | 213,587 | — | 3,073 | — | 322,118 |
| Vanguard Total International | | | | | | |
| Stock Index Fund | 1,079,927 | 1,805,605 | 3,008 | 67,224 | — | 3,049,503 |
| Vanguard Total Stock Market | | | | | | |
| Index Fund | 1,622,736 | 2,598,790 | 17,002 | 68,759 | — | 4,584,021 |
| Total | 3,025,980 | 5,139,043 | 30,644 | 150,878 | 584 | 8,707,978 |
| 1 Not applicable—purchases and sales are for temporary cash investment purposes. | | | |
G. Management has determined that no material events or transactions occurred subsequent to September 30, 2016, that would require recognition or disclosure in these financial statements.
27
Institutional Target Retirement 2045 Fund
Fund Profile
As of September 30, 2016
| |
| Total Fund Characteristics | |
| |
| Ticker Symbol | VITLX |
| 30-Day SEC Yield | 2.18% |
| Acquired Fund Fees and Expenses1 | 0.10% |
| |
| Allocation to Underlying Vanguard Funds | |
| Vanguard Total Stock Market Index Fund | |
| Institutional Shares | 54.1% |
| Vanguard Total International Stock Index | |
| Fund Investor Shares | 35.9 |
| Vanguard Total Bond Market II Index Fund | |
| Investor Shares | 7.0 |
| Vanguard Total International Bond Index | |
| Fund Admiral Shares | 3.0 |
1 This figure—drawn from the prospectus dated January 28, 2016—represents an estimate of the weighted average of the expense ratios and any transaction fees charged by the underlying mutual funds (the ”acquired” funds) in which the Institutional Target Retirement 2045 Fund invests. The fund does not charge any expenses or fees of its own. For the fiscal year ended September 30, 2016, the annualized acquired fund fees and expenses were 0.10%.
28
Institutional Target Retirement 2045 Fund
Performance Summary
All of the returns in this report represent past performance, which is not a guarantee of future results that may be achieved by the fund. (Current performance may be lower or higher than the performance data cited. For performance data current to the most recent month-end, visit our website at vanguard.com/performance.) Note, too, that both investment returns and principal value can fluctuate widely, so an investor’s shares, when sold, could be worth more or less than their original cost. The returns shown do not reflect taxes that a shareholder would pay on fund distributions or on the sale of fund shares.
Cumulative Performance: June 26, 2015, Through September 30, 2016
Initial Investment of $100,000,000
For a benchmark description, see the Glossary.
Mixed-Asset Target 2045 Funds Average: Derived from data provided by Lipper, a Thomson Reuters Company.
"Since Inception" performance is calculated from the fund's inception date for both the fund and its comparative standards.
See Financial Highlights for dividend and capital gains information.
29
Institutional Target Retirement 2045 Fund
Fiscal-Year Total Returns (%): June 26, 2015, Through September 30, 2016
30
Institutional Target Retirement 2045 Fund
Financial Statements
Statement of Net Assets
As of September 30, 2016
The fund reports a complete list of its holdings in regulatory filings four times in each fiscal year, at the quarter-ends. For the second and fourth fiscal quarters, the lists appear in the fund’s semiannual and annual reports to shareholders. For the first and third fiscal quarters, the fund files the lists with the Securities and Exchange Commission on Form N-Q. Shareholders can look up the fund’s Forms N-Q on the SEC’s website at sec.gov. Forms N-Q may also be reviewed and copied at the SEC’s Public Reference Room (see the back cover of this report for further information).
| | |
| | | Market |
| | | Value• |
| | Shares | ($000) |
| Investment Companies (99.6%) | | |
| U.S. Stock Fund (53.9%) | | |
| Vanguard Total Stock Market Index Fund Institutional Shares | 69,502,073 | 3,767,707 |
| International Stock Fund (35.8%) | | |
| Vanguard Total International Stock Index Fund Investor Shares | 165,046,958 | 2,498,811 |
| U.S. Bond Fund (6.9%) | | |
| 1 Vanguard Total Bond Market II Index Fund Investor Shares | 44,004,423 | 485,809 |
| International Bond Fund (3.0%) | | |
| Vanguard Total International Bond Index Fund Admiral Shares | 9,314,689 | 208,090 |
| Total Investment Companies (Cost $6,654,524) | | 6,960,417 |
| Temporary Cash Investment (0.0%) | | |
| Money Market Fund (0.0%) | | |
| 1 Vanguard Market Liquidity Fund, 0.640% (Cost $1,266) | 12,659 | 1,266 |
| Total Investments (99.6%) (Cost $6,655,790) | | 6,961,683 |
| Other Assets and Liabilities (0.4%) | | |
| Other Assets | | 85,946 |
| Liabilities | | (58,260) |
| | | 27,686 |
| Net Assets (100%) | | |
| Applicable to 347,565,509 outstanding $.001 par value shares of | | |
| beneficial interest (unlimited authorization) | | 6,989,369 |
| Net Asset Value Per Share | | $20.11 |
31
| |
| Institutional Target Retirement 2045 Fund | |
| |
| |
| |
| |
| | Amount |
| | ($000) |
| Statement of Assets and Liabilities | |
| Assets | |
| Investments in Securities, at Value—Affiliated Vanguard Funds | 6,961,683 |
| Receivables for Investment Securities Sold | 14,000 |
| Receivables for Accrued Income | 1,094 |
| Receivables for Capital Shares Issued | 70,852 |
| Total Assets | 7,047,629 |
| Liabilities | |
| Payables for Investment Securities Purchased | 57,865 |
| Payables for Capital Shares Redeemed | 394 |
| Other Liabilities | 1 |
| Total Liabilities | 58,260 |
| Net Assets | 6,989,369 |
| |
| |
| At September 30, 2016, net assets consisted of: | |
| | Amount |
| | ($000) |
| Paid-in Capital | 6,589,230 |
| Undistributed Net Investment Income | 93,893 |
| Accumulated Net Realized Gains | 353 |
| Unrealized Appreciation (Depreciation) | 305,893 |
| Net Assets | 6,989,369 |
• See Note A in Notes to Financial Statements.
1 Affiliated fund available only to Vanguard funds and certain trusts and accounts managed by Vanguard. Rate shown for Vanguard Market
Liquidity Fund is the 7-day yield.
See accompanying Notes, which are an integral part of the Financial Statements.
32
| |
| Institutional Target Retirement 2045 Fund | |
| |
| |
| Statement of Operations | |
| |
| | Year Ended |
| | September 30, 2016 |
| | ($000) |
| Investment Income | |
| Income | |
| Income Distributions Received from Affiliated Funds | 118,493 |
| Net Investment Income—Note B | 118,493 |
| Realized Net Gain (Loss) | |
| Capital Gain Distributions Received from Affiliated Funds | 419 |
| Affiliated Investment Securities Sold | (68) |
| Realized Net Gain (Loss) | 351 |
| Change in Unrealized Appreciation (Depreciation) of Investment Securities | 454,611 |
| Net Increase (Decrease) in Net Assets Resulting from Operations | 573,455 |
See accompanying Notes, which are an integral part of the Financial Statements.
33
| | |
| Institutional Target Retirement 2045 Fund | | |
| |
| |
| Statement of Changes in Net Assets | | |
| |
| | | June 26, |
| | Year Ended | 20151 to |
| | September 30, | Sept. 30, |
| | 2016 | 2015 |
| | ($000) | ($000) |
| Increase (Decrease) in Net Assets | | |
| Operations | | |
| Net Investment Income | 118,493 | 9,577 |
| Realized Net Gain (Loss) | 351 | 5 |
| Change in Unrealized Appreciation (Depreciation) | 454,611 | (148,718) |
| Net Increase (Decrease) in Net Assets Resulting from Operations | 573,455 | (139,136) |
| Distributions | | |
| Net Investment Income | (33,117) | — |
| Realized Capital Gain | — | — |
| Total Distributions | (33,117) | — |
| Capital Share Transactions | | |
| Issued | 4,302,587 | 2,469,343 |
| Issued in Lieu of Cash Distributions | 33,014 | — |
| Redeemed | (203,649) | (13,128) |
| Net Increase (Decrease) from Capital Share Transactions | 4,131,952 | 2,456,215 |
| Total Increase (Decrease) | 4,672,290 | 2,317,079 |
| Net Assets | | |
| Beginning of Period | 2,317,079 | — |
| End of Period2 | 6,989,369 | 2,317,079 |
| 1 | Inception. |
| 2 | Net Assets—End of Period includes undistributed (overdistributed) net investment income of $93,893,000 and $9,577,000. |
See accompanying Notes, which are an integral part of the Financial Statements.
34
| | |
| Institutional Target Retirement 2045 Fund | | |
| |
| |
| Financial Highlights | | |
| |
| | Year | June 26, |
| | Ended | 20151 to |
| | Sept. 30, | Sept. 30, |
| For a Share Outstanding Throughout Each Period | 2016 | 2015 |
| Net Asset Value, Beginning of Period | $18.07 | $20.00 |
| Investment Operations | | |
| Net Investment Income | . 464 2 | .1492 |
| Capital Gain Distributions Received | .002 | — |
| Net Realized and Unrealized Gain (Loss) on Investments | 1.736 | (2.079) |
| Total from Investment Operations | 2.202 | (1.930) |
| Distributions | | |
| Dividends from Net Investment Income | (.162) | — |
| Distributions from Realized Capital Gains | — | — |
| Total Distributions | (.162) | — |
| Net Asset Value, End of Period | $20.11 | $18.07 |
| |
| Total Return | 12.24% | -9.65% |
| |
| Ratios/Supplemental Data | | |
| Net Assets, End of Period (Millions) | $6,989 | $2,317 |
| Ratio of Total Expenses to Average Net Assets | — | — |
| Acquired Fund Fees and Expenses | 0.10% | 0.10%3 |
| Ratio of Net Investment Income to Average Net Assets | 2.42% | 2.79%3 |
| Portfolio Turnover Rate | 1% | 0% |
| 1 | Inception. |
| 2 | Calculated based on average shares outstanding. |
| 3 | Annualized. |
See accompanying Notes, which are an integral part of the Financial Statements.
35
Institutional Target Retirement 2045 Fund
Notes to Financial Statements
Vanguard Institutional Target Retirement 2045 Fund is registered under the Investment Company Act of 1940 as an open-end investment company, or mutual fund. The fund follows a balanced investment strategy by investing in selected Vanguard funds to achieve its targeted allocation of assets to U.S. and international stocks, and U.S. and international bonds. Financial statements and other information about each underlying fund are available on vanguard.com.
A. The following significant accounting policies conform to generally accepted accounting principles for U.S. investment companies. The fund consistently follows such policies in preparing its financial statements.
1. Security Valuation: Investments are valued at the net asset value of each underlying Vanguard fund determined as of the close of the New York Stock Exchange (generally 4 p.m., Eastern time) on the valuation date.
2. Federal Income Taxes: The fund intends to continue to qualify as a regulated investment company and distribute all of its taxable income. Management has analyzed the fund’s tax positions taken for all open federal income tax years (September 30, 2015–2016), and has concluded that no provision for federal income tax is required in the fund’s financial statements.
3. Distributions: Distributions to shareholders are recorded on the ex-dividend date.
4. Credit Facility: The fund and certain other funds managed by The Vanguard Group (“Vanguard”) participate in a $3.1 billion committed credit facility provided by a syndicate of lenders pursuant to a credit agreement that may be renewed annually; each fund is individually liable for its borrowings, if any, under the credit facility. Borrowings may be utilized for temporary and emergency purposes, and are subject to the fund’s regulatory and contractual borrowing restrictions. The participating funds are charged administrative fees and an annual commitment fee of 0.10% of the undrawn amount of the facility; these fees are allocated to the funds based on a method approved by the fund’s board of trustees and borne by the funds in which the fund invests (see Note B). Any borrowings under this facility bear interest at a rate based upon the higher of the one-month London Interbank Offered Rate, federal funds effective rate, or overnight bank funding rate plus an agreed-upon spread.
The fund had no borrowings outstanding at September 30, 2016, or at any time during the period then ended.
5. Other: Income and capital gain distributions received are recorded on the ex-dividend date. Security transactions are accounted for on the date securities are bought or sold. Costs used to determine realized gains (losses) on the sale of investment securities are those of the specific securities sold.
B. In accordance with the terms of a Funds’ Service Agreement (the “FSA”) between Vanguard and the fund, Vanguard furnishes to the fund investment advisory, corporate management, administrative, marketing, and distribution services at Vanguard’s cost of operations (as defined by the FSA). These costs of operations are allocated to the fund based on methods and guidelines approved by the board of trustees. The FSA provides that expenses otherwise allocable to Vanguard funds-of-funds may be reduced or eliminated to the extent of savings realized by the underlying Vanguard funds by virtue of being part of a fund-of-funds. Accordingly, all expenses for services provided by Vanguard to the fund and all other expenses incurred by the fund during the year ended September 30, 2016, were borne by the underlying Vanguard funds in which the fund invests. The fund’s trustees and officers are also trustees and officers, respectively, of the underlying Vanguard funds, as well as directors and employees, respectively, of Vanguard.
36
Institutional Target Retirement 2045 Fund
C. Various inputs may be used to determine the value of the fund’s investments. These inputs are summarized in three broad levels for financial statement purposes. The inputs or methodologies used to value securities are not necessarily an indication of the risk associated with investing in those securities.
Level 1—Quoted prices in active markets for identical securities.
Level 2—Other significant observable inputs (including quoted prices for similar securities, interest rates, prepayment speeds, credit risk, etc.).
Level 3—Significant unobservable inputs (including the fund’s own assumptions used to determine the fair value of investments).
At September 30, 2016, 100% of the market value of the fund’s investments was determined based on Level 1 inputs.
D. Distributions are determined on a tax basis and may differ from net investment income and realized capital gains for financial reporting purposes. Differences may be permanent or temporary. Permanent differences are reclassified among capital accounts in the financial statements to reflect their tax character. Temporary differences arise when certain items of income, expense, gain, or loss are recognized in different periods for financial statement and tax purposes. These differences will reverse at some time in the future. Differences in classification may also result from the treatment of short-term gains as ordinary income for tax purposes.
The fund used a tax accounting practice to treat a portion of the price of capital shares redeemed during the year as distributions from net investment income and realized capital gains. Accordingly, the fund has reclassified $1,060,000 from undistributed net investment income, and $3,000 from accumulated net realized gains, to paid-in capital.
For tax purposes, at September 30, 2016, the fund had $93,936,000 of ordinary income and $310,000 of long-term capital gains available for distribution.
At September 30, 2016, the cost of investment securities for tax purposes was $6,655,790,000. Net unrealized appreciation of investment securities for tax purposes was $305,893,000, consisting entirely of unrealized gains on securities that had risen in value since their purchase.
| | |
| E. Capital shares issued and redeemed were: | | |
| | Year Ended | June 26, 20151 to |
| | September 30, 2016 | September 30, 2015 |
| | Shares | Shares |
| | (000) | (000) |
| Issued | 228,312 | 128,933 |
| Issued in Lieu of Cash Distributions | 1,741 | — |
| Redeemed | (10,725) | (696) |
| Net Increase (Decrease) in Shares Outstanding | 219,328 | 128,237 |
| 1 Inception. | | |
At September 30, 2016, one shareholder was the record or beneficial owner of 28% of the fund’s net assets. If the shareholder were to redeem its investment in the fund, the redemption might lead to the realization of taxable capital gains.
37
Institutional Target Retirement 2045 Fund
| | | | | | |
| F. Transactions during the period in affiliated underlying Vanguard funds were as follows: | |
| | | | Current Period Transactions | |
| | Sept. 30, | | Proceeds | | | Sept. 30, |
| | 2015 | | from | | Capital Gain | 2016 |
| | Market | Purchases | Securities | | Distributions | Market |
| | Value | at Cost | Sold | Income | Received | Value |
| | ($000) | ($000) | ($000) | ($000) | ($000) | ($000) |
| Vanguard Market Liquidity Fund | 1,965 | NA1 | NA1 | 16 | — | 1,266 |
| Vanguard Total Bond Market II | | | | | | |
| Index Fund | 160,753 | 350,538 | 36,057 | 8,086 | 419 | 485,809 |
| Vanguard Total International Bond | | | | | |
| Index Fund | 68,451 | 131,358 | — | 2,104 | — | 208,090 |
| Vanguard Total International Stock | | | | | |
| Index Fund | 831,050 | 1,535,586 | 3,075 | 53,568 | — | 2,498,811 |
| Vanguard Total Stock Market | | | | | | |
| Index Fund | 1,249,582 | 2,225,496 | 7,808 | 54,719 | — | 3,767,707 |
| Total | 2,311,801 | 4,242,978 | 46,940 | 118,493 | 419 | 6,961,683 |
| 1 Not applicable—purchases and sales are for temporary cash investment purposes. | | | |
G. Management has determined that no material events or transactions occurred subsequent to September 30, 2016, that would require recognition or disclosure in these financial statements.
38
Institutional Target Retirement 2050 Fund
Fund Profile
As of September 30, 2016
| |
| Total Fund Characteristics | |
| |
| Ticker Symbol | VTRLX |
| 30-Day SEC Yield | 2.18% |
| Acquired Fund Fees and Expenses1 | 0.10% |
| |
| Allocation to Underlying Vanguard Funds | |
| Vanguard Total Stock Market Index Fund | |
| Institutional Shares | 54.0% |
| Vanguard Total International Stock Index | |
| Fund Investor Shares | 35.8 |
| Vanguard Total Bond Market II Index Fund | |
| Investor Shares | 7.2 |
| Vanguard Total International Bond Index | |
| Fund Admiral Shares | 3.0 |
1 This figure—drawn from the prospectus dated January 28, 2016—represents an estimate of the weighted average of the expense ratios and any transaction fees charged by the underlying mutual funds (the ”acquired” funds) in which the Institutional Target Retirement 2050 Fund invests. The fund does not charge any expenses or fees of its own. For the fiscal year ended September 30, 2016, the annualized acquired fund fees and expenses were 0.10%.
39
Institutional Target Retirement 2050 Fund
Performance Summary
All of the returns in this report represent past performance, which is not a guarantee of future results that may be achieved by the fund. (Current performance may be lower or higher than the performance data cited. For performance data current to the most recent month-end, visit our website at vanguard.com/performance.) Note, too, that both investment returns and principal value can fluctuate widely, so an investor’s shares, when sold, could be worth more or less than their original cost. The returns shown do not reflect taxes that a shareholder would pay on fund distributions or on the sale of fund shares.
Cumulative Performance: June 26, 2015, Through September 30, 2016
Initial Investment of $100,000,000
For a benchmark description, see the Glossary.
Mixed-Asset Target 2050 Funds Average: Derived from data provided by Lipper, a Thomson Reuters Company.
"Since Inception" performance is calculated from the fund's inception date for both the fund and its comparative standards.
See Financial Highlights for dividend and capital gains information.
40
Institutional Target Retirement 2050 Fund
Fiscal-Year Total Returns (%): June 26, 2015, Through September 30, 2016
41
Institutional Target Retirement 2050 Fund
Financial Statements
Statement of Net Assets
As of September 30, 2016
The fund reports a complete list of its holdings in regulatory filings four times in each fiscal year, at the quarter-ends. For the second and fourth fiscal quarters, the lists appear in the fund’s semiannual and annual reports to shareholders. For the first and third fiscal quarters, the fund files the lists with the Securities and Exchange Commission on Form N-Q. Shareholders can look up the fund’s Forms N-Q on the SEC’s website at sec.gov. Forms N-Q may also be reviewed and copied at the SEC’s Public Reference Room (see the back cover of this report for further information).
| | |
| | | Market |
| | | Value• |
| | Shares | ($000) |
| Investment Companies (99.7%) | | |
| U.S. Stock Fund (53.9%) | | |
| Vanguard Total Stock Market Index Fund Institutional Shares | 43,013,551 | 2,331,764 |
| International Stock Fund (35.7%) | | |
| Vanguard Total International Stock Index Fund Investor Shares | 102,155,525 | 1,546,635 |
| U.S. Bond Fund (7.1%) | | |
| 1 Vanguard Total Bond Market II Index Fund Investor Shares | 27,969,916 | 308,788 |
| International Bond Fund (3.0%) | | |
| Vanguard Total International Bond Index Fund Admiral Shares | 5,748,312 | 128,417 |
| Total Investment Companies (Cost $4,123,464) | | 4,315,604 |
| Temporary Cash Investment (0.0%) | | |
| Money Market Fund (0.0%) | | |
| 1 Vanguard Market Liquidity Fund, 0.640% (Cost $1,065) | 10,646 | 1,065 |
| Total Investments (99.7%) (Cost $4,124,529) | | 4,316,669 |
| Other Assets and Liabilities (0.3%) | | |
| Other Assets | | 61,163 |
| Liabilities | | (48,436) |
| | | 12,727 |
| Net Assets (100%) | | |
| Applicable to 215,249,740 outstanding $.001 par value shares of | | |
| beneficial interest (unlimited authorization) | | 4,329,396 |
| Net Asset Value Per Share | | $20.11 |
42
| |
| Institutional Target Retirement 2050 Fund | |
| |
| |
| |
| |
| | Amount |
| | ($000) |
| Statement of Assets and Liabilities | |
| Assets | |
| Investments in Securities, at Value—Affiliated Vanguard Funds | 4,316,669 |
| Receivables for Accrued Income | 677 |
| Receivables for Capital Shares Issued | 60,486 |
| Total Assets | 4,377,832 |
| Liabilities | |
| Payables for Investment Securities Purchased | 47,905 |
| Payables for Capital Shares Redeemed | 531 |
| Total Liabilities | 48,436 |
| Net Assets | 4,329,396 |
| |
| |
| At September 30, 2016, net assets consisted of: | |
| | Amount |
| | ($000) |
| Paid-in Capital | 4,080,314 |
| Undistributed Net Investment Income | 56,710 |
| Accumulated Net Realized Gains | 232 |
| Unrealized Appreciation (Depreciation) | 192,140 |
| Net Assets | 4,329,396 |
• See Note A in Notes to Financial Statements.
1 Affiliated fund available only to Vanguard funds and certain trusts and accounts managed by Vanguard. Rate shown for Vanguard Market
Liquidity Fund is the 7-day yield.
See accompanying Notes, which are an integral part of the Financial Statements.
43
| |
| Institutional Target Retirement 2050 Fund | |
| |
| |
| Statement of Operations | |
| |
| | Year Ended |
| | September 30, 2016 |
| | ($000) |
| Investment Income | |
| Income | |
| Income Distributions Received from Affiliated Funds | 70,655 |
| Net Investment Income—Note B | 70,655 |
| Realized Net Gain (Loss) | |
| Capital Gain Distributions Received from Affiliated Funds | 233 |
| Realized Net Gain (Loss) | 233 |
| Change in Unrealized Appreciation (Depreciation) of Investment Securities | 270,453 |
| Net Increase (Decrease) in Net Assets Resulting from Operations | 341,341 |
See accompanying Notes, which are an integral part of the Financial Statements.
44
| | |
| Institutional Target Retirement 2050 Fund | | |
| |
| |
| Statement of Changes in Net Assets | | |
| |
| | | June 26, |
| | Year Ended | 20151 to |
| | September 30, | Sept. 30, |
| | 2016 | 2015 |
| | ($000) | ($000) |
| Increase (Decrease) in Net Assets | | |
| Operations | | |
| Net Investment Income | 70,655 | 5,118 |
| Realized Net Gain (Loss) | 233 | 1 |
| Change in Unrealized Appreciation (Depreciation) | 270,453 | (78,313) |
| Net Increase (Decrease) in Net Assets Resulting from Operations | 341,341 | (73,194) |
| Distributions | | |
| Net Investment Income | (18,343) | — |
| Realized Capital Gain | — | — |
| Total Distributions | (18,343) | — |
| Capital Share Transactions | | |
| Issued | 2,864,884 | 1,341,784 |
| Issued in Lieu of Cash Distributions | 18,188 | — |
| Redeemed | (135,302) | (9,962) |
| Net Increase (Decrease) from Capital Share Transactions | 2,747,770 | 1,331,822 |
| Total Increase (Decrease) | 3,070,768 | 1,258,628 |
| Net Assets | | |
| Beginning of Period | 1,258,628 | — |
| End of Period2 | 4,329,396 | 1,258,628 |
| 1 | Inception. |
| 2 | Net Assets—End of Period includes undistributed (overdistributed) net investment income of $56,710,000 and $5,118,000. |
See accompanying Notes, which are an integral part of the Financial Statements.
45
| | |
| Institutional Target Retirement 2050 Fund | | |
| |
| |
| Financial Highlights | | |
| |
| | Year | June 26, |
| | Ended | 20151 to |
| | Sept. 30, | Sept. 30, |
| For a Share Outstanding Throughout Each Period | 2016 | 2015 |
| Net Asset Value, Beginning of Period | $18.07 | $20.00 |
| Investment Operations | | |
| Net Investment Income | . 466 2 | .1492 |
| Capital Gain Distributions Received | .002 2 | — |
| Net Realized and Unrealized Gain (Loss) on Investments | 1.732 | (2.079) |
| Total from Investment Operations | 2.200 | (1.930) |
| Distributions | | |
| Dividends from Net Investment Income | (.160) | — |
| Distributions from Realized Capital Gains | — | — |
| Total Distributions | (.160) | — |
| Net Asset Value, End of Period | $20.11 | $18.07 |
| |
| Total Return | 12.23% | -9.65% |
| |
| Ratios/Supplemental Data | | |
| Net Assets, End of Period (Millions) | $4,329 | $1,259 |
| Ratio of Total Expenses to Average Net Assets | — | — |
| Acquired Fund Fees and Expenses | 0.10% | 0.10%3 |
| Ratio of Net Investment Income to Average Net Assets | 2.43% | 2.81%3 |
| Portfolio Turnover Rate | 1% | 1% |
| 1 | Inception. |
| 2 | Calculated based on average shares outstanding. |
| 3 | Annualized. |
See accompanying Notes, which are an integral part of the Financial Statements.
46
Institutional Target Retirement 2050 Fund
Notes to Financial Statements
Vanguard Institutional Target Retirement 2050 Fund is registered under the Investment Company Act of 1940 as an open-end investment company, or mutual fund. The fund follows a balanced investment strategy by investing in selected Vanguard funds to achieve its targeted allocation of assets to U.S. and international stocks, and U.S. and international bonds. Financial statements and other information about each underlying fund are available on vanguard.com.
A. The following significant accounting policies conform to generally accepted accounting principles for U.S. investment companies. The fund consistently follows such policies in preparing its financial statements.
1. Security Valuation: Investments are valued at the net asset value of each underlying Vanguard fund determined as of the close of the New York Stock Exchange (generally 4 p.m., Eastern time) on the valuation date.
2. Federal Income Taxes: The fund intends to continue to qualify as a regulated investment company and distribute all of its taxable income. Management has analyzed the fund’s tax positions taken for all open federal income tax years (September 30, 2015–2016), and has concluded that no provision for federal income tax is required in the fund’s financial statements.
3. Distributions: Distributions to shareholders are recorded on the ex-dividend date.
4. Credit Facility: The fund and certain other funds managed by The Vanguard Group (“Vanguard”) participate in a $3.1 billion committed credit facility provided by a syndicate of lenders pursuant to a credit agreement that may be renewed annually; each fund is individually liable for its borrowings, if any, under the credit facility. Borrowings may be utilized for temporary and emergency purposes, and are subject to the fund’s regulatory and contractual borrowing restrictions. The participating funds are charged administrative fees and an annual commitment fee of 0.10% of the undrawn amount of the facility; these fees are allocated to the funds based on a method approved by the fund’s board of trustees and borne by the funds in which the fund invests (see Note B). Any borrowings under this facility bear interest at a rate based upon the higher of the one-month London Interbank Offered Rate, federal funds effective rate, or overnight bank funding rate plus an agreed-upon spread.
The fund had no borrowings outstanding at September 30, 2016, or at any time during the period then ended.
5. Other: Income and capital gain distributions received are recorded on the ex-dividend date. Security transactions are accounted for on the date securities are bought or sold. Costs used to determine realized gains (losses) on the sale of investment securities are those of the specific securities sold.
B. In accordance with the terms of a Funds’ Service Agreement (the “FSA”) between Vanguard and the fund, Vanguard furnishes to the fund investment advisory, corporate management, administrative, marketing, and distribution services at Vanguard’s cost of operations (as defined by the FSA). These costs of operations are allocated to the fund based on methods and guidelines approved by the board of trustees. The FSA provides that expenses otherwise allocable to Vanguard funds-of-funds may be reduced or eliminated to the extent of savings realized by the underlying Vanguard funds by virtue of being part of a fund-of-funds. Accordingly, all expenses for services provided by Vanguard to the fund and all other expenses incurred by the fund during the period ended September 30, 2016, were borne by the underlying Vanguard funds in which the fund invests. The fund’s trustees and officers are also trustees and officers, respectively, of the underlying Vanguard funds, as well as directors and employees, respectively, of Vanguard.
47
Institutional Target Retirement 2050 Fund
C. Various inputs may be used to determine the value of the fund’s investments. These inputs are summarized in three broad levels for financial statement purposes. The inputs or methodologies used to value securities are not necessarily an indication of the risk associated with investing in those securities.
Level 1—Quoted prices in active markets for identical securities.
Level 2—Other significant observable inputs (including quoted prices for similar securities, interest rates, prepayment speeds, credit risk, etc.).
Level 3—Significant unobservable inputs (including the fund’s own assumptions used to determine the fair value of investments).
At September 30, 2016, 100% of the market value of the fund’s investments was determined based on Level 1 inputs.
D. Distributions are determined on a tax basis and may differ from net investment income and realized capital gains for financial reporting purposes. Differences may be permanent or temporary. Permanent differences are reclassified among capital accounts in the financial statements to reflect their tax character. Temporary differences arise when certain items of income, expense, gain, or loss are recognized in different periods for financial statement and tax purposes. These differences will reverse at some time in the future. Differences in classification may also result from the treatment of short-term gains as ordinary income for tax purposes.
The fund used a tax accounting practice to treat a portion of the price of capital shares redeemed during the year as distributions from net investment income and realized capital gains. Accordingly, the fund has reclassified $720,000 from undistributed net investment income, and $2,000 from accumulated net realized gains, to paid-in capital.
For tax purposes, at September 30, 2016, the fund had $56,733,000 of ordinary income and $209,000 of long-term capital gains available for distribution.
At September 30, 2016, the cost of investment securities for tax purposes was $4,124,530,000. Net unrealized appreciation of investment securities for tax purposes was $192,140,000, consisting entirely of unrealized gains on securities that had risen in value since their purchase.
| | |
| E. Capital shares issued and redeemed were: | | |
| | Year Ended | June 26, 20151 to |
| | September 30, 2016 | September 30, 2015 |
| | Shares | Shares |
| | (000) | (000) |
| Issued | 151,751 | 70,183 |
| Issued in Lieu of Cash Distributions | 959 | — |
| Redeemed | (7,110) | (533) |
| Net Increase (Decrease) in Shares Outstanding | 145,600 | 69,650 |
| 1 Inception. | | |
At September 30, 2016, one shareholder was the record or beneficial owner of 27% of the fund’s net assets. If the shareholder were to redeem its investment in the fund, the redemption might lead to the realization of taxable capital gains.
48
Institutional Target Retirement 2050 Fund
| | | | | | |
| F. Transactions during the period in affiliated underlying Vanguard funds were as follows: | |
| | | | Current Period Transactions | |
| | Sept. 30, | | Proceeds | | | Sept. 30, |
| | 2015 | | from | | Capital Gain | 2016 |
| | Market | Purchases | Securities | | Distributions | Market |
| | Value | at Cost | Sold | Income | Received | Value |
| | ($000) | ($000) | ($000) | ($000) | ($000) | ($000) |
| Vanguard Market Liquidity Fund | 734 | NA1 | NA1 | 10 | — | 1,065 |
| Vanguard Total Bond Market II | | | | | | |
| Index Fund | 87,453 | 224,480 | 9,524 | 4,801 | 233 | 308,788 |
| Vanguard Total International Bond | | | | | | |
| Index Fund | 37,205 | 86,297 | — | 1,234 | — | 128,417 |
| Vanguard Total International Stock | | | | | |
| Index Fund | 451,990 | 1,014,225 | 2,010 | 31,954 | — | 1,546,635 |
| Vanguard Total Stock Market | | | | | | |
| Index Fund | 679,621 | 1,479,063 | 3,649 | 32,656 | — | 2,331,764 |
| Total | 1,257,003 | 2,804,065 | 15,183 | 70,655 | 233 | 4,316,669 |
| 1 Not applicable—purchases and sales are for temporary cash investment purposes. | | | |
G. Management has determined that no material events or transactions occurred subsequent to September 30, 2016, that would require recognition or disclosure in these financial statements.
49
Institutional Target Retirement 2055 Fund
Fund Profile
As of September 30, 2016
| |
| Total Fund Characteristics | |
| |
| Ticker Symbol | VIVLX |
| 30-Day SEC Yield | 2.18% |
| Acquired Fund Fees and Expenses1 | 0.10% |
| |
| Allocation to Underlying Vanguard Funds | |
| Vanguard Total Stock Market Index Fund | |
| Institutional Shares | 54.0% |
| Vanguard Total International Stock Index | |
| Fund Investor Shares | 36.0 |
| Vanguard Total Bond Market II Index Fund | |
| Investor Shares | 7.0 |
| Vanguard Total International Bond Index | |
| Fund Admiral Shares | 3.0 |
1 This figure—drawn from the prospectus dated January 28, 2016—represents an estimate of the weighted average of the expense ratios and any transaction fees charged by the underlying mutual funds (the ”acquired” funds) in which the Institutional Target Retirement 2055 Fund invests. The fund does not charge any expenses or fees of its own. For the fiscal year ended September 30, 2016, the annualized acquired fund fees and expenses were 0.10%.
50
Institutional Target Retirement 2055 Fund
Performance Summary
All of the returns in this report represent past performance, which is not a guarantee of future results that may be achieved by the fund. (Current performance may be lower or higher than the performance data cited. For performance data current to the most recent month-end, visit our website at vanguard.com/performance.) Note, too, that both investment returns and principal value can fluctuate widely, so an investor’s shares, when sold, could be worth more or less than their original cost. The returns shown do not reflect taxes that a shareholder would pay on fund distributions or on the sale of fund shares.
Cumulative Performance: June 26, 2015, Through September 30, 2016
Initial Investment of $100,000,000
For a benchmark description, see the Glossary.
Mixed-Asset Target 2055+ Funds Average: Derived from data provided by Lipper, a Thomson Reuters Company.
"Since Inception" performance is calculated from the fund's inception date for both the fund and its comparative standards.
See Financial Highlights for dividend and capital gains information.
51
Institutional Target Retirement 2055 Fund
Fiscal-Year Total Returns (%): June 26, 2015, Through September 30, 2016
52
Institutional Target Retirement 2055 Fund
Financial Statements
Statement of Net Assets
As of September 30, 2016
The fund reports a complete list of its holdings in regulatory filings four times in each fiscal year, at the quarter-ends. For the second and fourth fiscal quarters, the lists appear in the fund’s semiannual and annual reports to shareholders. For the first and third fiscal quarters, the fund files the lists with the Securities and Exchange Commission on Form N-Q. Shareholders can look up the fund’s Forms N-Q on the SEC’s website at sec.gov. Forms N-Q may also be reviewed and copied at the SEC’s Public Reference Room (see the back cover of this report for further information).
| | |
| | | Market |
| | | Value• |
| | Shares | ($000) |
| Investment Companies (99.6%) | | |
| U.S. Stock Fund (53.8%) | | |
| Vanguard Total Stock Market Index Fund Institutional Shares | 15,163,458 | 822,011 |
| International Stock Fund (35.8%) | | |
| Vanguard Total International Stock Index Fund Investor Shares | 36,112,838 | 546,748 |
| U.S. Bond Fund (7.0%) | | |
| 1 Vanguard Total Bond Market II Index Fund Investor Shares | 9,638,787 | 106,412 |
| International Bond Fund (3.0%) | | |
| Vanguard Total International Bond Index Fund Admiral Shares | 2,024,689 | 45,232 |
| Total Investment Companies (Cost $1,451,249) | | 1,520,403 |
| Temporary Cash Investment (0.0%) | | |
| Money Market Fund (0.0%) | | |
| 1 Vanguard Market Liquidity Fund, 0.640% (Cost $746) | 7,457 | 746 |
| Total Investments (99.6%) (Cost $1,451,995) | | 1,521,149 |
| Other Assets and Liabilities (0.4%) | | |
| Other Assets | | 18,434 |
| Liabilities | | (12,359) |
| | | 6,075 |
| Net Assets (100%) | | |
| Applicable to 75,925,313 outstanding $.001 par value shares of | | |
| beneficial interest (unlimited authorization) | | 1,527,224 |
| Net Asset Value Per Share | | $20.11 |
53
| |
| Institutional Target Retirement 2055 Fund | |
| |
| |
| |
| |
| | Amount |
| | ($000) |
| Statement of Assets and Liabilities | |
| Assets | |
| Investments in Securities, at Value—Affiliated Vanguard Funds | 1,521,149 |
| Receivables for Investment Securities Sold | 3,500 |
| Receivables for Accrued Income | 290 |
| Receivables for Capital Shares Issued | 14,644 |
| Total Assets | 1,539,583 |
| Liabilities | |
| Payables for Investment Securities Purchased | 9,641 |
| Payables for Capital Shares Redeemed | 2,718 |
| Total Liabilities | 12,359 |
| Net Assets | 1,527,224 |
| |
| |
| At September 30, 2016, net assets consisted of: | |
| | Amount |
| | ($000) |
| Paid-in Capital | 1,439,075 |
| Undistributed Net Investment Income | 18,984 |
| Accumulated Net Realized Gains | 11 |
| Unrealized Appreciation (Depreciation) | 69,154 |
| Net Assets | 1,527,224 |
• See Note A in Notes to Financial Statements.
1 Affiliated fund available only to Vanguard funds and certain trusts and accounts managed by Vanguard. Rate shown for Vanguard Market
Liquidity Fund is the 7-day yield.
See accompanying Notes, which are an integral part of the Financial Statements.
54
| |
| Institutional Target Retirement 2055 Fund | |
| |
| |
| Statement of Operations | |
| |
| | Year Ended |
| | September 30, 2016 |
| | ($000) |
| Investment Income | |
| Income | |
| Income Distributions Received from Affiliated Funds | 23,259 |
| Other Income | 53 |
| Net Investment Income—Note B | 23,312 |
| Realized Net Gain (Loss) | |
| Capital Gain Distributions Received from Affiliated Funds | 72 |
| Affiliated Investment Securities Sold | (26) |
| Realized Net Gain (Loss) | 46 |
| Change in Unrealized Appreciation (Depreciation) of Investment Securities | 90,488 |
| Net Increase (Decrease) in Net Assets Resulting from Operations | 113,846 |
See accompanying Notes, which are an integral part of the Financial Statements.
55
| | |
| Institutional Target Retirement 2055 Fund | | |
| |
| |
| Statement of Changes in Net Assets | | |
| |
| | | June 26, |
| | Year Ended | 20151 to |
| | September 30, | Sept. 30, |
| | 2016 | 2015 |
| | ($000) | ($000) |
| Increase (Decrease) in Net Assets | | |
| Operations | | |
| Net Investment Income | 23,312 | 1,519 |
| Realized Net Gain (Loss) | 46 | — |
| Change in Unrealized Appreciation (Depreciation) | 90,488 | (21,334) |
| Net Increase (Decrease) in Net Assets Resulting from Operations | 113,846 | (19,815) |
| Distributions | | |
| Net Investment Income | (5,544) | — |
| Realized Capital Gain 2 | (35) | — |
| Total Distributions | (5,579) | — |
| Capital Share Transactions | | |
| Issued | 1,099,916 | 396,960 |
| Issued in Lieu of Cash Distributions | 5,531 | — |
| Redeemed | (59,524) | (4,111) |
| Net Increase (Decrease) from Capital Share Transactions | 1,045,923 | 392,849 |
| Total Increase (Decrease) | 1,154,190 | 373,034 |
| Net Assets | | |
| Beginning of Period | 373,034 | — |
| End of Period3 | 1,527,224 | 373,034 |
| 1 | Inception. |
| 2 | Includes fiscal 2016 and 2015 short-term gain distributions totaling $35,000 and $0, respectively. Short-term gain distributions are treated as ordinary income dividends for tax purposes. |
| 3 | Net Assets—End of Period includes undistributed (overdistributed) net investment income of $18,984,000 and $1,519,000. |
See accompanying Notes, which are an integral part of the Financial Statements.
56
| | |
| Institutional Target Retirement 2055 Fund | | |
| |
| |
| Financial Highlights | | |
| |
| | Year | June 26, |
| | Ended | 20151 to |
| | Sept. 30, | Sept. 30, |
| For a Share Outstanding Throughout Each Period | 2016 | 2015 |
| Net Asset Value, Beginning of Period | $18.08 | $20.00 |
| Investment Operations | | |
| Net Investment Income | . 470 2 | .1572 |
| Capital Gain Distributions Received | .001 | — |
| Net Realized and Unrealized Gain (Loss) on Investments | 1.718 | (2.077) |
| Total from Investment Operations | 2.189 | (1.920) |
| Distributions | | |
| Dividends from Net Investment Income | (.158) | — |
| Distributions from Realized Capital Gains | (.001) | — |
| Total Distributions | (.159) | — |
| Net Asset Value, End of Period | $20.11 | $18.08 |
| |
| Total Return | 12.16% | -9.60% |
| |
| Ratios/Supplemental Data | | |
| Net Assets, End of Period (Millions) | $1,527 | $373 |
| Ratio of Total Expenses to Average Net Assets | — | — |
| Acquired Fund Fees and Expenses | 0.10% | 0.10%3 |
| Ratio of Net Investment Income to Average Net Assets | 2.47% | 3.05%3 |
| Portfolio Turnover Rate | 1% | 1% |
| 1 | Inception. |
| 2 | Calculated based on average shares outstanding. |
| 3 | Annualized. |
See accompanying Notes, which are an integral part of the Financial Statements.
57
Institutional Target Retirement 2055 Fund
Notes to Financial Statements
Vanguard Institutional Target Retirement 2055 Fund is registered under the Investment Company Act of 1940 as an open-end investment company, or mutual fund. The fund follows a balanced investment strategy by investing in selected Vanguard funds to achieve its targeted allocation of assets to U.S. and international stocks, and U.S. and international bonds. Financial statements and other information about each underlying fund are available on vanguard.com.
A. The following significant accounting policies conform to generally accepted accounting principles for U.S. investment companies. The fund consistently follows such policies in preparing its financial statements.
1. Security Valuation: Investments are valued at the net asset value of each underlying Vanguard fund determined as of the close of the New York Stock Exchange (generally 4 p.m., Eastern time) on the valuation date.
2. Federal Income Taxes: The fund intends to continue to qualify as a regulated investment company and distribute all of its taxable income. Management has analyzed the fund’s tax positions taken for all open federal income tax years (September 30, 2015–2016), and has concluded that no provision for federal income tax is required in the fund’s financial statements.
3. Distributions: Distributions to shareholders are recorded on the ex-dividend date.
4. Credit Facility: The fund and certain other funds managed by The Vanguard Group (“Vanguard”) participate in a $3.1 billion committed credit facility provided by a syndicate of lenders pursuant to a credit agreement that may be renewed annually; each fund is individually liable for its borrowings, if any, under the credit facility. Borrowings may be utilized for temporary and emergency purposes, and are subject to the fund’s regulatory and contractual borrowing restrictions. The participating funds are charged administrative fees and an annual commitment fee of 0.10% of the undrawn amount of the facility; these fees are allocated to the funds based on a method approved by the fund’s board of trustees and borne by the funds in which the fund invests (see Note B). Any borrowings under this facility bear interest at a rate based upon the higher of the one-month London Interbank Offered Rate, federal funds effective rate, or overnight bank funding rate plus an agreed-upon spread.
The fund had no borrowings outstanding at September 30, 2016, or at any time during the period then ended.
B. In accordance with the terms of a Funds’ Service Agreement (the “FSA”) between Vanguard and the fund, Vanguard furnishes to the fund investment advisory, corporate management, administrative, marketing, and distribution services at Vanguard’s cost of operations (as defined by the FSA). These costs of operations are allocated to the fund based on methods and guidelines approved by the board of trustees. The FSA provides that expenses otherwise allocable to Vanguard funds-of-funds may be reduced or eliminated to the extent of savings realized by the underlying Vanguard funds by virtue of being part of a fund-of-funds. Accordingly, all expenses for services provided by Vanguard to the fund and all other expenses incurred by the fund during the period ended September 30, 2016, were borne by the underlying Vanguard funds in which the fund invests. The fund’s trustees and officers are also trustees and officers, respectively, of the underlying Vanguard funds, as well as directors and employees, respectively, of Vanguard.
58
Institutional Target Retirement 2055 Fund
C. Various inputs may be used to determine the value of the fund’s investments. These inputs are summarized in three broad levels for financial statement purposes. The inputs or methodologies used to value securities are not necessarily an indication of the risk associated with investing in those securities.
Level 1—Quoted prices in active markets for identical securities.
Level 2—Other significant observable inputs (including quoted prices for similar securities, interest rates, prepayment speeds, credit risk, etc.).
Level 3—Significant unobservable inputs (including the fund’s own assumptions used to determine the fair value of investments).
At September 30, 2016, 100% of the market value of the fund’s investments was determined based on Level 1 inputs.
D. Distributions are determined on a tax basis and may differ from net investment income and realized capital gains for financial reporting purposes. Differences may be permanent or temporary. Permanent differences are reclassified among capital accounts in the financial statements to reflect their tax character. Temporary differences arise when certain items of income, expense, gain, or loss are recognized in different periods for financial statement and tax purposes. These differences will reverse at some time in the future. Differences in classification may also result from the treatment of short-term gains as ordinary income for tax purposes.
The fund used a tax accounting practice to treat a portion of the price of capital shares redeemed during the year as distributions from net investment income and realized capital gains. Accordingly, the fund has reclassified $303,000 from undistributed net investment income to paid in capital.
For tax purposes, at September 30, 2016, the fund had $18,975,000 of ordinary income and $20,000 of long-term capital gains available for distribution.
At September 30, 2016, the cost of investment securities for tax purposes was $1,451,995,000. Net unrealized appreciation of investment securities for tax purposes was $69,154,000, consisting entirely of unrealized gains on securities that had risen in value since their purchase.
| | |
| E. Capital shares issued and redeemed were: | | |
| | Year Ended | June 26, 20151 to |
| | September 30, 2016 | September 30, 2015 |
| | Shares | Shares |
| | (000) | (000) |
| Issued | 58,130 | 20,856 |
| Issued in Lieu of Cash Distributions | 292 | — |
| Redeemed | (3,134) | (218) |
| Net Increase (Decrease) in Shares Outstanding | 55,288 | 20,638 |
| 1 Inception. | | |
At September 30, 2016, one shareholder was the record or beneficial owner of 25% of the fund’s net assets. If the shareholder were to redeem its investment in the fund, the redemption might lead to the realization of taxable capital gains.
59
Institutional Target Retirement 2055 Fund
| | | | | | |
| F. Transactions during the period in affiliated underlying Vanguard funds were as follows: | |
| | | | Current Period Transactions | |
| | Sept. 30, | | Proceeds | | | Sept. 30, |
| | 2015 | | from | | Capital Gain | 2016 |
| | Market | Purchases | Securities | | Distributions | Market |
| | Value | at Cost | Sold | Income | Received | Value |
| | ($000) | ($000) | ($000) | ($000) | ($000) | ($000) |
| Vanguard Market Liquidity Fund | — | NA1 | NA1 | 5 | — | 746 |
| Vanguard Total Bond Market II | | | | | | |
| Index Fund | 25,919 | 86,494 | 8,080 | 1,559 | 72 | 106,412 |
| Vanguard Total International Bond | | | | | | |
| Index Fund | 11,079 | 32,561 | — | 396 | — | 45,232 |
| Vanguard Total International Stock | | | | | | |
| Index Fund | 133,894 | 385,940 | 1,539 | 10,547 | — | 546,748 |
| Vanguard Total Stock Market | | | | | | |
| Index Fund | 201,284 | 562,744 | 355 | 10,752 | — | 822,011 |
| Total | 372,176 | 1,067,739 | 9,974 | 23,259 | 72 | 1,521,149 |
| 1 Not applicable—purchases and sales are for temporary cash investment purposes. | | | |
G. Management has determined that no material events or transactions occurred subsequent to September 30, 2016, that would require recognition or disclosure in these financial statements.
60
Institutional Target Retirement 2060 Fund
Fund Profile
As of September 30, 2016
| |
| Total Fund Characteristics | |
| |
| Ticker Symbol | VILVX |
| 30-Day SEC Yield | 2.18% |
| Acquired Fund Fees and Expenses1 | 0.10% |
| |
| Allocation to Underlying Vanguard Funds | |
| Vanguard Total Stock Market Index Fund | |
| Institutional Shares | 54.1% |
| Vanguard Total International Stock Index | |
| Fund Investor Shares | 35.9 |
| Vanguard Total Bond Market II Index Fund | |
| Investor Shares | 7.0 |
| Vanguard Total International Bond Index | |
| Fund Admiral Shares | 3.0 |
1 This figure—drawn from the prospectus dated January 28, 2016—represents an estimate of the weighted average of the expense ratios and any transaction fees charged by the underlying mutual funds (the ”acquired” funds) in which the Institutional Target Retirement 2060 Fund invests. The fund does not charge any expenses or fees of its own. For the fiscal year ended September 30, 2016, the annualized acquired fund fees and expenses were 0.10%.
61
Institutional Target Retirement 2060 Fund
Performance Summary
All of the returns in this report represent past performance, which is not a guarantee of future results that may be achieved by the fund. (Current performance may be lower or higher than the performance data cited. For performance data current to the most recent month-end, visit our website at vanguard.com/performance.) Note, too, that both investment returns and principal value can fluctuate widely, so an investor’s shares, when sold, could be worth more or less than their original cost. The returns shown do not reflect taxes that a shareholder would pay on fund distributions or on the sale of fund shares.
Cumulative Performance: June 26, 2015, Through September 30, 2016
Initial Investment of $100,000,000
For a benchmark description, see the Glossary.
Mixed-Asset Target 2055+ Funds Average: Derived from data provided by Lipper, a Thomson Reuters Company.
"Since Inception" performance is calculated from the fund's inception date for both the fund and its comparative standards.
See Financial Highlights for dividend and capital gains information.
62
Institutional Target Retirement 2060 Fund
Fiscal-Year Total Returns (%): June 26, 2015, Through September 30, 2016
63
Institutional Target Retirement 2060 Fund
Financial Statements
Statement of Net Assets
As of September 30, 2016
The fund reports a complete list of its holdings in regulatory filings four times in each fiscal year, at the quarter-ends. For the second and fourth fiscal quarters, the lists appear in the fund’s semiannual and annual reports to shareholders. For the first and third fiscal quarters, the fund files the lists with the Securities and Exchange Commission on Form N-Q. Shareholders can look up the fund’s Forms N-Q on the SEC’s website at sec.gov. Forms N-Q may also be reviewed and copied at the SEC’s Public Reference Room (see the back cover of this report for further information).
| | |
| | | Market |
| | | Value• |
| | Shares | ($000) |
| Investment Companies (99.5%) | | |
| U.S. Stock Fund (53.9%) | | |
| Vanguard Total Stock Market Index Fund Institutional Shares | 3,324,071 | 180,198 |
| International Stock Fund (35.7%) | | |
| Vanguard Total International Stock Index Fund Investor Shares | 7,896,346 | 119,551 |
| U.S. Bond Fund (6.9%) | | |
| 1 Vanguard Total Bond Market II Index Fund Investor Shares | 2,099,631 | 23,180 |
| International Bond Fund (3.0%) | | |
| Vanguard Total International Bond Index Fund Admiral Shares | 443,267 | 9,902 |
| Total Investment Companies (Cost $318,810) | | 332,831 |
| Temporary Cash Investment (0.1%) | | |
| Money Market Fund (0.1%) | | |
| 1 Vanguard Market Liquidity Fund, 0.640% (Cost $410) | 4,102 | 410 |
| Total Investments (99.6%) (Cost $319,220) | | 333,241 |
| Other Assets and Liabilities (0.4%) | | |
| Other Assets | | 3,687 |
| Liabilities | | (2,431) |
| | | 1,256 |
| Net Assets (100%) | | |
| Applicable to 16,641,240 outstanding $.001 par value shares of | | |
| beneficial interest (unlimited authorization) | | 334,497 |
| Net Asset Value Per Share | | $20.10 |
64
| |
| Institutional Target Retirement 2060 Fund | |
| |
| |
| |
| |
| | Amount |
| | ($000) |
| Statement of Assets and Liabilities | |
| Assets | |
| Investments in Securities, at Value—Affiliated Vanguard Funds | 333,241 |
| Receivables for Investment Securities Sold | 997 |
| Receivables for Accrued Income | 91 |
| Receivables for Capital Shares Issued | 2,599 |
| Total Assets | 336,928 |
| Liabilities | |
| Payables for Investment Securities Purchased | 594 |
| Payables for Capital Shares Redeemed | 1,837 |
| Total Liabilities | 2,431 |
| Net Assets | 334,497 |
| |
| |
| At September 30, 2016, net assets consisted of: | |
| | Amount |
| | ($000) |
| Paid-in Capital | 316,177 |
| Undistributed Net Investment Income | 4,304 |
| Accumulated Net Realized Losses | (5) |
| Unrealized Appreciation (Depreciation) | 14,021 |
| Net Assets | 334,497 |
• See Note A in Notes to Financial Statements.
1 Affiliated fund available only to Vanguard funds and certain trusts and accounts managed by Vanguard. Rate shown for Vanguard Market
Liquidity Fund is the 7-day yield.
See accompanying Notes, which are an integral part of the Financial Statements.
65
| |
| Institutional Target Retirement 2060 Fund | |
| |
| |
| Statement of Operations | |
| |
| | Year Ended |
| | September 30, 2016 |
| | ($000) |
| Investment Income | |
| Income | |
| Income Distributions Received from Affiliated Funds | 5,186 |
| Other Income | 39 |
| Net Investment Income—Note B | 5,225 |
| Realized Net Gain (Loss) | |
| Capital Gain Distributions Received from Affiliated Funds | 16 |
| Affiliated Investment Securities Sold | (12) |
| Realized Net Gain (Loss) | 4 |
| Change in Unrealized Appreciation (Depreciation) of Investment Securities | 20,526 |
| Net Increase (Decrease) in Net Assets Resulting from Operations | 25,755 |
See accompanying Notes, which are an integral part of the Financial Statements.
66
| | |
| Institutional Target Retirement 2060 Fund | | |
| |
| |
| Statement of Changes in Net Assets | | |
| |
| | | June 26, |
| | Year Ended | 20151 to |
| | September 30, | Sept. 30, |
| | 2016 | 2015 |
| | ($000) | ($000) |
| Increase (Decrease) in Net Assets | | |
| Operations | | |
| Net Investment Income | 5,225 | 393 |
| Realized Net Gain (Loss) | 4 | (1) |
| Change in Unrealized Appreciation (Depreciation) | 20,526 | (6,505) |
| Net Increase (Decrease) in Net Assets Resulting from Operations | 25,755 | (6,113) |
| Distributions | | |
| Net Investment Income | (1,314) | — |
| Realized Capital Gain 2 | (8) | — |
| Total Distributions | (1,322) | — |
| Capital Share Transactions | | |
| Issued | 244,013 | 103,763 |
| Issued in Lieu of Cash Distributions | 1,322 | — |
| Redeemed | (30,040) | (2,881) |
| Net Increase (Decrease) from Capital Share Transactions | 215,295 | 100,882 |
| Total Increase (Decrease) | 239,728 | 94,769 |
| Net Assets | | |
| Beginning of Period | 94,769 | — |
| End of Period3 | 334,497 | 94,769 |
| 1 | Inception. |
| 2 | Includes fiscal 2016 and 2015 short-term gain distributions totaling $8,000 and $0, respectively. Short-term gain distributions are treated as ordinary income dividends for tax purposes. |
| 3 | Net Assets—End of Period includes undistributed (overdistributed) net investment income of $4,304,000 and $393,000. |
See accompanying Notes, which are an integral part of the Financial Statements.
67
| | |
| Institutional Target Retirement 2060 Fund | | |
| |
| |
| Financial Highlights | | |
| |
| | Year | June 26, |
| | Ended | 20151 to |
| | Sept. 30, | Sept. 30, |
| For a Share Outstanding Throughout Each Period | 2016 | 2015 |
| Net Asset Value, Beginning of Period | $18.07 | $20.00 |
| Investment Operations | | |
| Net Investment Income | . 466 2 | .1352 |
| Capital Gain Distributions Received | .0012 | — |
| Net Realized and Unrealized Gain (Loss) on Investments | 1.729 | (2.065) |
| Total from Investment Operations | 2.196 | (1.930) |
| Distributions | | |
| Dividends from Net Investment Income | (.165) | — |
| Distributions from Realized Capital Gains | (.001) | — |
| Total Distributions | (.166) | — |
| Net Asset Value, End of Period | $20.10 | $18.07 |
| |
| Total Return | 12.21% | -9.65% |
| |
| Ratios/Supplemental Data | | |
| Net Assets, End of Period (Millions) | $334 | $95 |
| Ratio of Total Expenses to Average Net Assets | — | — |
| Acquired Fund Fees and Expenses | 0.10% | 0.10%3 |
| Ratio of Net Investment Income to Average Net Assets | 2.45% | 2.53%3 |
| Portfolio Turnover Rate | 4% | 4% |
| 1 | Inception. |
| 2 | Calculated based on average shares outstanding. |
| 3 | Annualized. |
See accompanying Notes, which are an integral part of the Financial Statements.
68
Institutional Target Retirement 2060 Fund
Notes to Financial Statements
Vanguard Institutional Target Retirement 2060 Fund is registered under the Investment Company Act of 1940 as an open-end investment company, or mutual fund. The fund follows a balanced investment strategy by investing in selected Vanguard funds to achieve its targeted allocation of assets to U.S. and international stocks, and U.S. and international bonds. Financial statements and other information about each underlying fund are available on vanguard.com.
A. The following significant accounting policies conform to generally accepted accounting principles for U.S. investment companies. The fund consistently follows such policies in preparing its financial statements.
1. Security Valuation: Investments are valued at the net asset value of each underlying Vanguard fund determined as of the close of the New York Stock Exchange (generally 4 p.m., Eastern time) on the valuation date.
2. Federal Income Taxes: The fund intends to qualify as a regulated investment company and distribute all of its taxable income. Management has analyzed the fund’s tax positions taken for all open federal income tax years (September 30, 2015–2016), and has concluded that no provision for federal income tax is required in the fund’s financial statements.
3. Distributions: Distributions to shareholders are recorded on the ex-dividend date.
4. Credit Facility: The fund and certain other funds managed by The Vanguard Group (“Vanguard”) participate in a $3.1 billion committed credit facility provided by a syndicate of lenders pursuant to a credit agreement that may be renewed annually; each fund is individually liable for its borrowings, if any, under the credit facility. Borrowings may be utilized for temporary and emergency purposes, and are subject to the fund’s regulatory and contractual borrowing restrictions. The participating funds are charged administrative fees and an annual commitment fee of 0.10% of the undrawn amount of the facility; these fees are allocated to the funds based on a method approved by the fund’s board of trustees and borne by the funds in which the fund invests (see Note B). Any borrowings under this facility bear interest at a rate based upon the higher of the one-month London Interbank Offered Rate, federal funds effective rate, or overnight bank funding rate plus an agreed-upon spread.
The fund had no borrowings outstanding at September 30, 2016, or at any time during the period then ended.
5. Other: Income and capital gain distributions received are recorded on the ex-dividend date. Security transactions are accounted for on the date securities are bought or sold. Costs used to determine realized gains (losses) on the sale of investment securities are those of the specific securities sold.
B. In accordance with the terms of a Funds’ Service Agreement (the “FSA”) between Vanguard and the fund, Vanguard furnishes to the fund investment advisory, corporate management, administrative, marketing, and distribution services at Vanguard’s cost of operations (as defined by the FSA). These costs of operations are allocated to the fund based on methods and guidelines approved by the board of trustees. The FSA provides that expenses otherwise allocable to Vanguard funds-of-funds may be reduced or eliminated to the extent of savings realized by the underlying Vanguard funds by virtue of being part of a fund-of-funds. Accordingly, all expenses for services provided by Vanguard to the fund and all other expenses incurred by the fund during the period ended September 30, 2016, were borne by the underlying Vanguard funds in which the fund invests. The fund’s trustees and officers are also trustees and officers, respectively, of the underlying Vanguard funds, as well as directors and employees, respectively, of Vanguard.
69
Institutional Target Retirement 2060 Fund
C. Various inputs may be used to determine the value of the fund’s investments. These inputs are summarized in three broad levels for financial statement purposes. The inputs or methodologies used to value securities are not necessarily an indication of the risk associated with investing in those securities.
Level 1—Quoted prices in active markets for identical securities.
Level 2—Other significant observable inputs (including quoted prices for similar securities, interest rates, prepayment speeds, credit risk, etc.).
Level 3—Significant unobservable inputs (including the fund’s own assumptions used to determine the fair value of investments).
At September 30, 2016, 100% of the market value of the fund’s investments was determined based on Level 1 inputs.
D. Distributions are determined on a tax basis and may differ from net investment income and realized capital gains for financial reporting purposes. Differences may be permanent or temporary. Permanent differences are reclassified among capital accounts in the financial statements to reflect their tax character. Temporary differences arise when certain items of income, expense, gain, or loss are recognized in different periods for financial statement and tax purposes. These differences will reverse at some time in the future. Differences in classification may also result from the treatment of short-term gains as ordinary income for tax purposes.
For tax purposes, at September 30, 2016, the fund had $4,304,000 of ordinary income available for distribution. The fund had available capital losses totaling $5,000 that may be carried forward indefinitely to offset future net capital gains.
At September 30, 2016, the cost of investment securities for tax purposes was $319,220,000. Net unrealized appreciation of investment securities for tax purposes was $14,021,000, consisting entirely of unrealized gains on securities that had risen in value since their purchase.
| | |
| E. Capital shares issued and redeemed were: | | |
| | Year Ended | June 26, 20151 to |
| | September 30, 2016 | September 30, 2015 |
| | Shares | Shares |
| | (000) | (000) |
| Issued | 12,908 | 5,395 |
| Issued in Lieu of Cash Distributions | 70 | — |
| Redeemed | (1,581) | (151) |
| Net Increase (Decrease) in Shares Outstanding | 11,397 | 5,244 |
| 1 Inception. | | |
At September 30, 2016, one shareholder was the record or beneficial owner of 28% of the fund’s net assets. If the shareholder were to redeem its investment in the fund, the redemption might result in an increase in the fund’s expense ratio, cause the fund to incur higher transaction costs, or lead to the realization of taxable capital gains.
70
Institutional Target Retirement 2060 Fund
| | | | | | |
| F. Transactions during the period in affiliated underlying Vanguard funds were as follows: | |
| | | | Current Period Transactions | |
| | Sept. 30, | | Proceeds | | | Sept. 30, |
| | 2015 | | from | | Capital Gain | 2016 |
| | Market | Purchases | Securities | Dividend Distributions | Market |
| | Value | at Cost | Sold | Income | Received | Value |
| | ($000) | ($000) | ($000) | ($000) | ($000) | ($000) |
| Vanguard Market Liquidity Fund | 133 | NA1 | NA1 | 2 | — | 410 |
| Vanguard Total Bond Market II | | | | | | |
| Index Fund | 6,596 | 19,175 | 3,049 | 351 | 16 | 23,180 |
| Vanguard Total International Bond | | | | | | |
| Index Fund | 2,816 | 7,145 | 415 | 90 | — | 9,902 |
| Vanguard Total International Stock | | | | | | |
| Index Fund | 34,059 | 81,682 | 2,570 | 2,340 | — | 119,551 |
| Vanguard Total Stock Market | | | | | | |
| Index Fund | 51,191 | 118,089 | 2,402 | 2,403 | — | 180,198 |
| Total | 94,795 | 226,091 | 8,436 | 5,186 | 16 | 333,241 |
| 1 Not applicable--purchases and sales are for temporary cash investment purposes. | | | |
G. Management has determined that no material events or transactions occurred subsequent to September 30, 2016, that would require recognition or disclosure in these financial statements.
71
Report of Independent Registered Public Accounting Firm
To the Board of Trustees of Vanguard Chester Funds and the Shareholders of Vanguard Institutional Target Retirement 2035 Fund, Vanguard Institutional Target Retirement 2040 Fund, Vanguard Institutional Target Retirement 2045 Fund, Vanguard Institutional Target Retirement 2050 Fund, Vanguard Institutional Target Retirement 2055 Fund and Vanguard Institutional Target Retirement 2060 Fund: In our opinion, the accompanying statements of net assets and statements of assets and liabilities, and the related statements of operations and of changes in net assets and the financial highlights present fairly, in all material respects, the financial position of Vanguard Institutional Target Retirement 2035 Fund, Vanguard Institutional Target Retirement 2040 Fund, Vanguard Institutional Target Retirement 2045 Fund, Vanguard Institutional Target Retirement 2050 Fund, Vanguard Institutional Target Retirement 2055 Fund and Vanguard Institutional Target Retirement 2060 Fund (constituting separate portfolios of Vanguard Chester Funds, hereafter referred to as the “Funds”) at September 30, 2016, and the results of each of their operations for the year then ended, and the changes in each of their net assets and the financial highlights for the periods indicated, in conformity with accounting principles generally accepted in the United States of America. These financial statements and financial highlights (hereafter referred to as “financial statements”) are the responsibility of the Funds’ management.
Our responsibility is to express an opinion on these financial statements based on our audits. We conducted our audits of these financial statements in accordance with the standards of the Public Company Accounting Oversight Board (United States). Those standards require that we plan and perform the audit to obtain reasonable assurance about whether the financial statements are free of material misstatement. An audit includes examining, on a test basis, evidence supporting the amounts and disclosures in the financial statements, assessing the accounting principles used and significant estimates made by management, and evaluating the overall financial statement presentation. We believe that our audits, which included confirmation of securities at September 30, 2016 by agreement to the underlying ownership records of the transfer agent, provide a reasonable basis for our opinion.
/s/PricewaterhouseCoopers LLP
Philadelphia, Pennsylvania
November 15, 2016
Special 2016 tax information (unaudited) for Vanguard Institutional Target Retirement Funds
This information for the fiscal year ended September 30, 2016, is included pursuant to provisions of the Internal Revenue Code.
The funds distributed capital gain dividends (from net long-term capital gains) to shareholders during the fiscal year as follows:
| |
| Fund | ($000) |
| Institutional Target Retirement 2035 | 10 |
| Institutional Target Retirement 2040 | 5 |
| Institutional Target Retirement 2045 | 3 |
| Institutional Target Retirement 2050 | 2 |
| Institutional Target Retirement 2055 | — |
| Institutional Target Retirement 2060 | — |
72
For nonresident alien shareholders, 100% of short-term capital gain dividends distributed by the Institutional Target Retirement 2055 and Institutional Target Retirement 2060 Funds are qualified short-term capital gains.
The funds distributed qualified dividend income to shareholders during the fiscal year as follows:
| |
| Fund | ($000) |
| Institutional Target Retirement 2035 | 39,526 |
| Institutional Target Retirement 2040 | 33,711 |
| Institutional Target Retirement 2045 | 26,189 |
| Institutional Target Retirement 2050 | 14,503 |
| Institutional Target Retirement 2055 | 4,383 |
| Institutional Target Retirement 2060 | 1,033 |
For corporate shareholders, the percentage of investment income (dividend income plus short-term gains, if any) that qualifies for the dividends-received deduction is as follows:
| |
| Fund | Percentage |
| Institutional Target Retirement 2035 | 37.4% |
| Institutional Target Retirement 2040 | 40.3 |
| Institutional Target Retirement 2045 | 40.9 |
| Institutional Target Retirement 2050 | 40.9 |
| Institutional Target Retirement 2055 | 40.8 |
| Institutional Target Retirement 2060 | 40.7 |
The funds designate to shareholders foreign source income and foreign taxes paid as follows:
| | |
| | Foreign Source Income | Foreign Taxes Paid |
| Fund | ($000) | ($000) |
| Institutional Target Retirement 2035 | 81,820 | 4,937 |
| Institutional Target Retirement 2040 | 69,999 | 4,353 |
| Institutional Target Retirement 2045 | 55,477 | 3,467 |
| Institutional Target Retirement 2050 | 33,064 | 2,068 |
| Institutional Target Retirement 2055 | 10,890 | 683 |
| Institutional Target Retirement 2060 | 2,420 | 151 |
Shareholders will receive more detailed information with their Form 1099-DIV in January 2017 to determine the calendar-year amounts to be included on their 2016 tax returns.
73
About Your Fund’s Expenses
As a shareholder of the fund, you incur ongoing costs, which include costs for portfolio management, administrative services, and shareholder reports (like this one), among others. Operating expenses, which are deducted from a fund’s gross income, directly reduce the investment return of the fund.
A typical fund’s expenses are expressed as a percentage of its average net assets. The Institutional Target Retirement Funds have no direct expenses, but each fund bears its proportionate share of the costs for the underlying funds in which it invests. These indirect expenses make up the acquired fund fees and expenses, also expressed as a percentage of average net assets.
The following examples are intended to help you understand the ongoing cost (in dollars) of investing in your fund and to compare these costs with those of other mutual funds. The examples are based on an investment of $1,000 made at the beginning of the period shown and held for the entire period. The costs were calculated using the acquired fund fees and expenses for each Institutional Target Retirement Fund.
The accompanying table illustrates your fund’s costs in two ways:
• Based on actual fund return. This section helps you to estimate the actual expenses that you paid over the period. The ”Ending Account Value“ shown is derived from the fund‘s actual return, and the third column shows the dollar amount that would have been paid by an investor who started with $1,000 in the fund. You may use the information here, together with the amount you invested, to estimate the expenses that you paid over the period.
To do so, simply divide your account value by $1,000 (for example, an $8,600 account value divided by $1,000 = 8.6), then multiply the result by the number given for your fund under the heading ”Expenses Paid During Period.“
• Based on hypothetical 5% yearly return. This section is intended to help you compare your fund‘s costs with those of other mutual funds. It assumes that the fund had a yearly return of 5% before expenses, but that the expense ratio is unchanged. In this case—because the return used is not the fund’s actual return—the results do not apply to your investment. The example is useful in making comparisons because the Securities and Exchange Commission requires all mutual funds to calculate expenses based on a 5% return. You can assess your fund’s costs by comparing this hypothetical example with the hypothetical examples that appear in shareholder reports of other funds.
Note that the expenses shown in the table are meant to highlight and help you compare ongoing costs only and do not reflect transaction costs incurred by the fund for buying and selling securities. Further, the expenses do not include any purchase, redemption, or account service fees described in the fund prospectus. If such fees were applied to your account, your costs would be higher. Your fund does not carry a “sales load.”
The calculations assume no shares were bought or sold during the period. Your actual costs may have been higher or lower, depending on the amount of your investment and the timing of any purchases or redemptions.
You can find more information about the fund’s expenses, including annual expense ratios, in the Financial Statements section of this report. For additional information on operating expenses and other shareholder costs, please refer to your fund’s current prospectus.
74
| | | |
| Six Months Ended September 30, 2016 | | | |
| | Beginning | Ending | Expenses |
| | Account Value | Account Value | Paid During |
| | 3/31/2016 | 9/30/2016 | Period |
| Based on Actual Fund Return | | | |
| Institutional Target Retirement 2035 Fund | $1,000.00 | $1,063.06 | $0.52 |
| Institutional Target Retirement 2040 Fund | $1,000.00 | $1,066.31 | $0.52 |
| Institutional Target Retirement 2045 Fund | $1,000.00 | $1,067.41 | $0.52 |
| Institutional Target Retirement 2050 Fund | $1,000.00 | $1,066.84 | $0.52 |
| Institutional Target Retirement 2055 Fund | $1,000.00 | $1,066.84 | $0.52 |
| Institutional Target Retirement 2060 Fund | $1,000.00 | $1,067.45 | $0.52 |
| Based on Hypothetical 5% Yearly Return | | | |
| Institutional Target Retirement 2035 Fund | $1,000.00 | $1,024.50 | $0.51 |
| Institutional Target Retirement 2040 Fund | $1,000.00 | $1,024.50 | $0.51 |
| Institutional Target Retirement 2045 Fund | $1,000.00 | $1,024.50 | $0.51 |
| Institutional Target Retirement 2050 Fund | $1,000.00 | $1,024.50 | $0.51 |
| Institutional Target Retirement 2055 Fund | $1,000.00 | $1,024.50 | $0.51 |
| Institutional Target Retirement 2060 Fund | $1,000.00 | $1,024.50 | $0.51 |
The calculations are based on the acquired fund fees and expenses for the most recent six-month period. The funds’ annualized expense figures for that period are (in order as listed from top to bottom above) 0.10%, 0.10%, 0.10%, 0.10%, 0.10%, and 0.10%. The dollar amounts shown as ”Expenses Paid” are equal to the annualized expense figures for the underlying funds multiplied by the average account value over the period, multiplied by the number of days in the most recent six-month period, then divided by the number of days in the most recent 12-month period (183/366).
75
Glossary
30-Day SEC Yield. A fund’s 30-day SEC yield is derived using a formula specified by the U.S. Securities and Exchange Commission. Under the formula, data related to the fund’s security holdings in the previous 30 days are used to calculate the fund’s hypothetical net income for that period, which is then annualized and divided by the fund’s estimated average net assets over the calculation period. For the purposes of this calculation, a security’s income is based on its current market yield to maturity (for bonds), its actual income (for asset-backed securities), or its projected dividend yield (for stocks). Because the SEC yield represents hypothetical annualized income, it will differ—at times significantly—from the fund’s actual experience. As a result, the fund’s income distributions may be higher or lower than implied by the SEC yield.
Acquired Fund Fees and Expenses. Funds that invest in other Vanguard funds incur no direct expenses, but they do bear proportionate shares of the operating, administrative, and advisory expenses of the underlying funds, and they must pay any fees charged by those funds. The figure for acquired fund fees and expenses represents a weighted average of these underlying costs.
Acquired is a term that the Securities and Exchange Commission applies to any mutual fund whose shares are owned by another fund.
Expense Ratio. A fund’s total annual operating expenses expressed as a percentage of the fund’s average net assets. The expense ratio includes management and administrative expenses, but does not include the transaction costs of buying and selling portfolio securities.
Inception Date. The date on which the assets of a fund (or one of its share classes) are first invested in accordance with the fund’s investment objective. For funds with a subscription period, the inception date is the day after that period ends. Investment performance is measured from the inception date.
Benchmark Information
Target 2035 Composite Index: Derived by applying the fund’s target asset allocation to the results of the following benchmarks: for international stocks of developed markets, the MSCI EAFE Index through December 15, 2010, the MSCI ACWI ex USA IMI Index through June 2, 2013, and the FTSE Global All Cap ex US Index thereafter; for emerging-market stocks, the Select Emerging Markets Index through August 23, 2006, the MSCI Emerging Markets Index through December 15, 2010, the MSCI ACWI ex USA IMI Index through June 2, 2013, and the FTSE Global All Cap ex US Index thereafter; for U.S. bonds, the Bloomberg Barclays U.S. Aggregate Bond Index through December 31, 2009, and the Bloomberg Barclays U.S. Aggregate Float Adjusted Index thereafter; for international bonds, the Bloomberg Barclays Global Aggregate ex-USD Float Adjusted RIC Capped Index beginning June 3, 2013; and for U.S. stocks, the Dow Jones U.S. Total Stock Market Index (formerly known as the Dow Jones Wilshire 5000 Index) through April 22, 2005, the MSCI US Broad Market Index through June 2, 2013, and the CRSP US Total Market Index thereafter. International stock benchmark returns are adjusted for withholding taxes.
76
Target 2040 Composite Index: Derived by applying the fund’s target asset allocation to the results of the following benchmarks: for international stocks of developed markets, the MSCI EAFE Index through December 15, 2010, the MSCI ACWI ex USA IMI Index through June 2, 2013, and the FTSE Global All Cap ex US Index thereafter; for emerging-market stocks, the Select Emerging Markets Index through August 23, 2006, the MSCI Emerging Markets Index through December 15, 2010, the MSCI ACWI ex USA IMI Index through June 2, 2013, and the FTSE Global All Cap ex US Index thereafter; for U.S. bonds, the Bloomberg Barclays U.S. Aggregate Bond Index through December 31, 2009, and the Bloomberg Barclays U.S. Aggregate Float Adjusted Index thereafter; for international bonds, the Bloomberg Barclays Global Aggregate ex-USD Float Adjusted RIC Capped Index beginning June 3, 2013; and for U.S. stocks, the MSCI US Broad Market Index through June 2, 2013, and the CRSP US Total Market Index thereafter. International stock benchmark returns are adjusted for withholding taxes.
Target 2045 Composite Index: Derived by applying the fund’s target asset allocation to the results of the following benchmarks: for international stocks of developed markets, the MSCI EAFE Index through December 15, 2010, the MSCI ACWI ex USA IMI Index through June 2, 2013, and the FTSE Global All Cap ex US Index thereafter; for emerging-market stocks, the Select Emerging Markets Index through August 23, 2006, the MSCI Emerging Markets Index through December 15, 2010, the MSCI ACWI ex USA IMI Index through June 2, 2013, and the FTSE Global All Cap ex US Index thereafter; for U.S. bonds, the Bloomberg Barclays U.S. Aggregate Bond Index through December 31, 2009, and the Bloomberg Barclays U.S. Aggregate Float Adjusted Index thereafter; for international bonds, the Bloomberg Barclays Global Aggregate ex-USD Float Adjusted RIC Capped Index beginning June 3, 2013; and for U.S. stocks, the Dow Jones U.S. Total Stock Market Index (formerly known as the Dow Jones Wilshire 5000 Index) through April 22, 2005, the MSCI US Broad Market Index through June 2, 2013, and the CRSP US Total Market Index thereafter. International stock benchmark returns are adjusted for withholding taxes.
Target 2050 Composite Index: Derived by applying the fund’s target asset allocation to the results of the following benchmarks: for international stocks of developed markets, the MSCI EAFE Index through December 15, 2010, the MSCI ACWI ex USA IMI Index through June 2, 2013, and the FTSE Global All Cap ex US Index thereafter; for emerging-market stocks, the Select Emerging Markets Index through August 23, 2006, the MSCI Emerging Markets Index through December 15, 2010, the MSCI ACWI ex USA IMI Index through June 2, 2013, and the FTSE Global All Cap ex US Index thereafter; for U.S. bonds, the Bloomberg Barclays U.S. Aggregate Bond Index through December 31, 2009, and the Bloomberg Barclays U.S. Aggregate Float Adjusted Index thereafter; for international bonds, the Bloomberg Barclays Global Aggregate ex-USD Float Adjusted RIC Capped Index beginning June 3, 2013; and for U.S. stocks, the MSCI US Broad Market Index through June 2, 2013, and the CRSP US Total Market Index thereafter. International stock benchmark returns are adjusted for withholding taxes.
77
Target 2055 Composite Index: Derived by applying the fund’s target asset allocation to the results of the following benchmarks: for international stocks of developed markets, the MSCI EAFE Index through December 15, 2010, the MSCI ACWI ex USA IMI Index through June 2, 2013, and the FTSE Global All Cap ex US Index thereafter; for emerging-market stocks, the MSCI Emerging Markets Index through December 15, 2010, the MSCI ACWI ex USA IMI Index through June 2, 2013, and the FTSE Global All Cap ex US Index thereafter; for U.S. bonds, the Bloomberg Barclays U.S. Aggregate Float Adjusted Index; for international bonds, the Bloomberg Barclays Global Aggregate ex-USD Float Adjusted RIC Capped Index beginning June 3, 2013; and for U.S. stocks, the MSCI US Broad Market Index through June 2, 2013, and the CRSP US Total Market Index thereafter. International stock benchmark returns are adjusted for withholding taxes.
Target 2060 Composite Index: Derived by applying the fund’s target asset allocation to the results of the following benchmarks: for international stocks of developed markets, the MSCI ACWI ex USA IMI Index through June 2, 2013, and the FTSE Global All Cap ex US Index thereafter; for emerging-market stocks, the MSCI ACWI ex USA IMI Index through June 2, 2013, and the FTSE Global All Cap ex US Index thereafter; for U.S. bonds, the Bloomberg Barclays U.S. Aggregate Float Adjusted Index; for international bonds, the Bloomberg Barclays Global Aggregate ex-USD Float Adjusted RIC Capped Index beginning June 3, 2013; and for U.S. stocks, the MSCI US Broad Market Index through June 2, 2013, and the CRSP US Total Market Index thereafter. International stock benchmark returns are adjusted for withholding taxes.
78
This page intentionally left blank.
The People Who Govern Your Fund
The trustees of your mutual fund are there to see that the fund is operated and managed in your best interests since, as a shareholder, you are a part owner of the fund. Your fund’s trustees also serve on the board of directors of The Vanguard Group, Inc., which is owned by the Vanguard funds and provides services to them on an at-cost basis.
A majority of Vanguard’s board members are independent, meaning that they have no affiliation with Vanguard or the funds they oversee, apart from the sizable personal investments they have made as private individuals. The independent board members have distinguished backgrounds in business, academia, and public service. Each of the trustees and executive officers oversees 198 Vanguard funds.
The following table provides information for each trustee and executive officer of the fund. The mailing address of the trustees and officers is P.O. Box 876, Valley Forge, PA 19482. More information about the trustees is in the Statement of Additional Information, which can be obtained, without charge, by contacting Vanguard at 800-662-7447, or online at vanguard.com.
InterestedTrustee1
F. William McNabb III
Born 1957. Trustee Since July 2009. Chairman of the Board. Principal Occupation(s) During the Past Five Years and Other Experience: Chairman of the Board of The Vanguard Group, Inc., and of each of the investment companies served by The Vanguard Group, since January 2010; Director of The Vanguard Group since 2008; Chief Executive Officer and President of The Vanguard Group, and of each of the investment companies served by The Vanguard Group, since 2008; Director of Vanguard Marketing Corporation; Managing Director of The Vanguard Group (1995–2008).
IndependentTrustees
Emerson U. Fullwood
Born 1948. Trustee Since January 2008. Principal Occupation(s) During the Past Five Years and Other Experience: Executive Chief Staff and Marketing Officer for North America and Corporate Vice President (retired 2008) of Xerox Corporation (document management products and services); Executive in Residence and 2009–2010 Distinguished Minett Professor at the Rochester Institute of Technology; Lead Director of SPX FLOW, Inc. (multi-industry manufacturing); Director of the United Way of Rochester, the University of Rochester Medical Center, Monroe Community College Foundation, North Carolina A&T University, and Roberts Wesleyan College.
Rajiv L. Gupta
Born 1945. Trustee Since December 2001.2 Principal Occupation(s) During the Past Five Years and Other Experience: Chairman and Chief Executive Officer (retired 2009) and President (2006–2008) of Rohm and Haas Co. (chemicals); Director of Tyco International plc (diversified manufacturing and services), HP Inc. (printer and personal computer manufacturing), and Delphi Automotive plc (automotive components); Senior Advisor at New Mountain Capital.
Amy Gutmann
Born 1949. Trustee Since June 2006. Principal Occupation(s) During the Past Five Years and Other Experience: President of the University of Pennsylvania; Christopher H. Browne Distinguished Professor of Political Science, School of Arts and Sciences, and Professor of Communication, Annenberg School for Communication, with secondary faculty appointments in the Department of Philosophy, School of Arts and Sciences, and at the Graduate School of Education, University of Pennsylvania; Trustee of the National Constitution Center; Chair of the Presidential Commission for the Study of Bioethical Issues.
JoAnn Heffernan Heisen
Born 1950. Trustee Since July 1998. Principal Occupation(s) During the Past Five Years and Other Experience: Corporate Vice President and Chief Global Diversity Officer (retired 2008) and Member of the Executive Committee (1997–2008) of Johnson & Johnson (pharmaceuticals/medical devices/consumer products); Director of Skytop Lodge Corporation (hotels) and the Robert Wood Johnson Foundation; Member of the Advisory Board of the Institute for Women’s Leadership at Rutgers University.
F. Joseph Loughrey
Born 1949. Trustee Since October 2009. Principal Occupation(s) During the Past Five Years and Other Experience: President and Chief Operating Officer (retired 2009) of Cummins Inc. (industrial machinery); Chairman of the Board of Hillenbrand, Inc. (specialized consumer services), and of Oxfam America; Director of SKF AB (industrial machinery), Hyster-Yale Materials Handling, Inc. (forklift trucks), the Lumina Foundation for Education, and the V Foundation for Cancer Research; Member of the Advisory Council for the College of Arts and Letters and of the Advisory Board to the Kellogg Institute for International Studies, both at the University of Notre Dame.
Mark Loughridge
Born 1953. Trustee Since March 2012. Principal Occupation(s) During the Past Five Years and Other Experience: Senior Vice President and Chief Financial Officer (retired 2013) at IBM (information technology services); Fiduciary Member of IBM’s Retirement Plan Committee (2004–2013); Director of the Dow Chemical Company; Member of the Council on Chicago Booth.
Scott C. Malpass
Born 1962. Trustee Since March 2012. Principal Occupation(s) During the Past Five Years and Other Experience: Chief Investment Officer and Vice President at the University of Notre Dame; Assistant Professor of Finance at the Mendoza College of Business at Notre Dame; Member of the Notre Dame 403(b) Investment Committee, the Board of Advisors for Spruceview Capital Partners, and the Investment Advisory Committee of Major League Baseball; Board Member of TIFF Advisory Services, Inc., and Catholic Investment Services, Inc. (investment advisors).
André F. Perold
Born 1952. Trustee Since December 2004. Principal Occupation(s) During the Past Five Years and Other Experience: George Gund Professor of Finance and Banking, Emeritus at the Harvard Business School (retired 2011); Chief Investment Officer and Managing Partner of HighVista Strategies LLC (private investment firm); Director of Rand Merchant Bank; Overseer of the Museum of Fine Arts Boston.
Peter F. Volanakis
Born 1955. Trustee Since July 2009. Principal Occupation(s) During the Past Five Years and Other Experience: President and Chief Operating Officer (retired 2010) of Corning Incorporated (communications equipment); Chairman of the Board of Trustees of Colby-Sawyer College; Member of the Advisory Board of the Norris Cotton Cancer Center.
Executive Officers
Glenn Booraem
Born 1967. Treasurer Since May 2015. Principal Occupation(s) During the Past Five Years and Other Experience: Principal of The Vanguard Group, Inc.; Treasurer of each of the investment companies served by The Vanguard Group; Controller of each of the investment companies served by The Vanguard Group (2010–2015); Assistant Controller of each of the investment companies served by The Vanguard Group (2001–2010).
Thomas J. Higgins
Born 1957. Chief Financial Officer Since September 2008. Principal Occupation(s) During the Past Five Years and Other Experience: Principal of The Vanguard Group, Inc.; Chief Financial Officer of each of the investment companies served by The Vanguard Group; Treasurer of each of the investment companies served by The Vanguard Group (1998–2008).
Peter Mahoney
Born 1974. Controller Since May 2015. Principal Occupation(s) During the Past Five Years and Other Experience: Head of Global Fund Accounting at The Vanguard Group, Inc.; Controller of each of the investment companies served by The Vanguard Group; Head of International Fund Services at The Vanguard Group (2008–2014).
Anne E. Robinson
Born 1970. Secretary Since September 2016. Principal Occupation(s) During the Past Five Years and Other Experience: Managing Director of The Vanguard Group, Inc.; General Counsel of The Vanguard Group; Secretary of The Vanguard Group and of each of the investment companies served by The Vanguard Group; Director and Senior Vice President of Vanguard Marketing Corporation; Managing Director and General Counsel of Global Cards and Consumer Services at Citigroup (2014–2016); Counsel at American Express (2003–2014).
Vanguard Senior Management Team
| |
Mortimer J. Buckley Kathleen C. Gubanich Martha G. King John T. Marcante Chris D. McIsaac | James M. Norris Thomas M. Rampulla Glenn W. Reed Karin A. Risi Michael Rollings |
Chairman Emeritus and Senior Advisor John J. Brennan
Chairman, 1996–2009
Chief Executive Officer and President, 1996–2008
Founder
John C. Bogle
Chairman and Chief Executive Officer, 1974–1996
1 Mr. McNabb is considered an “interested person,” as defined in the Investment Company Act of 1940, because he is an officer of the Vanguard funds.
2 December 2002 for Vanguard Equity Income Fund, the Vanguard Municipal Bond Funds, and the Vanguard State Tax-Exempt Funds.
|
| P.O. Box 2600 |
| Valley Forge, PA 19482-2600 |
Connect with Vanguard® > vanguard.com
| |
| Fund Information > 800-662-7447 | |
| Direct Investor Account Services > 800-662-2739 | |
| Institutional Investor Services > 800-523-1036 | |
| Text Telephone for People | |
| Who Are Deaf or Hard of Hearing> 800-749-7273 | |
| |
| This material may be used in conjunction | |
| with the offering of shares of any Vanguard | |
| fund only if preceded or accompanied by | |
| the fund’s current prospectus. | |
| |
| All comparative mutual fund data are from Lipper, a | |
| Thomson Reuters Company, or Morningstar, Inc., unless | |
| otherwise noted. | |
| |
| You can obtain a free copy of Vanguard’s proxy voting | |
| guidelines by visiting vanguard.com/proxyreporting or by | |
| calling Vanguard at 800-662-2739. The guidelines are | |
| also available from the SEC’s website, sec.gov. In | |
| addition, you may obtain a free report on how your fund | |
| voted the proxies for securities it owned during the 12 | |
| months ended June 30. To get the report, visit either | |
| vanguard.com/proxyreporting or sec.gov. | |
| |
| You can review and copy information about your fund at | |
| the SEC’s Public Reference Room in Washington, D.C. To | |
| find out more about this public service, call the SEC at | |
| 202-551-8090. Information about your fund is also | |
| available on the SEC’s website, and you can receive | |
| copies of this information, for a fee, by sending a | |
| request in either of two ways: via email addressed to | |
| publicinfo@sec.gov or via regular mail addressed to the | |
| Public Reference Section, Securities and Exchange | |
| Commission, Washington, DC 20549-1520. | |
| |
| | © 2016 The Vanguard Group, Inc. |
| | All rights reserved. |
| | Vanguard Marketing Corporation, Distributor. |
| |
| | Q6730B 112016 |
Item 2: Code of Ethics. The Registrant has adopted a code of ethics that applies to the Registrant’s principal executive officer, principal financial officer, principal accounting officer or controller or persons performing similar functions. The Code of Ethics was amended during the reporting period covered by this report to make certain technical, non-material changes.
Item 3: Audit Committee Financial Expert. All members of the Audit Committee have been determined by the Registrant’s Board of Trustees to be Audit Committee Financial Experts and to be independent: Rajiv L. Gupta, JoAnn Heffernan Heisen, F. Joseph Loughrey, Mark Loughridge, and Peter F. Volanakis.
Item 4: Principal Accountant Fees and Services.
(a) Audit Fees.
Audit Fees of the Registrant
Fiscal Year Ended September 30, 2016: $35,000
Fiscal Year Ended September 30, 2015: $737,000
Aggregate Audit Fees of Registered Investment Companies in the Vanguard Group.
Fiscal Year Ended September 30, 2016: $9,629,849
Fiscal Year Ended September 30, 2015: $7,000,200
Includes fees billed in connection with audits of the Registrant, other registered investment companies in the Vanguard complex, The Vanguard Group, Inc. and Vanguard Marketing Corporation.
(b) Audit-Related Fees.
Fiscal Year Ended September 30, 2016: $2,717,627
Fiscal Year Ended September 30, 2015: $2,899,096
Includes fees billed in connection with assurance and related services provided to the Registrant, other registered investment companies in the Vanguard complex, The Vanguard Group, Inc., and Vanguard Marketing Corporation.
(c) Tax Fees.
Fiscal Year Ended September 30, 2016: $254,050
Fiscal Year Ended September 30, 2015: $353,389
Includes fees billed in connection with tax compliance, planning, and advice services provided to the Registrant, other registered investment companies in the Vanguard complex, The Vanguard Group, Inc., and Vanguard Marketing Corporation.
(d) All Other Fees.
Fiscal Year Ended September 30, 2016: $214,225
Fiscal Year Ended September 30, 2015: $202,313
Includes fees billed for services related to tax reported information provided to the Registrant, other registered investment companies in the Vanguard complex, The Vanguard Group, Inc., and Vanguard Marketing Corporation.
(e) (1) Pre-Approval Policies. The policy of the Registrant’s Audit Committee is to consider and, if appropriate, approve before the principal accountant is engaged for such services, all specific audit and non-audit services provided to: the Registrant, other registered investment companies in the Vanguard complex, The Vanguard Group, Inc., and entities controlled by The Vanguard Group, Inc. that provide ongoing services to the Registrant. In making a determination, the Audit Committee considers whether the services are consistent with maintaining the principal accountant’s independence.
In the event of a contingency situation in which the principal accountant is needed to provide services in between scheduled Audit Committee meetings, the Chairman of the Audit Committee would be called on to consider and, if appropriate, pre-approve audit or permitted non-audit services in an amount sufficient to complete services through the next Audit Committee meeting, and to determine if such services would be consistent with maintaining the accountant’s independence. At the next scheduled Audit Committee meeting, services and fees would be presented to the Audit Committee for formal consideration, and, if appropriate, approval by the entire Audit Committee. The Audit Committee would again consider whether such services and fees are consistent with maintaining the principal accountant’s independence.
The Registrant’s Audit Committee is informed at least annually of all audit and non-audit services provided by the principal accountant to the Vanguard complex, whether such services are provided to: the Registrant, other registered investment companies in the Vanguard complex, The Vanguard Group, Inc., or other entities controlled by The Vanguard Group, Inc. that provide ongoing services to the Registrant.
(2) No percentage of the principal accountant’s fees or services were approved pursuant to the waiver provision of paragraph (c)(7)(i)(C) of Rule 2-01 of Regulation S-X.
(f) For the most recent fiscal year, over 50% of the hours worked under the principal accountant’s engagement were not performed by persons other than full-time, permanent employees of the principal accountant.
(g) Aggregate Non-Audit Fees.
Fiscal Year Ended September 30, 2016: $468,275
Fiscal Year Ended September 30, 2015: $555,702
Includes fees billed for non-audit services provided to the Registrant, other registered investment companies in the Vanguard complex, The Vanguard Group, Inc., and Vanguard Marketing Corporation.
(h) For the most recent fiscal year, the Audit Committee has determined that the provision of all non-audit services was consistent with maintaining the principal accountant’s independence.
Item 5: Audit Committee of Listed Registrants.
Not Applicable.
Item 6: Investments.
Not Applicable.
Item 7: Disclosure of Proxy Voting Policies and Procedures for Closed-End Management Investment Companies.
Not Applicable.
Item 8: Portfolio Managers of Closed-End Management Investment Companies.
Not Applicable.
Item 9: Purchase of Equity Securities by Closed-End Management Investment Company and Affiliated Purchasers.
Not Applicable.
Item 10: Submission of Matters to a Vote of Security Holders.
Not Applicable.
Item 11: Controls and Procedures.
(a) Disclosure Controls and Procedures. The Principal Executive and Financial Officers concluded that the Registrant’s Disclosure Controls and Procedures are effective based on their evaluation of the Disclosure Controls and Procedures as of a date within 90 days of the filing date of this report.
(b) Internal Control Over Financial Reporting. There were no significant changes in Registrant’s Internal Control Over Financial Reporting or in other factors that could significantly affect this control subsequent to the date of the evaluation, including any corrective actions with regard to significant deficiencies and material weaknesses.
Item 12: Exhibits.
(a) Code of Ethics.
(b) Certifications.
Pursuant to the requirements of the Securities Exchange Act of 1934 and the Investment Company Act of 1940, the registrant has duly caused this report to be signed on its behalf by the undersigned, thereunto duly authorized.
| |
| | VANGUARD CHESTER FUNDS |
| |
| By: | /s/ F. WILLIAM MCNABB III* |
| | F. WILLIAM MCNABB III |
| | CHIEF EXECUTIVE OFFICER |
| |
| Date: November 17, 2016 |
Pursuant to the requirements of the Securities Exchange Act of 1934 and the Investment Company Act of 1940, this report has been signed below by the following persons on behalf of the registrant and in the capacities and on the dates indicated.
| |
| | VANGUARD CHESTER FUNDS |
| |
| By: | /s/ F. WILLIAM MCNABB III* |
| | F. WILLIAM MCNABB III |
| | CHIEF EXECUTIVE OFFICER |
| |
| Date: November 17, 2016 |
| |
| | VANGUARD CHESTER FUNDS |
| |
| By: | /s/ THOMAS J. HIGGINS* |
| | THOMAS J. HIGGINS |
| | CHIEF FINANCIAL OFFICER |
| |
| Date: November 17, 2016 |
* By: /s/ Anne E. Robinson
Anne E. Robinson, pursuant to a Power of Attorney filed on October 4, 2016 see file Number 33-32548, Incorporated by Reference.