UNITED STATES
SECURITIES AND EXCHANGE COMMISSION
Washington, D.C. 20549
FORM N-CSR
CERTIFIED SHAREHOLDER REPORT OF
REGISTERED MANAGEMENT INVESTMENT COMPANIES
Investment Company Act file number: 811-04098
Name of Registrant: Vanguard Chester Funds
Address of Registrant:
P.O. Box 2600
Valley Forge, PA 19482
Name and address of agent for service:
Heidi Stam, Esquire
P.O. Box 876
Valley Forge, PA 19482
Registrant’s telephone number, including area code: (610) 669-1000
Date of fiscal year end: September 30
Date of reporting period: October 1, 2012 – September 30, 2013
Item 1: Reports to Shareholders

Annual Report | September 30, 2013
Vanguard PRIMECAP Fund

Vanguard’s Principles for Investing Success
We want to give you the best chance of investment success. These principles, grounded in Vanguard’s research and experience, can put you on the right path.
Goals. Create clear, appropriate investment goals.
Balance. Develop a suitable asset allocation using broadly diversified funds. Cost. Minimize cost.
Discipline. Maintain perspective and long-term discipline.
A single theme unites these principles: Focus on the things you can control.
We believe there is no wiser course for any investor.
| |
| Contents | |
| Your Fund’s Total Returns. | 1 |
| Chairman’s Letter. | 2 |
| Advisor’s Report. | 9 |
| Fund Profile. | 13 |
| Performance Summary. | 14 |
| Financial Statements. | 16 |
| Your Fund’s After-Tax Returns. | 28 |
| About Your Fund’s Expenses. | 29 |
| Trustees Approve Advisory Agreement. | 31 |
| Glossary. | 32 |
Please note: The opinions expressed in this report are just that—informed opinions. They should not be considered promises or advice.
Also, please keep in mind that the information and opinions cover the period through the date on the front of this report. Of course, the risks of investing in your fund are spelled out in the prospectus.
See the Glossary for definitions of investment terms used in this report.
About the cover: The ship's wheel represents leadership and guidance, essential qualities in navigating difficult seas.
This one is a replica based on an 18th-century British vessel. The HMS Vanguard, another ship of that era, served as the flagship for Admiral Horatio Nelson when he defeated a French fleet at the Battle of the Nile.
Your Fund’s Total Returns
| | | | |
| Fiscal Year Ended September 30, 2013 | | | | |
| |
| | | | | Total |
| | | | | Returns |
| Vanguard PRIMECAP Fund | | | | |
| Investor Shares | | | | 29.63% |
| Admiral™ Shares | | | | 29.73 |
| S&P 500 Index | | | | 19.34 |
| Multi-Cap Growth Funds Average | | | | 22.55 |
| Multi-Cap Growth Funds Average: Derived from data provided by Lipper, a Thomson Reuters Company. |
| Admiral Shares carry lower expenses and are available to investors who meet certain account-balance requirements. |
| |
| |
| Your Fund’s Performance at a Glance | | | | |
| September 30, 2012, Through September 30, 2013 | | | | |
| | | | Distributions Per Share |
| | Starting | Ending | | |
| | Share | Share | Income | Capital |
| | Price | Price | Dividends | Gains |
| Vanguard PRIMECAP Fund | | | | |
| Investor Shares | $69.39 | $87.83 | $0.965 | $0.721 |
| Admiral Shares | 72.03 | 91.15 | 1.079 | 0.748 |
1

Chairman’s Letter
Dear Shareholder,
Vanguard PRIMECAP Fund, buoyed by a favorable stock market and the skill of its advisor, delivered a praiseworthy performance for the 12 months ended September 30, 2013. The fund returned nearly 30%, notably ahead of the results of its comparative standards––about 19% for its benchmark, the Standard & Poor’s 500 Index, and nearly 23% on average for its multi-capitalization growth peers.
PRIMECAP Management Company, the fund’s advisor, has customarily made outsized investments in health care and technology. For the fiscal year, the advisor’s commitment to these sectors and its investment decisions within them significantly boosted returns. The industrial sector was also a source of strength. At the same time, the fund was aided by its minimal or zero exposure to some of the market’s less productive precincts, such as consumer staples, utilities, and telecommunication services.
If you hold fund shares in a taxable account, you may wish to review the table of after-tax returns, based on the highest federal income tax bracket, that appears later in this report.
2
Stocks dodged obstacles to produce strong gains
Although their path wasn’t always smooth, U.S. stocks powered to a return of about 22% for the 12 months ended September 30. The U.S. economy delivered only modest growth, but investors’ tolerance for risk seemed to increase faster than companies’ profits.
In mid-September, U.S. stocks jumped when the Federal Reserve surprised investors by announcing that it had no immediate plans to unwind its stimulative bond-buying program. But in the waning days of that month, stocks slid ahead of the partial federal government shutdown that began October 1.
It’s natural for investors to be concerned by the situation in Washington. But as Sarah Hammer, a senior analyst in Vanguard Investment Strategy Group, noted in the midst of the temporary shutdown, they shouldn’t be unduly influenced by these events. “Investors are often best served by sticking to their long-term investment plans and avoiding short-term decisions based on the legislative outlook,” Ms. Hammer said. Our recurrent advice to stick to your plan may lack pizzazz, but it’s proven to be sound counsel over the decades.
International stocks generally posted strong results. Emerging-market stocks, however, lagged amid worries about slowing growth.
| | | |
| Market Barometer | | | |
| |
| | | Average Annual Total Returns |
| | Periods Ended September 30, 2013 |
| | One | Three | Five |
| | Year | Years | Years |
| Stocks | | | |
| Russell 1000 Index (Large-caps) | 20.91% | 16.64% | 10.53% |
| Russell 2000 Index (Small-caps) | 30.06 | 18.29 | 11.15 |
| Russell 3000 Index (Broad U.S. market) | 21.60 | 16.76 | 10.58 |
| MSCI All Country World Index ex USA (International) | 16.48 | 5.95 | 6.26 |
| |
| Bonds | | | |
| Barclays U.S. Aggregate Bond Index (Broad taxable market) | -1.68% | 2.86% | 5.41% |
| Barclays Municipal Bond Index (Broad tax-exempt market) | -2.21 | 3.24 | 5.98 |
| Citigroup Three-Month U.S. Treasury Bill Index | 0.07 | 0.07 | 0.14 |
| |
| CPI | | | |
| Consumer Price Index | 1.18% | 2.34% | 1.37% |
3
Bond returns were negative despite September’s bounce
Investor concern about the Fed’s potential scaling back of its bond-buying program also affected the performance of bonds, which declined for the year. In September, however, bonds trimmed their losses after the Fed said it would maintain the level of purchases. The broad U.S. taxable bond market returned –1.68% for the fiscal year, and the yield of the 10-year Treasury note closed at 2.63%, down from 2.76% at the end of August. (Bond yields and prices move in opposite directions.) Municipal bonds returned –2.21% after rebounding a bit in September.
Money markets and savings accounts barely budged as the Fed’s target for short-term interest rates remained at 0%–0.25%.
People and process are both crucial to the fund’s performance
PRIMECAP Management’s investment principles are steeped in both its people and its investment process, which draws on deep research. In seeking to understand a company or a business, PRIMECAP’s portfolio managers visit headquarters, factories, and stores; speak with employees and customers; build models; attend conferences; and analyze the links of the supply chain.
| | | |
| Expense Ratios | | | |
| Your Fund Compared With Its Peer Group | | | |
| | Investor | Admiral | Peer Group |
| | Shares | Shares | Average |
| PRIMECAP Fund | 0.45% | 0.36% | 1.31% |
The fund expense ratios shown are from the prospectus dated January 28, 2013, and represent estimated costs for the current fiscal year. For the fiscal year ended September 30, 2013, the fund’s expense ratios were 0.45% for Investor Shares and 0.36% for Admiral Shares. The peer-group expense ratio is derived from data provided by Lipper, a Thomson Reuters Company, and captures information through year-end 2012.
Peer group: Multi-Cap Growth Funds.
4
PRIMECAP Management’s people are equally essential. On that note, I’d like to express my appreciation to Mitch Milias, co-founder and chairman of the company and a manager of Vanguard PRIMECAP Fund since 2002, who will relinquish his portfolio management duties at the end of the year. Mitch will remain with the firm in a management and client relationship role.
Although this is a natural progression, Mitch has been an integral part of the PRIMECAP team, and we will miss him. However, we have full confidence in the talented co-managers and analysts at PRIMECAP who will continue to oversee the fund. Mitch’s portion will be absorbed by the existing four other portfolio managers as well as by analysts in the firm’s research department. As before, each manager will remain responsible for his own portion of the fund.
PRIMECAP focused on information technology and health care before and during Mitch’s tenure with the fund, and the sizable allocations to these industries are likely to continue after his departure. The fund’s exposure to each of those sectors was about 30% of assets on average during the fiscal year—far higher than the benchmark’s.
Over the 12 months, the fund’s health care stocks surged about 37% and were responsible for more than one-third of its return. Major pharmaceutical and biotechnology companies have been especially productive for PRIMECAP
| |
| Total Returns | |
| Ten Years Ended September 30, 2013 | |
| | Average |
| | Annual Return |
| PRIMECAP Fund Investor Shares | 10.19% |
| S&P 500 Index | 7.57 |
| Multi-Cap Growth Funds Average | 7.49 |
| Multi-Cap Growth Funds Average: Derived from data provided by Lipper, a Thomson Reuters Company. | |
The figures shown represent past performance, which is not a guarantee of future results. (Current performance may be lower or higher than the performance data cited. For performance data current to the most recent month-end, visit our website at vanguard.com/performance.) Note, too, that both investment returns and principal value can fluctuate widely, so an investor’s shares, when sold, could be worth more or less than their original cost.
5
as pipelines for new medicines have expanded and positive rulings from the Food and Drug Administration have resulted in a more hospitable business climate.
As we described in the fund’s semiannual report in April 2013, the fund’s relative success in IT was due to both the stocks it held and those it largely sidestepped. Its holdings in the software and
| |
| Investment insight | |
| |
| Don’t let a trick of the calendar alter your course | |
| When making investment decisions, it’s important to weigh past returns with caution. |
| That’s because investment returns from any particular period are an unreliable anchor |
| for gauging the future. They can be highly date-dependent. | |
| |
| For example, take the five-year average annual return for the broad U.S. stock |
| market. That average just made a startling bounce: from 1.30% for the period |
| ended September 30, 2012, to 10.58% for the period ended September 30, 2013. |
| True, the market returned a hearty 21.60% in the most recent 12 months, but that’s |
| not enough to explain such a big leap in the average. Significantly, the year ended |
| September 30, 2008––when U.S. stocks returned –21.52% during the financial |
| crisis––has now rolled off the five-year calculation. | |
| |
| The important thing to remember is that historical returns are just that: historical. |
| Basing investment decisions on such date-dependent snapshots could easily lead |
| you to alter course––possibly in the wrong direction. Instead, Vanguard believes, you |
| should build your asset allocation strategy on long-term risk-and-return relationships, |
| always recognizing that no level of return is guaranteed. | |
| |
| Which five-year average should you count on? | |
| (Answer: None of them!) | |
| Average annual returns for U.S. stocks over five-year periods ended September 30 |
| |
| 2007 | 16.18% |
| 2008 | 5.70 |
| 2009 | 1.56 |
| 2010 | 0.92 |
| 2011 | –0.92 |
| 2012 | 1.30 |
| 2013 | 10.58 |
| Note: The U.S. stock market is represented by the Russell 3000 Index. | |
| Source: Vanguard. | |
6
semiconductor industries were a boon. At the same time, PRIMECAP had only a minuscule investment in Apple, whose stock fell almost 27%. (Of course, the minimal exposure to Apple has also meant the fund didn’t benefit from the company’s soaring stock price over the past few years.)
PRIMECAP’s industrial stocks, mostly in the airfreight, aerospace, and airline groups, also lifted relative results. Stock choices were less favorable in consumer discretionary and in materials—the fund’s only negative-performing sector.
For more on the advisor’s strategy and outlook, please see the Advisor’s Report that follows this letter.
The advisor’s patient approach has yielded strong long-term results
PRIMECAP Management Company has consistently taken a long-term, low-turnover approach to investing and shown conviction in constructing a portfolio that can differ greatly from the broad market. The strategy has served the fund well for much of its 29-year existence, though there have been several multiyear stretches when it has underperformed its benchmark or peer group.
Most recently, during fiscal years 2011 and 2012 when the fund underperformed the S&P 500 Index, PRIMECAP Management never veered from its investment plan, though its sector allocation and stock choices were sometimes out of sync with market trends. In 2013, the advisor’s patience and program were rewarded, and the fund surpassed both its benchmark and the average return of its peers by a wide margin.
For the ten years ended September 30, 2013, the PRIMECAP Fund recorded an average annual return of 10.19% for Investor Shares, more than 2 percentage points ahead of both its market benchmark, the S&P 500 Index, and its peer funds average.
Those results are a product of PRIMECAP Management’s skill and expertise and also of Vanguard’s historically low costs, which allow shareholders to keep more of the fund’s returns.
Staying out of the rough by staying the course
Back in September 2008, global financial markets were stunned by the collapse of Lehman Brothers, which transformed the economic downturn already under way into the Great Recession. Fast-forward to 2013: The U.S. economy is growing, albeit slowly, and stock markets have set record highs.
When headlines are blaring and stock markets are sinking, it’s human nature to be tempted to head for the exits. But it’s important to stick with the principles of balance and diversification—and the portfolio asset allocation you established to meet your long-term goals. Bonds can provide ballast if stock prices keep falling, and by remaining in the stock market, you will be able to participate when stocks begin to recover.
7
The benefit of staying the course was confirmed in a recent analysis of the performance of more than 58,000 self-directed Vanguard IRA® investors over the five years ended December 31, 2012. Vanguard compared actual returns earned by each investor with the hypothetical results of personalized index benchmarks, taking into consideration investors’ beginning and ending balances and any intervening cash flow.
The key finding: Those who stayed with their investment plans earned five-year returns commensurate with the calculated benchmarks, generally outperforming those who changed course. Investors who reacted to market events were much more likely to miss out on potential returns. (You can read more in Most Vanguard IRA Investors Shot Par by Staying the Course: 2008–2012, available at vanguard.com/ research.)
The results for the five years through 2012 are a good reminder that sticking with a simple, broad-based portfolio—even amid a financial tempest—can help minimize the chances of making a mistake that can reduce returns.
As always, thank you for investing with Vanguard.
Sincerely,

F. William McNabb III
Chairman and Chief Executive Officer
October 11, 2013
8
Advisor’s Report
For the fiscal year ended September 30, 2013, Vanguard PRIMECAP Fund returned 29.63% for Investor Shares and 29.73% for Admiral Shares, exceeding both the 19.34% return of its benchmark, the unmanaged Standard & Poor’s 500 Index, and the 22.55% average return of its multi-capitalization growth fund peers. Favorable stock selection in information technology and health care was the main reason for the positive performance.
The investment environment
During the fiscal year, the actions of central banks—particularly in the United States, Japan, Europe, and the United Kingdom—heavily influenced the investment environment. Since the 2008–2009 financial crisis, these institutions have taken extraordinary measures to stimulate their countries’ economies, including large-scale quantitative easing, or QE. The banks have largely used the newly created money to buy government bonds, mortgage-backed securities, or both to try to reduce borrowing costs and encourage lending and investing. QE supports asset prices, because those who sell their securities to a central bank use some of the proceeds to buy other financial assets, and it often weakens currencies because of the increased supply.
For the 12 months, Japan’s stock market outperformed those of other major countries. When adjusted for the size of its economy, Japan’s QE program was the largest of any central bank’s. The Nikkei 225 index appreciated by 64% over the period after languishing since the financial crisis, and the yen depreciated by more than 25% against the U.S. dollar.
We are concerned that the absence of significant inflation in developed economies after the Great Recession has led many to assume that these conditions will persist indefinitely. In an inflationary environment, interest rates need to increase to compensate lenders for the loss of purchasing power, making debt levels that appear manageable at a time of ultralow interest rates more difficult to service. Overall debt levels in the United States remain high relative to gross domestic product, and large, unfunded entitlement obligations cloud the government’s fiscal outlook. Although U.S. interest rates have risen from recent lows, they remain depressed by historical standards. Eventually they will rise to more normal levels, but we believe the portfolio is relatively well-positioned for that circumstance given the strong balance sheets of many of our companies.
Outlook for U.S. equities
U.S. equities performed strongly for the fiscal year, with the S&P 500 Index returning 19.34%. In fact, the index reached a record high of 1,730 on September 18. Economically sensitive sectors such as consumer discretionary, financials, and industrials led. Defensive areas including consumer staples, utilities, and telecommunications services
9
underperformed. Bonds, which had enjoyed an extended period of outperformance, generally declined in price as interest rates increased.
We are less optimistic about U.S. equities than we were a year ago, though we still believe they are more attractive than bonds at current prices. At the end of the fiscal year, the S&P 500 was trading at about 15.5 times its calendar 2013 estimated earnings per share of $109, a reasonable valuation by historical standards. We are skeptical, though, that the index can sustain its earnings per share growth unless revenue growth accelerates.
Much of the recent earnings growth has come from profit margin expansion, and corporate margins are near record highs. Favorable trends from lower debt-service costs and debt-funded share repurchases, which have also helped boost earnings per share, could become hindrances in a rising interest rate environment.
Portfolio update and outlook
Although our focus is on the long term, we are encouraged by the fund’s fiscal year results. After generally lagging the returns of the S&P 500 Index for 2½ years, they improved dramatically. The portfolio remains significantly overweighted in health care and information technology. As of September 30, these two sectors constituted 64% of its assets (versus 31% for the S&P 500) and included nine of its ten largest holdings.
The fund’s outperformance was primarily driven by favorable stock selection in IT and health care. Even though the IT sector was the second-worst performer in the S&P 500, the fund’s stock picks more than offset the negative impact of its overweight position. Several longstanding investments appreciated significantly, including Adobe Systems (+60%) and Texas Instruments (+50%). A minimal exposure to Apple (–27%)—which still has the largest market capitalization in the S&P 500—further helped relative returns.
The health care sector outpaced the broader market by a wide margin and was the third-best performer in the index. Favorable stock selection was more helpful to the fund than its overweight position. Several long-held investments in pharmaceutical, biotechnology, and medical device stocks, which together make up a significant portion of the overall portfolio, outperformed the benchmark sector and the broader market. Among them were Biogen Idec (+61%), Roche Holding (+49%), and Amgen (+35%).
We believe that many of our IT and health care holdings are attractively valued. Both sectors are trading at discounts to their historical price-to-earnings ratios. IT is also currently valued at a discount to the overall market even though it has historically traded at a premium. We believe it has superior growth prospects.
10
Technology
In IT, the adoption of low-cost smart- phones in developing countries will give billions of people internet access for the first time. The internet more recently has emerged as a platform for delivering software applications and cloud computing services. Thanks to exponential growth in processing power, network bandwidth, storage capacity, and other capabilities, cloud computing is replacing the client-server model as the dominant computing paradigm. It enables productivity growth through better use of technology assets and allows users to obtain and pay for software and computing resources as needed.
We expect that internet-connected sensor applications will raise productivity through increased automation and improved use of assets. We believe we have positioned the fund to benefit from the internet’s continuing growth by investing in companies that provide underlying processes as well as those that offer internet-based services directly to users.
We have also identified other areas in which new technologies should create growth opportunities. The fund has significant investments in companies whose ideas help boost productivity in agriculture, oil and gas production, and payments. And we remain optimistic that health care applications will keep advancing, as we discuss in greater detail below.
Health care
The fund’s substantial investments in health care reflect our belief that innovation in this area will continue, as well as our expectation that consumption of health care services will grow more rapidly than the overall economy for the foreseeable future. Global demographic trends support increased demand as populations age in most developed countries and in China (largely because of its one-child policy introduced in 1979). As the proportion of elderly people grows, so does health care spending: Older people consume three times as many health care resources on average as the general population. We are also optimistic that the expected rise in living standards in many developing countries will open up new markets. As incomes in these countries grow and affordability improves, we anticipate that consumption will rise.
On the supply side, the industry’s considerable investments in research and development over the years are resulting in more effective therapies for many diseases such as cancer, diabetes, and Alzheimer’s. The precipitous decline in the cost of genetic sequencing is allowing researchers to identify diseases and rapidly devise therapies that improve the standard of care and save lives. Increasingly, drugs developed based on a better understanding of a disease’s genetic causes are providing higher cure rates with fewer side effects than conventional treatments.
11
Conclusion
We remain committed to our investment philosophy, which is based on individual stock selection. Although this “bottom-up” approach can lead to periods of under-performance when the stocks in our portfolio fall out of favor, we believe it can generate superior results for investors over the long term.
PRIMECAP Management Company October 11, 2013
Portfolio management team update
After nearly 50 years of managing equity investments, Mitchell J. Milias, a co-founder and the chairman of PRIMECAP Management Company, has decided to relinquish his portfolio management duties at the end of 2013. Mr. Milias has been a co-manager of the PRIMECAP Fund since 2002. The portion of the fund he manages will be assumed by the fund’s other co-managers and the firm’s research department.
12
PRIMECAP Fund
Fund Profile
As of September 30, 2013
| | | |
| Share-Class Characteristics | | |
| | | Investor | Admiral |
| | | Shares | Shares |
| Ticker Symbol | VPMCX | VPMAX |
| Expense Ratio1 | 0.45% | 0.36% |
| 30-Day SEC Yield | 1.19% | 1.28% |
| |
| Portfolio Characteristics | | |
| | | | DJ U.S. |
| | | | Total |
| | | | Market |
| | | S&P 500 | FA |
| | Fund | Index | Index |
| Number of Stocks | 131 | 500 | 3,636 |
| Median Market Cap | $55.7B | $64.9B | $40.2B |
| Price/Earnings Ratio | 20.6x | 17.9x | 19.5x |
| Price/Book Ratio | 3.4x | 2.5x | 2.5x |
| Return on Equity | 19.2% | 17.9% | 16.5% |
| Earnings Growth | | | |
| Rate | 12.5% | 10.9% | 11.1% |
| Dividend Yield | 1.7% | 2.1% | 1.9% |
| Foreign Holdings | 11.6% | 0.0% | 0.0% |
| Turnover Rate | 5% | — | — |
| Short-Term Reserves | 4.5% | — | — |
| |
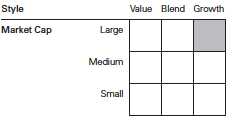
| Sector Diversification (% of equity exposure) |
| | | | DJ U.S. |
| | | | Total |
| | S&P 500 | Market |
| | Fund | Index | FA Index |
| Consumer | | | |
| Discretionary | 8.6% | 12.5% | 13.3% |
| Consumer Staples | 0.7 | 10.0 | 8.7 |
| Energy | 4.3 | 10.5 | 9.6 |
| Financials | 5.5 | 16.3 | 17.3 |
| Health Care | 33.2 | 13.0 | 12.6 |
| Industrials | 14.1 | 10.7 | 11.4 |
| Information | | | |
| Technology | 30.8 | 17.9 | 17.9 |
| Materials | 2.7 | 3.5 | 3.8 |
| Telecommunication | | | |
| Services | 0.0 | 2.4 | 2.2 |
| Utilities | 0.1 | 3.2 | 3.2 |
| | |
| Volatility Measures | | |
| |
| | | DJ U.S. |
| | S&P 500 | Total Market |
| | Index | FA Index |
| R-Squared | 0.95 | 0.95 |
| Beta | 1.04 | 0.99 |
| These measures show the degree and timing of the fund’s fluctuations compared with the indexes over 36 months. | |
| |
| |
| |
| Ten Largest Holdings (% of total net assets) |
| Biogen Idec Inc. | Biotechnology | 6.9% |
| Amgen Inc. | Biotechnology | 5.5 |
| Roche Holding AG | Pharmaceuticals | 4.4 |
| Google Inc. | Internet Software & | |
| | Services | 4.0 |
| FedEx Corp. | Air Freight & | |
| | Logistics | 3.8 |
| Texas Instruments Inc. | Semiconductors | 3.8 |
| Eli Lilly & Co. | Pharmaceuticals | 3.7 |
| Microsoft Corp. | Systems Software | 3.5 |
| Adobe Systems Inc. | Application Software | 3.3 |
| Novartis AG | Pharmaceuticals | 3.1 |
| Top Ten | | 42.0% |
| The holdings listed exclude any temporary cash investments and equity index products. |
| | |
Investment Focus
1 The expense ratios shown are from the prospectus dated January 28, 2013, and represent estimated costs for the current fiscal year. For the fiscal year ended September 30, 2013, the expense ratios were 0.45% for Investor Shares and 0.36% for Admiral Shares.
13
PRIMECAP Fund
Performance Summary
All of the returns in this report represent past performance, which is not a guarantee of future results that may be achieved by the fund. (Current performance may be lower or higher than the performance data cited. For performance data current to the most recent month-end, visit our website at vanguard.com/performance.) Note, too, that both investment returns and principal value can fluctuate widely, so an investor’s shares, when sold, could be worth more or less than their original cost. The returns shown do not reflect taxes that a shareholder would pay on fund distributions or on the sale of fund shares.
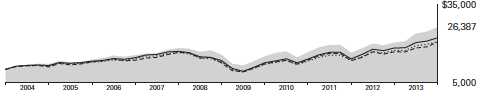
Cumulative Performance: September 30, 2003, Through September 30, 2013
Initial Investment of $10,000
| | | | | |
| | | | Average Annual Total Returns | |
| | | Periods Ended September 30, 2013 | |
| | | | | | Final Value |
| | | One | Five | Ten | of a $10,000 |
| | | Year | Years | Years | Investment |
| | PRIMECAP Fund*Investor Shares | 29.63% | 10.99% | 10.19% | $26,387 |
| •••••••• | S&P 500 Index | 19.34 | 10.02 | 7.57 | 20,737 |
| – – – – | Multi-Cap Growth Funds Average | 22.55 | 10.48 | 7.49 | 20,590 |
| | Dow Jones U.S. Total Stock Market | | | | |
| | Float Adjusted Index | 21.44 | 10.69 | 8.32 | 22,235 |
| Multi-Cap Growth Funds Average: Derived from data provided by Lipper, a Thomson Reuters Company. | | |
| | | | |
| | | | | Final Value |
| | One | Five | Ten | of a $50,000 |
| | Year | Years | Years | Investment |
| PRIMECAP Fund Admiral Shares | 29.73% | 11.09% | 10.32% | $133,488 |
| S&P 500 Index | 19.34 | 10.02 | 7.57 | 103,685 |
| Dow Jones U.S. Total Stock Market Float | | | | |
| Adjusted Index | 21.44 | 10.69 | 8.32 | 111,177 |
See Financial Highlights for dividend and capital gains information.
14
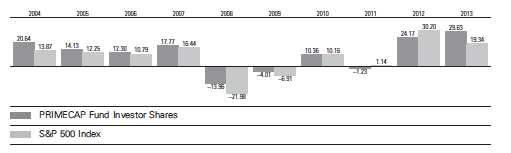
PRIMECAP Fund
Fiscal-Year Total Returns (%): September 30, 2003, Through September 30, 2013
15
PRIMECAP Fund
Financial Statements
Statement of Net Assets
As of September 30, 2013
The fund reports a complete list of its holdings in regulatory filings four times in each fiscal year, at the quarter-ends. For the second and fourth fiscal quarters, the lists appear in the fund’s semiannual and annual reports to shareholders. For the first and third fiscal quarters, the fund files the lists with the Securities and Exchange Commission on Form N-Q. Shareholders can look up the fund’s Forms N-Q on the SEC’s website at sec.gov. Forms N-Q may also be reviewed and copied at the SEC’s Public Reference Room (see the back cover of this report for further information).
| | | |
| | | | Market |
| | | | Value |
| | | Shares | ($000) |
| Common Stocks (95.7%) | | |
| Consumer Discretionary (8.2%) | |
| | L Brands Inc. | 9,471,722 | 578,722 |
| * | DIRECTV | 8,053,962 | 481,224 |
| | TJX Cos. Inc. | 6,875,000 | 387,681 |
| | Walt Disney Co. | 5,575,000 | 359,532 |
| | Whirlpool Corp. | 1,620,800 | 237,350 |
| ^ | Sony Corp. ADR | 10,050,000 | 216,276 |
| | Carnival Corp. | 5,793,200 | 189,090 |
| * | Bed Bath & Beyond Inc. | 2,300,975 | 178,003 |
| | Mattel Inc. | 3,906,433 | 163,523 |
| | Lowe’s Cos. Inc. | 750,000 | 35,707 |
| | Time Warner Cable Inc. | 293,304 | 32,733 |
| | Ross Stores Inc. | 368,800 | 26,849 |
| * | Amazon.com Inc. | 76,000 | 23,761 |
| | Las Vegas Sands Corp. | 300,000 | 19,926 |
| | VF Corp. | 99,350 | 19,776 |
| | Macy’s Inc. | 385,800 | 16,694 |
| | Target Corp. | 120,000 | 7,678 |
| | | | 2,974,525 |
| Consumer Staples (0.6%) | | |
| | Costco Wholesale Corp. | 1,415,000 | 162,895 |
| | Kellogg Co. | 700,000 | 41,111 |
| | CVS Caremark Corp. | 219,065 | 12,432 |
| | PepsiCo Inc. | 145,000 | 11,527 |
| | | | 227,965 |
| Energy (4.1%) | | |
| | Noble Energy Inc. | 7,920,176 | 530,731 |
| | EOG Resources Inc. | 1,865,000 | 315,707 |
| | Schlumberger Ltd. | 3,562,299 | 314,765 |
| | Transocean Ltd. | 2,702,374 | 120,256 |
| | Exxon Mobil Corp. | 615,000 | 52,914 |
| | Encana Corp. | 2,660,000 | 46,098 |
| * | Cameron International | | |
| | Corp. | 680,000 | 39,691 |
| * | Southwestern Energy Co. | 892,000 | 32,451 |
| | National Oilwell Varco Inc. | 310,000 | 24,214 |
| | | |
| | | | Market |
| | | | Value |
| | | Shares | ($000) |
| | Petroleo Brasileiro SA | | |
| | ADR Type A | 600,000 | 10,038 |
| | Noble Corp. | 240,000 | 9,065 |
| | Petroleo Brasileiro SA ADR | 400,000 | 6,196 |
| | Cenovus Energy Inc. | 100,000 | 2,985 |
| | Cabot Oil & Gas Corp. | 44,000 | 1,642 |
| | Range Resources Corp. | 12,500 | 949 |
| | | | 1,507,702 |
| Financials (5.3%) | | |
| | Marsh & McLennan | | |
| | Cos. Inc. | 15,382,000 | 669,886 |
| | Charles Schwab Corp. | 29,665,900 | 627,137 |
| * | Berkshire Hathaway Inc. | | |
| | Class B | 2,000,000 | 227,020 |
| | Chubb Corp. | 2,500,000 | 223,150 |
| | Wells Fargo & Co. | 2,680,000 | 110,738 |
| | American Express Co. | 457,100 | 34,520 |
| | CME Group Inc. Class A | 260,000 | 19,209 |
| | Weyerhaeuser Co. | 100,000 | 2,863 |
| | | | 1,914,523 |
| Health Care (31.8%) | | |
| * | Biogen Idec Inc. | 10,387,495 | 2,500,893 |
| | Amgen Inc. | 17,886,200 | 2,002,181 |
| | Roche Holding AG | 5,860,000 | 1,581,458 |
| | Eli Lilly & Co. | 26,450,000 | 1,331,228 |
| | Novartis AG ADR | 14,529,969 | 1,114,594 |
| | Medtronic Inc. | 16,323,952 | 869,250 |
| | Johnson & Johnson | 6,864,800 | 595,109 |
| * | Life Technologies Corp. | 6,939,300 | 519,268 |
| * | Boston Scientific Corp. | 28,342,560 | 332,742 |
| | GlaxoSmithKline plc | | |
| | ADR | 5,121,200 | 256,931 |
| | Abbott Laboratories | 5,911,300 | 196,196 |
| | AbbVie Inc. | 2,449,800 | 109,580 |
| | Sanofi ADR | 1,205,000 | 61,009 |
| | Stryker Corp. | 259,000 | 17,506 |
| | Zimmer Holdings Inc. | 197,000 | 16,182 |
| | | | 11,504,127 |
16
| | | |
| PRIMECAP Fund | | |
| |
| |
| |
| | | | Market |
| | | | Value |
| | | Shares | ($000) |
| Industrials (13.5%) | | |
| | FedEx Corp. | 11,969,012 | 1,365,784 |
| | Honeywell International | | |
| | Inc. | 7,818,547 | 649,252 |
| | Southwest Airlines Co. | 34,559,300 | 503,183 |
| | CH Robinson Worldwide | | |
| | Inc. | 5,284,080 | 314,720 |
| | United Parcel Service Inc. | | |
| | Class B | 3,211,070 | 293,395 |
| | Union Pacific Corp. | 1,838,700 | 285,624 |
| | Caterpillar Inc. | 3,236,775 | 269,850 |
| | European Aeronautic | | |
| | Defence and Space | | |
| | Co. NV | 4,233,700 | 269,781 |
| | Boeing Co. | 1,775,760 | 208,652 |
| | Alaska Air Group Inc. | 3,103,900 | 194,366 |
| | Deere & Co. | 1,961,500 | 159,647 |
| | Delta Air Lines Inc. | 3,094,000 | 72,987 |
| | PACCAR Inc. | 1,000,000 | 55,660 |
| | Canadian Pacific Railway | | |
| | Ltd. | 447,800 | 55,214 |
| | Expeditors International | | |
| | of Washington Inc. | 1,006,700 | 44,355 |
| | Donaldson Co. Inc. | 800,000 | 30,504 |
| | Rockwell Automation Inc. | 236,900 | 25,334 |
| | Pentair Ltd. | 350,000 | 22,729 |
| * | United Continental | | |
| | Holdings Inc. | 580,000 | 17,812 |
| | Pall Corp. | 205,000 | 15,793 |
| | CSX Corp. | 500,000 | 12,870 |
| | Granite Construction Inc. | 290,000 | 8,874 |
| | Norfolk Southern Corp. | 46,100 | 3,566 |
| | Safran SA | 42,000 | 2,587 |
| | Cummins Inc. | 12,150 | 1,614 |
| | Republic Services Inc. | | |
| | Class A | 17,000 | 567 |
| | | | 4,884,720 |
| Information Technology (29.5%) | |
| * | Google Inc. Class A | 1,664,643 | 1,458,078 |
| | Texas Instruments Inc. | 33,888,200 | 1,364,678 |
| | Microsoft Corp. | 38,464,600 | 1,281,256 |
| * | Adobe Systems Inc. | 23,310,070 | 1,210,725 |
| | QUALCOMM Inc. | 9,559,350 | 643,918 |
| | Intuit Inc. | 9,690,500 | 642,577 |
| | Oracle Corp. | 16,567,133 | 549,532 |
| * | Micron Technology Inc. | 20,120,000 | 351,496 |
| | EMC Corp. | 12,232,800 | 312,670 |
| | Visa Inc. Class A | 1,608,570 | 307,398 |
| | Intel Corp. | 12,400,000 | 284,208 |
| | Hewlett-Packard Co. | 11,350,000 | 238,123 |
| | Symantec Corp. | 9,503,500 | 235,212 |
| | Telefonaktiebolaget LM | | |
| | Ericsson ADR | 16,808,914 | 224,399 |
| | | |
| | | | Market |
| | | | Value |
| | | Shares | ($000) |
| | KLA-Tencor Corp. | 3,587,700 | 218,312 |
| | Accenture plc Class A | 2,886,100 | 212,532 |
| 1 | Plantronics Inc. | 3,701,500 | 170,454 |
| | NVIDIA Corp. | 10,291,000 | 160,128 |
| | Motorola Solutions Inc. | 1,874,000 | 111,278 |
| | NetApp Inc. | 2,600,000 | 110,812 |
| * | Blackberry Ltd. | 10,438,600 | 82,987 |
| | Corning Inc. | 5,243,200 | 76,498 |
| | Activision Blizzard Inc. | 3,720,000 | 62,012 |
| | Analog Devices Inc. | 1,222,000 | 57,495 |
| | ASML Holding NV | 479,175 | 47,323 |
| | Apple Inc. | 78,000 | 37,187 |
| | International Business | | |
| | Machines Corp. | 180,000 | 33,332 |
| | SanDisk Corp. | 500,000 | 29,755 |
| | Mastercard Inc. Class A | 41,250 | 27,752 |
| * | Entegris Inc. | 2,583,472 | 26,222 |
| | Applied Materials Inc. | 1,220,000 | 21,399 |
| * | Rambus Inc. | 2,000,000 | 18,800 |
| | Cisco Systems Inc. | 730,000 | 17,097 |
| | Altera Corp. | 450,000 | 16,722 |
| * | Salesforce.com Inc. | 154,000 | 7,994 |
| * | eBay Inc. | 115,000 | 6,416 |
| * | F5 Networks Inc. | 64,250 | 5,510 |
| | Dell Inc. | 200,000 | 2,754 |
| * | Yahoo! Inc. | 20,000 | 663 |
| | | | 10,665,704 |
| Materials (2.6%) | | |
| | Monsanto Co. | 6,140,460 | 640,880 |
| | Potash Corp. of | | |
| | Saskatchewan Inc. | 6,519,200 | 203,921 |
| | Praxair Inc. | 625,000 | 75,131 |
| | EI du Pont de Nemours | | |
| | & Co. | 135,000 | 7,906 |
| | Celanese Corp. Class A | 60,000 | 3,167 |
| | | | 931,005 |
| Utilities (0.1%) | | |
| | NextEra Energy Inc. | 229,440 | 18,392 |
| | Public Service Enterprise | | |
| | Group Inc. | 381,000 | 12,546 |
| | | | 30,938 |
| Total Common Stocks | | |
| (Cost $17,262,928) | | 34,641,209 |
| Temporary Cash Investment (4.8%) | |
| Money Market Fund (4.8%) | | |
| 2,3 | Vanguard Market | | |
| | Liquidity Fund, | | |
| | 0.112% | | |
| | (Cost $1,730,611) | 1,730,610,846 | 1,730,611 |
| Total Investments (100.5%) | | |
| (Cost $18,993,539) | | 36,371,820 |
17
| |
| PRIMECAP Fund | |
| |
| |
| |
| | Market |
| | Value |
| | ($000) |
| Other Assets and Liabilities (-0.5%) | |
| Other Assets | 691,586 |
| Liabilities3 | (875,325) |
| | (183,739) |
| Net Assets (100%) | 36,188,081 |
| |
| |
| At September 30, 2013, net assets consisted of: |
| | Amount |
| | ($000) |
| Paid-in Capital | 17,187,878 |
| Undistributed Net Investment Income | 216,612 |
| Accumulated Net Realized Gains | 1,404,609 |
| Unrealized Appreciation (Depreciation) | |
| Investment Securities | 17,378,281 |
| Foreign Currencies | 701 |
| Net Assets | 36,188,081 |
| |
| |
| Investor Shares—Net Assets | |
| Applicable to 148,695,662 outstanding | |
| $.001 par value shares of beneficial | |
| interest (unlimited authorization) | 13,059,377 |
| Net Asset Value Per Share— | |
| Investor Shares | $87.83 |
| |
| |
| Admiral Shares—Net Assets | |
| Applicable to 253,732,972 outstanding | |
| $.001 par value shares of beneficial | |
| interest (unlimited authorization) | 23,128,704 |
| Net Asset Value Per Share— | |
| Admiral Shares | $91.15 |
See Note A in Notes to Financial Statements.
* Non-income-producing security.
^ Part of security position is on loan to broker-dealers. The total value of securities on loan is $78,464,000.
1 Considered an affiliated company of the fund as the fund owns more than 5% of the outstanding voting securities of such company.
2 Affiliated money market fund available only to Vanguard funds and certain trusts and accounts managed by Vanguard. Rate shown is the 7-day yield.
3 Includes $80,214,000 of collateral received for securities on loan.
ADR—American Depositary Receipt.
See accompanying Notes, which are an integral part of the Financial Statements.
18
| |
| PRIMECAP Fund | |
| |
| |
| Statement of Operations | |
| |
| | Year Ended |
| | September 30, 2013 |
| | ($000) |
| Investment Income | |
| Income | |
| Dividends1,2 | 571,742 |
| Interest2 | 1,717 |
| Securities Lending | 3,792 |
| Total Income | 577,251 |
| Expenses | |
| Investment Advisory Fees—Note B | 67,551 |
| The Vanguard Group—Note C | |
| Management and Administrative—Investor Shares | 30,839 |
| Management and Administrative—Admiral Shares | 24,821 |
| Marketing and Distribution—Investor Shares | 2,347 |
| Marketing and Distribution—Admiral Shares | 2,625 |
| Custodian Fees | 452 |
| Auditing Fees | 26 |
| Shareholders’ Reports—Investor Shares | 121 |
| Shareholders’ Reports—Admiral Shares | 101 |
| Trustees’ Fees and Expenses | 85 |
| Total Expenses | 128,968 |
| Net Investment Income | 448,283 |
| Realized Net Gain (Loss) | |
| Investment Securities Sold2 | 1,544,552 |
| Foreign Currencies | 268 |
| Realized Net Gain (Loss) | 1,544,820 |
| Change in Unrealized Appreciation (Depreciation) | |
| Investment Securities | 6,421,077 |
| Foreign Currencies | 319 |
| Change in Unrealized Appreciation (Depreciation) | 6,421,396 |
| Net Increase (Decrease) in Net Assets Resulting from Operations | 8,414,499 |
1 Dividends are net of foreign withholding taxes of $15,596,000.
2 Dividend income, interest income, and realized net gain (loss) from affiliated companies of the fund were $1,481,000, $1,717,000, and $232,873,000, respectively.
See accompanying Notes, which are an integral part of the Financial Statements.
19
| | |
| PRIMECAP Fund | | |
| |
| |
| Statement of Changes in Net Assets | | |
| |
| | Year Ended September 30, |
| | 2013 | 2012 |
| | ($000) | ($000) |
| Increase (Decrease) in Net Assets | | |
| Operations | | |
| Net Investment Income | 448,283 | 383,777 |
| Realized Net Gain (Loss) | 1,544,820 | 314,049 |
| Change in Unrealized Appreciation (Depreciation) | 6,421,396 | 5,337,484 |
| Net Increase (Decrease) in Net Assets Resulting from Operations | 8,414,499 | 6,035,310 |
| Distributions | | |
| Net Investment Income | | |
| Investor Shares | (181,566) | (163,746) |
| Admiral Shares | (236,821) | (144,688) |
| Realized Capital Gain1 | | |
| Investor Shares | (135,657) | (500,030) |
| Admiral Shares | (164,172) | (402,175) |
| Total Distributions | (718,216) | (1,210,639) |
| Capital Share Transactions | | |
| Investor Shares | (3,902,726) | (3,252,493) |
| Admiral Shares | 2,784,511 | 2,590,407 |
| Net Increase (Decrease) from Capital Share Transactions | (1,118,215) | (662,086) |
| Total Increase (Decrease) | 6,578,068 | 4,162,585 |
| Net Assets | | |
| Beginning of Period | 29,610,013 | 25,447,428 |
| End of Period2 | 36,188,081 | 29,610,013 |
1 Includes fiscal 2013 and 2012 short-term gain distributions totaling $0 and $25,728,000, respectively. Short-term gain distributions are treated as ordinary income dividends for tax purposes.
2 Net Assets—End of Period includes undistributed net investment income of $216,612,000 and $222,255,000.
See accompanying Notes, which are an integral part of the Financial Statements.
20
| | | | | |
| PRIMECAP Fund | | | | | |
| |
| |
| Financial Highlights | | | | | |
| |
| |
| Investor Shares | | | | | |
| |
| For a Share Outstanding | | | Year Ended September 30, |
| Throughout Each Period | 2013 | 2012 | 2011 | 2010 | 2009 |
| Net Asset Value, Beginning of Period | $69.39 | $58.46 | $60.36 | $55.10 | $62.76 |
| Investment Operations | | | | | |
| Net Investment Income | 1.033 | .866 | .651 | .6311 | .500 |
| Net Realized and Unrealized Gain (Loss) | | | | | |
| on Investments | 19.093 | 12.857 | (1.266) | 5.076 | (3.990) |
| Total from Investment Operations | 20.126 | 13.723 | (.615) | 5.707 | (3.490) |
| Distributions | | | | | |
| Dividends from Net Investment Income | (. 965) | (. 689) | (.614) | (.447) | (.508) |
| Distributions from Realized Capital Gains | (.721) | (2.104) | (.671) | — | (3.662) |
| Total Distributions | (1.686) | (2.793) | (1.285) | (.447) | (4.170) |
| Net Asset Value, End of Period | $87.83 | $69.39 | $58.46 | $60.36 | $55.10 |
| |
| Total Return2 | 29.63% | 24.17% | -1.23% | 10.36% | -4.01% |
| |
| Ratios/Supplemental Data | | | | | |
| Net Assets, End of Period (Millions) | $13,059 | $13,632 | $14,359 | $18,028 | $17,795 |
| Ratio of Total Expenses to | | | | | |
| Average Net Assets | 0.45% | 0.45% | 0.45% | 0.45% | 0.49% |
| Ratio of Net Investment Income to | | | | | |
| Average Net Assets | 1.32% | 1.30% | 0.95% | 1.05%1 | 1.02% |
| Portfolio Turnover Rate | 5% | 6% | 8% | 5% | 4% |
1 Net investment income per share and the ratio of net investment income to average net assets include $.128 and 0.21%, respectively, resulting from a special dividend from Weyerhaeuser Co. in July 2010.
2 Total returns do not include transaction or account service fees that may have applied in the periods shown. Fund prospectuses provide information about any applicable transaction and account service fees.
See accompanying Notes, which are an integral part of the Financial Statements.
21
| | | | | |
| PRIMECAP Fund | | | | | |
| |
| |
| Financial Highlights | | | | | |
| |
| |
| Admiral Shares | | | | | |
| |
| For a Share Outstanding | | | Year Ended September 30, |
| Throughout Each Period | 2013 | 2012 | 2011 | 2010 | 2009 |
| Net Asset Value, Beginning of Period | $72.03 | $60.69 | $62.65 | $57.20 | $65.19 |
| Investment Operations | | | | | |
| Net Investment Income | 1.178 | .974 | .738 | .7111 | .580 |
| Net Realized and Unrealized Gain (Loss) | | | | | |
| on Investments | 19.769 | 13.333 | (1.319) | 5.269 | (4.160) |
| Total from Investment Operations | 20.947 | 14.307 | (. 581) | 5.980 | (3.580) |
| Distributions | | | | | |
| Dividends from Net Investment Income | (1.079) | (.785) | (.683) | (.530) | (.612) |
| Distributions from Realized Capital Gains | (.748) | (2.182) | (.696) | — | (3.798) |
| Total Distributions | (1.827) | (2.967) | (1.379) | (.530) | (4.410) |
| Net Asset Value, End of Period | $91.15 | $72.03 | $60.69 | $62.65 | $57.20 |
| |
| Total Return | 29.73% | 24.29% | -1.14% | 10.46% | -3.90% |
| |
| Ratios/Supplemental Data | | | | | |
| Net Assets, End of Period (Millions) | $23,129 | $15,978 | $11,088 | $9,765 | $9,222 |
| Ratio of Total Expenses to | | | | | |
| Average Net Assets | 0.36% | 0.36% | 0.36% | 0.36% | 0.37% |
| Ratio of Net Investment Income to | | | | | |
| Average Net Assets | 1.41% | 1.39% | 1.04% | 1.14%1 | 1.14% |
| Portfolio Turnover Rate | 5% | 6% | 8% | 5% | 4% |
1 Net investment income per share and the ratio of net investment income to average net assets include $.133 and 0.21%, respectively, resulting from a special dividend from Weyerhaeuser Co. in July 2010.
See accompanying Notes, which are an integral part of the Financial Statements.
22
PRIMECAP Fund
Notes to Financial Statements
Vanguard PRIMECAP Fund is registered under the Investment Company Act of 1940 as an open-end investment company, or mutual fund. The fund offers two classes of shares: Investor Shares and Admiral Shares. Investor Shares are available to any investor who meets the fund’s minimum purchase requirements. Admiral Shares are designed for investors who meet certain administrative, service, and account-size criteria.
A. The following significant accounting policies conform to generally accepted accounting principles for U.S. mutual funds. The fund consistently follows such policies in preparing its financial statements.
1. Security Valuation: Securities are valued as of the close of trading on the New York Stock Exchange (generally 4 p.m., Eastern time) on the valuation date. Equity securities are valued at the latest quoted sales prices or official closing prices taken from the primary market in which each security trades; such securities not traded on the valuation date are valued at the mean of the latest quoted bid and asked prices. Securities for which market quotations are not readily available, or whose values have been affected by events occurring before the fund’s pricing time but after the close of the securities’ primary markets, are valued at their fair values calculated according to procedures adopted by the board of trustees. These procedures include obtaining quotations from an independent pricing service, monitoring news to identify significant market- or security-specific events, and evaluating changes in the values of foreign market proxies (for example, ADRs, futures contracts, or exchange-traded funds), between the time the foreign markets close and the fund’s pricing time. When fair-value pricing is employed, the prices of securities used by a fund to calculate its net asset value may differ from quoted or published prices for the same securities. Investments in Vanguard Market Liquidity Fund are valued at that fund’s net asset value.
2. Foreign Currency: Securities and other assets and liabilities denominated in foreign currencies are translated into U.S. dollars using exchange rates obtained from an independent third party as of the fund’s pricing time on the valuation date. Realized gains (losses) and unrealized appreciation (depreciation) on investment securities include the effects of changes in exchange rates since the securities were purchased, combined with the effects of changes in security prices. Fluctuations in the value of other assets and liabilities resulting from changes in exchange rates are recorded as unrealized foreign currency gains (losses) until the assets or liabilities are settled in cash, at which time they are recorded as realized foreign currency gains (losses).
3. Federal Income Taxes: The fund intends to continue to qualify as a regulated investment company and distribute all of its taxable income. Management has analyzed the fund’s tax positions taken for all open federal income tax years (September 30, 2010–2013), and has concluded that no provision for federal income tax is required in the fund’s financial statements.
4. Distributions: Distributions to shareholders are recorded on the ex-dividend date.
5. Securities Lending: To earn additional income, the fund may lend its securities to qualified institutional borrowers. Security loans are required to be secured at all times by collateral in an amount at least equal to the market value of securities loaned. Daily market fluctuations could cause the value of loaned securities to be more or less than the value of the collateral received. When this occurs, the collateral is adjusted and settled on the next business day. The fund further mitigates its counterparty risk by entering into securities lending transactions only with a diverse group of prequalified counterparties, monitoring their financial strength, and entering into master securities lending agreements with its counterparties. The master securities lending agreements provide that, in the event of a counterparty’s default (including bankruptcy), the fund may terminate any loans with that borrower, determine the net amount owed, and sell or retain the collateral up to the net amount owed to the fund; however, such actions may be subject to legal proceedings. While collateral
23
PRIMECAP Fund
mitigates counterparty risk, in the absence of a default the fund may experience delays and costs in recovering the securities loaned. The fund invests cash collateral received in Vanguard Market Liquidity Fund, and records a liability for the return of the collateral, during the period the securities are on loan. Securities lending income represents fees charged to borrowers plus income earned on invested cash collateral, less expenses associated with the loan.
6. Other: Dividend income is recorded on the ex-dividend date. Interest income includes income distributions received from Vanguard Market Liquidity Fund and is accrued daily. Security transactions are accounted for on the date securities are bought or sold. Costs used to determine realized gains (losses) on the sale of investment securities are those of the specific securities sold.
Each class of shares has equal rights as to assets and earnings, except that each class separately bears certain class-specific expenses related to maintenance of shareholder accounts (included in Management and Administrative expenses) and shareholder reporting. Marketing and distribution expenses are allocated to each class of shares based on a method approved by the board of trustees. Income, other non-class-specific expenses, and gains and losses on investments are allocated to each class of shares based on its relative net assets.
B. PRIMECAP Management Company provides investment advisory services to the fund for a fee calculated at an annual percentage rate of average net assets. For the year ended September 30, 2013, the investment advisory fee represented an effective annual rate of 0.21% of the fund’s average net assets.
C. The Vanguard Group furnishes at cost corporate management, administrative, marketing, and distribution services. The costs of such services are allocated to the fund under methods approved by the board of trustees. The fund has committed to provide up to 0.40% of its net assets in capital contributions to Vanguard. At September 30, 2013, the fund had contributed capital of $4,218,000 to Vanguard (included in Other Assets), representing 0.01% of the fund’s net assets and 1.69% of Vanguard’s capitalization. The fund’s trustees and officers are also directors and officers of Vanguard.
D. Various inputs may be used to determine the value of the fund’s investments. These inputs are summarized in three broad levels for financial statement purposes. The inputs or methodologies used to value securities are not necessarily an indication of the risk associated with investing in those securities.
Level 1—Quoted prices in active markets for identical securities.
Level 2—Other significant observable inputs (including quoted prices for similar securities, interest rates, prepayment speeds, credit risk, etc.).
Level 3—Significant unobservable inputs (including the fund’s own assumptions used to determine the fair value of investments).
The following table summarizes the market value of the fund’s investments as of September 30, 2013, based on the inputs used to value them:
| | | |
| | Level 1 | Level 2 | Level 3 |
| Investments | ($000) | ($000) | ($000) |
| Common Stocks | 32,787,383 | 1,853,826 | — |
| Temporary Cash Investments | 1,730,611 | — | — |
| Total | 34,517,994 | 1,853,826 | — |
24
PRIMECAP Fund
E. Distributions are determined on a tax basis and may differ from net investment income and realized capital gains for financial reporting purposes. Differences may be permanent or temporary. Permanent differences are reclassified among capital accounts in the financial statements to reflect their tax character. Temporary differences arise when certain items of income, expense, gain, or loss are recognized in different periods for financial statement and tax purposes; these differences will reverse at some time in the future. Differences in classification may also result from the treatment of short-term gains as ordinary income for tax purposes.
During the year ended September 30, 2013, the fund realized net foreign currency gains of $268,000, which increased distributable net income for tax purposes; accordingly, such gains have been reclassified from accumulated net realized gains to undistributed net investment income.
The fund used a tax accounting practice to treat a portion of the price of capital shares redeemed during the year as distributions from net investment income and realized capital gains. Accordingly, the fund has reclassified $35,807,000 from undistributed net investment income, and $122,568,000 from accumulated net realized gains, to paid-in capital.
For tax purposes, at September 30, 2013, the fund had $279,607,000 of ordinary income and $1,396,058,000 of long-term capital gains available for distribution.
At September 30, 2013, the cost of investment securities for tax purposes was $18,993,539,000. Net unrealized appreciation of investment securities for tax purposes was $17,378,281,000, consisting of unrealized gains of $18,079,594,000 on securities that had risen in value since their purchase and $701,313,000 in unrealized losses on securities that had fallen in value since their purchase.
F. During the year ended September 30, 2013, the fund purchased $1,620,226,000 of investment securities and sold $3,657,295,000 of investment securities, other than temporary cash investments.
G. Capital share transactions for each class of shares were:
| | | | |
| | | | Year Ended September 30, |
| | | 2013 | | 2012 |
| | Amount | Shares | Amount | Shares |
| | ($000) | (000) | ($000) | (000) |
| Investor Shares | | | | |
| Issued | 668,647 | 8,660 | 1,018,574 | 15,661 |
| Issued in Lieu of Cash Distributions | 313,404 | 4,485 | 657,028 | 10,847 |
| Redeemed1 | (4,884,777) | (60,900) | (4,928,095) | (75,690) |
| Net Increase (Decrease)—Investor Shares | (3,902,726) | (47,755) | (3,252,493) | (49,182) |
| Admiral Shares | | | | |
| Issued | 4,361,547 | 51,652 | 3,650,726 | 54,056 |
| Issued in Lieu of Cash Distributions | 378,497 | 5,223 | 511,390 | 8,139 |
| Redeemed1 | (1,955,533) | (24,968) | (1,571,709) | (23,062) |
| Net Increase (Decrease) —Admiral Shares | 2,784,511 | 31,907 | 2,590,407 | 39,133 |
1 Net of redemption fees for fiscal 2012 of $545,000 (fund total). Effective May 23, 2012, the redemption fee was eliminated.
25
PRIMECAP Fund
H. Certain of the fund’s investments are in companies that are considered to be affiliated companies of the fund because the fund owns more than 5% of the outstanding voting securities of the company. Transactions during the period in securities of these companies were as follows:
| | | | | |
| | | | Current Period Transactions | |
| | Sept. 30, 2012 | | Proceeds from | | Sept. 30, 2013 |
| | Market | Purchases | Securities | Dividend | Market |
| | Value | at Cost | Sold | Income | Value |
| | ($000) | ($000) | ($000) | ($000) | ($000) |
| Biogen Idec Inc. | 1,790,029 | — | 292,429 | — | NA1 |
| Plantronics | 130,774 | — | — | 1,481 | 170,454 |
| | 1,920,803 | | | 1,481 | 170,454 |
1 Not applicable—At September 30, 2013, the security was still held, but the issuer was no longer an affiliated company of the fund.
I. Management has determined that no material events or transactions occurred subsequent to September 30, 2013, that would require recognition or disclosure in these financial statements.
26
Report of Independent Registered
Public Accounting Firm
To the Trustees of Vanguard Chester Funds and the Shareholders of Vanguard PRIMECAP Fund:
In our opinion, the accompanying statement of net assets and the related statements of operations and of changes in net assets and the financial highlights present fairly, in all material respects, the financial position of Vanguard PRIMECAP Fund (constituting a separate portfolio of Vanguard Chester Funds, hereafter referred to as the “Fund”) at September 30, 2013, the results of its operations for the year then ended, the changes in its net assets for each of the two years in the period then ended, and the financial highlights for each of the five years in the period then ended, in conformity with accounting principles generally accepted in the United States of America. These financial statements and financial highlights (hereafter referred to as “financial statements”) are the responsibility of the Fund’s management; our responsibility is to express an opinion on these financial statements based on our audits. We conducted our audits of these financial statements in accordance with the standards of the Public Company Accounting Oversight Board (United States). Those standards require that we plan and perform the audit to obtain reasonable assurance about whether the financial statements are free of material misstatement. An audit includes examining, on a test basis, evidence supporting the amounts and disclosures in the financial statements, assessing the accounting principles used and significant estimates made by management, and evaluating the overall financial statement presentation. We believe that our audits, which included confirmation of securities at September 30, 2013 by correspondence with the custodian and by agreement to the underlying ownership records of the transfer agent, provide a reasonable basis for our opinion.
PricewaterhouseCoopers LLP
Philadelphia, Pennsylvania
November 7, 2013
|
| Special 2013 tax information (unaudited) for Vanguard PRIMECAP Fund |
| This information for the fiscal year ended September 30, 2013, is included pursuant to provisions |
| of the Internal Revenue Code. |
| The fund distributed $421,739,000 as capital gain dividends (from net long-term capital gains) to |
| shareholders during the fiscal year. |
| The fund distributed $418,387,000 of qualified dividend income to shareholders during the fiscal year. |
| For corporate shareholders, 97.4% of investment income (dividend income plus short-term gains, |
| if any) qualifies for the dividends-received deduction. |
27
Your Fund’s After-Tax Returns
This table presents returns for your fund both before and after taxes. The after-tax returns are shown in two ways: (1) assuming that an investor owned the fund during the entire period and paid taxes on the fund’s distributions, and (2) assuming that an investor paid taxes on the fund’s distributions and sold all shares at the end of each period.
Calculations are based on the highest individual federal income tax and capital gains tax rates in effect at the times of the distributions and the hypothetical sales. State and local taxes were not considered. After-tax returns reflect any qualified dividend income, using actual prior-year figures and estimates for 2013. (In the example, returns after the sale of fund shares may be higher than those assuming no sale. This occurs when the sale would have produced a capital loss. The calculation assumes that the investor received a tax deduction for the loss.)
The table shows returns for one share class only; returns for other share classes will differ. Please note that your actual after-tax returns will depend on your tax situation and may differ from those shown. Also note that if you own the fund in a tax-deferred account, such as an individual retirement account or a 401(k) plan, this information does not apply to you. Such accounts are not subject to current taxes.
Finally, keep in mind that a fund’s performance—whether before or after taxes—does not guarantee future results.
Average Annual Total Returns: PRIMECAP Fund Investor Shares
Periods Ended September 30, 2013
| | | |
| | One | Five | Ten |
| | Year | Years | Years |
| Returns Before Taxes | 29.63% | 10.99% | 10.19% |
| Returns After Taxes on Distributions | 29.17 | 10.39 | 9.61 |
| Returns After Taxes on Distributions and Sale of Fund Shares | 17.41 | 8.76 | 8.46 |
28
About Your Fund’s Expenses
As a shareholder of the fund, you incur ongoing costs, which include costs for portfolio management, administrative services, and shareholder reports (like this one), among others. Operating expenses, which are deducted from a fund’s gross income, directly reduce the investment return of the fund.
A fund’s expenses are expressed as a percentage of its average net assets. This figure is known as the expense ratio. The following examples are intended to help you understand the ongoing costs (in dollars) of investing in your fund and to compare these costs with those of other mutual funds. The examples are based on an investment of $1,000 made at the beginning of the period shown and held for the entire period.
The accompanying table illustrates your fund’s costs in two ways:
• Based on actual fund return. This section helps you to estimate the actual expenses that you paid over the period. The ”Ending Account Value“ shown is derived from the fund‘s actual return, and the third column shows the dollar amount that would have been paid by an investor who started with $1,000 in the fund. You may use the information here, together with the amount you invested, to estimate the expenses that you paid over the period.
To do so, simply divide your account value by $1,000 (for example, an $8,600 account value divided by $1,000 = 8.6), then multiply the result by the number given for your fund under the heading ”Expenses Paid During Period.“
• Based on hypothetical 5% yearly return. This section is intended to help you compare your fund‘s costs with those of other mutual funds. It assumes that the fund had a yearly return of 5% before expenses, but that the expense ratio is unchanged. In this case—because the return used is not the fund’s actual return—the results do not apply to your investment. The example is useful in making comparisons because the Securities and Exchange Commission requires all mutual funds to calculate expenses based on a 5% return. You can assess your fund’s costs by comparing this hypothetical example with the hypothetical examples that appear in shareholder reports of other funds.
Note that the expenses shown in the table are meant to highlight and help you compare ongoing costs only and do not reflect transaction costs incurred by the fund for buying and selling securities. Further, the expenses do not include any purchase, redemption, or account service fees described in the fund prospectus. If such fees were applied to your account, your costs would be higher. Your fund does not carry a “sales load.”
The calculations assume no shares were bought or sold during the period. Your actual costs may have been higher or lower, depending on the amount of your investment and the timing of any purchases or redemptions.
You can find more information about the fund’s expenses, including annual expense ratios, in the Financial Statements section of this report. For additional information on operating expenses and other shareholder costs, please refer to your fund’s current prospectus.
29
| | | |
| Six Months Ended September 30, 2013 | | | |
| | Beginning | Ending | Expenses |
| | Account Value | Account Value | Paid During |
| PRIMECAP Fund | 3/31/2013 | 9/30/2013 | Period |
| Based on Actual Fund Return | | | |
| Investor Shares | $1,000.00 | $1,107.15 | $2.32 |
| Admiral Shares | 1,000.00 | 1,107.53 | 1.85 |
| Based on Hypothetical 5% Yearly Return | | | |
| Investor Shares | $1,000.00 | $1,022.86 | $2.23 |
| Admiral Shares | 1,000.00 | 1,023.31 | 1.78 |
The calculations are based on expenses incurred in the most recent six-month period. The fund’s annualized six-month expense ratios for that period are 0.44% for Investor Shares and 0.35% for Admiral Shares. The dollar amounts shown as “Expenses Paid” are equal to the annualized expense ratio multiplied by the average account value over the period, multiplied by the number of days in the most recent six-month period, then divided by the number of days in the most recent 12-month period.
30
Trustees Approve Advisory Agreement
The board of trustees of Vanguard PRIMECAP Fund has renewed the fund’s investment advisory agreement with PRIMECAP Management Company (PRIMECAP Management). The board determined that renewing the fund’s advisory arrangement was in the best interests of the fund and its shareholders.
The board based its decision upon an evaluation of the advisor’s investment staff, portfolio management process, and performance. The trustees considered the factors discussed below, among others. However, no single factor determined whether the board approved the agreement. Rather, it was the totality of the circumstances that drove the board’s decision.
Nature, extent, and quality of services
The board considered the quality of the fund’s investment management services over both the short and long term, and took into account the organizational depth and stability of the advisor. The board noted that PRIMECAP Management, founded in 1983, is recognized for its long-term approach to growth equity investing. Five experienced portfolio managers are responsible for separate subportfolios, and each portfolio manager employs a fundamental, research-driven approach in seeking to identify companies that have long-term growth potential overlooked by the market and are trading at attractive valuation levels. The firm has managed the fund since its inception in 1984.
The board concluded that the advisor’s experience, stability, depth, and performance, among other factors, warranted continuation of the advisory agreement.
Investment performance
The board considered the short- and long-term performance of the fund, including any periods of outperformance or underperformance relative to a benchmark index and peer group. The board concluded that the performance was such that the advisory arrangement should continue. Information about the fund’s most recent performance can be found in the Performance Summary section of this report.
Cost
The board concluded that the fund’s expense ratio was well below the average expense ratio charged by funds in its peer group and that the fund’s advisory fee rate was also well below its peer-group average. Information about the fund’s expenses appears in the About Your Fund’s Expenses section of this report as well as in the Financial Statements section, which also includes information about the fund’s advisory fee rate.
The board did not consider profitability of PRIMECAP Management in determining whether to approve the advisory fee, because PRIMECAP Management is independent of Vanguard and the advisory fee is the result of arm’s-length negotiations.
The benefit of economies of scale
The board concluded that the fund’s shareholders benefit from economies of scale because of breakpoints in the advisory fee schedule. The breakpoints reduce the effective rate of the fee as the fund’s assets increase.
The board will consider whether to renew the advisory agreement again after a one-year period.
31
Glossary
30-Day SEC Yield. A fund’s 30-day SEC yield is derived using a formula specified by the U.S. Securities and Exchange Commission. Under the formula, data related to the fund’s security holdings in the previous 30 days are used to calculate the fund’s hypothetical net income for that period, which is then annualized and divided by the fund’s estimated average net assets over the calculation period. For the purposes of this calculation, a security’s income is based on its current market yield to maturity (for bonds), its actual income (for asset-backed securities), or its projected dividend yield (for stocks). Because the SEC yield represents hypothetical annualized income, it will differ—at times significantly—from the fund’s actual experience. As a result, the fund’s income distributions may be higher or lower than implied by the SEC yield.
Beta. A measure of the magnitude of a fund’s past share-price fluctuations in relation to the ups and downs of a given market index. The index is assigned a beta of 1.00. Compared with a given index, a fund with a beta of 1.20 typically would have seen its share price rise or fall by 12% when the index rose or fell by 10%. For this report, beta is based on returns over the past 36 months for both the fund and the index. Note that a fund’s beta should be reviewed in conjunction with its R-squared (see definition). The lower the R-squared, the less correlation there is between the fund and the index, and the less reliable beta is as an indicator of volatility.
Dividend Yield. Dividend income earned by stocks, expressed as a percentage of the aggregate market value (or of net asset value, for a fund). The yield is determined by dividing the amount of the annual dividends by the aggregate value (or net asset value) at the end of the period. For a fund, the dividend yield is based solely on stock holdings and does not include any income produced by other investments.
Earnings Growth Rate. The average annual rate of growth in earnings over the past five years for the stocks now in a fund.
Equity Exposure. A measure that reflects a fund’s investments in stocks and stock futures. Any holdings in short-term reserves are excluded.
Expense Ratio. A fund’s total annual operating expenses expressed as a percentage of the fund’s average net assets. The expense ratio includes management and administrative expenses, but does not include the transaction costs of buying and selling portfolio securities.
Foreign Holdings. The percentage of a fund represented by securities or depositary receipts of companies based outside the United States.
Inception Date. The date on which the assets of a fund (or one of its share classes) are first invested in accordance with the fund’s investment objective. For funds with a subscription period, the inception date is the day after that period ends. Investment performance is measured from the inception date.
Median Market Cap. An indicator of the size of companies in which a fund invests; the midpoint of market capitalization (market price x shares outstanding) of a fund’s stocks, weighted by the proportion of the fund’s assets invested in each stock. Stocks representing half of the fund’s assets have market capitalizations above the median, and the rest are below it.
Price/Book Ratio. The share price of a stock divided by its net worth, or book value, per share. For a fund, the weighted average price/book ratio of the stocks it holds.
32
Price/Earnings Ratio. The ratio of a stock’s current price to its per-share earnings over the past year. For a fund, the weighted average P/E of the stocks it holds. P/E is an indicator of market expectations about corporate prospects; the higher the P/E, the greater the expectations for a company’s future growth.
R-Squared. A measure of how much of a fund’s past returns can be explained by the returns from the market in general, as measured by a given index. If a fund’s total returns were precisely synchronized with an index’s returns, its R-squared would be 1.00. If the fund’s returns bore no relationship to the index’s returns, its R-squared would be 0. For this report, R-squared is based on returns over the past 36 months for both the fund and the index.
Return on Equity. The annual average rate of return generated by a company during the past five years for each dollar of shareholder’s equity (net income divided by shareholder’s equity). For a fund, the weighted average return on equity for the companies whose stocks it holds.
Short-Term Reserves. The percentage of a fund invested in highly liquid, short-term securities that can be readily converted to cash.
Turnover Rate. An indication of the fund’s trading activity. Funds with high turnover rates incur higher transaction costs and may be more likely to distribute capital gains (which may be taxable to investors). The turnover rate excludes in-kind transactions, which have minimal impact on costs.
33
This page intentionally left blank.
This page intentionally left blank.
The People Who Govern Your Fund
The trustees of your mutual fund are there to see that the fund is operated and managed in your best interests since, as a shareholder, you are a part owner of the fund. Your fund’s trustees also serve on the board of directors of The Vanguard Group, Inc., which is owned by the Vanguard funds and provides services to them on an at-cost basis.
A majority of Vanguard’s board members are independent, meaning that they have no affiliation with Vanguard or the funds they oversee, apart from the sizable personal investments they have made as private individuals. The independent board members have distinguished backgrounds in business, academia, and public service. Each of the trustees and executive officers oversees 181 Vanguard funds.
The following table provides information for each trustee and executive officer of the fund. More information about the trustees is in the Statement of Additional Information, which can be obtained, without charge, by contacting Vanguard at 800-662-7447, or online at vanguard.com.
| |
| InterestedTrustee1 | and Delphi Automotive LLP (automotive components); |
| | Senior Advisor at New Mountain Capital; Trustee of |
| F. William McNabb III | The Conference Board. |
| Born 1957. Trustee Since July 2009. Chairman of the | |
| Board. Principal Occupation(s) During the Past Five | Amy Gutmann |
| Years: Chairman of the Board of The Vanguard Group, | Born 1949. Trustee Since June 2006. Principal |
| Inc., and of each of the investment companies served | Occupation(s) During the Past Five Years: President |
| by The Vanguard Group, since January 2010; Director | of the University of Pennsylvania; Christopher H. |
| of The Vanguard Group since 2008; Chief Executive | Browne Distinguished Professor of Political Science |
| Officer and President of The Vanguard Group and of | in the School of Arts and Sciences with secondary |
| each of the investment companies served by The | appointments at the Annenberg School for |
| Vanguard Group since 2008; Director of Vanguard | Communication and the Graduate School of Education |
| Marketing Corporation; Managing Director of The | of the University of Pennsylvania; Member of the |
| Vanguard Group (1995–2008). | National Commission on the Humanities and Social |
| | Sciences; Trustee of Carnegie Corporation of New |
| IndependentTrustees | York and of the National Constitution Center; Chair |
| | of the U. S. Presidential Commission for the Study |
| Emerson U. Fullwood | of Bioethical Issues. |
| Born 1948. Trustee Since January 2008. Principal | |
| Occupation(s) During the Past Five Years: Executive | JoAnn Heffernan Heisen |
| Chief Staff and Marketing Officer for North America | Born 1950. Trustee Since July 1998. Principal |
| and Corporate Vice President (retired 2008) of Xerox | Occupation(s) During the Past Five Years: Corporate |
| Corporation (document management products and | Vice President and Chief Global Diversity Officer |
| services); Executive in Residence and 2010 | (retired 2008) and Member of the Executive |
| Distinguished Minett Professor at the Rochester | Committee (1997–2008) of Johnson & Johnson |
| Institute of Technology; Director of SPX Corporation | (pharmaceuticals/medical devices/consumer |
| (multi-industry manufacturing), the United Way of | products); Director of Skytop Lodge Corporation |
| Rochester, Amerigroup Corporation (managed health | (hotels), the University Medical Center at Princeton, |
| care), the University of Rochester Medical Center, | the Robert Wood Johnson Foundation, and the Center |
| Monroe Community College Foundation, and North | of the Maxwell School of Citizenship and Public Affairs |
| Carolina A&T University. | at Syracuse University. |
| |
| Rajiv L. Gupta | F. Joseph Loughrey |
| Born 1945. Trustee Since December 2001. 2 | Born 1949. Trustee Since October 2009. Principal |
| Principal Occupation(s) During the Past Five Years: | Occupation(s) During the Past Five Years: President |
| Chairman and Chief Executive Officer (retired 2009) | and Chief Operating Officer (retired 2009) of Cummins |
| and President (2006–2008) of Rohm and Haas Co. | Inc. (industrial machinery); Chairman of the Board of |
| (chemicals); Director of Tyco International, Ltd. | Hillenbrand, Inc. (specialized consumer services) and |
| (diversified manufacturing and services), Hewlett- | of Oxfam America; Director of SKF AB (industrial |
| Packard Co. (electronic computer manufacturing), | |
| | |
| machinery) and the Lumina Foundation for Education; | Executive Officers | |
| Member of the Advisory Council for the College of | | |
| Arts and Letters and of the Advisory Board to the | Glenn Booraem | |
| Kellogg Institute for International Studies, both at | Born 1967. Controller Since July 2010. Principal |
| the University of Notre Dame. | Occupation(s) During the Past Five Years: Principal |
| | of The Vanguard Group, Inc.; Controller of each of |
| Mark Loughridge | the investment companies served by The Vanguard |
| Born 1953. Trustee Since March 2012. Principal | Group; Assistant Controller of each of the investment |
| Occupation(s) During the Past Five Years: Senior Vice | companies served by The Vanguard Group (2001–2010). |
| President and Chief Financial Officer at IBM (information | | |
| technology services); Fiduciary Member of IBM’s | Thomas J. Higgins | |
| Retirement Plan Committee. | Born 1957. Chief Financial Officer Since September |
| | 2008. Principal Occupation(s) During the Past Five |
| Scott C. Malpass | Years: Principal of The Vanguard Group, Inc.; Chief |
| Born 1962. Trustee Since March 2012. Principal | Financial Officer of each of the investment companies |
| Occupation(s) During the Past Five Years: Chief | served by The Vanguard Group; Treasurer of each of |
| Investment Officer and Vice President at the University | the investment companies served by The Vanguard |
| of Notre Dame; Assistant Professor of Finance at the | Group (1998–2008). | |
| Mendoza College of Business at Notre Dame; Member | | |
| of the Notre Dame 403(b) Investment Committee; | Kathryn J. Hyatt | |
| Director of TIFF Advisory Services, Inc. (investment | Born 1955. Treasurer Since November 2008. Principal |
| advisor); Member of the Investment Advisory | Occupation(s) During the Past Five Years: Principal of |
| Committees of the Financial Industry Regulatory | The Vanguard Group, Inc.; Treasurer of each of the |
| Authority (FINRA) and of Major League Baseball. | investment companies served by The Vanguard |
| | Group; Assistant Treasurer of each of the investment |
| André F. Perold | companies served by The Vanguard Group (1988–2008). |
| Born 1952. Trustee Since December 2004. Principal | | |
| Occupation(s) During the Past Five Years: George | Heidi Stam | |
| Gund Professor of Finance and Banking at the Harvard | Born 1956. Secretary Since July 2005. Principal |
| Business School (retired 2011); Chief Investment | Occupation(s) During the Past Five Years: Managing |
| Officer and Managing Partner of HighVista Strategies | Director of The Vanguard Group, Inc.; General Counsel |
| LLC (private investment firm); Director of Rand | of The Vanguard Group; Secretary of The Vanguard |
| Merchant Bank; Overseer of the Museum of Fine | Group and of each of the investment companies |
| Arts Boston. | served by The Vanguard Group; Director and Senior |
| | Vice President of Vanguard Marketing Corporation. |
| Alfred M. Rankin, Jr. | | |
| Born 1941. Trustee Since January 1993. Principal | Vanguard Senior ManagementTeam |
| Occupation(s) During the Past Five Years: Chairman, | | |
| President, and Chief Executive Officer of NACCO | Mortimer J. Buckley | Chris D. McIsaac |
| Industries, Inc. (housewares/lignite) and of Hyster-Yale | Kathleen C. Gubanich | Michael S. Miller |
| Materials Handling, Inc. (forklift trucks); Director of | Paul A. Heller | James M. Norris |
| the National Association of Manufacturers; Chairman | Martha G. King | Glenn W. Reed |
| of the Board of University Hospitals of Cleveland; | John T. Marcante | |
| Advisory Chairman of the Board of The Cleveland | | |
| Museum of Art. | |
| |
| Peter F. Volanakis | Chairman Emeritus and Senior Advisor | |
| Born 1955. Trustee Since July 2009. Principal | John J. Brennan | |
| Occupation(s) During the Past Five Years: President | Chairman, 1996–2009 | |
| and Chief Operating Officer (retired 2010) of Corning | Chief Executive Officer and President, 1996–2008 | |
| Incorporated (communications equipment); Director | | |
| of SPX Corporation (multi-industry manufacturing); | Founder | |
| Overseer of the Amos Tuck School of Business | John C. Bogle | |
| Administration at Dartmouth College; Advisor to the | Chairman and Chief Executive Officer, 1974–1996 | |
| Norris Cotton Cancer Center. | | |
1 Mr. McNabb is considered an “interested person,” as defined in the Investment Company Act of 1940, because he is an officer of the Vanguard funds.
2 December 2002 for Vanguard Equity Income Fund, Vanguard Growth Equity Fund, the Vanguard Municipal Bond Funds, and the Vanguard State Tax-Exempt Funds.
|  |
| P.O. Box 2600 |
| Valley Forge, PA 19482-2600 |
Connect with Vanguard® > vanguard.com
| |
| Fund Information > 800-662-7447 | |
| Direct Investor Account Services > 800-662-2739 | |
| Institutional Investor Services > 800-523-1036 | |
| Text Telephone for People | |
| With Hearing Impairment > 800-749-7273 | |
| |
| This material may be used in conjunction | |
| with the offering of shares of any Vanguard | |
| fund only if preceded or accompanied by | |
| the fund’s current prospectus. | |
| |
| All comparative mutual fund data are from Lipper, a | |
| Thomson Reuters Company, or Morningstar, Inc., unless | |
| otherwise noted. | |
| |
| You can obtain a free copy of Vanguard’s proxy voting | |
| guidelines by visiting vanguard.com/proxyreporting or by | |
| calling Vanguard at 800-662-2739. The guidelines are | |
| also available from the SEC’s website, sec.gov. In | |
| addition, you may obtain a free report on how your fund | |
| voted the proxies for securities it owned during the 12 | |
| months ended June 30. To get the report, visit either | |
| vanguard.com/proxyreporting or sec.gov. | |
| |
| You can review and copy information about your fund at | |
| the SEC’s Public Reference Room in Washington, D.C. To | |
| find out more about this public service, call the SEC at | |
| 202-551-8090. Information about your fund is also | |
| available on the SEC’s website, and you can receive | |
| copies of this information, for a fee, by sending a | |
| request in either of two ways: via e-mail addressed to | |
| publicinfo@sec.gov or via regular mail addressed to the | |
| Public Reference Section, Securities and Exchange | |
| Commission, Washington, DC 20549-1520. | |
| |
| | © 2013 The Vanguard Group, Inc. |
| | All rights reserved. |
| | Vanguard Marketing Corporation, Distributor. |
| |
| | Q590 112013 |

Annual Report | September 30, 2013
Vanguard Target Retirement Funds

Vanguard’s Principles for Investing Success
We want to give you the best chance of investment success. These principles, grounded in Vanguard’s research and experience, can put you on the right path.
Goals. Create clear, appropriate investment goals.
Balance. Develop a suitable asset allocation using broadly diversified funds. Cost. Minimize cost.
Discipline. Maintain perspective and long-term discipline.
A single theme unites these principles: Focus on the things you can control.
We believe there is no wiser course for any investor.
| |
| Contents | |
| Your Fund’s Total Returns. | 1 |
| Chairman’s Letter. | 2 |
| Target Retirement Income Fund. | 9 |
| Target Retirement 2010 Fund. | 18 |
| Target Retirement 2015 Fund. | 28 |
| Target Retirement 2020 Fund. | 38 |
| Target Retirement 2025 Fund. | 48 |
| Target Retirement 2030 Fund. | 58 |
| Your Fund’s After-Tax Returns. | 70 |
| About Your Fund’s Expenses. | 72 |
| Glossary. | 74 |
Please note: The opinions expressed in this report are just that—informed opinions. They should not be considered promises or advice.
Also, please keep in mind that the information and opinions cover the period through the date on the front of this report. Of course, the risks of investing in your fund are spelled out in the prospectus.
See the Glossary for definitions of investment terms used in this report.
About the cover: The ship's wheel represents leadership and guidance, essential qualities in navigating difficult seas.
This one is a replica based on an 18th-century British vessel. The HMS Vanguard, another ship of that era, served as the flagship for Admiral Horatio Nelson when he defeated a French fleet at the Battle of the Nile.
| |
| Your Fund’s Total Returns | |
| |
| |
| |
| |
| Fiscal Year Ended September 30, 2013 | |
| | Total |
| | Returns |
| Vanguard Target Retirement Income Fund | 4.12% |
| Target Income Composite Index | 4.26 |
| Mixed-Asset Target Allocation Conservative Funds Average | 4.94 |
| Mixed-Asset Target Allocation Conservative Funds Average: Derived from data provided by Lipper, a Thomson Reuters Company. | |
| |
| Vanguard Target Retirement 2010 Fund | 6.76% |
| Target 2010 Composite Index | 6.98 |
| Mixed-Asset Target 2010 Funds Average | 6.25 |
| Mixed-Asset Target 2010 Funds Average: Derived from data provided by Lipper, a Thomson Reuters Company. | |
| |
| Vanguard Target Retirement 2015 Fund | 9.56% |
| Target 2015 Composite Index | 9.81 |
| Mixed-Asset Target 2015 Funds Average | 6.94 |
| Mixed-Asset Target 2015 Funds Average: Derived from data provided by Lipper, a Thomson Reuters Company. | |
| |
| Vanguard Target Retirement 2020 Fund | 11.70% |
| Target 2020 Composite Index | 11.94 |
| Mixed-Asset Target 2020 Funds Average | 8.31 |
| Mixed-Asset Target 2020 Funds Average: Derived from data provided by Lipper, a Thomson Reuters Company. | |
| |
| Vanguard Target Retirement 2025 Fund | 13.34% |
| Target 2025 Composite Index | 13.61 |
| Mixed-Asset Target 2025 Funds Average | 11.45 |
| Mixed-Asset Target 2025 Funds Average: Derived from data provided by Lipper, a Thomson Reuters Company. | |
| |
| Vanguard Target Retirement 2030 Fund | 15.05% |
| Target 2030 Composite Index | 15.30 |
| Mixed-Asset Target 2030 Funds Average | 12.61 |
| Mixed-Asset Target 2030 Funds Average: Derived from data provided by Lipper, a Thomson Reuters Company. | |
| |
| For a benchmark description, see the Glossary. | |
Investments in Target Retirement Funds are subject to the risks of their underlying funds. The year in the fund name refers to the approximate year (the target date) when an investor in the fund would retire and leave the work force. The fund will gradually shift its emphasis from more aggressive investments to more conservative ones based on its target date. An investment in a Target Retirement Fund is not guaranteed at any time, including on or after the target date.
1

Chairman’s Letter
Dear Shareholder,
Global stock markets advanced during the fiscal year ended September 30, 2013, but bond markets fell as uncertainty grew around the Federal Reserve’s plans to reduce its $85 billion-a-month bond-buying stimulus program.
The six Vanguard Target Retirement Funds reviewed in this report—the Income Fund as well as the funds dated 2010 through 2030—were particularly sensitive to weakness in the bond market because they hold larger allocations to bonds than do longer-dated funds in the series. (The Target Retirement Funds dated 2035 through 2060 are discussed in a separate report.)
Despite the recent volatility in bond markets, the Target Retirement Funds covered here produced returns ranging from 4.12% to 15.05% for the fiscal year. As you would expect, the funds with the heaviest allocation to stocks performed best. Short-term challenges notwithstanding, we continue to believe that bonds are a good cushion to equity market volatility, and that a higher allocation to bonds can reduce the total risk in your portfolio over the long term.
Stocks dodged obstacles to produce strong gains
Although their path wasn’t always smooth, U.S. stocks powered to a return of about 22% for the 12 months ended September 30. The U.S. economy delivered
2
only modest growth over the fiscal year, but investors’ appetite for risk seemed to increase faster than companies’ profits.
In mid-September, U.S. stocks jumped when the Federal Reserve surprised investors by announcing that it had no immediate plans to unwind its stimulative bond-buying program. But in the waning days of that month, stocks slid ahead of the partial federal government shutdown that began October 1.
It’s natural for investors to be concerned by the situation in Washington. But as Sarah Hammer, a senior analyst in Vanguard Investment Strategy Group, noted in the midst of the temporary shutdown, they shouldn’t be unduly influenced by these events. “Investors are often best served by sticking to their long-term investment plans and avoiding short-term decisions based on the legislative outlook,” Ms. Hammer said. Our recurrent advice to stick to your plan may lack pizzazz, but it’s proven to be sound counsel over the decades.
International stocks generally posted strong results. Emerging-market stocks, however, lagged amid worries about slowing economic growth.
Bond returns were negative despite September’s bounce
Bonds posted declines for the year. However, bonds trimmed their losses in September after the Fed said it would continue its bond-buying program.
| | | |
| Market Barometer | | | |
| |
| | | Average Annual Total Returns |
| | Periods Ended September 30, 2013 |
| | One | Three | Five |
| | Year | Years | Years |
| Stocks | | | |
| Russell 1000 Index (Large-caps) | 20.91% | 16.64% | 10.53% |
| Russell 2000 Index (Small-caps) | 30.06 | 18.29 | 11.15 |
| Russell 3000 Index (Broad U.S. market) | 21.60 | 16.76 | 10.58 |
| MSCI All Country World Index ex USA (International) | 16.48 | 5.95 | 6.26 |
| |
| Bonds | | | |
| Barclays U.S. Aggregate Bond Index (Broad taxable market) | -1.68% | 2.86% | 5.41% |
| Barclays Municipal Bond Index (Broad tax-exempt market) | -2.21 | 3.24 | 5.98 |
| Citigroup Three-Month U.S. Treasury Bill Index | 0.07 | 0.07 | 0.14 |
| |
| CPI | | | |
| Consumer Price Index | 1.18% | 2.34% | 1.37% |
3
The broad U.S. taxable bond market returned –1.68% for the fiscal year, and the yield of the 10-year Treasury note closed at 2.63%, down from 2.76% a month earlier. (Bond yields and prices move in opposite directions.) Municipal bonds returned –2.21% after rebounding a bit in September.
Money markets and savings accounts barely budged as the Fed’s target for short-term interest rates remained at 0%–0.25%.
Strength of underlying stock funds tempered the bond funds’ declines
Target Retirement Funds provide investors with professionally managed, diversified portfolios composed of up to five underlying funds. Depending on when an investor expects to retire, these “funds of funds” gradually shift their allocation from stocks to bonds along a predetermined path. Once the target date is reached, these funds continue to adjust until they enter an income phase, when the portfolio will convert to the Target Retirement Income Fund. The Income Fund, which represents a static allocation of about 70% bonds and 30% stocks, is mostly focused on helping investors generate income and preserve their wealth.
As I mentioned earlier, the performance of the Target Retirement Funds for the fiscal year ended September 30 was largely influenced by the extent of their exposure to stocks. The Target Retirement
| | |
| Expense Ratios | | |
| Your Fund Compared With Its Peer Group | | |
| | Acquired Fund Fees | Peer Group |
| | and Expenses | Average |
| Target Retirement Income Fund | 0.16% | 0.92% |
| Target Retirement 2010 Fund | 0.16 | 0.53 |
| Target Retirement 2015 Fund | 0.16 | 0.53 |
| Target Retirement 2020 Fund | 0.16 | 0.58 |
| Target Retirement 2025 Fund | 0.17 | 0.51 |
| Target Retirement 2030 Fund | 0.17 | 0.57 |
The fund expense figures shown—drawn from the prospectus dated August 12, 2013—represent an estimate of the weighted average of the expense ratios and any transaction fees charged by the underlying mutual funds (the ”acquired” funds) in which the Target Retirement Funds invest. The Target Retirement Funds do not charge any expenses or fees of their own. For the fiscal year ended September 30, 2013, the acquired fund fees and expenses were 0.16% for the Income Fund, 0.16% for the 2010 Fund, 0.16% for the 2015 Fund, 0.16% for the 2020 Fund, 0.17% for the 2025 Fund, and 0.17% for the 2030 Fund. Peer-group expense ratios are derived from data provided by Lipper, a Thomson Reuters Company, and capture information through year-end 2012.
Peer groups: For the Income Fund, Mixed-Asset Target Allocation Conservative Funds; for the 2010 Fund, Mixed-Asset Target 2010 Funds; for the 2015 Fund, Mixed-Asset Target 2015 Funds; for the 2020 Fund, Mixed-Asset Target 2020 Funds; for the 2025 Fund, Mixed-Asset Target 2025 Funds, and for the Target Retirement 2030 Fund, Mixed-Asset Target 2030 Funds.
4
| |
| Total Returns | |
| Inception Through September 30, 2013 | |
| | Average |
| | Annual Return |
| Target Retirement Income Fund (Returns since inception: 10/27/2003) | 5.54% |
| Target Income Composite Index | 5.54 |
| Mixed-Asset Target Allocation Conservative Funds Average | 4.46 |
| Mixed-Asset Target Allocation Conservative Funds Average: Derived from data provided by Lipper, a Thomson Reuters Company. |
| |
| Target Retirement 2010 Fund (Returns since inception: 6/7/2006) | 5.74% |
| Target 2010 Composite Index | 5.74 |
| Mixed-Asset Target 2010 Funds Average | 4.36 |
| Mixed-Asset Target 2010 Funds Average: Derived from data provided by Lipper, a Thomson Reuters Company. | |
| |
| Target Retirement 2015 Fund (Returns since inception: 10/27/2003) | 6.27% |
| Target 2015 Composite Index | 6.26 |
| Mixed-Asset Target 2015 Funds Average | 5.03 |
| Mixed-Asset Target 2015 Funds Average: Derived from data provided by Lipper, a Thomson Reuters Company. | |
| |
| Target Retirement 2020 Fund (Returns since inception: 6/7/2006) | 5.93% |
| Target 2020 Composite Index | 6.01 |
| Mixed-Asset Target 2020 Funds Average | 4.55 |
| Mixed-Asset Target 2020 Funds Average: Derived from data provided by Lipper, a Thomson Reuters Company. | |
| |
| Target Retirement 2025 Fund (Returns since inception: 10/27/2003) | 6.53% |
| Target 2025 Composite Index | 6.62 |
| Mixed-Asset Target 2025 Funds Average | 5.96 |
| Mixed-Asset Target 2025 Funds Average: Derived from data provided by Lipper, a Thomson Reuters Company. | |
| |
| Target Retirement 2030 Fund (Returns since inception: 6/7/2006) | 5.86% |
| Target 2030 Composite Index | 5.97 |
| Mixed-Asset Target 2030 Funds Average | 4.64 |
| Mixed-Asset Target 2030 Funds Average: Derived from data provided by Lipper, a Thomson Reuters Company. | |
| For a benchmark description, see the Glossary. | |
The figures shown represent past performance, which is not a guarantee of future results. (Current performance may be lower or higher than the performance data cited. For performance data current to the most recent month-end, visit our website at vanguard.com/performance.) Note, too, that both investment returns and principal value can fluctuate widely, so an investor’s shares, when sold, could be worth more or less than their original cost.
5
2030 Fund, which invested more than 75% of its assets in stocks, produced the strongest result, with a 15.05% return. The Income Fund, the most conservative of the group, was the weakest performer, with a 4.12% return. The results of the four other funds fell in between.
Among the funds’ underlying investments, Vanguard Total Stock Market Index Fund stood out with a 21.36% gain for the fiscal year. (The returns here are for Investor Shares of the underlying index funds.) U.S. stocks benefited from increased investor confidence in most sectors, particularly financials, where the recovering housing and labor markets have made investing more attractive.
Vanguard Total International Stock Index Fund produced an impressive 17.06% result for the 12 months, buoyed largely by the strength of developed markets in Europe.
Results for the underlying bond funds were a different story. Vanguard Total Bond Market II Index Fund, a component of all six funds covered in this report, returned –1.93% for the fiscal year. Two other underlying bond funds—Vanguard Total International Bond Index Fund (launched May 31, 2013) and Vanguard Short-Term Inflation-Protected Securities Index Fund (launched October 16, 2012)—didn’t do much better, though neither had a full year’s results by September 30.
The Total International Bond Index Fund, which is included in each of the Target Retirement Funds, returned –0.54% from its inception date through the fiscal year-end. And the Short-Term Inflation-Protected Securities Index Fund, which is held in the three most conservative portfolios (the Income Fund, 2010 Fund, and 2015 Fund) returned –0.40% from May 31, the date when it joined the portfolios, through September 30.
After a volatile decade, funds are still on target
Three of the funds in this report—the Target Retirement Income Fund, Target Retirement 2015 Fund, and Target Retirement 2025 Fund—marked their tenth anniversaries in October. (The three other funds are younger.) Over the years, each of these funds has experienced volatility in both the stock market and, more recently, the bond market.
The funds have successfully achieved their goals of providing retirement investors with balanced and diversified portfolios that automatically adjust over time to control risk. Each fund’s average annual return has exceeded that of its peer group.
The quality of the underlying index funds has been crucial to the funds’ strong records. Credit goes to Vanguard’s Equity Investment Group and Fixed Income Group, whose skilled portfolio construction and management have enabled the
6
underlying index funds to successfully track their benchmarks while keeping the associated costs very low.
Our Target Retirement Funds have continued to evolve. Over the past year, the funds further diversified their portfolios by adding an international bond component. We also adjusted our approach to inflation and interest rate risk in the most conservative funds by adding the Short-Term Inflation-Protected Securities Index Fund, which replaced a longer-term inflation-protected securities fund.
Target Retirement Funds empower investors saving for their retirement
I am pleased that Vanguard has been able to offer investors Target Retirement Funds for a decade. As you may be aware, these types of single-fund offerings have had a significant impact on the way millions of Americans save for retirement. They’ve made the process more accessible, transparent, and convenient for investors, many of whom have neither the time nor the inclination to manage a retirement portfolio.
The presence of Vanguard Target Retirement Funds in employer-sponsored and individual retirement plans has expanded dramatically over the past ten years. This has enabled investors to create well-diversified, balanced portfolios for the long term consistent with Vanguard’s core investment principles.
Although it’s often tempting to react to blaring headlines as the stock or bond markets fluctuate, we believe it’s important that you stay the course and stick to your long-term goals. The Target Retirement Funds, through their mix of underlying stock and bond funds, help you do this by automatically rebalancing and adjusting based on the funds’ target retirement dates.
While they can’t entirely shield you from volatility, the Target Retirement Funds can help you navigate the market’s challenges as you move closer to your retirement goals.
As always, thank you for investing with Vanguard.
Sincerely,

F. William McNabb III
Chairman and Chief Executive Officer
October 11, 2013
7
| | | | |
| Your Fund’s Performance at a Glance | | | | |
| September 30, 2012, Through September 30, 2013 | | | | |
| | | | Distributions Per Share |
| | Starting | Ending | Income | Capital |
| | Share Price | Share Price | Dividends | Gains |
| Target Retirement Income Fund | $12.23 | $12.46 | $0.247 | $0.021 |
| Target Retirement 2010 Fund | $24.45 | $25.50 | $0.531 | $0.037 |
| Target Retirement 2015 Fund | $13.54 | $14.49 | $0.298 | $0.018 |
| Target Retirement 2020 Fund | $24.04 | $26.26 | $0.508 | $0.026 |
| Target Retirement 2025 Fund | $13.70 | $15.18 | $0.296 | $0.012 |
| Target Retirement 2030 Fund | $23.51 | $26.46 | $0.499 | $0.015 |
8
Target Retirement Income Fund
Fund Profile
As of September 30, 2013
| |
| Total Fund Characteristics | |
| |
| Ticker Symbol | VTINX |
| 30-Day SEC Yield | 1.75% |
| Acquired Fund Fees and Expenses1 | 0.16% |
| |
| Allocation to Underlying Vanguard Funds | |
| Vanguard Total Bond Market II Index Fund | |
| Investor Shares | 39.3% |
| Vanguard Total Stock Market Index Fund | |
| Investor Shares | 20.9 |
| Vanguard Short-Term Inflation-Protected | |
| Securities Index Fund Investor Shares | 16.8 |
| Vanguard Total International Bond Index | |
| Fund Investor Shares | 14.0 |
| Vanguard Total International Stock Index | |
| Fund Investor Shares | 9.0 |
| | |
| Total Fund Volatility Measures | |
| | Target | Barclays |
| | Income | Aggregate |
| | Composite | Bond |
| | Index | Index |
| R-Squared | 1.00 | 0.07 |
| Beta | 1.01 | 0.41 |
These measures show the degree and timing of the fund’s fluctuations compared with the indexes over 36 months.
Fund Asset Allocation
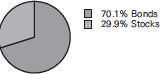
1 This figure—drawn from the prospectus dated August 12, 2013—represents an estimate of the weighted average of the expense ratios and any transaction fees charged by the underlying mutual funds (the ”acquired” funds) in which the Target Retirement Income Fund invests. The fund does not charge any expenses or fees of its own. For the fiscal year ended September 30, 2013, the acquired fund fees and expenses were 0.16%.
9
Target Retirement Income Fund
Performance Summary
All of the returns in this report represent past performance, which is not a guarantee of future results that may be achieved by the fund. (Current performance may be lower or higher than the performance data cited. For performance data current to the most recent month-end, visit our website at vanguard.com/performance.) Note, too, that both investment returns and principal value can fluctuate widely, so an investor’s shares, when sold, could be worth more or less than their original cost. The returns shown do not reflect taxes that a shareholder would pay on fund distributions or on the sale of fund shares.
Cumulative Performance: October 27, 2003, Through September 30, 2013
Initial Investment of $10,000
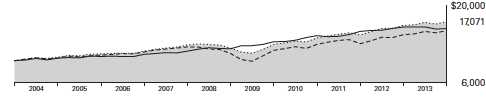
| | | | | |
| | | | Average Annual Total Returns | |
| | | Periods Ended September 30, 2013 | |
| | | | | Since | Final Value |
| | | One | Five | Inception | of a $10,000 |
| | | Year | Years | (10/27/2003) | Investment |
| | Target Retirement Income Fund | 4.12% | 6.83% | 5.54% | $17,071 |
| •••••••• | Target Income Composite Index | 4.26 | 6.84 | 5.54 | 17,085 |
| – – – – | Mixed-Asset Target Allocation | | | | |
| |
| | Barclays Conservative U.S. Funds Aggregate Average Bond Index | -1.68 4.94 | 5.41 6.42 | 4.73 4.46 | 15,820 15,425 |
For a benchmark description, see the Glossary.
Mixed-Asset Target Allocation Conservative Funds Average: Derived from data provided by Lipper, a Thomson Reuters Company.
"Since Inception" performance is calculated from the inception date for both the fund and its comparative standards.
See Financial Highlights for dividend and capital gains information.
10
Target Retirement Income Fund
Fiscal-Year Total Returns (%): October 27, 2003, Through September 30, 2013
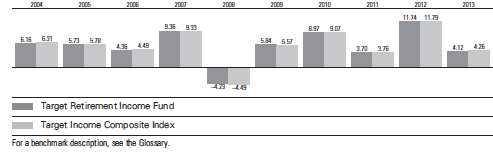
11
Target Retirement Income Fund
Financial Statements
Statement of Net Assets
As of September 30, 2013
The fund reports a complete list of its holdings in regulatory filings four times in each fiscal year, at the quarter-ends. For the second and fourth fiscal quarters, the lists appear in the fund’s semiannual and annual reports to shareholders. For the first and third fiscal quarters, the fund files the lists with the Securities and Exchange Commission on Form N-Q. Shareholders can look up the fund’s Forms N-Q on the SEC’s website at sec.gov. Forms N-Q may also be reviewed and copied at the SEC’s Public Reference Room (see the back cover of this report for further information).
| | |
| | | Market |
| | | Value |
| | Shares | ($000) |
| Investment Companies (100.0%) | | |
| U.S. Stock Fund (20.9%) | | |
| Vanguard Total Stock Market Index Fund Investor Shares | 49,893,797 | 2,126,474 |
| |
| International Stock Fund (9.0%) | | |
| Vanguard Total International Stock Index Fund Investor Shares | 56,708,837 | 914,147 |
| |
| U.S. Bond Funds (56.1%) | | |
| 1 Vanguard Total Bond Market II Index Fund Investor Shares | 377,279,753 | 3,995,392 |
| Vanguard Short-Term Inflation-Protected Securities Index Fund Investor Shares | 68,873,564 | 1,704,621 |
| | | 5,700,013 |
| International Bond Fund (14.0%) | | |
| Vanguard Total International Bond Index Fund Investor Shares | 143,412,455 | 1,419,783 |
| Total Investment Companies (Cost $9,259,974) | | 10,160,417 |
| Other Assets and Liabilities (0.0%) | | |
| Other Assets | | 75,348 |
| Liabilities | | (73,137) |
| | | 2,211 |
| Net Assets (100%) | | |
| Applicable to 815,755,850 outstanding $.001 par value shares of | | |
| beneficial interest (unlimited authorization) | | 10,162,628 |
| Net Asset Value Per Share | | $12.46 |
| |
| |
| At September 30, 2013, net assets consisted of: | | |
| | | Amount |
| | | ($000) |
| Paid-in Capital | | 9,101,334 |
| Undistributed Net Investment Income | | 4,559 |
| Accumulated Net Realized Gains | | 156,292 |
| Unrealized Appreciation (Depreciation) | | 900,443 |
| Net Assets | | 10,162,628 |
See Note A in Notes to Financial Statements.
1 Affiliated fund available only to Vanguard funds and certain trusts and accounts managed by Vanguard.
See accompanying Notes, which are an integral part of the Financial Statements.
12
| |
| Target Retirement Income Fund | |
| |
| |
| Statement of Operations | |
| |
| | Year Ended |
| | September 30, 2013 |
| | ($000) |
| Investment Income | |
| Income | |
| Income Distributions Received | 199,821 |
| Net Investment Income—Note B | 199,821 |
| Realized Net Gain (Loss) | |
| Capital Gain Distributions Received | 52,275 |
| Investment Securities Sold | 184,900 |
| Realized Net Gain (Loss) | 237,175 |
| Change in Unrealized Appreciation (Depreciation) of Investment Securities | (40,097) |
| Net Increase (Decrease) in Net Assets Resulting from Operations | 396,899 |
See accompanying Notes, which are an integral part of the Financial Statements.
13
| | |
| Target Retirement Income Fund | | |
| |
| |
| Statement of Changes in Net Assets | | |
| |
| | Year Ended September 30, |
| | 2013 | 2012 |
| | ($000) | ($000) |
| Increase (Decrease) in Net Assets | | |
| Operations | | |
| Net Investment Income | 199,821 | 172,142 |
| Realized Net Gain (Loss) | 237,175 | 37,941 |
| Change in Unrealized Appreciation (Depreciation) | (40,097) | 522,955 |
| Net Increase (Decrease) in Net Assets Resulting from Operations | 396,899 | 733,038 |
| Distributions | | |
| Net Investment Income | (200,619) | (168,784) |
| Realized Capital Gain1 | (16,647) | (9,699) |
| Total Distributions | (217,266) | (178,483) |
| Capital Share Transactions | | |
| Issued | 3,006,065 | 3,254,326 |
| Issued in Connection with Acquisition of | | |
| Vanguard Target Retirement 2005 Fund—Note G | — | 2,192,576 |
| Issued in Lieu of Cash Distributions | 209,124 | 171,526 |
| Redeemed | (2,614,401) | (1,555,508) |
| Net Increase (Decrease) from Capital Share Transactions | 600,788 | 4,062,920 |
| Total Increase (Decrease) | 780,421 | 4,617,475 |
| Net Assets | | |
| Beginning of Period | 9,382,207 | 4,764,732 |
| End of Period2 | 10,162,628 | 9,382,207 |
1 Includes fiscal 2013 and 2012 short-term gain distributions totaling $16,647,000 and $9,699,000, respectively. Short-term gain distributions are treated as ordinary income dividends for tax purposes.
2 Net Assets—End of Period includes undistributed net investment income of $4,559,000 and $5,357,000.
See accompanying Notes, which are an integral part of the Financial Statements.
14
| | | | | |
| Target Retirement Income Fund | | | | | |
| |
| |
| Financial Highlights | | | | | |
| |
| |
| |
| For a Share Outstanding | | | Year Ended September 30, |
| Throughout Each Period | 2013 | 2012 | 2011 | 2010 | 2009 |
| Net Asset Value, Beginning of Period | $12.23 | $11.22 | $11.13 | $10.49 | $10.19 |
| Investment Operations | | | | | |
| Net Investment Income | . 246 | .275 | .3031 | .288 | .268 |
| Capital Gain Distributions Received | .067 | .052 | .0301 | — | — |
| Net Realized and Unrealized Gain (Loss) | | | | | |
| on Investments | .185 | .977 | .080 | .640 | .302 |
| Total from Investment Operations | .498 | 1.304 | .413 | .928 | .570 |
| Distributions | | | | | |
| Dividends from Net Investment Income | (.247) | (.273) | (. 299) | (. 288) | (.270) |
| Distributions from Realized Capital Gains | (.021) | (.021) | (.024) | — | — |
| Total Distributions | (.268) | (.294) | (. 323) | (. 288) | (.270) |
| Net Asset Value, End of Period | $12.46 | $12.23 | $11.22 | $11.13 | $10.49 |
| |
| Total Return2 | 4.12% | 11.74% | 3.70% | 8.97% | 5.84% |
| |
| Ratios/Supplemental Data | | | | | |
| Net Assets, End of Period (Millions) | $10,163 | $9,382 | $4,765 | $3,623 | $2,463 |
| Ratio of Total Expenses to | | | | | |
| Average Net Assets | — | — | — | — | — |
| Acquired Fund Fees and Expenses | 0.16% | 0.16% | 0.17% | 0.17% | 0.21% |
| Ratio of Net Investment Income to | | | | | |
| Average Net Assets | 1.99% | 2.31% | 2.65% | 2.70% | 2.78% |
| Portfolio Turnover Rate | 40% | 7% | 14%3 | 12% | 29%4 |
1 Calculated based on average shares outstanding.
2 Total returns do not include account service fees that may have applied in the periods shown. Fund prospectuses provide information about any applicable account service fees.
3 Excludes the value of mutual fund shares delivered and received in connection with a change in the fund’s international equity investments from Vanguard European, Pacific, and Emerging Markets Stock Index Funds to Vanguard Total International Stock Index Fund because those transactions were effected in kind and did not cause the fund to incur transaction costs.
4 Excludes the value of mutual fund shares delivered and received in connection with a change in the fund’s bond investments from Vanguard Total Bond Market Index Fund to Vanguard Total Bond Market II Index Fund because those transactions were effected in kind and did not cause the fund to incur transaction costs.
See accompanying Notes, which are an integral part of the Financial Statements.
15
Target Retirement Income Fund
Notes to Financial Statements
Vanguard Target Retirement Income Fund is registered under the Investment Company Act of 1940 as an open-end investment company, or mutual fund. The fund follows a balanced investment strategy by investing in selected Vanguard funds to achieve its targeted allocation of assets to U.S. stocks, international stocks, U.S. bonds, and international bonds. Financial statements and other information about each underlying fund are available on vanguard.com.
A. The following significant accounting policies conform to generally accepted accounting principles for U.S. mutual funds. The fund consistently follows such policies in preparing its financial statements.
1. Security Valuation: Investments are valued at the net asset value of each underlying Vanguard fund determined as of the close of the New York Stock Exchange (generally 4 p.m., Eastern time) on the valuation date.
2. Federal Income Taxes: The fund intends to continue to qualify as a regulated investment company and distribute all of its taxable income. Management has analyzed the fund’s tax positions taken for all open federal income tax years (September 30, 2010–2013), and has concluded that no provision for federal income tax is required in the fund’s financial statements.
3. Distributions: Distributions to shareholders are recorded on the ex-dividend date.
4. Other: Income and capital gain distributions received are recorded on the ex-dividend date. Security transactions are accounted for on the date securities are bought or sold. Costs used to determine realized gains (losses) on the sale of investment securities are those of the specific securities sold.
B. Under a service agreement, The Vanguard Group furnishes investment advisory, corporate management, administrative, marketing, and distribution services to the fund. The service agreement provides that the fund’s expenses may be reduced or eliminated to the extent of savings realized by the Vanguard funds by the operation of the fund. Accordingly, all incremental expenses for services provided by Vanguard and all other expenses incurred by the fund during the year ended September 30, 2013, were borne by the funds in which the fund invests. The fund’s trustees and officers are also directors and officers of Vanguard and the funds in which the fund invests.
C. Various inputs may be used to determine the value of the fund’s investments. These inputs are summarized in three broad levels for financial statement purposes. The inputs or methodologies used to value securities are not necessarily an indication of the risk associated with investing in those securities.
Level 1—Quoted prices in active markets for identical securities.
Level 2—Other significant observable inputs (including quoted prices for similar securities, interest rates, prepayment speeds, credit risk, etc.).
Level 3—Significant unobservable inputs (including the fund’s own assumptions used to determine the fair value of investments).
At September 30, 2013, 100% of the market value of the fund’s investments was determined based on Level 1 inputs.
D. Distributions are determined on a tax basis and may differ from net investment income and realized capital gains for financial reporting purposes. Differences may be permanent or temporary. Permanent differences are reclassified among capital accounts in the financial statements to reflect their tax character. Temporary differences arise when certain items of income, expense, gain, or loss are recognized in different periods for financial statement and tax purposes; these differences will reverse at some time in the future. Differences in classification may also result from the treatment of short-term gains as ordinary income for tax purposes.
16
Target Retirement Income Fund
The fund used a tax accounting practice to treat a portion of the price of capital shares redeemed during the year as distributions from realized capital gains. Accordingly, the fund has reclassified $22,538,000 from accumulated net realized gains to paid-in capital.
The fund used capital loss carryforwards of $43,292,000 to offset taxable capital gains realized during the year ended September 30, 2013, reducing the amount of capital gains that would otherwise be available to distribute to shareholders. For tax purposes, at September 30, 2013, the fund had $5,047,000 of ordinary income and $157,059,000 of long-term capital gains available for distribution.
At September 30, 2013, the cost of investment securities for tax purposes was $9,261,229,000. Net unrealized appreciation of investment securities for tax purposes was $899,188,000, consisting of unrealized gains of $951,160,000 on securities that had risen in value since their purchase and $51,972,000 in unrealized losses on securities that had fallen in value since their purchase.
E. During the year ended September 30, 2013, the fund purchased $6,453,283,000 of investment securities and sold $5,813,395,000 of investment securities, other than temporary cash investments.
F. Capital shares issued and redeemed were:
| | |
| | Year Ended September 30, |
| | 2013 | 2012 |
| | Shares | Shares |
| | (000) | (000) |
| Issued | 243,245 | 274,845 |
| Issued in Connection with Acquisition of | | |
| Vanguard Target Retirement 2005 Fund | — | 184,543 |
| Issued in Lieu of Cash Distributions | 17,060 | 14,464 |
| Redeemed | (211,747) | (131,221) |
| Net Increase (Decrease) in Shares Outstanding | 48,558 | 342,631 |
G. On February 10, 2012, the fund acquired all the net assets of Vanguard Target Retirement 2005 Fund pursuant to a plan of reorganization approved by the funds’ board of trustees. The purpose of the transaction was to combine two funds with comparable investment objectives. The acquisition was accomplished by a tax-free exchange of 184,543,000 shares of the fund for 177,808,000 shares of Vanguard Target Retirement 2005 Fund outstanding as of the close of business on February 10, 2012. Vanguard Target Retirement 2005 Fund’s net assets as of the close of business on February 10, 2012, of $2,192,576,000, including $237,489,000 of unrealized appreciation, were combined with the fund’s net assets. The net assets of the fund immediately before the acquisition were $5,956,166,000. The net assets of the fund immediately following the acquisition were $8,148,742,000.
H. Management has determined that no material events or transactions occurred subsequent to September 30, 2013, that would require recognition or disclosure in these financial statements.
17
Target Retirement 2010 Fund
Fund Profile
As of September 30, 2013
| |
| Total Fund Characteristics | |
| |
| Ticker Symbol | VTENX |
| 30-Day SEC Yield | 1.86% |
| Acquired Fund Fees and Expenses1 | 0.16% |
| |
| Allocation to Underlying Vanguard Funds | |
| Vanguard Total Bond Market II Index Fund | |
| Investor Shares | 35.8% |
| Vanguard Total Stock Market Index Fund | |
| Investor Shares | 27.8 |
| Vanguard Short-Term Inflation-Protected | |
| Securities Index Fund Investor Shares | 12.4 |
| Vanguard Total International Bond Index | |
| Fund Investor Shares | 12.0 |
| Vanguard Total International Stock Index | |
| Fund Investor Shares | 12.0 |
| | |
| Total Fund Volatility Measures | |
| | Target 2010 | MSCI US |
| | Composite | Broad Market |
| | Index | Index |
| R-Squared | 1.00 | 0.87 |
| Beta | 0.99 | 0.45 |
These measures show the degree and timing of the fund’s fluctuations compared with the indexes over 36 months.
Fund Asset Allocation
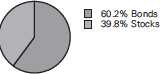
1 This figure—drawn from the prospectus dated August 12, 2013—represents an estimate of the weighted average of the expense ratios and any transaction fees charged by the underlying mutual funds (the ”acquired” funds) in which the Target Retirement 2010 Fund invests. The fund does not charge any expenses or fees of its own. For the fiscal year ended September 30, 2013, the acquired fund fees and expenses were 0.16%.
18
Target Retirement 2010 Fund
Performance Summary
All of the returns in this report represent past performance, which is not a guarantee of future results that may be achieved by the fund. (Current performance may be lower or higher than the performance data cited. For performance data current to the most recent month-end, visit our website at vanguard.com/performance.) Note, too, that both investment returns and principal value can fluctuate widely, so an investor’s shares, when sold, could be worth more or less than their original cost. The returns shown do not reflect taxes that a shareholder would pay on fund distributions or on the sale of fund shares.
Cumulative Performance: June 7, 2006, Through September 30, 2013
Initial Investment of $10,000
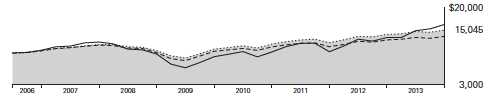
| | | | | |
| | | | Average Annual Total Returns | |
| | | Periods Ended September 30, 2013 | |
| | | | | Since | Final Value |
| | | One | Five | Inception | of a $10,000 |
| | | Year | Years | (6/7/2006) | Investment |
| | Target Retirement 2010 Fund | 6.76% | 7.41% | 5.74% | $15,045 |
| •••••••• | Target 2010 Composite Index | 6.98 | 7.45 | 5.74 | 15,047 |
| – – – – | Mixed-Asset Target 2010 Funds | | | | |
| |
| | MSCI Average US Broad Market Index | 21.55 6.25 | 10.74 6.26 | 6.89 4.36 | 16,275 13,665 |
For a benchmark description, see the Glossary.
Mixed-Asset Target 2010 Funds Average: Derived from data provided by Lipper, a Thomson Reuters Company.
"Since Inception" performance is calculated from the inception date for both the fund and its comparative standards.
See Financial Highlights for dividend and capital gains information.
19
Target Retirement 2010 Fund
Fiscal-Year Total Returns (%): June 7, 2006, Through September 30, 2013
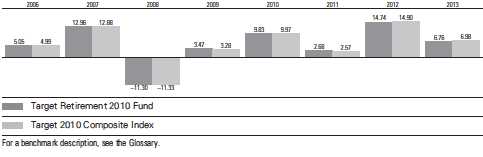
20
Target Retirement 2010 Fund
Financial Statements
Statement of Net Assets
As of September 30, 2013
The fund reports a complete list of its holdings in regulatory filings four times in each fiscal year, at the quarter-ends. For the second and fourth fiscal quarters, the lists appear in the fund’s semiannual and annual reports to shareholders. For the first and third fiscal quarters, the fund files the lists with the Securities and Exchange Commission on Form N-Q. Shareholders can look up the fund’s Forms N-Q on the SEC’s website at sec.gov. Forms N-Q may also be reviewed and copied at the SEC’s Public Reference Room (see the back cover of this report for further information).
| | |
| | | Market |
| | | Value |
| | Shares | ($000) |
| Investment Companies (100.0%) | | |
| U.S. Stock Fund (27.8%) | | |
| Vanguard Total Stock Market Index Fund Investor Shares | 43,585,628 | 1,857,619 |
| |
| International Stock Fund (12.0%) | | |
| Vanguard Total International Stock Index Fund Investor Shares | 49,702,595 | 801,206 |
| |
| U.S. Bond Funds (48.2%) | | |
| 1 Vanguard Total Bond Market II Index Fund Investor Shares | 226,004,485 | 2,393,388 |
| Vanguard Short-Term Inflation-Protected Securities Index Fund Investor Shares | 33,424,375 | 827,253 |
| | | 3,220,641 |
| International Bond Fund (12.0%) | | |
| Vanguard Total International Bond Index Fund Investor Shares | 80,965,448 | 801,558 |
| Total Investment Companies (Cost $5,939,188) | | 6,681,024 |
| Temporary Cash Investment (0.0%) | | |
| Money Market Fund (0.0%) | | |
| 1 Vanguard Market Liquidity Fund, 0.112% (Cost $498) | 497,518 | 498 |
| Total Investments (100.0%) (Cost $5,939,686) | | 6,681,522 |
| Other Assets and Liabilities (0.0%) | | |
| Other Assets | | 67,692 |
| Liabilities | | (70,128) |
| | | (2,436) |
| Net Assets (100%) | | |
| Applicable to 261,901,351 outstanding $.001 par value shares of | | |
| beneficial interest (unlimited authorization) | | 6,679,086 |
| Net Asset Value Per Share | | $25.50 |
21
| |
| Target Retirement 2010 Fund | |
| |
| |
| |
| At September 30, 2013, net assets consisted of: | |
| | Amount |
| | ($000) |
| Paid-in Capital | 5,789,951 |
| Undistributed Net Investment Income | 76,227 |
| Accumulated Net Realized Gains | 71,072 |
| Unrealized Appreciation (Depreciation) | 741,836 |
| Net Assets | 6,679,086 |
See Note A in Notes to Financial Statements.
1 Affiliated fund available only to Vanguard funds and certain trusts and accounts managed by Vanguard. Rate shown for Vanguard Market Liquidity Fund is the 7-day yield.
See accompanying Notes, which are an integral part of the Financial Statements.
22
| |
| Target Retirement 2010 Fund | |
| |
| |
| Statement of Operations | |
| |
| | Year Ended |
| | September 30, 2013 |
| | ($000) |
| Investment Income | |
| Income | |
| Income Distributions Received | 138,234 |
| Net Investment Income—Note B | 138,234 |
| Realized Net Gain (Loss) | |
| Capital Gain Distributions Received | 27,526 |
| Investment Securities Sold | 121,545 |
| Realized Net Gain (Loss) | 149,071 |
| Change in Unrealized Appreciation (Depreciation) of Investment Securities | 145,289 |
| Net Increase (Decrease) in Net Assets Resulting from Operations | 432,594 |
See accompanying Notes, which are an integral part of the Financial Statements.
23
| | |
| Target Retirement 2010 Fund | | |
| |
| |
| Statement of Changes in Net Assets | | |
| |
| | Year Ended September 30, |
| | 2013 | 2012 |
| | ($000) | ($000) |
| Increase (Decrease) in Net Assets | | |
| Operations | | |
| Net Investment Income | 138,234 | 138,726 |
| Realized Net Gain (Loss) | 149,071 | 38,287 |
| Change in Unrealized Appreciation (Depreciation) | 145,289 | 561,971 |
| Net Increase (Decrease) in Net Assets Resulting from Operations | 432,594 | 738,984 |
| Distributions | | |
| Net Investment Income | (138,503) | (132,211) |
| Realized Capital Gain1 | (9,651) | (8,208) |
| Total Distributions | (148,154) | (140,419) |
| Capital Share Transactions | | |
| Issued | 2,006,950 | 1,935,277 |
| Issued in Lieu of Cash Distributions | 145,950 | 138,772 |
| Redeemed | (1,913,559) | (1,264,685) |
| Net Increase (Decrease) from Capital Share Transactions | 239,341 | 809,364 |
| Total Increase (Decrease) | 523,781 | 1,407,929 |
| Net Assets | | |
| Beginning of Period | 6,155,305 | 4,747,376 |
| End of Period2 | 6,679,086 | 6,155,305 |
1 Includes fiscal 2013 and 2012 short-term gain distributions totaling $9,651,000 and $8,208,000, respectively. Short-term gain distributions are treated as ordinary income dividends for tax purposes.
2 Net Assets—End of Period includes undistributed net investment income of $76,227,000 and $86,217,000.
See accompanying Notes, which are an integral part of the Financial Statements.
24
| | | | | |
| Target Retirement 2010 Fund | | | | | |
| |
| |
| Financial Highlights | | | | | |
| |
| |
| |
| For a Share Outstanding | | | Year Ended September 30, |
| Throughout Each Period | 2013 | 2012 | 2011 | 2010 | 2009 |
| Net Asset Value, Beginning of Period | $24.45 | $21.91 | $21.87 | $20.39 | $20.47 |
| Investment Operations | | | | | |
| Net Investment Income | . 516 | . 571 | .5601 | .520 | .553 |
| Capital Gain Distributions Received | .103 | .100 | .0561 | — | — |
| Net Realized and Unrealized Gain (Loss) | | | | | |
| on Investments | .999 | 2.502 | (.022) | 1.455 | .046 |
| Total from Investment Operations | 1.618 | 3.173 | .594 | 1.975 | .599 |
| Distributions | | | | | |
| Dividends from Net Investment Income | (. 531) | (. 596) | (. 511) | (. 495) | (.679) |
| Distributions from Realized Capital Gains | (.037) | (.037) | (.043) | — | — |
| Total Distributions | (.568) | (. 633) | (. 554) | (.495) | (.679) |
| Net Asset Value, End of Period | $25.50 | $24.45 | $21.91 | $21.87 | $20.39 |
| |
| Total Return2 | 6.76% | 14.74% | 2.68% | 9.83% | 3.47% |
| |
| Ratios/Supplemental Data | | | | | |
| Net Assets, End of Period (Millions) | $6,679 | $6,155 | $4,747 | $4,247 | $3,065 |
| Ratio of Total Expenses to | | | | | |
| Average Net Assets | — | — | — | — | — |
| Acquired Fund Fees and Expenses | 0.16% | 0.16% | 0.17% | 0.17% | 0.21% |
| Ratio of Net Investment Income to | | | | | |
| Average Net Assets | 2.08% | 2.51% | 2.46% | 2.67% | 3.15% |
| Portfolio Turnover Rate | 38% | 12% | 27%3 | 19% | 41%4 |
1 Calculated based on average shares outstanding.
2 Total returns do not include account service fees that may have applied in the periods shown. Fund prospectuses provide information about any applicable account service fees.
3 Excludes the value of mutual fund shares delivered and received in connection with a change in the fund’s international equity investments from Vanguard European, Pacific, and Emerging Markets Stock Index Funds to Vanguard Total International Stock Index Fund because those transactions were effected in kind and did not cause the fund to incur transaction costs.
4 Excludes the value of mutual fund shares delivered and received in connection with a change in the fund’s bond investments from Vanguard Total Bond Market Index Fund to Vanguard Total Bond Market II Index Fund because those transactions were effected in kind and did not cause the fund to incur transaction costs.
See accompanying Notes, which are an integral part of the Financial Statements.
25
Target Retirement 2010 Fund
Notes to Financial Statements
Vanguard Target Retirement 2010 Fund is registered under the Investment Company Act of 1940 as an open-end investment company, or mutual fund. The fund follows a balanced investment strategy by investing in selected Vanguard funds to achieve its targeted allocation of assets to U.S. stocks, international stocks, U.S. bonds, and international bonds. Financial statements and other information about each underlying fund are available on vanguard.com.
A. The following significant accounting policies conform to generally accepted accounting principles for U.S. mutual funds. The fund consistently follows such policies in preparing its financial statements.
1. Security Valuation: Investments are valued at the net asset value of each underlying Vanguard fund determined as of the close of the New York Stock Exchange (generally 4 p.m., Eastern time) on the valuation date.
2. Federal Income Taxes: The fund intends to continue to qualify as a regulated investment company and distribute all of its taxable income. Management has analyzed the fund’s tax positions taken for all open federal income tax years (September 30, 2010–2013), and has concluded that no provision for federal income tax is required in the fund’s financial statements.
3. Distributions: Distributions to shareholders are recorded on the ex-dividend date.
4. Other: Income and capital gain distributions received are recorded on the ex-dividend date. Security transactions are accounted for on the date securities are bought or sold. Costs used to determine realized gains (losses) on the sale of investment securities are those of the specific securities sold.
B. Under a service agreement, The Vanguard Group furnishes investment advisory, corporate management, administrative, marketing, and distribution services to the fund. The service agreement provides that the fund’s expenses may be reduced or eliminated to the extent of savings realized by the Vanguard funds by the operation of the fund. Accordingly, all incremental expenses for services provided by Vanguard and all other expenses incurred by the fund during the year ended September 30, 2013, were borne by the funds in which the fund invests. The fund’s trustees and officers are also directors and officers of Vanguard and the funds in which the fund invests.
C. Various inputs may be used to determine the value of the fund’s investments. These inputs are summarized in three broad levels for financial statement purposes. The inputs or methodologies used to value securities are not necessarily an indication of the risk associated with investing in those securities.
Level 1—Quoted prices in active markets for identical securities.
Level 2—Other significant observable inputs (including quoted prices for similar securities, interest rates, prepayment speeds, credit risk, etc.).
Level 3—Significant unobservable inputs (including the fund’s own assumptions used to determine the fair value of investments).
At September 30, 2013, 100% of the market value of the fund’s investments was determined based on Level 1 inputs.
D. Distributions are determined on a tax basis and may differ from net investment income and realized capital gains for financial reporting purposes. Differences may be permanent or temporary. Permanent differences are reclassified among capital accounts in the financial statements to reflect their tax character. Temporary differences arise when certain items of income, expense, gain, or loss are recognized in different periods for financial statement and tax purposes; these differences will reverse at some time in the future. Differences in classification may also result from the treatment of short-term gains as ordinary income for tax purposes.
26
Target Retirement 2010 Fund
The fund used a tax accounting practice to treat a portion of the price of capital shares redeemed during the year as distributions from net investment income and realized capital gains. Accordingly, the fund has reclassified $9,721,000 from undistributed net investment income, and $5,349,000 from accumulated net realized gains, to paid-in capital.
The fund used capital loss carryforwards of $63,820,000 to offset taxable capital gains realized during the year ended September 30, 2013, reducing the amount of capital gains that would otherwise be available to distribute to shareholders. For tax purposes, at September 30, 2013, the fund had $76,620,000 of ordinary income and $71,541,000 of long-term capital gains available for distribution.
At September 30, 2013, the cost of investment securities for tax purposes was $5,940,548,000. Net unrealized appreciation of investment securities for tax purposes was $740,974,000, consisting of unrealized gains of $768,866,000 on securities that had risen in value since their purchase and $27,892,000 in unrealized losses on securities that had fallen in value since their purchase.
E. During the year ended September 30, 2013, the fund purchased $3,584,517,000 of investment securities and sold $3,324,653,000 of investment securities, other than temporary cash investments.
F. Capital shares issued and redeemed were:
| | |
| | Year Ended September 30, |
| | 2013 | 2012 |
| | Shares | Shares |
| | (000) | (000) |
| Issued | 81,038 | 82,983 |
| Issued in Lieu of Cash Distributions | 6,076 | 6,184 |
| Redeemed | (76,925) | (54,110) |
| Net Increase (Decrease) in Shares Outstanding | 10,189 | 35,057 |
G. Management has determined that no material events or transactions occurred subsequent to September 30, 2013, that would require recognition or disclosure in these financial statements.
27
Target Retirement 2015 Fund
Fund Profile
As of September 30, 2013
| |
| Total Fund Characteristics | |
| |
| Ticker Symbol | VTXVX |
| 30-Day SEC Yield | 2.03% |
| Acquired Fund Fees and Expenses1 | 0.16% |
| |
| Allocation to Underlying Vanguard Funds | |
| Vanguard Total Stock Market Index Fund | |
| Investor Shares | 36.9% |
| Vanguard Total Bond Market II Index Fund | |
| Investor Shares | 32.2 |
| Vanguard Total International Stock Index | |
| Fund Investor Shares | 15.9 |
| Vanguard Total International Bond Index | |
| Fund Investor Shares | 9.4 |
| Vanguard Short-Term Inflation-Protected | |
| Securities Index Fund Investor Shares | 5.6 |
| | |
| Total Fund Volatility Measures | |
| | Target 2015 | MSCI US |
| | Composite | Broad Market |
| | Index | Index |
| R-Squared | 1.00 | 0.93 |
| Beta | 0.99 | 0.57 |
These measures show the degree and timing of the fund’s fluctuations compared with the indexes over 36 months.
Fund Asset Allocation
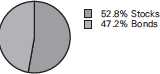
1 This figure—drawn from the prospectus dated August 12, 2013—represents an estimate of the weighted average of the expense ratios and any transaction fees charged by the underlying mutual funds (the ”acquired” funds) in which the Target Retirement 2015 Fund invests. The fund does not charge any expenses or fees of its own. For the fiscal year ended September 30, 2013, the acquired fund fees and expenses were 0.16%.
28
Target Retirement 2015 Fund
Performance Summary
All of the returns in this report represent past performance, which is not a guarantee of future results that may be achieved by the fund. (Current performance may be lower or higher than the performance data cited. For performance data current to the most recent month-end, visit our website at vanguard.com/performance.) Note, too, that both investment returns and principal value can fluctuate widely, so an investor’s shares, when sold, could be worth more or less than their original cost. The returns shown do not reflect taxes that a shareholder would pay on fund distributions or on the sale of fund shares.
Cumulative Performance: October 27, 2003, Through September 30, 2013
Initial Investment of $10,000
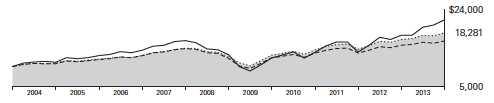
| | | | |
| | | Average Annual Total Returns | |
| | Periods Ended September 30, 2013 | |
| | | | Since | Final Value |
| | One | Five | Inception | of a $10,000 |
| | Year | Years | (10/27/2003) | Investment |
| Target Retirement 2015 Fund | 9.56% | 7.92% | 6.27% | $18,281 |
| Target 2015 Composite Index | 9.81 | 7.91 | 6.26 | 18,277 |
| Mixed-Asset Target 2015 Funds | | | | |
| Average | 6.94 | 6.28 | 5.03 | 16,275 |
| MSCI US Broad Market Index | 21.55 | 10.74 | 8.00 | 21,470 |
For a benchmark description, see the Glossary.
Mixed-Asset Target 2015 Funds Average: Derived from data provided by Lipper, a Thomson Reuters Company.
"Since Inception" performance is calculated from the inception date for both the fund and its comparative standards.
See Financial Highlights for dividend and capital gains information.
29
Target Retirement 2015 Fund
Fiscal-Year Total Returns (%): October 27, 2003, Through September 30, 2013
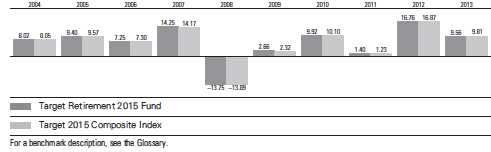
30
Target Retirement 2015 Fund
Financial Statements
Statement of Net Assets
As of September 30, 2013
The fund reports a complete list of its holdings in regulatory filings four times in each fiscal year, at the quarter-ends. For the second and fourth fiscal quarters, the lists appear in the fund’s semiannual and annual reports to shareholders. For the first and third fiscal quarters, the fund files the lists with the Securities and Exchange Commission on Form N-Q. Shareholders can look up the fund’s Forms N-Q on the SEC’s website at sec.gov. Forms N-Q may also be reviewed and copied at the SEC’s Public Reference Room (see the back cover of this report for further information).
| | |
| | | Market |
| | | Value |
| | Shares | ($000) |
| Investment Companies (100.0%) | | |
| U.S. Stock Fund (36.9%) | | |
| Vanguard Total Stock Market Index Fund Investor Shares | 170,983,436 | 7,287,314 |
| |
| International Stock Fund (15.9%) | | |
| Vanguard Total International Stock Index Fund Investor Shares | 194,700,537 | 3,138,573 |
| |
| U.S. Bond Funds (37.8%) | | |
| 1 Vanguard Total Bond Market II Index Fund Investor Shares | 600,175,327 | 6,355,857 |
| Vanguard Short-Term Inflation-Protected Securities Index Fund Investor Shares | 44,611,905 | 1,104,144 |
| | | 7,460,001 |
| International Bond Fund (9.4%) | | |
| Vanguard Total International Bond Index Fund Investor Shares | 187,409,840 | 1,855,357 |
| Total Investment Companies (Cost $16,717,760) | | 19,741,245 |
| Temporary Cash Investment (0.0%) | | |
| Money Market Fund (0.0%) | | |
| 1 Vanguard Market Liquidity Fund, 0.112% (Cost $8,639) | 8,638,763 | 8,639 |
| Total Investments (100.1%) (Cost $16,726,399) | | 19,749,884 |
| Other Assets and Liabilities (-0.1%) | | |
| Other Assets | | 285,453 |
| Liabilities | | (296,013) |
| | | (10,560) |
| Net Assets (100%) | | |
| Applicable to 1,361,957,033 outstanding $.001 par value shares of | | |
| beneficial interest (unlimited authorization) | | 19,739,324 |
| Net Asset Value Per Share | | $14.49 |
31
| |
| Target Retirement 2015 Fund | |
| |
| |
| |
| At September 30, 2013, net assets consisted of: | |
| | Amount |
| | ($000) |
| Paid-in Capital | 16,357,363 |
| Undistributed Net Investment Income | 247,209 |
| Accumulated Net Realized Gains | 111,267 |
| Unrealized Appreciation (Depreciation) | 3,023,485 |
| Net Assets | 19,739,324 |
See Note A in Notes to Financial Statements.
1 Affiliated fund available only to Vanguard funds and certain trusts and accounts managed by Vanguard. Rate shown for Vanguard Market Liquidity Fund is the 7-day yield.
See accompanying Notes, which are an integral part of the Financial Statements.
32
| |
| Target Retirement 2015 Fund | |
| |
| |
| Statement of Operations | |
| |
| | Year Ended |
| | September 30, 2013 |
| | ($000) |
| Investment Income | |
| Income | |
| Income Distributions Received | 408,230 |
| Net Investment Income—Note B | 408,230 |
| Realized Net Gain (Loss) | |
| Capital Gain Distributions Received | 52,398 |
| Investment Securities Sold | 152,574 |
| Realized Net Gain (Loss) | 204,972 |
| Change in Unrealized Appreciation (Depreciation) of Investment Securities | 1,107,450 |
| Net Increase (Decrease) in Net Assets Resulting from Operations | 1,720,652 |
See accompanying Notes, which are an integral part of the Financial Statements.
33
| | |
| Target Retirement 2015 Fund | | |
| |
| |
| Statement of Changes in Net Assets | | |
| |
| | Year Ended September 30, |
| | 2013 | 2012 |
| | ($000) | ($000) |
| Increase (Decrease) in Net Assets | | |
| Operations | | |
| Net Investment Income | 408,230 | 394,621 |
| Realized Net Gain (Loss) | 204,972 | 91,378 |
| Change in Unrealized Appreciation (Depreciation) | 1,107,450 | 1,819,354 |
| Net Increase (Decrease) in Net Assets Resulting from Operations | 1,720,652 | 2,305,353 |
| Distributions | | |
| Net Investment Income | (384,520) | (356,688) |
| Realized Capital Gain1 | (23,226) | (22,792) |
| Total Distributions | (407,746) | (379,480) |
| Capital Share Transactions | | |
| Issued | 5,113,964 | 4,080,711 |
| Issued in Lieu of Cash Distributions | 403,269 | 375,872 |
| Redeemed | (3,929,112) | (2,978,853) |
| Net Increase (Decrease) from Capital Share Transactions | 1,588,121 | 1,477,730 |
| Total Increase (Decrease) | 2,901,027 | 3,403,603 |
| Net Assets | | |
| Beginning of Period | 16,838,297 | 13,434,694 |
| End of Period2 | 19,739,324 | 16,838,297 |
1 Includes fiscal 2013 and 2012 short-term gain distributions totaling $23,226,000 and $22,792,000, respectively. Short-term gain distributions are treated as ordinary income dividends for tax purposes.
2 Net Assets—End of Period includes undistributed net investment income of $247,209,000 and $247,068,000.
See accompanying Notes, which are an integral part of the Financial Statements.
34
| | | | | |
| Target Retirement 2015 Fund | | | | | |
| |
| |
| Financial Highlights | | | | | |
| |
| |
| |
| For a Share Outstanding | | | Year Ended September 30, |
| Throughout Each Period | 2013 | 2012 | 2011 | 2010 | 2009 |
| Net Asset Value, Beginning of Period | $13.54 | $11.91 | $12.03 | $11.21 | $11.34 |
| Investment Operations | | | | | |
| Net Investment Income | . 298 | .327 | .2831 | .285 | .307 |
| Capital Gain Distributions Received | .039 | .053 | .0311 | — | — |
| Net Realized and Unrealized Gain (Loss) | | | | | |
| on Investments | .929 | 1.583 | (.134) | .811 | (.072) |
| Total from Investment Operations | 1.266 | 1.963 | .180 | 1.096 | .235 |
| Distributions | | | | | |
| Dividends from Net Investment Income | (.298) | (.313) | (.276) | (. 276) | (. 365) |
| Distributions from Realized Capital Gains | (.018) | (. 020) | (. 024) | — | — |
| Total Distributions | (. 316) | (. 333) | (. 300) | (. 276) | (. 365) |
| Net Asset Value, End of Period | $14.49 | $13.54 | $11.91 | $12.03 | $11.21 |
| |
| Total Return2 | 9.56% | 16.76% | 1.40% | 9.92% | 2.66% |
| |
| Ratios/Supplemental Data | | | | | |
| Net Assets, End of Period (Millions) | $19,739 | $16,838 | $13,435 | $12,466 | $9,507 |
| Ratio of Total Expenses to | | | | | |
| Average Net Assets | — | — | — | — | — |
| Acquired Fund Fees and Expenses | 0.16% | 0.16% | 0.17% | 0.17% | 0.21% |
| Ratio of Net Investment Income to | | | | | |
| Average Net Assets | 2.17% | 2.59% | 2.24% | 2.62% | 3.31% |
| Portfolio Turnover Rate | 26% | 13% | 27%3 | 19% | 37%4 |
1 Calculated based on average shares outstanding.
2 Total returns do not include account service fees that may have applied in the periods shown. Fund prospectuses provide information about any applicable account service fees.
3 Excludes the value of mutual fund shares delivered and received in connection with a change in the fund’s international equity investments from Vanguard European, Pacific, and Emerging Markets Stock Index Funds to Vanguard Total International Stock Index Fund because those transactions were effected in kind and did not cause the fund to incur transaction costs.
4 Excludes the value of mutual fund shares delivered and received in connection with a change in the fund’s bond investments from Vanguard Total Bond Market Index Fund to Vanguard Total Bond Market II Index Fund because those transactions were effected in kind and did not cause the fund to incur transaction costs.
See accompanying Notes, which are an integral part of the Financial Statements.
35
Target Retirement 2015 Fund
Notes to Financial Statements
Vanguard Target Retirement 2015 Fund is registered under the Investment Company Act of 1940 as an open-end investment company, or mutual fund. The fund follows a balanced investment strategy by investing in selected Vanguard funds to achieve its targeted allocation of assets to U.S. stocks, international stocks, U.S. bonds, and international bonds. Financial statements and other information about each underlying fund are available on vanguard.com.
A. The following significant accounting policies conform to generally accepted accounting principles for U.S. mutual funds. The fund consistently follows such policies in preparing its financial statements.
1. Security Valuation: Investments are valued at the net asset value of each underlying Vanguard fund determined as of the close of the New York Stock Exchange (generally 4 p.m., Eastern time) on the valuation date.
2. Federal Income Taxes: The fund intends to continue to qualify as a regulated investment company and distribute all of its taxable income. Management has analyzed the fund’s tax positions taken for all open federal income tax years (September 30, 2010–2013), and has concluded that no provision for federal income tax is required in the fund’s financial statements.
3. Distributions: Distributions to shareholders are recorded on the ex-dividend date.
4. Other: Income and capital gain distributions received are recorded on the ex-dividend date. Security transactions are accounted for on the date securities are bought or sold. Costs used to determine realized gains (losses) on the sale of investment securities are those of the specific securities sold.
B. Under a service agreement, The Vanguard Group furnishes investment advisory, corporate management, administrative, marketing, and distribution services to the fund. The service agreement provides that the fund’s expenses may be reduced or eliminated to the extent of savings realized by the Vanguard funds by the operation of the fund. Accordingly, all incremental expenses for services provided by Vanguard and all other expenses incurred by the fund during the year ended September 30, 2013, were borne by the funds in which the fund invests. The fund’s trustees and officers are also directors and officers of Vanguard and the funds in which the fund invests.
C. Various inputs may be used to determine the value of the fund’s investments. These inputs are summarized in three broad levels for financial statement purposes. The inputs or methodologies used to value securities are not necessarily an indication of the risk associated with investing in those securities.
Level 1—Quoted prices in active markets for identical securities.
Level 2—Other significant observable inputs (including quoted prices for similar securities, interest rates, prepayment speeds, credit risk, etc.).
Level 3—Significant unobservable inputs (including the fund’s own assumptions used to determine the fair value of investments).
At September 30, 2013, 100% of the market value of the fund’s investments was determined based on Level 1 inputs.
D. Distributions are determined on a tax basis and may differ from net investment income and realized capital gains for financial reporting purposes. Differences may be permanent or temporary. Permanent differences are reclassified among capital accounts in the financial statements to reflect their tax character. Temporary differences arise when certain items of income, expense, gain, or loss are recognized in different periods for financial statement and tax purposes; these differences will reverse at some time in the future. Differences in classification may also result from the treatment of short-term gains as ordinary income for tax purposes.
36
Target Retirement 2015 Fund
The fund used a tax accounting practice to treat a portion of the price of capital shares redeemed during the year as distributions from net investment income and realized capital gains. Accordingly, the fund has reclassified $23,569,000 from undistributed net investment income, and $6,760,000 from accumulated net realized gains, to paid-in capital.
The fund used capital loss carryforwards of $64,723,000 to offset taxable capital gains realized during the year ended September 30, 2013, reducing the amount of capital gains that would otherwise be available to distribute to shareholders. For tax purposes, at September 30, 2013, the fund had $247,329,000 of ordinary income and $111,897,000 of long-term capital gains available for distribution.
At September 30, 2013, the cost of investment securities for tax purposes was $16,727,148,000. Net unrealized appreciation of investment securities for tax purposes was $3,022,736,000, consisting of unrealized gains of $3,081,842,000 on securities that had risen in value since their purchase and $59,106,000 in unrealized losses on securities that had fallen in value since their purchase.
E. During the year ended September 30, 2013, the fund purchased $7,502,447,000 of investment securities and sold $5,848,491,000 of investment securities, other than temporary cash investments.
F. Capital shares issued and redeemed were:
| | |
| | Year Ended September 30, |
| | 2013 | 2012 |
| | Shares | Shares |
| | (000) | (000) |
| Issued | 368,573 | 317,087 |
| Issued in Lieu of Cash Distributions | 30,344 | 30,534 |
| Redeemed | (280,939) | (232,130) |
| Net Increase (Decrease) in Shares Outstanding | 117,978 | 115,491 |
G. Management has determined that no material events or transactions occurred subsequent to September 30, 2013, that would require recognition or disclosure in these financial statements.
37
Target Retirement 2020 Fund
Fund Profile
As of September 30, 2013
| |
| Total Fund Characteristics | |
| Ticker Symbol | VTWNX |
| 30-Day SEC Yield | 2.15% |
| Acquired Fund Fees and Expenses1 | 0.16% |
| |
| Allocation to Underlying Vanguard Funds | |
| Vanguard Total Stock Market Index Fund | |
| Investor Shares | 43.4% |
| Vanguard Total Bond Market II Index Fund | |
| Investor Shares | 30.4 |
| Vanguard Total International Stock Index | |
| Fund Investor Shares | 18.7 |
| Vanguard Total International Bond Index | |
| Fund Investor Shares | 7.5 |
| | |
| Total Fund Volatility Measures | |
| | Target 2020 | MSCI US |
| | Composite | Broad Market |
| | Index | Index |
| R-Squared | 1.00 | 0.95 |
| Beta | 1.00 | 0.66 |
These measures show the degree and timing of the fund’s fluctuations compared with the indexes over 36 months.
Fund Asset Allocation
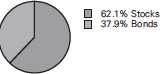
1 This figure—drawn from the prospectus dated August 12, 2013—represents an estimate of the weighted average of the expense ratios and any transaction fees charged by the underlying mutual funds (the ”acquired” funds) in which the Target Retirement 2020 Fund invests. The fund does not charge any expenses or fees of its own. For the fiscal year ended September 30, 2013, the acquired fund fees and expenses were 0.16%.
38
Target Retirement 2020 Fund
Performance Summary
All of the returns in this report represent past performance, which is not a guarantee of future results that may be achieved by the fund. (Current performance may be lower or higher than the performance data cited. For performance data current to the most recent month-end, visit our website at vanguard.com/performance.) Note, too, that both investment returns and principal value can fluctuate widely, so an investor’s shares, when sold, could be worth more or less than their original cost. The returns shown do not reflect taxes that a shareholder would pay on fund distributions or on the sale of fund shares.
Cumulative Performance: June 7, 2006, Through September 30, 2013
Initial Investment of $10,000
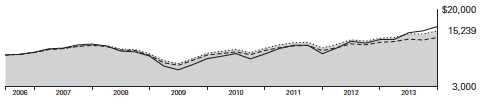
| | | | | |
| | | | Average Annual Total Returns | |
| | | Periods Ended September 30, 2013 | |
| | | | | Since | Final Value |
| | | One | Five | Inception | of a $10,000 |
| | | Year | Years | (6/7/2006) | Investment |
| | Target Retirement 2020 Fund | 11.70% | 8.20% | 5.93% | $15,239 |
| •••••••• | Target 2020 Composite Index | 11.94 | 8.37 | 6.01 | 15,330 |
| – – – – | Mixed-Asset Target 2020 Funds | | | | |
| |
| | MSCI Average US Broad Market Index | 21.55 8.31 | 10.74 6.93 | 6.89 4.55 | 16,275 13,843 |
For a benchmark description, see the Glossary.
Mixed-Asset Target 2020 Funds Average: Derived from data provided by Lipper, a Thomson Reuters Company.
"Since Inception" performance is calculated from the inception date for both the fund and its comparative standards.
See Financial Highlights for dividend and capital gains information.
39
Target Retirement 2020 Fund
Fiscal-Year Total Returns (%): June 7, 2006, Through September 30, 2013
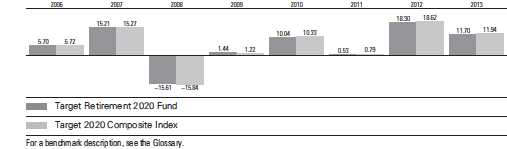
40
Target Retirement 2020 Fund
Financial Statements
Statement of Net Assets
As of September 30, 2013
The fund reports a complete list of its holdings in regulatory filings four times in each fiscal year, at the quarter-ends. For the second and fourth fiscal quarters, the lists appear in the fund’s semiannual and annual reports to shareholders. For the first and third fiscal quarters, the fund files the lists with the Securities and Exchange Commission on Form N-Q. Shareholders can look up the fund’s Forms N-Q on the SEC’s website at sec.gov. Forms N-Q may also be reviewed and copied at the SEC’s Public Reference Room (see the back cover of this report for further information).
| | |
| | | Market |
| | | Value |
| | Shares | ($000) |
| Investment Companies (100.0%) | | |
| U.S. Stock Fund (43.4%) | | |
| Vanguard Total Stock Market Index Fund Investor Shares | 221,976,098 | 9,460,621 |
| |
| International Stock Fund (18.7%) | | |
| Vanguard Total International Stock Index Fund Investor Shares | 252,213,627 | 4,065,684 |
| |
| U.S. Bond Fund (30.4%) | | |
| 1 Vanguard Total Bond Market II Index Fund Investor Shares | 624,388,103 | 6,612,270 |
| |
| International Bond Fund (7.5%) | | |
| Vanguard Total International Bond Index Fund Investor Shares | 166,058,715 | 1,643,981 |
| Total Investment Companies (Cost $18,545,013) | | 21,782,556 |
| Temporary Cash Investment (0.1%) | | |
| Money Market Fund (0.1%) | | |
| 1 Vanguard Market Liquidity Fund, 0.112% (Cost $16,201) | 16,200,781 | 16,201 |
| Total Investments (100.1%) (Cost $18,561,214) | | 21,798,757 |
| Other Assets and Liabilities (-0.1%) | | |
| Other Assets | | 307,590 |
| Liabilities | | (321,690) |
| | | (14,100) |
| Net Assets (100%) | | |
| Applicable to 829,728,440 outstanding $.001 par value shares of | | |
| beneficial interest (unlimited authorization) | | 21,784,657 |
| Net Asset Value Per Share | | $26.26 |
41
| |
| Target Retirement 2020 Fund | |
| |
| |
| |
| At September 30, 2013, net assets consisted of: | |
| | Amount |
| | ($000) |
| Paid-in Capital | 18,262,238 |
| Undistributed Net Investment Income | 282,064 |
| Accumulated Net Realized Gains | 2,812 |
| Unrealized Appreciation (Depreciation) | 3,237,543 |
| Net Assets | 21,784,657 |
See Note A in Notes to Financial Statements.
1 Affiliated fund available only to Vanguard funds and certain trusts and accounts managed by Vanguard. Rate shown for Vanguard Market Liquidity Fund is the 7-day yield.
See accompanying Notes, which are an integral part of the Financial Statements.
42
| |
| Target Retirement 2020 Fund | |
| |
| |
| Statement of Operations | |
| |
| | Year Ended |
| | September 30, 2013 |
| | ($000) |
| Investment Income | |
| Income | |
| Income Distributions Received | 434,879 |
| Net Investment Income—Note B | 434,879 |
| Realized Net Gain (Loss) | |
| Capital Gain Distributions Received | 35,666 |
| Investment Securities Sold | 37,941 |
| Realized Net Gain (Loss) | 73,607 |
| Change in Unrealized Appreciation (Depreciation) of Investment Securities | 1,631,720 |
| Net Increase (Decrease) in Net Assets Resulting from Operations | 2,140,206 |
See accompanying Notes, which are an integral part of the Financial Statements.
43
| | |
| Target Retirement 2020 Fund | | |
| |
| |
| Statement of Changes in Net Assets | | |
| |
| | Year Ended September 30, |
| | 2013 | 2012 |
| | ($000) | ($000) |
| Increase (Decrease) in Net Assets | | |
| Operations | | |
| Net Investment Income | 434,879 | 359,941 |
| Realized Net Gain (Loss) | 73,607 | 79,895 |
| Change in Unrealized Appreciation (Depreciation) | 1,631,720 | 1,764,009 |
| Net Increase (Decrease) in Net Assets Resulting from Operations | 2,140,206 | 2,203,845 |
| Distributions | | |
| Net Investment Income | (362,212) | (281,924) |
| Realized Capital Gain1 | (18,538) | (17,036) |
| Total Distributions | (380,750) | (298,960) |
| Capital Share Transactions | | |
| Issued | 7,050,481 | 4,865,832 |
| Issued in Lieu of Cash Distributions | 376,274 | 296,988 |
| Redeemed | (3,479,383) | (2,021,399) |
| Net Increase (Decrease) from Capital Share Transactions | 3,947,372 | 3,141,421 |
| Total Increase (Decrease) | 5,706,828 | 5,046,306 |
| Net Assets | | |
| Beginning of Period | 16,077,829 | 11,031,523 |
| End of Period2 | 21,784,657 | 16,077,829 |
1 Includes fiscal 2013 and 2012 short-term gain distributions totaling $18,538,000 and $17,036,000, respectively. Short-term gain distributions are treated as ordinary income dividends for tax purposes.
2 Net Assets—End of Period includes undistributed net investment income of $282,064,000 and $232,148,000.
See accompanying Notes, which are an integral part of the Financial Statements.
44
| | | | | |
| Target Retirement 2020 Fund | | | | | |
| |
| |
| Financial Highlights | | | | | |
| |
| |
| |
| For a Share Outstanding | | | Year Ended September 30, |
| Throughout Each Period | 2013 | 2012 | 2011 | 2010 | 2009 |
| Net Asset Value, Beginning of Period | $24.04 | $20.83 | $21.17 | $19.66 | $20.03 |
| Investment Operations | | | | | |
| Net Investment Income | . 528 | .569 | . 4731 | .5101 | .5391 |
| Capital Gain Distributions Received | .047 | .079 | .0441 | — | — |
| Net Realized and Unrealized Gain (Loss) | | | | | |
| on Investments | 2.179 | 3.106 | (.378) | 1.440 | (.360) |
| Total from Investment Operations | 2.754 | 3.754 | .139 | 1.950 | .179 |
| Distributions | | | | | |
| Dividends from Net Investment Income | (.508) | (. 513) | (. 444) | (.440) | (.549) |
| Distributions from Realized Capital Gains | (.026) | (.031) | (.035) | — | — |
| Total Distributions | (.534) | (.544) | (.479) | (.440) | (.549) |
| Net Asset Value, End of Period | $26.26 | $24.04 | $20.83 | $21.17 | $19.66 |
| |
| Total Return2 | 11.70% | 18.30% | 0.53% | 10.04% | 1.44% |
| |
| Ratios/Supplemental Data | | | | | |
| Net Assets, End of Period (Millions) | $21,785 | $16,078 | $11,032 | $8,890 | $5,706 |
| Ratio of Total Expenses to | | | | | |
| Average Net Assets | — | — | — | — | — |
| Acquired Fund Fees and Expenses | 0.16% | 0.16% | 0.17% | 0.17% | 0.21% |
| Ratio of Net Investment Income to | | | | | |
| Average Net Assets | 2.23% | 2.62% | 2.11% | 2.51% | 3.19% |
| Portfolio Turnover Rate | 17% | 8% | 23%3 | 14% | 27%4 |
1 Calculated based on average shares outstanding.
2 Total returns do not include account service fees that may have applied in the periods shown. Fund prospectuses provide information about any applicable account service fees.
3 Excludes the value of mutual fund shares delivered and received in connection with a change in the fund’s international equity investments from Vanguard European, Pacific, and Emerging Markets Stock Index Funds to Vanguard Total International Stock Index Fund because those transactions were effected in kind and did not cause the fund to incur transaction costs.
4 Excludes the value of mutual fund shares delivered and received in connection with a change in the fund’s bond investments from Vanguard Total Bond Market Index Fund to Vanguard Total Bond Market II Index Fund because those transactions were effected in kind and did not cause the fund to incur transaction costs.
See accompanying Notes, which are an integral part of the Financial Statements.
45
Target Retirement 2020 Fund
Notes to Financial Statements
Vanguard Target Retirement 2020 Fund is registered under the Investment Company Act of 1940 as an open-end investment company, or mutual fund. The fund follows a balanced investment strategy by investing in selected Vanguard funds to achieve its targeted allocation of assets to U.S. stocks, international stocks, U.S. bonds, and international bonds. Financial statements and other information about each underlying fund are available on vanguard.com.
A. The following significant accounting policies conform to generally accepted accounting principles for U.S. mutual funds. The fund consistently follows such policies in preparing its financial statements.
1. Security Valuation: Investments are valued at the net asset value of each underlying Vanguard fund determined as of the close of the New York Stock Exchange (generally 4 p.m., Eastern time) on the valuation date.
2. Federal Income Taxes: The fund intends to continue to qualify as a regulated investment company and distribute all of its taxable income. Management has analyzed the fund’s tax positions taken for all open federal income tax years (September 30, 2010–2013), and has concluded that no provision for federal income tax is required in the fund’s financial statements.
3. Distributions: Distributions to shareholders are recorded on the ex-dividend date.
4. Other: Income and capital gain distributions received are recorded on the ex-dividend date. Security transactions are accounted for on the date securities are bought or sold. Costs used to determine realized gains (losses) on the sale of investment securities are those of the specific securities sold.
B. Under a service agreement, The Vanguard Group furnishes investment advisory, corporate management, administrative, marketing, and distribution services to the fund. The service agreement provides that the fund’s expenses may be reduced or eliminated to the extent of savings realized by the Vanguard funds by the operation of the fund. Accordingly, all incremental expenses for services provided by Vanguard and all other expenses incurred by the fund during the year ended September 30, 2013, were borne by the funds in which the fund invests. The fund’s trustees and officers are also directors and officers of Vanguard and the funds in which the fund invests.
C. Various inputs may be used to determine the value of the fund’s investments. These inputs are summarized in three broad levels for financial statement purposes. The inputs or methodologies used to value securities are not necessarily an indication of the risk associated with investing in those securities.
Level 1—Quoted prices in active markets for identical securities.
Level 2—Other significant observable inputs (including quoted prices for similar securities, interest rates, prepayment speeds, credit risk, etc.).
Level 3—Significant unobservable inputs (including the fund’s own assumptions used to determine the fair value of investments).
At September 30, 2013, 100% of the market value of the fund’s investments was determined based on Level 1 inputs.
D. Distributions are determined on a tax basis and may differ from net investment income and realized capital gains for financial reporting purposes. Differences may be permanent or temporary. Permanent differences are reclassified among capital accounts in the financial statements to reflect their tax character. Temporary differences arise when certain items of income, expense, gain, or loss are recognized in different periods for financial statement and tax purposes; these differences will reverse at some time in the future. Differences in classification may also result from the treatment of short-term gains as ordinary income for tax purposes.
46
Target Retirement 2020 Fund
The fund used a tax accounting practice to treat a portion of the price of capital shares redeemed during the year as distributions from net investment income and realized capital gains. Accordingly, the fund has reclassified $22,751,000 from undistributed net investment income, and $451,000 from accumulated net realized gains, to paid-in capital.
The fund used capital loss carryforwards of $46,452,000 to offset taxable capital gains realized during the year ended September 30, 2013, reducing the amount of capital gains that would otherwise be available to distribute to shareholders. For tax purposes, at September 30, 2013, the fund had $284,746,000 of ordinary income and $6,022,000 of long-term capital gains available for distribution.
At September 30, 2013, the cost of investment securities for tax purposes was $18,567,106,000. Net unrealized appreciation of investment securities for tax purposes was $3,231,651,000, consisting of unrealized gains of $3,284,339,000 on securities that had risen in value since their purchase and $52,688,000 in unrealized losses on securities that had fallen in value since their purchase.
E. During the year ended September 30, 2013, the fund purchased $7,274,848,000 of investment securities and sold $3,225,260,000 of investment securities, other than temporary cash investments.
F. Capital shares issued and redeemed were:
| | |
| | Year Ended September 30, |
| | 2013 | 2012 |
| | Shares | Shares |
| | (000) | (000) |
| Issued | 283,506 | 213,996 |
| Issued in Lieu of Cash Distributions | 15,924 | 13,680 |
| Redeemed | (138,429) | (88,615) |
| Net Increase (Decrease) in Shares Outstanding | 161,001 | 139,061 |
G. Management has determined that no material events or transactions occurred subsequent to September 30, 2013, that would require recognition or disclosure in these financial statements.
47
Target Retirement 2025 Fund
Fund Profile
As of September 30, 2013
| |
| Total Fund Characteristics | |
| |
| Ticker Symbol | VTTVX |
| 30-Day SEC Yield | 2.17% |
| Acquired Fund Fees and Expenses1 | 0.17% |
| |
| Allocation to Underlying Vanguard Funds | |
| Vanguard Total Stock Market Index Fund | |
| Investor Shares | 48.8% |
| Vanguard Total Bond Market II Index Fund | |
| Investor Shares | 24.3 |
| Vanguard Total International Stock Index | |
| Fund Investor Shares | 20.9 |
| Vanguard Total International Bond Index | |
| Fund Investor Shares | 6.0 |
| | |
| Total Fund Volatility Measures | |
| | Target 2025 | MSCI US |
| | Composite | Broad Market |
| | Index | Index |
| R-Squared | 1.00 | 0.96 |
| Beta | 1.00 | 0.75 |
These measures show the degree and timing of the fund’s fluctuations compared with the indexes over 36 months.
Fund Asset Allocation
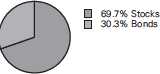
1 This figure—drawn from the prospectus dated August 12, 2013—represents an estimate of the weighted average of the expense ratios and any transaction fees charged by the underlying mutual funds (the ”acquired” funds) in which the Target Retirement 2025 Fund invests. The fund does not charge any expenses or fees of its own. For the fiscal year ended September 30, 2013, the acquired fund fees and expenses were 0.17%.
48
Target Retirement 2025 Fund
Performance Summary
All of the returns in this report represent past performance, which is not a guarantee of future results that may be achieved by the fund. (Current performance may be lower or higher than the performance data cited. For performance data current to the most recent month-end, visit our website at vanguard.com/performance.) Note, too, that both investment returns and principal value can fluctuate widely, so an investor’s shares, when sold, could be worth more or less than their original cost. The returns shown do not reflect taxes that a shareholder would pay on fund distributions or on the sale of fund shares.
Cumulative Performance: October 27, 2003, Through September 30, 2013
Initial Investment of $10,000
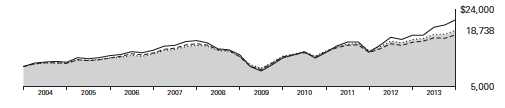
For a benchmark description, see the Glossary.
Mixed-Asset Target 2025 Funds Average: Derived from data provided by Lipper, a Thomson Reuters Company.
"Since Inception" performance is calculated from the inception date for both the fund and its comparative standards.
| | | | |
| | | Average Annual Total Returns | |
| | Periods Ended September 30, 2013 | |
| | | | Since | Final Value |
| | One | Five | Inception | of a $10,000 |
| | Year | Years | (10/27/2003) | Investment |
| Target Retirement 2025 Fund | 13.34% | 8.39% | 6.53% | $18,738 |
| Target 2025 Composite Index | 13.61 | 8.59 | 6.62 | 18,893 |
| Mixed-Asset Target 2025 Funds | | | | |
| Average | 11.45 | 7.49 | 5.96 | 17,772 |
| MSCI US Broad Market Index | 21.55 | 10.74 | 8.00 | 21,470 |
See Financial Highlights for dividend and capital gains information.
49
Target Retirement 2025 Fund
Fiscal-Year Total Returns (%): October 27, 2003, Through September 30, 2013
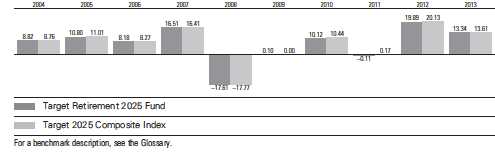
50
Target Retirement 2025 Fund
Financial Statements
Statement of Net Assets
As of September 30, 2013
The fund reports a complete list of its holdings in regulatory filings four times in each fiscal year, at the quarter-ends. For the second and fourth fiscal quarters, the lists appear in the fund’s semiannual and annual reports to shareholders. For the first and third fiscal quarters, the fund files the lists with the Securities and Exchange Commission on Form N-Q. Shareholders can look up the fund’s Forms N-Q on the SEC’s website at sec.gov. Forms N-Q may also be reviewed and copied at the SEC’s Public Reference Room (see the back cover of this report for further information).
| | |
| | | Market |
| | | Value |
| | Shares | ($000) |
| Investment Companies (100.0%) | | |
| U.S. Stock Fund (48.7%) | | |
| Vanguard Total Stock Market Index Fund Investor Shares | 293,081,763 | 12,491,145 |
| |
| International Stock Fund (20.9%) | | |
| Vanguard Total International Stock Index Fund Investor Shares | 332,780,027 | 5,364,414 |
| |
| U.S. Bond Fund (24.3%) | | |
| 1 Vanguard Total Bond Market II Index Fund Investor Shares | 589,038,518 | 6,237,918 |
| |
| International Bond Fund (6.1%) | | |
| Vanguard Total International Bond Index Fund Investor Shares | 156,658,390 | 1,550,918 |
| Total Investment Companies (Cost $21,048,272) | | 25,644,395 |
| Temporary Cash Investment (0.1%) | | |
| Money Market Fund (0.1%) | | |
| 1 Vanguard Market Liquidity Fund, 0.112% (Cost $15,187) | 15,186,962 | 15,187 |
| Total Investments (100.1%) (Cost $21,063,459) | | 25,659,582 |
| Other Assets and Liabilities (-0.1%) | | |
| Other Assets | | 326,448 |
| Liabilities | | (344,358) |
| | | (17,910) |
| Net Assets (100%) | | |
| Applicable to 1,689,468,110 outstanding $.001 par value shares of | | |
| beneficial interest (unlimited authorization) | | 25,641,672 |
| Net Asset Value Per Share | | $15.18 |
51
| |
| Target Retirement 2025 Fund | |
| |
| |
| |
| At September 30, 2013, net assets consisted of: | |
| | Amount |
| | ($000) |
| Paid-in Capital | 20,683,290 |
| Undistributed Net Investment Income | 339,939 |
| Accumulated Net Realized Gains | 22,320 |
| Unrealized Appreciation (Depreciation) | 4,596,123 |
| Net Assets | 25,641,672 |
See Note A in Notes to Financial Statements.
1 Affiliated fund available only to Vanguard funds and certain trusts and accounts managed by Vanguard. Rate shown for Vanguard Market Liquidity Fund is the 7-day yield.
See accompanying Notes, which are an integral part of the Financial Statements.
52
| |
| Target Retirement 2025 Fund | |
| |
| |
| Statement of Operations | |
| |
| | Year Ended |
| | September 30, 2013 |
| | ($000) |
| Investment Income | |
| Income | |
| Income Distributions Received | 533,278 |
| Net Investment Income—Note B | 533,278 |
| Realized Net Gain (Loss) | |
| Capital Gain Distributions Received | 34,762 |
| Investment Securities Sold | 83,691 |
| Realized Net Gain (Loss) | 118,453 |
| Change in Unrealized Appreciation (Depreciation) of Investment Securities | 2,280,063 |
| Net Increase (Decrease) in Net Assets Resulting from Operations | 2,931,794 |
See accompanying Notes, which are an integral part of the Financial Statements.
53
| | |
| Target Retirement 2025 Fund | | |
| |
| |
| Statement of Changes in Net Assets | | |
| |
| | Year Ended September 30, |
| | 2013 | 2012 |
| | ($000) | ($000) |
| Increase (Decrease) in Net Assets | | |
| Operations | | |
| Net Investment Income | 533,278 | 465,615 |
| Realized Net Gain (Loss) | 118,453 | 77,668 |
| Change in Unrealized Appreciation (Depreciation) | 2,280,063 | 2,539,930 |
| Net Increase (Decrease) in Net Assets Resulting from Operations | 2,931,794 | 3,083,213 |
| Distributions | | |
| Net Investment Income | (454,865) | (378,248) |
| Realized Capital Gain1 | (18,440) | (16,898) |
| Total Distributions | (473,305) | (395,146) |
| Capital Share Transactions | | |
| Issued | 6,898,529 | 4,781,176 |
| Issued in Lieu of Cash Distributions | 468,277 | 391,525 |
| Redeemed | (4,205,203) | (2,836,642) |
| Net Increase (Decrease) from Capital Share Transactions | 3,161,603 | 2,336,059 |
| Total Increase (Decrease) | 5,620,092 | 5,024,126 |
| Net Assets | | |
| Beginning of Period | 20,021,580 | 14,997,454 |
| End of Period2 | 25,641,672 | 20,021,580 |
1 Includes fiscal 2013 and 2012 short-term gain distributions totaling $18,440,000 and $16,898,000, respectively. Short-term gain distributions are treated as ordinary income dividends for tax purposes.
2 Net Assets—End of Period includes undistributed net investment income of $339,939,000 and $288,040,000.
See accompanying Notes, which are an integral part of the Financial Statements.
54
| | | | | |
| Target Retirement 2025 Fund | | | | | |
| |
| |
| Financial Highlights | | | | | |
| |
| |
| |
| For a Share Outstanding | | | Year Ended September 30, |
| Throughout Each Period | 2013 | 2012 | 2011 | 2010 | 2009 |
| Net Asset Value, Beginning of Period | $13.70 | $11.71 | $11.97 | $11.11 | $11.49 |
| Investment Operations | | | | | |
| Net Investment Income | .316 | .331 | .2571 | .262 | .279 |
| Capital Gain Distributions Received | .021 | .036 | .0201 | — | — |
| Net Realized and Unrealized Gain (Loss) | | | | | |
| on Investments | 1.451 | 1.927 | (. 271) | .850 | (.336) |
| Total from Investment Operations | 1.788 | 2.294 | .006 | 1.112 | (.057) |
| Distributions | | | | | |
| Dividends from Net Investment Income | (. 296) | (. 291) | (. 250) | (. 252) | (. 323) |
| Distributions from Realized Capital Gains | (.012) | (.013) | (.016) | — | — |
| Total Distributions | (.308) | (.304) | (. 266) | (. 252) | (. 323) |
| Net Asset Value, End of Period | $15.18 | $13.70 | $11.71 | $11.97 | $11.11 |
| |
| Total Return2 | 13.34% | 19.89% | -0.11% | 10.12% | 0.10% |
| |
| Ratios/Supplemental Data | | | | | |
| Net Assets, End of Period (Millions) | $25,642 | $20,022 | $14,997 | $13,652 | $9,932 |
| Ratio of Total Expenses to | | | | | |
| Average Net Assets | — | — | — | — | — |
| Acquired Fund Fees and Expenses | 0.17% | 0.17% | 0.18% | 0.18% | 0.21% |
| Ratio of Net Investment Income to | | | | | |
| Average Net Assets | 2.27% | 2.64% | 2.01% | 2.42% | 3.09% |
| Portfolio Turnover Rate | 16% | 9% | 23%3 | 11% | 21%4 |
1 Calculated based on average shares outstanding.
2 Total returns do not include account service fees that may have applied in the periods shown. Fund prospectuses provide information about any applicable account service fees.
3 Excludes the value of mutual fund shares delivered and received in connection with a change in the fund’s international equity investments from Vanguard European, Pacific, and Emerging Markets Stock Index Funds to Vanguard Total International Stock Index Fund because those transactions were effected in kind and did not cause the fund to incur transaction costs.
4 Excludes the value of mutual fund shares delivered and received in connection with a change in the fund’s bond investments from Vanguard Total Bond Market Index Fund to Vanguard Total Bond Market II Index Fund because those transactions were effected in kind and did not cause the fund to incur transaction costs.
See accompanying Notes, which are an integral part of the Financial Statements.
55
Target Retirement 2025 Fund
Notes to Financial Statements
Vanguard Target Retirement 2025 Fund is registered under the Investment Company Act of 1940 as an open-end investment company, or mutual fund. The fund follows a balanced investment strategy by investing in selected Vanguard funds to achieve its targeted allocation of assets to U.S. stocks, international stocks, U.S. bonds, and international bonds. Financial statements and other information about each underlying fund are available on vanguard.com.
A. The following significant accounting policies conform to generally accepted accounting principles for U.S. mutual funds. The fund consistently follows such policies in preparing its financial statements.
1. Security Valuation: Investments are valued at the net asset value of each underlying Vanguard fund determined as of the close of the New York Stock Exchange (generally 4 p.m., Eastern time) on the valuation date.
2. Federal Income Taxes: The fund intends to continue to qualify as a regulated investment company and distribute all of its taxable income. Management has analyzed the fund’s tax positions taken for all open federal income tax years (September 30, 2010–2013), and has concluded that no provision for federal income tax is required in the fund’s financial statements.
3. Distributions: Distributions to shareholders are recorded on the ex-dividend date.
4. Other: Income and capital gain distributions received are recorded on the ex-dividend date. Security transactions are accounted for on the date securities are bought or sold. Costs used to determine realized gains (losses) on the sale of investment securities are those of the specific securities sold.
B. Under a service agreement, The Vanguard Group furnishes investment advisory, corporate management, administrative, marketing, and distribution services to the fund. The service agreement provides that the fund’s expenses may be reduced or eliminated to the extent of savings realized by the Vanguard funds by the operation of the fund. Accordingly, all incremental expenses for services provided by Vanguard and all other expenses incurred by the fund during the year ended September 30, 2013, were borne by the funds in which the fund invests. The fund’s trustees and officers are also directors and officers of Vanguard and the funds in which the fund invests.
C. Various inputs may be used to determine the value of the fund’s investments. These inputs are summarized in three broad levels for financial statement purposes. The inputs or methodologies used to value securities are not necessarily an indication of the risk associated with investing in those securities.
Level 1—Quoted prices in active markets for identical securities.
Level 2—Other significant observable inputs (including quoted prices for similar securities, interest rates, prepayment speeds, credit risk, etc.).
Level 3—Significant unobservable inputs (including the fund’s own assumptions used to determine the fair value of investments).
At September 30, 2013, 100% of the market value of the fund’s investments was determined based on Level 1 inputs.
D. Distributions are determined on a tax basis and may differ from net investment income and realized capital gains for financial reporting purposes. Differences may be permanent or temporary. Permanent differences are reclassified among capital accounts in the financial statements to reflect their tax character. Temporary differences arise when certain items of income, expense, gain, or loss are recognized in different periods for financial statement and tax purposes; these differences will reverse at some time in the future. Differences in classification may also result from the treatment of short-term gains as ordinary income for tax purposes.
56
Target Retirement 2025 Fund
The fund used a tax accounting practice to treat a portion of the price of capital shares redeemed during the year as distributions from net investment income and realized capital gains. Accordingly, the fund has reclassified $26,514,000 from undistributed net investment income, and $1,377,000 from accumulated net realized gains, to paid-in capital.
The fund used capital loss carryforwards of $74,491,000 to offset taxable capital gains realized during the year ended September 30, 2013, reducing the amount of capital gains that would otherwise be available to distribute to shareholders. For tax purposes, at September 30, 2013, the fund had $367,354,000 of ordinary income available for distribution.
At September 30, 2013, the cost of investment securities for tax purposes was $21,068,554,000. Net unrealized appreciation of investment securities for tax purposes was $4,591,028,000, consisting of unrealized gains of $4,640,419,000 on securities that had risen in value since their purchase and $49,391,000 in unrealized losses on securities that had fallen in value since their purchase.
E. During the year ended September 30, 2013, the fund purchased $7,078,476,000 of investment securities and sold $3,798,111,000 of investment securities, other than temporary cash investments.
F. Capital shares issued and redeemed were:
| | |
| | Year Ended September 30, |
| | 2013 | 2012 |
| | Shares | Shares |
| | (000) | (000) |
| Issued | 483,653 | 369,649 |
| Issued in Lieu of Cash Distributions | 34,790 | 31,883 |
| Redeemed | (290,706) | (220,958) |
| Net Increase (Decrease) in Shares Outstanding | 227,737 | 180,574 |
G. Management has determined that no material events or transactions occurred subsequent to September 30, 2013, that would require recognition or disclosure in these financial statements.
57
Target Retirement 2030 Fund
Fund Profile
As of September 30, 2013
| |
| Total Fund Characteristics | |
| |
| Ticker Symbol | VTHRX |
| 30-Day SEC Yield | 2.18% |
| Acquired Fund Fees and Expenses1 | 0.17% |
| |
| Allocation to Underlying Vanguard Funds | |
| Vanguard Total Stock Market Index Fund | |
| Investor Shares | 54.0% |
| Vanguard Total International Stock Index | |
| Fund Investor Shares | 23.2 |
| Vanguard Total Bond Market II Index Fund | |
| Investor Shares | 18.3 |
| Vanguard Total International Bond Index | |
| Fund Investor Shares | 4.5 |
| | |
| Total Fund Volatility Measures | |
| | Target 2030 | MSCI US |
| | Composite | Broad Market |
| | Index | Index |
| R-Squared | 1.00 | 0.96 |
| Beta | 1.00 | 0.83 |
These measures show the degree and timing of the fund’s fluctuations compared with the indexes over 36 months.
Fund Asset Allocation

1 This figure—drawn from the prospectus dated August 12, 2013—represents an estimate of the weighted average of the expense ratios and any transaction fees charged by the underlying mutual funds (the ”acquired” funds) in which the Target Retirement 2030 Fund invests. The fund does not charge any expenses or fees of its own. For the fiscal year ended September 30, 2013, the acquired fund fees and expenses were 0.17%.
58
Target Retirement 2030 Fund
Performance Summary
All of the returns in this report represent past performance, which is not a guarantee of future results that may be achieved by the fund. (Current performance may be lower or higher than the performance data cited. For performance data current to the most recent month-end, visit our website at vanguard.com/performance.) Note, too, that both investment returns and principal value can fluctuate widely, so an investor’s shares, when sold, could be worth more or less than their original cost. The returns shown do not reflect taxes that a shareholder would pay on fund distributions or on the sale of fund shares.
Cumulative Performance: June 7, 2006, Through September 30, 2013
Initial Investment of $10,000
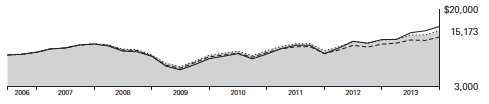
| | | | | |
| | | | Average Annual Total Returns | |
| | | Periods Ended September 30, 2013 | |
| | | | | Since | Final Value |
| | | One | Five | Inception | of a $10,000 |
| | | Year | Years | (6/7/2006) | Investment |
| | Target Retirement 2030 Fund | 15.05% | 8.59% | 5.86% | $15,173 |
| •••••••• | Target 2030 Composite Index | 15.30 | 8.79 | 5.97 | 15,287 |
| – – – – | Mixed-Asset Target 2030 Funds | | | | |
| |
| | MSCI Average US Broad Market Index | 21.55 12.61 | 10.74 7.50 | 6.89 4.64 | 16,275 13,939 |
For a benchmark description, see the Glossary.
Mixed-Asset Target 2030 Funds Average: Derived from data provided by Lipper, a Thomson Reuters Company.
"Since Inception" performance is calculated from the inception date for both the fund and its comparative standards.
See Financial Highlights for dividend and capital gains information.
59
Target Retirement 2030 Fund
Fiscal-Year Total Returns (%): June 7, 2006, Through September 30, 2013
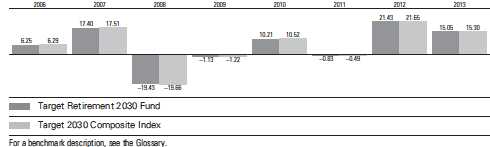
60
Target Retirement 2030 Fund
Financial Statements
Statement of Net Assets
As of September 30, 2013
The fund reports a complete list of its holdings in regulatory filings four times in each fiscal year, at the quarter-ends. For the second and fourth fiscal quarters, the lists appear in the fund’s semiannual and annual reports to shareholders. For the first and third fiscal quarters, the fund files the lists with the Securities and Exchange Commission on Form N-Q. Shareholders can look up the fund’s Forms N-Q on the SEC’s website at sec.gov. Forms N-Q may also be reviewed and copied at the SEC’s Public Reference Room (see the back cover of this report for further information).
| | |
| | | Market |
| | | Value |
| | Shares | ($000) |
| Investment Companies (99.9%) | | |
| U.S. Stock Fund (54.0%) | | |
| Vanguard Total Stock Market Index Fund Investor Shares | 225,591,075 | 9,614,692 |
| |
| International Stock Fund (23.1%) | | |
| Vanguard Total International Stock Index Fund Investor Shares | 255,655,497 | 4,121,167 |
| |
| U.S. Bond Fund (18.3%) | | |
| 1 Vanguard Total Bond Market II Index Fund Investor Shares | 306,844,139 | 3,249,479 |
| |
| International Bond Fund (4.5%) | | |
| Vanguard Total International Bond Index Fund Investor Shares | 81,303,757 | 804,907 |
| Total Investment Companies (Cost $14,611,221) | | 17,790,245 |
| Temporary Cash Investment (0.1%) | | |
| Money Market Fund (0.1%) | | |
| 1 Vanguard Market Liquidity Fund, 0.112% (Cost $8,924) | 8,923,695 | 8,924 |
| Total Investments (100.0%) (Cost $14,620,145) | | 17,799,169 |
| Other Assets and Liabilities (0.0%) | | |
| Other Assets | | 254,170 |
| Liabilities | | (258,714) |
| | | (4,544) |
| Net Assets (100%) | | |
| Applicable to 672,420,191 outstanding $.001 par value shares of | | |
| beneficial interest (unlimited authorization) | | 17,794,625 |
| Net Asset Value Per Share | | $26.46 |
61
| |
| Target Retirement 2030 Fund | |
| |
| |
| |
| At September 30, 2013, net assets consisted of: | |
| | Amount |
| | ($000) |
| Paid-in Capital | 14,369,113 |
| Undistributed Net Investment Income | 229,962 |
| Accumulated Net Realized Gains | 16,526 |
| Unrealized Appreciation (Depreciation) | 3,179,024 |
| Net Assets | 17,794,625 |
See Note A in Notes to Financial Statements.
1 Affiliated fund available only to Vanguard funds and certain trusts and accounts managed by Vanguard. Rate shown for Vanguard Market Liquidity Fund is the 7-day yield.
See accompanying Notes, which are an integral part of the Financial Statements.
62
| |
| Target Retirement 2030 Fund | |
| |
| |
| Statement of Operations | |
| |
| | Year Ended |
| | September 30, 2013 |
| | ($000) |
| Investment Income | |
| Income | |
| Income Distributions Received | 361,634 |
| Net Investment Income—Note B | 361,634 |
| Realized Net Gain (Loss) | |
| Capital Gain Distributions Received | 16,847 |
| Investment Securities Sold | 24,034 |
| Realized Net Gain (Loss) | 40,881 |
| Change in Unrealized Appreciation (Depreciation) of Investment Securities | 1,795,127 |
| Net Increase (Decrease) in Net Assets Resulting from Operations | 2,197,642 |
See accompanying Notes, which are an integral part of the Financial Statements.
63
| | |
| Target Retirement 2030 Fund | | |
| |
| |
| Statement of Changes in Net Assets | | |
| |
| | Year Ended September 30, |
| | 2013 | 2012 |
| | ($000) | ($000) |
| Increase (Decrease) in Net Assets | | |
| Operations | | |
| Net Investment Income | 361,634 | 282,814 |
| Realized Net Gain (Loss) | 40,881 | 35,619 |
| Change in Unrealized Appreciation (Depreciation) | 1,795,127 | 1,624,548 |
| Net Increase (Decrease) in Net Assets Resulting from Operations | 2,197,642 | 1,942,981 |
| Distributions | | |
| Net Investment Income | (289,870) | (204,000) |
| Realized Capital Gain1 | (8,714) | (7,410) |
| Total Distributions | (298,584) | (211,410) |
| Capital Share Transactions | | |
| Issued | 5,741,317 | 3,986,357 |
| Issued in Lieu of Cash Distributions | 294,856 | 209,803 |
| Redeemed | (2,787,514) | (1,525,373) |
| Net Increase (Decrease) from Capital Share Transactions | 3,248,659 | 2,670,787 |
| Total Increase (Decrease) | 5,147,717 | 4,402,358 |
| Net Assets | | |
| Beginning of Period | 12,646,908 | 8,244,550 |
| End of Period2 | 17,794,625 | 12,646,908 |
1 Includes fiscal 2013 and 2012 short-term gain distributions totaling $8,714,000 and $7,410,000, respectively. Short-term gain distributions are treated as ordinary income dividends for tax purposes.
2 Net Assets—End of Period includes undistributed net investment income of $229,962,000 and $177,537,000.
See accompanying Notes, which are an integral part of the Financial Statements.
64
Target Retirement 2030 Fund
Financial Highlights
| | | | | |
| For a Share Outstanding | | | Year Ended September 30, |
| Throughout Each Period | 2013 | 2012 | 2011 | 2010 | 2009 |
| Net Asset Value, Beginning of Period | $23.51 | $19.81 | $20.36 | $18.84 | $19.63 |
| Investment Operations | | | | | |
| Net Investment Income | . 540 | .561 | .398 | .4531 | .4661 |
| Capital Gain Distributions Received | .027 | .044 | .011 | — | — |
| Net Realized and Unrealized Gain (Loss) | | | | | |
| on Investments | 2.897 | 3.580 | (.542) | 1.453 | (.793) |
| Total from Investment Operations | 3.464 | 4.185 | (.133) | 1.906 | (.327) |
| Distributions | | | | | |
| Dividends from Net Investment Income | (.499) | (.468) | (. 395) | (. 386) | (.463) |
| Distributions from Realized Capital Gains | (.015) | (.017) | (.022) | — | — |
| Total Distributions | (.514) | (.485) | (. 417) | (.386) | (.463) |
| Net Asset Value, End of Period | $26.46 | $23.51 | $19.81 | $20.36 | $18.84 |
| |
| Total Return2 | 15.05% | 21.43% | -0.83% | 10.21% | -1.13% |
| |
| Ratios/Supplemental Data | | | | | |
| Net Assets, End of Period (Millions) | $17,795 | $12,647 | $8,245 | $6,533 | $4,003 |
| Ratio of Total Expenses to | | | | | |
| Average Net Assets | — | — | — | — | — |
| Acquired Fund Fees and Expenses | 0.17% | 0.17% | 0.18% | 0.19% | 0.21% |
| Ratio of Net Investment Income to | | | | | |
| Average Net Assets | 2.30% | 2.66% | 1.91% | 2.32% | 2.92% |
| Portfolio Turnover Rate | 14% | 4% | 19%3 | 9% | 13% 4 |
1 Calculated based on average shares outstanding.
2 Total returns do not include account service fees that may have applied in the periods shown. Fund prospectuses provide information about any applicable account service fees.
3 Excludes the value of mutual fund shares delivered and received in connection with a change in the fund’s international equity investments from Vanguard European, Pacific, and Emerging Markets Stock Index Funds to Vanguard Total International Stock Index Fund because those transactions were effected in kind and did not cause the fund to incur transaction costs.
4 Excludes the value of mutual fund shares delivered and received in connection with a change in the fund’s bond investments from Vanguard Total Bond Market Index Fund to Vanguard Total Bond Market II Index Fund because those transactions were effected in kind and did not cause the fund to incur transaction costs.
See accompanying Notes, which are an integral part of the Financial Statements.
65
Target Retirement 2030 Fund
Notes to Financial Statements
Vanguard Target Retirement 2030 Fund is registered under the Investment Company Act of 1940 as an open-end investment company, or mutual fund. The fund follows a balanced investment strategy by investing in selected Vanguard funds to achieve its targeted allocation of assets to U.S. stocks, international stocks, U.S. bonds, and international bonds. Financial statements and other information about each underlying fund are available on vanguard.com.
A. The following significant accounting policies conform to generally accepted accounting principles for U.S. mutual funds. The fund consistently follows such policies in preparing its financial statements.
1. Security Valuation: Investments are valued at the net asset value of each underlying Vanguard fund determined as of the close of the New York Stock Exchange (generally 4 p.m., Eastern time) on the valuation date.
2. Federal Income Taxes: The fund intends to continue to qualify as a regulated investment company and distribute all of its taxable income. Management has analyzed the fund’s tax positions taken for all open federal income tax years (September 30, 2010–2013), and has concluded that no provision for federal income tax is required in the fund’s financial statements.
3. Distributions: Distributions to shareholders are recorded on the ex-dividend date.
4. Other: Income and capital gain distributions received are recorded on the ex-dividend date. Security transactions are accounted for on the date securities are bought or sold. Costs used to determine realized gains (losses) on the sale of investment securities are those of the specific securities sold.
B. Under a service agreement, The Vanguard Group furnishes investment advisory, corporate management, administrative, marketing, and distribution services to the fund. The service agreement provides that the fund’s expenses may be reduced or eliminated to the extent of savings realized by the Vanguard funds by the operation of the fund. Accordingly, all incremental expenses for services provided by Vanguard and all other expenses incurred by the fund during the year ended September 30, 2013, were borne by the funds in which the fund invests. The fund’s trustees and officers are also directors and officers of Vanguard and the funds in which the fund invests.
C. Various inputs may be used to determine the value of the fund’s investments. These inputs are summarized in three broad levels for financial statement purposes. The inputs or methodologies used to value securities are not necessarily an indication of the risk associated with investing in those securities.
Level 1—Quoted prices in active markets for identical securities.
Level 2—Other significant observable inputs (including quoted prices for similar securities, interest rates, prepayment speeds, credit risk, etc.).
Level 3—Significant unobservable inputs (including the fund’s own assumptions used to determine the fair value of investments).
At September 30, 2013, 100% of the market value of the fund’s investments was determined based on Level 1 inputs.
D. Distributions are determined on a tax basis and may differ from net investment income and realized capital gains for financial reporting purposes. Differences may be permanent or temporary. Permanent differences are reclassified among capital accounts in the financial statements to reflect their tax character. Temporary differences arise when certain items of income, expense, gain, or loss are recognized in different periods for financial statement and tax purposes; these differences will reverse at some time in the future. Differences in classification may also result from the treatment of short-term gains as ordinary income for tax purposes.
66
Target Retirement 2030 Fund
The fund used a tax accounting practice to treat a portion of the price of capital shares redeemed during the year as distributions from net investment income and realized capital gains. Accordingly, the fund has reclassified $19,339,000 from undistributed net investment income, and $1,363,000 from accumulated net realized gains, to paid-in capital.
The fund used capital loss carryforwards of $7,257,000 to offset taxable capital gains realized during the year ended September 30, 2013, reducing the amount of capital gains that would otherwise be available to distribute to shareholders. For tax purposes, at September 30, 2013, the fund had $252,838,000 of ordinary income and $1,793,000 of long-term capital gains available for distribution.
At September 30, 2013, the cost of investment securities for tax purposes was $14,628,287,000. Net unrealized appreciation of investment securities for tax purposes was $3,170,882,000, consisting of unrealized gains of $3,201,662,000 on securities that had risen in value since their purchase and $30,780,000 in unrealized losses on securities that had fallen in value since their purchase.
E. During the year ended September 30, 2013, the fund purchased $5,572,145,000 of investment securities and sold $2,229,224,000 of investment securities, other than temporary cash investments.
F. Capital shares issued and redeemed were:
| | |
| | Year Ended September 30, |
| | 2013 | 2012 |
| | Shares | Shares |
| | (000) | (000) |
| Issued | 233,050 | 180,472 |
| Issued in Lieu of Cash Distributions | 12,748 | 10,019 |
| Redeemed | (111,235) | (68,762) |
| Net Increase (Decrease) in Shares Outstanding | 134,563 | 121,729 |
G. Management has determined that no material events or transactions occurred subsequent to September 30, 2013, that would require recognition or disclosure in these financial statements.
67
Report of Independent Registered
Public Accounting Firm
To the Trustees of Vanguard Chester Funds and the Shareholders of Vanguard Target Retirement Income Fund, Vanguard Target Retirement 2010 Fund, Vanguard Target Retirement 2015 Fund, Vanguard Target Retirement 2020 Fund, Vanguard Target Retirement 2025 Fund and Vanguard Target Retirement 2030 Fund:
In our opinion, the accompanying statements of net assets and the related statements of operations and of changes in net assets and the financial highlights present fairly, in all material respects, the financial position of Vanguard Target Retirement Income Fund, Vanguard Target Retirement 2010 Fund, Vanguard Target Retirement 2015 Fund, Vanguard Target Retirement 2020 Fund, Vanguard Target Retirement 2025 Fund and Vanguard Target Retirement 2030 Fund (constituting separate portfolios of Vanguard Chester Funds, hereafter referred to as the “Funds”) at September 30, 2013, the results of each of their operations for the year then ended, the changes in each of their net assets for each of the two years in the period then ended, and the financial highlights for each of the five years in the period then ended, in conformity with accounting principles generally accepted in the United States of America. These financial statements and financial highlights (hereafter referred to as “financial statements”) are the responsibility of the Funds’ management; our responsibility is to express an opinion on these financial statements based on our audits. We conducted our audits of these financial statements in accordance with the standards of the Public Company Accounting Oversight Board (United States). Those standards require that we plan and perform the audit to obtain reasonable assurance about whether the financial statements are free of material misstatement. An audit includes examining, on a test basis, evidence supporting the amounts and disclosures in the financial statements, assessing the accounting principles used and significant estimates made by management, and evaluating the overall financial statement presentation. We believe that our audits, which included confirmation of securities at September 30, 2013 by agreement to the underlying ownership records of the transfer agent, provide a reasonable basis for our opinion.
PricewaterhouseCoopers LLP
Philadelphia, Pennsylvania
November 7, 2013
|
| Special 2013 tax information (unaudited) for Vanguard Target Retirement Funds |
| |
| This information for the fiscal year ended September 30, 2013, is included pursuant to provisions of |
| the Internal Revenue Code. |
| The funds distributed capital gain dividends (from net long-term capital gains) to shareholders during |
| the fiscal year as follows: |
| |
| Fund | ($000) |
| Target Retirement Income Fund | 22,538 |
| Target Retirement 2010 Fund | 5,349 |
| Target Retirement 2015 Fund | 6,760 |
| Target Retirement 2020 Fund | 327 |
| Target Retirement 2025 Fund | — |
| Target Retirement 2030 Fund | 99 |
68
The funds distributed qualified dividend income to shareholders during the fiscal year as follows:
| |
| Fund | ($000) |
| Target Retirement Income Fund | 70,303 |
| Target Retirement 2010 Fund | 54,999 |
| Target Retirement 2015 Fund | 190,991 |
| Target Retirement 2020 Fund | 209,938 |
| Target Retirement 2025 Fund | 291,205 |
| Target Retirement 2030 Fund | 204,097 |
For corporate shareholders, the percentage of investment income (dividend income plus short-term gains, if any) that qualifies for the dividends-received deduction is as follows:
| |
| Fund | Percentage |
| Target Retirement Income Fund | 18.9% |
| Target Retirement 2010 Fund | 25.3 |
| Target Retirement 2015 Fund | 31.8 |
| Target Retirement 2020 Fund | 36.2 |
| Target Retirement 2025 Fund | 38.3 |
| Target Retirement 2030 Fund | 41.6 |
The funds designate to shareholders foreign source income and foreign taxes paid as follows:
| | |
| | Foreign Source Income | Foreign Taxes Paid |
| Fund | ($000) | ($000) |
| Target Retirement Income Fund | 29,042 | 1,641 |
| Target Retirement 2010 Fund | 26,461 | 1,495 |
| Target Retirement 2015 Fund | 97,191 | 5,491 |
| Target Retirement 2020 Fund | 116,791 | 6,598 |
| Target Retirement 2025 Fund | 158,451 | 8,951 |
| Target Retirement 2030 Fund | 116,957 | 6,607 |
Shareholders will receive more detailed information with their Form 1099-DIV in January 2014 to determine the calendar-year amounts to be included on their 2013 tax returns.
69
Your Fund’s After-Tax Returns
This table presents returns for your fund both before and after taxes. The after-tax returns are shown in two ways: (1) assuming that an investor owned the fund during the entire period and paid taxes on the fund’s distributions, and (2) assuming that an investor paid taxes on the fund’s distributions and sold all shares at the end of each period.
Calculations are based on the highest individual federal income tax and capital gains tax rates in effect at the times of the distributions and the hypothetical sales. State and local taxes were not considered. After-tax returns reflect any qualified dividend income, using actual prior-year figures and estimates for 2013. (In the example, returns after the sale of fund shares may be higher than those assuming no sale. This occurs when the sale would have produced a capital loss. The calculation assumes that the investor received a tax deduction for the loss.)
Please note that your actual after-tax returns will depend on your tax situation and may differ from those shown. Also note that if you own the fund in a tax-deferred account, such as an individual retirement account or a 401(k) plan, this information does not apply to you. Such accounts are not subject to current taxes.
Finally, keep in mind that a fund’s performance—whether before or after taxes—does not guarantee future results.
| | | |
| Average Annual Total Returns: Target Retirement Funds | | | |
| Periods Ended September 30, 2013 | | | |
| | | | Since |
| | One | Five | Inception |
| | Year | Years | (10/27/2003) |
| Target Retirement Income Fund | | | |
| Returns Before Taxes | 4.12% | 6.83% | 5.54% |
| Returns After Taxes on Distributions | 3.38 | 5.98 | 4.48 |
| Returns After Taxes on Distributions and Sale of Fund Shares | 2.56 | 5.08 | 4.01 |
| | | | Since |
| | One | Five | Inception |
| | Year | Years | (6/7/2006) |
| Target Retirement 2010 Fund | | | |
| Returns Before Taxes | 6.76% | 7.41% | 5.74% |
| Returns After Taxes on Distributions | 6.10 | 6.60 | 5.09 |
| Returns After Taxes on Distributions and Sale of Fund Shares | 4.19 | 5.58 | 4.35 |
| |
| | | | Since |
| | One | Five | Inception |
| | Year | Years | (10/27/2003) |
| Target Retirement 2015 Fund | | | |
| Returns Before Taxes | 9.56% | 7.92% | 6.27% |
| Returns After Taxes on Distributions | 8.93 | 7.16 | 5.61 |
| Returns After Taxes on Distributions and Sale of Fund Shares | 5.81 | 6.03 | 4.84 |
70
| | | |
| Average Annual Total Returns: Target Retirement Funds | | | |
| Periods Ended September 30, 2013 | | | |
| |
| | | | Since |
| | One | Five | Inception |
| | Year | Years | (6/7/2006) |
| Target Retirement 2020 Fund | | | |
| Returns Before Taxes | 11.70% | 8.20% | 5.93% |
| Returns After Taxes on Distributions | 11.13 | 7.56 | 5.41 |
| Returns After Taxes on Distributions and Sale of Fund Shares | 7.04 | 6.31 | 4.58 |
| |
| | | | Since |
| | One | Five | Inception |
| | Year | Years | (10/27/2003) |
| Target Retirement 2025 Fund | | | |
| Returns Before Taxes | 13.34% | 8.39% | 6.53% |
| Returns After Taxes on Distributions | 12.79 | 7.78 | 6.00 |
| Returns After Taxes on Distributions and Sale of Fund Shares | 8.00 | 6.50 | 5.14 |
| |
| | | | Since |
| | One | Five | Inception |
| | Year | Years | (6/7/2006) |
| Target Retirement 2030 Fund | | | |
| Returns Before Taxes | 15.05% | 8.59% | 5.86% |
| Returns After Taxes on Distributions | 14.54 | 8.07 | 5.45 |
| Returns After Taxes on Distributions and Sale of Fund Shares | 8.99 | 6.71 | 4.59 |
71
About Your Fund’s Expenses
As a shareholder of the fund, you incur ongoing costs, which include costs for portfolio management, administrative services, and shareholder reports (like this one), among others. Operating expenses, which are deducted from a fund’s gross income, directly reduce the investment return of the fund.
A typical fund’s expenses are expressed as a percentage of its average net assets. The Target Retirement Funds have no direct expenses, but each fund bears its proportionate share of the costs for the underlying funds in which it invests. These indirect expenses make up the acquired fund fees and expenses, also expressed as a percentage of average net assets.
The following examples are intended to help you understand the ongoing cost (in dollars) of investing in your fund and to compare these costs with those of other mutual funds. The examples are based on an investment of $1,000 made at the beginning of the period shown and held for the entire period. The costs were calculated using the acquired fund fees and expenses for each Target Retirement Fund.
The accompanying table illustrates your fund’s costs in two ways:
• Based on actual fund return. This section helps you to estimate the actual expenses that you paid over the period. The ”Ending Account Value“ shown is derived from the fund‘s actual return, and the third column shows the dollar amount that would have been paid by an investor who started with $1,000 in the fund. You may use the information here, together with the amount you invested, to estimate the expenses that you paid over the period.
To do so, simply divide your account value by $1,000 (for example, an $8,600 account value divided by $1,000 = 8.6), then multiply the result by the number given for your fund under the heading ”Expenses Paid During Period.“
• Based on hypothetical 5% yearly return. This section is intended to help you compare your fund‘s costs with those of other mutual funds. It assumes that the fund had a yearly return of 5% before expenses, but that the expense ratio is unchanged. In this case—because the return used is not the fund’s actual return—the results do not apply to your investment. The example is useful in making comparisons because the Securities and Exchange Commission requires all mutual funds to calculate expenses based on a 5% return. You can assess your fund’s costs by comparing this hypothetical example with the hypothetical examples that appear in shareholder reports of other funds.
Note that the expenses shown in the table are meant to highlight and help you compare ongoing costs only and do not reflect transaction costs incurred by the fund for buying and selling securities. Further, the expenses do not include any purchase, redemption, or account service fees described in the fund prospectus. If such fees were applied to your account, your costs would be higher. Your fund does not carry a “sales load.”
The calculations assume no shares were bought or sold during the period. Your actual costs may have been higher or lower, depending on the amount of your investment and the timing of any purchases or redemptions.
You can find more information about the fund’s expenses, including annual expense ratios, in the Financial Statements section of this report. For additional information on operating expenses and other shareholder costs, please refer to your fund’s current prospectus.
72
| | | |
| Six Months Ended September 30, 2013 | | | |
| | Beginning | Ending | Expenses |
| | Account Value | Account Value | Paid During |
| | 3/31/2013 | 9/30/2013 | Period |
| Based on Actual Fund Return | | | |
| Target Retirement Income Fund | $1,000.00 | $1,008.22 | $0.86 |
| Target Retirement 2010 Fund | $1,000.00 | $1,020.82 | $0.86 |
| Target Retirement 2015 Fund | $1,000.00 | $1,035.00 | $0.87 |
| Target Retirement 2020 Fund | $1,000.00 | $1,046.22 | $0.87 |
| Target Retirement 2025 Fund | $1,000.00 | $1,053.44 | $0.88 |
| Target Retirement 2030 Fund | $1,000.00 | $1,061.37 | $0.88 |
| Based on Hypothetical 5% Yearly Return | | | |
| Target Retirement Income Fund | $1,000.00 | $1,024.22 | $0.86 |
| Target Retirement 2010 Fund | $1,000.00 | $1,024.22 | $0.86 |
| Target Retirement 2015 Fund | $1,000.00 | $1,024.22 | $0.86 |
| Target Retirement 2020 Fund | $1,000.00 | $1,024.22 | $0.86 |
| Target Retirement 2025 Fund | $1,000.00 | $1,024.22 | $0.86 |
| Target Retirement 2030 Fund | $1,000.00 | $1,024.22 | $0.86 |
The calculations are based on the acquired fund fees and expenses for the most recent six-month period. The funds’ annualized expense figures for that period are (in order as listed from top to bottom above) 0.17%, 0.17%, 0.17%, 0.17%, 0.17%, and 0.17%. The dollar amounts shown as ”Expenses Paid” are equal to the annualized expense figures for the underlying funds multiplied by the average account value over the period, multiplied by the number of days in the most recent six-month period, then divided by the number of days in the most recent 12-month period.
73
Glossary
30-Day SEC Yield. A fund’s 30-day SEC yield is derived using a formula specified by the U.S. Securities and Exchange Commission. Under the formula, data related to the fund’s security holdings in the previous 30 days are used to calculate the fund’s hypothetical net income for that period, which is then annualized and divided by the fund’s estimated average net assets over the calculation period. For the purposes of this calculation, a security’s income is based on its current market yield to maturity (for bonds), its actual income (for asset-backed securities), or its projected dividend yield (for stocks). Because the SEC yield represents hypothetical annualized income, it will differ—at times significantly—from the fund’s actual experience. As a result, the fund’s income distributions may be higher or lower than implied by the SEC yield.
Acquired Fund Fees and Expenses. Funds that invest in other Vanguard funds incur no direct expenses, but they do bear proportionate shares of the operating, administrative, and advisory expenses of the underlying funds, and they must pay any fees charged by those funds. The figure for acquired fund fees and expenses represents a weighted average of these underlying costs. Acquired is a term that the Securities and Exchange Commission applies to any mutual fund whose shares are owned by another fund.
Beta. A measure of the magnitude of a fund’s past share-price fluctuations in relation to the ups and downs of a given market index. The index is assigned a beta of 1.00. Compared with a given index, a fund with a beta of 1.20 typically would have seen its share price rise or fall by 12% when the index rose or fell by 10%. For this report, beta is based on returns over the past 36 months for both the fund and the index. Note that a fund’s beta should be reviewed in conjunction with its R-squared (see definition). The lower the R-squared, the less correlation there is between the fund and the index, and the less reliable beta is as an indicator of volatility.
Expense Ratio. A fund’s total annual operating expenses expressed as a percentage of the fund’s average net assets. The expense ratio includes management and administrative expenses, but does not include the transaction costs of buying and selling portfolio securities.
Inception Date. The date on which the assets of a fund (or one of its share classes) are first invested in accordance with the fund’s investment objective. For funds with a subscription period, the inception date is the day after that period ends. Investment performance is measured from the inception date.
R-Squared. A measure of how much of a fund’s past returns can be explained by the returns from the market in general, as measured by a given index. If a fund’s total returns were precisely synchronized with an index’s returns, its R-squared would be 1.00. If the fund’s returns bore no relationship to the index’s returns, its R-squared would be 0. For this report, R-squared is based on returns over the past 36 months for both the fund and the index.
74
Benchmark Information
Target 2010 Composite Index: Derived by applying the fund’s target asset allocation to the results of the following benchmarks: for international stocks of developed markets, the MSCI EAFE Index through December 15, 2010, the MSCI ACWI ex USA IMI Index through June 2, 2013, and the FTSE Global All Cap ex US Index thereafter; for emerging-market stocks, the Select Emerging Markets Index through August 23, 2006, the MSCI Emerging Markets Index through December 15, 2010, the MSCI ACWI ex USA IMI Index through June 2, 2013, and the FTSE Global All Cap ex US Index thereafter; for U.S. bonds, the Barclays U.S. Aggregate Bond Index through December 31, 2009, and the Barclays U.S. Aggregate Float Adjusted Index thereafter, as well as the Barclays U.S. Treasury Inflation Protected Securities Index through June 2, 2013, and the Barclays U.S. Treasury Inflation-Protected Securities (TIPS) 0-5 Year Index thereafter; for short-term reserves, the Citigroup Three-Month Treasury Bill Index through June 2, 2013; for international bonds, the Barclays Global Aggregate ex-USD Float Adjusted RIC Capped Index; and for U.S. stocks, the MSCI US Broad Market Index through June 2, 2013, and the CRSP US Total Market Index thereafter. International stock benchmark returns are adjusted for withholding taxes.
Target 2015 Composite Index: Derived by applying the fund’s target asset allocation to the results of the following benchmarks: for international stocks of developed markets, the MSCI EAFE Index through December 15, 2010, the MSCI ACWI ex USA IMI Index through June 2, 2013, and the FTSE Global All Cap ex US Index thereafter; for emerging-market stocks, the Select Emerging Markets Index through August 23, 2006, the MSCI Emerging Markets Index through December 15, 2010, the MSCI ACWI ex USA IMI Index through June 2, 2013, and the FTSE Global All Cap ex US Index thereafter; for U.S. bonds, the Barclays U.S. Aggregate Bond Index through December 31, 2009, and the Barclays U.S. Aggregate Float Adjusted Index thereafter, as well as the Barclays U.S. Treasury Inflation Protected Securities Index through June 2, 2013, and the Barclays U.S. Treasury Inflation-Protected Securities (TIPS) 0-5 Year Index thereafter; for international bonds, the Barclays Global Aggregate ex-USD Float Adjusted RIC Capped Index; and for U.S. stocks, the Dow Jones U.S. Total Stock Market Index (formerly known as the Dow Jones Wilshire 5000 Index) through April 22, 2005, the MSCI US Broad Market Index through June 2, 2013, and the CRSP US Total Market Index thereafter. International stock benchmark returns are adjusted for withholding taxes.
Target 2020 Composite Index: Derived by applying the fund’s target asset allocation to the results of the following benchmarks: for international stocks of developed markets, the MSCI EAFE Index through December 15, 2010, the MSCI ACWI ex USA IMI Index through June 2, 2013, and the FTSE Global All Cap ex US Index thereafter; for emerging-market stocks, the Select Emerging Markets Index through August 23, 2006, the MSCI Emerging Markets Index through December 15, 2010, the MSCI ACWI ex USA IMI Index through June 2, 2013, and the FTSE Global All Cap ex US Index thereafter; for U.S. bonds, the Barclays U.S. Aggregate Bond Index through December 31, 2009, and the Barclays U.S. Aggregate Float Adjusted Index thereafter; for international bonds, the Barclays Global Aggregate ex-USD Float Adjusted RIC Capped Index; and for U.S. stocks, the MSCI US Broad Market Index through June 2, 2013, and the CRSP US Total Market Index thereafter. International stock benchmark returns are adjusted for withholding taxes.
75
Target 2025 Composite Index: Derived by applying the fund’s target asset allocation to the results of the following benchmarks: for international stocks of developed markets, the MSCI EAFE Index through December 15, 2010, the MSCI ACWI ex USA IMI Index through June 2, 2013, and the FTSE Global All Cap ex US Index thereafter; for emerging-market stocks, the Select Emerging Markets Index through August 23, 2006, the MSCI Emerging Markets Index through December 15, 2010, the MSCI ACWI ex USA IMI Index through June 2, 2013, and the FTSE Global All Cap ex US Index thereafter; for U.S. bonds, the Barclays U.S. Aggregate Bond Index through December 31, 2009, and the Barclays U.S. Aggregate Float Adjusted Index thereafter; for international bonds, the Barclays Global Aggregate ex-USD Float Adjusted RIC Capped Index; and for U.S. stocks, the Dow Jones U.S. Total Stock Market Index (formerly known as the Dow Jones Wilshire 5000 Index) through April 22, 2005, the MSCI US Broad Market Index through June 2, 2013, and the CRSP US Total Market Index thereafter. International stock benchmark returns are adjusted for withholding taxes.
Target 2030 Composite Index: Derived by applying the fund’s target asset allocation to the results of the following benchmarks: for international stocks of developed markets, the MSCI EAFE Index through December 15, 2010, the MSCI ACWI ex USA IMI Index through June 2, 2013, and the FTSE Global All Cap ex US Index thereafter; for emerging-market stocks, the Select Emerging Markets Index through August 23, 2006, the MSCI Emerging Markets Index through December 15, 2010, the MSCI ACWI ex USA IMI Index through June 2, 2013, and the FTSE Global All Cap ex US Index thereafter; for U.S. bonds, the Barclays U.S. Aggregate Bond Index through December 31, 2009, and the Barclays U.S. Aggregate Float Adjusted Index thereafter; for international bonds, the Barclays Global Aggregate ex-USD Float Adjusted RIC Capped Index; and for U.S. stocks, the MSCI US Broad Market Index through June 2, 2013, and the CRSP US Total Market Index thereafter. International stock benchmark returns are adjusted for withholding taxes.
Target Income Composite Index: Derived by applying the fund’s target asset allocation to the results of the following benchmarks: for international stocks of developed markets, the MSCI EAFE Index through December 15, 2010, the MSCI ACWI ex USA IMI Index through June 2, 2013, and the FTSE Global All Cap ex US Index thereafter; for emerging-market stocks, the Select Emerging Markets Index through August 23, 2006, the MSCI Emerging Markets Index through December 15, 2010, the MSCI ACWI ex USA IMI Index through June 2, 2013, and the FTSE Global All Cap ex US Index thereafter; for U.S. bonds, the Barclays U.S. Aggregate Bond Index through December 31, 2009, and the Barclays U.S. Aggregate Float Adjusted Index thereafter, as well as the Barclays U.S. Treasury Inflation Protected Securities Index through June 2, 2013, and the Barclays U.S. Treasury Inflation-Protected Securities (TIPS) 0-5 Year Index thereafter; for short-term reserves, the Citigroup Three-Month Treasury Bill Index through June 2, 2013; for international bonds, the Barclays Global Aggregate ex-USD Float Adjusted RIC Capped Index; and for U.S. stocks, the Dow Jones U.S. Total Stock Market Index (formerly known as the Dow Jones Wilshire 5000 Index) through April 22, 2005, the MSCI US Broad Market Index through June 2, 2013, and the CRSP US Total Market Index thereafter. International stock benchmark returns are adjusted for withholding taxes.
76
This page intentionally left blank.
This page intentionally left blank.
This page intentionally left blank.
The People Who Govern Your Fund
The trustees of your mutual fund are there to see that the fund is operated and managed in your best interests since, as a shareholder, you are a part owner of the fund. Your fund’s trustees also serve on the board of directors of The Vanguard Group, Inc., which is owned by the Vanguard funds and provides services to them on an at-cost basis.
A majority of Vanguard’s board members are independent, meaning that they have no affiliation with Vanguard or the funds they oversee, apart from the sizable personal investments they have made as private individuals. The independent board members have distinguished backgrounds in business, academia, and public service. Each of the trustees and executive officers oversees 181 Vanguard funds.
The following table provides information for each trustee and executive officer of the fund. More information about the trustees is in the Statement of Additional Information, which can be obtained, without charge, by contacting Vanguard at 800-662-7447, or online at vanguard.com.
| |
| InterestedTrustee1 | and Delphi Automotive LLP (automotive components); |
| | Senior Advisor at New Mountain Capital; Trustee of |
| F. William McNabb III | The Conference Board. |
| Born 1957. Trustee Since July 2009. Chairman of the | |
| Board. Principal Occupation(s) During the Past Five | Amy Gutmann |
| Years: Chairman of the Board of The Vanguard Group, | Born 1949. Trustee Since June 2006. Principal |
| Inc., and of each of the investment companies served | Occupation(s) During the Past Five Years: President |
| by The Vanguard Group, since January 2010; Director | of the University of Pennsylvania; Christopher H. |
| of The Vanguard Group since 2008; Chief Executive | Browne Distinguished Professor of Political Science |
| Officer and President of The Vanguard Group and of | in the School of Arts and Sciences with secondary |
| each of the investment companies served by The | appointments at the Annenberg School for |
| Vanguard Group since 2008; Director of Vanguard | Communication and the Graduate School of Education |
| Marketing Corporation; Managing Director of The | of the University of Pennsylvania; Member of the |
| Vanguard Group (1995–2008). | National Commission on the Humanities and Social |
| | Sciences; Trustee of Carnegie Corporation of New |
| | York and of the National Constitution Center; Chair |
| IndependentTrustees | of the U. S. Presidential Commission for the Study |
| | of Bioethical Issues. |
| Emerson U. Fullwood | |
| Born 1948. Trustee Since January 2008. Principal | |
| Occupation(s) During the Past Five Years: Executive | JoAnn Heffernan Heisen |
| Chief Staff and Marketing Officer for North America | Born 1950. Trustee Since July 1998. Principal |
| and Corporate Vice President (retired 2008) of Xerox | Occupation(s) During the Past Five Years: Corporate |
| Corporation (document management products and | Vice President and Chief Global Diversity Officer |
| services); Executive in Residence and 2010 | (retired 2008) and Member of the Executive |
| Distinguished Minett Professor at the Rochester | Committee (1997–2008) of Johnson & Johnson |
| Institute of Technology; Director of SPX Corporation | (pharmaceuticals/medical devices/consumer |
| (multi-industry manufacturing), the United Way of | products); Director of Skytop Lodge Corporation |
| Rochester, Amerigroup Corporation (managed health | (hotels), the University Medical Center at Princeton, |
| care), the University of Rochester Medical Center, | the Robert Wood Johnson Foundation, and the Center |
| Monroe Community College Foundation, and North | for Talent Innovation; Member of the Advisory Board |
| Carolina A&T University. | of the Maxwell School of Citizenship and Public Affairs |
| at Syracuse University. |
| Rajiv L. Gupta | |
| Born 1945. Trustee Since December 2001. 2 | F. Joseph Loughrey |
| Principal Occupation(s) During the Past Five Years: | Born 1949. Trustee Since October 2009. Principal |
| Chairman and Chief Executive Officer (retired 2009) | Occupation(s) During the Past Five Years: President |
| and President (2006–2008) of Rohm and Haas Co. | and Chief Operating Officer (retired 2009) of Cummins |
| (chemicals); Director of Tyco International, Ltd. | Inc. (industrial machinery); Chairman of the Board of |
| (diversified manufacturing and services), Hewlett- | Hillenbrand, Inc. (specialized consumer services) and |
| Packard Co. (electronic computer manufacturing), | of Oxfam America; Director of SKF AB (industrial |
| |
| | |
| machinery) and the Lumina Foundation for Education; | Executive Officers | |
| Member of the Advisory Council for the College of | | |
| Arts and Letters and of the Advisory Board to the | Glenn Booraem | |
| Kellogg Institute for International Studies, both at | Born 1967. Controller Since July 2010. Principal |
| the University of Notre Dame. | Occupation(s) During the Past Five Years: Principal |
| | of The Vanguard Group, Inc.; Controller of each of |
| Mark Loughridge | the investment companies served by The Vanguard |
| Born 1953. Trustee Since March 2012. Principal | Group; Assistant Controller of each of the investment |
| Occupation(s) During the Past Five Years: Senior Vice | companies served by The Vanguard Group (2001–2010). |
| President and Chief Financial Officer at IBM (information | | |
| technology services); Fiduciary Member of IBM’s | Thomas J. Higgins | |
| Retirement Plan Committee. | Born 1957. Chief Financial Officer Since September |
| | 2008. Principal Occupation(s) During the Past Five |
| Scott C. Malpass | Years: Principal of The Vanguard Group, Inc.; Chief |
| Born 1962. Trustee Since March 2012. Principal | Financial Officer of each of the investment companies |
| Occupation(s) During the Past Five Years: Chief | served by The Vanguard Group; Treasurer of each of |
| Investment Officer and Vice President at the University | the investment companies served by The Vanguard |
| of Notre Dame; Assistant Professor of Finance at the | Group (1998–2008). | |
| Mendoza College of Business at Notre Dame; Member | | |
| of the Notre Dame 403(b) Investment Committee; | Kathryn J. Hyatt | |
| Director of TIFF Advisory Services, Inc. (investment | Born 1955. Treasurer Since November 2008. Principal |
| advisor); Member of the Investment Advisory | Occupation(s) During the Past Five Years: Principal of |
| Committees of the Financial Industry Regulatory | The Vanguard Group, Inc.; Treasurer of each of the |
| Authority (FINRA) and of Major League Baseball. | investment companies served by The Vanguard |
| | Group; Assistant Treasurer of each of the investment |
| André F. Perold | companies served by The Vanguard Group (1988–2008). |
| Born 1952. Trustee Since December 2004. Principal | | |
| Occupation(s) During the Past Five Years: George | Heidi Stam | |
| Gund Professor of Finance and Banking at the Harvard | Born 1956. Secretary Since July 2005. Principal |
| Business School (retired 2011); Chief Investment | Occupation(s) During the Past Five Years: Managing |
| Officer and Managing Partner of HighVista Strategies | Director of The Vanguard Group, Inc.; General Counsel |
| LLC (private investment firm); Director of Rand | of The Vanguard Group; Secretary of The Vanguard |
| Merchant Bank; Overseer of the Museum of Fine | Group and of each of the investment companies |
| Arts Boston. | served by The Vanguard Group; Director and Senior |
| | Vice President of Vanguard Marketing Corporation. |
| Alfred M. Rankin, Jr. | | |
| Born 1941. Trustee Since January 1993. Principal | Vanguard Senior ManagementTeam | |
| Occupation(s) During the Past Five Years: Chairman, | | |
| President, and Chief Executive Officer of NACCO | Mortimer J. Buckley | Chris D. McIsaac |
| Industries, Inc. (housewares/lignite) and of Hyster-Yale | Kathleen C. Gubanich | Michael S. Miller |
| Materials Handling, Inc. (forklift trucks); Director of | Paul A. Heller | James M. Norris |
| the National Association of Manufacturers; Chairman | Martha G. King | Glenn W. Reed |
| of the Board of University Hospitals of Cleveland; | John T. Marcante | |
| Advisory Chairman of the Board of The Cleveland | | |
| Museum of Art. | | |
| | Chairman Emeritus and Senior Advisor |
| Peter F. Volanakis | | |
| Born 1955. Trustee Since July 2009. Principal | John J. Brennan | |
| Occupation(s) During the Past Five Years: President | Chairman, 1996–2009 | |
| and Chief Operating Officer (retired 2010) of Corning | Chief Executive Officer and President, 1996–2008 | |
| Incorporated (communications equipment); Director | | |
| of SPX Corporation (multi-industry manufacturing); | Founder | |
| Overseer of the Amos Tuck School of Business | | |
| Administration at Dartmouth College; Advisor to the | John C. Bogle | |
| Norris Cotton Cancer Center. | Chairman and Chief Executive Officer, 1974–1996 | |
| | |
| | |
1 Mr. McNabb is considered an “interested person,” as defined in the Investment Company Act of 1940, because he is an officer of the Vanguard funds.
December 2002 for Vanguard Equity Income Fund, Vanguard Growth Equity Fund, the Vanguard Municipal Bond Funds, and the Vanguard State Tax-Exempt Funds.
|  |
| P.O. Box 2600 |
| Valley Forge, PA 19482-2600 |
Connect with Vanguard® > vanguard.com
| |
| Fund Information > 800-662-7447 | |
| Direct Investor Account Services > 800-662-2739 | |
| Institutional Investor Services > 800-523-1036 | |
| Text Telephone for People | |
| With Hearing Impairment > 800-749-7273 | |
| |
| This material may be used in conjunction | |
| with the offering of shares of any Vanguard | |
| fund only if preceded or accompanied by | |
| the fund’s current prospectus. | |
| |
| All comparative mutual fund data are from Lipper, a | |
| Thomson Reuters Company, or Morningstar, Inc., unless | |
| otherwise noted. | |
| |
| You can obtain a free copy of Vanguard’s proxy voting | |
| guidelines by visiting vanguard.com/proxyreporting or by | |
| calling Vanguard at 800-662-2739. The guidelines are | |
| also available from the SEC’s website, sec.gov. In | |
| addition, you may obtain a free report on how your fund | |
| voted the proxies for securities it owned during the 12 | |
| months ended June 30. To get the report, visit either | |
| vanguard.com/proxyreporting or sec.gov. | |
| |
| You can review and copy information about your fund at | |
| the SEC’s Public Reference Room in Washington, D.C. To | |
| find out more about this public service, call the SEC at | |
| 202-551-8090. Information about your fund is also | |
| available on the SEC’s website, and you can receive | |
| copies of this information, for a fee, by sending a | |
| request in either of two ways: via e-mail addressed to | |
| publicinfo@sec.gov or via regular mail addressed to the | |
| Public Reference Section, Securities and Exchange | |
| Commission, Washington, DC 20549-1520. | |
| |
| | © 2013 The Vanguard Group, Inc. |
| | All rights reserved. |
| | Vanguard Marketing Corporation, Distributor. |
| |
| | Q3080 112013 |

Annual Report | September 30, 2013
Vanguard Target Retirement Funds

Vanguard’s Principles for Investing Success
We want to give you the best chance of investment success. These principles, grounded in Vanguard’s research and experience, can put you on the right path.
Goals. Create clear, appropriate investment goals.
Balance. Develop a suitable asset allocation using broadly diversified funds. Cost. Minimize cost.
Discipline. Maintain perspective and long-term discipline.
A single theme unites these principles: Focus on the things you can control.
We believe there is no wiser course for any investor.
| |
| Contents | |
| Your Fund’s Total Returns. | 1 |
| Chairman’s Letter. | 2 |
| Target Retirement 2035 Fund. | 9 |
| Target Retirement 2040 Fund. | 19 |
| Target Retirement 2045 Fund. | 29 |
| Target Retirement 2050 Fund. | 39 |
| Target Retirement 2055 Fund. | 49 |
| Target Retirement 2060 Fund. | 59 |
| Your Fund’s After-Tax Returns. | 72 |
| About Your Fund’s Expenses. | 74 |
| Glossary. | 76 |
Please note: The opinions expressed in this report are just that—informed opinions. They should not be considered promises or advice.
Also, please keep in mind that the information and opinions cover the period through the date on the front of this report. Of course, the risks of investing in your fund are spelled out in the prospectus.
See the Glossary for definitions of investment terms used in this report.
About the cover: The ship's wheel represents leadership and guidance, essential qualities in navigating difficult seas.
This one is a replica based on an 18th-century British vessel. The HMS Vanguard, another ship of that era, served as the flagship for Admiral Horatio Nelson when he defeated a French fleet at the Battle of the Nile.
| |
| Your Fund’s Total Returns | |
| |
| |
| |
| |
| Fiscal Year Ended September 30, 2013 | |
| | Total |
| | Returns |
| Vanguard Target Retirement 2035 Fund | 16.77% |
| Target 2035 Composite Index | 17.00 |
| Mixed-Asset Target 2035 Funds Average | 15.04 |
| Mixed-Asset Target 2035 Funds Average: Derived from data provided by Lipper, a Thomson Reuters Company. | |
| |
| Vanguard Target Retirement 2040 Fund | 17.75% |
| Target 2040 Composite Index | 17.92 |
| Mixed-Asset Target 2040 Funds Average | 14.85 |
| Mixed-Asset Target 2040 Funds Average: Derived from data provided by Lipper, a Thomson Reuters Company. | |
| |
| Vanguard Target Retirement 2045 Fund | 17.70% |
| Target 2045 Composite Index | 17.92 |
| Mixed-Asset Target 2045 Funds Average | 16.53 |
| Mixed-Asset Target 2045 Funds Average: Derived from data provided by Lipper, a Thomson Reuters Company. | |
| |
| Vanguard Target Retirement 2050 Fund | 17.74% |
| Target 2050 Composite Index | 17.92 |
| Mixed-Asset Target 2050 Funds Average | 16.28 |
| Mixed-Asset Target 2050 Funds Average: Derived from data provided by Lipper, a Thomson Reuters Company. | |
| |
| Vanguard Target Retirement 2055 Fund | 17.73% |
| Target 2055 Composite Index | 17.92 |
| Spliced Mixed-Asset Target 2055+ Funds Average | 16.53 |
| Spliced Mixed-Asset Target 2055+ Funds Average: Derived from data provided by Lipper, a Thomson Reuters Company. | |
| |
| Vanguard Target Retirement 2060 Fund | 17.69% |
| Target 2060 Composite Index | 17.92 |
| Spliced Mixed-Asset Target 2055+ Funds Average | 16.53 |
| Spliced Mixed-Asset Target 2055+ Funds Average: Derived from data provided by Lipper, a Thomson Reuters Company. | |
| |
| For a benchmark description, see the Glossary. | |
Investments in Target Retirement Funds are subject to the risks of their underlying funds. The year in the fund name refers to the approximate year (the target date) when an investor in the fund would retire and leave the work force. The fund will gradually shift its emphasis from more aggressive investments to more conservative ones based on its target date. An investment in a Target Retirement Fund is not guaranteed at any time, including on or after the target date.
1

Chairman’s Letter
Dear Shareholder,
Global stock markets advanced during the fiscal year ended September 30, 2013, but bond markets fell as uncertainty grew around the Federal Reserve’s plans to reduce its $85 billion-a-month bond-buying stimulus program.
Despite volatility in the bond markets, the six Vanguard Target Retirement Funds reviewed in this report produced double-digit returns for the fiscal year. (The Target Retirement Income Fund as well as the funds dated 2010 through 2030 are discussed in a separate report.)
As you would expect, the funds with the heavier allocations to stocks performed best. Short-term challenges notwithstanding, we continue to believe that bonds are a good cushion to equity market volatility, and that a higher allocation to bonds can reduce the total risk in your portfolio over the long term.
Stocks dodged obstacles to produce strong gains
Although their path wasn’t always smooth, U.S. stocks powered to a return of about 22% for the 12 months ended September 30. The U.S. economy delivered only modest growth over the fiscal year, but investors’ appetite for risk seemed to increase faster than companies’ profits.
2
In mid-September, U.S. stocks jumped when the Federal Reserve surprised investors by announcing that it had no immediate plans to unwind its stimulative bond-buying program. But in the waning days of that month, stocks slid ahead of the partial federal government shutdown that began October 1.
It’s natural for investors to be concerned by the situation in Washington. But as Sarah Hammer, a senior analyst in Vanguard Investment Strategy Group, noted in the midst of the temporary shutdown, they shouldn’t be unduly influenced by these events. “Investors are often best served by sticking to their long-term investment plans and avoiding short-term decisions based on the legislative outlook,” Ms. Hammer said.
Our recurrent advice to stick to your plan may lack pizzazz, but it’s proven to be sound counsel over the decades.
International stocks generally posted strong results. Emerging-market stocks, however, lagged amid worries about slowing economic growth.
Bond returns were negative despite September’s bounce
Bonds posted declines for the year. However, bonds trimmed their losses in September after the Fed said it would continue its bond-buying program.
The broad U.S. taxable bond market returned –1.68% for the fiscal year, and the yield of the 10-year Treasury note closed at 2.63%, down from 2.76% a
| | | |
| Market Barometer | | | |
| |
| | | Average Annual Total Returns |
| | Periods Ended September 30, 2013 |
| | One | Three | Five |
| | Year | Years | Years |
| Stocks | | | |
| Russell 1000 Index (Large-caps) | 20.91% | 16.64% | 10.53% |
| Russell 2000 Index (Small-caps) | 30.06 | 18.29 | 11.15 |
| Russell 3000 Index (Broad U.S. market) | 21.60 | 16.76 | 10.58 |
| MSCI All Country World Index ex USA (International) | 16.48 | 5.95 | 6.26 |
| |
| Bonds | | | |
| Barclays U.S. Aggregate Bond Index (Broad taxable market) | -1.68% | 2.86% | 5.41% |
| Barclays Municipal Bond Index (Broad tax-exempt market) | -2.21 | 3.24 | 5.98 |
| Citigroup Three-Month U.S. Treasury Bill Index | 0.07 | 0.07 | 0.14 |
| |
| CPI | | | |
| Consumer Price Index | 1.18% | 2.34% | 1.37% |
3
month earlier. (Bond yields and prices move in opposite directions.) Municipal bonds returned –2.21% after rebounding a bit in September.
Money markets and savings accounts barely budged as the Fed’s target for short-term interest rates remained between 0% and 0.25%.
Strength of underlying stock funds tempered the bond funds’ declines
Target Retirement Funds provide investors with professionally managed, diversified portfolios composed of up to five underlying funds. Depending on when an investor expects to retire, these “fund of funds” gradually shift their allocation from stocks to bonds along a predetermined path.
Once the target date is reached, these funds continue to adjust until they enter an income phase, when the portfolio will convert to the Target Retirement Income Fund. The Income Fund, which represents a static allocation of about 70% bonds and 30% stocks, is mostly focused on helping investors generate income and preserve their wealth.
As I mentioned earlier, the performance of the Target Retirement Funds for the most recent fiscal year was largely influenced by the extent of their exposure to stocks. The Target Retirement 2060 Fund, which invested about 90% of its assets in stocks and 10% in bonds as of September 30, produced a 17.69% return. The Target Retirement 2035 Fund, the most
| | |
| Expense Ratios | | |
| Your Fund Compared With Its Peer Group | | |
| | Acquired Fund Fees | Peer Group |
| | and Expenses | Average |
| Target Retirement 2035 Fund | 0.18% | 0.52% |
| Target Retirement 2040 Fund | 0.18 | 0.57 |
| Target Retirement 2045 Fund | 0.18 | 0.51 |
| Target Retirement 2050 Fund | 0.18 | 0.54 |
| Target Retirement 2055 Fund | 0.18 | 0.54 |
| Target Retirement 2060 Fund | 0.18 | 0.54 |
The fund expense figures shown—drawn from the prospectus dated August 12, 2013—represent an estimate of the weighted average of the expense ratios and any transaction fees charged by the underlying mutual funds (the ”acquired” funds) in which the Target Retirement Funds invest. The Target Retirement Funds do not charge any expenses or fees of their own. For the fiscal year ended September 30, 2013, the acquired fund fees and expenses were 0.18% for the 2035 Fund, 0.18% for the 2040 Fund, 0.18% for the 2045 Fund, 0.18% for the 2050 Fund, 0.18% for the 2055 Fund, and 0.18% for the 2060 Fund. Peer-group expense ratios are derived from data provided by Lipper, a Thomson Reuters Company, and capture information through year-end 2012.
Peer groups as of December 31, 2012: For the 2035 Fund, Mixed-Asset Target 2035 Funds; for the 2040 Fund, Mixed-Asset Target 2040 Funds; for the 2045 Fund, Mixed-Asset Target 2045 Funds; for the 2050, 2055, and 2060 Funds, Mixed-Asset Target 2050+ Funds.
4
conservative of this group with about 85% of its assets in stocks and 15% in bonds, returned 16.77% for the same period.
Among the funds’ underlying investments, Vanguard Total Stock Market Index Fund Investor Shares stood out with a 21.36% gain for the fiscal year. U.S. stocks benefited from investor confidence in most sectors, particularly financials, where the recovering housing and labor markets have made investing more attractive.
| |
| Total Returns | |
| Inception Through September 30, 2013 | |
| | Average |
| | Annual Return |
| Target Retirement 2035 Fund (Returns since inception: 10/27/2003) | 7.03% |
| Target 2035 Composite Index | 7.14 |
| Mixed-Asset Target 2035 Funds Average | 6.39 |
| Mixed-Asset Target 2035 Funds Average: Derived from data provided by Lipper, a Thomson Reuters Company. | |
| |
| Target Retirement 2040 Fund (Returns since inception: 6/7/2006) | 6.01% |
| Target 2040 Composite Index | 6.08 |
| Mixed-Asset Target 2040 Funds Average | 4.66 |
| Mixed-Asset Target 2040 Funds Average: Derived from data provided by Lipper, a Thomson Reuters Company. | |
| |
| Target Retirement 2045 Fund (Returns since inception: 10/27/2003) | 7.45% |
| Target 2045 Composite Index | 7.54 |
| Mixed-Asset Target 2045 Funds Average | 6.92 |
| Mixed-Asset Target 2045 Funds Average: Derived from data provided by Lipper, a Thomson Reuters Company. | |
| |
| Target Retirement 2050 Fund (Returns since inception: 6/7/2006) | 6.07% |
| Target 2050 Composite Index | 6.14 |
| Mixed-Asset Target 2050 Funds Average | 4.94 |
| Mixed-Asset Target 2050 Funds Average: Derived from data provided by Lipper, a Thomson Reuters Company. | |
| |
| Target Retirement 2055 Fund (Returns since inception: 8/18/2010) | 13.93% |
| Target 2055 Composite Index | 14.09 |
| Spliced Mixed-Asset Target 2055+ Funds Average | 12.49 |
| Spliced Mixed-Asset Target 2055+ Funds Average: Derived from data provided by Lipper, a Thomson Reuters Company. | |
| For a benchmark description, see the Glossary. | |
The figures shown represent past performance, which is not a guarantee of future results. (Current performance may be lower or higher than the performance data cited. For performance data current to the most recent month-end, visit our website at vanguard.com/performance.) Note, too, that both investment returns and principal value can fluctuate widely, so an investor’s shares, when sold, could be worth more or less than their original cost.
The table does not include funds that have operated for less than three years.
5
Vanguard Total International Stock Index Fund Investor Shares also produced an impressive 17.06% result for the 12 months, buoyed largely by the strength of developed markets in Europe.
Results for the underlying bond funds were a different story. Vanguard Total Bond Market II Index Fund Investor Shares, a component of all six funds covered in this report, returned –1.93% for the fiscal year. Another underlying bond fund included in all the funds, Vanguard Total International Bond Index Fund (launched May 31, 2013), didn’t do much better, though it didn’t have a full year’s results. The Total International Bond Index Fund Investor Shares returned –0.54% between its inception date and September 30.
After a volatile decade, funds are still on target
Two of the funds in this report—the Target Retirement 2035 Fund and Target Retirement 2045 Fund—marked their tenth anniversaries in October. (Four other funds are younger.) Over the years, each of these funds has experienced volatility in both the stock markets and, more recently, the bond markets.
The funds have successfully achieved their goals of providing retirement investors with balanced and diversified portfolios that automatically adjust over time to control risk. Each fund’s average annual return has exceeded that of its respective peer group.
The quality of the underlying index funds has been crucial to the funds’ strong records. Credit goes to Vanguard’s Equity Investment Group and Fixed Income Group, whose skilled portfolio construction and management have enabled the underlying index funds to successfully track their benchmarks while keeping the associated costs very low.
Our Target Retirement Funds have also continued to evolve. Over the past year, the funds in this report further diversified their portfolios by adding the international bond component.
Target Retirement Funds empower investors saving for retirement
I am pleased that Vanguard has been able to offer investors Target Retirement Funds for a decade. As you may be aware, these types of single-fund offerings have had a significant impact on the way millions of Americans save for retirement. They’ve made the process more accessible, transparent, and convenient for investors, many of whom have neither the time nor the inclination to manage a retirement portfolio.
The presence of Vanguard Target Retirement Funds in employer-sponsored and individual retirement plans has expanded dramatically over the past ten years. This has enabled investors to create well-diversified, balanced portfolios for the long term consistent with Vanguard’s core investment principles.
6
Although it’s often tempting to react to blaring headlines as the stock or bond markets fluctuate, we believe it’s important that you stay the course and stick to your long-term goals. The Target Retirement Funds, through their mix of underlying stock and bond funds, help you do this by automatically rebalancing and adjusting based on the funds’ target retirement dates.
While they can’t entirely shield you from volatility, the Target Retirement Funds can help you navigate the market’s challenges as you move closer to your retirement goals.
As always, thank you for investing with Vanguard.
Sincerely,

F. William McNabb III
Chairman and Chief Executive Officer
October 15, 2013
7
| | | | |
| Your Fund’s Performance at a Glance | | | | |
| September 30, 2012, Through September 30, 2013 | | | | |
| | | | Distributions Per Share |
| | Starting | Ending | Income | Capital |
| | Share Price | Share Price | Dividends | Gains |
| Target Retirement 2035 Fund | $14.15 | $16.16 | $0.307 | $0.006 |
| Target Retirement 2040 Fund | $23.26 | $26.80 | $0.496 | $0.007 |
| Target Retirement 2045 Fund | $14.61 | $16.82 | $0.316 | $0.005 |
| Target Retirement 2050 Fund | $23.16 | $26.69 | $0.487 | $0.007 |
| Target Retirement 2055 Fund | $24.81 | $28.67 | $0.447 | $0.013 |
| Target Retirement 2060 Fund | $21.74 | $25.21 | $0.315 | $0.006 |
8
Target Retirement 2035 Fund
Fund Profile
As of September 30, 2013
| |
| Total Fund Characteristics | |
| |
| Ticker Symbol | VTTHX |
| 30-Day SEC Yield | 2.20% |
| Acquired Fund Fees and Expenses1 | 0.18% |
| |
| Allocation to Underlying Vanguard Funds | |
| Vanguard Total Stock Market Index Fund | |
| Investor Shares | 59.1% |
| Vanguard Total International Stock Index | |
| Fund Investor Shares | 25.5 |
| Vanguard Total Bond Market II Index Fund | |
| Investor Shares | 12.3 |
| Vanguard Total International Bond Index | |
| Fund Investor Shares | 3.1 |
| | |
| Total Fund Volatility Measures | |
| | Target 2035 | MSCI US |
| | Composite | Broad Market |
| | Index | Index |
| R-Squared | 1.00 | 0.97 |
| Beta | 1.00 | 0.91 |
These measures show the degree and timing of the fund’s fluctuations compared with the indexes over 36 months.
Fund Asset Allocation
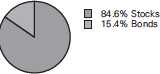
1 This figure—drawn from the prospectus dated August 12, 2013—represents an estimate of the weighted average of the expense ratios and any transaction fees charged by the underlying mutual funds (the ”acquired” funds) in which the Target Retirement 2035 Fund invests. The fund does not charge any expenses or fees of its own. For the fiscal year ended September 30, 2013, the acquired fund fees and expenses were 0.18%.
9
Target Retirement 2035 Fund
Performance Summary
All of the returns in this report represent past performance, which is not a guarantee of future results that may be achieved by the fund. (Current performance may be lower or higher than the performance data cited. For performance data current to the most recent month-end, visit our website at vanguard.com/performance.) Note, too, that both investment returns and principal value can fluctuate widely, so an investor’s shares, when sold, could be worth more or less than their original cost. The returns shown do not reflect taxes that a shareholder would pay on fund distributions or on the sale of fund shares.
Cumulative Performance: October 27, 2003, Through September 30, 2013
Initial Investment of $10,000
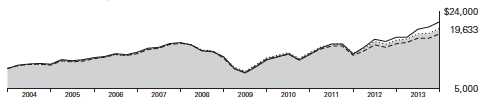
| | | | | |
| | | | Average Annual Total Returns | |
| | | Periods Ended September 30, 2013 | |
| | | | | Since | Final Value |
| | | One | Five | Inception | of a $10,000 |
| | | Year | Years | (10/27/2003) | Investment |
| | Target Retirement 2035 Fund | 16.77% | 8.87% | 7.03% | $19,633 |
| •••••••• | Target 2035 Composite Index | 17.00 | 9.08 | 7.14 | 19,833 |
| – – – – | Mixed-Asset Target 2035 Funds | | | | |
| | | 15.04 | 8.11 | 6.39 | 18,493 |
| | MSCI Average US Broad Market Index | 21.55 | 10.74 | 8.00 | 21,470 |
For a benchmark description, see the Glossary.
Mixed-Asset Target 2035 Funds Average: Derived from data provided by Lipper, a Thomson Reuters Company.
"Since Inception" performance is calculated from the inception date for both the fund and its comparative standards.
See Financial Highlights for dividend and capital gains information.
10
Target Retirement 2035 Fund
Fiscal-Year Total Returns (%): October 27, 2003, Through September 30, 2013
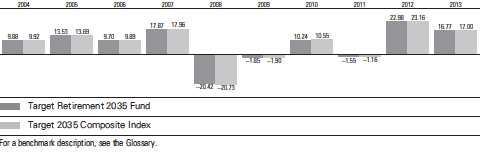
11
Target Retirement 2035 Fund
Financial Statements
Statement of Net Assets
As of September 30, 2013
The fund reports a complete list of its holdings in regulatory filings four times in each fiscal year, at the quarter-ends. For the second and fourth fiscal quarters, the lists appear in the fund’s semiannual and annual reports to shareholders. For the first and third fiscal quarters, the fund files the lists with the Securities and Exchange Commission on Form N-Q. Shareholders can look up the fund’s Forms N-Q on the SEC’s website at sec.gov. Forms N-Q may also be reviewed and copied at the SEC’s Public Reference Room (see the back cover of this report for further information).
| | |
| | | Market |
| | | Value |
| | Shares | ($000) |
| Investment Companies (100.0%) | | |
| U.S. Stock Fund (59.1%) | | |
| Vanguard Total Stock Market Index Fund Investor Shares | 263,633,613 | 11,236,065 |
| International Stock Fund (25.5%) | | |
| Vanguard Total International Stock Index Fund Investor Shares | 301,399,734 | 4,858,564 |
| U.S. Bond Fund (12.3%) | | |
| 1 Vanguard Total Bond Market II Index Fund Investor Shares | 221,567,183 | 2,346,396 |
| International Bond Fund (3.1%) | | |
| Vanguard Total International Bond Index Fund Investor Shares | 58,624,395 | 580,382 |
| Total Investment Companies (Cost $15,114,231) | | 19,021,407 |
| Temporary Cash Investment (0.1%) | | |
| Money Market Fund (0.1%) | | |
| 1 Vanguard Market Liquidity Fund, 0.112% (Cost $14,982) | 14,982,000 | 14,982 |
| Total Investments (100.1%) (Cost $15,129,213) | | 19,036,389 |
| Other Assets and Liabilities (-0.1%) | | |
| Other Assets | | 211,061 |
| Liabilities | | (221,202) |
| | | (10,141) |
| Net Assets (100%) | | |
| Applicable to 1,177,350,111 outstanding $.001 par value shares of | | |
| beneficial interest (unlimited authorization) | | 19,026,248 |
| Net Asset Value Per Share | | $16.16 |
12
| |
| Target Retirement 2035 Fund | |
| |
| |
| |
| At September 30, 2013, net assets consisted of: | |
| | Amount |
| | ($000) |
| Paid-in Capital | 14,874,823 |
| Undistributed Net Investment Income | 270,382 |
| Accumulated Net Realized Losses | (26,133) |
| Unrealized Appreciation (Depreciation) | 3,907,176 |
| Net Assets | 19,026,248 |
See Note A in Notes to Financial Statements.
1 Affiliated fund available only to Vanguard funds and certain trusts and accounts managed by Vanguard. Rate shown for Vanguard Market Liquidity Fund is the 7- day yield.
See accompanying Notes, which are an integral part of the Financial Statements.
13
| |
| Target Retirement 2035 Fund | |
| |
| |
| Statement of Operations | |
| |
| | Year Ended |
| | September 30, 2013 |
| | ($000) |
| Investment Income | |
| Income | |
| Income Distributions Received | 398,402 |
| Net Investment Income—Note B | 398,402 |
| Realized Net Gain (Loss) | |
| Capital Gain Distributions Received | 12,080 |
| Investment Securities Sold | 33,851 |
| Realized Net Gain (Loss) | 45,931 |
| Change in Unrealized Appreciation (Depreciation) of Investment Securities | 2,193,228 |
| Net Increase (Decrease) in Net Assets Resulting from Operations | 2,637,561 |
See accompanying Notes, which are an integral part of the Financial Statements.
14
| | |
| Target Retirement 2035 Fund | | |
| |
| |
| Statement of Changes in Net Assets | | |
| |
| | Year Ended September 30, |
| | 2013 | 2012 |
| | ($000) | ($000) |
| Increase (Decrease) in Net Assets | | |
| Operations | | |
| Net Investment Income | 398,402 | 331,291 |
| Realized Net Gain (Loss) | 45,931 | 31,795 |
| Change in Unrealized Appreciation (Depreciation) | 2,193,228 | 2,077,103 |
| Net Increase (Decrease) in Net Assets Resulting from Operations | 2,637,561 | 2,440,189 |
| Distributions | | |
| Net Investment Income | (326,142) | (249,484) |
| Realized Capital Gain1 | (6,374) | (5,327) |
| Total Distributions | (332,516) | (254,811) |
| Capital Share Transactions | | |
| Issued | 5,012,842 | 3,574,347 |
| Issued in Lieu of Cash Distributions | 329,351 | 252,543 |
| Redeemed | (2,840,996) | (2,031,576) |
| Net Increase (Decrease) from Capital Share Transactions | 2,501,197 | 1,795,314 |
| Total Increase (Decrease) | 4,806,242 | 3,980,692 |
| Net Assets | | |
| Beginning of Period | 14,220,006 | 10,239,314 |
| End of Period2 | 19,026,248 | 14,220,006 |
1 Includes fiscal 2013 and 2012 short-term gain distributions totaling $6,374,000 and $5,327,000, respectively. Short-term gain distributions are treated as ordinary income dividends for tax purposes.
2 Net Assets—End of Period includes undistributed net investment income of $270,382,000 and $198,122,000.
See accompanying Notes, which are an integral part of the Financial Statements.
15
| | | | | |
| Target Retirement 2035 Fund | | | | | |
| |
| |
| Financial Highlights | | | | | |
| |
| |
| For a Share Outstanding | | | Year Ended September 30, |
| Throughout Each Period | 2013 | 2012 | 2011 | 2010 | 2009 |
| Net Asset Value, Beginning of Period | $14.15 | $11.77 | $12.22 | $11.31 | $11.90 |
| Investment Operations | | | | | |
| Net Investment Income | .340 | .344 | .235 | .250 | .2731 |
| Capital Gain Distributions Received | .011 | .016 | .006 | — | — |
| Net Realized and Unrealized Gain (Loss) | | | | | |
| on Investments | 1.972 | 2.307 | (. 402) | . 898 | (. 564) |
| Total from Investment Operations | 2.323 | 2.667 | (.161) | 1.148 | (. 291) |
| Distributions | | | | | |
| Dividends from Net Investment Income | (.307) | (.281) | (. 236) | (. 238) | (.299) |
| Distributions from Realized Capital Gains | (.006) | (.006) | (.053) | — | — |
| Total Distributions | (.313) | (.287) | (.289) | (. 238) | (.299) |
| Net Asset Value, End of Period | $16.16 | $14.15 | $11.77 | $12.22 | $11.31 |
| |
| Total Return2 | 16.77% | 22.98% | -1.55% | 10.24% | -1.85% |
| |
| Ratios/Supplemental Data | | | | | |
| Net Assets, End of Period (Millions) | $19,026 | $14,220 | $10,239 | $9,223 | $6,780 |
| Ratio of Total Expenses to | | | | | |
| Average Net Assets | — | — | — | — | — |
| Acquired Fund Fees and Expenses | 0.18% | 0.18% | 0.19% | 0.19% | 0.21% |
| Ratio of Net Investment Income to | | | | | |
| Average Net Assets | 2.33% | 2.68% | 1.81% | 2.24% | 2.88% |
| Portfolio Turnover Rate | 12% | 6% | 18%3 | 6% | 9% 4 |
1 Calculated based on average shares outstanding.
2 Total returns do not include account service fees that may have applied in the periods shown. Fund prospectuses provide information about any applicable account service fees.
3 Excludes the value of mutual fund shares delivered and received in connection with a change in the fund’s international equity investments from Vanguard European, Pacific, and Emerging Markets Stock Index Funds to Vanguard Total International Stock Index Fund because those transactions were effected in kind and did not cause the fund to incur transaction costs.
4 Excludes the value of mutual fund shares delivered and received in connection with a change in the fund’s bond investments from Vanguard Total Bond Market Index Fund to Vanguard Total Bond Market II Index Fund because those transactions were effected in kind and did not cause the fund to incur transaction costs.
See accompanying Notes, which are an integral part of the Financial Statements.
16
Target Retirement 2035 Fund
Notes to Financial Statements
Vanguard Target Retirement 2035 Fund is registered under the Investment Company Act of 1940 as an open-end investment company, or mutual fund. The fund follows a balanced investment strategy by investing in selected Vanguard funds to achieve its targeted allocation of assets to U.S. stocks, international stocks, U.S. bonds, and international bonds. Financial statements and other information about each underlying fund are available on vanguard.com.
A. The following significant accounting policies conform to generally accepted accounting principles for U.S. mutual funds. The fund consistently follows such policies in preparing its financial statements.
1. Security Valuation: Investments are valued at the net asset value of each underlying Vanguard fund determined as of the close of the New York Stock Exchange (generally 4 p.m., Eastern time) on the valuation date.
2. Federal Income Taxes: The fund intends to continue to qualify as a regulated investment company and distribute all of its taxable income. Management has analyzed the fund’s tax positions taken for all open federal income tax years (September 30, 2010–2013), and has concluded that no provision for federal income tax is required in the fund’s financial statements.
3. Distributions: Distributions to shareholders are recorded on the ex-dividend date.
4. Other: Income and capital gain distributions received are recorded on the ex-dividend date. Security transactions are accounted for on the date securities are bought or sold. Costs used to determine realized gains (losses) on the sale of investment securities are those of the specific securities sold.
B. Under a service agreement, The Vanguard Group furnishes investment advisory, corporate management, administrative, marketing, and distribution services to the fund. The service agreement provides that the fund’s expenses may be reduced or eliminated to the extent of savings realized by the Vanguard funds by the operation of the fund. Accordingly, all incremental expenses for services provided by Vanguard and all other expenses incurred by the fund during the year ended September 30, 2013, were borne by the funds in which the fund invests. The fund’s trustees and officers are also directors and officers of Vanguard and the funds in which the fund invests.
C. Various inputs may be used to determine the value of the fund’s investments. These inputs are summarized in three broad levels for financial statement purposes. The inputs or methodologies used to value securities are not necessarily an indication of the risk associated with investing in those securities.
Level 1—Quoted prices in active markets for identical securities.
Level 2—Other significant observable inputs (including quoted prices for similar securities, interest rates, prepayment speeds, credit risk, etc.).
Level 3—Significant unobservable inputs (including the fund’s own assumptions used to determine the fair value of investments).
At September 30, 2013, 100% of the market value of the fund’s investments was determined based on Level 1 inputs.
D. Distributions are determined on a tax basis and may differ from net investment income and realized capital gains for financial reporting purposes. Differences may be permanent or temporary. Permanent differences are reclassified among capital accounts in the financial statements to reflect their tax character. Temporary differences arise when certain items of income, expense, gain, or loss are recognized in different periods for financial statement and tax purposes; these differences will reverse at some time in the future. Differences in classification may also result from the treatment
17
Target Retirement 2035 Fund
For tax purposes, at September 30, 2013, the fund had $270,855,000 of ordinary income available for distribution. Tax-basis amounts required to be distributed in December 2012 included short-term gain distributions received from Vanguard Total Bond Market II Index Fund in March 2012 and December 2012. Short-term capital gain distributions received are treated as ordinary income for tax purposes, and cannot be offset by capital losses. The fund used capital loss carryforwards of $37,602,000 to offset taxable capital gains realized during the year ended September 30, 2013. At September 30, 2013, the fund had available capital losses totaling $23,213,000 that may be carried forward indefinitely to offset future net capital gains.
At September 30, 2013, the cost of investment securities for tax purposes was $15,132,607,000. Net unrealized appreciation of investment securities for tax purposes was $3,903,782,000, consisting of unrealized gains of $3,923,532,000 on securities that had risen in value since their purchase and $19,750,000 in unrealized losses on securities that had fallen in value since their purchase.
E. During the year ended September 30, 2013, the fund purchased $4,556,377,000 of investment securities and sold $1,962,625,000 of investment securities, other than temporary cash investments.
F. Capital shares issued and redeemed were:
| | |
| | Year Ended September 30, |
| | 2013 | 2012 |
| | Shares | Shares |
| | (000) | (000) |
| Issued | 335,609 | 269,022 |
| Issued in Lieu of Cash Distributions | 23,660 | 20,171 |
| Redeemed | (186,558) | (154,290) |
| Net Increase (Decrease) in Shares Outstanding | 172,711 | 134,903 |
G. Management has determined that no material events or transactions occurred subsequent to September 30, 2013, that would require recognition or disclosure in these financial statements.
18
Target Retirement 2040 Fund
Fund Profile
As of September 30, 2013
| |
| Total Fund Characteristics | |
| |
| Ticker Symbol | VFORX |
| 30-Day SEC Yield | 2.21% |
| Acquired Fund Fees and Expenses1 | 0.18% |
| |
| Allocation to Underlying Vanguard Funds | |
| Vanguard Total Stock Market Index Fund | |
| Investor Shares | 62.9% |
| Vanguard Total International Stock Index | |
| Fund Investor Shares | 27.0 |
| Vanguard Total Bond Market II Index Fund | |
| Investor Shares | 8.1 |
| Vanguard Total International Bond Index | |
| Fund Investor Shares | 2.0 |
| | |
| Total Fund Volatility Measures | |
| | Target 2040 | MSCI US |
| | Composite | Broad Market |
| | Index | Index |
| R-Squared | 1.00 | 0.97 |
| Beta | 1.00 | 0.94 |
These measures show the degree and timing of the fund’s fluctuations compared with the indexes over 36 months.
Fund Asset Allocation
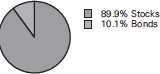
1 This figure—drawn from the prospectus dated August 12, 2013—represents an estimate of the weighted average of the expense ratios and any transaction fees charged by the underlying mutual funds (the ”acquired” funds) in which the Target Retirement 2040 Fund invests. The fund does not charge any expenses or fees of its own. For the fiscal year ended September 30, 2013, the acquired fund fees and expenses were 0.18%.
19
Target Retirement 2040 Fund
Performance Summary
All of the returns in this report represent past performance, which is not a guarantee of future results that may be achieved by the fund. (Current performance may be lower or higher than the performance data cited. For performance data current to the most recent month-end, visit our website at vanguard.com/performance.) Note, too, that both investment returns and principal value can fluctuate widely, so an investor’s shares, when sold, could be worth more or less than their original cost. The returns shown do not reflect taxes that a shareholder would pay on fund distributions or on the sale of fund shares.
Cumulative Performance: June 7, 2006, Through September 30, 2013
Initial Investment of $10,000
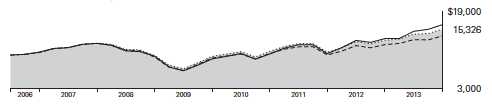
| | | | | |
| | | | Average Annual Total Returns | |
| | | Periods Ended September 30, 2013 | |
| | | | | Since | Final Value |
| | | One | Five | Inception | of a $10,000 |
| | | Year | Years | (6/7/2006) | Investment |
| | Target Retirement 2040 Fund | 17.75% | 9.11% | 6.01% | $15,326 |
| •••••••• | Target 2040 Composite Index | 17.92 | 9.27 | 6.08 | 15,395 |
| – – – – | Mixed-Asset Target 2040 Funds | | | | |
| | | 14.85 | 7.84 | 4.66 | 13,952 |
| | MSCI Average US Broad Market Index | 21.55 | 10.74 | 6.89 | 16,275 |
For a benchmark description, see the Glossary.
Mixed-Asset Target 2040 Funds Average: Derived from data provided by Lipper, a Thomson Reuters Company.
"Since Inception" performance is calculated from the inception date for both the fund and its comparative standards.
See Financial Highlights for dividend and capital gains information.
20
Target Retirement 2040 Fund
Fiscal-Year Total Returns (%): June 7, 2006, Through September 30, 2013
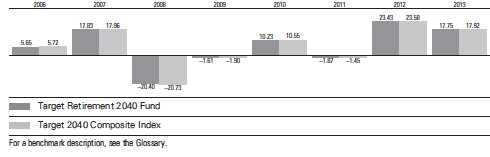
21
Target Retirement 2040 Fund
Financial Statements
Statement of Net Assets
As of September 30, 2013
The fund reports a complete list of its holdings in regulatory filings four times in each fiscal year, at the quarter-ends. For the second and fourth fiscal quarters, the lists appear in the fund’s semiannual and annual reports to shareholders. For the first and third fiscal quarters, the fund files the lists with the Securities and Exchange Commission on Form N-Q. Shareholders can look up the fund’s Forms N-Q on the SEC’s website at sec.gov. Forms N-Q may also be reviewed and copied at the SEC’s Public Reference Room (see the back cover of this report for further information).
| | |
| | | Market |
| | | Value |
| | Shares | ($000) |
| Investment Companies (99.9%) | | |
| U.S. Stock Fund (62.8%) | | |
| Vanguard Total Stock Market Index Fund Investor Shares | 177,223,729 | 7,553,275 |
| |
| International Stock Fund (27.0%) | | |
| Vanguard Total International Stock Index Fund Investor Shares | 201,048,400 | 3,240,900 |
| |
| U.S. Bond Fund (8.1%) | | |
| 1 Vanguard Total Bond Market II Index Fund Investor Shares | 91,829,857 | 972,478 |
| |
| International Bond Fund (2.0%) | | |
| Vanguard Total International Bond Index Fund Investor Shares | 24,263,409 | 240,208 |
| Total Investment Companies (Cost $9,641,155) | | 12,006,861 |
| Temporary Cash Investment (0.1%) | | |
| Money Market Fund (0.1%) | | |
| 1 Vanguard Market Liquidity Fund, 0.112% (Cost $8,263) | 8,263,000 | 8,263 |
| Total Investments (100.0%) (Cost $9,649,418) | | 12,015,124 |
| Other Assets and Liabilities (0.0%) | | |
| Other Assets | | 140,702 |
| Liabilities | | (142,885) |
| | | (2,183) |
| Net Assets (100%) | | |
| Applicable to 448,274,056 outstanding $.001 par value shares of | | |
| beneficial interest (unlimited authorization) | | 12,012,941 |
| Net Asset Value Per Share | | $26.80 |
22
| |
| Target Retirement 2040 Fund | |
| |
| |
| |
| At September 30, 2013, net assets consisted of: | |
| | Amount |
| | ($000) |
| Paid-in Capital | 9,494,761 |
| Undistributed Net Investment Income | 154,704 |
| Accumulated Net Realized Losses | (2,230) |
| Unrealized Appreciation (Depreciation) | 2,365,706 |
| Net Assets | 12,012,941 |
See Note A in Notes to Financial Statements.
1 Affiliated fund available only to Vanguard funds and certain trusts and accounts managed by Vanguard. Rate shown for Vanguard Market Liquidity Fund is the 7-day yield.
See accompanying Notes, which are an integral part of the Financial Statements.
23
| |
| Target Retirement 2040 Fund | |
| |
| |
| Statement of Operations | |
| |
| | Year Ended |
| | September 30, 2013 |
| | ($000) |
| Investment Income | |
| Income | |
| Income Distributions Received | 241,052 |
| Net Investment Income—Note B | 241,052 |
| Realized Net Gain (Loss) | |
| Capital Gain Distributions Received | 4,995 |
| Investment Securities Sold | 888 |
| Realized Net Gain (Loss) | 5,883 |
| Change in Unrealized Appreciation (Depreciation) of Investment Securities | 1,425,108 |
| Net Increase (Decrease) in Net Assets Resulting from Operations | 1,672,043 |
See accompanying Notes, which are an integral part of the Financial Statements.
24
| | |
| Target Retirement 2040 Fund | | |
| |
| |
| Statement of Changes in Net Assets | | |
| |
| | Year Ended September 30, |
| | 2013 | 2012 |
| | ($000) | ($000) |
| Increase (Decrease) in Net Assets | | |
| Operations | | |
| Net Investment Income | 241,052 | 178,202 |
| Realized Net Gain (Loss) | 5,883 | 11,321 |
| Change in Unrealized Appreciation (Depreciation) | 1,425,108 | 1,107,410 |
| Net Increase (Decrease) in Net Assets Resulting from Operations | 1,672,043 | 1,296,933 |
| Distributions | | |
| Net Investment Income | (184,948) | (121,325) |
| Realized Capital Gain1 | (2,610) | (2,459) |
| Total Distributions | (187,558) | (123,784) |
| Capital Share Transactions | | |
| Issued | 4,047,039 | 2,765,586 |
| Issued in Lieu of Cash Distributions | 184,925 | 122,539 |
| Redeemed | (1,685,838) | (1,056,098) |
| Net Increase (Decrease) from Capital Share Transactions | 2,546,126 | 1,832,027 |
| Total Increase (Decrease) | 4,030,611 | 3,005,176 |
| Net Assets | | |
| Beginning of Period | 7,982,330 | 4,977,154 |
| End of Period2 | 12,012,941 | 7,982,330 |
1 Includes fiscal 2013 and 2012 short-term gain distributions totaling $2,610,000 and $2,459,000, respectively. Short-term gain distributions are treated as ordinary income dividends for tax purposes.
2 Net Assets—End of Period includes undistributed net investment income of $154,704,000 and $110,201,000.
See accompanying Notes, which are an integral part of the Financial Statements.
25
| | | | | |
| Target Retirement 2040 Fund | | | | | |
| |
| |
| Financial Highlights | | | | | |
| |
| |
| For a Share Outstanding | | | Year Ended September 30, |
| Throughout Each Period | 2013 | 2012 | 2011 | 2010 | 2009 |
| Net Asset Value, Beginning of Period | $23.26 | $19.26 | $20.03 | $18.52 | $19.36 |
| Investment Operations | | | | | |
| Net Investment Income | . 546 | . 559 | . 369 | . 393 | . 4351 |
| Capital Gain Distributions Received | .012 | .022 | .006 | — | — |
| Net Realized and Unrealized Gain (Loss) | | | | | |
| on Investments | 3.485 | 3.872 | (.705) | 1.485 | (.849) |
| Total from Investment Operations | 4.043 | 4.453 | (.330) | 1.878 | (. 414) |
| Distributions | | | | | |
| Dividends from Net Investment Income | (.496) | (.444) | (.368) | (.368) | (.426) |
| Distributions from Realized Capital Gains | (.007) | (. 009) | (. 072) | — | — |
| Total Distributions | (. 503) | (. 453) | (. 440) | (. 368) | (.426) |
| Net Asset Value, End of Period | $26.80 | $23.26 | $19.26 | $20.03 | $18.52 |
| |
| Total Return2 | 17.75% | 23.43% | -1.87% | 10.23% | -1.61% |
| |
| Ratios/Supplemental Data | | | | | |
| Net Assets, End of Period (Millions) | $12,013 | $7,982 | $4,977 | $3,831 | $2,330 |
| Ratio of Total Expenses to Average Net Assets | — | — | — | — | — |
| Acquired Fund Fees and Expenses | 0.18% | 0.18% | 0.19% | 0.19% | 0.21% |
| Ratio of Net Investment Income to | | | | | |
| Average Net Assets | 2.36% | 2.69% | 1.79% | 2.23% | 2.78% |
| Portfolio Turnover Rate | 9% | 3% | 15%3 | 7% | 9%4 |
1 Calculated based on average shares outstanding.
2 Total returns do not include account service fees that may have applied in the periods shown. Fund prospectuses provide information about any applicable account service fees.
3 Excludes the value of mutual fund shares delivered and received in connection with a change in the fund’s international equity investments from Vanguard European, Pacific, and Emerging Markets Stock Index Funds to Vanguard Total International Stock Index Fund because those transactions were effected in kind and did not cause the fund to incur transaction costs.
4 Excludes the value of mutual fund shares delivered and received in connection with a change in the fund’s bond investments from Vanguard Total Bond Market Index Fund to Vanguard Total Bond Market II Index Fund because those transactions were effected in kind and did not cause the fund to incur transaction costs.
See accompanying Notes, which are an integral part of the Financial Statements.
26
Target Retirement 2040 Fund
Notes to Financial Statements
Vanguard Target Retirement 2040 Fund is registered under the Investment Company Act of 1940 as an open-end investment company, or mutual fund. The fund follows a balanced investment strategy by investing in selected Vanguard funds to achieve its targeted allocation of assets to U.S. stocks, international stocks, U.S. bonds, and international bonds. Financial statements and other information about each underlying fund are available on vanguard.com.
A. The following significant accounting policies conform to generally accepted accounting principles for U.S. mutual funds. The fund consistently follows such policies in preparing its financial statements.
1. Security Valuation: Investments are valued at the net asset value of each underlying Vanguard fund determined as of the close of the New York Stock Exchange (generally 4 p.m., Eastern time) on the valuation date.
2. Federal Income Taxes: The fund intends to continue to qualify as a regulated investment company and distribute all of its taxable income. Management has analyzed the fund’s tax positions taken for all open federal income tax years (September 30, 2010–2013), and has concluded that no provision for federal income tax is required in the fund’s financial statements.
3. Distributions: Distributions to shareholders are recorded on the ex-dividend date.
4. Other: Income and capital gain distributions received are recorded on the ex-dividend date. Security transactions are accounted for on the date securities are bought or sold. Costs used to determine realized gains (losses) on the sale of investment securities are those of the specific securities sold.
B. Under a service agreement, The Vanguard Group furnishes investment advisory, corporate management, administrative, marketing, and distribution services to the fund. The service agreement provides that the fund’s expenses may be reduced or eliminated to the extent of savings realized by the Vanguard funds by the operation of the fund. Accordingly, all incremental expenses for services provided by Vanguard and all other expenses incurred by the fund during the year ended September 30, 2013, were borne by the funds in which the fund invests. The fund’s trustees and officers are also directors and officers of Vanguard and the funds in which the fund invests.
C. Various inputs may be used to determine the value of the fund’s investments. These inputs are summarized in three broad levels for financial statement purposes. The inputs or methodologies used to value securities are not necessarily an indication of the risk associated with investing in those securities.
Level 1—Quoted prices in active markets for identical securities.
Level 2—Other significant observable inputs (including quoted prices for similar securities, interest rates, prepayment speeds, credit risk, etc.).
Level 3—Significant unobservable inputs (including the fund’s own assumptions used to determine the fair value of investments).
At September 30, 2013, 100% of the market value of the fund’s investments was determined based on Level 1 inputs.
D. Distributions are determined on a tax basis and may differ from net investment income and realized capital gains for financial reporting purposes. Differences may be permanent or temporary. Permanent differences are reclassified among capital accounts in the financial statements to reflect their tax character. Temporary differences arise when certain items of income, expense, gain, or loss are recognized in different periods for financial statement and tax purposes; these differences will reverse at some time in the future. Differences in classification may also result from the treatment of short-term gains as ordinary income for tax purposes.
27
Target Retirement 2040 Fund
The fund used a tax accounting practice to treat a portion of the price of capital shares redeemed during the year as distributions from net investment income and realized capital gains. Accordingly, the fund has reclassified $11,601,000 from undistributed net investment income, and $142,000 from accumulated net realized losses, to paid-in capital.
For tax purposes, at September 30, 2013, the fund had $154,919,000 of ordinary income and $2,664,000 of long-term capital gains available for distribution.
At September 30, 2013, the cost of investment securities for tax purposes was $9,654,528,000. Net unrealized appreciation of investment securities for tax purposes was $2,360,596,000, consisting of unrealized gains of $2,372,543,000 on securities that had risen in value since their purchase and $11,947,000 in unrealized losses on securities that had fallen in value since their purchase.
E. During the year ended September 30, 2013, the fund purchased $3,549,151,000 of investment securities and sold $933,929,000 of investment securities, other than temporary cash investments.
F. Capital shares issued and redeemed were:
| | |
| | Year Ended September 30, |
| | 2013 | 2012 |
| | Shares | Shares |
| | (000) | (000) |
| Issued | 164,144 | 127,086 |
| Issued in Lieu of Cash Distributions | 8,082 | 5,969 |
| Redeemed | (67,148) | (48,337) |
| Net Increase (Decrease) in Shares Outstanding | 105,078 | 84,718 |
G. Management has determined that no material events or transactions occurred subsequent to September 30, 2013, that would require recognition or disclosure in these financial statements.
28
Target Retirement 2045 Fund
Fund Profile
As of September 30, 2013
| |
| Total Fund Characteristics | |
| |
| Ticker Symbol | VTIVX |
| 30-Day SEC Yield | 2.21% |
| Acquired Fund Fees and Expenses1 | 0.18% |
| |
| Allocation to Underlying Vanguard Funds | |
| Vanguard Total Stock Market Index Fund | |
| Investor Shares | 63.0% |
| Vanguard Total International Stock Index | |
| Fund Investor Shares | 27.0 |
| Vanguard Total Bond Market II Index Fund | |
| Investor Shares | 8.0 |
| Vanguard Total International Bond Index | |
| Fund Investor Shares | 2.0 |
| | |
| Total Fund Volatility Measures | |
| | Target 2045 | MSCI US |
| | Composite | Broad Market |
| | Index | Index |
| R-Squared | 1.00 | 0.97 |
| Beta | 1.00 | 0.94 |
These measures show the degree and timing of the fund’s fluctuations compared with the indexes over 36 months.
Fund Asset Allocation
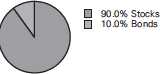
1 This figure—drawn from the prospectus dated August 12, 2013—represents an estimate of the weighted average of the expense ratios and any transaction fees charged by the underlying mutual funds (the ”acquired” funds) in which the Target Retirement 2045 Fund invests. The fund does not charge any expenses or fees of its own. For the fiscal year ended September 30, 2013, the acquired fund fees and expenses were 0.18%.
29
Target Retirement 2045 Fund
Performance Summary
All of the returns in this report represent past performance, which is not a guarantee of future results that may be achieved by the fund. (Current performance may be lower or higher than the performance data cited. For performance data current to the most recent month-end, visit our website at vanguard.com/performance.) Note, too, that both investment returns and principal value can fluctuate widely, so an investor’s shares, when sold, could be worth more or less than their original cost. The returns shown do not reflect taxes that a shareholder would pay on fund distributions or on the sale of fund shares.
Cumulative Performance: October 27, 2003, Through September 30, 2013
Initial Investment of $10,000
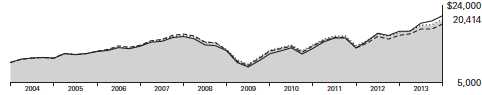
| | | | | |
| | | | Average Annual Total Returns | |
| | | Periods Ended September 30, 2013 | |
| | | | | Since | Final Value |
| | | One | Five | Inception | of a $10,000 |
| | | Year | Years | (10/27/2003) | Investment |
| | Target Retirement 2045 Fund | 17.70% | 9.09% | 7.45% | $20,414 |
| •••••••• | Target 2045 Composite Index | 17.92 | 9.27 | 7.54 | 20,580 |
| – – – – | Mixed-Asset Target 2045 Funds | | | | |
| | | 16.53 | 8.36 | 6.92 | 19,427 |
| | MSCI Average US Broad Market Index | 21.55 | 10.74 | 8.00 | 21,470 |
For a benchmark description, see the Glossary.
Mixed-Asset Target 2045 Funds Average: Derived from data provided by Lipper, a Thomson Reuters Company.
"Since Inception" performance is calculated from the inception date for both the fund and its comparative standards.
See Financial Highlights for dividend and capital gains information.
30
Target Retirement 2045 Fund
Fiscal-Year Total Returns (%): October 27, 2003, Through September 30, 2013
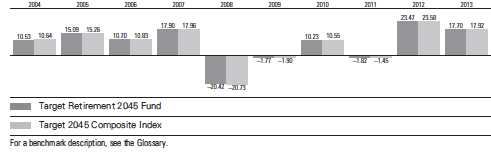
31
Target Retirement 2045 Fund
Financial Statements
Statement of Net Assets
As of September 30, 2013
The fund reports a complete list of its holdings in regulatory filings four times in each fiscal year, at the quarter-ends. For the second and fourth fiscal quarters, the lists appear in the fund’s semiannual and annual reports to shareholders. For the first and third fiscal quarters, the fund files the lists with the Securities and Exchange Commission on Form N-Q. Shareholders can look up the fund’s Forms N-Q on the SEC’s website at sec.gov. Forms N-Q may also be reviewed and copied at the SEC’s Public Reference Room (see the back cover of this report for further information).
| | |
| | | Market |
| | | Value |
| | Shares | ($000) |
| Investment Companies (99.9%) | | |
| U.S. Stock Fund (62.9%) | | |
| Vanguard Total Stock Market Index Fund Investor Shares | 168,827,153 | 7,195,413 |
| |
| International Stock Fund (27.0%) | | |
| Vanguard Total International Stock Index Fund Investor Shares | 191,379,673 | 3,085,040 |
| |
| U.S. Bond Fund (8.0%) | | |
| 1 Vanguard Total Bond Market II Index Fund Investor Shares | 86,389,091 | 914,861 |
| |
| International Bond Fund (2.0%) | | |
| Vanguard Total International Bond Index Fund Investor Shares | 23,537,470 | 233,021 |
| Total Investment Companies (Cost $9,066,859) | | 11,428,335 |
| Temporary Cash Investment (0.1%) | | |
| Money Market Fund (0.1%) | | |
| 1 Vanguard Market Liquidity Fund, 0.112% (Cost $10,111) | 10,110,826 | 10,111 |
| Total Investments (100.0%) (Cost $9,076,970) | | 11,438,446 |
| Other Assets and Liabilities (0.0%) | | |
| Other Assets | | 102,422 |
| Liabilities | | (99,747) |
| | | 2,675 |
| Net Assets (100%) | | |
| Applicable to 680,070,472 outstanding $.001 par value shares of | | |
| beneficial interest (unlimited authorization) | | 11,441,121 |
| Net Asset Value Per Share | | $16.82 |
32
| |
| Target Retirement 2045 Fund | |
| |
| |
| |
| At September 30, 2013, net assets consisted of: | |
| | Amount |
| | ($000) |
| Paid-in Capital | 8,944,325 |
| Undistributed Net Investment Income | 159,898 |
| Accumulated Net Realized Losses | (24,578) |
| Unrealized Appreciation (Depreciation) | 2,361,476 |
| Net Assets | 11,441,121 |
See Note A in Notes to Financial Statements.
1 Affiliated fund available only to Vanguard funds and certain trusts and accounts managed by Vaguard. Rate shown for Vanguard Market Liquidity Fund is the 7 day yield.
See accompanying Notes, which are an integral part of the Financial Statements.
33
| |
| Target Retirement 2045 Fund | |
| |
| |
| Statement of Operations | |
| |
| | Year Ended |
| | September 30, 2013 |
| | ($000) |
| Investment Income | |
| Income | |
| Income Distributions Received | 234,541 |
| Net Investment Income—Note B | 234,541 |
| Realized Net Gain (Loss) | |
| Capital Gain Distributions Received | 4,984 |
| Investment Securities Sold | 4,493 |
| Realized Net Gain (Loss) | 9,477 |
| Change in Unrealized Appreciation (Depreciation) of Investment Securities | 1,382,551 |
| Net Increase (Decrease) in Net Assets Resulting from Operations | 1,626,569 |
See accompanying Notes, which are an integral part of the Financial Statements.
34
| | |
| Target Retirement 2045 Fund | | |
| |
| |
| Statement of Changes in Net Assets | | |
| |
| | Year Ended September 30, |
| | 2013 | 2012 |
| | ($000) | ($000) |
| Increase (Decrease) in Net Assets | | |
| Operations | | |
| Net Investment Income | 234,541 | 188,310 |
| Realized Net Gain (Loss) | 9,477 | 24,245 |
| Change in Unrealized Appreciation (Depreciation) | 1,382,551 | 1,185,281 |
| Net Increase (Decrease) in Net Assets Resulting from Operations | 1,626,569 | 1,397,836 |
| Distributions | | |
| Net Investment Income | (186,901) | (138,613) |
| Realized Capital Gain1 | (2,957) | (2,423) |
| Total Distributions | (189,858) | (141,036) |
| Capital Share Transactions | | |
| Issued | 3,187,991 | 2,414,872 |
| Issued in Lieu of Cash Distributions | 188,279 | 140,029 |
| Redeemed | (1,534,886) | (1,350,612) |
| Net Increase (Decrease) from Capital Share Transactions | 1,841,384 | 1,204,289 |
| Total Increase (Decrease) | 3,278,095 | 2,461,089 |
| Net Assets | | |
| Beginning of Period | 8,163,026 | 5,701,937 |
| End of Period2 | 11,441,121 | 8,163,026 |
1 Includes fiscal 2013 and 2012 short-term gain distributions totaling $2,957,000 and $2,423,000, respectively. Short-term gain distributions are treated as ordinary income dividends for tax purposes.
2 Net Assets—End of Period includes undistributed net investment income of $159,898,000 and $112,258,000.
See accompanying Notes, which are an integral part of the Financial Statements.
35
| | | | | |
| Target Retirement 2045 Fund | | | | | |
| |
| |
| Financial Highlights | | | | | |
| |
| |
| For a Share Outstanding | | | Year Ended September 30, |
| Throughout Each Period | 2013 | 2012 | 2011 | 2010 | 2009 |
| Net Asset Value, Beginning of Period | $14.61 | $12.10 | $12.64 | $11.70 | $12.29 |
| Investment Operations | | | | | |
| Net Investment Income | .350 | .354 | .237 | .257 | .2811 |
| Capital Gain Distributions Received | .008 | .014 | .005 | — | — |
| Net Realized and Unrealized Gain (Loss) | | | | | |
| on Investments | 2.173 | 2.433 | (.436) | .929 | (.570) |
| Total from Investment Operations | 2.531 | 2.801 | (.194) | 1.186 | (.289) |
| Distributions | | | | | |
| Dividends from Net Investment Income | (.316) | (.286) | (. 242) | (. 246) | (. 301) |
| Distributions from Realized Capital Gains | (.005) | (.005) | (.104) | — | — |
| Total Distributions | (. 321) | (. 291) | (. 346) | (. 246) | (. 301) |
| Net Asset Value, End of Period | $16.82 | $14.61 | $12.10 | $12.64 | $11.70 |
| |
| Total Return2 | 17.70% | 23.47% | -1.82% | 10.23% | -1.77% |
| |
| Ratios/Supplemental Data | | | | | |
| Net Assets, End of Period (Millions) | $11,441 | $8,163 | $5,702 | $4,918 | $3,560 |
| Ratio of Total Expenses to Average Net Assets | — | — | — | — | — |
| Acquired Fund Fees and Expenses | 0.18% | 0.18% | 0.19% | 0.19% | 0.21% |
| Ratio of Net Investment Income to | | | | | |
| Average Net Assets | 2.36% | 2.70% | 1.79% | 2.24% | 2.86% |
| Portfolio Turnover Rate | 10% | 7% | 16%3 | 6% | 10% 4 |
1 Calculated based on average shares outstanding.
2 Total returns do not include account service fees that may have applied in the periods shown. Fund prospectuses provide information about any applicable account service fees.
3 Excludes the value of mutual fund shares delivered and received in connection with a change in the fund’s international equity investments from Vanguard European, Pacific, and Emerging Markets Stock Index Funds to Vanguard Total International Stock Index Fund because those transactions were effected in kind and did not cause the fund to incur transaction costs.
4 Excludes the value of mutual fund shares delivered and received in connection with a change in the fund’s bond investments from Vanguard Total Bond Market Index Fund to Vanguard Total Bond Market II Index Fund because those transactions were effected in kind and did not cause the fund to incur transaction costs. See accompanying Notes, which are an integral part of the Financial Statements.
36
Target Retirement 2045 Fund
Notes to Financial Statements
Vanguard Target Retirement 2045 Fund is registered under the Investment Company Act of 1940 as an open-end investment company, or mutual fund. The fund follows a balanced investment strategy by investing in selected Vanguard funds to achieve its targeted allocation of assets to U.S. stocks, international stocks, U.S. bonds, and international bonds. Financial statements and other information about each underlying fund are available on vanguard.com.
A. The following significant accounting policies conform to generally accepted accounting principles for U.S. mutual funds. The fund consistently follows such policies in preparing its financial statements.
1. Security Valuation: Investments are valued at the net asset value of each underlying Vanguard fund determined as of the close of the New York Stock Exchange (generally 4 p.m., Eastern time) on the valuation date.
2. Federal Income Taxes: The fund intends to continue to qualify as a regulated investment company and distribute all of its taxable income. Management has analyzed the fund’s tax positions taken for all open federal income tax years (September 30, 2010–2013), and has concluded that no provision for federal income tax is required in the fund’s financial statements.
3. Distributions: Distributions to shareholders are recorded on the ex-dividend date.
4. Other: Income and capital gain distributions received are recorded on the ex-dividend date. Security transactions are accounted for on the date securities are bought or sold. Costs used to determine realized gains (losses) on the sale of investment securities are those of the specific securities sold.
B. Under a service agreement, The Vanguard Group furnishes investment advisory, corporate management, administrative, marketing, and distribution services to the fund. The service agreement provides that the fund’s expenses may be reduced or eliminated to the extent of savings realized by the Vanguard funds by the operation of the fund. Accordingly, all incremental expenses for services provided by Vanguard and all other expenses incurred by the fund during the year ended September 30, 2013, were borne by the funds in which the fund invests. The fund’s trustees and officers are also directors and officers of Vanguard and the funds in which the fund invests.
C. Various inputs may be used to determine the value of the fund’s investments. These inputs are summarized in three broad levels for financial statement purposes. The inputs or methodologies used to value securities are not necessarily an indication of the risk associated with investing in those securities.
Level 1—Quoted prices in active markets for identical securities.
Level 2—Other significant observable inputs (including quoted prices for similar securities, interest rates, prepayment speeds, credit risk, etc.).
Level 3—Significant unobservable inputs (including the fund’s own assumptions used to determine the fair value of investments).
At September 30, 2013, 100% of the market value of the fund’s investments was determined based on Level 1 inputs.
D. Distributions are determined on a tax basis and may differ from net investment income and realized capital gains for financial reporting purposes. Differences may be permanent or temporary. Permanent differences are reclassified among capital accounts in the financial statements to reflect their tax character. Temporary differences arise when certain items of income, expense, gain, or loss are recognized in different periods for financial statement and tax purposes; these differences will reverse at some time in the future. Differences in classification may also result from the treatment of short-term gains as ordinary income for tax purposes.
37
Target Retirement 2045 Fund
For tax purposes, at September 30, 2013, the fund had $159,789,000 of ordinary income available for distribution. Tax-basis amounts required to be distributed in December 2012 included short-term gain distributions received from Vanguard Total Bond Market II Index Fund in March 2012 and December 2012. Short-term capital gain distributions received are treated as ordinary income for tax purposes, and cannot be offset by capital losses. The fund used capital loss carryforwards of $8,064,000 to offset taxable capital gains realized during the year ended September 30, 2013. At September 30, 2013, the fund had available capital losses totaling $22,317,000 that may be carried forward indefinitely to offset future net capital gains.
At September 30, 2013, the cost of investment securities for tax purposes was $9,079,122,000. Net unrealized appreciation of investment securities for tax purposes was $2,359,324,000, consisting of unrealized gains of $2,368,098,000 on securities that had risen in value since their purchase and $8,774,000 in unrealized losses on securities that had fallen in value since their purchase.
E. During the year ended September 30, 2013, the fund purchased $2,863,188,000 of investment securities and sold $969,011,000 of investment securities, other than temporary cash investments.
F. Capital shares issued and redeemed were:
| | |
| | Year Ended September 30, |
| | 2013 | 2012 |
| | Shares | Shares |
| | (000) | (000) |
| Issued | 205,525 | 176,519 |
| Issued in Lieu of Cash Distributions | 13,102 | 10,863 |
| Redeemed | (97,476) | (99,852) |
| Net Increase (Decrease) in Shares Outstanding | 121,151 | 87,530 |
G. Management has determined that no material events or transactions occurred subsequent to September 30, 2013, that would require recognition or disclosure in these financial statements.
38
Target Retirement 2050 Fund
Fund Profile
As of September 30, 2013
| |
| Total Fund Characteristics | |
| |
| Ticker Symbol | VFIFX |
| 30-Day SEC Yield | 2.21% |
| Acquired Fund Fees and Expenses1 | 0.18% |
| |
| Allocation to Underlying Vanguard Funds | |
| Vanguard Total Stock Market Index Fund | |
| Investor Shares | 63.0% |
| Vanguard Total International Stock Index | |
| Fund Investor Shares | 27.0 |
| Vanguard Total Bond Market II Index Fund | |
| Investor Shares | 8.0 |
| Vanguard Total International Bond Index | |
| Fund Investor Shares | 2.0 |
| | |
| Total Fund Volatility Measures | |
| | Target 2050 | MSCI US |
| | Composite | Broad Market |
| | Index | Index |
| R-Squared | 1.00 | 0.97 |
| Beta | 1.00 | 0.94 |
These measures show the degree and timing of the fund’s fluctuations compared with the indexes over 36 months.
Fund Asset Allocation

1 This figure—drawn from the prospectus dated August 12, 2013—represents an estimate of the weighted average of the expense ratios and any transaction fees charged by the underlying mutual funds (the ”acquired” funds) in which the Target Retirement 2050 Fund invests. The fund does not charge any expenses or fees of its own. For the fiscal year ended September 30, 2013, the acquired fund fees and expenses were 0.18%.
39
Target Retirement 2050 Fund
Performance Summary
All of the returns in this report represent past performance, which is not a guarantee of future results that may be achieved by the fund. (Current performance may be lower or higher than the performance data cited. For performance data current to the most recent month-end, visit our website at vanguard.com/performance.) Note, too, that both investment returns and principal value can fluctuate widely, so an investor’s shares, when sold, could be worth more or less than their original cost. The returns shown do not reflect taxes that a shareholder would pay on fund distributions or on the sale of fund shares.
Cumulative Performance: June 7, 2006, Through September 30, 2013
Initial Investment of $10,000
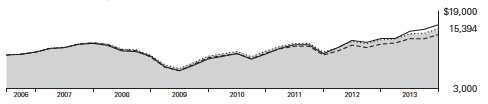
| | | | | |
| | | | Average Annual Total Returns | |
| | | Periods Ended September 30, 2013 | |
| | | | | Since | Final Value |
| | | One | Five | Inception | of a $10,000 |
| | | Year | Years | (6/7/2006) | Investment |
| | Target Retirement 2050 Fund | 17.74% | 9.10% | 6.07% | $15,394 |
| •••••••• | Target 2050 Composite Index | 17.92 | 9.27 | 6.14 | 15,463 |
| – – – – | Mixed-Asset Target 2050 Funds | | | | |
| | | 16.28 | 8.24 | 4.94 | 14,227 |
| | MSCI Average US Broad Market Index | 21.55 | 10.74 | 6.89 | 16,275 |
For a benchmark description, see the Glossary.
Mixed-Asset Target 2050 Funds Average: Derived from data provided by Lipper, a Thomson Reuters Company.
"Since Inception" performance is calculated from the inception date for both the fund and its comparative standards.
See Financial Highlights for dividend and capital gains information.
40
Target Retirement 2050 Fund
Fiscal-Year Total Returns (%): June 7, 2006, Through September 30, 2013
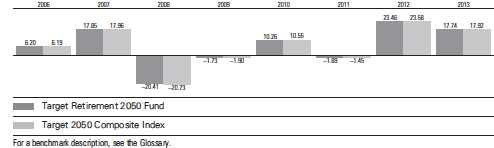
41
Target Retirement 2050 Fund
Financial Statements
Statement of Net Assets
As of September 30, 2013
The fund reports a complete list of its holdings in regulatory filings four times in each fiscal year, at the quarter-ends. For the second and fourth fiscal quarters, the lists appear in the fund’s semiannual and annual reports to shareholders. For the first and third fiscal quarters, the fund files the lists with the Securities and Exchange Commission on Form N-Q. Shareholders can look up the fund’s Forms N-Q on the SEC’s website at sec.gov. Forms N-Q may also be reviewed and copied at the SEC’s Public Reference Room (see the back cover of this report for further information).
| | |
| | | Market |
| | | Value |
| | Shares | ($000) |
| Investment Companies (99.9%) | | |
| U.S. Stock Fund (62.9%) | | |
| Vanguard Total Stock Market Index Fund Investor Shares | 79,006,766 | 3,367,269 |
| |
| International Stock Fund (27.0%) | | |
| Vanguard Total International Stock Index Fund Investor Shares | 89,544,356 | 1,443,455 |
| |
| U.S. Bond Fund (8.0%) | | |
| 1 Vanguard Total Bond Market II Index Fund Investor Shares | 40,520,313 | 429,110 |
| |
| International Bond Fund (2.0%) | | |
| Vanguard Total International Bond Index Fund Investor Shares | 10,970,845 | 108,611 |
| Total Investment Companies (Cost $4,316,749) | | 5,348,445 |
| Temporary Cash Investment (0.1%) | | |
| Money Market Fund (0.1%) | | |
| 1 Vanguard Market Liquidity Fund, 0.112% (Cost $6,630) | 6,630,020 | 6,630 |
| Total Investments (100.0%) (Cost $4,323,379) | | 5,355,075 |
| Other Assets and Liabilities (0.0%) | | |
| Other Assets | | 48,530 |
| Liabilities | | (48,495) |
| | | 35 |
| Net Assets (100%) | | |
| Applicable to 200,644,832 outstanding $.001 par value shares of | | |
| beneficial interest (unlimited authorization) | | 5,355,110 |
| Net Asset Value Per Share | | $26.69 |
42
| |
| Target Retirement 2050 Fund | |
| |
| |
| |
| At September 30, 2013, net assets consisted of: | |
| | Amount |
| | ($000) |
| Paid-in Capital | 4,257,510 |
| Undistributed Net Investment Income | 73,297 |
| Accumulated Net Realized Losses | (7,393) |
| Unrealized Appreciation (Depreciation) | 1,031,696 |
| Net Assets | 5,355,110 |
See Note A in Notes to Financial Statements.
1 Affiliated fund available only to Vanguard and certain trusts and accounts managed by Vanguard. Rate shown for Vanguard Market Liquidity Fund is the 7 day yield.
See accompanying Notes, which are an intergal part of the Financial Statements.
43
| |
| Target Retirement 2050 Fund | |
| |
| |
| Statement of Operations | |
| |
| | Year Ended |
| | September 30, 2013 |
| | ($000) |
| Investment Income | |
| Income | |
| Income Distributions Received | 105,695 |
| Net Investment Income—Note B | 105,695 |
| Realized Net Gain (Loss) | |
| Capital Gain Distributions Received | 2,178 |
| Investment Securities Sold | (2,561) |
| Realized Net Gain (Loss) | (383) |
| Change in Unrealized Appreciation (Depreciation) of Investment Securities | 625,961 |
| Net Increase (Decrease) in Net Assets Resulting from Operations | 731,273 |
See accompanying Notes, which are an integral part of the Financial Statements.
44
| | |
| Target Retirement 2050 Fund | | |
| |
| |
| Statement of Changes in Net Assets | | |
| |
| | Year Ended September 30, |
| | 2013 | 2012 |
| | ($000) | ($000) |
| Increase (Decrease) in Net Assets | | |
| Operations | | |
| Net Investment Income | 105,695 | 75,474 |
| Realized Net Gain (Loss) | (383) | 3,866 |
| Change in Unrealized Appreciation (Depreciation) | 625,961 | 465,291 |
| Net Increase (Decrease) in Net Assets Resulting from Operations | 731,273 | 544,631 |
| Distributions | | |
| Net Investment Income | (79,191) | (50,671) |
| Realized Capital Gain1 | (1,138) | (923) |
| Total Distributions | (80,329) | (51,594) |
| Capital Share Transactions | | |
| Issued | 1,926,591 | 1,387,997 |
| Issued in Lieu of Cash Distributions | 79,320 | 51,071 |
| Redeemed | (769,063) | (538,920) |
| Net Increase (Decrease) from Capital Share Transactions | 1,236,848 | 900,148 |
| Total Increase (Decrease) | 1,887,792 | 1,393,185 |
| Net Assets | | |
| Beginning of Period | 3,467,318 | 2,074,133 |
| End of Period2 | 5,355,110 | 3,467,318 |
1 Includes fiscal 2013 and 2012 short-term gain distributions totaling $1,138,000 and $923,000, respectively. Short-term gain distributions are treated as ordinary income dividends for tax purposes.
2 Net Assets—End of Period includes undistributed net investment income of $73,297,000 and $46,793,000.
See accompanying Notes, which are an integral part of the Financial Statements.
45
| | | | | |
| Target Retirement 2050 Fund | | | | | |
| |
| |
| Financial Highlights | | | | | |
| |
| |
| For a Share Outstanding | | | Year Ended September 30, |
| Throughout Each Period | 2013 | 2012 | 2011 | 2010 | 2009 |
| Net Asset Value, Beginning of Period | $23.16 | $19.17 | $20.10 | $18.58 | $19.43 |
| Investment Operations | | | | | |
| Net Investment Income | . 539 | . 549 | . 360 | . 399 | . 4311 |
| Capital Gain Distributions Received | .012 | .022 | .006 | — | — |
| Net Realized and Unrealized Gain (Loss) | | | | | |
| on Investments | 3.473 | 3.866 | (.682) | 1.492 | (. 866) |
| Total from Investment Operations | 4.024 | 4.437 | (.316) | 1.891 | (. 435) |
| Distributions | | | | | |
| Dividends from Net Investment Income | (.487) | (. 439) | (. 370) | (. 371) | (.415) |
| Distributions from Realized Capital Gains | (.007) | (.008) | (.244) | — | — |
| Total Distributions | (.494) | (.447) | (. 614) | (. 371) | (.415) |
| Net Asset Value, End of Period | $26.69 | $23.16 | $19.17 | $20.10 | $18.58 |
| |
| Total Return2 | 17.74% | 23.46% | -1.89% | 10.26% | -1.73% |
| |
| Ratios/Supplemental Data | | | | | |
| Net Assets, End of Period (Millions) | $5,355 | $3,467 | $2,074 | $1,517 | $924 |
| Ratio of Total Expenses to Average Net Assets | — | — | — | — | — |
| Acquired Fund Fees and Expenses | 0.18% | 0.18% | 0.19% | 0.19% | 0.21% |
| Ratio of Net Investment Income to | | | | | |
| Average Net Assets | 2.36% | 2.70% | 1.79% | 2.21% | 2.74% |
| Portfolio Turnover Rate | 9% | 4% | 15%3 | 10% | 8%4 |
1 Calculated based on average shares outstanding.
2 Total returns do not include account service fees that may have applied in the periods shown. Fund prospectuses provide information about any applicable account service fees.
3 Excludes the value of mutual fund shares delivered and received in connection with a change in the fund’s international equity investments from Vanguard European, Pacific, and Emerging Markets Stock Index Funds to Vanguard Total International Stock Index Fund because those transactions were effected in kind and did not cause the fund to incur transaction costs.
4 Excludes the value of mutual fund shares delivered and received in connection with a change in the fund’s bond investments from Vanguard Total Bond Market Index Fund to Vanguard Total Bond Market II Index Fund because those transactions were effected in kind and did not cause the fund to incur transaction costs.
See accompanying Notes, which are an integral part of the Financial Statements.
46
Target Retirement 2050 Fund
Notes to Financial Statements
Vanguard Target Retirement 2050 Fund is registered under the Investment Company Act of 1940 as an open-end investment company, or mutual fund. The fund follows a balanced investment strategy by investing in selected Vanguard funds to achieve its targeted allocation of assets to U.S. stocks, international stocks, U.S. bonds, and international bonds. Financial statements and other information about each underlying fund are available on vanguard.com.
A. The following significant accounting policies conform to generally accepted accounting principles for U.S. mutual funds. The fund consistently follows such policies in preparing its financial statements.
1. Security Valuation: Investments are valued at the net asset value of each underlying Vanguard fund determined as of the close of the New York Stock Exchange (generally 4 p.m., Eastern time) on the valuation date.
2. Federal Income Taxes: The fund intends to continue to qualify as a regulated investment company and distribute all of its taxable income. Management has analyzed the fund’s tax positions taken for all open federal income tax years (September 30, 2010–2013), and has concluded that no provision for federal income tax is required in the fund’s financial statements.
3. Distributions: Distributions to shareholders are recorded on the ex-dividend date.
4. Other: Income and capital gain distributions received are recorded on the ex-dividend date. Security transactions are accounted for on the date securities are bought or sold. Costs used to determine realized gains (losses) on the sale of investment securities are those of the specific securities sold.
B. Under a service agreement, The Vanguard Group furnishes investment advisory, corporate management, administrative, marketing, and distribution services to the fund. The service agreement provides that the fund’s expenses may be reduced or eliminated to the extent of savings realized by the Vanguard funds by the operation of the fund. Accordingly, all incremental expenses for services provided by Vanguard and all other expenses incurred by the fund during the year ended September 30, 2013, were borne by the funds in which the fund invests. The fund’s trustees and officers are also directors and officers of Vanguard and the funds in which the fund invests.
C. Various inputs may be used to determine the value of the fund’s investments. These inputs are summarized in three broad levels for financial statement purposes. The inputs or methodologies used to value securities are not necessarily an indication of the risk associated with investing in those securities.
Level 1—Quoted prices in active markets for identical securities.
Level 2—Other significant observable inputs (including quoted prices for similar securities, interest rates, prepayment speeds, credit risk, etc.).
Level 3—Significant unobservable inputs (including the fund’s own assumptions used to determine the fair value of investments).
At September 30, 2013, 100% of the market value of the fund’s investments was determined based on Level 1 inputs.
D. Distributions are determined on a tax basis and may differ from net investment income and realized capital gains for financial reporting purposes. Differences may be permanent or temporary. Permanent differences are reclassified among capital accounts in the financial statements to reflect their tax character. Temporary differences arise when certain items of income, expense, gain, or loss are recognized in different periods for financial statement and tax purposes; these differences will reverse at some time in the future. Differences in classification may also result from the treatment of short-term gains as ordinary income for tax purposes.
47
Target Retirement 2050 Fund
For tax purposes, at September 30, 2013, the fund had $73,298,000 of ordinary income available for distribution. Tax-basis amounts required to be distributed in December 2012 included short-term gain distributions received from Vanguard Total Bond Market II Index Fund in March 2012 and December 2012. Short-term capital gain distributions received are treated as ordinary income for tax purposes, and cannot be offset by capital losses. The fund used capital loss carryforwards of $342,000 to offset taxable capital gains realized during the year ended September 30, 2013. At September 30, 2013, the fund had available capital losses totaling $5,721,000 that may be carried forward indefinitely to offset future net capital gains.
At September 30, 2013, the cost of investment securities for tax purposes was $4,325,052,000. Net unrealized appreciation of investment securities for tax purposes was $1,030,023,000, consisting of unrealized gains of $1,034,761,000 on securities that had risen in value since their purchase and $4,738,000 in unrealized losses on securities that had fallen in value since their purchase.
E. During the year ended September 30, 2013, the fund purchased $1,684,538,000 of investment securities and sold $416,474,000 of investment securities, other than temporary cash investments.
F. Capital shares issued and redeemed were:
| | |
| | Year Ended September 30, |
| | 2013 | 2012 |
| | Shares | Shares |
| | (000) | (000) |
| Issued | 78,284 | 64,017 |
| Issued in Lieu of Cash Distributions | 3,480 | 2,499 |
| Redeemed | (30,850) | (25,002) |
| Net Increase (Decrease) in Shares Outstanding | 50,914 | 41,514 |
G. Management has determined that no material events or transactions occurred subsequent to September 30, 2013, that would require recognition or disclosure in these financial statements.
48
Target Retirement 2055 Fund
Fund Profile
As of September 30, 2013
| |
| Total Fund Characteristics | |
| |
| Ticker Symbol | VFFVX |
| 30-Day SEC Yield | 2.20% |
| Acquired Fund Fees and Expenses1 | 0.18% |
| |
| Allocation to Underlying Vanguard Funds | |
| Vanguard Total Stock Market Index Fund | |
| Investor Shares | 62.9% |
| Vanguard Total International Stock Index | |
| Fund Investor Shares | 27.0 |
| Vanguard Total Bond Market II Index Fund | |
| Investor Shares | 8.1 |
| Vanguard Total International Bond Index | |
| Fund Investor Shares | 2.0 |
| | |
| Total Fund Volatility Measures | |
| | Target 2055 | MSCI US |
| | Composite | Broad Market |
| | Index | Index |
| R-Squared | 1.00 | 0.97 |
| Beta | 1.00 | 0.94 |
These measures show the degree and timing of the fund’s fluctuations compared with the indexes over 36 months.
Fund Asset Allocation

1 This figure—drawn from the prospectus dated August 12, 2013—represents an estimate of the weighted average of the expense ratios and any transaction fees charged by the underlying mutual funds (the ”acquired” funds) in which the Target Retirement 2055 Fund invests. The fund does not charge any expenses or fees of its own. For the fiscal year ended September 30, 2013, the acquired fund fees and expenses were 0.18%.
49
Target Retirement 2055 Fund
Performance Summary
All of the returns in this report represent past performance, which is not a guarantee of future results that may be achieved by the fund. (Current performance may be lower or higher than the performance data cited. For performance data current to the most recent month-end, visit our website at vanguard.com/performance.) Note, too, that both investment returns and principal value can fluctuate widely, so an investor’s shares, when sold, could be worth more or less than their original cost. The returns shown do not reflect taxes that a shareholder would pay on fund distributions or on the sale of fund shares.
Cumulative Performance: August 18, 2010, Through September 30, 2013
Initial Investment of $10,000
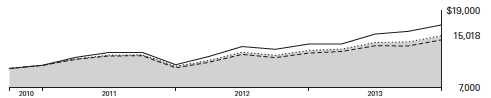
| | | | |
| | | Average Annual Total Returns | |
| | | Periods Ended September 30, 2013 | |
| | | | Since | Final Value |
| | | One | Inception | of a $10,000 |
| | | Year | (8/18/2010) | Investment |
| | Target Retirement 2055 Fund | 17.73% | 13.93% | $15,018 |
| •••••••• | Target 2055 Composite Index | 17.92 | 14.09 | 15,084 |
| – – – – | Spliced Mixed-Asset Target 2055+ | | | |
| | | 16.53 | 12.49 | 14,432 |
| | MSCI Funds US Average Broad Market Index | 21.55 | 18.01 | 16,760 |
For a benchmark description, see the Glossary.
Spliced Mixed-Asset Target 2055+ Funds Average: Derived from data provided by Lipper, a Thomson Reuters Company.
"Since Inception" performance is calculated from the inception date for both the fund and its comparative standards.
See Financial Highlights for dividend and capital gains information.
50
Target Retirement 2055 Fund
Fiscal-Year Total Returns (%): August 18, 2010, Through September 30, 2013
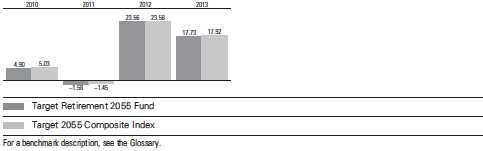
51
Target Retirement 2055 Fund
Financial Statements
Statement of Net Assets
As of September 30, 2013
The fund reports a complete list of its holdings in regulatory filings four times in each fiscal year, at the quarter-ends. For the second and fourth fiscal quarters, the lists appear in the fund’s semiannual and annual reports to shareholders. For the first and third fiscal quarters, the fund files the lists with the Securities and Exchange Commission on Form N-Q. Shareholders can look up the fund’s Forms N-Q on the SEC’s website at sec.gov. Forms N-Q may also be reviewed and copied at the SEC’s Public Reference Room (see the back cover of this report for further information).
| | |
| | | Market |
| | | Value |
| | Shares | ($000) |
| Investment Companies (99.7%) | | |
| U.S. Stock Fund (62.8%) | | |
| Vanguard Total Stock Market Index Fund Investor Shares | 13,477,720 | 574,420 |
| |
| International Stock Fund (26.9%) | | |
| Vanguard Total International Stock Index Fund Investor Shares | 15,275,366 | 246,239 |
| |
| U.S. Bond Fund (8.0%) | | |
| 1 Vanguard Total Bond Market II Index Fund Investor Shares | 6,951,456 | 73,616 |
| |
| International Bond Fund (2.0%) | | |
| Vanguard Total International Bond Index Fund Investor Shares | 1,864,138 | 18,455 |
| Total Investment Companies (Cost $801,789) | | 912,730 |
| Temporary Cash Investment (0.3%) | | |
| Money Market Fund (0.3%) | | |
| 1 Vanguard Market Liquidity Fund, 0.112% (Cost $2,542) | 2,542,041 | 2,542 |
| Total Investments (100.0%) (Cost $804,331) | | 915,272 |
| Other Assets and Liabilities (0.0%) | | |
| Other Assets | | 8,308 |
| Liabilities | | (8,693) |
| | | (385) |
| Net Assets (100%) | | |
| Applicable to 31,912,330 outstanding $.001 par value shares of | | |
| beneficial interest (unlimited authorization) | | 914,887 |
| Net Asset Value Per Share | | $28.67 |
52
| |
| Target Retirement 2055 Fund | |
| |
| |
| |
| At September 30, 2013, net assets consisted of: | |
| | Amount |
| | ($000) |
| Paid-in Capital | 793,460 |
| Undistributed Net Investment Income | 10,791 |
| Accumulated Net Realized Losses | (305) |
| Unrealized Appreciation (Depreciation) | 110,941 |
| Net Assets | 914,887 |
See Note A in Notes to Financial Statements.
1 Affiliated fund available only to Vanguard and certain trusts and accounts managed by Vanguard. Rate shown for Vanguard Market Liquidity Fund is the 7 day yield.
See accompanying Notes, which are an integral part of the Financial Statements.
53
| |
| Target Retirement 2055 Fund | |
| |
| |
| Statement of Operations | |
| |
| | Year Ended |
| | September 30, 2013 |
| | ($000) |
| Investment Income | |
| Income | |
| Income Distributions Received | 15,546 |
| Net Investment Income—Note B | 15,546 |
| Realized Net Gain (Loss) | |
| Capital Gain Distributions Received | 275 |
| Investment Securities Sold | (443) |
| Realized Net Gain (Loss) | (168) |
| Change in Unrealized Appreciation (Depreciation) of Investment Securities | 91,119 |
| Net Increase (Decrease) in Net Assets Resulting from Operations | 106,497 |
See accompanying Notes, which are an integral part of the Financial Statements.
54
| | |
| Target Retirement 2055 Fund | | |
| |
| |
| Statement of Changes in Net Assets | | |
| |
| | Year Ended September 30, |
| | 2013 | 2012 |
| | ($000) | ($000) |
| Increase (Decrease) in Net Assets | | |
| Operations | | |
| Net Investment Income | 15,546 | 6,645 |
| Realized Net Gain (Loss) | (168) | 414 |
| Change in Unrealized Appreciation (Depreciation) | 91,119 | 35,775 |
| Net Increase (Decrease) in Net Assets Resulting from Operations | 106,497 | 42,834 |
| Distributions | | |
| Net Investment Income | (8,415) | (2,904) |
| Realized Capital Gain1 | (245) | (97) |
| Total Distributions | (8,660) | (3,001) |
| Capital Share Transactions | | |
| Issued | 567,744 | 286,736 |
| Issued in Lieu of Cash Distributions | 8,573 | 2,985 |
| Redeemed | (140,041) | (73,016) |
| Net Increase (Decrease) from Capital Share Transactions | 436,276 | 216,705 |
| Total Increase (Decrease) | 534,113 | 256,538 |
| Net Assets | | |
| Beginning of Period | 380,774 | 124,236 |
| End of Period2 | 914,887 | 380,774 |
1 Includes fiscal 2013 and 2012 short-term gain distributions totaling $132,000 and $97,000, respectively. Short-term gain distributions are treated as ordinary income dividends for tax purposes.
2 Net Assets—End of Period includes undistributed net investment income of $10,791,000 and $4,443,000.
See accompanying Notes, which are an integral part of the Financial Statements.
55
| | | | |
| Target Retirement 2055 Fund | | | | |
| |
| |
| Financial Highlights | | | | |
| |
| |
| | | | | Aug. 18, |
| | | | | 20101 to |
| | Year Ended September 30, | Sept. 30, |
| For a Share Outstanding Throughout Each Period | 2013 | 2012 | 2011 | 2010 |
| Net Asset Value, Beginning of Period | $24.81 | $20.45 | $20.98 | $20.00 |
| Investment Operations | | | | |
| Net Investment Income | .6412 | .540 | .3882 | .063 |
| Capital Gain Distributions Received | .0112 | .022 | .001 | — |
| Net Realized and Unrealized Gain (Loss) on Investments | 3.668 | 4.202 | (.698) | .917 |
| Total from Investment Operations | 4.320 | 4.764 | (.309) | .980 |
| Distributions | | | | |
| Dividends from Net Investment Income | (.447) | (.391) | (.179) | — |
| Distributions from Realized Capital Gains | (.013) | (.013) | (.042) | — |
| Total Distributions | (.460) | (.404) | (.221) | — |
| Net Asset Value, End of Period | $28.67 | $24.81 | $20.45 | $20.98 |
| |
| Total Return3 | 17.73% | 23.56% | -1.58% | 4.90% |
| |
| Ratios/Supplemental Data | | | | |
| Net Assets, End of Period (Millions) | $915 | $381 | $124 | $2 |
| Ratio of Total Expenses to Average Net Assets | — | — | — | — |
| Acquired Fund Fees and Expenses | 0.18% | 0.18% | 0.19% | 0.22%4 |
| Ratio of Net Investment Income to Average Net Assets | 2.39% | 2.76% | 1.71% | 2.73%4 |
| Portfolio Turnover Rate | 9% | 3% | 12%5 | 3% |
1 Inception.
2 Calculated based on average shares outstanding.
3 Total returns do not include account service fees that may have applied in the periods shown. Fund prospectuses provide information about any applicable account service fees.
4 Annualized.
5 Excludes the value of mutual fund shares delivered and received in connection with a change in the fund’s international equity investments from Vanguard European, Pacific, and Emerging Markets Stock Index Funds to Vanguard Total International Stock Index Fund because those transactions were effected in kind and did not cause the fund to incur transaction costs.
See accompanying Notes, which are an integral part of the Financial Statements.
56
Target Retirement 2055 Fund
Notes to Financial Statements
Vanguard Target Retirement 2055 Fund is registered under the Investment Company Act of 1940 as an open-end investment company, or mutual fund. The fund follows a balanced investment strategy by investing in selected Vanguard funds to achieve its targeted allocation of assets to U.S. stocks, international stocks, U.S. bonds, and international bonds. Financial statements and other information about each underlying fund are available on vanguard.com.
A. The following significant accounting policies conform to generally accepted accounting principles for U.S. mutual funds. The fund consistently follows such policies in preparing its financial statements.
1. Security Valuation: Investments are valued at the net asset value of each underlying Vanguard fund determined as of the close of the New York Stock Exchange (generally 4 p.m., Eastern time) on the valuation date.
2. Federal Income Taxes: The fund intends to continue to qualify as a regulated investment company and distribute all of its taxable income. Management has analyzed the fund’s tax positions taken for all open federal income tax years (September 30, 2010–2013), and has concluded that no provision for federal income tax is required in the fund’s financial statements.
3. Distributions: Distributions to shareholders are recorded on the ex-dividend date.
4. Other: Income and capital gain distributions received are recorded on the ex-dividend date. Security transactions are accounted for on the date securities are bought or sold. Costs used to determine realized gains (losses) on the sale of investment securities are those of the specific securities sold.
B. Under a service agreement, The Vanguard Group furnishes investment advisory, corporate management, administrative, marketing, and distribution services to the fund. The service agreement provides that the fund’s expenses may be reduced or eliminated to the extent of savings realized by the Vanguard funds by the operation of the fund. Accordingly, all incremental expenses for services provided by Vanguard and all other expenses incurred by the fund during the year ended September 30, 2013, were borne by the funds in which the fund invests. The fund’s trustees and officers are also directors and officers of Vanguard and the funds in which the fund invests.
C. Various inputs may be used to determine the value of the fund’s investments. These inputs are summarized in three broad levels for financial statement purposes. The inputs or methodologies used to value securities are not necessarily an indication of the risk associated with investing in those securities.
Level 1—Quoted prices in active markets for identical securities.
Level 2—Other significant observable inputs (including quoted prices for similar securities, interest rates, prepayment speeds, credit risk, etc.).
Level 3—Significant unobservable inputs (including the fund’s own assumptions used to determine the fair value of investments).
At September 30, 2013, 100% of the market value of the fund’s investments was determined based on Level 1 inputs.
D. Distributions are determined on a tax basis and may differ from net investment income and realized capital gains for financial reporting purposes. Differences may be permanent or temporary. Permanent differences are reclassified among capital accounts in the financial statements to reflect their tax character. Temporary differences arise when certain items of income, expense, gain, or loss are recognized in different periods for financial statement and tax purposes; these differences will reverse at some time in the future. Differences in classification may also result from the treatment of short-term gains as ordinary income for tax purposes.
57
Target Retirement 2055 Fund
The fund used a tax accounting practice to treat a portion of the price of capital shares redeemed during the year as distributions from net investment income and realized capital gains. Accordingly, the fund has reclassified $783,000 from undistributed net investment income, and $7,000 from accumulated net realized losses, to paid-in capital.
For tax purposes, at September 30, 2013, the fund had $10,794,000 of ordinary income and $127,000 of long-term capital gains available for distribution.
At September 30, 2013, the cost of investment securities for tax purposes was $804,766,000. Net unrealized appreciation of investment securities for tax purposes was $110,506,000, consisting of unrealized gains of $112,661,000 on securities that had risen in value since their purchase and $2,155,000 in unrealized losses on securities that had fallen in value since their purchase.
E. During the year ended September 30, 2013, the fund purchased $501,190,000 of investment securities and sold $57,233,000 of investment securities, other than temporary cash investments.
F. Capital shares issued and redeemed were:
| | |
| | Year Ended September 30, |
| | 2013 | 2012 |
| | Shares | Shares |
| | (000) | (000) |
| Issued | 21,406 | 12,295 |
| Issued in Lieu of Cash Distributions | 350 | 136 |
| Redeemed | (5,194) | (3,155) |
| Net Increase (Decrease) in Shares Outstanding | 16,562 | 9,276 |
G. Management has determined that no material events or transactions occurred subsequent to September 30, 2013, that would require recognition or disclosure in these financial statements.
58
Target Retirement 2060 Fund
Fund Profile
As of September 30, 2013
| |
| Total Fund Characteristics | |
| |
| Ticker Symbol | VTTSX |
| 30-Day SEC Yield | 2.20% |
| Acquired Fund Fees and Expenses1 | 0.18% |
| |
| Allocation to Underlying Vanguard Funds | |
| Vanguard Total Stock Market Index Fund | |
| Investor Shares | 63.0% |
| Vanguard Total International Stock Index | |
| Fund Investor Shares | 27.0 |
| Vanguard Total Bond Market II Index Fund | |
| Investor Shares | 8.0 |
| Vanguard Total International Bond Index | |
| Fund Investor Shares | 2.0 |
Fund Asset Allocation
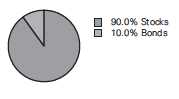
1 This figure—drawn from the prospectus dated August 12, 2013—represents an estimate of the weighted average of the expense ratios and any transaction fees charged by the underlying mutual funds (the ”acquired” funds) in which the Target Retirement 2060 Fund invests. The fund does not charge any expenses or fees of its own. For the fiscal year ended September 30, 2013, the annualized acquired fund fees and expenses were 0.18%.
59
Target Retirement 2060 Fund
Performance Summary
All of the returns in this report represent past performance, which is not a guarantee of future results that may be achieved by the fund. (Current performance may be lower or higher than the performance data cited. For performance data current to the most recent month-end, visit our website at vanguard.com/performance.) Note, too, that both investment returns and principal value can fluctuate widely, so an investor’s shares, when sold, could be worth more or less than their original cost. The returns shown do not reflect taxes that a shareholder would pay on fund distributions or on the sale of fund shares.
Cumulative Performance: January 19, 2012, Through September 30, 2013
Initial Investment of $10,000
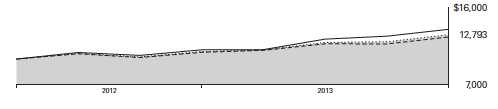
| | | | |
| | | Average Annual Total Returns | |
| | | Periods Ended September 30, 2013 | |
| | | | Since | Final Value |
| | | One | Inception | of a $10,000 |
| | | Year | (1/19/2012) | Investment |
| | Target Retirement 2060 Fund | 17.69% | 15.63% | $12,793 |
| •••••••• | Target 2060 Composite Index | 17.92 | 15.81 | 12,826 |
| – – – – | Spliced Mixed-Asset Target 2055+ | | | |
| | | 16.53 | 14.41 | 12,565 |
| | MSCI Funds US Average Broad Market Index | 21.55 | 19.14 | 13,458 |
For a benchmark description, see the Glossary.
Spliced Mixed-Asset Target 2055+ Funds Average: Derived from data provided by Lipper, a Thomson Reuters Company.
"Since Inception" performance is calculated from the inception date for both the fund and its comparative standards.
See Financial Highlights for dividend and capital gains information.
60
Target Retirement 2060 Fund
Fiscal-Year Total Returns (%): January 19, 2012, Through September 30, 2013
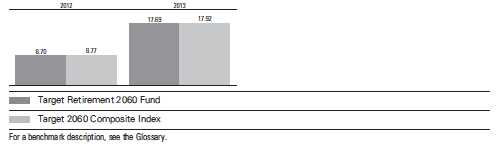
61
Target Retirement 2060 Fund
Financial Statements
Statement of Net Assets
As of September 30, 2013
The fund reports a complete list of its holdings in regulatory filings four times in each fiscal year, at the quarter-ends. For the second and fourth fiscal quarters, the lists appear in the fund’s semiannual and annual reports to shareholders. For the first and third fiscal quarters, the fund files the lists with the Securities and Exchange Commission on Form N-Q. Shareholders can look up the fund’s Forms N-Q on the SEC’s website at sec.gov. Forms N-Q may also be reviewed and copied at the SEC’s Public Reference Room (see the back cover of this report for further information).
| | |
| | | Market |
| | | Value |
| | Shares | ($000) |
| Investment Companies (99.4%) | | |
| U.S. Stock Fund (62.6%) | | |
| Vanguard Total Stock Market Index Fund Investor Shares | 3,191,446 | 136,020 |
| |
| International Stock Fund (26.9%) | | |
| Vanguard Total International Stock Index Fund Investor Shares | 3,617,124 | 58,308 |
| |
| U.S. Bond Fund (7.9%) | | |
| 1 Vanguard Total Bond Market II Index Fund Investor Shares | 1,628,593 | 17,247 |
| |
| International Bond Fund (2.0%) | | |
| Vanguard Total International Bond Index Fund Investor Shares | 442,348 | 4,379 |
| Total Investment Companies (Cost $199,213) | | 215,954 |
| Temporary Cash Investment (0.1%) | | |
| Money Market Fund (0.1%) | | |
| 1 Vanguard Market Liquidity Fund, 0.112% (Cost $219) | 219,351 | 219 |
| Total Investments (99.5%) (Cost $199,432) | | 216,173 |
| Other Assets and Liabilities (0.5%) | | |
| Other Assets | | 3,158 |
| Liabilities | | (2,174) |
| | | 984 |
| Net Assets (100%) | | |
| Applicable to 8,613,854 outstanding $.001 par value shares of | | |
| beneficial interest (unlimited authorization) | | 217,157 |
| Net Asset Value Per Share | | $25.21 |
62
| |
| Target Retirement 2060 Fund | |
| |
| |
| |
| At September 30, 2013, net assets consisted of: | |
| | Amount |
| | ($000) |
| Paid-in Capital | 198,258 |
| Undistributed Net Investment Income | 2,204 |
| Accumulated Net Realized Losses | (46) |
| Unrealized Appreciation (Depreciation) | 16,741 |
| Net Assets | 217,157 |
See Note A in Notes to Financial Statements.
1 Affiliated fund available only to Vanguard funds and certain trusts and accounts managed by Vanguard. Rate shown for Vanguard Market Liquidity Fund is the 7 day yield.
See accompanying Notes, which are an integral part of the Financial Statments.
63
| |
| Target Retirement 2060 Fund | |
| |
| |
| Statement of Operations | |
| |
| | Year Ended |
| | September 30, 2013 |
| | ($000) |
| Investment Income | |
| Income | |
| Dividends | 2,846 |
| Net Investment Income—Note B | 2,846 |
| Realized Net Gain (Loss) | |
| Capital Gain Distributions Received | 34 |
| Investment Securities Sold | 107 |
| Realized Net Gain (Loss) | 141 |
| Change in Unrealized Appreciation (Depreciation) of Investment Securities | 15,512 |
| Net Increase (Decrease) in Net Assets Resulting from Operations | 18,499 |
See accompanying Notes, which are an integral part of the Financial Statements.
64
| | |
| Target Retirement 2060 Fund | | |
| |
| |
| Statement of Changes in Net Assets | | |
| |
| | | January 19, |
| | Year Ended | 20121 to |
| | September 30, | September 30, |
| | 2013 | 2012 |
| | ($000) | ($000) |
| Increase (Decrease) in Net Assets | | |
| Operations | | |
| Net Investment Income | 2,846 | 334 |
| Realized Net Gain (Loss) | 141 | (171) |
| Change in Unrealized Appreciation (Depreciation) | 15,512 | 1,229 |
| Net Increase (Decrease) in Net Assets Resulting from Operations | 18,499 | 1,392 |
| Distributions | | |
| Net Investment Income | (784) | — |
| Realized Capital Gain2 | (15) | — |
| Total Distributions | (799) | — |
| Capital Share Transactions | | |
| Issued | 205,842 | 43,919 |
| Issued in Lieu of Cash Distributions | 790 | — |
| Redeemed | (40,404) | (12,082) |
| Net Increase (Decrease) from Capital Share Transactions | 166,228 | 31,837 |
| Total Increase (Decrease) | 183,928 | 33,229 |
| Net Assets | | |
| Beginning of Period | 33,229 | — |
| End of Period3 | 217,157 | 33,229 |
1 Inception.
2 Includes fiscal 2013 short-term gain distributions totaling $15,000. Short-term gain distributions are treated as ordinary income dividends for tax purposes.
3 Net Assets—End of Period includes undistributed net investment income of $2,204,000 and $334,000.
See accompanying Notes, which are an integral part of the Financial Statements.
65
| | |
| Target Retirement 2060 Fund | | |
| |
| |
| Financial Highlights | | |
| |
| | Year | Jan. 19, |
| | Ended | 20121 to |
| | Sept. 30, | Sept. 30, |
| For a Share Outstanding Throughout Each Period | 2013 | 2012 |
| Net Asset Value, Beginning of Period | $21.74 | $20.00 |
| Investment Operations | | |
| Net Investment Income | . 5812 | .218 |
| Capital Gain Distributions Received | .007 2 | .002 |
| Net Realized and Unrealized Gain (Loss) on Investments | 3.203 | 1.520 |
| Total from Investment Operations | 3.791 | 1.740 |
| Distributions | | |
| Dividends from Net Investment Income | (.315) | — |
| Distributions from Realized Capital Gains | (.006) | — |
| Total Distributions | (. 321) | — |
| Net Asset Value, End of Period | $25.21 | $21.74 |
| |
| Total Return3 | 17.69% | 8.70% |
| |
| Ratios/Supplemental Data | | |
| Net Assets, End of Period (Millions) | $217 | $33 |
| Ratio of Total Expenses to Average Net Assets | — | — |
| Acquired Fund Fees and Expenses | 0.18% | 0.18%4 |
| Ratio of Net Investment Income to Average Net Assets | 2.45% | 2.99%4 |
| Portfolio Turnover Rate | 10% | 40% |
1 Inception.
2 Calculated based on average shares outstanding.
3 Total returns do not include account service fees that may have applied in the periods shown. Fund prospectuses provide information about any applicable account service fees.
4 Annualized.
See accompanying Notes, which are an integral part of the Financial Statements.
66
Target Retirement 2060 Fund
Notes to Financial Statements
Vanguard Target Retirement 2060 Fund is registered under the Investment Company Act of 1940 as an open-end investment company, or mutual fund. The fund follows a balanced investment strategy by investing in selected Vanguard funds to achieve its targeted allocation of assets to U.S. stocks, international stocks, U.S. bonds, and international bonds. Financial statements and other information about each underlying fund are available on vanguard.com.
A. The following significant accounting policies conform to generally accepted accounting principles for U.S. mutual funds. The fund consistently follows such policies in preparing its financial statements.
1. Security Valuation: Investments are valued at the net asset value of each underlying Vanguard fund determined as of the close of the New York Stock Exchange (generally 4 p.m., Eastern time) on the valuation date.
2. Federal Income Taxes: The fund intends to continue to qualify as a regulated investment company and distribute all of its taxable income. Management has analyzed the fund’s tax positions taken for all open federal income tax years (September 30, 2012–2013), and has concluded that no provision for federal income tax is required in the fund’s financial statements.
3. Distributions: Distributions to shareholders are recorded on the ex-dividend date.
4. Other: Income and capital gain distributions received are recorded on the ex-dividend date. Security transactions are accounted for on the date securities are bought or sold. Costs used to determine realized gains (losses) on the sale of investment securities are those of the specific securities sold.
B. Under a service agreement, The Vanguard Group furnishes investment advisory, corporate management, administrative, marketing, and distribution services to the fund. The service agreement provides that the fund’s expenses may be reduced or eliminated to the extent of savings realized by the Vanguard funds by the operation of the fund. Accordingly, all incremental expenses for services provided by Vanguard and all other expenses incurred by the fund during the year ended September 30, 2013, were borne by the funds in which the fund invests. The fund’s trustees and officers are also directors and officers of Vanguard and the funds in which the fund invests.
C. Various inputs may be used to determine the value of the fund’s investments. These inputs are summarized in three broad levels for financial statement purposes. The inputs or methodologies used to value securities are not necessarily an indication of the risk associated with investing in those securities.
Level 1—Quoted prices in active markets for identical securities.
Level 2—Other significant observable inputs (including quoted prices for similar securities, interest rates, prepayment speeds, credit risk, etc.).
Level 3—Significant unobservable inputs (including the fund’s own assumptions used to determine the fair value of investments).
At September 30, 2013, 100% of the market value of the fund’s investments was determined based on Level 1 inputs.
D. Distributions are determined on a tax basis and may differ from net investment income and realized capital gains for financial reporting purposes. Differences may be permanent or temporary. Permanent differences are reclassified among capital accounts in the financial statements to reflect their tax character. Temporary differences arise when certain items of income, expense, gain, or loss are recognized in different periods for financial statement and tax purposes; these differences will reverse at some time in the future. Differences in classification may also result from the treatment of short-term gains as ordinary income for tax purposes.
67
Target Retirement 2060 Fund
The fund used a tax accounting practice to treat a portion of the price of capital shares redeemed during the year as distributions from net investment income and realized capital gains. Accordingly, the fund has reclassified $192,000 from undistributed net investment income, and $1,000 from accumulated net realized losses, to paid-in capital.
The fund used capital loss carryforwards of $4,000 to offset taxable capital gains realized during the year ended September 30, 2013, reducing the amount of capital gains that would otherwise be available to distribute to shareholders. For tax purposes, at September 30, 2013, the fund had $2,204,000 of ordinary income and $12,000 of long-term capital gains available for distribution.
At September 30, 2013, the cost of investment securities for tax purposes was $199,490,000. Net unrealized appreciation of investment securities for tax purposes was $16,683,000, consisting of unrealized gains of $17,162,000 on securities that had risen in value since their purchase and $479,000 in unrealized losses on securities that had fallen in value since their purchase.
E. During the year ended September 30, 2013, the fund purchased $179,376,000 of investment securities and sold $12,050,000 of investment securities, other than temporary cash investments.
F. Capital shares issued and redeemed were:
| | |
| | Year Ended | January 19, 20121 to |
| | September 30, 2013 | September 30, 2012 |
| | Shares | Shares |
| | (000) | (000) |
| Issued | 8,760 | 2,110 |
| Issued in Lieu of Cash Distributions | 37 | — |
| Redeemed | (1,712) | (581) |
| Net Increase (Decrease) in Shares Outstanding | 7,085 | 1,529 |
| 1 Inception. | | |
G. Management has determined that no material events or transactions occurred subsequent to September 30, 2013, that would require recognition or disclosure in these financial statements.
68
Report of Independent Registered
Public Accounting Firm
To the Trustees of Vanguard Chester Funds and the Shareholders of Vanguard Target Retirement 2035 Fund, Vanguard Target Retirement 2040 Fund, Vanguard Target Retirement 2045 Fund, Vanguard Target Retirement 2050 Fund, Vanguard Target Retirement 2055 Fund, and Vanguard Target Retirement 2060 Fund:
In our opinion, the accompanying statements of net assets and the related statements of operations and of changes in net assets and the financial highlights present fairly, in all material respects, the financial position of Vanguard Target Retirement 2035 Fund, Vanguard Target Retirement 2040 Fund, Vanguard Target Retirement 2045 Fund, Vanguard Target Retirement 2050 Fund, Vanguard Target Retirement 2055 Fund and Vanguard Target Retirement 2060 Fund (constituting separate portfolios of Vanguard Chester Funds, hereafter referred to as the “Funds”) at September 30, 2013, the results of each of their operations for the year then ended, the changes of each of their net assets and the financial highlights for each of the periods indicated, in conformity with accounting principles generally accepted in the United States of America. These financial statements and financial highlights (hereafter referred to as “financial statements”) are the responsibility of the Funds’ management; our responsibility is to express an opinion on these financial statements based on our audits. We conducted our audits of these financial statements in accordance with the standards of the Public Company Accounting Oversight Board (United States). Those standards require that we plan and perform the audit to obtain reasonable assurance about whether the financial statements are free of material misstatement. An audit includes examining, on a test basis, evidence supporting the amounts and disclosures in the financial statements, assessing the accounting principles used and significant estimates made by management, and evaluating the overall financial statement presentation. We believe that our audits, which included confirmation of securities at September 30, 2013 by agreement to the underlying ownership records of the transfer agent, provide a reasonable basis for our opinion.
PricewaterhouseCoopers LLP
Philadelphia, Pennsylvania
November 14, 2013
69
|
| Special 2013 tax information (unaudited) for Vanguard Target Retirement Funds |
| |
| This information for the fiscal year ended September 30, 2013, is included pursuant to provisions of |
| the Internal Revenue Code. |
| The funds distributed capital gain dividends (from net long-term capital gains) to shareholders during |
| the fiscal year as follows: |
| |
| Fund | ($000) |
| Target Retirement 2035 Fund | — |
| Target Retirement 2040 Fund | 132 |
| Target Retirement 2045 Fund | — |
| Target Retirement 2050 Fund | — |
| Target Retirement 2055 Fund | 120 |
| Target Retirement 2060 Fund | 1 |
The funds distributed qualified dividend income to shareholders during the fiscal year as follows:
| |
| Fund | ($000) |
| Target Retirement 2035 Fund | 249,010 |
| Target Retirement 2040 Fund | 146,017 |
| Target Retirement 2045 Fund | 147,521 |
| Target Retirement 2050 Fund | 62,592 |
| Target Retirement 2055 Fund | 6,672 |
| Target Retirement 2060 Fund | 621 |
For corporate shareholders, the percentage of investment income (dividend income plus short-term gains, if any) that qualifies for the dividends-received deduction is as follows:
| |
| Fund | Percentage |
| Target Retirement 2035 Fund | 47.9% |
| Target Retirement 2040 Fund | 50.1 |
| Target Retirement 2045 Fund | 50.0 |
| Target Retirement 2050 Fund | 50.1 |
| Target Retirement 2055 Fund | 50.2 |
| Target Retirement 2060 Fund | 50.4 |
70
The funds designate to shareholders foreign source income and foreign taxes paid as follows:
| | |
| | Foreign Source Income | Foreign Taxes Paid |
| Fund | ($000) | ($000) |
| Target Retirement 2035 Fund | 139,562 | 7,884 |
| Target Retirement 2040 Fund | 87,771 | 4,958 |
| Target Retirement 2045 Fund | 85,455 | 4,828 |
| Target Retirement 2050 Fund | 38,439 | 2,172 |
| Target Retirement 2055 Fund | 5,673 | 320 |
| Target Retirement 2060 Fund | 1,039 | 59 |
Shareholders will receive more detailed information with their FORM 1099-DIV in January 2014 to determine the calendar-year amounts to be included on their 2013 tax returns.
71
Your Fund’s After-Tax Returns
This table presents returns for your fund both before and after taxes. The after-tax returns are shown in two ways: (1) assuming that an investor owned the fund during the entire period and paid taxes on the fund’s distributions, and (2) assuming that an investor paid taxes on the fund’s distributions and sold all shares at the end of each period.
Calculations are based on the highest individual federal income tax and capital gains tax rates in effect at the times of the distributions and the hypothetical sales. State and local taxes were not considered. After-tax returns reflect any qualified dividend income, using actual prior-year figures and estimates for 2013. (In the example, returns after the sale of fund shares may be higher than those assuming no sale. This occurs when the sale would have produced a capital loss. The calculation assumes that the investor received a tax deduction for the loss.)
Please note that your actual after-tax returns will depend on your tax situation and may differ from those shown. Also note that if you own the fund in a tax-deferred account, such as an individual retirement account or a 401(k) plan, this information does not apply to you. Such accounts are not subject to current taxes.
Finally, keep in mind that a fund’s performance—whether before or after taxes—does not guarantee future results.
| | | |
| Average Annual Total Returns: Target Retirement Funds | | | |
| Periods Ended September 30, 2013 | | | |
| | | | Since |
| | One | Five | Inception |
| | Year | Years | (10/27/2003) |
| Target Retirement 2035 Fund | | | |
| Returns Before Taxes | 16.77% | 8.87% | 7.03% |
| Returns After Taxes on Distributions | 16.29 | 8.37 | 6.61 |
| Returns After Taxes on Distributions and Sale of Fund Shares | 10.00 | 6.97 | 5.64 |
| | | | Since |
| | One | Five | Inception |
| | Year | Years | (6/7/2006) |
| Target Retirement 2040 Fund | | | |
| Returns Before Taxes | 17.75% | 9.11% | 6.01% |
| Returns After Taxes on Distributions | 17.29 | 8.64 | 5.63 |
| Returns After Taxes on Distributions and Sale of Fund Shares | 10.56 | 7.16 | 4.73 |
| |
| | | | Since |
| | One | Five | Inception |
| | Year | Years | (10/27/2003) |
| Target Retirement 2045 Fund | | | |
| Returns Before Taxes | 17.70% | 9.09% | 7.45% |
| Returns After Taxes on Distributions | 17.23 | 8.58 | 7.04 |
| Returns After Taxes on Distributions and Sale of Fund Shares | 10.53 | 7.14 | 6.01 |
72
| | | |
| Average Annual Total Returns: Target Retirement Funds | | | |
| Periods Ended September 30, 2013 | | | |
| |
| | | | Since |
| | One | Five | Inception |
| | Year | Years | (6/7/2006) |
| Target Retirement 2050 Fund | | | |
| Returns Before Taxes | 17.74% | 9.10% | 6.07% |
| Returns After Taxes on Distributions | 17.29 | 8.59 | 5.67 |
| Returns After Taxes on Distributions and Sale of Fund Shares | 10.54 | 7.14 | 4.78 |
| | |
| | | Since |
| | One | Inception |
| | Year | (8/18/2010) |
| Target Retirement 2055 Fund | | |
| Returns Before Taxes | 17.73% | 13.93% |
| Returns After Taxes on Distributions | 17.34 | 13.60 |
| Returns After Taxes on Distributions and Sale of Fund Shares | 10.48 | 10.93 |
| |
| | | Since |
| | One | Inception |
| | Year | (1/19/2012) |
| Target Retirement 2060 Fund | | |
| Returns Before Taxes | 17.69% | 15.63% |
| Returns After Taxes on Distributions | 17.38 | 15.45 |
| Returns After Taxes on Distributions and Sale of Fund Shares | 10.36 | 12.06 |
73
About Your Fund’s Expenses
As a shareholder of the fund, you incur ongoing costs, which include costs for portfolio management, administrative services, and shareholder reports (like this one), among others. Operating expenses, which are deducted from a fund’s gross income, directly reduce the investment return of the fund.
A typical fund’s expenses are expressed as a percentage of its average net assets. The Target Retirement Funds have no direct expenses, but each fund bears its proportionate share of the costs for the underlying funds in which it invests. These indirect expenses make up the acquired fund fees and expenses, also expressed as a percentage of average net assets.
The following examples are intended to help you understand the ongoing cost (in dollars) of investing in your fund and to compare these costs with those of other mutual funds. The examples are based on an investment of $1,000 made at the beginning of the period shown and held for the entire period. The costs were calculated using the acquired fund fees and expenses for each Target Retirement Fund.
The accompanying table illustrates your fund’s costs in two ways:
• Based on actual fund return. This section helps you to estimate the actual expenses that you paid over the period. The ”Ending Account Value“ shown is derived from the fund‘s actual return, and the third column shows the dollar amount that would have been paid by an investor who started with $1,000 in the fund. You may use the information here, together with the amount you invested, to estimate the expenses that you paid over the period.
To do so, simply divide your account value by $1,000 (for example, an $8,600 account value divided by $1,000 = 8.6), then multiply the result by the number given for your fund under the heading ”Expenses Paid During Period.“
• Based on hypothetical 5% yearly return. This section is intended to help you compare your fund‘s costs with those of other mutual funds. It assumes that the fund had a yearly return of 5% before expenses, but that the expense ratio is unchanged. In this case—because the return used is not the fund’s actual return—the results do not apply to your investment. The example is useful in making comparisons because the Securities and Exchange Commission requires all mutual funds to calculate expenses based on a 5% return. You can assess your fund’s costs by comparing this hypothetical example with the hypothetical examples that appear in shareholder reports of other funds.
Note that the expenses shown in the table are meant to highlight and help you compare ongoing costs only and do not reflect transaction costs incurred by the fund for buying and selling securities. Further, the expenses do not include any purchase, redemption, or account service fees described in the fund prospectus. If such fees were applied to your account, your costs would be higher. Your fund does not carry a “sales load.”
The calculations assume no shares were bought or sold during the period. Your actual costs may have been higher or lower, depending on the amount of your investment and the timing of any purchases or redemptions.
You can find more information about the fund’s expenses, including annual expense ratios, in the Financial Statements section of this report. For additional information on operating expenses and other shareholder costs, please refer to your fund’s current prospectus.
74
| | | |
| Six Months Ended September 30, 2013 | | | |
| | Beginning | Ending | Expenses |
| | Account Value | Account Value | Paid During |
| | 3/31/2013 | 9/30/2013 | Period |
| Based on Actual Fund Return | | | |
| Target Retirement 2035 Fund | $1,000.00 | $1,068.78 | $0.93 |
| Target Retirement 2040 Fund | $1,000.00 | $1,074.15 | $0.94 |
| Target Retirement 2045 Fund | $1,000.00 | $1,074.07 | $0.94 |
| Target Retirement 2050 Fund | $1,000.00 | $1,074.04 | $0.94 |
| Target Retirement 2055 Fund | $1,000.00 | $1,074.19 | $0.94 |
| Target Retirement 2060 Fund | $1,000.00 | $1,074.14 | $0.94 |
| Based on Hypothetical 5% Yearly Return | | | |
| Target Retirement 2035 Fund | $1,000.00 | $1,024.17 | $0.91 |
| Target Retirement 2040 Fund | $1,000.00 | $1,024.17 | $0.91 |
| Target Retirement 2045 Fund | $1,000.00 | $1,024.17 | $0.91 |
| Target Retirement 2050 Fund | $1,000.00 | $1,024.17 | $0.91 |
| Target Retirement 2055 Fund | $1,000.00 | $1,024.17 | $0.91 |
| Target Retirement 2060 Fund | $1,000.00 | $1,024.17 | $0.91 |
The calculations are based on the acquired fund fees and expenses for the most recent six-month period. The funds’ annualized expense figures for the period are (in order as listed from top to bottom above) 0.18%, 0.18%, 0.18%, 0.18%, 0.18%, and 0.18%. The dollar amounts shown as ”Expenses Paid” are equal to the annualized average weighted expense ratio for the underlying funds multiplied by the average account value over the period, multiplied by the number of days in the most recent six-month period, then divided by the number of days in the most recent 12-month period.
75
Glossary
30-Day SEC Yield. A fund’s 30-day SEC yield is derived using a formula specified by the U.S. Securities and Exchange Commission. Under the formula, data related to the fund’s security holdings in the previous 30 days are used to calculate the fund’s hypothetical net income for that period, which is then annualized and divided by the fund’s estimated average net assets over the calculation period. For the purposes of this calculation, a security’s income is based on its current market yield to maturity (for bonds), its actual income (for asset-backed securities), or its projected dividend yield (for stocks). Because the SEC yield represents hypothetical annualized income, it will differ—at times significantly—from the fund’s actual experience. As a result, the fund’s income distributions may be higher or lower than implied by the SEC yield.
Acquired Fund Fees and Expenses. Funds that invest in other Vanguard funds incur no direct expenses, but they do bear proportionate shares of the operating, administrative, and advisory expenses of the underlying funds, and they must pay any fees charged by those funds. The figure for acquired fund fees and expenses represents a weighted average of these underlying costs. Acquired is a term that the Securities and Exchange Commission applies to any mutual fund whose shares are owned by another fund.
Beta. A measure of the magnitude of a fund’s past share-price fluctuations in relation to the ups and downs of a given market index. The index is assigned a beta of 1.00. Compared with a given index, a fund with a beta of 1.20 typically would have seen its share price rise or fall by 12% when the index rose or fell by 10%. For this report, beta is based on returns over the past 36 months for both the fund and the index. Note that a fund’s beta should be reviewed in conjunction with its R-squared (see definition). The lower the R-squared, the less correlation there is between the fund and the index, and the less reliable beta is as an indicator of volatility.
Expense Ratio. A fund’s total annual operating expenses expressed as a percentage of the fund’s average net assets. The expense ratio includes management and administrative expenses, but does not include the transaction costs of buying and selling portfolio securities.
Inception Date. The date on which the assets of a fund (or one of its share classes) are first invested in accordance with the fund’s investment objective. For funds with a subscription period, the inception date is the day after that period ends. Investment performance is measured from the inception date.
R-Squared. A measure of how much of a fund’s past returns can be explained by the returns from the market in general, as measured by a given index. If a fund’s total returns were precisely synchronized with an index’s returns, its R-squared would be 1.00. If the fund’s returns bore no relationship to the index’s returns, its R-squared would be 0. For this report, R-squared is based on returns over the past 36 months for both the fund and the index.
76
Benchmark Information
Spliced Mixed-Asset Target 2055+ Funds Average: Mixed-Asset Target 2050 Funds Average through August 31, 2013; Mixed-Asset Target 2055+ Funds Average thereafter.
Target 2035 Composite Index: Derived by applying the fund’s target asset allocation to the results of the following benchmarks: for international stocks of developed markets, the MSCI EAFE Index through December 15, 2010, the MSCI ACWI ex USA IMI Index through June 2, 2013, and the FTSE Global All Cap ex US Index thereafter; for emerging-market stocks, the Select Emerging Markets Index through August 23, 2006, the MSCI Emerging Markets Index through December 15, 2010, the MSCI ACWI ex USA IMI Index through June 2, 2013, and the FTSE Global All Cap ex US Index thereafter; for U.S. bonds, the Barclays U.S. Aggregate Bond Index through December 31, 2009, and the Barclays U.S. Aggregate Float Adjusted Index thereafter; for international bonds, the Barclays Global Aggregate ex-USD Float Adjusted RIC Capped Index beginning June 3, 2013; and for U.S. stocks, the Dow Jones U.S. Total Stock Market Index (formerly known as the Dow Jones Wilshire 5000 Index) through April 22, 2005, the MSCI US Broad Market Index through June 2, 2013, and the CRSP US Total Market Index thereafter. International stock benchmark returns are adjusted for withholding taxes.
Target 2040 Composite Index: Derived by applying the fund’s target asset allocation to the results of the following benchmarks: for international stocks of developed markets, the MSCI EAFE Index through December 15, 2010, the MSCI ACWI ex USA IMI Index through June 2, 2013, and the FTSE Global All Cap ex US Index thereafter; for emerging-market stocks, the Select Emerging Markets Index through August 23, 2006, the MSCI Emerging Markets Index through December 15, 2010, the MSCI ACWI ex USA IMI Index through June 2, 2013, and the FTSE Global All Cap ex US Index thereafter; for U.S. bonds, the Barclays U.S. Aggregate Bond Index through December 31, 2009, and the Barclays U.S. Aggregate Float Adjusted Index thereafter; for international bonds, the Barclays Global Aggregate ex-USD Float Adjusted RIC Capped Index beginning June 3, 2013; and for U.S. stocks, the MSCI US Broad Market Index through June 2, 2013, and the CRSP US Total Market Index thereafter. International stock benchmark returns are adjusted for withholding taxes.
Target 2045 Composite Index: Derived by applying the fund’s target asset allocation to the results of the following benchmarks: for international stocks of developed markets, the MSCI EAFE Index through December 15, 2010, the MSCI ACWI ex USA IMI Index through June 2, 2013, and the FTSE Global All Cap ex US Index thereafter; for emerging-market stocks, the Select Emerging Markets Index through August 23, 2006, the MSCI Emerging Markets Index through December 15, 2010, the MSCI ACWI ex USA IMI Index through June 2, 2013, and the FTSE Global All Cap ex US Index thereafter; for U.S. bonds, the Barclays U.S. Aggregate Bond Index through December 31, 2009, and the Barclays U.S. Aggregate Float Adjusted Index thereafter; for international bonds, the Barclays Global Aggregate ex-USD Float Adjusted RIC Capped Index beginning June 3, 2013; and for U.S. stocks, the Dow Jones U.S. Total Stock Market Index (formerly known as the Dow Jones Wilshire 5000 Index) through April 22, 2005, the MSCI US Broad Market Index through June 2, 2013, and the CRSP US Total Market Index thereafter. International stock benchmark returns are adjusted for withholding taxes.
77
Target 2050 Composite Index: Derived by applying the fund’s target asset allocation to the results of the following benchmarks: for international stocks of developed markets, the MSCI EAFE Index through December 15, 2010, the MSCI ACWI ex USA IMI Index through June 2, 2013, and the FTSE Global All Cap ex US Index thereafter; for emerging-market stocks, the Select Emerging Markets Index through August 23, 2006, the MSCI Emerging Markets Index through December 15, 2010, the MSCI ACWI ex USA IMI Index through June 2, 2013, and the FTSE Global All Cap ex US Index thereafter; for U.S. bonds, the Barclays U.S. Aggregate Bond Index through December 31, 2009, and the Barclays U.S. Aggregate Float Adjusted Index thereafter; for international bonds, the Barclays Global Aggregate ex-USD Float Adjusted RIC Capped Index beginning June 3, 2013; and for U.S. stocks, the MSCI US Broad Market Index through June 2, 2013, and the CRSP US Total Market Index thereafter. International stock benchmark returns are adjusted for withholding taxes.
Target 2055 Composite Index: Derived by applying the fund’s target asset allocation to the results of the following benchmarks: for international stocks of developed markets, the MSCI EAFE Index through December 15, 2010, the MSCI ACWI ex USA IMI Index through June 2, 2013, and the FTSE Global All Cap ex US Index thereafter; for emerging-market stocks, the MSCI Emerging Markets Index through December 15, 2010, the MSCI ACWI ex USA IMI Index through June 2, 2013, and the FTSE Global All Cap ex US Index thereafter; for U.S. bonds, the Barclays U.S. Aggregate Float Adjusted Index; for international bonds, the Barclays Global Aggregate ex-USD Float Adjusted RIC Capped Index beginning June 3, 2013; and for U.S. stocks, the MSCI US Broad Market Index through June 2, 2013, and the CRSP US Total Market Index thereafter. International stock benchmark returns are adjusted for withholding taxes.
Target 2060 Composite Index: Derived by applying the fund’s target asset allocation to the results of the following benchmarks: for international stocks of developed markets, the MSCI ACWI ex USA IMI Index through June 2, 2013, and the FTSE Global All Cap ex US Index thereafter; for emerging-market stocks, the MSCI ACWI ex USA IMI Index through June 2, 2013, and the FTSE Global All Cap ex US Index thereafter; for U.S. bonds, the Barclays U.S. Aggregate Float Adjusted Index; for international bonds, the Barclays Global Aggregate ex-USD Float Adjusted RIC Capped Index beginning June 3, 2013; and for U.S. stocks, the MSCI US Broad Market Index through June 2, 2013, and the CRSP US Total Market Index thereafter. International stock benchmark returns are adjusted for withholding taxes.
78
This page intentionally left blank.
The People Who Govern Your Fund
The trustees of your mutual fund are there to see that the fund is operated and managed in your best interests since, as a shareholder, you are a part owner of the fund. Your fund’s trustees also serve on the board of directors of The Vanguard Group, Inc., which is owned by the Vanguard funds and provides services to them on an at-cost basis.
A majority of Vanguard’s board members are independent, meaning that they have no affiliation with Vanguard or the funds they oversee, apart from the sizable personal investments they have made as private individuals. The independent board members have distinguished backgrounds in business, academia, and public service. Each of the trustees and executive officers oversees 181 Vanguard funds.
The following table provides information for each trustee and executive officer of the fund. More information about the trustees is in the Statement of Additional Information, which can be obtained, without charge, by contacting Vanguard at 800-662-7447, or online at vanguard.com.
| |
| InterestedTrustee1 | and Delphi Automotive LLP (automotive components); |
| | Senior Advisor at New Mountain Capital; Trustee of |
| F. William McNabb III | The Conference Board. |
| Born 1957. Trustee Since July 2009. Chairman of the | |
| Board. Principal Occupation(s) During the Past Five | Amy Gutmann |
| Years: Chairman of the Board of The Vanguard Group, | Born 1949. Trustee Since June 2006. Principal |
| Inc., and of each of the investment companies served | Occupation(s) During the Past Five Years: President |
| by The Vanguard Group, since January 2010; Director | of the University of Pennsylvania; Christopher H. |
| of The Vanguard Group since 2008; Chief Executive | Browne Distinguished Professor of Political Science |
| Officer and President of The Vanguard Group and of | in the School of Arts and Sciences with secondary |
| each of the investment companies served by The | appointments at the Annenberg School for |
| Vanguard Group since 2008; Director of Vanguard | Communication and the Graduate School of Education |
| Marketing Corporation; Managing Director of The | of the University of Pennsylvania; Member of the |
| Vanguard Group (1995–2008). | National Commission on the Humanities and Social |
| | Sciences; Trustee of Carnegie Corporation of New |
| | York and of the National Constitution Center; Chair |
| IndependentTrustees | of the U. S. Presidential Commission for the Study |
| | of Bioethical Issues. |
| Emerson U. Fullwood | |
| Born 1948. Trustee Since January 2008. Principal | |
| Occupation(s) During the Past Five Years: Executive | JoAnn Heffernan Heisen |
| Chief Staff and Marketing Officer for North America | Born 1950. Trustee Since July 1998. Principal |
| and Corporate Vice President (retired 2008) of Xerox | Occupation(s) During the Past Five Years: Corporate |
| Corporation (document management products and | Vice President and Chief Global Diversity Officer |
| services); Executive in Residence and 2010 | (retired 2008) and Member of the Executive |
| Distinguished Minett Professor at the Rochester | Committee (1997–2008) of Johnson & Johnson |
| Institute of Technology; Director of SPX Corporation | (pharmaceuticals/medical devices/consumer |
| (multi-industry manufacturing), the United Way of | products); Director of Skytop Lodge Corporation |
| Rochester, Amerigroup Corporation (managed health | (hotels), the University Medical Center at Princeton, |
| care), the University of Rochester Medical Center, | the Robert Wood Johnson Foundation, and the Center |
| Monroe Community College Foundation, and North | for Talent Innovation; Member of the Advisory Board |
| Carolina A&T University. | of the Maxwell School of Citizenship and Public Affairs |
| | at Syracuse University. |
| Rajiv L. Gupta | |
| Born 1945. Trustee Since December 2001.2 | F. Joseph Loughrey |
| Principal Occupation(s) During the Past Five Years: | Born 1949. Trustee Since October 2009. Principal |
| Chairman and Chief Executive Officer (retired 2009) | Occupation(s) During the Past Five Years: President |
| and President (2006–2008) of Rohm and Haas Co. | and Chief Operating Officer (retired 2009) of Cummins |
| (chemicals); Director of Tyco International, Ltd. | Inc. (industrial machinery); Chairman of the Board of |
| (diversified manufacturing and services), Hewlett- | Hillenbrand, Inc. (specialized consumer services) and |
| Packard Co. (electronic computer manufacturing), | of Oxfam America; Director of SKF AB (industrial |
| |
| | |
| machinery) and the Lumina Foundation for Education; | Executive Officers | |
| Member of the Advisory Council for the College of | | |
| Arts and Letters and of the Advisory Board to the | Glenn Booraem | |
| Kellogg Institute for International Studies, both at | Born 1967. Controller Since July 2010. Principal |
| the University of Notre Dame. | Occupation(s) During the Past Five Years: Principal |
| | of The Vanguard Group, Inc.; Controller of each of |
| Mark Loughridge | the investment companies served by The Vanguard |
| Born 1953. Trustee Since March 2012. Principal | Group; Assistant Controller of each of the investment |
| Occupation(s) During the Past Five Years: Senior Vice | companies served by The Vanguard Group (2001–2010). |
| President and Chief Financial Officer at IBM (information | | |
| technology services); Fiduciary Member of IBM’s | Thomas J. Higgins | |
| Retirement Plan Committee. | Born 1957. Chief Financial Officer Since September |
| | 2008. Principal Occupation(s) During the Past Five |
| Scott C. Malpass | Years: Principal of The Vanguard Group, Inc.; Chief |
| Born 1962. Trustee Since March 2012. Principal | Financial Officer of each of the investment companies |
| Occupation(s) During the Past Five Years: Chief | served by The Vanguard Group; Treasurer of each of |
| Investment Officer and Vice President at the University | the investment companies served by The Vanguard |
| of Notre Dame; Assistant Professor of Finance at the | Group (1998–2008). | |
| Mendoza College of Business at Notre Dame; Member | | |
| of the Notre Dame 403(b) Investment Committee; | Kathryn J. Hyatt | |
| Director of TIFF Advisory Services, Inc. (investment | Born 1955. Treasurer Since November 2008. Principal |
| advisor); Member of the Investment Advisory | Occupation(s) During the Past Five Years: Principal of |
| Committees of the Financial Industry Regulatory | The Vanguard Group, Inc.; Treasurer of each of the |
| Authority (FINRA) and of Major League Baseball. | investment companies served by The Vanguard |
| | Group; Assistant Treasurer of each of the investment |
| André F. Perold | companies served by The Vanguard Group (1988–2008). |
| Born 1952. Trustee Since December 2004. Principal | | |
| Occupation(s) During the Past Five Years: George | Heidi Stam | |
| Gund Professor of Finance and Banking at the Harvard | Born 1956. Secretary Since July 2005. Principal |
| Business School (retired 2011); Chief Investment | Occupation(s) During the Past Five Years: Managing |
| Officer and Managing Partner of HighVista Strategies | Director of The Vanguard Group, Inc.; General Counsel |
| LLC (private investment firm); Director of Rand | of The Vanguard Group; Secretary of The Vanguard |
| Merchant Bank; Overseer of the Museum of Fine | Group and of each of the investment companies |
| Arts Boston. | served by The Vanguard Group; Director and Senior |
| | Vice President of Vanguard Marketing Corporation. |
| Alfred M. Rankin, Jr. | | |
| Born 1941. Trustee Since January 1993. Principal | Vanguard Senior ManagementTeam | |
| Occupation(s) During the Past Five Years: Chairman, | | |
| President, and Chief Executive Officer of NACCO | Mortimer J. Buckley | Chris D. McIsaac |
| Industries, Inc. (housewares/lignite) and of Hyster-Yale | Kathleen C. Gubanich | Michael S. Miller |
| Materials Handling, Inc. (forklift trucks); Director of | Paul A. Heller | James M. Norris |
| the National Association of Manufacturers; Chairman | Martha G. King | Glenn W. Reed |
| of the Board of University Hospitals of Cleveland; | John T. Marcante | |
| Advisory Chairman of the Board of The Cleveland | | |
| Museum of Art. | | |
| | Chairman Emeritus and Senior Advisor |
| Peter F. Volanakis | | |
| | | |
| Born 1955. Trustee Since July 2009. Principal | John J. Brennan | |
| Occupation(s) During the Past Five Years: President | Chairman, 1996–2009 | |
| and Chief Operating Officer (retired 2010) of Corning | Chief Executive Officer and President, 1996–2008 | |
| Incorporated (communications equipment); Director | | |
| of SPX Corporation (multi-industry manufacturing); | Founder | |
| Overseer of the Amos Tuck School of Business | | |
| Administration at Dartmouth College; Advisor to the | John C. Bogle | |
| Norris Cotton Cancer Center. | Chairman and Chief Executive Officer, 1974–1996 | |
| | |
| | |
1 Mr. McNabb is considered an “interested person,” as defined in the Investment Company Act of 1940, because he is an officer of the Vanguard funds.
2 December 2002 for Vanguard Equity Income Fund, Vanguard Growth Equity Fund, the Vanguard Municipal Bond Funds, and the Vanguard State Tax-Exempt Funds.
|  |
| P.O. Box 2600 |
| Valley Forge, PA 19482-2600 |
Connect with Vanguard® > vanguard.com
| |
| Fund Information > 800-662-7447 | |
| Direct Investor Account Services > 800-662-2739 | |
| Institutional Investor Services > 800-523-1036 | |
| Text Telephone for People | |
| With Hearing Impairment > 800-749-7273 | |
| |
| This material may be used in conjunction | |
| with the offering of shares of any Vanguard | |
| fund only if preceded or accompanied by | |
| the fund’s current prospectus. | |
| |
| All comparative mutual fund data are from Lipper, a | |
| Thomson Reuters Company, or Morningstar, Inc., unless | |
| otherwise noted. | |
| |
| You can obtain a free copy of Vanguard’s proxy voting | |
| guidelines by visiting vanguard.com/proxyreporting or by | |
| calling Vanguard at 800-662-2739. The guidelines are | |
| also available from the SEC’s website, sec.gov. In | |
| addition, you may obtain a free report on how your fund | |
| voted the proxies for securities it owned during the 12 | |
| months ended June 30. To get the report, visit either | |
| vanguard.com/proxyreporting or sec.gov. | |
| |
| You can review and copy information about your fund at | |
| the SEC’s Public Reference Room in Washington, D.C. To | |
| find out more about this public service, call the SEC at | |
| 202-551-8090. Information about your fund is also | |
| available on the SEC’s website, and you can receive | |
| copies of this information, for a fee, by sending a | |
| request in either of two ways: via e-mail addressed to | |
| publicinfo@sec.gov or via regular mail addressed to the | |
| Public Reference Section, Securities and Exchange | |
| Commission, Washington, DC 20549-1520. | |
| |
| | © 2013 The Vanguard Group, Inc. |
| | All rights reserved. |
| | Vanguard Marketing Corporation, Distributor. |
| |
| | Q3080B 112013 |
Item 2: Code of Ethics. The Registrant has adopted a code of ethics that applies to the Registrant’s principal executive officer, principal financial officer, principal accounting officer or controller or persons performing similar functions. The Code of Ethics was amended during the reporting period covered by this report to make certain technical, non-material changes.
Item 3: Audit Committee Financial Expert. The following members of the Audit Committee have been determined by the Registrant’s Board of Trustees to be Audit Committee Financial Experts serving on its Audit Committee, and to be independent: Rajiv L. Gupta, Amy Gutmann, JoAnn Heffernan Heisen, F. Joseph Loughrey, Mark Loughridge, Scott C. Malpass, André F. Perold, and Alfred M. Rankin, Jr.
Item 4: Principal Accountant Fees and Services.
(a) Audit Fees.
Audit Fees of the Registrant
Fiscal Year Ended September 30, 2013: $287,000 Fiscal Year Ended September 30, 2012: $204,000
Aggregate Audit Fees of Registered Investment Companies in the Vanguard Group.
Fiscal Year Ended September 30, 2013: $5,714,113
Fiscal Year Ended September 30, 2012: $4,809,780
Includes fees billed in connection with audits of the Registrant and other registered investment companies in the Vanguard complex. Also includes fees billed in connection with audits of The Vanguard Group, Inc. and Vanguard Marketing Corporation for Fiscal Year Ended September 30, 2013.
(b) Audit-Related Fees.
Fiscal Year Ended September 30, 2013: $1,552,950
Fiscal Year Ended September 30, 2012: $1,812,565
Includes fees billed in connection with assurance and related services provided to the Registrant, other registered investment companies in the Vanguard complex, The Vanguard Group, Inc., and Vanguard Marketing Corporation.
(c) Tax Fees.
Fiscal Year Ended September 30, 2013: $110,000
Fiscal Year Ended September 30, 2012: $490,518
Includes fees billed in connection with tax compliance, planning, and advice services provided to the Registrant, other registered investment companies in the Vanguard complex, The Vanguard Group, Inc., and Vanguard Marketing Corporation. Also includes fees billed in connection with certain tax services related to audits of the Registrant and other registered investment companies in the Vanguard complex for Fiscal Year Ended September 30, 2012.
(d) All Other Fees.
Fiscal Year Ended September 30, 2013: $132,000
Fiscal Year Ended September 30, 2012: $16,000
Includes fees billed in connection with tax compliance, planning, and advice services provided to the Registrant, other registered investment companies in the Vanguard complex, The Vanguard Group, Inc., and Vanguard Marketing Corporation.
(e) (1) Pre-Approval Policies. The policy of the Registrant’s Audit Committee is to consider and, if appropriate, approve before the principal accountant is engaged for such services, all specific audit and non-audit services provided to: the Registrant, other registered investment companies in the Vanguard complex, The Vanguard Group, Inc., and entities controlled by The Vanguard Group, Inc. that provide ongoing services to the Registrant. In making a determination, the Audit Committee considers whether the services are consistent with maintaining the principal accountant’s independence.
In the event of a contingency situation in which the principal accountant is needed to provide services in between scheduled Audit Committee meetings, the Chairman of the Audit Committee would be called on to consider and, if appropriate, pre-approve audit or permitted non-audit services in an amount sufficient to complete services through the next Audit Committee meeting, and to determine if such services would be consistent with maintaining the accountant’s independence. At the next scheduled Audit Committee meeting, services and fees would be presented to the Audit Committee for formal consideration, and, if appropriate, approval by the entire Audit Committee. The Audit Committee would again consider whether such services and fees are consistent with maintaining the principal accountant’s independence.
The Registrant’s Audit Committee is informed at least annually of all audit and non-audit services provided by the principal accountant to the Vanguard complex, whether such services are provided to: the Registrant, other registered investment companies in the Vanguard complex, The Vanguard Group, Inc., or other entities controlled by The Vanguard Group, Inc. that provide ongoing services to the Registrant.
(2) No percentage of the principal accountant’s fees or services were approved pursuant to the waiver provision of paragraph (c)(7)(i)(C) of Rule 2-01 of Regulation S-X.
(f) For the most recent fiscal year, over 50% of the hours worked under the principal accountant’s engagement were not performed by persons other than full-time, permanent employees of the principal accountant.
(g) Aggregate Non-Audit Fees.
Fiscal Year Ended September 30, 2013: $242,000
Fiscal Year Ended September 30, 2012: $506,518
Includes fees billed for non-audit services provided to the Registrant, other registered investment companies in the Vanguard complex, The Vanguard Group, Inc., and Vanguard Marketing Corporation.
(h) For the most recent fiscal year, the Audit Committee has determined that the provision of all non-audit services was consistent with maintaining the principal accountant’s independence.
Item 5: Audit Committee of Listed Registrants.
Not Applicable.
Item 6: Investments.
Not Applicable.
Item 7: Disclosure of Proxy Voting Policies and Procedures for Closed-End Management Investment Companies.
Not Applicable.
Item 8: Portfolio Managers of Closed-End Management Investment Companies.
Not Applicable.
Item 9: Purchase of Equity Securities by Closed-End Management Investment Company and Affiliated Purchasers.
Not Applicable.
Item 10: Submission of Matters to a Vote of Security Holders.
Not Applicable.
Item 11: Controls and Procedures.
(a) Disclosure Controls and Procedures. The Principal Executive and Financial Officers concluded that the Registrant’s Disclosure Controls and Procedures are effective based on their evaluation of the Disclosure Controls and Procedures as of a date within 90 days of the filing date of this report.
(b) Internal Control Over Financial Reporting. There were no significant changes in Registrant’s Internal Control Over Financial Reporting or in other factors that could significantly affect this control subsequent to the date of the evaluation, including any corrective actions with regard to significant deficiencies and material weaknesses.
Item 12: Exhibits.
(a) Code of Ethics.
(b) Certifications.
Pursuant to the requirements of the Securities Exchange Act of 1934 and the Investment Company Act of 1940, the registrant has duly caused this report to be signed on its behalf by the undersigned, thereunto duly authorized.
| |
| | VANGUARD CHESTER FUNDS |
| |
| By: | /s/ F. WILLIAM MCNABB III* |
| | F. WILLIAM MCNABB III |
| | CHIEF EXECUTIVE OFFICER |
| |
| Date: November 15, 2013 |
Pursuant to the requirements of the Securities Exchange Act of 1934 and the Investment Company Act of 1940, this report has been signed below by the following persons on behalf of the registrant and in the capacities and on the dates indicated.
| |
| | VANGUARD CHESTER FUNDS |
| |
| By: | /s/ F. WILLIAM MCNABB III* |
| | F. WILLIAM MCNABB III |
| | CHIEF EXECUTIVE OFFICER |
| |
| Date: November 15, 2013 |
| |
| | VANGUARD CHESTER FUNDS |
| |
| By: | /s/ THOMAS J. HIGGINS* |
| | THOMAS J. HIGGINS |
| | CHIEF FINANCIAL OFFICER |
| |
| Date: November 15, 2013 |
* By: /s/ Heidi Stam
Heidi Stam, pursuant to a Power of Attorney filed on March 27, 2012 see file Number 2-11444, Incorporated by Reference.