UNITED STATES
SECURITIES AND EXCHANGE COMMISSION
Washington, D.C. 20549
FORM N-CSR
CERTIFIED SHAREHOLDER REPORT
OF
REGISTERED MANAGEMENT INVESTMENT COMPANIES
Investment Company Act file number: 811-4098
Name of Registrant: Vanguard Chester Funds
Address of Registrant:
P.O. Box 2600
Valley Forge, PA 19482
Name and address of agent for service:
Heidi Stam, Esquire
P.O. Box 876
Valley Forge, PA 19482
Registrant’s telephone number, including area code: (610) 669-1000
Date of fiscal year end: September 30
Date of reporting period: October 1, 2010 – September 30, 2011
Item 1: Reports to Shareholders
 |
| Annual Report | September 30, 2011 |
| Vanguard PRIMECAP Fund |
> Vanguard PRIMECAP Fund returned about –1% in the 2011 fiscal year, trailing the return of the benchmark Standard & Poor’s 500 Index but slightly exceeding the average return of peer funds.
> The fund had disappointing results in information technology, its largest sector, but benefited from the advisor’s stock selections in health care and from having minimal exposure to the troubled financial sector.
> The fund remained significantly ahead of its comparative standards in performance for the decade ended September 30, 2011.
| |
| Contents | |
| Your Fund’s Total Returns. | 1 |
| Chairman’s Letter. | 2 |
| Advisor’s Report. | 8 |
| Fund Profile. | 11 |
| Performance Summary. | 12 |
| Financial Statements. | 14 |
| Your Fund’s After-Tax Returns. | 26 |
| About Your Fund’s Expenses. | 27 |
| Trustees Approve Advisory Agreement. | 29 |
| Glossary. | 30 |
The figures shown represent past performance, which is not a guarantee of future results. (Current performance may be lower or higher than the performance data cited. For performance data current to the most recent month-end, visit our website at vanguard.com/performance.)
Please note: The opinions expressed in this report are just that—informed opinions. They should not be considered promises or advice. Also, please keep in mind that the information and opinions cover the period through the date on the front of this report. Of course, the risks of investing in your fund are spelled out in the prospectus.
See the Glossary for definitions of investment terms used in this report.
About the cover: Vanguard was named for the HMS Vanguard, flagship of British Admiral Horatio Nelson. A ship—whose performance and safety depend on the work of all hands—has served as a fitting metaphor for the Vanguard crew as we strive to help clients reach their financial goals.
Your Fund’s Total Returns
| |
| Fiscal Year Ended September 30, 2011 | |
| |
| | Total |
| | Returns |
| Vanguard PRIMECAP Fund | |
| Investor Shares | -1.23% |
| Admiral™ Shares | -1.14 |
| S&P 500 Index | 1.14 |
| Multi-Cap Growth Funds Average | -1.49 |
| Multi-Cap Growth Funds Average: Derived from data provided by Lipper Inc. | |
| Admiral Shares carry lower expenses and are available to investors who meet certain account-balance requirements. | |
| | | | |
| Your Fund’s Performance at a Glance | | | | |
| September 30, 2010 , Through September 30, 2011 | | | | |
| | | | Distributions Per Share |
| | Starting | Ending | Income | Capital |
| | Share Price | Share Price | Dividends | Gains |
| Vanguard PRIMECAP Fund | | | | |
| Investor Shares | $60.36 | $58.46 | $0.614 | $0.671 |
| Admiral Shares | 62.65 | 60.69 | 0.683 | 0.696 |
1

Chairman’s Letter
Dear Shareholder,
Vanguard PRIMECAP Fund, like the broad U.S. stock market, had solid results in the first half of the fiscal year, but then retreated in the second half amid intensifying concerns about the economic outlook, both domestically and internationally.
For the 12 months ended September 30, 2011, the fund returned –1.23% for Investor Shares and –1.14% for Admiral Shares. Though the returns trailed the return of the benchmark Standard & Poor’s 500 Index, which notched a gain of about 1%, they slightly exceeded the average return of multi-capitalization growth funds.
Although the returns of the fund and its comparative standards didn’t differ greatly for the past year, the longer-term record shows a significant divergence—to the benefit of the fund’s shareholders. You can see that record in the table on page 5.
One major source of that divergence is the distinctive investment strategy of the fund’s advisor, PRIMECAP Management Company. The managers are willing to concentrate assets where they believe opportunity exists. Perhaps the most notable examples of this approach are their outsized investments in information technology and health care.
2
The fund’s strategy has been rewarding over the long term, but it can lead to significant year-to-year variations in performance. Indeed, we saw marked variation within the past fiscal year. Through the first six months, the fund’s technology stocks turned in impressive gains amid optimism that business investment was set to pick up. As the economic indicators turned negative in the second half, tech stocks reversed course. By contrast, health care was one of the weakest sectors early on, but it gained ground in the second half of the fiscal year, benefiting from the perception that health care is insulated from changes in demand tied to the economy.
Although there are inevitably ups and downs for both sectors, your fund’s advisor remains consistent in its view that the significant investments in health care and information technology offer the potential for achieving higher returns than the overall market will produce.
If you hold fund shares in a taxable account, you may wish to review the table of after-tax returns, based on the highest federal income tax bracket, that appears later in this report.
A swift change in sentiment weighed on stock prices
Global stock markets rallied through the first half of the fiscal year as corporate earnings surged and the economic recovery seemed to be gathering steam.
| | | |
| Market Barometer | | | |
| |
| | | Average Annual Total Returns |
| | | Periods Ended September 30, 2011 |
| | One | Three | Five |
| | Year | Years | Years |
| Stocks | | | |
| Russell 1000 Index (Large-caps) | 0.91% | 1.61% | -0.91% |
| Russell 2000 Index (Small-caps) | -3.53 | -0.37 | -1.02 |
| Dow Jones U.S. Total Stock Market Index | 0.31 | 1.75 | -0.57 |
| MSCI All Country World Index ex USA (International) | -10.81 | 0.52 | -1.57 |
| |
| Bonds | | | |
| Barclays Capital U.S. Aggregate Bond Index (Broad | | | |
| taxable market) | 5.26% | 7.97% | 6.53% |
| Barclays Capital Municipal Bond Index (Broad | | | |
| tax-exempt market) | 3.88 | 8.08 | 5.01 |
| Citigroup Three-Month U.S. Treasury Bill Index | 0.11 | 0.19 | 1.61 |
| |
| CPI | | | |
| Consumer Price Index | 3.87% | 1.22% | 2.26% |
3
In the second half, as I noted earlier, stock prices tumbled as economic indicators took a turn for the worse and U.S. and European policymaking strife dominated the headlines. (Standard & Poor’s, the ratings agency, downgraded the U.S. credit rating, in large part because of the political gridlock on display during the debt-ceiling debate. Vanguard’s confidence in the “full faith and credit” of the U.S. Treasury remains unshaken.)
The U.S. stock market’s second-half weakness offset its first-half strength. The broad market returned 0.31% for the full 12 months. International stocks, which gained less at the start of the year and lost more at the end, returned –10.81% in U.S. dollars.
Bond prices rallied as optimism faded
The stock market’s pattern of strength and weakness was inverted in the bond market. Early in the year, bond prices retreated, consistent with investor optimism about economic growth. Later in the year, as optimism gave way to anxiety, bond prices surged, driving yields to remarkable lows. At the end of September, the yield of the 10-year U.S. Treasury note, a benchmark for longer-term interest rates, stood at 1.93%.
Bond indexes recorded impressive returns, though it’s worth noting that shrinking yields imply lower returns on prospective investments.
| | | |
| Expense Ratios | | | |
| Your Fund Compared With Its Peer Group | | | |
| | Investor | Admiral | Peer Group |
| | Shares | Shares | Average |
| PRIMECAP Fund | 0.45% | 0.36% | 1.45% |
The fund expense ratios shown are from the prospectus dated January 26, 2011, and represent estimated costs for the current fiscal year. For the fiscal year ended September 30, 2011, the fund’s expense ratios were 0.45% for Investor Shares and 0.36% for Admiral Shares. The peer-group expense ratio is derived from data provided by Lipper Inc. and captures information through year-end 2010.
Peer group: Multi-Cap Growth Funds.
4
The yields of money market instruments hovered near zero, as they have since December 2008, when the Federal Reserve cut its target for short-term interest rates to between 0% and 0.25%. Toward the end of the period, the Fed indicated that it expected to maintain this exceptionally low target at least through mid-2013.
Three key themes in the fund produced mixed results
The key investment themes that have framed the advisor’s strategy in recent years remain unchanged: a strong belief in the exceptional long-term growth prospects for technology stocks, a similar belief regarding health care stocks, and a wariness about the financial sector.
In the 2011 fiscal year, two of those themes—emphasis on health care and wariness about the financial sector—supported the fund’s performance. But information technology, which accounted for, on average, about 30% of portfolio assets, was a weak spot. Company-specific setbacks for some of the fund’s long-term tech holdings led to a lackluster sector return that trailed the performance of the broader technology sector in the benchmark index. Some of the tech companies in the fund were perceived as suffering, at least in the near term, from changing consumer tastes in smartphones and tablet computers.
Also detracting from performance were the industrial and energy sectors. Airlines and other transportation-related holdings
| |
| Total Returns | |
| Ten Years Ended September 30, 2011 | |
| | Average |
| | Annual Return |
| PRIMECAP Fund Investor Shares | 6.14% |
| S&P 500 Index | 2.82 |
| Multi-Cap Growth Funds Average | 3.08 |
| Multi-Cap Growth Funds Average: Derived from data provided by Lipper Inc. | |
The figures shown represent past performance, which is not a guarantee of future results. (Current performance may be lower or higher than the performance data cited. For performance data current to the most recent month-end, visit our website at vanguard.com/performance.) Note, too, that both investment returns and principal value can fluctuate widely, so an investor’s shares, when sold, could be worth more or less than their original cost.
5
in the industrial sector were hit hard by concerns that a sagging economy would hurt their businesses. The energy sector was a laggard for the fund because some of the largest integrated oil companies, which were up sharply for this period, are absent from the portfolio.
Health care, meanwhile, was a bright spot. Here, strong stock selection allowed the fund to outperform the benchmark. And as noted earlier, the fund also benefited from the advisor’s longstanding aversion to the financial sector, which was the worst-performing sector in the benchmark index. Many financial services firms continue to face deep problems, from the lingering effects of mortgage defaults and home foreclosures to concerns about the repercussions of the European debt crisis.
The financial stocks that PRIMECAP Fund did own performed well overall. These holdings were largely insurance firms, outside of the struggling banking industry.
For more on the advisor’s strategy and outlook, please see the Advisor’s Report following this letter.
The fund’s distinctive style has led to strong long-term results
Because of the advisor’s long-term focus, the fund’s record in any single year won’t tell the full story. Evaluating performance over a decade can provide more insight into whether the advisor has been successful. For the ten years ended September 30, 2011, PRIMECAP Fund outperformed both its benchmark’s results and the average return for its peer funds.
The decade was challenging, marked at the beginning by the demise of the technology bubble and at the end by fallout from the Great Recession. Still, the advisor’s bottom-up research and disciplined approach to investing have helped to deliver gains for shareholders despite the turmoil. PRIMECAP Management seeks to identify reasonably priced stocks of companies that appear to have strong growth prospects. Once the fund managers find a stock they consider promising, they tend to invest with patience and conviction. It’s typical for the fund’s ten largest holdings to represent more than one-third of the portfolio.
In addition to the advisor’s stewardship, fund shareholders have benefited from relatively low investment expenses. Keeping costs low, of course, helps shareholders keep more of their returns.
A fund built on shared faith in long-term investing
Philosophically, Vanguard and PRIMECAP Management Company share a commitment to long-term investing.
As individuals, it’s not always easy for us to keep a long-term perspective in the face of day-to-day events that seem dramatic. In the past few months, some of the anxiety of 2008 has returned to the
6
markets, with dire headlines about debt troubles in Europe and stubbornly high unemployment in the United States.
Feeling strong emotions—anxiety, confusion, and frustration—in the face of these events is natural. Still, our experience with tough situations tells us that the best course for most investors is to stick with a sensible, long-term asset allocation that’s in keeping with their personal goals and their tolerance for risk.
Vanguard PRIMECAP Fund can play an important role in such a portfolio. The advisor’s patient and disciplined approach can help you stay the course and reach your investment goals.
Thank you for entrusting your assets to Vanguard.
Sincerely,

F. William McNabb III
Chairman and Chief Executive Officer
October 12, 2011
7
Advisor’s Report
For the fiscal year ended September 30, 2011, Vanguard PRIMECAP Fund’s total returns of –1.23% for Investor Shares and –1.14% for Admiral Shares trailed the 1.14% gain of the unmanaged Standard & Poor’s 500 Index but slightly exceeded the –1.49% average return of competing multi-cap growth funds.
The investment environment
Led by energy, materials, and industrial stocks, the S&P 500 Index gained more than 16% in the first half of the fiscal year. By midyear, however, confidence in the U.S. economic recovery began to falter, and concern regarding the European sovereign-debt crisis and its potential ramifications for the global financial system weighed on financial markets. In response, stock prices fell precipitously in the last fiscal quarter, reversing nearly all of the earlier gains. The S&P 500’s return for the full year was slightly less than its dividend yield.
The U.S. economy’s recovery from the recession has unquestionably slowed, as evidenced by moderating growth in gross domestic product and consumer spending. Unemployment remains stubbornly high, and the housing market has failed to show any meaningful improvement. Despite these unsettling developments, industrial production continues to grow, and corporations are generating profit margins and returns on capital well above historical averages.
Management of the fund
Despite the subpar results for this past fiscal year, our investment approach remains consistent. We rely on fundamental research to identify companies whose revenues and earnings will, in our opinion, grow more rapidly over a three-to-five-year time frame than current valuations might suggest. We seek to capitalize on situations in which the fundamental value of a company significantly exceeds its current market value.
This investment strategy has led us to build and maintain significant investments in information technology and health care companies that we believe offer the potential for higher returns than the overall market will produce. These two sectors account for slightly more than half of the fund’s holdings (versus about 30% for the S&P 500 Index). Nine of the fund’s ten largest holdings are health care or information technology stocks.
Technology
Our holdings in the information technology sector hurt the fund’s results. Research In Motion (–58.3%), Hewlett-Packard (–46.0%), and Corning (–31.7%) were among the biggest decliners. Research In Motion, a new holding in the fund, suffered from concerns over its loss of market share in U.S. smartphones and delays in the development of its next-generation QNX operating system. Notwithstanding the company’s struggles in the United
8
States, we believe there is significant value in the stock at current levels, given the recurring nature of the company’s services revenue and its strong position in rapidly growing markets in Latin America and Asia.
Hewlett-Packard stock fell as investors questioned the scale and timing of several strategic decisions announced by management, including a large acquisition, the potential spin-off of the company’s personal computer business, and its exit from the tablet computer market just months after the launch of its first tablet. In September, the company appointed a new chief executive officer, its fourth in six years. Corning, the leading manufacturer of display glass used in flat-screen televisions, lowered its sales forecast as its largest customers reduced production in anticipation of weaker consumer demand during the upcoming holiday season.
We remain enthusiastic about investment opportunities in the tech sector. The explosive growth in smartphones and tablet computers, the emergence of “the cloud” as the new data center, and the popularity of social networks are spawning entirely new business opportunities and driving higher demand for semiconductors, computer hardware, and storage. In addition, as wireless networks evolve to support higher data transmission capacity and faster speeds, the use of mobile platforms for search, advertising, and commerce is increasing. Some of the largest holdings in the portfolio, such as Google, Qualcomm, Texas Instruments, Oracle, and Microsoft, are well-positioned to capitalize on these trends. These companies are also trading at attractive valuations and have strong balance sheets.
Health care
The fund’s health care stocks boosted overall performance, with two of our largest holdings—Biogen Idec (+66.0%) and Roche Holding AG (+23.7%)—among the biggest gainers. Biogen Idec reported favorable results from studies of its new oral drug to treat multiple sclerosis, while Roche received regulatory approval for new drugs to treat melanoma and lung cancer. Life Technologies (–17.7%) was the biggest decliner among the fund’s holdings in the sector.
We built considerable positions in large pharmaceutical, biotechnology, and medical device companies based on the view that growth in revenues and earnings derived from new products, an aging global population, and growing demand in emerging markets would more than offset any loss in earnings from patent expirations. Following a period of considerable political and regulatory challenges, we are encouraged by the uptick in new drug approvals by the U.S. Food and Drug Administration in the past year. We continue to believe that the pharmaceutical, biotechnology, and medical device products currently in development represent real advances in the treatment of diseases such as
9
Alzheimer’s, diabetes, and cancer. The aging of populations in the United States, Europe, and Japan, along with rising standards of living in developing markets such as China and India, should lead to greater demand for health care products.
Financials
In performance relative to the benchmark, the fund benefited from having minimal exposure to the financial sector. This was the worst-performing sector in the S&P 500 Index by a considerable margin. In general, we continue to view the outlook for financial stocks as negative. Prior to the recent financial crisis, banks had enjoyed 15 years of above-average profitability. In our opinion, the combination of increased regulatory and compliance costs, higher capital requirements, and a reassessment of credit risk will constrain banks’ earnings going forward.
Outlook
As we enter fiscal year 2012, U.S. equities look attractive in our judgment, particularly in light of the significant decline in stock prices in the last fiscal quarter. In the sectors that have the largest portfolio weightings, especially information technology and health care, we find the valuations compelling. Moreover, many of the fund’s holdings in these sectors have very strong balance sheets and generate significant free cash flow.
Over the last decade, the greatest returns among U.S. stocks were concentrated in the energy and materials sectors. Driven by rapidly growing demand from China, India, Brazil, and other emerging economies, prices for commodities such as oil, copper, and corn have soared, generating large profits and high valuations for companies in these industries. In our opinion, and contrary to conventional wisdom, this trend is unsustainable. Conversely, the information technology and health care sectors have endured a decade of shrinking valuation measures, such as price-to-earning ratios, as investors questioned the long-term growth prospects and earnings potential of companies in these sectors. As noted, we believe the fundamental outlook for many companies in both sectors is promising. We also think our investment case is supported by compelling valuations and very strong balance sheets.
Over the history of the PRIMECAP Fund, we have tended to find the greatest opportunities in downtrodden stocks and sectors where others often have perceived the greatest risks. Similarly, we frequently consider the risks to be greatest in stocks and sectors that are viewed most favorably by the consensus. We believe this approach has been a key driver of the fund’s long-term results.
PRIMECAP Management Company
October 12, 2011
10
PRIMECAP Fund
Fund Profile
As of September 30, 2011
| | |
| Share-Class Characteristics | |
| | Investor | Admiral |
| | Shares | Shares |
| Ticker Symbol | VPMCX | VPMAX |
| Expense Ratio1 | 0.45% | 0.36% |
| 30-Day SEC Yield | 1.34% | 1.43% |
| | | |
| Portfolio Characteristics | | |
| | | | DJ |
| | | | U.S. Total |
| | | S&P 500 | Market |
| | Fund | Index | Index |
| Number of Stocks | 115 | 500 | 3,717 |
| Median Market Cap | $34.6B | $45.5B | $28.7B |
| Price/Earnings Ratio | 13.5x | 12.9x | 13.6x |
| Price/Book Ratio | 2.3x | 1.9x | 1.9x |
| Return on Equity | 23.1% | 20.3% | 19.1% |
| Earnings Growth Rate | 8.7% | 7.4% | 7.3% |
| Dividend Yield | 1.9% | 2.4% | 2.2% |
| Foreign Holdings | 14.7% | 0.0% | 0.0% |
| Turnover Rate | 8% | — | — |
| Short-Term Reserves | 1.8% | — | — |
| | | |
| Sector Diversification (% of equity exposure) |
| | | | DJ |
| | | | U.S. Total |
| | | S&P 500 | Market |
| | Fund | Index | Index |
| Consumer | | | |
| Discretionary | 9.9% | 10.6% | 12.2% |
| Consumer Staples | 1.2 | 11.8 | 11.0 |
| Energy | 6.4 | 11.6 | 10.3 |
| Financials | 4.3 | 13.6 | 14.3 |
| Health Care | 26.7 | 12.1 | 11.7 |
| Industrials | 14.8 | 10.3 | 10.6 |
| Information | | | |
| Technology | 31.1 | 19.4 | 19.4 |
| Materials | 5.2 | 3.3 | 4.0 |
| Telecommunication | | | |
| Services | 0.1 | 3.3 | 2.8 |
| Utilities | 0.3 | 4.0 | 3.7 |
| | |
| Volatility Measures | | |
| | | DJ |
| | | U.S. Total |
| | S&P 500 | Market |
| | Index | Index |
| R-Squared | 0.96 | 0.97 |
| Beta | 1.00 | 0.97 |
These measures show the degree and timing of the fund’s fluctuations compared with the indexes over 36 months.
| | |
| Ten Largest Holdings (% of total net assets) |
| Amgen Inc. | Biotechnology | 4.8% |
| Biogen Idec Inc. | Biotechnology | 4.5 |
| Eli Lilly & Co. | Pharmaceuticals | 3.8 |
| Google Inc. Class A | Internet Software & | |
| | Services | 3.6 |
| Roche Holding AG | Pharmaceuticals | 3.6 |
| Texas Instruments Inc. | Semiconductors | 3.5 |
| Novartis AG ADR | Pharmaceuticals | 3.4 |
| Oracle Corp. | Systems Software | 3.4 |
| FedEx Corp. | Air Freight & | |
| | Logistics | 3.3 |
| Microsoft Corp. | Systems Software | 3.0 |
| Top Ten | | 36.9% |
The holdings listed exclude any temporary cash investments and equity index products.
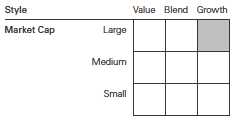
Investment Focus
1 The expense ratios shown are from the prospectus dated January 26, 2011, and represent estimated costs for the current fiscal year. For the fiscal year ended September 30, 2011, the expense ratios were 0.45% for Investor Shares and 0.36% for Admiral Shares.
11
PRIMECAP Fund
Performance Summary
All of the returns in this report represent past performance, which is not a guarantee of future results that may be achieved by the fund. (Current performance may be lower or higher than the performance data cited. For performance data current to the most recent month-end, visit our website at vanguard.com/performance.) Note, too, that both investment returns and principal value can fluctuate widely, so an investor’s shares, when sold, could be worth more or less than their original cost. The returns shown do not reflect taxes that a shareholder would pay on fund distributions or on the sale of fund shares.
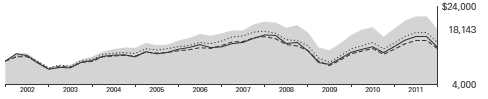
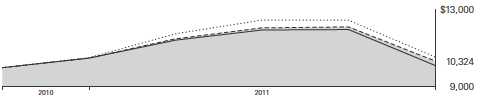
Cumulative Performance: September 30, 2001, Through September 30, 2011
Initial Investment of $10,000
| | | | |
| | Average Annual Total Returns | |
| | Periods Ended September 30, 2011 | |
| | | | | Final Value |
| | One | Five | Ten | of a $10,000 |
| | Year | Years | Years | Investment |
| PRIMECAP Fund Investor Shares | -1.23% | 1.18% | 6.14% | $18,143 |
| Dow Jones U.S. Total Stock Market | | | | |
| Index | 0.31 | -0.57 | 3.93 | 14,709 |
| S&P 500 Index | 1.14 | -1.18 | 2.82 | 13,200 |
| Multi-Cap Growth Funds Average | -1.49 | -0.17 | 3.08 | 13,544 |
| Multi-Cap Growth Funds Average: Derived from data provided by Lipper Inc. | | | |
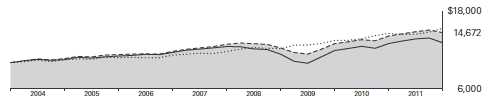
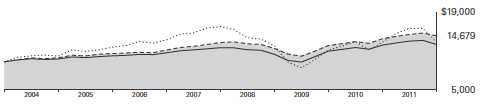
| | | | |
| | | | Since | Final Value |
| | One | Five | Inception | of a $50,000 |
| | Year | Years | (11/12/2001) | Investment |
| PRIMECAP Fund Admiral Shares | -1.14% | 1.29% | 5.26% | $82,975 |
| Dow Jones U.S. Total Stock Market | | | | |
| Index | 0.31 | -0.57 | 3.20 | 68,246 |
| S&P 500 Index | 1.14 | -1.18 | 2.09 | 61,341 |
| "Since Inception" performance is calculated from the Admiral Shares’ inception date for both the fund and its comparative standards. |
Vanguard fund returns do not reflect the 1% fee on redemptions of shares held for less than one year.
See Financial Highlights for dividend and capital gains information.
12
PRIMECAP Fund
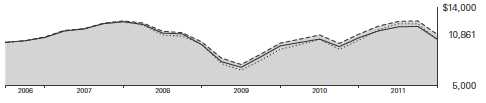
Fiscal-Year Total Returns (%): September 30, 2001, Through September 30, 2011
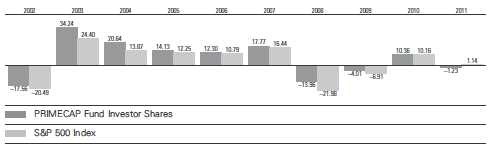
Vanguard fund returns do not reflect the 1% fee on redemptions of shares held for less than one year.
13
PRIMECAP Fund
Financial Statements
Statement of Net Assets
As of September 30, 2011
The fund reports a complete list of its holdings in regulatory filings four times in each fiscal year, at the quarter-ends. For the second and fourth fiscal quarters, the lists appear in the fund’s semiannual and annual reports to shareholders. For the first and third fiscal quarters, the fund files the lists with the Securities and Exchange Commission on Form N-Q. Shareholders can look up the fund’s Forms N-Q on the SEC’s website at sec.gov. Forms N-Q may also be reviewed and copied at the SEC’s Public Reference Room (see the back cover of this report for further information).
| | | |
| | | | Market |
| | | | Value |
| | | Shares | ($000) |
| Common Stocks (98.4%) | | |
| Consumer Discretionary (9.7%) | |
| * | DIRECTV Class A | 14,894,562 | 629,295 |
| * | Amazon.com Inc. | 2,070,000 | 447,596 |
| 1 | Whirlpool Corp. | 5,900,000 | 294,469 |
| | TJX Cos. Inc. | 3,450,000 | 191,372 |
| ^ | Sony Corp. ADR | 9,750,000 | 185,250 |
| * | Bed Bath & Beyond Inc. | 3,000,775 | 171,974 |
| | Walt Disney Co. | 5,310,000 | 160,150 |
| | Carnival Corp. | 4,344,200 | 131,629 |
| | Limited Brands Inc. | 3,158,193 | 121,622 |
| | Mattel Inc. | 4,247,800 | 109,976 |
| | Lowe’s Cos. Inc. | 1,000,000 | 19,340 |
| | Kohl’s Corp. | 300,000 | 14,730 |
| | | | 2,477,403 |
| Consumer Staples (1.2%) | | |
| | Costco Wholesale Corp. | 2,850,000 | 234,042 |
| | Procter & Gamble Co. | 510,000 | 32,222 |
| | Kellogg Co. | 448,000 | 23,829 |
| | PepsiCo Inc. | 169,000 | 10,461 |
| | CVS Caremark Corp. | 250,000 | 8,395 |
| | Kraft Foods Inc. | 40,000 | 1,343 |
| | | | 310,292 |
| Energy (6.3%) | | |
| | Noble Energy Inc. | 6,146,500 | 435,172 |
| | EOG Resources Inc. | 3,816,000 | 270,974 |
| | Schlumberger Ltd. | 3,682,200 | 219,938 |
| | Hess Corp. | 3,800,000 | 199,348 |
| | Peabody Energy Corp. | 4,000,000 | 135,520 |
| | Petroleo Brasileiro SA | | |
| | ADR Type A | 6,073,800 | 125,849 |
| | Cenovus Energy Inc. | 1,994,476 | 61,250 |
| | National Oilwell Varco Inc. | 1,038,000 | 53,166 |
| | Encana Corp. | 2,390,000 | 45,912 |
| * | Southwestern Energy Co. | 950,000 | 31,664 |
| | Transocean Ltd. | 250,000 | 11,935 |
| | Petroleo Brasileiro SA ADR | 500,000 | 11,225 |
| | Noble Corp. | 200,000 | 5,870 |
| | | | 1,607,823 |
| | | |
| | | | Market |
| | | | Value |
| | | Shares | ($000) |
| Financials (4.2%) | | |
| | Marsh & McLennan | | |
| | Cos. Inc. | 18,000,000 | 477,720 |
| | Charles Schwab Corp. | 20,275,100 | 228,500 |
| * | Berkshire Hathaway Inc. | | |
| | Class B | 2,400,000 | 170,496 |
| | Chubb Corp. | 2,550,000 | 152,975 |
| | Progressive Corp. | 1,500,000 | 26,640 |
| | Wells Fargo & Co. | 600,000 | 14,472 |
| | Weyerhaeuser Co. | 365,000 | 5,676 |
| | | | 1,076,479 |
| Health Care (26.2%) | | |
| | Amgen Inc. | 22,214,000 | 1,220,659 |
| *,1 | Biogen Idec Inc. | 12,304,500 | 1,146,164 |
| | Eli Lilly & Co. | 26,108,000 | 965,213 |
| | Roche Holding AG | 5,651,400 | 912,770 |
| | Novartis AG ADR | 15,473,465 | 862,955 |
| | Medtronic Inc. | 21,931,652 | 729,008 |
| | Johnson & Johnson | 5,013,400 | 319,404 |
| * | Boston Scientific Corp. | 31,731,760 | 187,535 |
| | GlaxoSmithKline plc ADR | 4,450,000 | 183,740 |
| * | Life Technologies Corp. | 3,430,000 | 131,815 |
| | Abbott Laboratories | 350,000 | 17,899 |
| | | | 6,677,162 |
| Industrials (14.6%) | | |
| | FedEx Corp. | 12,442,470 | 842,106 |
| | CH Robinson Worldwide | | |
| | Inc. | 8,201,000 | 561,523 |
| | Honeywell International | | |
| | Inc. | 8,495,000 | 373,015 |
| | Southwest Airlines Co. | 34,521,300 | 277,551 |
| | Caterpillar Inc. | 3,520,400 | 259,946 |
| | United Parcel Service | | |
| | Inc. Class B | 3,542,500 | 223,709 |
| | Union Pacific Corp. | 2,434,700 | 198,842 |
| | Boeing Co. | 3,050,000 | 184,556 |
| | Deere & Co. | 2,438,700 | 157,467 |
| *,1 | Alaska Air Group Inc. | 2,400,000 | 135,096 |
14
PRIMECAP Fund
| | | |
| | | | Market |
| | | | Value |
| | | Shares | ($000) |
| | European Aeronautic | | |
| | Defence and Space | | |
| | Co. NV | 4,183,900 | 117,606 |
| ^ | Canadian Pacific Railway | | |
| | Ltd. | 2,041,800 | 98,190 |
| | Donaldson Co. Inc. | 1,600,000 | 87,680 |
| | Expeditors International | | |
| | of Washington Inc. | 1,680,000 | 68,124 |
| *,^ | AMR Corp. | 15,504,550 | 45,894 |
| | PACCAR Inc. | 1,000,000 | 33,820 |
| | Granite Construction Inc. | 1,440,000 | 27,029 |
| | Pall Corp. | 205,000 | 8,692 |
| | Norfolk Southern Corp. | 53,100 | 3,240 |
| | Rockwell Automation Inc. | 25,000 | 1,400 |
| | | | 3,705,486 |
| Information Technology (30.6%) | |
| * | Google Inc. Class A | 1,795,875 | 923,762 |
| | Texas Instruments Inc. | 33,381,900 | 889,628 |
| | Oracle Corp. | 29,672,300 | 852,782 |
| | Microsoft Corp. | 30,585,800 | 761,281 |
| * | Intuit Inc. | 13,100,000 | 621,464 |
| * | Adobe Systems Inc. | 23,621,000 | 570,920 |
| | Qualcomm Inc. | 9,892,300 | 481,063 |
| | Intel Corp. | 12,400,000 | 264,492 |
| * | EMC Corp. | 10,447,800 | 219,299 |
| * | Research In Motion Ltd. | 10,438,600 | 211,904 |
| * | Symantec Corp. | 12,009,200 | 195,750 |
| * | NVIDIA Corp. | 15,500,000 | 193,750 |
| | Telefonaktiebolaget LM | | |
| | Ericsson ADR | 19,808,914 | 189,175 |
| | Corning Inc. | 14,885,900 | 183,990 |
| | Accenture plc Class A | 3,425,800 | 180,471 |
| | Hewlett-Packard Co. | 7,950,000 | 178,477 |
| | KLA-Tencor Corp. | 3,010,000 | 115,223 |
| 1 | Plantronics Inc. | 3,701,500 | 105,308 |
| | Applied Materials Inc. | 10,081,200 | 104,340 |
| * | Micron Technology Inc. | 20,000,000 | 100,800 |
| | Motorola Solutions Inc. | 1,838,571 | 77,036 |
| | Visa Inc. Class A | 833,070 | 71,411 |
| * | Motorola Mobility | | |
| | Holdings Inc. | 1,608,750 | 60,779 |
| | Activision Blizzard Inc. | 4,014,200 | 47,769 |
| | ASML Holding NV | 1,078,056 | 37,236 |
| * | Rambus Inc. | 2,000,000 | 28,000 |
| | Cisco Systems Inc. | 1,750,000 | 27,107 |
| * | eBay Inc. | 800,000 | 23,592 |
| * | Apple Inc. | 50,000 | 19,059 |
| * | Entegris Inc. | 2,583,472 | 16,483 |
| | Altera Corp. | 400,000 | 12,612 |
| | Analog Devices Inc. | 350,000 | 10,937 |
| * | Dell Inc. | 750,000 | 10,612 |
| * | NetApp Inc. | 115,000 | 3,903 |
| | Mastercard Inc. Class A | 6,500 | 2,061 |
| | | | 7,792,476 |
| | |
| | | Market |
| | | Value |
| | Shares | ($000) |
| Materials (5.1%) | | |
| Potash Corp. of | | |
| Saskatchewan Inc. | 16,041,700 | 693,322 |
| Monsanto Co. | 6,707,060 | 402,692 |
| Domtar Corp. | 1,023,560 | 69,776 |
| Praxair Inc. | 525,000 | 49,077 |
| Vulcan Materials Co. | 1,500,000 | 41,340 |
| Freeport-McMoRan | | |
| Copper & Gold Inc. | 1,200,000 | 36,540 |
| | | 1,292,747 |
| Telecommunication Services (0.1%) | |
| * Sprint Nextel Corp. | 10,274,100 | 31,233 |
| |
| Utilities (0.4%) | | |
| * AES Corp. | 4,983,000 | 48,634 |
| Public Service Enterprise | | |
| Group Inc. | 851,000 | 28,398 |
| NextEra Energy Inc. | 179,440 | 9,693 |
| | | 86,725 |
| Total Common Stocks | | |
| (Cost $19,438,724) | | 25,057,826 |
| Temporary Cash Investment (2.3%) | |
| Money Market Fund (2.3%) | | |
| 2,3 Vanguard Market | | |
| Liquidity Fund, 0.144% | | |
| (Cost $578,217) | 578,217,000 | 578,217 |
| Total Investments (100.7%) | | |
| (Cost $20,016,941) | | 25,636,043 |
| Other Assets and Liabilities (-0.7%) | |
| Other Assets | | 72,030 |
| Liabilities3 | | (260,645) |
| | | (188,615) |
| Net Assets (100%) | | 25,447,428 |
| |
| |
| Statement of Assets and Liabilities | |
| Assets | | |
| Investments in Securities, at Value | 25,636,043 |
| Receivables for Capital Shares Issued | 30,693 |
| Accrued Income Receivable | | 25,344 |
| Other Assets | | 15,993 |
| Total Assets | | 25,708,073 |
| Liabilities | | |
| Security Lending Collateral Payable | |
| to Brokers | | 137,048 |
| Payables for Capital Shares Redeemed | 25,991 |
| Other Liabilities | | 97,606 |
| Total Liabilities | | 260,645 |
| Net Assets | | 25,447,428 |
15
PRIMECAP Fund
| |
| At September 30, 2011, net assets consisted of: |
| | Amount |
| | ($000) |
| Paid-in Capital | 18,759,576 |
| Undistributed Net Investment Income | 175,468 |
| Accumulated Net Realized Gains | 892,282 |
| Unrealized Appreciation (Depreciation) | |
| Investment Securities | 5,619,102 |
| Foreign Currencies | 1,000 |
| Net Assets | 25,447,428 |
| |
| Investor Shares—Net Assets | |
| Applicable to 245,632,503 outstanding | |
| $.001 par value shares of beneficial | |
| interest (unlimited authorization) | 14,359,351 |
| Net Asset Value Per Share— | |
| Investor Shares | $58.46 |
| |
| Admiral Shares—Net Assets | |
| Applicable to 182,692,672 outstanding | |
| $.001 par value shares of beneficial | |
| interest (unlimited authorization) | 11,088,077 |
| Net Asset Value Per Share— | |
| Admiral Shares | $60.69 |
See Note A in Notes to Financial Statements.
* Non-income-producing security.
^ Part of security position is on loan to broker-dealers. The total value of securities on loan is $124,831,000.
1 Considered an affiliated company of the fund as the fund owns more than 5% of the outstanding voting securities of such company.
2 Affiliated money market fund available only to Vanguard funds and certain trusts and accounts managed by Vanguard. Rate shown is the 7-day yield.
3 Includes $137,048,000 of collateral received for securities on loan.
ADR—American Depositary Receipt.
See accompanying Notes, which are an integral part of the Financial Statements.
16
PRIMECAP Fund
| |
| Statement of Operations | |
| |
| | Year Ended |
| | September 30, 2011 |
| | ($000) |
| Investment Income | |
| Income | |
| Dividends1,2 | 419,266 |
| Interest2 | 940 |
| Security Lending | 1,802 |
| Total Income | 422,008 |
| Expenses | |
| Investment Advisory Fees—Note B | 63,754 |
| The Vanguard Group—Note C | |
| Management and Administrative—Investor Shares | 37,795 |
| Management and Administrative—Admiral Shares | 16,094 |
| Marketing and Distribution—Investor Shares | 3,860 |
| Marketing and Distribution—Admiral Shares | 2,326 |
| Custodian Fees | 487 |
| Auditing Fees | 26 |
| Shareholders’ Reports—Investor Shares | 251 |
| Shareholders’ Reports—Admiral Shares | 50 |
| Trustees’ Fees and Expenses | 59 |
| Total Expenses | 124,702 |
| Net Investment Income | 297,306 |
| Realized Net Gain (Loss) | |
| Investment Securities Sold2 | 1,074,099 |
| Foreign Currencies | 186 |
| Realized Net Gain (Loss) | 1,074,285 |
| Change in Unrealized Appreciation (Depreciation) | |
| Investment Securities | (1,474,329) |
| Foreign Currencies | 612 |
| Change in Unrealized Appreciation (Depreciation) | (1,473,717) |
| Net Increase (Decrease) in Net Assets Resulting from Operations | (102,126) |
1 Dividends are net of foreign withholding taxes of $16,229,000.
2 Dividend income, interest income, and realized net gain (loss) from affiliated companies of the fund were $21,213,000, $940,000, and $92,711,000, respectively.
See accompanying Notes, which are an integral part of the Financial Statements.
17
PRIMECAP Fund
| | |
| Statement of Changes in Net Assets | | |
| |
| |
| | Year Ended September 30, |
| | 2011 | 2010 |
| | ($000) | ($000) |
| Increase (Decrease) in Net Assets | | |
| Operations | | |
| Net Investment Income | 297,306 | 302,216 |
| Realized Net Gain (Loss) | 1,074,285 | 666,413 |
| Change in Unrealized Appreciation (Depreciation) | (1,473,717) | 1,738,244 |
| Net Increase (Decrease) in Net Assets Resulting from Operations | (102,126) | 2,706,873 |
| Distributions | | |
| Net Investment Income | | |
| Investor Shares | (168,148) | (142,413) |
| Admiral Shares | (119,031) | (84,478) |
| Realized Capital Gain | | |
| Investor Shares | (183,757) | — |
| Admiral Shares | (121,296) | — |
| Total Distributions | (592,232) | (226,891) |
| Capital Share Transactions | | |
| Investor Shares | (3,494,598) | (1,389,870) |
| Admiral Shares | 1,843,532 | (314,209) |
| Net Increase (Decrease) from Capital Share Transactions | (1,651,066) | (1,704,079) |
| Total Increase (Decrease) | (2,345,424) | 775,903 |
| Net Assets | | |
| Beginning of Period | 27,792,852 | 27,016,949 |
| End of Period1 | 25,447,428 | 27,792,852 |
| 1 Net Assets—End of Period includes undistributed net investment income of $175,468,000 and $185,535,000. | |
See accompanying Notes, which are an integral part of the Financial Statements.
18
PRIMECAP Fund
Financial Highlights
| | | | | |
| Investor Shares | | | | | |
| |
| For a Share Outstanding | | | Year Ended September 30, |
| Throughout Each Period | 2011 | 2010 | 2009 | 2008 | 2007 |
| Net Asset Value, Beginning of Period | $60.36 | $55.10 | $62.76 | $77.82 | $70.30 |
| Investment Operations | | | | | |
| Net Investment Income | . 651 | . 6311 | .500 | .552 | .460 |
| Net Realized and Unrealized Gain | | | | | |
| (Loss) on Investments | (1.266) | 5.076 | (3.990) | (10.913) | 11.500 |
| Total from Investment Operations | (. 615) | 5.707 | (3.490) | (10.361) | 11.960 |
| Distributions | | | | | |
| Dividends from Net Investment Income | (. 614) | (. 447) | (. 508) | (. 476) | (. 440) |
| Distributions from Realized Capital Gains | (.671) | — | (3.662) | (4.223) | (4.000) |
| Total Distributions | (1.285) | (. 447) | (4.170) | (4.699) | (4.440) |
| Net Asset Value, End of Period | $58.46 | $60.36 | $55.10 | $62.76 | $77.82 |
| |
| Total Return2 | -1.23% | 10.36% | -4.01% | -13.96% | 17.77% |
| |
| Ratios/Supplemental Data | | | | | |
| Net Assets, End of Period (Millions) | $14,359 | $18,028 | $17,795 | $19,234 | $23,435 |
| Ratio of Total Expenses to | | | | | |
| Average Net Assets | 0.45% | 0.45% | 0.49% | 0.43% | 0.43% |
| Ratio of Net Investment Income to | | | | | |
| Average Net Assets | 0.95% | 1.05%1 | 1.02% | 0.76% | 0.62% |
| Portfolio Turnover Rate | 8% | 5% | 4% | 11% | 11% |
1 Net investment income per share and the ratio of net investment income to average net assets include $0.128 and 0.21%, respectively, resulting from a special dividend from Weyerhaeuser Co. in July 2010.
2 Total returns do not include transaction or account service fees that may have applied in the periods shown. Fund prospectuses provide information about any applicable transaction and account service fees.
See accompanying Notes, which are an integral part of the Financial Statements.
19
PRIMECAP Fund
Financial Highlights
| | | | | |
| Admiral Shares | | | | | |
| |
| For a Share Outstanding | | | Year Ended September 30, |
| Throughout Each Period | 2011 | 2010 | 2009 | 2008 | 2007 |
| Net Asset Value, Beginning of Period | $62.65 | $57.20 | $65.19 | $80.82 | $73.03 |
| Investment Operations | | | | | |
| Net Investment Income | .738 | .7111 | .580 | .664 | .580 |
| Net Realized and Unrealized Gain | | | | | |
| (Loss) on Investments | (1.319) | 5.269 | (4.160) | (11.327) | 11.930 |
| Total from Investment Operations | (. 581) | 5.980 | (3.580) | (10.663) | 12.510 |
| Distributions | | | | | |
| Dividends from Net Investment Income | (. 683) | (. 530) | (. 612) | (. 586) | (. 570) |
| Distributions from Realized Capital Gains | (.696) | — | (3.798) | (4.381) | (4.150) |
| Total Distributions | (1.379) | (. 530) | (4.410) | (4.967) | (4.720) |
| Net Asset Value, End of Period | $60.69 | $62.65 | $57.20 | $65.19 | $80.82 |
| |
| Total Return2 | -1.14% | 10.46% | -3.90% | -13.85% | 17.91% |
| |
| Ratios/Supplemental Data | | | | | |
| Net Assets, End of Period (Millions) | $11,088 | $9,765 | $9,222 | $9,651 | $10,565 |
| Ratio of Total Expenses to | | | | | |
| Average Net Assets | 0.36% | 0.36% | 0.37% | 0.31% | 0.31% |
| Ratio of Net Investment Income to | | | | | |
| Average Net Assets | 1.04% | 1.14%1 | 1.14% | 0.88% | 0.74% |
| Portfolio Turnover Rate | 8% | 5% | 4% | 11% | 11% |
1 Net investment income per share and the ratio of net investment income to average net assets include $0.133 and 0.21%, respectively, resulting from a special dividend from Weyerhaeuser Co. in July 2010.
2 Total returns do not include transaction fees that may have applied in the periods shown. Fund prospectuses provide information about any applicable transaction fees.
See accompanying Notes, which are an integral part of the Financial Statements.
20
PRIMECAP Fund
Notes to Financial Statements
Vanguard PRIMECAP Fund is registered under the Investment Company Act of 1940 as an open-end investment company, or mutual fund. The fund offers two classes of shares: Investor Shares and Admiral Shares. Investor Shares are available to any investor who meets the fund’s minimum purchase requirements. Admiral Shares are designed for investors who meet certain administrative, service, and account-size criteria.
A. The following significant accounting policies conform to generally accepted accounting principles for U.S. mutual funds. The fund consistently follows such policies in preparing its financial statements.
1. Security Valuation: Securities are valued as of the close of trading on the New York Stock Exchange (generally 4 p.m., Eastern time) on the valuation date. Equity securities are valued at the latest quoted sales prices or official closing prices taken from the primary market in which each security trades; such securities not traded on the valuation date are valued at the mean of the latest quoted bid and asked prices. Securities for which market quotations are not readily available, or whose values have been affected by events occurring before the fund’s pricing time but after the close of the securities’ primary markets, are valued at their fair values calculated according to procedures adopted by the board of trustees. These procedures include obtaining quotations from an independent pricing service, monitoring news to identify significant market- or security-specific events, and evaluating changes in the values of foreign market proxies (for example, ADRs, futures contracts, or exchange-traded funds), between the time the foreign markets close and the fund’s pricing time. When fair-value pricing is employed, the prices of securities used by a fund to calculate its net asset value may differ from quoted or published prices for the same securities. Investments in Vanguard Market Liquidity Fund are valued at that fund’s net asset value.
2. Foreign Currency: Securities and other assets and liabilities denominated in foreign currencies are translated into U.S. dollars using exchange rates obtained from an independent third party as of the fund’s pricing time on the valuation date. Realized gains (losses) and unrealized appreciation (depreciation) on investment securities include the effects of changes in exchange rates since the securities were purchased, combined with the effects of changes in security prices. Fluctuations in the value of other assets and liabilities resulting from changes in exchange rates are recorded as unrealized foreign currency gains (losses) until the assets or liabilities are settled in cash, at which time they are recorded as realized foreign currency gains (losses).
3. Federal Income Taxes: The fund intends to continue to qualify as a regulated investment company and distribute all of its taxable income. Management has analyzed the fund’s tax positions taken for all open federal income tax years (September 30, 2008–2011), and has concluded that no provision for federal income tax is required in the fund’s financial statements.
4. Distributions: Distributions to shareholders are recorded on the ex-dividend date.
5. Security Lending: The fund may lend its securities to qualified institutional borrowers to earn additional income. Security loans are required to be secured at all times by collateral at least equal to the market value of securities loaned. The fund invests cash collateral received in Vanguard Market Liquidity Fund, and records a liability for the return of the collateral, during the period the securities are on loan. Security lending income represents fees charged to borrowers plus income earned on investing cash collateral, less expenses associated with the loan.
21
PRIMECAP Fund
6. Other: Dividend income is recorded on the ex-dividend date. Interest income includes income distributions received from Vanguard Market Liquidity Fund and is accrued daily. Security transactions are accounted for on the date securities are bought or sold. Costs used to determine realized gains (losses) on the sale of investment securities are those of the specific securities sold. Fees assessed on redemptions of capital shares are credited to paid-in capital.
Each class of shares has equal rights as to assets and earnings, except that each class separately bears certain class-specific expenses related to maintenance of shareholder accounts (included in Management and Administrative expenses) and shareholder reporting. Marketing and distribution expenses are allocated to each class of shares based on a method approved by the board of trustees. Income, other non-class-specific expenses, and gains and losses on investments are allocated to each class of shares based on its relative net assets.
B. PRIMECAP Management Company provides investment advisory services to the fund for a fee calculated at an annual percentage rate of average net assets. For the year ended September 30, 2011, the investment advisory fee represented an effective annual rate of 0.21% of the fund’s average net assets.
C. The Vanguard Group furnishes at cost corporate management, administrative, marketing, and distribution services. The costs of such services are allocated to the fund under methods approved by the board of trustees. The fund has committed to provide up to 0.40% of its net assets in capital contributions to Vanguard. At September 30, 2011, the fund had contributed capital of $4,569,000 to Vanguard (included in Other Assets), representing 0.02% of the fund’s net assets and 1.83% of Vanguard’s capitalization. The fund’s trustees and officers are also directors and officers of Vanguard.
D. Various inputs may be used to determine the value of the fund’s investments. These inputs are summarized in three broad levels for financial statement purposes. The inputs or methodologies used to value securities are not necessarily an indication of the risk associated with investing in those securities.
Level 1—Quoted prices in active markets for identical securities.
Level 2—Other significant observable inputs (including quoted prices for similar securities, interest rates, prepayment speeds, credit risk, etc.).
Level 3—Significant unobservable inputs (including the fund’s own assumptions used to determine the fair value of investments).
The following table summarizes the fund’s investments as of September 30, 2011, based on the inputs used to value them:
| | | |
| | Level 1 | Level 2 | Level 3 |
| Investments | ($000) | ($000) | ($000) |
| Common Stocks | 24,027,450 | 1,030,376 | — |
| Temporary Cash Investments | 578,217 | — | — |
| Total | 24,605,667 | 1,030,376 | — |
22
PRIMECAP Fund
E. Distributions are determined on a tax basis and may differ from net investment income and realized capital gains for financial reporting purposes. Differences may be permanent or temporary. Permanent differences are reclassified among capital accounts in the financial statements to reflect their tax character. Temporary differences arise when certain items of income, expense, gain, or loss are recognized in different periods for financial statement and tax purposes; these differences will reverse at some time in the future. Differences in classification may also result from the treatment of short-term gains as ordinary income for tax purposes.
During the year ended September 30, 2011, the fund realized net foreign currency gains of $186,000, which increased distributable net income for tax purposes; accordingly, such gains have been reclassified from accumulated net realized gains to undistributed net investment income.
The fund used a tax accounting practice to treat a portion of the price of capital shares redeemed during the year as distributions from net investment income and realized capital gains. Accordingly, the fund has reclassified $20,380,000 from undistributed net investment income, and $73,573,000 from accumulated net realized gains, to paid-in capital.
For tax purposes, at September 30, 2011, the fund had $250,250,000 of ordinary income and $877,056,000 of long-term capital gains available for distribution.
At September 30, 2011, the cost of investment securities for tax purposes was $20,027,786,000. Net unrealized appreciation of investment securities for tax purposes was $5,608,257,000, consisting of unrealized gains of $8,692,454,000 on securities that had risen in value since their purchase and $3,084,197,000 in unrealized losses on securities that had fallen in value since their purchase.
F. During the year ended September 30, 2011, the fund purchased $2,263,611,000 of investment securities and sold $4,231,881,000 of investment securities, other than temporary cash investments.
G. Capital share transactions for each class of shares were:
| | | | |
| | | | Year Ended September 30, |
| | | 2011 | | 2010 |
| | Amount | Shares | Amount | Shares |
| | ($000) | (000) | ($000) | (000) |
| Investor Shares | | | | |
| Issued | 1,479,247 | 22,334 | 1,468,783 | 25,220 |
| Issued in Lieu of Cash Distributions | 348,370 | 5,369 | 140,568 | 2,343 |
| Redeemed1 | (5,322,215) | (80,748) | (2,999,221) | (51,839) |
| Net Increase (Decrease)—Investor Shares | (3,494,598) | (53,045) | (1,389,870) | (24,276) |
| Admiral Shares | | | | |
| Issued | 3,378,773 | 49,378 | 936,594 | 15,542 |
| Issued in Lieu of Cash Distributions | 221,992 | 3,298 | 76,415 | 1,228 |
| Redeemed1 | (1,757,233) | (25,847) | (1,327,218) | (22,112) |
| Net Increase (Decrease)—Admiral Shares | 1,843,532 | 26,829 | (314,209) | (5,342) |
| 1 Net of redemption fees for fiscal 2011 and 2010 of $1,090,000 and $1,493,000, respectively (fund totals). | | |
23
PRIMECAP Fund
H. Certain of the fund’s investments are in companies that are considered to be affiliated companies of the fund because the fund owns more than 5% of the outstanding voting securities of the company. Transactions during the period in securities of these companies were as follows:
| | | | | |
| | | | Current Period Transactions | |
| | Sept. 30, 2010 | | Proceeds from | | Sept. 30, 2011 |
| | Market | Purchases | Securities | Dividend | Market |
| | Value | at Cost | Sold | Income | Value |
| | ($000) | ($000) | ($000) | ($000) | ($000) |
| Alaska Air Group Inc. | 122,982 | — | 604 | — | 135,096 |
| Biogen Idec Inc. | 704,329 | — | 23,538 | — | 1,146,164 |
| CH Robinson Worldwide Inc. | NA1 | 2,556 | — | 9,499 | NA1 |
| Intuit Inc. | 750,965 | — | 194,637 | — | NA2 |
| Plantronics Inc. | 125,037 | — | — | 740 | 105,308 |
| Whirlpool Corp. | 477,664 | — | — | 10,974 | 294,469 |
| | 2,180,977 | | | 21,213 | 1,681,037 |
1 Not applicable—At September 30, 2010, and September 30, 2011, the issuer was not an affiliated company of the fund, but it was affiliated during the period.
2 Not applicable—At September 30, 2011, the security was still held, but the issuer was no longer an affiliated company of the fund.
I. In preparing the financial statements as of September 30, 2011, management considered the impact of subsequent events for potential recognition or disclosure in these financial statements.
24
Report of Independent Registered Public Accounting Firm
To the Trustees of Vanguard Chester Funds and the Shareholders of Vanguard PRIMECAP Fund:
In our opinion, the accompanying statement of net assets, the statement of assets and liabilities and the related statements of operations and of changes in net assets and the financial highlights present fairly, in all material respects, the financial position of Vanguard PRIMECAP Fund (constituting a separate portfolio of Vanguard Chester Funds, hereafter referred to as the “Fund”) at September 30, 2011, the results of its operations for the year then ended, the changes in its net assets for each of the two years in the period then ended and the financial highlights for each of the five years in the period then ended, in conformity with accounting principles generally accepted in the United States of America. These financial statements and financial highlights (hereafter referred to as “financial statements”) are the responsibility of the Fund’s management; our responsibility is to express an opinion on these financial statements based on our audits. We conducted our audits of these financial statements in accordance with the standards of the Public Company Accounting Oversight Board (United States). Those standards require that we plan and perform the audit to obtain reasonable assurance about whether the financial statements are free of material misstatement. An audit includes examining, on a test basis, evidence supporting the amounts and disclosures in the financial statements, assessing the accounting principles used and significant estimates made by management, and evaluating the overall financial statement presentation. We believe that our audits, which included confirmation of securities at September 30, 2011 by correspondence with the custodian and by agreement to the underlying ownership records of Vanguard Market Liquidity Fund, provide a reasonable basis for our opinion.
PricewaterhouseCoopers LLP
Philadelphia, Pennsylvania
November 11, 2011
|
| Special 2011 tax information (unaudited) for Vanguard PRIMECAP Fund |
This information for the fiscal year ended September 30, 2011, is included pursuant to provisions of the Internal Revenue Code.
The fund distributed $347,180,000 as capital gain dividends (from net long-term capital gains) to shareholders during the fiscal year.
The fund distributed $316,729,000 of qualified dividend income to shareholders during the fiscal year.
For corporate shareholders, 95.6% of investment income (dividend income plus short-term gains, if any) qualifies for the dividends-received deduction.
25
Your Fund’s After-Tax Returns
This table presents returns for your fund both before and after taxes. The after-tax returns are shown in two ways: (1) assuming that an investor owned the fund during the entire period and paid taxes on the fund’s distributions, and (2) assuming that an investor paid taxes on the fund’s distributions and sold all shares at the end of each period.
Calculations are based on the highest individual federal income tax and capital gains tax rates in effect at the times of the distributions and the hypothetical sales. State and local taxes were not considered. After-tax returns reflect any qualified dividend income, using actual prior-year figures and estimates for 2011. (In the example, returns after the sale of fund shares may be higher than those assuming no sale. This occurs when the sale would have produced a capital loss. The calculation assumes that the investor received a tax deduction for the loss.)
The table shows returns for Investor Shares only; returns for other share classes will differ. Please note that your actual after-tax returns will depend on your tax situation and may differ from those shown. Also note that if you own the fund in a tax-deferred account, such as an individual retirement account or a 401(k) plan, this information does not apply to you. Such accounts are not subject to current taxes.
Finally, keep in mind that a fund’s performance—whether before or after taxes—does not guarantee future results.
| | | |
| Average Annual Total Returns: PRIMECAP Fund Investor Shares | | |
| Periods Ended September 30, 2011 | | | |
| | One | Five | Ten |
| | Year | Years | Years |
| Returns Before Taxes | -1.23% | 1.18% | 6.14% |
| Returns After Taxes on Distributions | -1.52 | 0.46 | 5.64 |
| Returns After Taxes on Distributions and Sale of Fund Shares | -0.35 | 0.97 | 5.33 |
Returns do not reflect the 1% fee on redemptions of shares held for less than one year.
26
About Your Fund’s Expenses
As a shareholder of the fund, you incur ongoing costs, which include costs for portfolio management, administrative services, and shareholder reports (like this one), among others. Operating expenses, which are deducted from a fund’s gross income, directly reduce the investment return of the fund.
A fund’s expenses are expressed as a percentage of its average net assets. This figure is known as the expense ratio. The following examples are intended to help you understand the ongoing costs (in dollars) of investing in your fund and to compare these costs with those of other mutual funds. The examples are based on an investment of $1,000 made at the beginning of the period shown and held for the entire period.
The accompanying table illustrates your fund’s costs in two ways:
• Based on actual fund return. This section helps you to estimate the actual expenses that you paid over the period. The ”Ending Account Value“ shown is derived from the fund‘s actual return, and the third column shows the dollar amount that would have been paid by an investor who started with $1,000 in the fund. You may use the information here, together with the amount you invested, to estimate the expenses that you paid over the period.
To do so, simply divide your account value by $1,000 (for example, an $8,600 account value divided by $1,000 = 8.6), then multiply the result by the number given for your fund under the heading ”Expenses Paid During Period.“
• Based on hypothetical 5% yearly return. This section is intended to help you compare your fund‘s costs with those of other mutual funds. It assumes that the fund had a yearly return of 5% before expenses, but that the expense ratio is unchanged. In this case—because the return used is not the fund’s actual return—the results do not apply to your investment. The example is useful in making comparisons because the Securities and Exchange Commission requires all mutual funds to calculate expenses based on a 5% return. You can assess your fund’s costs by comparing this hypothetical example with the hypothetical examples that appear in shareholder reports of other funds.
Note that the expenses shown in the table are meant to highlight and help you compare ongoing costs only and do not reflect transaction costs incurred by the fund for buying and selling securities. Further, the expenses do not include any purchase, redemption, or account service fees described in the fund prospectus. If such fees were applied to your account, your costs would be higher. Your fund does not carry a “sales load.”
The calculations assume no shares were bought or sold during the period. Your actual costs may have been higher or lower, depending on the amount of your investment and the timing of any purchases or redemptions.
You can find more information about the fund’s expenses, including annual expense ratios, in the Financial Statements section of this report. For additional information on operating expenses and other shareholder costs, please refer to your fund’s current prospectus.
27
| | | |
| Six Months Ended September 30, 2011 | | | |
| | Beginning | Ending | Expenses |
| | Account Value | Account Value | Paid During |
| PRIMECAP Fund | 3/31/2011 | 9/30/2011 | Period |
| Based on Actual Fund Return | | | |
| Investor Shares | $1,000.00 | $844.31 | $2.08 |
| Admiral Shares | 1,000.00 | 844.68 | 1.66 |
| Based on Hypothetical 5% Yearly Return | | | |
| Investor Shares | $1,000.00 | $1,022.81 | $2.28 |
| Admiral Shares | 1,000.00 | 1,023.26 | 1.83 |
The calculations are based on expenses incurred in the most recent six-month period. The fund’s annualized six-month expense ratios for that period are 0.45% for Investor Shares and 0.36% for Admiral Shares. The dollar amounts shown as “Expenses Paid” are equal to the annualized expense ratio multiplied by the average account value over the period, multiplied by the number of days in the most recent six-month period, then divided by the number of days in the most recent 12-month period.
28
Trustees Approve Advisory Agreement
The board of trustees of Vanguard PRIMECAP Fund has renewed the fund’s investment advisory agreement with PRIMECAP Management Company. The board determined that the retention of the advisor was in the best interests of the fund and its shareholders.
The board based its decision upon an evaluation of the advisor’s investment staff, portfolio management process, and performance. The trustees considered the factors discussed below, among others. However, no single factor determined whether the board approved the agreement. Rather, it was the totality of the circumstances that drove the board’s decision.
Nature, extent, and quality of services
The board considered the quality of the fund’s investment management over both the short and long term, and took into account the organizational depth and stability of the advisor. The board noted that PRIMECAP Management, founded in 1983, is recognized for its long-term approach to growth equity investing. Six experienced portfolio managers are responsible for separate subportfolios, and each portfolio manager employs a fundamental, research-driven approach in seeking to identify companies with long-term growth potential that have been overlooked by the market and are trading at attractive valuation levels. The firm has managed the fund since its inception in 1984.
The board concluded that the advisor’s experience, stability, depth, and performance, among other factors, warranted continuation of the advisory agreement.
Investment performance
The board considered the short- and long-term performance of the fund, including any periods of outperformance or underperformance of a relevant benchmark and peer group. The board noted that the fund had underperformed its benchmark and peer group over the 12 months ended March 31, 2011, but had outperformed both during the 3-, 5-, and 10-year periods. The board concluded that the advisor has carried out the fund’s investment strategy in disciplined fashion. Information about the fund’s most recent performance can be found in the Performance Summary section of this report.
Cost
The board concluded that the fund’s expense ratio was well below the average expense ratio charged by funds in its peer group and that the fund’s advisory fee rate was also well below its peer-group average. Information about the fund’s expenses appears in the About Your Fund’s Expenses section of this report as well as in the Financial Statements section, which also includes information about the fund’s advisory fee rate.
The board did not consider profitability of PRIMECAP Management in determining whether to approve the advisory fee, because PRIMECAP Management is independent of Vanguard and the advisory fee is the result of arm’s-length negotiations.
The benefit of economies of scale
The board concluded that the fund’s shareholders benefit from economies of scale because of breakpoints in the advisory fee schedule. The breakpoints reduce the effective rate of the fee as the fund’s assets increase.
The board will consider whether to renew the advisory agreement again after a one-year period.
29
Glossary
30-Day SEC Yield. A fund’s 30-day SEC yield is derived using a formula specified by the U.S. Securities and Exchange Commission. Under the formula, data related to the fund’s security holdings in the previous 30 days are used to calculate the fund’s hypothetical net income for that period, which is then annualized and divided by the fund’s estimated average net assets over the calculation period. For the purposes of this calculation, a security’s income is based on its current market yield to maturity (for bonds; excluding inflation for inflation-protected securities), its actual income (for asset-backed securities), or its projected dividend yield (for stocks). Because the SEC yield represents hypothetical annualized income, it will differ—at times significantly—from the fund’s actual experience. As a result, the fund’s income distributions may be higher or lower than implied by the SEC yield.
Beta. A measure of the magnitude of a fund’s past share-price fluctuations in relation to the ups and downs of a given market index. The index is assigned a beta of 1.00. Compared with a given index, a fund with a beta of 1.20 typically would have seen its share price rise or fall by 12% when the index rose or fell by 10%. For this report, beta is based on returns over the past 36 months for both the fund and the index. Note that a fund’s beta should be reviewed in conjunction with its R-squared (see definition). The lower the R-squared, the less correlation there is between the fund and the index, and the less reliable beta is as an indicator of volatility.
Dividend Yield. Dividend income earned by stocks, expressed as a percentage of the aggregate market value (or of net asset value, for a fund). The yield is determined by dividing the amount of the annual dividends by the aggregate value (or net asset value) at the end of the period. For a fund, the dividend yield is based solely on stock holdings and does not include any income produced by other investments.
Earnings Growth Rate. The average annual rate of growth in earnings over the past five years for the stocks now in a fund.
Equity Exposure. A measure that reflects a fund’s investments in stocks and stock futures. Any holdings in short-term reserves are excluded.
Expense Ratio. The percentage of a fund’s average net assets used to pay its annual administrative and advisory expenses. These expenses directly reduce returns to investors.
Foreign Holdings. The percentage of a fund represented by securities or depositary receipts of companies based outside the United States.
Inception Date. The date on which the assets of a fund (or one of its share classes) are first invested in accordance with the fund’s investment objective. For funds with a subscription period, the inception date is the day after that period ends. Investment performance is measured from the inception date.
Median Market Cap. An indicator of the size of companies in which a fund invests; the midpoint of market capitalization (market price x shares outstanding) of a fund’s stocks, weighted by the proportion of the fund’s assets invested in each stock. Stocks representing half of the fund’s assets have market capitalizations above the median, and the rest are below it.
Price/Book Ratio. The share price of a stock divided by its net worth, or book value, per share. For a fund, the weighted average price/book ratio of the stocks it holds.
30
Price/Earnings Ratio. The ratio of a stock’s current price to its per-share earnings over the past year. For a fund, the weighted average P/E of the stocks it holds. P/E is an indicator of market expectations about corporate prospects; the higher the P/E, the greater the expectations for a company’s future growth.
R-Squared. A measure of how much of a fund’s past returns can be explained by the returns from the market in general, as measured by a given index. If a fund’s total returns were precisely synchronized with an index’s returns, its R-squared would be 1.00. If the fund’s returns bore no relationship to the index’s returns, its R-squared would be 0. For this report, R-squared is based on returns over the past 36 months for both the fund and the index.
Return on Equity. The annual average rate of return generated by a company during the past five years for each dollar of shareholder’s equity (net income divided by shareholder’s equity). For a fund, the weighted average return on equity for the companies whose stocks it holds.
Short-Term Reserves. The percentage of a fund invested in highly liquid, short-term securities that can be readily converted to cash.
Turnover Rate. An indication of the fund’s trading activity. Funds with high turnover rates incur higher transaction costs and may be more likely to distribute capital gains (which may be taxable to investors). The turnover rate excludes in-kind transactions, which have minimal impact on costs.
31
The People Who Govern Your Fund
The trustees of your mutual fund are there to see that the fund is operated and managed in your best interests since, as a shareholder, you are a part owner of the fund. Your fund’s trustees also serve on the board of directors of The Vanguard Group, Inc., which is owned by the Vanguard funds and provides services to them on an at-cost basis.
A majority of Vanguard’s board members are independent, meaning that they have no affiliation with Vanguard or the funds they oversee, apart from the sizable personal investments they have made as private individuals. The independent board members have distinguished backgrounds in business, academia, and public service. Each of the trustees and executive officers oversees 178 Vanguard funds.
The following table provides information for each trustee and executive officer of the fund. More information about the trustees is in the Statement of Additional Information, which can be obtained, without charge, by contacting Vanguard at 800-662-7447, or online at vanguard.com.
| |
| Interested Trustee1 | and President (2006–2008) of Rohm and Haas Co. |
| | (chemicals); Director of Tyco International, Ltd. |
| F. William McNabb III | (diversified manufacturing and services) and Hewlett- |
| Born 1957. Trustee Since July 2009. Chairman of the | Packard Co. (electronic computer manufacturing); |
| Board. Principal Occupation(s) During the Past Five | Senior Advisor at New Mountain Capital; Trustee |
| Years: Chairman of the Board of The Vanguard Group, | of The Conference Board; Member of the Board of |
| Inc., and of each of the investment companies served | Managers of Delphi Automotive LLP (automotive |
| by The Vanguard Group, since January 2010; Director | components). |
| of The Vanguard Group since 2008; Chief Executive | |
| Officer and President of The Vanguard Group and of | Amy Gutmann |
| each of the investment companies served by The | Born 1949. Trustee Since June 2006. Principal |
| Vanguard Group since 2008; Director of Vanguard | Occupation(s) During the Past Five Years: President |
| Marketing Corporation; Managing Director of The | of the University of Pennsylvania; Christopher H. |
| Vanguard Group (1995–2008). | Browne Distinguished Professor of Political Science |
| | in the School of Arts and Sciences with secondary |
| | appointments at the Annenberg School for Commu- |
| Independent Trustees | nication and the Graduate School of Education |
| | of the University of Pennsylvania; Director of |
| Emerson U. Fullwood | Carnegie Corporation of New York, Schuylkill River |
| Born 1948. Trustee Since January 2008. Principal | Development Corporation, and Greater Philadelphia |
| Occupation(s) During the Past Five Years: Executive | Chamber of Commerce; Trustee of the National |
| Chief Staff and Marketing Officer for North America | Constitution Center; Chair of the Presidential |
| and Corporate Vice President (retired 2008) of Xerox | Commission for the Study of Bioethical Issues. |
| Corporation (document management products and | |
| services); Executive in Residence and 2010 | JoAnn Heffernan Heisen |
| Distinguished Minett Professor at the Rochester | Born 1950. Trustee Since July 1998. Principal |
| Institute of Technology; Director of SPX Corporation | Occupation(s) During the Past Five Years: Corporate |
| (multi-industry manufacturing), the United Way of | Vice President and Chief Global Diversity Officer |
| Rochester, Amerigroup Corporation (managed health | (retired 2008) and Member of the Executive |
| care), the University of Rochester Medical Center, | Committee (1997–2008) of Johnson & Johnson |
| Monroe Community College Foundation, and North | (pharmaceuticals/consumer products); Director of |
| Carolina A&T University. | Skytop Lodge Corporation (hotels), the University |
| | Medical Center at Princeton, the Robert Wood |
| Rajiv L. Gupta | Johnson Foundation, and the Center for Work Life |
| Born 1945. Trustee Since December 2001.2 | Policy; Member of the Advisory Board of the |
| Principal Occupation(s) During the Past Five Years: | Maxwell School of Citizenship and Public Affairs |
| Chairman and Chief Executive Officer (retired 2009) | at Syracuse University. |
| | |
| F. Joseph Loughrey | Thomas J. Higgins | |
| Born 1949. Trustee Since October 2009. Principal | Born 1957. Chief Financial Officer Since September |
| Occupation(s) During the Past Five Years: President | 2008. Principal Occupation(s) During the Past Five |
| and Chief Operating Officer (retired 2009) and Vice | Years: Principal of The Vanguard Group, Inc.; Chief |
| Chairman of the Board (2008–2009) of Cummins Inc. | Financial Officer of each of the investment companies |
| (industrial machinery); Director of SKF AB (industrial | served by The Vanguard Group since 2008; Treasurer |
| machinery), Hillenbrand, Inc. (specialized consumer | of each of the investment companies served by The |
| services), the Lumina Foundation for Education, and | Vanguard Group (1998–2008). |
| Oxfam America; Chairman of the Advisory Council | | |
| for the College of Arts and Letters and Member | Kathryn J. Hyatt | |
| of the Advisory Board to the Kellogg Institute for | Born 1955. Treasurer Since November 2008. Principal |
| International Studies at the University of Notre Dame. | Occupation(s) During the Past Five Years: Principal |
| | of The Vanguard Group, Inc.; Treasurer of each of |
| André F. Perold | the investment companies served by The Vanguard |
| Born 1952. Trustee Since December 2004. Principal | Group since 2008; Assistant Treasurer of each of the |
| Occupation(s) During the Past Five Years: George | investment companies served by The Vanguard Group |
| Gund Professor of Finance and Banking at the Harvard | (1988–2008). | |
| Business School (retired July 2011); Chief Investment | | |
| Officer and co-Managing Partner of HighVista | Heidi Stam | |
| Strategies LLC (private investment firm); Director of | Born 1956. Secretary Since July 2005. Principal |
| Rand Merchant Bank; Overseer of the Museum of | Occupation(s) During the Past Five Years: Managing |
| Fine Arts Boston. | Director of The Vanguard Group, Inc., since 2006; |
| | General Counsel of The Vanguard Group since 2005; |
| Alfred M. Rankin, Jr. | Secretary of The Vanguard Group and of each of the |
| Born 1941. Trustee Since January 1993. Principal | investment companies served by The Vanguard Group |
| Occupation(s) During the Past Five Years: Chairman, | since 2005; Director and Senior Vice President of |
| President, and Chief Executive Officer of NACCO | Vanguard Marketing Corporation since 2005; |
| Industries, Inc. (forklift trucks/housewares/lignite); | Principal of The Vanguard Group (1997–2006). |
| Director of Goodrich Corporation (industrial products/ | | |
| aircraft systems and services) and the National | | |
| Association of Manufacturers; Chairman of the | Vanguard Senior Management Team |
| Federal Reserve Bank of Cleveland; Vice Chairman | | |
| of University Hospitals of Cleveland; President of | R. Gregory Barton | Chris D. McIsaac |
| the Board of The Cleveland Museum of Art. | Mortimer J. Buckley | Michael S. Miller |
| | Kathleen C. Gubanich | James M. Norris |
| Peter F. Volanakis | Paul A. Heller | Glenn W. Reed |
| Born 1955. Trustee Since July 2009. Principal | Martha G. King | George U. Sauter |
| Occupation(s) During the Past Five Years: President | | |
| and Chief Operating Officer (retired 2010) of Corning | | |
| Incorporated (communications equipment); Director of | Chairman Emeritus and Senior Advisor |
| Corning Incorporated (2000–2010) and Dow Corning | | |
| (2001–2010); Overseer of the Amos Tuck School of | John J. Brennan | |
| Business Administration at Dartmouth College. | Chairman, 1996–2009 | |
| | Chief Executive Officer and President, 1996–2008 |
| |
| Executive Officers | | |
| | Founder | |
| Glenn Booraem | | |
| Born 1967. Controller Since July 2010. Principal | John C. Bogle | |
| Occupation(s) During the Past Five Years: Principal | Chairman and Chief Executive Officer, 1974–1996 |
| of The Vanguard Group, Inc.; Controller of each of | | |
| the investment companies served by The Vanguard | | |
| Group since 2010; Assistant Controller of each of | | |
| the investment companies served by The Vanguard | | |
| Group (2001–2010). | | |
1 Mr. McNabb is considered an “interested person,” as defined in the Investment Company Act of 1940, because he is an officer of the Vanguard funds.
2 December 2002 for Vanguard Equity Income Fund, Vanguard Growth Equity Fund, the Vanguard Municipal Bond Funds, and the Vanguard State Tax-Exempt Funds.
|  |
| P.O. Box 2600 |
| Valley Forge, PA 19482-2600 |
Connect with Vanguard® > vanguard.com
| |
| Fund Information > 800-662-7447 | |
| Direct Investor Account Services > 800-662-2739 | |
| Institutional Investor Services > 800-523-1036 | |
| Text Telephone for People | |
| With Hearing Impairment > 800-749-7273 | |
| |
| This material may be used in conjunction | |
| with the offering of shares of any Vanguard | |
| fund only if preceded or accompanied by | |
| the fund’s current prospectus. | |
| |
| All comparative mutual fund data are from Lipper Inc. or | |
| Morningstar, Inc., unless otherwise noted. | |
| |
| You can obtain a free copy of Vanguard’s proxy voting | |
| guidelines by visiting vanguard.com/proxyreporting or by | |
| calling Vanguard at 800-662-2739. The guidelines are | |
| also available from the SEC’s website, sec.gov. In | |
| addition, you may obtain a free report on how your fund | |
| voted the proxies for securities it owned during the 12 | |
| months ended June 30. To get the report, visit either | |
| vanguard.com/proxyreporting or sec.gov. | |
| |
| You can review and copy information about your fund at | |
| the SEC’s Public Reference Room in Washington, D.C. To | |
| find out more about this public service, call the SEC at | |
| 202-551-8090. Information about your fund is also | |
| available on the SEC’s website, and you can receive | |
| copies of this information, for a fee, by sending a | |
| request in either of two ways: via e-mail addressed to | |
| publicinfo@sec.gov or via regular mail addressed to the | |
| Public Reference Section, Securities and Exchange | |
| Commission, Washington, DC 20549-1520. | |
| | © 2011 The Vanguard Group, Inc. |
| | All rights reserved. |
| | Vanguard Marketing Corporation, Distributor. |
| |
| | Q590 112011 |
 |
|
| Annual Report | September 30, 2011 |
| |
| Vanguard Target Retirement Funds |
| |
| Vanguard Target Retirement Income Fund |
| Vanguard Target Retirement 2005 Fund |
| Vanguard Target Retirement 2010 Fund |
| Vanguard Target Retirement 2015 Fund |
| Vanguard Target Retirement 2020 Fund |
| Vanguard Target Retirement 2025 Fund |
> The broad U.S. stock market returned less than 1% for the fiscal year ended September 30, 2011, after slumping through the spring and summer. International stocks suffered declines.
> For the 12 months, returns for the six Target Retirement Funds in this report ranged from 3.92% to –0.11%.
> Among the underlying funds that make up the funds’ portfolios, Vanguard Inflation-Protected Securities Fund was the strongest performer and Vanguard Total International Stock Index Fund was the weakest.
| |
| Contents | |
| Your Fund’s Total Returns. | 1 |
| Chairman’s Letter. | 2 |
| Target Retirement Income Fund. | 9 |
| Target Retirement 2005 Fund. | 19 |
| Target Retirement 2010 Fund. | 28 |
| Target Retirement 2015 Fund. | 38 |
| Target Retirement 2020 Fund. | 48 |
| Target Retirement 2025 Fund. | 58 |
| Your Fund’s After-Tax Returns. | 70 |
| About Your Fund’s Expenses. | 72 |
| Glossary. | 74 |
Please note: The opinions expressed in this report are just that—informed opinions. They should not be considered promises or advice. Also, please keep in mind that the information and opinions cover the period through the date on the front of this report. Of course, the risks of investing in your fund are spelled out in the prospectus.
See the Glossary for definitions of investment terms used in this report.
About the cover: Vanguard was named for the HMS Vanguard, flagship of British Admiral Horatio Nelson. A ship—whose performance and safety depend on the work of all hands—has served as a fitting metaphor for the Vanguard crew as we strive to help clients reach their financial goals.
Your Fund’s Total Returns
| |
| Fiscal Year Ended September 30, 2011 | |
| | Total |
| | Returns |
| Vanguard Target Retirement Income Fund | 3.70% |
| Target Income Composite Index | 3.76 |
| Mixed-Asset Target Allocation Conservative Funds Average | 0.88 |
| Mixed-Asset Target Allocation Conservative Funds Average: Derived from data provided by Lipper Inc. | |
| |
| Vanguard Target Retirement 2005 Fund | 3.92% |
| Target 2005 Composite Index | 3.81 |
| Mixed-Asset Target Allocation Conservative Funds Average | 0.88 |
| Mixed-Asset Target Allocation Conservative Funds Average: Derived from data provided by Lipper Inc. | |
| |
| Vanguard Target Retirement 2010 Fund | 2.68% |
| Target 2010 Composite Index | 2.57 |
| Mixed-Asset Target 2010 Funds Average | 0.34 |
| Mixed-Asset Target 2010 Funds Average: Derived from data provided by Lipper Inc. | |
| |
| Vanguard Target Retirement 2015 Fund | 1.40% |
| Target 2015 Composite Index | 1.23 |
| Mixed-Asset Target 2015 Funds Average | 0.15 |
| Mixed-Asset Target 2015 Funds Average: Derived from data provided by Lipper Inc. | |
| |
| Vanguard Target Retirement 2020 Fund | 0.53% |
| Target 2020 Composite Index | 0.79 |
| Mixed-Asset Target 2020 Funds Average | -0.18 |
| Mixed-Asset Target 2020 Funds Average: Derived from data provided by Lipper Inc. | |
| |
| Vanguard Target Retirement 2025 Fund | -0.11% |
| Target 2025 Composite Index | 0.17 |
| Mixed-Asset Target 2025 Funds Average | -1.22 |
| Mixed-Asset Target 2025 Funds Average: Derived from data provided by Lipper Inc. | |
Returns for the composite indexes are derived by applying the funds’ target allocations to the results of the following benchmarks: for U.S. stocks, the MSCI US Broad Market Index; for international stocks, the MSCI EAFE Index and the MSCI Emerging Markets Index through December 15, 2010, and the MSCI ACWI ex USA IMI Index thereafter; for bonds, the Barclays Capital U.S. Aggregate Float Adjusted Index and the Barclays Capital U.S. Treasury Inflation Protected Securities Index; and for short-term reserves, the Citigroup Three-Month Treasury Bill Index.
Investments in Target Retirement Funds are subject to the risks of their underlying funds. The year in the fund name refers to the approximate year (the target date) when an investor in the fund would retire and leave the work force. The fund will gradually shift its emphasis from more aggressive investments to more conservative ones based on its target date. An investment in a Target Retirement Fund is not guaranteed at any time, including on or after the target date.
1

Chairman’s Letter
Dear Shareholder,
For the fiscal year ended September 30, 2011, increasing volatility in global equity markets erased strong returns attained earlier. Bonds handily outperformed stocks during the 12 months as investors sought refuge in the markets’ safer regions. The Target Retirement Funds with the largest fixed income allocations fared better than those with higher equity allocations.
This report features the results of 6 of Vanguard’s 12 Target Retirement Funds (the longer-dated funds are covered in a separate report). The Target Retirement Income Fund and the Target Retirement 2005 Fund, which have the highest allocation to bonds, were the top performers. The Target Retirement 2025 Fund, which includes heavier exposure to U.S. and international equities, produced the lowest return.
Vanguard announced shortly after the Target Retirement Funds’ fiscal year ended that, in early 2012, the 2005 Fund will merge with the Target Retirement Income Fund as their asset allocations become nearly identical. The Target Retirement Funds are designed to reach an allocation of 65% bonds, 30% stocks, and 5% short-term reserves within seven years after their target date. The 2005 Fund closed to new investors as of the date of the announcement.
2
Vanguard has also filed a registration statement with the U.S. Securities and Exchange Commission for the Target Retirement 2060 Fund, which is aimed at investors who plan to retire and leave the workforce in or within a few years of 2060. At the time the fund is launched in early 2012, those investors will be about 20 years old.
A swift change in sentiment weighed on stock prices
Global stock markets rallied through the first half of the fiscal year as corporate earnings surged and the economic recovery seemed to be gathering steam. In the second half, however, stock prices tumbled as economic indicators took a turn for the worse and U.S. and European policymaking strife dominated the headlines. (Standard & Poor’s, the ratings agency, downgraded the U.S. credit rating, in large part because of the political gridlock on display during the debt-ceiling debate. Vanguard’s confidence in the “full faith and credit” of the U.S. Treasury remains unshaken.)
The U.S. stock market’s second-half weakness sapped its first-half strength. The broad market returned 0.31% for the full 12 months. International stocks, which gained less at the start of the year and lost more at the end, returned –10.81% in U.S. dollars.
Bond prices rallied as optimism faded
The stock market’s pattern of strength and weakness was inverted in the bond market. Early in the year, bond prices
| | | |
| Market Barometer | | | |
| |
| | | Average Annual Total Returns |
| | | Periods Ended September 30, 2011 |
| | One | Three | Five |
| | Year | Years | Years |
| Stocks | | | |
| Russell 1000 Index (Large-caps) | 0.91% | 1.61% | -0.91% |
| Russell 2000 Index (Small-caps) | -3.53 | -0.37 | -1.02 |
| Dow Jones U.S. Total Stock Market Index | 0.31 | 1.75 | -0.57 |
| MSCI All Country World Index ex USA (International) | -10.81 | 0.52 | -1.57 |
| |
| Bonds | | | |
| Barclays Capital U.S. Aggregate Bond Index (Broad | | | |
| taxable market) | 5.26% | 7.97% | 6.53% |
| Barclays Capital Municipal Bond Index (Broad | | | |
| tax-exempt market) | 3.88 | 8.08 | 5.01 |
| Citigroup Three-Month U.S. Treasury Bill Index | 0.11 | 0.19 | 1.61 |
| |
| CPI | | | |
| Consumer Price Index | 3.87% | 1.22% | 2.26% |
3
retreated, consistent with investor optimism about economic growth. Later in the year, as optimism gave way to anxiety, bond prices surged, driving yields to remarkable lows. At the end of September, the yield of the 10-year U.S. Treasury note, a benchmark for longer-term interest rates, stood at 1.93%. Bond indexes recorded impressive returns, though it’s worth noting that shrinking yields imply lower returns on prospective investments.
The yields of money market instruments hovered near zero, as they have since December 2008, when the Federal Reserve cut its target for short-term interest rates to between 0% and 0.25%. Toward the end of the period, the Fed indicated that it expected to maintain this exceptionally low target at least through mid-2013.
Bond performance softened stocks’ fall
The Vanguard Target Retirement Funds were created as vehicles for investors on the road to retirement. Each fund is composed of other Vanguard funds and combines stock, bond, and money market holdings in proportions tailored to an investor’s expected retirement date. As the investor moves closer to retirement, the asset mix becomes more conservative, gradually tilting toward fewer stocks and more bonds and money market funds, which are less volatile. It becomes
| | |
| Expense Ratios | | |
| Your Fund Compared With Its Peer Group | | |
| | Acquired Fund Fees | Peer Group |
| | and Expenses | Average |
| Target Retirement Income Fund | 0.17% | 0.85% |
| Target Retirement 2005 Fund | 0.17 | 0.85 |
| Target Retirement 2010 Fund | 0.17 | 0.57 |
| Target Retirement 2015 Fund | 0.16 | 0.58 |
| Target Retirement 2020 Fund | 0.17 | 0.62 |
| Target Retirement 2025 Fund | 0.18 | 0.53 |
The fund expense figures shown—drawn from the prospectus dated January 26, 2011—represent an estimate of the weighted average of the expense ratios and any transaction fees charged by the underlying mutual funds (the ”acquired” funds) in which the Target Retirement Funds invest. The Target Retirement Funds do not charge any expenses or fees of their own. For the fiscal year ended September 30, 2011, the acquired fund fees and expenses were 0.17% for the Target Retirement Income Fund, 0.17% for the 2005 Fund, 0.17% for the 2010 Fund, 0.17% for the 2015 Fund, 0.17% for the 2020 Fund, and 0.18% for the 2025 Fund. Peer group expense ratios are derived from data provided by Lipper Inc. and capture information through year-end 2010.
Peer groups: For the Target Retirement Income and 2005 Funds, Mixed-Asset Target Allocation Conservative Funds Average; for the 2010 Fund, Mixed-Asset Target 2010 Funds Average; for the 2015 Fund, Mixed-Asset Target 2015 Funds Average; for the 2020 Fund, Mixed-Asset Target 2020 Funds Average; and for the 2025 Fund, Mixed-Asset Target 2025 Funds Average.
4
increasingly important to limit a portfolio’s fluctuations as the need for income and wealth preservation draws near. Most investors in the six funds described in this report are either in retirement or approaching it within the next 15 years.
Results for the funds depended on where each one stood on the retirement-year continuum. The 2005 Fund posted the top result, with a return of 3.92%, while the Income Fund was a shade behind, at 3.70%. Both portfolios had
| |
| Total Returns | |
| Inception Through September 30, 2011 | |
| | Average |
| | Annual Return |
| Target Retirement Income Fund (Returns since inception: 10/27/2003) | 4.96% |
| Target Income Composite Index | 4.94 |
| Mixed-Asset Target Allocation Conservative Funds Average | 3.44 |
| Mixed-Asset Target Allocation Conservative Funds Average: Derived from data provided by Lipper Inc. | |
| Target Retirement 2005 Fund (Returns since inception: 10/27/2003) | 4.96% |
| Target 2005 Composite Index | 5.00 |
| Mixed-Asset Target Allocation Conservative Funds Average | 3.50 |
| Mixed-Asset Target Allocation Conservative Funds Average: Derived from data provided by Lipper Inc. | |
| Target Retirement 2010 Fund (Returns since inception: 6/7/2006) | 3.94% |
| Target 2010 Composite Index | 3.88 |
| Mixed-Asset Target 2010 Funds Average | 2.44 |
| Mixed-Asset Target 2010 Funds Average: Derived from data provided by Lipper Inc. | |
| Target Retirement 2015 Fund (Returns since inception: 10/27/2003) | 4.61% |
| Target 2015 Composite Index | 4.55 |
| Mixed-Asset Target 2015 Funds Average | 3.66 |
| Mixed-Asset Target 2015 Funds Average: Derived from data provided by Lipper Inc. | |
| Target Retirement 2020 Fund (Returns since inception: 6/7/2006) | 2.72% |
| Target 2020 Composite Index | 2.74 |
| Mixed-Asset Target 2020 Funds Average | 1.74 |
| Mixed-Asset Target 2020 Funds Average: Derived from data provided by Lipper Inc. | |
| Target Retirement 2025 Fund (Returns since inception: 10/27/2003) | 4.14% |
| Target 2025 Composite Index | 4.18 |
| Mixed-Asset Target 2025 Funds Average | 3.79 |
| Mixed-Asset Target 2025 Funds Average: Derived from data provided by Lipper Inc. | |
The figures shown represent past performance, which is not a guarantee of future results. (Current performance may be lower or higher than the performance data cited. For performance data current to the most recent month-end, visit our website at vanguard.com/performance.) Note, too, that both investment returns and principal value can fluctuate widely, so an investor’s shares, when sold, could be worth more or less than their original cost.
5
a large exposure to bond funds, the best performers among the underlying holdings of the funds in the Target Retirement series. As the bond allocation for the funds decreased, so did the results. The 2010 and 2015 Funds had respective returns of 2.68% and 1.40%.
Vanguard Inflation-Protected Securities Fund, which aims to protect investors against the long-term effects of inflation by investing in bonds with a built-in inflation safeguard, stood out among the underlying funds with a result of about 9%. Next was Vanguard Total Bond Market II Index Fund, which returned about 5%. Vanguard Prime Money Market Fund’s 0.06% return was the result of the near-0% yields on short-term U.S. Treasury bills and other money market instruments.
At the other end of the spectrum, the Target Retirement 2025 Fund recorded the group’s only negative result, returning –0.11%. This reflected the fund’s equity allocation of nearly 73%, which included exposure to U.S. and international stocks. The 2020 Fund eked out a positive return of 0.53%.
Vanguard Total International Stock Index Fund, which returned about –12%, was the poorest performer of the underlying funds amid debt worries in Europe and fear that growth would weaken in China and other emerging markets. U.S. stocks held up a bit better, although the prolonged slide over the period’s last five months reduced Vanguard Total Stock Market Index Fund’s return to 0.59%.
Cost-efficient investment has proven competitive
Vanguard Target Retirement Funds have produced competitive results since their inception. Through this year’s ups and downs, their returns have been consistent with their asset allocations. As you can see from the table, returns for the fund in this report fell within a fraction of a percentage point of their respective benchmark indexes, whose returns reflect market performance without operating and transaction costs. Each fund’s return surpassed the average return of its peers.
The funds’ advisors, Vanguard’s Quantitative Equity Group and Fixed Income Group, combine experienced and skilled portfolio management with refined risk control and trading systems. Over time, the funds have also benefited from their low operating costs, which allow shareholders to capture more of the markets’ returns. For a look at how the funds’ costs compare with the average expenses of peers, please see the table later in this letter.
A streamlined program for a lifetime of investing
A solid market turned soft in August and September, and stock prices retreated as the period progressed. Such severe volatility was last seen during the financial crisis of 2008–2009. As recent events prove so well, the investment environment can shift without notice. Despite a vast arsenal of tools and technology, even the most seasoned professionals can’t forecast the market’s frequent changes.
6
At Vanguard, we encourage investors to focus on a long-term strategy and concentrate less on the market’s daily movements. This means constructing a diversified portfolio of stocks, bonds, and money market instruments tailored to your own goals, time horizon, and tolerance for risk. The Vanguard Target Retirement Funds were built on these principles, providing a professionally managed portfolio that can help address your retirement investing needs through changing circumstances and challenging markets.
As always, thank you for entrusting your assets to Vanguard.
Sincerely,

F. William McNabb III
Chairman and Chief Executive Officer
October 14, 2011
| | | | |
| Your Fund’s Performance at a Glance | | | | |
| September 30, 2010 , Through September 30, 2011 | | | | |
| | | | Distributions Per Share |
| | Starting | Ending | Income | Capital |
| | Share Price | Share Price | Dividends | Gains |
| Target Retirement Income Fund | $11.13 | $11.22 | $0.299 | $0.024 |
| Target Retirement 2005 Fund | $11.71 | $11.85 | $0.290 | $0.025 |
| Target Retirement 2010 Fund | $21.87 | $21.91 | $0.511 | $0.043 |
| Target Retirement 2015 Fund | $12.03 | $11.91 | $0.276 | $0.024 |
| Target Retirement 2020 Fund | $21.17 | $20.83 | $0.444 | $0.035 |
| Target Retirement 2025 Fund | $11.97 | $11.71 | $0.250 | $0.016 |
| | | |
| Asset Allocation on September 30, 2011 | | | |
| | | | Short-Term |
| | Stocks | Bonds | Reserves |
| Target Retirement Income Fund | 29.5% | 65.5% | 5.0% |
| Target Retirement 2005 Fund | 31.7% | 63.8% | 4.5% |
| Target Retirement 2010 Fund | 45.9% | 53.2% | 0.9% |
| Target Retirement 2015 Fund | 56.8% | 43.2% | 0.0% |
| Target Retirement 2020 Fund | 65.1% | 34.9% | 0.0% |
| Target Retirement 2025 Fund | 72.6% | 27.4% | 0.0% |
Note: The Income Fund’s allocations do not change. As of September 30, 2011, international stock weightings for the Income, 2005, 2010, 2015, 2020, and 2025 Funds were 9%, 10%, 14%, 17%, 20%, and 22% of assets, respectively.
8
Target Retirement Income Fund
Fund Profile
As of September 30, 2011
| |
| Total Fund Characteristics | |
| Ticker Symbol | VTINX |
| 30-Day SEC Yield | 2.69% |
| Acquired Fund Fees and Expenses1 | 0.17% |
| |
| Allocation to Underlying Vanguard Funds | |
| Vanguard Total Bond Market II Index Fund | |
| Investor Shares | 45.5% |
| Vanguard Total Stock Market Index Fund | |
| Investor Shares | 20.7 |
| Vanguard Inflation-Protected Securities | |
| Fund Investor Shares | 20.0 |
| Vanguard Total International Stock Index | |
| Fund Investor Shares | 8.8 |
| Vanguard Prime Money Market Fund | |
| Investor Shares | 5.0 |
| | |
| Total Fund Volatility Measures | |
| | Target | Barclays |
| | Income | Aggregate |
| | Composite | Bond |
| | Index | Index |
| R-Squared | 1.00 | 0.25 |
| Beta | 1.00 | 1.02 |
These measures show the degree and timing of the fund’s fluctuations compared with the indexes over 36 months.
Fund Asset Allocation
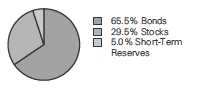
1 This figure—drawn from the prospectus dated January 26, 2011—represents an estimate of the weighted average of the expense ratios and any transaction fees charged by the underlying mutual funds (the ”acquired” funds) in which the Target Retirement Income Fund invests. The fund does not charge any expenses or fees of its own. For the fiscal year ended September 30, 2011, the acquired fund fees and expenses were 0.17%.
9
Target Retirement Income Fund
Performance Summary
All of the returns in this report represent past performance, which is not a guarantee of future results that may be achieved by the fund. (Current performance may be lower or higher than the performance data cited. For performance data current to the most recent month-end, visit our website at vanguard.com/performance.) Note, too, that both investment returns and principal value can fluctuate widely, so an investor’s shares, when sold, could be worth more or less than their original cost. The returns shown do not reflect taxes that a shareholder would pay on fund distributions or on the sale of fund shares.
Cumulative Performance: October 27, 2003, Through September 30, 2011
Initial Investment of $10,000
| | | | |
| | Average Annual Total Returns | |
| | Periods Ended September 30, 2011 | |
| | | | Since | Final Value |
| | One | Five | Inception | of a $10,000 |
| | Year | Years | (10/27/2003) | Investment |
| Target Retirement Income Fund | 3.70% | 4.61% | 4.96% | $14,672 |
| Barclays Capital U.S. Aggregate Bond | | | | |
| Index | 5.26 | 6.53 | 5.51 | 15,302 |
| Target Income Composite Index | 3.76 | 4.52 | 4.94 | 14,657 |
| Mixed-Asset Target Allocation | | | | |
| Conservative Funds Average | 0.88 | 2.47 | 3.44 | 13,073 |
| "Since Inception" performance is calculated from the fund’s inception date for both the fund and its comparative standards. | |
Target Income Composite Index: Derived by applying the fund’s target asset allocation to the results of the following benchmarks: for international stocks of developed markets, the MSCI EAFE Index through December 15, 2010, and the MSCI ACWI ex USA IMI Index thereafter; for emerging markets stocks, the Select Emerging Markets Index through August 23, 2006, the MSCI Emerging Markets Index through December 15, 2010, and the MSCI ACWI ex USA IMI Index thereafter; for bonds, the Barclays Capital U.S. Aggregate Bond Index through December 31, 2009, and the Barclays Capital U.S. Aggregate Float Adjusted Index thereafter, as well as the Barclays Capital U.S. Treasury Inflation Protected Securities Index; for short-term reserves, the Citigroup Three-Month Treasury Bill Index; and for U.S. stocks, the Dow Jones Wilshire 5000 Index through April 22, 2005, and the MSCI US Broad Market Index thereafter. MSCI international benchmark returns are adjusted for withholding taxes applicable to Luxembourg holding companies.
Mixed-Asset Target Allocation Conservative Funds Average: Derived from data provided by Lipper Inc.
See Financial Highlights for dividend and capital gains information.
10
Target Retirement Income Fund
Fiscal-Year Total Returns (%): October 27, 2003, Through September 30, 2011
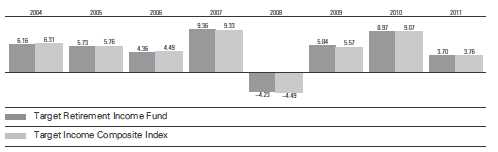
11
Target Retirement Income Fund
Financial Statements
Statement of Net Assets
As of September 30, 2011
The fund reports a complete list of its holdings in regulatory filings four times in each fiscal year, at the quarter-ends. For the second and fourth fiscal quarters, the lists appear in the fund’s semiannual and annual reports to shareholders. For the first and third fiscal quarters, the fund files the lists with the Securities and Exchange Commission on Form N-Q. Shareholders can look up the fund’s Forms N-Q on the SEC’s website at sec.gov. Forms N-Q may also be reviewed and copied at the SEC’s Public Reference Room (see the back cover of this report for further information).
| | |
| | | Market |
| | | Value |
| | Shares | ($000) |
| Investment Companies (99.9%) | | |
| U.S. Stock Fund (20.6%) | | |
| Vanguard Total Stock Market Index Fund Investor Shares | 35,041,051 | 983,602 |
| |
| International Stock Fund (8.8%) | | |
| Vanguard Total International Stock Index Fund Investor Shares | 32,514,150 | 420,083 |
| |
| Bond Funds (65.4%) | | |
| 1 Vanguard Total Bond Market II Index Fund Investor Shares | 197,799,170 | 2,163,923 |
| Vanguard Inflation-Protected Securities Fund Investor Shares | 68,201,897 | 953,462 |
| | | 3,117,385 |
| Money Market Funds (5.1%) | | |
| Vanguard Prime Money Market Fund Investor Shares | 239,414,255 | 239,414 |
| 1 Vanguard Market Liquidity Fund, 0.144% | 1,041,647 | 1,042 |
| | | 240,456 |
| Total Investment Companies (Cost $4,581,430) | | 4,761,526 |
| Other Assets and Liabilities (0.1%) | | |
| Other Assets | | 13,644 |
| Liabilities | | (10,438) |
| | | 3,206 |
| Net Assets (100%) | | |
| Applicable to 424,566,579 outstanding $.001 par value shares of | | |
| beneficial interest (unlimited authorization) | | 4,764,732 |
| Net Asset Value Per Share | | $11.22 |
12
Target Retirement Income Fund
| |
| At September 30, 2011, net assets consisted of: | |
| | Amount |
| | ($000) |
| Paid-in Capital | 4,606,298 |
| Undistributed Net Investment Income | 1,999 |
| Accumulated Net Realized Losses | (23,661) |
| Unrealized Appreciation (Depreciation) | 180,096 |
| Net Assets | 4,764,732 |
See Note A in Notes to Financial Statements.
1 Affiliated fund available only to Vanguard funds and certain trusts and accounts managed by Vanguard. Rate shown for Vanguard Market Liquidity Fund is the 7-day yield.
See accompanying Notes, which are an integral part of the Financial Statements.
13
Target Retirement Income Fund
| |
| Statement of Operations | |
| |
| | Year Ended |
| | September 30, 2011 |
| | ($000) |
| Investment Income | |
| Income | |
| Income Distributions Received | 113,850 |
| Net Investment Income—Note B | 113,850 |
| Realized Net Gain (Loss) | |
| Capital Gain Distributions Received | 11,284 |
| Investment Securities Sold | 14,885 |
| Realized Net Gain (Loss) | 26,169 |
| Change in Unrealized Appreciation (Depreciation) of Investment Securities | (11,577) |
| Net Increase (Decrease) in Net Assets Resulting from Operations | 128,442 |
See accompanying Notes, which are an integral part of the Financial Statements.
14
Target Retirement Income Fund
| | |
| Statement of Changes in Net Assets | | |
| |
| |
| | Year Ended September 30, |
| | 2011 | 2010 |
| | ($000) | ($000) |
| Increase (Decrease) in Net Assets | | |
| Operations | | |
| Net Investment Income | 113,850 | 81,997 |
| Realized Net Gain (Loss) | 26,169 | (549) |
| Change in Unrealized Appreciation (Depreciation) | (11,577) | 185,970 |
| Net Increase (Decrease) in Net Assets Resulting from Operations | 128,442 | 267,418 |
| Distributions | | |
| Net Investment Income | (113,803) | (81,428) |
| Realized Capital Gain1 | (8,254) | — |
| Total Distributions | (122,057) | (81,428) |
| Capital Share Transactions | | |
| Issued | 2,148,360 | 1,674,140 |
| Issued in Lieu of Cash Distributions | 116,593 | 77,463 |
| Redeemed | (1,129,601) | (777,327) |
| Net Increase (Decrease) from Capital Share Transactions | 1,135,352 | 974,276 |
| Total Increase (Decrease) | 1,141,737 | 1,160,266 |
| Net Assets | | |
| Beginning of Period | 3,622,995 | 2,462,729 |
| End of Period2 | 4,764,732 | 3,622,995 |
1 Includes fiscal 2011 short-term gain distributions totaling $8,254,000. Short-term gain distributions are treated as ordinary income dividends for tax purposes.
2 Net Assets—End of Period includes undistributed net investment income of $1,999,000 and $1,952,000.
See accompanying Notes, which are an integral part of the Financial Statements.
15
Target Retirement Income Fund
Financial Highlights
| | | | | |
| For a Share Outstanding | | | Year Ended September 30, |
| Throughout Each Period | 2011 | 2010 | 2009 | 2008 | 2007 |
| Net Asset Value, Beginning of Period | $11.13 | $10.49 | $10.19 | $11.08 | $10.52 |
| Investment Operations | | | | | |
| Net Investment Income | .3031 | .288 | .268 | .427 | .4301 |
| Capital Gain Distributions Received | .0301 | — | — | — | — |
| Net Realized and Unrealized Gain (Loss) | | | | | |
| on Investments | .080 | .640 | .302 | (.878) | .540 |
| Total from Investment Operations | .413 | .928 | .570 | (.451) | .970 |
| Distributions | | | | | |
| Dividends from Net Investment Income | (.299) | (.288) | (.270) | (.439) | (.410) |
| Distributions from Realized Capital Gains | (.024) | — | — | — | — |
| Total Distributions | (.323) | (.288) | (.270) | (.439) | (.410) |
| Net Asset Value, End of Period | $11.22 | $11.13 | $10.49 | $10.19 | $11.08 |
| |
| Total Return2 | 3.70% | 8.97% | 5.84% | -4.23% | 9.36% |
| |
| Ratios/Supplemental Data | | | | | |
| Net Assets, End of Period (Millions) | $4,765 | $3,623 | $2,463 | $2,046 | $1,336 |
| Ratio of Total Expenses to | | | | | |
| Average Net Assets | — | — | — | — | — |
| Acquired Fund Fees and Expenses | 0.17% | 0.17% | 0.21% | 0.19% | 0.19% |
| Ratio of Net Investment Income to | | | | | |
| Average Net Assets | 2.65% | 2.70% | 2.78% | 4.11% | 4.03% |
| Portfolio Turnover Rate | 14%3 | 12% | 29%4 | 14% | 3% |
1 Calculated based on average shares outstanding.
2 Total returns do not include account service fees that may have applied in the periods shown. Fund prospectuses provide information about any applicable account service fees.
3 Excludes the value of mutual fund shares delivered and received in connection with a change in the fund’s international equity investments from Vanguard European, Pacific, and Emerging Markets Stock Index Funds to Vanguard Total International Stock Index Fund because those transactions were effected in kind and did not cause the fund to incur transaction costs.
4 Excludes the value of mutual fund shares delivered and received in connection with a change in the fund’s bond investments from Vanguard Total Bond Market Index Fund to Vanguard Total Bond Market II Index Fund because those transactions were effected in kind and did not cause the fund to incur transaction costs.
See accompanying Notes, which are an integral part of the Financial Statements.
16
Target Retirement Income Fund
Notes to Financial Statements
Vanguard Target Retirement Income Fund is registered under the Investment Company Act of 1940 as an open-end investment company, or mutual fund. The fund follows a balanced investment strategy by investing in selected Vanguard funds to achieve its targeted allocation of assets to U.S. stocks, international stocks, bonds, and short-term reserves.
A. The following significant accounting policies conform to generally accepted accounting principles for U.S. mutual funds. The fund consistently follows such policies in preparing its financial statements.
1. Security Valuation: Investments are valued at the net asset value of each underlying Vanguard fund determined as of the close of the New York Stock Exchange (generally 4 p.m., Eastern time) on the valuation date.
2. Federal Income Taxes: The fund intends to continue to qualify as a regulated investment company and distribute all of its taxable income. Management has analyzed the fund’s tax positions taken for all open federal income tax years (September 30, 2008–2011), and has concluded that no provision for federal income tax is required in the fund’s financial statements.
3. Distributions: Distributions to shareholders are recorded on the ex-dividend date.
4. Other: Income and capital gain distributions received are recorded on the ex-dividend date. Security transactions are accounted for on the date securities are bought or sold. Costs used to determine realized gains (losses) on the sale of investment securities are those of the specific securities sold.
B. Under a service agreement, The Vanguard Group furnishes investment advisory, corporate management, administrative, marketing, and distribution services to the fund. The service agreement provides that the fund’s expenses may be reduced or eliminated to the extent of savings realized by the Vanguard funds by the operation of the fund. Accordingly, all incremental expenses for services provided by Vanguard and all other expenses incurred by the fund during the year ended September 30, 2011, were borne by the funds in which the fund invests. The fund’s trustees and officers are also directors and officers of Vanguard and the funds in which the fund invests.
C. Various inputs may be used to determine the value of the fund’s investments. These inputs are summarized in three broad levels for financial statement purposes. The inputs or methodologies used to value securities are not necessarily an indication of the risk associated with investing in those securities.
Level 1—Quoted prices in active markets for identical securities.
Level 2—Other significant observable inputs (including quoted prices for similar securities, interest rates, prepayment speeds, credit risk, etc.).
Level 3—Significant unobservable inputs (including the fund’s own assumptions used to determine the fair value of investments).
At September 30, 2011, 100% of the market value of the fund’s investments was based on Level 1 inputs.
D. Distributions are determined on a tax basis and may differ from net investment income and realized capital gains for financial reporting purposes. Differences may be permanent or temporary. Permanent differences are reclassified among capital accounts in the financial statements to reflect their tax character. Temporary differences arise when certain items of income, expense, gain, or loss are recognized in different periods for financial statement and tax purposes; these differences will reverse at some time in the future. Differences in classification may also result from the treatment of short-term gains as ordinary income for tax purposes.
17
Target Retirement Income Fund
For tax purposes, at September 30, 2011, the fund had $2,054,000 of ordinary income available for distribution. Tax-basis amounts required to be distributed in December 2010 included short-term gain distributions received from Vanguard Total Bond Market II Index Fund in December 2010. Short-term capital gain distributions received are treated as ordinary income for tax purposes, and cannot be offset by capital losses. At September 30, 2011, the fund had available capital loss carryforwards totaling $11,953,000 to offset future net capital gains through September 30, 2018. In addition, the fund realized losses of $3,623,000 during the period from November 1, 2010, through September 30, 2011, which are deferred and will be treated as realized for tax purposes in fiscal 2012.
At September 30, 2011, the cost of investment securities for tax purposes was $4,589,570,000. Net unrealized appreciation of investment securities for tax purposes was $171,956,000, consisting of unrealized gains of $254,813,000 on securities that had risen in value since their purchase and $82,857,000 in unrealized losses on securities that had fallen in value since their purchase.
E. During the year ended September 30, 2011, the fund purchased $1,958,654,000 of investment securities and sold $822,849,000 of investment securities, other than temporary cash investments.
F. Capital shares issued and redeemed were:
| | |
| | Year Ended September 30, |
| | 2011 | 2010 |
| | Shares | Shares |
| | (000) | (000) |
| Issued | 187,588 | 155,610 |
| Issued in Lieu of Cash Distributions | 10,255 | 7,185 |
| Redeemed | (98,730) | (72,208) |
| Net Increase (Decrease) in Shares Outstanding | 99,113 | 90,587 |
G. In preparing the financial statements as of September 30, 2011, management considered the impact of subsequent events for potential recognition or disclosure in these financial statements.
18
Target Retirement 2005 Fund
Fund Profile
As of September 30, 2011
| |
| Total Fund Characteristics | |
| Ticker Symbol | VTOVX |
| 30-Day SEC Yield | 2.67% |
| Acquired Fund Fees and Expenses1 | 0.17% |
| |
| Allocation to Underlying Vanguard Funds | |
| Vanguard Total Bond Market II Index Fund | |
| Investor Shares | 44.8% |
| Vanguard Total Stock Market Index Fund | |
| Investor Shares | 22.2 |
| Vanguard Inflation-Protected Securities | |
| Fund Investor Shares | 19.0 |
| Vanguard Total International Stock Index | |
| Fund Investor Shares | 9.5 |
| Vanguard Prime Money Market Fund | |
| Investor Shares | 4.5 |
| | |
| Total Fund Volatility Measures | |
| | | DJ |
| | Target 2005 | U.S. Total |
| | Composite | Market |
| | Index | Index |
| R-Squared | 1.00 | 0.87 |
| Beta | 1.00 | 0.42 |
These measures show the degree and timing of the fund’s fluctuations compared with the indexes over 36 months.
Fund Asset Allocation
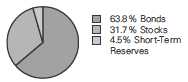
1 This figure—drawn from the prospectus dated January 26, 2011—represents an estimate of the weighted average of the expense ratios and any transaction fees charged by the underlying mutual funds (the ”acquired” funds) in which the Target Retirement 2005 Fund invests. The fund does not charge any expenses or fees of its own. For the fiscal year ended September 30, 2011, the acquired fund fees and expenses were 0.17%.
19
Target Retirement 2005 Fund
Performance Summary
All of the returns in this report represent past performance, which is not a guarantee of future results that may be achieved by the fund. (Current performance may be lower or higher than the performance data cited. For performance data current to the most recent month-end, visit our website at vanguard.com/performance.) Note, too, that both investment returns and principal value can fluctuate widely, so an investor’s shares, when sold, could be worth more or less than their original cost. The returns shown do not reflect taxes that a shareholder would pay on fund distributions or on the sale of fund shares.
Cumulative Performance: October 27, 2003, Through September 30, 2011
Initial Investment of $10,000
| | | | |
| | Average Annual Total Returns | |
| | Periods Ended September 30, 2011 | |
| | | | Since | Final Value |
| | One | Five | Inception | of a $10,000 |
| | Year | Years | (10/27/2003) | Investment |
| Target Retirement 2005 Fund | 3.92% | 4.02% | 4.96% | $14,679 |
| Dow Jones U.S. Total Stock Market | | | | |
| Index | 0.31 | -0.57 | 3.94 | 13,581 |
| Target 2005 Composite Index | 3.81 | 3.96 | 5.00 | 14,716 |
| Mixed-Asset Target Allocation | | | | |
| Conservative Funds Average | 0.88 | 2.47 | 3.50 | 13,138 |
| "Since Inception" performance is calculated from the fund’s inception date for both the fund and its comparative standards. | |
Target 2005 Composite Index: Derived by applying the fund’s target asset allocation to the results of the following benchmarks: for international stocks of developed markets, the MSCI EAFE Index through December 15, 2010, and the MSCI ACWI ex USA IMI Index thereafter; for emerging markets stocks, the Select Emerging Markets Index through August 23, 2006, the MSCI Emerging Markets Index through December 15, 2010, and the MSCI ACWI ex USA IMI Index thereafter; for bonds, the Barclays Capital U.S. Aggregate Bond Index through December 31, 2009, and the Barclays Capital U.S. Aggregate Float Adjusted Index thereafter, as well as the Barclays Capital U.S. Treasury Inflation Protected Securities Index; for short-term reserves, the Citigroup Three-Month Treasury Bill Index; and for U.S. stocks, the Dow Jones Wilshire 5000 Index through April 22, 2005, and the MSCI US Broad Market Index thereafter. MSCI international benchmark returns are adjusted for withholding taxes applicable to Luxembourg holding companies.
Mixed-Asset Target Allocation Conservative Funds Average: Derived from data provided by Lipper Inc.
See Financial Highlights for dividend and capital gains information.
20
Target Retirement 2005 Fund
Fiscal-Year Total Returns (%): October 27, 2003, Through September 30, 2011
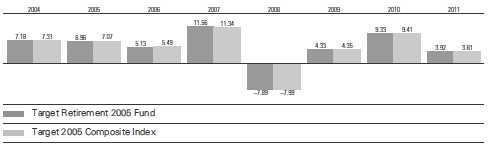
21
Target Retirement 2005 Fund
Financial Statements
Statement of Net Assets
As of September 30, 2011
The fund reports a complete list of its holdings in regulatory filings four times in each fiscal year, at the quarter-ends. For the second and fourth fiscal quarters, the lists appear in the fund’s semiannual and annual reports to shareholders. For the first and third fiscal quarters, the fund files the lists with the Securities and Exchange Commission on Form N-Q. Shareholders can look up the fund’s Forms N-Q on the SEC’s website at sec.gov. Forms N-Q may also be reviewed and copied at the SEC’s Public Reference Room (see the back cover of this report for further information).
| | |
| | | Market |
| | | Value |
| | Shares | ($000) |
| Investment Companies (100.0%) | | |
| U.S. Stock Fund (22.2%) | | |
| Vanguard Total Stock Market Index Fund Investor Shares | 17,396,090 | 488,308 |
| |
| International Stock Fund (9.5%) | | |
| Vanguard Total International Stock Index Fund Investor Shares | 16,079,458 | 207,747 |
| |
| Bond Funds (63.8%) | | |
| 1 Vanguard Total Bond Market II Index Fund Investor Shares | 90,105,660 | 985,756 |
| Vanguard Inflation-Protected Securities Fund Investor Shares | 29,861,385 | 417,462 |
| | | 1,403,218 |
| Money Market Fund (4.5%) | | |
| Vanguard Prime Money Market Fund Investor Shares | 99,083,736 | 99,084 |
| Total Investment Companies (Cost $2,079,484) | | 2,198,357 |
| Other Assets and Liabilities (0.0%) | | |
| Other Assets | | 6,828 |
| Liabilities | | (5,861) |
| | | 967 |
| Net Assets (100%) | | |
| Applicable to 185,630,038 outstanding $.001 par value shares of | | |
| beneficial interest (unlimited authorization) | | 2,199,324 |
| Net Asset Value Per Share | | $11.85 |
| |
| At September 30, 2011, net assets consisted of: | |
| | Amount |
| | ($000) |
| Paid-in Capital | 2,098,644 |
| Undistributed Net Investment Income | 39,595 |
| Accumulated Net Realized Losses | (57,788) |
| Unrealized Appreciation (Depreciation) | 118,873 |
| Net Assets | 2,199,324 |
See Note A in Notes to Financial Statements.
1 Affiliated fund available only to Vanguard funds and certain trusts and accounts managed by Vanguard.
See accompanying Notes, which are an integral part of the Financial Statements.
22
Target Retirement 2005 Fund
| |
| Statement of Operations | |
| |
| | Year Ended |
| | September 30, 2011 |
| | ($000) |
| Investment Income | |
| Income | |
| Income Distributions Received | 58,009 |
| Net Investment Income—Note B | 58,009 |
| Realized Net Gain (Loss) | |
| Capital Gain Distributions Received | 6,209 |
| Investment Securities Sold | 16,678 |
| Realized Net Gain (Loss) | 22,887 |
| Change in Unrealized Appreciation (Depreciation) of Investment Securities | 2,922 |
| Net Increase (Decrease) in Net Assets Resulting from Operations | 83,818 |
See accompanying Notes, which are an integral part of the Financial Statements.
23
Target Retirement 2005 Fund
| | |
| Statement of Changes in Net Assets | | |
| |
| |
| | Year Ended September 30, |
| | 2011 | 2010 |
| | ($000) | ($000) |
| Increase (Decrease) in Net Assets | | |
| Operations | | |
| Net Investment Income | 58,009 | 55,145 |
| Realized Net Gain (Loss) | 22,887 | (5,672) |
| Change in Unrealized Appreciation (Depreciation) | 2,922 | 132,956 |
| Net Increase (Decrease) in Net Assets Resulting from Operations | 83,818 | 182,429 |
| Distributions | | |
| Net Investment Income | (53,106) | (48,354) |
| Realized Capital Gain1 | (4,578) | — |
| Total Distributions | (57,684) | (48,354) |
| Capital Share Transactions | | |
| Issued | 611,839 | 732,870 |
| Issued in Lieu of Cash Distributions | 56,617 | 47,561 |
| Redeemed | (693,216) | (531,282) |
| Net Increase (Decrease) from Capital Share Transactions | (24,760) | 249,149 |
| Total Increase (Decrease) | 1,374 | 383,224 |
| Net Assets | | |
| Beginning of Period | 2,197,950 | 1,814,726 |
| End of Period2 | 2,199,324 | 2,197,950 |
1 Includes fiscal 2011 short-term gain distributions totaling $4,578,000. Short-term gain distributions are treated as ordinary income dividends for tax purposes.
2 Net Assets—End of Period includes undistributed net investment income of $39,595,000 and $34,692,000.
See accompanying Notes, which are an integral part of the Financial Statements.
24
Target Retirement 2005 Fund
Financial Highlights
| | | | | |
| For a Share Outstanding | | | Year Ended September 30, |
| Throughout Each Period | 2011 | 2010 | 2009 | 2008 | 2007 |
| Net Asset Value, Beginning of Period | $11.71 | $10.98 | $10.99 | $12.31 | $11.38 |
| Investment Operations | | | | | |
| Net Investment Income | .318 | .293 | .303 | .4391 | .4201 |
| Capital Gain Distributions Received | .033 | — | — | — | — |
| Net Realized and Unrealized Gain (Loss) | | | | | |
| on Investments | .104 | .714 | .114 | (1.379) | .870 |
| Total from Investment Operations | .455 | 1.007 | .417 | (.940) | 1.290 |
| Distributions | | | | | |
| Dividends from Net Investment Income | (.290) | (.277) | (.427) | (.380) | (.360) |
| Distributions from Realized Capital Gains | (.025) | — | — | — | — |
| Total Distributions | (.315) | (.277) | (.427) | (.380) | (.360) |
| Net Asset Value, End of Period | $11.85 | $11.71 | $10.98 | $10.99 | $12.31 |
| |
| Total Return2 | 3.92% | 9.33% | 4.33% | -7.89% | 11.56% |
| |
| Ratios/Supplemental Data | | | | | |
| Net Assets, End of Period (Millions) | $2,199 | $2,198 | $1,815 | $1,767 | $1,473 |
| Ratio of Total Expenses to | | | | | |
| Average Net Assets | — | — | — | — | — |
| Acquired Fund Fees and Expenses | 0.17% | 0.17% | 0.21% | 0.18% | 0.19% |
| Ratio of Net Investment Income to | | | | | |
| Average Net Assets | 2.62% | 2.71% | 2.95% | 3.71% | 3.56% |
| Portfolio Turnover Rate | 27%3 | 21% | 44%4 | 21% | 6% |
1 Calculated based on average shares outstanding.
2 Total returns do not include account service fees that may have applied in the periods shown. Fund prospectuses provide information about any applicable account service fees.
3 Excludes the value of mutual fund shares delivered and received in connection with a change in the fund’s international equity investments from Vanguard European, Pacific, and Emerging Markets Stock Index Funds to Vanguard Total International Stock Index Fund because those transactions were effected in kind and did not cause the fund to incur transaction costs.
4 Excludes the value of mutual fund shares delivered and received in connection with a change in the fund’s bond investments from Vanguard Total Bond Market Index Fund to Vanguard Total Bond Market II Index Fund because those transactions were effected in kind and did not cause the fund to incur transaction costs.
See accompanying Notes, which are an integral part of the Financial Statements.
25
Target Retirement 2005 Fund
Notes to Financial Statements
Vanguard Target Retirement 2005 Fund is registered under the Investment Company Act of 1940 as an open-end investment company, or mutual fund. The fund follows a balanced investment strategy by investing in selected Vanguard funds to achieve its targeted allocation of assets to U.S. stocks, international stocks, bonds, and short-term reserves.
A. The following significant accounting policies conform to generally accepted accounting principles for U.S. mutual funds. The fund consistently follows such policies in preparing its financial statements.
1. Security Valuation: Investments are valued at the net asset value of each underlying Vanguard fund determined as of the close of the New York Stock Exchange (generally 4 p.m., Eastern time) on the valuation date.
2. Federal Income Taxes: The fund intends to continue to qualify as a regulated investment company and distribute all of its taxable income. Management has analyzed the fund’s tax positions taken for all open federal income tax years (September 30, 2008–2011), and has concluded that no provision for federal income tax is required in the fund’s financial statements.
3. Distributions: Distributions to shareholders are recorded on the ex-dividend date.
4. Other: Income and capital gain distributions received are recorded on the ex-dividend date. Security transactions are accounted for on the date securities are bought or sold. Costs used to determine realized gains (losses) on the sale of investment securities are those of the specific securities sold.
B. Under a service agreement, The Vanguard Group furnishes investment advisory, corporate management, administrative, marketing, and distribution services to the fund. The service agreement provides that the fund’s expenses may be reduced or eliminated to the extent of savings realized by the Vanguard funds by the operation of the fund. Accordingly, all incremental expenses for services provided by Vanguard and all other expenses incurred by the fund during the year ended September 30, 2011, were borne by the funds in which the fund invests. The fund’s trustees and officers are also directors and officers of Vanguard and the funds in which the fund invests.
C. Various inputs may be used to determine the value of the fund’s investments. These inputs are summarized in three broad levels for financial statement purposes. The inputs or methodologies used to value securities are not necessarily an indication of the risk associated with investing in those securities.
Level 1—Quoted prices in active markets for identical securities.
Level 2—Other significant observable inputs (including quoted prices for similar securities, interest rates, prepayment speeds, credit risk, etc.).
Level 3—Significant unobservable inputs (including the fund’s own assumptions used to determine the fair value of investments).
At September 30, 2011, 100% of the market value of the fund’s investments was based on Level 1 inputs.
D. Distributions are determined on a tax basis and may differ from net investment income and realized capital gains for financial reporting purposes. Differences may be permanent or temporary. Permanent differences are reclassified among capital accounts in the financial statements to reflect their tax character. Temporary differences arise when certain items of income, expense, gain, or loss are recognized in different periods for financial statement and tax purposes; these differences will reverse at some time in the future. Differences in classification may also result from the treatment of short-term gains as ordinary income for tax purposes.
26
Target Retirement 2005 Fund
For tax purposes, at September 30, 2011, the fund had $39,574,000 of ordinary income available for distribution. Tax-basis amounts required to be distributed in December 2010 included short-term gain distributions received from Vanguard Total Bond Market II Index Fund in December 2010. Short-term capital gain distributions received are treated as ordinary income for tax purposes, and cannot be offset by capital losses. At September 30, 2011, the fund had available capital loss carryforwards totaling $54,857,000 to offset future net capital gains through September 30, 2018.
At September 30, 2011, the cost of investment securities for tax purposes was $2,082,395,000. Net unrealized appreciation of investment securities for tax purposes was $115,962,000 consisting of unrealized gains of $154,794,000 on securities that had risen in value since their purchase and $38,832,000 in unrealized losses on securities that had fallen in value since their purchase.
E. During the year ended September 30, 2011, the fund purchased $756,742,000 of investment securities and sold $775,892,000 of investment securities, other than temporary cash investments.
F. Capital shares issued and redeemed were:
| | |
| | Year Ended September 30, |
| | 2011 | 2010 |
| | Shares | Shares |
| | (000) | (000) |
| Issued | 51,060 | 65,509 |
| Issued in Lieu of Cash Distributions | 4,839 | 4,316 |
| Redeemed | (58,030) | (47,270) |
| Net Increase (Decrease) in Shares Outstanding | (2,131) | 22,555 |
G. In preparing the financial statements as of September 30, 2011, management considered the impact of subsequent events for potential recognition or disclosure in these financial statements.
In September 2011, the fund’s board of trustees approved a plan of reorganization of Vanguard Target Retirement 2005 Fund into Vanguard Target Retirement Income Fund. The reorganization does not require shareholder approval. Shares of Vanguard Target Retirement 2005 Fund will be exchanged for new shares of Vanguard Target Retirement Income Fund. The reorganization is expected to qualify as a tax-free reorganization for federal income tax purposes, and to be completed on or around February 10, 2012. In anticipation of the merger, the Target Retirement 2005 Fund has been closed to new accounts.
27
Target Retirement 2010 Fund
Fund Profile
As of September 30, 2011
| |
| Total Fund Characteristics | |
| Ticker Symbol | VTENX |
| 30-Day SEC Yield | 2.58% |
| Acquired Fund Fees and Expenses1 | 0.17% |
| |
| Allocation to Underlying Vanguard Funds | |
| Vanguard Total Bond Market II Index Fund | |
| Investor Shares | 41.4% |
| Vanguard Total Stock Market Index Fund | |
| Investor Shares | 32.0 |
| Vanguard Total International Stock Index | |
| Fund Investor Shares | 13.9 |
| Vanguard Inflation-Protected Securities | |
| Fund Investor Shares | 11.8 |
| Vanguard Prime Money Market Fund | |
| Investor Shares | 0.9 |
| | |
| Total Fund Volatility Measures | |
| | | DJ |
| | Target 2010 | U.S. Total |
| | Composite | Market |
| | Index | Index |
| R-Squared | 1.00 | 0.94 |
| Beta | 1.00 | 0.55 |
These measures show the degree and timing of the fund’s fluctuations compared with the indexes over 36 months.
Fund Asset Allocation
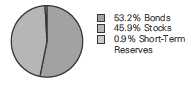
1 This figure—drawn from the prospectus dated January 26, 2011—represents an estimate of the weighted average of the expense ratios and any transaction fees charged by the underlying mutual funds (the ”acquired” funds) in which the Target Retirement 2010 Fund invests. The fund does not charge any expenses or fees of its own. For the fiscal year ended September 30, 2011, the acquired fund fees and expenses were 0.17%.
28
Target Retirement 2010 Fund
Performance Summary
All of the returns in this report represent past performance, which is not a guarantee of future results that may be achieved by the fund. (Current performance may be lower or higher than the performance data cited. For performance data current to the most recent month-end, visit our website at vanguard.com/performance.) Note, too, that both investment returns and principal value can fluctuate widely, so an investor’s shares, when sold, could be worth more or less than their original cost. The returns shown do not reflect taxes that a shareholder would pay on fund distributions or on the sale of fund shares.
Cumulative Performance: June 7, 2006, Through September 30, 2011
Initial Investment of $10,000
| | | | |
| | Average Annual Total Returns | |
| | Periods Ended September 30, 2011 | |
| | | | Since | Final Value |
| | One | Five | Inception | of a $10,000 |
| | Year | Years | (6/7/2006) | Investment |
| Target Retirement 2010 Fund | 2.68% | 3.17% | 3.94% | $12,282 |
| Dow Jones U.S. Total Stock Market | | | | |
| Index | 0.31 | -0.57 | 0.53 | 10,283 |
| Target 2010 Composite Index | 2.57 | 3.12 | 3.88 | 12,241 |
| Mixed-Asset Target 2010 Funds | | | | |
| Average | 0.34 | 1.67 | 2.44 | 11,364 |
| "Since Inception" performance is calculated from the fund’s inception date for both the fund and its comparative standards. | |
Target 2010 Composite Index: Derived by applying the fund’s target asset allocation to the results of the following benchmarks: for international stocks of developed markets, the MSCI EAFE Index through December 15, 2010, and the MSCI ACWI ex USA IMI Index thereafter; for emerging markets stocks, the Select Emerging Markets Index through August 23, 2006, the MSCI Emerging Markets Index through December 15, 2010, and the MSCI ACWI ex USA IMI Index thereafter; for bonds, the Barclays Capital U.S. Aggregate Bond Index through December 31, 2009, and the Barclays Capital U.S. Aggregate Float Adjusted Index thereafter, as well as the Barclays Capital U.S. Treasury Inflation Protected Securities Index; for short-term reserves, the Citigroup Three-Month Treasury Bill Index; and for U.S. stocks, the MSCI US Broad Market Index. MSCI international benchmark returns are adjusted for withholding taxes applicable to Luxembourg holding companies.
Mixed-Asset Target 2010 Funds Average: Derived from data provided by Lipper Inc.
See Financial Highlights for dividend and capital gains information.
29
Target Retirement 2010 Fund
Fiscal-Year Total Returns (%): June 7, 2006, Through September 30, 2011
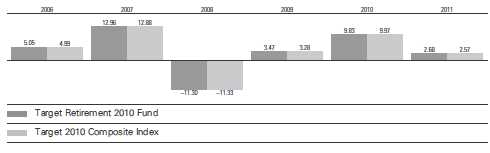
30
Target Retirement 2010 Fund
Financial Statements
Statement of Net Assets
As of September 30, 2011
The fund reports a complete list of its holdings in regulatory filings four times in each fiscal year, at the quarter-ends. For the second and fourth fiscal quarters, the lists appear in the fund’s semiannual and annual reports to shareholders. For the first and third fiscal quarters, the fund files the lists with the Securities and Exchange Commission on Form N-Q. Shareholders can look up the fund’s Forms N-Q on the SEC’s website at sec.gov. Forms N-Q may also be reviewed and copied at the SEC’s Public Reference Room (see the back cover of this report for further information).
| | |
| | | Market |
| | | Value |
| | Shares | ($000) |
| Investment Companies (100.0%) | | |
| U.S. Stock Fund (32.0%) | | |
| Vanguard Total Stock Market Index Fund Investor Shares | 54,100,800 | 1,518,610 |
| |
| International Stock Fund (13.9%) | | |
| Vanguard Total International Stock Index Fund Investor Shares | 50,946,685 | 658,231 |
| |
| Bond Funds (53.2%) | | |
| 1 Vanguard Total Bond Market II Index Fund Investor Shares | 179,627,717 | 1,965,127 |
| Vanguard Inflation-Protected Securities Fund Investor Shares | 40,183,106 | 561,760 |
| | | 2,526,887 |
| Money Market Funds (0.9%) | | |
| Vanguard Prime Money Market Fund Investor Shares | 43,672,000 | 43,672 |
| 1 Vanguard Market Liquidity Fund, 0.144% | 645,359 | 645 |
| | | 44,317 |
| Total Investment Companies (Cost $4,713,469) | | 4,748,045 |
| Other Assets and Liabilities (0.0%) | | |
| Other Assets | | 12,436 |
| Liabilities | | (13,105) |
| | | (669) |
| Net Assets (100%) | | |
| Applicable to 216,654,867 outstanding $.001 par value shares of | | |
| beneficial interest (unlimited authorization) | | 4,747,376 |
| Net Asset Value Per Share | | $21.91 |
31
Target Retirement 2010 Fund
| |
| At September 30, 2011, net assets consisted of: | |
| | Amount |
| | ($000) |
| Paid-in Capital | 4,726,176 |
| Undistributed Net Investment Income | 79,702 |
| Accumulated Net Realized Losses | (93,078) |
| Unrealized Appreciation (Depreciation) | 34,576 |
| Net Assets | 4,747,376 |
See Note A in Notes to Financial Statements.
1 Affiliated fund available only to Vanguard funds and certain trusts and accounts managed by Vanguard. Rate shown for Vanguard Market Liquidity Fund is the 7-day yield.
See accompanying Notes, which are an integral part of the Financial Statements.
32
Target Retirement 2010 Fund
| |
| Statement of Operations | |
| |
| | Year Ended |
| | September 30, 2011 |
| | ($000) |
| Investment Income | |
| Income | |
| Income Distributions Received | 116,426 |
| Net Investment Income—Note B | 116,426 |
| Realized Net Gain (Loss) | |
| Capital Gain Distributions Received | 11,588 |
| Investment Securities Sold | (29,452) |
| Realized Net Gain (Loss) | (17,864) |
| Change in Unrealized Appreciation (Depreciation) of Investment Securities | (1,898) |
| Net Increase (Decrease) in Net Assets Resulting from Operations | 96,664 |
See accompanying Notes, which are an integral part of the Financial Statements.
33
Target Retirement 2010 Fund
| | |
| Statement of Changes in Net Assets | | |
| |
| |
| | Year Ended September 30, |
| | 2011 | 2010 |
| | ($000) | ($000) |
| Increase (Decrease) in Net Assets | | |
| Operations | | |
| Net Investment Income | 116,426 | 99,252 |
| Realized Net Gain (Loss) | (17,864) | (24,327) |
| Change in Unrealized Appreciation (Depreciation) | (1,898) | 274,253 |
| Net Increase (Decrease) in Net Assets Resulting from Operations | 96,664 | 349,178 |
| Distributions | | |
| Net Investment Income | (100,684) | (80,923) |
| Realized Capital Gain1 | (8,472) | — |
| Total Distributions | (109,156) | (80,923) |
| Capital Share Transactions | | |
| Issued | 1,835,448 | 1,813,457 |
| Issued in Lieu of Cash Distributions | 107,920 | 80,380 |
| Redeemed | (1,430,032) | (980,136) |
| Net Increase (Decrease) from Capital Share Transactions | 513,336 | 913,701 |
| Total Increase (Decrease) | 500,844 | 1,181,956 |
| Net Assets | | |
| Beginning of Period | 4,246,532 | 3,064,576 |
| End of Period2 | 4,747,376 | 4,246,532 |
1 Includes fiscal 2011 short-term gain distributions totaling $8,472,000. Short-term gain distributions are treated as ordinary income dividends for tax purposes.
2 Net Assets—End of Period includes undistributed net investment income of $79,702,000 and $63,960,000.
See accompanying Notes, which are an integral part of the Financial Statements.
34
Target Retirement 2010 Fund
Financial Highlights
| | | | | |
| For a Share Outstanding | | | Year Ended September 30, |
| Throughout Each Period | 2011 | 2010 | 2009 | 2008 | 2007 |
| Net Asset Value, Beginning of Period | $21.87 | $20.39 | $20.47 | $23.54 | $21.01 |
| Investment Operations | | | | | |
| Net Investment Income | .5601 | .520 | .553 | .7441 | .7301 |
| Capital Gain Distributions Received | .0561 | — | — | — | — |
| Net Realized and Unrealized Gain (Loss) | | | | | |
| on Investments | (.022) | 1.455 | .046 | (3.354) | 1.980 |
| Total from Investment Operations | .594 | 1.975 | .599 | (2.610) | 2.710 |
| Distributions | | | | | |
| Dividends from Net Investment Income | (.511) | (.495) | (.679) | (.460) | (.180) |
| Distributions from Realized Capital Gains | (.043) | — | — | — | — |
| Total Distributions | (.554) | (.495) | (.679) | (.460) | (.180) |
| Net Asset Value, End of Period | $21.91 | $21.87 | $20.39 | $20.47 | $23.54 |
| |
| Total Return2 | 2.68% | 9.83% | 3.47% | -11.30% | 12.96% |
| |
| Ratios/Supplemental Data | | | | | |
| Net Assets, End of Period (Millions) | $4,747 | $4,247 | $3,065 | $2,567 | $1,297 |
| Ratio of Total Expenses to | | | | | |
| Average Net Assets | — | — | — | — | — |
| Acquired Fund Fees and Expenses | 0.17% | 0.17% | 0.21% | 0.19% | 0.20% |
| Ratio of Net Investment Income to | | | | | |
| Average Net Assets | 2.46% | 2.67% | 3.15% | 3.34% | 3.26% |
| Portfolio Turnover Rate | 27%3 | 19% | 41%4 | 18% | 4% |
1 Calculated based on average shares outstanding.
2 Total returns do not include account service fees that may have applied in the periods shown. Fund prospectuses provide information about any applicable account service fees.
3 Excludes the value of mutual fund shares delivered and received in connection with a change in the fund’s international equity investments from Vanguard European, Pacific, and Emerging Markets Stock Index Funds to Vanguard Total International Stock Index Fund because those transactions were effected in kind and did not cause the fund to incur transaction costs.
4 Excludes the value of mutual fund shares delivered and received in connection with a change in the fund’s bond investments from Vanguard Total Bond Market Index Fund to Vanguard Total Bond Market II Index Fund because those transactions were effected in kind and did not cause the fund to incur transaction costs.
See accompanying Notes, which are an integral part of the Financial Statements.
35
Target Retirement 2010 Fund
Notes to Financial Statements
Vanguard Target Retirement 2010 Fund is registered under the Investment Company Act of 1940 as an open-end investment company, or mutual fund. The fund follows a balanced investment strategy by investing in selected Vanguard funds to achieve its targeted allocation of assets to U.S. stocks, international stocks, bonds, and short-term reserves.
A. The following significant accounting policies conform to generally accepted accounting principles for U.S. mutual funds. The fund consistently follows such policies in preparing its financial statements.
1. Security Valuation: Investments are valued at the net asset value of each underlying Vanguard fund determined as of the close of the New York Stock Exchange (generally 4 p.m., Eastern time) on the valuation date.
2. Federal Income Taxes: The fund intends to continue to qualify as a regulated investment company and distribute all of its taxable income. Management has analyzed the fund’s tax positions taken for all open federal income tax years (September 30, 2008–2011), and has concluded that no provision for federal income tax is required in the fund’s financial statements.
3. Distributions: Distributions to shareholders are recorded on the ex-dividend date.
4. Other: Income and capital gain distributions received are recorded on the ex-dividend date. Security transactions are accounted for on the date securities are bought or sold. Costs used to determine realized gains (losses) on the sale of investment securities are those of the specific securities sold.
B. Under a service agreement, The Vanguard Group furnishes investment advisory, corporate management, administrative, marketing, and distribution services to the fund. The service agreement provides that the fund’s expenses may be reduced or eliminated to the extent of savings realized by the Vanguard funds by the operation of the fund. Accordingly, all incremental expenses for services provided by Vanguard and all other expenses incurred by the fund during the year ended September 30, 2011, were borne by the funds in which the fund invests. The fund’s trustees and officers are also directors and officers of Vanguard and the funds in which the fund invests.
C. Various inputs may be used to determine the value of the fund’s investments. These inputs are summarized in three broad levels for financial statement purposes. The inputs or methodologies used to value securities are not necessarily an indication of the risk associated with investing in those securities.
Level 1—Quoted prices in active markets for identical securities.
Level 2—Other significant observable inputs (including quoted prices for similar securities, interest rates, prepayment speeds, credit risk, etc.).
Level 3—Significant unobservable inputs (including the fund’s own assumptions used to determine the fair value of investments).
At September 30, 2011, 100% of the market value of the fund’s investments was based on Level 1 inputs.
D. Distributions are determined on a tax basis and may differ from net investment income and realized capital gains for financial reporting purposes. Differences may be permanent or temporary. Permanent differences are reclassified among capital accounts in the financial statements to reflect their tax character. Temporary differences arise when certain items of income, expense, gain, or loss are recognized in different periods for financial statement and tax purposes; these differences will reverse at some time in the future. Differences in classification may also result from the treatment of short-term gains as ordinary income for tax purposes.
36
Target Retirement 2010 Fund
For tax purposes, at September 30, 2011, the fund had $79,770,000 of ordinary income available for distribution. Tax-basis amounts required to be distributed in December 2010 included short-term gain distributions received from Vanguard Total Bond Market II Index Fund in December 2010. Short-term capital gain distributions received are treated as ordinary income for tax purposes, and cannot be offset by capital losses. At September 30, 2011, the fund had available capital loss carryforwards totaling $47,220,000 to offset future net capital gains of $5,639,000 through September 30, 2017, $26,042,000 through September 30, 2018, and $15,539,000 through September 30, 2019. In addition, the fund realized losses of $29,938,000 during the period from November 1, 2010, through September 30, 2011, which are deferred and will be treated as realized for tax purposes in fiscal 2012.
At September 30, 2011, the cost of investment securities for tax purposes was $4,729,456,000. Net unrealized appreciation of investment securities for tax purposes was $18,589,000, consisting of unrealized gains of $198,263,000 on securities that had risen in value since their purchase and $179,674,000 in unrealized losses on securities that had fallen in value since their purchase.
E. During the year ended September 30, 2011, the fund purchased $2,205,690,000 of investment securities and sold $1,676,163,000 of investment securities, other than temporary cash investments.
F. Capital shares issued and redeemed were:
| | |
| | Year Ended September 30, |
| | 2011 | 2010 |
| | Shares | Shares |
| | (000) | (000) |
| Issued | 80,703 | 86,856 |
| Issued in Lieu of Cash Distributions | 4,848 | 3,896 |
| Redeemed | (63,101) | (46,824) |
| Net Increase (Decrease) in Shares Outstanding | 22,450 | 43,928 |
G. In preparing the financial statements as of September 30, 2011, management considered the impact of subsequent events for potential recognition or disclosure in these financial statements.
37
Target Retirement 2015 Fund
Fund Profile
As of September 30, 2011
| |
| Total Fund Characteristics | |
| Ticker Symbol | VTXVX |
| 30-Day SEC Yield | 2.42% |
| Acquired Fund Fees and Expenses1 | 0.16% |
| |
| Allocation to Underlying Vanguard Funds | |
| Vanguard Total Bond Market II Index Fund | |
| Investor Shares | 40.7% |
| Vanguard Total Stock Market Index Fund | |
| Investor Shares | 39.8 |
| Vanguard Total International Stock Index | |
| Fund Investor Shares | 17.0 |
| Vanguard Inflation-Protected Securities | |
| Fund Investor Shares | 2.5 |
| | |
| Total Fund Volatility Measures | |
| | | DJ |
| | Target 2015 | U.S. Total |
| | Composite | Market |
| | Index | Index |
| R-Squared | 1.00 | 0.97 |
| Beta | 1.00 | 0.64 |
These measures show the degree and timing of the fund’s fluctuations compared with the indexes over 36 months.
Fund Asset Allocation
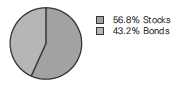
1 This figure—drawn from the prospectus dated January 26, 2011—represents an estimate of the weighted average of the expense ratios and any transaction fees charged by the underlying mutual funds (the ”acquired” funds) in which the Target Retirement 2015 Fund invests. The fund does not charge any expenses or fees of its own. For the fiscal year ended September 30, 2011, the acquired fund fees and expenses were 0.17%.
38
Target Retirement 2015 Fund
Performance Summary
All of the returns in this report represent past performance, which is not a guarantee of future results that may be achieved by the fund. (Current performance may be lower or higher than the performance data cited. For performance data current to the most recent month-end, visit our website at vanguard.com/performance.) Note, too, that both investment returns and principal value can fluctuate widely, so an investor’s shares, when sold, could be worth more or less than their original cost. The returns shown do not reflect taxes that a shareholder would pay on fund distributions or on the sale of fund shares.
Cumulative Performance: October 27, 2003, Through September 30, 2011
Initial Investment of $10,000
| | | | |
| | Average Annual Total Returns | |
| | Periods Ended September 30, 2011 | |
| | | | Since | Final Value |
| | One | Five | Inception | of a $10,000 |
| | Year | Years | (10/27/2003) | Investment |
| Target Retirement 2015 Fund | 1.40% | 2.43% | 4.61% | $14,291 |
| Dow Jones U.S. Total Stock Market | | | | |
| Index | 0.31 | -0.57 | 3.94 | 13,581 |
| Target 2015 Composite Index | 1.23 | 2.31 | 4.55 | 14,234 |
| Mixed-Asset Target 2015 Funds | | | | |
| Average | 0.15 | 1.01 | 3.66 | 13,300 |
| "Since Inception" performance is calculated from the fund’s inception date for both the fund and its comparative standards. | |
Target 2015 Composite Index: Derived by applying the fund’s target asset allocation to the results of the following benchmarks: for international stocks of developed markets, the MSCI EAFE Index through December 15, 2010, and the MSCI ACWI ex USA IMI Index thereafter; for emerging markets stocks, the Select Emerging Markets Index through August 23, 2006, the MSCI Emerging Markets Index through December 15, 2010, and the MSCI ACWI ex USA IMI Index thereafter; for bonds, the Barclays Capital U.S. Aggregate Bond Index through December 31, 2009, and the Barclays Capital U.S. Aggregate Float Adjusted Index thereafter, as well as the Barclays Capital U.S. Treasury Inflation Protected Securities Index; and for U.S. stocks, the Dow Jones Wilshire 5000 Index through April 22, 2005, and the MSCI US Broad Market Index thereafter. MSCI international benchmark returns are adjusted for withholding taxes applicable to Luxembourg holding companies.
Mixed-Asset Target 2015 Funds Average: Derived from data provided by Lipper Inc.
See Financial Highlights for dividend and capital gains information.
39
Target Retirement 2015 Fund
Fiscal-Year Total Returns (%): October 27, 2003, Through September 30, 2011
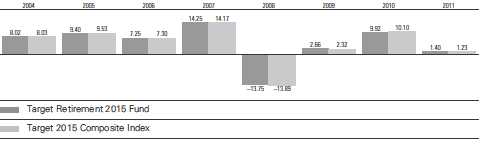
40
Target Retirement 2015 Fund
Financial Statements
Statement of Net Assets
As of September 30, 2011
The fund reports a complete list of its holdings in regulatory filings four times in each fiscal year, at the quarter-ends. For the second and fourth fiscal quarters, the lists appear in the fund’s semiannual and annual reports to shareholders. For the first and third fiscal quarters, the fund files the lists with the Securities and Exchange Commission on Form N-Q. Shareholders can look up the fund’s Forms N-Q on the SEC’s website at sec.gov. Forms N-Q may also be reviewed and copied at the SEC’s Public Reference Room (see the back cover of this report for further information).
| | |
| | | Market |
| | | Value |
| | Shares | ($000) |
| Investment Companies (100.0%) | | |
| U.S. Stock Fund (39.8%) | | |
| Vanguard Total Stock Market Index Fund Investor Shares | 190,517,551 | 5,347,828 |
| |
| International Stock Fund (17.0%) | | |
| Vanguard Total International Stock Index Fund Investor Shares | 176,847,040 | 2,284,864 |
| |
| Bond Funds (43.2%) | | |
| 1 Vanguard Total Bond Market II Index Fund Investor Shares | 498,707,048 | 5,455,855 |
| Vanguard Inflation-Protected Securities Fund Investor Shares | 24,352,273 | 340,445 |
| | | 5,796,300 |
| Total Investment Companies (Cost $13,332,311) | | 13,428,992 |
| Temporary Cash Investment (0.0%) | | |
| Money Market Fund (0.0%) | | |
| 1 Vanguard Market Liquidity Fund, 0.144% (Cost $690) | 690,000 | 690 |
| Total Investments (100.0%) (Cost $13,333,001) | | 13,429,682 |
| Other Assets and Liabilities (0.0%) | | |
| Other Assets | | 28,786 |
| Liabilities | | (23,774) |
| | | 5,012 |
| Net Assets (100%) | | |
| Applicable to 1,128,488,077 outstanding $.001 par value shares of | | |
| beneficial interest (unlimited authorization) | | 13,434,694 |
| Net Asset Value Per Share | | $11.91 |
41
Target Retirement 2015 Fund
| |
| At September 30, 2011, net assets consisted of: | |
| | Amount |
| | ($000) |
| Paid-in Capital | 13,261,183 |
| Undistributed Net Investment Income | 209,135 |
| Accumulated Net Realized Losses | (132,305) |
| Unrealized Appreciation (Depreciation) | 96,681 |
| Net Assets | 13,434,694 |
See Note A in Notes to Financial Statements.
1 Affiliated fund available only to Vanguard funds and certain trusts and accounts managed by Vanguard. Rate shown for Vanguard Market Liquidity Fund is the 7-day yield.
See accompanying Notes, which are an integral part of the Financial Statements.
42
Target Retirement 2015 Fund
| |
| Statement of Operations | |
| |
| | Year Ended |
| | September 30, 2011 |
| | ($000) |
| Investment Income | |
| Income | |
| Income Distributions Received | 311,191 |
| Net Investment Income—Note B | 311,191 |
| Realized Net Gain (Loss) | |
| Capital Gain Distributions Received | 34,055 |
| Investment Securities Sold | 34,339 |
| Realized Net Gain (Loss) | 68,394 |
| Change in Unrealized Appreciation (Depreciation) of Investment Securities | (276,867) |
| Net Increase (Decrease) in Net Assets Resulting from Operations | 102,718 |
See accompanying Notes, which are an integral part of the Financial Statements.
43
Target Retirement 2015 Fund
| | |
| Statement of Changes in Net Assets | | |
| |
| |
| | Year Ended September 30, |
| | 2011 | 2010 |
| | ($000) | ($000) |
| Increase (Decrease) in Net Assets | | |
| Operations | | |
| Net Investment Income | 311,191 | 288,630 |
| Realized Net Gain (Loss) | 68,394 | (31,485) |
| Change in Unrealized Appreciation (Depreciation) | (276,867) | 806,619 |
| Net Increase (Decrease) in Net Assets Resulting from Operations | 102,718 | 1,063,764 |
| Distributions | | |
| Net Investment Income | (288,841) | (247,227) |
| Realized Capital Gain1 | (25,117) | — |
| Total Distributions | (313,958) | (247,227) |
| Capital Share Transactions | | |
| Issued | 4,194,618 | 3,937,991 |
| Issued in Lieu of Cash Distributions | 311,203 | 246,248 |
| Redeemed | (3,325,763) | (2,042,392) |
| Net Increase (Decrease) from Capital Share Transactions | 1,180,058 | 2,141,847 |
| Total Increase (Decrease) | 968,818 | 2,958,384 |
| Net Assets | | |
| Beginning of Period | 12,465,876 | 9,507,492 |
| End of Period2 | 13,434,694 | 12,465,876 |
1 Includes fiscal 2011 short-term gain distributions totaling $25,117,000. Short-term gain distributions are treated as ordinary income dividends for tax purposes.
2 Net Assets—End of Period includes undistributed net investment income of $209,135,000 and $186,785,000.
See accompanying Notes, which are an integral part of the Financial Statements.
44
Target Retirement 2015 Fund
Financial Highlights
| | | | | |
| For a Share Outstanding | | | Year Ended September 30, |
| Throughout Each Period | 2011 | 2010 | 2009 | 2008 | 2007 |
| Net Asset Value, Beginning of Period | $12.03 | $11.21 | $11.34 | $13.49 | $12.10 |
| Investment Operations | | | | | |
| Net Investment Income | .2831 | .285 | .307 | .3801 | .3801 |
| Capital Gain Distributions Received | .0311 | — | — | — | — |
| Net Realized and Unrealized Gain (Loss) | | | | | |
| on Investments | (.134) | .811 | (.072) | (2.190) | 1.320 |
| Total from Investment Operations | .180 | 1.096 | .235 | (1.810) | 1.700 |
| Distributions | | | | | |
| Dividends from Net Investment Income | (.276) | (.276) | (.365) | (.340) | (.310) |
| Distributions from Realized Capital Gains | (.024) | — | — | — | — |
| Total Distributions | (.300) | (.276) | (.365) | (.340) | (.310) |
| Net Asset Value, End of Period | $11.91 | $12.03 | $11.21 | $11.34 | $13.49 |
| |
| Total Return2 | 1.40% | 9.92% | 2.66% | -13.75% | 14.25% |
| |
| Ratios/Supplemental Data | | | | | |
| Net Assets, End of Period (Millions) | $13,435 | $12,466 | $9,507 | $7,804 | $6,619 |
| Ratio of Total Expenses to | | | | | |
| Average Net Assets | — | — | — | — | — |
| Acquired Fund Fees and Expenses | 0.17% | 0.17% | 0.21% | 0.18% | 0.19% |
| Ratio of Net Investment Income to | | | | | |
| Average Net Assets | 2.24% | 2.62% | 3.31% | 3.02% | 2.93% |
| Portfolio Turnover Rate | 27%3 | 19% | 37%4 | 24% | 5% |
1 Calculated based on average shares outstanding.
2 Total returns do not include account service fees that may have applied in the periods shown. Fund prospectuses provide information about any applicable account service fees.
3 Excludes the value of mutual fund shares delivered and received in connection with a change in the fund’s international equity investments from Vanguard European, Pacific, and Emerging Markets Stock Index Funds to Vanguard Total International Stock Index Fund because those transactions were effected in kind and did not cause the fund to incur transaction costs.
4 Excludes the value of mutual fund shares delivered and received in connection with a change in the fund’s bond investments from Vanguard Total Bond Market Index Fund to Vanguard Total Bond Market II Index Fund because those transactions were effected in kind and did not cause the fund to incur transaction costs.
See accompanying Notes, which are an integral part of the Financial Statements.
45
Target Retirement 2015 Fund
Notes to Financial Statements
Vanguard Target Retirement 2015 Fund is registered under the Investment Company Act of 1940 as an open-end investment company, or mutual fund. The fund follows a balanced investment strategy by investing in selected Vanguard funds to achieve its targeted allocation of assets to U.S. stocks, international stocks, and bonds.
A. The following significant accounting policies conform to generally accepted accounting principles for U.S. mutual funds. The fund consistently follows such policies in preparing its financial statements.
1. Security Valuation: Investments are valued at the net asset value of each underlying Vanguard fund determined as of the close of the New York Stock Exchange (generally 4 p.m., Eastern time) on the valuation date.
2. Federal Income Taxes: The fund intends to continue to qualify as a regulated investment company and distribute all of its taxable income. Management has analyzed the fund’s tax positions taken for all open federal income tax years (September 30, 2008–2011), and has concluded that no provision for federal income tax is required in the fund’s financial statements.
3. Distributions: Distributions to shareholders are recorded on the ex-dividend date.
4. Other: Income and capital gain distributions received are recorded on the ex-dividend date. Security transactions are accounted for on the date securities are bought or sold. Costs used to determine realized gains (losses) on the sale of investment securities are those of the specific securities sold.
B. Under a service agreement, The Vanguard Group furnishes investment advisory, corporate management, administrative, marketing, and distribution services to the fund. The service agreement provides that the fund’s expenses may be reduced or eliminated to the extent of savings realized by the Vanguard funds by the operation of the fund. Accordingly, all incremental expenses for services provided by Vanguard and all other expenses incurred by the fund during the year ended September 30, 2011, were borne by the funds in which the fund invests. The fund’s trustees and officers are also directors and officers of Vanguard and the funds in which the fund invests.
C. Various inputs may be used to determine the value of the fund’s investments. These inputs are summarized in three broad levels for financial statement purposes. The inputs or methodologies used to value securities are not necessarily an indication of the risk associated with investing in those securities.
Level 1—Quoted prices in active markets for identical securities.
Level 2—Other significant observable inputs (including quoted prices for similar securities, interest rates, prepayment speeds, credit risk, etc.).
Level 3—Significant unobservable inputs (including the fund’s own assumptions used to determine the fair value of investments).
At September 30, 2011, 100% of the market value of the fund’s investments was based on Level 1 inputs.
D. Distributions are determined on a tax basis and may differ from net investment income and realized capital gains for financial reporting purposes. Differences may be permanent or temporary. Permanent differences are reclassified among capital accounts in the financial statements to reflect their tax character. Temporary differences arise when certain items of income, expense, gain, or loss are recognized in different periods for financial statement and tax purposes; these differences will reverse at some time in the future. Differences in classification may also result from the treatment of short-term gains as ordinary income for tax purposes.
46
Target Retirement 2015 Fund
For tax purposes, at September 30, 2011, the fund had $209,125,000 of ordinary income available for distribution. Tax-basis amounts required to be distributed in December 2010 included short-term gain distributions received from Vanguard Total Bond Market II Index Fund in December 2010. Short-term capital gain distributions received are treated as ordinary income for tax purposes, and cannot be offset by capital losses. At September 30, 2011, the fund had available capital loss carryforwards totaling $27,719,000 to offset future net capital gains through September 30, 2018. In addition, the fund realized losses of $63,601,000 during the period from November 1, 2010, through September 30, 2011, which are deferred and will be treated as realized for tax purposes in fiscal 2012.
At September 30, 2011, the cost of investment securities for tax purposes was $13,373,976,000. Net unrealized appreciation of investment securities for tax purposes was $55,706,000, consisting of unrealized gains of $514,197,000 on securities that had risen in value since their purchase and $458,491,000 in unrealized losses on securities that had fallen in value since their purchase.
E. During the year ended September 30, 2011, the fund purchased $6,411,453,000 of investment securities and sold $5,202,877,000 of investment securities, other than temporary cash investments.
F. Capital shares issued and redeemed were:
| | |
| | Year Ended September 30, |
| | 2011 | 2010 |
| | Shares | Shares |
| | (000) | (000) |
| Issued | 332,265 | 343,338 |
| Issued in Lieu of Cash Distributions | 25,097 | 21,639 |
| Redeemed | (265,009) | (177,195) |
| Net Increase (Decrease) in Shares Outstanding | 92,353 | 187,782 |
G. In preparing the financial statements as of September 30, 2011, management considered the impact of subsequent events for potential recognition or disclosure in these financial statements.
47
Target Retirement 2020 Fund
Fund Profile
As of September 30, 2011
| |
| Total Fund Characteristics | |
| Ticker Symbol | VTWNX |
| 30-Day SEC Yield | 2.31% |
| Acquired Fund Fees and Expenses1 | 0.17% |
| |
| Allocation to Underlying Vanguard Funds | |
| Vanguard Total Stock Market Index Fund | |
| Investor Shares | 45.6% |
| Vanguard Total Bond Market II Index Fund | |
| Investor Shares | 34.9 |
| Vanguard Total International Stock Index | |
| Fund Investor Shares | 19.5 |
| | |
| Total Fund Volatility Measures | |
| | | DJ |
| | Target 2020 | U.S. Total |
| | Composite | Market |
| | Index | Index |
| R-Squared | 1.00 | 0.98 |
| Beta | 1.01 | 0.72 |
These measures show the degree and timing of the fund’s fluctuations compared with the indexes over 36 months.
Fund Asset Allocation
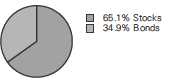
1 This figure—drawn from the prospectus dated January 26, 2011—represents an estimate of the weighted average of the expense ratios and any transaction fees charged by the underlying mutual funds (the ”acquired” funds) in which the Target Retirement 2020 Fund invests. The fund does not charge any expenses or fees of its own. For the fiscal year ended September 30, 2011, the acquired fund fees and expenses were 0.17%.
48
Target Retirement 2020 Fund
Performance Summary
All of the returns in this report represent past performance, which is not a guarantee of future results that may be achieved by the fund. (Current performance may be lower or higher than the performance data cited. For performance data current to the most recent month-end, visit our website at vanguard.com/performance.) Note, too, that both investment returns and principal value can fluctuate widely, so an investor’s shares, when sold, could be worth more or less than their original cost. The returns shown do not reflect taxes that a shareholder would pay on fund distributions or on the sale of fund shares.
Cumulative Performance: June 7, 2006, Through September 30, 2011
Initial Investment of $10,000
| | | | |
| | Average Annual Total Returns | |
| | Periods Ended September 30, 2011 | |
| | | | Since | Final Value |
| | One | Five | Inception | of a $10,000 |
| | Year | Years | (6/7/2006) | Investment |
| Target Retirement 2020 Fund | 0.53% | 1.76% | 2.72% | $11,532 |
| Dow Jones U.S. Total Stock Market | | | | |
| Index | 0.31 | -0.57 | 0.53 | 10,283 |
| Target 2020 Composite Index | 0.79 | 1.78 | 2.74 | 11,545 |
| Mixed-Asset Target 2020 Funds | | | | |
| Average | -0.18 | 0.79 | 1.74 | 10,962 |
| "Since Inception" performance is calculated from the fund’s inception date for both the fund and its comparative standards. | |
Target 2020 Composite Index: Derived by applying the fund’s target asset allocation to the results of the following benchmarks: for international stocks of developed markets, the MSCI EAFE Index through December 15, 2010, and the MSCI ACWI ex USA IMI Index thereafter; for emerging markets stocks, the Select Emerging Markets Index through August 23, 2006, the MSCI Emerging Markets Index through December 15, 2010, and the MSCI ACWI ex USA IMI Index thereafter; for bonds, the Barclays Capital U.S. Aggregate Bond Index through December 31, 2009, and the Barclays Capital U.S. Aggregate Float Adjusted Index thereafter; and for U.S. stocks, the MSCI US Broad Market Index. MSCI international benchmark returns are adjusted for withholding taxes applicable to Luxembourg holding companies. Mixed-Asset Target 2020 Funds Average: Derived from data provided by Lipper Inc.
See Financial Highlights for dividend and capital gains information.
49
Target Retirement 2020 Fund
Fiscal-Year Total Returns (%): June 7, 2006, Through September 30, 2011
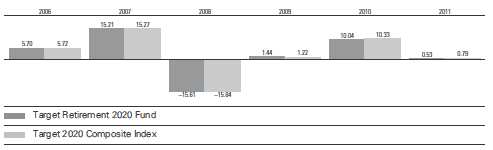
Target Retirement 2020 Fund
Financial Statements
Statement of Net Assets
As of September 30, 2011
The fund reports a complete list of its holdings in regulatory filings four times in each fiscal year, at the quarter-ends. For the second and fourth fiscal quarters, the lists appear in the fund’s semiannual and annual reports to shareholders. For the first and third fiscal quarters, the fund files the lists with the Securities and Exchange Commission on Form N-Q. Shareholders can look up the fund’s Forms N-Q on the SEC’s website at sec.gov. Forms N-Q may also be reviewed and copied at the SEC’s Public Reference Room (see the back cover of this report for further information).
| | |
| | | Market |
| | | Value |
| | Shares | ($000) |
| Investment Companies (100.0%) | | |
| U.S. Stock Fund (45.6%) | | |
| Vanguard Total Stock Market Index Fund Investor Shares | 179,020,366 | 5,025,102 |
| |
| International Stock Fund (19.5%) | | |
| Vanguard Total International Stock Index Fund Investor Shares | 166,269,398 | 2,148,200 |
| |
| Bond Fund (34.9%) | | |
| 1 Vanguard Total Bond Market II Index Fund Investor Shares | 351,994,119 | 3,850,816 |
| Total Investment Companies (Cost $11,182,304) | | 11,024,118 |
| Temporary Cash Investment (0.0%) | | |
| Money Market Fund (0.0%) | | |
| 1 Vanguard Market Liquidity Fund, 0.144% (Cost $1,973) | 1,972,857 | 1,973 |
| Total Investments (100.0%) (Cost $11,184,277) | | 11,026,091 |
| Other Assets and Liabilities (0.0%) | | |
| Other Assets | | 32,671 |
| Liabilities | | (27,239) |
| | | 5,432 |
| Net Assets (100%) | | |
| Applicable to 529,666,764 outstanding $.001 par value shares of | | |
| beneficial interest (unlimited authorization) | | 11,031,523 |
| Net Asset Value Per Share | | $20.83 |
51
Target Retirement 2020 Fund
| |
| At September 30, 2011, net assets consisted of: | |
| | Amount |
| | ($000) |
| Paid-in Capital | 11,150,243 |
| Undistributed Net Investment Income | 154,131 |
| Accumulated Net Realized Losses | (114,665) |
| Unrealized Appreciation (Depreciation) | (158,186) |
| Net Assets | 11,031,523 |
See Note A in Notes to Financial Statements.
1 Affiliated fund available only to Vanguard funds and certain trusts and accounts managed by Vanguard. Rate shown for Vanguard Market Liquidity Fund is the 7-day yield.
See accompanying Notes, which are an integral part of the Financial Statements.
52
Target Retirement 2020 Fund
| |
| Statement of Operations | |
| |
| | Year Ended |
| | September 30, 2011 |
| | ($000) |
| Investment Income | |
| Income | |
| Income Distributions Received | 229,705 |
| Net Investment Income—Note B | 229,705 |
| Realized Net Gain (Loss) | |
| Capital Gain Distributions Received | 21,165 |
| Investment Securities Sold | (41,560) |
| Realized Net Gain (Loss) | (20,395) |
| Change in Unrealized Appreciation (Depreciation) of Investment Securities | (332,355) |
| Net Increase (Decrease) in Net Assets Resulting from Operations | (123,045) |
See accompanying Notes, which are an integral part of the Financial Statements.
53
Target Retirement 2020 Fund
| | |
| Statement of Changes in Net Assets | | |
| |
| |
| | Year Ended September 30, |
| | 2011 | 2010 |
| | ($000) | ($000) |
| Increase (Decrease) in Net Assets | | |
| Operations | | |
| Net Investment Income | 229,705 | 184,448 |
| Realized Net Gain (Loss) | (20,395) | (47,295) |
| Change in Unrealized Appreciation (Depreciation) | (332,355) | 578,699 |
| Net Increase (Decrease) in Net Assets Resulting from Operations | (123,045) | 715,852 |
| Distributions | | |
| Net Investment Income | (195,538) | (141,070) |
| Realized Capital Gain1 | (15,414) | — |
| Total Distributions | (210,952) | (141,070) |
| Capital Share Transactions | | |
| Issued | 4,414,516 | 3,687,694 |
| Issued in Lieu of Cash Distributions | 209,835 | 140,582 |
| Redeemed | (2,149,043) | (1,218,557) |
| Net Increase (Decrease) from Capital Share Transactions | 2,475,308 | 2,609,719 |
| Total Increase (Decrease) | 2,141,311 | 3,184,501 |
| Net Assets | | |
| Beginning of Period | 8,890,212 | 5,705,711 |
| End of Period2 | 11,031,523 | 8,890,212 |
1 Includes fiscal 2011 short-term gain distributions totaling $15,414,000. Short-term gain distributions are treated as ordinary income dividends for tax purposes.
2 Net Assets—End of Period includes undistributed net investment income of $154,131,000 and $119,964,000.
See accompanying Notes, which are an integral part of the Financial Statements.
54
Target Retirement 2020 Fund
Financial Highlights
| | | | | |
| For a Share Outstanding | | | Year Ended September 30, |
| Throughout Each Period | 2011 | 2010 | 2009 | 2008 | 2007 |
| Net Asset Value, Beginning of Period | $21.17 | $19.66 | $20.03 | $24.15 | $21.14 |
| Investment Operations | | | | | |
| Net Investment Income | .4731 | .5101 | .5391 | .6191 | .6001 |
| Capital Gain Distributions Received | .0441 | — | — | — | — |
| Net Realized and Unrealized Gain (Loss) | | | | | |
| on Investments | (.378) | 1.440 | (.360) | (4.329) | 2.600 |
| Total from Investment Operations | .139 | 1.950 | .179 | (3.710) | 3.200 |
| Distributions | | | | | |
| Dividends from Net Investment Income | (.444) | (.440) | (.549) | (.410) | (.190) |
| Distributions from Realized Capital Gains | (.035) | — | — | — | — |
| Total Distributions | (.479) | (.440) | (.549) | (.410) | (.190) |
| Net Asset Value, End of Period | $20.83 | $21.17 | $19.66 | $20.03 | $24.15 |
| |
| Total Return2 | 0.53% | 10.04% | 1.44% | -15.61% | 15.21% |
| |
| Ratios/Supplemental Data | | | | | |
| Net Assets, End of Period (Millions) | $11,032 | $8,890 | $5,706 | $3,859 | $1,719 |
| Ratio of Total Expenses to | | | | | |
| Average Net Assets | — | — | — | — | — |
| Acquired Fund Fees and Expenses | 0.17% | 0.17% | 0.21% | 0.19% | 0.20% |
| Ratio of Net Investment Income to | | | | | |
| Average Net Assets | 2.11% | 2.51% | 3.19% | 2.79% | 2.61% |
| Portfolio Turnover Rate | 23%3 | 14% | 27%4 | 15% | 4% |
1 Calculated based on average shares outstanding.
2 Total returns do not include account service fees that may have applied in the periods shown. Fund prospectuses provide information about any applicable account service fees.
3 Excludes the value of mutual fund shares delivered and received in connection with a change in the fund’s international equity investments from Vanguard European, Pacific, and Emerging Markets Stock Index Funds to Vanguard Total International Stock Index Fund because those transactions were effected in kind and did not cause the fund to incur transaction costs.
4 Excludes the value of mutual fund shares delivered and received in connection with a change in the fund’s bond investments from Vanguard Total Bond Market Index Fund to Vanguard Total Bond Market II Index Fund because those transactions were effected in kind and did not cause the fund to incur transaction costs.
See accompanying Notes, which are an integral part of the Financial Statements.
55
Target Retirement 2020 Fund
Notes to Financial Statements
Vanguard Target Retirement 2020 Fund is registered under the Investment Company Act of 1940 as an open-end investment company, or mutual fund. The fund follows a balanced investment strategy by investing in selected Vanguard funds to achieve its targeted allocation of assets to U.S. stocks, international stocks, and bonds.
A. The following significant accounting policies conform to generally accepted accounting principles for U.S. mutual funds. The fund consistently follows such policies in preparing its financial statements.
1. Security Valuation: Investments are valued at the net asset value of each underlying Vanguard fund determined as of the close of the New York Stock Exchange (generally 4 p.m., Eastern time) on the valuation date.
2. Federal Income Taxes: The fund intends to continue to qualify as a regulated investment company and distribute all of its taxable income. Management has analyzed the fund’s tax positions taken for all open federal income tax years (September 30, 2008–2011), and has concluded that no provision for federal income tax is required in the fund’s financial statements.
3. Distributions: Distributions to shareholders are recorded on the ex-dividend date.
4. Other: Income and capital gain distributions received are recorded on the ex-dividend date. Security transactions are accounted for on the date securities are bought or sold. Costs used to determine realized gains (losses) on the sale of investment securities are those of the specific securities sold.
B. Under a service agreement, The Vanguard Group furnishes investment advisory, corporate management, administrative, marketing, and distribution services to the fund. The service agreement provides that the fund’s expenses may be reduced or eliminated to the extent of savings realized by the Vanguard funds by the operation of the fund. Accordingly, all incremental expenses for services provided by Vanguard and all other expenses incurred by the fund during the year ended September 30, 2011, were borne by the funds in which the fund invests. The fund’s trustees and officers are also directors and officers of Vanguard and the funds in which the fund invests.
C. Various inputs may be used to determine the value of the fund’s investments. These inputs are summarized in three broad levels for financial statement purposes. The inputs or methodologies used to value securities are not necessarily an indication of the risk associated with investing in those securities.
Level 1—Quoted prices in active markets for identical securities.
Level 2—Other significant observable inputs (including quoted prices for similar securities, interest rates, prepayment speeds, credit risk, etc.).
Level 3—Significant unobservable inputs (including the fund’s own assumptions used to determine the fair value of investments).
At September 30, 2011, 100% of the market value of the fund’s investments was based on Level 1 inputs.
D. Distributions are determined on a tax basis and may differ from net investment income and realized capital gains for financial reporting purposes. Differences may be permanent or temporary. Permanent differences are reclassified among capital accounts in the financial statements to reflect their tax character. Temporary differences arise when certain items of income, expense, gain, or loss are recognized in different periods for financial statement and tax purposes; these differences will reverse at some time in the future. Differences in classification may also result from the treatment of short-term gains as ordinary income for tax purposes.
56
Target Retirement 2020 Fund
For tax purposes, at September 30, 2011, the fund had $154,302,000 of ordinary income available for distribution. Tax-basis amounts required to be distributed in December 2010 included short-term gain distributions received from Vanguard Total Bond Market II Index Fund in December 2010. Short-term capital gain distributions received are treated as ordinary income for tax purposes, and cannot be offset by capital losses. At September 30, 2011, the fund had available capital loss carryforwards totaling $32,992,000 to offset future net capital gains of $6,167,000 through September 30, 2017, $21,253,000 through September 30, 2018, and $5,572,000 through September 30, 2019. In addition, the fund realized losses of $40,268,000 during the period from November 1, 2010, through September 30, 2011, which are deferred and will be treated as realized for tax purposes in fiscal 2012.
At September 30, 2011, the cost of investment securities for tax purposes was $11,225,854,000. Net unrealized depreciation of investment securities for tax purposes was $199,763,000, consisting of unrealized gains of $244,409,000 on securities that had risen in value since their purchase and $444,172,000 in unrealized losses on securities that had fallen in value since their purchase.
E. During the year ended September 30, 2011, the fund purchased $6,184,582,000 of investment securities and sold $3,671,065,000 of investment securities, other than temporary cash investments.
F. Capital shares issued and redeemed were:
| | |
| | Year Ended September 30, |
| | 2011 | 2010 |
| | Shares | Shares |
| | (000) | (000) |
| Issued | 196,781 | 182,806 |
| Issued in Lieu of Cash Distributions | 9,508 | 6,998 |
| Redeemed | (96,606) | (60,060) |
| Net Increase (Decrease) in Shares Outstanding | 109,683 | 129,744 |
G. In preparing the financial statements as of September 30, 2011, management considered the impact of subsequent events for potential recognition or disclosure in these financial statements.
57
Target Retirement 2025 Fund
Fund Profile
As of September 30, 2011
| |
| Total Fund Characteristics | |
| Ticker Symbol | VTTVX |
| 30-Day SEC Yield | 2.24% |
| Acquired Fund Fees and Expenses1 | 0.18% |
| |
| Allocation to Underlying Vanguard Funds | |
| Vanguard Total Stock Market Index Fund | |
| Investor Shares | 50.9% |
| Vanguard Total Bond Market II Index Fund | |
| Investor Shares | 27.4 |
| Vanguard Total International Stock Index | |
| Fund Investor Shares | 21.7 |
| | |
| Total Fund Volatility Measures | |
| | | DJ |
| | Target 2025 | U.S. Total |
| | Composite | Market |
| | Index | Index |
| R-Squared | 1.00 | 0.98 |
| Beta | 1.01 | 0.80 |
These measures show the degree and timing of the fund’s fluctuations compared with the indexes over 36 months.
Fund Asset Allocation
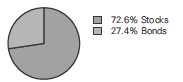
1 This figure—drawn from the prospectus dated January 26, 2011—represents an estimate of the weighted average of the expense ratios and any transaction fees charged by the underlying mutual funds (the ”acquired” funds) in which the Target Retirement 2025 Fund invests. The fund does not charge any expenses or fees of its own. For the fiscal year ended September 30, 2011, the acquired fund fees and expenses were 0.18%.
58
Target Retirement 2025 Fund
Performance Summary
All of the returns in this report represent past performance, which is not a guarantee of future results that may be achieved by the fund. (Current performance may be lower or higher than the performance data cited. For performance data current to the most recent month-end, visit our website at vanguard.com/performance.) Note, too, that both investment returns and principal value can fluctuate widely, so an investor’s shares, when sold, could be worth more or less than their original cost. The returns shown do not reflect taxes that a shareholder would pay on fund distributions or on the sale of fund shares.
Cumulative Performance: October 27, 2003, Through September 30, 2011
Initial Investment of $10,000
| | | | |
| | Average Annual Total Returns | |
| | Periods Ended September 30, 2011 | |
| | | | Since | Final Value |
| | One | Five | Inception | of a $10,000 |
| | Year | Years | (10/27/2003) | Investment |
| Target Retirement 2025 Fund | -0.11% | 1.12% | 4.14% | $13,790 |
| Dow Jones U.S. Total Stock Market | | | | |
| Index | 0.31 | -0.57 | 3.94 | 13,581 |
| Target 2025 Composite Index | 0.17 | 1.15 | 4.18 | 13,830 |
| Mixed-Asset Target 2025 Funds | | | | |
| Average | -1.22 | 0.20 | 3.79 | 13,433 |
| "Since Inception" performance is calculated from the fund’s inception date for both the fund and its comparative standards. | |
Target 2025 Composite Index: Derived by applying the fund’s target asset allocation to the results of the following benchmarks: for international stocks of developed markets, the MSCI EAFE Index through December 15, 2010, and the MSCI ACWI ex USA IMI Index thereafter; for emerging markets stocks, the Select Emerging Markets Index through August 23, 2006, the MSCI Emerging Markets Index through December 15, 2010, and the MSCI ACWI ex USA IMI Index thereafter; for bonds, the Barclays Capital U.S. Aggregate Bond Index through December 31, 2009, and the Barclays Capital U.S. Aggregate Float Adjusted Index thereafter; and for U.S. stocks, the Dow Jones Wilshire 5000 Index through April 22, 2005, and the MSCI US Broad Market Index thereafter. MSCI international benchmark returns are adjusted for withholding taxes applicable to Luxembourg holding companies.
Mixed-Asset Target 2025 Funds Average: Derived from data provided by Lipper Inc.
See Financial Highlights for dividend and capital gains information.
59
Target Retirement 2025 Fund
Fiscal-Year Total Returns (%): October 27, 2003, Through September 30, 2011
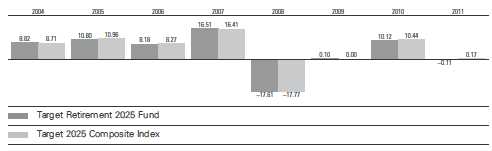
60
Target Retirement 2025 Fund
Financial Statements
Statement of Net Assets
As of September 30, 2011
The fund reports a complete list of its holdings in regulatory filings four times in each fiscal year, at the quarter-ends. For the second and fourth fiscal quarters, the lists appear in the fund’s semiannual and annual reports to shareholders. For the first and third fiscal quarters, the fund files the lists with the Securities and Exchange Commission on Form N-Q. Shareholders can look up the fund’s Forms N-Q on the SEC’s website at sec.gov. Forms N-Q may also be reviewed and copied at the SEC’s Public Reference Room (see the back cover of this report for further information).
| | |
| | | Market |
| | | Value |
| | Shares | ($000) |
| Investment Companies (99.9%) | | |
| U.S. Stock Fund (50.9%) | | |
| Vanguard Total Stock Market Index Fund Investor Shares | 271,705,361 | 7,626,769 |
| |
| International Stock Fund (21.7%) | | |
| Vanguard Total International Stock Index Fund Investor Shares | 251,969,039 | 3,255,440 |
| |
| Bond Fund (27.3%) | | |
| 1 Vanguard Total Bond Market II Index Fund Investor Shares | 374,842,218 | 4,100,774 |
| Total Investment Companies (Cost $15,206,853) | | 14,982,983 |
| Temporary Cash Investment (0.0%) | | |
| Money Market Fund (0.0%) | | |
| 1 Vanguard Market Liquidity Fund, 0.144% (Cost $4,134) | 4,133,871 | 4,134 |
| Total Investments (99.9%) (Cost $15,210,987) | | 14,987,117 |
| Other Assets and Liabilities (0.1%) | | |
| Other Assets | | 40,622 |
| Liabilities | | (30,285) |
| | | 10,337 |
| Net Assets (100%) | | |
| Applicable to 1,281,157,000 outstanding $.001 par value shares of | | |
| beneficial interest (unlimited authorization) | | 14,997,454 |
| Net Asset Value Per Share | | $11.71 |
61
Target Retirement 2025 Fund
| |
| At September 30, 2011, net assets consisted of: | |
| | Amount |
| | ($000) |
| Paid-in Capital | 15,157,737 |
| Undistributed Net Investment Income | 200,673 |
| Accumulated Net Realized Losses | (137,086) |
| Unrealized Appreciation (Depreciation) | (223,870) |
| Net Assets | 14,997,454 |
See Note A in Notes to Financial Statements.
1 Affiliated fund available only to Vanguard funds and certain trusts and accounts managed by Vanguard. Rate shown for Vanguard Market Liquidity Fund is the 7-day yield.
See accompanying Notes, which are an integral part of the Financial Statements.
62
Target Retirement 2025 Fund
| |
| Statement of Operations | |
| |
| | Year Ended |
| | September 30, 2011 |
| | ($000) |
| Investment Income | |
| Income | |
| Income Distributions Received | 315,625 |
| Net Investment Income—Note B | 315,625 |
| Realized Net Gain (Loss) | |
| Capital Gain Distributions Received | 24,549 |
| Investment Securities Sold | (23,774) |
| Realized Net Gain (Loss) | 775 |
| Change in Unrealized Appreciation (Depreciation) of Investment Securities | (492,656) |
| Net Increase (Decrease) in Net Assets Resulting from Operations | (176,256) |
See accompanying Notes, which are an integral part of the Financial Statements.
63
Target Retirement 2025 Fund
| | |
| Statement of Changes in Net Assets | | |
| |
| |
| | Year Ended September 30, |
| | 2011 | 2010 |
| | ($000) | ($000) |
| Increase (Decrease) in Net Assets | | |
| Operations | | |
| Net Investment Income | 315,625 | 284,420 |
| Realized Net Gain (Loss) | 775 | (30,823) |
| Change in Unrealized Appreciation (Depreciation) | (492,656) | 902,782 |
| Net Increase (Decrease) in Net Assets Resulting from Operations | (176,256) | 1,156,379 |
| Distributions | | |
| Net Investment Income | (289,553) | (237,667) |
| Realized Capital Gain1 | (18,531) | — |
| Total Distributions | (308,084) | (237,667) |
| Capital Share Transactions | | |
| Issued | 4,556,327 | 4,234,050 |
| Issued in Lieu of Cash Distributions | 305,363 | 236,845 |
| Redeemed | (3,032,384) | (1,668,731) |
| Net Increase (Decrease) from Capital Share Transactions | 1,829,306 | 2,802,164 |
| Total Increase (Decrease) | 1,344,966 | 3,720,876 |
| Net Assets | | |
| Beginning of Period | 13,652,488 | 9,931,612 |
| End of Period2 | 14,997,454 | 13,652,488 |
1 Includes fiscal 2011 short-term gain distributions totaling $18,531,000. Short-term gain distributions are treated as ordinary income dividends for tax purposes.
2 Net Assets—End of Period includes undistributed net investment income of $200,673,000 and $174,601,000.
See accompanying Notes, which are an integral part of the Financial Statements.
64
Target Retirement 2025 Fund
Financial Highlights
| | | | | |
| For a Share Outstanding | | | Year Ended September 30, |
| Throughout Each Period | 2011 | 2010 | 2009 | 2008 | 2007 |
| Net Asset Value, Beginning of Period | $11.97 | $11.11 | $11.49 | $14.26 | $12.51 |
| Investment Operations | | | | | |
| Net Investment Income | .257† | .262 | .279 | .307 | .300 |
| Capital Gain Distributions Received | .020† | — | — | — | — |
| Net Realized and Unrealized Gain (Loss) | | | | | |
| on Investments | (.271) | .850 | (.336) | (2.767) | 1.740 |
| Total from Investment Operations | .006 | 1.112 | (.057) | (2.460) | 2.040 |
| Distributions | | | | | |
| Dividends from Net Investment Income | (.250) | (.252) | (.323) | (.310) | (.290) |
| Distributions from Realized Capital Gains | (.016) | — | — | — | — |
| Total Distributions | (.266) | (.252) | (.323) | (.310) | (.290) |
| Net Asset Value, End of Period | $11.71 | $11.97 | $11.11 | $11.49 | $14.26 |
| |
| Total Return1 | -0.11% | 10.12% | 0.10% | -17.61% | 16.51% |
| |
| Ratios/Supplemental Data | | | | | |
| Net Assets, End of Period (Millions) | $14,997 | $13,652 | $9,932 | $7,769 | $6,721 |
| Ratio of Total Expenses to | | | | | |
| Average Net Assets | — | — | — | — | — |
| Acquired Fund Fees and Expenses | 0.18% | 0.18% | 0.21% | 0.18% | 0.19% |
| Ratio of Net Investment Income to | | | | | |
| Average Net Assets | 2.01% | 2.42% | 3.09% | 2.59% | 2.43% |
| Portfolio Turnover Rate | 23%2 | 11% | 21%3 | 17% | 4% |
† Calculated based on average shares outstanding.
1 Total returns do not include account service fees that may have applied in the periods shown. Fund prospectuses provide information about any applicable account service fees.
2 Excludes the value of mutual fund shares delivered and received in connection with a change in the fund’s international equity investments from Vanguard European, Pacific, and Emerging Markets Stock Index Funds to Vanguard Total International Stock Index Fund because those transactions were effected in kind and did not cause the fund to incur transaction costs.
3 Excludes the value of mutual fund shares delivered and received in connection with a change in the fund’s bond investments from Vanguard Total Bond Market Index Fund to Vanguard Total Bond Market II Index Fund because those transactions were effected in kind and did not cause the fund to incur transaction costs.
See accompanying Notes, which are an integral part of the Financial Statements.
65
Target Retirement 2025 Fund
Notes to Financial Statements
Vanguard Target Retirement 2025 Fund is registered under the Investment Company Act of 1940 as an open-end investment company, or mutual fund. The fund follows a balanced investment strategy by investing in selected Vanguard funds to achieve its targeted allocation of assets to U.S. stocks, international stocks, and bonds.
A. The following significant accounting policies conform to generally accepted accounting principles for U.S. mutual funds. The fund consistently follows such policies in preparing its financial statements.
1. Security Valuation: Investments are valued at the net asset value of each underlying Vanguard fund determined as of the close of the New York Stock Exchange (generally 4 p.m., Eastern time) on the valuation date.
2. Federal Income Taxes: The fund intends to continue to qualify as a regulated investment company and distribute all of its taxable income. Management has analyzed the fund’s tax positions taken for all open federal income tax years (September 30, 2008–2011), and has concluded that no provision for federal income tax is required in the fund’s financial statements.
3. Distributions: Distributions to shareholders are recorded on the ex-dividend date.
4. Other: Income and capital gain distributions received are recorded on the ex-dividend date. Security transactions are accounted for on the date securities are bought or sold. Costs used to determine realized gains (losses) on the sale of investment securities are those of the specific securities sold.
B. Under a service agreement, The Vanguard Group furnishes investment advisory, corporate management, administrative, marketing, and distribution services to the fund. The service agreement provides that the fund’s expenses may be reduced or eliminated to the extent of savings realized by the Vanguard funds by the operation of the fund. Accordingly, all incremental expenses for services provided by Vanguard and all other expenses incurred by the fund during the year ended September 30, 2011, were borne by the funds in which the fund invests. The fund’s trustees and officers are also directors and officers of Vanguard and the funds in which the fund invests.
C. Various inputs may be used to determine the value of the fund’s investments. These inputs are summarized in three broad levels for financial statement purposes. The inputs or methodologies used to value securities are not necessarily an indication of the risk associated with investing in those securities.
Level 1—Quoted prices in active markets for identical securities.
Level 2—Other significant observable inputs (including quoted prices for similar securities, interest rates, prepayment speeds, credit risk, etc.).
Level 3—Significant unobservable inputs (including the fund’s own assumptions used to determine the fair value of investments).
At September 30, 2011, 100% of the market value of the fund’s investments was based on Level 1 inputs.
D. Distributions are determined on a tax basis and may differ from net investment income and realized capital gains for financial reporting purposes. Differences may be permanent or temporary. Permanent differences are reclassified among capital accounts in the financial statements to reflect their tax character. Temporary differences arise when certain items of income, expense, gain, or loss are recognized in different periods for financial statement and tax purposes; these differences will reverse at some time in the future. Differences in classification may also result from the treatment of short-term gains as ordinary income for tax purposes.
66
Target Retirement 2025 Fund
For tax purposes, at September 30, 2011, the fund had $200,254,000 of ordinary income available for distribution. Tax-basis amounts required to be distributed in December 2010 included short-term gain distributions received from Vanguard Total Bond Market II Index Fund in December 2010. Short-term capital gain distributions received are treated as ordinary income for tax purposes, and cannot be offset by capital losses. At September 30, 2011, the fund had available capital loss carryforwards totaling $7,742,000 to offset future net capital gains through September 30, 2018. In addition, the fund realized losses of $84,622,000 during the period from November 1, 2010, through September 30, 2011, which are deferred and will be treated as realized for tax purposes in fiscal 2012.
At September 30, 2011, the cost of investment securities for tax purposes was $15,255,291,000. Net unrealized depreciation of investment securities for tax purposes was $268,174,000, consisting of unrealized gains of $391,153,000 on securities that had risen in value since their purchase and $659,327,000 in unrealized losses on securities that had fallen in value since their purchase.
E. During the year ended September 30, 2011, the fund purchased $7,471,867,000 of investment securities and sold $5,615,881,000 of investment securities, other than temporary cash investments.
F. Capital shares issued and redeemed were:
| | |
| | Year Ended September 30, |
| | 2011 | 2010 |
| | Shares | Shares |
| | (000) | (000) |
| Issued | 356,359 | 371,227 |
| Issued in Lieu of Cash Distributions | 24,235 | 20,776 |
| Redeemed | (239,602) | (145,642) |
| Net Increase (Decrease) in Shares Outstanding | 140,992 | 246,361 |
G. In preparing the financial statements as of September 30, 2011, management considered the impact of subsequent events for potential recognition or disclosure in these financial statements.
67
Report of Independent Registered Public Accounting Firm
To the Trustees of Vanguard Chester Funds and the Shareholders of Vanguard Target Retirement Income Fund, Vanguard Target Retirement 2005 Fund, Vanguard Target Retirement 2010 Fund, Vanguard Target Retirement 2015 Fund, Vanguard Target Retirement 2020 Fund and Vanguard Target Retirement 2025 Fund:
In our opinion, the accompanying statements of net assets and the related statements of operations and of changes in net assets and the financial highlights present fairly, in all material respects, the financial position of Vanguard Target Retirement Income Fund, Vanguard Target Retirement 2005 Fund, Vanguard Target Retirement 2010 Fund, Vanguard Target Retirement 2015 Fund, Vanguard Target Retirement 2020 Fund and Vanguard Target Retirement 2025 Fund (constituting six separate portfolios of Vanguard Chester Funds, hereafter referred to as the “Funds”) at September 30, 2011, the results of each of their operations for the year then ended, the changes in each of their net assets for each of the two years in the period then ended and the financial highlights for each of the five years in the period then ended, in conformity with accounting principles generally accepted in the United States of America. These financial statements and financial highlights (hereafter referred to as “financial statements”) are the responsibility of the Funds’ management; our responsibility is to express an opinion on these financial statements based on our audits. We conducted our audits of these financial statements in accordance with the standards of the Public Company Accounting Oversight Board (United States). Those standards require that we plan and perform the audit to obtain reasonable assurance about whether the financial statements are free of material misstatement. An audit includes examining, on a test basis, evidence supporting the amounts and disclosures in the financial statements, assessing the accounting principles used and significant estimates made by management, and evaluating the overall financial statement presentation. We believe that our audits, which included confirmation of securities at September 30, 2011 by agreement to the underlying ownership records of the Vanguard funds, provide a reasonable basis for our opinion.
PricewaterhouseCoopers LLP
Philadelphia, Pennsylvania
November 15, 2011
68
|
| Special 2011 tax information (unaudited) for Vanguard Target Retirement Funds |
This information for the fiscal year ended September 30, 2011, is included pursuant to provisions of the Internal Revenue Code.
The funds distributed qualified dividend income to shareholders during the fiscal year as follows:
| |
| | Qualified Dividend Income |
| Fund | ($000) |
| Target Retirement Income Fund | 19,466 |
| Target Retirement 2005 Fund | 13,069 |
| Target Retirement 2010 Fund | 35,592 |
| Target Retirement 2015 Fund | 125,992 |
| Target Retirement 2020 Fund | 101,523 |
| Target Retirement 2025 Fund | 172,950 |
For corporate shareholders, the percentage of investment income (dividend income plus short-term gains, if any) that qualifies for the dividends-received deduction is as follows:
| |
| Fund | Percentage |
| Target Retirement Income Fund | 12.8% |
| Target Retirement 2005 Fund | 14.0 |
| Target Retirement 2010 Fund | 21.6 |
| Target Retirement 2015 Fund | 28.6 |
| Target Retirement 2020 Fund | 35.3 |
| Target Retirement 2025 Fund | 41.3 |
69
Your Fund’s After-Tax Returns
This table presents returns for your fund both before and after taxes. The after-tax returns are shown in two ways: (1) assuming that an investor owned the fund during the entire period and paid taxes on the fund’s distributions, and (2) assuming that an investor paid taxes on the fund’s distributions and sold all shares at the end of each period.
Calculations are based on the highest individual federal income tax and capital gains tax rates in effect at the times of the distributions and the hypothetical sales. State and local taxes were not considered. After-tax returns reflect any qualified dividend income, using actual prior-year figures and estimates for 2011. (In the example, returns after the sale of fund shares may be higher than those assuming no sale. This occurs when the sale would have produced a capital loss. The calculation assumes that the investor received a tax deduction for the loss.)
Please note that your actual after-tax returns will depend on your tax situation and may differ from those shown. Also note that if you own the fund in a tax-deferred account, such as an individual retirement account or a 401(k) plan, this information does not apply to you. Such accounts are not subject to current taxes.
Finally, keep in mind that a fund’s performance—whether before or after taxes—does not guarantee future results.
| | | |
| Average Annual Total Returns: Target Retirement Funds | | | |
| Periods Ended September 30, 2011 | | | |
| | | | Since |
| | One | Five | Inception |
| | Year | Years | (10/27/2003) |
| Target Retirement Income Fund | | | |
| Returns Before Taxes | 3.70% | 4.61% | 4.96% |
| Returns After Taxes on Distributions | 2.78 | 3.56 | 3.83 |
| Returns After Taxes on Distributions and Sale of Fund Shares | 2.50 | 3.37 | 3.63 |
| |
| | | | Since |
| | One | Five | Inception |
| | Year | Years | (10/27/2003) |
| Target Retirement 2005 Fund | | | |
| Returns Before Taxes | 3.92% | 4.02% | 4.96% |
| Returns After Taxes on Distributions | 3.09 | 3.06 | 4.11 |
| Returns After Taxes on Distributions and Sale of Fund Shares | 2.66 | 2.92 | 3.82 |
| |
| | | | Since |
| | One | Five | Inception |
| | Year | Years | (6/7/2006) |
| Target Retirement 2010 Fund | | | |
| Returns Before Taxes | 2.68% | 3.17% | 3.94% |
| Returns After Taxes on Distributions | 1.97 | 2.53 | 3.33 |
| Returns After Taxes on Distributions and Sale of Fund Shares | 1.91 | 2.40 | 3.08 |
70
| | | |
| Average Annual Total Returns: Target Retirement Funds | | | |
| Periods Ended September 30, 2011 | | | |
| |
| | | | Since |
| | One | Five | Inception |
| | Year | Years | (10/27/2003) |
| Target Retirement 2015 Fund | | | |
| Returns Before Taxes | 1.40% | 2.43% | 4.61% |
| Returns After Taxes on Distributions | 0.75 | 1.70 | 3.96 |
| Returns After Taxes on Distributions and Sale of Fund Shares | 1.13 | 1.74 | 3.67 |
| |
| | | | Since |
| | One | Five | Inception |
| | Year | Years | (6/7/2006) |
| Target Retirement 2020 Fund | | | |
| Returns Before Taxes | 0.53% | 1.76% | 2.72% |
| Returns After Taxes on Distributions | -0.01 | 1.26 | 2.24 |
| Returns After Taxes on Distributions and Sale of Fund Shares | 0.58 | 1.29 | 2.13 |
| |
| | | | Since |
| | One | Five | Inception |
| | Year | Years | (10/27/2003) |
| Target Retirement 2025 Fund | | | |
| Returns Before Taxes | -0.11% | 1.12% | 4.14% |
| Returns After Taxes on Distributions | -0.60 | 0.55 | 3.62 |
| Returns After Taxes on Distributions and Sale of Fund Shares | 0.20 | 0.74 | 3.37 |
71
About Your Fund’s Expenses
As a shareholder of the fund, you incur ongoing costs, which include costs for portfolio management, administrative services, and shareholder reports (like this one), among others. Operating expenses, which are deducted from a fund’s gross income, directly reduce the investment return of the fund.
A typical fund’s expenses are expressed as a percentage of its average net assets. The Target Retirement Funds have no direct expenses, but each fund bears its proportionate share of the costs for the underlying funds in which it invests. These indirect expenses make up the acquired fund fees and expenses, also expressed as a percentage of average net assets.
The following examples are intended to help you understand the ongoing cost (in dollars) of investing in your fund and to compare these costs with those of other mutual funds. The examples are based on an investment of $1,000 made at the beginning of the period shown and held for the entire period. The costs were calculated using the acquired fund fees and expenses for each Target Retirement Fund.
The accompanying table illustrates your fund’s costs in two ways:
• Based on actual fund return. This section helps you to estimate the actual expenses that you paid over the period. The ”Ending Account Value“ shown is derived from the fund‘s actual return, and the third column shows the dollar amount that would have been paid by an investor who started with $1,000 in the fund. You may use the information here, together with the amount you invested, to estimate the expenses that you paid over the period.
To do so, simply divide your account value by $1,000 (for example, an $8,600 account value divided by $1,000 = 8.6), then multiply the result by the number given for your fund under the heading ”Expenses Paid During Period.“
• Based on hypothetical 5% yearly return. This section is intended to help you compare your fund‘s costs with those of other mutual funds. It assumes that the fund had a yearly return of 5% before expenses, but that the expense ratio is unchanged. In this case—because the return used is not the fund’s actual return—the results do not apply to your investment. The example is useful in making comparisons because the Securities and Exchange Commission requires all mutual funds to calculate expenses based on a 5% return. You can assess your fund’s costs by comparing this hypothetical example with the hypothetical examples that appear in shareholder reports of other funds.
Note that the expenses shown in the table are meant to highlight and help you compare ongoing costs only and do not reflect transaction costs incurred by the fund for buying and selling securities. Further, the expenses do not include any purchase, redemption, or account service fees described in the fund prospectus. If such fees were applied to your account, your costs would be higher. Your fund does not carry a “sales load.”
The calculations assume no shares were bought or sold during the period. Your actual costs may have been higher or lower, depending on the amount of your investment and the timing of any purchases or redemptions.
You can find more information about the fund’s expenses, including annual expense ratios, in the Financial Statements section of this report. For additional information on operating expenses and other shareholder costs, please refer to your fund’s current prospectus.
72
| | | |
| Six Months Ended September 30, 2011 | | | |
| | Beginning | Ending | Expenses |
| | Account Value | Account Value | Paid During |
| | 3/31/2011 | 9/30/2011 | Period |
| Based on Actual Fund Return | | | |
| Target Retirement Income Fund | $1,000.00 | $991.08 | $0.85 |
| Target Retirement 2005 Fund | $1,000.00 | $987.50 | $0.85 |
| Target Retirement 2010 Fund | $1,000.00 | $954.27 | $0.83 |
| Target Retirement 2015 Fund | $1,000.00 | $928.29 | $0.82 |
| Target Retirement 2020 Fund | $1,000.00 | $909.21 | $0.81 |
| Target Retirement 2025 Fund | $1,000.00 | $891.85 | $0.81 |
| Based on Hypothetical 5% Yearly Return | | | |
| Target Retirement Income Fund | $1,000.00 | $1,024.22 | $0.86 |
| Target Retirement 2005 Fund | $1,000.00 | $1,024.22 | $0.86 |
| Target Retirement 2010 Fund | $1,000.00 | $1,024.22 | $0.86 |
| Target Retirement 2015 Fund | $1,000.00 | $1,024.22 | $0.86 |
| Target Retirement 2020 Fund | $1,000.00 | $1,024.22 | $0.86 |
| Target Retirement 2025 Fund | $1,000.00 | $1,024.22 | $0.86 |
The calculations are based on the acquired fund fees and expenses for the most recent six-month period. The funds’ annualized expense figures for that period are (in order as listed from top to bottom above) 0.17%, 0.17%, 0.17%, 0.17%, 0.17%, and 0.18%. The dollar amounts shown as ”Expenses Paid” are equal to the annualized expense figures for the underlying funds multiplied by the average account value over the period, multiplied by the number of days in the most recent six-month period, then divided by the number of days in the most recent 12-month period.

Glossary
30-Day SEC Yield. A fund’s 30-day SEC yield is derived using a formula specified by the U.S. Securities and Exchange Commission. Under the formula, data related to the fund’s security holdings in the previous 30 days are used to calculate the fund’s hypothetical net income for that period, which is then annualized and divided by the fund’s estimated average net assets over the calculation period. For the purposes of this calculation, a security’s income is based on its current market yield to maturity (for bonds; excluding inflation for inflation-protected securities), its actual income (for asset-backed securities), or its projected dividend yield (for stocks). Because the SEC yield represents hypothetical annualized income, it will differ—at times significantly—from the fund’s actual experience. As a result, the fund’s income distributions may be higher or lower than implied by the SEC yield.
Acquired Fund Fees and Expenses. Funds that invest in other Vanguard funds incur no direct expenses, but they do bear proportionate shares of the operating, administrative, and advisory expenses of the underlying funds, and they must pay any fees charged by those funds. The figure for acquired fund fees and expenses represents a weighted average of these underlying costs. Acquired is a term that the Securities and Exchange Commission applies to any mutual fund whose shares are owned by another fund.
Beta. A measure of the magnitude of a fund’s past share-price fluctuations in relation to the ups and downs of a given market index. The index is assigned a beta of 1.00. Compared with a given index, a fund with a beta of 1.20 typically would have seen its share price rise or fall by 12% when the index rose or fell by 10%. For this report, beta is based on returns over the past 36 months for both the fund and the index. Note that a fund’s beta should be reviewed in conjunction with its R-squared (see definition). The lower the R-squared, the less correlation there is between the fund and the index, and the less reliable beta is as an indicator of volatility.
Expense Ratio. The percentage of a fund’s average net assets used to pay its annual administrative and advisory expenses. These expenses directly reduce returns to investors.
Inception Date. The date on which the assets of a fund (or one of its share classes) are first invested in accordance with the fund’s investment objective. For funds with a subscription period, the inception date is the day after that period ends. Investment performance is measured from the inception date.
R-Squared. A measure of how much of a fund’s past returns can be explained by the returns from the market in general, as measured by a given index. If a fund’s total returns were precisely synchronized with an index’s returns, its R-squared would be 1.00. If the fund’s returns bore no relationship to the index’s returns, its R-squared would be 0. For this report, R-squared is based on returns over the past 36 months for both the fund and the index.
74
This page intentionally left blank.
The People Who Govern Your Fund
The trustees of your mutual fund are there to see that the fund is operated and managed in your best interests since, as a shareholder, you are a part owner of the fund. Your fund’s trustees also serve on the board of directors of The Vanguard Group, Inc., which is owned by the Vanguard funds and provides services to them on an at-cost basis.
A majority of Vanguard’s board members are independent, meaning that they have no affiliation with Vanguard or the funds they oversee, apart from the sizable personal investments they have made as private individuals. The independent board members have distinguished backgrounds in business, academia, and public service. Each of the trustees and executive officers oversees 178 Vanguard funds.
The following table provides information for each trustee and executive officer of the fund. More information about the trustees is in the Statement of Additional Information, which can be obtained, without charge, by contacting Vanguard at 800-662-7447, or online at vanguard.com.
| |
| Interested Trustee1 | and President (2006–2008) of Rohm and Haas Co. |
| | (chemicals); Director of Tyco International, Ltd. |
| F. William McNabb III | (diversified manufacturing and services) and Hewlett- |
| Born 1957. Trustee Since July 2009. Chairman of the | Packard Co. (electronic computer manufacturing); |
| Board. Principal Occupation(s) During the Past Five | Senior Advisor at New Mountain Capital; Trustee |
| Years: Chairman of the Board of The Vanguard Group, | of The Conference Board; Member of the Board of |
| Inc., and of each of the investment companies served | Managers of Delphi Automotive LLP (automotive |
| by The Vanguard Group, since January 2010; Director | components). |
| of The Vanguard Group since 2008; Chief Executive | |
| Officer and President of The Vanguard Group and of | Amy Gutmann |
| each of the investment companies served by The | Born 1949. Trustee Since June 2006. Principal |
| Vanguard Group since 2008; Director of Vanguard | Occupation(s) During the Past Five Years: President |
| Marketing Corporation; Managing Director of The | of the University of Pennsylvania; Christopher H. |
| Vanguard Group (1995–2008). | Browne Distinguished Professor of Political Science |
| | in the School of Arts and Sciences with secondary |
| | appointments at the Annenberg School for Commu- |
| Independent Trustees | nication and the Graduate School of Education |
| | of the University of Pennsylvania; Director of |
| Emerson U. Fullwood | Carnegie Corporation of New York, Schuylkill River |
| Born 1948. Trustee Since January 2008. Principal | Development Corporation, and Greater Philadelphia |
| Occupation(s) During the Past Five Years: Executive | Chamber of Commerce; Trustee of the National |
| Chief Staff and Marketing Officer for North America | Constitution Center; Chair of the Presidential |
| and Corporate Vice President (retired 2008) of Xerox | Commission for the Study of Bioethical Issues. |
| Corporation (document management products and | |
| services); Executive in Residence and 2010 | JoAnn Heffernan Heisen |
| Distinguished Minett Professor at the Rochester | Born 1950. Trustee Since July 1998. Principal |
| Institute of Technology; Director of SPX Corporation | Occupation(s) During the Past Five Years: Corporate |
| (multi-industry manufacturing), the United Way of | Vice President and Chief Global Diversity Officer |
| Rochester, Amerigroup Corporation (managed health | (retired 2008) and Member of the Executive |
| care), the University of Rochester Medical Center, | Committee (1997–2008) of Johnson & Johnson |
| Monroe Community College Foundation, and North | (pharmaceuticals/consumer products); Director of |
| Carolina A&T University. | Skytop Lodge Corporation (hotels), the University |
| | Medical Center at Princeton, the Robert Wood |
| Rajiv L. Gupta | Johnson Foundation, and the Center for Work Life |
| Born 1945. Trustee Since December 2001.2 | Policy; Member of the Advisory Board of the |
| Principal Occupation(s) During the Past Five Years: | Maxwell School of Citizenship and Public Affairs |
| Chairman and Chief Executive Officer (retired 2009) | at Syracuse University. |
| | |
| F. Joseph Loughrey | Thomas J. Higgins | |
| Born 1949. Trustee Since October 2009. Principal | Born 1957. Chief Financial Officer Since September |
| Occupation(s) During the Past Five Years: President | 2008. Principal Occupation(s) During the Past Five |
| and Chief Operating Officer (retired 2009) and Vice | Years: Principal of The Vanguard Group, Inc.; Chief |
| Chairman of the Board (2008–2009) of Cummins Inc. | Financial Officer of each of the investment companies |
| (industrial machinery); Director of SKF AB (industrial | served by The Vanguard Group since 2008; Treasurer |
| machinery), Hillenbrand, Inc. (specialized consumer | of each of the investment companies served by The |
| services), the Lumina Foundation for Education, and | Vanguard Group (1998–2008). |
| Oxfam America; Chairman of the Advisory Council | | |
| for the College of Arts and Letters and Member | Kathryn J. Hyatt | |
| of the Advisory Board to the Kellogg Institute for | Born 1955. Treasurer Since November 2008. Principal |
| International Studies at the University of Notre Dame. | Occupation(s) During the Past Five Years: Principal |
| | of The Vanguard Group, Inc.; Treasurer of each of |
| André F. Perold | the investment companies served by The Vanguard |
| Born 1952. Trustee Since December 2004. Principal | Group since 2008; Assistant Treasurer of each of the |
| Occupation(s) During the Past Five Years: George | investment companies served by The Vanguard Group |
| Gund Professor of Finance and Banking at the Harvard | (1988–2008). | |
| Business School (retired July 2011); Chief Investment | | |
| Officer and co-Managing Partner of HighVista | Heidi Stam | |
| Strategies LLC (private investment firm); Director of | Born 1956. Secretary Since July 2005. Principal |
| Rand Merchant Bank; Overseer of the Museum of | Occupation(s) During the Past Five Years: Managing |
| Fine Arts Boston. | Director of The Vanguard Group, Inc., since 2006; |
| | General Counsel of The Vanguard Group since 2005; |
| Alfred M. Rankin, Jr. | Secretary of The Vanguard Group and of each of the |
| Born 1941. Trustee Since January 1993. Principal | investment companies served by The Vanguard Group |
| Occupation(s) During the Past Five Years: Chairman, | since 2005; Director and Senior Vice President of |
| President, and Chief Executive Officer of NACCO | Vanguard Marketing Corporation since 2005; |
| Industries, Inc. (forklift trucks/housewares/lignite); | Principal of The Vanguard Group (1997–2006). |
| Director of Goodrich Corporation (industrial products/ | | |
| aircraft systems and services) and the National | | |
| Association of Manufacturers; Chairman of the | Vanguard Senior Management Team |
| Federal Reserve Bank of Cleveland; Vice Chairman | | |
| of University Hospitals of Cleveland; President of | R. Gregory Barton | Chris D. McIsaac |
| the Board of The Cleveland Museum of Art. | Mortimer J. Buckley | Michael S. Miller |
| | Kathleen C. Gubanich | James M. Norris |
| Peter F. Volanakis | Paul A. Heller | Glenn W. Reed |
| Born 1955. Trustee Since July 2009. Principal | Martha G. King | George U. Sauter |
| Occupation(s) During the Past Five Years: President | | |
| and Chief Operating Officer (retired 2010) of Corning | | |
| Incorporated (communications equipment); Director of | Chairman Emeritus and Senior Advisor |
| Corning Incorporated (2000–2010) and Dow Corning | | |
| (2001–2010); Overseer of the Amos Tuck School of | John J. Brennan | |
| Business Administration at Dartmouth College. | Chairman, 1996–2009 | |
| | Chief Executive Officer and President, 1996–2008 |
| |
| Executive Officers | | |
| | Founder | |
| Glenn Booraem | | |
| Born 1967. Controller Since July 2010. Principal | John C. Bogle | |
| Occupation(s) During the Past Five Years: Principal | Chairman and Chief Executive Officer, 1974–1996 |
| of The Vanguard Group, Inc.; Controller of each of | | |
| the investment companies served by The Vanguard | | |
| Group since 2010; Assistant Controller of each of | | |
| the investment companies served by The Vanguard | | |
| Group (2001–2010). | | |
1 Mr. McNabb is considered an “interested person,” as defined in the Investment Company Act of 1940, because he is an officer of the Vanguard funds.
2 December 2002 for Vanguard Equity Income Fund, Vanguard Growth Equity Fund, the Vanguard Municipal Bond Funds, and the Vanguard State Tax-Exempt Funds.
|  |
| P.O. Box 2600 |
| Valley Forge, PA 19482-2600 |
Connect with Vanguard® > vanguard.com
| A registration statement relating to the Target |
| Fund Information > 800-662-7447 | Retirement 2060 Fund has been filed with the |
| Direct Investor Account Services > 800-662-2739 | Securities and Exchange Commission but has not |
| Institutional Investor Services > 800-523-1036 | yet become effective. These securities may not be |
| Text Telephone for People | sold nor may offers to buy be accepted prior to the |
| With Hearing Impairment > 800-749-7273 | time the registration statement becomes effective. |
| | This communication shall not constitute an offer to |
| This material may be used in conjunction | sell or the solicitation of an offer to buy, nor shall |
| with the offering of shares of any Vanguard | there be any sale of, these securities in any state |
| fund only if preceded or accompanied by | in which such offer, solicitation, or sale would be |
| the fund’s current prospectus. | unlawful prior to registration or qualification under |
| | the securities laws of any such state. |
| All comparative mutual fund data are from Lipper Inc. or | |
| Morningstar, Inc., unless otherwise noted. | Copies of the final prospectus can be obtained |
| | from Vanguard. Please note that a preliminary |
| You can obtain a free copy of Vanguard’s proxy voting | prospectus is subject to change. |
| guidelines by visiting vanguard.com/proxyreporting or by | |
| calling Vanguard at 800-662-2739. The guidelines are | |
| also available from the SEC’s website, sec.gov. In | |
| addition, you may obtain a free report on how your fund | |
| voted the proxies for securities it owned during the 12 | |
| months ended June 30. To get the report, visit either | |
| vanguard.com/proxyreporting or sec.gov. | |
| |
| You can review and copy information about your fund at | |
| the SEC’s Public Reference Room in Washington, D.C. To | |
| find out more about this public service, call the SEC at | |
| 202-551-8090. Information about your fund is also | |
| available on the SEC’s website, and you can receive | |
| copies of this information, for a fee, by sending a | |
| request in either of two ways: via e-mail addressed to | |
| publicinfo@sec.gov or via regular mail addressed to the | |
| Public Reference Section, Securities and Exchange | |
| Commission, Washington, DC 20549-1520. | |
| | © 2011 The Vanguard Group, Inc. |
| | All rights reserved. |
| | Vanguard Marketing Corporation, Distributor. |
| |
| | Q3080 112011 |
 |
|
| Annual Report | September 30, 2011 |
| |
| Vanguard Target Retirement Funds |
| |
| Vanguard Target Retirement 2030 Fund |
| Vanguard Target Retirement 2035 Fund |
| Vanguard Target Retirement 2040 Fund |
| Vanguard Target Retirement 2045 Fund |
| Vanguard Target Retirement 2050 Fund |
| Vanguard Target Retirement 2055 Fund |
> The broad U.S. stock market returned less than 1% for the fiscal year ended September 30, 2011, after slumping through the spring and summer. International stocks suffered declines.
> For the 12 months, returns for the six Target Retirement Funds in this report ranged from –0.83% to –1.89%.
> Among the underlying funds that make up the funds’ portfolios, Vanguard Total International Stock Index Fund was the poorest performer, and Vanguard Total Bond Market II Index Fund was the strongest.
| |
| Contents | |
| Your Fund’s Total Returns. | 1 |
| Chairman’s Letter. | 2 |
| Target Retirement 2030 Fund. | 9 |
| Target Retirement 2035 Fund. | 18 |
| Target Retirement 2040 Fund. | 27 |
| Target Retirement 2045 Fund. | 36 |
| Target Retirement 2050 Fund. | 45 |
| Target Retirement 2055 Fund. | 54 |
| Your Fund’s After-Tax Returns. | 65 |
| About Your Fund’s Expenses. | 67 |
| Glossary. | 69 |
Please note: The opinions expressed in this report are just that—informed opinions. They should not be considered promises or advice. Also, please keep in mind that the information and opinions cover the period through the date on the front of this report. Of course, the risks of investing in your fund are spelled out in the prospectus.
See the Glossary for definitions of investment terms used in this report.
About the cover: Vanguard was named for the HMS Vanguard, flagship of British Admiral Horatio Nelson. A ship—whose performance and safety depend on the work of all hands—has served as a fitting metaphor for the Vanguard crew as we strive to help clients reach their financial goals.
Your Fund’s Total Returns
| |
| Fiscal Year Ended September 30, 2011 | |
| | Total |
| | Returns |
| Vanguard Target Retirement 2030 Fund | -0.83% |
| Target 2030 Composite Index | -0.49 |
| Mixed-Asset Target 2030 Funds Average | -1.87 |
| Mixed-Asset Target 2030 Funds Average: Derived from data provided by Lipper Inc. | |
| |
| Vanguard Target Retirement 2035 Fund | -1.55% |
| Target 2035 Composite Index | -1.16 |
| Mixed-Asset Target 2035 Funds Average | -2.48 |
| Mixed-Asset Target 2035 Funds Average: Derived from data provided by Lipper Inc. | |
| |
| Vanguard Target Retirement 2040 Fund | -1.87% |
| Target 2040 Composite Index | -1.45 |
| Mixed-Asset Target 2040 Funds Average | -2.99 |
| Mixed-Asset Target 2040 Funds Average: Derived from data provided by Lipper Inc. | |
| |
| Vanguard Target Retirement 2045 Fund | -1.82% |
| Target 2045 Composite Index | -1.45 |
| Mixed-Asset Target 2045 Funds Average | -3.42 |
| Mixed-Asset Target 2045 Funds Average: Derived from data provided by Lipper Inc. | |
| |
| Vanguard Target Retirement 2050 Fund | -1.89% |
| Target 2050 Composite Index | -1.45 |
| Mixed-Asset Target 2050+ Funds Average | -3.61 |
| Mixed-Asset Target 2050+ Funds Average: Derived from data provided by Lipper Inc. | |
| |
| Vanguard Target Retirement 2055 Fund | -1.58% |
| Target 2055 Composite Index | -1.45 |
| Mixed-Asset Target 2050+ Funds Average | -3.61 |
| Mixed-Asset Target 2050+ Funds Average: Derived from data provided by Lipper Inc. | |
Returns for the composite indexes are derived by applying the funds’ target allocations to the results of the following benchmarks: for U.S. stocks, the MSCI US Broad Market Index; for international stocks, the MSCI EAFE Index and the MSCI Emerging Markets Index through December 15, 2010, and the MSCI ACWI ex USA IMI Index thereafter; and for bonds, the Barclays Capital U.S. Aggregate Float Adjusted Index.
Investments in Target Retirement Funds are subject to the risks of their underlying funds. The year in the fund name refers to the approximate year (the target date) when an investor in the fund would retire and leave the work force. The fund will gradually shift its emphasis from more aggressive investments to more conservative ones based on its target date. An investment in a Target Retirement Fund is not guaranteed at any time, including on or after the target date.
1

Chairman’s Letter
Dear Shareholder,
For the fiscal year ended September 30, 2011, increasing volatility in global equity markets erased strong returns attained earlier. Bonds handily outperformed stocks during the 12 months as investors sought refuge in the markets’ safer regions. The six Vanguard Target Retirement Funds covered in this report had heavy equity allocations, and their negative returns reflect the weakness in the global stock markets.
This report features the performance of 6 of Vanguard’s 12 Target Retirement Funds (the shorter-dated funds are covered in a separate report). Because the target retirement dates for these funds are about 20 to 45 years in the future, they are intended for investors whose time horizon can accommodate sizable allocations to stocks, which historically have produced higher long-term returns than other asset classes, albeit with greater ups and downs. These allocations reflect Vanguard’s belief that stocks are a powerful means of building long-term wealth for retirement.
Please note that Vanguard has filed a registration statement with the U.S. Securities and Exchange Commission for the Target Retirement 2060 Fund, which is aimed at investors who plan to retire and leave the workforce in or within a few years of 2060. At the time the fund is launched in early 2012, those investors will be about 20 years old.
2
A swift change in sentiment weighed on stock prices
Global stock markets rallied through the first half of the fiscal year as corporate earnings surged and the economic recovery seemed to be gathering steam. In the second half, however, stock prices tumbled as economic indicators took a turn for the worse and U.S. and European policymaking strife dominated the headlines. (Standard & Poor’s, the ratings agency, downgraded the U.S. credit rating, in large part because of the political gridlock on display during the debt-ceiling debate. Vanguard’s confidence in the “full faith and credit” of the U.S. Treasury remains unshaken.)
The U.S. stock market’s second-half weakness sapped its first-half strength. The broad market returned 0.31% for the full 12 months. International stocks, which gained less at the start of the year and lost more at the end, returned –10.81% in U.S. dollars.
Bond prices rallied as optimism faded
The stock market’s pattern of strength and weakness was inverted in the bond market. Early in the year, bond prices retreated, consistent with investor optimism about economic growth. Later in the year, as optimism gave way to anxiety, bond prices surged, driving yields to remarkable lows. At the end of September, the yield of
| | | |
| Market Barometer | | | |
| | | Average Annual Total Returns |
| | | Periods Ended September 30, 2011 |
| | One | Three | Five |
| | Year | Years | Years |
| Stocks | | | |
| Russell 1000 Index (Large-caps) | 0.91% | 1.61% | -0.91% |
| Russell 2000 Index (Small-caps) | -3.53 | -0.37 | -1.02 |
| Dow Jones U.S. Total Stock Market Index | 0.31 | 1.75 | -0.57 |
| MSCI All Country World Index ex USA (International) | -10.81 | 0.52 | -1.57 |
| |
| Bonds | | | |
| Barclays Capital U.S. Aggregate Bond Index (Broad | | | |
| taxable market) | 5.26% | 7.97% | 6.53% |
| Barclays Capital Municipal Bond Index (Broad | | | |
| tax-exempt market) | 3.88 | 8.08 | 5.01 |
| Citigroup Three-Month U.S. Treasury Bill Index | 0.11 | 0.19 | 1.61 |
| |
| CPI | | | |
| Consumer Price Index | 3.87% | 1.22% | 2.26% |
3
the 10-year U.S. Treasury note, a benchmark for longer-term interest rates, stood at 1.93%. Bond indexes recorded impressive returns, though it’s worth noting that shrinking yields imply lower returns on prospective investments.
The yields of money market instruments hovered near zero, as they have since December 2008, when the Federal Reserve cut its target for short-term interest rates to between 0% and 0.25%. Toward the end of the period, the Fed indicated that it expected to maintain this exceptionally low target at least through mid-2013.
Large exposure to stocks limited funds’ returns
The Vanguard Target Retirement Funds were created as vehicles for investors on the road to retirement. Each fund is composed of other Vanguard funds and combines stock, bond, and money market holdings in proportions tailored to an investor’s expected retirement date. As the investor moves closer to retirement, the asset mix becomes more conservative, gradually tilting toward fewer stocks and more bonds and money market funds, whose prices are less volatile. It becomes increasingly important to limit a portfolio’s fluctuations as the need for income and wealth preservation draws closer.
| | |
| Expense Ratios | | |
| Your Fund Compared With Its Peer Group | | |
| | Acquired Fund Fees | Peer Group |
| | and Expenses | Average |
| Target Retirement 2030 Fund | 0.18% | 0.61% |
| Target Retirement 2035 Fund | 0.19 | 0.51 |
| Target Retirement 2040 Fund | 0.19 | 0.62 |
| Target Retirement 2045 Fund | 0.19 | 0.52 |
| Target Retirement 2050 Fund | 0.19 | 0.60 |
| Target Retirement 2055 Fund | 0.19 | 0.60 |
The fund expense figures shown—drawn from the prospectus dated January 26, 2011—represent an estimate of the weighted average of the expense ratios and any transaction fees charged by the underlying mutual funds (the ”acquired” funds) in which the Target Retirement Funds invest. The Target Retirement Funds do not charge any expenses or fees of their own. For the fiscal year ended September 30, 2011, the acquired fund fees and expenses were 0.18% for the 2030 Fund, 0.19% for the 2035 Fund, 0.19% for the 2040 Fund, 0.19% for the 2045 Fund, 0.19% for the 2050 Fund, and 0.19% for the 2055 Fund. Peer group expense ratios are derived from data provided by Lipper Inc. and capture information through year-end 2010.
Peer groups: For the Target Retirement 2030 Fund, Mixed-Asset Target 2030 Funds Average; for the 2035 Fund, Mixed-Asset Target 2035 Funds Average; for the 2040 Fund, Mixed-Asset Target 2040 Funds Average; for the 2045 Fund, Mixed-Asset Target 2045 Funds Average; and for the 2050 and 2055 Funds, Mixed-Asset Target 2050+ Funds.
4
For most investors in the funds described in this report, retirement is about 20 years or more away. These funds, therefore, maintain a growth-oriented asset allocation and have a large exposure to U.S. and international stocks. Their fiscal-year performance reflected an investing environment that turned from sweet to sour as the year progressed, although the funds’ bond holdings served as a bit of a buffer as stocks declined.
As of September 30, the four funds with target dates from 2040 to 2055 held nearly 63% of their assets in U.S. stocks, 27% in international stocks, and 10% in bonds, while the Target Date 2035 Fund included
| |
| Total Returns | |
| Inception Through September 30, 2011 | |
| | Average |
| | Annual Return |
| Target Retirement 2030 Fund (Returns since inception: 6/7/2006) | 1.57% |
| Target 2030 Composite Index | 1.63 |
| Mixed-Asset Target 2030 Funds Average | 0.62 |
| Mixed-Asset Target 2030 Funds Average: Derived from data provided by Lipper Inc. | |
| Target Retirement 2035 Fund (Returns since inception: 10/27/2003) | 4.02% |
| Target 2035 Composite Index | 4.12 |
| Mixed-Asset Target 2035 Funds Average | 3.61 |
| Mixed-Asset Target 2035 Funds Average: Derived from data provided by Lipper Inc. | |
| Target Retirement 2040 Fund (Returns since inception: 6/7/2006) | 1.00% |
| Target 2040 Composite Index | 1.04 |
| Mixed-Asset Target 2040 Funds Average | 0.00 |
| Mixed-Asset Target 2040 Funds Average: Derived from data provided by Lipper Inc. | |
| Target Retirement 2045 Fund (Returns since inception: 10/27/2003) | 4.38% |
| Target 2045 Composite Index | 4.45 |
| Mixed-Asset Target 2045 Funds Average | 3.92 |
| Mixed-Asset Target 2045 Funds Average: Derived from data provided by Lipper Inc. | |
| Target Retirement 2050 Fund (Returns since inception: 6/7/2006) | 1.09% |
| Target 2050 Composite Index | 1.12 |
| Mixed-Asset Target 2050+ Funds Average | -0.02 |
| Mixed-Asset Target 2050+ Funds Average: Derived from data provided by Lipper Inc. | |
The figures shown represent past performance, which is not a guarantee of future results. (Current performance may be lower or higher than the performance data cited. For performance data current to the most recent month-end, visit our website at vanguard.com/performance.) Note, too, that both investment returns and principal value can fluctuate widely, so an investor’s shares, when sold, could be worth more or less than their original cost.
The Target Retirement 2055 Fund is not listed because the fund has operated for less than three years.
5
slightly more bonds. Returns of the five funds ranged from –1.55% for the 2035 Fund to –1.89% for the 2050 Fund. The Target Retirement 2030 Fund, which had nearly a 20% allocation to bonds, returned –0.83%.
The retreat of international stock markets amid debt worries in Europe and fear that growth would weaken in China and other emerging markets pushed the funds’ results into negative territory. Of the three underlying funds in each of their portfolios, the poorest performer was Vanguard Total International Stock Index Fund, which declined about 12%.
U.S. stocks held up better, although the prolonged slide over the period’s last five months reduced Vanguard Total Stock Market Index Fund’s return to a bit less than 1%. Vanguard Total Bond Market II Index Fund, the fixed income holding in each of the six funds, performed best, returning about 5%. Long-term rates declined to historically low levels as investors darted for the safety of U.S. Treasuries, which make up about 40% of the fund.
Costefficient investment has proven competitive
Vanguard Target Retirement Funds have produced competitive results since their inception. Through this year’s ups and downs, their returns have been consistent with their asset allocations. As you can see from the table, returns for the funds in this report fell within a fraction of a percentage point of their respective benchmark indexes, whose returns reflect market performance without operating and transaction costs. Each fund’s return surpassed the average return of its peer group.
The funds’ advisors, Vanguard’s Quantitative Equity Group and Fixed Income Group, combine experienced and skilled portfolio management with refined risk-control and trading systems. Over time, the funds have also benefited from their low operating costs, which allow shareholders to capture more of the markets’ returns. For a look at how the funds’ costs compare with the average expenses of their peer groups, please see the table on page 4.
6
A streamlined program for a lifetime of investing
A solid market turned soft in August and September, and stock prices retreated as the period progressed. Such severe volatility was last seen during the financial crisis of 2008–2009. As recent events prove so well, the investment environment can shift without notice. Despite a vast arsenal of tools and technology, even the most seasoned professionals can’t forecast the market’s frequent changes.
At Vanguard, we encourage investors to focus on a long-term strategy and concentrate less on the market’s daily movements. This means constructing a diversified portfolio of stocks, bonds, and money market instruments tailored
to your own goals, time horizon, and tolerance for risk. The Vanguard Target Retirement Funds were built on these principles, providing a professionally managed portfolio that can help address your retirement investing needs through changing circumstances and challenging markets.
As always, thank you for entrusting your assets to Vanguard.
Sincerely,

F. William McNabb III
Chairman and Chief Executive Officer
October 11, 2011
7
| | | | |
| Your Fund’s Performance at a Glance | | | | |
| September 30, 2010 , Through September 30, 2011 | | | | |
| | | | Distributions Per Share |
| | Starting | Ending | Income | Capital |
| | Share Price | Share Price | Dividends | Gains |
| Target Retirement 2030 Fund | $20.36 | $19.81 | $0.395 | $0.022 |
| Target Retirement 2035 Fund | $12.22 | $11.77 | $0.236 | $0.053 |
| Target Retirement 2040 Fund | $20.03 | $19.26 | $0.368 | $0.072 |
| Target Retirement 2045 Fund | $12.64 | $12.10 | $0.242 | $0.104 |
| Target Retirement 2050 Fund | $20.10 | $19.17 | $0.370 | $0.244 |
| Target Retirement 2055 Fund | $20.98 | $20.45 | $0.179 | $0.042 |
| | | |
| Asset Allocation on September 30, 2011 | | | |
| | | | Short-Term |
| | Stocks | Bonds | Reserves |
| Target Retirement 2030 Fund | 80.2% | 19.8% | 0.0% |
| Target Retirement 2035 Fund | 87.9% | 12.1% | 0.0% |
| Target Retirement 2040 Fund | 89.8% | 10.2% | 0.0% |
| Target Retirement 2045 Fund | 89.8% | 10.2% | 0.0% |
| Target Retirement 2050 Fund | 89.8% | 10.2% | 0.0% |
| Target Retirement 2055 Fund | 89.8% | 10.2% | 0.0% |
Note: As of September 30, 2011, international stock weightings for the 2030, 2035, 2040, 2045, 2050, and 2055 Funds were 24%, 26%, 27%, 27%, 27%, and 27% of assets, respectively.
8
Target Retirement 2030 Fund
Fund Profile
As of September 30, 2011
| |
| Total Fund Characteristics | |
| Ticker Symbol | VTHRX |
| 30-Day SEC Yield | 2.17% |
| Acquired Fund Fees and Expenses1 | 0.18% |
| |
| Allocation to Underlying Vanguard Funds | |
| Vanguard Total Stock Market Index Fund | |
| Investor Shares | 56.2% |
| Vanguard Total International Stock Index | |
| Fund Investor Shares | 24.0 |
| Vanguard Total Bond Market II Index Fund | |
| Investor Shares | 19.8 |
| | |
| Total Fund Volatility Measures | |
| | | DJ |
| | Target 2030 | U.S. Total |
| | Composite | Market |
| | Index | Index |
| R-Squared | 1.00 | 0.99 |
| Beta | 1.01 | 0.87 |
These measures show the degree and timing of the fund’s fluctuations compared with the indexes over 36 months.
Fund Asset Allocation
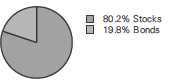
1 This figure—drawn from the prospectus dated January 26, 2011—represents an estimate of the weighted average of the expense ratios and any transaction fees charged by the underlying mutual funds (the ”acquired” funds) in which the Target Retirement 2030 Fund invests. The fund does not charge any expenses or fees of its own. For the fiscal year ended September 30, 2011, the acquired fund fees and expenses were 0.18%.
9
Target Retirement 2030 Fund
Performance Summary
All of the returns in this report represent past performance, which is not a guarantee of future results that may be achieved by the fund. (Current performance may be lower or higher than the performance data cited. For performance data current to the most recent month-end, visit our website at vanguard.com/performance.) Note, too, that both investment returns and principal value can fluctuate widely, so an investor’s shares, when sold, could be worth more or less than their original cost. The returns shown do not reflect taxes that a shareholder would pay on fund distributions or on the sale of fund shares.
Cumulative Performance: June 7, 2006, Through September 30, 2011
Initial Investment of $10,000
| | | | |
| | Average Annual Total Returns | |
| | Periods Ended September 30, 2011 | |
| | | | Since | Final Value |
| | One | Five | Inception | of a $10,000 |
| | Year | Years | (6/7/2006) | Investment |
| Target Retirement 2030 Fund | -0.83% | 0.44% | 1.57% | $10,861 |
| Dow Jones U.S. Total Stock Market | | | | |
| Index | 0.31 | -0.57 | 0.53 | 10,283 |
| |
| Target 2030 Composite Index | -0.49 | 0.50 | 1.63 | 10,900 |
| Mixed-Asset Target 2030 Funds | | | | |
| Average | -1.87 | -0.43 | 0.62 | 10,336 |
"Since Inception" performance is calculated from the fund’s inception date for both the fund and its comparative standards.
Target 2030 Composite Index: Derived by applying the fund’s target asset allocation to the results of the following benchmarks: for international stocks of developed markets, the MSCI EAFE Index through December 15, 2010, and the MSCI ACWI ex USA IMI Index thereafter; for emerging markets stocks, the Select Emerging Markets Index through August 23, 2006, the MSCI Emerging Markets Index through December 15, 2010, and the MSCI ACWI ex USA IMI Index thereafter; for bonds, the Barclays Capital U.S. Aggregate Bond Index through December 31, 2009, and the Barclays Capital U.S. Aggregate Float Adjusted Index thereafter; and for U.S. stocks, the MSCI US Broad Market Index. MSCI international benchmark returns are adjusted for withholding taxes applicable to Luxembourg holding companies.
Mixed-Asset Target 2030 Funds Average: Derived from data provided by Lipper Inc.
See Financial Highlights for dividend and capital gains information.
10
Target Retirement 2030 Fund
Fiscal-Year Total Returns (%): June 7, 2006, Through September 30, 2011

11
Target Retirement 2030 Fund
Financial Statements
Statement of Net Assets
As of September 30, 2011
The fund reports a complete list of its holdings in regulatory filings four times in each fiscal year, at the quarter-ends. For the second and fourth fiscal quarters, the lists appear in the fund’s semiannual and annual reports to shareholders. For the first and third fiscal quarters, the fund files the lists with the Securities and Exchange Commission on Form N-Q. Shareholders can look up the fund’s Forms N-Q on the SEC’s website at sec.gov. Forms N-Q may also be reviewed and copied at the SEC’s Public Reference Room (see the back cover of this report for further information).
| | |
| | | Market |
| | | Value |
| | Shares | ($000) |
| Investment Companies (99.8%) | | |
| U.S. Stock Fund (56.1%) | | |
| Vanguard Total Stock Market Index Fund Investor Shares | 164,918,757 | 4,629,270 |
| |
| International Stock Fund (24.0%) | | |
| Vanguard Total International Stock Index Fund Investor Shares | 153,157,131 | 1,978,790 |
| |
| Bond Fund (19.7%) | | |
| 1 Vanguard Total Bond Market II Index Fund Investor Shares | 148,764,445 | 1,627,483 |
| Total Investment Companies (Cost $8,476,194) | | 8,235,543 |
| Temporary Cash Investment (0.1%) | | |
| Money Market Fund (0.1%) | | |
| 1 Vanguard Market Liquidity Fund, 0.144% (Cost $4,241) | 4,241,299 | 4,241 |
| Total Investments (99.9%) (Cost $8,480,435) | | 8,239,784 |
| Other Assets and Liabilities (0.1%) | | |
| Other Assets | | 23,995 |
| Liabilities | | (19,229) |
| | | 4,766 |
| Net Assets (100%) | | |
| Applicable to 416,128,053 outstanding $.001 par value shares of | | |
| beneficial interest (unlimited authorization) | | 8,244,550 |
| Net Asset Value Per Share | | $19.81 |
| |
| At September 30, 2011, net assets consisted of: | |
| | Amount |
| | ($000) |
| Paid-in Capital | 8,428,965 |
| Undistributed Net Investment Income | 98,723 |
| Accumulated Net Realized Losses | (42,487) |
| Unrealized Appreciation (Depreciation) | (240,651) |
| Net Assets | 8,244,550 |
See Note A in Notes to Financial Statements.
1 Affiliated fund available only to Vanguard funds and certain trusts and accounts managed by Vanguard. Rate shown for Vanguard Market Liquidity Fund is the 7-day yield.
See accompanying Notes, which are an integral part of the Financial Statements.
12
Target Retirement 2030 Fund
| |
| Statement of Operations | |
| |
| | Year Ended |
| | September 30, 2011 |
| | ($000) |
| Investment Income | |
| Income | |
| Income Distributions Received | 155,961 |
| Net Investment Income—Note B | 155,961 |
| Realized Net Gain (Loss) | |
| Capital Gain Distributions Received | 8,738 |
| Investment Securities Sold | (22,976) |
| Realized Net Gain (Loss) | (14,238) |
| Change in Unrealized Appreciation (Depreciation) of Investment Securities | (402,712) |
| Net Increase (Decrease) in Net Assets Resulting from Operations | (260,989) |
See accompanying Notes, which are an integral part of the Financial Statements.
13
Target Retirement 2030 Fund
| | |
| Statement of Changes in Net Assets | | |
| |
| |
| | Year Ended September 30, |
| | 2011 | 2010 |
| | ($000) | ($000) |
| Increase (Decrease) in Net Assets | | |
| Operations | | |
| Net Investment Income | 155,961 | 122,297 |
| Realized Net Gain (Loss) | (14,238) | (20,358) |
| Change in Unrealized Appreciation (Depreciation) | (402,712) | 427,057 |
| Net Increase (Decrease) in Net Assets Resulting from Operations | (260,989) | 528,996 |
| Distributions | | |
| Net Investment Income | (132,260) | (91,755) |
| Realized Capital Gain1 | (7,366) | — |
| Total Distributions | (139,626) | (91,755) |
| Capital Share Transactions | | |
| Issued | 3,465,536 | 2,832,104 |
| Issued in Lieu of Cash Distributions | 138,834 | 91,300 |
| Redeemed | (1,491,969) | (831,107) |
| Net Increase (Decrease) from Capital Share Transactions | 2,112,401 | 2,092,297 |
| Total Increase (Decrease) | 1,711,786 | 2,529,538 |
| Net Assets | | |
| Beginning of Period | 6,532,764 | 4,003,226 |
| End of Period2 | 8,244,550 | 6,532,764 |
1 Includes fiscal 2011 short-term gain distributions totaling $7,366,000. Short-term gain distributions are treated as ordinary income dividends for tax purposes.
2 Net Assets—End of Period includes undistributed net investment income of $98,723,000 and $75,022,000.
See accompanying Notes, which are an integral part of the Financial Statements.
14
Target Retirement 2030 Fund
| | | | | |
| Financial Highlights | | | | | |
| |
| |
| For a Share Outstanding | | | Year Ended September 30, |
| Throughout Each Period | 2011 | 2010 | 2009 | 2008 | 2007 |
| Net Asset Value, Beginning of Period | $20.36 | $18.84 | $19.63 | $24.74 | $21.25 |
| Investment Operations | | | | | |
| Net Investment Income | .398 | .4531 | .4661 | .5221 | .4901 |
| Capital Gain Distributions Received | .011 | — | — | — | — |
| Net Realized and Unrealized Gain (Loss) | | | | | |
| on Investments | (.542) | 1.453 | (.793) | (5.262) | 3.190 |
| Total from Investment Operations | (.133) | 1.906 | (.327) | (4.740) | 3.680 |
| Distributions | | | | | |
| Dividends from Net Investment Income | (.395) | (.386) | (.463) | (.370) | (.190) |
| Distributions from Realized Capital Gains | (.022) | — | — | — | — |
| Total Distributions | (.417) | (.386) | (.463) | (.370) | (.190) |
| Net Asset Value, End of Period | $19.81 | $20.36 | $18.84 | $19.63 | $24.74 |
| |
| Total Return2 | -0.83% | 10.21% | -1.13% | -19.43% | 17.40% |
| |
| Ratios/Supplemental Data | | | | | |
| Net Assets, End of Period (Millions) | $8,245 | $6,533 | $4,003 | $2,359 | $1,103 |
| Ratio of Total Expenses to Average Net Assets | — | — | — | — | — |
| Acquired Fund Fees and Expenses | 0.18% | 0.19% | 0.21% | 0.19% | 0.21% |
| Ratio of Net Investment Income to | | | | | |
| Average Net Assets | 1.91% | 2.32% | 2.92% | 2.35% | 2.10% |
| Portfolio Turnover Rate | 19%3 | 9% | 13%4 | 6% | 4% |
1 Calculated based on average shares outstanding.
2 Total returns do not include account service fees that may have applied in the periods shown. Fund prospectuses provide information about any applicable account service fees.
3 Excludes the value of mutual fund shares delivered and received in connection with a change in the fund’s international equity investments from Vanguard European, Pacific, and Emerging Markets Stock Index Funds to Vanguard Total International Stock Index Fund because those transactions were effected in kind and did not cause the fund to incur transaction costs.
4 Excludes the value of mutual fund shares delivered and received in connection with a change in the fund’s bond investments from Vanguard Total Bond Market Index Fund to Vanguard Total Bond Market II Index Fund because those transactions were effected in kind and did not cause the fund to incur transaction costs.
See accompanying Notes, which are an integral part of the Financial Statements.
15
Target Retirement 2030 Fund
Notes to Financial Statements
Vanguard Target Retirement 2030 Fund is registered under the Investment Company Act of 1940 as an open-end investment company, or mutual fund. The fund follows a balanced investment strategy by investing in selected Vanguard funds to achieve its targeted allocation of assets to U.S. stocks, international stocks, and bonds.
A. The following significant accounting policies conform to generally accepted accounting principles for U.S. mutual funds. The fund consistently follows such policies in preparing its financial statements.
1. Security Valuation: Investments are valued at the net asset value of each underlying Vanguard fund determined as of the close of the New York Stock Exchange (generally 4 p.m., Eastern time) on the valuation date.
2. Federal Income Taxes: The fund intends to continue to qualify as a regulated investment company and distribute all of its taxable income. Management has analyzed the fund’s tax positions taken for all open federal income tax years (September 30, 2008–2011), and has concluded that no provision for federal income tax is required in the fund’s financial statements.
3. Distributions: Distributions to shareholders are recorded on the ex-dividend date.
4. Other: Income and capital gain distributions received are recorded on the ex-dividend date. Security transactions are accounted for on the date securities are bought or sold. Costs used to determine realized gains (losses) on the sale of investment securities are those of the specific securities sold.
B. Under a service agreement, The Vanguard Group furnishes investment advisory, corporate management, administrative, marketing, and distribution services to the fund. The service agreement provides that the fund’s expenses may be reduced or eliminated to the extent of savings realized by the Vanguard funds by the operation of the fund. Accordingly, all incremental expenses for services provided by Vanguard and all other expenses incurred by the fund during the year ended September 30, 2011, were borne by the funds in which the fund invests. The fund’s trustees and officers are also directors and officers of Vanguard and the funds in which the fund invests.
C. Various inputs may be used to determine the value of the fund’s investments. These inputs are summarized in three broad levels for financial statement purposes. The inputs or methodologies used to value securities are not necessarily an indication of the risk associated with investing in those securities.
Level 1—Quoted prices in active markets for identical securities.
Level 2—Other significant observable inputs (including quoted prices for similar securities, interest rates, prepayment speeds, credit risk, etc.).
Level 3—Significant unobservable inputs (including the fund’s own assumptions used to determine the fair value of investments).
At September 30, 2011, 100% of the market value of the fund’s investments was based on Level 1 inputs.
D. Distributions are determined on a tax basis and may differ from net investment income and realized capital gains for financial reporting purposes. Differences may be permanent or temporary. Permanent differences are reclassified among capital accounts in the financial statements to reflect their tax character. Temporary differences arise when certain items of income, expense, gain, or loss are recognized in different periods for financial statement and tax purposes; these differences will reverse at some time in the future. Differences in classification may also result from the treatment of short-term gains as ordinary income for tax purposes.
16
Target Retirement 2030 Fund
For tax purposes, at September 30, 2011, the fund had $98,687,000 of ordinary income available for distribution. The fund used a capital loss carryforward of $535,000 to offset taxable capital gains realized during the year ended September 30, 2011, reducing the amount of capital gains that would otherwise be available to distribute to shareholders. After utilizing these losses, tax-basis amounts required to be distributed in December 2010 included net capital gains realized through October 31, 2010, plus short-term gain distributions received from Vanguard Total Bond Market II Index Fund in December 2010. Short-term capital gain distributions received are treated as ordinary income for tax purposes, and cannot be offset by capital losses. The fund realized losses of $18,959,000 during the period from November 1, 2010, through September 30, 2011, which are deferred and will be treated as realized for tax purposes in fiscal 2012.
At September 30, 2011, the cost of investment securities for tax purposes was $8,503,927,000. Net unrealized depreciation of investment securities for tax purposes was $264,143,000, consisting of unrealized gains of $139,581,000 on securities that had risen in value since their purchase and $403,724,000 in unrealized losses on securities that had fallen in value since their purchase.
E. During the year ended September 30, 2011, the fund purchased $4,738,448,000 of investment securities and sold $2,600,895,000 of investment securities, other than temporary cash investments.
F. Capital shares issued and redeemed were:
| | |
| | Year Ended September 30, |
| | 2011 | 2010 |
| | Shares | Shares |
| | (000) | (000) |
| Issued | 157,714 | 146,170 |
| Issued in Lieu of Cash Distributions | 6,410 | 4,692 |
| Redeemed | (68,807) | (42,500) |
| Net Increase (Decrease) in Shares Outstanding | 95,317 | 108,362 |
G. In preparing the financial statements as of September 30, 2011, management considered the impact of subsequent events for potential recognition or disclosure in these financial statements.
17
Target Retirement 2035 Fund
Fund Profile
As of September 30, 2011
| |
| Total Fund Characteristics | |
| Ticker Symbol | VTTHX |
| 30-Day SEC Yield | 2.09% |
| Acquired Fund Fees and Expenses1 | 0.19% |
| |
| Allocation to Underlying Vanguard Funds | |
| Vanguard Total Stock Market Index Fund | |
| Investor Shares | 61.6% |
| Vanguard Total International Stock Index | |
| Fund Investor Shares | 26.3 |
| Vanguard Total Bond Market II Index Fund | |
| Investor Shares | 12.1 |
| | |
| Total Fund Volatility Measures | |
| | | DJ |
| | Target 2035 | U.S. Total |
| | Composite | Market |
| | Index | Index |
| R-Squared | 1.00 | 0.99 |
| Beta | 1.01 | 0.93 |
These measures show the degree and timing of the fund’s fluctuations compared with the indexes over 36 months.
Fund Asset Allocation
1 This figure—drawn from the prospectus dated January 26, 2011—represents an estimate of the weighted average of the expense ratios and any transaction fees charged by the underlying mutual funds (the ”acquired” funds) in which the Target Retirement 2035 Fund invests. The fund does not charge any expenses or fees of its own. For the fiscal year ended September 30, 2011, the acquired fund fees and expenses were 0.19%.
18
Target Retirement 2035 Fund
Performance Summary
All of the returns in this report represent past performance, which is not a guarantee of future results that may be achieved by the fund. (Current performance may be lower or higher than the performance data cited. For performance data current to the most recent month-end, visit our website at vanguard.com/performance.) Note, too, that both investment returns and principal value can fluctuate widely, so an investor’s shares, when sold, could be worth more or less than their original cost. The returns shown do not reflect taxes that a shareholder would pay on fund distributions or on the sale of fund shares.
Cumulative Performance: October 27, 2003, Through September 30, 2011
Initial Investment of $10,000
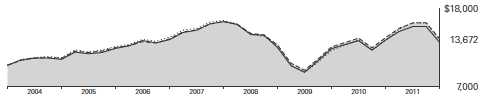
| | | | |
| | Average Annual Total Returns | |
| | Periods Ended September 30, 2011 | |
| | | | Since | Final Value |
| | One | Five | Inception | of a $10,000 |
| | Year | Years | (10/27/2003) | Investment |
| Target Retirement 2035 Fund | -1.55% | -0.02% | 4.02% | $13,672 |
| Dow Jones U.S. Total Stock Market | | | | |
| Index | 0.31 | -0.57 | 3.94 | 13,581 |
| |
| Target 2035 Composite Index | -1.16 | 0.04 | 4.12 | 13,768 |
| Mixed-Asset Target 2035 Funds | | | | |
| Average | -2.48 | -0.59 | 3.61 | 13,244 |
"Since Inception" performance is calculated from the fund’s inception date for both the fund and its comparative standards.
Target 2035 Composite Index: Derived by applying the fund’s target asset allocation to the results of the following benchmarks: for international stocks of developed markets, the MSCI EAFE Index through December 15, 2010, and the MSCI ACWI ex USA IMI Index thereafter; for emerging markets stocks, the Select Emerging Markets Index through August 23, 2006, the MSCI Emerging Markets Index through December 15, 2010, and the MSCI ACWI ex USA IMI Index thereafter; for bonds, the Barclays Capital U.S. Aggregate Bond Index through December 31, 2009, and the Barclays Capital U.S. Aggregate Float Adjusted Index thereafter; and for U.S. stocks, the Dow Jones Wilshire 5000 Index through April 22, 2005, and the MSCI US Broad Market Index thereafter. MSCI international benchmark returns are adjusted for withholding taxes applicable to Luxembourg holding companies.
Mixed-Asset Target 2035 Funds Average: Derived from data provided by Lipper Inc.
See Financial Highlights for dividend and capital gains information.
19
Target Retirement 2035 Fund
Fiscal-Year Total Returns (%): October 27, 2003, Through September 30, 2011
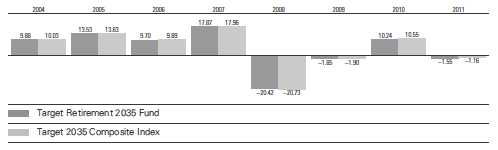
20
Target Retirement 2035 Fund
Financial Statements
Statement of Net Assets
As of September 30, 2011
The fund reports a complete list of its holdings in regulatory filings four times in each fiscal year, at the quarter-ends. For the second and fourth fiscal quarters, the lists appear in the fund’s semiannual and annual reports to shareholders. For the first and third fiscal quarters, the fund files the lists with the Securities and Exchange Commission on Form N-Q. Shareholders can look up the fund’s Forms N-Q on the SEC’s website at sec.gov. Forms N-Q may also be reviewed and copied at the SEC’s Public Reference Room (see the back cover of this report for further information).
| | |
| | | Market |
| | | Value |
| | Shares | ($000) |
| Investment Companies (99.9%) | | |
| U.S. Stock Fund (61.5%) | | |
| Vanguard Total Stock Market Index Fund Investor Shares | 224,289,695 | 6,295,812 |
| |
| International Stock Fund (26.3%) | | |
| Vanguard Total International Stock Index Fund Investor Shares | 208,283,204 | 2,691,019 |
| |
| Bond Fund (12.1%) | | |
| 1 Vanguard Total Bond Market II Index Fund Investor Shares | 113,456,221 | 1,241,211 |
| Total Investment Companies (Cost $10,591,197) | | 10,228,042 |
| Temporary Cash Investment (0.0%) | | |
| Money Market Fund (0.0%) | | |
| 1 Vanguard Market Liquidity Fund, 0.144% (Cost $4,189) | 4,189,239 | 4,189 |
| Total Investments (99.9%) (Cost $10,595,386) | | 10,232,231 |
| Other Assets and Liabilities (0.1%) | | |
| Other Assets | | 30,412 |
| Liabilities | | (23,329) |
| | | 7,083 |
| Net Assets (100%) | | |
| Applicable to 869,736,084 outstanding $.001 par value shares of | | |
| beneficial interest (unlimited authorization) | | 10,239,314 |
| Net Asset Value Per Share | | $11.77 |
| |
| At September 30, 2011, net assets consisted of: | |
| | Amount |
| | ($000) |
| Paid-in Capital | 10,578,312 |
| Undistributed Net Investment Income | 116,315 |
| Accumulated Net Realized Losses | (92,158) |
| Unrealized Appreciation (Depreciation) | (363,155) |
| Net Assets | 10,239,314 |
See Note A in Notes to Financial Statements.
1 Affiliated fund available only to Vanguard funds and certain trusts and accounts managed by Vanguard. Rate shown for Vanguard Market Liquidity Fund is the 7-day yield.
See accompanying Notes, which are an integral part of the Financial Statements.
21
Target Retirement 2035 Fund
| |
| Statement of Operations | |
| |
| | Year Ended |
| | September 30, 2011 |
| | ($000) |
| Investment Income | |
| Income | |
| Income Distributions Received | 196,416 |
| Net Investment Income—Note B | 196,416 |
| Realized Net Gain (Loss) | |
| Capital Gain Distributions Received | 7,165 |
| Investment Securities Sold | (5,660) |
| Realized Net Gain (Loss) | 1,505 |
| Change in Unrealized Appreciation (Depreciation) of Investment Securities | (502,631) |
| Net Increase (Decrease) in Net Assets Resulting from Operations | (304,710) |
See accompanying Notes, which are an integral part of the Financial Statements.
22
Target Retirement 2035 Fund
| | |
| Statement of Changes in Net Assets | | |
| |
| |
| | Year Ended September 30, |
| | 2011 | 2010 |
| | ($000) | ($000) |
| Increase (Decrease) in Net Assets | | |
| Operations | | |
| Net Investment Income | 196,416 | 178,970 |
| Realized Net Gain (Loss) | 1,505 | (20,809) |
| Change in Unrealized Appreciation (Depreciation) | (502,631) | 627,991 |
| Net Increase (Decrease) in Net Assets Resulting from Operations | (304,710) | 786,152 |
| Distributions | | |
| Net Investment Income | (181,829) | (151,112) |
| Realized Capital Gain1 | (40,834) | — |
| Total Distributions | (222,663) | (151,112) |
| Capital Share Transactions | | |
| Issued | 3,401,770 | 2,894,667 |
| Issued in Lieu of Cash Distributions | 220,834 | 150,664 |
| Redeemed | (2,078,454) | (1,238,082) |
| Net Increase (Decrease) from Capital Share Transactions | 1,544,150 | 1,807,249 |
| Total Increase (Decrease) | 1,016,777 | 2,442,289 |
| Net Assets | | |
| Beginning of Period | 9,222,537 | 6,780,248 |
| End of Period2 | 10,239,314 | 9,222,537 |
1 Includes fiscal 2011 short-term gain distributions totaling $9,246,000. Short-term gain distributions are treated as ordinary income dividends for tax purposes.
2 Net Assets—End of Period includes undistributed net investment income of $116,315,000 and $101,728,000.
See accompanying Notes, which are an integral part of the Financial Statements.
23
Target Retirement 2035 Fund
| | | | | |
| Financial Highlights | | | | | |
| |
| |
| For a Share Outstanding | | | Year Ended September 30, |
| Throughout Each Period | 2011 | 2010 | 2009 | 2008 | 2007 |
| Net Asset Value, Beginning of Period | $12.22 | $11.31 | $11.90 | $15.25 | $13.18 |
| Investment Operations | | | | | |
| Net Investment Income | .235 | .250 | .2731 | .293 | .270 |
| Capital Gain Distributions Received | .006 | — | — | — | — |
| Net Realized and Unrealized Gain (Loss) | | | | | |
| on Investments | (.402) | .898 | (.564) | (3.353) | 2.060 |
| Total from Investment Operations | (.161) | 1.148 | (.291) | (3.060) | 2.330 |
| Distributions | | | | | |
| Dividends from Net Investment Income | (.236) | (.238) | (.299) | (.290) | (.260) |
| Distributions from Realized Capital Gains | (.053) | — | — | — | — |
| Total Distributions | (.289) | (.238) | (.299) | (.290) | (.260) |
| Net Asset Value, End of Period | $11.77 | $12.22 | $11.31 | $11.90 | $15.25 |
| |
| Total Return2 | -1.55% | 10.24% | -1.85% | -20.42% | 17.87% |
| |
| Ratios/Supplemental Data | | | | | |
| Net Assets, End of Period (Millions) | $10,239 | $9,223 | $6,780 | $5,030 | $4,553 |
| Ratio of Total Expenses to Average Net Assets | — | — | — | — | — |
| Acquired Fund Fees and Expenses | 0.19% | 0.19% | 0.21% | 0.18% | 0.19% |
| Ratio of Net Investment Income to | | | | | |
| Average Net Assets | 1.81% | 2.24% | 2.88% | 2.28% | 2.09% |
| Portfolio Turnover Rate | 18%3 | 6% | 9%4 | 10% | 1% |
1 Calculated based on average shares outstanding.
2 Total returns do not include account service fees that may have applied in the periods shown. Fund prospectuses provide information about any applicable account service fees.
3 Excludes the value of mutual fund shares delivered and received in connection with a change in the fund’s international equity investments from Vanguard European, Pacific, and Emerging Markets Stock Index Funds to Vanguard Total International Stock Index Fund because those transactions were effected in kind and did not cause the fund to incur transaction costs.
4 Excludes the value of mutual fund shares delivered and received in connection with a change in the fund’s bond investments from Vanguard Total Bond Market Index Fund to Vanguard Total Bond Market II Index Fund because those transactions were effected in kind and did not cause the fund to incur transaction costs.
See accompanying Notes, which are an integral part of the Financial Statements.
24
Target Retirement 2035 Fund
Notes to Financial Statements
Vanguard Target Retirement 2035 Fund is registered under the Investment Company Act of 1940 as an open-end investment company, or mutual fund. The fund follows a balanced investment strategy by investing in selected Vanguard funds to achieve its targeted allocation of assets to U.S. stocks, international stocks, and bonds.
A. The following significant accounting policies conform to generally accepted accounting principles for U.S. mutual funds. The fund consistently follows such policies in preparing its financial statements.
1. Security Valuation: Investments are valued at the net asset value of each underlying Vanguard fund determined as of the close of the New York Stock Exchange (generally 4 p.m., Eastern time) on the valuation date.
2. Federal Income Taxes: The fund intends to continue to qualify as a regulated investment company and distribute all of its taxable income. Management has analyzed the fund’s tax positions taken for all open federal income tax years (September 30, 2008–2011), and has concluded that no provision for federal income tax is required in the fund’s financial statements.
3. Distributions: Distributions to shareholders are recorded on the ex-dividend date.
4. Other: Income and capital gain distributions received are recorded on the ex-dividend date. Security transactions are accounted for on the date securities are bought or sold. Costs used to determine realized gains (losses) on the sale of investment securities are those of the specific securities sold.
B. Under a service agreement, The Vanguard Group furnishes investment advisory, corporate management, administrative, marketing, and distribution services to the fund. The service agreement provides that the fund’s expenses may be reduced or eliminated to the extent of savings realized by the Vanguard funds by the operation of the fund. Accordingly, all incremental expenses for services provided by Vanguard and all other expenses incurred by the fund during the year ended September 30, 2011, were borne by the funds in which the fund invests. The fund’s trustees and officers are also directors and officers of Vanguard and the funds in which the fund invests.
C. Various inputs may be used to determine the value of the fund’s investments. These inputs are summarized in three broad levels for financial statement purposes. The inputs or methodologies used to value securities are not necessarily an indication of the risk associated with investing in those securities.
Level 1—Quoted prices in active markets for identical securities.
Level 2—Other significant observable inputs (including quoted prices for similar securities, interest rates, prepayment speeds, credit risk, etc.).
Level 3—Significant unobservable inputs (including the fund’s own assumptions used to determine the fair value of investments).
At September 30, 2011, 100% of the market value of the fund’s investments was based on Level 1 inputs.
D. Distributions are determined on a tax basis and may differ from net investment income and realized capital gains for financial reporting purposes. Differences may be permanent or temporary. Permanent differences are reclassified among capital accounts in the financial statements to reflect their tax character. Temporary differences arise when certain items of income, expense, gain, or loss are recognized in different periods for financial statement and tax purposes; these differences will reverse at some time in the future. Differences in classification may also result from the treatment of short-term gains as ordinary income for tax purposes.
25
Target Retirement 2035 Fund
For tax purposes, at September 30, 2011, the fund had $116,569,000 of ordinary income available for distribution. The fund used a capital loss carryforward of $32,138,000 to offset taxable capital gains realized during the year ended September 30, 2011, reducing the amount of capital gains that would otherwise be available to distribute to shareholders. After utilizing these losses, tax-basis amounts required to be distributed in December 2010 included net capital gains realized through October 31, 2010, plus short-term gain distributions received from Vanguard Total Bond Market II Index Fund in December 2010. Short-term capital gain distributions received are treated as ordinary income for tax purposes, and cannot be offset by capital losses. The fund realized losses of $59,672,000 during the period from November 1, 2010, through September 30, 2011, which are deferred and will be treated as realized for tax purposes in fiscal 2012.
At September 30, 2011, the cost of investment securities for tax purposes was $10,628,126,000. Net unrealized depreciation of investment securities for tax purposes was $395,895,000, consisting of unrealized gains of $156,050,000 on securities that had risen in value since their purchase and $551,945,000 in unrealized losses on securities that had fallen in value since their purchase.
E. During the year ended September 30, 2011, the fund purchased $5,175,078,000 of investment securities and sold $3,654,011,000 of investment securities, other than temporary cash investments.
F. Capital shares issued and redeemed were:
| | |
| | Year Ended September 30, |
| | 2011 | 2010 |
| | Shares | Shares |
| | (000) | (000) |
| Issued | 257,014 | 247,766 |
| Issued in Lieu of Cash Distributions | 16,883 | 12,855 |
| Redeemed | (158,773) | (105,300) |
| Net Increase (Decrease) in Shares Outstanding | 115,124 | 155,321 |
G. In preparing the financial statements as of September 30, 2011, management considered the impact of subsequent events for potential recognition or disclosure in these financial statements.
26
Target Retirement 2040 Fund
Fund Profile
As of September 30, 2011
| |
| Total Fund Characteristics | |
| Ticker Symbol | VFORX |
| 30-Day SEC Yield | 2.07% |
| Acquired Fund Fees and Expenses1 | 0.19% |
| |
| Allocation to Underlying Vanguard Funds | |
| Vanguard Total Stock Market Index Fund | |
| Investor Shares | 62.9% |
| Vanguard Total International Stock Index | |
| Fund Investor Shares | 26.9 |
| Vanguard Total Bond Market II Index Fund | |
| Investor Shares | 10.2 |
| | |
| Total Fund Volatility Measures | |
| | | DJ |
| | Target 2040 | U.S. Total |
| | Composite | Market |
| | Index | Index |
| R-Squared | 1.00 | 0.99 |
| Beta | 1.01 | 0.94 |
These measures show the degree and timing of the fund’s fluctuations compared with the indexes over 36 months.
Fund Asset Allocation
1 This figure—drawn from the prospectus dated January 26, 2011—represents an estimate of the weighted average of the expense ratios and any transaction fees charged by the underlying mutual funds (the ”acquired” funds) in which the Target Retirement 2040 Fund invests. The fund does not charge any expenses or fees of its own. For the fiscal year ended September 30, 2011, the acquired fund fees and expenses were 0.19%.
27
Target Retirement 2040 Fund
Performance Summary
All of the returns in this report represent past performance, which is not a guarantee of future results that may be achieved by the fund. (Current performance may be lower or higher than the performance data cited. For performance data current to the most recent month-end, visit our website at vanguard.com/performance.) Note, too, that both investment returns and principal value can fluctuate widely, so an investor’s shares, when sold, could be worth more or less than their original cost. The returns shown do not reflect taxes that a shareholder would pay on fund distributions or on the sale of fund shares.
Cumulative Performance: June 7, 2006, Through September 30, 2011
Initial Investment of $10,000
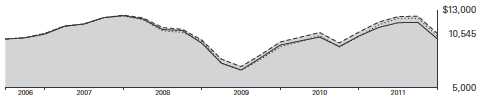
| | | | |
| | Average Annual Total Returns | |
| | Periods Ended September 30, 2011 | |
| | | | Since | Final Value |
| | One | Five | Inception | of a $10,000 |
| | Year | Years | (6/7/2006) | Investment |
| Target Retirement 2040 Fund | -1.87% | -0.04% | 1.00% | $10,545 |
| Dow Jones U.S. Total Stock Market | | | | |
| Index | 0.31 | -0.57 | 0.53 | 10,283 |
| |
| Target 2040 Composite Index | -1.45 | -0.02 | 1.04 | 10,564 |
| Mixed-Asset Target 2040 Funds | | | | |
| Average | -2.99 | -0.99 | 0.00 | 9,998 |
"Since Inception" performance is calculated from the fund’s inception date for both the fund and its comparative standards.
Target 2040 Composite Index: Derived by applying the fund’s target asset allocation to the results of the following benchmarks: for international stocks of developed markets, the MSCI EAFE Index through December 15, 2010, and the MSCI ACWI ex USA IMI Index thereafter; for emerging markets stocks, the Select Emerging Markets Index through August 23, 2006, the MSCI Emerging Markets Index through December 15, 2010, and the MSCI ACWI ex USA IMI Index thereafter; for bonds, the Barclays Capital U.S. Aggregate Bond Index through December 31, 2009, and the Barclays Capital U.S. Aggregate Float Adjusted Index thereafter; and for U.S. stocks, the MSCI US Broad Market Index. MSCI international benchmark returns are adjusted for withholding taxes applicable to Luxembourg holding companies.
Mixed-Asset Target 2040 Funds Average: Derived from data provided by Lipper Inc.
See Financial Highlights for dividend and capital gains information.
28
Target Retirement 2040 Fund
Fiscal-Year Total Returns (%): June 7, 2006, Through September 30, 2011
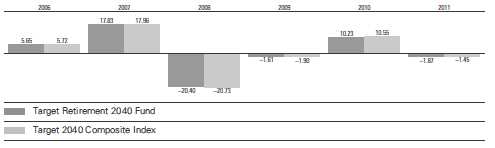
29
Target Retirement 2040 Fund
Financial Statements
Statement of Net Assets
As of September 30, 2011
The fund reports a complete list of its holdings in regulatory filings four times in each fiscal year, at the quarter-ends. For the second and fourth fiscal quarters, the lists appear in the fund’s semiannual and annual reports to shareholders. For the first and third fiscal quarters, the fund files the lists with the Securities and Exchange Commission on Form N-Q. Shareholders can look up the fund’s Forms N-Q on the SEC’s website at sec.gov. Forms N-Q may also be reviewed and copied at the SEC’s Public Reference Room (see the back cover of this report for further information).
| | |
| | | Market |
| | | Value |
| | Shares | ($000) |
| Investment Companies (99.8%) | | |
| U.S. Stock Fund (62.7%) | | |
| Vanguard Total Stock Market Index Fund Investor Shares | 111,235,120 | 3,122,370 |
| |
| International Stock Fund (26.9%) | | |
| Vanguard Total International Stock Index Fund Investor Shares | 103,543,729 | 1,337,785 |
| |
| Bond Fund (10.2%) | | |
| 1 Vanguard Total Bond Market II Index Fund Investor Shares | 46,396,609 | 507,579 |
| Total Investment Companies (Cost $5,134,546) | | 4,967,734 |
| Temporary Cash Investment (0.1%) | | |
| Money Market Fund (0.1%) | | |
| 1 Vanguard Market Liquidity Fund, 0.144% (Cost $2,559) | 2,559,017 | 2,559 |
| Total Investments (99.9%) (Cost $5,137,105) | | 4,970,293 |
| Other Assets and Liabilities (0.1%) | | |
| Other Assets | | 21,259 |
| Liabilities | | (14,398) |
| | | 6,861 |
| Net Assets (100%) | | |
| Applicable to 258,477,139 outstanding $.001 par value shares of | | |
| beneficial interest (unlimited authorization) | | 4,977,154 |
| Net Asset Value Per Share | | $19.26 |
| |
| At September 30, 2011, net assets consisted of: | |
| | Amount |
| | ($000) |
| Paid-in Capital | 5,104,865 |
| Undistributed Net Investment Income | 53,324 |
| Accumulated Net Realized Losses | (14,223) |
| Unrealized Appreciation (Depreciation) | (166,812) |
| Net Assets | 4,977,154 |
See Note A in Notes to Financial Statements.
1 Affiliated fund available only to Vanguard funds and certain trusts and accounts managed by Vanguard. Rate shown for Vanguard Market Liquidity Fund is the 7-day yield.
See accompanying Notes, which are an integral part of the Financial Statements.
30
Target Retirement 2040 Fund
| |
| Statement of Operations | |
| |
| | Year Ended |
| | September 30, 2011 |
| | ($000) |
| Investment Income | |
| Income | |
| Income Distributions Received | 88,335 |
| Net Investment Income—Note B | 88,335 |
| Realized Net Gain (Loss) | |
| Capital Gain Distributions Received | 2,853 |
| Investment Securities Sold | 24,204 |
| Realized Net Gain (Loss) | 27,057 |
| Change in Unrealized Appreciation (Depreciation) of Investment Securities | (344,764) |
| Net Increase (Decrease) in Net Assets Resulting from Operations | (229,372) |
See accompanying Notes, which are an integral part of the Financial Statements.
31
Target Retirement 2040 Fund
| | |
| Statement of Changes in Net Assets | | |
| |
| |
| | Year Ended September 30, |
| | 2011 | 2010 |
| | ($000) | ($000) |
| Increase (Decrease) in Net Assets | | |
| Operations | | |
| Net Investment Income | 88,335 | 69,272 |
| Realized Net Gain (Loss) | 27,057 | (26,008) |
| Change in Unrealized Appreciation (Depreciation) | (344,764) | 260,556 |
| Net Increase (Decrease) in Net Assets Resulting from Operations | (229,372) | 303,820 |
| Distributions | | |
| Net Investment Income | (74,229) | (52,010) |
| Realized Capital Gain1 | (14,523) | — |
| Total Distributions | (88,752) | (52,010) |
| Capital Share Transactions | | |
| Issued | 2,363,000 | 1,771,872 |
| Issued in Lieu of Cash Distributions | 88,014 | 51,808 |
| Redeemed | (986,609) | (574,648) |
| Net Increase (Decrease) from Capital Share Transactions | 1,464,405 | 1,249,032 |
| Total Increase (Decrease) | 1,146,281 | 1,500,842 |
| Net Assets | | |
| Beginning of Period | 3,830,873 | 2,330,031 |
| End of Period2 | 4,977,154 | 3,830,873 |
1 Includes fiscal 2011 short-term gain distributions totaling $14,523,000. Short-term gain distributions are treated as ordinary income dividends for tax purposes.
2 Net Assets—End of Period includes undistributed net investment income of $53,324,000 and $39,218,000.
See accompanying Notes, which are an integral part of the Financial Statements.
32
Target Retirement 2040 Fund
Financial Highlights
| | | | | |
| For a Share Outstanding | | | Year Ended September 30, |
| Throughout Each Period | 2011 | 2010 | 2009 | 2008 | 2007 |
| Net Asset Value, Beginning of Period | $20.03 | $18.52 | $19.36 | $24.70 | $21.13 |
| Investment Operations | | | | | |
| Net Investment Income | .369 | .393 | .4351 | .4941 | .4601 |
| Capital Gain Distributions Received | .006 | — | — | — | — |
| Net Realized and Unrealized Gain (Loss) | | | | | |
| on Investments | (.705) | 1.485 | (.849) | (5.464) | 3.290 |
| Total from Investment Operations | (.330) | 1.878 | (.414) | (4.970) | 3.750 |
| Distributions | | | | | |
| Dividends from Net Investment Income | (.368) | (.368) | (.426) | (.370) | (.180) |
| Distributions from Realized Capital Gains | (.072) | — | — | — | — |
| Total Distributions | (.440) | (.368) | (.426) | (.370) | (.180) |
| Net Asset Value, End of Period | $19.26 | $20.03 | $18.52 | $19.36 | $24.70 |
| |
| Total Return2 | -1.87% | 10.23% | -1.61% | -20.40% | 17.83% |
| |
| Ratios/Supplemental Data | | | | | |
| Net Assets, End of Period (Millions) | $4,977 | $3,831 | $2,330 | $1,199 | $513 |
| Ratio of Total Expenses to Average Net Assets | — | — | — | — | — |
| Acquired Fund Fees and Expenses | 0.19% | 0.19% | 0.21% | 0.19% | 0.21% |
| Ratio of Net Investment Income to | | | | | |
| Average Net Assets | 1.79% | 2.23% | 2.78% | 2.24% | 1.99% |
| Portfolio Turnover Rate | 15%3 | 7% | 9%4 | 4% | 4% |
1 Calculated based on average shares outstanding.
2 Total returns do not include account service fees that may have applied in the periods shown. Fund prospectuses provide information about any applicable account service fees.
3 Excludes the value of mutual fund shares delivered and received in connection with a change in the fund’s international equity investments from Vanguard European, Pacific, and Emerging Markets Stock Index Funds to Vanguard Total International Stock Index Fund because those transactions were effected in kind and did not cause the fund to incur transaction costs.
4 Excludes the value of mutual fund shares delivered and received in connection with a change in the fund’s bond investments from Vanguard Total Bond Market Index Fund to Vanguard Total Bond Market II Index Fund because those transactions were effected in kind and did not cause the fund to incur transaction costs.
See accompanying Notes, which are an integral part of the Financial Statements.
33
Target Retirement 2040 Fund
Notes to Financial Statements
Vanguard Target Retirement 2040 Fund is registered under the Investment Company Act of 1940 as an open-end investment company, or mutual fund. The fund follows a balanced investment strategy by investing in selected Vanguard funds to achieve its targeted allocation of assets to U.S. stocks, international stocks, and bonds.
A. The following significant accounting policies conform to generally accepted accounting principles for U.S. mutual funds. The fund consistently follows such policies in preparing its financial statements.
1. Security Valuation: Investments are valued at the net asset value of each underlying Vanguard fund determined as of the close of the New York Stock Exchange (generally 4 p.m., Eastern time) on the valuation date.
2. Federal Income Taxes: The fund intends to continue to qualify as a regulated investment company and distribute all of its taxable income. Management has analyzed the fund’s tax positions taken for all open federal income tax years (September 30, 2008–2011), and has concluded that no provision for federal income tax is required in the fund’s financial statements.
3. Distributions: Distributions to shareholders are recorded on the ex-dividend date.
4. Other: Income and capital gain distributions received are recorded on the ex-dividend date. Security transactions are accounted for on the date securities are bought or sold. Costs used to determine realized gains (losses) on the sale of investment securities are those of the specific securities sold.
B. Under a service agreement, The Vanguard Group furnishes investment advisory, corporate management, administrative, marketing, and distribution services to the fund. The service agreement provides that the fund’s expenses may be reduced or eliminated to the extent of savings realized by the Vanguard funds by the operation of the fund. Accordingly, all incremental expenses for services provided by Vanguard and all other expenses incurred by the fund during the year ended September 30, 2011, were borne by the funds in which the fund invests. The fund’s trustees and officers are also directors and officers of Vanguard and the funds in which the fund invests.
C. Various inputs may be used to determine the value of the fund’s investments. These inputs are summarized in three broad levels for financial statement purposes. The inputs or methodologies used to value securities are not necessarily an indication of the risk associated with investing in those securities.
Level 1—Quoted prices in active markets for identical securities.
Level 2—Other significant observable inputs (including quoted prices for similar securities, interest rates, prepayment speeds, credit risk, etc.).
Level 3—Significant unobservable inputs (including the fund’s own assumptions used to determine the fair value of investments).
At September 30, 2011, 100% of the market value of the fund’s investments was based on Level 1 inputs.
D. Distributions are determined on a tax basis and may differ from net investment income and realized capital gains for financial reporting purposes. Differences may be permanent or temporary. Permanent differences are reclassified among capital accounts in the financial statements to reflect their tax character. Temporary differences arise when certain items of income, expense, gain, or loss are recognized in different periods for financial statement and tax purposes; these differences will reverse at some time in the future. Differences in classification may also result from the treatment of short-term gains as ordinary income for tax purposes.
34
Target Retirement 2040 Fund
For tax purposes, at September 30, 2011, the fund had $53,358,000 of ordinary income available for distribution. Tax-basis amounts required to be distributed in December 2010 included net capital gains realized through October 31, 2010, plus short-term gain distributions received from Vanguard Total Bond Market II Index Fund in December 2010. Short-term capital gain distributions received are treated as ordinary income for tax purposes, and cannot be offset by capital losses. The fund realized losses of $3,340,000 during the period from November 1, 2010, through September 30, 2011, which are deferred and will be treated as realized for tax purposes in fiscal 2012.
At September 30, 2011, the cost of investment securities for tax purposes was $5,148,022,000. Net unrealized depreciation of investment securities for tax purposes was $177,729,000, consisting of unrealized gains of $87,475,000 on securities that had risen in value since their purchase and $265,204,000 in unrealized losses on securities that had fallen in value since their purchase.
E. During the year ended September 30, 2011, the fund purchased $2,892,692,000 of investment securities and sold $1,428,119,000 of investment securities, other than temporary cash investments.
F. Capital shares issued and redeemed were:
| | |
| | Year Ended September 30, |
| | 2011 | 2010 |
| | Shares | Shares |
| | (000) | (000) |
| Issued | 108,785 | 92,527 |
| Issued in Lieu of Cash Distributions | 4,097 | 2,698 |
| Redeemed | (45,683) | (29,778) |
| Net Increase (Decrease) in Shares Outstanding | 67,199 | 65,447 |
G. In preparing the financial statements as of September 30, 2011, management considered the impact of subsequent events for potential recognition or disclosure in these financial statements.
35
Target Retirement 2045 Fund
Fund Profile
As of September 30, 2011
| |
| Total Fund Characteristics | |
| Ticker Symbol | VTIVX |
| 30-Day SEC Yield | 2.07% |
| Acquired Fund Fees and Expenses1 | 0.19% |
| |
| Allocation to Underlying Vanguard Funds | |
| Vanguard Total Stock Market Index Fund | |
| Investor Shares | 62.8% |
| Vanguard Total International Stock Index | |
| Fund Investor Shares | 27.0 |
| Vanguard Total Bond Market II Index Fund | |
| Investor Shares | 10.2 |
| | |
| Total Fund Volatility Measures | |
| | | DJ |
| | Target 2045 | U.S. Total |
| | Composite | Market |
| | Index | Index |
| R-Squared | 1.00 | 0.99 |
| Beta | 1.01 | 0.94 |
These measures show the degree and timing of the fund’s fluctuations compared with the indexes over 36 months.
Fund Asset Allocation
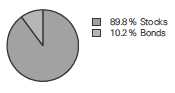
1 This figure—drawn from the prospectus dated January 26, 2011—represents an estimate of the weighted average of the expense ratios and any transaction fees charged by the underlying mutual funds (the ”acquired” funds) in which the Target Retirement 2045 Fund invests. The fund does not charge any expenses or fees of its own. For the fiscal year ended September 30, 2011, the acquired fund fees and expenses were 0.19%.
36
Target Retirement 2045 Fund
Performance Summary
All of the returns in this report represent past performance, which is not a guarantee of future results that may be achieved by the fund. (Current performance may be lower or higher than the performance data cited. For performance data current to the most recent month-end, visit our website at vanguard.com/performance.) Note, too, that both investment returns and principal value can fluctuate widely, so an investor’s shares, when sold, could be worth more or less than their original cost. The returns shown do not reflect taxes that a shareholder would pay on fund distributions or on the sale of fund shares.
Cumulative Performance: October 27, 2003, Through September 30, 2011
Initial Investment of $10,000
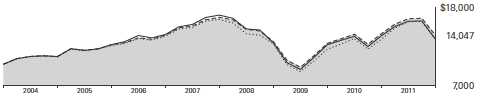
| | | | |
| | Average Annual Total Returns | |
| | Periods Ended September 30, 2011 | |
| | | | Since | Final Value |
| | One | Five | Inception | of a $10,000 |
| | Year | Years | (10/27/2003) | Investment |
| Target Retirement 2045 Fund | -1.82% | -0.05% | 4.38% | $14,047 |
| Dow Jones U.S. Total Stock Market | | | | |
| Index | 0.31 | -0.57 | 3.94 | 13,581 |
| |
| Target 2045 Composite Index | -1.45 | -0.02 | 4.45 | 14,122 |
| Mixed-Asset Target 2045 Funds | | | | |
| Average | -3.42 | -0.95 | 3.92 | 13,559 |
"Since Inception" performance is calculated from the fund’s inception date for both the fund and its comparative standards.
Target 2045 Composite Index: Derived by applying the fund’s target asset allocation to the results of the following benchmarks: for international stocks of developed markets, the MSCI EAFE Index through December 15, 2010, and the MSCI ACWI ex USA IMI Index thereafter; for emerging markets stocks, the Select Emerging Markets Index through August 23, 2006, the MSCI Emerging Markets Index through December 15, 2010, and the MSCI ACWI ex USA IMI Index thereafter; for bonds, the Barclays Capital U.S. Aggregate Bond Index through December 31, 2009, and the Barclays Capital U.S. Aggregate Float Adjusted Index thereafter; and for U.S. stocks, the Dow Jones Wilshire 5000 Index through April 22, 2005, and the MSCI US Broad Market Index thereafter. MSCI international benchmark returns are adjusted for withholding taxes applicable to Luxembourg holding companies.
Mixed-Asset Target 2045 Funds Average: Derived from data provided by Lipper Inc.
See Financial Highlights for dividend and capital gains information.
37
Target Retirement 2045 Fund
Fiscal-Year Total Returns (%): October 27, 2003, Through September 30, 2011

38
Target Retirement 2045 Fund
Financial Statements
Statement of Net Assets
As of September 30, 2011
The fund reports a complete list of its holdings in regulatory filings four times in each fiscal year, at the quarter-ends. For the second and fourth fiscal quarters, the lists appear in the fund’s semiannual and annual reports to shareholders. For the first and third fiscal quarters, the fund files the lists with the Securities and Exchange Commission on Form N-Q. Shareholders can look up the fund’s Forms N-Q on the SEC’s website at sec.gov. Forms N-Q may also be reviewed and copied at the SEC’s Public Reference Room (see the back cover of this report for further information).
| | |
| | | Market |
| | | Value |
| | Shares | ($000) |
| Investment Companies (99.9%) | | |
| U.S. Stock Fund (62.7%) | | |
| Vanguard Total Stock Market Index Fund Investor Shares | 127,316,692 | 3,573,780 |
| |
| International Stock Fund (27.0%) | | |
| Vanguard Total International Stock Index Fund Investor Shares | 118,891,250 | 1,536,075 |
| |
| Bond Fund (10.2%) | | |
| 1 Vanguard Total Bond Market II Index Fund Investor Shares | 53,180,943 | 581,799 |
| Total Investment Companies (Cost $5,898,010) | | 5,691,654 |
| Temporary Cash Investment (0.0%) | | |
| Money Market Fund (0.0%) | | |
| 1 Vanguard Market Liquidity Fund, 0.144% (Cost $2,174) | 2,173,912 | 2,174 |
| Total Investments (99.9%) (Cost $5,900,184) | | 5,693,828 |
| Other Assets and Liabilities (0.1%) | | |
| Other Assets | | 22,902 |
| Liabilities | | (14,793) |
| | | 8,109 |
| Net Assets (100%) | | |
| Applicable to 471,389,409 outstanding $.001 par value shares of | | |
| beneficial interest (unlimited authorization) | | 5,701,937 |
| Net Asset Value Per Share | | $12.10 |
| |
| At September 30, 2011, net assets consisted of: | |
| | Amount |
| | ($000) |
| Paid-in Capital | 5,898,652 |
| Undistributed Net Investment Income | 62,561 |
| Accumulated Net Realized Losses | (52,920) |
| Unrealized Appreciation (Depreciation) | (206,356) |
| Net Assets | 5,701,937 |
See Note A in Notes to Financial Statements.
1 Affiliated fund available only to Vanguard funds and certain trusts and accounts managed by Vanguard. Rate shown for Vanguard Market Liquidity Fund is the 7-day yield.
See accompanying Notes, which are an integral part of the Financial Statements.
39
Target Retirement 2045 Fund
| |
| Statement of Operations | |
| |
| | Year Ended |
| | September 30, 2011 |
| | ($000) |
| Investment Income | |
| Income | |
| Income Distributions Received | 106,266 |
| Net Investment Income—Note B | 106,266 |
| Realized Net Gain (Loss) | |
| Capital Gain Distributions Received | 3,608 |
| Investment Securities Sold | 4,006 |
| Realized Net Gain (Loss) | 7,614 |
| Change in Unrealized Appreciation (Depreciation) of Investment Securities | (321,143) |
| Net Increase (Decrease) in Net Assets Resulting from Operations | (207,263) |
See accompanying Notes, which are an integral part of the Financial Statements.
40
Target Retirement 2045 Fund
| | |
| Statement of Changes in Net Assets | | |
| |
| |
| | Year Ended September 30, |
| | 2011 | 2010 |
| | ($000) | ($000) |
| Increase (Decrease) in Net Assets | | |
| Operations | | |
| Net Investment Income | 106,266 | 94,717 |
| Realized Net Gain (Loss) | 7,614 | (15,689) |
| Change in Unrealized Appreciation (Depreciation) | (321,143) | 334,427 |
| Net Increase (Decrease) in Net Assets Resulting from Operations | (207,263) | 413,455 |
| Distributions | | |
| Net Investment Income | (97,564) | (79,441) |
| Realized Capital Gain1 | (41,929) | — |
| Total Distributions | (139,493) | (79,441) |
| Capital Share Transactions | | |
| Issued | 2,176,140 | 1,660,216 |
| Issued in Lieu of Cash Distributions | 138,621 | 79,243 |
| Redeemed | (1,184,181) | (715,190) |
| Net Increase (Decrease) from Capital Share Transactions | 1,130,580 | 1,024,269 |
| Total Increase (Decrease) | 783,824 | 1,358,283 |
| Net Assets | | |
| Beginning of Period | 4,918,113 | 3,559,830 |
| End of Period2 | 5,701,937 | 4,918,113 |
1 Includes fiscal 2011 short-term gain distributions totaling $20,965,000. Short-term gain distributions are treated as ordinary income dividends for tax purposes.
2 Net Assets—End of Period includes undistributed net investment income of $62,561,000 and $53,859,000.
See accompanying Notes, which are an integral part of the Financial Statements.
41
Target Retirement 2045 Fund
Financial Highlights
| | | | | |
| For a Share Outstanding | | | Year Ended September 30, |
| Throughout Each Period | 2011 | 2010 | 2009 | 2008 | 2007 |
| Net Asset Value, Beginning of Period | $12.64 | $11.70 | $12.29 | $15.75 | $13.60 |
| Investment Operations | | | | | |
| Net Investment Income | .237 | .257 | .2811 | .303 | .280 |
| Capital Gain Distributions Received | .005 | — | — | — | — |
| Net Realized and Unrealized Gain (Loss) | | | | | |
| on Investments | (.436) | .929 | (.570) | (3.463) | 2.130 |
| Total from Investment Operations | (.194) | 1.186 | (.289) | (3.160) | 2.410 |
| Distributions | | | | | |
| Dividends from Net Investment Income | (.242) | (.246) | (.301) | (.300) | (.250) |
| Distributions from Realized Capital Gains | (.104) | — | — | — | (.010) |
| Total Distributions | (.346) | (.246) | (.301) | (.300) | (.260) |
| Net Asset Value, End of Period | $12.10 | $12.64 | $11.70 | $12.29 | $15.75 |
| |
| Total Return2 | -1.82% | 10.23% | -1.77% | -20.42% | 17.90% |
| |
| Ratios/Supplemental Data | | | | | |
| Net Assets, End of Period (Millions) | $5,702 | $4,918 | $3,560 | $2,493 | $2,204 |
| Ratio of Total Expenses to Average Net Assets | — | — | — | — | — |
| Acquired Fund Fees and Expenses | 0.19% | 0.19% | 0.21% | 0.18% | 0.19% |
| Ratio of Net Investment Income to | | | | | |
| Average Net Assets | 1.79% | 2.24% | 2.86% | 2.28% | 2.08% |
| Portfolio Turnover Rate | 16%3 | 6% | 10%4 | 9% | 1% |
1 Calculated based on average shares outstanding.
2 Total returns do not include account service fees that may have applied in the periods shown. Fund prospectuses provide information about any applicable account service fees.
3 Excludes the value of mutual fund shares delivered and received in connection with a change in the fund’s international equity investments from Vanguard European, Pacific, and Emerging Markets Stock Index Funds to Vanguard Total International Stock Index Fund because those transactions were effected in kind and did not cause the fund to incur transaction costs.
4 Excludes the value of mutual fund shares delivered and received in connection with a change in the fund’s bond investments from Vanguard Total Bond Market Index Fund to Vanguard Total Bond Market II Index Fund because those transactions were effected in kind and did not cause the fund to incur transaction costs.
See accompanying Notes, which are an integral part of the Financial Statements.
42
Target Retirement 2045 Fund
Notes to Financial Statements
Vanguard Target Retirement 2045 Fund is registered under the Investment Company Act of 1940 as an open-end investment company, or mutual fund. The fund follows a balanced investment strategy by investing in selected Vanguard funds to achieve its targeted allocation of assets to U.S. stocks, international stocks, and bonds.
A. The following significant accounting policies conform to generally accepted accounting principles for U.S. mutual funds. The fund consistently follows such policies in preparing its financial statements.
1. Security Valuation: Investments are valued at the net asset value of each underlying Vanguard fund determined as of the close of the New York Stock Exchange (generally 4 p.m., Eastern time) on the valuation date.
2. Federal Income Taxes: The fund intends to continue to qualify as a regulated investment company and distribute all of its taxable income. Management has analyzed the fund’s tax positions taken for all open federal income tax years (September 30, 2008–2011), and has concluded that no provision for federal income tax is required in the fund’s financial statements.
3. Distributions: Distributions to shareholders are recorded on the ex-dividend date.
4. Other: Income and capital gain distributions received are recorded on the ex-dividend date. Security transactions are accounted for on the date securities are bought or sold. Costs used to determine realized gains (losses) on the sale of investment securities are those of the specific securities sold.
B. Under a service agreement, The Vanguard Group furnishes investment advisory, corporate management, administrative, marketing, and distribution services to the fund. The service agreement provides that the fund’s expenses may be reduced or eliminated to the extent of savings realized by the Vanguard funds by the operation of the fund. Accordingly, all incremental expenses for services provided by Vanguard and all other expenses incurred by the fund during the year ended September 30, 2011, were borne by the funds in which the fund invests. The fund’s trustees and officers are also directors and officers of Vanguard and the funds in which the fund invests.
C. Various inputs may be used to determine the value of the fund’s investments. These inputs are summarized in three broad levels for financial statement purposes. The inputs or methodologies used to value securities are not necessarily an indication of the risk associated with investing in those securities.
Level 1—Quoted prices in active markets for identical securities.
Level 2—Other significant observable inputs (including quoted prices for similar securities, interest rates, prepayment speeds, credit risk, etc.).
Level 3—Significant unobservable inputs (including the fund’s own assumptions used to determine the fair value of investments).
At September 30, 2011, 100% of the market value of the fund’s investments was based on Level 1 inputs.
D. Distributions are determined on a tax basis and may differ from net investment income and realized capital gains for financial reporting purposes. Differences may be permanent or temporary. Permanent differences are reclassified among capital accounts in the financial statements to reflect their tax character. Temporary differences arise when certain items of income, expense, gain, or loss are recognized in different periods for financial statement and tax purposes; these differences will reverse at some time in the future. Differences in classification may also result from the treatment of short-term gains as ordinary income for tax purposes.
43
Target Retirement 2045 Fund
For tax purposes, at September 30, 2011, the fund had $62,604,000 of ordinary income available for distribution. The fund used a capital loss carryforward of $3,064,000 to offset taxable capital gains realized during the year ended September 30, 2011, reducing the amount of capital gains that would otherwise be available to distribute to shareholders. After utilizing these losses, tax-basis amounts required to be distributed in December 2010 included net capital gains realized through October 31, 2010, plus short-term gain distributions received from Vanguard Total Bond Market II Index Fund in December 2010. Short-term capital gain distributions received are treated as ordinary income for tax purposes, and cannot be offset by capital losses. The fund realized losses of $34,303,000 during the period from November 1, 2010, through September 30, 2011, which are deferred and will be treated as realized for tax purposes in fiscal 2012.
At September 30, 2011, the cost of investment securities for tax purposes was $5,918,843,000. Net unrealized depreciation of investment securities for tax purposes was $225,015,000, consisting of unrealized gains of $88,888,000 on securities that had risen in value since their purchase and $313,903,000 in unrealized losses on securities that had fallen in value since their purchase.
E. During the year ended September 30, 2011, the fund purchased $2,928,736,000 of investment securities and sold $1,830,787,000 of investment securities, other than temporary cash investments.
F. Capital shares issued and redeemed were:
| | |
| | Year Ended September 30, |
| | 2011 | 2010 |
| | Shares | Shares |
| | (000) | (000) |
| Issued | 159,565 | 137,147 |
| Issued in Lieu of Cash Distributions | 10,276 | 6,538 |
| Redeemed | (87,425) | (58,872) |
| Net Increase (Decrease) in Shares Outstanding | 82,416 | 84,813 |
G. In preparing the financial statements as of September 30, 2011, management considered the impact of subsequent events for potential recognition or disclosure in these financial statements.
44
Target Retirement 2050 Fund
Fund Profile
As of September 30, 2011
| |
| Total Fund Characteristics | |
| Ticker Symbol | VFIFX |
| 30-Day SEC Yield | 2.07% |
| Acquired Fund Fees and Expenses1 | 0.19% |
| |
| Allocation to Underlying Vanguard Funds | |
| Vanguard Total Stock Market Index Fund | |
| Investor Shares | 62.7% |
| Vanguard Total International Stock Index | |
| Fund Investor Shares | 27.1 |
| Vanguard Total Bond Market II Index Fund | |
| Investor Shares | 10.2 |
| | |
| Total Fund Volatility Measures | |
| | | DJ |
| | Target 2050 | U.S. Total |
| | Composite | Market |
| | Index | Index |
| R-Squared | 1.00 | 0.99 |
| Beta | 1.01 | 0.94 |
These measures show the degree and timing of the fund’s fluctuations compared with the indexes over 36 months.
Fund Asset Allocation
1 This figure—drawn from the prospectus dated January 26, 2011—represents an estimate of the weighted average of the expense ratios and any transaction fees charged by the underlying mutual funds (the ”acquired” funds) in which the Target Retirement 2050 Fund invests. The fund does not charge any expenses or fees of its own. For the fiscal year ended September 30, 2011, the acquired fund fees and expenses were 0.19%.
45
Target Retirement 2050 Fund
Performance Summary
All of the returns in this report represent past performance, which is not a guarantee of future results that may be achieved by the fund. (Current performance may be lower or higher than the performance data cited. For performance data current to the most recent month-end, visit our website at vanguard.com/performance.) Note, too, that both investment returns and principal value can fluctuate widely, so an investor’s shares, when sold, could be worth more or less than their original cost. The returns shown do not reflect taxes that a shareholder would pay on fund distributions or on the sale of fund shares.
Cumulative Performance: June 7, 2006, Through September 30, 2011
Initial Investment of $10,000
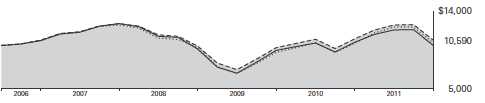
| | | | |
| | Average Annual Total Returns | |
| | Periods Ended September 30, 2011 | |
| | | | Since | Final Value |
| | One | Five | Inception | of a $10,000 |
| | Year | Years | (6/7/2006) | Investment |
| Target Retirement 2050 Fund | -1.89% | -0.06% | 1.09% | $10,590 |
| Dow Jones U.S. Total Stock Market | | | | |
| Index | 0.31 | -0.57 | 0.53 | 10,283 |
| |
| Target 2050 Composite Index | -1.45 | -0.02 | 1.12 | 10,611 |
| Mixed-Asset Target 2050+ Funds | | | | |
| Average | -3.61 | -1.09 | -0.02 | 9,991 |
"Since Inception" performance is calculated from the fund’s inception date for both the fund and its comparative standards.
Target 2050 Composite Index: Derived by applying the fund’s target asset allocation to the results of the following benchmarks: for international stocks of developed markets, the MSCI EAFE Index through December 15, 2010, and the MSCI ACWI ex USA IMI Index thereafter; for emerging markets stocks, the Select Emerging Markets Index through August 23, 2006, the MSCI Emerging Markets Index through December 15, 2010, and the MSCI ACWI ex USA IMI Index thereafter; for bonds, the Barclays Capital U.S. Aggregate Bond Index through December 31, 2009, and the Barclays Capital U.S. Aggregate Float Adjusted Index thereafter; and for U.S. stocks, the MSCI US Broad Market Index. MSCI international benchmark returns are adjusted for withholding taxes applicable to Luxembourg holding companies.
Mixed-Asset Target 2050+ Funds Average: Derived from data provided by Lipper Inc.
See Financial Highlights for dividend and capital gains information.
46
Target Retirement 2050 Fund
Fiscal-Year Total Returns (%): June 7, 2006, Through September 30, 2011
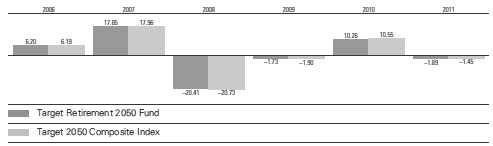
47
Target Retirement 2050 Fund
Financial Statements
Statement of Net Assets
As of September 30, 2011
The fund reports a complete list of its holdings in regulatory filings four times in each fiscal year, at the quarter-ends. For the second and fourth fiscal quarters, the lists appear in the fund’s semiannual and annual reports to shareholders. For the first and third fiscal quarters, the fund files the lists with the Securities and Exchange Commission on Form N-Q. Shareholders can look up the fund’s Forms N-Q on the SEC’s website at sec.gov. Forms N-Q may also be reviewed and copied at the SEC’s Public Reference Room (see the back cover of this report for further information).
| | |
| | | Market |
| | | Value |
| | Shares | ($000) |
| Investment Companies (99.8%) | | |
| U.S. Stock Fund (62.5%) | | |
| Vanguard Total Stock Market Index Fund Investor Shares | 46,210,569 | 1,297,131 |
| |
| International Stock Fund (27.1%) | | |
| Vanguard Total International Stock Index Fund Investor Shares | 43,460,497 | 561,509 |
| |
| Bond Fund (10.2%) | | |
| 1 Vanguard Total Bond Market II Index Fund Investor Shares | 19,301,259 | 211,156 |
| Total Investment Companies (Cost $2,129,352) | | 2,069,796 |
| Temporary Cash Investment (0.1%) | | |
| Money Market Fund (0.1%) | | |
| 1 Vanguard Market Liquidity Fund, 0.144% (Cost $1,732) | 1,731,888 | 1,732 |
| Total Investments (99.9%) (Cost $2,131,084) | | 2,071,528 |
| Other Assets and Liabilities (0.1%) | | |
| Other Assets | | 12,155 |
| Liabilities | | (9,550) |
| | | 2,605 |
| Net Assets (100%) | | |
| Applicable to 108,216,842 outstanding $.001 par value shares of | | |
| beneficial interest (unlimited authorization) | | 2,074,133 |
| Net Asset Value Per Share | | $19.17 |
| |
| At September 30, 2011, net assets consisted of: | |
| | Amount |
| | ($000) |
| Paid-in Capital | 2,120,514 |
| Undistributed Net Investment Income | 21,990 |
| Accumulated Net Realized Losses | (8,815) |
| Unrealized Appreciation (Depreciation) | (59,556) |
| Net Assets | 2,074,133 |
See Note A in Notes to Financial Statements.
1 Affiliated fund available only to Vanguard funds and certain trusts and accounts managed by Vanguard. Rate shown for Vanguard Market Liquidity Fund is the 7-day yield.
See accompanying Notes, which are an integral part of the Financial Statements.
48
Target Retirement 2050 Fund
| |
| Statement of Operations | |
| |
| | Year Ended |
| | September 30, 2011 |
| | ($000) |
| Investment Income | |
| Income | |
| Income Distributions Received | 36,062 |
| Net Investment Income—Note B | 36,062 |
| Realized Net Gain (Loss) | |
| Capital Gain Distributions Received | 1,174 |
| Investment Securities Sold | 23,700 |
| Realized Net Gain (Loss) | 24,874 |
| Change in Unrealized Appreciation (Depreciation) of Investment Securities | (159,824) |
| Net Increase (Decrease) in Net Assets Resulting from Operations | (98,888) |
See accompanying Notes, which are an integral part of the Financial Statements.
49
Target Retirement 2050 Fund
| | |
| Statement of Changes in Net Assets | | |
| |
| |
| | Year Ended September 30, |
| | 2011 | 2010 |
| | ($000) | ($000) |
| Increase (Decrease) in Net Assets | | |
| Operations | | |
| Net Investment Income | 36,062 | 27,183 |
| Realized Net Gain (Loss) | 24,874 | (13,176) |
| Change in Unrealized Appreciation (Depreciation) | (159,824) | 104,504 |
| Net Increase (Decrease) in Net Assets Resulting from Operations | (98,888) | 118,511 |
| Distributions | | |
| Net Investment Income | (30,163) | (20,292) |
| Realized Capital Gain1 | (19,891) | — |
| Total Distributions | (50,054) | (20,292) |
| Capital Share Transactions | | |
| Issued | 1,174,424 | 809,016 |
| Issued in Lieu of Cash Distributions | 49,545 | 20,210 |
| Redeemed | (518,202) | (333,882) |
| Net Increase (Decrease) from Capital Share Transactions | 705,767 | 495,344 |
| Total Increase (Decrease) | 556,825 | 593,563 |
| Net Assets | | |
| Beginning of Period | 1,517,308 | 923,745 |
| End of Period2 | 2,074,133 | 1,517,308 |
1 Includes fiscal 2011 short-term gain distributions totaling $10,109,000. Short-term gain distributions are treated as ordinary income dividends for tax purposes.
2 Net Assets—End of Period includes undistributed net investment income of $21,990,000 and $16,091,000.
See accompanying Notes, which are an integral part of the Financial Statements.
50
Target Retirement 2050 Fund
Financial Highlights
| | | | | |
| For a Share Outstanding | | | Year Ended September 30, |
| Throughout Each Period | 2011 | 2010 | 2009 | 2008 | 2007 |
| Net Asset Value, Beginning of Period | $20.10 | $18.58 | $19.43 | $24.79 | $21.24 |
| Investment Operations | | | | | |
| Net Investment Income | .360 | .399 | .4311 | .5031 | .4801 |
| Capital Gain Distributions Received | .006 | — | — | — | — |
| Net Realized and Unrealized Gain (Loss) | | | | | |
| on Investments | (.682) | 1.492 | (.866) | (5.493) | 3.290 |
| Total from Investment Operations | (.316) | 1.891 | (.435) | (4.990) | 3.770 |
| Distributions | | | | | |
| Dividends from Net Investment Income | (.370) | (.371) | (.415) | (.370) | (.220) |
| Distributions from Realized Capital Gains | (.244) | — | — | — | — |
| Total Distributions | (.614) | (.371) | (.415) | (.370) | (.220) |
| Net Asset Value, End of Period | $19.17 | $20.10 | $18.58 | $19.43 | $24.79 |
| |
| Total Return2 | -1.89% | 10.26% | -1.73% | -20.41% | 17.85% |
| |
| Ratios/Supplemental Data | | | | | |
| Net Assets, End of Period (Millions) | $2,074 | $1,517 | $924 | $409 | $192 |
| Ratio of Total Expenses to Average Net Assets | — | — | — | — | — |
| Acquired Fund Fees and Expenses | 0.19% | 0.19% | 0.21% | 0.19% | 0.21% |
| Ratio of Net Investment Income to | | | | | |
| Average Net Assets | 1.79% | 2.21% | 2.74% | 2.27% | 2.04% |
| Portfolio Turnover Rate | 15%3 | 10% | 8%4 | 4% | 2% |
1 Calculated based on average shares outstanding.
2 Total returns do not include account service fees that may have applied in the periods shown. Fund prospectuses provide information about any applicable account service fees.
3 Excludes the value of mutual fund shares delivered and received in connection with a change in the fund’s international equity investments from Vanguard European, Pacific, and Emerging Markets Stock Index Funds to Vanguard Total International Stock Index Fund because those transactions were effected in kind and did not cause the fund to incur transaction costs.
4 Excludes the value of mutual fund shares delivered and received in connection with a change in the fund’s bond investments from Vanguard Total Bond Market Index Fund to Vanguard Total Bond Market II Index Fund because those transactions were effected in kind and did not cause the fund to incur transaction costs.
See accompanying Notes, which are an integral part of the Financial Statements.
51
Target Retirement 2050 Fund
Notes to Financial Statements
Vanguard Target Retirement 2050 Fund is registered under the Investment Company Act of 1940 as an open-end investment company, or mutual fund. The fund follows a balanced investment strategy by investing in selected Vanguard funds to achieve its targeted allocation of assets to U.S. stocks, international stocks, and bonds.
A. The following significant accounting policies conform to generally accepted accounting principles for U.S. mutual funds. The fund consistently follows such policies in preparing its financial statements.
1. Security Valuation: Investments are valued at the net asset value of each underlying Vanguard fund determined as of the close of the New York Stock Exchange (generally 4 p.m., Eastern time) on the valuation date.
2. Federal Income Taxes: The fund intends to continue to qualify as a regulated investment company and distribute all of its taxable income. Management has analyzed the fund’s tax positions taken for all open federal income tax years (September 30, 2008–2011), and has concluded that no provision for federal income tax is required in the fund’s financial statements.
3. Distributions: Distributions to shareholders are recorded on the ex-dividend date.
4. Other: Income and capital gain distributions received are recorded on the ex-dividend date. Security transactions are accounted for on the date securities are bought or sold. Costs used to determine realized gains (losses) on the sale of investment securities are those of the specific securities sold.
B. Under a service agreement, The Vanguard Group furnishes investment advisory, corporate management, administrative, marketing, and distribution services to the fund. The service agreement provides that the fund’s expenses may be reduced or eliminated to the extent of savings realized by the Vanguard funds by the operation of the fund. Accordingly, all incremental expenses for services provided by Vanguard and all other expenses incurred by the fund during the year ended September 30, 2011, were borne by the funds in which the fund invests. The fund’s trustees and officers are also directors and officers of Vanguard and the funds in which the fund invests.
C. Various inputs may be used to determine the value of the fund’s investments. These inputs are summarized in three broad levels for financial statement purposes. The inputs or methodologies used to value securities are not necessarily an indication of the risk associated with investing in those securities.
Level 1—Quoted prices in active markets for identical securities.
Level 2—Other significant observable inputs (including quoted prices for similar securities, interest rates, prepayment speeds, credit risk, etc.).
Level 3—Significant unobservable inputs (including the fund’s own assumptions used to determine the fair value of investments).
At September 30, 2011, 100% of the market value of the fund’s investments was based on Level 1 inputs.
D. Distributions are determined on a tax basis and may differ from net investment income and realized capital gains for financial reporting purposes. Differences may be permanent or temporary. Permanent differences are reclassified among capital accounts in the financial statements to reflect their tax character. Temporary differences arise when certain items of income, expense, gain, or loss are recognized in different periods for financial statement and tax purposes; these differences will reverse at some time in the future. Differences in classification may also result from the treatment of short-term gains as ordinary income for tax purposes.
52
Target Retirement 2050 Fund
For tax purposes, at September 30, 2011, the fund had $21,944,000 of ordinary income available for distribution. Tax-basis amounts required to be distributed in December 2010 included net capital gains realized through October 31, 2010, plus short-term gain distributions received from Vanguard Total Bond Market II Index Fund in December 2010. Short-term capital gain distributions received are treated as ordinary income for tax purposes, and cannot be offset by capital losses. The fund realized losses of $7,663,000 during the period from November 1, 2010, through September 30, 2011, which are deferred and will be treated as realized for tax purposes in fiscal 2012.
At September 30, 2011, the cost of investment securities for tax purposes was $2,132,190,000. Net unrealized depreciation of investment securities for tax purposes was $60,662,000, consisting of unrealized gains of $45,830,000 on securities that had risen in value since their purchase and $106,492,000 in unrealized losses on securities that had fallen in value since their purchase.
E. During the year ended September 30, 2011, the fund purchased $1,277,717,000 of investment securities and sold $585,592,000 of investment securities, other than temporary cash investments.
F. Capital shares issued and redeemed were:
| | |
| | Year Ended September 30, |
| | 2011 | 2010 |
| | Shares | Shares |
| | (000) | (000) |
| Issued | 54,294 | 42,109 |
| Issued in Lieu of Cash Distributions | 2,317 | 1,049 |
| Redeemed | (23,901) | (17,367) |
| Net Increase (Decrease) in Shares Outstanding | 32,710 | 25,791 |
G. In preparing the financial statements as of September 30, 2011, management considered the impact of subsequent events for potential recognition or disclosure in these financial statements.
53
Target Retirement 2055 Fund
Fund Profile
As of September 30, 2011
| |
| Total Fund Characteristics | |
| Ticker Symbol | VFFVX |
| 30-Day SEC Yield | 2.07% |
| Acquired Fund Fees and Expenses1 | 0.19% |
| |
| Allocation to Underlying Vanguard Funds | |
| Vanguard Total Stock Market Index Fund | |
| Investor Shares | 62.6% |
| Vanguard Total International Stock Index | |
| Fund Investor Shares | 27.2 |
| Vanguard Total Bond Market II Index Fund | |
| Investor Shares | 10.2 |
Fund Asset Allocation
1 This figure—drawn from the prospectus dated January 26, 2011—represents an estimate of the weighted average of the expense ratios and any transaction fees charged by the underlying mutual funds (the ”acquired” funds) in which the Target Retirement 2055 Fund invests. The fund does not charge any expenses or fees of its own. For the fiscal year ended September 30, 2011, the acquired fund fees and expenses were 0.19%.
54
Target Retirement 2055 Fund
Performance Summary
All of the returns in this report represent past performance, which is not a guarantee of future results that may be achieved by the fund. (Current performance may be lower or higher than the performance data cited. For performance data current to the most recent monthend, visit our website at vanguard.com/performance.) Note, too, that both investment returns and principal value can fluctuate widely, so an investor’s shares, when sold, could be worth more or less than their original cost. The returns shown do not reflect taxes that a shareholder would pay on fund distributions or on the sale of fund shares.
Cumulative Performance: August 18, 2010, Through September 30, 2011
Initial Investment of $10,000
| | | |
| | | Total Returns | |
| | Periods Ended September 30, 2011 | |
| | | Since | Final Value |
| | One | Inception | of a $10,000 |
| | Year | (8/18/2010) | Investment |
| Target Retirement 2055 Fund | -1.58% | 2.90% | $10,324 |
| Dow Jones U.S. Total Stock Market Index | 0.31 | 4.90 | 10,549 |
| Target 2055 Composite Index | -1.45 | 3.07 | 10,344 |
| Mixed-Asset Target 2050+ Funds Average | -3.61 | 1.01 | 10,113 |
“Since Inception” performance is calculated from the fund’s inception date for both the fund and its comparative standards.
Target 2055 Composite Index: Derived by applying the fund’s target asset allocation to the results of the following benchmarks: for international stocks of developed markets, the MSCI EAFE Index through December 15, 2010, and the MSCI ACWI ex USA IMI Index thereafter; for emerging markets stocks, the MSCI Emerging Markets Index through December 15, 2010, and the MSCI ACWI ex USA IMI Index thereafter; for bonds, the Barclays Capital U.S. Aggregate Float Adjusted Index; and for U.S. stocks, the MSCI US Broad Market Index. MSCI international benchmark returns are adjusted for withholding taxes applicable to Luxembourg holding companies.
Mixed-Asset Target 2050+ Funds Average: Derived from data provided by Lipper Inc.
See Financial Highlights for dividend and capital gains information.
55
Target Retirement 2055 Fund
Fiscal-Year Total Returns (%): August 18, 2010, Through September 30, 2011
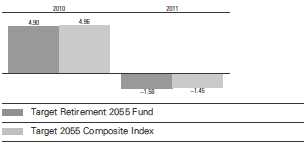
56
Target Retirement 2055 Fund
Financial Statements
Statement of Net Assets
As of September 30, 2011
The fund reports a complete list of its holdings in regulatory filings four times in each fiscal year, at the quarter-ends. For the second and fourth fiscal quarters, the lists appear in the fund’s semiannual and annual reports to shareholders. For the first and third fiscal quarters, the fund files the lists with the Securities and Exchange Commission on Form N-Q. Shareholders can look up the fund’s Forms N-Q on the SEC’s website at sec.gov. Forms N-Q may also be reviewed and copied at the SEC’s Public Reference Room (see the back cover of this report for further information).
| | |
| | | Market |
| | | Value |
| | Shares | ($000) |
| Investment Companies (100.0%) | | |
| U.S. Stock Fund (62.6%) | | |
| Vanguard Total Stock Market Index Fund Investor Shares | 2,769,092 | 77,728 |
| |
| International Stock Fund (27.2%) | | |
| Vanguard Total International Stock Index Fund Investor Shares | 2,617,324 | 33,816 |
| |
| Bond Fund (10.2%) | | |
| 1 Vanguard Total Bond Market II Index Fund Investor Shares | 1,155,518 | 12,641 |
| Total Investment Companies (Cost $140,138) | | 124,185 |
| Temporary Cash Investment (0.1%) | | |
| Money Market Fund (0.1%) | | |
| 1 Vanguard Market Liquidity Fund, 0.144% (Cost $139) | 138,668 | 139 |
| Total Investments (100.1%) (Cost $140,277) | | 124,324 |
| Other Assets and Liabilities (-0.1%) | | |
| Other Assets | | 1,444 |
| Liabilities | | (1,532) |
| | | (88) |
| Net Assets (100%) | | |
| Applicable to 6,073,912 outstanding $.001 par value shares of | | |
| beneficial interest (unlimited authorization) | | 124,236 |
| Net Asset Value Per Share | | $20.45 |
| |
| At September 30, 2011, net assets consisted of: | |
| | Amount |
| | ($000) |
| Paid-in Capital | 139,442 |
| Undistributed Net Investment Income | 945 |
| Accumulated Net Realized Losses | (198) |
| Unrealized Appreciation (Depreciation) | (15,953) |
| Net Assets | 124,236 |
See Note A in Notes to Financial Statements.
1 Affiliated fund available only to Vanguard funds and certain trusts and accounts managed by Vanguard. Rate shown for Vanguard Market Liquidity Fund is the 7-day yield.
See accompanying Notes, which are an integral part of the Financial Statements.
57
Target Retirement 2055 Fund
| |
| Statement of Operations | |
| |
| | Year Ended |
| | September 30, 2011 |
| | ($000) |
| Investment Income | |
| Income | |
| Income Distributions Received | 1,085 |
| Net Investment Income—Note B | 1,085 |
| Realized Net Gain (Loss) | |
| Capital Gain Distributions Received | 12 |
| Investment Securities Sold | (176) |
| Realized Net Gain (Loss) | (164) |
| Change in Unrealized Appreciation (Depreciation) of Investment Securities | (16,009) |
| Net Increase (Decrease) in Net Assets Resulting from Operations | (15,088) |
See accompanying Notes, which are an integral part of the Financial Statements.
58
Target Retirement 2055 Fund
| | |
| Statement of Changes in Net Assets | | |
| |
| |
| | | August 18, |
| | Year Ended | 20101 to |
| | September 30, | September 30, |
| | 2011 | 2010 |
| | ($000) | ($000) |
| Increase (Decrease) in Net Assets | | |
| Operations | | |
| Net Investment Income | 1,085 | 6 |
| Realized Net Gain (Loss) | (164) | — |
| Change in Unrealized Appreciation (Depreciation) | (16,009) | 56 |
| Net Increase (Decrease) in Net Assets Resulting from Operations | (15,088) | 62 |
| Distributions | | |
| Net Investment Income | (146) | — |
| Realized Capital Gain2 | (34) | — |
| Total Distributions | (180) | — |
| Capital Share Transactions | | |
| Issued | 163,181 | 1,825 |
| Issued in Lieu of Cash Distributions | 180 | — |
| Redeemed | (25,727) | (17) |
| Net Increase (Decrease) from Capital Share Transactions | 137,634 | 1,808 |
| Total Increase (Decrease) | 122,366 | 1,870 |
| Net Assets | | |
| Beginning of Period | 1,870 | — |
| End of Period3 | 124,236 | 1,870 |
1 Inception.
2 Includes fiscal 2011 short-term gain distributions totaling $34,000. Short-term gain distributions are treated as ordinary income dividends for tax purposes.
3 Net Assets—End of Period includes undistributed net investment income of $945,000 and $6,000.
See accompanying Notes, which are an integral part of the Financial Statements.
59
Target Retirement 2055 Fund
| | |
| Financial Highlights | | |
| |
| | | Aug. 18, |
| | Year Ended | 20101 to |
| | September 30, | Sept. 30, |
| For a Share Outstanding Throughout Each Period | 2011 | 2010 |
| Net Asset Value, Beginning of Period | $20.98 | $20.00 |
| Investment Operations | | |
| Net Investment Income | .3882 | .063 |
| Capital Gain Distributions Received | .001 | — |
| Net Realized and Unrealized Gain (Loss) on Investments | (.698) | .917 |
| Total from Investment Operations | (.309) | .980 |
| Distributions | | |
| Dividends from Net Investment Income | (.179) | — |
| Distributions from Realized Capital Gains | (.042) | — |
| Total Distributions | (.221) | — |
| Net Asset Value, End of Period | $20.45 | $20.98 |
| |
| Total Return3 | -1.58% | 4.90% |
| |
| Ratios/Supplemental Data | | |
| Net Assets, End of Period (Millions) | $124 | $2 |
| Ratio of Total Expenses to Average Net Assets | — | — |
| Acquired Fund Fees and Expenses | 0.19% | 0.22%4 |
| Ratio of Net Investment Income to Average Net Assets | 1.71% | 2.73%4 |
| Portfolio Turnover Rate | 12%5 | 3% |
1 Inception.
2 Calculated based on average shares outstanding.
3 Total returns do not include account service fees that may have applied in the periods shown. Fund prospectuses provide information about any applicable account service fees.
4 Annualized.
5 Excludes the value of mutual fund shares delivered and received in connection with a change in the fund’s international equity investments from Vanguard European, Pacific, and Emerging Markets Stock Index Funds to Vanguard Total International Stock Index Fund because those transactions were effected in kind and did not cause the fund to incur transaction costs.
See accompanying Notes, which are an integral part of the Financial Statements.
60
Target Retirement 2055 Fund
Notes to Financial Statements
Vanguard Target Retirement 2055 Fund is registered under the Investment Company Act of 1940 as an open-end investment company, or mutual fund. The fund follows a balanced investment strategy by investing in selected Vanguard funds to achieve its targeted allocation of assets to U.S. stocks, international stocks, and bonds.
A. The following significant accounting policies conform to generally accepted accounting principles for U.S. mutual funds. The fund consistently follows such policies in preparing its financial statements.
1. Security Valuation: Investments are valued at the net asset value of each underlying Vanguard fund determined as of the close of the New York Stock Exchange (generally 4 p.m., Eastern time) on the valuation date.
2. Federal Income Taxes: The fund intends to continue to qualify as a regulated investment company and distribute all of its taxable income. Management has analyzed the fund’s tax positions taken for all open federal income tax years (September 30, 2010–2011), and has concluded that no provision for federal income tax is required in the fund’s financial statements.
3. Distributions: Distributions to shareholders are recorded on the ex-dividend date.
4. Other: Income and capital gain distributions received are recorded on the ex-dividend date. Security transactions are accounted for on the date securities are bought or sold. Costs used to determine realized gains (losses) on the sale of investment securities are those of the specific securities sold.
B. Under a service agreement, The Vanguard Group furnishes investment advisory, corporate management, administrative, marketing, and distribution services to the fund. The service agreement provides that the fund’s expenses may be reduced or eliminated to the extent of savings realized by the Vanguard funds by the operation of the fund. Accordingly, all incremental expenses for services provided by Vanguard and all other expenses incurred by the fund during the year ended September 30, 2011, were borne by the funds in which the fund invests. The fund’s trustees and officers are also directors and officers of Vanguard and the funds in which the fund invests.
C. Various inputs may be used to determine the value of the fund’s investments. These inputs are summarized in three broad levels for financial statement purposes. The inputs or methodologies used to value securities are not necessarily an indication of the risk associated with investing in those securities.
Level 1—Quoted prices in active markets for identical securities.
Level 2—Other significant observable inputs (including quoted prices for similar securities, interest rates, prepayment speeds, credit risk, etc.).
Level 3—Significant unobservable inputs (including the fund’s own assumptions used to determine the fair value of investments).
At September 30, 2011, 100% of the market value of the fund’s investments was based on Level 1 inputs.
D. Distributions are determined on a tax basis and may differ from net investment income and realized capital gains for financial reporting purposes. Differences may be permanent or temporary. Permanent differences are reclassified among capital accounts in the financial statements to reflect their tax character. Temporary differences arise when certain items of income, expense, gain, or loss are recognized in different periods for financial statement and tax purposes; these differences will reverse at some time in the future. Differences in classification may also result from the treatment of short-term gains as ordinary income for tax purposes.
61
Target Retirement 2055 Fund
For tax purposes, at September 30, 2011, the fund had $975,000 of ordinary income available for distribution. Tax-basis amounts required to be distributed in December 2010 included net capital gains realized through October 31, 2010, plus short-term gain distributions received from Vanguard Total Bond Market II Index Fund in December 2010. Short-term capital gain distributions received are treated as ordinary income for tax purposes, and cannot be offset by capital losses.
At September 30, 2011, the cost of investment securities for tax purposes was $140,505,000. Net unrealized depreciation of investment securities for tax purposes was $16,181,000, consisting of unrealized gains of $417,000 on securities that had risen in value since their purchase and $16,598,000 in unrealized losses on securities that had fallen in value since their purchase.
E. During the year ended September 30, 2011, the fund purchased $146,589,000 of investment securities and sold $8,078,000 of investment securities, other than temporary cash investments.
F. Capital shares issued and redeemed were:
| | |
| | Year Ended | August 18, 20101 to |
| | September 30, 2011 | September 30, 2010 |
| | Shares | Shares |
| | (000) | (000) |
| Issued | 7,096 | 90 |
| Issued in Lieu of Cash Distributions | 8 | — |
| Redeemed | (1,119) | (1) |
| Net Increase (Decrease) in Shares Outstanding | 5,985 | 89 |
| 1 Inception. | | |
G. In preparing the financial statements as of September 30, 2011, management considered the impact of subsequent events for potential recognition or disclosure in these financial statements.
62
Report of Independent Registered Public Accounting Firm
To the Trustees of Vanguard Chester Funds and the Shareholders of Vanguard Target Retirement 2030 Fund, Vanguard Target Retirement 2035 Fund, Vanguard Target Retirement 2040 Fund, Vanguard Target Retirement 2045 Fund, Vanguard Target Retirement 2050 Fund and Vanguard Target Retirement 2055 Fund:
In our opinion, the accompanying statements of net assets and the related statements of operations and of changes in net assets and the financial highlights present fairly, in all material respects, the financial position of Vanguard Target Retirement 2030 Fund, Vanguard Target Retirement 2035 Fund, Vanguard Target Retirement 2040 Fund, Vanguard Target Retirement 2045 Fund, Vanguard Target Retirement 2050 Fund, and Vanguard Target Retirement 2055 Fund (collectively constituting six separate portfolios of Vanguard Chester Funds, hereafter referred to as the “Funds”) at September 30, 2011, the results of each of their operations for the year then ended, the changes in each of their net assets for each of the periods indicated and the financial highlights for each of the periods indicated, in conformity with accounting principles generally accepted in the United States of America. These financial statements and financial highlights (hereafter referred to as “financial statements”) are the responsibility of the Funds’ management; our responsibility is to express an opinion on these financial statements based on our audits. We conducted our audits of these financial statements in accordance with the standards of the Public Company Accounting Oversight Board (United States). Those standards require that we plan and perform the audit to obtain reasonable assurance about whether the financial statements are free of material misstatement. An audit includes examining, on a test basis, evidence supporting the amounts and disclosures in the financial statements, assessing the accounting principles used and significant estimates made by management, and evaluating the overall financial statement presentation. We believe that our audits, which included confirmation of securities at September 30, 2011 by agreement to the underlying ownership records of the Vanguard funds, provide a reasonable basis for our opinion.
PricewaterhouseCoopers LLP
Philadelphia, Pennsylvania
November 11, 2011
63
|
| Special 2011 tax information (unaudited) for Vanguard Target Retirement Funds |
This information for the fiscal year ended September 30, 2011, is included pursuant to provisions of the Internal Revenue Code.
The funds distributed capital gain dividends (from net long-term capital gains) to shareholders during the fiscal year as follows:
| |
| | Capital Gain Dividends |
| Fund | ($000) |
| Target Retirement 2030 Fund | — |
| Target Retirement 2035 Fund | 31,589 |
| Target Retirement 2040 Fund | — |
| Target Retirement 2045 Fund | 20,965 |
| Target Retirement 2050 Fund | 9,791 |
| Target Retirement 2055 Fund | 3 |
The funds distributed qualified dividend income to shareholders during the fiscal year as follows:
| |
| | Qualified Dividend Income |
| Fund | ($000) |
| Target Retirement 2030 Fund | 91,008 |
| Target Retirement 2035 Fund | 141,844 |
| Target Retirement 2040 Fund | 58,158 |
| Target Retirement 2045 Fund | 76,383 |
| Target Retirement 2050 Fund | 23,636 |
| Target Retirement 2055 Fund | 116 |
For corporate shareholders, the percentage of investment income (dividend income plus short-term gains, if any) that qualifies for the dividends-received deduction is as follows:
| |
| Fund | Percentage |
| Target Retirement 2030 Fund | 48.8% |
| Target Retirement 2035 Fund | 55.7 |
| Target Retirement 2040 Fund | 51.7 |
| Target Retirement 2045 Fund | 50.0 |
| Target Retirement 2050 Fund | 47.4 |
| Target Retirement 2055 Fund | 66.9 |
64
Your Fund’s After-Tax Returns
This table presents returns for your fund both before and after taxes. The after-tax returns are shown in two ways: (1) assuming that an investor owned the fund during the entire period and paid taxes on the fund’s distributions, and (2) assuming that an investor paid taxes on the fund’s distributions and sold all shares at the end of each period.
Calculations are based on the highest individual federal income tax and capital gains tax rates in effect at the times of the distributions and the hypothetical sales. State and local taxes were not considered. After-tax returns reflect any qualified dividend income , using actual prior-year figures and estimates for 2011. (In the example, returns after the sale of fund shares may be higher than those assuming no sale. This occurs when the sale would have produced a capital loss. The calculation assumes that the investor received a tax deduction for the loss.) Please note that your actual after-tax returns will depend on your tax situation and may differ from those shown. Also note that if you own the fund in a tax-deferred account, such as an individual retirement account or a 401(k) plan, this information does not apply to you. Such accounts are not subject to current taxes.
Finally, keep in mind that a fund’s performance—whether before or after taxes—does not guarantee future results.
| | | |
| Average Annual Total Returns: Target Retirement Funds | | | |
| Periods Ended September 30, 2011 | | | |
| | | | Since |
| | One | Five | Inception |
| | Year | Years | (6/7/2006) |
| Target Retirement 2030 Fund | | | |
| Returns Before Taxes | -0.83% | 0.44% | 1.57% |
| Returns After Taxes on Distributions | -1.24 | 0.06 | 1.20 |
| Returns After Taxes on Distributions and Sale of Fund Shares | -0.25 | 0.26 | 1.23 |
| |
| | | | Since |
| | One | Five | Inception |
| | Year | Years | (10/27/2003) |
| Target Retirement 2035 Fund | | | |
| Returns Before Taxes | -1.55% | -0.02% | 4.02% |
| Returns After Taxes on Distributions | -1.97 | -0.46 | 3.62 |
| Returns After Taxes on Distributions and Sale of Fund Shares | -0.61 | -0.12 | 3.36 |
| |
| | | | Since |
| | One | Five | Inception |
| | Year | Years | (6/7/2006) |
| Target Retirement 2040 Fund | | | |
| Returns Before Taxes | -1.87% | -0.04% | 1.00% |
| Returns After Taxes on Distributions | -2.31 | -0.40 | 0.66 |
| Returns After Taxes on Distributions and Sale of Fund Shares | -0.90 | -0.12 | 0.77 |
65
| | | | |
| Average Annual Total Returns: Target Retirement Funds | | | | |
| Periods Ended September 30, 2011 | | | | |
| |
| | | | | Since |
| | One | | Five | Inception |
| | Year | | Years | (10/27/2003) |
| Target Retirement 2045 Fund | | | | |
| Returns Before Taxes | -1.82% | | -0.05% | 4.38% |
| Returns After Taxes on Distributions | -2.33 | | -0.51 | 3.99 |
| Returns After Taxes on Distributions and Sale of Fund Shares | -0.76 | | -0.16 | 3.69 |
| |
| | | | | Since |
| | One | | Five | Inception |
| | Year | | Years | (6/7/2006) |
| Target Retirement 2050 Fund | | | | |
| Returns Before Taxes | -1.89% | | -0.06% | 1.09% |
| Returns After Taxes on Distributions | -2.48 | | -0.45 | 0.71 |
| Returns After Taxes on Distributions and Sale of Fund Shares | -0.77 | | -0.14 | 0.84 |
| |
| | | | | Since |
| | | One | | Inception |
| | | Year | | (8/18/2010) |
| Target Retirement 2055 Fund | | | | |
| Returns Before Taxes | | -1.58% | | 2.90% |
| Returns After Taxes on Distributions | | -1.79 | | 2.70 |
| Returns After Taxes on Distributions and Sale of Fund Shares | | -0.88 | | 2.41 |
66
About Your Fund’s Expenses
As a shareholder of the fund, you incur ongoing costs, which include costs for portfolio management, administrative services, and shareholder reports (like this one), among others. Operating expenses, which are deducted from a fund’s gross income, directly reduce the investment return of the fund.
A typical fund’s expenses are expressed as a percentage of its average net assets. The Target Retirement Funds have no direct expenses, but each fund bears its proportionate share of the costs for the underlying funds in which it invests. These indirect expenses make up the acquired fund fees and expenses, also expressed as a percentage of average net assets.
The following examples are intended to help you understand the ongoing cost (in dollars) of investing in your fund and to compare these costs with those of other mutual funds. The examples are based on an investment of $1,000 made at the beginning of the period shown and held for the entire period. The costs were calculated using the acquired fund fees and expenses for each Target Retirement Fund.
The accompanying table illustrates your fund’s costs in two ways:
• Based on actual fund return. This section helps you to estimate the actual expenses that you paid over the period. The ”Ending Account Value“ shown is derived from the fund‘s actual return, and the third column shows the dollar amount that would have been paid by an investor who started with $1,000 in the fund. You may use the information here, together with the amount you invested, to estimate the expenses that you paid over the period.
To do so, simply divide your account value by $1,000 (for example, an $8,600 account value divided by $1,000 = 8.6), then multiply the result by the number given for your fund under the heading ”Expenses Paid During Period.“
• Based on hypothetical 5% yearly return. This section is intended to help you compare your fund‘s costs with those of other mutual funds. It assumes that the fund had a yearly return of 5% before expenses, but that the expense ratio is unchanged. In this case—because the return used is not the fund’s actual return—the results do not apply to your investment. The example is useful in making comparisons because the Securities and Exchange Commission requires all mutual funds to calculate expenses based on a 5% return. You can assess your fund’s costs by comparing this hypothetical example with the hypothetical examples that appear in shareholder reports of other funds.
Note that the expenses shown in the table are meant to highlight and help you compare ongoing costs only and do not reflect transaction costs incurred by the fund for buying and selling securities. Further, the expenses do not include any purchase, redemption, or account service fees described in the fund prospectus. If such fees were applied to your account, your costs would be higher. Your fund does not carry a “sales load.”
The calculations assume no shares were bought or sold during the period. Your actual costs may have been higher or lower, depending on the amount of your investment and the timing of any purchases or redemptions.
You can find more information about the fund’s expenses, including annual expense ratios, in the Financial Statements section of this report. For additional information on operating expenses and other shareholder costs, please refer to your fund’s current prospectus.
67
| | | |
| Six Months Ended September 30, 2011 | | | |
| | Beginning | Ending | Expenses |
| | Account Value | Account Value | Paid During |
| | 3/31/2011 | 9/30/2011 | Period |
| Based on Actual Fund Return | | | |
| Target Retirement 2030 Fund | $1,000.00 | $875.00 | $0.85 |
| Target Retirement 2035 Fund | $1,000.00 | $857.87 | $0.88 |
| Target Retirement 2040 Fund | $1,000.00 | $854.48 | $0.88 |
| Target Retirement 2045 Fund | $1,000.00 | $854.52 | $0.88 |
| Target Retirement 2050 Fund | $1,000.00 | $854.28 | $0.88 |
| Target Retirement 2055 Fund | $1,000.00 | $855.65 | $0.88 |
| Based on Hypothetical 5% Yearly Return | | | |
| Target Retirement 2030 Fund | $1,000.00 | $1,024.17 | $0.91 |
| Target Retirement 2035 Fund | $1,000.00 | $1,024.12 | $0.96 |
| Target Retirement 2040 Fund | $1,000.00 | $1,024.12 | $0.96 |
| Target Retirement 2045 Fund | $1,000.00 | $1,024.12 | $0.96 |
| Target Retirement 2050 Fund | $1,000.00 | $1,024.12 | $0.96 |
| Target Retirement 2055 Fund | $1,000.00 | $1,024.12 | $0.96 |
The calculations are based on the acquired fund fees and expenses for the most recent six-month period. The funds’ annualized expense figures for the period are (in order as listed from top to bottom above) 0.18%, 0.19%, 0.19%, 0.19%, 0.19%, and 0.19%. The dollar amounts shown as ”Expenses Paid” are equal to the annualized expense figures for the underlying funds multiplied by the average account value over the period, multiplied by the number of days in the most recent six-month period, then divided by the number of days in the most recent 12-month period.
68
Glossary
30-Day SEC Yield. A fund’s 30-day SEC yield is derived using a formula specified by the U.S. Securities and Exchange Commission. Under the formula, data related to the fund’s security holdings in the previous 30 days are used to calculate the fund’s hypothetical net income for that period, which is then annualized and divided by the fund’s estimated average net assets over the calculation period. For the purposes of this calculation, a security’s income is based on its current market yield to maturity (for bonds; excluding inflation for inflation-protected securities), its actual income (for asset-backed securities), or its projected dividend yield (for stocks). Because the SEC yield represents hypothetical annualized income, it will differ—at times significantly—from the fund’s actual experience. As a result, the fund’s income distributions may be higher or lower than implied by the SEC yield.
Acquired Fund Fees and Expenses. Funds that invest in other Vanguard funds incur no direct expenses, but they do bear proportionate shares of the operating, administrative, and advisory expenses of the underlying funds, and they must pay any fees charged by those funds. The figure for acquired fund fees and expenses represents a weighted average of these underlying costs. Acquired is a term that the Securities and Exchange Commission applies to any mutual fund whose shares are owned by another fund.
Beta. A measure of the magnitude of a fund’s past share-price fluctuations in relation to the ups and downs of a given market index. The index is assigned a beta of 1.00. Compared with a given index, a fund with a beta of 1.20 typically would have seen its share price rise or fall by 12% when the index rose or fell by 10%. For this report, beta is based on returns over the past 36 months for both the fund and the index. Note that a fund’s beta should be reviewed in conjunction with its R-squared (see definition). The lower the R-squared, the less correlation there is between the fund and the index, and the less reliable beta is as an indicator of volatility.
Expense Ratio. The percentage of a fund’s average net assets used to pay its annual administrative and advisory expenses. These expenses directly reduce returns to investors.
Inception Date. The date on which the assets of a fund (or one of its share classes) are first invested in accordance with the fund’s investment objective. For funds with a subscription period, the inception date is the day after that period ends. Investment performance is measured from the inception date.
R-Squared. A measure of how much of a fund’s past returns can be explained by the returns from the market in general, as measured by a given index. If a fund’s total returns were precisely synchronized with an index’s returns, its R-squared would be 1.00. If the fund’s returns bore no relationship to the index’s returns, its R-squared would be 0. For this report, R-squared is based on returns over the past 36 months for both the fund and the index.
69
This page intentionally left blank.
This page intentionally left blank.
The People Who Govern Your Fund
The trustees of your mutual fund are there to see that the fund is operated and managed in your best interests since, as a shareholder, you are a part owner of the fund. Your fund’s trustees also serve on the board of directors of The Vanguard Group, Inc., which is owned by the Vanguard funds and provides services to them on an at-cost basis.
A majority of Vanguard’s board members are independent, meaning that they have no affiliation with Vanguard or the funds they oversee, apart from the sizable personal investments they have made as private individuals. The independent board members have distinguished backgrounds in business, academia, and public service. Each of the trustees and executive officers oversees 178 Vanguard funds.
The following table provides information for each trustee and executive officer of the fund. More information about the trustees is in the Statement of Additional Information, which can be obtained, without charge, by contacting Vanguard at 800-662-7447, or online at vanguard.com.
| |
| Interested Trustee1 | and President (2006–2008) of Rohm and Haas Co. |
| | (chemicals); Director of Tyco International, Ltd. |
| F. William McNabb III | (diversified manufacturing and services) and Hewlett- |
| Born 1957. Trustee Since July 2009. Chairman of the | Packard Co. (electronic computer manufacturing); |
| Board. Principal Occupation(s) During the Past Five | Senior Advisor at New Mountain Capital; Trustee |
| Years: Chairman of the Board of The Vanguard Group, | of The Conference Board; Member of the Board of |
| Inc., and of each of the investment companies served | Managers of Delphi Automotive LLP (automotive |
| by The Vanguard Group, since January 2010; Director | components). |
| of The Vanguard Group since 2008; Chief Executive | |
| Officer and President of The Vanguard Group and of | Amy Gutmann |
| each of the investment companies served by The | Born 1949. Trustee Since June 2006. Principal |
| Vanguard Group since 2008; Director of Vanguard | Occupation(s) During the Past Five Years: President |
| Marketing Corporation; Managing Director of The | of the University of Pennsylvania; Christopher H. |
| Vanguard Group (1995–2008). | Browne Distinguished Professor of Political Science |
| | in the School of Arts and Sciences with secondary |
| | appointments at the Annenberg School for Commu- |
| Independent Trustees | nication and the Graduate School of Education |
| | of the University of Pennsylvania; Director of |
| Emerson U. Fullwood | Carnegie Corporation of New York, Schuylkill River |
| Born 1948. Trustee Since January 2008. Principal | Development Corporation, and Greater Philadelphia |
| Occupation(s) During the Past Five Years: Executive | Chamber of Commerce; Trustee of the National |
| Chief Staff and Marketing Officer for North America | Constitution Center; Chair of the Presidential |
| and Corporate Vice President (retired 2008) of Xerox | Commission for the Study of Bioethical Issues. |
| Corporation (document management products and | |
| services); Executive in Residence and 2010 | JoAnn Heffernan Heisen |
| Distinguished Minett Professor at the Rochester | Born 1950. Trustee Since July 1998. Principal |
| Institute of Technology; Director of SPX Corporation | Occupation(s) During the Past Five Years: Corporate |
| (multi-industry manufacturing), the United Way of | Vice President and Chief Global Diversity Officer |
| Rochester, Amerigroup Corporation (managed health | (retired 2008) and Member of the Executive |
| care), the University of Rochester Medical Center, | Committee (1997–2008) of Johnson & Johnson |
| Monroe Community College Foundation, and North | (pharmaceuticals/consumer products); Director of |
| Carolina A&T University. | Skytop Lodge Corporation (hotels), the University |
| | Medical Center at Princeton, the Robert Wood |
| Rajiv L. Gupta | Johnson Foundation, and the Center for Work Life |
| Born 1945. Trustee Since December 2001.2 | Policy; Member of the Advisory Board of the |
| Principal Occupation(s) During the Past Five Years: | Maxwell School of Citizenship and Public Affairs |
| Chairman and Chief Executive Officer (retired 2009) | at Syracuse University. |
| | |
| F. Joseph Loughrey | Thomas J. Higgins | |
| Born 1949. Trustee Since October 2009. Principal | Born 1957. Chief Financial Officer Since September |
| Occupation(s) During the Past Five Years: President | 2008. Principal Occupation(s) During the Past Five |
| and Chief Operating Officer (retired 2009) and Vice | Years: Principal of The Vanguard Group, Inc.; Chief |
| Chairman of the Board (2008–2009) of Cummins Inc. | Financial Officer of each of the investment companies |
| (industrial machinery); Director of SKF AB (industrial | served by The Vanguard Group since 2008; Treasurer |
| machinery), Hillenbrand, Inc. (specialized consumer | of each of the investment companies served by The |
| services), the Lumina Foundation for Education, and | Vanguard Group (1998–2008). |
| Oxfam America; Chairman of the Advisory Council | | |
| for the College of Arts and Letters and Member | Kathryn J. Hyatt | |
| of the Advisory Board to the Kellogg Institute for | Born 1955. Treasurer Since November 2008. Principal |
| International Studies at the University of Notre Dame. | Occupation(s) During the Past Five Years: Principal |
| | of The Vanguard Group, Inc.; Treasurer of each of |
| André F. Perold | the investment companies served by The Vanguard |
| Born 1952. Trustee Since December 2004. Principal | Group since 2008; Assistant Treasurer of each of the |
| Occupation(s) During the Past Five Years: George | investment companies served by The Vanguard Group |
| Gund Professor of Finance and Banking at the Harvard | (1988–2008). | |
| Business School (retired July 2011); Chief Investment | | |
| Officer and co-Managing Partner of HighVista | Heidi Stam | |
| Strategies LLC (private investment firm); Director of | Born 1956. Secretary Since July 2005. Principal |
| Rand Merchant Bank; Overseer of the Museum of | Occupation(s) During the Past Five Years: Managing |
| Fine Arts Boston. | Director of The Vanguard Group, Inc., since 2006; |
| | General Counsel of The Vanguard Group since 2005; |
| Alfred M. Rankin, Jr. | Secretary of The Vanguard Group and of each of the |
| Born 1941. Trustee Since January 1993. Principal | investment companies served by The Vanguard Group |
| Occupation(s) During the Past Five Years: Chairman, | since 2005; Director and Senior Vice President of |
| President, and Chief Executive Officer of NACCO | Vanguard Marketing Corporation since 2005; |
| Industries, Inc. (forklift trucks/housewares/lignite); | Principal of The Vanguard Group (1997–2006). |
| Director of Goodrich Corporation (industrial products/ | | |
| aircraft systems and services) and the National | | |
| Association of Manufacturers; Chairman of the | Vanguard Senior Management Team |
| Federal Reserve Bank of Cleveland; Vice Chairman | | |
| of University Hospitals of Cleveland; President of | R. Gregory Barton | Chris D. McIsaac |
| the Board of The Cleveland Museum of Art. | Mortimer J. Buckley | Michael S. Miller |
| | Kathleen C. Gubanich | James M. Norris |
| Peter F. Volanakis | Paul A. Heller | Glenn W. Reed |
| Born 1955. Trustee Since July 2009. Principal | Martha G. King | George U. Sauter |
| Occupation(s) During the Past Five Years: President | | |
| and Chief Operating Officer (retired 2010) of Corning | | |
| Incorporated (communications equipment); Director of | Chairman Emeritus and Senior Advisor |
| Corning Incorporated (2000–2010) and Dow Corning | | |
| (2001–2010); Overseer of the Amos Tuck School of | John J. Brennan | |
| Business Administration at Dartmouth College. | Chairman, 1996–2009 | |
| | Chief Executive Officer and President, 1996–2008 |
| |
| Executive Officers | | |
| | Founder | |
| Glenn Booraem | | |
| Born 1967. Controller Since July 2010. Principal | John C. Bogle | |
| Occupation(s) During the Past Five Years: Principal | Chairman and Chief Executive Officer, 1974–1996 |
| of The Vanguard Group, Inc.; Controller of each of | | |
| the investment companies served by The Vanguard | | |
| Group since 2010; Assistant Controller of each of | | |
| the investment companies served by The Vanguard | | |
| Group (2001–2010). | | |
1 Mr. McNabb is considered an “interested person,” as defined in the Investment Company Act of 1940, because he is an officer of the Vanguard funds.
2 December 2002 for Vanguard Equity Income Fund, Vanguard Growth Equity Fund, the Vanguard Municipal Bond Funds, and the Vanguard State Tax-Exempt Funds.
|  |
| P.O. Box 2600 |
| Valley Forge, PA 19482-2600 |
Connect with Vanguard® > vanguard.com
| A registration statement relating to the Target |
| Fund Information > 800-662-7447 | Retirement 2060 Fund has been filed with the |
| Direct Investor Account Services > 800-662-2739 | Securities and Exchange Commission but has not |
| Institutional Investor Services > 800-523-1036 | yet become effective. These securities may not be |
| Text Telephone for People | sold nor may offers to buy be accepted prior to the |
| With Hearing Impairment > 800-749-7273 | time the registration statement becomes effective. |
| | This communication shall not constitute an offer to |
| This material may be used in conjunction | sell or the solicitation of an offer to buy, nor shall |
| with the offering of shares of any Vanguard | there be any sale of, these securities in any state |
| fund only if preceded or accompanied by | in which such offer, solicitation, or sale would be |
| the fund’s current prospectus. | unlawful prior to registration or qualification under |
| | the securities laws of any such state. |
| All comparative mutual fund data are from Lipper Inc. or | |
| Morningstar, Inc., unless otherwise noted. | Copies of the final prospectus can be obtained |
| | from Vanguard. Please note that a preliminary |
| You can obtain a free copy of Vanguard’s proxy voting | prospectus is subject to change. |
| guidelines by visiting vanguard.com/proxyreporting or by | |
| calling Vanguard at 800-662-2739. The guidelines are | |
| also available from the SEC’s website, sec.gov. In | |
| addition, you may obtain a free report on how your fund | |
| voted the proxies for securities it owned during the 12 | |
| months ended June 30. To get the report, visit either | |
| vanguard.com/proxyreporting or sec.gov. | |
| |
| You can review and copy information about your fund at | |
| the SEC’s Public Reference Room in Washington, D.C. To | |
| find out more about this public service, call the SEC at | |
| 202-551-8090. Information about your fund is also | |
| available on the SEC’s website, and you can receive | |
| copies of this information, for a fee, by sending a | |
| request in either of two ways: via e-mail addressed to | |
| publicinfo@sec.gov or via regular mail addressed to the | |
| Public Reference Section, Securities and Exchange | |
| Commission, Washington, DC 20549-1520. | |
| | © 2011 The Vanguard Group, Inc. |
| | All rights reserved. |
| | Vanguard Marketing Corporation, Distributor. |
| |
| | Q3080B 112011 |
Item 2: Code of Ethics. The Registrant has adopted a code of ethics that applies to the Registrant’s principal executive officer, principal financial officer, principal accounting officer or controller or persons performing similar functions. The Code of Ethics was amended during the reporting period covered by this report to make certain technical, non-material changes.
Item 3: Audit Committee Financial Expert. The following members of the Audit Committee have been determined by the Registrant’s Board of Trustees to be Audit Committee Financial Experts serving on its Audit Committee, and to be independent: Charles D. Ellis, Rajiv L. Gupta, JoAnn Heffernan Heisen, André F. Perold, and Alfred M. Rankin, Jr. Item 4: Principal Accountant Fees and Services.
(a) Audit Fees.
Audit Fees of the Registrant
Fiscal Year Ended September 30, 2011: $206,000
Fiscal Year Ended September 30, 2010: $182,000
Aggregate Audit Fees of Registered Investment Companies in the Vanguard Group.
Fiscal Year Ended September 30, 2011: $3,978,540
Fiscal Year Ended September 30, 2010: $3,607,060
(b) Audit-Related Fees.
Fiscal Year Ended September 30, 2011: $1,341,750
Fiscal Year Ended September 30, 2010: $791,350
Includes fees billed in connection with assurance and related services provided to the Registrant, The Vanguard Group, Inc., Vanguard Marketing Corporation, and other registered investment companies in the Vanguard Group.
(c) Tax Fees.
Fiscal Year Ended September 30, 2011: $373,830
Fiscal Year Ended September 30, 2010: $336,090
Includes fees billed in connection with tax compliance, planning and advice services provided to the Registrant, The Vanguard Group, Inc., Vanguard Marketing Corporation, and other registered investment companies in the Vanguard Group and related to income and excise taxes.
(d) All Other Fees.
Fiscal Year Ended September 30, 2011: $16,000
Fiscal Year Ended September 30, 2010: $16,000
Includes fees billed for services related to risk management and privacy matters. Services were provided to the Registrant, The Vanguard Group, Inc., Vanguard Marketing Corporation, and other registered investment companies in the Vanguard Group.
(e) (1) Pre-Approval Policies. The policy of the Registrant’s Audit Committee is to consider and, if appropriate, approve before the principal accountant is engaged for such services, all specific audit and non-audit services provided to: (1) the Registrant; (2) The Vanguard Group, Inc.; (3) other entities controlled by The Vanguard Group, Inc. that provide ongoing services to the Registrant; and (4) other registered investment companies in the Vanguard Group. In making a determination, the Audit Committee considers whether the services are consistent with maintaining the principal accountant’s independence.
In the event of a contingency situation in which the principal accountant is needed to provide services in between scheduled Audit Committee meetings, the Chairman of the Audit Committee would be called on to consider and, if appropriate, pre-approve audit or permitted non-audit services in an amount sufficient to complete services through the next Audit Committee meeting, and to determine if such services would be consistent with maintaining the accountant’s independence. At the next scheduled Audit Committee meeting, services and fees would be presented to the Audit Committee for formal consideration, and, if appropriate, approval by the entire Audit Committee. The Audit Committee would again consider whether such services and fees are consistent with maintaining the principal accountant’s independence.
The Registrant’s Audit Committee is informed at least annually of all audit and non-audit services provided by the principal accountant to the Vanguard complex, whether such services are provided to: (1) the Registrant; (2) The Vanguard Group, Inc.; (3) other entities controlled by The Vanguard Group, Inc. that provide ongoing services to the Registrant; or (4) other registered investment companies in the Vanguard Group.
(2) No percentage of the principal accountant’s fees or services were approved pursuant to the waiver provision of paragraph (c)(7)(i)(C) of Rule 2-01 of Regulation S-X.
(f) For the most recent fiscal year, over 50% of the hours worked under the principal accountant’s engagement were not performed by persons other than full-time, permanent employees of the principal accountant.
(g) Aggregate Non-Audit Fees.
Fiscal Year Ended September 30, 2011: $389,830
Fiscal Year Ended September 30, 2010: $352,090
Includes fees billed for non-audit services provided to the Registrant, The Vanguard Group, Inc., Vanguard Marketing Corporation, and other registered investment companies in the Vanguard Group.
(h) For the most recent fiscal year, the Audit Committee has determined that the provision of all non-audit services was consistent with maintaining the principal accountant’s independence.
Item 5: Audit Committee of Listed Registrants.
Not Applicable.
Item 6: Investments.
Not Applicable.
Item 7: Disclosure of Proxy Voting Policies and Procedures for Closed-End Management Investment Companies.
Not Applicable.
Item 8: Portfolio Managers of Closed-End Management Investment Companies.
Not Applicable.
Item 9: Purchase of Equity Securities by Closed-End Management Investment Company and Affiliated Purchasers.
Not Applicable.
Item 10: Submission of Matters to a Vote of Security Holders.
Not Applicable.
Item 11: Controls and Procedures.
(a) Disclosure Controls and Procedures. The Principal Executive and Financial Officers concluded that the Registrant's Disclosure Controls and Procedures are effective based on their evaluation of the Disclosure Controls and Procedures as of a date within 90 days of the filing date of this report.
(b) Internal Control Over Financial Reporting. There were no significant changes in Registrant’s Internal Control Over Financial Reporting or in other factors that could significantly affect this control subsequent to the date of the evaluation, including any corrective actions with regard to significant deficiencies and material weaknesses.
Item 12: Exhibits.
(a) Code of Ethics.
(b) Certifications.
Pursuant to the requirements of the Securities Exchange Act of 1934 and the Investment Company Act of 1940, the registrant has duly caused this report to be signed on its behalf by the undersigned, thereunto duly authorized.
| |
| | VANGUARD CHESTER FUNDS |
| |
| By: | /s/ F. WILLIAM MCNABB III* |
| | F. WILLIAM MCNABB III |
| | CHIEF EXECUTIVE OFFICER |
| |
| Date: November 18, 2011 |
Pursuant to the requirements of the Securities Exchange Act of 1934 and the Investment Company Act of 1940, this report has been signed below by the following persons on behalf of the registrant and in the capacities and on the dates indicated.
| |
| | VANGUARD CHESTER FUNDS |
| |
| By: | /s/ F. WILLIAM MCNABB III* |
| | F. WILLIAM MCNABB III |
| | CHIEF EXECUTIVE OFFICER |
| |
| Date: November 18, 2011 |
| |
| | VANGUARD CHESTER FUNDS |
| |
| By: | /s/ THOMAS J. HIGGINS* |
| | THOMAS J. HIGGINS |
| | CHIEF FINANCIAL OFFICER |
| |
| Date: November 18, 2011 |
* By: /s/ Heidi Stam
Heidi Stam, pursuant to a Power of Attorney filed on November 28, 2011, see file Number 33-23444, Incorporated by Reference.