UNITED STATES
SECURITIES AND EXCHANGE COMMISSION
Washington, D.C. 20549
FORM N-CSR
CERTIFIED SHAREHOLDER REPORT
OF
REGISTERED MANAGEMENT INVESTMENT COMPANIES
Investment Company Act file number: 811-4098
Name of Registrant: Vanguard Chester Funds
Address of Registrant:
P.O. Box 2600
Valley Forge, PA 19482
Name and address of agent for service:
Heidi Stam, Esquire
P.O. Box 876
Valley Forge, PA 19482
Registrant’s telephone number, including area code: (610) 669-1000
Date of fiscal year end: September 30
Date of reporting period: October 1, 2008 – September 30, 2009
Item 1: Reports to Shareholders
| Vanguard PRIMECAP Fund |
| Annual Report |
| September 30, 2009 |
 |
> Vanguard PRIMECAP Fund returned about –4% for the 2009 fiscal year. The fund, like its comparative standards, was unable to fully recover from first-half losses.
> Two long-standing, oversized sector investments produced divergent results: success in information technology but disappointment in health care.
> For the decade ended September 30, 2009, the fund’s average annual return of more than 4% outperformed the comparable return of both the S&P 500 Index and the average result for peer funds by about 4–5 percentage points.
| Contents | |
| Your Fund’s Total Returns | 1 |
| President’s Letter | 2 |
| Advisor’s Report | 8 |
| Results of Proxy Voting | 13 |
| Fund Profile | 15 |
| Performance Summary | 16 |
| Financial Statements | 18 |
| Your Fund’s After-Tax Returns | 30 |
| About Your Fund’s Expenses | 31 |
| Trustees Approve Advisory Agreement | 33 |
| Glossary | 34 |
The figures shown represent past performance, which is not a guarantee of future results. (Current performance may be lower or higher than the performance data cited. For performance data current to the most recent month-end, visit our website at www.vanguard.com/performance.)
Please note: The opinions expressed in this report are just that—informed opinions. They should not be considered promises or advice. Also, please keep in mind that the information and opinions cover the period through the date on the front of this report. Of course, the risks of investing in your fund are spelled out in the prospectus.
Cover photograph: Veronica Coia.
Your Fund’s Total Returns
| Fiscal Year Ended September 30, 2009 | ||
| Ticker | Total | |
| Symbol | Returns | |
| Vanguard PRIMECAP Fund | ||
| Investor Shares | VPMCX | –4.01% |
| Admiral™ Shares1 | VPMAX | –3.90 |
| S&P 500 Index | –6.91 | |
| Multi-Cap Growth Funds Average2 | ���3.19 |
| Your Fund’s Performance at a Glance | ||||
| September 30, 2008–September 30, 2009 | ||||
| Distributions Per Share | ||||
| Starting | Ending | Income | Capital | |
| Share Price | Share Price | Dividends | Gains | |
| Vanguard PRIMECAP Fund | ||||
| Investor Shares | $62.76 | $55.10 | $0.508 | $3.662 |
| Admiral Shares | 65.19 | 57.20 | 0.612 | 3.798 |
1 A lower-cost class of shares available to many longtime shareholders and to those with significant investments in the fund.
2 Derived from data provided by Lipper Inc.
1

President’s Letter
Dear Shareholder,
The 12 months ended September 30 spanned two strikingly different half-years. Stocks continued to fall steeply and broadly during the first half, then dramatically turned around in March as investors became more confident about credit markets and the economy. When the dust settled, Vanguard PRIMECAP Fund had returned –4.01% for Investor Shares (–3.90% for Admiral Shares) for the fiscal year, ahead of the result of the Standard & Poor’s 500 Index but a bit behind the average return of multi-capitalization growth funds.
Amid the market’s remarkable inconsistency, the strategy followed by PRIMECAP Management Company, the fund’s advisor, was remarkably consistent—staying the course and sparing investors the worst of the downturn, then participating in the recovery. Maintaining an outsized commitment to information technology and steering clear of most financials contributed significantly to the fund’s relative success.
If you hold shares in a taxable account, you may wish to review the table and discussion on after-tax returns for the fiscal year, based on the highest tax bracket, later in this report.
2
After a precipitous fall, stock markets rebound
In recent months, the financial markets have performed so strongly that it’s almost hard to remember that less than a year ago the global financial system stood on the brink of collapse. Since then, markets have pulled back from the abyss. Although unemployment remains near generational highs, and the prospects of a robust recovery seem dim, the global economy has begun to grind into gear.
Reminders of the markets’ dark days are nevertheless apparent in the index returns for both the past 12 months and the past three years. Over both periods, U.S. stocks recorded negative returns. Global stocks did better over the past 12 months, recouping their late-2008 losses thanks to general strength in developed economies and a powerful rally in emerging markets. Over the past three years, however, international stocks posted a modestly negative return.
The bond market’s turnabout has been equally dramatic
The stock market’s collapse and recovery echo even more dramatic developments in the bond market. At the end of 2008, as the credit markets nearly ceased to function, the difference between the yields of corporate bonds and Treasury bonds spiked to levels last seen during the Great Depression.
The Federal Reserve and its central bank counterparts around the world responded with aggressive monetary stimulus efforts,
| Market Barometer | |||
| Average Annual Total Returns | |||
| Periods Ended September 30, 2009 | |||
| One Year | Three Years | Five Years | |
| Stocks | |||
| Russell 1000 Index (Large-caps) | –6.14% | –5.10% | 1.49% |
| Russell 2000 Index (Small-caps) | –9.55 | –4.57 | 2.41 |
| Dow Jones U.S. Total Stock Market Index | –5.83 | –4.58 | 1.93 |
| MSCI All Country World Index ex USA (International) | 6.43 | –0.78 | 8.59 |
| Bonds | |||
| Barclays Capital U.S. Aggregate Bond Index (Broad taxable market) | 10.56% | 6.41% | 5.13% |
| Barclays Capital Municipal Bond Index | 14.85 | 5.13 | 4.78 |
| Citigroup 3-Month Treasury Bill Index | 0.39 | 2.63 | 2.96 |
| CPI | |||
| Consumer Price Index | –1.29% | 2.10% | 2.61% |
3
while global governments opened the fiscal taps. Investors first tiptoed, then stampeded, back into the market, boosting bond prices and bringing down yields. Over the past 12 months, taxable U.S. bonds returned more than 10%; municipal securities did even better, returning almost 15%, as measured by the Barclays Capital Municipal Bond Index.
The Fed’s rescue campaign has imposed a heavy price on short-term savings vehicles such as money market funds. In December 2008, the Fed reduced its target for the federal funds rate, a benchmark for the interest rates paid by money market instruments and other very short-term securities, to between 0% and 0.25%. The Fed has said it expects to maintain its target at this level “for an extended period.”
Stock selection bolstered returns in several sectors
PRIMECAP seeks to identify companies that appear out of favor and are expected to outperform the market over an investment horizon of about three to five years. Over the years, this strategy has produced a portfolio (concentrated in about 100 stocks) whose composition and performance differ—sometimes significantly—from those of its benchmark and peers.
| Expense Ratios1 | |||
| Your Fund Compared With Its Peer Group | |||
| Multi-Cap | |||
| Investor | Admiral | Growth Funds | |
| Shares | Shares | Average | |
| PRIMECAP Fund | 0.50% | 0.38% | 1.41% |
1 The fund expense ratios shown are from the prospectus dated January 28, 2009, and represent estimated costs for the current fiscal year based on the fund’s net assets as of the prospectus date. For the fiscal year ended September 30, 2009, the fund’s expense ratios were 0.49% for Investor Shares and 0.37% for Admiral Shares. The peer-group expense ratio is derived from data provided by Lipper Inc. and captures information through year-end 2008.
4
In recent years, the advisor has built up large stakes in information technology and health care, two research-and-development-intensive sectors that are expected to benefit from global growth in electronics and the aging baby boomers’ increasing demand for medical care and prescription medications. IT and health care stocks continued to represent more than half of the fund’s assets, on average, in the fiscal year (compared with less than one-third of the S&P 500 Index).
In the first half of the fiscal year, these two sectors were the fund’s best performers (which meant they declined the least). But their performances diverged in the second half. As a result, technology added about 5 percentage points to the fund’s 12-month return, but health care subtracted about 4 percentage points. Similarly, tech holdings boosted the fund’s performance relative to its benchmark, while health care detracted.
Tech stocks were a consistent strength for the fund—relatively resilient during the downturn, and robust during the rally. Among the standout contributors for the year were top-ten holding Google, Citrix Systems (a developer and marketer of computer applications delivery and sharing solutions), semiconductor-maker Texas Instruments, and EMC (a provider of technologies to manage and protect information).
In contrast, health care stocks came up short, partly reflecting uncertainty surrounding the ongoing debate over
| Total Returns | |
| Ten Years Ended September 30, 2009 | |
| Average | |
| Annual Return | |
| PRIMECAP Fund Investor Shares | 4.25% |
| S&P 500 Index | –0.15 |
| Multi-Cap Growth Funds Average1 | –1.11 |
The figures shown represent past performance, which is not a guarantee of future results. (Current performance may be lower or higher than the performance data cited. For performance data current to the most recent month-end, visit our website at www.vanguard.com/performance.) Note, too, that both investment returns and principal value can fluctuate widely, so an investor’s shares, when sold, could be worth more or less than their original cost.
1 Derived from data provided by Lipper Inc.
5
health care reform and the movement toward generic drugs. Biotechnology holdings Amgen (a top-ten position) and Biogen Idec eked out modest gains for the year. However, major pharmaceutical maker Eli Lilly (also a top-ten holding) and medical-device maker Medtronic sustained double-digit losses.
To accommodate above-benchmark holdings of IT and health care stocks, the advisor held relatively small positions in consumer staples, energy, and financial stocks—notably avoiding much of the financial sector’s distress over the past two years. And this letter would not be complete without mentioning Monsanto and Potash Corp. of Saskatchewan, standout performers for the fund in fiscal years 2007 and 2008. These agriculture-oriented firms struggled during the 2009 fiscal year as farmers reduced their crop planting and, consequently, their fertilizer use in the face of falling commodity prices.
For more on the advisor’s strategy and outlook, please see the Advisor’s Report following this letter.
Ten-year record topped benchmark and peers
PRIMECAP Fund marks its 25th anniversary in November. A significant achievement for any actively managed fund, this landmark is especially noteworthy, given some of the watershed events of the past quarter century: the stock market crash in October 1987, the ballooning and then bursting of the technology bubble in 2000, and the global financial meltdown that began in late 2007, to name a few.
Throughout the market’s many ups and downs, PRIMECAP Management Company has distinguished itself by not wavering from its disciplined, focused, and patient investment philosophy. The advisor’s low-turnover, research-intensive approach to identifying underappreciated growth companies has consistently generated impressive long-term results for shareholders.
For the most recent ten years ended September 30, 2009, PRIMECAP Fund’s Investor Shares posted an average annual return of 4.25%, about 4 to 5 percentage points above the result for its benchmark index and the average return of competing multi-cap growth funds.
A word on expenses
The fund’s expense ratios have risen over the past fiscal year. The explanation is twofold.
First, as the value of fund assets has declined, the fund’s fixed expenses have accounted for a modestly higher percentage of fund assets. Second, the Vanguard funds’ contracts with external advisors typically include breakpoint pricing. As assets rise above a breakpoint threshold, advisory fees are paid at a lower rate. When assets fall, as they have during fiscal 2009, a smaller portion of assets is subject to the lower rate, causing the overall rate to increase.
6
Over time, breakpoint pricing has helped shareholders benefit from the economies of scale produced by growth in the fund’s assets.
Old-fashioned precepts still work in today’s markets
Stocks have taken investors on a roller-coaster ride over the last two years. After soaring to record highs in October 2007, the U.S. stock market in 2008 suffered its worst calendar year since the 1930s, before turning around this past spring. Investors were given a strong dose of reality—not only by the volatile stock market but also by the demise of some major financial institutions and the persistence of the longest recession in seven decades.
Now that the markets and the economy have pulled back from the brink, it’s a good opportunity for you to reevaluate your long-term investment objectives, time frame, and risk tolerance, and to make sure your investment plan is still appropriate. Remember that patience is often rewarded: Many investors who did not panic and sell out as stocks sank have recovered a substantial share of their paper losses.
The old-fashioned principles of discipline, patience, and taking a long-term view have been key to the investment strategy of PRIMECAP Fund’s advisors—and to the fund’s quarter century of success. The fund’s low costs help shareholders keep more of the returns, a benefit that can compound over time and help make the fund a valuable core holding within a diversified portfolio.
Thank you for entrusting your assets to Vanguard.
Sincerely,

F. William McNabb III
President and Chief Executive Officer
October 12, 2009
7
Advisor’s Report
For the fiscal year ended September 30, Vanguard PRIMECAP Fund returned –4.01% for Investor Shares and –3.90% for Admiral Shares. The fund modestly lagged the –3.19% average return of multi-capitalization growth fund competitors but was ahead of the –6.91% return of the S&P 500 Index. Our outsized investment and favorable stock selection in information technology—the fund’s largest sector—boosted performance. However, the reverse was true in health care, the fund’s second-largest sector.
Investment environment
The turmoil in the financial markets that began in the summer of 2007 intensified last fall following the failure of Lehman Brothers and the government rescue of AIG. The capital markets were effectively frozen, with the exception of government-guaranteed programs, through the early months of 2009 because of concerns about the solvency of major financial institutions, widening credit spreads, and uncertainty about the valuation of financial assets. The resulting lack of availability of credit as well as general fears of a further collapse of the financial system contributed to a dramatic decline in economic activity.
In an effort to restore confidence and trust in the financial markets, the U.S. government initiated massive fiscal and monetary stimulus programs along with numerous facilities to guarantee investments in commercial paper, bank debt, and other securities. These actions began to take hold and investor sentiment began to improve in March. This turnaround was evident not only in the dramatic stock market rally that ensued—which was led by lower-quality, higher-risk stocks—but also in the return of investors’ appetite for risk in the bond markets. Credit spreads above the yields on U.S. Treasury bonds began falling to more normal levels, leading to strong performance for corporate bonds—especially high-yield bonds—at the expense of Treasuries.
Despite improvement in the short-term funding markets, access to credit has remained difficult for many consumers and businesses. Banks and other financial institutions continued to experience mounting credit losses from loans and securities that were originated during an extended period of underpriced risk and excessive leverage. For example, the Federal Deposit Insurance Corporation’s list of problem banks rose above 400 at the end of June, the highest number since 1994.
There are, however, encouraging signs that the economy is emerging from recession: Real gross domestic product (GDP) has been shrinking at a slower rate. (On October 29, the preliminary report for third-quarter GDP showed growth for the first time in more than a year.) Still, unemployment and home foreclosures have continued to rise, and consumer and business spending has remained weak.
8
From its peak in October 2007 through March 2009, the S&P 500 experienced the largest market decline since the Great Depression, a reflection of investors’ anxiety about the failing global economy. Since early March, however, the S&P 500 has rebounded sharply on signs that the financial markets are stabilizing and that the decline in economic activity has slowed. As a result of the market’s dramatic rally, we believe that equity investment opportunities are no longer as compelling as they were earlier this year, but we continue to find promising stocks into which we can deploy capital.
Management of the fund
We have not wavered in our investment objective or strategy throughout the large swings in the stock market over the past 18 months: We seek to find companies whose long-term fundamentals will, in our estimation, evolve significantly better than current valuation suggests. We rely on rigorous fundamental research and meet not only with company management but also with competitors, suppliers, and customers to help identify potential opportunities and to reassess our conviction in our holdings. And we invest with a long-term perspective, in the expectation that over a three- to five-year horizon, our selections will outperform the market.
In the past few years, we have established significant investments in technology and health care stocks. Together, these two sectors represented more than half of the fund’s average assets during the year, compared with less than one-third of the benchmark.
In technology, we are particularly enthusiastic about the growth opportunities represented by trends in mobile broadband communications. The global population of broadband users continues to grow; at the same time, the mix of users continues to shift to mobile devices from fixed-line equipment. Traffic growth is accelerated further by the increasing demand for data transmission in addition to voice. The world’s developing countries are expected to continue to adopt broadband and to become more reliant on mobile devices such as smart phones and netbook computers.
The fund has invested in several companies that should benefit from the anticipated growth in broadband usage as well as the growth in software applications, e-commerce, and other activities that should result from this broad shift in the behavior of consumers and businesses throughout the world. Ericsson, Motorola, and Texas Instruments are expected to benefit from the growth in mobile devices, networks, and communications infrastructure. Google and Amazon.com are well-positioned in Internet advertising and e-commerce, respectively, two areas that are expected to experience rapid growth with more mobile broadband subscribers and expanded usage of the Internet. Adobe Systems, Microsoft, EMC, and Oracle provide many of the software applications and data storage systems
9
needed to support the increased Internet activity enabled by mobile broadband. During the year, we took some profits and reduced our holdings in some of these companies, and we opportunistically increased our stake in some of the others—notably Ericsson.
For the year, the technology sector—which represented about 30% of fund assets, on average, during the fiscal year—was the leading contributor to the fund’s absolute and relative performance. Among our most successful holdings were Google (+24%), enterprise software provider Citrix Systems (+55%), Texas Instruments (+13%), and EMC (+42%).
In the health care sector, our investment thesis is based on global demographic trends and a belief in the power of science. The demand for health care will continue to grow given the growth in worldwide population, increasing life expectancy, and the rapid increase in income in developing countries such as China and India. At the same time, scientific developments such as the sequencing of the human genome earlier this decade are expected to lead to the development of new drugs, medical devices, and other treatments. We are particularly excited about the potential for more customized treatments for diseases and other ailments.
Consistent with these themes, four of the fund’s ten largest holdings at September 30, 2009, were pharmaceutical firms Eli Lilly, Amgen, and Novartis, and medical-device maker Medtronic. Among these four companies, only Amgen (+2%) posted a positive total return for the fiscal year. Amgen has been awaiting Food and Drug Administration (FDA) approval of a biologics license application for Denosumab, a new treatment for osteoporosis and certain forms of cancer. (On October 19, the FDA requested additional information from Amgen, postponing a final approval decision.) Unlike some other major drug makers, Amgen does not face the expiration of major patents and we believe the company has a solid pipeline of future drugs that may be brought to market.
Eli Lilly (–21%) does face patent expirations and has suffered setbacks with two drugs in late-stage clinical trials this year. In July, the FDA gave final approval to Eli Lilly’s blood thinner Prasugrel (which will be marketed in the United States as Effient), but the drug’s rollout has been slower than anticipated. We believe that these challenges are fully reflected in Eli Lilly’s stock price; the stock trades at less than eight times earnings. We remain optimistic about the company’s long-term prospects. For example, significant resources are being invested in research and development of protein inhibitors that may prove successful in treating Alzheimer’s disease.
The valuation of Medtronic (–25%) fell to its lowest level in about two decades—in part because of integration issues related to the company’s November 2007
10
acquisition of Kyphon, which specialized in spinal treatments. Spinal therapies are among the fastest-growing areas in orthopedics. We believe Medtronic is well positioned there, and in solutions for cardiac rhythm management, diabetes, and neurological diseases.
Overall, the health care sector weighed on the fund’s performance for the year, especially in the second half. Both Eli Lilly and Medtronic were among the notable detractors; however, we remain confident in their long-term prospects, and took advantage of the weakness in their stock prices to add to our holdings.
We had mixed results in two sectors that are more sensitive to economic cycles: success in consumer discretionary but disappointment in industrials. Some of the best contributors were The TJX Companies (+24%), owners of off-price retailers T.J. Maxx and Marshalls, DIRECTV (+5%), and Kohl’s (+24%). On the other side, airlines continued to struggle. Southwest Airlines (–34%) and, to a lesser extent, American Airlines’ parent AMR (–19%), detracted from our results. We added to our holdings of both companies based on the strength of their brands. We also bought more of C.H. Robinson Worldwide (a produce-sourcing and transport and logistics company), and significantly increased our holdings of Boeing, which continued to face delays with its new 787 “Dreamliner” aircraft.
In the materials sector, our holdings of Monsanto and Potash Corp. of Saskatchewan struggled, after major gains in fiscal years 2007 and 2008. Year-over-year, our stake in both companies increased modestly, although we selectively sold shares during the year. And we continue to underweight the financial sector overall as we remain concerned about the deleveraging process throughout the financial system, the ongoing credit issues faced by many financial institutions, and the prospect of tighter regulation and oversight.
Outlook
Looking beyond the collective sigh of relief that the economy and credit markets appear to have averted disaster, it is difficult to predict the future course of the economy and the markets. Although we do not know whether the economic recovery will be U-shaped, W-shaped, or otherwise, we expect the economy will begin to grow modestly in what is likely to be the most notably jobless recovery in generations. On balance, our outlook for the rest of 2009 and into 2010 remains uncertain but cautiously optimistic.
We see two potential areas of concern stemming from the fiscal and monetary policy actions undertaken to avert disaster: inflation risk and the unintended consequences of the increased government involvement in the private sector. While near-term inflation appears not to be a threat, the longer-term effects
11
of the massive economic stimulus could portend future price pressure and continued weakness in the U.S. dollar.
We are also concerned about the government’s significantly expanded role in owning and/or overseeing financial institutions and private industry (for example, the auto industry), and the potential impact of this involvement on entrepreneurship and productivity growth in the future. We believe that, over time, scarce economic resources such as capital and labor are better allocated by free markets than by regulations and other government involvement.
Although the outcome of the ongoing debate over health care reform remains unknown, the outline of a possible consensus has been emerging recently. It appears that final legislation will not be as sweeping as initially anticipated, and that price controls are unlikely—at least in the near future. Our biotech holdings are intrinsically less vulnerable to health care reform, and it is possible that pharmaceutical companies could benefit as several million uninsured Americans gain access to health insurance.
As has been the case for several years, we remain enthusiastic about our holdings and their potential to deliver superior performance going forward.
| Howard B. Schow | Theo A. Kolokotrones | |
| Portfolio Manager | Portfolio Manager | |
| Joel P. Fried | ||
| Portfolio Manager | ||
| Mitchell J. Milias | Alfred W. Mordecai | |
| Portfolio Manager | Portfolio Manager | |
| David H. Van Slooten | ||
| Portfolio Manager | ||
| PRIMECAP Management Company | October 30, 2009 | |
12
Results of Proxy Voting
At a special meeting of shareholders on July 2, 2009, fund shareholders approved the following two proposals:
Proposal 1—Elect trustees for each fund.*
The individuals listed in the table below were elected as trustees for each fund. All trustees with the exception of Messrs. McNabb and Volanakis (both of whom already served as directors of The Vanguard Group, Inc.) served as trustees to the funds prior to the shareholder meeting.
| Percentage | |||
| Trustee | For | Withheld | For |
| John J. Brennan | 2,630,147,450 | 97,260,963 | 96.2% |
| Charles D. Ellis | 2,625,722,607 | 101,685,806 | 96.0% |
| Emerson U. Fullwood | 2,628,496,004 | 98,912,409 | 96.1% |
| Rajiv L. Gupta | 2,626,864,431 | 100,543,982 | 96.0% |
| Amy Gutmann | 2,630,727,663 | 96,680,750 | 96.2% |
| JoAnn Heffernan Heisen | 2,628,219,495 | 99,188,918 | 96.1% |
| F. William McNabb III | 2,629,764,221 | 97,644,192 | 96.1% |
| André F. Perold | 2,627,865,185 | 99,543,228 | 96.1% |
| Alfred M. Rankin, Jr. | 2,628,819,510 | 98,588,903 | 96.1% |
| Peter F. Volanakis | 2,630,490,646 | 96,917,767 | 96.2% |
| * Results are for all funds within the same trust. |
Proposal 2—Update and standardize the funds’ fundamental policies regarding:
(a) Purchasing and selling real estate.
(b) Issuing senior securities.
(c) Borrowing money.
(d) Making loans.
(e) Purchasing and selling commodities.
(f) Concentrating investments in a particular industry or group of industries.
(g) Eliminating outdated fundamental investment policies not required by law.
The revised fundamental policies are clearly stated and simple, yet comprehensive, making oversight and compliance more efficient than under the former policies. The revised fundamental policies will allow the funds to respond more quickly to regulatory and market changes, while avoiding the costs and delays associated with successive shareholder meetings.
13
| Broker | Percentage | ||||
| PRIMECAP Fund | For | Abstain | Against | Non-Votes | For |
| 2a | 342,810,971 | 5,786,758 | 5,895,692 | 11,683,322 | 93.6% |
| 2b | 342,235,660 | 6,160,758 | 6,097,000 | 11,683,326 | 93.5% |
| 2c | 334,906,250 | 5,985,081 | 13,602,091 | 11,683,322 | 91.5% |
| 2d | 340,938,004 | 6,025,462 | 7,529,955 | 11,683,322 | 93.1% |
| 2e | 340,927,761 | 5,952,331 | 7,613,327 | 11,683,325 | 93.1% |
| 2f | 342,219,597 | 6,040,309 | 6,233,514 | 11,683,324 | 93.5% |
| 2g | 343,205,343 | 6,202,485 | 5,085,600 | 11,683,317 | 93.7% |
Fund shareholders did not approve this proposal:
Proposal 3—Institute procedures to prevent holding investments in companies that, in the judgment of the board, substantially contribute to genocide or crimes against humanity, the most egregious violations of human rights.
The trustees recommended a vote against the proposal because it called for procedures that duplicate existing practices and procedures of the Vanguard funds.
| Broker | Percentage | ||||
| For | Abstain | Against | Non-Votes | For | |
| PRIMECAP Fund | 30,533,132 | 23,399,609 | 300,555,183 | 11,688,820 | 8.3% |
14
PRIMECAP Fund
Fund Profile
As of September 30, 2009
| Portfolio Characteristics | ||
| Comparative | ||
| Fund | Index1 | |
| Number of Stocks | 113 | 500 |
| Median Market Cap | $27.8B | $41.5B |
| Price/Earnings Ratio | 30.8x | 23.5x |
| Price/Book Ratio | 2.7x | 2.2x |
| Yield2 | 2.0% | |
| Investor Shares | 0.8% | |
| Admiral Shares | 0.9% | |
| Return on Equity | 19.9% | 20.6% |
| Earnings Growth Rate | 11.5% | 9.8% |
| Foreign Holdings | 12.4% | 0.0% |
| Turnover Rate | 4% | — |
| Expense Ratio3 | — | |
| Investor Shares | 0.50% | |
| Admiral Shares | 0.38% | |
| Short-Term Reserves | 2.5% | — |
| Sector Diversification (% of equity exposure) | ||
| Comparative | ||
| Fund | Index1 | |
| Consumer Discretionary | 12.5% | 9.1% |
| Consumer Staples | 1.5 | 11.5 |
| Energy | 7.2 | 11.7 |
| Financials | 4.0 | 15.2 |
| Health Care | 23.6 | 13.1 |
| Industrials | 13.0 | 10.3 |
| Information Technology | 31.3 | 18.7 |
| Materials | 6.5 | 3.5 |
| Telecommunication Services | 0.2 | 3.2 |
| Utilities | 0.2 | 3.7 |
| Volatility Measures4 | |
| Fund Versus | |
| Comparative Index1 | |
| R-Squared | 0.94 |
| Beta | 0.95 |
| Ten Largest Holdings5 (% of total net assets) | ||
| Amgen Inc. | biotechnology | 4.1% |
| FedEx Corp. | air freight and | |
| logistics | 3.9 | |
| Novartis AG ADR | pharmaceuticals | 3.5 |
| Eli Lilly & Co. | pharmaceuticals | 3.4 |
| Google Inc. Class A | internet software | |
| and services | 3.3 | |
| Adobe Systems Inc. | application software | 3.1 |
| Oracle Corp. | systems software | 3.0 |
| Medtronic Inc. | health care | |
| equipment | 2.9 | |
| DIRECTV Group Inc. | cable and satellite | 2.8 |
| Microsoft Corp. | systems software | 2.7 |
| Top Ten | 32.7% | |
Investment Focus
1 S&P 500 Index.
2 30-day SEC yield for the fund; annualized dividend yield for the index. See the Glossary.
3 The expense ratios shown are from the prospectus dated January 28, 2009, and represent estimated costs for the current fiscal year based on the fund’s net assets as of the prospectus date. For the fiscal year ended September 30, 2009, the expense ratios were 0.49% for Investor Shares and 0.37% for Admiral Shares.
4 For an explanation of R-squared, beta, and other terms used here, see the Glossary.
5 The holdings listed exclude any temporary cash investments and equity index products.
15
PRIMECAP Fund
Performance Summary
All of the returns in this report represent past performance, which is not a guarantee of future results that may be achieved by the fund. (Current performance may be lower or higher than the performance data cited. For performance data current to the most recent month-end, visit our website at www.vanguard.com/performance.) Note, too, that both investment returns and principal value can fluctuate widely, so an investor’s shares, when sold, could be worth more or less than their original cost. The returns shown do not reflect taxes that a shareholder would pay on fund distributions or on the sale of fund shares.
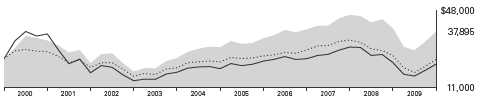
Cumulative Performance: September 30, 1999–September 30, 2009
Initial Investment of $25,000
| Average Annual Total Returns | Final Value | |||
| Periods Ended September 30, 2009 | of a $25,000 | |||
| One Year | Five Years | Ten Years | Investment | |
| PRIMECAP Fund Investor Shares1,2 | –4.01% | 4.51% | 4.25% | $37,895 |
| S&P 500 Index | –6.91 | 1.02 | –0.15 | 24,620 |
| Multi-Cap Growth Funds Average3 | –3.19 | 2.04 | –1.11 | 22,355 |
| Final Value | ||||
| Since | of a $100,000 | |||
| One Year | Five Years | Inception4 | Investment | |
| PRIMECAP Fund Admiral Shares1 | –3.90% | 4.65% | 5.45% | $151,974 |
| S&P 500 Index | –6.91 | 1.02 | 1.23 | 110,105 |
1 Total return figures do not reflect the 1% redemption fee assessed on redemptions of shares held less than one year, or the 1% fee assessed until March 23, 2005, on shares purchased on or after April 23, 2001, and held for less than five years.
2 Total returns do not include the account service fee that may be applicable to certain accounts with balances below $10,000. 3 Derived from data provided by Lipper Inc.
4 Performance for the fund’s Admiral Shares and its comparative standard is calculated since the Admiral Shares’ inception: November 12, 2001.
16
PRIMECAP Fund
Financial Statements
Statement of Net Assets
As of September 30, 2009
The fund reports a complete list of its holdings in regulatory filings four times in each fiscal year, at the quarter-ends. For the second and fourth fiscal quarters, the lists appear in the fund’s semiannual and annual reports to shareholders. For the first and third fiscal quarters, the fund files the lists with the Securities and Exchange Commission on Form N-Q. Shareholders can look up the fund’s Forms N-Q on the SEC’s website at www.sec.gov. Forms N-Q may also be reviewed and copied at the SEC’s Public Reference Room (see the back cover of this report for further information).
| Market | |||
| Value• | |||
| Shares | ($000) | ||
| Common Stocks (98.3%) | |||
| Consumer Discretionary (12.3%) | |||
| *,^ | DIRECTV Group Inc. | 27,122,807 | 748,047 |
| TJX Cos. Inc. | 11,913,500 | 442,586 | |
| 1 | Whirlpool Corp. | 5,985,000 | 418,711 |
| Sony Corp. ADR | 12,150,000 | 354,780 | |
| * | Kohl’s Corp. | 5,172,400 | 295,085 |
| * | Amazon.com Inc. | 2,550,000 | 238,068 |
| Target Corp. | 5,019,000 | 234,287 | |
| Walt Disney Co. | 5,500,000 | 151,030 | |
| * | Bed Bath & Beyond Inc. | 3,466,000 | 130,114 |
| Mattel Inc. | 5,000,000 | 92,300 | |
| Best Buy Co. Inc. | 1,575,000 | 59,094 | |
| Lowe’s Cos. Inc. | 2,450,000 | 51,303 | |
| Eastman Kodak Co. | 9,000,000 | 43,020 | |
| Carnival Corp. | 1,200,000 | 39,936 | |
| * | Viacom Inc. Class B | 500,000 | 14,020 |
| Abercrombie & Fitch Co. | 375,000 | 12,330 | |
| 3,324,711 | |||
| Consumer Staples (1.5%) | |||
| Costco Wholesale Corp. | 6,400,000 | 361,344 | |
| Procter & Gamble Co. | 510,000 | 29,539 | |
| Kellogg Co. | 98,000 | 4,825 | |
| 395,708 | |||
| Energy (7.1%) | |||
| Noble Energy Inc. | 6,300,000 | 415,548 | |
| EOG Resources Inc. | 3,816,000 | 318,674 | |
| Schlumberger Ltd. | 5,185,500 | 309,056 | |
| Peabody Energy Corp. | 5,837,100 | 217,257 | |
| Hess Corp. | 3,000,000 | 160,380 | |
| EnCana Corp. | 2,282,000 | 131,466 | |
| * | Plains Exploration & | ||
| Production Co. | 4,000,000 | 110,640 | |
| ConocoPhillips | 1,000,000 | 45,160 | |
| * | National Oilwell Varco Inc. | 1,037,000 | 44,726 |
| Petroleo Brasileiro SA | |||
| Series A ADR | 1,100,000 | 43,241 | |
| * | Southwestern Energy Co. | 800,000 | 34,144 |
| Petroleo Brasileiro SA ADR | 680,400 | 31,230 | |
| * | Transocean Ltd. | 250,000 | 21,382 |
| Market | |||
| Value• | |||
| Shares | ($000) | ||
| Murphy Oil Corp. | 350,000 | 20,150 | |
| Noble Corp. | 200,000 | 7,592 | |
| 1,910,646 | |||
| Financials (3.9%) | |||
| Marsh & McLennan | |||
| Cos. Inc. | 16,410,000 | 405,819 | |
| * | Berkshire Hathaway Inc. | ||
| Class B | 65,600 | 217,989 | |
| Discover Financial | |||
| Services | 10,140,800 | 164,585 | |
| Chubb Corp. | 2,500,000 | 126,025 | |
| Bank of New York | |||
| Mellon Corp. | 1,900,000 | 55,081 | |
| Aflac Inc. | 800,000 | 34,192 | |
| * | Progressive Corp. | 1,450,000 | 24,041 |
| Wells Fargo & Co. | 800,000 | 22,544 | |
| 1,050,276 | |||
| Health Care (23.2%) | |||
| * | Amgen Inc. | 18,445,000 | 1,110,942 |
| Novartis AG ADR | 18,939,765 | 954,185 | |
| Eli Lilly & Co. | 28,174,500 | 930,604 | |
| Medtronic Inc. | 21,646,652 | 796,597 | |
| * | Biogen Idec Inc. | 12,415,900 | 627,251 |
| Roche Holdings AG | 3,439,000 | 556,047 | |
| * | Boston Scientific Corp. | 41,577,610 | 440,307 |
| * | Genzyme Corp. | 4,400,000 | 249,612 |
| *,1 | Millipore Corp. | 2,820,000 | 198,331 |
| * | Life Technologies Corp. | 3,090,000 | 143,839 |
| GlaxoSmithKline PLC ADR | 3,460,000 | 136,705 | |
| Wyeth | 1,310,000 | 63,640 | |
| Johnson & Johnson | 1,000,000 | 60,890 | |
| Sanofi-Aventis SA ADR | 165,000 | 6,097 | |
| 6,275,047 | |||
| Industrials (12.8%) | |||
| FedEx Corp. | 13,871,170 | 1,043,389 | |
| CH Robinson | |||
| Worldwide Inc. | 8,102,000 | 467,891 | |
| Southwest Airlines Co. | 34,521,300 | 331,405 | |
| Honeywell International Inc. | 8,147,300 | 302,672 | |
| Caterpillar Inc. | 5,681,900 | 291,652 | |
18
| PRIMECAP Fund | |||
| Market | |||
| Value• | |||
| Shares | ($000) | ||
| United Parcel Service | |||
| Inc. Class B | 3,520,000 | 198,774 | |
| Boeing Co. | 3,005,000 | 162,721 | |
| Union Pacific Corp. | 2,525,900 | 147,386 | |
| * | AMR Corp. | 15,753,850 | 125,243 |
| Deere & Co. | 2,438,700 | 104,669 | |
| Canadian Pacific | |||
| Railway Ltd. | 1,641,800 | 76,754 | |
| *,1 | Alaska Air Group Inc. | 2,410,000 | 64,564 |
| Donaldson Co. Inc. | 1,600,000 | 55,408 | |
| Granite Construction Inc. | 1,500,000 | 46,410 | |
| Expeditors International | |||
| of Washington Inc. | 830,000 | 29,175 | |
| Pall Corp. | 185,000 | 5,972 | |
| Norfolk Southern Corp. | 53,100 | 2,289 | |
| 3,456,374 | |||
| Information Technology (30.8%) | |||
| * | Google Inc. Class A | 1,789,300 | 887,224 |
| * | Adobe Systems Inc. | 25,090,000 | 828,974 |
| Oracle Corp. | 39,100,600 | 814,857 | |
| Microsoft Corp. | 28,690,000 | 742,784 | |
| Texas Instruments Inc. | 31,035,000 | 735,219 | |
| *,1 | Intuit Inc. | 17,300,000 | 493,050 |
| QUALCOMM Inc. | 10,758,000 | 483,895 | |
| Hewlett-Packard Co. | 8,650,000 | 408,366 | |
| * | EMC Corp. | 22,229,200 | 378,786 |
| * | Citrix Systems Inc. | 7,655,000 | 300,306 |
| Intel Corp. | 14,900,000 | 291,593 | |
| Corning Inc. | 16,280,400 | 249,253 | |
| Telefonaktiebolaget LM | |||
| Ericsson ADR | 23,500,000 | 235,470 | |
| * | NVDIA Corp. | 15,200,000 | 228,456 |
| * | Symantec Corp. | 12,009,200 | 197,792 |
| * | Micron Technology Inc. | 20,000,000 | 164,000 |
| * | Accenture PLC Class A | 4,136,200 | 154,156 |
| Applied Materials Inc. | 8,894,600 | 119,188 | |
| Motorola Inc. | 12,870,000 | 110,553 | |
| ASML Holding NV | 3,623,111 | 107,135 | |
| KLA-Tencor Corp. | 2,818,000 | 101,053 | |
| 1 | Plantronics Inc. | 3,701,500 | 99,237 |
| * | eBay Inc. | 3,425,000 | 80,864 |
| * | Rambus Inc. | 2,500,000 | 43,500 |
| * | Cisco Systems Inc. | 1,612,000 | 37,946 |
| * | Dell Inc. | 1,380,000 | 21,059 |
| * | Entegris Inc. | 2,583,472 | 12,788 |
| * | Apple Inc. | 23,000 | 4,264 |
| 8,331,768 | |||
| Materials (6.4%) | |||
| Potash Corp. of | |||
| Saskatchewan Inc. | 6,300,000 | 569,142 | |
| Monsanto Co. | 6,551,460 | 507,083 | |
| Praxair Inc. | 3,670,867 | 299,873 | |
| Weyerhaeuser Co. | 2,225,000 | 81,546 | |
| Vulcan Materials Co. | 1,430,000 | 77,320 | |
| Alcoa Inc. | 4,854,7000 | 63,685 | |
| Market | ||
| Value• | ||
| Shares | ($000) | |
| Freeport-McMoRan | ||
| Copper & Gold Inc. | 600,000 | 41,166 |
| Dow Chemical Co. | 1,500,000 | 39,105 |
| * Domtar Corp. | 1,073,560 | 37,811 |
| 1,716,731 | ||
| Telecommunication Services (0.1%) | ||
| * Sprint Nextel Corp. | 10,520,000 | 41,554 |
| Utilities (0.2%) | ||
| * AES Corp. | 2,422,600 | 35,903 |
| FPL Group Inc. | 172,640 | 9,535 |
| 45,438 | ||
| Total Common Stocks | ||
| (Cost $21,192,656) | 26,548,253 | |
| Temporary Cash Investment (3.2%) | ||
| Money Market Fund (3.2%) | ||
| 2,3 Vanguard Market | ||
| Liquidity Fund, 0.267% | ||
| (Cost $878,073) | 878,073,417 | 878,073 |
| Total Investments (101.5%) | ||
| (Cost $22,070,729) | 27,426,326 | |
| Other Assets and Liabilities (–1.5%) | ||
| Other Assets | 73,497 | |
| Liabilities3 | (482,874) | |
| (409,377) | ||
| Net Assets (100%) | 27,016,949 | |
19
PRIMECAP Fund
| At September 30, 2009, net assets consisted of: | |
| Amount | |
| ($000) | |
| Paid-in Capital | 21,989,267 |
| Undistributed Net Investment Income | 128,854 |
| Accumulated Net Realized Losses | (456,747) |
| Unrealized Appreciation (Depreciation) | |
| Investment Securities | 5,355,597 |
| Foreign Currencies | (22) |
| Net Assets | 27,016,949 |
| Investor Shares—Net Assets | |
| Applicable to 322,953,563 outstanding | |
| $.001 par value shares of beneficial | |
| interest (unlimited authorization) | 17,795,346 |
| Net Asset Value Per Share— | |
| Investor Shares | $55.10 |
| Admiral Shares—Net Assets | |
| Applicable to 161,205,769 outstanding | |
| $.001 par value shares of beneficial | |
| interest (unlimited authorization) | 9,221,603 |
| Net Asset Value Per Share— | |
| Admiral Shares | $57.20 |
• See Note A in Notes to Financial Statements. * Non-income-producing security.
^ Part of security position is on loan to broker-dealers. The total value of securities on loan is $184,786,000.
1 Considered an affiliated company of the fund as the fund owns more than 5% of the outstanding voting securities of such company.
2 Affiliated money market fund available only to Vanguard funds and certain trusts and accounts managed by Vanguard. Rate shown is the 7-day yield.
3 Includes $194,300,000 of collateral received for securities on loan. ADR—American Depositary Receipt.
See accompanying Notes, which are an integral part of the Financial Statements.
20
| PRIMECAP Fund | |
| Statement of Operations | |
| Year Ended | |
| September 30, 2009 | |
| ($000) | |
| Investment Income | |
| Income | |
| Dividends1,2 | 338,190 |
| Interest2 | 4,756 |
| Security Lending | 2,668 |
| Total Income | 345,614 |
| Expenses | |
| Investment Advisory Fees—Note B | 50,681 |
| The Vanguard Group—Note C | |
| Management and Administrative—Investor Shares | 35,794 |
| Management and Administrative—Admiral Shares | 9,141 |
| Marketing and Distribution—Investor Shares | 3,995 |
| Marketing and Distribution—Admiral Shares | 1,915 |
| Custodian Fees | 341 |
| Auditing Fees | 22 |
| Shareholders’ Reports and Proxies—Investor Shares | 546 |
| Shareholders’ Reports and Proxies—Admiral Shares | 98 |
| Trustees’ Fees and Expenses | 44 |
| Total Expenses | 102,577 |
| Net Investment Income | 243,037 |
| Realized Net Gain (Loss) | |
| Investment Securities Sold2 | (440,555) |
| Foreign Currencies | 16 |
| Realized Net Gain (Loss) | (440,539) |
| Change in Unrealized Appreciation (Depreciation) | |
| Investment Securities | (1,100,291) |
| Foreign Currencies | 210 |
| Change in Unrealized Appreciation (Depreciation) | (1,100,081) |
| Net Increase (Decrease) in Net Assets Resulting from Operations | (1,297,583) |
1 Dividends are net of foreign withholding taxes of $8,933,000.
2 Dividend income, interest income, and realized net gain (loss) from affiliated companies of the fund were $10,845,000, $4,756,000, and $160,971,000, respectively.
See accompanying Notes, which are an integral part of the Financial Statements.
21
| PRIMECAP Fund | ||
| Statement of Changes in Net Assets | ||
| Year Ended September 30, | ||
| 2009 | 2008 | |
| ($000) | ($000) | |
| Increase (Decrease) in Net Assets | ||
| Operations | ||
| Net Investment Income | 243,037 | 260,376 |
| Realized Net Gain (Loss) | (440,539) | 2,165,641 |
| Change in Unrealized Appreciation (Depreciation) | (1,100,081) | (7,149,154) |
| Net Increase (Decrease) in Net Assets Resulting from Operations | (1,297,583) | (4,723,137) |
| Distributions | ||
| Net Investment Income | ||
| Investor Shares | (153,471) | (140,925) |
| Admiral Shares | (88,655) | (78,490) |
| Realized Capital Gain1 | ||
| Investor Shares | (1,106,324) | (1,250,270) |
| Admiral Shares | (550,187) | (586,796) |
| Total Distributions | (1,898,637) | (2,056,481) |
| Capital Share Transactions | ||
| Investor Shares | 709,425 | 374,088 |
| Admiral Shares | 619,198 | 1,290,705 |
| Net Increase (Decrease) from Capital Share Transactions | 1,328,623 | 1,664,793 |
| Total Increase (Decrease) | (1,867,597) | (5,114,825) |
| Net Assets | ||
| Beginning of Period | 28,884,546 | 33,999,371 |
| End of Period2 | 27,016,949 | 28,884,546 |
1 Includes fiscal 2009 and 2008 short-term gain distributions totaling $0 and $42,196,000, respectively. Short-term gain distributions are treated as ordinary income dividends for tax purposes.
2 Net Assets—End of Period includes undistributed net investment income of $128,854,000 and $127,927,000.
See accompanying Notes, which are an integral part of the Financial Statements.
22
| PRIMECAP Fund | |||||
| Financial Highlights | |||||
| Investor Shares | |||||
| For a Share Outstanding | Year Ended September 30, | ||||
| Throughout Each Period | 2009 | 2008 | 2007 | 2006 | 2005 |
| Net Asset Value, Beginning of Period | $62.76 | $77.82 | $70.30 | $64.79 | $57.18 |
| Investment Operations | |||||
| Net Investment Income | .500 | .552 | .460 | .437 | .511 |
| Net Realized and Unrealized Gain (Loss) | |||||
| on Investments | (3.990) | (10.913) | 11.500 | 7.367 | 7.544 |
| Total from Investment Operations | (3.490) | (10.361) | 11.960 | 7.804 | 8.055 |
| Distributions | |||||
| Dividends from Net Investment Income | (.508) | (.476) | (.440) | (.386) | (.445) |
| Distributions from Realized Capital Gains | (3.662) | (4.223) | (4.000) | (1.908) | — |
| Total Distributions | (4.170) | (4.699) | (4.440) | (2.294) | (.445) |
| Net Asset Value, End of Period | $55.10 | $62.76 | $77.82 | $70.30 | $64.79 |
| Total Return1 | –4.01% | –13.96% | 17.77% | 12.30% | 14.13% |
| Ratios/Supplemental Data | |||||
| Net Assets, End of Period (Millions) | $17,795 | $19,234 | $23,435 | $21,828 | $20,643 |
| Ratio of Total Expenses to | |||||
| Average Net Assets | 0.49% | 0.43% | 0.43% | 0.46% | 0.46% |
| Ratio of Net Investment Income to | |||||
| Average Net Assets | 1.02% | 0.76% | 0.62% | 0.64% | 0.85% |
| Portfolio Turnover Rate | 4% | 11% | 11% | 10% | 12% |
1 Total returns do not reflect the 1% fee assessed on redemptions after March 23, 2005, of shares held for less than one year, or the 1% fee assessed until March 23, 2005, on shares purchased on or after April 23, 2001, and held for less than five years. Total returns do not include the account service fee that may be applicable to certain accounts with balances below $10,000.
See accompanying Notes, which are an integral part of the Financial Statements.
23
| PRIMECAP Fund | |||||
| Financial Highlights | |||||
| Admiral Shares | |||||
| For a Share Outstanding | Year Ended September 30, | ||||
| Throughout Each Period | 2009 | 2008 | 2007 | 2006 | 2005 |
| Net Asset Value, Beginning of Period | $65.19 | $80.82 | $73.03 | $67.28 | $59.36 |
| Investment Operations | |||||
| Net Investment Income | .580 | .664 | .580 | .562 | .636 |
| Net Realized and Unrealized Gain (Loss) | |||||
| on Investments | (4.160) | (11.327) | 11.930 | 7.640 | 7.836 |
| Total from Investment Operations | (3.580) | (10.663) | 12.510 | 8.202 | 8.472 |
| Distributions | |||||
| Dividends from Net Investment Income | (.612) | (.586) | (.570) | (.472) | (.552) |
| Distributions from Realized Capital Gains | (3.798) | (4.381) | (4.150) | (1.980) | — |
| Total Distributions | (4.410) | (4.967) | (4.720) | (2.452) | (.552) |
| Net Asset Value, End of Period | $57.20 | $65.19 | $80.82 | $73.03 | $67.28 |
| Total Return1 | –3.90% | –13.85% | 17.91% | 12.45% | 14.33% |
| Ratios/Supplemental Data | |||||
| Net Assets, End of Period (Millions) | $9,222 | $9,651 | $10,565 | $8,542 | $6,930 |
| Ratio of Total Expenses to | |||||
| Average Net Assets | 0.37% | 0.31% | 0.31% | 0.31% | 0.31% |
| Ratio of Net Investment Income to | |||||
| Average Net Assets | 1.14% | 0.88% | 0.74% | 0.79% | 0.96% |
| Portfolio Turnover Rate | 4% | 11% | 11% | 10% | 12% |
1 Total returns do not reflect the 1% fee assessed on redemptions after March 23, 2005, of shares held for less than one year, or the 1% fee previously assessed on shares held for less than five years.
See accompanying Notes, which are an integral part of the Financial Statements.
24
PRIMECAP Fund
Notes to Financial Statements
Vanguard PRIMECAP Fund is registered under the Investment Company Act of 1940 as an open-end investment company, or mutual fund. The fund offers two classes of shares: Investor Shares and Admiral Shares. Investor Shares are available to any investor who meets the fund’s minimum purchase requirements. Admiral Shares are designed for investors who meet certain administrative, service, tenure, and account-size criteria.
A. The following significant accounting policies conform to generally accepted accounting principles for U.S. mutual funds. The fund consistently follows such policies in preparing its financial statements.
1. Security Valuation: Securities are valued as of the close of trading on the New York Stock Exchange (generally 4 p.m., Eastern time) on the valuation date. Equity securities are valued at the latest quoted sales prices or official closing prices taken from the primary market in which each security trades; such securities not traded on the valuation date are valued at the mean of the latest quoted bid and asked prices. Securities for which market quotations are not readily available, or whose values have been affected by events occurring before the fund’s pricing time but after the close of the securities’ primary markets, are valued at their fair values calculated according to procedures adopted by the board of trustees. These procedures include obtaining quotations from an independent pricing service, monitoring news to identify significant market- or security-specific events, and evaluating changes in the va lues of foreign market proxies (for example, ADRs, futures contracts, or exchange-traded funds), between the time the foreign markets close and the fund’s pricing time. When fair-value pricing is employed, the prices of securities used by a fund to calculate its net asset value may differ from quoted or published prices for the same securities. Investments in Vanguard Market Liquidity Fund are valued at that fund’s net asset value.
2. Foreign Currency: Securities and other assets and liabilities denominated in foreign currencies are translated into U.S. dollars using exchange rates obtained from an independent third party as of the fund’s pricing time on the valuation date. Realized gains (losses) and unrealized appreciation (depreciation) on investment securities include the effects of changes in exchange rates since the securities were purchased, combined with the effects of changes in security prices. Fluctuations in the value of other assets and liabilities resulting from changes in exchange rates are recorded as unrealized foreign currency gains (losses) until the assets or liabilities are settled in cash, at which time they are recorded as realized foreign currency gains (losses).
3. Federal Income Taxes: The fund intends to continue to qualify as a regulated investment company and distribute all of its taxable income. Management has analyzed the fund’s tax positions taken for all open federal income tax years (September 30, 2006–2009), and has concluded that no provision for federal income tax is required in the fund’s financial statements.
4. Distributions: Distributions to shareholders are recorded on the ex-dividend date.
5. Security Lending: The fund may lend its securities to qualified institutional borrowers to earn additional income. Security loans are required to be secured at all times by collateral at least equal to the market value of securities loaned. The fund invests cash collateral received in Vanguard Market Liquidity Fund, and records a liability for the return of the collateral, during the period the securities are on loan. Security lending income represents the income earned on investing cash collateral, less expenses associated with the loan.
25
PRIMECAP Fund
6. Other: Dividend income is recorded on the ex-dividend date. Interest income includes income distributions received from Vanguard Market Liquidity Fund and is accrued daily. Security transactions are accounted for on the date securities are bought or sold. Costs used to determine realized gains (losses) on the sale of investment securities are those of the specific securities sold. Fees assessed on redemptions of capital shares are credited to paid-in capital.
Each class of shares has equal rights as to assets and earnings, except that each class separately bears certain class-specific expenses related to maintenance of shareholder accounts (included in Management and Administrative expenses), shareholder reporting, and proxies. Marketing and distribution expenses are allocated to each class of shares based on a method approved by the board of trustees. Income, other non-class-specific expenses, and gains and losses on investments are allocated to each class of shares based on its relative net assets.
B. PRIMECAP Management Company provides investment advisory services to the fund for a fee calculated at an annual percentage rate of average net assets. For the year ended September 30, 2009, the investment advisory fee represented an effective annual rate of 0.22% of the fund’s average net assets.
C. The Vanguard Group furnishes at cost corporate management, administrative, marketing, and distribution services. The costs of such services are allocated to the fund under methods approved by the board of trustees. The fund has committed to provide up to 0.40% of its net assets in capital contributions to Vanguard. At September 30, 2009, the fund had contributed capital of $5,613,000 to Vanguard (included in Other Assets), representing 0.02% of the fund’s net assets and 2.24% of Vanguard’s capitalization. The fund’s trustees and officers are also directors and officers of Vanguard.
D. Various inputs may be used to determine the value of the fund’s investments. These inputs are summarized in three broad levels for financial statement purposes. The inputs or methodologies used to value securities are not necessarily an indication of the risk associated with investing in those securities.
Level 1—Quoted prices in active markets for identical securities.
Level 2—Other significant observable inputs (including quoted prices for similar securities, interest rates, prepayment speeds, credit risk, etc.).
Level 3—Significant unobservable inputs (including the fund’s own assumptions used to determine the fair value of investments).
The following table summarizes the fund’s investments as of September 30, 2009, based on the inputs used to value them:
| Level 1 | Level 2 | Level 3 | |
| Investments | ($000) | ($000) | ($000) |
| Common Stocks | 25,992,206 | 556,047 | — |
| Temporary Cash Investments | 878,073 | — | — |
| Total | 26,870,279 | 556,047 | — |
26
PRIMECAP Fund
E. Distributions are determined on a tax basis and may differ from net investment income and realized capital gains for financial reporting purposes. Differences may be permanent or temporary. Permanent differences are reclassified among capital accounts in the financial statements to reflect their tax character. Temporary differences arise when certain items of income, expense, gain, or loss are recognized in different periods for financial statement and tax purposes; these differences will reverse at some time in the future. Differences in classification may also result from the treatment of short-term gains as ordinary income for tax purposes.
During the year ended September 30, 2009, the fund realized net foreign currency gains of $16,000, which increased distributable net income for tax purposes; accordingly, such gains have been reclassified from accumulated net realized losses to undistributed net investment income.
For tax purposes, at September 30, 2009, the fund had $181,754,000 of ordinary income available for distribution. The fund realized losses of $456,486,000 during the period from November 1, 2008, through September 30, 2009, which are deferred and will be treated as realized for tax purposes in fiscal 2010.
At September 30, 2009, the cost of investment securities for tax purposes was $22,070,729,000. Net unrealized appreciation of investment securities for tax purposes was $5,355,597,000, consisting of unrealized gains of $8,289,813,000 on securities that had risen in value since their purchase and $2,934,216,000 in unrealized losses on securities that had fallen in value since their purchase.
F. During the year ended September 30, 2009, the fund purchased $1,234,590,000 of investment securities and sold $1,025,562,000 of investment securities, other than temporary cash investments.
| G. Capital share transactions for each class of shares were: | ||||
| Year Ended September 30, | ||||
| 2009 | 2008 | |||
| Amount | Shares | Amount | Shares | |
| ($000) | (000) | ($000) | (000) | |
| Investor Shares | ||||
| Issued | 1,793,876 | 38,280 | 2,077,166 | 29,316 |
| Issued in Lieu of Cash Distributions | 1,244,348 | 27,869 | 1,373,695 | 19,529 |
| Redeemed1 | (2,328,799) | (49,652) | (3,076,773) | (43,528) |
| Net Increase (Decrease)—Investor Shares | 709,425 | 16,497 | 374,088 | 5,317 |
| Admiral Shares | ||||
| Issued | 1,108,415 | 22,881 | 1,585,771 | 21,398 |
| Issued in Lieu of Cash Distributions | 594,116 | 12,829 | 623,446 | 8,542 |
| Redeemed1 | (1,083,333) | (22,558) | (918,512) | (12,597) |
| Net Increase (Decrease)—Admiral Shares | 619,198 | 13,152 | 1,290,705 | 17,343 |
1 Net of redemption fees for fiscal 2009 and 2008 of $2,430,000 and $1,871,000, respectively (fund totals).
27
PRIMECAP Fund
H. Certain of the fund’s investments are in companies that are considered to be affiliated companies of the fund because the fund owns more than 5% of the outstanding voting securities of the company. Transactions during the period in securities of these companies were as follows:
| Current Period Transactions | |||||
| Sept. 30, 2008 | Proceeds from | Sept. 30, 2009 | |||
| Market | Purchases | Securities | Dividend | Market | |
| Value | at Cost | Sold | Income | Value | |
| ($000) | ($000) | ($000) | ($000) | ($000) | |
| Alaska Air Group Inc. | 57,092 | 183 | 10,025 | — | 64,564 |
| AMR Corp. | 149,452 | 2,715 | — | — | NA1 |
| Applied Biosystems Inc. | 301,393 | — | 253,802 | — | — |
| Citrix Systems Inc. | 251,337 | — | 85,851 | — | NA1 |
| Intuit Inc. | 546,853 | — | — | — | 493,050 |
| Millipore Corp. | 194,016 | — | — | — | 198,331 |
| Plantronics Inc. | 105,878 | — | 16,450 | 740 | 99,237 |
| Whirlpool Corp. | 442,835 | 16,635 | — | 10,105 | 418,711 |
| 2,048,856 | 10,845 | 1,273,893 | |||
| 1 Not applicable—At September 30, 2009, the security was still held but the issuer was no longer an affiliated company of the fund. | |||||
I. In preparing the financial statements as of September 30, 2009, management considered the impact of subsequent events occurring through November 6, 2009, for potential recognition or disclosure in these financial statements.
28
Report of Independent Registered Public Accounting Firm
To the Trustees of Vanguard Chester Funds and the Shareholders of Vanguard PRIMECAP Fund:
In our opinion, the accompanying statement of net assets and the related statements of operations and of changes in net assets and the financial highlights present fairly, in all material respects, the financial position of the Vanguard PRIMECAP Fund (the “Fund”) at September 30, 2009, the results of its operations for the year then ended, the changes in its net assets for each of the two years in the period then ended and the financial highlights for each of the periods indicated, in conformity with accounting principles generally accepted in the United States of America. These financial statements and financial highlights (hereafter referred to as “financial statements”) are the responsibility of the Fund’s management; our responsibility is to express an opinion on these financial statements based on our audits. We conducted our audits of these financial statements in accordance with the standard s of the Public Company Accounting Oversight Board (United States). Those standards require that we plan and perform the audit to obtain reasonable assurance about whether the financial statements are free of material misstatement. An audit includes examining, on a test basis, evidence supporting the amounts and disclosures in the financial statements, assessing the accounting principles used and significant estimates made by management, and evaluating the overall financial statement presentation. We believe that our audits, which included confirmation of securities at September 30, 2009 by correspondence with the custodian and by agreement to the underlying ownership records of Vanguard Market Liquidity Fund, provide a reasonable basis for our opinion.
PricewaterhouseCoopers LLP
Philadelphia, Pennsylvania
November 6, 2009
| Special 2009 tax information (unaudited) for Vanguard PRIMECAP Fund |
This information for the fiscal year ended September 30, 2009, is included pursuant to provisions of the Internal Revenue Code.
The fund distributed $1,656,511,000 as capital gain dividends (from net long-term capital gains) to shareholders during the fiscal year.
The fund distributed $242,126,000 of qualified dividend income to shareholders during the fiscal year.
For corporate shareholders, 100% of investment income (dividend income plus short-term gains, if any) qualifies for the dividends-received deduction.
29
Your Fund’s After-Tax Returns
This table presents returns for your fund both before and after taxes. The after-tax returns are shown in two ways: (1) assuming that an investor owned the fund during the entire period and paid taxes on the fund’s distributions, and (2) assuming that an investor paid taxes on the fund’s distributions and sold all shares at the end of each period.
Calculations are based on the highest individual federal income tax and capital gains tax rates in effect at the times of the distributions and the hypothetical sales. State and local taxes were not considered. After-tax returns reflect any qualified dividend income, using actual prior-year figures and estimates for 2009. (In the example, returns after the sale of fund shares may be higher than those assuming no sale. This occurs when the sale would have produced a capital loss. The calculation assumes that the investor received a tax deduction for the loss.)
The table shows returns for Investor Shares only; returns for other share classes will differ. Please note that your actual after-tax returns will depend on your tax situation and may differ from those shown. Also note that if you own the fund in a tax-deferred account, such as an individual retirement account or a 401(k) plan, this information does not apply to you. Such accounts are not subject to current taxes.
Finally, keep in mind that a fund’s performance—whether before or after taxes—does not guarantee future results.
| Average Annual Total Returns: PRIMECAP Fund Investor Shares1 | |||
| Periods Ended September 30, 2009 | |||
| One | Five | Ten | |
| Year | Years | Years | |
| Returns Before Taxes | –4.01% | 4.51% | 4.25% |
| Returns After Taxes on Distributions | –5.24 | 3.73 | 3.45 |
| Returns After Taxes on Distributions and Sale of Fund Shares | –1.43 | 3.87 | 3.49 |
1 Total returns do not reflect the 1% fee assessed on redemptions of shares held for less than one year, or the 1% fee assessed until March 23, 2005, on shares purchased on or after April 23, 2001, and held for less than five years. Nor do they include the account service fee that may be applicable to certain accounts with balances below $10,000.
30
About Your Fund’s Expenses
As a shareholder of the fund, you incur ongoing costs, which include costs for portfolio management, administrative services, and shareholder reports (like this one), among others. Operating expenses, which are deducted from a fund’s gross income, directly reduce the investment return of the fund.
A fund’s expenses are expressed as a percentage of its average net assets. This figure is known as the expense ratio. The following examples are intended to help you understand the ongoing costs (in dollars) of investing in your fund and to compare these costs with those of other mutual funds. The examples are based on an investment of $1,000 made at the beginning of the period shown and held for the entire period.
The accompanying table illustrates your fund’s costs in two ways:
• Based on actual fund return. This section helps you to estimate the actual expenses that you paid over the period. The “Ending Account Value” shown is derived from the fund’s actual return, and the third column shows the dollar amount that would have been paid by an investor who started with $1,000 in the fund. You may use the information here, together with the amount you invested, to estimate the expenses that you paid over the period.
To do so, simply divide your account value by $1,000 (for example, an $8,600 account value divided by $1,000 = 8.6), then multiply the result by the number given for your fund under the heading “Expenses Paid During Period.”
• Based on hypothetical 5% yearly return. This section is intended to help you compare your fund’s costs with those of other mutual funds. It assumes that the fund had a yearly return of 5% before expenses, but that the expense ratio is unchanged. In this case—because the return used is not the fund’s actual return—the results do not apply to your investment. The example is useful in making comparisons because the Securities and Exchange Commission requires all mutual funds to calculate expenses based on a 5% return. You can assess your fund’s costs by comparing this hypothetical example with the hypothetical examples that appear in shareholder reports of other funds.
| Six Months Ended September 30, 2009 | |||
| Beginning | Ending | Expenses | |
| Account Value | Account Value | Paid During | |
| PRIMECAP Fund | 3/31/2009 | 9/30/2009 | Period1 |
| Based on Actual Fund Return | |||
| Investor Shares | $1,000.00 | 1,308.17 | $2.78 |
| Admiral Shares | 1,000.00 | 1,308.63 | 2.08 |
| Based on Hypothetical 5% Yearly Return | |||
| Investor Shares | $1,000.00 | $1,022.66 | $2.43 |
| Admiral Shares | 1,000.00 | 1,023.26 | 1.83 |
1 The calculations are based on expenses incurred in the most recent six-month period. The fund’s annualized six-month expense ratios for that period are 0.48% for Investor Shares and 0.36% for Admiral Shares. The dollar amounts shown as “Expenses Paid” are equal to the annualized expense ratio multiplied by the average account value over the period, multiplied by the number of days in the most recent six-month period, then divided by the number of days in the most recent 12-month period.
31
Note that the expenses shown in the table are meant to highlight and help you compare ongoing costs only and do not reflect transaction costs incurred by the fund for buying and selling securities. Further, the expenses do not include the 1% fee on redemptions of shares held for less than one year, nor do they include the account service fee described in the prospectus. If such fees were applied to your account, your costs would be higher. Your fund does not carry a “sales load.”
The calculations assume no shares were bought or sold during the period. Your actual costs may have been higher or lower, depending on the amount of your investment and the timing of any purchases or redemptions.
You can find more information about the fund’s expenses, including annual expense ratios, in the Financial Statements section of this report. For additional information on operating expenses and other shareholder costs, please refer to your fund’s current prospectus.
32
Trustees Approve Advisory Agreement
The board of trustees of Vanguard PRIMECAP Fund has renewed the fund’s investment advisory agreement with PRIMECAP Management Company. The board determined that the retention of the advisor was in the best interests of the fund and its shareholders.
The board based its decision upon an evaluation of the advisor’s investment staff, portfolio management process, and performance. The trustees considered the factors discussed below, among others. However, no single factor determined whether the board approved the agreement. Rather, it was the totality of the circumstances that drove the board’s decision.
Nature, extent, and quality of services
The board considered the quality of the fund’s investment management over both the short and long term, and took into account the organizational depth and stability of the advisor. The board noted that PRIMECAP Management, founded in 1983, is recognized for its long-term approach to growth equity investing. The firm has managed the fund since its inception in 1984. Six experienced portfolio managers are responsible for separate subportfolios, and each portfolio manager employs a fundamental, research-driven approach in seeking to identify companies with long-term growth potential that have been overlooked by the market and are trading at attractive valuation levels. The board concluded that the advisor’s experience, stability, depth, and performance, among other factors, warranted continuation of the advisory agreement.
Investment performance
The board considered the short- and long-term performance of the fund, including any periods of outperformance or underperformance of a relevant benchmark and peer group. The board concluded that the advisor has carried out the fund’s investment strategy in disciplined fashion, and that the results have been solid. Information about the fund’s most recent performance can be found in the Performance Summary section of this report.
Cost
The board concluded that the fund’s expense ratio was well below the average expense ratio charged by funds in its peer group and that the fund’s advisory fee rate was also well below its peer-group average. Information about the fund’s expense ratio appears in the About Your Fund’s Expenses section of this report as well as in the Financial Statements section, which also includes information about the fund’s advisory fee rate.
The board did not consider profitability of PRIMECAP Management in determining whether to approve the advisory fee, because PRIMECAP Management is independent of Vanguard and the advisory fee is the result of arm’s-length negotiations.
The benefit of economies of scale
The board concluded that the fund’s shareholders benefit from economies of scale because of breakpoints in the advisory fee schedule. The breakpoints reduce the effective rate of the fee as the fund’s assets increase.
The board will consider whether to renew the advisory agreement again after a one-year period.
33
Glossary
Beta. A measure of the magnitude of a fund’s past share-price fluctuations in relation to the ups and downs of a given market index. The index is assigned a beta of 1.00. Compared with a given index, a fund with a beta of 1.20 typically would have seen its share price rise or fall by 12% when the index rose or fell by 10%. For this report, beta is based on returns over the past 36 months for both the fund and the index. Note that a fund’s beta should be reviewed in conjunction with its R-squared (see definition). The lower the R-squared, the less correlation there is between the fund and the index, and the less reliable beta is as an indicator of volatility.
Earnings Growth Rate. The average annual rate of growth in earnings over the past five years for the stocks now in a fund.
Equity Exposure. A measure that reflects a fund’s investments in stocks and stock futures. Any holdings in short-term reserves are excluded.
Expense Ratio. The percentage of a fund’s average net assets used to pay its annual administrative and advisory expenses. These expenses directly reduce returns to investors.
Foreign Holdings. The percentage of a fund represented by stocks or depositary receipts of companies based outside the United States.
Inception Date. The date on which the assets of a fund (or one of its share classes) are first invested in accordance with the fund’s investment objective. For funds with a subscription period, the inception date is the day after that period ends. Investment performance is measured from the inception date.
Median Market Cap. An indicator of the size of companies in which a fund invests; the midpoint of market capitalization (market price x shares outstanding) of a fund’s stocks, weighted by the proportion of the fund’s assets invested in each stock. Stocks representing half of the fund’s assets have market capitalizations above the median, and the rest are below it.
Price/Book Ratio. The share price of a stock divided by its net worth, or book value, per share. For a fund, the weighted average price/book ratio of the stocks it holds.
Price/Earnings Ratio. The ratio of a stock’s current price to its per-share earnings over the past year. For a fund, the weighted average P/E of the stocks it holds. P/E is an indicator of market expectations about corporate prospects; the higher the P/E, the greater the expectations for a company’s future growth.
R-Squared. A measure of how much of a fund’s past returns can be explained by the returns from the market in general, as measured by a given index. If a fund’s total returns were precisely synchronized with an index’s returns, its R-squared would be 1.00. If the fund’s returns bore no relationship to the index’s returns, its R-squared would be 0. For this report, R-squared is based on returns over the past 36 months for both the fund and the index.
Return on Equity. The annual average rate of return generated by a company during the past five years for each dollar of shareholder’s equity (net income divided by shareholder’s equity). For a fund, the weighted average return on equity for the companies whose stocks it holds.
Short-Term Reserves. The percentage of a fund invested in highly liquid, short-term securities that can be readily converted to cash.
34
Turnover Rate. An indication of the fund’s trading activity. Funds with high turnover rates incur higher transaction costs and may be more likely to distribute capital gains (which may be taxable to investors). The turnover rate excludes in-kind transactions, which have minimal impact on costs.
Yield. A fund’s 30-day SEC yield is derived using a formula specified by the U.S. Securities and Exchange Commission. Under the formula, data related to the fund’s security holdings in the previous 30 days are used to calculate the fund’s hypothetical net income for that period, which is then annualized and divided by the fund’s estimated average net assets over the calculation period. For the purposes of this calculation, a security’s income is based on its current market yield to maturity (in the case of bonds) or its projected dividend yield (for stocks). Because the SEC yield represents hypothetical annualized income, it will differ—at times significantly—from the fund’s actual experience. As a result, the fund’s income distributions may be higher or lower than implied by the SEC yield.
35
The People Who Govern Your Fund
The trustees of your mutual fund are there to see that the fund is operated and managed in your best interests since, as a shareholder, you are a part owner of the fund. Your fund’s trustees also serve on the board of directors of The Vanguard Group, Inc., which is owned by the Vanguard funds and provides services to them on an at-cost basis.
A majority of Vanguard’s board members are independent, meaning that they have no affiliation with Vanguard or the funds they oversee, apart from the sizable personal investments they have made as private individuals. The independent board members have distinguished backgrounds in business, academia, and public service. Each of the trustees and executive officers oversees 156 Vanguard funds.
The following table provides information for each trustee and executive officer of the fund. More information about the trustees is in the Statement of Additional Information, which can be obtained, without charge, by contacting Vanguard at 800-662-7447, or online at www.vanguard.com.
| Interested Trustees | Emerson U. Fullwood |
| Born 1948. Trustee Since January 2008. Principal | |
| John J. Brennan1 | Occupation(s) During the Past Five Years: Executive |
| Born 1954. Trustee Since May 1987. Chairman of | Chief Staff and Marketing Officer for North America |
| the Board. Principal Occupation(s) During the Past | and Corporate Vice President (retired 2008) of Xerox |
| Five Years: Chairman of the Board and Director/Trustee | Corporation (photocopiers and printers); Director of |
| of The Vanguard Group, Inc., and of each of the | SPX Corporation (multi-industry manufacturing), the |
| investment companies served by The Vanguard Group; | United Way of Rochester, the Boy Scouts of America, |
| Chief Executive Officer (1996–2008) and President | Amerigroup Corporation (direct health and medical |
| (1989–2008) of The Vanguard Group and of each of the | insurance carriers), and Monroe Community College |
| investment companies served by The Vanguard Group; | Foundation. |
| Chairman of the Financial Accounting Foundation; | |
| Governor of the Financial Industry Regulatory Authority | Rajiv L. Gupta |
| (FINRA); Director of United Way of Southeastern | Born 1945. Trustee Since December 2001.2 Principal |
| Pennsylvania. | Occupation(s) During the Past Five Years: Chairman |
| and Chief Executive Officer (retired 2009) and President | |
| F. William McNabb III1 | (2006–2008) of Rohm and Haas Co. (chemicals); Board |
| Born 1957. Trustee Since July 2009. Principal | Member of American Chemistry Council; Director of |
| Occupation(s) During the Past Five Years: Director of | Tyco International, Ltd. (diversified manufacturing and |
| The Vanguard Group, Inc., since 2008; Chief Executive | services) and Hewlett-Packard Co. (electronic computer |
| Officer and President of The Vanguard Group and of | manufacturing); Trustee of The Conference Board. |
| each of the investment companies served by The | |
| Vanguard Group since 2008; Director of Vanguard | Amy Gutmann |
| Marketing Corporation; Managing Director of The | Born 1949. Trustee Since June 2006. Principal |
| Vanguard Group (1995–2008). | Occupation(s) During the Past Five Years: President of |
| the University of Pennsylvania; Christopher H. Browne | |
| Distinguished Professor of Political Science in the School | |
| Independent Trustees | of Arts and Sciences with secondary appointments |
| at the Annenberg School for Communication and the | |
| Charles D. Ellis | Graduate School of Education of the University of |
| Born 1937. Trustee Since January 2001. Principal | Pennsylvania; Director of Carnegie Corporation of |
| Occupation(s) During the Past Five Years: Applecore | New York, Schuylkill River Development Corporation, |
| Partners (pro bono ventures in education); Senior | and Greater Philadelphia Chamber of Commerce; |
| Advisor to Greenwich Associates (international business | Trustee of the National Constitution Center. |
| strategy consulting); Successor Trustee of Yale University; | |
| Overseer of the Stern School of Business at New York | |
| University; Trustee of the Whitehead Institute for | |
| Biomedical Research. |
| JoAnn Heffernan Heisen | Executive Officers | |
| Born 1950. Trustee Since July 1998. Principal | ||
| Occupation(s) During the Past Five Years: Corporate | Thomas J. Higgins1 | |
| Vice President and Chief Global Diversity Officer since | Born 1957. Chief Financial Officer Since September | |
| 2006 (retired 2008) and Member of the Executive | 2008. Principal Occupation(s) During the Past Five | |
| Committee (retired 2008) of Johnson & Johnson | Years: Principal of The Vanguard Group, Inc.; Chief | |
| (pharmaceuticals/consumer products); Vice President | Financial Officer of each of the investment companies | |
| and Chief Information Officer of Johnson & Johnson | served by The Vanguard Group since 2008; Treasurer | |
| (1997–2005); Director of the University Medical Center | of each of the investment companies served by The | |
| at Princeton and Women’s Research and Education | Vanguard Group (1998–2008). | |
| Institute. | ||
| Kathryn J. Hyatt1 | ||
| André F. Perold | Born 1955. Treasurer Since November 2008. Principal | |
| Born 1952. Trustee Since December 2004. Principal | Occupation(s) During the Past Five Years: Principal of | |
| Occupation(s) During the Past Five Years: George Gund | The Vanguard Group, Inc.; Treasurer of each of the | |
| Professor of Finance and Banking, Harvard Business | investment companies served by The Vanguard | |
| School; Chairman of UNX, Inc. (equities trading firm); | Group since 2008; Assistant Treasurer of each of the | |
| Chair of the Investment Committee of HighVista | investment companies served by The Vanguard Group | |
| Strategies LLC (private investment firm). | (1988–2008). | |
| Alfred M. Rankin, Jr. | Heidi Stam1 | |
| Born 1941. Trustee Since January 1993. Principal | Born 1956. Secretary Since July 2005. Principal | |
| Occupation(s) During the Past Five Years: Chairman, | Occupation(s) During the Past Five Years: Managing | |
| President, and Chief Executive Officer of NACCO | Director of The Vanguard Group, Inc., since 2006; | |
| Industries, Inc. (forklift trucks/housewares/lignite); | General Counsel of The Vanguard Group since 2005; | |
| Director of Goodrich Corporation (industrial products/ | Secretary of The Vanguard Group and of each of the | |
| aircraft systems and services); Deputy Chairman of | investment companies served by The Vanguard Group | |
| the Federal Reserve Bank of Cleveland. | since 2005; Director and Senior Vice President of | |
| Vanguard Marketing Corporation since 2005; Principal | ||
| Peter F. Volanakis | of The Vanguard Group (1997–2006). | |
| Born 1955. Trustee Since July 2009. Principal | ||
| Occupation(s) During the Past Five Years: President | ||
| since 2007 and Chief Operating Officer since 2005 | Vanguard Senior Management Team | |
| of Corning Incorporated (communications equipment); | ||
| President of Corning Technologies (2001–2005); Director | R. Gregory Barton | Michael S. Miller |
| of Corning Incorporated and Dow Corning; Trustee of | Mortimer J. Buckley | James M. Norris |
| the Corning Incorporated Foundation and the Corning | Kathleen C. Gubanich | Glenn W. Reed |
| Museum of Glass; Overseer of the Amos Tuck School | Paul A. Heller | George U. Sauter |
| of Business Administration at Dartmouth College. | ||
| Founder | ||
| John C. Bogle | ||
| Chairman and Chief Executive Officer, 1974–1996 | ||
1 These individuals are “interested persons” as defined in the Investment Company Act of 1940.
2 December 2002 for Vanguard Equity Income Fund, Vanguard Growth Equity Fund, the Vanguard Municipal Bond Funds, and the Vanguard
State Tax-Exempt Funds.
 | ||
| P.O. Box 2600 | ||
| Valley Forge, PA 19482-2600 | ||
| Connect with Vanguard® > www.vanguard.com | ||
| Fund Information > 800-662-7447 | All comparative mutual fund data are from Lipper Inc. |
| or Morningstar, Inc., unless otherwise noted. | |
| Direct Investor Account Services > 800-662-2739 | |
| Institutional Investor Services > 800-523-1036 | You can obtain a free copy of Vanguard’s proxy voting |
| guidelines by visiting our website, www.vanguard.com, | |
| Text Telephone for People | and searching for “proxy voting guidelines,” or by |
| With Hearing Impairment > 800-952-3335 | calling Vanguard at 800-662-2739. The guidelines are |
| also available from the SEC’s website, www.sec.gov. | |
| In addition, you may obtain a free report on how your | |
| fund voted the proxies for securities it owned during | |
| This material may be used in conjunction | the 12 months ended June 30. To get the report, visit |
| with the offering of shares of any Vanguard | either www.vanguard.com or www.sec.gov. |
| fund only if preceded or accompanied by | |
| the fund’s current prospectus. | You can review and copy information about your fund |
| at the SEC’s Public Reference Room in Washington, D.C. | |
| To find out more about this public service, call the SEC | |
| at 202-551-8090. Information about your fund is also | |
| available on the SEC’s website, and you can receive | |
| copies of this information, for a fee, by sending a | |
| request in either of two ways: via e-mail addressed to | |
| publicinfo@sec.gov or via regular mail addressed to the | |
| Public Reference Section, Securities and Exchange | |
| Commission, Washington, DC 20549-0102. | |
| © 2009 The Vanguard Group, Inc. | |
| All rights reserved. | |
| Vanguard Marketing Corporation, Distributor. | |
| Q590 112009 | |
 |
| Vanguard Target Retirement Funds |
| Annual Report |
| September 30, 2009 |
 |
| Vanguard Target Retirement Income Fund |
| Vanguard Target Retirement 2005 Fund |
| Vanguard Target Retirement 2010 Fund |
| Vanguard Target Retirement 2015 Fund |
| Vanguard Target Retirement 2020 Fund |
| Vanguard Target Retirement 2025 Fund |
> Despite its strong rally through the spring and summer, the broad U.S. stock market returned about –6% for the fiscal year ended September 30, 2009.
> The broad U.S. bond market returned about 11% for the fiscal year. As the economy improved and credit markets stabilized, investors shifted from U.S. Treasury securities to corporate bonds.
> For the 12 months, returns for the six Target Retirement Funds in this report ranged from 5.84% for the Income Fund to 0.10% for the 2025 fund, which has the highest allocation to equities.
| Contents | |
| Your Fund’s Total Returns | 1 |
| President’s Letter | 2 |
| Results of Proxy Voting | 9 |
| Target Retirement Income Fund | 11 |
| Target Retirement 2005 Fund | 21 |
| Target Retirement 2010 Fund | 30 |
| Target Retirement 2015 Fund | 39 |
| Target Retirement 2020 Fund | 49 |
| Target Retirement 2025 Fund | 59 |
| Your Fund’s After-Tax Returns | 71 |
| About Your Fund’s Expenses | 73 |
| Glossary | 75 |
Please note: The opinions expressed in this report are just that—informed opinions. They should not be considered promises or advice. Also, please keep in mind that the information and opinions cover the period through the date on the front of this report. Of course, the risks of investing in your fund are spelled out in the prospectus.
Cover photograph: Veronica Coia.
| Your Fund’s Total Returns | ||
| Fiscal Year Ended September 30, 2009 | ||
| Ticker | Total | |
| Symbol | Returns | |
| Vanguard Target Retirement Income Fund | VTINX | 5.84% |
| Target Income Composite Index1 | 5.57 | |
| Target Income Composite Average2 | 5.09 | |
| Vanguard Target Retirement 2005 Fund | VTOVX | 4.33% |
| Target 2005 Composite Index1 | 4.35 | |
| Target 2005 Composite Average2 | 4.00 | |
| Vanguard Target Retirement 2010 Fund | VTENX | 3.47% |
| Target 2010 Composite Index1 | 3.28 | |
| Target 2010 Composite Average2 | 3.06 | |
| Vanguard Target Retirement 2015 Fund | VTXVX | 2.66% |
| Target 2015 Composite Index1 | 2.32 | |
| Target 2015 Composite Average2 | 2.28 | |
| Vanguard Target Retirement 2020 Fund | VTWNX | 1.44% |
| Target 2020 Composite Index1 | 1.17 | |
| Target 2020 Composite Average2 | 1.27 | |
| Vanguard Target Retirement 2025 Fund | VTTVX | 0.10% |
| Target 2025 Composite Index1 | –0.04 | |
| Target 2025 Composite Average2 | 0.19 | |
Investments in Target Retirement Funds are subject to the risks of their underlying funds. The year in the fund name refers to the approximate year (the target date) when an investor in the fund would retire and leave the work force. The fund will gradually shift its emphasis from more aggressive investments to more conservative ones based on its target date. An investment in the Target Retirement Fund is not guaranteed at any time, including on or after the target date.
1 Returns for the composite indexes are derived by applying the funds’ target allocations to the results of the following benchmarks: for U.S. stocks, the Morgan Stanley Capital International (MSCI) US Broad Market Index; for international stocks, the MSCI Europe, Australasia, Far East Index and the MSCI Emerging Markets Index; for bonds, Barclays Capital U.S. Aggregate Bond Index and the Barclays Capital U.S. Treasury Inflation Notes Index; and for short-term reserves, the Citigroup 3-Month Treasury Bill Index.
2 Each composite average weights the average returns of the appropriate mutual fund peer groups in proportion with the targeted weighting of the specific Target Retirement Fund. All together, the composites use returns for the fixed income funds average, the Treasury inflation-protected securities funds average, the money market funds average, the general equity funds average, the international funds average, and the emerging markets funds average. These returns are derived from data provided by Lipper Inc.
1

President’s Letter
Dear Shareholder,
For the fiscal year ended September 30, 2009, a robust second-half rally in the stock market could not offset deep losses incurred earlier in the period. The Target Retirement Funds with larger weightings in fixed income securities benefited from the strong performance of U.S. bonds.
Returns for the six Target Retirement Funds featured in this report ranged from 5.84% for the Target Retirement Income Fund, which has the highest allocation to bonds, to 0.10% for the Target Retirement 2025 Fund, which includes heavier exposure to U.S. and international equities.
After a precipitous fall, stock markets rebound
In recent months, the financial markets have performed so strongly that it’s almost hard to remember that less than a year ago the global financial system stood on the brink of collapse. Since then, markets have pulled back from the abyss. Although unemployment remains near generational highs, and the prospects of a robust recovery seem dim, the global economy has begun to grind into gear.
Reminders of the markets’ dark days are nevertheless apparent in the index returns for both the past 12 months and the past three years. Over both periods, U.S. stocks recorded negative returns. Global stocks did better over the past 12 months, recouping their late-2008 losses thanks to general strength in developed markets and a powerful rally in emerging markets. Over the past three years, however, international stocks posted a modestly negative return.
2
The bond market’s turnabout has been equally dramatic
The stock market’s collapse and recovery echo even more dramatic developments in the bond market. At the end of 2008, as the credit markets nearly ceased to function, the difference between the yields of corporate bonds and Treasury bonds spiked to levels last seen during the Great Depression.
The Federal Reserve and its central bank counterparts around the world responded with aggressive monetary stimulus efforts, while global governments opened the fiscal taps. Investors first tiptoed, then stampeded, back into the market, boosting bond prices and bringing down yields.
Over the past 12 months, taxable U.S. bonds returned more than 10%; municipal securities did even better, returning almost 15%, as measured by the Barclays Capital Municipal Bond Index.
The Fed’s rescue campaign has imposed a heavy price on short-term savings vehicles such as money market funds. In December 2008, the Fed reduced its target for the federal funds rate, a benchmark for the interest rates paid by money market instruments and other very short-term securities, to between 0% and 0.25%. The Fed has said it expects to maintain its target at this level “for an extended period.”
| Market Barometer | |||
| Average Annual Total Returns | |||
| Periods Ended September 30, 2009 | |||
| One Year | Three Years | Five Years | |
| Stocks | |||
| Russell 1000 Index (Large-caps) | –6.14% | –5.10% | 1.49% |
| Russell 2000 Index (Small-caps) | –9.55 | –4.57 | 2.41 |
| Dow Jones U.S. Total Stock Market Index | –5.83 | –4.58 | 1.93 |
| MSCI All Country World Index ex USA (International) | 6.43 | –0.78 | 8.59 |
| Bonds | |||
| Barclays Capital U.S. Aggregate Bond Index | |||
| (Broad taxable market) | 10.56% | 6.41% | 5.13% |
| Barclays Capital Municipal Bond Index | 14.85 | 5.13 | 4.78 |
| Citigroup 3-Month Treasury Bill Index | 0.39 | 2.63 | 2.96 |
| CPI | |||
| Consumer Price Index | –1.29% | 2.10% | 2.61% |
3
Bond performance paced return of funds
The asset allocations of the Vanguard Target Retirement Funds are consistent with well-established principles of retirement planning. Funds with more distant time horizons include heavy allocations to stocks, which are expected to produce higher longer-term growth than bonds, albeit with significant risks of short-term loss. Funds with nearer retirement dates include heavier allocations to fixed income securities; as the prospect of spending from a portfolio comes closer, the importance of moderating the ups and downs in the portfolio’s value increases.
In addition to conventional bond funds, the Target Retirement Income Fund and the Target Retirement 2005 Fund––the funds
intended for investors in or closest to retirement––hold part of their assets in Vanguard Inflation-Protected Securities Fund and Vanguard Prime Money Market Fund. The Inflation Protected Securities Fund also aims to shield investors against the long-term effects of inflation by investing in bonds with inflation protection, while the money market fund provides stability.
During the past 12 months, the Target Retirement Income Fund, which was established for investors in or near retirement, posted the best return, a reflection of the bond market’s strength. With about 65% of its assets in bonds and about 5% in money markets as of September 30, the Target Retirement Income Fund is the most conservative of the six funds in this report.
| Asset Allocations on September 30, 2009 | |||
| Short-Term | |||
| Stocks1 | Bonds | Investments | |
| Income2 | 30% | 65% | 5% |
| 2005 | 38 | 59 | 3 |
| 2010 | 51 | 49 | 0 |
| 2015 | 61 | 39 | 0 |
| 2020 | 68 | 32 | 0 |
| 2025 | 76 | 24 | 0 |
1 As of September 30, 2009, international stock weightings for the Income, 2005, 2010, 2015, 2020, and 2025 Funds were 6%, 8%, 10%, 12%, 14%, and 15% of assets, respectively.
2 Allocations do not change.
4
Conversely, the Target Retirement 2025 Fund has the most distant retirement date of the six funds in this report. As the fund group’s design would suggest, 2025 Fund has the highest allocation to stocks. Given the outcome of the financial markets for the fiscal year, it’s no surprise that its return was the lowest of the group. As of September 30, the 2025 Fund held about 61% of its assets in U.S. stocks, 15% in international stocks, and 24% in bonds.
Among the underlying Vanguard funds represented in the Target Retirement Fund series, the best performers for the
fiscal year were the Vanguard Emerging Markets Index Fund (about +17%) and the Vanguard Total Bond Market II Index Fund, which launched in January and is essentially identical to its portfolio predecessor, Vanguard Total Bond Market Index Fund (about +10%). However, because the Emerging Markets Index Fund accounted for less than 4% of the 2025 Fund’s holdings as of September 30, and was represented even less in the other five funds in this report, its impact on performance was minimal. The only
| Total Returns | |
| Inception1 through September 30, 2009 | |
| Average | |
| Annual Return | |
| Target Retirement Income Fund | 4.50% |
| Target Income Composite Index | 4.46 |
| Target Income Composite Average2 | 3.42 |
| Target Retirement 2005 Fund | 4.42% |
| Target 2005 Composite Index | 4.42 |
| Target 2005 Composite Average2 | 3.42 |
| Target Retirement 2010 Fund | 2.61% |
| Target 2010 Composite Index | 2.50 |
| Target 2010 Composite Average2 | 0.97 |
| Target Retirement 2015 Fund | 4.28% |
| Target 2015 Composite Index | 4.21 |
| Target 2015 Composite Average2 | 3.30 |
| Target Retirement 2020 Fund | 1.26% |
| Target 2020 Composite Index | 1.12 |
| Target 2020 Composite Average2 | –0.13 |
| Target Retirement 2025 Fund | 3.89% |
| Target 2025 Composite Index | 3.83 |
| Target 2025 Composite Average2 | 3.06 |
The figures shown represent past performance, which is not a guarantee of future results. (Current performance may be lower or higher than the performance data cited. For performance data current to the most recent month-end, visit our website at www.vanguard.com/performance.) Note, too, that both investment returns and principal value can fluctuate widely, so an investor’s shares, when sold, could be worth more or less than their original cost.
1 For the Income, 2005, 2015, and 2025 Funds, inception was October 27, 2003; for the 2010 and 2020 Funds, inception was June 7, 2006.
2 Derived from data provided by Lipper Inc.
5
underlying fund represented in the series to post a decline was Vanguard Total Stock Market Index Fund (about –6%).
Target-date portfolios combine with low costs
Vanguard Target Retirement Funds invest in a mix of underlying Vanguard stock and bond funds tailored to the time horizon selected by the investor. Each fund’s weighting of stocks and bonds shifts toward a more conservative, income-oriented allocation as retirement approaches.
Excluding the Income Fund, each Vanguard Target Retirement Fund follows a steady path toward more conservative asset allocations over time.
The performance of the funds has been competitive since their inceptions, and each fund is ahead of the average return for an appropriate composite of mutual fund peers. This accomplishment is a tribute to the both Vanguard Quantitative Equity Group and Vanguard Fixed Income Group, the advisors of the underlying funds.
| Investment insight |
| Target Retirement Funds: A long-term compact |
| When you invest in a target-date retirement fund, you establish a relationship with a |
| fund, and a fund company, that may last for decades. |
| What does Vanguard consider some of the characteristics of a target-date fund that |
| can serve as a trusted long-term partner? |
| Low costs. Over time, costs can have a big impact on the amount of wealth you |
| accumulate. You want your long-term partner to minimize costs, maximizing your |
| share of the fund’s return. |
| Philosophical coherence. Target-date funds reflect a fund manager’s investment |
| beliefs. At Vanguard, we have long counseled investors to stick with a long-term plan |
| that emphasizes balance among the asset classes, diversification within them, and low |
| costs. These same principles are at the core of the Vanguard Target Retirement Funds. |
| Transparency. Well-designed target-date funds are built on sophisticated thinking about |
| asset allocation, risk control, and investor needs and behavior. You don’t want the |
| product of this research and analysis to be hidden in a black box. Vanguard’s portfolios |
| invest in index funds on the basis of well-defined “glide paths.” You can see clearly |
| how each fund will try to capture market returns and manage the risk-return trade-off |
| through gradual changes in strategic asset allocation. |
6
Each of these groups combines skilled portfolio management with sophisticated risk-control and trading systems.
The Target Retirement Funds, like all Vanguard funds, also benefit from low operating costs. For a look at how the funds’ costs compare with the composite average expenses of peers, please see the table below.
A retirement investment that’s straightforward, sensible
Investors have faced many challenges over the past year as the financial markets experienced uncommon volatility. The early part of 2009 brought further declines after 2008 registered as the worst calendar year for the U.S. stock market since the 1930s. As the economy showed signs of improvement and investors’ tolerance for risk returned, the financial markets started an impressive recovery.
As nobody knows the fate of future markets, we encourage investors to pay less attention to short-term events and trends and instead rely on a long-term strategy built on tried and true investment lessons. This means selecting a mix of stocks, bonds, and money market funds that suits your goals, time horizon, and risk tolerance.
A balanced portfolio is unlikely to provide either the best or worst returns, or even to fully shield investors from severe market turbulence. However, holding several different asset classes can help
| Expense Ratios | ||
| Your Fund Compared With Its Peer Group | ||
| Acquired Fund | Peer-Group | |
| Fees and | Expense | |
| Expenses1 | Ratio2 | |
| Income | 0.19% | 1.08% |
| 2005 | 0.18 | 1.13 |
| 2010 | 0.19 | 1.19 |
| 2015 | 0.18 | 1.24 |
| 2020 | 0.19 | 1.26 |
| 2025 | 0.18 | 1.29 |
1 This figure—drawn from the prospectus dated January 28, 2009—represents an estimate of the weighted average of the expense ratios and any transaction fees charged by the underlying mutual funds (the “acquired” funds) in which the Target Retirement Funds invest. The Target Retirement Funds do not charge any expenses or fees of their own. For the fiscal year ended September 30, 2009, the annualized acquired fund fees and expenses were 0.21% for the Target Retirement Income Fund, 0.21% for the 2005 Fund, 0.21% for the 2010 Fund, 0.21% for the 2015 Fund, 0.21% for the 2020 Fund, and 0.21% for the 2025 Fund.
2 Peer groups are (from top to bottom) the Target Income Composite Average, the Target 2005 Composite Average, the Target 2010 Composite Average, the Target 2015 Composite Average, the Target 2020 Composite Average, and the Target 2025 Composite Average. Each average is a blended composite that weights the expense ratio of the comparable mutual funds average for each asset class in proportion to the target weighting of the appropriate Target Retirement Fund. Peer-group expense ratios are derived from data provided by Lipper Inc. and capture information through year-end 2008.
7
reduce the volatility of returns relative to that of an undiversified portfolio. With their broad diversification and low costs, the Target Retirement Funds are designed to provide a straightforward solution to your retirement investing needs. By choosing a Target Retirement Fund, you have selected an investment designed to be balanced appropriately for your time horizon.
Thank you for your confidence in Vanguard.
Sincerely,
F. William McNabb III
President and Chief Executive Officer
October 12, 2009
| Your Fund’s Performance at a Glance | |||||
| September 30, 2008–September 30, 2009 | |||||
| Starting | Ending | Distributions Per Share | |||
| Share | Share | Income | Capital | 30-Day | |
| Price | Price | Dividends | Gains | SEC Yield | |
| Income | $10.19 | $10.49 | $0.270 | $0.000 | 1.93% |
| 2005 | 10.99 | 10.98 | 0.427 | 0.000 | 2.01 |
| 2010 | 20.47 | 20.39 | 0.679 | 0.000 | 2.12 |
| 2015 | 11.34 | 11.21 | 0.365 | 0.000 | 2.18 |
| 2020 | 20.03 | 19.66 | 0.549 | 0.000 | 2.21 |
| 2025 | 11.49 | 11.11 | 0.323 | 0.000 | 2.24 |
8
Results of Proxy Voting
At a special meeting of shareholders on July 2, 2009, fund shareholders approved the following two proposals:
Proposal 1—Elect trustees for each fund.*
The individuals listed in the table below were elected as trustees for each fund. All trustees with the exception of Messrs. McNabb and Volanakis (both of whom already served as directors of The Vanguard Group, Inc.) served as trustees to the funds prior to the shareholder meeting.
| Percentage | |||
| Trustee | For | Withheld | For |
| John J. Brennan | 2,630,147,450 | 97,260,963 | 96.2% |
| Charles D. Ellis | 2,625,722,607 | 101,685,806 | 96.0% |
| Emerson U. Fullwood | 2,628,496,004 | 98,912,409 | 96.1% |
| Rajiv L. Gupta | 2,626,864,431 | 100,543,982 | 96.0% |
| Amy Gutmann | 2,630,727,663 | 96,680,750 | 96.2% |
| JoAnn Heffernan Heisen | 2,628,219,495 | 99,188,918 | 96.1% |
| F. William McNabb III | 2,629,764,221 | 97,644,192 | 96.1% |
| André F. Perold | 2,627,865,185 | 99,543,228 | 96.1% |
| Alfred M. Rankin, Jr. | 2,628,819,510 | 98,588,903 | 96.1% |
| Peter F. Volanakis | 2,630,490,646 | 96,917,767 | 96.2% |
| * Results are for all funds within the same trust. |
Proposal 2—Update and standardize the funds’ fundamental policies regarding:
(a) Purchasing and selling real estate. (b) Issuing senior securities.
(c) Borrowing money. (d) Making loans.
(e) Purchasing and selling commodities.
(f) Concentrating investments in a particular industry or group of industries. (g) Eliminating outdated fundamental investment policies not required by law.
The revised fundamental policies are clearly stated and simple, yet comprehensive, making oversight and compliance more efficient than under the former policies. The revised fundamental policies will allow the funds to respond more quickly to regulatory and market changes, while avoiding the costs and delays associated with successive shareholder meetings.
| Broker | Percentage | ||||
| Vanguard Fund | For | Abstain | Against | Non-Votes | For |
| Target Retirement Income Fund | |||||
| 2a | 140,894,731 | 3,731,505 | 3,311,713 | 4,270,896 | 92.6% |
| 2b | 140,856,949 | 3,587,354 | 3,493,647 | 4,270,896 | 92.5% |
| 2c | 137,506,738 | 4,462,877 | 5,968,335 | 4,270,895 | 90.3% |
| 2d | 139,835,398 | 4,308,288 | 3,794,263 | 4,270,896 | 91.9% |
| 2e | 139,922,463 | 3,697,432 | 4,318,057 | 4,270,894 | 91.9% |
| 2f | 140,061,144 | 3,601,175 | 4,275,628 | 4,270,898 | 92.0% |
| 2g | 142,234,280 | 3,385,596 | 2,318,073 | 4,270,896 | 93.4% |
9
| Target Retirement 2005 Fund | |||||
| 2a | 110,221,356 | 3,006,648 | 2,391,444 | 5,100,198 | 91.3% |
| 2b | 110,412,321 | 3,215,665 | 1,991,463 | 5,100,198 | 91.5% |
| 2c | 107,104,078 | 3,462,424 | 5,052,946 | 5,100,199 | 88.7% |
| 2d | 109,874,235 | 3,452,315 | 2,292,898 | 5,100,199 | 91.0% |
| 2e | 109,699,055 | 3,105,232 | 2,815,161 | 5,100,199 | 90.9% |
| 2f | 109,748,427 | 3,332,284 | 2,538,738 | 5,100,198 | 90.9% |
| 2g | 110,819,158 | 3,185,141 | 1,615,146 | 5,100,201 | 91.8% |
| Target Retirement 2010 Fund | |||||
| 2a | 84,399,359 | 1,776,773 | 3,237,027 | 2,797,473 | 91.5% |
| 2b | 82,818,276 | 1,905,953 | 4,688,933 | 2,797,470 | 89.8% |
| 2c | 81,484,547 | 1,862,277 | 6,066,341 | 2,797,466 | 88.4% |
| 2d | 82,466,711 | 1,899,326 | 5,047,123 | 2,797,472 | 89.4% |
| 2e | 84,091,944 | 1,941,307 | 3,379,912 | 2,797,469 | 91.2% |
| 2f | 84,150,131 | 1,820,723 | 3,442,305 | 2,797,472 | 91.3% |
| 2g | 84,598,311 | 1,789,295 | 3,025,556 | 2,797,470 | 91.7% |
| Target Retirement 2015 Fund | |||||
| 2a | 480,736,733 | 15,384,024 | 15,508,567 | 27,627,580 | 89.1% |
| 2b | 480,951,150 | 15,861,989 | 14,824,123 | 27,619,643 | 89.2% |
| 2c | 470,185,105 | 16,875,029 | 24,577,127 | 27,619,642 | 87.2% |
| 2d | 477,848,933 | 16,913,228 | 16,875,099 | 27,619,643 | 88.6% |
| 2e | 479,054,417 | 15,539,974 | 17,042,869 | 27,619,643 | 88.8% |
| 2f | 479,405,018 | 15,800,720 | 16,431,529 | 27,619,637 | 88.9% |
| 2g | 482,801,781 | 16,060,414 | 12,767,131 | 27,627,578 | 89.5% |
| Target Retirement 2020 Fund | |||||
| 2a | 144,224,434 | 2,876,684 | 6,738,518 | 8,108,542 | 89.1% |
| 2b | 143,924,753 | 2,932,119 | 6,982,764 | 8,108,542 | 88.9% |
| 2c | 139,267,660 | 2,836,407 | 11,735,568 | 8,108,543 | 86.0% |
| 2d | 143,567,403 | 2,867,313 | 7,404,918 | 8,108,544 | 88.7% |
| 2e | 143,925,548 | 2,844,994 | 7,069,091 | 8,108,544 | 88.9% |
| 2f | 143,892,063 | 2,799,593 | 7,147,981 | 8,108,541 | 88.9% |
| 2g | 144,302,068 | 2,972,603 | 6,564,967 | 8,108,540 | 89.1% |
| Target Retirement 2025 Fund | |||||
| 2a | 472,787,217 | 22,346,757 | 15,051,544 | 38,793,293 | 86.1% |
| 2b | 472,180,381 | 22,303,002 | 15,702,135 | 38,793,294 | 86.0% |
| 2c | 462,692,032 | 23,310,122 | 24,183,360 | 38,793,298 | 84.3% |
| 2d | 469,989,353 | 23,306,660 | 16,889,507 | 38,793,293 | 85.6% |
| 2e | 471,070,972 | 22,128,378 | 16,986,167 | 38,793,295 | 85.8% |
| 2f | 470,977,403 | 22,194,808 | 17,013,306 | 38,793,294 | 85.8% |
| 2g | 474,328,458 | 22,905,603 | 12,951,453 | 38,793,299 | 86.4% |
10
Target Retirement Income Fund
Fund Profile
As of September 30, 2009
| Financial Attributes | |
| Yield1 | 1.9% |
| Acquired Fund Fees and Expenses2 | 0.19% |
| Volatility Measures3 | |
| Fund Versus | |
| Composite Index4 | |
| R-Squared | 1.00 |
| Beta | 1.00 |
| Allocation to Underlying Vanguard Funds | |
| Total Bond Market II Index Fund | 45.1% |
| Total Stock Market Index Fund | 23.9 |
| Inflation-Protected Securities Fund | 20.0 |
| Prime Money Market Find | 5.0 |
| European Stock Index Fund | 3.0 |
| Pacific Stock Index Fund | 1.6 |
| Emerging Markets Stock Index Fund | 1.4 |
Fund Asset Allocation
Equity Investment Focus
Fixed Income Investment Focus
1 30-day SEC yield. See the Glossary.
2 This figure—drawn from the prospectus dated January 28, 2009—represents an estimate of the weighted average of the expense ratios and any transaction fees charged by the underlying mutual funds (the “acquired” funds) in which the Target Retirement Income Fund invests. The Target Retirement Income Fund does not charge any expenses or fees of its own. For the fiscal year ended September 30, 2009, the annualized acquired fund fees and expenses was 0.21%.
3 For an explanation of R-squared, beta, and other items used here, see the Glossary.
4 Target Income Composite Index: Derived by applying the fund’s target asset allocation to the results of the following benchmarks: for international stocks of developed markets, the MSCI EAFE Index; for emerging markets stocks, the MSCI Emerging Markets Index; for bonds, the Barclays Capital U.S. Aggregate Bond Index and the Barclays Capital U.S. Treasury Inflation Notes Index; for short-term reserves, the Citigroup 3-Month Treasury Bill Index; and for U.S. stocks, MSCI US Broad Market Index. MSCI EAFE Index returns are adjusted for withholding taxes applicable to Luxembourg holding companies.
11
Target Retirement Income Fund
Performance Summary
All of the returns in this report represent past performance, which is not a guarantee of future results that may be achieved by the fund. (Current performance may be lower or higher than the performance data cited. For performance data current to the most recent month-end, visit our website at www.vanguard.com/performance.) Note, too, that both investment returns and principal value can fluctuate widely, so an investor’s shares, when sold, could be worth more or less than their original cost. The returns shown do not reflect taxes that a shareholder would pay on fund distributions or on the sale of fund shares.
Cumulative Performance: October 27, 2003––September 30, 2009
Initial Investment of $10,000
| Average Annual Total Returns | ||||
| Periods Ended September 30, 2009 | Final Value | |||
| Since | of a $10,000 | |||
| One Year | Five Years | Inception1 | Investment | |
| Target Retirement Income Fund2 | 5.84% | 4.11% | 4.50% | $12,984 |
| Barclays Capital U.S. Aggregate Bond Index | 10.56 | 5.13 | 5.11 | 13,440 |
| Target Income Composite Index3 | 5.57 | 4.03 | 4.46 | 12,951 |
| Target Income Composite Average4 | 5.09 | 2.93 | 3.42 | 12,203 |
1 Performance for the fund and its comparative standards is calculated since the fund’s inception: October 27, 2003.
2 Total returns do not include the account service fee that may be applicable to certain accounts with balances below $10,000.
3 Target Income Composite Index: Derived by applying the fund’s target asset allocation to the results of the following benchmarks: for international stocks of developed markets, the MSCI EAFE Index; for emerging markets stocks, the Select Emerging Markets Index from inception through August 23, 2006, and the MSCI Emerging Markets Index thereafter; for bonds, the Barclays Capital U.S. Aggregate Bond Index and the Barclays Capital U.S. Treasury Inflation Notes Index; for short-term reserves, the Citigroup 3-Month Treasury Bill Index; and for U.S. stocks, the Dow Jones Wilshire 5000 Index from inception through April 22, 2005, and the MSCI US Broad Market Index thereafter.
MSCI EAFE Index returns are adjusted for withholding taxes applicable to Luxembourg holding companies.
4 Target Income Composite Average: Derived by applying the fund’s target allocation to the following peer-group averages: the fixed income funds average, general equity funds average, Treasury inflation protected securities funds average, money market funds average, international funds average, and emerging markets funds average. Derived from data provided by Lipper Inc.
Note: See Financial Highlights tables for dividend and capital gains information.
12
Target Retirement Income Fund
Fiscal-Year Total Returns (%): October 27, 2003–September 30, 2009
1 Target Income Composite Index: Derived by applying the fund’s target asset allocation to the results of the following benchmarks: for international stocks of developed markets, the MSCI EAFE Index; for emerging markets stocks, the Select Emerging Markets Index from inception through August 23, 2006, and the MSCI Emerging Markets Index thereafter; for bonds, the Barclays Capital U.S. Aggregate Bond Index and the Barclays Capital U.S. Treasury Inflation Notes Index; for short-term reserves, the Citigroup 3-Month Treasury Bill Index; and for U.S. stocks, the Dow Jones Wilshire 5000 Index from inception through April 22, 2005, and the MSCI US Broad Market Index thereafter.
MSCI EAFE Index returns are adjusted for withholding taxes applicable to Luxembourg holding companies.
Note: See Financial Highlights tables for dividend and capital gains information.
13
Target Retirement Income Fund
Financial Statements
Statement of Net Assets
As of September 30, 2009
The fund reports a complete list of its holdings in regulatory filings four times in each fiscal year, at the quarter-ends. For the second and fourth fiscal quarters, the lists appear in the fund’s semiannual and annual reports to shareholders. For the first and third fiscal quarters, the fund files the lists with the Securities and Exchange Commission on Form N-Q. Shareholders can look up the fund’s Forms N-Q on the SEC’s website at www.sec.gov. Forms N-Q may also be reviewed and copied at the SEC’s Public Reference Room (see the back cover of this report for further information).
| Market | ||
| Value• | ||
| Shares | ($000) | |
| Investment Companies (100.0%) | ||
| U.S. Stock Fund (23.9%) | ||
| Vanguard Total Stock Market Index Fund Investor Shares | 22,534,030 | 587,913 |
| International Stock Funds (6.0%) | ||
| Vanguard European Stock Index Fund Investor Shares | 2,789,631 | 73,451 |
| Vanguard Pacific Stock Index Fund Investor Shares | 3,952,828 | 39,094 |
| Vanguard Emerging Markets Stock Index Fund Investor Shares | 1,465,059 | 35,498 |
| 148,043 | ||
| Bond Funds (65.0%) | ||
| 1 Vanguard Total Bond Market II Index Fund Investor Shares | 107,339,866 | 1,108,821 |
| Vanguard Inflation-Protected Securities Fund Investor Shares | 39,375,399 | 492,980 |
| 1,601,801 | ||
| Money Market Funds (5.1%) | ||
| Vanguard Prime Money Market Fund Investor Shares | 122,970,563 | 122,971 |
| 1 Vanguard Market Liquidity Fund, 0.267% | 2,016,000 | 2,016 |
| 124,987 | ||
| Total Investment Companies (Cost $2,457,041) | 2,462,744 | |
| Other Assets and Liabilities (0.0%) | ||
| Other Assets | 8,533 | |
| Liabilities | (8,548) | |
| (15) | ||
| Net Assets (100%) | ||
| Applicable to 234,865,840 outstanding $.001 par value shares of | ||
| beneficial interest (unlimited authorization) | 2,462,729 | |
| Net Asset Value Per Share | $10.49 | |
14
| Target Retirement Income Fund | |
| At September 30, 2009, net assets consisted of: | |
| Amount | |
| ($000) | |
| Paid-in Capital | 2,496,670 |
| Undistributed Net Investment Income | 1,383 |
| Accumulated Net Realized Losses | (41,027) |
| Unrealized Appreciation (Depreciation) | 5,703 |
| Net Assets | 2,462,729 |
• See Note A in Notes to Financial Statements.
1 Affiliated fund available only to Vanguard funds and certain trusts and accounts managed by Vanguard. Rate shown for Vanguard Market Liquidity Fund is the 7-day yield.
See accompanying Notes, which are an integral part of the Financial Statements.
15
| Target Retirement Income Fund | |
| Statement of Operations | |
| Year Ended | |
| September 30, 2009 | |
| ($000) | |
| Investment Income | |
| Income | |
| Income Distributions Received | 55,500 |
| Net Investment Income—Note B | 55,500 |
| Realized Net Gain (Loss) on Investment Securities Sold | (31,945) |
| Change in Unrealized Appreciation (Depreciation) of Investment Securities | 108,639 |
| Net Increase (Decrease) in Net Assets Resulting from Operations | 132,194 |
See accompanying Notes, which are an integral part of the Financial Statements.
16
| Target Retirement Income Fund | ||
| Statement of Changes in Net Assets | ||
| Year Ended September 30, | ||
| 2009 | 2008 | |
| ($000) | ($000) | |
| Increase (Decrease) in Net Assets | ||
| Operations | ||
| Net Investment Income | 55,500 | 73,806 |
| Realized Net Gain (Loss) | (31,945) | (4,008) |
| Change in Unrealized Appreciation (Depreciation) | 108,639 | (166,391) |
| Net Increase (Decrease) in Net Assets Resulting from Operations | 132,194 | (96,593) |
| Distributions | ||
| Net Investment Income | (55,814) | (74,307) |
| Realized Capital Gain | — | — |
| Total Distributions | (55,814) | (74,307) |
| Capital Share Transactions | ||
| Issued | 930,456 | 1,279,636 |
| Issued in Lieu of Cash Distributions | 52,709 | 69,952 |
| Redeemed | (643,011) | (468,082) |
| Net Increase (Decrease) from Capital Share Transactions | 340,154 | 881,506 |
| Total Increase (Decrease) | 416,534 | 710,606 |
| Net Assets | ||
| Beginning of Period | 2,046,195 | 1,335,589 |
| End of Period1 | 2,462,729 | 2,046,195 |
| 1 Net Assets—End of Period includes undistributed net investment income of $1,383,000 and $1,697,000. | ||
See accompanying Notes, which are an integral part of the Financial Statements.
17
| Target Retirement Income Fund | |||||
| Financial Highlights | |||||
| For a Share Outstanding | Year Ended September 30, | ||||
| Throughout Each Period | 2009 | 2008 | 2007 | 2006 | 2005 |
| Net Asset Value, Beginning of Period | $10.19 | $11.08 | $10.52 | $10.52 | $10.31 |
| Investment Operations | |||||
| Net Investment Income | .268 | .427 | .4301 | .4391 | .3991 |
| Capital Gain Distributions Received | — | — | — | .0031 | .0221 |
| Net Realized and Unrealized Gain (Loss) | |||||
| on Investments | .302 | (.878) | .540 | .003 | .163 |
| Total from Investment Operations | .570 | (.451) | .970 | .445 | .584 |
| Distributions | |||||
| Dividends from Net Investment Income | (.270) | (.439) | (.410) | (.430) | (.370) |
| Distributions from Realized Capital Gains | — | — | — | (.015) | (.004) |
| Total Distributions | (.270) | (.439) | (.410) | (.445) | (.374) |
| Net Asset Value, End of Period | $10.49 | $10.19 | $11.08 | $10.52 | $10.52 |
| Total Return2 | 5.84% | –4.23% | 9.36% | 4.36% | 5.73% |
| Ratios/Supplemental Data | |||||
| Net Assets, End of Period (Millions) | $2,463 | $2,046 | $1,336 | $822 | $677 |
| Ratio of Total Expenses to | |||||
| Average Net Assets | 0%3 | 0% | 0% | 0% | 0% |
| Ratio of Net Investment Income to | |||||
| Average Net Assets | 2.78% | 4.11% | 4.03% | 4.21% | 3.80% |
| Portfolio Turnover Rate | 29%4 | 14% | 3% | 22% | 0% |
1 Calculated based on average shares outstanding.
2 Total returns do not include the account service fee that may be applicable to certain accounts with balances below $10,000. 3 The acquired fund fees and expenses were 0.21%.
4 Excludes the value of mutual fund shares delivered and received in connection with a change in the fund’s bond investments from the Vanguard Total Bond Market Index Fund to the Vanguard Total Bond Market II Index Fund because those transactions were effected in kind and did not cause the fund to incur transaction costs.
See accompanying Notes, which are an integral part of the Financial Statements.
18
Target Retirement Income Fund
Notes to Financial Statements
Vanguard Target Retirement Income Fund is registered under the Investment Company Act of 1940 as an open-end investment company, or mutual fund. The fund follows a balanced investment strategy by investing in selected Vanguard funds to achieve its targeted allocation of assets to U.S. stocks, international stocks, bonds, and short-term reserves.
A. The following significant accounting policies conform to generally accepted accounting principles for U.S. mutual funds. The fund consistently follows such policies in preparing its financial statements.
1. Security Valuation: Investments are valued at the net asset value of each underlying Vanguard fund determined as of the close of the New York Stock Exchange (generally 4 p.m., Eastern time) on the valuation date.
2. Federal Income Taxes: The fund intends to continue to qualify as a regulated investment company and distribute all of its taxable income. Management has analyzed the fund’s tax positions taken for all open federal income tax years (September 30, 2006–2009), and has concluded that no provision for federal income tax is required in the fund’s financial statements.
3. Distributions: Distributions to shareholders are recorded on the ex-dividend date.
4. Other: Income and capital gain distributions received are recorded on the ex-dividend date. Security transactions are accounted for on the date securities are bought or sold. Costs used to determine realized gains (losses) on the sale of investment securities are those of the specific securities sold.
B. Under a service agreement, The Vanguard Group furnishes investment advisory, corporate management, administrative, marketing, and distribution services to the fund. The service agreement provides that the fund’s expenses may be reduced or eliminated to the extent of savings realized by the Vanguard funds by the operation of the fund. Accordingly, all incremental expenses for services provided by Vanguard and all other expenses incurred by the fund during the year ended September 30, 2009, were borne by the funds in which the fund invests. The fund’s trustees and officers are also directors and officers of Vanguard and the funds in which the fund invests.
C. Various inputs may be used to determine the value of the fund’s investments. These inputs are summarized in three broad levels for financial statement purposes. The inputs or methodologies used to value securities are not necessarily an indication of the risk associated with investing in those securities.
Level 1—Quoted prices in active markets for identical securities.
Level 2—Other significant observable inputs (including quoted prices for similar securities, interest rates, prepayment speeds, credit risk, etc.).
Level 3—Significant unobservable inputs (including the fund’s own assumptions used to determine the fair value of investments).
At September 30, 2009, 100% of the fund’s investments were valued based on Level 1 inputs.
D. Distributions are determined on a tax basis and may differ from net investment income and realized capital gains for financial reporting purposes. Differences may be permanent or temporary. Permanent differences are reclassified among capital accounts in the financial statements to reflect their tax character. Temporary differences arise when certain items of income, expense, gain, or loss are recognized in different periods for financial statement and tax purposes; these differences will reverse at some time in the future. Differences in classification may also result from the treatment of short-term gains as ordinary income for tax purposes.
19
Target Retirement Income Fund
For tax purposes, at September 30, 2009, the fund had $1,395,000 of ordinary income available for distribution. The fund had available capital loss carryforwards totaling $10,331,000 to offset future net capital gains of $4,560,000 through September 30, 2015, and $5,771,000 through September 30, 2017. In addition, the fund realized losses of $22,860,000 during the period from November 1, 2008, through September 30, 2009, which are deferred and will be treated as realized for tax purposes in fiscal 2010.
At September 30, 2009, the cost of investment securities for tax purposes was $2,464,889,000. Net unrealized depreciation of investment securities for tax purposes was $2,145,000, consisting of unrealized gains of $48,380,000 on securities that had risen in value since their purchase and $50,525,000 in unrealized losses on securities that had fallen in value since their purchase.
E. During the year ended September 30, 2009, the fund purchased $1,752,433,000 of investment securities and sold $1,414,452,000 of investment securities, other than temporary cash investments.
| F. Capital shares issued and redeemed were: | ||
| Year Ended September 30, | ||
| 2009 | 2008 | |
| Shares | Shares | |
| (000) | (000) | |
| Issued | 96,222 | 116,714 |
| Issued in Lieu of Cash Distributions | 5,415 | 6,507 |
| Redeemed | (67,527) | (42,975) |
| Net Increase (Decrease) in Shares Outstanding | 34,110 | 80,246 |
G. In preparing the financial statements as of September 30, 2009, management considered the impact of subsequent events occurring through November 6, 2009, for potential recognition or disclosure in these financial statements.
20
Target Retirement 2005 Fund
Fund Profile
As of September 30, 2009
| Financial Attributes | |
| Yield1 | 2.0% |
| Acquired Fund Fees and Expenses2 | 0.18% |
| Volatility Measures3 | |
| Fund Versus | |
| Composite Index4 | |
| R-Squared | 1.00 |
| Beta | 1.00 |
| Allocation to Underlying Vanguard Funds | |
| Total Bond Market II Index Fund | 43.1% |
| Total Stock Market Index Fund | 30.2 |
| Inflation-Protected Securities Fund | 16.1 |
| European Stock Index Fund | 3.8 |
| Prime Money Market Find | 3.0 |
| Pacific Stock Index Fund | 2.0 |
| Emerging Markets Stock Index Fund | 1.8 |
Fund Asset Allocation
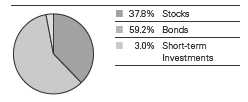
Equity Investment Focus
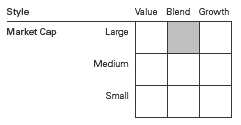
Fixed Income Investment Focus
1 30-day SEC yield. See the Glossary.
2 This figure—drawn from the prospectus dated January 28, 2009—represents an estimate of the weighted average of the expense ratios and any transaction fees charged by the underlying mutual funds (the “acquired” funds) in which the Target Retirement 2005 Fund invests.
The Target Retirement 2005 Fund does not charge any expenses or fees of its own. For the fiscal year ended September 30, 2009, the annualized acquired fund fees and expenses was 0.21%.
3 For an explanation of R-squared, beta, and other items used here, see the Glossary.
4 Target 2005 Composite Index: Derived by applying the fund’s target asset allocation to the results of the following benchmarks: for international stocks of developed markets, the MSCI EAFE Index; for emerging markets stocks, the MSCI Emerging Markets Index; for bonds, the Barclays Capital U.S. Aggregate Bond Index and the Barclays Capital U.S. Treasury Inflation Notes Index; for short-term reserves, the Citigroup 3-Month Treasury Bill Index; and for U.S. stocks, the MSCI US Broad Market Index. MSCI EAFE Index returns are adjusted for withholding taxes applicable to Luxembourg holding companies.
21
Target Retirement 2005 Fund
Performance Summary
All of the returns in this report represent past performance, which is not a guarantee of future results that may be achieved by the fund. (Current performance may be lower or higher than the performance data cited. For performance data current to the most recent month-end, visit our website at www.vanguard.com/performance.) Note, too, that both investment returns and principal value can fluctuate widely, so an investor’s shares, when sold, could be worth more or less than their original cost. The returns shown do not reflect taxes that a shareholder would pay on fund distributions or on the sale of fund shares.
Cumulative Performance: October 27, 2003–September 30, 2009
Initial Investment of $10,000
| Average Annual Total Returns | ||||
| Periods Ended September 30, 2009 | Final Value | |||
| Since | of a $10,000 | |||
| One Year | Five Years | Inception1 | Investment | |
| Target Retirement 2005 Fund2 | 4.33% | 3.81% | 4.42% | $12,920 |
| Dow Jones U.S. Total Stock Market Index | –5.83 | 1.93 | 3.33 | 12,141 |
| Target 2005 Composite Index3 | 4.35 | 3.79 | 4.42 | 12,924 |
| Target 2005 Composite Average4 | 4.00 | 2.79 | 3.42 | 12,208 |
1 Performance for the fund and its comparative standards is calculated since the fund’s inception: October 27, 2003.
2 Total returns do not include the account service fee that may be applicable to certain accounts with balances below $10,000.
3 Target 2005 Composite Index: Derived by applying the fund’s target asset allocation to the results of the following benchmarks: for international stocks of developed markets, the MSCI EAFE Index; for emerging markets stocks, the Select Emerging Markets Index from inception through August 23, 2006, and the MSCI Emerging Markets Index thereafter; for bonds, the Barclays Capital U.S.
Aggregate Bond Index and the Barclays Capital U.S. Treasury Inflation Notes Index; for short-term reserves, the Citigroup 3-Month Treasury Bill Index; and for U.S. stocks, the Dow Jones Wilshire 5000 Index from inception through April 22, 2005, and the MSCI US Broad Market Index thereafter. MSCI EAFE Index returns are adjusted for withholding taxes applicable to Luxembourg holding companies.
4 Target 2005 Composite Average: Derived by applying the fund’s target allocation to the following peer-group averages: the fixed income funds average, general equity funds average, Treasury inflation protected securities funds average, international funds average, money market funds average, and emerging markets funds average. Derived from data provided by Lipper Inc.
Note: See Financial Highlights tables for dividend and capital gains information.
22
Target Retirement 2005 Fund
Fiscal-Year Total Returns (%): October 27, 2003–September 30, 2009
1 Target 2005 Composite Index: Derived by applying the fund’s target asset allocation to the results of the following benchmarks: for international stocks of developed markets, the MSCI EAFE Index; for emerging markets stocks, the Select Emerging Markets Index from inception through August 23, 2006, and the MSCI Emerging Markets Index thereafter; for bonds, the Barclays Capital U.S.
Aggregate Bond Index and the Barclays Capital U.S. Treasury Inflation Notes Index; for short-term reserves, the Citigroup 3-Month Treasury Bill Index; and for U.S. stocks, the Dow Jones Wilshire 5000 Index from inception through April 22, 2005, and the MSCI US Broad Market Index thereafter. MSCI EAFE Index returns are adjusted for withholding taxes applicable to Luxembourg holding companies.
Note: See Financial Highlights tables for dividend and capital gains information.
23
Target Retirement 2005 Fund
Financial Statements
Statement of Net Assets
As of September 30, 2009
The fund reports a complete list of its holdings in regulatory filings four times in each fiscal year, at the quarter-ends. For the second and fourth fiscal quarters, the lists appear in the fund’s semiannual and annual reports to shareholders. For the first and third fiscal quarters, the fund files the lists with the Securities and Exchange Commission on Form N-Q. Shareholders can look up the fund’s Forms N-Q on the SEC’s website at www.sec.gov. Forms N-Q may also be reviewed and copied at the SEC’s Public Reference Room (see the back cover of this report for further information).
| Market | ||
| Value• | ||
| Shares | ($000) | |
| Investment Companies (100.0%) | ||
| U.S. Stock Fund (30.1%) | ||
| Vanguard Total Stock Market Index Fund Investor Shares | 20,972,331 | 547,168 |
| International Stock Funds (7.7%) | ||
| Vanguard European Stock Index Fund Investor Shares | 2,616,073 | 68,881 |
| Vanguard Pacific Stock Index Fund Investor Shares | 3,696,875 | 36,562 |
| Vanguard Emerging Markets Stock Index Fund Investor Shares | 1,380,813 | 33,457 |
| 138,900 | ||
| Bond Funds (59.2%) | ||
| 1 Vanguard Total Bond Market II Index Fund Investor Shares | 75,661,208 | 781,580 |
| Vanguard Inflation-Protected Securities Fund Investor Shares | 23,325,059 | 292,030 |
| 1,073,610 | ||
| Money Market Fund (3.0%) | ||
| Vanguard Prime Money Market Fund Investor Shares | 54,568,511 | 54,569 |
| Total Investment Companies (Cost $1,831,252) | 1,814,247 | |
| Other Assets and Liabilities (0.0%) | ||
| Other Assets | 16,179 | |
| Liabilities | (15,700) | |
| 479 | ||
| Net Assets (100%) | ||
| Applicable to 165,206,587 outstanding $.001 par value shares of | ||
| beneficial interest (unlimited authorization) | 1,814,726 | |
| Net Asset Value Per Share | $10.98 | |
| At September 30, 2009, net assets consisted of: | ||
| Amount | ||
| ($000) | ||
| Paid-in Capital | 1,874,255 | |
| Undistributed Net Investment Income | 27,901 | |
| Accumulated Net Realized Losses | (70,425) | |
| Unrealized Appreciation (Depreciation) | (17,005) | |
| Net Assets | 1,814,726 | |
• See Note A in Notes to Financial Statements.
1 Affiliated fund available only to Vanguard funds and certain trusts and accounts managed by Vanguard.
See accompanying Notes, which are an integral part of the Financial Statements.
24
| Target Retirement 2005 Fund | |
| Statement of Operations | |
| Year Ended | |
| September 30, 2009 | |
| ($000) | |
| Investment Income | |
| Income | |
| Income Distributions Received | 46,436 |
| Net Investment Income—Note B | 46,436 |
| Realized Net Gain (Loss) on Investment Securities Sold | (59,610) |
| Change in Unrealized Appreciation (Depreciation) of Investment Securities | 75,118 |
| Net Increase (Decrease) in Net Assets Resulting from Operations | 61,944 |
See accompanying Notes, which are an integral part of the Financial Statements.
25
| Target Retirement 2005 Fund | ||
| Statement of Changes in Net Assets | ||
| Year Ended September 30, | ||
| 2009 | 2008 | |
| ($000) | ($000) | |
| Increase (Decrease) in Net Assets | ||
| Operations | ||
| Net Investment Income | 46,436 | 63,474 |
| Realized Net Gain (Loss) | (59,610) | (5,945) |
| Change in Unrealized Appreciation (Depreciation) | 75,118 | (206,608) |
| Net Increase (Decrease) in Net Assets Resulting from Operations | 61,944 | (149,079) |
| Distributions | ||
| Net Investment Income | (65,673) | (49,631) |
| Realized Capital Gain | — | — |
| Total Distributions | (65,673) | (49,631) |
| Capital Share Transactions | ||
| Issued | 489,989 | 902,990 |
| Issued in Lieu of Cash Distributions | 64,712 | 48,860 |
| Redeemed | (503,197) | (459,171) |
| Net Increase (Decrease) from Capital Share Transactions | 51,504 | 492,679 |
| Total Increase (Decrease) | 47,775 | 293,969 |
| Net Assets | ||
| Beginning of Period | 1,766,951 | 1,472,982 |
| End of Period1 | 1,814,726 | 1,766,951 |
| 1 Net Assets—End of Period includes undistributed net investment income of $27,901,000 and $47,138,000. | ||
See accompanying Notes, which are an integral part of the Financial Statements.
26
| Target Retirement 2005 Fund | |||||
| Financial Highlights | |||||
| For a Share Outstanding | Year Ended September 30, | ||||
| Throughout Each Period | 2009 | 2008 | 2007 | 2006 | 2005 |
| Net Asset Value, Beginning of Period | $10.99 | $12.31 | $11.38 | $11.14 | $10.65 |
| Investment Operations | |||||
| Net Investment Income | .303 | .4391 | .4201 | .4081 | .3881 |
| Capital Gain Distributions Received | — | — | — | .0021 | .0151 |
| Net Realized and Unrealized Gain (Loss) | |||||
| on Investments | .114 | (1.379) | .870 | .149 | .331 |
| Total from Investment Operations | .417 | (.940) | 1.290 | .559 | .734 |
| Distributions | |||||
| Dividends from Net Investment Income | (.427) | (.380) | (.360) | (.310) | (.240) |
| Distributions from Realized Capital Gains | — | — | — | (.009) | (.004) |
| Total Distributions | (.427) | (.380) | (.360) | (.319) | (.244) |
| Net Asset Value, End of Period | $10.98 | $10.99 | $12.31 | $11.38 | $11.14 |
| Total Return2 | 4.33% | –7.89% | 11.56% | 5.13% | 6.96% |
| Ratios/Supplemental Data | |||||
| Net Assets, End of Period (Millions) | $1,815 | $1,767 | $1,473 | $957 | $651 |
| Ratio of Total Expenses to | |||||
| Average Net Assets | 0%3 | 0% | 0% | 0% | 0% |
| Ratio of Net Investment Income to | |||||
| Average Net Assets | 2.95% | 3.71% | 3.56% | 3.68% | 3.57% |
| Portfolio Turnover Rate | 44%4 | 21% | 6% | 19% | 4% |
1 Calculated based on average shares outstanding.
2 Total returns do not include the account service fee that may be applicable to certain accounts with balances below $10,000. 3 The acquired fund fees and expenses were 0.21%.
4 Excludes the value of mutual fund shares delivered and received in connection with a change in the fund’s bond investments from the Vanguard Total Bond Market Index Fund to the Vanguard Total Bond Market II Index Fund because those transactions were effected in kind and did not cause the fund to incur transaction costs.
See accompanying Notes, which are an integral part of the Financial Statements.
27
Target Retirement 2005 Fund
Notes to Financial Statements
Vanguard Target Retirement 2005 Fund is registered under the Investment Company Act of 1940 as an open-end investment company, or mutual fund. The fund follows a balanced investment strategy by investing in selected Vanguard funds to achieve its targeted allocation of assets to U.S. stocks, international stocks, bonds, and short-term reserves.
A. The following significant accounting policies conform to generally accepted accounting principles for U.S. mutual funds. The fund consistently follows such policies in preparing its financial statements.
1. Security Valuation: Investments are valued at the net asset value of each underlying Vanguard fund determined as of the close of the New York Stock Exchange (generally 4 p.m., Eastern time) on the valuation date.
2. Federal Income Taxes: The fund intends to continue to qualify as a regulated investment company and distribute all of its taxable income. Management has analyzed the fund’s tax positions taken for all open federal income tax years (September 30, 2006–2009), and has concluded that no provision for federal income tax is required in the fund’s financial statements.
3. Distributions: Distributions to shareholders are recorded on the ex-dividend date.
4. Other: Income and capital gain distributions received are recorded on the ex-dividend date. Security transactions are accounted for on the date securities are bought or sold. Costs used to determine realized gains (losses) on the sale of investment securities are those of the specific securities sold.
B. Under a service agreement, The Vanguard Group furnishes investment advisory, corporate management, administrative, marketing, and distribution services to the fund. The service agreement provides that the fund’s expenses may be reduced or eliminated to the extent of savings realized by the Vanguard funds by the operation of the fund. Accordingly, all incremental expenses for services provided by Vanguard and all other expenses incurred by the fund during the year ended September 30, 2009, were borne by the funds in which the fund invests. The fund’s trustees and officers are also directors and officers of Vanguard and the funds in which the fund invests.
C. Various inputs may be used to determine the value of the fund’s investments. These inputs are summarized in three broad levels for financial statement purposes. The inputs or methodologies used to value securities are not necessarily an indication of the risk associated with investing in those securities.
Level 1—Quoted prices in active markets for identical securities.
Level 2—Other significant observable inputs (including quoted prices for similar securities, interest rates, prepayment speeds, credit risk, etc.).
Level 3—Significant unobservable inputs (including the fund’s own assumptions used to determine the fair value of investments).
At September 30, 2009, 100% of the fund’s investments were valued based on Level 1 inputs.
D. Distributions are determined on a tax basis and may differ from net investment income and realized capital gains for financial reporting purposes. Differences may be permanent or temporary. Permanent differences are reclassified among capital accounts in the financial statements to reflect their tax character. Temporary differences arise when certain items of income, expense, gain, or loss are recognized in different periods for financial statement and tax purposes; these differences will reverse at some time in the future. Differences in classification may also result from the treatment of short-term gains as ordinary income for tax purposes.
28
Target Retirement 2005 Fund
For tax purposes, at September 30, 2009, the fund had $27,894,000 of ordinary income available for distribution. The fund had available capital loss carryforwards totaling $9,220,000 to offset future net capital gains of $4,418,000 through September 30, 2015, and $4,802,000 through September 30, 2017. In addition, the fund realized losses of $57,197,000 during the period from November 1, 2008, through September 30, 2009, which are deferred and will be treated as realized for tax purposes in fiscal 2010.
At September 30, 2009, the cost of investment securities for tax purposes was $1,835,252,000. Net unrealized depreciation of investment securities for tax purposes was $21,005,000, consisting of unrealized gains of $37,647,000 on securities that had risen in value since their purchase and $58,652,000 in unrealized losses on securities that had fallen in value since their purchase.
E. During the year ended September 30, 2009, the fund purchased $1,366,827,000 of investment securities and sold $1,338,010,000 of investment securities, other than temporary cash investments.
| F. Capital shares issued and redeemed were: | ||
| Year Ended September 30, | ||
| 2009 | 2008 | |
| Shares | Shares | |
| (000) | (000) | |
| Issued | 49,211 | 76,093 |
| Issued in Lieu of Cash Distributions | 6,706 | 4,078 |
| Redeemed | (51,532) | (39,032) |
| Net Increase (Decrease) in Shares Outstanding | 4,385 | 41,139 |
G. In preparing the financial statements as of September 30, 2009, management considered the impact of subsequent events occurring through November 6, 2009, for potential recognition or disclosure in these financial statements.
29
Target Retirement 2010 Fund
Fund Profile
As of September 30, 2009
| Financial Attributes | |
| Yield1 | 2.1% |
| Acquired Fund Fees and Expenses2 | 0.19% |
| Volatility Measures3 | |
| Fund Versus | |
| Composite Index4 | |
| R-Squared | 1.00 |
| Beta | 1.00 |
| Allocation to Underlying Vanguard Funds | |
| Total Stock Market Index Fund | 41.1% |
| Total Bond Market II Index Fund | 40.1 |
| Inflation-Protected Securities Fund | 8.5 |
| European Stock Index Fund | 5.1 |
| Pacific Stock Index Fund | 2.7 |
| Emerging Markets Stock Index Fund | 2.5 |
Fund Asset Allocation
Equity Investment Focus
Fixed Income Investment Focus
1 30-day SEC yield. See the Glossary.
2 This figure—drawn from the prospectus dated January 28, 2009—represents an estimate of the weighted average of the expense ratios and any transaction fees charged by the underlying mutual funds (the “acquired” funds) in which the Target Retirement 2010 Fund invests.
The Target Retirement 2010 Fund does not charge any expenses or fees of its own. For the fiscal year ended September 30, 2009, the annualized acquired fund fees and expenses was 0.21%.
3 For an explanation of R-squared, beta, and other items used here, see the Glossary.
4 Target 2010 Composite Index: Derived by applying the fund’s target asset allocation to the results of the following benchmarks: for international stocks of developed markets, the MSCI EAFE Index; for emerging markets stocks, the MSCI Emerging Markets Index; for bonds, the Barclays Capital U.S. Aggregate Bond Index and the Barclays Capital U.S. Treasury Inflation Notes Index; and for U.S. stocks, the MSCI US Broad Market Index. MSCI EAFE Index returns are adjusted for withholding taxes applicable to Luxembourg holding companies.
30
Target Retirement 2010 Fund
Performance Summary
All of the returns in this report represent past performance, which is not a guarantee of future results that may be achieved by the fund. (Current performance may be lower or higher than the performance data cited. For performance data current to the most recent month-end, visit our website at www.vanguard.com/performance.) Note, too, that both investment returns and principal value can fluctuate widely, so an investor’s shares, when sold, could be worth more or less than their original cost. The returns shown do not reflect taxes that a shareholder would pay on fund distributions or on the sale of fund shares.
Cumulative Performance: June 7, 2006–September 30, 2009
Initial Investment of $10,000
| Average Annual Total Returns | Final Value | ||
| Periods Ended September 30, 2009 | of a $10,000 | ||
| One Year | Since Inception1 | Investment | |
| Target Retirement 2010 Fund2 | 3.47% | 2.61% | $10,891 |
| Dow Jones U.S. Total Stock Market Index | –5.83 | –2.51 | 9,193 |
| Target 2010 Composite Index3 | 3.28 | 2.50 | 10,852 |
| Target 2010 Composite Average4 | 3.06 | 0.97 | 10,324 |
1 Performance for the fund and its comparative standards is calculated since the fund’s inception: June 7, 2006.
2 Total returns do not include the account service fee that may be applicable to certain accounts with balances below $10,000.
3 Target 2010 Composite Index: Derived by applying the fund’s target asset allocation to the results of the following benchmarks: for international stocks of developed markets, the MSCI EAFE Index; for emerging markets stocks, the Select Emerging Markets Index from inception through August 23, 2006, and the MSCI Emerging Markets Index thereafter; for bonds, the Barclays Capital U.S.
Aggregate Bond Index and the Barclays Capital U.S. Treasury Inflation Notes Index; and for U.S. stocks, the MSCI US Broad Market Index. MSCI EAFE Index returns are adjusted for withholding taxes applicable to Luxembourg holding companies.
4 Target 2010 Composite Average: Derived by applying the fund’s target allocation to the following peer-group averages: the general equity funds average, fixed income funds average, international funds average, Treasury inflation protected securities funds average, and emerging markets funds average. Derived from data provided by Lipper Inc.
Note: See Financial Highlights tables for dividend and capital gains information.
31
Target Retirement 2010 Fund
Fiscal-Year Total Returns (%): June 7, 2006–September 30, 2009
1 Target 2010 Composite Index: Derived by applying the fund’s target asset allocation to the results of the following benchmarks: for international stocks of developed markets, the MSCI EAFE Index; for emerging markets stocks, the Select Emerging Markets Index from inception through August 23, 2006, and the MSCI Emerging Markets Index thereafter; for bonds, the Barclays Capital U.S.
Aggregate Bond Index and the Barclays Capital U.S. Treasury Inflation Notes Index; and for U.S. stocks, the MSCI US Broad Market Index. MSCI EAFE Index returns are adjusted for withholding taxes applicable to Luxembourg holding companies.
Note: See Financial Highlights tables for dividend and capital gains information.
32
Target Retirement 2010 Fund
Financial Statements
Statement of Net Assets
As of September 30, 2009
The fund reports a complete list of its holdings in regulatory filings four times in each fiscal year, at the quarter-ends. For the second and fourth fiscal quarters, the lists appear in the fund’s semiannual and annual reports to shareholders. For the first and third fiscal quarters, the fund files the lists with the Securities and Exchange Commission on Form N-Q. Shareholders can look up the fund’s Forms N-Q on the SEC’s website at www.sec.gov. Forms N-Q may also be reviewed and copied at the SEC’s Public Reference Room (see the back cover of this report for further information).
| Market | ||
| Value• | ||
| Shares | ($000) | |
| Investment Companies (100.0%) | ||
| U.S. Stock Fund (41.1%) | ||
| Vanguard Total Stock Market Index Fund Investor Shares | 48,206,098 | 1,257,697 |
| International Stock Funds (10.3%) | ||
| Vanguard European Stock Index Fund Investor Shares | 5,946,257 | 156,565 |
| Vanguard Pacific Stock Index Fund Investor Shares | 8,376,503 | 82,844 |
| Vanguard Emerging Markets Stock Index Fund Investor Shares | 3,188,612 | 77,260 |
| 316,669 | ||
| Bond Funds (48.6%) | ||
| 1 Vanguard Total Bond Market II Index Fund Investor Shares | 118,892,314 | 1,228,157 |
| Vanguard Inflation-Protected Securities Fund Investor Shares | 20,852,867 | 261,078 |
| 1,489,235 | ||
| Total Investment Companies (Cost $3,301,380) | 3,063,601 | |
| Other Assets and Liabilities (0.0%) | ||
| Other Assets | 45,998 | |
| Liabilities | (45,023) | |
| 975 | ||
| Net Assets (100%) | ||
| Applicable to 150,277,255 outstanding $.001 par value shares of | ||
| beneficial interest (unlimited authorization) | 3,064,576 | |
| Net Asset Value Per Share | $20.39 | |
| At September 30, 2009, net assets consisted of: | ||
| Amount | ||
| ($000) | ||
| Paid-in Capital | 3,299,139 | |
| Undistributed Net Investment Income | 45,631 | |
| Accumulated Net Realized Losses | (42,415) | |
| Unrealized Appreciation (Depreciation) | (237,779) | |
| Net Assets | 3,064,576 | |
• See Note A in Notes to Financial Statements.
1 Affiliated fund available only to Vanguard funds and certain trusts and accounts managed by Vanguard.
See accompanying Notes, which are an integral part of the Financial Statements.
33
| Target Retirement 2010 Fund | |
| Statement of Operations | |
| Year Ended | |
| September 30, 2009 | |
| ($000) | |
| Investment Income | |
| Income | |
| Income Distributions Received | 76,525 |
| Net Investment Income—Note B | 76,525 |
| Realized Net Gain (Loss) on Investment Securities Sold | (33,417) |
| Change in Unrealized Appreciation (Depreciation) of Investment Securities | 72,719 |
| Net Increase (Decrease) in Net Assets Resulting from Operations | 115,827 |
See accompanying Notes, which are an integral part of the Financial Statements.
34
| Target Retirement 2010 Fund | ||
| Statement of Changes in Net Assets | ||
| Year Ended September 30, | ||
| 2009 | 2008 | |
| ($000) | ($000) | |
| Increase (Decrease) in Net Assets | ||
| Operations | ||
| Net Investment Income | 76,525 | 72,341 |
| Realized Net Gain (Loss) | (33,417) | (9,018) |
| Change in Unrealized Appreciation (Depreciation) | 72,719 | (356,455) |
| Net Increase (Decrease) in Net Assets Resulting from Operations | 115,827 | (293,132) |
| Distributions | ||
| Net Investment Income | (84,814) | (36,684) |
| Realized Capital Gain | — | — |
| Total Distributions | (84,814) | (36,684) |
| Capital Share Transactions | ||
| Issued | 1,116,594 | 2,079,645 |
| Issued in Lieu of Cash Distributions | 84,413 | 36,584 |
| Redeemed | (734,153) | (517,140) |
| Net Increase (Decrease) from Capital Share Transactions | 466,854 | 1,599,089 |
| Total Increase (Decrease) | 497,867 | 1,269,273 |
| Net Assets | ||
| Beginning of Period | 2,566,709 | 1,297,436 |
| End of Period1 | 3,064,576 | 2,566,709 |
| 1 Net Assets—End of Period includes undistributed net investment income of $45,631,000 and $53,920,000. | ||
See accompanying Notes, which are an integral part of the Financial Statements.
35
| Target Retirement 2010 Fund | ||||
| Financial Highlights | ||||
| June 7, | ||||
| Year Ended | 20061 to | |||
| September 30, | Sept. 30, | |||
| For a Share Outstanding Throughout Each Period | 2009 | 2008 | 2007 | 2006 |
| Net Asset Value, Beginning of Period | $20.47 | $23.54 | $21.01 | $20.00 |
| Investment Operations | ||||
| Net Investment Income | .553 | .7442 | .7302 | .2302 |
| Capital Gain Distributions Received | — | — | — | — |
| Net Realized and Unrealized Gain (Loss) on Investments | .046 | (3.354) | 1.980 | .780 |
| Total from Investment Operations | .599 | (2.610) | 2.710 | 1.010 |
| Distributions | ||||
| Dividends from Net Investment Income | (.679) | (.460) | (.180) | — |
| Distributions from Realized Capital Gains | — | — | — | — |
| Total Distributions | (.679) | (.460) | (.180) | — |
| Net Asset Value, End of Period | $20.39 | $20.47 | $23.54 | $21.01 |
| Total Return3 | 3.47% | –11.30% | 12.96% | 5.05% |
| Ratios/Supplemental Data | ||||
| Net Assets, End of Period (Millions) | $3,065 | $2,567 | $1,297 | $75 |
| Ratio of Total Expenses to Average Net Assets | 0%4 | 0% | 0% | 0% |
| Ratio of Net Investment Income to Average Net Assets | 3.15% | 3.34% | 3.26% | 2.89%5 |
| Portfolio Turnover Rate | 41%6 | 18% | 4% | 4% |
1 Inception.
2 Calculated based on average shares outstanding.
3 Total returns do not include the account service fee that may be applicable to certain accounts with balances below $10,000. 4 The acquired fund fees and expenses were 0.21%.
5 Annualized.
6 Excludes the value of mutual fund shares delivered and received in connection with a change in the fund’s bond investments from the Vanguard Total Bond Market Index Fund to the Vanguard Total Bond Market II Index Fund because those transactions were effected in kind and did not cause the fund to incur transaction costs.
See accompanying Notes, which are an integral part of the Financial Statements.
36
Target Retirement 2010 Fund
Notes to Financial Statements
Vanguard Target Retirement 2010 Fund is registered under the Investment Company Act of 1940 as an open-end investment company, or mutual fund. The fund follows a balanced investment strategy by investing in selected Vanguard funds to achieve its targeted allocation of assets to U.S. stocks, international stocks, and bonds.
A. The following significant accounting policies conform to generally accepted accounting principles for U.S. mutual funds. The fund consistently follows such policies in preparing its financial statements.
1. Security Valuation: Investments are valued at the net asset value of each underlying Vanguard fund determined as of the close of the New York Stock Exchange (generally 4 p.m., Eastern time) on the valuation date.
2. Federal Income Taxes: The fund intends to continue to qualify as a regulated investment company and distribute all of its taxable income. Management has analyzed the fund’s tax positions taken for all open federal income tax years (September 30, 2006–2009), and has concluded that no provision for federal income tax is required in the fund’s financial statements.
3. Distributions: Distributions to shareholders are recorded on the ex-dividend date.
4. Other: Income and capital gain distributions received are recorded on the ex-dividend date. Security transactions are accounted for on the date securities are bought or sold. Costs used to determine realized gains (losses) on the sale of investment securities are those of the specific securities sold.
B. Under a service agreement, The Vanguard Group furnishes investment advisory, corporate management, administrative, marketing, and distribution services to the fund. The service agreement provides that the fund’s expenses may be reduced or eliminated to the extent of savings realized by the Vanguard funds by the operation of the fund. Accordingly, all incremental expenses for services provided by Vanguard and all other expenses incurred by the fund during the year ended September 30, 2009, were borne by the funds in which the fund invests. The fund’s trustees and officers are also directors and officers of Vanguard and the funds in which the fund invests.
C. Various inputs may be used to determine the value of the fund’s investments. These inputs are summarized in three broad levels for financial statement purposes. The inputs or methodologies used to value securities are not necessarily an indication of the risk associated with investing in those securities.
Level 1—Quoted prices in active markets for identical securities.
Level 2—Other significant observable inputs (including quoted prices for similar securities, interest rates, prepayment speeds, credit risk, etc.).
Level 3—Significant unobservable inputs (including the fund’s own assumptions used to determine the fair value of investments).
At September 30, 2009, 100% of the fund’s investments were valued based on Level 1 inputs.
D. Distributions are determined on a tax basis and may differ from net investment income and realized capital gains for financial reporting purposes. Differences may be permanent or temporary. Permanent differences are reclassified among capital accounts in the financial statements to reflect their tax character. Temporary differences arise when certain items of income, expense, gain, or loss are recognized in different periods for financial statement and tax purposes; these differences will reverse at some time in the future. Differences in classification may also result from the treatment of short-term gains as ordinary income for tax purposes.
37
Target Retirement 2010 Fund
For tax purposes, at September 30, 2009, the fund had $45,651,000 of ordinary income available for distribution. The fund had available capital loss carryforwards totaling $5,639,000 to offset future net capital gains through September 30, 2017. In addition, the fund realized losses of $26,057,000 during the period from November 1, 2008, through September 30, 2009, which are deferred and will be treated as realized for tax purposes in fiscal 2010.
At September 30, 2009, the cost of investment securities for tax purposes was $3,312,119,000. Net unrealized depreciation of investment securities for tax purposes was $248,518,000, consisting of unrealized gains of $43,031,000 on securities that had risen in value since their purchase and $291,549,000 in unrealized losses on securities that had fallen in value since their purchase.
E. During the year ended September 30, 2009, the fund purchased $2,362,559,000 of investment securities and sold $1,908,610,000 of investment securities, other than temporary cash investments.
| F. Capital shares issued and redeemed were: | ||
| Year Ended September 30, | ||
| 2009 | 2008 | |
| Shares | Shares | |
| (000) | (000) | |
| Issued | 61,637 | 92,025 |
| Issued in Lieu of Cash Distributions | 4,824 | 1,589 |
| Redeemed | (41,592) | (23,324) |
| Net Increase (Decrease) in Shares Outstanding | 24,869 | 70,290 |
G. In preparing the financial statements as of September 30, 2009, management considered the impact of subsequent events occurring through November 6, 2009, for potential recognition or disclosure in these financial statements.
38
Target Retirement 2015 Fund
Fund Profile
As of September 30, 2009
| Financial Attributes | |
| Yield1 | 2.2% |
| Acquired Fund Fees and Expenses2 | 0.18% |
| Volatility Measures3 | |
| Fund Versus | |
| Composite Index4 | |
| R-Squared | 1.00 |
| Beta | 1.00 |
| Allocation to Underlying Vanguard Funds | |
| Total Stock Market Index Fund | 48.7% |
| Total Bond Market II Index Fund | 39.0 |
| European Stock Index Fund | 6.1 |
| Pacific Stock Index Fund | 3.2 |
| Emerging Markets Stock Index Fund | 3.0 |
Fund Asset Allocation
Equity Investment Focus
Fixed Income Investment Focus
1 30-day SEC yield. See the Glossary.
2 This figure—drawn from the prospectus dated January 28, 2009—represents an estimate of the weighted average of the expense ratios and any transaction fees charged by the underlying mutual funds (the “acquired” funds) in which the Target Retirement 2015 Fund invests.
The Target Retirement 2015 Fund does not charge any expenses or fees of its own. For the fiscal year ended September 30, 2009, the annualized acquired fund fees and expenses was 0.21%.
3 For an explanation of R-squared, beta, and other items used here, see the Glossary.
4 Target 2015 Composite Index: Derived by applying the fund’s target asset allocation to the results of the following benchmarks: for international stocks of developed markets, the MSCI EAFE Index; for emerging markets stocks, the MSCI Emerging Markets Index; for bonds, the Barclays Capital U.S. Aggregate Bond Index; and for U.S. stocks, the MSCI US Broad Market Index. MSCI EAFE Index returns are adjusted for withholding taxes applicable to Luxembourg holding companies.
39
Target Retirement 2015 Fund
Performance Summary
All of the returns in this report represent past performance, which is not a guarantee of future results that may be achieved by the fund. (Current performance may be lower or higher than the performance data cited. For performance data current to the most recent month-end, visit our website at www.vanguard.com/performance.) Note, too, that both investment returns and principal value can fluctuate widely, so an investor’s shares, when sold, could be worth more or less than their original cost. The returns shown do not reflect taxes that a shareholder would pay on fund distributions or on the sale of fund shares.
Cumulative Performance: October 27, 2003–September 30, 2009
Initial Investment of $10,000
| Average Annual Total Returns | ||||
| Periods Ended September 30, 2009 | Final Value | |||
| Since | of a $10,000 | |||
| One Year | Five Years | Inception1 | Investment | |
| Target Retirement 2015 Fund2 | 2.66% | 3.49% | 4.28% | $12,822 |
| Dow Jones U.S. Total Stock Market Index | –5.83 | 1.93 | 3.33 | 12,141 |
| Target 2015 Composite Index3 | 2.32 | 3.40 | 4.21 | 12,771 |
| Target 2015 Composite Average4 | 2.28 | 2.53 | 3.30 | 12,119 |
1 Performance for the fund and its comparative standards is calculated since the fund’s inception: October 27, 2003.
2 Total returns do not include the account service fee that may be applicable to certain accounts with balances below $10,000.
3 Target 2015 Composite Index: Derived by applying the fund’s target asset allocation to the results of the following benchmarks: for international stocks of developed markets, the MSCI EAFE Index; for emerging markets stocks, the Select Emerging Markets Index from inception through August 23, 2006, and the MSCI Emerging Markets Index thereafter; for bonds, the Barclays Capital U.S. Aggregate Bond Index; and for U.S. stocks, the Dow Jones Wilshire 5000 Index from inception through April 22, 2005, and the MSCI US Broad Market Index thereafter. MSCI EAFE Index returns are adjusted for withholding taxes applicable to Luxembourg holding companies.
4 Target 2015 Composite Average: Derived by applying the fund’s target allocation to the following peer-group averages: the general equity funds average, fixed income funds average, international funds average, and emerging markets funds average. Derived from data provided by Lipper Inc.
Note: See Financial Highlights tables for dividend and capital gains information.
40
Target Retirement 2015 Fund
Fiscal-Year Total Returns (%): October 27, 2003–September 30, 2009
1 Target 2015 Composite Index: Derived by applying the fund’s target asset allocation to the results of the following benchmarks: for international stocks of developed markets, the MSCI EAFE Index; for emerging markets stocks, the Select Emerging Markets Index from inception through August 23, 2006, and the MSCI Emerging Markets Index thereafter; for bonds, the Barclays Capital U.S. Aggregate Bond Index; and for U.S. stocks, the Dow Jones Wilshire 5000 Index from inception through April 22, 2005, and the MSCI US Broad Market Index thereafter. MSCI EAFE Index returns are adjusted for withholding taxes applicable to Luxembourg holding companies.
Note: See Financial Highlights tables for dividend and capital gains information.
41
Target Retirement 2015 Fund
Financial Statements
Statement of Net Assets
As of September 30, 2009
The fund reports a complete list of its holdings in regulatory filings four times in each fiscal year, at the quarter-ends. For the second and fourth fiscal quarters, the lists appear in the fund’s semiannual and annual reports to shareholders. For the first and third fiscal quarters, the fund files the lists with the Securities and Exchange Commission on Form N-Q. Shareholders can look up the fund’s Forms N-Q on the SEC’s website at www.sec.gov. Forms N-Q may also be reviewed and copied at the SEC’s Public Reference Room (see the back cover of this report for further information).
| Market | ||
| Value• | ||
| Shares | ($000) | |
| Investment Companies (99.9%) | ||
| U.S. Stock Fund (48.7%) | ||
| Vanguard Total Stock Market Index Fund Investor Shares | 177,489,799 | 4,630,709 |
| International Stock Funds (12.3%) | ||
| Vanguard European Stock Index Fund Investor Shares | 21,893,729 | 576,462 |
| Vanguard Pacific Stock Index Fund Investor Shares | 30,580,055 | 302,437 |
| Vanguard Emerging Markets Stock Index Fund Investor Shares | 11,845,882 | 287,025 |
| 1,165,924 | ||
| Bond Fund (38.9%) | ||
| 1 Vanguard Total Bond Market II Index Fund Investor Shares | 358,448,782 | 3,702,776 |
| Total Investment Companies (Cost $9,932,480) | 9,499,409 | |
| Temporary Cash Investment (0.0%) | ||
| Money Market Fund (0.0%) | ||
| 1 Vanguard Market Liquidity Fund, 0.267%, (Cost $2,557) | 2,556,947 | 2,557 |
| Total Investments (99.9%) (Cost $9,935,037) | 9,501,966 | |
| Other Assets and Liabilities (0.1%) | ||
| Other Assets | 116,268 | |
| Liabilities | (110,742) | |
| 5,526 | ||
| Net Assets (100%) | ||
| Applicable to 848,353,078 outstanding $.001 par value shares of | ||
| beneficial interest (unlimited authorization) | 9,507,492 | |
| Net Asset Value Per Share | $11.21 | |
42
| Target Retirement 2015 Fund | |
| At September 30, 2009, net assets consisted of: | |
| Amount | |
| ($000) | |
| Paid-in Capital | 9,939,278 |
| Undistributed Net Investment Income | 145,382 |
| Accumulated Net Realized Losses | (144,097) |
| Unrealized Appreciation (Depreciation) | (433,071) |
| Net Assets | 9,507,492 |
• See Note A in Notes to Financial Statements.
1 Affiliated fund available only to Vanguard funds and certain trusts and accounts managed by Vanguard. Rate shown for Vanguard Market Liquidity Fund is the 7-day yield.
See accompanying Notes, which are an integral part of the Financial Statements.
43
| Target Retirement 2015 Fund | |
| Statement of Operations | |
| Year Ended | |
| September 30, 2009 | |
| ($000) | |
| Investment Income | |
| Income | |
| Income Distributions Received | 246,540 |
| Net Investment Income—Note B | 246,540 |
| Realized Net Gain (Loss) on Investment Securities Sold | (91,822) |
| Change in Unrealized Appreciation (Depreciation) of Investment Securities | 219,284 |
| Net Increase (Decrease) in Net Assets Resulting from Operations | 374,002 |
See accompanying Notes, which are an integral part of the Financial Statements.
44
| Target Retirement 2015 Fund | ||
| Statement of Changes in Net Assets | ||
| Year Ended September 30, | ||
| 2009 | 2008 | |
| ($000) | ($000) | |
| Increase (Decrease) in Net Assets | ||
| Operations | ||
| Net Investment Income | 246,540 | 228,895 |
| Realized Net Gain (Loss) | (91,822) | (35,964) |
| Change in Unrealized Appreciation (Depreciation) | 219,284 | (1,349,722) |
| Net Increase (Decrease) in Net Assets Resulting from Operations | 374,002 | (1,156,791) |
| Distributions | ||
| Net Investment Income | (258,747) | (181,936) |
| Realized Capital Gain | — | — |
| Total Distributions | (258,747) | (181,936) |
| Capital Share Transactions | ||
| Issued | 2,786,028 | 3,567,141 |
| Issued in Lieu of Cash Distributions | 257,600 | 181,232 |
| Redeemed | (1,454,916) | (1,224,652) |
| Net Increase (Decrease) from Capital Share Transactions | 1,588,712 | 2,523,721 |
| Total Increase (Decrease) | 1,703,967 | 1,184,994 |
| Net Assets | ||
| Beginning of Period | 7,803,525 | 6,618,531 |
| End of Period1 | 9,507,492 | 7,803,525 |
| 1 Net Assets—End of Period includes undistributed net investment income of $145,382,000 and $157,589,000. | ||
See accompanying Notes, which are an integral part of the Financial Statements.
45
| Target Retirement 2015 Fund | |||||
| Financial Highlights | |||||
| For a Share Outstanding | Year Ended September 30, | ||||
| Throughout Each Period | 2009 | 2008 | 2007 | 2006 | 2005 |
| Net Asset Value, Beginning of Period | $11.34 | $13.49 | $12.10 | $11.54 | $10.74 |
| Investment Operations | |||||
| Net Investment Income | .307 | .3801 | .3801 | .3561 | .3461 |
| Capital Gain Distributions Received | — | — | — | — | .0041 |
| Net Realized and Unrealized Gain (Loss) | |||||
| on Investments | (.072) | (2.190) | 1.320 | .466 | .652 |
| Total from Investment Operations | .235 | (1.810) | 1.700 | .822 | 1.002 |
| Distributions | |||||
| Dividends from Net Investment Income | (.365) | (.340) | (.310) | (.260) | (.200) |
| Distributions from Realized Capital Gains | — | — | — | (.002) | (.002) |
| Total Distributions | (.365) | (.340) | (.310) | (.262) | (.202) |
| Net Asset Value, End of Period | $11.21 | $11.34 | $13.49 | $12.10 | $11.54 |
| Total Return2 | 2.66% | –13.75% | 14.25% | 7.25% | 9.40% |
| Ratios/Supplemental Data | |||||
| Net Assets, End of Period (Millions) | $9,507 | $7,804 | $6,619 | $3,720 | $1,804 |
| Ratio of Total Expenses to | |||||
| Average Net Assets | 0%3 | 0% | 0% | 0% | 0% |
| Ratio of Net Investment Income to | |||||
| Average Net Assets | 3.31% | 3.02% | 2.93% | 3.04% | 3.11% |
| Portfolio Turnover Rate | 37%4 | 24% | 5% | 15% | 1% |
1 Calculated based on average shares outstanding.
2 Total returns do not include the account service fee that may be applicable to certain accounts with balances below $10,000. 3 The acquired fund fees and expenses were 0.21%.
4 Excludes the value of mutual fund shares delivered and received in connection with a change in the fund’s bond investments from the Vanguard Total Bond Market Index Fund to the Vanguard Total Bond Market II Index Fund because those transactions were effected in kind and did not cause the fund to incur transaction costs.
See accompanying Notes, which are an integral part of the Financial Statements.
46
Target Retirement 2015 Fund
Notes to Financial Statements
Vanguard Target Retirement 2015 Fund is registered under the Investment Company Act of 1940 as an open-end investment company, or mutual fund. The fund follows a balanced investment strategy by investing in selected Vanguard funds to achieve its targeted allocation of assets to U.S. stocks, international stocks, and bonds.
A. The following significant accounting policies conform to generally accepted accounting principles for U.S. mutual funds. The fund consistently follows such policies in preparing its financial statements.
1. Security Valuation: Investments are valued at the net asset value of each underlying Vanguard fund determined as of the close of the New York Stock Exchange (generally 4 p.m., Eastern time) on the valuation date.
2. Federal Income Taxes: The fund intends to continue to qualify as a regulated investment company and distribute all of its taxable income. Management has analyzed the fund’s tax positions taken for all open federal income tax years (September 30, 2006–2009), and has concluded that no provision for federal income tax is required in the fund’s financial statements.
3. Distributions: Distributions to shareholders are recorded on the ex-dividend date.
4. Other: Income and capital gain distributions received are recorded on the ex-dividend date. Security transactions are accounted for on the date securities are bought or sold. Costs used to determine realized gains (losses) on the sale of investment securities are those of the specific securities sold.
B. Under a service agreement, The Vanguard Group furnishes investment advisory, corporate management, administrative, marketing, and distribution services to the fund. The service agreement provides that the fund’s expenses may be reduced or eliminated to the extent of savings realized by the Vanguard funds by the operation of the fund. Accordingly, all incremental expenses for services provided by Vanguard and all other expenses incurred by the fund during the year ended September 30, 2009, were borne by the funds in which the fund invests. The fund’s trustees and officers are also directors and officers of Vanguard and the funds in which the fund invests.
C. Various inputs may be used to determine the value of the fund’s investments. These inputs are summarized in three broad levels for financial statement purposes. The inputs or methodologies used to value securities are not necessarily an indication of the risk associated with investing in those securities.
Level 1—Quoted prices in active markets for identical securities.
Level 2—Other significant observable inputs (including quoted prices for similar securities, interest rates, prepayment speeds, credit risk, etc.).
Level 3—Significant unobservable inputs (including the fund’s own assumptions used to determine the fair value of investments).
At September 30, 2009, 100% of the fund’s investments were valued based on Level 1 inputs.
D. Distributions are determined on a tax basis and may differ from net investment income and realized capital gains for financial reporting purposes. Differences may be permanent or temporary. Permanent differences are reclassified among capital accounts in the financial statements to reflect their tax character. Temporary differences arise when certain items of income, expense, gain, or loss are recognized in different periods for financial statement and tax purposes; these differences will reverse at some time in the future. Differences in classification may also result from the treatment of short-term gains as ordinary income for tax purposes.
47
Target Retirement 2015 Fund
For tax purposes, at September 30, 2009, the fund had $145,448,000 of ordinary income available for distribution. The fund had available capital loss carryforwards totaling $32,329,000 to offset future net capital gains of $15,574,000 through September 30, 2015, and $16,755,000 through September 30, 2017. In addition, the fund realized losses of $75,769,000 during the period from November 1, 2008, through September 30, 2009, which are deferred and will be treated as realized for tax purposes in fiscal 2010.
At September 30, 2009, the cost of investment securities for tax purposes was $9,971,102,000. Net unrealized depreciation of investment securities for tax purposes was $469,136,000, consisting of unrealized gains of $135,044,000 on securities that had risen in value since their purchase and $604,180,000 in unrealized losses on securities that had fallen in value since their purchase.
E. During the year ended September 30, 2009, the fund purchased $6,875,350,000 of investment securities and sold $5,314,994,000 of investment securities, other than temporary cash investments.
| F. Capital shares issued and redeemed were: | ||
| Year Ended September 30, | ||
| 2009 | 2008 | |
| Shares | Shares | |
| (000) | (000) | |
| Issued | 285,886 | 282,206 |
| Issued in Lieu of Cash Distributions | 27,202 | 13,888 |
| Redeemed | (152,578) | (98,726) |
| Net Increase (Decrease) in Shares Outstanding | 160,510 | 197,368 |
G. In preparing the financial statements as of September 30, 2009, management considered the impact of subsequent events occurring through November 6, 2009, for potential recognition or disclosure in these financial statements.
48
Target Retirement 2020 Fund
Fund Profile
As of September 30, 2009
| Financial Attributes | |
| Yield1 | 2.2% |
| Acquired Fund Fees and Expenses2 | 0.19% |
| Volatility Measures3 | |
| Fund Versus | |
| Composite Index4 | |
| R-Squared | 1.00 |
| Beta | 1.00 |
| Allocation to Underlying Vanguard Funds | |
| Total Stock Market Index Fund | 54.8% |
| Total Bond Market II Index Fund | 31.5 |
| European Stock Index Fund | 6.8 |
| Pacific Stock Index Fund | 3.5 |
| Emerging Markets Stock Index Fund | 3.4 |
Fund Asset Allocation
Equity Investment Focus
Fixed Income Investment Focus
1 30-day SEC yield. See the Glossary.
2 This figure—drawn from the prospectus dated January 28, 2009—represents an estimate of the weighted average of the expense ratios and any transaction fees charged by the underlying mutual funds (the “acquired” funds) in which the Target Retirement 2020 Fund invests.
The Target Retirement 2020 Fund does not charge any expenses or fees of its own. For the fiscal year ended September 30, 2009, the annualized acquired fund fees and expenses was 0.21%.
3 For an explanation of R-squared, beta, and other items used here, see the Glossary.
4 Target 2020 Composite Index: Derived by applying the fund’s target asset allocation to the results of the following benchmarks: for international stocks of developed markets, the MSCI EAFE Index; for emerging markets stocks, the MSCI Emerging Markets Index; for bonds, the Barclays Capital U.S. Aggregate Bond Index; and for U.S. stocks, the MSCI US Broad Market Index. MSCI EAFE Index returns are adjusted for withholding taxes applicable to Luxembourg holding companies.
49
Target Retirement 2020 Fund
Performance Summary
All of the returns in this report represent past performance, which is not a guarantee of future results that may be achieved by the fund. (Current performance may be lower or higher than the performance data cited. For performance data current to the most recent month-end, visit our website at www.vanguard.com/performance.) Note, too, that both investment returns and principal value can fluctuate widely, so an investor’s shares, when sold, could be worth more or less than their original cost. The returns shown do not reflect taxes that a shareholder would pay on fund distributions or on the sale of fund shares.
Cumulative Performance: June 7, 2006–September 30, 2009
Initial Investment of $10,000
| Average Annual Total Returns | Final Value | ||
| Periods Ended September 30, 2009 | of a $10,000 | ||
| One Year | Since Inception1 | Investment | |
| Target Retirement 2020 Fund2 | 1.44% | 1.26% | $10,424 |
| Dow Jones U.S. Total Stock Market Index | –5.83 | –2.51 | 9,193 |
| Target 2020 Composite Index3 | 1.17 | 1.12 | 10,377 |
| Target 2020 Composite Average4 | 1.27 | –0.13 | 9,957 |
1 Performance for the fund and its comparative standards is calculated since the fund’s inception: June 7, 2006.
2 Total returns do not include the account service fee that may be applicable to certain accounts with balances below $10,000.
3 Target 2020 Composite Index: Derived by applying the fund’s target asset allocation to the results of the following benchmarks: for international stocks of developed markets, the MSCI EAFE Index; for emerging markets stocks, the Select Emerging Markets Index from inception through August 23, 2006, and the MSCI Emerging Markets Index thereafter; for bonds, the Barclays Capital U.S. Aggregate Bond Index; and for U.S. stocks, the MSCI US Broad Market Index. MSCI EAFE Index returns are adjusted for withholding taxes applicable to Luxembourg holding companies.
4 Target 2020 Composite Average: Derived by applying the fund’s target allocation to the following peer-group averages: the general equity funds average, fixed income funds average, international funds average, and emerging markets funds average. Derived from data provided by Lipper Inc.
Note: See Financial Highlights tables for dividend and capital gains information.
50
Target Retirement 2020 Fund
Fiscal-Year Total Returns (%): June 7, 2006–September 30, 2009
1 Target 2020 Composite Index: Derived by applying the fund’s target asset allocation to the results of the following benchmarks: for international stocks of developed markets, the MSCI EAFE Index; for emerging markets stocks, the Select Emerging Markets Index from inception through August 23, 2006, and the MSCI Emerging Markets Index thereafter; for bonds, the Barclays Capital U.S.
Aggregate Bond Index; and for U.S. stocks, the MSCI US Broad Market Index. MSCI EAFE Index returns are adjusted for withholding taxes applicable to Luxembourg holding companies.
Note: See Financial Highlights tables for dividend and capital gains information.
51
Target Retirement 2020 Fund
Financial Statements
Statement of Net Assets
As of September 30, 2009
The fund reports a complete list of its holdings in regulatory filings four times in each fiscal year, at the quarter-ends. For the second and fourth fiscal quarters, the lists appear in the fund’s semiannual and annual reports to shareholders. For the first and third fiscal quarters, the fund files the lists with the Securities and Exchange Commission on Form N-Q. Shareholders can look up the fund’s Forms N-Q on the SEC’s website at www.sec.gov. Forms N-Q may also be reviewed and copied at the SEC’s Public Reference Room (see the back cover of this report for further information).
| Market | ||
| Value• | ||
| Shares | ($000) | |
| Investment Companies (99.9%) | ||
| U.S. Stock Fund (54.7%) | ||
| Vanguard Total Stock Market Index Fund Investor Shares | 119,613,174 | 3,120,708 |
| International Stock Funds (13.8%) | ||
| Vanguard European Stock Index Fund Investor Shares | 14,753,475 | 388,459 |
| Vanguard Pacific Stock Index Fund Investor Shares | 20,457,261 | 202,322 |
| Vanguard Emerging Markets Stock Index Fund Investor Shares | 8,041,861 | 194,854 |
| 785,635 | ||
| Bond Fund (31.4%) | ||
| 1 Vanguard Total Bond Market II Index Fund Investor Shares | 173,638,621 | 1,793,687 |
| Total Investment Companies (Cost $6,104,560) | 5,700,030 | |
| Temporary Cash Investment (0.0%) | ||
| Money Market Fund (0.0%) | ||
| 1 Vanguard Market Liquidity Fund, 0.267% (Cost $1,241) | 1,240,953 | 1,241 |
| Total Investments (99.9%) (Cost $6,105,801) | 5,701,271 | |
| Other Assets and Liabilities (0.1%) | ||
| Other Assets | 142,076 | |
| Liabilities | (137,636) | |
| 4,440 | ||
| Net Assets (100%) | ||
| Applicable to 290,239,910 outstanding $.001 par value shares of | ||
| beneficial interest (unlimited authorization) | 5,705,711 | |
| Net Asset Value Per Share | $19.66 | |
52
| Target Retirement 2020 Fund | |
| At September 30, 2009, net assets consisted of: | |
| Amount | |
| ($000) | |
| Paid-in Capital | 6,065,216 |
| Undistributed Net Investment Income | 76,586 |
| Accumulated Net Realized Losses | (31,561) |
| Unrealized Appreciation (Depreciation) | (404,530) |
| Net Assets | 5,705,711 |
• See Note A in Notes to Financial Statements.
1 Affiliated fund available only to Vanguard funds and certain trusts and accounts managed by Vanguard. Rate shown for Vanguard Market Liquidity Fund is the 7-day yield.
See accompanying Notes, which are an integral part of the Financial Statements.
53
| Target Retirement 2020 Fund | |
| Statement of Operations | |
| Year Ended | |
| September 30, 2009 | |
| ($000) | |
| Investment Income | |
| Income | |
| Income Distributions Received | 129,443 |
| Net Investment Income—Note B | 129,443 |
| Realized Net Gain (Loss) on Investment Securities Sold | (22,122) |
| Change in Unrealized Appreciation (Depreciation) of Investment Securities | 168,763 |
| Net Increase (Decrease) in Net Assets Resulting from Operations | 276,084 |
See accompanying Notes, which are an integral part of the Financial Statements.
54
| Target Retirement 2020 Fund | ||
| Statement of Changes in Net Assets | ||
| Year Ended September 30, | ||
| 2009 | 2008 | |
| ($000) | ($000) | |
| Increase (Decrease) in Net Assets | ||
| Operations | ||
| Net Investment Income | 129,443 | 84,945 |
| Realized Net Gain (Loss) | (22,122) | (9,462) |
| Change in Unrealized Appreciation (Depreciation) | 168,763 | (655,255) |
| Net Increase (Decrease) in Net Assets Resulting from Operations | 276,084 | (579,772) |
| Distributions | ||
| Net Investment Income | (114,758) | (42,617) |
| Realized Capital Gain | — | — |
| Total Distributions | (114,758) | (42,617) |
| Capital Share Transactions | ||
| Issued | 2,336,391 | 3,161,786 |
| Issued in Lieu of Cash Distributions | 114,502 | 42,557 |
| Redeemed | (765,505) | (441,547) |
| Net Increase (Decrease) from Capital Share Transactions | 1,685,388 | 2,762,796 |
| Total Increase (Decrease) | 1,846,714 | 2,140,407 |
| Net Assets | ||
| Beginning of Period | 3,858,997 | 1,718,590 |
| End of Period1 | 5,705,711 | 3,858,997 |
| 1 Net Assets—End of Period includes undistributed net investment income of $76,586,000 and $61,901,000. | ||
See accompanying Notes, which are an integral part of the Financial Statements.
55
| Target Retirement 2020 Fund | ||||
| Financial Highlights | ||||
| June 7, | ||||
| Year Ended | 20061 to | |||
| September 30, | Sept. 30, | |||
| For a Share Outstanding Throughout Each Period | 2009 | 2008 | 2007 | 2006 |
| Net Asset Value, Beginning of Period | $20.03 | $24.15 | $21.14 | $20.00 |
| Investment Operations | ||||
| Net Investment Income | .5392 | .6192 | .6002 | .1902 |
| Capital Gain Distributions Received | — | — | — | — |
| Net Realized and Unrealized Gain (Loss) on Investments | (.360) | (4.329) | 2.600 | .950 |
| Total from Investment Operations | .179 | (3.710) | 3.200 | 1.140 |
| Distributions | ||||
| Dividends from Net Investment Income | (.549) | (.410) | (.190) | — |
| Distributions from Realized Capital Gains | — | — | — | — |
| Total Distributions | (.549) | (.410) | (.190) | — |
| Net Asset Value, End of Period | $19.66 | $20.03 | $24.15 | $21.14 |
| Total Return3 | 1.44% | –15.61% | 15.21% | 5.70% |
| Ratios/Supplemental Data | ||||
| Net Assets, End of Period (Millions) | $5,706 | $3,859 | $1,719 | $117 |
| Ratio of Total Expenses to Average Net Assets | 0%4 | 0% | 0% | 0% |
| Ratio of Net Investment Income to Average Net Assets | 3.19% | 2.79% | 2.61% | 2.24%5 |
| Portfolio Turnover Rate | 27%6 | 15% | 4% | 2% |
1 Inception.
2 Calculated based on average shares outstanding.
3 Total returns do not include the account service fee that may be applicable to certain accounts with balances below $10,000. 4 The acquired fund fees and expenses were 0.21%.
5 Annualized.
6 Excludes the value of mutual fund shares delivered and received in connection with a change in the fund’s bond investments from the Vanguard Total Bond Market Index Fund to the Vanguard Total Bond Market II Index Fund because those transactions were effected in kind and did not cause the fund to incur transaction costs.
See accompanying Notes, which are an integral part of the Financial Statements.
56
Target Retirement 2020 Fund
Notes to Financial Statements
Vanguard Target Retirement 2020 Fund is registered under the Investment Company Act of 1940 as an open-end investment company, or mutual fund. The fund follows a balanced investment strategy by investing in selected Vanguard funds to achieve its targeted allocation of assets to U.S. stocks, international stocks, and bonds.
A. The following significant accounting policies conform to generally accepted accounting principles for U.S. mutual funds. The fund consistently follows such policies in preparing its financial statements.
1. Security Valuation: Investments are valued at the net asset value of each underlying Vanguard fund determined as of the close of the New York Stock Exchange (generally 4 p.m., Eastern time) on the valuation date.
2. Federal Income Taxes: The fund intends to continue to qualify as a regulated investment company and distribute all of its taxable income. Management has analyzed the fund’s tax positions taken for all open federal income tax years (September 30, 2006–2009), and has concluded that no provision for federal income tax is required in the fund’s financial statements.
3. Distributions: Distributions to shareholders are recorded on the ex-dividend date.
4. Other: Income and capital gain distributions received are recorded on the ex-dividend date. Security transactions are accounted for on the date securities are bought or sold. Costs used to determine realized gains (losses) on the sale of investment securities are those of the specific securities sold.
B. Under a service agreement, The Vanguard Group furnishes investment advisory, corporate management, administrative, marketing, and distribution services to the fund. The service agreement provides that the fund’s expenses may be reduced or eliminated to the extent of savings realized by the Vanguard funds by the operation of the fund. Accordingly, all incremental expenses for services provided by Vanguard and all other expenses incurred by the fund during the year ended September 30, 2009, were borne by the funds in which the fund invests. The fund’s trustees and officers are also directors and officers of Vanguard and the funds in which the fund invests.
C. Various inputs may be used to determine the value of the fund’s investments. These inputs are summarized in three broad levels for financial statement purposes. The inputs or methodologies used to value securities are not necessarily an indication of the risk associated with investing in those securities.
Level 1—Quoted prices in active markets for identical securities.
Level 2—Other significant observable inputs (including quoted prices for similar securities, interest rates, prepayment speeds, credit risk, etc.).
Level 3—Significant unobservable inputs (including the fund’s own assumptions used to determine the fair value of investments).
At September 30, 2009, 100% of the fund’s investments were valued based on Level 1 inputs.
D. Distributions are determined on a tax basis and may differ from net investment income and realized capital gains for financial reporting purposes. Differences may be permanent or temporary. Permanent differences are reclassified among capital accounts in the financial statements to reflect their tax character. Temporary differences arise when certain items of income, expense, gain, or loss are recognized in different periods for financial statement and tax purposes; these differences will reverse at some time in the future. Differences in classification may also result from the treatment of short-term gains as ordinary income for tax purposes.
57
Target Retirement 2020 Fund
For tax purposes, at September 30, 2009, the fund had $76,609,000 of ordinary income available for distribution. The fund had available capital loss carryforwards totaling $6,167,000 to offset future net capital gains through September 30, 2017. In addition, the fund realized losses of $21,264,000 during the period from November 1, 2008, through September 30, 2009, which are deferred and will be treated as realized for tax purposes in fiscal 2010.
At September 30, 2009, the cost of investment securities for tax purposes was $6,109,954,000. Net unrealized depreciation of investment securities for tax purposes was $408,683,000, consisting of unrealized gains of $52,783,000 on securities that had risen in value since their purchase and $461,466,000 in unrealized losses on securities that had fallen in value since their purchase.
E. During the year ended September 30, 2009, the fund purchased $3,885,496,000 of investment securities and sold $2,191,951,000 of investment securities, other than temporary cash investments.
| F. Capital shares issued and redeemed were: | ||
| Year Ended September 30, | ||
| 2009 | 2008 | |
| Shares | Shares | |
| (000) | (000) | |
| Issued | 136,945 | 139,639 |
| Issued in Lieu of Cash Distributions | 6,978 | 1,813 |
| Redeemed | (46,344) | (19,939) |
| Net Increase (Decrease) in Shares Outstanding | 97,579 | 121,513 |
G. In preparing the financial statements as of September 30, 2009, management considered the impact of subsequent events occurring through November 6, 2009, for potential recognition or disclosure in these financial statements.
58
Target Retirement 2025 Fund
Fund Profile
As of September 30, 2009
| Financial Attributes | |
| Yield1 | 2.2% |
| Acquired Fund Fees and Expenses2 | 0.18% |
| Volatility Measures3 | |
| Fund Versus | |
| Composite Index4 | |
| R-Squared | 1.00 |
| Beta | 1.01 |
| Allocation to Underlying Vanguard Funds | |
| Total Stock Market Index Fund | 60.7% |
| Total Bond Market II Index Fund | 24.0 |
| European Stock Index Fund | 7.6 |
| Pacific Stock Index Fund | 3.9 |
| Emerging Markets Stock Index Fund | 3.8 |
Fund Asset Allocation
Equity Investment Focus
Fixed Income Investment Focus
1 30-day SEC yield. See the Glossary.
2 This figure—drawn from the prospectus dated January 28, 2009—represents an estimate of the weighted average of the expense ratios and any transaction fees charged by the underlying mutual funds (the “acquired” funds) in which the Target Retirement 2025 Fund invests.
The Target Retirement 2025 Fund does not charge any expenses or fees of its own. For the fiscal year ended September 30, 2009, the annualized acquired fund fees and expenses was 0.21%.
3 For an explanation of R-squared, beta, and other items used here, see the Glossary.
4 Target 2025 Composite Index: Derived by applying the fund’s target asset allocation to the results of the following benchmarks: for international stocks of developed markets, the MSCI EAFE Index; for emerging markets stocks, the MSCI Emerging Markets Index; for bonds, the Barclays Capital U.S. Aggregate Bond Index; and for U.S. stocks, the MSCI US Broad Market Index. MSCI EAFE Index returns are adjusted for withholding taxes applicable to Luxembourg holding companies.
59
Target Retirement 2025 Fund
Performance Summary
All of the returns in this report represent past performance, which is not a guarantee of future results that may be achieved by the fund. (Current performance may be lower or higher than the performance data cited. For performance data current to the most recent month-end, visit our website at www.vanguard.com/performance.) Note, too, that both investment returns and principal value can fluctuate widely, so an investor’s shares, when sold, could be worth more or less than their original cost. The returns shown do not reflect taxes that a shareholder would pay on fund distributions or on the sale of fund shares.
Cumulative Performance: October 27, 2003–September 30, 2009
Initial Investment of $10,000
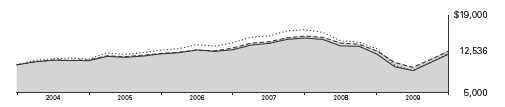
| Average Annual Total Returns | ||||
| Periods Ended September 30, 2009 | Final Value | |||
| Since | of a $10,000 | |||
| One Year | Five Years | Inception1 | Investment | |
| Target Retirement 2025 Fund2 | 0.10% | 2.87% | 3.89% | $12,536 |
| Dow Jones U.S. Total Stock Market Index | –5.83 | 1.93 | 3.33 | 12,141 |
| Target 2025 Composite Index3 | –0.04 | 2.83 | 3.83 | 12,497 |
| Target 2025 Composite Average4 | 0.19 | 2.15 | 3.06 | 11,955 |
1 Performance for the fund and its comparative standards is calculated since the fund’s inception: October 27, 2003.
2 Total returns do not include the account service fee that may be applicable to certain accounts with balances below $10,000.
3 Target 2025 Composite Index: Derived by applying the fund’s target asset allocation to the results of the following benchmarks: for international stocks of developed markets, the MSCI EAFE Index; for emerging markets stocks, the Select Emerging Markets Index from inception through August 23, 2006, and the MSCI Emerging Markets Index thereafter; for bonds, the Barclays Capital U.S.
Aggregate Bond Index; and for U.S. stocks, the Dow Jones Wilshire 5000 Index from inception through April 22, 2005, and the MSCI US Broad Market Index thereafter. MSCI EAFE Index returns are adjusted for withholding taxes applicable to Luxembourg holding companies.
4 Target 2025 Composite Average: Derived by applying the fund’s target allocation to the following peer-group averages: the general equity funds average, fixed income funds average, international funds average, and emerging markets funds averge. Derived from data provided by Lipper Inc.
Note: See Financial Highlights tables for dividend and capital gains information.
60
Target Retirement 2025 Fund
Fiscal-Year Total Returns (%): October 27, 2003–September 30, 2009
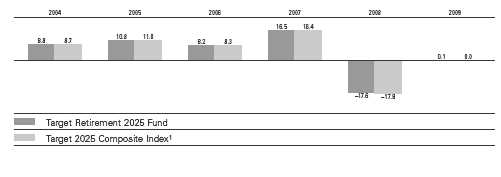
1 Target 2025 Composite Index: Derived by applying the fund’s target asset allocation to the results of the following benchmarks: for international stocks of developed markets, the MSCI EAFE Index; for emerging markets stocks, the Select Emerging Markets Index from inception through August 23, 2006, and the MSCI Emerging Markets Index thereafter; for bonds, the Barclays Capital U.S. Aggregate Bond Index; and for U.S. stocks, the Dow Jones Wilshire 5000 Index from inception through April 22, 2005, and the MSCI US Broad Market Index thereafter. MSCI EAFE Index returns are adjusted for withholding taxes applicable to Luxembourg holding companies.
Note: See Financial Highlights tables for dividend and capital gains information.
61
Target Retirement 2025 Fund
Financial Statements
Statement of Net Assets
As of September 30, 2009
The fund reports a complete list of its holdings in regulatory filings four times in each fiscal year, at the quarter-ends. For the second and fourth fiscal quarters, the lists appear in the fund’s semiannual and annual reports to shareholders. For the first and third fiscal quarters, the fund files the lists with the Securities and Exchange Commission on Form N-Q. Shareholders can look up the fund’s Forms N-Q on the SEC’s website at www.sec.gov. Forms N-Q may also be reviewed and copied at the SEC’s Public Reference Room (see the back cover of this report for further information).
| Market | ||
| Value• | ||
| Shares | ($000) | |
| Investment Companies (99.9%) | ||
| U.S. Stock Fund (60.7%) | ||
| Vanguard Total Stock Market Index Fund Investor Shares | 231,068,304 | 6,028,572 |
| International Stock Funds (15.3%) | ||
| Vanguard European Stock Index Fund Investor Shares | 28,502,622 | 750,474 |
| Vanguard Pacific Stock Index Fund Investor Shares | 39,523,509 | 390,887 |
| Vanguard Emerging Markets Stock Index Fund Investor Shares | 15,534,524 | 376,402 |
| 1,517,763 | ||
| Bond Fund (23.9%) | ||
| 1 Vanguard Total Bond Market II Index Fund Investor Shares | 230,118,828 | 2,377,128 |
| Total Investment Companies (Cost $10,557,459) | 9,923,463 | |
| Temporary Cash Investment (0.0%) | ||
| Money Market Fund (0.0%) | ||
| 1 Vanguard Market Liquidity Fund, 0.267% (Cost $1,517) | 1,516,922 | 1,517 |
| Total Investments (99.9%) (Cost $10,558,976) | 9,924,980 | |
| Other Assets and Liabilities (0.1%) | ||
| Other Assets | 132,038 | |
| Liabilities | (125,406) | |
| 6,632 | ||
| Net Assets (100%) | ||
| Applicable to 893,804,193 outstanding $.001 par value shares of | ||
| beneficial interest (unlimited authorization) | 9,931,612 | |
| Net Asset Value Per Share | $11.11 | |
62
| Target Retirement 2025 Fund | |
| At September 30, 2009, net assets consisted of: | |
| Amount | |
| ($000) | |
| Paid-in Capital | 10,526,267 |
| Undistributed Net Investment Income | 127,848 |
| Accumulated Net Realized Losses | (88,507) |
| Unrealized Appreciation (Depreciation) | (633,996) |
| Net Assets | 9,931,612 |
• See Note A in Notes to Financial Statements.
1 Affiliated fund available only to Vanguard funds and certain trusts and accounts managed by Vanguard. Rate shown for Vanguard Market Liquidity Fund is the 7-day yield.
See accompanying Notes, which are an integral part of the Financial Statements.
63
| Target Retirement 2025 Fund | |
| Statement of Operations | |
| Year Ended | |
| September 30, 2009 | |
| ($000) | |
| Investment Income | |
| Income | |
| Income Distributions Received | 229,825 |
| Net Investment Income—Note B | 229,825 |
| Realized Net Gain (Loss) on Investment Securities Sold | (38,499) |
| Change in Unrealized Appreciation (Depreciation) of Investment Securities | 128,992 |
| Net Increase (Decrease) in Net Assets Resulting from Operations | 320,318 |
See accompanying Notes, which are an integral part of the Financial Statements.
64
| Target Retirement 2025 Fund | ||
| Statement of Changes in Net Assets�� | ||
| Year Ended September 30, | ||
| 2009 | 2008 | |
| ($000) | ($000) | |
| Increase (Decrease) in Net Assets | ||
| Operations | ||
| Net Investment Income | 229,825 | 197,015 |
| Realized Net Gain (Loss) | (38,499) | (21,723) |
| Change in Unrealized Appreciation (Depreciation) | 128,992 | (1,673,419) |
| Net Increase (Decrease) in Net Assets Resulting from Operations | 320,318 | (1,498,127) |
| Distributions | ||
| Net Investment Income | (228,472) | (159,322) |
| Realized Capital Gain | — | — |
| Total Distributions | (228,472) | (159,322) |
| Capital Share Transactions | ||
| Issued | 2,825,666 | 3,447,494 |
| Issued in Lieu of Cash Distributions | 227,487 | 158,878 |
| Redeemed | (982,865) | (900,232) |
| Net Increase (Decrease) from Capital Share Transactions | 2,070,288 | 2,706,140 |
| Total Increase (Decrease) | 2,162,134 | 1,048,691 |
| Net Assets | ||
| Beginning of Period | 7,769,478 | 6,720,787 |
| End of Period1 | 9,931,612 | 7,769,478 |
| 1 Net Assets—End of Period includes undistributed net investment income of $127,848,000 and $126,495,000. | ||
See accompanying Notes, which are an integral part of the Financial Statements.
65
| Target Retirement 2025 Fund | |||||
| Financial Highlights | |||||
| For a Share Outstanding | Year Ended September 30, | ||||
| Throughout Each Period | 2009 | 2008 | 2007 | 2006 | 2005 |
| Net Asset Value, Beginning of Period | $11.49 | $14.26 | $12.51 | $11.80 | $10.82 |
| Investment Operations | |||||
| Net Investment Income | .279 | .307 | .300 | .3211 | .3201 |
| Capital Gain Distributions Received | — | — | — | — | .0031 |
| Net Realized and Unrealized Gain (Loss) | |||||
| on Investments | (.336) | (2.767) | 1.740 | .630 | .839 |
| Total from Investment Operations | (.057) | (2.460) | 2.040 | .951 | 1.162 |
| Distributions | |||||
| Dividends from Net Investment Income | (.323) | (.310) | (.290) | (.240) | (.180) |
| Distributions from Realized Capital Gains | — | — | — | (.001) | (.002) |
| Total Distributions | (.323) | (.310) | (.290) | (.241) | (.182) |
| Net Asset Value, End of Period | $11.11 | $11.49 | $14.26 | $12.51 | $11.80 |
| Total Return2 | 0.10% | –17.61% | 16.51% | 8.18% | 10.80% |
| Ratios/Supplemental Data | |||||
| Net Assets, End of Period (Millions) | $9,932 | $7,769 | $6,721 | $3,957 | $1,968 |
| Ratio of Total Expenses to | |||||
| Average Net Assets | 0%3 | 0% | 0% | 0% | 0% |
| Ratio of Net Investment Income to | |||||
| Average Net Assets | 3.09% | 2.59% | 2.43% | 2.66% | 2.84% |
| Portfolio Turnover Rate | 21%4 | 17% | 4% | 22% | 2% |
1 Calculated based on average shares outstanding.
2 Total returns do not include the account service fee that may be applicable to certain accounts with balances below $10,000. 3 The acquired fund fees and expenses were 0.21%.
4 Excludes the value of mutual fund shares delivered and received in connection with a change in the fund’s bond investments from the Vanguard Total Bond Market Index Fund to the Vanguard Total Bond Market II Index Fund because those transactions were effected in kind and did not cause the fund to incur transaction costs.
See accompanying Notes, which are an integral part of the Financial Statements.
66
Target Retirement 2025 Fund
Notes to Financial Statements
Vanguard Target Retirement 2025 Fund is registered under the Investment Company Act of 1940 as an open-end investment company, or mutual fund. The fund follows a balanced investment strategy by investing in selected Vanguard funds to achieve its targeted allocation of assets to U.S. stocks, international stocks, and bonds.
A. The following significant accounting policies conform to generally accepted accounting principles for U.S. mutual funds. The fund consistently follows such policies in preparing its financial statements.
1. Security Valuation: Investments are valued at the net asset value of each underlying Vanguard fund determined as of the close of the New York Stock Exchange (generally 4 p.m., Eastern time) on the valuation date.
2. Federal Income Taxes: The fund intends to continue to qualify as a regulated investment company and distribute all of its taxable income. Management has analyzed the fund’s tax positions taken for all open federal income tax years (September 30, 2006–2009), and has concluded that no provision for federal income tax is required in the fund’s financial statements.
3. Distributions: Distributions to shareholders are recorded on the ex-dividend date.
4. Other: Income and capital gain distributions received are recorded on the ex-dividend date. Security transactions are accounted for on the date securities are bought or sold. Costs used to determine realized gains (losses) on the sale of investment securities are those of the specific securities sold.
B. Under a service agreement, The Vanguard Group furnishes investment advisory, corporate management, administrative, marketing, and distribution services to the fund. The service agreement provides that the fund’s expenses may be reduced or eliminated to the extent of savings realized by the Vanguard funds by the operation of the fund. Accordingly, all incremental expenses for services provided by Vanguard and all other expenses incurred by the fund during the year ended September 30, 2009, were borne by the funds in which the fund invests. The fund’s trustees and officers are also directors and officers of Vanguard and the funds in which the fund invests.
C. Various inputs may be used to determine the value of the fund’s investments. These inputs are summarized in three broad levels for financial statement purposes. The inputs or methodologies used to value securities are not necessarily an indication of the risk associated with investing in those securities.
Level 1—Quoted prices in active markets for identical securities.
Level 2—Other significant observable inputs (including quoted prices for similar securities, interest rates, prepayment speeds, credit risk, etc.).
Level 3—Significant unobservable inputs (including the fund’s own assumptions used to determine the fair value of investments).
At September 30, 2009, 100% of the fund’s investments were valued based on Level 1 inputs.
D. Distributions are determined on a tax basis and may differ from net investment income and realized capital gains for financial reporting purposes. Differences may be permanent or temporary. Permanent differences are reclassified among capital accounts in the financial statements to reflect their tax character. Temporary differences arise when certain items of income, expense, gain, or loss are recognized in different periods for financial statement and tax purposes; these differences will reverse at some time in the future. Differences in classification may also result from the treatment of short-term gains as ordinary income for tax purposes.
67
Target Retirement 2025 Fund
For tax purposes, at September 30, 2009, the fund had $127,910,000 of ordinary income available for distribution. The fund had available capital loss carryforwards totaling $44,727,000 to offset future net capital gains of $27,716,000 through September 30, 2015, and $17,011,000 through September 30, 2017. In addition, the fund realized losses of $37,395,000 during the period from November 1, 2008, through September 30, 2009, which are deferred and will be treated as realized for tax purposes in fiscal 2010.
At September 30, 2009, the cost of investment securities for tax purposes was $10,565,422,000. Net unrealized depreciation of investment securities for tax purposes was $640,442,000, consisting of unrealized gains of $97,461,000 on securities that had risen in value since their purchase and $737,903,000 in unrealized losses on securities that had fallen in value since their purchase.
E. During the year ended September 30, 2009, the fund purchased $5,113,708,000 of investment securities and sold $3,052,809,000 of investment securities, other than temporary cash investments.
| F. Capital shares issued and redeemed were: | ||
| Year Ended September 30, | ||
| 2009 | 2008 | |
| Shares | Shares | |
| (000) | (000) | |
| Issued | 298,327 | 262,709 |
| Issued in Lieu of Cash Distributions | 24,835 | 11,563 |
| Redeemed | (105,351) | (69,696) |
| Net Increase (Decrease) in Shares Outstanding | 217,811 | 204,576 |
G. In preparing the financial statements as of September 30, 2009, management considered the impact of subsequent events occurring through November 6, 2009, for potential recognition or disclosure in these financial statements.
68
Report of Independent Registered Public Accounting Firm
To the Trustees of Vanguard Chester Funds and the Shareholders of Vanguard Target Retirement Income Fund, Vanguard Target Retirement 2005 Fund, Vanguard Target Retirement 2010 Fund, Vanguard Target Retirement 2015 Fund, Vanguard Target Retirement 2020 Fund and Vanguard Target Retirement 2025 Fund:
In our opinion, the accompanying statements of net assets and the related statements of operations and of changes in net assets and the financial highlights present fairly, in all material respects, the financial position of Vanguard Target Retirement Income Fund, Vanguard Target Retirement 2005 Fund, Vanguard Target Retirement 2010 Fund, Vanguard Target Retirement 2015 Fund, Vanguard Target Retirement 2020 Fund and Vanguard Target Retirement 2025 Fund (the “Funds”) at September 30, 2009, the results of each of their operations for the year then ended, the changes in each of their net assets for each of the two years in the period then ended and the financial highlights for each of the periods indicated, in conformity with accounting principles generally accepted in the United States of America. These financial statements and financial highlights (hereafter referred to as “financial statements”) are the responsibility of the Funds’ management; our responsibility is to express an opinion on these financial statements based on our audits. We conducted our audits of these financial statements in accordance with the standards of the Public Company Accounting Oversight Board (United States). Those standards require that we plan and perform the audit to obtain reasonable assurance about whether the financial statements are free of material misstatement. An audit includes examining, on a test basis, evidence supporting the amounts and disclosures in the financial statements, assessing the accounting principles used and significant estimates made by management, and evaluating the overall financial statement presentation. We believe that our audits, which included confirmation of securities at September 30, 2009 by agreement to the underlying ownership records of the Vanguard funds, provide a reasonable basis for our opinion.
PricewaterhouseCoopers LLP
Philadelphia, Pennsylvania
November 6, 2009
69
| Special 2009 tax information (unaudited) for Vanguard Target Retirement Funds |
This information for the fiscal period ended September 30, 2009, is included pursuant to provisions of the Internal Revenue Code.
The funds distributed qualified dividend income to shareholders during the fiscal year as follows:
| Qualified Dividend Income | |
| Fund | ($000) |
| Target Retirement Income Fund | 9,790 |
| Target Retirement 2005 Fund | 16,786 |
| Target Retirement 2010 Fund | 30,813 |
| Target Retirement 2015 Fund | 114,547 |
| Target Retirement 2020 Fund | 60,811 |
| Target Retirement 2025 Fund | 137,792 |
For corporate shareholders, the percentage of investment income (dividend income plus short-term gains, if any) that qualifies for the dividends-received deduction is as follows:
| Fund | Percentage |
| Target Retirement Income Fund | 19.0% |
| Target Retirement 2005 Fund | 23.3 |
| Target Retirement 2010 Fund | 29.2 |
| Target Retirement 2015 Fund | 32.8 |
| Target Retirement 2020 Fund | 38.5 |
| Target Retirement 2025 Fund | 43.6 |
70
Your Fund’s After-Tax Returns
This table presents returns for your fund both before and after taxes. The after-tax returns are shown in two ways: (1) assuming that an investor owned the fund during the entire period and paid taxes on the fund’s distributions, and (2) assuming that an investor paid taxes on the fund’s distributions and sold all shares at the end of each period.
Calculations are based on the highest individual federal income tax and capital gains tax rates in effect at the times of the distributions and the hypothetical sales. State and local taxes were not considered. After-tax returns reflect any qualified dividend income, using actual prior-year figures and estimates for 2009. (In the example, returns after the sale of fund shares may be higher than those assuming no sale. This occurs when the sale would have produced a capital loss. The calculation assumes that the investor received a tax deduction for the loss.)
Please note that your actual after-tax returns will depend on your tax situation and may differ from those shown. Also note that if you own the fund in a tax-deferred account, such as an individual retirement account or a 401(k) plan, this information does not apply to you. Such accounts are not subject to current taxes.
Finally, keep in mind that a fund’s performance—whether before or after taxes—does not guarantee future results.
| Average Annual Total Returns: Vanguard Target Retirement Funds1 | |||
| Periods Ended September 30, 2009 | |||
| One | Five | Since | |
| Year | Years | Inception2 | |
| Target Retirement Income Fund | |||
| Returns Before Taxes | 5.84% | 4.11% | 4.50% |
| Returns After Taxes on Distributions | 4.92 | 2.89 | 3.30 |
| Returns After Taxes on Distributions and Sale of Fund Shares | 3.84 | 2.84 | 3.19 |
| Target Retirement 2005 Fund | |||
| Returns Before Taxes | 4.33% | 3.81% | 4.42% |
| Returns After Taxes on Distributions | 3.01 | 2.83 | 3.55 |
| Returns After Taxes on Distributions and Sale of Fund Shares | 2.91 | 2.73 | 3.33 |
| Target Retirement 2010 Fund | |||
| Returns Before Taxes | 3.47% | — | 2.61% |
| Returns After Taxes on Distributions | 2.40 | — | 2.05 |
| Returns After Taxes on Distributions and Sale of Fund Shares | 2.40 | — | 1.94 |
1 Total returns do not include the account service fee that may be applicable to certain accounts with balances below $10,000.
2 For the Income, 2005, 2015, and 2025 Funds, October 27, 2003; for the 2010 and 2020 Funds, June 7, 2006.
71
| One | Five | Since | |
| Year | Years | Inception1 | |
| Target Retirement 2015 Fund | |||
| Returns Before Taxes | 2.66% | 3.49% | 4.28% |
| Returns After Taxes on Distributions | 1.67 | 2.76 | 3.64 |
| Returns After Taxes on Distributions and Sale of Fund Shares | 1.92 | 2.63 | 3.37 |
| Target Retirement 2020 Fund | |||
| Returns Before Taxes | 1.44% | — | 1.26% |
| Returns After Taxes on Distributions | 0.64 | — | 0.83 |
| Returns After Taxes on Distributions and Sale of Fund Shares | 1.14 | — | 0.90 |
| Target Retirement 2025 Fund | |||
| Returns Before Taxes | 0.10% | 2.87% | 3.89% |
| Returns After Taxes on Distributions | –0.68 | 2.29 | 3.37 |
| Returns After Taxes on Distributions and Sale of Fund Shares | 0.32 | 2.21 | 3.12 |
1 For the Income, 2005, 2015, and 2025 Funds, October 27, 2003; for the 2010 and 2020 Funds, June 7, 2006.
72
About Your Fund’s Expenses
As a shareholder of the fund, you incur ongoing costs, which include costs for portfolio management, administrative services, and shareholder reports (like this one), among others. Operating expenses, which are deducted from a fund’s gross income, directly reduce the investment return of the fund.
A typical fund’s expenses are expressed as a percentage of its average net assets. The Target Retirement Funds have no direct expenses, but each fund bears its proportionate share of the costs for the underlying funds in which it invests. These indirect expenses make up the acquired fund fees and expenses, also expressed as a percentage of average net assets.
The following examples are intended to help you understand the ongoing costs (in dollars) of investing in your fund and to compare these costs with those of other mutual funds. The examples are based on an investment of $1,000 made at the beginning of the period shown and held for the entire period. The costs were calculated using the acquired fund fees and expenses for each Target Retirement Fund.
The accompanying table illustrates your fund’s costs in two ways:
• Based on actual fund return. This section helps you to estimate the actual expenses that you paid over the period. The “Ending Account Value” shown is derived from the fund’s actual return, and the third column shows the dollar amount that would have been paid by an investor who started with $1,000 in the fund. You may use the information here, together with the amount you invested, to estimate the expenses that you paid over the period.
To do so, simply divide your account value by $1,000 (for example, an $8,600 account value divided by $1,000 = 8.6), then multiply the result by the number given for your fund under the heading “Expenses Paid During Period.”
• Based on hypothetical 5% yearly return. This section is intended to help you compare your fund’s costs with those of other mutual funds. It assumes that the fund had a yearly return of 5% before expenses, but that the expense ratio is unchanged. In this case—because the return used is not the fund’s actual return—the results do not apply to your investment. The example is useful in making comparisons because the Securities and Exchange Commission requires all mutual funds to calculate expenses based on a 5% return. You can assess your fund’s costs by comparing this hypothetical example with the hypothetical examples that appear in shareholder reports of other funds.
73
| Six Months Ended September 30, 2009 | |||
| Beginning | Ending | Expenses | |
| Account Value | Account Value | Paid During | |
| 3/31/2009 | 9/30/2009 | Period1 | |
| Based on Actual Fund Return | |||
| Income | $1,000.00 | $1,141.57 | $1.13 |
| 2005 | 1,000.00 | 1,173.08 | 1.14 |
| 2010 | 1,000.00 | 1,221.69 | 1.11 |
| 2015 | 1,000.00 | 1,255.32 | 1.13 |
| 2020 | 1,000.00 | 1,281.62 | 1.14 |
| 2025 | 1,000.00 | 1,308.60 | 1.16 |
| Based on Hypothetical 5% Yearly Return | |||
| Income | $1,000.00 | $1,024.02 | $1.07 |
| 2005 | 1,000.00 | 1,024.02 | 1.07 |
| 2010 | 1,000.00 | 1,024.07 | 1.01 |
| 2015 | 1,000.00 | 1,024.07 | 1.01 |
| 2020 | 1,000.00 | 1,024.07 | 1.01 |
| 2025 | 1,000.00 | 1,024.07 | 1.01 |
Note that the expenses shown in the table are meant to highlight and help you compare ongoing costs only and do not reflect transaction costs incurred by the fund for buying and selling securities. Further, the expenses do not include the account service fee described in the prospectus. If such a fee were applied to your account, your costs would be higher. Your fund does not charge transaction fees, such as purchase or redemption fees, nor does it carry a “sales load.”
The calculations assume no shares were bought or sold during the period. Your actual costs may have been higher or lower, depending on the amount of your investment and the timing of any purchases or redemptions.
You can find more information about the fund’s expenses, including annual expense ratios, in the Financial Statements section of this report. For additional information on operating expenses and other shareholder costs, please refer to your fund’s current prospectus.
1 The calculations are based on the acquired fund fees and expenses for the most recent six-month period. The funds’ annualized expense figures for that period are (in order as listed from top to bottom above) 0.21%, 0.21%, 0.20%, 0.20%, 0.20%, and 0.20%. The dollar amounts shown as “Expenses Paid” are equal to the annualized expense figures, multiplied by the number of days in the most recent six-month period, then divided by the number of days in the most recent 12-month period.
74
Glossary
Acquired Fund Fees and Expenses. Funds that invest in other Vanguard funds incur no direct expenses, but they do bear proportionate shares of the operating, administrative, and advisory expenses of the underlying funds, and they must pay any fees charged by those funds. The figure for acquired fund fees and expenses represents a weighted average of these underlying costs. Acquired is a term that the Securities and Exchange Commission applies to any mutual fund whose shares are owned by another fund.
Beta. A measure of the magnitude of a fund’s past share-price fluctuations in relation to the ups and downs of a given market index. The index is assigned a beta of 1.00. Compared with a given index, a fund with a beta of 1.20 typically would have seen its share price rise or fall by 12% when the index rose or fell by 10%. For this report, beta is based on returns over the past 36 months for both the fund and the index. Note that a fund’s beta should be reviewed in conjunction with its R-squared (see definition). The lower the R-squared, the less correlation there is between the fund and the index, and the less reliable beta is as an indicator of volatility.
Expense Ratio. The percentage of a fund’s average net assets used to pay its annual administrative and advisory expenses. These expenses directly reduce returns to investors.
Inception Date. The date on which the assets of a fund (or one of its share classes) are first invested in accordance with the fund’s investment objective. For funds with a subscription period, the inception date is the day after that period ends. Investment performance is measured from the inception date.
R-Squared. A measure of how much of a fund’s past returns can be explained by the returns from the market in general, as measured by a given index. If a fund’s total returns were precisely synchronized with an index’s returns, its R-squared would be 1.00. If the fund’s returns bore no relationship to the index’s returns, its R-squared would be 0. For this report, R-squared is based on returns over the past 36 months for both the fund and the index.
Yield. A fund’s 30-day SEC yield is derived using a formula specified by the U.S. Securities and Exchange Commission. Under the formula, data related to the fund’s security holdings in the previous 30 days are used to calculate the fund’s hypothetical net income for that period, which is then annualized and divided by the fund’s estimated average net assets over the calculation period. For the purposes of this calculation, a security’s income is based on its current market yield to maturity (in the case of bonds) or its projected dividend yield (for stocks). Because the SEC yield represents hypothetical annualized income, it will differ—at times significantly—from the fund’s actual experience. As a result, the fund’s income distributions may be higher or lower than implied by the SEC yield.
75
The People Who Govern Your Fund
The trustees of your mutual fund are there to see that the fund is operated and managed in your best interests since, as a shareholder, you are a part owner of the fund. Your fund’s trustees also serve on the board of directors of The Vanguard Group, Inc., which is owned by the Vanguard funds and provides services to them on an at-cost basis.
A majority of Vanguard’s board members are independent, meaning that they have no affiliation with Vanguard or the funds they oversee, apart from the sizable personal investments they have made as private individuals. The independent board members have distinguished backgrounds in business, academia, and public service. Each of the trustees and executive officers oversees 156 Vanguard funds.
The following table provides information for each trustee and executive officer of the fund. More information about the trustees is in the Statement of Additional Information, which can be obtained, without charge, by contacting Vanguard at 800-662-7447, or online at www.vanguard.com.
| Interested Trustees | Emerson U. Fullwood |
| Born 1948. Trustee Since January 2008. Principal | |
| John J. Brennan1 | Occupation(s) During the Past Five Years: Executive |
| Born 1954. Trustee Since May 1987. Chairman of | Chief Staff and Marketing Officer for North America |
| the Board. Principal Occupation(s) During the Past | and Corporate Vice President (retired 2008) of Xerox |
| Five Years: Chairman of the Board and Director/Trustee | Corporation (photocopiers and printers); Director of |
| of The Vanguard Group, Inc., and of each of the | SPX Corporation (multi-industry manufacturing), the |
| investment companies served by The Vanguard Group; | United Way of Rochester, the Boy Scouts of America, |
| Chief Executive Officer (1996–2008) and President | Amerigroup Corporation (direct health and medical |
| (1989–2008) of The Vanguard Group and of each of the | insurance carriers), and Monroe Community College |
| investment companies served by The Vanguard Group; | Foundation. |
| Chairman of the Financial Accounting Foundation; | |
| Governor of the Financial Industry Regulatory Authority | Rajiv L. Gupta |
| (FINRA); Director of United Way of Southeastern | Born 1945. Trustee Since December 2001.2 Principal |
| Pennsylvania. | Occupation(s) During the Past Five Years: Chairman |
| and Chief Executive Officer (retired 2009) and President | |
| F. William McNabb III1 | (2006–2008) of Rohm and Haas Co. (chemicals); Board |
| Born 1957. Trustee Since July 2009. Principal | Member of American Chemistry Council; Director of |
| Occupation(s) During the Past Five Years: Director of | Tyco International, Ltd. (diversified manufacturing and |
| The Vanguard Group, Inc., since 2008; Chief Executive | services) and Hewlett-Packard Co. (electronic computer |
| Officer and President of The Vanguard Group and of | manufacturing); Trustee of The Conference Board. |
| each of the investment companies served by The | |
| Vanguard Group since 2008; Director of Vanguard | Amy Gutmann |
| Marketing Corporation; Managing Director of The | Born 1949. Trustee Since June 2006. Principal |
| Vanguard Group (1995–2008). | Occupation(s) During the Past Five Years: President of |
| the University of Pennsylvania; Christopher H. Browne | |
| Distinguished Professor of Political Science in the School | |
| Independent Trustees | of Arts and Sciences with secondary appointments |
| at the Annenberg School for Communication and the | |
| Charles D. Ellis | Graduate School of Education of the University of |
| Born 1937. Trustee Since January 2001. Principal | Pennsylvania; Director of Carnegie Corporation of |
| Occupation(s) During the Past Five Years: Applecore | New York, Schuylkill River Development Corporation, |
| Partners (pro bono ventures in education); Senior | and Greater Philadelphia Chamber of Commerce; |
| Advisor to Greenwich Associates (international business | Trustee of the National Constitution Center. |
| strategy consulting); Successor Trustee of Yale University; | |
| Overseer of the Stern School of Business at New York | |
| University; Trustee of the Whitehead Institute for | |
| Biomedical Research. |
| JoAnn Heffernan Heisen | Executive Officers | |
| Born 1950. Trustee Since July 1998. Principal | ||
| Occupation(s) During the Past Five Years: Corporate | Thomas J. Higgins1 | |
| Vice President and Chief Global Diversity Officer since | Born 1957. Chief Financial Officer Since September | |
| 2006 (retired 2008) and Member of the Executive | 2008. Principal Occupation(s) During the Past Five | |
| Committee (retired 2008) of Johnson & Johnson | Years: Principal of The Vanguard Group, Inc.; Chief | |
| (pharmaceuticals/consumer products); Vice President | Financial Officer of each of the investment companies | |
| and Chief Information Officer of Johnson & Johnson | served by The Vanguard Group since 2008; Treasurer | |
| (1997–2005); Director of the University Medical Center | of each of the investment companies served by The | |
| at Princeton and Women’s Research and Education | Vanguard Group (1998–2008). | |
| Institute. | ||
| Kathryn J. Hyatt1 | ||
| André F. Perold | Born 1955. Treasurer Since November 2008. Principal | |
| Born 1952. Trustee Since December 2004. Principal | Occupation(s) During the Past Five Years: Principal of | |
| Occupation(s) During the Past Five Years: George Gund | The Vanguard Group, Inc.; Treasurer of each of the | |
| Professor of Finance and Banking, Harvard Business | investment companies served by The Vanguard | |
| School; Chairman of UNX, Inc. (equities trading firm); | Group since 2008; Assistant Treasurer of each of the | |
| Chair of the Investment Committee of HighVista | investment companies served by The Vanguard Group | |
| Strategies LLC (private investment firm). | (1988–2008). | |
| Alfred M. Rankin, Jr. | Heidi Stam1 | |
| Born 1941. Trustee Since January 1993. Principal | Born 1956. Secretary Since July 2005. Principal | |
| Occupation(s) During the Past Five Years: Chairman, | Occupation(s) During the Past Five Years: Managing | |
| President, and Chief Executive Officer of NACCO | Director of The Vanguard Group, Inc., since 2006; | |
| Industries, Inc. (forklift trucks/housewares/lignite); | General Counsel of The Vanguard Group since 2005; | |
| Director of Goodrich Corporation (industrial products/ | Secretary of The Vanguard Group and of each of the | |
| aircraft systems and services); Deputy Chairman of | investment companies served by The Vanguard Group | |
| the Federal Reserve Bank of Cleveland. | since 2005; Director and Senior Vice President of | |
| Vanguard Marketing Corporation since 2005; Principal | ||
| Peter F. Volanakis | of The Vanguard Group (1997–2006). | |
| Born 1955. Trustee Since July 2009. Principal | ||
| Occupation(s) During the Past Five Years: President | ||
| since 2007 and Chief Operating Officer since 2005 | Vanguard Senior Management Team | |
| of Corning Incorporated (communications equipment); | ||
| President of Corning Technologies (2001–2005); Director | R. Gregory Barton | Michael S. Miller |
| of Corning Incorporated and Dow Corning; Trustee of | Mortimer J. Buckley | James M. Norris |
| the Corning Incorporated Foundation and the Corning | Kathleen C. Gubanich | Glenn W. Reed |
| Museum of Glass; Overseer of the Amos Tuck School | Paul A. Heller | George U. Sauter |
| of Business Administration at Dartmouth College. | ||
| Founder | ||
| John C. Bogle | ||
| Chairman and Chief Executive Officer, 1974–1996 | ||
1 These individuals are “interested persons” as defined in the Investment Company Act of 1940.
2 December 2002 for Vanguard Equity Income Fund, Vanguard Growth Equity Fund, the Vanguard Municipal Bond Funds, and the Vanguard
State Tax-Exempt Funds.
 | ||
| P.O. Box 2600 | ||
| Valley Forge, PA 19482-2600 | ||
| Connect with Vanguard® > www.vanguard.com | ||
| Fund Information > 800-662-7447 | You can review and copy information about your fund |
| at the SEC’s Public Reference Room in Washington, D.C. | |
| Direct Investor Account Services > 800-662-2739 | |
| To find out more about this public service, call the SEC | |
| Institutional Investor Services > 800-523-1036 | at 202-551-8090. Information about your fund is also |
| available on the SEC’s website, and you can receive | |
| Text Telephone for People | copies of this information, for a fee, by sending a |
| With Hearing Impairment > 800-952-3335 | request in either of two ways: via e-mail addressed to |
| publicinfo@sec.gov or via regular mail addressed to the | |
| Public Reference Section, Securities and Exchange | |
| This material may be used in conjunction | Commission, Washington, DC 20549-0102. |
| with the offering of shares of any Vanguard | |
| fund only if preceded or accompanied by | |
| the fund’s current prospectus. | |
| All comparative mutual fund data are from Lipper Inc. | |
| or Morningstar, Inc., unless otherwise noted. | |
| You can obtain a free copy of Vanguard’s proxy voting | |
| guidelines by visiting our website, www.vanguard.com, | |
| and searching for “proxy voting guidelines,” or by | |
| calling Vanguard at 800-662-2739. The guidelines are | |
| also available from the SEC’s website, www.sec.gov. | |
| In addition, you may obtain a free report on how your | |
| fund voted the proxies for securities it owned during | |
| the 12 months ended June 30. To get the report, visit | |
| either www.vanguard.com or www.sec.gov. | |
| © 2009 The Vanguard Group, Inc. | |
| All rights reserved. | |
| Vanguard Marketing Corporation, Distributor. | |
| Q3080 112009 | |
![]()
| Vanguard Target Retirement Funds |
| Annual Report |
| September 30, 2009 |
 |
| Vanguard Target Retirement 2030 Fund |
| Vanguard Target Retirement 2035 Fund |
| Vanguard Target Retirement 2040 Fund |
| Vanguard Target Retirement 2045 Fund |
| Vanguard Target Retirement 2050 Fund |
> After rallying strongly through the spring and summer, the broad U.S. stock market returned about –6% for the fiscal year ended September 30, 2009.
> The broad U.S. bond market returned about 10% for the fiscal year. As the economy improved and credit markets stabilized, many investors shifted from U.S. Treasury securities to corporate bonds.
> For the 12 months, returns for the Target Retirement Funds in this report ranged from –1.13% to –1.85%, reflecting the funds’ heavy allocations to stocks.
| Contents | |
| Your Fund’s Total Returns | 1 |
| President’s Letter | 2 |
| Results of Proxy Voting | 9 |
| Target Retirement 2030 Fund | 11 |
| Target Retirement 2035 Fund | 21 |
| Target Retirement 2040 Fund | 31 |
| Target Retirement 2045 Fund | 41 |
| Target Retirement 2050 Fund | 51 |
| Your Fund’s After-Tax Returns | 63 |
| About Your Fund’s Expenses | 65 |
| Glossary | 67 |
Please note: The opinions expressed in this report are just that—informed opinions. They should not be considered promises or advice. Also, please keep in mind that the information and opinions cover the period through the date on the front of this report. Of course, the risks of investing in your fund are spelled out in the prospectus.
Cover photograph: Veronica Coia.
| Your Fund’s Total Returns | ||
| Fiscal Year Ended September 30, 2009 | ||
| Ticker | Total | |
| Symbol | Returns | |
| Vanguard Target Retirement 2030 Fund | VTHRX | –1.13% |
| Target 2030 Composite Index1 | –1.26 | |
| Target 2030 Composite Average2 | –0.88 | |
| Vanguard Target Retirement 2035 Fund | VTTHX | –1.85% |
| Target 2035 Composite Index1 | –1.94 | |
| Target 2035 Composite Average2 | –1.49 | |
| Vanguard Target Retirement 2040 Fund | VFORX | –1.61% |
| Target 2040 Composite Index1 | –1.94 | |
| Target 2040 Composite Average2 | –1.49 | |
| Vanguard Target Retirement 2045 Fund | VTIVX | –1.77% |
| Target 2045 Composite Index1 | –1.94 | |
| Target 2045 Composite Average2 | –1.49 | |
| Vanguard Target Retirement 2050 Fund | VFIFX | –1.73% |
| Target 2050 Composite Index1 | –1.94 | |
| Target 2050 Composite Average2 | –1.49 | |
Investments in Target Retirement Funds are subject to the risks of their underlying funds. The year in the fund name refers to the approximate year (the target date) when an investor in the fund would retire and leave the work force. The fund will gradually shift its emphasis from more aggressive investments to more conservative ones based on its target date. An investment in the Target Retirement Fund is not guaranteed at any time, including on or after the target date.
1 Returns for the composite indexes are derived by applying the funds’ target allocations to the results of the following benchmarks: for U.S. stocks, the Morgan Stanley Capital International (MSCI) US Broad Market Index; for international stocks, the MSCI Europe, Australasia, Far East Index and the MSCI Emerging Markets Index; and for bonds, the Barclays Capital U.S. Aggregate Bond Index.
2 Each composite average weights the average returns of the appropriate mutual fund peer groups in proportion with the targeted weighting of the specific Target Retirement Fund. All together, the composites use returns for the fixed income funds average, the general equity funds average, the international funds average, and the emerging markets funds average. These returns are derived from data provided by Lipper Inc.
1

President’s Letter
Dear Shareholder,
For the fiscal year ended September 30, 2009, the robust second-half rally in the stock market could not offset deep losses incurred earlier in the period. While the five Target Retirement Funds featured in this report allocate a small percentage of their assets to bonds, the performance of equities in their portfolios largely determined their outcome for the fiscal year. The four Target Retirement Funds that have about 90% of their assets allocated to stocks returned between –1.61% and –1.85%, while the 2030 fund, with its stock weighting of about 84%, returned –1.13%.
After a precipitous fall, stock markets rebound
In recent months, the financial markets have performed so strongly that it’s almost hard to remember that less than a year ago the global financial system stood on the brink of collapse. Since then, markets have pulled back from the abyss. Although unemployment remains near generational highs, and the prospects of a robust recovery seem dim, the global economy has begun to grind into gear.
Reminders of the markets’ dark days are nevertheless apparent in the index returns for both the past 12 months and the past three years. Over both periods, U.S. stocks recorded negative returns. Global stocks did better over the past 12 months, recouping their late 2008 losses thanks to general strength in developed markets and a powerful
2
rally in emerging markets. Over the past three years, however, international stocks posted a modestly negative return.
The bond market’s turnabout has been equally dramatic
The stock market’s collapse and recovery echo even more dramatic developments in the bond market. At the end of 2008, as the credit markets nearly ceased to function, the difference between the yields of corporate bonds and Treasury bonds spiked to levels last seen during the Great Depression.
The Federal Reserve and its central bank counterparts around the world responded with aggressive monetary stimulus efforts, while global governments opened the fiscal taps. Investors first tiptoed, then stampeded, back into the market, boosting bond prices and bringing down yields. Over the past 12 months, taxable U.S. bonds returned more than 10%; municipal securities did even better, returning almost 15%, as measured by the Barclays Capital Municipal Bond Index.
The Fed’s rescue campaign has imposed a heavy price on short-term savings vehicles such as money market funds. In December 2008, the Fed reduced its target for the federal funds rate, a benchmark for the interest rates paid by money market instruments and other very short-term securities, to between 0% and 0.25%. The Fed has said it expects to maintain its target at this level “for an extended period.”
| Market Barometer | |||
| Average Annual Total Returns | |||
| Periods Ended September 30, 2009 | |||
| One Year | Three Years | Five Years | |
| Stocks | |||
| Russell 1000 Index (Large-caps) | –6.14% | –5.10% | 1.49% |
| Russell 2000 Index (Small-caps) | –9.55 | –4.57 | 2.41 |
| Dow Jones U.S. Total Stock Market Index | –5.83 | –4.58 | 1.93 |
| MSCI All Country World Index ex USA (International) | 6.43 | –0.78 | 8.59 |
| Bonds | |||
| Barclays Capital U.S. Aggregate Bond Index | |||
| (Broad taxable market) | 10.56% | 6.41% | 5.13% |
| Barclays Capital Municipal Bond Index | 14.85 | 5.13 | 4.78 |
| Citigroup 3-Month Treasury Bill Index | 0.39 | 2.63 | 2.96 |
| CPI | |||
| Consumer Price Index | –1.29% | 2.10% | 2.61% |
3
The severe first-half downturn weighed on the funds’ returns
The asset allocations of the Vanguard Target Retirement Funds are consistent with well-established principles of retirement planning. Funds with more distant horizon dates include heavy allocations to stocks, which are expected to produce higher longer-term growth than bonds, albeit with significant risk of short-term losses. Funds with nearer retirement dates include heavier allocations to fixed income securities; as the prospect of spending from a portfolio comes closer, the importance of moderating the ups and downs in the portfolio’s value increases.
Retirement is about 20 or more years away for most investors in the five funds featured in this report. Therefore, these funds maintain a growth-oriented asset allocation and invest mostly in U.S. and international stocks. As of September 30, the four more aggressive funds held about 72% of their assets in U.S. stocks, 18% in international stocks, and 10% in bonds. The 2030 fund, which is slightly more conservative than the four others, held about 67% of its assets in U.S. stocks, 17% in international stocks, and 16% in bonds.
As you know, a larger portion of stocks means a greater potential for short-term risks. Although stocks bounced impressively off their March lows through the spring and summer, they weren’t able to overcome the severe downturn experienced in the final months of 2008 and the beginning of 2009. In all the Target
| Asset Allocations on September 30, 2009 | |||
| Short-Term | |||
| Stocks1 | Bonds | Investments | |
| 2030 | 84% | 16% | 0% |
| 2035 | 90 | 10 | 0 |
| 2040 | 90 | 10 | 0 |
| 2045 | 90 | 10 | 0 |
| 2050 | 90 | 10 | 0 |
1 As of September 30, 2009, international stock weightings for the 2030, 2035, 2040, 2045, and 2050 Funds were 17%, 18%, 18%, 18%, and 18% of assets, respectively.
4
Retirement portfolios, the only underlying fund that declined was Vanguard Total Stock Market Index Fund (which returned about –6%). Because of its heavy weighting in the five funds included in this report, its influence was significant.
Among the other underlying Vanguard funds held in Target Retirement portfolios, the best performers for the fiscal year were Vanguard Emerging Markets Stock Index Fund (about +17%) and Vanguard Total Bond Market II Index Fund, which launched in January and is essentially identical to its portfolio predecessor, Vanguard Total Bond Market Index Fund (about +10%).
However, the Emerging Markets Stock Index Fund represented only about 4% of the holdings in each of the five funds as of September 30, and its rally had a limited effect on the funds’ performance. Investors were less enthusiastic about the stocks of developed countries abroad and that meant lower returns for Vanguard European Stock Index Fund (about +1%) and Pacific Stock Index Fund (about +3%).
| Total Returns | |
| Inception1 Through September 30, 2009 | |
| Average | |
| Annual Return | |
| Target Retirement 2030 Fund | –0.19% |
| Target 2030 Composite Index | –0.28 |
| Target 2030 Composite Average2 | –1.21 |
| Target Retirement 2035 Fund | 3.97 |
| Target 2035 Composite Index | 3.97 |
| Target 2035 Composite Average2 | 3.25 |
| Target Retirement 2040 Fund | –0.76 |
| Target 2040 Composite Index | –0.93 |
| Target 2040 Composite Average2 | –1.76 |
| Target Retirement 2045 Fund | 4.50 |
| Target 2045 Composite Index | 4.47 |
| Target 2045 Composite Average2 | 3.74 |
| Target Retirement 2050 Fund | –0.64 |
| Target 2050 Composite Index | –0.80 |
| Target 2050 Composite Average2 | –1.63 |
The figures shown represent past performance, which is not a guarantee of future results. (Current performance may be lower or higher than the performance data cited. For performance data current to the most recent month-end, visit our website at www.vanguard.com/performance.) Note, too, that both investment returns and principal value can fluctuate widely, so an investor’s shares, when sold, could be worth more or less than their original cost.
1 For the 2035 and 2045 Funds, October 27, 2003; for the 2030, 2040, and 2050 Funds, June 7, 2006.
2 Derived from data provided by Lipper Inc.
5
Clearly defined portfolios that benefit from low costs
As you know, the Vanguard Target Retirement Funds invest in a mix of underlying Vanguard stock and bond funds tailored to the time horizon selected by the investor. Each fund’s weighting of stocks and bonds shifts toward a more conservative, income-oriented allocation as retirement approaches. Excluding the Income Fund, the Vanguard Target Retirement Funds all follow a steady path toward more conservative asset allocations.
The performance of the funds has been competitive since their inceptions, and each fund is ahead of the average return for an appropriate composite of mutual fund peers. This accomplishment is a tribute to Vanguard’s Quantitative Equity Group and Fixed Income Group, the advisors of the underlying funds. Each of these groups combines skilled portfolio management with sophisticated risk-control and trading systems.
| Investment insight |
| Target Retirement Funds: A long-term compact |
| When you invest in a target-date retirement fund, you establish a relationship with a |
| fund, and a fund company, that may last for decades. |
| What does Vanguard consider some of the characteristics of a target-date fund that |
| can serve as a trusted long-term partner? |
| Low costs. Over time, costs can have a big impact on the amount of wealth you |
| accumulate. You want your long-term partner to minimize costs, maximizing your |
| share of the fund’s return. |
| Philosophical coherence. Target-date funds reflect a fund manager’s investment |
| beliefs. At Vanguard, we have long counseled investors to stick with a long-term plan |
| that emphasizes balance among the asset classes, diversification within them, and low |
| costs. These same principles are at the core of the Vanguard Target Retirement Funds. |
| Transparency. Well-designed target-date funds are built on sophisticated thinking about |
| asset allocation, risk control, and investor needs and behavior. You don’t want the |
| product of this research and analysis to be hidden in a black box. Vanguard’s portfolios |
| invest in index funds on the basis of well-defined “glide paths.” You can see clearly |
| how each fund will try to capture market returns and manage the risk-return tradeoff |
| through gradual changes in strategic asset allocation. |
6
The Target Retirement Funds, like all Vanguard funds, also benefit from low operating costs. For a look at how the funds’ costs compare with the composite average expenses of peers, please see the table below.
A straightforward, sensible retirement investment
Investors have faced many challenges over the past year as the financial markets experienced uncommon volatility. When our fiscal period began, the U.S. stock market was in the final months of its worst calendar year since the 1930s, and the early part of 2009 brought further declines. Then, as the economy showed signs of improvement and investors’ tolerance for risk returned, the financial markets started an impressive recovery.
Because nobody knows the fate of future markets, we encourage investors to pay less attention to short-term events and trends and instead to rely on a long-term strategy based on tried and true investment lessons. This means selecting a mix of stock, bond, and money market funds that suits your goals, time horizon, and risk tolerance.
| Expense Ratios | ||
| Your Fund Compared With Its Peer Group | ||
| Acquired Fund | Peer-Group | |
| Fees and | Expense | |
| Expenses1 | Ratio2 | |
| 2030 | 0.19% | 1.32% |
| 2035 | 0.18 | 1.34 |
| 2040 | 0.19 | 1.34 |
| 2045 | 0.18 | 1.34 |
| 2050 | 0.19 | 1.34 |
1 This figure—drawn from the prospectus dated January 28, 2009—represents an estimate of the weighted average of the expense ratios and any transaction fees charged by the underlying mutual funds (the “acquired” funds) in which the Target Retirement Funds invest. The Target Retirement Funds do not charge any expenses or fees of their own. For the fiscal year ended September 30, 2009, the annualized acquired fund fees and expenses were 0.21% for the 2030 Fund, 0.21% for the 2035 Fund, 0.21% for the 2040 Fund, 0.21% for the 2045 Fund, and 0.21% for the 2050 Fund.
2 Peer groups are (from top to bottom) the Target 2030 Composite Average, the Target 2035 Composite Average, the Target 2040 Composite Average, the Target 2045 Composite Average, and the Target 2050 Composite Average. Each average is a blended composite that weights the expense ratio of the comparable mutual funds average for each asset class in proportion to the target weighting of the appropriate Target Retirement Fund. Peer-group expense ratios are derived from data provided by Lipper Inc. and capture information through year-end 2008.
7
A portfolio that includes both stocks and bonds and is diversified within those asset classes is unlikely to provide the best returns or worst returns, or even to fully shield investors from severe market turbulence. However, the different asset classes can help reduce the overall volatility of the portfolio’s returns. With their broad diversification and low costs, the Target Retirement Funds are designed to provide a straightforward solution to your retirement investing needs.
Thank you for your confidence in Vanguard.
Sincerely,

F. William McNabb III
President and Chief Executive Officer
October 12, 2009
| Your Fund’s Performance at a Glance | |||||
| September 30, 2008–September 30, 2009 | |||||
| Starting | Ending | Distributions Per Share | |||
| Share | Share | Income | Capital | 30-Day | |
| Price | Price | Dividends | Gains | SEC Yield | |
| 2030 | $19.63 | $18.84 | $0.463 | $0.00 | 2.27% |
| 2035 | 11.90 | 11.31 | 0.299 | 0.00 | 2.30 |
| 2040 | 19.36 | 18.52 | 0.426 | 0.00 | 2.29 |
| 2045 | 12.29 | 11.70 | 0.301 | 0.00 | 2.30 |
| 2050 | 19.43 | 18.58 | 0.415 | 0.00 | 2.29 |
8
Results of Proxy Voting
At a special meeting of shareholders on July 2, 2009, fund shareholders approved the following two proposals:
Proposal 1—Elect trustees for each fund.*
The individuals listed in the table below were elected as trustees for each fund. All trustees with the exception of Messrs. McNabb and Volanakis (both of whom already served as directors of The Vanguard Group, Inc.) served as trustees to the funds prior to the shareholder meeting.
Target Retirement 2030 Fund, Target Retirement 2035 Fund, Target Retirement 2040 Fund, Target Retirement 2045 Fund, Target Retirement 2050 Fund
| Percentage | |||
| Trustee | For | Withheld | For |
| John J. Brennan | 2,630,147,450 | 97,260,963 | 96.2% |
| Charles D. Ellis | 2,625,722,607 | 101,685,806 | 96.0% |
| Emerson U. Fullwood | 2,628,496,004 | 98,912,409 | 96.1% |
| Rajiv L. Gupta | 2,626,864,431 | 100,543,982 | 96.0% |
| Amy Gutmann | 2,630,727,663 | 96,680,750 | 96.2% |
| JoAnn Heffernan Heisen | 2,628,219,495 | 99,188,918 | 96.1% |
| F. William McNabb III | 2,629,764,221 | 97,644,192 | 96.1% |
| André F. Perold | 2,627,865,185 | 99,543,228 | 96.1% |
| Alfred M. Rankin, Jr. | 2,628,819,510 | 98,588,903 | 96.1% |
| Peter F. Volanakis | 2,630,490,646 | 96,917,767 | 96.2% |
| * Results are for all funds within the same trust. |
Proposal 2—Update and standardize the funds’ fundamental policies regarding:
(a) Purchasing and selling real estate.
(b) Issuing senior securities.
(c) Borrowing money. (d) Making loans.
(e) Purchasing and selling commodities.
(f) Concentrating investments in a particular industry or group of industries. (g) Eliminating outdated fundamental investment policies not required by law.
The revised fundamental policies are clearly stated and simple, yet comprehensive, making oversight and compliance more efficient than under the former policies. The revised fundamental policies will allow the funds to respond more quickly to regulatory and market changes, while avoiding the costs and delays associated with successive shareholder meetings.
| Broker | Percentage | ||||
| Vanguard Fund | For | Abstain | Against | Non-Votes | For |
| Target Retirement 2030 Fund | |||||
| 2a | 102,548,538 | 2,107,055 | 4,499,065 | 7,081,119 | 88.2% |
| 2b | 102,391,713 | 2,154,016 | 4,608,930 | 7,081,119 | 88.1% |
| 2c | 100,718,989 | 2,120,495 | 6,315,176 | 7,081,117 | 86.7% |
| 2d | 102,260,604 | 2,132,577 | 4,761,478 | 7,081,119 | 88.0% |
9
| Broker | Percentage | ||||
| Vanguard Fund | For | Abstain | Against | Non-Votes | For |
| Target Retirement 2030 Fund | |||||
| (continued) | |||||
| 2e | 102,397,268 | 2,120,680 | 4,636,710 | 7,081,119 | 88.1% |
| 2f | 102,471,568 | 2,109,710 | 4,573,381 | 7,081,118 | 88.2% |
| 2g | 102,632,398 | 2,183,061 | 4,339,199 | 7,081,118 | 88.3% |
| Target Retirement 2035 Fund | |||||
| 2a | 307,775,277 | 19,183,458 | 8,491,817 | 28,033,740 | 84.7% |
| 2b | 307,488,766 | 19,475,460 | 8,486,328 | 28,033,738 | 84.6% |
| 2c | 302,460,120 | 21,389,062 | 11,601,369 | 28,033,740 | 83.2% |
| 2d | 306,033,223 | 21,359,927 | 8,057,402 | 28,033,740 | 84.2% |
| 2e | 306,302,944 | 19,268,621 | 9,878,990 | 28,033,737 | 84.3% |
| 2f | 306,703,228 | 19,409,552 | 9,337,772 | 28,033,740 | 84.4% |
| 2g | 308,956,185 | 20,013,996 | 6,480,370 | 28,033,740 | 85.0% |
| Target Retirement 2040 Fund | |||||
| 2a | 57,378,506 | 1,938,652 | 1,819,643 | 4,605,066 | 87.3% |
| 2b | 57,331,505 | 1,970,526 | 1,834,771 | 4,605,064 | 87.2% |
| 2c | 56,870,436 | 2,408,686 | 1,857,683 | 4,605,061 | 86.5% |
| 2d | 57,271,623 | 2,414,697 | 1,450,482 | 4,605,065 | 87.1% |
| 2e | 57,325,260 | 1,940,855 | 1,870,686 | 4,605,066 | 87.2% |
| 2f | 57,318,358 | 1,937,397 | 1,881,046 | 4,605,066 | 87.2% |
| 2g | 57,907,133 | 2,017,004 | 1,212,664 | 4,605,066 | 88.1% |
| Target Retirement 2045 Fund | |||||
| 2a | 152,381,088 | 12,402,285 | 3,564,480 | 14,337,142 | 83.4% |
| 2b | 152,162,055 | 12,697,846 | 3,487,950 | 14,337,144 | 83.3% |
| 2c | 150,366,699 | 13,184,251 | 4,796,900 | 14,337,144 | 82.3% |
| 2d | 151,962,088 | 13,116,884 | 3,268,877 | 14,337,146 | 83.2% |
| 2e | 151,030,114 | 12,458,990 | 4,858,748 | 14,337,143 | 82.7% |
| 2f | 151,834,953 | 12,588,898 | 3,924,001 | 14,337,143 | 83.1% |
| 2g | 152,954,188 | 12,616,504 | 2,777,158 | 14,337,145 | 83.7% |
| Target Retirement 2050 Fund | |||||
| 2a | 22,536,373 | 761,660 | 669,809 | 1,819,841 | 87.4% |
| 2b | 22,444,666 | 802,062 | 721,114 | 1,819,841 | 87.0% |
| 2c | 22,199,174 | 1,022,017 | 746,651 | 1,819,841 | 86.1% |
| 2d | 22,437,721 | 1,014,729 | 515,392 | 1,819,841 | 87.0% |
| 2e | 22,415,433 | 765,429 | 786,978 | 1,819,842 | 86.9% |
| 2f | 22,418,550 | 811,096 | 738,194 | 1,819,842 | 86.9% |
| 2g | 22,783,669 | 774,463 | 409,710 | 1,819,841 | 88.4% |
10
Target Retirement 2030 Fund
Fund Profile
As of September 30, 2009
| Financial Attributes | |
| Yield1 | 2.3% |
| Acquired Fund Fees and Expenses2 | 0.19% |
| Volatility Measures3 | |
| Fund Versus | |
| Composite Index4 | |
| R-Squared | 1.00 |
| Beta | 1.00 |
| Allocation to Underlying Vanguard Funds | |
| Total Stock Market Index Fund | 66.8% |
| Total Bond Market II Index Fund | 16.4 |
| European Stock Index Fund | 8.3 |
| Pacific Stock Index Fund | 4.3 |
| Emerging Markets Stock Index Fund | 4.2 |
Fund Asset Allocation
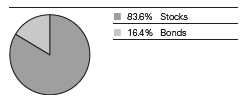
Equity Investment Focus
Fixed Income Investment Focus
1 30-day SEC yield. See the Glossary.
2 This figure—drawn from the prospectus dated January 28, 2009—represents a weighted average of the expense ratios and any transaction fees charged by the underlying mutual funds (the “acquired” funds) in which the Target Retirement 2030 Fund invests.
The Target Retirement 2030 Fund does not charge any expenses or fees of its own. For the fiscal year ended September 30, 2009, the annualized acquired fund fees and expenses figure was 0.21%.
3 For an explanation of R-squared, beta, and other terms used here, see the Glossary.
4 Target 2030 Composite Index: Derived by applying the fund’s target asset allocation to the results of the following benchmarks: for international stocks of developed markets, the MSCI EAFE Index; for emerging markets stocks, the MSCI Emerging Markets Index; for bonds, the Barclays Capital U.S. Aggregate Bond Index; and for U.S. stocks, the MSCI US Broad Market Index. MSCI EAFE Index returns are adjusted for withholding taxes applicable to Luxembourg holding companies.
11
Target Retirement 2030 Fund
Performance Summary
All of the returns in this report represent past performance, which is not a guarantee of future results that may be achieved by the fund. (Current performance may be lower or higher than the performance data cited. For performance data current to the most recent month-end, visit our website at www.vanguard.com/performance.) Note, too, that both investment returns and principal value can fluctuate widely, so an investor’s shares, when sold, could be worth more or less than their original cost. The returns shown do not reflect taxes that a shareholder would pay on fund distributions or on the sale of fund shares.
Cumulative Performance: June 7, 2006–September 30, 2009
Initial Investment of $10,000
| Average Annual Total Returns | Final Value | ||
| Periods Ended September 30, 2009 | of a $10,000 | ||
| One Year | Since Inception1 | Investment | |
| Target Retirement 2030 Fund2 | –1.13% | –0.19% | $9,937 |
| Dow Jones U.S. Total Stock Market Index | –5.83 | –2.51 | 9,193 |
| Target 2030 Composite Index3 | –1.26 | –0.28 | 9,908 |
| Target 2030 Composite Average4 | –0.88 | –1.21 | 9,605 |
1 Performance for the fund and its comparative standards is calculated since the fund’s inception: June 7, 2006.
2 Total returns do not include the account service fee that may be applicable to certain accounts with balances below $10,000.
3 Target 2030 Composite Index: Derived by applying the fund’s target asset allocation to the results of the following benchmarks: for international stocks of developed markets, the MSCI EAFE Index; for emerging markets stocks, the Select Emerging Markets Index from inception through August 23, 2006, and the MSCI Emerging Markets Index thereafter; for bonds, the Barclays Capital U.S. Aggregate Bond Index; and for U.S. stocks, the MSCI US Broad Market Index. MSCI EAFE Index returns are adjusted for withholding taxes applicable to Luxembourg holding companies.
4 Target 2030 Composite Average: Derived by applying the fund’s target allocation to the following peer-group averages: the general equity funds average, fixed income funds average, international funds average, and emerging markets funds average. Derived from data provided by Lipper Inc.
12
Target Retirement 2030 Fund
Fiscal-Year Total Returns (%): June 7, 2006–September 30, 2009

1 Target 2030 Composite Index: Derived by applying the fund’s target asset allocation to the results of the following benchmarks: for international stocks of developed markets, the MSCI EAFE Index; for emerging markets stocks, the Select Emerging Markets Index from inception through August 23, 2006, and the MSCI Emerging Markets Index thereafter; for bonds, the Barclays Capital U.S. Aggregate Bond Index; and for U.S. stocks, the MSCI US Broad Market Index. MSCI EAFE Index returns are adjusted for withholding taxes applicable to Luxembourg holding companies.
Note: See Financial Highlights table for dividend and capital gains information.
13
Target Retirement 2030 Fund
Financial Statements
Statement of Net Assets
As of September 30, 2009
The fund reports a complete list of its holdings in regulatory filings four times in each fiscal year, at the quarter-ends. For the second and fourth fiscal quarters, the lists appear in the fund’s semiannual and annual reports to shareholders. For the first and third fiscal quarters, the fund files the lists with the Securities and Exchange Commission on Form N-Q. Shareholders can look up the fund’s Forms N-Q on the SEC’s website at www.sec.gov. Forms N-Q may also be reviewed and copied at the SEC’s Public Reference Room (see the back cover of this report for further information).
| Market | ||
| Value• | ||
| Shares | ($000) | |
| Investment Companies (99.8%) | ||
| U.S. Stock Fund (66.6%) | ||
| Vanguard Total Stock Market Index Fund Investor Shares | 102,259,924 | 2,667,961 |
| International Stock Funds (16.8%) | ||
| Vanguard European Stock Index Fund Investor Shares | 12,613,260 | 332,107 |
| Vanguard Pacific Stock Index Fund Investor Shares | 17,489,120 | 172,968 |
| Vanguard Emerging Markets Stock Index Fund Investor Shares | 6,875,652 | 166,597 |
| 671,672 | ||
| Bond Fund (16.4%) | ||
| 1 Vanguard Total Bond Market II Index Fund Investor Shares | 63,580,522 | 656,787 |
| Total Investment Companies (Cost $4,261,416) | 3,996,420 | |
| Temporary Cash Investment (0.1%) | ||
| Money Market Fund (0.1%) | ||
| 1 Vanguard Market Liquidity Fund, 0.267% (Cost $2,844) | 2,844,470 | 2,844 |
| Total Investments (99.9%) (Cost $4,264,260) | 3,999,264 | |
| Other Assets and Liabilities (0.1%) | ||
| Other Assets | 85,573 | |
| Liabilities | (81,611) | |
| 3,962 | ||
| Net Assets (100%) | ||
| Applicable to 212,448,556 outstanding $.001 par value shares of | ||
| beneficial interest (unlimited authorization) | 4,003,226 | |
| Net Asset Value Per Share | $18.84 | |
14
| Target Retirement 2030 Fund | |
| At September 30, 2009, net assets consisted of: | |
| Amount | |
| ($000) | |
| Paid-in Capital | 4,224,267 |
| Undistributed Net Investment Income | 44,480 |
| Accumulated Net Realized Losses | (525) |
| Unrealized Appreciation (Depreciation) | (264,996) |
| Net Assets | 4,003,226 |
• See Note A in Notes to Financial Statements.
1 Affiliated fund available only to Vanguard funds and certain trusts and accounts managed by Vanguard. Rate shown for Vanguard Market Liquidity Fund is the 7-day yield.
See accompanying Notes, which are an integral part of the Financial Statements.
15
| Target Retirement 2030 Fund | |
| Statement of Operations | |
| Year Ended | |
| September 30, 2009 | |
| ($000) | |
| Investment Income | |
| Income | |
| Income Distributions Received | 77,794 |
| Net Investment Income—Note B | 77,794 |
| Realized Net Gain (Loss) on Investment Securities Sold | 3,788 |
| Change in Unrealized Appreciation (Depreciation) of Investment Securities | 154,208 |
| Net Increase (Decrease) in Net Assets Resulting from Operations | 235,790 |
See accompanying Notes, which are an integral part of the Financial Statements.
16
| Target Retirement 2030 Fund | ||
| Statement of Changes in Net Assets | ||
| Year Ended September 30, | ||
| 2009 | 2008 | |
| ($000) | ($000) | |
| Increase (Decrease) in Net Assets | ||
| Operations | ||
| Net Investment Income | 77,794 | 43,703 |
| Realized Net Gain (Loss) | 3,788 | (4,329) |
| Change in Unrealized Appreciation (Depreciation) | 154,208 | (480,336) |
| Net Increase (Decrease) in Net Assets Resulting from Operations | 235,790 | (440,962) |
| Distributions | ||
| Net Investment Income | (63,644) | (22,914) |
| Realized Capital Gain | — | — |
| Total Distributions | (63,644) | (22,914) |
| Capital Share Transactions | ||
| Issued | 1,793,675 | 1,955,546 |
| Issued in Lieu of Cash Distributions | 63,446 | 22,869 |
| Redeemed | (385,086) | (258,051) |
| Net Increase (Decrease) from Capital Share Transactions | 1,472,035 | 1,720,364 |
| Total Increase (Decrease) | 1,644,181 | 1,256,488 |
| Net Assets | ||
| Beginning of Period | 2,359,045 | 1,102,557 |
| End of Period1 | 4,003,226 | 2,359,045 |
| 1 Net Assets—End of Period includes undistributed net investment income of $44,480,000 and $30,330,000. | ||
See accompanying Notes, which are an integral part of the Financial Statements.
17
| Target Retirement 2030 Fund | ||||
| Financial Highlights | ||||
| June 7, | ||||
| 20061 to | ||||
| Year Ended September 30, | Sept. 30, | |||
| For a Share Outstanding Throughout Each Period | 2009 | 2008 | 2007 | 2006 |
| Net Asset Value, Beginning of Period | $19.63 | $24.74 | $21.25 | $20.00 |
| Investment Operations | ||||
| Net Investment Income | .4662 | .5222 | .4902 | .1702 |
| Capital Gain Distributions Received | — | — | — | — |
| Net Realized and Unrealized Gain (Loss) on Investments | (.793) | (5.262) | 3.190 | 1.080 |
| Total from Investment Operations | (.327) | (4.740) | 3.680 | 1.250 |
| Distributions | ||||
| Dividends from Net Investment Income | (.463) | (.370) | (.190) | — |
| Distributions from Realized Capital Gains | — | — | — | — |
| Total Distributions | (.463) | (.370) | (.190) | — |
| Net Asset Value, End of Period | $18.84 | $19.63 | $24.74 | $21.25 |
| Total Return3 | –1.13% | –19.43% | 17.40% | 6.25% |
| Ratios/Supplemental Data | ||||
| Net Assets, End of Period (Millions) | $4,003 | $2,359 | $1,103 | $69 |
| Ratio of Total Expenses to Average Net Assets | 0%4 | 0% | 0% | 0% |
| Ratio of Net Investment Income to Average Net Assets | 2.92% | 2.35% | 2.10% | 1.81%5 |
| Portfolio Turnover Rate | 13%6 | 6% | 4% | 13% |
1 Inception.
2 Calculated based on average shares outstanding.
3 Total returns do not include the account service fee that may be applicable to certain accounts with balances below $10,000. 4 The acquired fund fees and expenses were 0.21%.
5 Annualized.
6 Excludes the value of mutual fund shares delivered and received in connection with a change in the fund’s bond investments from Vanguard Total Bond Market Index Fund to Vanguard Total Bond Market II Index Fund because those transactions were effected in kind and did not cause the fund to incur transaction costs.
See accompanying Notes, which are an integral part of the Financial Statements.
18
Target Retirement 2030 Fund
Notes to Financial Statements
Vanguard Target Retirement 2030 Fund is registered under the Investment Company Act of 1940 as an open-end investment company, or mutual fund. The fund follows a balanced investment strategy by investing in selected Vanguard funds to achieve its targeted allocation of assets to U.S. stocks, international stocks, and bonds.
A. The following significant accounting policies conform to generally accepted accounting principles for U.S. mutual funds. The fund consistently follows such policies in preparing its financial statements.
1. Security Valuation: Investments are valued at the net asset value of each underlying Vanguard fund determined as of the close of the New York Stock Exchange (generally 4 p.m., Eastern time) on the valuation date.
2. Federal Income Taxes: The fund intends to continue to qualify as a regulated investment company and distribute all of its taxable income. Management has analyzed the fund’s tax positions taken for all open federal income tax years (September 30, 2006–2009), and has concluded that no provision for federal income tax is required in the fund’s financial statements.
3. Distributions: Distributions to shareholders are recorded on the ex-dividend date.
4. Other: Income and capital gain distributions received are recorded on the ex-dividend date. Security transactions are accounted for on the date securities are bought or sold. Costs used to determine realized gains (losses) on the sale of investment securities are those of the specific securities sold.
B. Under a service agreement, The Vanguard Group furnishes investment advisory, corporate management, administrative, marketing, and distribution services to the fund. The service agreement provides that the fund’s expenses may be reduced or eliminated to the extent of savings realized by the Vanguard funds by the operation of the fund. Accordingly, all incremental expenses for services provided by Vanguard and all other expenses incurred by the fund during the year ended September 30, 2009, were borne by the funds in which the fund invests. The fund’s trustees and officers are also directors and officers of Vanguard and the funds in which the fund invests.
C. Various inputs may be used to determine the value of the fund’s investments. These inputs are summarized in three broad levels for financial statement purposes. The inputs or methodologies used to value securities are not necessarily an indication of the risk associated with investing in those securities.
Level 1—Quoted prices in active markets for identical securities.
Level 2—Other significant observable inputs (including quoted prices for similar securities, interest rates, prepayment speeds, credit risk, etc.).
Level 3—Significant unobservable inputs (including the fund’s own assumptions used to determine the fair value of investments).
At September 30, 2009, 100% of the fund’s investments were valued based on Level 1 inputs.
D. Distributions are determined on a tax basis and may differ from net investment income and realized capital gains for financial reporting purposes. Differences may be permanent or temporary. Permanent differences are reclassified among capital accounts in the financial statements to reflect their tax character. Temporary differences arise when certain items of income, expense, gain, or loss are recognized in different periods for financial statement and tax purposes; these differences will reverse at some time in the future. Differences in classification may also result from the treatment of short-term gains as ordinary income for tax purposes.
19
Target Retirement 2030 Fund
For tax purposes, at September 30, 2009, the fund had $44,496,000 of ordinary income available for distribution. The fund had available capital loss carryforwards totaling $541,000 to offset future net capital gains through September 30, 2017.
At September 30, 2009, the cost of investment securities for tax purposes was $4,264,260,000. Net unrealized depreciation of investment securities for tax purposes was $264,996,000, consisting of unrealized gains of $22,848,000 on securities that had risen in value since their purchase and $287,844,000 in unrealized losses on securities that had fallen in value since their purchase.
E. During the year ended September 30, 2009, the fund purchased $2,161,859,000 of investment securities and sold $680,153,000 of investment securities, other than temporary cash investments.
| F. Capital shares issued and redeemed were: | ||
| Year Ended September 30, | ||
| 2009 | 2008 | |
| Shares | Shares | |
| (000) | (000) | |
| Issued | 112,709 | 86,285 |
| Issued in Lieu of Cash Distributions | 4,133 | 956 |
| Redeemed | (24,572) | (11,624) |
| Net Increase (Decrease) in Shares Outstanding | 92,270 | 75,617 |
G. In preparing the financial statements as of September 30, 2009, management considered the impact of subsequent events occurring through November 6, 2009, for potential recognition or disclosure in these financial statements.
20
Target Retirement 2035 Fund
Fund Profile
As of September 30, 2009
| Financial Attributes | |
| Yield1 | 2.3% |
| Acquired Fund Fees and Expenses2 | 0.18% |
| Volatility Measures3 | |
| Fund Versus | |
| Composite Index4 | |
| R-Squared | 1.00 |
| Beta | 1.00 |
| Allocation to Underlying Vanguard Funds | |
| Total Stock Market Index Fund | 71.7% |
| Total Bond Market II Index Fund | 10.1 |
| European Stock Index Fund | 9.0 |
| Pacific Stock Index Fund | 4.7 |
| Emerging Markets Stock Index Fund | 4.5 |
Fund Asset Allocation
Equity Investment Focus
Fixed Income Investment Focus
1 30-day SEC yield. See the Glossary.
2 This figure—drawn from the prospectus dated January 28, 2009—represents a weighted average of the expense ratios and any transaction fees charged by the underlying mutual funds (the “acquired” funds) in which the Target Retirement 2035 Fund invests.
The Target Retirement 2035 Fund does not charge any expenses or fees of its own. For the fiscal year ended September 30, 2009, the annualized acquired fund fees and expenses figure was 0.21%.
3 For an explanation of R-squared, beta, and other terms used here, see the Glossary.
4 Target 2035 Composite Index: Derived by applying the fund’s target asset allocation to the results of the following benchmarks: for international stocks of developed markets, the MSCI EAFE Index; for emerging markets stocks, the MSCI Emerging Markets Index; for bonds, the Barclays Capital U.S. Aggregate Bond Index; and for U.S. stocks, the MSCI US Broad Market Index. MSCI EAFE Index returns are adjusted for withholding taxes applicable to Luxembourg holding companies.
21
Target Retirement 2035 Fund
Performance Summary
All of the returns in this report represent past performance, which is not a guarantee of future results that may be achieved by the fund. (Current performance may be lower or higher than the performance data cited. For performance data current to the most recent month-end, visit our website at www.vanguard.com/performance.) Note, too, that both investment returns and principal value can fluctuate widely, so an investor’s shares, when sold, could be worth more or less than their original cost. The returns shown do not reflect taxes that a shareholder would pay on fund distributions or on the sale of fund shares.
Cumulative Performance: October 27, 2003–September 30, 2009
Initial Investment of $10,000
| Average Annual Total Returns | ||||
| Periods Ended September 30, 2009 | Final Value | |||
| Since | of a $10,000 | |||
| One Year | Five Years | Inception1 | Investment | |
| Target Retirement 2035 Fund2 | –1.85% | 2.77% | 3.97% | $12,598 |
| Dow Jones U.S. Total Stock Market Index | –5.83 | 1.93 | 3.33 | 12,141 |
| Target 2035 Composite Index3 | –1.94 | 2.74 | 3.97 | 12,597 |
| Target 2035 Composite Average4 | –1.49 | 2.22 | 3.25 | 12,088 |
1 Performance for the fund and its comparative standards is calculated since the fund’s inception: October 27, 2003.
2 Total returns do not include the account service fee that may be applicable to certain accounts with balances below $10,000.
3 Target 2035 Composite Index: Derived by applying the fund’s target asset allocation to the results of the following benchmarks: for international stocks of developed markets, the MSCI EAFE Index; for emerging markets stocks, the Select Emerging Markets Index from inception through August 23, 2006, and the MSCI Emerging Markets Index thereafter; for bonds, the Barclays Capital U.S. Aggregate Bond Index; and for U.S. stocks, the Dow Jones Wilshire 5000 Index from inception through April 22, 2005, and the MSCI US Broad Market Index thereafter. MSCI EAFE Index returns are adjusted for withholding taxes applicable to Luxembourg holding companies.
4 Target 2035 Composite Average: Derived by applying the fund’s target allocation to the following peer-group averages: the general equity funds average, international funds average, fixed income funds average, and emerging markets funds average. Derived from data provided by Lipper Inc.
22
Target Retirement 2035 Fund
Fiscal-Year Total Returns (%): October 27, 2003–September 30, 2009
1 Target 2035 Composite Index: Derived by applying the fund’s target asset allocation to the results of the following benchmarks: for international stocks of developed markets, the MSCI EAFE Index; for emerging markets stocks, the Select Emerging Markets Index from inception through August 23, 2006, and the MSCI Emerging Markets Index thereafter; for bonds, the Barclays Capital U.S. Aggregate Bond Index; and for U.S. stocks, the Dow Jones Wilshire 5000 Index from inception through April 22, 2005, and the MSCI US Broad Market Index thereafter. MSCI EAFE Index returns are adjusted for withholding taxes applicable to Luxembourg holding companies.
Note: See Financial Highlights table for dividend and capital gains information.
23
Target Retirement 2035 Fund
Financial Statements
Statement of Net Assets
As of September 30, 2009
The fund reports a complete list of its holdings in regulatory filings four times in each fiscal year, at the quarter-ends. For the second and fourth fiscal quarters, the lists appear in the fund’s semiannual and annual reports to shareholders. For the first and third fiscal quarters, the fund files the lists with the Securities and Exchange Commission on Form N-Q. Shareholders can look up the fund’s Forms N-Q on the SEC’s website at www.sec.gov. Forms N-Q may also be reviewed and copied at the SEC’s Public Reference Room (see the back cover of this report for further information).
| Market | ||
| Value• | ||
| Shares | ($000) | |
| Investment Companies (99.9%) | ||
| U.S. Stock Fund (71.8%) | ||
| Vanguard Total Stock Market Index Fund Investor Shares | 186,526,861 | 4,866,486 |
| International Stock Funds (18.1%) | ||
| Vanguard European Stock Index Fund Investor Shares | 23,026,653 | 606,292 |
| Vanguard Pacific Stock Index Fund Investor Shares | 31,906,163 | 315,552 |
| Vanguard Emerging Markets Stock Index Fund Investor Shares | 12,464,720 | 302,020 |
| 1,223,864 | ||
| Bond Fund (10.0%) | ||
| 1 Vanguard Total Bond Market II Index Fund Investor Shares | 65,947,604 | 681,239 |
| Total Investment Companies (Cost $7,260,104) | 6,771,589 | |
| Temporary Cash Investment (0.0%) | ||
| Money Market Fund (0.0%) | ||
| 1 Vanguard Market Liquidity Fund, 0.267% (Cost $1,212) | 1,212,116 | 1,212 |
| Total Investments (99.9%) (Cost $7,261,316) | 6,772,801 | |
| Other Assets and Liabilities (0.1%) | ||
| Other Assets | 65,913 | |
| Liabilities | (58,466) | |
| 7,447 | ||
| Net Assets (100%) | ||
| Applicable to 599,291,097 outstanding $.001 par value shares of | ||
| beneficial interest (unlimited authorization) | 6,780,248 | |
| Net Asset Value Per Share | $11.31 | |
24
| Target Retirement 2035 Fund | |
| At September 30, 2009, net assets consisted of: | |
| Amount | |
| ($000) | |
| Paid-in Capital | 7,226,913 |
| Undistributed Net Investment Income | 73,870 |
| Accumulated Net Realized Losses | (32,020) |
| Unrealized Appreciation (Depreciation) | (488,515) |
| Net Assets | 6,780,248 |
• See Note A in Notes to Financial Statements.
1 Affiliated fund available only to Vanguard funds and certain trusts and accounts managed by Vanguard. Rate shown for Vanguard Market Liquidity Fund is the 7-day yield.
See accompanying Notes, which are an integral part of the Financial Statements.
25
| Target Retirement 2035 Fund | |
| Statement of Operations | |
| Year Ended | |
| September 30, 2009 | |
| ($000) | |
| Investment Income | |
| Income | |
| Income Distributions Received | 140,445 |
| Net Investment Income—Note B | 140,445 |
| Realized Net Gain (Loss) on Investment Securities Sold | (12,432) |
| Change in Unrealized Appreciation (Depreciation) of Investment Securities | 99,154 |
| Net Increase (Decrease) in Net Assets Resulting from Operations | 227,167 |
See accompanying Notes, which are an integral part of the Financial Statements.
26
| Target Retirement 2035 Fund | ||
| Statement of Changes in Net Assets | ||
| Year Ended September 30, | ||
| 2009 | 2008 | |
| ($000) | ($000) | |
| Increase (Decrease) in Net Assets | ||
| Operations | ||
| Net Investment Income | 140,445 | 114,085 |
| Realized Net Gain (Loss) | (12,432) | (9,743) |
| Change in Unrealized Appreciation (Depreciation) | 99,154 | (1,262,430) |
| Net Increase (Decrease) in Net Assets Resulting from Operations | 227,167 | (1,158,088) |
| Distributions | ||
| Net Investment Income | (135,526) | (93,585) |
| Realized Capital Gain | — | — |
| Total Distributions | (135,526) | (93,585) |
| Capital Share Transactions | ||
| Issued | 2,112,231 | 2,228,973 |
| Issued in Lieu of Cash Distributions | 135,056 | 93,310 |
| Redeemed | (588,457) | (594,084) |
| Net Increase (Decrease) from Capital Share Transactions | 1,658,830 | 1,728,199 |
| Total Increase (Decrease) | 1,750,471 | 476,526 |
| Net Assets | ||
| Beginning of Period | 5,029,777 | 4,553,251 |
| End of Period1 | 6,780,248 | 5,029,777 |
| 1 Net Assets—End of Period includes undistributed net investment income of $73,870,000 and $68,951,000. | ||
See accompanying Notes, which are an integral part of the Financial Statements.
27
| Target Retirement 2035 Fund | |||||
| Financial Highlights | |||||
| For a Share Outstanding | Year Ended September 30, | ||||
| Throughout Each Period | 2009 | 2008 | 2007 | 2006 | 2005 |
| Net Asset Value, Beginning of Period | $11.90 | $15.25 | $13.18 | $12.22 | $10.92 |
| Investment Operations | |||||
| Net Investment Income | .2731 | .293 | .270 | .2801 | .2701 |
| Capital Gain Distributions Received | — | — | — | — | — |
| Net Realized and Unrealized Gain (Loss) | |||||
| on Investments | (.564) | (3.353) | 2.060 | .890 | 1.200 |
| Total from Investment Operations | (.291) | (3.060) | 2.330 | 1.170 | 1.470 |
| Distributions | |||||
| Dividends from Net Investment Income | (.299) | (.290) | (.260) | (.210) | (.170) |
| Distributions from Realized Capital Gains | — | — | — | — | — |
| Total Distributions | (.299) | (.290) | (.260) | (.210) | (.170) |
| Net Asset Value, End of Period | $11.31 | $11.90 | $15.25 | $13.18 | $12.22 |
| Total Return2 | –1.85% | –20.42% | 17.87% | 9.70% | 13.53% |
| Ratios/Supplemental Data | |||||
| Net Assets, End of Period (Millions) | $6,780 | $5,030 | $4,553 | $2,562 | $1,092 |
| Ratio of Total Expenses to | |||||
| Average Net Assets | 0%3 | 0% | 0% | 0% | 0% |
| Ratio of Net Investment Income to | |||||
| Average Net Assets | 2.88% | 2.28% | 2.09% | 2.21% | 2.33% |
| Portfolio Turnover Rate | 9%4 | 10% | 1% | 14% | 0% |
1 Calculated based on average shares outstanding.
2 Total returns do not include the account service fee that may be applicable to certain accounts with balances below $10,000. 3 The acquired fund fees and expenses were 0.21%.
4 Excludes the value of mutual fund shares delivered and received in connection with a change in the fund’s bond investments from Vanguard Total Bond Market Index Fund to Vanguard Total Bond Market II Index Fund because those transactions were effected in kind and did not cause the fund to incur transaction costs.
See accompanying Notes, which are an integral part of the Financial Statements.
28
Target Retirement 2035 Fund
Notes to Financial Statements
Vanguard Target Retirement 2035 Fund is registered under the Investment Company Act of 1940 as an open-end investment company, or mutual fund. The fund follows a balanced investment strategy by investing in selected Vanguard funds to achieve its targeted allocation of assets to U.S. stocks, international stocks, and bonds.
A. The following significant accounting policies conform to generally accepted accounting principles for U.S. mutual funds. The fund consistently follows such policies in preparing its financial statements.
1. Security Valuation: Investments are valued at the net asset value of each underlying Vanguard fund determined as of the close of the New York Stock Exchange (generally 4 p.m., Eastern time) on the valuation date.
2. Federal Income Taxes: The fund intends to continue to qualify as a regulated investment company and distribute all of its taxable income. Management has analyzed the fund’s tax positions taken for all open federal income tax years (September 30, 2006–2009), and has concluded that no provision for federal income tax is required in the fund’s financial statements.
3. Distributions: Distributions to shareholders are recorded on the ex-dividend date.
4. Other: Income and capital gain distributions received are recorded on the ex-dividend date. Security transactions are accounted for on the date securities are bought or sold. Costs used to determine realized gains (losses) on the sale of investment securities are those of the specific securities sold.
B. Under a service agreement, The Vanguard Group furnishes investment advisory, corporate management, administrative, marketing, and distribution services to the fund. The service agreement provides that the fund’s expenses may be reduced or eliminated to the extent of savings realized by the Vanguard funds by the operation of the fund. Accordingly, all incremental expenses for services provided by Vanguard and all other expenses incurred by the fund during the year ended September 30, 2009, were borne by the funds in which the fund invests. The fund’s trustees and officers are also directors and officers of Vanguard and the funds in which the fund invests.
C. Various inputs may be used to determine the value of the fund’s investments. These inputs are summarized in three broad levels for financial statement purposes. The inputs or methodologies used to value securities are not necessarily an indication of the risk associated with investing in those securities.
Level 1—Quoted prices in active markets for identical securities.
Level 2—Other significant observable inputs (including quoted prices for similar securities, interest rates, prepayment speeds, credit risk, etc.).
Level 3—Significant unobservable inputs (including the fund’s own assumptions used to determine the fair value of investments).
At September 30, 2009, 100% of the fund’s investments were valued based on Level 1 inputs.
D. Distributions are determined on a tax basis and may differ from net investment income and realized capital gains for financial reporting purposes. Differences may be permanent or temporary. Permanent differences are reclassified among capital accounts in the financial statements to reflect their tax character. Temporary differences arise when certain items of income, expense, gain, or loss are recognized in different periods for financial statement and tax purposes; these differences will reverse at some time in the future. Differences in classification may also result from the treatment of short-term gains as ordinary income for tax purposes.
29
Target Retirement 2035 Fund
For tax purposes, at September 30, 2009, the fund had $73,990,000 of ordinary income available for distribution. The fund had available capital loss carryforwards totaling $19,114,000 to offset future net capital gains of $9,886,000 through September 30, 2015, and $9,228,000 through September 30, 2017. In addition, the fund realized losses of $13,026,000 during the period from November 1, 2008, through September 30, 2009, which are deferred and will be treated as realized for tax purposes in fiscal 2010.
At September 30, 2009, the cost of investment securities for tax purposes was $7,261,316,000. Net unrealized depreciation of investment securities for tax purposes was $488,515,000, consisting of unrealized gains of $40,605,000 on securities that had risen in value since their purchase and $529,120,000 in unrealized losses on securities that had fallen in value since their purchase.
E. During the year ended September 30, 2009, the fund purchased $2,553,648,000 of investment securities and sold $895,429,000 of investment securities, other than temporary cash investments.
| F. Capital shares issued and redeemed were: | ||
| Year Ended September 30, | ||
| 2009 | 2008 | |
| Shares | Shares | |
| (000) | (000) | |
| Issued | 224,509 | 161,252 |
| Issued in Lieu of Cash Distributions | 14,793 | 6,365 |
| Redeemed | (62,583) | (43,526) |
| Net Increase (Decrease) in Shares Outstanding | 176,719 | 124,091 |
G. In preparing the financial statements as of September 30, 2009, management considered the impact of subsequent events occurring through November 6, 2009, for potential recognition or disclosure in these financial statements.
30
Target Retirement 2040 Fund
Fund Profile
As of September 30, 2009
| Financial Attributes | |
| Yield1 | 2.3% |
| Acquired Fund Fees and Expenses2 | 0.19% |
| Volatility Measures3 | |
| Fund Versus | |
| Composite Index4 | |
| R-Squared | 1.00 |
| Beta | 1.00 |
| Allocation to Underlying Vanguard Funds | |
| Total Stock Market Index Fund | 71.9% |
| Total Bond Market II Index Fund | 10.0 |
| European Stock Index Fund | 8.9 |
| Pacific Stock Index Fund | 4.7 |
| Emerging Markets Stock Index Fund | 4.5 |
Fund Asset Allocation
Equity Investment Focus

Fixed Income Investment Focus
1 30-day SEC yield. See the Glossary.
2 This figure—drawn from the prospectus dated January 28, 2009—represents a weighted average of the expense ratios and any transaction fees charged by the underlying mutual funds (the“acquired” funds) in which the Target Retirement 2040 Fund invests.
The Target Retirement 2040 Fund does not charge any expenses or fees of its own. For the fiscal year ended September 30, 2009, the annualized acquired fund fees and expenses figure was 0.21%.
3 For an explanation of R-squared, beta, and other terms used here, see the Glossary.
4 Target 2040 Composite Index: Derived by applying the fund’s target asset allocation to the results of the following benchmarks: for international stocks of developed markets, the MSCI EAFE Index; for emerging markets stocks, the MSCI Emerging Markets Index; for bonds, the Barclays Capital U.S. Aggregate Bond Index; and for U.S. stocks, the MSCI US Broad Market Index. MSCI EAFE Index returns are adjusted for withholding taxes applicable to Luxembourg holding companies.
31
Target Retirement 2040 Fund
Performance Summary
All of the returns in this report represent past performance, which is not a guarantee of future results that may be achieved by the fund. (Current performance may be lower or higher than the performance data cited. For performance data current to the most recent month-end, visit our website at www.vanguard.com/performance.) Note, too, that both investment returns and principal value can fluctuate widely, so an investor’s shares, when sold, could be worth more or less than their original cost. The returns shown do not reflect taxes that a shareholder would pay on fund distributions or on the sale of fund shares.
Cumulative Performance: June 7, 2006–September 30, 2009
Initial Investment of $10,000
| Average Annual Total Returns | Final Value | ||
| Periods Ended September 30, 2009 | of a $10,000 | ||
| One Year | Since Inception1 | Investment | |
| Target Retirement 2040 Fund2 | –1.61% | –0.76% | $9,749 |
| Dow Jones U.S. Total Stock Market Index | –5.83 | –2.51 | 9,193 |
| Target 2040 Composite Index3 | –1.94 | –0.93 | 9,693 |
| Target 2040 Composite Average4 | –1.49 | –1.76 | 9,427 |
1 Performance for the fund and its comparative standards is calculated since the fund’s inception: June 7, 2006.
2 Total returns do not include the account service fee that may be applicable to certain accounts with balances below $10,000.
3 Target 2040 Composite Index: Derived by applying the fund’s target asset allocation to the results of the following benchmarks: for international stocks of developed markets, the MSCI EAFE Index; for emerging markets stocks, the Select Emerging Markets Index from inception through August 23, 2006, and the MSCI Emerging Markets Index thereafter; for bonds, the Barclays Capital U.S. Aggregate Bond Index; and for U.S. stocks, the MSCI US Broad Market Index. MSCI EAFE Index returns are adjusted for withholding taxes applicable to Luxembourg holding companies.
4 Target 2040 Composite Average: Derived by applying the fund’s target allocation to the following peer-group averages: the general equity funds average, international funds average, fixed income funds average, and emerging markets funds average. Derived from data provided by Lipper Inc.
32
Target Retirement 2040 Fund
Fiscal-Year Total Returns (%): June 7, 2006–September 30, 2009
1 Target 2040 Composite Index: Derived by applying the fund’s target asset allocation to the results of the following benchmarks: for international stocks of developed markets, the MSCI EAFE Index; for emerging markets stocks, the Select Emerging Markets Index from inception through August 23, 2006, and the MSCI Emerging Markets Index thereafter; for bonds, the Barclays Capital U.S. Aggregate Bond Index; and for U.S. stocks, the MSCI US Broad Market Index. MSCI EAFE Index returns are adjusted for withholding taxes applicable to Luxembourg holding companies.
Note: See Financial Highlights table for dividend and capital gains information.
33
Target Retirement 2040 Fund
Financial Statements
Statement of Net Assets
As of September 30, 2009
The fund reports a complete list of its holdings in regulatory filings four times in each fiscal year, at the quarter-ends. For the second and fourth fiscal quarters, the lists appear in the fund’s semiannual and annual reports to shareholders. For the first and third fiscal quarters, the fund files the lists with the Securities and Exchange Commission on Form N-Q. Shareholders can look up the fund’s Forms N-Q on the SEC’s website at www.sec.gov. Forms N-Q may also be reviewed and copied at the SEC’s Public Reference Room (see the back cover of this report for further information).
| Market | ||
| Value• | ||
| Shares | ($000) | |
| Investment Companies (99.8%) | ||
| U.S. Stock Fund (71.7%) | ||
| Vanguard Total Stock Market Index Fund Investor Shares | 64,060,074 | 1,671,327 |
| International Stock Funds (18.1%) | ||
| Vanguard European Stock Index Fund Investor Shares | 7,901,808 | 208,055 |
| Vanguard Pacific Stock Index Fund Investor Shares | 10,957,081 | 108,365 |
| Vanguard Emerging Markets Stock Index Fund Investor Shares | 4,307,431 | 104,369 |
| 420,789 | ||
| Bond Fund (10.0%) | ||
| 1 Vanguard Total Bond Market II Index Fund Investor Shares | 22,601,512 | 233,474 |
| Total Investment Companies (Cost $2,408,194) | 2,325,590 | |
| Temporary Cash Investment (0.1%) | ||
| Money Market Fund (0.1%) | ||
| 1 Vanguard Market Liquidity Fund, 0.267% (Cost $1,565) | 1,565,160 | 1,565 |
| Total Investments (99.9%) (Cost $2,409,759) | 2,327,155 | |
| Other Assets and Liabilities (0.1%) | ||
| Other Assets | 37,713 | |
| Liabilities | (34,837) | |
| 2,876 | ||
| Net Assets (100%) | ||
| Applicable to 125,830,513 outstanding $.001 par value shares of | ||
| beneficial interest (unlimited authorization) | 2,330,031 | |
| Net Asset Value Per Share | $18.52 | |
34
| Target Retirement 2040 Fund | |
| At September 30, 2009, net assets consisted of: | |
| Amount | |
| ($000) | |
| Paid-in Capital | 2,388,900 |
| Undistributed Net Investment Income | 23,735 |
| Accumulated Net Realized Gains | — |
| Unrealized Appreciation (Depreciation) | (82,604) |
| Net Assets | 2,330,031 |
• See Note A in Notes to Financial Statements.
1 Affiliated fund available only to Vanguard funds and certain trusts and accounts managed by Vanguard. Rate shown for Vanguard Market Liquidity Fund is the 7-day yield.
See accompanying Notes, which are an integral part of the Financial Statements.
35
| Target Retirement 2040 Fund | |
| Statement of Operations | |
| Year Ended | |
| September 30, 2009 | |
| ($000) | |
| Investment Income | |
| Income | |
| Income Distributions Received | 41,269 |
| Net Investment Income—Note B | 41,269 |
| Realized Net Gain (Loss) on Investment Securities Sold | 5,132 |
| Change in Unrealized Appreciation (Depreciation) of Investment Securities | 134,533 |
| Net Increase (Decrease) in Net Assets Resulting from Operations | 180,934 |
See accompanying Notes, which are an integral part of the Financial Statements.
36
| Target Retirement 2040 Fund | ||
| Statement of Changes in Net Assets | ||
| Year Ended September 30, | ||
| 2009 | 2008 | |
| ($000) | ($000) | |
| Increase (Decrease) in Net Assets | ||
| Operations | ||
| Net Investment Income | 41,269 | 20,451 |
| Realized Net Gain (Loss) | 5,132 | (4,367) |
| Change in Unrealized Appreciation (Depreciation) | 134,533 | (245,843) |
| Net Increase (Decrease) in Net Assets Resulting from Operations | 180,934 | (229,759) |
| Distributions | ||
| Net Investment Income | (31,267) | (10,639) |
| Realized Capital Gain | — | — |
| Total Distributions | (31,267) | (10,639) |
| Capital Share Transactions | ||
| Issued | 1,184,150 | 1,070,554 |
| Issued in Lieu of Cash Distributions | 31,205 | 10,628 |
| Redeemed | (234,075) | (154,452) |
| Net Increase (Decrease) from Capital Share Transactions | 981,280 | 926,730 |
| Total Increase (Decrease) | 1,130,947 | 686,332 |
| Net Assets | ||
| Beginning of Period | 1,199,084 | 512,752 |
| End of Period1 | 2,330,031 | 1,199,084 |
| 1 Net Assets—End of Period includes undistributed net investment income of $23,735,000 and $13,895,000. | ||
See accompanying Notes, which are an integral part of the Financial Statements.
37
| Target Retirement 2040 Fund | ||||
| Financial Highlights | ||||
| June 7, | ||||
| 20061 to | ||||
| Year Ended September 30, | Sept. 30, | |||
| For a Share Outstanding Throughout Each Period | 2009 | 2008 | 2007 | 2006 |
| Net Asset Value, Beginning of Period | $19.36 | $24.70 | $21.13 | $20.00 |
| Investment Operations | ||||
| Net Investment Income | .4352 | .4942 | .4602 | .1602 |
| Capital Gain Distributions Received | — | — | — | — |
| Net Realized and Unrealized Gain (Loss) on Investments | (.849) | (5.464) | 3.290 | .970 |
| Total from Investment Operations | (.414) | (4.970) | 3.750 | 1.130 |
| Distributions | ||||
| Dividends from Net Investment Income | (.426) | (.370) | (.180) | — |
| Distributions from Realized Capital Gains | — | — | — | — |
| Total Distributions | (.426) | (.370) | (.180) | — |
| Net Asset Value, End of Period | $18.52 | $19.36 | $24.70 | $21.13 |
| Total Return3 | –1.61% | –20.40% | 17.83% | 5.65% |
| Ratios/Supplemental Data | ||||
| Net Assets, End of Period (Millions) | $2,330 | $1,199 | $513 | $32 |
| Ratio of Total Expenses to Average Net Assets | 0%4 | 0% | 0% | 0% |
| Ratio of Net Investment Income to Average Net Assets | 2.78% | 2.24% | 1.99% | 1.72%5 |
| Portfolio Turnover Rate | 9%6 | 4% | 4% | 0% |
1 Inception.
2 Calculated based on average shares outstanding.
3 Total returns do not include the account service fee that may be applicable to certain accounts with balances below $10,000. 4 The acquired fund fees and expenses were 0.21%.
5 Annualized.
6 Excludes the value of mutual fund shares delivered and received in connection with a change in the fund’s bond investments from Vanguard Total Bond Market Index Fund to Vanguard Total Bond Market II Index Fund because those transactions were effected in kind and did not cause the fund to incur transaction costs.
See accompanying Notes, which are an integral part of the Financial Statements.
38
Target Retirement 2040 Fund
Notes to Financial Statements
Vanguard Target Retirement 2040 Fund is registered under the Investment Company Act of 1940 as an open-end investment company, or mutual fund. The fund follows a balanced investment strategy by investing in selected Vanguard funds to achieve its targeted allocation of assets to U.S. stocks, international stocks, and bonds.
A. The following significant accounting policies conform to generally accepted accounting principles for U.S. mutual funds. The fund consistently follows such policies in preparing its financial statements.
1. Security Valuation: Investments are valued at the net asset value of each underlying Vanguard fund determined as of the close of the New York Stock Exchange (generally 4 p.m., Eastern time) on the valuation date.
2. Federal Income Taxes: The fund intends to continue to qualify as a regulated investment company and distribute all of its taxable income. Management has analyzed the fund’s tax positions taken for all open federal income tax years (September 30, 2006–2009), and has concluded that no provision for federal income tax is required in the fund’s financial statements.
3. Distributions: Distributions to shareholders are recorded on the ex-dividend date.
4. Other: Income and capital gain distributions received are recorded on the ex-dividend date. Security transactions are accounted for on the date securities are bought or sold. Costs used to determine realized gains (losses) on the sale of investment securities are those of the specific securities sold.
B. Under a service agreement, The Vanguard Group furnishes investment advisory, corporate management, administrative, marketing, and distribution services to the fund. The service agreement provides that the fund’s expenses may be reduced or eliminated to the extent of savings realized by the Vanguard funds by the operation of the fund. Accordingly, all incremental expenses for services provided by Vanguard and all other expenses incurred by the fund during the year ended September 30, 2009, were borne by the funds in which the fund invests. The fund’s trustees and officers are also directors and officers of Vanguard and the funds in which the fund invests.
C. Various inputs may be used to determine the value of the fund’s investments. These inputs are summarized in three broad levels for financial statement purposes. The inputs or methodologies used to value securities are not necessarily an indication of the risk associated with investing in those securities.
Level 1—Quoted prices in active markets for identical securities.
Level 2—Other significant observable inputs (including quoted prices for similar securities, interest rates, prepayment speeds, credit risk, etc.).
Level 3—Significant unobservable inputs (including the fund’s own assumptions used to determine the fair value of investments).
At September 30, 2009, 100% of the fund’s investments were valued based on Level 1 inputs.
D. Distributions are determined on a tax basis and may differ from net investment income and realized capital gains for financial reporting purposes. Differences may be permanent or temporary. Permanent differences are reclassified among capital accounts in the financial statements to reflect their tax character. Temporary differences arise when certain items of income, expense, gain, or loss are recognized in different periods for financial statement and tax purposes; these differences will reverse at some time in the future. Differences in classification may also result from the treatment of short-term gains as ordinary income for tax purposes.
39
Target Retirement 2040 Fund
The fund used a tax accounting practice to treat a portion of the price of capital shares redeemed during the year as distributions from net investment income and realized capital gains. Accordingly, the fund has reclassified $162,000 from undistributed net investment income, and $752,000 from accumulated net realized gains, to paid-in capital.
For tax purposes, at September 30, 2009, the fund had $23,735,000 of ordinary income available for distribution.
At September 30, 2009, the cost of investment securities for tax purposes was $2,409,759,000. Net unrealized depreciation of investment securities for tax purposes was $82,604,000, consisting of unrealized gains of $13,459,000 on securities that had risen in value since their purchase and $96,063,000 in unrealized losses on securities that had fallen in value since their purchase.
E. During the year ended September 30, 2009, the fund purchased $1,246,447,000 of investment securities and sold $256,761,000 of investment securities, other than temporary cash investments.
| F. Capital shares issued and redeemed were: | ||
| Year Ended September 30, | ||
| 2009 | 2008 | |
| Shares | Shares | |
| (000) | (000) | |
| Issued | 77,026 | 47,729 |
| Issued in Lieu of Cash Distributions | 2,090 | 446 |
| Redeemed | (15,227) | (6,997) |
| Net Increase (Decrease) in Shares Outstanding | 63,889 | 41,178 |
G. In preparing the financial statements as of September 30, 2009, management considered the impact of subsequent events occurring through November 6, 2009, for potential recognition or disclosure in these financial statements.
40
Target Retirement 2045 Fund
Fund Profile
As of September 30, 2009
| Financial Attributes | |
| Yield1 | 2.3% |
| Acquired Fund Fees and Expenses2 | 0.18% |
| Volatility Measures3 | |
| Fund Versus | |
| Composite Index4 | |
| R-Squared | 1.00 |
| Beta | 1.00 |
| Allocation to Underlying Vanguard Funds | |
| Total Stock Market Index Fund | 71.9% |
| Total Bond Market II Index Fund | 10.1 |
| European Stock Index Fund | 8.9 |
| Pacific Stock Index Fund | 4.7 |
| Emerging Markets Stock Index Fund | 4.4 |
Fund Asset Allocation
Equity Investment Focus

Fixed Income Investment Focus
1 30-day SEC yield. See the Glossary.
2 This figure—drawn from the prospectus dated January 28, 2009—represents a weighted average of the expense ratios and any transaction fees charged by the underlying mutual funds (the “acquired” funds) in which the Target Retirement 2045 Fund invests.
The Target Retirement 2045 Fund does not charge any expenses or fees of its own. For the fiscal year ended September 30, 2009, the annualized acquired fund fees and expenses figure was 0.21%.
3 For an explanation of R-squared, beta, and other terms used here, see the Glossary.
4 Target 2045 Composite Index: Derived by applying the fund’s target asset allocation to the results of the following benchmarks: for international stocks of developed markets, the MSCI EAFE Index; for emerging markets stocks, the MSCI Emerging Markets Index; for bonds, the Barclays Capital U.S. Aggregate Bond Index; and for U.S. stocks, the MSCI US Broad Market Index. MSCI EAFE Index returns are adjusted for withholding taxes applicable to Luxembourg holding companies.
41
Target Retirement 2045 Fund
Performance Summary
All of the returns in this report represent past performance, which is not a guarantee of future results that may be achieved by the fund. (Current performance may be lower or higher than the performance data cited. For performance data current to the most recent month-end, visit our website at www.vanguard.com/performance.) Note, too, that both investment returns and principal value can fluctuate widely, so an investor’s shares, when sold, could be worth more or less than their original cost. The returns shown do not reflect taxes that a shareholder would pay on fund distributions or on the sale of fund shares.
Cumulative Performance: October 27, 2003–September 30, 2009
Initial Investment of $10,000

| Average Annual Total Returns | ||||
| Periods Ended September 30, 2009 | Final Value | |||
| Since | of a $10,000 | |||
| One Year | Five Years | Inception1 | Investment | |
| Target Retirement 2045 Fund2 | –1.77% | 3.27% | 4.50% | $12,980 |
| Dow Jones U.S. Total Stock Market Index | –5.83 | 1.93 | 3.33 | 12,141 |
| Target 2045 Composite Index3 | –1.94 | 3.20 | 4.47 | 12,958 |
| Target 2045 Composite Average4 | –1.49 | 2.70 | 3.74 | 12,434 |
1 Performance for the fund and its comparative standards is calculated since the fund’s inception: October 27, 2003.
2 Total returns do not include the account service fee that may be applicable to certain accounts with balances below $10,000.
3 Target 2045 Composite Index: Derived by applying the fund’s target asset allocation to the results of the following benchmarks: for international stocks of developed markets, the MSCI EAFE Index; for emerging markets stocks, the Select Emerging Markets Index from inception through August 23, 2006, and the MSCI Emerging Markets Index thereafter; for bonds, the Barclays Capital U.S. Aggregate Bond Index; and for U.S. stocks, the Dow Jones Wilshire 5000 Index from inception through April 22, 2005, and the MSCI US Broad Market Index thereafter. MSCI EAFE Index returns are adjusted for withholding taxes applicable to Luxembourg holding companies.
4 Target 2045 Composite Average: Derived by applying the fund’s target allocation to the following peer-group averages: the general equity funds average, international funds average, fixed income funds average, and emerging markets funds average. Derived from data provided by Lipper Inc.
42
Target Retirement 2045 Fund
Fiscal-Year Total Returns (%): October 27, 2003–September 30, 2009
1 Target 2045 Composite Index: Derived by applying the fund’s target asset allocation to the results of the following benchmarks: for international stocks of developed markets, the MSCI EAFE Index; for emerging markets stocks, the Select Emerging Markets Index from inception through August 23, 2006, and the MSCI Emerging Markets Index thereafter; for bonds, the Barclays Capital U.S. Aggregate Bond Index; and for U.S. stocks, the Dow Jones Wilshire 5000 Index from inception through April 22, 2005, and the MSCI US Broad Market Index thereafter. MSCI EAFE Index returns are adjusted for withholding taxes applicable to Luxembourg holding companies.
Note: See Financial Highlights table for dividend and capital gains information.
43
Target Retirement 2045 Fund
Financial Statements
Statement of Net Assets
As of September 30, 2009
The fund reports a complete list of its holdings in regulatory filings four times in each fiscal year, at the quarter-ends. For the second and fourth fiscal quarters, the lists appear in the fund’s semiannual and annual reports to shareholders. For the first and third fiscal quarters, the fund files the lists with the Securities and Exchange Commission on Form N-Q. Shareholders can look up the fund’s Forms N-Q on the SEC’s website at www.sec.gov. Forms N-Q may also be reviewed and copied at the SEC’s Public Reference Room (see the back cover of this report for further information).
| Market | ||
| Value• | ||
| Shares | ($000) | |
| Investment Companies (99.9%) | ||
| U.S. Stock Fund (71.8%) | ||
| Vanguard Total Stock Market Index Fund Investor Shares | 97,906,453 | 2,554,379 |
| International Stock Funds (18.0%) | ||
| Vanguard European Stock Index Fund Investor Shares | 12,079,665 | 318,058 |
| Vanguard Pacific Stock Index Fund Investor Shares | 16,748,157 | 165,639 |
| Vanguard Emerging Markets Stock Index Fund Investor Shares | 6,485,217 | 157,137 |
| 640,834 | ||
| Bond Fund (10.1%) | ||
| 1 Vanguard Total Bond Market II Index Fund Investor Shares | 34,769,655 | 359,171 |
| Total Investment Companies (Cost $3,774,024) | 3,554,384 | |
| Temporary Cash Investment (0.0%) | ||
| Money Market Fund (0.0%) | ||
| 1 Vanguard Market Liquidity Fund, 0.267% (Cost $1,371) | 1,371,491 | 1,371 |
| Total Investments (99.9%) (Cost $3,775,395) | 3,555,755 | |
| Other Assets and Liabilities (0.1%) | ||
| Other Assets | 21,948 | |
| Liabilities | (17,873) | |
| 4,075 | ||
| Net Assets (100%) | ||
| Applicable to 304,159,591 outstanding $.001 par value shares of | ||
| beneficial interest (unlimited authorization) | 3,559,830 | |
| Net Asset Value Per Share | $11.70 | |
44
| Target Retirement 2045 Fund | |
| At September 30, 2009, net assets consisted of: | |
| Amount | |
| ($000) | |
| Paid-in Capital | 3,743,803 |
| Undistributed Net Investment Income | 38,583 |
| Accumulated Net Realized Losses | (2,916) |
| Unrealized Appreciation (Depreciation) | (219,640) |
| Net Assets | 3,559,830 |
• See Note A in Notes to Financial Statements.
1 Affiliated fund available only to Vanguard funds and certain trusts and accounts managed by Vanguard. Rate shown for Vanguard Market Liquidity Fund is the 7-day yield.
See accompanying Notes, which are an integral part of the Financial Statements.
45
| Target Retirement 2045 Fund | |
| Statement of Operations | |
| Year Ended | |
| September 30, 2009 | |
| ($000) | |
| Investment Income | |
| Income | |
| Income Distributions Received | 71,941 |
| Net Investment Income—Note B | 71,941 |
| Realized Net Gain (Loss) on Investment Securities Sold | 5,006 |
| Change in Unrealized Appreciation (Depreciation) of Investment Securities | 79,123 |
| Net Increase (Decrease) in Net Assets Resulting from Operations | 156,070 |
See accompanying Notes, which are an integral part of the Financial Statements.
46
| Target Retirement 2045 Fund | ||
| Statement of Changes in Net Assets | ||
| Year Ended September 30, | ||
| 2009 | 2008 | |
| ($000) | ($000) | |
| Increase (Decrease) in Net Assets | ||
| Operations | ||
| Net Investment Income | 71,941 | 56,083 |
| Realized Net Gain (Loss) | 5,006 | (7,999) |
| Change in Unrealized Appreciation (Depreciation) | 79,123 | (618,023) |
| Net Increase (Decrease) in Net Assets Resulting from Operations | 156,070 | (569,939) |
| Distributions | ||
| Net Investment Income | (66,481) | (45,796) |
| Realized Capital Gain | — | — |
| Total Distributions | (66,481) | (45,796) |
| Capital Share Transactions | ||
| Issued | 1,270,551 | 1,272,485 |
| Issued in Lieu of Cash Distributions | 66,252 | 45,696 |
| Redeemed | (359,392) | (413,544) |
| Net Increase (Decrease) from Capital Share Transactions | 977,411 | 904,637 |
| Total Increase (Decrease) | 1,067,000 | 288,902 |
| Net Assets | ||
| Beginning of Period | 2,492,830 | 2,203,928 |
| End of Period1 | 3,559,830 | 2,492,830 |
| 1 Net Assets—End of Period includes undistributed net investment income of $38,583,000 and $33,123,000. | ||
See accompanying Notes, which are an integral part of the Financial Statements.
47
| Target Retirement 2045 Fund | |||||
| Financial Highlights | |||||
| For a Share Outstanding | Year Ended September 30, | ||||
| Throughout Each Period | 2009 | 2008 | 2007 | 2006 | 2005 |
| Net Asset Value, Beginning of Period | $12.29 | $15.75 | $13.60 | $12.47 | $10.98 |
| Investment Operations | |||||
| Net Investment Income | .2811 | .303 | .280 | .2701 | .2401 |
| Capital Gain Distributions Received | — | — | — | — | — |
| Net Realized and Unrealized Gain (Loss) | |||||
| on Investments | (.570) | (3.463) | 2.130 | 1.050 | 1.410 |
| Total from Investment Operations | (.289) | (3.160) | 2.410 | 1.320 | 1.650 |
| Distributions | |||||
| Dividends from Net Investment Income | (.301) | (.300) | (.250) | (.190) | (.160) |
| Distributions from Realized Capital Gains | — | — | (.010) | — | — |
| Total Distributions | (.301) | (.300) | (.260) | (.190) | (.160) |
| Net Asset Value, End of Period | $11.70 | $12.29 | $15.75 | $13.60 | $12.47 |
| Total Return2 | –1.77% | –20.42% | 17.90% | 10.70% | 15.09% |
| Ratios/Supplemental Data | |||||
| Net Assets, End of Period (Millions) | $3,560 | $2,493 | $2,204 | $1,186 | $492 |
| Ratio of Total Expenses to | |||||
| Average Net Assets | 0%3 | 0% | 0% | 0% | 0% |
| Ratio of Net Investment Income to | |||||
| Average Net Assets | 2.86% | 2.28% | 2.08% | 2.03% | 2.07% |
| Portfolio Turnover Rate | 10%4 | 9% | 1% | 3% | 7% |
1 Calculated based on average shares outstanding.
2 Total returns do not include the account service fee that may be applicable to certain accounts with balances below $10,000. 3 The acquired fund fees and expenses were 0.21%.
4 Excludes the value of mutual fund shares delivered and received in connection with a change in the fund’s bond investments from Vanguard Total Bond Market Index Fund to Vanguard Total Bond Market II Index Fund because those transactions were effected in kind and did not cause the fund to incur transaction costs.
See accompanying Notes, which are an integral part of the Financial Statements.
48
Target Retirement 2045 Fund
Notes to Financial Statements
Vanguard Target Retirement 2045 Fund is registered under the Investment Company Act of 1940 as an open-end investment company, or mutual fund. The fund follows a balanced investment strategy by investing in selected Vanguard funds to achieve its targeted allocation of assets to U.S. stocks, international stocks, and bonds.
A. The following significant accounting policies conform to generally accepted accounting principles for U.S. mutual funds. The fund consistently follows such policies in preparing its financial statements.
1. Security Valuation: Investments are valued at the net asset value of each underlying Vanguard fund determined as of the close of the New York Stock Exchange (generally 4 p.m., Eastern time) on the valuation date.
2. Federal Income Taxes: The fund intends to continue to qualify as a regulated investment company and distribute all of its taxable income. Management has analyzed the fund’s tax positions taken for all open federal income tax years (September 30, 2006–2009), and has concluded that no provision for federal income tax is required in the fund’s financial statements.
3. Distributions: Distributions to shareholders are recorded on the ex-dividend date.
4. Other: Income and capital gain distributions received are recorded on the ex-dividend date. Security transactions are accounted for on the date securities are bought or sold. Costs used to determine realized gains (losses) on the sale of investment securities are those of the specific securities sold.
B. Under a service agreement, The Vanguard Group furnishes investment advisory, corporate management, administrative, marketing, and distribution services to the fund. The service agreement provides that the fund’s expenses may be reduced or eliminated to the extent of savings realized by the Vanguard funds by the operation of the fund. Accordingly, all incremental expenses for services provided by Vanguard and all other expenses incurred by the fund during the year ended September 30, 2009, were borne by the funds in which the fund invests. The fund’s trustees and officers are also directors and officers of Vanguard and the funds in which the fund invests.
C. Various inputs may be used to determine the value of the fund’s investments. These inputs are summarized in three broad levels for financial statement purposes. The inputs or methodologies used to value securities are not necessarily an indication of the risk associated with investing in those securities.
Level 1—Quoted prices in active markets for identical securities.
Level 2—Other significant observable inputs (including quoted prices for similar securities, interest rates, prepayment speeds, credit risk, etc.).
Level 3—Significant unobservable inputs (including the fund’s own assumptions used to determine the fair value of investments).
At September 30, 2009, 100% of the fund’s investments were valued based on Level 1 inputs.
D. Distributions are determined on a tax basis and may differ from net investment income and realized capital gains for financial reporting purposes. Differences may be permanent or temporary. Permanent differences are reclassified among capital accounts in the financial statements to reflect their tax character. Temporary differences arise when certain items of income, expense, gain, or loss are recognized in different periods for financial statement and tax purposes; these differences will reverse at some time in the future. Differences in classification may also result from the treatment of short-term gains as ordinary income for tax purposes.
49
Target Retirement 2045 Fund
For tax purposes, at September 30, 2009, the fund had $38,735,000 of ordinary income available for distribution. The fund had available capital loss carryforwards totaling $2,203,000 to offset future net capital gains through September 30, 2017. In addition, the fund realized losses of $864,000 during the period from November 1, 2008, through September 30, 2009, which are deferred and will be treated as realized for tax purposes in fiscal 2010.
At September 30, 2009, the cost of investment securities for tax purposes was $3,775,395,000. Net unrealized depreciation of investment securities for tax purposes was $219,640,000, consisting of unrealized gains of $18,121,000 on securities that had risen in value since their purchase and $237,761,000 in unrealized losses on securities that had fallen in value since their purchase.
E. During the year ended September 30, 2009, the fund purchased $1,456,412,000 of investment securities and sold $475,372,000 of investment securities, other than temporary cash investments.
| F. Capital shares issued and redeemed were: | ||
| Year Ended September 30, | ||
| 2009 | 2008 | |
| Shares | Shares | |
| (000) | (000) | |
| Issued | 131,286 | 89,071 |
| Issued in Lieu of Cash Distributions | 7,018 | 3,018 |
| Redeemed | (36,910) | (29,227) |
| Net Increase (Decrease) in Shares Outstanding | 101,394 | 62,862 |
G. In preparing the financial statements as of September 30, 2009, management considered the impact of subsequent events occurring through November 6, 2009, for potential recognition or disclosure in these financial statements.
50
Target Retirement 2050 Fund
Fund Profile
As of September 30, 2009
| Financial Attributes | |
| Yield1 | 2.3% |
| Acquired Fund Fees and Expenses2 | 0.19% |
| Volatility Measures3 | |
| Fund Versus | |
| Composite Index4 | |
| R-Squared | 1.00 |
| Beta | 1.00 |
| Allocation to Underlying Vanguard Funds | |
| Total Stock Market Index Fund | 71.9% |
| Total Bond Market II Index Fund | 10.0 |
| European Stock Index Fund | 8.9 |
| Pacific Stock Index Fund | 4.7 |
| Emerging Markets Stock Index Fund | 4.5 |
Fund Asset Allocation
Equity Investment Focus
Fixed Income Investment Focus
1 30-day SEC yield. See the Glossary.
2 This figure—drawn from the prospectus dated January 28, 2009—represents a weighted average of the expense ratios and any transaction fees charged by the underlying mutual funds (the “acquired” funds) in which the Target Retirement 2050 Fund invests.
The Target Retirement 2050 Fund does not charge any expenses or fees of its own. For the fiscal year ended September 30, 2009, the annualized acquired fund fees and expenses figure was 0.21%.
3 For an explanation of R-squared, beta, and other terms used here, see the Glossary.
4 Target 2050 Composite Index: Derived by applying the fund’s target asset allocation to the results of the following benchmarks: for international stocks of developed markets, the MSCI EAFE Index; for emerging markets stocks, the MSCI Emerging Markets Index; for bonds, the Barclays Capital U.S. Aggregate Bond Index; and for U.S. stocks, the MSCI US Broad Market Index. MSCI EAFE Index returns are adjusted for withholding taxes applicable to Luxembourg holding companies.
51
Target Retirement 2050 Fund
Performance Summary
All of the returns in this report represent past performance, which is not a guarantee of future results that may be achieved by the fund. (Current performance may be lower or higher than the performance data cited. For performance data current to the most recent month-end, visit our website at www.vanguard.com/performance.) Note, too, that both investment returns and principal value can fluctuate widely, so an investor’s shares, when sold, could be worth more or less than their original cost. The returns shown do not reflect taxes that a shareholder would pay on fund distributions or on the sale of fund shares.
Cumulative Performance: June 7, 2006–September 30, 2009
Initial Investment of $10,000
| Average Annual Total Returns | Final Value | ||
| Periods Ended September 30, 2009 | of a $10,000 | ||
| One Year | Since Inception1 | Investment | |
| Target Retirement 2050 Fund2 | –1.73% | –0.64% | $9,789 |
| Dow Jones U.S. Total Stock Market Index | –5.83 | –2.51 | 9,193 |
| Target 2050 Composite Index3 | –1.94 | –0.80 | 9,736 |
| Target 2050 Composite Average4 | –1.49 | –1.63 | 9,469 |
1 Performance for the fund and its comparative standards is calculated since the fund’s inception: June 7, 2006.
2 Total returns do not include the account service fee that may be applicable to certain accounts with balances below $10,000.
3 Target 2050 Composite Index: Derived by applying the fund’s target asset allocation to the results of the following benchmarks: for international stocks of developed markets, the MSCI EAFE Index; for emerging markets stocks, the Select Emerging Markets Index from inception through August 23, 2006, and the MSCI Emerging Markets Index thereafter; for bonds, the Barclays Capital U.S. Aggregate Bond Index; and for U.S. stocks, the MSCI US Broad Market Index. MSCI EAFE Index returns are adjusted for withholding taxes applicable to Luxembourg holding companies.
4 Target 2050 Composite Average: Derived by applying the fund’s target allocation to the following peer-group averages: the general equity funds average, international funds average, fixed income funds average, and emerging markets funds average. Derived from data provided by Lipper Inc.
52
Target Retirement 2050 Fund
Fiscal-Year Total Returns (%): June 7, 2006–September 30, 2009

1 Target 2050 Composite Index: Derived by applying the fund’s target asset allocation to the results of the following benchmarks: for international stocks of developed markets, the MSCI EAFE Index; for emerging markets stocks, the Select Emerging Markets Index from inception through August 23, 2006, and the MSCI Emerging Markets Index thereafter; for bonds, the Barclays Capital U.S. Aggregate Bond Index; and for U.S. stocks, the MSCI US Broad Market Index. MSCI EAFE Index returns are adjusted for withholding taxes applicable to Luxembourg holding companies.
Note: See Financial Highlights table for dividend and capital gains information.
53
Target Retirement 2050 Fund
Financial Statements
Statement of Net Assets
As of September 30, 2009
The fund reports a complete list of its holdings in regulatory filings four times in each fiscal year, at the quarter-ends. For the second and fourth fiscal quarters, the lists appear in the fund’s semiannual and annual reports to shareholders. For the first and third fiscal quarters, the fund files the lists with the Securities and Exchange Commission on Form N-Q. Shareholders can look up the fund’s Forms N-Q on the SEC’s website at www.sec.gov. Forms N-Q may also be reviewed and copied at the SEC’s Public Reference Room (see the back cover of this report for further information).
| Market | ||
| Value• | ||
| Shares | ($000) | |
| Investment Companies (99.7%) | ||
| U.S. Stock Fund (71.7%) | ||
| Vanguard Total Stock Market Index Fund Investor Shares | 25,370,602 | 661,919 |
| International Stock Funds (18.0%) | ||
| Vanguard European Stock Index Fund Investor Shares | 3,129,586 | 82,402 |
| Vanguard Pacific Stock Index Fund Investor Shares | 4,339,996 | 42,922 |
| Vanguard Emerging Markets Stock Index Fund Investor Shares | 1,706,054 | 41,338 |
| 166,662 | ||
| Bond Fund (10.0%) | ||
| 1 Vanguard Total Bond Market II Index Fund Investor Shares | 8,951,364 | 92,468 |
| Total Investment Companies (Cost $925,285) | 921,049 | |
| Temporary Cash Investment (0.1%) | ||
| Money Market Fund (0.1%) | ||
| 1 Vanguard Market Liquidity Fund, 0.267% (Cost $523) | 523,021 | 523 |
| Total Investments (99.8%) (Cost $925,808) | 921,572 | |
| Other Assets and Liabilities (0.2%) | ||
| Other Assets | 7,382 | |
| Liabilities | (5,209) | |
| 2,173 | ||
| Net Assets (100%) | ||
| Applicable to 49,715,159 outstanding $.001 par value shares of | ||
| beneficial interest (unlimited authorization) | 923,745 | |
| Net Asset Value Per Share | $18.58 | |
54
| Target Retirement 2050 Fund | |
| At September 30, 2009, net assets consisted of: | |
| Amount | |
| ($000) | |
| Paid-in Capital | 919,403 |
| Undistributed Net Investment Income | 9,200 |
| Accumulated Net Realized Losses | (622) |
| Unrealized Appreciation (Depreciation) | (4,236) |
| Net Assets | 923,745 |
• See Note A in Notes to Financial Statements.
1 Affiliated fund available only to Vanguard funds and certain trusts and accounts managed by Vanguard. Rate shown for Vanguard Market Liquidity Fund is the 7-day yield.
See accompanying Notes, which are an integral part of the Financial Statements.
55
| Target Retirement 2050 Fund | |
| Statement of Operations | |
| Year Ended | |
| September 30, 2009 | |
| ($000) | |
| Investment Income | |
| Income | |
| Income Distributions Received | 15,677 |
| Net Investment Income—Note B | 15,677 |
| Realized Net Gain (Loss) on Investment Securities Sold | 1,753 |
| Change in Unrealized Appreciation (Depreciation) of Investment Securities | 68,983 |
| Net Increase (Decrease) in Net Assets Resulting from Operations | 86,413 |
See accompanying Notes, which are an integral part of the Financial Statements.
56
| Target Retirement 2050 Fund | ||
| Statement of Changes in Net Assets | ||
| Year Ended September 30, | ||
| 2009 | 2008 | |
| ($000) | ($000) | |
| Increase (Decrease) in Net Assets | ||
| Operations | ||
| Net Investment Income | 15,677 | 7,161 |
| Realized Net Gain (Loss) | 1,753 | (2,001) |
| Change in Unrealized Appreciation (Depreciation) | 68,983 | (83,852) |
| Net Increase (Decrease) in Net Assets Resulting from Operations | 86,413 | (78,692) |
| Distributions | ||
| Net Investment Income | (11,083) | (3,847) |
| Realized Capital Gain | — | — |
| Total Distributions | (11,083) | (3,847) |
| Capital Share Transactions | ||
| Issued | 561,043 | 393,021 |
| Issued in Lieu of Cash Distributions | 11,001 | 3,836 |
| Redeemed | (132,211) | (97,882) |
| Net Increase (Decrease) from Capital Share Transactions | 439,833 | 298,975 |
| Total Increase (Decrease) | 515,163 | 216,436 |
| Net Assets | ||
| Beginning of Period | 408,582 | 192,146 |
| End of Period1 | 923,745 | 408,582 |
| 1 Net Assets—End of Period includes undistributed net investment income of $9,200,000 and $4,832,000. | ||
See accompanying Notes, which are an integral part of the Financial Statements.
57
| Target Retirement 2050 Fund | ||||
| Financial Highlights | ||||
| June 7, | ||||
| 20061 to | ||||
| Year Ended September 30, | Sept. 30, | |||
| For a Share Outstanding Throughout Each Period | 2009 | 2008 | 2007 | 2006 |
| Net Asset Value, Beginning of Period | $19.43 | $24.79 | $21.24 | $20.00 |
| Investment Operations | ||||
| Net Investment Income | .4312 | .5032 | .4802 | .1702 |
| Capital Gain Distributions Received | — | — | — | — |
| Net Realized and Unrealized Gain (Loss) on Investments | (.866) | (5.493) | 3.290 | 1.070 |
| Total from Investment Operations | (.435) | (4.990) | 3.770 | 1.240 |
| Distributions | ||||
| Dividends from Net Investment Income | (.415) | (.370) | (.220) | — |
| Distributions from Realized Capital Gains | — | — | — | — |
| Total Distributions | (.415) | (.370) | (.220) | — |
| Net Asset Value, End of Period | $18.58 | $19.43 | $24.79 | $21.24 |
| Total Return3 | –1.73% | –20.41% | 17.85% | 6.20% |
| Ratios/Supplemental Data | ||||
| Net Assets, End of Period (Millions) | $924 | $409 | $192 | $12 |
| Ratio of Total Expenses to Average Net Assets | 0%4 | 0% | 0% | 0% |
| Ratio of Net Investment Income to Average Net Assets | 2.74% | 2.27% | 2.04% | 1.88%5 |
| Portfolio Turnover Rate | 8%6 | 4% | 2% | 0% |
1 Inception.
2 Calculated based on average shares outstanding.
3 Total returns do not include the account service fee that may be applicable to certain accounts with balances below $10,000. 4 The acquired fund fees and expenses were 0.21%.
5 Annualized.
6 Excludes the value of mutual fund shares delivered and received in connection with a change in the fund’s bond investments from Vanguard Total Bond Market Index Fund to Vanguard Total Bond Market II Index Fund because those transactions were effected in kind and did not cause the fund to incur transaction costs.
See accompanying Notes, which are an integral part of the Financial Statements.
58
Target Retirement 2050 Fund
Notes to Financial Statements
Vanguard Target Retirement 2050 Fund is registered under the Investment Company Act of 1940 as an open-end investment company, or mutual fund. The fund follows a balanced investment strategy by investing in selected Vanguard funds to achieve its targeted allocation of assets to U.S. stocks, international stocks, and bonds.
A. The following significant accounting policies conform to generally accepted accounting principles for U.S. mutual funds. The fund consistently follows such policies in preparing its financial statements.
1. Security Valuation: Investments are valued at the net asset value of each underlying Vanguard fund determined as of the close of the New York Stock Exchange (generally 4 p.m., Eastern time) on the valuation date.
2. Federal Income Taxes: The fund intends to continue to qualify as a regulated investment company and distribute all of its taxable income. Management has analyzed the fund’s tax positions taken for all open federal income tax years (September 30, 2006–2009), and has concluded that no provision for federal income tax is required in the fund’s financial statements.
3. Distributions: Distributions to shareholders are recorded on the ex-dividend date.
4. Other: Income and capital gain distributions received are recorded on the ex-dividend date. Security transactions are accounted for on the date securities are bought or sold. Costs used to determine realized gains (losses) on the sale of investment securities are those of the specific securities sold.
B. Under a service agreement, The Vanguard Group furnishes investment advisory, corporate management, administrative, marketing, and distribution services to the fund. The service agreement provides that the fund’s expenses may be reduced or eliminated to the extent of savings realized by the Vanguard funds by the operation of the fund. Accordingly, all incremental expenses for services provided by Vanguard and all other expenses incurred by the fund during the year ended September 30, 2009, were borne by the funds in which the fund invests. The fund’s trustees and officers are also directors and officers of Vanguard and the funds in which the fund invests.
C. Various inputs may be used to determine the value of the fund’s investments. These inputs are summarized in three broad levels for financial statement purposes. The inputs or methodologies used to value securities are not necessarily an indication of the risk associated with investing in those securities.
Level 1—Quoted prices in active markets for identical securities.
Level 2—Other significant observable inputs (including quoted prices for similar securities, interest rates, prepayment speeds, credit risk, etc.).
Level 3—Significant unobservable inputs (including the fund’s own assumptions used to determine the fair value of investments).
At September 30, 2009, 100% of the fund’s investments were valued based on Level 1 inputs.
D. Distributions are determined on a tax basis and may differ from net investment income and realized capital gains for financial reporting purposes. Differences may be permanent or temporary. Permanent differences are reclassified among capital accounts in the financial statements to reflect their tax character. Temporary differences arise when certain items of income, expense, gain, or loss are recognized in different periods for financial statement and tax purposes; these differences will reverse at some time in the future. Differences in classification may also result from the treatment of short-term gains as ordinary income for tax purposes.
59
Target Retirement 2050 Fund
The fund used a tax accounting practice to treat a portion of the price of capital shares redeemed during the year as distributions from net investment income and realized capital gains. Accordingly, the fund has reclassified $226,000 from undistributed net investment income, and $361,000 from accumulated net realized gains, to paid-in capital.
For tax purposes, at September 30, 2009, the fund had $9,200,000 of ordinary income available for distribution.
At September 30, 2009, the cost of investment securities for tax purposes was $926,430,000. Net unrealized depreciation of investment securities for tax purposes was $4,858,000, consisting of unrealized gains of $7,827,000 on securities that had risen in value since their purchase and $12,685,000 in unrealized losses on securities that had fallen in value since their purchase.
E. During the year ended September 30, 2009, the fund purchased $530,996,000 of investment securities and sold $88,136,000 of investment securities, other than temporary cash investments.
| F. Capital shares issued and redeemed were: | ||
| Year Ended September 30, | ||
| 2009 | 2008 | |
| Shares | Shares | |
| (000) | (000) | |
| Issued | 36,496 | 17,508 |
| Issued in Lieu of Cash Distributions | 734 | 160 |
| Redeemed | (8,548) | (4,386) |
| Net Increase (Decrease) in Shares Outstanding | 28,682 | 13,282 |
G. In preparing the financial statements as of September 30, 2009, management considered the impact of subsequent events occurring through November 6, 2009, for potential recognition or disclosure in these financial statements.
60
Report of Independent Registered Public Accounting Firm
To the Trustees of Vanguard Chester Funds and the Shareholders of Vanguard Target Retirement 2030 Fund, Vanguard Target Retirement 2035 Fund, Vanguard Target Retirement 2040 Fund, Vanguard Target Retirement 2045 Fund and Vanguard Target Retirement 2050 Fund:
In our opinion, the accompanying statements of net assets and the related statements of operations and of changes in net assets and the financial highlights present fairly, in all material respects, the financial position of Vanguard Target Retirement 2030 Fund, Vanguard Target Retirement 2035 Fund, Vanguard Target Retirement 2040 Fund, Vanguard Target Retirement 2045 Fund and Vanguard Target Retirement 2050 Fund (the “Funds”) at September 30, 2009, the results of each of their operations for the year then ended, the changes in each of their net assets for each of the two years in the period then ended and the financial highlights for each of the periods indicated, in conformity with accounting principles generally accepted in the United States of America. These financial statements and financial highlights (hereafter referred to as “financial statements”) are the responsibility of the Fun ds’ management; our responsibility is to express an opinion on these financial statements based on our audits. We conducted our audits of these financial statements in accordance with the standards of the Public Company Accounting Oversight Board (United States). Those standards require that we plan and perform the audit to obtain reasonable assurance about whether the financial statements are free of material misstatement. An audit includes examining, on a test basis, evidence supporting the amounts and disclosures in the financial statements, assessing the accounting principles used and significant estimates made by management, and evaluating the overall financial statement presentation. We believe that our audits, which included confirmation of securities at September 30, 2009 by agreement to the underlying ownership records of the Vanguard funds, provide a reasonable basis for our opinion.
PricewaterhouseCoopers LLP
Philadelphia, Pennsylvania
November 6, 2009
61
Special 2009 tax information (unaudited) for Vanguard Target Retirement Funds
This information for the fiscal period ended September 30, 2009, is included pursuant to provisions of the Internal Revenue Code.
The funds distributed qualified dividend income to shareholders during the fiscal year as follows:
| Qualified Dividend Income | |
| Fund | ($000) |
| Target Retirement 2030 | 44,907 |
| Target Retirement 2035 | 102,810 |
| Target Retirement 2040 | 23,923 |
| Target Retirement 2045 | 50,406 |
| Target Retirement 2050 | 8,519 |
For corporate shareholders, the percentage of investment income (dividend income plus short-term gains, if any) that qualifies for the dividends-received deduction is as follows:
| Fund | Percentage |
| Target Retirement 2030 | 51.0% |
| Target Retirement 2035 | 54.8 |
| Target Retirement 2040 | 57.3 |
| Target Retirement 2045 | 55.3 |
| Target Retirement 2050 | 58.2 |
62
Your Fund’s After-Tax Returns
This table presents returns for your fund both before and after taxes. The after-tax returns are shown in two ways: (1) assuming that an investor owned the fund during the entire period and paid taxes on the fund’s distributions, and (2) assuming that an investor paid taxes on the fund’s distributions and sold all shares at the end of each period.
Calculations are based on the highest individual federal income tax and capital gains tax rates in effect at the times of the distributions and the hypothetical sales. State and local taxes were not considered. After-tax returns reflect any qualified dividend income, using actual prior-year figures and estimates for 2009. (In the example, returns after the sale of fund shares may be higher than those assuming no sale. This occurs when the sale would have produced a capital loss. The calculation assumes that the investor received a tax deduction for the loss.)
Please note that your actual after-tax returns will depend on your tax situation and may differ from those shown. Also note that if you own the fund in a tax-deferred account, such as an individual retirement account or a 401(k) plan, this information does not apply to you. Such accounts are not subject to current taxes.
Finally, keep in mind that a fund’s performance—whether before or after taxes—does not guarantee future results.
63
| Average Annual Total Returns: Vanguard Target Retirement Funds1 | |||
| Periods Ended September 30, 2009 | |||
| One | Five | Since | |
| Year | Years | Inception2 | |
| Target Retirement 2030 Fund | |||
| Returns Before Taxes | –1.13% | — | –0.19% |
| Returns After Taxes on Distributions | –1.73 | — | –0.52 |
| Returns After Taxes on Distributions and Sale of Fund Shares | –0.47 | — | –0.26 |
| Target Retirement 2035 Fund | |||
| Returns Before Taxes | –1.85% | 2.77% | 3.97% |
| Returns After Taxes on Distributions | –2.46 | 2.33 | 3.57 |
| Returns After Taxes on Distributions and Sale of Fund Shares | –0.90 | 2.23 | 3.29 |
| Target Retirement 2040 Fund | |||
| Returns Before Taxes | –1.61% | — | –0.76% |
| Returns After Taxes on Distributions | –2.15 | — | –1.07 |
| Returns After Taxes on Distributions and Sale of Fund Shares | –0.78 | — | –0.72 |
| Target Retirement 2045 Fund | |||
| Returns Before Taxes | –1.77% | 3.27% | 4.50% |
| Returns After Taxes on Distributions | –2.37 | 2.86 | 4.13 |
| Returns After Taxes on Distributions and Sale of Fund Shares | –0.85 | 2.68 | 3.77 |
| Target Retirement 2050 Fund | |||
| Returns Before Taxes | –1.73% | — | –0.64% |
| Returns After Taxes on Distributions | –2.25 | — | –0.95 |
| Returns After Taxes on Distributions and Sale of Fund Shares | –0.86 | — | –0.62 |
1 Total returns do not include the account service fee that may be applicable to certain accounts with balances below $10,000.
2 For the 2035, and 2045 Funds, October 27, 2003; for the 2030, 2040, and 2050 Funds, June 7, 2006.
64
About Your Fund’s Expenses
As a shareholder of the fund, you incur ongoing costs, which include costs for portfolio management, administrative services, and shareholder reports (like this one), among others. Operating expenses, which are deducted from a fund’s gross income, directly reduce the investment return of the fund.
A typical fund’s expenses are expressed as a percentage of its average net assets. The Target Retirement Funds have no direct expenses, but each fund bears its proportionate share of the costs for the underlying funds in which it invests. These indirect expenses make up the acquired fund fees and expenses, also expressed as a percentage of average net assets.
The following examples are intended to help you understand the ongoing costs (in dollars) of investing in your fund and to compare these costs with those of other mutual funds. The examples are based on an investment of $1,000 made at the beginning of the period shown and held for the entire period. The costs were calculated using the acquired fund fees and expenses for each Target Retirement Fund listed.
The accompanying table illustrates your fund’s costs in two ways:
• Based on actual fund return. This section helps you to estimate the actual expenses that you paid over the period. The “Ending Account Value” shown is derived from the fund’s actual return, and the third column shows the dollar amount that would have been paid by an investor who started with $1,000 in the fund. You may use the information here, together with the amount you invested, to estimate the expenses that you paid over the period.
To do so, simply divide your account value by $1,000 (for example, an $8,600 account value divided by $1,000 = 8.6), then multiply the result by the number given for your fund under the heading “Expenses Paid During Period.”
• Based on hypothetical 5% yearly return. This section is intended to help you compare your fund’s costs with those of other mutual funds. It assumes that the fund had a yearly return of 5% before expenses, but that the expense ratio is unchanged. In this case—because the return used is not the fund’s actual return—the results do not apply to your investment. The example is useful in making comparisons, because the Securities and Exchange Commission requires all mutual funds to calculate expenses based on a 5% return. You can assess your fund’s costs by comparing this hypothetical example with the hypothetical examples that appear in shareholder reports of other funds.
Note that the expenses shown in the table are meant to highlight and help you compare ongoing costs only and do not reflect transaction costs incurred by the fund for buying and selling securities. Further, the expenses do not include the account service fee described in the prospectus. If such a fee were applied to your account, your costs would be higher. Your fund does not charge transaction fees, such as purchase or redemption fees, nor does it carry a “sales load.”
The calculations assume no shares were bought or sold during the period. Your actual costs may have been higher or lower, depending on the amount of your investment and the timing of any purchases or redemptions.
You can find more information about the fund’s expenses, including annual expense ratios, in the Financial Statements section of this report. For additional information on operating expenses and other shareholder costs, please refer to your fund’s current prospectus.
65
| Six Months Ended September 30, 2009 | |||
| Beginning | Ending | Expenses | |
| Account Value | Account Value | Paid During | |
| Target Retirement Fund | 3/31/2009 | 9/30/2009 | Period1 |
| Based on Actual Fund Return | |||
| 2030 | $1,000.00 | $1,335.22 | $1.23 |
| 2035 | 1,000.00 | 1,356.12 | 1.24 |
| 2040 | 1,000.00 | 1,355.78 | 1.24 |
| 2045 | 1,000.00 | 1,355.74 | 1.24 |
| 2050 | 1,000.00 | 1,356.20 | 1.24 |
| Based on Hypothetical 5% Yearly Return | |||
| 2030 | $1,000.00 | $1,024.02 | $1.07 |
| 2035 | 1,000.00 | 1,024.02 | 1.07 |
| 2040 | 1,000.00 | 1,024.02 | 1.07 |
| 2045 | 1,000.00 | 1,024.02 | 1.07 |
| 2050 | 1,000.00 | 1,024.02 | 1.07 |
1 The calculations are based on the acquired fund fees and expenses for the most recent six-month period. The funds’ annualized expense figures for that period are (in order as listed from top to bottom above) 0.21%, 0.21%, 0.21%, 0.21%, and 0.21%. The dollar amounts shown as “Expenses Paid” are equal to the annualized expense figures for the underlying funds, multiplied by the average account value over the period, multiplied by the number of days in the most recent six-month period, then divided by the number of days in the most recent 12-month period.
66
Glossary
Acquired Fund Fees and Expenses. Funds that invest in other Vanguard funds incur no direct expenses, but they do bear proportionate shares of the operating, administrative, and advisory expenses of the underlying funds, and they must pay any fees charged by those funds. The figure for acquired fund fees and expenses represents a weighted average of these underlying costs. Acquired is a term that the Securities and Exchange Commission applies to any mutual fund whose shares are owned by another fund.
Beta. A measure of the magnitude of a fund’s past share-price fluctuations in relation to the ups and downs of a given market index. The index is assigned a beta of 1.00. Compared with a given index, a fund with a beta of 1.20 typically would have seen its share price rise or fall by 12% when the index rose or fell by 10%. For this report, beta is based on returns over the past 36 months for both the fund and the index. Note that a fund’s beta should be reviewed in conjunction with its R-squared (see definition). The lower the R-squared, the less correlation there is between the fund and the index, and the less reliable beta is as an indicator of volatility.
Expense Ratio. The percentage of a fund’s average net assets used to pay its annual administrative and advisory expenses. These expenses directly reduce returns to investors.
Inception Date. The date on which the assets of a fund (or one of its share classes) are first invested in accordance with the fund’s investment objective. For funds with a subscription period, the inception date is the day after that period ends. Investment performance is measured from the inception date.
R-Squared. A measure of how much of a fund’s past returns can be explained by the returns from the market in general, as measured by a given index. If a fund’s total returns were precisely synchronized with an index’s returns, its R-squared would be 1.00. If the fund’s returns bore no relationship to the index’s returns, its R-squared would be 0. For this report, R-squared is based on returns over the past 36 months for both the fund and the index.
Yield. A fund’s 30-day SEC yield is derived using a formula specified by the U.S. Securities and Exchange Commission. Under the formula, data related to the fund’s security holdings in the previous 30 days are used to calculate the fund’s hypothetical net income for that period, which is then annualized and divided by the fund’s estimated average net assets over the calculation period. For the purposes of this calculation, a security’s income is based on its current market yield to maturity (in the case of bonds) or its projected dividend yield (for stocks). Because the SEC yield represents hypothetical annualized income, it will differ—at times significantly—from the fund’s actual experience. As a result, the fund’s income distributions may be higher or lower than implied by the SEC yield.
67
The People Who Govern Your Fund
The trustees of your mutual fund are there to see that the fund is operated and managed in your best interests since, as a shareholder, you are a part owner of the fund. Your fund’s trustees also serve on the board of directors of The Vanguard Group, Inc., which is owned by the Vanguard funds and provides services to them on an at-cost basis.
A majority of Vanguard’s board members are independent, meaning that they have no affiliation with Vanguard or the funds they oversee, apart from the sizable personal investments they have made as private individuals. The independent board members have distinguished backgrounds in business, academia, and public service. Each of the trustees and executive officers oversees 156 Vanguard funds.
The following table provides information for each trustee and executive officer of the fund. More information about the trustees is in the Statement of Additional Information, which can be obtained, without charge, by contacting Vanguard at 800-662-7447, or online at www.vanguard.com.
| Interested Trustees | Emerson U. Fullwood |
| Born 1948. Trustee Since January 2008. Principal | |
| John J. Brennan1 | Occupation(s) During the Past Five Years: Executive |
| Born 1954. Trustee Since May 1987. Chairman of | Chief Staff and Marketing Officer for North America |
| the Board. Principal Occupation(s) During the Past | and Corporate Vice President (retired 2008) of Xerox |
| Five Years: Chairman of the Board and Director/Trustee | Corporation (photocopiers and printers); Director of |
| of The Vanguard Group, Inc., and of each of the | SPX Corporation (multi-industry manufacturing), the |
| investment companies served by The Vanguard Group; | United Way of Rochester, the Boy Scouts of America, |
| Chief Executive Officer (1996–2008) and President | Amerigroup Corporation (direct health and medical |
| (1989–2008) of The Vanguard Group and of each of the | insurance carriers), and Monroe Community College |
| investment companies served by The Vanguard Group; | Foundation. |
| Chairman of the Financial Accounting Foundation; | |
| Governor of the Financial Industry Regulatory Authority | Rajiv L. Gupta |
| (FINRA); Director of United Way of Southeastern | Born 1945. Trustee Since December 2001.2 Principal |
| Pennsylvania. | Occupation(s) During the Past Five Years: Chairman |
| and Chief Executive Officer (retired 2009) and President | |
| F. William McNabb III1 | (2006–2008) of Rohm and Haas Co. (chemicals); Board |
| Born 1957. Trustee Since July 2009. Principal | Member of American Chemistry Council; Director of |
| Occupation(s) During the Past Five Years: Director of | Tyco International, Ltd. (diversified manufacturing and |
| The Vanguard Group, Inc., since 2008; Chief Executive | services) and Hewlett-Packard Co. (electronic computer |
| Officer and President of The Vanguard Group and of | manufacturing); Trustee of The Conference Board. |
| each of the investment companies served by The | |
| Vanguard Group since 2008; Director of Vanguard | Amy Gutmann |
| Marketing Corporation; Managing Director of The | Born 1949. Trustee Since June 2006. Principal |
| Vanguard Group (1995–2008). | Occupation(s) During the Past Five Years: President of |
| the University of Pennsylvania; Christopher H. Browne | |
| Distinguished Professor of Political Science in the School | |
| Independent Trustees | of Arts and Sciences with secondary appointments |
| at the Annenberg School for Communication and the | |
| Charles D. Ellis | Graduate School of Education of the University of |
| Born 1937. Trustee Since January 2001. Principal | Pennsylvania; Director of Carnegie Corporation of |
| Occupation(s) During the Past Five Years: Applecore | New York, Schuylkill River Development Corporation, |
| Partners (pro bono ventures in education); Senior | and Greater Philadelphia Chamber of Commerce; |
| Advisor to Greenwich Associates (international business | Trustee of the National Constitution Center. |
| strategy consulting); Successor Trustee of Yale University; | |
| Overseer of the Stern School of Business at New York | |
| University; Trustee of the Whitehead Institute for | |
| Biomedical Research. |
| JoAnn Heffernan Heisen | Executive Officers | |
| Born 1950. Trustee Since July 1998. Principal | ||
| Occupation(s) During the Past Five Years: Corporate | Thomas J. Higgins1 | |
| Vice President and Chief Global Diversity Officer since | Born 1957. Chief Financial Officer Since September | |
| 2006 (retired 2008) and Member of the Executive | 2008. Principal Occupation(s) During the Past Five | |
| Committee (retired 2008) of Johnson & Johnson | Years: Principal of The Vanguard Group, Inc.; Chief | |
| (pharmaceuticals/consumer products); Vice President | Financial Officer of each of the investment companies | |
| and Chief Information Officer of Johnson & Johnson | served by The Vanguard Group since 2008; Treasurer | |
| (1997–2005); Director of the University Medical Center | of each of the investment companies served by The | |
| at Princeton and Women’s Research and Education | Vanguard Group (1998–2008). | |
| Institute. | ||
| Kathryn J. Hyatt1 | ||
| André F. Perold | Born 1955. Treasurer Since November 2008. Principal | |
| Born 1952. Trustee Since December 2004. Principal | Occupation(s) During the Past Five Years: Principal of | |
| Occupation(s) During the Past Five Years: George Gund | The Vanguard Group, Inc.; Treasurer of each of the | |
| Professor of Finance and Banking, Harvard Business | investment companies served by The Vanguard | |
| School; Chairman of UNX, Inc. (equities trading firm); | Group since 2008; Assistant Treasurer of each of the | |
| Chair of the Investment Committee of HighVista | investment companies served by The Vanguard Group | |
| Strategies LLC (private investment firm). | (1988–2008). | |
| Alfred M. Rankin, Jr. | Heidi Stam1 | |
| Born 1941. Trustee Since January 1993. Principal | Born 1956. Secretary Since July 2005. Principal | |
| Occupation(s) During the Past Five Years: Chairman, | Occupation(s) During the Past Five Years: Managing | |
| President, and Chief Executive Officer of NACCO | Director of The Vanguard Group, Inc., since 2006; | |
| Industries, Inc. (forklift trucks/housewares/lignite); | General Counsel of The Vanguard Group since 2005; | |
| Director of Goodrich Corporation (industrial products/ | Secretary of The Vanguard Group and of each of the | |
| aircraft systems and services); Deputy Chairman of | investment companies served by The Vanguard Group | |
| the Federal Reserve Bank of Cleveland. | since 2005; Director and Senior Vice President of | |
| Vanguard Marketing Corporation since 2005; Principal | ||
| Peter F. Volanakis | of The Vanguard Group (1997–2006). | |
| Born 1955. Trustee Since July 2009. Principal | ||
| Occupation(s) During the Past Five Years: President | ||
| since 2007 and Chief Operating Officer since 2005 | Vanguard Senior Management Team | |
| of Corning Incorporated (communications equipment); | ||
| President of Corning Technologies (2001–2005); Director | R. Gregory Barton | Michael S. Miller |
| of Corning Incorporated and Dow Corning; Trustee of | Mortimer J. Buckley | James M. Norris |
| the Corning Incorporated Foundation and the Corning | Kathleen C. Gubanich | Glenn W. Reed |
| Museum of Glass; Overseer of the Amos Tuck School | Paul A. Heller | George U. Sauter |
| of Business Administration at Dartmouth College. | ||
| Founder | ||
| John C. Bogle | ||
| Chairman and Chief Executive Officer, 1974–1996 | ||
1 These individuals are “interested persons” as defined in the Investment Company Act of 1940.
2 December 2002 for Vanguard Equity Income Fund, Vanguard Growth Equity Fund, the Vanguard Municipal Bond Funds, and the Vanguard
State Tax-Exempt Funds.
 | ||
| P.O. Box 2600 | ||
| Valley Forge, PA 19482-2600 | ||
| Connect with Vanguard® > www.vanguard.com | ||
| Fund Information > 800-662-7447 | All comparative mutual fund data are from Lipper Inc. |
| or Morningstar, Inc., unless otherwise noted. | |
| Direct Investor Account Services > 800-662-2739 | |
| Institutional Investor Services > 800-523-1036 | You can obtain a free copy of Vanguard’s proxy voting |
| guidelines by visiting our website, www.vanguard.com, | |
| Text Telephone for People | and searching for “proxy voting guidelines,” or by |
| With Hearing Impairment > 800-952-3335 | calling Vanguard at 800-662-2739. The guidelines are |
| also available from the SEC’s website, www.sec.gov. | |
| In addition, you may obtain a free report on how your | |
| fund voted the proxies for securities it owned during | |
| This material may be used in conjunction | the 12 months ended June 30. To get the report, visit |
| with the offering of shares of any Vanguard | either www.vanguard.com or www.sec.gov. |
| fund only if preceded or accompanied by | |
| the fund’s current prospectus. | You can review and copy information about your fund |
| at the SEC’s Public Reference Room in Washington, D.C. | |
| To find out more about this public service, call the SEC | |
| at 202-551-8090. Information about your fund is also | |
| available on the SEC’s website, and you can receive | |
| copies of this information, for a fee, by sending a | |
| request in either of two ways: via e-mail addressed to | |
| publicinfo@sec.gov or via regular mail addressed to the | |
| Public Reference Section, Securities and Exchange | |
| Commission, Washington, DC 20549-0102. | |
| © 2009 The Vanguard Group, Inc. | |
| All rights reserved. | |
| Vanguard Marketing Corporation, Distributor. | |
| Q3080B 112009 | |
Item 2: Code of Ethics. The Registrant has adopted a code of ethics that applies to the Registrant’s principal executive officer, principal financial officer, principal accounting officer or controller or persons performing similar functions. The Code of Ethics was amended during the reporting period covered by this report to make certain technical, non-material changes.
Item 3: Audit Committee Financial Expert. The following members of the Audit Committee have been determined by the Registrant’s Board of Trustees to be Audit Committee Financial Experts serving on its Audit Committee, and to be independent: Charles D. Ellis, Rajiv L. Gupta, JoAnn Heffernan Heisen, André F. Perold, and Alfred M. Rankin, Jr.
Item 4: Principal Accountant Fees and Services.
(a) Audit Fees.
Audit Fees of the Registrant
Fiscal Year Ended September 30, 2009: $176,000
Fiscal Year Ended September 30, 2008: $168,000
Aggregate Audit Fees of Registered Investment Companies in the Vanguard Group.
Fiscal Year Ended September 30, 2009: $3,354,640
Fiscal Year Ended September 30, 2008: $3,055,590
(b) Audit-Related Fees.
Fiscal Year Ended September 30, 2009: $876,210
Fiscal Year Ended September 30, 2008: $626,240
Includes fees billed in connection with assurance and related services provided to the Registrant, The Vanguard Group, Inc., Vanguard Marketing Corporation, and other registered investment companies in the Vanguard Group.
(c) Tax Fees.
Fiscal Year Ended September 30, 2009: $423,070
Fiscal Year Ended September 30, 2008: $230,400
Includes fees billed in connection with tax compliance, planning and advice services provided to the Registrant, The Vanguard Group, Inc., Vanguard Marketing Corporation, and other registered investment companies in the Vanguard Group and related to income and excise taxes.
(d) All Other Fees.
Fiscal Year Ended September 30, 2009: $0
Fiscal Year Ended September 30, 2008: $0
Includes fees billed for services related to risk management and privacy matters. Services were provided to the Registrant, The Vanguard Group, Inc., Vanguard Marketing Corporation, and other registered investment companies in the Vanguard Group.
(e) (1) Pre-Approval Policies. The policy of the Registrant’s Audit Committee is to consider and, if appropriate, approve before the principal accountant is engaged for such services, all specific audit and non-audit services provided to: (1) the Registrant; (2) The Vanguard Group, Inc.; (3) other entities controlled by The Vanguard Group, Inc. that provide ongoing services to the Registrant; and (4) other registered investment companies in the Vanguard Group. In making a determination, the Audit Committee considers whether the services are consistent with maintaining the principal accountant’s independence.
In the event of a contingency situation in which the principal accountant is needed to provide services in between scheduled Audit Committee meetings, the Chairman of the Audit Committee would be called on to consider and, if appropriate, pre-approve audit or permitted non-audit services in an amount sufficient to complete services through the next Audit Committee meeting, and to determine if such services would be consistent with maintaining the accountant’s independence. At the next scheduled Audit Committee meeting, services and fees would be presented to the Audit Committee for formal consideration, and, if appropriate, approval by the entire Audit Committee. The Audit Committee would again consider whether such services and fees are consistent with maintaining the principal accountant’s independence.
The Registrant’s Audit Committee is informed at least annually of all audit and non-audit services provided by the principal accountant to the Vanguard complex, whether such services are provided to: (1) the Registrant; (2) The Vanguard Group, Inc.; (3) other entities controlled by The Vanguard Group, Inc. that provide ongoing services to the Registrant; or (4) other registered investment companies in the Vanguard Group.
(2) No percentage of the principal accountant’s fees or services were approved pursuant to the waiver provision of paragraph (c)(7)(i)(C) of Rule 2-01 of Regulation S-X.
(f) For the most recent fiscal year, over 50% of the hours worked under the principal accountant’s engagement were not performed by persons other than full-time, permanent employees of the principal accountant.
(g) Aggregate Non-Audit Fees.
Fiscal Year Ended September 30, 2009: $423,070
Fiscal Year Ended September 30, 2008: $230,400
Includes fees billed for non-audit services provided to the Registrant, The Vanguard Group, Inc., Vanguard Marketing Corporation, and other registered investment companies in the Vanguard Group.
(h) For the most recent fiscal year, the Audit Committee has determined that the provision of all non-audit services was consistent with maintaining the principal accountant’s independence.
Item 5: Not Applicable.
Item 6: Not Applicable.
Item 7: Not Applicable.
Item 8: Not Applicable.
Item 9: Not Applicable.
Item 10: Not Applicable.
Item 11: Controls and Procedures.
(a) Disclosure Controls and Procedures. The Principal Executive and Financial Officers concluded that the Registrant's Disclosure Controls and Procedures are effective based on their evaluation of the Disclosure Controls and Procedures as of a date within 90 days of the filing date of this report.
(b) Internal Control Over Financial Reporting. There were no significant changes in Registrant’s Internal Control Over Financial Reporting or in other factors that could significantly affect this control subsequent to the date of the evaluation, including any corrective actions with regard to significant deficiencies and material weaknesses.
Item 12: Exhibits.
(a) Code of Ethics.
(b) Certifications.
Pursuant to the requirements of the Securities Exchange Act of 1934 and the Investment Company Act of 1940, the registrant has duly caused this report to be signed on its behalf by the undersigned, thereunto duly authorized.
| VANGUARD CHESTER FUNDS | |
| By: | /s/ F. WILLIAM MCNABB III* |
| F. WILLIAM MCNABB III | |
| CHIEF EXECUTIVE OFFICER | |
| Date: November 20, 2009 | |
Pursuant to the requirements of the Securities Exchange Act of 1934 and the Investment Company Act of 1940, this report has been signed below by the following persons on behalf of the registrant and in the capacities and on the dates indicated.
| VANGUARD CHESTER FUNDS | |
| By: | /s/ F. WILLIAM MCNABB III* |
| F. WILLIAM MCNABB III | |
| CHIEF EXECUTIVE OFFICER | |
| Date: November 20, 2009 | |
| VANGUARD CHESTER FUNDS | |
| By: | /s/ THOMAS J. HIGGINS* |
| THOMAS J. HIGGINS | |
| CHIEF FINANCIAL OFFICER | |
| Date: November 20, 2009 | |
*By: /s/ Heidi Stam
Heidi Stam, pursuant to a Power of Attorney filed on July 24, 2009, see File Number 2-88373,
and a Power of Attorney filed on October 16, 2009, see File Number 2-52698,
both Incorporated by Reference.