UNITED STATES
SECURITIES AND EXCHANGE COMMISSION
Washington, D.C. 20549
FORM N-CSR
Amendment to filing dated November 26, 2008
CERTIFIED SHAREHOLDER REPORT
OF
REGISTERED MANAGEMENT INVESTMENT COMPANIES
Investment Company Act file number: 811-4098
Name of Registrant: Vanguard Chester Funds
Address of Registrant: | P.O. Box 2600 |
| Valley Forge, PA 19482 |
|
|
Name and address of agent for service: | Heidi Stam, Esquire |
| P.O. Box 876 |
| Valley Forge, PA 19482 |
|
|
Registrant’s telephone number, including area code: (610) 669-1000
Date of fiscal year end: September 30
Date of reporting period: October 1, 2007–September 30, 2008
Item 1: Reports to Shareholders |

Vanguard Target Retirement Funds
Correction to the Annual Report dated September 30, 2008
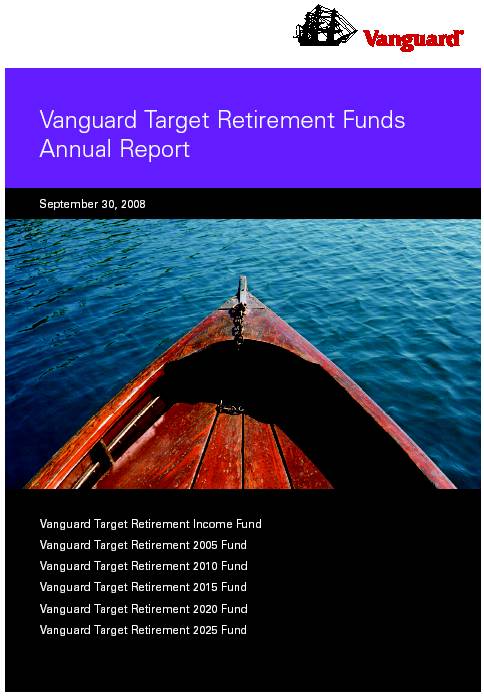
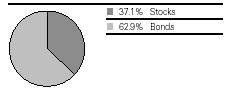
On page 34, the pie chart should have shown the fund asset allocation as 37.1% Bonds, 62.9% Stocks.
© 2008 The Vanguard Group, Inc. All rights reserved. |
|
Vanguard Marketing Corporation, Distributor. | SQ3080 112008 |
> | The broad U.S. stock market retreated –21.2% in the fiscal year ended September 30, 2008, as a year-long credit crunch came to a head. |
> | Helped by strong demand for U.S. Treasury securities, returns from the broad U.S. bond market were positive, providing a bit of a cushion for the Vanguard Target Retirement Funds. |
> | For the 12 months, the returns for the six Target Retirement Funds in this report ranged from –4.2% for the most income-oriented fund to –17.6% for the 2025 fund, which has the highest allocation to equities. |
Contents |
|
|
|
Your Fund’s Total Returns | 1 |
President’s Letter | 2 |
Target Retirement Income Fund | 8 |
Target Retirement 2005 Fund | 17 |
Target Retirement 2010 Fund | 26 |
Target Retirement 2015 Fund | 34 |
Target Retirement 2020 Fund | 43 |
Target Retirement 2025 Fund | 51 |
Your Fund’s After-Tax Returns | 62 |
About Your Fund’s Expenses | 64 |
Glossary | 66 |
Please note: The opinions expressed in this report are just that—informed opinions. They should not be considered promises or advice. Also, please keep in mind that the information and opinions cover the period through the date on the front of this report. Of course, the risks of investing in your fund are spelled out in the prospectus.
Your Fund’s Total Returns
Fiscal Year Ended September 30, 2008 |
|
|
| Ticker | Total |
| Symbol | Returns |
Vanguard Target Retirement Income Fund | VTINX | –4.2% |
Target Income Composite Index1 |
| –4.5 |
Target Income Composite Average2 |
| –7.9 |
|
|
|
Vanguard Target Retirement 2005 Fund | VTOVX | –7.9% |
Target 2005 Composite Index1 |
| –8.0 |
Target 2005 Composite Average2 |
| –11.2 |
|
|
|
Vanguard Target Retirement 2010 Fund | VTENX | –11.3% |
Target 2010 Composite Index1 |
| –11.3 |
Target 2010 Composite Average2 |
| –14.3 |
|
|
|
Vanguard Target Retirement 2015 Fund | VTXVX | –13.7% |
Target 2015 Composite Index1 |
| –13.9 |
Target 2015 Composite Average2 |
| –16.5 |
|
|
|
Vanguard Target Retirement 2020 Fund | VTWNX | –15.6% |
Target 2020 Composite Index1 |
| –15.8 |
Target 2020 Composite Average2 |
| –18.1 |
|
|
|
Vanguard Target Retirement 2025 Fund | VTTVX | –17.6% |
Target 2025 Composite Index1 |
| –17.8 |
Target 2025 Composite Average2 |
| –19.6 |
1 Returns for the composite indexes are derived by applying the funds’ target allocations to the results of the following benchmarks: for U.S. stocks, the Morgan Stanley Capital International (MSCI) US Broad Market Index; for international stocks, the MSCI Europe, Australasia, Far East Index and the MSCI Emerging Markets Index; for bonds, the Lehman U.S. Aggregate Bond Index and the Lehman U.S. Treasury Inflation Notes Index; and for short-term reserves, the Citigroup 3-Month Treasury Bill Index.
2 Each composite average weights the average returns of the appropriate mutual fund peer groups in proportion with the targeted weighting of the specific Target Retirement Fund. All together, the composites use returns for the average fixed income fund, the average Treasury inflation-protected securities fund, the average money market fund, the average general equity fund, the average international fund, and the average emerging markets fund. These returns are derived from data provided by Lipper Inc.
1

President’s Letter
Dear Shareholder,
For the fiscal year ended September 30, 2008, both domestic and international stocks suffered their worst losses since the bear market that ended in 2002. U.S. bond returns were modestly positive, providing a bit of counterbalance for the Target Retirement Funds, particularly those with larger weightings in bonds.
The six Target Retirement Funds included in this report all posted declines consistent with their respective asset allocations. The returns ranged from –4.2% for the Target Retirement Income Fund, which has the heaviest allocation to bonds, to –17.6% for the Target Retirement 2025 Fund, with its heavier weighting in stocks, particularly international equities.
Credit market turbulence weighed heavily on stock prices
Troubles simmering in the credit markets for much of the past year came to a boil at the end of the fiscal period, producing several high-profile bankruptcies and putting severe pressure on stock prices around the world. The broad U.S. stock market returned –21.2% for the 12 months ended September 30. In September alone, stock prices fell more than 9%. International stock markets were similarly disappointing, returning –30.0% for the full 12 months.
2
Policy-makers and elected officials, both in the United States and abroad, responded to the upheavals with dramatic new programs designed to help stabilize the credit markets. As participants struggled to make sense of the markets’ fast-changing dynamics, stock prices were exceptionally volatile, with daily ups and downs of 2 percentage points or more becoming commonplace.
U.S. Treasuries rallied in a nervous market
Nervousness in the stock market was echoed, and even amplified, in the bond market. For the 12 months, the broad U.S. bond market returned 3.7%, largely on the strength of Treasuries—investors’ security of choice in times of duress.
Corporate bonds generally produced negative returns for the period, coming under heavy selling pressure during investors’ flight to safety. Even the municipal market, made up of generally high-quality securities issued by states and municipalities, recorded a negative 12-month return.
The U.S. Federal Reserve Board responded to the turmoil with a dramatic easing of monetary policy. Over the full 12 months, the Fed reduced its target for the federal funds rate from 4.75% to 2.00%. On October 8, shortly after the close of the fiscal period, the Fed cut rates again, to 1.50%. The move was made in coordination with rate cuts by several other central banks.
Market Barometer |
| ||
| Average Annual Total Returns | ||
| Periods Ended September 30, 2008 | ||
| One Year | Three Years | Five Years |
Stocks |
|
|
|
Russell 1000 Index (Large-caps) | –22.1% | 0.1% | 5.5% |
Russell 2000 Index (Small-caps) | –14.5 | 1.8 | 8.1 |
Dow Jones Wilshire 5000 Index (Entire market) | –21.2 | 0.6 | 6.0 |
MSCI All Country World Index ex USA (International) | –30.0 | 3.1 | 11.8 |
|
|
|
|
Bonds |
|
|
|
Lehman U.S. Aggregate Bond Index (Broad taxable market) | 3.7% | 4.2% | 3.8% |
Lehman Municipal Bond Index | –1.9 | 1.9 | 2.8 |
Citigroup 3-Month Treasury Bill Index | 2.6 | 4.0 | 3.1 |
|
|
|
|
CPI |
|
|
|
Consumer Price Index | 4.9% | 3.2% | 3.4% |
3
Funds with higher bond allocations suffered less than the others
During the fiscal year, performance for the Vanguard Target Retirement Funds depended on where each fund stood on the retirement-year spectrum. The best return—although still negative—came from the Target Retirement Income Fund, which is designed for investors in or near retirement. It has the highest exposure to bonds and invests about 5% of its assets in a money market portfolio.
At the other end of the spectrum was the Target Retirement 2025 Fund, which has the most distant retirement date in this group. Consequently, it is the most aggressive of the six funds, with 15% of its assets in international stocks, 63% in U.S. stocks, and 22% in bonds as of September 30. Therefore, its return was the lowest, given the poor performance of stocks.
Each Target Retirement Fund includes a mix of Vanguard stock and bond funds (and in two cases a money market fund), with that mix calibrated according to the fund’s target maturity date. As the retirement date approaches, these mixes gradually shift to become more conservative, and more income-oriented.
The funds designed for investors in or closest to retirement—the Target Retirement Income Fund and the Target
Asset Allocations on September 30, 2008 |
|
|
|
|
|
|
|
|
|
| Short-Term |
| Stocks1 | Bonds | Investments |
Income2 | 30% | 65% | 5% |
2005 | 42 | 56 | 2 |
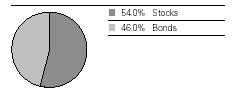
2010 | 54 | 46 | 0 |
2015 | 63 | 37 | 0 |
2020 | 70 | 30 | 0 |
2025 | 78 | 22 | 0 |
1 As of September 30, 2008, international stock weightings for the Income, 2005, 2010, 2015, 2020, and 2025 Funds were 6%, 8%, 11%, 12%, 14%, and 15% of assets, respectively.
2 Allocations do not change.
4
Retirement 2005 Fund—both hold some portion of their assets in Vanguard Prime Money Market Fund and Vanguard Inflation-Protected Securities Fund. The inclusion of these two funds is intended to provide shareholders with a combination of inflation protection and stability. The Inflation-Protected Securities Fund seeks to protect investors against the long-term effects of inflation by investing in bonds with a builtin inflation safeguard.
Over the 12 months, the worst performers among the underlying Vanguard funds represented in the Target Retirement portfolios were the international funds: Vanguard Emerging Markets Stock Index Fund (–32.7%), European Stock Index Fund (–30.0%), and Pacific Stock Index Fund (–27.3%). The Total Stock Market Index Fund, reflecting U.S. equities, returned –21.2%. On the other hand, modest gains were posted by Vanguard
Total Returns |
|
Inception1 through September 30, 2008 |
|
| Average Annual |
| Total Return |
Vanguard Target Retirement Income Fund | 4.2% |
Target Income Composite Index | 4.2 |
Target Income Composite Average2 | 3.1 |
Vanguard Target Retirement 2005 Fund | 4.4% |
Target 2005 Composite Index | 4.4 |
Target 2005 Composite Average2 | 3.3 |
Vanguard Target Retirement 2010 Fund | 2.2% |
Target 2010 Composite Index | 2.2 |
Target 2010 Composite Average2 | 0.1 |
Vanguard Target Retirement 2015 Fund | 4.6% |
Target 2015 Composite Index | 4.6 |
Target 2015 Composite Average2 | 3.5 |
Vanguard Target Retirement 2020 Fund | 1.2% |
Target 2020 Composite Index | 1.1 |
Target 2020 Composite Average2 | –0.7 |
Vanguard Target Retirement 2025 Fund | 4.7% |
Target 2025 Composite Index | 4.6 |
Target 2025 Composite Average2 | 3.7 |
The figures shown represent past performance, which is not a guarantee of future results. (Current performance may be lower or higher than the performance data cited. For performance data current to the most recent month-end, visit our website at www.vanguard.com/performance.) Note, too, that both investment returns and principal value can fluctuate widely, so an investor’s shares, when sold, could be worth more or less than their original cost.
1 For the Income, 2005, 2015, and 2025 Funds, inception was October 27, 2003; for the 2010 and 2020 Funds, inception was June 7, 2006.
2 Derived from data provided by Lipper Inc.
5
Total Bond Market Index Fund (+3.8%) and the Inflation-Protected Securities Fund (+6.2%). The Prime Money Market Fund provided a return of 3.4%.
Low expenses provide a cost-efficient investment
To accomplish their mission of providing broadly diversified investments across asset classes in a mix that becomes more conservative over time, the Target Retirement Funds invest primarily in cost-efficient Vanguard index funds that seek to capture the returns of the broad stock and bond markets.
The funds have provided competitive performance since their inception, as you can see in the table on page 5. The return of each of the Target Retirement Funds falls within 0.1 percentage point of the performance of its composite benchmark index, which reflects market performance without operating costs subtracted. And each fund’s return has outperformed an appropriate composite average based on mutual-fund peer groups.
Over time, the low costs of the Vanguard Target Retirement Funds have provided a distinct advantage. For a look at how the funds’ costs compare with the composite average expenses of peers, please see the table below.
Still a smart way to help keep your retirement plan on track
There’s no doubt the past year has been unsettling for investors. While we cannot predict what will happen in the markets
Expense Ratios |
|
|
Your Fund Compared With Its Peer Group |
|
|
| Acquired Fund | Peer-Group |
| Fees and | Expense |
| Expenses1 | Ratio2 |
Income | 0.19% | 1.11% |
2005 | 0.19 | 1.16 |
2010 | 0.20 | 1.22 |
2015 | 0.19 | 1.27 |
2020 | 0.20 | 1.29 |
2025 | 0.19 | 1.32 |
1 This figure—drawn from the prospectus dated January 25, 2008—represents a weighted average of the annualized expense ratios and any transaction fees charged by the underlying mutual funds (the “acquired” funds) in which the Target Retirement Funds invest. The Target Retirement Funds do not charge any expenses or fees of their own. For the fiscal year ended September 30, 2008, the acquired fund fees and expenses were 0.19% for the Target Retirement Income Fund, 0.18% for the 2005 Fund, 0.19% for the 2010 Fund, 0.18% for the 2015 Fund, 0.19% for the 2020 Fund, and 0.18% for the 2025 Fund.
2 Peer groups are (from top to bottom) the Target Income Composite Average, the Target 2005 Composite Average, the Target 2010 Composite Average, the Target 2015 Composite Average, the Target 2020 Composite Average, and the Target 2025 Composite Average. Each average is a blended composite that weights the returns of the average comparable mutual funds for each asset class in proportion to the target weighting of the appropriate Target Retirement Fund. Peer-group expense ratios are derived from data provided by Lipper Inc. and capture information through year-end 2007.
6
in the future, experienced investors know we have navigated through stormy times before. Through good times and bad, investors who have been in the market over several decades have experienced the benefits of sticking with a long-term investment program, particularly one that relies on a diversified, carefully constructed mix of stock, bond, and money market investments suited to one’s personal goals, time horizon, and tolerance for risk.
As we’ve seen in the past year, even a highly diversified strategy doesn’t prevent sharp losses during times of widespread market turmoil. Over time, however, the principles of broad diversification, careful balance, and low costs have been powerful allies for retirement investors. By investing in a Target Retirement Fund, you have chosen an investment that is designed for your time horizon and is managed to help you meet your needs for a lifetime.
Thank you for your confidence in Vanguard.
Sincerely,

F. William McNabb III
President and Chief Executive Officer
October 13, 2008
Your Fund’s Performance at a Glance | |||||
September 30, 2007–September 30, 2008 | |||||
|
|
|
|
|
|
|
|
| Distributions Per Share |
| |
| Starting | Ending |
|
|
|
| Share | Share | Income | Capital | 30-Day |
| Price | Price | Dividends | Gains | SEC Yield |
Income | $11.08 | $10.19 | $0.439 | $0.000 | 4.28% |
2005 | 12.31 | 10.99 | 0.380 | 0.000 | 4.03 |
2010 | 23.54 | 20.47 | 0.460 | 0.000 | 3.70 |
2015 | 13.49 | 11.34 | 0.340 | 0.000 | 3.41 |
2020 | 24.15 | 20.03 | 0.410 | 0.000 | 3.22 |
2025 | 14.26 | 11.49 | 0.310 | 0.000 | 3.03 |
7
Target Retirement Income Fund
Fund Profile
As of September 30, 2008
Financial Attributes |
|
|
|
Yield1 | 4.3% |
Acquired Fund Fees and Expenses |
|
(9/30/2007)2 | 0.19% |
Volatility Measures3 |
|
| Fund Versus |
| Composite Index4 |
R-Squared | 1.00 |
Beta | 0.99 |
Allocation to Underlying Vanguard Funds |
|
|
|
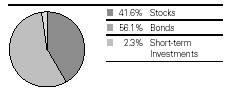
Total Bond Market Index Fund | 45.1% |
Total Stock Market Index Fund | 24.2 |
Inflation-Protected Securities Fund | 19.9 |
Prime Money Market Fund | 5.2 |
European Stock Index Fund | 3.1 |
Pacific Stock Index Fund | 1.4 |
Emerging Markets Stock Index Fund | 1.1 |
Fund Asset Allocation
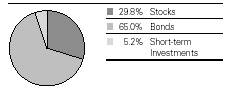
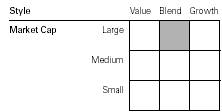
Equity Investment Focus
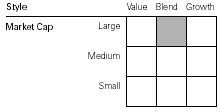
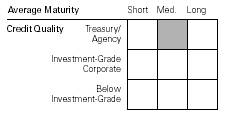
Fixed Income Investment Focus
1 30-day SEC yield for the fund. See the Glossary.
2 This figure—drawn from the prospectus dated January 25, 2008—represents a weighted average of the annualized expense ratios and any transaction fees charged by the underlying mutual funds (the “acquired” funds) in which the Target Retirement Income Fund invests. The Target Retirement Income Fund does not charge any expenses or fees of its own. For the fiscal year ended September 30, 2008, the acquired fund fees and expenses was 0.19%.
3 For an explanation of R-squared, beta, and other terms used here, see the Glossary.
4 Target Income Composite Index: Derived by applying the fund’s target asset allocation to the results of the following benchmarks: for international stocks of developed markets, the MSCI EAFE Index; for emerging markets stocks, the Select Emerging Markets Index from inception through August 23, 2006, and the MSCI Emerging Markets Index thereafter; for bonds, the Lehman U.S. Aggregate Bond Index and the Lehman U.S. Treasury Inflation Notes Index; for short-term reserves, the Citigroup 3-Month Treasury Bill Index; and for U.S. stocks, the Dow Jones Wilshire 5000 Index from inception through April 22, 2005, and the MSCI US Broad Market Index thereafter. MSCI EAFE Index returns are adjusted for withholding taxes applicable to Luxembourg holding companies.
8
Target Retirement Income Fund
Performance Summary
All of the returns in this report represent past performance, which is not a guarantee of future results that may be achieved by the fund. (Current performance may be lower or higher than the performance data cited. For performance data current to the most recent month-end, visit our website at www.vanguard.com/performance.) Note, too, that both investment returns and principal value can fluctuate widely, so an investor’s shares, when sold, could be worth more or less than their original cost. The returns shown do not reflect taxes that a shareholder would pay on fund distributions or on the sale of fund shares.
Cumulative Performance: October 27, 2003–September 30, 2008
Initial Investment of $10,000
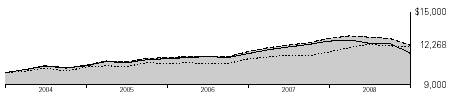
| Average Annual Total Returns | Final Value | |
| Periods Ended September 30, 2008 | of a $10,000 | |
| One Year | Since Inception1 | Investment |
Vanguard Target Retirement Income Fund2 | –4.23% | 4.24% | $12,268 |
Lehman U.S. Aggregate Bond Index | 3.65 | 4.04 | 12,156 |
Target Income Composite Index3 | –4.49 | 4.24 | 12,268 |
Target Income Composite Average4 | –7.91 | 3.08 | 11,613 |
1 Performance for the fund and its comparative standards is calculated since the fund’s inception: October 27, 2003.
2 Total returns do not include the account service fee that may be applicable to certain accounts with balances below $10,000.
3 Target Income Composite Index: Derived by applying the fund’s target asset allocation to the results of the following benchmarks: for international stocks of developed markets, the MSCI EAFE Index; for emerging markets stocks, the Select Emerging Markets Index from inception through August 23, 2006, and the MSCI Emerging Markets Index thereafter; for bonds, the Lehman U.S. Aggregate Bond Index and the Lehman U.S. Treasury Inflation Notes Index; for short-term reserves, the Citigroup 3-Month Treasury Bill Index; and for U.S. stocks, the Dow Jones Wilshire 5000 Index from inception through April 22, 2005, and the MSCI US Broad Market Index thereafter. MSCI EAFE Index returns are adjusted for withholding taxes applicable to Luxembourg holding companies.
4 Target Income Composite Average: Derived by applying the fund’s target allocation to the following peer-group averages: the average fixed income fund, average general equity fund, average Treasury inflation protected securities fund, average money market fund, average international fund, and average emerging markets fund. Derived from data provided by Lipper Inc.
9
Target Retirement Income Fund
Fiscal-Year Total Returns (%): October 27, 2003–September 30, 2008 | ||||
|
|
|
| Target |
|
|
|
| Income |
Fiscal | Capital | Income | Total | Composite |
Year | Return | Return | Return | Index1 |
2004 | 3.3% | 2.9% | 6.2% | 6.3% |
2005 | 2.1 | 3.6 | 5.7 | 5.8 |
2006 | 0.1 | 4.3 | 4.4 | 4.5 |
2007 | 5.3 | 4.1 | 9.4 | 9.3 |
2008 | –8.0 | 3.8 | –4.2 | –4.5 |
1 Target Income Composite Index: Derived by applying the fund’s target asset allocation to the results of the following benchmarks: for international stocks of developed markets, the MSCI EAFE Index; for emerging markets stocks, the Select Emerging Markets Index from inception through August 23, 2006, and the MSCI Emerging Markets Index thereafter; for bonds, the Lehman U.S. Aggregate Bond Index and the Lehman U.S. Treasury Inflation Notes Index; for short-term reserves, the Citigroup 3-Month Treasury Bill Index; and for U.S. stocks, the Dow Jones Wilshire 5000 Index from inception through April 22, 2005, and the MSCI US Broad Market Index thereafter. MSCI EAFE Index returns are adjusted for withholding taxes applicable to Luxembourg holding companies.
Note: See Financial Highlights table for dividend and capital gains information.
10
Target Retirement Income Fund
Financial Statements
Statement of Net Assets
As of September 30, 2008
The fund provides a complete list of its holdings four times in each fiscal year, at the quarter-ends. For the second and fourth fiscal quarters, the lists appear in the fund’s semiannual and annual reports to shareholders. For the first and third fiscal quarters, the fund files the lists with the Securities and Exchange Commission on Form N-Q. Shareholders can look up the fund’s Forms N-Q on the SEC’s website at www.sec.gov. Forms N-Q may also be reviewed and copied at the SEC’s Public Reference Room (see the back cover of this report for further information).
|
| Market |
|
| Value• |
| Shares | ($000) |
Investment Companies (100.0%) |
|
|
U.S. Stock Fund (24.2%) |
|
|
Vanguard Total Stock Market Index Fund Investor Shares | 17,413,487 | 494,891 |
|
|
|
International Stock Funds (5.6%) |
|
|
Vanguard European Stock Index Fund Investor Shares | 2,250,461 | 63,260 |
Vanguard Pacific Stock Index Fund Investor Shares | 3,009,196 | 29,280 |
Vanguard Emerging Markets Stock Index Fund Investor Shares | 1,071,378 | 23,195 |
|
|
|
Bond Funds (65.0%) |
|
|
Vanguard Total Bond Market Index Fund Investor Shares | 93,400,281 | 921,861 |
Vanguard Inflation-Protected Securities Fund Investor Shares | 33,970,226 | 407,643 |
|
|
|
Money Market Fund (5.2%) |
|
|
Vanguard Prime Money Market Fund Investor Shares | 105,922,330 | 105,922 |
Total Investment Companies (Cost $2,148,988) |
| 2,046,052 |
Other Assets and Liabilities (0.0%) |
|
|
Other Assets |
| 18,531 |
Liabilities |
| (18,388) |
|
| 143 |
Net Assets (100%) |
|
|
Applicable to 200,755,665 outstanding $.001 par value shares of |
|
|
beneficial interest (unlimited authorization) |
| 2,046,195 |
Net Asset Value Per Share |
| $10.19 |
|
|
|
|
|
|
At September 30, 2008, net assets consisted of: |
|
|
|
| Amount |
|
| ($000) |
Paid-in Capital |
| 2,156,516 |
Undistributed Net Investment Income |
| 1,697 |
Accumulated Net Realized Losses |
| (9,082) |
Unrealized Appreciation (Depreciation) |
| (102,936) |
Net Assets |
| 2,046,195 |
• | See Note A in Notes to Financial Statements. |
See accompanying Notes, which are an integral part of the Financial Statements.
11
Target Retirement Income Fund
Statement of Operations
| Year Ended |
| September 30, 2008 |
| ($000) |
Investment Income |
|
Income |
|
Income Distributions Received | 73,806 |
Net Investment Income—Note B | 73,806 |
Realized Net Gain (Loss) |
|
Capital Gain Distributions Received | — |
Investment Securities Sold | (4,008) |
Realized Net Gain (Loss) | (4,008) |
Change in Unrealized Appreciation (Depreciation) of Investment Securities | (166,391) |
Net Increase (Decrease) in Net Assets Resulting from Operations | (96,593) |
See accompanying Notes, which are an integral part of the Financial Statements.
12
Target Retirement Income Fund
Statement of Changes in Net Assets
| Year Ended September 30, | |
| 2008 | 2007 |
| ($000) | ($000) |
Increase (Decrease) in Net Assets |
|
|
Operations |
|
|
Net Investment Income | 73,806 | 41,580 |
Realized Net Gain (Loss) | (4,008) | 373 |
Change in Unrealized Appreciation (Depreciation) | (166,391) | 50,792 |
Net Increase (Decrease) in Net Assets Resulting from Operations | (96,593) | 92,745 |
Distributions |
|
|
Net Investment Income | (74,307) | (40,667) |
Realized Capital Gain | — | — |
Total Distributions | (74,307) | (40,667) |
Capital Share Transactions |
|
|
Issued | 1,279,636 | 676,276 |
Issued in Lieu of Cash Distributions | 69,952 | 37,472 |
Redeemed | (468,082) | (251,865) |
Net Increase (Decrease) from Capital Share Transactions | 881,506 | 461,883 |
Total Increase (Decrease) | 710,606 | 513,961 |
Net Assets |
|
|
Beginning of Period | 1,335,589 | 821,628 |
End of Period1 | 2,046,195 | 1,335,589 |
1 Net Assets—End of Period includes undistributed net investment income of $1,697,000 and $2,198,000.
See accompanying Notes, which are an integral part of the Financial Statements.
13
Target Retirement Income Fund
Financial Highlights
|
|
|
|
| Sept. 1, | Oct. 27, |
|
|
|
|
| 2004, to | 20032 to |
For a Share Outstanding | Year Ended September 30, | Sept. 30, | Aug. 31, | |||
Throughout Each Period | 2008 | 2007 | 2006 | 2005 | 20041 | 2004 |
Net Asset Value, Beginning of Period | $11.08 | $10.52 | $10.52 | $10.31 | $10.34 | $10.00 |
Investment Operations |
|
|
|
|
|
|
Net Investment Income | .427 | .4303 | .4393 | .3993 | .060 | .235 |
Capital Gain Distributions Received | — | — | .0033 | .0223 | — | .015 |
Net Realized and Unrealized Gain (Loss) |
|
|
|
|
|
|
on Investments | (.878) | .540 | .003 | .163 | (.010) | .310 |
Total from Investment Operations | (.451) | .970 | .445 | .584 | .050 | .560 |
Distributions |
|
|
|
|
|
|
Dividends from Net Investment Income | (.439) | (.410) | (.430) | (.370) | (.080) | (.205) |
Distributions from Realized Capital Gains | — | — | (.015) | (.004) | — | (.015) |
Total Distributions | (.439) | (.410) | (.445) | (.374) | (.080) | (.220) |
Net Asset Value, End of Period | $10.19 | $11.08 | $10.52 | $10.52 | $10.31 | $10.34 |
|
|
|
|
|
|
|
Total Return4 | –4.23% | 9.36% | 4.36% | 5.73% | 0.48% | 5.65% |
|
|
|
|
|
|
|
Ratios/Supplemental Data |
|
|
|
|
|
|
Net Assets, End of Period (Millions) | $2,046 | $1,336 | $822 | $677 | $315 | $297 |
Ratio of Total Expenses to |
|
|
|
|
|
|
Average Net Assets | 0%5 | 0% | 0% | 0% | 0% | 0% |
Ratio of Net Investment Income to |
|
|
|
|
|
|
Average Net Assets | 4.11% | 4.03% | 4.21% | 3.80% | 3.96%6 | 3.62%6 |
Portfolio Turnover Rate | 14% | 3% | 22% | 0% | 0% | 1% |
1 The fund’s fiscal year-end changed from August 31 to September 30, effective September 30, 2004.
2 Inception.
3 Calculated based on average shares outstanding.
4 Total returns do not include the account service fee that may be applicable to certain accounts with balances below $10,000.
5 The acquired fund fees and expenses were 0.19%.
6 Annualized.
See accompanying Notes, which are an integral part of the Financial Statements.
14
Target Retirement Income Fund
Notes to Financial Statements
Vanguard Target Retirement Income Fund is registered under the Investment Company Act of 1940 as an open-end investment company, or mutual fund. The fund follows a balanced investment strategy by investing in selected Vanguard funds to achieve its targeted allocation of assets to U.S. stocks, international stocks, bonds, and short-term reserves.
A. The following significant accounting policies conform to generally accepted accounting principles for U.S. mutual funds. The fund consistently follows such policies in preparing its financial statements.
1. Security Valuation: Investments are valued at the net asset value of each underlying Vanguard fund determined as of the close of the New York Stock Exchange (generally 4 p.m., Eastern time) on the valuation date.
2. Federal Income Taxes: The fund intends to continue to qualify as a regulated investment company and distribute all of its taxable income. Management has analyzed the fund’s tax positions taken on federal income tax returns for all open tax years (tax years ended September 30, 2005–2008), and has concluded that no provision for federal income tax is required in the fund’s financial statements.
3. Distributions: Distributions to shareholders are recorded on the ex-dividend date.
4. Other: Income and capital gain distributions received are recorded on the ex-dividend date. Security transactions are accounted for on the date securities are bought or sold. Costs used to determine realized gains (losses) on the sale of investment securities are those of the specific securities sold.
B. Under a service agreement, The Vanguard Group furnishes investment advisory, corporate management, administrative, marketing, and distribution services to the fund. The service agreement provides that the fund’s expenses may be reduced or eliminated to the extent of savings realized by the Vanguard funds by the operation of the fund. Accordingly, all incremental expenses for services provided by Vanguard and all other expenses incurred by the fund during the year ended September 30, 2008, were borne by the funds in which the fund invests. The fund’s trustees and officers are also directors and officers of Vanguard and the funds in which the fund invests.
C. Distributions are determined on a tax basis and may differ from net investment income and realized capital gains for financial reporting purposes. Differences may be permanent or temporary. Permanent differences are reclassified among capital accounts in the financial statements to reflect their tax character. Temporary differences arise when certain items of income, expense, gain, or loss are recognized in different periods for financial statement and tax purposes; these differences will reverse at some time in the future. Differences in classification may also result from the treatment of short-term gains as ordinary income for tax purposes.
For tax purposes, at September 30, 2008, the fund had $1,709,000 of ordinary income available for distribution. The fund had available realized losses of $4,561,000 to offset future net capital gains through September 30, 2015.
At September 30, 2008, the cost of investment securities for tax purposes was $2,153,521,000. Net unrealized depreciation of investment securities for tax purposes was $107,469,000, consisting entirely of unrealized losses on securities that had fallen in value since their purchase.
D. During the year ended September 30, 2008, the fund purchased $1,136,485,000 of investment securities and sold $254,581,000 of investment securities, other than temporary cash investments.
15
Target Retirement Income Fund
E. Capital shares issued and redeemed were:
| Year Ended September 30, | |
| 2008 | 2007 |
| Shares | Shares |
| (000) | (000) |
Issued | 116,714 | 62,175 |
Issued in Lieu of Cash Distributions | 6,507 | 3,453 |
Redeemed | (42,975) | (23,195) |
Net Increase (Decrease) in Shares Outstanding | 80,246 | 42,433 |
F. In September 2006, the Financial Accounting Standards Board issued Statement of Financial Accounting Standards No. 157 (“FAS 157”), “Fair Value Measurements.” FAS 157 establishes a framework for measuring fair value and expands disclosures about fair value measurements in financial statements.
The various inputs that may be used to determine the value of the fund’s investments are summarized in three broad levels. The inputs or methodologies used for valuing securities are not necessarily an indication of the risk associated with investing in those securities.
Level 1—Quoted prices in active markets for identical securities.
Level 2—Other significant observable inputs (including quoted prices for similar securities, interest rates, prepayment speeds, credit risk, etc.).
Level 3—Significant unobservable inputs (including the fund’s own assumptions used to determine the fair value of investments).
At September 30, 2008, 100% of the fund’s investments were valued based on Level 1 inputs.
16
Target Retirement 2005 Fund
Fund Profile
As of September 30, 2008
Financial Attributes |
|
|
|
Yield1 | 4.0% |
Acquired Fund Fees and Expenses |
|
(9/30/2007)2 | 0.19% |
Volatility Measures3 |
|
| Fund Versus |
| Composite Index4 |
R-Squared | 1.00 |
Beta | 0.99 |
Allocation to Underlying Vanguard Funds |
|
|
|
Total Bond Market Index Fund | 41.9% |
Total Stock Market Index Fund | 33.4 |
Inflation-Protected Securities Fund | 14.2 |
European Stock Index Fund | 4.6 |
Prime Money Market Find | 2.3 |
Pacific Stock Index Fund | 2.0 |
Emerging Markets Stock Index Fund | 1.6 |
Fund Asset Allocation
Equity Investment Focus
Fixed Income Investment Focus
1 30-day SEC yield for the fund. See the Glossary.
2 This figure—drawn from the prospectus dated January 25, 2008—represents a weighted average of the annualized expense ratios and any transaction fees charged by the underlying mutual funds (the “acquired” funds) in which the Target Retirement 2005 Fund invests. The Target Retirement 2005 Fund does not charge any expenses or fees of its own. For the fiscal year ended September 30, 2008, the acquired fund fees and expenses was 0.18%.
3 For an explanation of R-squared, beta, and other terms used here, see the Glossary.
4 Target 2005 Composite Index: Derived by applying the fund’s target asset allocation to the results of the following benchmarks: for international stocks of developed markets, the MSCI EAFE Index; for emerging markets stocks, the Select Emerging Markets Index from inception through August 23, 2006, and the MSCI Emerging Markets Index thereafter; for bonds, the Lehman U.S. Aggregate Bond Index and the Lehman U.S. Treasury Inflation Notes Index; for short-term reserves, the Citigroup 3-Month Treasury Bill Index; and for U.S. stocks, the Dow Jones Wilshire 5000 Index from inception through April 22, 2005, and the MSCI US Broad Market Index thereafter. MSCI EAFE Index returns are adjusted for withholding taxes applicable to Luxembourg holding companies.
17
Target Retirement 2005 Fund
Performance Summary
All of the returns in this report represent past performance, which is not a guarantee of future results that may be achieved by the fund. (Current performance may be lower or higher than the performance data cited. For performance data current to the most recent month-end, visit our website at www.vanguard.com/performance.) Note, too, that both investment returns and principal value can fluctuate widely, so an investor’s shares, when sold, could be worth more or less than their original cost. The returns shown do not reflect taxes that a shareholder would pay on fund distributions or on the sale of fund shares.
Cumulative Performance: October 27, 2003–September 30, 2008
Initial Investment of $10,000
| Average Annual Total Returns | Final Value | |
| Periods Ended September 30, 2008 | of a $10,000 | |
| One Year | Since Inception1 | Investment |
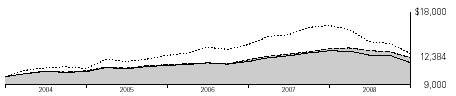
Vanguard Target Retirement 2005 Fund2 | –7.89% | 4.43% | $12,384 |
Dow Jones Wilshire 5000 Index | –21.20 | 5.29 | 12,893 |
Target 2005 Composite Index3 | –7.99 | 4.44 | 12,385 |
Target 2005 Composite Average4 | –11.16 | 3.31 | 11,738 |
1 Performance for the fund and its comparative standards is calculated since the fund’s inception: October 27, 2003.
2 Total returns do not include the account service fee that may be applicable to certain accounts with balances below $10,000.
3 Target 2005 Composite Index: Derived by applying the fund’s target asset allocation to the results of the following benchmarks: for international stocks of developed markets, the MSCI EAFE Index; for emerging markets stocks, the Select Emerging Markets Index from inception through August 23, 2006, and the MSCI Emerging Markets Index thereafter; for bonds, the Lehman U.S. Aggregate Bond Index and the Lehman U.S. Treasury Inflation Notes Index; for short-term reserves, the Citigroup 3-Month Treasury Bill Index; and for U.S. stocks, the Dow Jones Wilshire 5000 Index from inception through April 22, 2005, and the MSCI US Broad Market Index thereafter. MSCI EAFE Index returns are adjusted for withholding taxes applicable to Luxembourg holding companies.
4 Target 2005 Composite Average: Derived by applying the fund’s target allocation to the following peer-group averages: the average fixed income fund, average general equity fund, average Treasury inflation protected securities fund, average international fund, average money market fund, and average emerging markets fund. Derived from data provided by Lipper Inc.
18
Target Retirement 2005 Fund
Fiscal-Year Total Returns (%): October 27, 2003–September 30, 2008 | ||||
|
|
|
| Target |
|
|
|
| 2005 |
Fiscal | Capital | Income | Total | Composite |
Year | Return | Return | Return | Index1 |
2004 | 6.6% | 0.6% | 7.2% | 7.3% |
2005 | 4.6 | 2.4 | 7.0 | 7.1 |
2006 | 2.2 | 2.9 | 5.1 | 5.2 |
2007 | 8.2 | 3.4 | 11.6 | 11.3 |
2008 | –10.7 | 2.8 | –7.9 | –8.0 |
1 Target 2005 Composite Index: Derived by applying the fund’s target asset allocation to the results of the following benchmarks: for international stocks of developed markets, the MSCI EAFE Index; for emerging markets stocks, the Select Emerging Markets Index from inception through August 23, 2006, and the MSCI Emerging Markets Index thereafter; for bonds, the Lehman U.S. Aggregate Bond Index and the Lehman U.S. Treasury Inflation Notes Index; for short-term reserves, the Citigroup 3-Month Treasury Bill Index; and for U.S. stocks, the Dow Jones Wilshire 5000 Index from inception through April 22, 2005, and the MSCI US Broad Market Index thereafter. MSCI EAFE Index returns are adjusted for withholding taxes applicable to Luxembourg holding companies.
Note: See Financial Highlights table for dividend and capital gains information.
19
Target Retirement 2005 Fund
Financial Statements
Statement of Net Assets
As of September 30, 2008
The fund provides a complete list of its holdings four times in each fiscal year, at the quarter-ends. For the second and fourth fiscal quarters, the lists appear in the fund’s semiannual and annual reports to shareholders. For the first and third fiscal quarters, the fund files the lists with the Securities and Exchange Commission on Form N-Q. Shareholders can look up the fund’s Forms N-Q on the SEC’s website at www.sec.gov. Forms N-Q may also be reviewed and copied at the SEC’s Public Reference Room (see the back cover of this report for further information).
|
| Market |
|
| Value• |
| Shares | ($000) |
Investment Companies (100.2%) |
|
|
U.S. Stock Funds (33.4%) |
|
|
Vanguard Total Stock Market Index Fund Investor Shares | 20,473,919 | 581,869 |
Vanguard Total Stock Market ETF | 146,512 | 8,678 |
|
|
|
International Stock Funds (8.2%) |
|
|
Vanguard European Stock Index Fund Investor Shares | 2,879,615 | 80,946 |
Vanguard Pacific Stock Index Fund Investor Shares | 3,668,266 | 35,692 |
Vanguard Emerging Markets Stock Index Fund Investor Shares | 1,288,881 | 27,904 |
|
|
|
Bond Funds (56.3%) |
|
|
Vanguard Total Bond Market Index Fund Investor Shares | 75,305,391 | 743,264 |
Vanguard Inflation-Protected Securities Fund Investor Shares | 20,974,789 | 251,698 |
|
|
|
Money Market Fund (2.3%) |
|
|
Vanguard Prime Money Market Fund Investor Shares | 39,871,799 | 39,872 |
Total Investment Companies (Cost $1,862,046) |
| 1,769,923 |
Other Assets and Liabilities (–0.2%) |
|
|
Other Assets |
| 19,790 |
Liabilities |
| (22,762) |
|
| (2,972) |
Net Assets (100%) |
|
|
Applicable to 160,821,189 outstanding $.001 par value shares of |
|
|
beneficial interest (unlimited authorization) |
| 1,766,951 |
Net Asset Value Per Share |
| $10.99 |
|
|
|
|
|
|
At September 30, 2008, net assets consisted of: |
|
|
|
| Amount |
|
| ($000) |
Paid-in Capital |
| 1,822,751 |
Undistributed Net Investment Income |
| 47,138 |
Accumulated Net Realized Losses |
| (10,815) |
Unrealized Appreciation (Depreciation) |
| (92,123) |
Net Assets |
| 1,766,951 |
• | See Note A in Notes to Financial Statements. |
See accompanying Notes, which are an integral part of the Financial Statements.
20
Target Retirement 2005 Fund
Statement of Operations
| Year Ended |
| September 30, 2008 |
| ($000) |
Investment Income |
|
Income |
|
Income Distributions Received | 63,474 |
Net Investment Income—Note B | 63,474 |
Realized Net Gain (Loss) |
|
Capital Gain Distributions Received | — |
Investment Securities Sold | (5,945) |
Realized Net Gain (Loss) | (5,945) |
Change in Unrealized Appreciation (Depreciation) of Investment Securities | (206,608) |
Net Increase (Decrease) in Net Assets Resulting from Operations | (149,079) |
See accompanying Notes, which are an integral part of the Financial Statements.
21
Target Retirement 2005 Fund
Statement of Changes in Net Assets
| Year Ended September 30, | |
| 2008 | 2007 |
| ($000) | ($000) |
Increase (Decrease) in Net Assets |
|
|
Operations |
|
|
Net Investment Income | 63,474 | 42,868 |
Realized Net Gain (Loss) | (5,945) | 1,349 |
Change in Unrealized Appreciation (Depreciation) | (206,608) | 84,706 |
Net Increase (Decrease) in Net Assets Resulting from Operations | (149,079) | 128,923 |
Distributions |
|
|
Net Investment Income | (49,631) | (31,941) |
Realized Capital Gain | — | — |
Total Distributions | (49,631) | (31,941) |
Capital Share Transactions |
|
|
Issued | 902,990 | 683,917 |
Issued in Lieu of Cash Distributions | 48,860 | 31,382 |
Redeemed | (459,171) | (296,270) |
Net Increase (Decrease) from Capital Share Transactions | 492,679 | 419,029 |
Total Increase (Decrease) | 293,969 | 516,011 |
Net Assets |
|
|
Beginning of Period | 1,472,982 | 956,971 |
End of Period1 | 1,766,951 | 1,472,982 |
1 Net Assets—End of Period includes undistributed net investment income of $47,138,000 and $33,295,000.
See accompanying Notes, which are an integral part of the Financial Statements.
22
Target Retirement 2005 Fund
Financial Highlights
|
|
|
|
| Sept. 1, | Oct. 27, |
|
|
|
|
| 2004, to | 20032 to |
For a Share Outstanding | Year Ended September 30, | Sept. 30, | Aug. 31, | |||
Throughout Each Period | 2008 | 2007 | 2006 | 2005 | 20041 | 2004 |
Net Asset Value, Beginning of Period | $12.31 | $11.38 | $11.14 | $10.65 | $10.58 | $10.00 |
Investment Operations |
|
|
|
|
|
|
Net Investment Income | .4393 | .4203 | .4083 | .3883 | .050 | .185 |
Capital Gain Distributions Received | — | — | .0023 | .0153 | — | .010 |
Net Realized and Unrealized Gain (Loss) |
|
|
|
|
|
|
on Investments | (1.379) | .870 | .149 | .331 | .020 | .450 |
Total from Investment Operations | (.940) | 1.290 | .559 | .734 | .070 | .645 |
Distributions |
|
|
|
|
|
|
Dividends from Net Investment Income | (.380) | (.360) | (.310) | (.240) | — | (.055) |
Distributions from Realized Capital Gains | — | — | (.009) | (.004) | — | (.010) |
Total Distributions | (.380) | (.360) | (.319) | (.244) | — | (.065) |
Net Asset Value, End of Period | $10.99 | $12.31 | $11.38 | $11.14 | $10.65 | $10.58 |
|
|
|
|
|
|
|
Total Return4 | –7.89% | 11.56% | 5.13% | 6.96% | 0.66% | 6.47% |
|
|
|
|
|
|
|
Ratios/Supplemental Data |
|
|
|
|
|
|
Net Assets, End of Period (Millions) | $1,767 | $1,473 | $957 | $651 | $237 | $219 |
Ratio of Total Expenses to |
|
|
|
|
|
|
Average Net Assets | 0%5 | 0% | 0% | 0% | 0% | 0% |
Ratio of Net Investment Income to |
|
|
|
|
|
|
Average Net Assets | 3.71% | 3.56% | 3.68% | 3.57% | 3.57%6 | 3.31%6 |
Portfolio Turnover Rate | 21% | 6% | 19% | 4% | 0% | 2% |
1 The fund’s fiscal year-end changed from August 31 to September 30, effective September 30, 2004.
2 Inception.
3 Calculated based on average shares outstanding.
4 Total returns do not include the account service fee that may be applicable to certain accounts with balances below $10,000.
5 The acquired fund fees and expenses were 0.18%.
6 Annualized.
See accompanying Notes, which are an integral part of the Financial Statements.
23
Target Retirement 2005 Fund
Notes to Financial Statements
Vanguard Target Retirement 2005 Fund is registered under the Investment Company Act of 1940 as an open-end investment company, or mutual fund. The fund follows a balanced investment strategy by investing in selected Vanguard funds to achieve its targeted allocation of assets to U.S. stocks, international stocks, bonds, and short-term reserves.
A. The following significant accounting policies conform to generally accepted accounting principles for U.S. mutual funds. The fund consistently follows such policies in preparing its financial statements.
1. Security Valuation: Securities are valued as of the close of trading on the New York Stock Exchange (generally 4 p.m., Eastern time) on the valuation date. Investments in other Vanguard funds (with the exception of ETF Shares) are valued at that fund’s net asset value. ETFs are valued at the latest quoted sales prices or official closing prices taken from their primary market or, if not traded on the valuation date, at the mean of the latest quoted bid and asked prices.
2. Federal Income Taxes: The fund intends to continue to qualify as a regulated investment company and distribute all of its taxable income. Management has analyzed the fund’s tax positions taken on federal income tax returns for all open tax years (tax years ended September 30, 2005–2008), and has concluded that no provision for federal income tax is required in the fund’s financial statements.
3. Distributions: Distributions to shareholders are recorded on the ex-dividend date.
4. Other: Income and capital gain distributions received are recorded on the ex-dividend date. Security transactions are accounted for on the date securities are bought or sold. Costs used to determine realized gains (losses) on the sale of investment securities are those of the specific securities sold.
B. Under a service agreement, The Vanguard Group furnishes investment advisory, corporate management, administrative, marketing, and distribution services to the fund. The service agreement provides that the fund’s expenses may be reduced or eliminated to the extent of savings realized by the Vanguard funds by the operation of the fund. Accordingly, all incremental expenses for services provided by Vanguard and all other expenses incurred by the fund during the year ended September 30, 2008, were borne by the funds in which the fund invests. The fund’s trustees and officers are also directors and officers of Vanguard and the funds in which the fund invests.
C. Distributions are determined on a tax basis and may differ from net investment income and realized capital gains for financial reporting purposes. Differences may be permanent or temporary. Permanent differences are reclassified among capital accounts in the financial statements to reflect their tax character. Temporary differences arise when certain items of income, expense, gain, or loss are recognized in different periods for financial statement and tax purposes; these differences will reverse at some time in the future. Differences in classification may also result from the treatment of short-term gains as ordinary income for tax purposes.
For tax purposes, at September 30, 2008, the fund had $47,131,000 of ordinary income available for distribution. The fund had available realized losses of $5,576,000 to offset future net capital gains of $4,417,000 through September 30, 2015, and $1,159,000 through September 30, 2017.
At September 30, 2008, the cost of investment securities for tax purposes was $1,867,277,000. Net unrealized depreciation of investment securities for tax purposes was $97,354,000, consisting of unrealized gains of $319,000 on securities that had risen in value since their purchase and $97,673,000 in unrealized losses on securities that had fallen in value since their purchase.
24
Target Retirement 2005 Fund
D. During the year ended September 30, 2008, the fund purchased $874,685,000 of investment securities and sold $365,961,000 of investment securities, other than temporary cash investments.
E. Capital shares issued and redeemed were:
| Year Ended September 30, | |
| 2008 | 2007 |
| Shares | Shares |
| (000) | (000) |
Issued | 76,093 | 57,990 |
Issued in Lieu of Cash Distributions | 4,078 | 2,729 |
Redeemed | (39,032) | (25,100) |
Net Increase (Decrease) in Shares Outstanding | 41,139 | 35,619 |
F. In September 2006, the Financial Accounting Standards Board issued Statement of Financial Accounting Standards No. 157 (“FAS 157”), “Fair Value Measurements.” FAS 157 establishes a framework for measuring fair value and expands disclosures about fair value measurements in financial statements.
The various inputs that may be used to determine the value of the fund’s investments are summarized in three broad levels. The inputs or methodologies used for valuing securities are not necessarily an indication of the risk associated with investing in those securities.
Level 1—Quoted prices in active markets for identical securities.
Level 2—Other significant observable inputs (including quoted prices for similar securities, interest rates, prepayment speeds, credit risk, etc.).
Level 3—Significant unobservable inputs (including the fund’s own assumptions used to determine the fair value of investments).
At September 30, 2008, 100% of the fund’s investments were valued based on Level 1 inputs.
25
Target Retirement 2010 Fund
Fund Profile
As of September 30, 2008
Financial Attributes |
|
|
|
Yield1 | 3.7% |
Acquired Fund Fees and Expenses |
|
(9/30/2007)2 | 0.20% |
Allocation to Underlying Vanguard Funds |
|
|
|
Total Stock Market Index Fund | 43.4% |
Total Bond Market Index Fund | 39.9 |
European Stock Index Fund | 5.8 |
Inflation-Protected Securities Fund | 6.1 |
Pacific Stock Index Fund | 2.7 |
Emerging Markets Stock Index Fund | 2.1 |
Fund Asset Allocation
Equity Investment Focus

Fixed Income Investment Focus
1 30-day SEC yield for the fund. See the Glossary.
2 This figure—drawn from the prospectus dated January 25, 2008—represents a weighted average of the annualized expense ratios and any transaction fees charged by the underlying mutual funds (the “acquired” funds) in which the Target Retirement 2010 Fund invests. The Target Retirement 2010 Fund does not charge any expenses or fees of its own. For the fiscal year ended September 30, 2008, the acquired fund fees and expenses was 0.19%.
26
Target Retirement 2010 Fund
Performance Summary
All of the returns in this report represent past performance, which is not a guarantee of future results that may be achieved by the fund. (Current performance may be lower or higher than the performance data cited. For performance data current to the most recent month-end, visit our website at www.vanguard.com/performance.) Note, too, that both investment returns and principal value can fluctuate widely, so an investor’s shares, when sold, could be worth more or less than their original cost. The returns shown do not reflect taxes that a shareholder would pay on fund distributions or on the sale of fund shares.
Cumulative Performance: June 7, 2006–September 30, 2008
Initial Investment of $10,000
| Average Annual Total Returns | Final Value | |
| Periods Ended September 30, 2008 | of a $10,000 | |
| One Year | Since Inception1 | Investment |
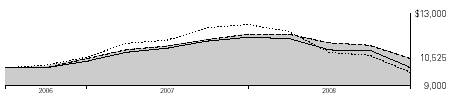
Vanguard Target Retirement 2010 Fund2 | –11.30% | 2.24% | $10,525 |
Dow Jones Wilshire 5000 Index | –21.20 | –1.03 | 9,762 |
Target 2010 Composite Index3 | –11.33 | 2.16 | 10,508 |
Target 2010 Composite Average4 | –14.27 | 0.07 | 10,017 |
Fiscal-Year Total Returns (%): June 7, 20061–September 30, 2008 | ||||
|
|
|
| Target |
|
|
|
| 2010 |
Fiscal | Capital | Income | Total | Composite |
Year | Return | Return | Return | Index3 |
2006 | 5.1% | 0.0% | 5.1% | 5.0% |
2007 | 12.0 | 1.0 | 13.0 | 12.9 |
2008 | –13.0 | 1.7 | –11.3 | –11.3 |
1 Performance for the fund and its comparative standards is calculated since the fund’s inception: June 7, 2006.
2 Total returns do not include the account service fee that may be applicable to certain accounts with balances below $10,000.
3 Target 2010 Composite Index: Derived by applying the fund’s target asset allocation to the results of the following benchmarks: for international stocks of developed markets, the MSCI EAFE Index; for emerging markets stocks, the Select Emerging Markets Index from inception through August 23, 2006, and the MSCI Emerging Markets Index thereafter; for bonds, the Lehman U.S. Aggregate Bond Index and the Lehman U.S. Treasury Inflation Notes Index; and for U.S. stocks, the MSCI US Broad Market Index. MSCI EAFE Index returns are adjusted for withholding taxes applicable to Luxembourg holding companies.
4 Target 2010 Composite Average: Derived by applying the fund’s target allocation to the following peer-group averages: the average general equity fund, average fixed income fund, average international fund, average Treasury inflation protected securities fund, and average emerging markets fund. Derived from data provided by Lipper Inc.
Note: See Financial Highlights table for dividend and capital gains information.
27
Target Retirement 2010 Fund
Financial Statements
Statement of Net Assets
As of September 30, 2008
The fund provides a complete list of its holdings four times in each fiscal year, at the quarter-ends. For the second and fourth fiscal quarters, the lists appear in the fund’s semiannual and annual reports to shareholders. For the first and third fiscal quarters, the fund files the lists with the Securities and Exchange Commission on Form N-Q. Shareholders can look up the fund’s Forms N-Q on the SEC’s website at www.sec.gov. Forms N-Q may also be reviewed and copied at the SEC’s Public Reference Room (see the back cover of this report for further information).
|
| Market |
|
| Value• |
| Shares | ($000) |
Investment Companies (100.1%) |
|
|
U.S. Stock Fund (43.4%) |
|
|
Vanguard Total Stock Market Index Fund Investor Shares | 39,217,520 | 1,114,562 |
|
|
|
International Stock Funds (10.6%) |
|
|
Vanguard European Stock Index Fund Investor Shares | 5,303,307 | 149,076 |
Vanguard Pacific Stock Index Fund Investor Shares | 7,096,607 | 69,050 |
Vanguard Emerging Markets Stock Index Fund Investor Shares | 2,550,995 | 55,229 |
|
|
|
Bond Funds (46.1%) |
|
|
Vanguard Total Bond Market Index Fund Investor Shares | 103,999,273 | 1,026,473 |
Vanguard Inflation-Protected Securities Fund Investor Shares | 12,996,752 | 155,961 |
Total Investment Companies (Cost $2,880,849) |
| 2,570,351 |
Other Assets and Liabilities (–0.1%) |
|
|
Other Assets |
| 27,247 |
Liabilities |
| (30,889) |
|
| (3,642) |
Net Assets (100%) |
|
|
Applicable to 125,407,828 outstanding $.001 par value shares of |
|
|
beneficial interest (unlimited authorization) |
| 2,566,709 |
Net Asset Value Per Share |
| $20.47 |
|
|
|
|
|
|
At September 30, 2008, net assets consisted of: |
|
|
|
| Amount |
|
| ($000) |
Paid-in Capital |
| 2,832,285 |
Undistributed Net Investment Income |
| 53,920 |
Accumulated Net Realized Losses |
| (8,998) |
Unrealized Appreciation (Depreciation) |
| (310,498) |
Net Assets |
| 2,566,709 |
• | See Note A in Notes to Financial Statements. |
See accompanying Notes, which are an integral part of the Financial Statements.
28
Target Retirement 2010 Fund
Statement of Operations
| Year Ended |
| September 30, 2008 |
| ($000) |
Investment Income |
|
Income |
|
Income Distributions Received | 72,341 |
Net Investment Income—Note B | 72,341 |
Realized Net Gain (Loss) |
|
Capital Gain Distributions Received | — |
Investment Securities Sold | (9,018) |
Realized Net Gain (Loss) | (9,018) |
Change in Unrealized Appreciation (Depreciation) of Investment Securities | (356,455) |
Net Increase (Decrease) in Net Assets Resulting from Operations | (293,132) |
See accompanying Notes, which are an integral part of the Financial Statements.
29
Target Retirement 2010 Fund
Statement of Changes in Net Assets
| Year Ended September 30, | |
| 2008 | 2007 |
| ($000) | ($000) |
Increase (Decrease) in Net Assets |
|
|
Operations |
|
|
Net Investment Income | 72,341 | 20,078 |
Realized Net Gain (Loss) | (9,018) | 23 |
Change in Unrealized Appreciation (Depreciation) | (356,455) | 44,637 |
Net Increase (Decrease) in Net Assets Resulting from Operations | (293,132) | 64,738 |
Distributions |
|
|
Net Investment Income | (36,684) | (2,109) |
Realized Capital Gain | — | — |
Total Distributions | (36,684) | (2,109) |
Capital Share Transactions |
|
|
Issued | 2,079,645 | 1,301,181 |
Issued in Lieu of Cash Distributions | 36,584 | 2,103 |
Redeemed | (517,140) | (143,478) |
Net Increase (Decrease) from Capital Share Transactions | 1,599,089 | 1,159,806 |
Total Increase (Decrease) | 1,269,273 | 1,222,435 |
Net Assets |
|
|
Beginning of Period | 1,297,436 | 75,001 |
End of Period1 | 2,566,709 | 1,297,436 |
1 Net Assets—End of Period includes undistributed net investment income of $53,920,000 and $18,263,000.
See accompanying Notes, which are an integral part of the Financial Statements.
30
Target Retirement 2010 Fund
Financial Highlights
|
|
| June 7, |
| Year Ended | 20061 to | |
|
| September 30, | Sept. 30, |
For a Share Outstanding Throughout Each Period | 2008 | 2007 | 2006 |
Net Asset Value, Beginning of Period | $23.54 | $21.01 | $20.00 |
Investment Operations |
|
|
|
Net Investment Income | .7442 | .7302 | .2302 |
Capital Gain Distributions Received | — | — | — |
Net Realized and Unrealized Gain (Loss) on Investments | (3.354) | 1.980 | .780 |
Total from Investment Operations | (2.610) | 2.710 | 1.010 |
Distributions |
|
|
|
Dividends from Net Investment Income | (.460) | (.180) | — |
Distributions from Realized Capital Gains | — | — | — |
Total Distributions | (.460) | (.180) | — |
Net Asset Value, End of Period | $20.47 | $23.54 | $21.01 |
|
|
|
|
Total Return3 | –11.30% | 12.96% | 5.05% |
|
|
|
|
Ratios/Supplemental Data |
|
|
|
Net Assets, End of Period (Millions) | $2,567 | $1,297 | $75 |
Ratio of Total Expenses to Average Net Assets | 0%4 | 0% | 0% |
Ratio of Net Investment Income to Average Net Assets | 3.34% | 3.26% | 2.89%5 |
Portfolio Turnover Rate | 18% | 4% | 4% |
1 Inception.
2 Calculated based on average shares outstanding.
3 Total returns do not include the account service fee that may be applicable to certain accounts with balances below $10,000.
4 The acquired fund fees and expenses were 0.19%.
5 Annualized.
See accompanying Notes, which are an integral part of the Financial Statements.
31
Target Retirement 2010 Fund
Notes to Financial Statements
Vanguard Target Retirement 2010 Fund is registered under the Investment Company Act of 1940 as an open-end investment company, or mutual fund. The fund follows a balanced investment strategy by investing in selected Vanguard funds to achieve its targeted allocation of assets to U.S. stocks, international stocks, and bonds.
A. The following significant accounting policies conform to generally accepted accounting principles for U.S. mutual funds. The fund consistently follows such policies in preparing its financial statements.
1. Security Valuation: Investments are valued at the net asset value of each underlying Vanguard fund determined as of the close of the New York Stock Exchange (generally 4 p.m., Eastern time) on the valuation date.
2. Federal Income Taxes: The fund intends to continue to qualify as a regulated investment company and distribute all of its taxable income. Management has analyzed the fund’s tax positions taken on federal income tax returns for all open tax years (tax years ended September 30, 2006–2008), and has concluded that no provision for federal income tax is required in the fund’s financial statements.
3. Distributions: Distributions to shareholders are recorded on the ex-dividend date.
4. Other: Income and capital gain distributions received are recorded on the ex-dividend date. Security transactions are accounted for on the date securities are bought or sold. Costs used to determine realized gains (losses) on the sale of investment securities are those of the specific securities sold.
B. Under a service agreement, The Vanguard Group furnishes investment advisory, corporate management, administrative, marketing, and distribution services to the fund. The service agreement provides that the fund’s expenses may be reduced or eliminated to the extent of savings realized by the Vanguard funds by the operation of the fund. Accordingly, all incremental expenses for services provided by Vanguard and all other expenses incurred by the fund during the year ended September 30, 2008, were borne by the funds in which the fund invests. The fund’s trustees and officers are also directors and officers of Vanguard and the funds in which the fund invests.
C. Distributions are determined on a tax basis and may differ from net investment income and realized capital gains for financial reporting purposes. Differences may be permanent or temporary. Permanent differences are reclassified among capital accounts in the financial statements to reflect their tax character. Temporary differences arise when certain items of income, expense, gain, or loss are recognized in different periods for financial statement and tax purposes; these differences will reverse at some time in the future. Differences in classification may also result from the treatment of short-term gains as ordinary income for tax purposes.
For tax purposes, at September 30, 2008, the fund had $53,940,000 of ordinary income available for distribution. The fund had available realized losses of $1,423,000 to offset future net capital gains through September 30, 2017.
At September 30, 2008, the cost of investment securities for tax purposes was $2,888,444,000. Net unrealized depreciation of investment securities for tax purposes was $318,093,000, consisting entirely of unrealized losses on securities that had fallen in value since their purchase.
D. During the year ended September 30, 2008, the fund purchased $2,035,954,000 of investment securities and sold $397,392,000 of investment securities, other than temporary cash investments.
32
Target Retirement 2010 Fund
E. Capital shares issued and redeem
| Year Ended September 30, | |
| 2008 | 2007 |
| Shares | Shares |
| (000) | (000) |
Issued | 92,025 | 57,778 |
Issued in Lieu of Cash Distributions | 1,589 | 96 |
Redeemed | (23,324) | (6,326) |
Net Increase (Decrease) in Shares Outstanding | 70,290 | 51,548 |
F. In September 2006, the Financial Accounting Standards Board issued Statement of Financial Accounting Standards No. 157 (“FAS 157”), “Fair Value Measurements.” FAS 157 establishes a framework for measuring fair value and expands disclosures about fair value measurements in financial statements.
The various inputs that may be used to determine the value of the fund’s investments are summarized in three broad levels. The inputs or methodologies used for valuing securities are not necessarily an indication of the risk associated with investing in those securities.
Level 1—Quoted prices in active markets for identical securities.
Level 2—Other significant observable inputs (including quoted prices for similar securities, interest rates, prepayment speeds, credit risk, etc.).
Level 3—Significant unobservable inputs (including the fund’s own assumptions used to determine the fair value of investments).
At September 30, 2008, 100% of the fund’s investments were valued based on Level 1 inputs.
33
Target Retirement 2015 Fund
Fund Profile
As of September 30, 2008
Financial Attributes |
|
|
|
Yield1 | 3.4% |
Acquired Fund Fees and Expenses |
|
(9/30/2007)2 | 0.19% |
Volatility Measures3 |
|
| Fund Versus |
| Composite Index4 |
R-Squared | 1.00 |
Beta | 0.99 |
Allocation to Underlying Vanguard Funds |
|
|
|
Total Stock Market Index Fund | 50.5% |
Total Bond Market Index Fund | 37.1 |
European Stock Index Fund | 6.7 |
Pacific Stock Index Fund | 3.1 |
Emerging Markets Stock Index Fund | 2.6 |
Fund Asset Allocation
Equity Investment Focus
Fixed Income Investment Focus
1 30-day SEC yield for the fund. See the Glossary.
2 This figure—drawn from the prospectus dated January 25, 2008—represents a weighted average of the annualized expense ratios and any transaction fees charged by the underlying mutual funds (the “acquired” funds) in which the Target Retirement 2015 Fund invests. The Target Retirement 2015 Fund does not charge any expenses or fees of its own. For the fiscal year ended September 30, 2008, the acquired fund fees and expenses was 0.18%.
3 For an explanation of R-squared, beta, and other terms used here, see the Glossary.
4 Target 2015 Composite Index: Derived by applying the fund’s target asset allocation to the results of the following benchmarks: for international stocks of developed markets, the MSCI EAFE Index; for emerging markets stocks, the Select Emerging Markets Index from inception through August 23, 2006, and the MSCI Emerging Markets Index thereafter; for bonds, the Lehman U.S. Aggregate Bond Index; and for U.S. stocks, the Dow Jones Wilshire 5000 Index from inception through April 22, 2005, and the MSCI US Broad Market Index thereafter. MSCI EAFE Index returns are adjusted for withholding taxes applicable to Luxembourg holding companies.
34
Target Retirement 2015 Fund
Performance Summary
All of the returns in this report represent past performance, which is not a guarantee of future results that may be achieved by the fund. (Current performance may be lower or higher than the performance data cited. For performance data current to the most recent month-end, visit our website at www.vanguard.com/performance.) Note, too, that both investment returns and principal value can fluctuate widely, so an investor’s shares, when sold, could be worth more or less than their original cost. The returns shown do not reflect taxes that a shareholder would pay on fund distributions or on the sale of fund shares.
Cumulative Performance: October 27, 2003–September 30, 2008
Initial Investment of $10,000
| Average Annual Total Returns | Final Value | |
| Periods Ended September 30, 2008 | of a $10,000 | |
| One Year | Since Inception1 | Investment |
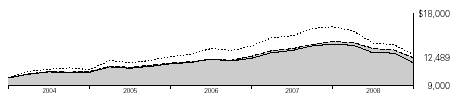
Vanguard Target Retirement 2015 Fund2 | –13.75% | 4.62% | $12,489 |
Dow Jones Wilshire 5000 Index | –21.20 | 5.29 | 12,893 |
Target 2015 Composite Index3 | –13.89 | 4.60 | 12,482 |
Target 2015 Composite Average4 | –16.53 | 3.52 | 11,858 |
1 Performance for the fund and its comparative standards is calculated since the fund’s inception: October 27, 2003.
2 Total returns do not include the account service fee that may be applicable to certain accounts with balances below $10,000.
3 Target 2015 Composite Index: Derived by applying the fund’s target asset allocation to the results of the following benchmarks: for international stocks of developed markets, the MSCI EAFE Index; for emerging markets stocks, the Select Emerging Markets Index from inception through August 23, 2006, and the MSCI Emerging Markets Index thereafter; for bonds, the Lehman U.S. Aggregate Bond Index; and for U.S. stocks, the Dow Jones Wilshire 5000 Index from inception through April 22, 2005, and the MSCI US Broad Market Index thereafter. MSCI EAFE Index returns are adjusted for withholding taxes applicable to Luxembourg holding companies.
4 Target 2015 Composite Average: Derived by applying the fund’s target allocation to the following peer-group averages: the average general equity fund, average fixed income fund, average international fund, and average emerging markets fund. Derived from data provided by Lipper Inc.
35
Target Retirement 2015 Fund
Fiscal-Year Total Returns (%): October 27, 2003–September 30, 2008 | ||||
|
|
|
| Target |
|
|
|
| 2015 |
Fiscal | Capital | Income | Total | Composite |
Year | Return | Return | Return | Index1 |
2004 | 7.4% | 0.6% | 8.0% | 8.0% |
2005 | 7.5 | 1.9 | 9.4 | 9.5 |
2006 | 4.9 | 2.3 | 7.2 | 7.3 |
2007 | 11.5 | 2.8 | 14.3 | 14.2 |
2008 | –15.9 | 2.2 | –13.7 | –13.9 |
1 Target 2015 Composite Index: Derived by applying the fund’s target asset allocation to the results of the following benchmarks: for international stocks of developed markets, the MSCI EAFE Index; for emerging markets stocks, the Select Emerging Markets Index from inception through August 23, 2006, and the MSCI Emerging Markets Index thereafter; for bonds, the Lehman U.S. Aggregate Bond Index; and for U.S. stocks, the Dow Jones Wilshire 5000 Index from inception through April 22, 2005, and the MSCI US Broad Market Index thereafter. MSCI EAFE Index returns are adjusted for withholding taxes applicable to Luxembourg holding companies.
Note: See Financial Highlights table for dividend and capital gains information.
36
Target Retirement 2015 Fund
Financial Statements
Statement of Net Assets
As of September 30, 2008
The fund provides a complete list of its holdings four times in each fiscal year, at the quarter-ends. For the second and fourth fiscal quarters, the lists appear in the fund’s semiannual and annual reports to shareholders. For the first and third fiscal quarters, the fund files the lists with the Securities and Exchange Commission on Form N-Q. Shareholders can look up the fund’s Forms N-Q on the SEC’s website at www.sec.gov. Forms N-Q may also be reviewed and copied at the SEC’s Public Reference Room (see the back cover of this report for further information).
|
| Market |
|
| Value• |
| Shares | ($000) |
Investment Companies (100.1%) |
|
|
U.S. Stock Funds (50.5%) |
|
|
Vanguard Total Stock Market Index Fund Investor Shares | 137,853,199 | 3,917,788 |
Vanguard Total Stock Market ETF | 425,882 | 25,225 |
|
|
|
International Stock Funds (12.4%) |
|
|
Vanguard European Stock Index Fund Investor Shares | 18,578,778 | 522,249 |
Vanguard Pacific Stock Index Fund Investor Shares | 24,927,742 | 242,547 |
Vanguard Emerging Markets Stock Index Fund Investor Shares | 9,346,968 | 202,362 |
|
|
|
Bond Fund (37.2%) |
|
|
Vanguard Total Bond Market Index Fund Investor Shares | 293,963,388 | 2,901,419 |
Total Investment Companies (Cost $8,463,945) |
| 7,811,590 |
Other Assets and Liabilities (–0.1%) |
|
|
Other Assets |
| 64,022 |
Liabilities |
| (72,087) |
|
| (8,065) |
Net Assets (100%) |
|
|
Applicable to 687,843,403 outstanding $.001 par value shares of |
|
|
beneficial interest (unlimited authorization) |
| 7,803,525 |
Net Asset Value Per Share |
| $11.34 |
At September 30, 2008, net assets consisted of: |
|
| Amount |
| ($000) |
Paid-in Capital | 8,350,566 |
Undistributed Net Investment Income | 157,589 |
Accumulated Net Realized Losses | (52,275) |
Unrealized Appreciation (Depreciation) | (652,355) |
Net Assets | 7,803,525 |
• | See Note A in Notes to Financial Statements. |
See accompanying Notes, which are an integral part of the Financial Statements.
37
Target Retirement 2015 Fund
Statement of Operations
| Year Ended |
| September 30, 2008 |
| ($000) |
Investment Income |
|
Income |
|
Income Distributions Received | 228,895 |
Net Investment Income—Note B | 228,895 |
Realized Net Gain (Loss) |
|
Capital Gain Distributions Received | — |
Investment Securities Sold | (35,964) |
Realized Net Gain (Loss) | (35,964) |
Change in Unrealized Appreciation (Depreciation) of Investment Securities | (1,349,722) |
Net Increase (Decrease) in Net Assets Resulting from Operations | (1,156,791) |
See accompanying Notes, which are an integral part of the Financial Statements.
38
Target Retirement 2015 Fund
Statement of Changes in Net Assets
| Year Ended September 30, | |
| 2008 | 2007 |
| ($000) | ($000) |
Increase (Decrease) in Net Assets |
|
|
Operations |
|
|
Net Investment Income | 228,895 | 151,696 |
Realized Net Gain (Loss) | (35,964) | 182 |
Change in Unrealized Appreciation (Depreciation) | (1,349,722) | 505,907 |
Net Increase (Decrease) in Net Assets Resulting from Operations | (1,156,791) | 657,785 |
Distributions |
|
|
Net Investment Income | (181,936) | (104,720) |
Realized Capital Gain | — | — |
Total Distributions | (181,936) | (104,720) |
Capital Share Transactions |
|
|
Issued | 3,567,141 | 2,889,953 |
Issued in Lieu of Cash Distributions | 181,232 | 104,087 |
Redeemed | (1,224,652) | (648,837) |
Net Increase (Decrease) from Capital Share Transactions | 2,523,721 | 2,345,203 |
Total Increase (Decrease) | 1,184,994 | 2,898,268 |
Net Assets |
|
|
Beginning of Period | 6,618,531 | 3,720,263 |
End of Period1 | 7,803,525 | 6,618,531 |
1 Net Assets—End of Period includes undistributed net investment income of $157,589,000 and $110,630,000.
See accompanying Notes, which are an integral part of the Financial Statements.
39
Target Retirement 2015 Fund
Financial Highlights
|
|
|
|
| Sept. 1, | Oct. 27, |
|
|
|
|
| 2004, to | 20032 to |
For a Share Outstanding | Year Ended September 30, | Sept. 30, | Aug. 31, | |||
Throughout Each Period | 2008 | 2007 | 2006 | 2005 | 20041 | 2004 |
Net Asset Value, Beginning of Period | $13.49 | $12.10 | $11.54 | $10.74 | $10.63 | $10.00 |
Investment Operations |
|
|
|
|
|
|
Net Investment Income | .3803 | .3803 | .3563 | .3463 | .030 | .160 |
Capital Gain Distributions Received | — | — | — | .0043 | — | — |
Net Realized and Unrealized Gain (Loss) |
|
|
|
|
|
|
on Investments | (2.190) | 1.320 | .466 | .652 | .080 | .530 |
Total from Investment Operations | (1.810) | 1.700 | .822 | 1.002 | .110 | .690 |
Distributions |
|
|
|
|
|
|
Dividends from Net Investment Income | (.340) | (.310) | (.260) | (.200) | — | (.060) |
Distributions from Realized Capital Gains | — | — | (.002) | (.002) | — | — |
Total Distributions | (.340) | (.310) | (.262) | (.202) | — | (.060) |
Net Asset Value, End of Period | $11.34 | $13.49 | $12.10 | $11.54 | $10.74 | $10.63 |
|
|
|
|
|
|
|
Total Return4 | –13.75% | 14.25% | 7.25% | 9.40% | 1.03% | 6.92% |
|
|
|
|
|
|
|
Ratios/Supplemental Data |
|
|
|
|
|
|
|
|
|
|
|
|
|
Net Assets, End of Period (Millions) | $7,804 | $6,619 | $3,720 | $1,804 | $470 | $427 |
Ratio of Total Expenses to |
|
|
|
|
|
|
Average Net Assets | 0%5 | 0% | 0% | 0% | 0% | 0% |
Ratio of Net Investment Income to |
|
|
|
|
|
|
Average Net Assets | 3.02% | 2.93% | 3.04% | 3.11% | 2.85%6 | 2.69%6 |
Portfolio Turnover Rate | 24% | 5% | 15% | 1% | 0% | 1% |
1 The fund’s fiscal year-end changed from August 31 to September 30, effective September 30, 2004.
2 Inception.
3 Calculated based on average shares outstanding.
4 Total returns do not include the account service fee that may be applicable to certain accounts with balances below $10,000.
5 The acquired fund fees and expenses were 0.18%.
6 Annualized.
See accompanying Notes, which are an integral part of the Financial Statements.
40
Target Retirement 2015 Fund
Notes to Financial Statements
Vanguard Target Retirement 2015 Fund is registered under the Investment Company Act of 1940 as an open-end investment company, or mutual fund. The fund follows a balanced investment strategy by investing in selected Vanguard funds to achieve its targeted allocation of assets to U.S. stocks, international stocks, and bonds.
A. The following significant accounting policies conform to generally accepted accounting principles for U.S. mutual funds. The fund consistently follows such policies in preparing its financial statements.
1. Security Valuation: Securities are valued as of the close of trading on the New York Stock Exchange (generally 4 p.m., Eastern time) on the valuation date. Investments in other Vanguard funds (with the exception of ETF Shares) are valued at that fund’s net asset value. ETFs are valued at the latest quoted sales prices or official closing prices taken from their primary market or, if not traded on the valuation date, at the mean of the latest quoted bid and asked prices.
2. Federal Income Taxes: The fund intends to continue to qualify as a regulated investment company and distribute all of its taxable income. Management has analyzed the fund’s tax positions taken on federal income tax returns for all open tax years (tax years ended September 30, 2005–2008), and has concluded that no provision for federal income tax is required in the fund’s financial statements.
3. Distributions: Distributions to shareholders are recorded on the ex-dividend date.
4. Other: Income and capital gain distributions received are recorded on the ex-dividend date. Security transactions are accounted for on the date securities are bought or sold. Costs used to determine realized gains (losses) on the sale of investment securities are those of the specific securities sold.
B. Under a service agreement, The Vanguard Group furnishes investment advisory, corporate management, administrative, marketing, and distribution services to the fund. The service agreement provides that the fund’s expenses may be reduced or eliminated to the extent of savings realized by the Vanguard funds by the operation of the fund. Accordingly, all incremental expenses for services provided by Vanguard and all other expenses incurred by the fund during the year ended September 30, 2008, were borne by the funds in which the fund invests. The fund’s trustees and officers are also directors and officers of Vanguard and the funds in which the fund invests.
C. Distributions are determined on a tax basis and may differ from net investment income and realized capital gains for financial reporting purposes. Differences may be permanent or temporary. Permanent differences are reclassified among capital accounts in the financial statements to reflect their tax character. Temporary differences arise when certain items of income, expense, gain, or loss are recognized in different periods for financial statement and tax purposes; these differences will reverse at some time in the future. Differences in classification may also result from the treatment of short-term gains as ordinary income for tax purposes.
For tax purposes, at September 30, 2008, the fund had $157,655,000 of ordinary income available for distribution. The fund had available realized losses of $18,548,000 to offset future net capital gains of $15,574,000 through September 30, 2015, and $2,974,000 through September 30, 2017.
At September 30, 2008, the cost of investment securities for tax purposes was $8,497,739,000. Net unrealized depreciation of investment securities for tax purposes was $686,149,000, consisting of unrealized gains of $1,542,000 on securities that had risen in value since their purchase and $687,691,000 in unrealized losses on securities that had fallen in value since their purchase.
41
Target Retirement 2015 Fund
D. During the year ended September 30, 2008, the fund purchased $4,433,889,000 of investment securities and sold $1,850,896,000 of investment securities, other than temporary cash investments.
E. Capital shares issued and redeemed were:
| Year Ended September 30, | |
| 2008 | 2007 |
| Shares | Shares |
| (000) | (000) |
Issued | 282,206 | 225,167 |
Issued in Lieu of Cash Distributions | 13,888 | 8,327 |
Redeemed | (98,726) | (50,427) |
Net Increase (Decrease) in Shares Outstanding | 197,368 | 183,067 |
F. In September 2006, the Financial Accounting Standards Board issued Statement of Financial Accounting Standards No. 157 (“FAS 157”), “Fair Value Measurements.” FAS 157 establishes a framework for measuring fair value and expands disclosures about fair value measurements in financial statements.
The various inputs that may be used to determine the value of the fund’s investments are summarized in three broad levels. The inputs or methodologies used for valuing securities are not necessarily an indication of the risk associated with investing in those securities.
Level 1—Quoted prices in active markets for identical securities.
Level 2—Other significant observable inputs (including quoted prices for similar securities, interest rates, prepayment speeds, credit risk, etc.).
Level 3—Significant unobservable inputs (including the fund’s own assumptions used to determine the fair value of investments).
At September 30, 2008, 100% of the fund’s investments were valued based on Level 1 inputs.
Target Retirement 2020 Fund
Fund Profile
As of September 30, 2008
Financial Attributes |
|
|
|
Yield1 | 3.2% |
Acquired Fund Fees and Expenses |
|
(9/30/2007)2 | 0.20% |
Allocation to Underlying Vanguard Funds |
|
|
|
Total Stock Market Index Fund | 56.5% |
Total Bond Market Index Fund | 29.5 |
European Stock Index Fund | 7.6 |
Pacific Stock Index Fund | 3.5 |
Emerging Markets Stock Index Fund | 2.9 |
Fund Asset Allocation
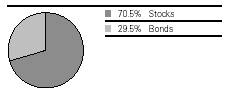
Equity Investment Focus
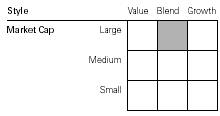
Fixed Income Investment Focus
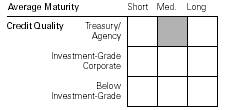
1 30-day SEC yield for the fund. See the Glossary.
2 This figure—drawn from the prospectus dated January 25, 2008—represents a weighted average of the annualized expense ratios and any transaction fees charged by the underlying mutual funds (the “acquired” funds) in which the Target Retirement 2020 Fund invests. The Target Retirement 2020 Fund does not charge any expenses or fees of its own. For the fiscal year ended September 30, 2008, the acquired fund fees and expenses was 0.19%.
43
Target Retirement 2020 Fund
Performance Summary
All of the returns in this report represent past performance, which is not a guarantee of future results that may be achieved by the fund. (Current performance may be lower or higher than the performance data cited. For performance data current to the most recent month-end, visit our website at www.vanguard.com/performance.) Note, too, that both investment returns and principal value can fluctuate widely, so an investor’s shares, when sold, could be worth more or less than their original cost. The returns shown do not reflect taxes that a shareholder would pay on fund distributions or on the sale of fund shares.
Cumulative Performance: June 7, 2006–September 30, 2008
Initial Investment of $10,000
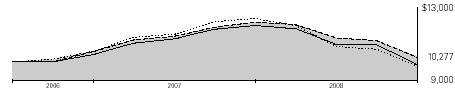
| Average Annual Total Returns | Final Value | |
| Periods Ended September 30, 2008 | of a $10,000 | |
| One Year | Since Inception1 | Investment |
Vanguard Target Retirement 2020 Fund2 | –15.61% | 1.19% | $10,277 |
Dow Jones Wilshire 5000 Index | –21.20 | –1.03 | 9,762 |
Target 2020 Composite Index3 | –15.84 | 1.10 | 10,257 |
Target 2020 Composite Average4 | –18.10 | –0.73 | 9,832 |
Fiscal-Year Total Returns (%): June 7, 20061–September 30, 2008 | ||||
|
|
|
| Target |
|
|
|
| 2020 |
Fiscal | Capital | Income | Total | Composite |
Year | Return | Return | Return | Index3 |
2006 | 5.7% | 0.0% | 5.7% | 5.7% |
2007 | 14.2 | 1.0 | 15.2 | 15.3 |
2008 | –17.1 | 1.5 | –15.6 | –15.8 |
1 Performance for the fund and its comparative standards is calculated since the fund’s inception: June 7, 2006.
2 Total returns do not include the account service fee that may be applicable to certain accounts with balances below $10,000.
3 Target 2020 Composite Index: Derived by applying the fund’s target asset allocation to the results of the following benchmarks: for international stocks of developed markets, the MSCI EAFE Index; for emerging markets stocks, the Select Emerging Markets Index from inception through August 23, 2006, and the MSCI Emerging Markets Index thereafter; for bonds, the Lehman U.S. Aggregate Bond Index; and for U.S. stocks, the MSCI US Broad Market Index. MSCI EAFE Index returns are adjusted for withholding taxes applicable to Luxembourg holding companies.
4 Target 2020 Composite Average: Derived by applying the fund’s target allocation to the following peer-group averages: the average general equity fund, average fixed income fund, average international fund, and average emerging markets fund. Derived from data provided by Lipper Inc.
Note: See Financial Highlights table for dividend and capital gains information.
44
Target Retirement 2020 Fund
Financial Statements
Statement of Net Assets
As of September 30, 2008
The fund provides a complete list of its holdings four times in each fiscal year, at the quarter-ends. For the second and fourth fiscal quarters, the lists appear in the fund’s semiannual and annual reports to shareholders. For the first and third fiscal quarters, the fund files the lists with the Securities and Exchange Commission on Form N-Q. Shareholders can look up the fund’s Forms N-Q on the SEC’s website at www.sec.gov. Forms N-Q may also be reviewed and copied at the SEC’s Public Reference Room (see the back cover of this report for further information).
|
| Market |
|
| Value• |
| Shares | ($000) |
Investment Companies (100.0%) |
|
|
U.S. Stock Fund (56.5%) |
|
|
Vanguard Total Stock Market Index Fund Investor Shares | 76,671,101 | 2,178,993 |
|
|
|
International Stock Funds (14.0%) |
|
|
Vanguard European Stock Index Fund Investor Shares | 10,474,123 | 294,428 |
Vanguard Pacific Stock Index Fund Investor Shares | 13,776,762 | 134,048 |
Vanguard Emerging Markets Stock Index Fund Investor Shares | 5,242,133 | 113,492 |
|
|
|
Bond Fund (29.5%) |
|
|
Vanguard Total Bond Market Index Fund Investor Shares | 115,388,474 | 1,138,884 |
Total Investment Companies (Cost $4,433,138) |
| 3,859,845 |
Other Assets and Liabilities (0.0%) |
|
|
Other Assets |
| 31,040 |
Liabilities |
| (31,888) |
|
| (848) |
Net Assets (100%) |
|
|
Applicable to 192,661,349 outstanding $.001 par value shares of |
|
|
beneficial interest (unlimited authorization) |
| 3,858,997 |
Net Asset Value Per Share |
| $20.03 |
At September 30, 2008, net assets consisted of: |
|
| Amount |
| ($000) |
Paid-in Capital | 4,379,828 |
Undistributed Net Investment Income | 61,901 |
Accumulated Net Realized Losses | (9,439) |
Unrealized Appreciation (Depreciation) | (573,293) |
Net Assets | 3,858,997 |
• | See Note A in Notes to Financial Statements. |
See accompanying Notes, which are an integral part of the Financial Statements.
45
Target Retirement 2020 Fund
Statement of Operations
| Year Ended |
| September 30, 2008 |
| ($000) |
Investment Income |
|
Income |
|
Income Distributions Received | 84,945 |
Net Investment Income—Note B | 84,945 |
Realized Net Gain (Loss) |
|
Capital Gain Distributions Received | — |
Investment Securities Sold | (9,462) |
Realized Net Gain (Loss) | (9,462) |
Change in Unrealized Appreciation (Depreciation) of Investment Securities | (655,255) |
Net Increase (Decrease) in Net Assets Resulting from Operations | (579,772) |
See accompanying Notes, which are an integral part of the Financial Statements.
46
Target Retirement 2020 Fund
Statement of Changes in Net Assets
| Year Ended September 30, | |
| 2008 | 2007 |
| ($000) | ($000) |
Increase (Decrease) in Net Assets |
|
|
Operations |
|
|
Net Investment Income | 84,945 | 22,355 |
Realized Net Gain (Loss) | (9,462) | 24 |
Change in Unrealized Appreciation (Depreciation) | (655,255) | 79,776 |
Net Increase (Decrease) in Net Assets Resulting from Operations | (579,772) | 102,155 |
Distributions |
|
|
Net Investment Income | (42,617) | (3,141) |
Realized Capital Gain | — | — |
Total Distributions | (42,617) | (3,141) |
Capital Share Transactions |
|
|
Issued | 3,161,786 | 1,602,760 |
Issued in Lieu of Cash Distributions | 42,557 | 3,137 |
Redeemed | (441,547) | (103,496) |
Net Increase (Decrease) from Capital Share Transactions | 2,762,796 | 1,502,401 |
Total Increase (Decrease) | 2,140,407 | 1,601,415 |
Net Assets |
|
|
Beginning of Period | 1,718,590 | 117,175 |
End of Period1 | 3,858,997 | 1,718,590 |
1 Net Assets—End of Period includes undistributed net investment income of $61,901,000 and $19,573,000.
See accompanying Notes, which are an integral part of the Financial Statements.
47
Target Retirement 2020 Fund
Financial Highlights
|
| June 7, | |
| Year Ended | 20061 to | |
| September 30, | Sept. 30, | |
For a Share Outstanding Throughout Each Period | 2008 | 2007 | 2006 |
Net Asset Value, Beginning of Period | $24.15 | $21.14 | $20.00 |
Investment Operations |
|
|
|
Net Investment Income | .6192 | .6002 | .1902 |
Capital Gain Distributions Received | — | — | — |
Net Realized and Unrealized Gain (Loss) on Investments | (4.329) | 2.600 | .950 |
Total from Investment Operations | (3.710) | 3.200 | 1.140 |
Distributions |
|
|
|
Dividends from Net Investment Income | (.410) | (.190) | — |
Distributions from Realized Capital Gains | — | — | — |
Total Distributions | (.410) | (.190) | — |
Net Asset Value, End of Period | $20.03 | $24.15 | $21.14 |
|
|
|
|
Total Return3 | –15.61% | 15.21% | 5.70% |
|
|
|
|
Ratios/Supplemental Data |
|
|
|
Net Assets, End of Period (Millions) | $3,859 | $1,719 | $117 |
Ratio of Total Expenses to Average Net Assets | 0%4 | 0% | 0% |
Ratio of Net Investment Income to Average Net Assets | 2.79% | 2.61% | 2.24%5 |
Portfolio Turnover Rate | 15% | 4% | 2% |
1 Inception.
2 Calculated based on average shares outstanding.
3 Total returns do not include the account service fee that may be applicable to certain accounts with balances below $10,000.
4 The acquired fund fees and expenses were 0.19%.
5 Annualized.
See accompanying Notes, which are an integral part of the Financial Statements.
48
Target Retirement 2020 Fund
Notes to Financial Statements
Vanguard Target Retirement 2020 Fund is registered under the Investment Company Act of 1940 as an open-end investment company, or mutual fund. The fund follows a balanced investment strategy by investing in selected Vanguard funds to achieve its targeted allocation of assets to U.S. stocks, international stocks, and bonds.
A. The following significant accounting policies conform to generally accepted accounting principles for U.S. mutual funds. The fund consistently follows such policies in preparing its financial statements.
1. Security Valuation: Investments are valued at the net asset value of each underlying Vanguard fund determined as of the close of the New York Stock Exchange (generally 4 p.m., Eastern time) on the valuation date.
2. Federal Income Taxes: The fund intends to continue to qualify as a regulated investment company and distribute all of its taxable income. Management has analyzed the fund’s tax positions taken on federal income tax returns for all open tax years (tax years ended September 30, 2006–2008), and has concluded that no provision for federal income tax is required in the fund’s financial statements.
3. Distributions: Distributions to shareholders are recorded on the ex-dividend date.
4. Other: Income and capital gain distributions received are recorded on the ex-dividend date. Security transactions are accounted for on the date securities are bought or sold. Costs used to determine realized gains (losses) on the sale of investment securities are those of the specific securities sold.
B. Under a service agreement, The Vanguard Group furnishes investment advisory, corporate management, administrative, marketing, and distribution services to the fund. The service agreement provides that the fund’s expenses may be reduced or eliminated to the extent of savings realized by the Vanguard funds by the operation of the fund. Accordingly, all incremental expenses for services provided by Vanguard and all other expenses incurred by the fund during the year ended September 30, 2008, were borne by the funds in which the fund invests. The fund’s trustees and officers are also directors and officers of Vanguard and the funds in which the fund invests.
C. Distributions are determined on a tax basis and may differ from net investment income and realized capital gains for financial reporting purposes. Differences may be permanent or temporary. Permanent differences are reclassified among capital accounts in the financial statements to reflect their tax character. Temporary differences arise when certain items of income, expense, gain, or loss are recognized in different periods for financial statement and tax purposes; these differences will reverse at some time in the future. Differences in classification may also result from the treatment of short-term gains as ordinary income for tax purposes.
For tax purposes, at September 30, 2008, the fund had $61,923,000 of ordinary income available for distribution. The fund had available realized losses of $320,000 to offset future net capital gains through September 30, 2017.
At September 30, 2008, the cost of investment securities for tax purposes was $4,442,279,000. Net unrealized depreciation of investment securities for tax purposes was $582,434,000, consisting entirely of unrealized losses on securities that had fallen in value since their purchase.
D. During the year ended September 30, 2008, the fund purchased $3,266,310,000 of investment securities and sold $458,489,000 of investment securities, other than temporary cash investments.
49
Target Retirement 2020 Fund
E. Capital shares issued and redeemed were:
| Year Ended September 30, | |
| 2008 | 2007 |
| Shares | Shares |
| (000) | (000) |
Issued | 139,639 | 69,925 |
Issued in Lieu of Cash Distributions | 1,813 | 141 |
Redeemed | (19,939) | (4,461) |
Net Increase (Decrease) in Shares Outstanding | 121,513 | 65,605 |
F. In September 2006, the Financial Accounting Standards Board issued Statement of Financial Accounting Standards No. 157 (“FAS 157”), “Fair Value Measurements.” FAS 157 establishes a framework for measuring fair value and expands disclosures about fair value measurements in financial statements.
The various inputs that may be used to determine the value of the fund’s investments are summarized in three broad levels. The inputs or methodologies used for valuing securities are not necessarily an indication of the risk associated with investing in those securities.
Level 1—Quoted prices in active markets for identical securities.
Level 2—Other significant observable inputs (including quoted prices for similar securities, interest rates, prepayment speeds, credit risk, etc.).
Level 3—Significant unobservable inputs (including the fund’s own assumptions used to determine the fair value of investments).
At September 30, 2008, 100% of the fund’s investments were valued based on Level 1 inputs.
50
Target Retirement 2025 Fund
Fund Profile
As of September 30, 2008
Financial Attributes |
|
|
|
Yield1 | 3.0% |
Acquired Fund Fees and Expenses |
|
(9/30/2007)2 | 0.19% |
Volatility Measures3 |
|
| Fund Versus |
| Composite Index4 |
R-Squared | 1.00 |
Beta | 0.99 |
Allocation to Underlying Vanguard Funds |
|
|
|
Total Stock Market Index Fund | 62.5% |
Total Bond Market Index Fund | 22.1 |
European Stock Index Fund | 8.4 |
Pacific Stock Index Fund | 3.8 |
Emerging Markets Stock Index Fund | 3.2 |
Fund Asset Allocation
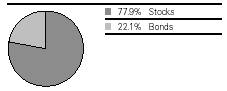
Equity Investment Focus

Fixed Income Investment Focus

1 30-day SEC yield for the fund. See the Glossary.
2 This figure—drawn from the prospectus dated January 25, 2008—represents a weighted average of the annualized expense ratios and any transaction fees charged by the underlying mutual funds (the “acquired” funds) in which the Target Retirement 2025 Fund invests. The Target Retirement 2025 Fund does not charge any expenses or fees of its own. For the fiscal year ended September 30, 2008, the acquired fund fees and expenses was 0.18%.
3 For an explanation of R-squared, beta, and other terms used here, see the Glossary.
4 Target 2025 Composite Index: Derived by applying the fund’s target asset allocation to the results of the following benchmarks: for international stocks of developed markets, the MSCI EAFE Index; for emerging markets stocks, the Select Emerging Markets Index from inception through August 23, 2006, and the MSCI Emerging Markets Index thereafter; for bonds, the Lehman U.S. Aggregate Bond Index; and for U.S. stocks, the Dow Jones Wilshire 5000 Index from inception through April 22, 2005, and the MSCI US Broad Market Index thereafter. MSCI EAFE Index returns are adjusted for withholding taxes applicable to Luxembourg holding companies.
51
Target Retirement 2025 Fund
Performance Summary
All of the returns in this report represent past performance, which is not a guarantee of future results that may be achieved by the fund. (Current performance may be lower or higher than the performance data cited. For performance data current to the most recent month-end, visit our website at www.vanguard.com/performance.) Note, too, that both investment returns and principal value can fluctuate widely, so an investor’s shares, when sold, could be worth more or less than their original cost. The returns shown do not reflect taxes that a shareholder would pay on fund distributions or on the sale of fund shares.
Cumulative Performance: October 27, 2003–September 30, 2008
Initial Investment of $10,000
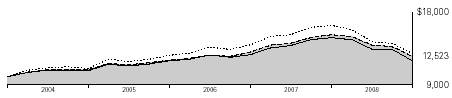
| Average Annual Total Returns | Final Value | |
| Periods Ended September 30, 2008 | of a $10,000 | |
| One Year | Since Inception1 | Investment |
Vanguard Target Retirement 2025 Fund2 | –17.61% | 4.67% | $12,523 |
Dow Jones Wilshire 5000 Index | –21.20 | 5.29 | 12,893 |
Target 2025 Composite Index3 | –17.77 | 4.64 | 12,502 |
Target 2025 Composite Average4 | –19.64 | 3.65 | 11,932 |
1 Performance for the fund and its comparative standards is calculated since the fund’s inception: October 27, 2003.
2 Total returns do not include the account service fee that may be applicable to certain accounts with balances below $10,000.
3 Target 2025 Composite Index: Derived by applying the fund’s target asset allocation to the results of the following benchmarks: for international stocks of developed markets, the MSCI EAFE Index; for emerging markets stocks, the Select Emerging Markets Index from inception through August 23, 2006, and the MSCI Emerging Markets Index thereafter; for bonds, the Lehman U.S. Aggregate Bond Index; and for U.S. stocks, the Dow Jones Wilshire 5000 Index from inception through April 22, 2005, and the MSCI US Broad Market Index thereafter. MSCI EAFE Index returns are adjusted for withholding taxes applicable to Luxembourg holding companies.
4 Target 2025 Composite Average: Derived by applying the fund’s target allocation to the following peer-group averages: the average general equity fund, average fixed income fund, average international fund, and average emerging markets fund. Derived from data provided by Lipper Inc.
52
Target Retirement 2025 Fund
Fiscal-Year Total Returns (%): October 27, 2003–September 30, 2008 | ||||
|
|
|
| Target |
|
|
|
| 2025 |
Fiscal | Capital | Income | Total | Composite1 |
Year | Return | Return | Return | Index |
2004 | 8.2% | 0.6% | 8.8% | 8.7% |
2005 | 9.1 | 1.7 | 10.8 | 11.0 |
2006 | 6.0 | 2.2 | 8.2 | 8.3 |
2007 | 14.0 | 2.5 | 16.5 | 16.4 |
2008 | –19.4 | 1.8 | –17.6 | –17.8 |
1 Target 2025 Composite Index: Derived by applying the fund’s target asset allocation to the results of the following benchmarks: for international stocks of developed markets, the MSCI EAFE Index; for emerging markets stocks, the Select Emerging Markets Index from inception through August 23, 2006, and the MSCI Emerging Markets Index thereafter; for bonds, the Lehman U.S. Aggregate Bond Index; and for U.S. stocks, the Dow Jones Wilshire 5000 Index from inception through April 22, 2005, and the MSCI US Broad Market Index thereafter. MSCI EAFE Index returns are adjusted for withholding taxes applicable to Luxembourg holding companies.
Note: See Financial Highlights table for dividend and capital gains information.
53
Target Retirement 2025 Fund
Financial Statements
Statement of Net Assets
As of September 30, 2008
The fund provides a complete list of its holdings four times in each fiscal year, at the quarter-ends. For the second and fourth fiscal quarters, the lists appear in the fund’s semiannual and annual reports to shareholders. For the first and third fiscal quarters, the fund files the lists with the Securities and Exchange Commission on Form N-Q. Shareholders can look up the fund’s Forms N-Q on the SEC’s website at www.sec.gov. Forms N-Q may also be reviewed and copied at the SEC’s Public Reference Room (see the back cover of this report for further information).
|
| Market |
|
| Value• |
| Shares | ($000) |
Investment Companies (100.0%) |
|
|
U.S. Stock Funds (62.4%) |
|
|
Vanguard Total Stock Market Index Fund Investor Shares | 169,098,609 | 4,805,783 |
Vanguard Total Stock Market ETF | 742,584 | 43,983 |
|
|
|
International Stock Funds (15.5%) |
|
|
Vanguard European Stock Index Fund Investor Shares | 23,198,008 | 652,096 |
Vanguard Pacific Stock Index Fund Investor Shares | 30,743,774 | 299,137 |
Vanguard Emerging Markets Stock Index Fund Investor Shares | 11,642,479 | 252,060 |
|
|
|
Bond Fund (22.1%) |
|
|
Vanguard Total Bond Market Index Fund Investor Shares | 174,165,268 | 1,719,011 |
Total Investment Companies (Cost $8,535,058) |
| 7,772,070 |
Other Assets and Liabilities (0.0%) |
|
|
Other Assets |
| 49,300 |
Liabilities |
| (51,892) |
|
| (2,592) |
Net Assets (100%) |
|
|
Applicable to 675,993,201 outstanding $.001 par value shares of |
|
|
beneficial interest (unlimited authorization) |
| 7,769,478 |
Net Asset Value Per Share |
| $11.49 |
At September 30, 2008, net assets consisted of: |
|
| Amount |
| ($000) |
Paid-in Capital | 8,455,979 |
Undistributed Net Investment Income | 126,495 |
Accumulated Net Realized Losses | (50,008) |
Unrealized Appreciation (Depreciation) | (762,988) |
Net Assets | 7,769,478 |
• | See Note A in Notes to Financial Statements. |
See accompanying Notes, which are an integral part of the Financial Statements.
54
Target Retirement 2025 Fund
Statement of Operations
| Year Ended |
| September 30, 2008 |
| ($000) |
Investment Income |
|
Income |
|
Income Distributions Received | 197,015 |
Net Investment Income—Note B | 197,015 |
Realized Net Gain (Loss) |
|
Capital Gain Distributions Received | — |
Investment Securities Sold | (21,723) |
Realized Net Gain (Loss) | (21,723) |
Change in Unrealized Appreciation (Depreciation) of Investment Securities | (1,673,419) |
Net Increase (Decrease) in Net Assets Resulting from Operations | (1,498,127) |
See accompanying Notes, which are an integral part of the Financial Statements.
55
Target Retirement 2025 Fund
Statement of Changes in Net Assets
| Year Ended September 30, | |
| 2008 | 2007 |
| ($000) | ($000) |
Increase (Decrease) in Net Assets |
|
|
Operations |
|
|
Net Investment Income | 197,015 | 130,000 |
Realized Net Gain (Loss) | (21,723) | 747 |
Change in Unrealized Appreciation (Depreciation) | (1,673,419) | 647,918 |
Net Increase (Decrease) in Net Assets Resulting from Operations | (1,498,127) | 778,665 |
Distributions |
|
|
Net Investment Income | (159,322) | (99,473) |
Realized Capital Gain | — | — |
Total Distributions | (159,322) | (99,473) |
Capital Share Transactions |
|
|
Issued | 3,447,494 | 2,514,282 |
Issued in Lieu of Cash Distributions | 158,878 | 99,047 |
Redeemed | (900,232) | (528,787) |
Net Increase (Decrease) from Capital Share Transactions | 2,706,140 | 2,084,542 |
Total Increase (Decrease) | 1,048,691 | 2,763,734 |
Net Assets |
|
|
Beginning of Period | 6,720,787 | 3,957,053 |
End of Period1 | 7,769,478 | 6,720,787 |
1 Net Assets—End of Period includes undistributed net investment income of $126,495,000 and $88,802,000.
See accompanying Notes, which are an integral part of the Financial Statements.
56
Target Retirement 2025 Fund
Financial Highlights
|
|
|
|
| Sept. 1, | Oct. 27, |
|
|
|
|
| 2004, to | 20032 to |
For a Share Outstanding | Year Ended September 30, | Sept. 30, | Aug. 31, | |||
Throughout Each Period | 2008 | 2007 | 2006 | 2005 | 20041 | 2004 |
Net Asset Value, Beginning of Period | $14.26 | $12.51 | $11.80 | $10.82 | $10.69 | $10.00 |
Investment Operations |
|
|
|
|
|
|
Net Investment Income | .307 | .300 | .3213 | .3203 | .020 | .130 |
Capital Gain Distributions Received | — | — | — | .0033 | — | — |
Net Realized and Unrealized Gain (Loss) |
|
|
|
|
|
|
on Investments | (2.767) | 1.740 | .630 | .839 | .110 | .620 |
Total from Investment Operations | (2.460) | 2.040 | .951 | 1.162 | .130 | .750 |
Distributions |
|
|
|
|
|
|
Dividends from Net Investment Income | (.310) | (.290) | (.240) | (.180) | — | (.060) |
Distributions from Realized Capital Gains | — | — | (.001) | (.002) | — | — |
Total Distributions | (.310) | (.290) | (.241) | (.182) | — | (.060) |
Net Asset Value, End of Period | $11.49 | $14.26 | $12.51 | $11.80 | $10.82 | $10.69 |
|
|
|
|
|
|
|
Total Return4 | –17.61% | 16.51% | 8.18% | 10.80% | 1.22% | 7.52% |
|
|
|
|
|
|
|
Ratios/Supplemental Data |
|
|
|
|
|
|
Net Assets, End of Period (Millions) | $7,769 | $6,721 | $3,957 | $1,968 | $495 | $453 |
Ratio of Total Expenses to |
|
|
|
|
|
|
Average Net Assets | 0%5 | 0% | 0% | 0% | 0% | 0% |
Ratio of Net Investment Income to |
|
|
|
|
|
|
Average Net Assets | 2.59% | 2.43% | 2.66% | 2.84% | 2.55%6 | 2.33%6 |
Portfolio Turnover Rate | 17% | 4% | 22% | 2% | 0% | 3% |
1 The fund’s fiscal year-end changed from August 31 to September 30, effective September 30, 2004.
2 Inception.
3 Calculated based on average shares outstanding.
4 Total returns do not include the account service fee that may be applicable to certain accounts with balances below $10,000.
5 The acquired fund fees and expenses were 0.18%.
6 Annualized.
See accompanying Notes, which are an integral part of the Financial Statements.
57
Target Retirement 2025 Fund
Notes to Financial Statements
Vanguard Target Retirement 2025 Fund is registered under the Investment Company Act of 1940 as an open-end investment company, or mutual fund. The fund follows a balanced investment strategy by investing in selected Vanguard funds to achieve its targeted allocation of assets to U.S. stocks, international stocks, and bonds.
A. The following significant accounting policies conform to generally accepted accounting principles for U.S. mutual funds. The fund consistently follows such policies in preparing its financial statements.
1. Security Valuation: Securities are valued as of the close of trading on the New York Stock Exchange (generally 4 p.m., Eastern time) on the valuation date. Investments in other Vanguard funds (with the exception of ETF Shares) are valued at that fund’s net asset value. ETFs are valued at the latest quoted sales prices or official closing prices taken from their primary market or, if not traded on the valuation date, at the mean of the latest quoted bid and asked prices.
2. Federal Income Taxes: The fund intends to continue to qualify as a regulated investment company and distribute all of its taxable income. Management has analyzed the fund’s tax positions taken on federal income tax returns for all open tax years (tax years ended September 30, 2005–2008), and has concluded that no provision for federal income tax is required in the fund’s financial statements.
3. Distributions: Distributions to shareholders are recorded on the ex-dividend date.
4. Other: Income and capital gain distributions received are recorded on the ex-dividend date. Security transactions are accounted for on the date securities are bought or sold. Costs used to determine realized gains (losses) on the sale of investment securities are those of the specific securities sold.
B. Under a service agreement, The Vanguard Group furnishes investment advisory, corporate management, administrative, marketing, and distribution services to the fund. The service agreement provides that the fund’s expenses may be reduced or eliminated to the extent of savings realized by the Vanguard funds by the operation of the fund. Accordingly, all incremental expenses for services provided by Vanguard and all other expenses incurred by the fund during the year ended September 30, 2008, were borne by the funds in which the fund invests. The fund’s trustees and officers are also directors and officers of Vanguard and the funds in which the fund invests.
C. Distributions are determined on a tax basis and may differ from net investment income and realized capital gains for financial reporting purposes. Differences may be permanent or temporary. Permanent differences are reclassified among capital accounts in the financial statements to reflect their tax character. Temporary differences arise when certain items of income, expense, gain, or loss are recognized in different periods for financial statement and tax purposes; these differences will reverse at some time in the future. Differences in classification may also result from the treatment of short-term gains as ordinary income for tax purposes.
For tax purposes, at September 30, 2008, the fund had $126,557,000 of ordinary income available for distribution. The fund had available realized losses of $28,071,000 to offset future net capital gains of $27,716,000 through September 30, 2015, and $355,000 through September 30, 2017.
At September 30, 2008, the cost of investment securities for tax purposes was $8,557,056,000. Net unrealized depreciation of investment securities for tax purposes was $784,986,000, consisting of unrealized gains of $1,270,000 on securities that had risen in value since their purchase and $786,256,000 in unrealized losses on securities that had fallen in value since their purchase.
58
Target Retirement 2025 Fund
D. During the year ended September 30, 2008, the fund purchased $4,054,617,000 of investment securities and sold $1,299,848,000 of investment securities, other than temporary cash investments.
E. Capital shares issued and redeemed were:
| Year Ended September 30, | |
| 2008 | 2007 |
| Shares | Shares |
| (000) | (000) |
Issued | 262,709 | 186,702 |
Issued in Lieu of Cash Distributions | 11,563 | 7,567 |
Redeemed | (69,696) | (39,196) |
Net Increase (Decrease) in Shares Outstanding | 204,576 | 155,073 |
F. In September 2006, the Financial Accounting Standards Board issued Statement of Financial Accounting Standards No. 157 (“FAS 157”), “Fair Value Measurements.” FAS 157 establishes a framework for measuring fair value and expands disclosures about fair value measurements in financial statements.
The various inputs that may be used to determine the value of the fund’s investments are summarized in three broad levels. The inputs or methodologies used for valuing securities are not necessarily an indication of the risk associated with investing in those securities.
Level 1—Quoted prices in active markets for identical securities.
Level 2—Other significant observable inputs (including quoted prices for similar securities, interest rates, prepayment speeds, credit risk, etc.).
Level 3—Significant unobservable inputs (including the fund’s own assumptions used to determine the fair value of investments).
At September 30, 2008, 100% of the fund’s investments were valued based on Level 1 inputs.
59
Report of Independent Registered Public Accounting Firm
To the Trustees of Vanguard Chester Funds and the Shareholders of Vanguard Target Retirement
Income Fund, Vanguard Target Retirement 2005 Fund, Vanguard Target Retirement 2010 Fund, Vanguard Target Retirement 2015 Fund, Vanguard Target Retirement 2020 Fund, and Vanguard Target Retirement 2025 Fund:
In our opinion, the accompanying statements of net assets and the related statements of operations and of changes in net assets and the financial highlights present fairly, in all material respects, the financial position of Vanguard Target Retirement Income Fund, Vanguard Target Retirement 2005 Fund, Vanguard Target Retirement 2010 Fund, Vanguard Target Retirement 2015 Fund, Vanguard Target Retirement 2020 Fund, and Vanguard Target Retirement 2025 Fund (the “Funds”) at September 30, 2008, the results of each of their operations for the year then ended, the changes in each of their net assets for each of the two years in the period then ended, and the financial highlights for each of the periods indicated, in conformity with accounting principles generally accepted in the United States of America. These financial statements and financial highlights (hereafter referred to as “financial statements”) are the responsibility of the Funds’ management; our responsibility is to express an opinion on these financial statements based on our audits. We conducted our audits of these financial statements in accordance with the standards of the Public Company Accounting Oversight Board (United States). Those standards require that we plan and perform the audit to obtain reasonable assurance about whether the financial statements are free of material misstatement. An audit includes examining, on a test basis, evidence supporting the amounts and disclosures in the financial statements, assessing the accounting principles used and significant estimates made by management, and evaluating the overall financial statement presentation. We believe that our audits, which included confirmation of securities at September 30, 2008 by agreement to the underlying ownership records for the Vanguard funds, provide a reasonable basis for our opinion.
PricewaterhouseCoopers LLP
Philadelphia, Pennsylvania
November 19, 2008
60
Special 2008 tax information (unaudited) for Vanguard Target Retirement Funds |
This information for the fiscal year ended September 30, 2008, is included pursuant to provisions of the Internal Revenue Code.
The funds distributed qualified dividend income to shareholders during the fiscal year as follows:
| Qualified Dividend Income |
Fund | ($000) |
Target Retirement Income Fund | 9,435 |
Target Retirement 2005 Fund | 10,954 |
Target Retirement 2010 Fund | 12,770 |
Target Retirement 2015 Fund | 70,391 |
Target Retirement 2020 Fund | 21,632 |
Target Retirement 2025 Fund | 89,236 |
For corporate shareholders, the percentage of investment income (dividend income plus short-term gains, if any) that qualifies for the dividends-received deduction is as follows:
Fund | Percentage |
Target Retirement Income Fund | 10.7% |
Target Retirement 2005 Fund | 16.4 |
Target Retirement 2010 Fund | 24.2 |
Target Retirement 2015 Fund | 30.2 |
Target Retirement 2020 Fund | 37.8 |
Target Retirement 2025 Fund | 43.3 |
61
Your Fund’s After-Tax Returns
This table presents returns for your fund both before and after taxes. The after-tax returns are shown in two ways: (1) assuming that an investor owned the fund during the entire period and paid taxes on the fund’s distributions, and (2) assuming that an investor paid taxes on the fund’s distributions and sold all shares at the end of each period.
Calculations are based on the highest individual federal income tax and capital gains tax rates in effect at the times of the distributions and the hypothetical sales. State and local taxes were not considered. After-tax returns reflect any qualified dividend income, using actual prior-year figures and estimates for 2008. (In the example, returns after the sale of fund shares may be higher than those assuming no sale. This occurs when the sale would have produced a capital loss. The calculation assumes that the investor received a tax deduction for the loss.)
Please note that your actual after-tax returns will depend on your tax situation and may differ from those shown. Also note that if you own the fund in a tax-deferred account, such as an individual retirement account or a 401(k) plan, this information does not apply to you. Such accounts are not subject to current taxes.
Finally, keep in mind that a fund’s performance—whether before or after taxes—does not guarantee future results.
Average Annual Total Returns: Vanguard Target Retirement Funds1 | ||
Periods Ended September 30, 2008 |
|
|
| One | Since |
| Year | Inception2 |
Target Retirement Income Fund |
|
|
Returns Before Taxes | –4.23% | 4.24% |
Returns After Taxes on Distributions | –5.48 | 2.97 |
Returns After Taxes on Distributions and Sale of Fund Shares | –2.62 | 2.93 |
|
|
|
Target Retirement 2005 Fund |
|
|
Returns Before Taxes | –7.89% | 4.43% |
Returns After Taxes on Distributions | –8.76 | 3.66 |
Returns After Taxes on Distributions and Sale of Fund Shares | –4.94 | 3.41 |
|
|
|
Target Retirement 2010 Fund |
|
|
Returns Before Taxes | –11.30% | 2.24% |
Returns After Taxes on Distributions | –11.79 | 1.90 |
Returns After Taxes on Distributions and Sale of Fund Shares | –7.17 | 1.76 |
1 Total returns do not include the account service fee that my be applicable to certain accounts with balances below $10,000.
2 For the Income and 2005 Funds, October 27, 2003; for the 2010 Fund, June 7, 2006.
62
| One | Since |
| Year | Inception1 |
Target Retirement 2015 Fund |
|
|
Returns Before Taxes | –13.75% | 4.62% |
Returns After Taxes on Distributions | –14.34 | 4.05 |
Returns After Taxes on Distributions and Sale of Fund Shares | –8.68 | 3.71 |
|
|
|
Target Retirement 2020 Fund |
|
|
Returns Before Taxes | –15.61% | 1.19% |
Returns After Taxes on Distributions | –15.97 | 0.91 |
Returns After Taxes on Distributions and Sale of Fund Shares | –9.94 | 0.94 |
|
|
|
Target Retirement 2025 Fund |
|
|
Returns Before Taxes | –17.61% | 4.67% |
Returns After Taxes on Distributions | –18.04 | 4.21 |
Returns After Taxes on Distributions and Sale of Fund Shares | –11.15 | 3.84 |
1 For the 2015 and 2025 Funds, October 27, 2003; for the 2020 Fund, June 7, 2006.
63
About Your Fund’s Expenses
As a shareholder of the fund, you incur ongoing costs, which include costs for portfolio management, administrative services, and shareholder reports (like this one), among others. Operating expenses, which are deducted from a fund’s gross income, directly reduce the investment return of the fund.
A typical fund’s expenses are expressed as a percentage of its average net assets. The Target Retirement Funds have no direct expenses, but each fund bears its proportionate share of the costs for the underlying funds in which it invests. These indirect expenses make up the acquired fund fees and expenses, also expressed as a percentage of average net assets.
The following examples are intended to help you understand the ongoing costs (in dollars) of investing in your fund and to compare these costs with those of other mutual funds. The examples are based on an investment of $1,000 made at the beginning of the period shown and held for the entire period. The costs were calculated using the acquired fund fees and expenses for each Target Retirement Fund.
The accompanying table illustrates your fund’s costs in two ways:
• Based on actual fund return. This section helps you to estimate the actual expenses that you paid over the period. The “Ending Account Value” shown is derived from the fund’s actual return, and the third column shows the dollar amount that would have been paid by an investor who started with $1,000 in the fund. You may use the information here, together with the amount you invested, to estimate the expenses that you paid over the period.
To do so, simply divide your account value by $1,000 (for example, an $8,600 account value divided by $1,000 = 8.6), then multiply the result by the number given for your fund under the heading “Expenses Paid During Period.”
• Based on hypothetical 5% yearly return. This section is intended to help you compare your fund’s costs with those of other mutual funds. It assumes that the fund had a yearly return of 5% before expenses, but that the expense ratio is unchanged. In this case—because the return used is not the fund’s actual return—the results do not apply to your investment. The example is useful in making comparisons because the Securities and Exchange Commission requires all mutual funds to calculate expenses based on a 5% return. You can assess your fund’s costs by comparing this hypothetical example with the hypothetical examples that appear in shareholder reports of other funds.
64
Six Months Ended September 30, 2008 |
|
|
|
| Beginning | Ending | Expenses |
| Account Value | Account Value | Paid During |
| 3/31/2008 | 9/30/2008 | Period1 |
Based on Actual Fund Return |
|
|
|
Income | $1,000.00 | $949.11 | $0.93 |
2005 | 1,000.00 | 937.71 | 0.87 |
2010 | 1,000.00 | 925.41 | 0.87 |
2015 | 1,000.00 | 915.99 | 0.86 |
2020 | 1,000.00 | 908.39 | 0.86 |
2025 | 1,000.00 | 899.77 | 0.81 |
Based on Hypothetical 5% Yearly Return |
|
|
|
Income | $1,000.00 | $1,024.12 | $0.96 |
2005 | 1,000.00 | 1,024.17 | 0.91 |
2010 | 1,000.00 | 1,024.17 | 0.91 |
2015 | 1,000.00 | 1,024.17 | 0.91 |
2020 | 1,000.00 | 1,024.17 | 0.91 |
2025 | 1,000.00 | 1,024.22 | 0.86 |
Note that the expenses shown in the table are meant to highlight and help you compare ongoing costs only and do not reflect transaction costs incurred by the fund for buying and selling securities. Further, the expenses do not include the account service fee described in the prospectus. If such a fee were applied to your account, your costs would be higher. Your fund does not charge transaction fees, such as purchase or redemption fees, nor does it carry a “sales load.”
The calculations assume no shares were bought or sold during the period. Your actual costs may have been higher or lower, depending on the amount of your investment and the timing of any purchases or redemptions.
You can find more information about the fund’s expenses, including annual expense ratios, in the Financial Statements section of this report. For additional information on operating expenses and other shareholder costs, please refer to your fund’s current prospectus.
1 The calculations are based on the acquired fund fees and expenses for the most recent six-month period. The funds’ annualized expense ratios for that period are (in order as listed from top to bottom above) 0.19%, 0.18%, 0.18%, 0.18%, 0.18%, and 0.17%. The dollar amounts shown as “Expenses Paid” are equal to the annualized expense figures, multiplied by the average account value over the period, multiplied by the number of days in the most recent six-month period, then divided by the number of days in the most recent 12-month period.
65
Glossary
Acquired Fund Fees and Expenses. Funds that invest in other Vanguard funds incur no direct expenses, but they do bear proportionate shares of the operating, administrative, and advisory expenses of the underlying funds, and they must pay any fees charged by those funds. The figure for acquired fund fees and expenses represents a weighted average of these underlying costs. Acquired is a term that the Securities and Exchange Commission applies to any mutual fund whose shares are owned by another fund.
Beta. A measure of the magnitude of a fund’s past share-price fluctuations in relation to the ups and downs of a given market index. The index is assigned a beta of 1.00. Compared with a given index, a fund with a beta of 1.20 typically would have seen its share price rise or fall by 12% when the index rose or fell by 10%. For this report, beta is based on returns over the past 36 months for both the fund and the index. Note that a fund’s beta should be reviewed in conjunction with its R-squared (see definition). The lower the R-squared, the less correlation there is between the fund and the index, and the less reliable beta is as an indicator of volatility.
Expense Ratio. The percentage of a fund’s average net assets used to pay its annual administrative and advisory expenses. These expenses directly reduce returns to investors.
Inception Date. The date on which the assets of a fund (or one of its share classes) are first invested in accordance with the fund’s investment objective. For funds with a subscription period, the inception date is the day after that period ends. Investment performance is measured from the inception date.
R-Squared. A measure of how much of a fund’s past returns can be explained by the returns from the market in general, as measured by a given index. If a fund’s total returns were precisely synchronized with an index’s returns, its R-squared would be 1.00. If the fund’s returns bore no relationship to the index’s returns, its R-squared would be 0. For this report, R-squared is based on returns over the past 36 months for both the fund and the index.
Yield. A fund’s 30-day SEC yield is derived using a formula specified by the U.S. Securities and Exchange Commission. Under the formula, data related to the fund’s security holdings in the previous 30 days are used to calculate the fund’s hypothetical net income for that period, which is then annualized and divided by the fund’s estimated average net assets over the calculation period. For the purposes of this calculation, a security’s income is based on its current market yield to maturity (in the case of bonds) or its projected dividend yield (for stocks). Because the SEC yield represents hypothetical annualized income, it will differ—at times significantly—from the fund’s actual experience. As a result, the fund’s income distributions may be higher or lower than implied by the SEC yield.
66
This page intentionally left blank.
The People Who Govern Your Fund
The trustees of your mutual fund are there to see that the fund is operated and managed in your best interests since, as a shareholder, you are a part owner of the fund. Your fund’s trustees also serve on the board of directors of The Vanguard Group, Inc., which is owned by the Vanguard funds and provides services to them on an at-cost basis.
A majority of Vanguard’s board members are independent, meaning that they have no affiliation with Vanguard or the funds they oversee, apart from the sizable personal investments they have made as private individuals.
Our independent board members bring distinguished backgrounds in business, academia, and public service to their task of working with Vanguard officers to establish the policies and oversee the activities of the funds. Among board members’ responsibilities are selecting investment advisors for the funds; monitoring fund operations, performance, and costs; reviewing contracts; nominating and selecting new trustees/directors; and electing Vanguard officers.
Each trustee serves a fund until its termination; or until the trustee’s retirement, resignation, or death; or otherwise as specified in the fund’s organizational documents. Any trustee may be removed at a shareholders’ meeting by a vote representing two-thirds of the net asset value of all shares of the fund together with shares of other Vanguard funds organized within the same trust. The table on these two pages shows information for each trustee and executive officer of the fund. The mailing address of the trustees and officers is P.O. Box 876, Valley Forge, PA 19482.
Chairman of the Board and Trustee | |
|
|
John J. Brennan1 |
|
Born 1954 | Principal Occupation(s) During the Past Five Years: Chairman of the Board and Director/ |
Trustee Since May 1987; | Trustee of The Vanguard Group, Inc., and of each of the investment companies served |
Chairman of the Board | by The Vanguard Group; Chief Executive Officer and President of The Vanguard Group |
156 Vanguard Funds Overseen | and of each of the investment companies served by The Vanguard Group (1996–2008). |
|
|
Independent Trustees |
|
|
|
Charles D. Ellis |
|
Born 1937 | Principal Occupation(s) During the Past Five Years: Applecore Partners (pro bono ventures |
Trustee Since January 2001 | in education); Senior Advisor to Greenwich Associates (international business strategy |
156 Vanguard Funds Overseen | consulting); Successor Trustee of Yale University; Overseer of the Stern School of Business |
| at New York University; Trustee of the Whitehead Institute for Biomedical Research. |
|
|
Emerson U. Fullwood |
|
Born 1948 | Principal Occupation(s) During the Past Five Years: Executive Chief Staff and Marketing |
Trustee Since January 2008 | Officer for North America since 2004 and Corporate Vice President of Xerox Corporation |
156 Vanguard Funds Overseen | (photocopiers and printers); Director of SPX Corporation (multi-industry manufacturing), |
| of the United Way of Rochester, and of the Boy Scouts of America. |
|
|
Rajiv L. Gupta |
|
Born 1945 | Principal Occupation(s) During the Past Five Years: Chairman, President, and |
Trustee Since December 20012 | Chief Executive Officer of Rohm and Haas Co. (chemicals); Board Member of |
156 Vanguard Funds Overseen | the American Chemistry Council; Director of Tyco International, Ltd. (diversified |
| manufacturing and services) since 2005. |
|
|
Amy Gutmann |
|
Born 1949 | Principal Occupation(s) During the Past Five Years: President of the University of |
Trustee Since June 2006 | Pennsylvania since 2004; Professor in the School of Arts and Sciences, Annenberg School |
156 Vanguard Funds Overseen | for Communication, and Graduate School of Education of the University of Pennsylvania |
| since 2004; Provost (2001–2004) and Laurance S. Rockefeller Professor of Politics and |
| the University Center for Human Values (1990–2004), Princeton University; Director of |
| Carnegie Corporation of New York since 2005 and of Schuylkill River Development |
| Corporation and Greater Philadelphia Chamber of Commerce since 2004; Trustee of |
| the National Constitution Center since 2007. |
JoAnn Heffernan Heisen |
|
Born 1950 | Principal Occupation(s) During the Past Five Years: Corporate Vice President and |
Trustee Since July 1998 | Chief Global Diversity Officer since 2006, Vice President and Chief Information |
156 Vanguard Funds Overseen | Officer (1997–2005), and Member of the Executive Committee of Johnson & |
| Johnson (pharmaceuticals/consumer products); Director of the University Medical |
| Center at Princeton and Women’s Research and Education Institute. |
|
|
André F. Perold |
|
Born 1952 | Principal Occupation(s) During the Past Five Years: George Gund Professor of Finance |
Trustee Since December 2004 | and Banking, Harvard Business School; Senior Associate Dean and Director of Faculty |
156 Vanguard Funds Overseen | Recruiting, Harvard Business School; Director and Chairman of UNX, Inc. (equities |
| trading firm); Chair of the Investment Committee of HighVista Strategies LLC (private |
| investment firm) since 2005. |
|
|
Alfred M. Rankin, Jr. |
|
Born 1941 | Principal Occupation(s) During the Past Five Years: Chairman, President, Chief Executive |
Trustee Since January 1993 | Officer, and Director of NACCO Industries, Inc. (forklift trucks/housewares/lignite); Director |
156 Vanguard Funds Overseen | of Goodrich Corporation (industrial products/aircraft systems and services). |
|
|
J. Lawrence Wilson |
|
Born 1936 | Principal Occupation(s) During the Past Five Years: Retired Chairman and Chief Executive |
Trustee Since April 1985 | Officer of Rohm and Haas Co. (chemicals); Director of Cummins Inc. (diesel engines) and |
156 Vanguard Funds Overseen | AmerisourceBergen Corp. (pharmaceutical distribution); Trustee of Vanderbilt University |
| and of Culver Educational Foundation. |
|
|
Executive Officers1 |
|
|
|
Thomas J. Higgins |
|
Born 1957 | Principal Occupation(s) During the Past Five Years: Principal of The Vanguard Group, Inc.; |
Chief Financial Officer | Treasurer of each of the investment companies served by The Vanguard Group; Chief |
Since September 2008 | Financial Officer of each of the investment companies served by The Vanguard |
Treasurer Since July 1998 | Group since 2008. |
156 Vanguard Funds Overseen |
|
|
|
F. William McNabb III |
|
Born 1957 | Principal Occupation(s) During the Past Five Years: Chief Executive Officer, Director, |
Chief Executive Officer | and President of The Vanguard Group, Inc., since 2008; Chief Executive Officer and |
Since August 31, 2008 | President of each of the investment companies served by The Vanguard Group since |
President Since March 2008 | 2008; Director of Vanguard Marketing Corporation; Managing Director of The Vanguard |
156 Vanguard Funds Overseen | Group (1995–2008). |
|
|
Heidi Stam |
|
Born 1956 | Principal Occupation(s) During the Past Five Years: Managing Director of The Vanguard |
Secretary Since July 2005 | Group, Inc., since 2006; General Counsel of The Vanguard Group since 2005; Secretary of |
156 Vanguard Funds Overseen | The Vanguard Group and of each of the investment companies served by The Vanguard |
| Group since 2005; Director and Senior Vice President of Vanguard Marketing Corporation |
| since 2005; Principal of The Vanguard Group (1997–2006). |
Vanguard Senior Management Team |
|
| |
|
|
|
|
R. Gregory Barton | Kathleen C. Gubanich | Michael S. Miller | Glenn W. Reed |
Mortimer J. Buckley | Paul A. Heller | Ralph K. Packard | George U. Sauter |
Founder |
|
John C. Bogle |
Chairman and Chief Executive Officer, 1974–1996 |
1 These individuals are “interested persons” as defined in the Investment Company Act of 1940.
2 December 2002 for Vanguard Equity Income Fund, Vanguard Growth Equity Fund, the Vanguard Municipal Bond Funds, and the Vanguard State Tax-Exempt Funds.
More information about the trustees is in the Statement of Additional Information, available from The Vanguard Group.
|
|
| P.O. Box 2600 |
| Valley Forge, PA 19482-2600 |

Connect with Vanguard® > www.vanguard.com
Fund Information > 800-662-7447 | All comparative mutual fund data are from Lipper Inc. |
| or Morningstar, Inc., unless otherwise noted. |
Direct Investor Account Services > 800-662-2739 |
|
|
|
Institutional Investor Services > 800-523-1036 | You can obtain a free copy of Vanguard’s proxy voting |
| guidelines by visiting our website, www.vanguard.com, |
Text Telephone for People | and searching for “proxy voting guidelines,” or by |
With Hearing Impairment > 800-952-3335 | calling Vanguard at 800-662-2739. The guidelines are |
| also available from the SEC’s website, www.sec.gov. |
| In addition, you may obtain a free report on how your |
| fund voted the proxies for securities it owned during |
This material may be used in conjunction | the 12 months ended June 30. To get the report, visit |
with the offering of shares of any Vanguard | either www.vanguard.com or www.sec.gov. |
fund only if preceded or accompanied by |
|
the fund’s current prospectus. |
|
|
|
| You can review and copy information about your fund |
| at the SEC’s Public Reference Room in Washington, D.C. |
The funds or securities referred to herein are not | To find out more about this public service, call the SEC |
sponsored, endorsed, or promoted by MSCI, and MSCI | at 202-551-8090. Information about your fund is also |
bears no liability with respect to any such funds or | available on the SEC’s website, and you can receive |
securities. For any such funds or securities, the | copies of this information, for a fee, by sending a |
prospectus or the Statement of Additional Information | request in either of two ways: via e-mail addressed to |
contains a more detailed description of the limited | publicinfo@sec.gov or via regular mail addressed to the |
relationship MSCI has with The Vanguard Group and | Public Reference Section, Securities and Exchange |
any related funds. | Commission, Washington, DC 20549-0102. |
|
|
|
|
Russell is a trademark of The Frank Russell Company. |
|
|
|
|
|
|
|
|
|
|
|
|
|
| © 2008 The Vanguard Group, Inc. |
| All rights reserved. |
| Vanguard Marketing Corporation, Distributor. |
|
|
| Q3080 112008 |
Item 2: Code of Ethics. The Registrant has adopted a code of ethics that applies to the Registrant’s principal executive officer, principal financial officer, principal accounting officer or controller or persons performing similar functions. The Code of Ethics was amended during the reporting period covered by this report to make certain technical, non-material changes.
Item 3: Audit Committee Financial Expert. The following members of the Audit Committee have been determined by the Registrant’s Board of Trustees to be Audit Committee Financial Experts serving on its Audit Committee, and to be independent: Charles D. Ellis, Rajiv L. Gupta, JoAnn Heffernan Heisen, André F. Perold, Alfred M. Rankin, Jr., and J. Lawrence Wilson.
Item 4: Principal Accountant Fees and Services.
(a) Audit Fees.
Audit Fees of the Registrant
Fiscal Year Ended September 30, 2008: $168,000
Fiscal Year Ended September 30, 2007: $170,000
Aggregate Audit Fees of Registered Investment Companies in the Vanguard Group.
Fiscal Year Ended September 30, 2008: $3,055,590
Fiscal Year Ended September 30, 2007: $2,835,320
(b) Audit-Related Fees.
Fiscal Year Ended September 30, 2008: $626,240
Fiscal Year Ended September 30, 2007: $630,400
Includes fees billed in connection with assurance and related services provided to the Registrant, The Vanguard Group, Inc., Vanguard Marketing Corporation, and other registered investment companies in the Vanguard Group.
(c) Tax Fees.
Fiscal Year Ended September 30, 2008: $230,400
Fiscal Year Ended September 30, 2007: $215,900
Includes fees billed in connection with tax compliance, planning and advice services provided to the Registrant, The Vanguard Group, Inc., Vanguard Marketing Corporation, and other registered investment companies in the Vanguard Group and related to income and excise taxes.
(d) All Other Fees.
Fiscal Year Ended September 30, 2008: $0
Fiscal Year Ended September 30, 2007: $0
Includes fees billed for services related to risk management and privacy matters. Services were provided to the Registrant, The Vanguard Group, Inc., Vanguard Marketing Corporation, and other registered investment companies in the Vanguard Group.
(e) (1) Pre-Approval Policies. The policy of the Registrant’s Audit Committee is to consider and, if appropriate, approve before the principal accountant is engaged for such services, all specific audit and non-audit services provided to: (1) the Registrant; (2) The Vanguard Group, Inc.; (3) other entities controlled by The Vanguard Group, Inc. that provide ongoing services to the Registrant; and (4) other registered investment companies in the Vanguard Group. In making a determination, the Audit Committee considers whether the services are consistent with maintaining the principal accountant’s independence.
In the event of a contingency situation in which the principal accountant is needed to provide services in between scheduled Audit Committee meetings, the Chairman of the Audit Committee would be called on to consider and, if appropriate, pre-approve audit or permitted non-audit services in an amount sufficient to complete services through the next Audit Committee meeting, and to determine if such services would be consistent with maintaining the accountant’s independence. At the next scheduled Audit Committee meeting, services and fees would be presented to the Audit Committee for formal consideration, and, if appropriate, approval by the entire Audit Committee. The Audit Committee would again consider whether such services and fees are consistent with maintaining the principal accountant’s independence.
The Registrant’s Audit Committee is informed at least annually of all audit and non-audit services provided by the principal accountant to the Vanguard complex, whether such services are provided to: (1) the Registrant; (2) The Vanguard Group, Inc.; (3) other entities controlled by The Vanguard Group, Inc. that provide ongoing services to the Registrant; or (4) other registered investment companies in the Vanguard Group.
(2) No percentage of the principal accountant’s fees or services were approved pursuant to the waiver provision of paragraph (c)(7)(i)(C) of Rule 2-01 of Regulation S-X.
(f) For the most recent fiscal year, over 50% of the hours worked under the principal accountant’s engagement were not performed by persons other than full-time, permanent employees of the principal accountant.
(g) Aggregate Non-Audit Fees.
Fiscal Year Ended September 30, 2008: $230,400
Fiscal Year Ended September 30, 2007: $215,900
Includes fees billed for non-audit services provided to the Registrant, The Vanguard Group, Inc., Vanguard Marketing Corporation, and other registered investment companies in the Vanguard Group.
(h) For the most recent fiscal year, the Audit Committee has determined that the provision of all non-audit services was consistent with maintaining the principal accountant’s independence.
Item 5: Not Applicable.
Item 6: Not Applicable.
Item 7: Not Applicable.
Item 8: Not Applicable.
Item 9: Not Applicable.
Item 10: Not Applicable.
Item 11: Controls and Procedures.
(a) Disclosure Controls and Procedures. The Principal Executive and Financial Officers concluded that the Registrant's Disclosure Controls and Procedures are effective based on their evaluation of the Disclosure Controls and Procedures as of a date within 90 days of the filing date of this report.
(b) Internal Control Over Financial Reporting. There were no significant changes in Registrant’s Internal Control Over Financial Reporting or in other factors that could significantly affect this control subsequent to the date of the evaluation, including any corrective actions with regard to significant deficiencies and material weaknesses.
Item 12: Exhibits.
| (a) | Code of Ethics. |
| (b) | Certifications. |
Pursuant to the requirements of the Securities Exchange Act of 1934 and the Investment Company Act of 1940, the registrant has duly caused this report to be signed on its behalf by the undersigned, thereunto duly authorized.
| VANGUARD CHESTER FUNDS |
|
|
By: | /s/ F. WILLIAM MCNABB III* |
| F. WILLIAM MCNABB III |
| CHIEF EXECUTIVE OFFICER |
|
|
Date: November 18, 2008 | |
Pursuant to the requirements of the Securities Exchange Act of 1934 and the Investment Company Act of 1940, this report has been signed below by the following persons on behalf of the registrant and in the capacities and on the dates indicated.
| VANGUARD CHESTER FUNDS |
|
|
By: | /s/ F. WILLIAM MCNABB III* |
| F. WILLIAM MCNABB III |
| CHIEF EXECUTIVE OFFICER |
|
|
Date: November 18, 2008 | |
| VANGUARD CHESTER FUNDS |
|
|
By: | /s/ THOMAS J. HIGGINS* |
| THOMAS J. HIGGINS |
| CHIEF FINANCIAL OFFICER |
|
|
Date: November 18, 2008 | |
* By: /s/ Heidi Stam
Heidi Stam, pursuant to a Power of Attorney filed on January 18, 2008, see file Number 2-29601, Incorporated by Reference; and pursuant to a Power of Attorney filed on September 26, 2008, see File Number 2-47371, Incorporated by Reference.