UNITED STATES
SECURITIES AND EXCHANGE COMMISSION
Washington, D.C. 20549
FORM N-CSR
CERTIFIED SHAREHOLDER REPORT
OF
REGISTERED MANAGEMENT INVESTMENT COMPANIES
Investment Company Act file number: 811-04098
Name of Registrant: Vanguard Chester Funds
Address of Registrant:
P.O. Box 2600
Valley Forge, PA 19482
Name and address of agent for service:
Heidi Stam, Esquire
P.O. Box 876
Valley Forge, PA 19482
Registrant’s telephone number, including area code: (610) 669-1000
Date of fiscal year end: September 30
Date of reporting period: October 1, 2011 – September 30, 2012
Item 1: Reports to Shareholders

|
| |
| Annual Report | September 30, 2012 |
| |
| Vanguard PRIMECAP Fund |
| |
 |
> For the fiscal year ended September 30, 2012, Vanguard PRIMECAP Fund returned about 24%, trailing the return of its benchmark index and the average return of peer funds.
> The fund’s holdings in information technology, its largest sector on average, didn’t measure up to those of the benchmark, but its commitment to health care boosted performance.
> For the decade ended September 30, 2012, the fund’s average annual return of more than 10% outperformed the comparable returns of its benchmark index and peer funds by more than 2 percentage points.
| |
| Contents | |
| Your Fund’s Total Returns. | 1 |
| Chairman’s Letter. | 2 |
| Advisor’s Report. | 9 |
| Fund Profile. | 13 |
| Performance Summary. | 14 |
| Financial Statements. | 16 |
| Your Fund’s After-Tax Returns. | 28 |
| About Your Fund’s Expenses. | 29 |
| Trustees Approve Advisory Arrangement. | 31 |
| Glossary. | 32 |
Please note: The opinions expressed in this report are just that—informed opinions. They should not be considered promises or advice. Also, please keep in mind that the information and opinions cover the period through the date on the front of this report. Of course, the risks of investing in your fund are spelled out in the prospectus.
See the Glossary for definitions of investment terms used in this report.
About the cover: Our cover photograph shows rigging on the HMSSurprise, a replica of an 18th-century Royal Navy frigate. It was featured in the 2003 movie Master and Commander: The Far Side of the World, which was based on Patrick O’Brian’s sea novels, set amid the Napoleonic Wars. Vanguard was named for another ship of that era, the HMSVanguard, which was the flagship of British Admiral Horatio Nelson at the Battle of the Nile.
| |
| Your Fund’s Total Returns | |
| |
| |
| |
| |
| Fiscal Year Ended September 30, 2012 | |
| |
| | Total |
| | Returns |
| Vanguard PRIMECAP Fund | |
| Investor Shares | 24.17% |
| Admiral™ Shares | 24.29 |
| S&P 500 Index | 30.20 |
| Multi-Cap Growth Funds Average | 25.46 |
Multi-Cap Growth Funds Average: Derived from data provided by Lipper Inc.
Admiral Shares carry lower expenses and are available to investors who meet certain account-balance requirements.
Your Fund’s Performance at a Glance
September 30, 2011, Through September 30, 2012
| | | | |
| | | | Distributions Per Share |
| | Starting | Ending | Income | Capital |
| | Share Price | Share Price | Dividends | Gains |
| Vanguard PRIMECAP Fund | | | | |
| Investor Shares | $58.46 | $69.39 | $0.689 | $2.104 |
| Admiral Shares | 60.69 | 72.03 | 0.785 | 2.182 |

Chairman’s Letter
Dear Shareholder,
Global stock markets began the fiscal year strongly and––after weathering some springtime disruption––also finished on a high note with four straight months of gains. Although Vanguard PRIMECAP Fund’s performance was strong for the 12 months ended September 30, 2012, it trailed its comparative standards.
The fund returned about 24% for the period, compared with about 30% for its benchmark, the Standard & Poor’s 500 Index, and 25% on average for peer multi-capitalization growth funds.
The PRIMECAP Fund’s returns often diverge from those of its benchmark and peers because of the advisor’s willingness to establish outsized stakes in what it considers the market’s most promising long-term investment opportunities. In recent years, the advisor has found those opportunities in information technology and health care companies. Over the past 12 months, the fund’s tech stocks weighed on relative performance, while its health care stocks gave it a boost.
On a separate note, I want to inform you that Vanguard has eliminated the redemption fee for your fund, effective May 23. The fund’s trustees determined that the fee, one of several measures in place to discourage frequent trading and protect the interests of long-term investors, was no longer needed.
2
If you hold fund shares in a taxable account, you may wish to review the table of after-tax returns, based on the highest federal income tax bracket, that appears later in this report.
Stocks notched a powerful rally, with help from central bankers
U.S. stocks surged 30% in the 12 months ended September 30, outpacing the gains of their international counterparts. The rally came amid moves by U.S. and European central bankers to quiet—at least temporarily—investors’ concerns about the U.S. economy and the finances of European governments and banks.
While U.S. stocks were the standouts, European and emerging markets stocks also posted double-digit results. The developed markets of the Pacific region were the weakest performers but still recorded a modest advance.
In July, the president of the European Central Bank declared that policymakers would do whatever was needed to preserve the euro common currency. That pronouncement was encouraging to investors, but Europe’s financial troubles are by no means resolved.
Vanguard economists believe the most likely scenario is that the Eurozone will “muddle through” for several years, with occasional spikes in market volatility, as fiscal tightening continues in the face of weak economic growth.
| | | |
| Market Barometer | | | |
| |
| | | Average Annual Total Returns |
| | Periods Ended September 30, 2012 |
| | One | Three | Five |
| | Year | Years | Years |
| Stocks | | | |
| Russell 1000 Index (Large-caps) | 30.06% | 13.27% | 1.22% |
| Russell 2000 Index (Small-caps) | 31.91 | 12.99 | 2.21 |
| Dow Jones U.S. Total Stock Market Index | 30.00 | 13.29 | 1.53 |
| MSCI All Country World Index ex USA (International) | 14.48 | 3.17 | -4.12 |
| |
| Bonds | | | |
| Barclays U.S. Aggregate Bond Index (Broad taxable market) | 5.16% | 6.19% | 6.53% |
| Barclays Municipal Bond Index (Broad tax-exempt market) | 8.32 | 5.99 | 6.06 |
| Citigroup Three-Month U.S. Treasury Bill Index | 0.05 | 0.08 | 0.63 |
| |
| CPI | | | |
| Consumer Price Index | 1.99% | 2.33% | 2.11% |
3
Bonds produced solid returns; future results may be more muted
Bonds once again advanced; the broad U.S. taxable market returned about 5% for the 12 months. Among U.S. Treasuries, long-term bonds were particularly strong as they benefited from the Federal Reserve’s bond-buying program.
As bond prices rose, the yield of the 10-year U.S. Treasury note fell to a record low in July, closing below 1.5%. (Bond yields and prices move in opposite directions.) By the end of the period, the yield had climbed, but it still remained low by historical standards.
Bondholders have enjoyed years of strong returns. But as Tim Buckley, our incoming chief investment officer, has noted, investors shouldn’t be surprised if future results are much more modest. As yields tumble, the scope for further declines—and price increases—diminishes.
The Federal Reserve announced on September 13 that it would continue to hold its target for short-term interest rates between 0% and 0.25% at least through mid-2015. The exceptionally low rates, in place since late 2008, kept a tight lid on returns from money market funds and savings accounts.
The fund’s technology holdingshindered relative performance
The PRIMECAP Fund seeks to invest in companies with underappreciated long-term growth prospects, a strategy that has served it well over the decades. The
Expense Ratios
Your Fund Compared With Its Peer Group
| | | |
| | Investor | Admiral | Peer Group |
| | Shares | Shares | Average |
| PRIMECAP Fund | 0.45% | 0.36% | 1.34% |
The fund expense ratios shown are from the prospectus dated January 26, 2012, and represent estimated costs for the current fiscal year. For the fiscal year ended September 30, 2012, the fund’s expense ratios were 0.45% for Investor Shares and 0.36% for Admiral Shares. The peer-group expense ratio is derived from data provided by Lipper Inc. and captures information through year-end 2011.
Peer group: Multi-Cap Growth Funds.
4
advisor has built a solid track record on a willingness to assemble a portfolio that can look very different from the market.
The flip side of this distinctive approach is that there are times when the fund’s performance trails the benchmark results. Such was the case over the 2012 fiscal year, when the fund lacked exposure to some of the technology sector’s brightest stars. PRIMECAP’s technology stocks climbed almost 19%. Those in the benchmark returned more than 30%. The fund hasn’t had meaningful exposure to certain companies that have best capitalized on the craze for smartphones and tablets. Instead, its tech holdings include a number of formerly high-flying companies that have fallen (temporarily, in the advisor’s judgment) from consumers’ and investors’ favor.
Industrial stocks were also a disappointment for PRIMECAP. The fund’s airline and logistics companies––which are susceptible to swings both large and small––struggled over the period.
Against these sore spots for the fund, health care stocks provided at least a partial salve. PRIMECAP’s health care holdings climbed about 35%, compared with 29% for the index sector. Almost all of the difference came from the biotech-nology industry, where the fund’s stocks benefited from developing drug pipelines and their strong financial position.
Total Returns
Ten Years Ended September 30, 2012
| |
| | Average |
| | Annual Return |
| PRIMECAP Fund Investor Shares | 10.58% |
| S&P 500 Index | 8.01 |
| Multi-Cap Growth Funds Average | 7.96 |
| Multi-Cap Growth Funds Average: Derived from data provided by Lipper Inc. | |
The figures shown represent past performance, which is not a guarantee of future results. (Current performance may be lower or higher than the performance data cited. For performance data current to the most recent month-end, visit our website at vanguard.com/performance.) Note, too, that both investment returns and principal value can fluctuate widely, so an investor’s shares, when sold, could be worth more or less than their original cost.
5
For more on the advisor’s strategy and outlook, please see the Advisor’s Report following this letter.
The longterm record testifies to the merit of a patient approach
PRIMECAP Management Company, the fund’s advisor, relies on deep fundamental research in an effort to uncover opportunities that will yield outsized rewards over the next three to five years. When it finds these companies, it invests heavily. The fund’s long-term record is a ringing validation of this approach.
But the key word there is long-term. I hope you’ll read the Investment Insight on page 6 for some additional thoughts regarding
|
| Investment insight |
| |
| Patience and perspective |
| |
| Vanguard PRIMECAP Fund’s portfolio |
| looks very different from the makeup |
| of its benchmark index. Ideally, these |
| differences lead to benchmark-beating |
| long-term returns. At times, however, |
| different can mean subpar. A key to |
| success with PRIMECAP’s bold, |
| relatively concentrated approach is |
| patience during these patches of |
| weakness. |
| |
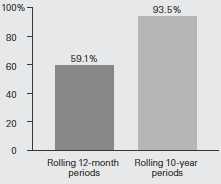
| The fund’s historical returns show |
| that short-term weakness has often |
| marked the path to superior long-term |
| returns. The fund’s Investor Shares |
| have outperformed the S&P 500 Index |
| in 59% of the 323 rolling 12-month |
| periods since their 1984 inception. That |
| figure is impressive, but look at it from |
| the other side: The fund has trailed the |
| index 41% of the time—132 occasions |
| when an impatient investor could have |
| grown frustrated. |
| |
| Over the 215 rolling ten-year periods |
| since its inception, however, the fund |
| has outperformed the S&P 500 Index |
| 93.5% of the time in terms of average |
| yearly return—a powerful case for |
| patience and perspective with a strategy |
| designed not to mirror the market, but |
| to follow its own path toward potentially |
| superior results. |
| |
| Percentage of periods in which Vanguard |
| PRIMECAP Fund outperformed the S&P 500 |
| Index, November 1984–September 2012 |
| |
 |
| |
| Note: In the 323 12-month periods since November 30, 1984, |
| the fund’s Investor Shares outperformed the S&P 500 Index |
| 191 times. In the 215 ten-year periods since November 30, 1984, |
| the Investor Shares outperformed the index 201 times, based |
| on average annual returns. |
| Sources: Vanguard and S&P. |
| |
6
the kind of patience and tempered expectations that a distinctively managed fund such as this one can require from its investors.
For the ten years ended September 30, 2012, the PRIMECAP Fund generated an average annual return of 10.58%, more than 2 percentage points ahead of both its market benchmark, the S&P 500 Index, and the average return of peer funds. That means that over those ten years, an initial investment of $10,000 in the PRIMECAP Fund would have grown to $27,326, some $5,000 more than it would have earned had it grown at the benchmark’s rate of return.
These results are the product of PRIMECAP Management Company’s deep expertise. Vanguard’s historically low costs helped the advisor’s cause and allowed shareholders to keep more of the fund’s returns.
The lessons of the financial crisis remain relevant four years later
In September, the end of your fund’s fiscal year, we marked the fourth anniversary of Lehman Brothers’ collapse, the start of the 2008–2009 financial crisis. When the Lehman news broke, I was speaking to institutional clients at an event in Washington, D.C., all of three weeks into my new role as Vanguard’s CEO.
In the ensuing months, I was struck both by how fortunate I was to work with a great team of Vanguard “crew” and by the remarkable steadiness demonstrated by our clients. Many clients experienced significant losses, but signs of panic were few. On balance, they remained committed to their long-term investment programs and managed to benefit from the financial markets’ subsequent recovery.
As the crisis recedes further in time, it’s important not to lose sight of the lessons that it illuminated about investing and sound financial practices generally. First among those lessons is that diversification does work. Diversification didn’t immunize investors from the market’s decline, but it certainly helped to insulate them from the worst of it.
Second, saving money and living within your means are critical. Investors are acting on this lesson as they pay off debt, which is a form of saving, and increase their savings rates from the dangerously low levels that prevailed before the crisis.
Third, having the courage to stick with a sound investment plan—as so many of our clients did—is important during volatile, uncertain times. Investors who resisted the urge to bail out of stocks at the depths of the crisis have largely been rewarded in the succeeding years.
7
I am very optimistic that, if investors embrace these lessons, they can give themselves a better chance of reaching their long-term goals.
As always, thank you for entrusting your assets to Vanguard.
Sincerely,

F. William McNabb III
Chairman and Chief Executive Officer
October 11, 2012
8
Advisor’s Report
For the fiscal year ended September 30, 2012, Vanguard PRIMECAP Fund’s total returns of 24.17% for Investor Shares and 24.29% for Admiral Shares trailed both the 30.20% return of the unmanaged S&P 500 Index benchmark and the 25.46% average return of multi-capitalization growth fund competitors.
The investment environment
The stock market showed strong gains over the past 12 months despite a more challenging global economic outlook. Growth in U.S. gross domestic product (GDP) for the second quarter of 2012 was just 1.3%, suggesting a slowdown in the midst of an already tepid recovery. Consumer spending trends have been mixed, with signs of acceleration followed by periods of sluggishness as households struggle in the face of high unemployment, little growth in personal income, and a difficult housing market.
Despite news that the unemployment rate dropped below 8% in September for the first time since January 2009, job growth remains weak. The official unemployment rate likely understates the difficult job environment, since it does not reflect workers who are no longer seeking employment or those who are underemployed. Outside the United States, economic and geopolitical developments were largely negative. The sovereign-debt crisis continued to weigh on European economies, China showed signs of slowing economic growth, and tensions flared in the Middle East.
Management of the fund
Despite the subpar results of the past fiscal year, our investment approach remains consistent. We rely on fundamental research to identify companies whose revenues and earnings will, in our opinion, grow more rapidly over a three-to-five-year time frame than current valuations might suggest. We seek to capitalize on situations in which the fundamental value of a company significantly exceeds its current market value.
This investment strategy has led us to build and maintain significant investments in information technology and health care companies that we believe offer the potential for higher returns than the overall market will produce. These two sectors make up about 60% of the fund’s holdings (versus about 30% for the S&P 500 Index). Nine of the ten largest holdings in the fund are health care or information technology stocks.
Technology
The fund’s disappointing relative returns for the past 12 months were mainly due to poor stock selection in the information technology sector. The IT stocks in the S&P 500 Index returned 32.4% for the fiscal year. In comparison, the fund’s holdings in the sector returned only 18.8%. A major reason for this gap was the fund’s minimal position in Apple (+76%), which in August attained the highest market capitalization of any company in history. Notable detractors within the portfolio were Research In Motion (–63%) and
9
Hewlett-Packard (–22%). Several of the fund’s largest IT holdings, including Texas Instruments (+6%), Oracle (+10%), and Microsoft (+23%), had lower returns than the S&P 500; however, our holding in Google (+47%) partially offset these results.
Despite the disappointing results over the past 12 months, we remain enthusiastic about the fund’s information technology holdings for several reasons. Many of these companies are trading at attractive valuations, with good growth prospects and large cash balances. The adoption of mobile computing devices, such as smartphones and tablet computers, and the continued expansion of the internet through social networking and e-commerce applications are helping to drive growth in demand for semiconductors, computer hardware, software, storage, and technology-driven services such as consulting and data analytics. Some of the largest holdings in the portfolio, including Google, Qualcomm, Texas Instruments, Oracle, and Microsoft, are well-positioned to capitalize on these trends.
Health care
The fund’s health care stocks contributed favorably to its results. Two of our largest holdings, Biogen Idec (+60%) and Amgen (+56%), were among the biggest gainers. Biogen Idec reported favorable results from studies of its new oral drug to treat multiple sclerosis, while Amgen’s stock price increased following the company’s announcement in November 2011 of a share repurchase program that included a $5 billion Dutch tender offer.
We continue to believe that large pharmaceutical, biotechnology, and medical device companies will experience growth in revenues and earnings from new products, an aging global population, and growing demand in emerging markets. In the wake of a period of considerable political and regulatory challenges as well as an unusually high number of patent expirations, we are encouraged by an increase in new drug approvals by the U.S. Food and Drug Administration in the past two years. For the longer term, we believe that the aging of populations in the United States, Europe, and Japan, along with rising standards of living in developing markets such as China and India, should lead to greater demand for health care products.
The health care industry spends tens of billions of dollars annually on research and development, which we believe will lead to the discovery of more effective treatments for many diseases, such as cancer, diabetes, and Alzheimer’s. For example, because of the rapid decline in the cost of sequencing human genomes, it is expected that millions of individuals globally will have their genome sequenced in the near future. Further, cancer cell genomes are being sequenced to gain an understanding of the specific mutations responsible for their proliferation.
10
The availability of this increasingly rich and broad set of genetic information is helping researchers better understand how patients with certain genetic traits develop diseases and respond to pathogens, chemicals, and drugs. That growing knowledge base is enabling the development of new, highly effective targeted drug therapies and associated diagnostic tests, bringing the possibility of personalized medicine closer to reality.
Other sectors
Poor stock selection in the industrial and consumer discretionary sectors hurt the fund’s relative returns. C.H. Robinson (–13%) and Sony (–38%) were the biggest detractors. The fund’s minimal exposure to the financial sector, combined with poor stock selection within the sector, also hurt returns. On the other hand, the fund benefited from having below-benchmark exposure to consumer staples and utilities, the two sectors with the lowest returns in the S&P 500 over the 12 months.
Outlook
As we enter fiscal year 2013, we are more tempered in our optimism for U.S. equities than we were a year ago. Valuations generally seem attractive relative to historical standards, especially given the low interest rate environment. Although the S&P 500 Index is considerably higher than it was a year ago, equities remain attractive compared with most other asset classes. As we write, the average dividend of the S&P 500 is almost 2%, which is still above the current yield on the 10-year U.S. Treasury bond.
In the sectors where the fund has the greatest weightings, we find current valuations compelling. We believe that investors may be underestimating the growth potential of many companies. Although we expect the economic growth rate in the United States to be modest in the near future, we believe that, because of globalization and innovation, many U.S. companies can grow revenues and earnings at a faster rate than the GDP will grow. U.S. corporations generate an increasing portion of their revenues and earnings from abroad; last year, 46% of the revenues for S&P 500 companies came from outside the United States. Prospects for international growth are particularly attractive for companies in the information technology, health care, and industrial sectors.
We also believe that innovation by U.S. companies, particularly those in the information technology and health care sectors, should result in revenue and earnings growth opportunities that are not reflected in current expectations. These two sectors represent areas where we believe the United States has a strong competitive advantage relative to the rest of the world. We expect that the substantial investment in research and development will lead to new products and services that improve productivity for businesses and quality of life for consumers.
Furthermore, the stock market may be undervaluing the cash on the balance sheets of many companies. As U.S.
11
corporations have recovered from the recession, many have improved their balance sheets by paying down debt and growing their cash balances, which in the current low interest rate environment represent an underutilized asset. That asset could be a source of higher returns in the future. Companies with strong cash flows have seen considerable appreciation in their stock price as they returned cash to shareholders by raising dividends or by buying back shares.
In closing, we note that the fund’s returns have generally lagged those of the S&P 500 for the past two years. We are certainly disappointed with these results, but we accept that our low-turnover approach will not produce returns that exceed the index every year. Our disciplined strategy of continuing to add to high-conviction, out-of-favor positions as they decline ensures that if our view of the fundamentals ultimately proves correct, the fund will hold larger positions on the way up than it did on the way down. In our view, this approach is instrumental to delivering superior relative returns over the long run.
PRIMECAP Management Company
October 12, 2012
12
PRIMECAP Fund
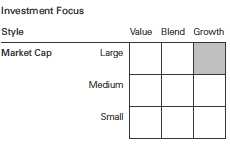
Fund Profile
As of September 30, 2012
| | |
| Share-Class Characteristics | |
| | Investor | Admiral |
| | Shares | Shares |
| Ticker Symbol | VPMCX | VPMAX |
| Expense Ratio1 | 0.45% | 0.36% |
| 30-Day SEC Yield | 1.23% | 1.32% |
| | | |
| Portfolio Characteristics | | |
| | | | DJ |
| | | | U.S. Total |
| | | S&P 500 | Market |
| | Fund | Index | Index |
| Number of Stocks | 121 | 500 | 3,638 |
| Median Market Cap $44.7B | $57.5B | $35.6B |
| Price/Earnings Ratio | 17.5x | 16.1x | 17.0x |
| Price/Book Ratio | 3.0x | 2.2x | 2.2x |
| Return on Equity | 22.1% | 19.3% | 18.0% |
| Earnings Growth Rate | 12.0% | 10.6% | 10.4% |
| Dividend Yield | 1.7% | 2.1% | 2.0% |
| Foreign Holdings | 12.3% | 0.0% | 0.0% |
| Turnover Rate | 6% | — | — |
| Short-Term Reserves | 3.3% | — | — |
| | | |
| Sector Diversification (% of equity exposure) |
| | | | DJ |
| | | | U.S. Total |
| | | S&P 500 | Market |
| | Fund | Index | Index |
| Consumer Discretionary | 8.9% | 11.0% | 12.0% |
| Consumer Staples | 1.2 | 10.9 | 9.5 |
| Energy | 4.9 | 11.3 | 10.4 |
| Financials | 5.0 | 14.6 | 16.0 |
| Health Care | 31.7 | 12.0 | 11.9 |
| Industrials | 13.6 | 9.8 | 10.6 |
| Information Technology 30.6 | 20.1 | 19.2 |
| Materials | 3.9 | 3.5 | 3.9 |
| Telecommunication | | | |
| Services | 0.0 | 3.3 | 2.9 |
| Utilities | 0.2 | 3.5 | 3.6 |
| | |
| Volatility Measures | | |
| | | DJ |
| | | U.S. Total |
| | S&P 500 | Market |
| | Index | Index |
| R-Squared | 0.97 | 0.97 |
| Beta | 1.05 | 1.00 |
These measures show the degree and timing of the fund’s fluctuations compared with the indexes over 36 months.
| | |
| Ten Largest Holdings (% of total net assets) |
| Amgen Inc. | Biotechnology | 6.3% |
| Biogen Idec Inc. | Biotechnology | 6.0 |
| Google Inc. Class A | Internet Software & | |
| | Services | 4.5 |
| Eli Lilly & Co. | Pharmaceuticals | 4.0 |
| Roche Holding AG | Pharmaceuticals | 3.7 |
| FedEx Corp. | Air Freight & | |
| | Logistics | 3.5 |
| Microsoft Corp. | Systems Software | 3.5 |
| Texas Instruments Inc. | Semiconductors | 3.1 |
| Novartis AG | Pharmaceuticals | 3.1 |
| Medtronic Inc. | Health Care | |
| | Equipment | 2.9 |
| Top Ten | | 40.6% |
The holdings listed exclude any temporary cash investments and equity index products.
1 The expense ratios shown are from the prospectus dated January 26, 2012, and represent estimated costs for the current fiscal year. For the fiscal year ended September 30, 2012, the expense ratios were 0.45% for Investor Shares and 0.36% for Admiral Shares.
13
PRIMECAP Fund
Performance Summary
All of the returns in this report represent past performance, which is not a guarantee of future results that may be achieved by the fund. (Current performance may be lower or higher than the performance data cited. For performance data current to the most recent month-end, visit our website at vanguard.com/performance.) Note, too, that both investment returns and principal value can fluctuate widely, so an investor’s shares, when sold, could be worth more or less than their original cost. The returns shown do not reflect taxes that a shareholder would pay on fund distributions or on the sale of fund shares.
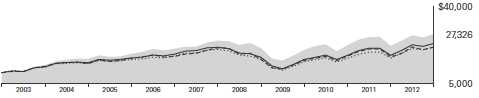
Cumulative Performance: September 30, 2002, Through September 30, 2012
Initial Investment of $10,000
| | | | |
| | | Average Annual Total Returns | |
| | Periods Ended September 30, 2012 | |
| | | | | Final Value |
| | One | Five | Ten | of a $10,000 |
| | Year | Years | Years | Investment |
| PRIMECAP Fund Investor Shares | 24.17% | 2.25% | 10.58% | $27,326 |
| S&P 500 Index | 30.20 | 1.05 | 8.01 | 21,615 |
| Multi-Cap Growth Funds Average | 25.46 | 0.31 | 7.96 | 21,516 |
| Dow Jones U.S. Total Stock Market | 30.00 | 1.53 | 8.77 | 23,184 |
Multi-Cap Growth Funds Average: Derived from data provided by Lipper Inc.
| | | | |
| | | | | Final Value |
| | One | Five | Ten | of a $50,000 |
| | Year | Years | Years | Investment |
| PRIMECAP Fund Admiral Shares | 24.29% | 2.36% | 10.71% | $138,342 |
| S&P 500 Index | 30.20 | 1.05 | 8.01 | 108,075 |
| Dow Jones U.S. Total Stock Market Index | 30.00 | 1.53 | 8.77 | 115,920 |
See Financial Highlights for dividend and capital gains information.
14
PRIMECAP Fund
Fiscal-Year Total Returns (%): September 30, 2002, Through September 30, 2012
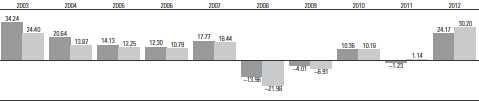
| PRIMECAP Fund Investor Shares |
| S&P 500 Index |
15
PRIMECAP Fund
Financial Statements
Statement of Net Assets
As of September 30, 2012
The fund reports a complete list of its holdings in regulatory filings four times in each fiscal year, at the quarter-ends. For the second and fourth fiscal quarters, the lists appear in the fund’s semiannual and annual reports to shareholders. For the first and third fiscal quarters, the fund files the lists with the Securities and Exchange Commission on Form N-Q. Shareholders can look up the fund’s Forms N-Q on the SEC’s website at sec.gov. Forms N-Q may also be reviewed and copied at the SEC’s Public Reference Room (see the back cover of this report for further information).
| | | |
| | | | Market |
| | | | Value |
| | | Shares | ($000) |
| Common Stocks (97.0%) | | |
| Consumer Discretionary (8.7%) | |
| * | DIRECTV | 13,843,062 | 726,207 |
| | TJX Cos. Inc. | 6,875,000 | 307,931 |
| | Walt Disney Co. | 5,575,000 | 291,461 |
| | Limited Brands Inc. | 5,512,950 | 271,568 |
| | Carnival Corp. | 5,242,600 | 191,040 |
| | Whirlpool Corp. | 2,185,800 | 181,225 |
| * | Bed Bath & Beyond Inc. | 2,680,975 | 168,901 |
| | Mattel Inc. | 4,000,000 | 141,920 |
| ^ | Sony Corp. ADR | 9,750,000 | 114,075 |
| * | Amazon.com Inc. | 270,000 | 68,666 |
| | Lowe’s Cos. Inc. | 900,000 | 27,216 |
| | Time Warner Cable Inc. | 235,000 | 22,339 |
| | Macy’s Inc. | 558,800 | 21,022 |
| | Ross Stores Inc. | 248,800 | 16,073 |
| | VF Corp. | 94,550 | 15,068 |
| | Target Corp. | 100,000 | 6,347 |
| | | | 2,571,059 |
| Consumer Staples (1.2%) | | |
| | Costco Wholesale Corp. | 2,825,000 | 282,853 |
| | Kellogg Co. | 810,000 | 41,845 |
| | PepsiCo Inc. | 170,000 | 12,031 |
| | | | 336,729 |
| Energy (4.7%) | | |
| | Noble Energy Inc. | 4,400,000 | 407,924 |
| | Schlumberger Ltd. | 3,682,200 | 266,334 |
| | EOG Resources Inc. | 2,262,300 | 253,491 |
| | Petroleo Brasileiro SA | | |
| | ADR Type A | 4,473,800 | 98,737 |
| | Hess Corp. | 1,480,100 | 79,511 |
| | Cenovus Energy Inc. | 1,794,476 | 62,537 |
| | Encana Corp. | 2,535,000 | 55,567 |
| | Exxon Mobil Corp. | 515,000 | 47,097 |
| | National Oilwell Varco Inc. | 483,000 | 38,693 |
| | | |
| | | | Market |
| | | | Value |
| | | Shares | ($000) |
| * | Cameron | | |
| | International Corp. | 635,000 | 35,604 |
| * | Southwestern Energy Co. | 840,000 | 29,215 |
| | Transocean Ltd. | 250,000 | 11,223 |
| | Petroleo Brasileiro | | |
| | SA ADR | 400,000 | 9,176 |
| | Noble Corp. | 200,000 | 7,156 |
| | | | 1,402,265 |
| Financials (4.8%) | | |
| | Marsh & McLennan | | |
| | Cos. Inc. | 17,275,300 | 586,151 |
| | Charles Schwab Corp. | 28,400,000 | 363,236 |
| * | Berkshire Hathaway Inc. | | |
| | Class B | 2,400,000 | 211,680 |
| | Chubb Corp. | 2,550,000 | 194,514 |
| | American Express Co. | 432,100 | 24,569 |
| | Progressive Corp. | 1,000,000 | 20,740 |
| | Wells Fargo & Co. | 600,000 | 20,718 |
| | Weyerhaeuser Co. | 300,000 | 7,842 |
| | | | 1,429,450 |
| Health Care (30.7%) | | |
| | Amgen Inc. | 22,079,800 | 1,861,769 |
| *,1 | Biogen Idec Inc. | 11,995,100 | 1,790,029 |
| | Eli Lilly & Co. | 24,700,800 | 1,171,065 |
| | Roche Holding AG | 5,900,000 | 1,103,575 |
| | Novartis AG ADR | 14,859,365 | 910,285 |
| | Medtronic Inc. | 20,107,552 | 867,038 |
| | Johnson & Johnson | 6,514,800 | 448,935 |
| * | Life Technologies Corp. | 6,939,300 | 339,193 |
| | GlaxoSmithKline plc ADR | 5,644,000 | 260,978 |
| * | Boston Scientific Corp. | 28,342,560 | 162,686 |
| | Abbott Laboratories | 1,528,700 | 104,808 |
| | Sanofi ADR | 1,205,000 | 51,887 |
| | Stryker Corp. | 259,000 | 14,416 |
| | Zimmer Holdings Inc. | 197,000 | 13,321 |
| | | | 9,099,985 |
16
| | | |
| PRIMECAP Fund | | |
| |
| |
| |
| | | | Market |
| | | | Value |
| | | Shares | ($000) |
| Industrials (13.2%) | | |
| | FedEx Corp. | 12,401,570 | 1,049,421 |
| | Honeywell | | |
| | International Inc. | 8,810,800 | 526,445 |
| | C.H. Robinson | | |
| | Worldwide Inc. | 5,995,800 | 351,054 |
| | Southwest Airlines Co. | 34,537,600 | 302,895 |
| | Caterpillar Inc. | 3,294,300 | 283,442 |
| | United Parcel Service Inc. | | |
| | Class B | 3,731,700 | 267,078 |
| | Union Pacific Corp. | 1,974,200 | 234,338 |
| | Boeing Co. | 2,975,760 | 207,172 |
| | Deere & Co. | 1,961,500 | 161,804 |
| | European Aeronautic | | |
| | Defence and | | |
| | Space Co. NV | 4,233,700 | 134,188 |
| * | Alaska Air Group Inc. | 3,242,300 | 113,675 |
| | Donaldson Co. Inc. | 1,992,000 | 69,142 |
| | Expeditors International | | |
| | of Washington Inc. | 1,280,700 | 46,566 |
| ^ | Canadian Pacific | | |
| | Railway Ltd. | 547,400 | 45,374 |
| | PACCAR Inc. | 1,000,000 | 40,025 |
| | Pall Corp. | 205,000 | 13,015 |
| * | United Continental | | |
| | Holdings Inc. | 560,000 | 10,920 |
| * | Delta Air Lines Inc. | 1,173,000 | 10,745 |
| | CSX Corp. | 490,000 | 10,167 |
| | Granite Construction Inc. | 317,500 | 9,119 |
| | Norfolk Southern Corp. | 46,100 | 2,933 |
| | Rockwell Automation Inc. | 25,000 | 1,739 |
| | Safran SA | 42,000 | 1,511 |
| | Republic Services Inc. | | |
| | Class A | 17,000 | 468 |
| | | | 3,893,236 |
| Information Technology (29.7%) | |
| * | Google Inc. Class A | 1,755,425 | 1,324,468 |
| | Microsoft Corp. | 34,661,200 | 1,032,211 |
| | Texas Instruments Inc. | 33,456,500 | 921,727 |
| * | Adobe Systems Inc. | 24,626,770 | 799,385 |
| | Oracle Corp. | 24,260,233 | 763,955 |
| | Intuit Inc. | 11,697,400 | 688,743 |
| | QUALCOMM Inc. | 10,023,250 | 626,353 |
| | Intel Corp. | 12,400,000 | 281,232 |
| * | EMC Corp. | 9,622,800 | 262,414 |
| | Accenture plc Class A | 3,425,800 | 239,909 |
| | Visa Inc. Class A | 1,662,120 | 223,189 |
| * | Symantec Corp. | 12,009,200 | 216,166 |
| | Telefonaktiebolaget | | |
| | LM Ericsson ADR | 16,808,914 | 153,465 |
| | Hewlett-Packard Co. | 8,250,000 | 140,745 |
| | KLA-Tencor Corp. | 2,878,700 | 137,328 |
| 1 | Plantronics Inc. | 3,701,500 | 130,774 |
| | | |
| | | | Market |
| | | | Value |
| | | Shares | ($000) |
| * | Micron Technology Inc. | 20,000,000 | 119,700 |
| * | NVIDIA Corp. | 7,635,700 | 101,860 |
| | Applied Materials Inc. | 8,324,600 | 92,944 |
| | Motorola Solutions Inc. | 1,834,000 | 92,709 |
| *,^ | Research In Motion Ltd. | 10,438,600 | 78,289 |
| | Corning Inc. | 5,243,200 | 68,948 |
| * | NetApp Inc. | 1,575,000 | 51,786 |
| | ASML Holding NV | 827,500 | 44,420 |
| | Activision Blizzard Inc. | 3,500,000 | 39,480 |
| | Apple Inc. | 52,000 | 34,698 |
| | Cisco Systems Inc. | 1,300,000 | 24,817 |
| | Mastercard Inc. Class A | 49,950 | 22,551 |
| * | Entegris Inc. | 2,583,472 | 21,004 |
| * | SanDisk Corp. | 400,000 | 17,372 |
| | Analog Devices Inc. | 350,000 | 13,716 |
| | Altera Corp. | 400,000 | 13,594 |
| * | Rambus Inc. | 2,000,000 | 11,080 |
| | Dell Inc. | 400,000 | 3,944 |
| | | | 8,794,976 |
| Materials (3.8%) | | |
| | Monsanto Co. | 5,912,460 | 538,152 |
| | Potash Corp. of | | |
| | Saskatchewan Inc. | 12,246,200 | 531,730 |
| | Praxair Inc. | 625,000 | 64,925 |
| | Domtar Corp. | 3,400 | 266 |
| | | | 1,135,073 |
| Telecommunication Services (0.0%) | |
| * | Sprint Nextel Corp. | 146,300 | 808 |
| |
| Utilities (0.2%) | | |
| * | AES Corp. | 2,421,800 | 26,567 |
| | Public Service Enterprise | | |
| | Group Inc. | 608,471 | 19,581 |
| | NextEra Energy Inc. | 179,440 | 12,620 |
| | | | 58,768 |
| Total Common Stocks | | |
| (Cost $17,765,145) | | 28,722,349 |
| Temporary Cash Investment (3.7%) | |
| Money Market Fund (3.7%) | | |
| 2,3 | Vanguard Market | | |
| | Liquidity Fund, 0.163% | | |
| | (Cost $1,082,832) | 1,082,832,419 | 1,082,832 |
| Total Investments (100.7%) | | |
| (Cost $18,847,977) | | 29,805,181 |
| Other Assets and Liabilities (-0.7%) | |
| Other Assets | | 57,670 |
| Liabilities3 | | (252,838) |
| | | | (195,168) |
| Net Assets (100%) | | 29,610,013 |
17
| |
| PRIMECAP Fund | |
| |
| |
| |
| | Market |
| | Value |
| | ($000) |
| Statement of Assets and Liabilities | |
| Assets | |
| Investments in Securities, at Value | |
| Unaffiliated Issuers | 26,801,546 |
| Affiliated Vanguard Funds | 1,082,832 |
| Other Affiliated Issuers | 1,920,803 |
| Total Investments in Securities | 29,805,181 |
| Receivables for Accrued Income | 35,047 |
| Other Assets | 22,623 |
| Total Assets | 29,862,851 |
| Liabilities | |
| Security Lending Collateral | |
| Payable to Brokers | 95,464 |
| Other Liabilities | 157,374 |
| Total Liabilities | 252,838 |
| Net Assets | 29,610,013 |
| |
| At September 30, 2012, net assets consisted of: |
| | Amount |
| | ($000) |
| Paid-in Capital | 18,147,718 |
| Undistributed Net Investment Income | 222,255 |
| Accumulated Net Realized Gains | 282,454 |
| Unrealized Appreciation (Depreciation) | |
| Investment Securities | 10,957,204 |
| Foreign Currencies | 382 |
| Net Assets | 29,610,013 |
| |
| |
| Investor Shares—Net Assets | |
| Applicable to 196,450,347 outstanding | |
| $.001 par value shares of beneficial | |
| interest (unlimited authorization) | 13,631,754 |
| Net Asset Value Per Share— | |
| Investor Shares | $69.39 |
| |
| |
| Admiral Shares—Net Assets | |
| Applicable to 221,826,051 outstanding | |
| $.001 par value shares of beneficial | |
| interest (unlimited authorization) | 15,978,259 |
| Net Asset Value Per Share— | |
| Admiral Shares | $72.03 |
See Note A in Notes to Financial Statements.
* Non-income-producing security.
^ Part of security position is on loan to broker-dealers. The total value of securities on loan is $89,522,000.
1 Considered an affiliated company of the fund as the fund owns more than 5% of the outstanding voting securities of such company.
2 Affiliated money market fund available only to Vanguard funds and certain trusts and accounts managed by Vanguard. Rate shown is the 7-day yield.
3 Includes $95,464,000 of collateral received for securities on loan.
ADR—American Depositary Receipt.
See accompanying Notes, which are an integral part of the Financial Statements.
18
| |
| PRIMECAP Fund | |
| |
| |
| Statement of Operations | |
| |
| | Year Ended |
| | September 30, 2012 |
| | ($000) |
| Investment Income | |
| Income | |
| Dividends1,2 | 498,815 |
| Interest2 | 834 |
| Security Lending | 1,449 |
| Total Income | 501,098 |
| Expenses | |
| Investment Advisory Fees—Note B | 61,222 |
| The Vanguard Group—Note C | |
| Management and Administrative—Investor Shares | 31,347 |
| Management and Administrative—Admiral Shares | 18,395 |
| Marketing and Distribution—Investor Shares | 3,142 |
| Marketing and Distribution—Admiral Shares | 2,471 |
| Custodian Fees | 472 |
| Auditing Fees | 26 |
| Shareholders’ Reports—Investor Shares | 130 |
| Shareholders’ Reports—Admiral Shares | 56 |
| Trustees’ Fees and Expenses | 60 |
| Total Expenses | 117,321 |
| Net Investment Income | 383,777 |
| Realized Net Gain (Loss) | |
| Investment Securities Sold2 | 314,493 |
| Foreign Currencies | (444) |
| Realized Net Gain (Loss) | 314,049 |
| Change in Unrealized Appreciation (Depreciation) | |
| Investment Securities | 5,338,102 |
| Foreign Currencies | (618) |
| Change in Unrealized Appreciation (Depreciation) | 5,337,484 |
| Net Increase (Decrease) in Net Assets Resulting from Operations | 6,035,310 |
1 Dividends are net of foreign withholding taxes of $16,614,000.
2 Dividend income, interest income, and realized net gain (loss) from affiliated companies of the fund were $10,841,000, $834,000, and ($30,951,000), respectively.
See accompanying Notes, which are an integral part of the Financial Statements.
19
| | |
| PRIMECAP Fund | | |
| |
| |
| Statement of Changes in Net Assets | | |
| |
| | Year Ended September 30, |
| | 2012 | 2011 |
| | ($000) | ($000) |
| Increase (Decrease) in Net Assets | | |
| Operations | | |
| Net Investment Income | 383,777 | 297,306 |
| Realized Net Gain (Loss) | 314,049 | 1,074,285 |
| Change in Unrealized Appreciation (Depreciation) | 5,337,484 | (1,473,717) |
| Net Increase (Decrease) in Net Assets Resulting from Operations | 6,035,310 | (102,126) |
| Distributions | | |
| Net Investment Income | | |
| Investor Shares | (163,746) | (168,148) |
| Admiral Shares | (144,688) | (119,031) |
| Realized Capital Gain | | |
| Investor Shares | (500,030) | (183,757) |
| Admiral Shares | (402,175) | (121,296) |
| Total Distributions | (1,210,639) | (592,232) |
| Capital Share Transactions | | |
| Investor Shares | (3,252,493) | (3,494,598) |
| Admiral Shares | 2,590,407 | 1,843,532 |
| Net Increase (Decrease) from Capital Share Transactions | (662,086) | (1,651,066) |
| Total Increase (Decrease) | 4,162,585 | (2,345,424) |
| Net Assets | | |
| Beginning of Period | 25,447,428 | 27,792,852 |
| End of Period1 | 29,610,013 | 25,447,428 |
1 Net Assets—End of Period includes undistributed net investment income of $222,255,000 and $175,468,000.
See accompanying Notes, which are an integral part of the Financial Statements.
20
| | | | | |
| PRIMECAP Fund | | | | | |
| |
| |
| Financial Highlights | | | | | |
| |
| |
| Investor Shares | | | | | |
| |
| |
| For a Share Outstanding | | | Year Ended September 30, |
| Throughout Each Period | 2012 | 2011 | 2010 | 2009 | 2008 |
| Net Asset Value, Beginning of Period | $58.46 | $60.36 | $55.10 | $62.76 | $77.82 |
| Investment Operations | | | | | |
| Net Investment Income | .866 | .651 | .6311 | .500 | .552 |
| Net Realized and Unrealized Gain (Loss) | | | | | |
| on Investments | 12.857 | (1.266) | 5.076 | (3.990) | (10.913) |
| Total from Investment Operations | 13.723 | (.615) | 5.707 | (3.490) | (10.361) |
| Distributions | | | | | |
| Dividends from Net Investment Income | (.689) | (.614) | (.447) | (.508) | (.476) |
| Distributions from Realized Capital Gains | (2.104) | (.671) | — | (3.662) | (4.223) |
| Total Distributions | (2.793) | (1.285) | (.447) | (4.170) | (4.699) |
| Net Asset Value, End of Period | $69.39 | $58.46 | $60.36 | $55.10 | $62.76 |
| |
| Total Return2 | 24.17% | -1.23% | 10.36% | -4.01% | -13.96% |
| |
| Ratios/Supplemental Data | | | | | |
| Net Assets, End of Period (Millions) | $13,632 | $14,359 | $18,028 | $17,795 | $19,234 |
| Ratio of Total Expenses to | | | | | |
| Average Net Assets | 0.45% | 0.45% | 0.45% | 0.49% | 0.43% |
| Ratio of Net Investment Income to | | | | | |
| Average Net Assets | 1.30% | 0.95% | 1.05%1 | 1.02% | 0.76% |
| Portfolio Turnover Rate | 6% | 8% | 5% | 4% | 11% |
1 Net investment income per share and the ratio of net investment income to average net assets include $.128 and 0.21%, respectively, resulting from a special dividend from Weyerhaeuser Co. in July 2010.
2 Total returns do not include transaction or account service fees that may have applied in the periods shown. Fund prospectuses provide information about any applicable transaction and account service fees.
See accompanying Notes, which are an integral part of the Financial Statements.
21
| | | | | |
| PRIMECAP Fund | | | | | |
| |
| |
| Financial Highlights | | | | | |
| |
| |
| Admiral Shares | | | | | |
| |
| |
| For a Share Outstanding | | | Year Ended September 30, |
| Throughout Each Period | 2012 | 2011 | 2010 | 2009 | 2008 |
| Net Asset Value, Beginning of Period | $60.69 | $62.65 | $57.20 | $65.19 | $80.82 |
| Investment Operations | | | | | |
| Net Investment Income | .974 | .738 | .7111 | .580 | .664 |
| Net Realized and Unrealized Gain (Loss) | | | | | |
| on Investments | 13.333 | (1.319) | 5.269 | (4.160) | (11.327) |
| Total from Investment Operations | 14.307 | (.581) | 5.980 | (3.580) | (10.663) |
| Distributions | | | | | |
| Dividends from Net Investment Income | (.785) | (.683) | (.530) | (.612) | (.586) |
| Distributions from Realized Capital Gains | (2.182) | (.696) | — | (3.798) | (4.381) |
| Total Distributions | (2.967) | (1.379) | (.530) | (4.410) | (4.967) |
| Net Asset Value, End of Period | $72.03 | $60.69 | $62.65 | $57.20 | $65.19 |
| |
| Total Return2 | 24.29% | -1.14% | 10.46% | -3.90% | -13.85% |
| |
| Ratios/Supplemental Data | | | | | |
| Net Assets, End of Period (Millions) | $15,978 | $11,088 | $9,765 | $9,222 | $9,651 |
| Ratio of Total Expenses to | | | | | |
| Average Net Assets | 0.36% | 0.36% | 0.36% | 0.37% | 0.31% |
| Ratio of Net Investment Income to | | | | | |
| Average Net Assets | 1.39% | 1.04% | 1.14%1 | 1.14% | 0.88% |
| Portfolio Turnover Rate | 6% | 8% | 5% | 4% | 11% |
1 Net investment income per share and the ratio of net investment income to average net assets include $.133 and 0.21%, respectively, resulting from a special dividend from Weyerhaeuser Co. in July 2010.
2 Total returns do not include transaction or account service fees that may have applied in the periods shown. Fund prospectuses provide information about any applicable transaction and account service fees.
See accompanying Notes, which are an integral part of the Financial Statements.
22
PRIMECAP Fund
Notes to Financial Statements
Vanguard PRIMECAP Fund is registered under the Investment Company Act of 1940 as an open-end investment company, or mutual fund. The fund offers two classes of shares: Investor Shares and Admiral Shares. Investor Shares are available to any investor who meets the fund’s minimum purchase requirements. Admiral Shares are designed for investors who meet certain administrative, service, and account-size criteria.
A. The following significant accounting policies conform to generally accepted accounting principles for U.S. mutual funds. The fund consistently follows such policies in preparing its financial statements.
1. Security Valuation: Securities are valued as of the close of trading on the New York Stock Exchange (generally 4 p.m., Eastern time) on the valuation date. Equity securities are valued at the latest quoted sales prices or official closing prices taken from the primary market in which each security trades; such securities not traded on the valuation date are valued at the mean of the latest quoted bid and asked prices. Securities for which market quotations are not readily available, or whose values have been affected by events occurring before the fund’s pricing time but after the close of the securities’ primary markets, are valued at their fair values calculated according to procedures adopted by the board of trustees. These procedures include obtaining quotations from an independent pricing service, monitoring news to identify significant market- or security-specific events, and evaluating changes in the values of foreign market proxies (for example, ADRs, futures contracts, or exchange-traded funds), between the time the foreign markets close and the fund’s pricing time. When fair-value pricing is employed, the prices of securities used by a fund to calculate its net asset value may differ from quoted or published prices for the same securities. Investments in Vanguard Market Liquidity Fund are valued at that fund’s net asset value.
2. Foreign Currency: Securities and other assets and liabilities denominated in foreign currencies are translated into U.S. dollars using exchange rates obtained from an independent third party as of the fund’s pricing time on the valuation date. Realized gains (losses) and unrealized appreciation (depreciation) on investment securities include the effects of changes in exchange rates since the securities were purchased, combined with the effects of changes in security prices. Fluctuations in the value of other assets and liabilities resulting from changes in exchange rates are recorded as unrealized foreign currency gains (losses) until the assets or liabilities are settled in cash, at which time they are recorded as realized foreign currency gains (losses).
3. Federal Income Taxes: The fund intends to continue to qualify as a regulated investment company and distribute all of its taxable income. Management has analyzed the fund’s tax positions taken for all open federal income tax years (September 30, 2009–2012), and has concluded that no provision for federal income tax is required in the fund’s financial statements.
4. Distributions: Distributions to shareholders are recorded on the ex-dividend date.
5. Security Lending: The fund may lend its securities to qualified institutional borrowers to earn additional income. Security loans are required to be secured at all times by collateral at least equal to the market value of securities loaned. The fund invests cash collateral received in Vanguard Market Liquidity Fund, and records a liability for the return of the collateral, during the period the securities are on loan. Security lending income represents fees charged to borrowers plus income earned on investing cash collateral, less expenses associated with the loan.
23
PRIMECAP Fund
6. Other: Dividend income is recorded on the ex-dividend date. Interest income includes income distributions received from Vanguard Market Liquidity Fund and is accrued daily. Security transactions are accounted for on the date securities are bought or sold. Costs used to determine realized gains (losses) on the sale of investment securities are those of the specific securities sold. Fees assessed on redemptions of capital shares prior to May 23, 2012, were credited to paid-in capital.
Each class of shares has equal rights as to assets and earnings, except that each class separately bears certain class-specific expenses related to maintenance of shareholder accounts (included in Management and Administrative expenses) and shareholder reporting. Marketing and distribution expenses are allocated to each class of shares based on a method approved by the board of trustees. Income, other non-class-specific expenses, and gains and losses on investments are allocated to each class of shares based on its relative net assets.
B. PRIMECAP Management Company provides investment advisory services to the fund for a fee calculated at an annual percentage rate of average net assets. For the year ended September 30, 2012, the investment advisory fee represented an effective annual rate of 0.21% of the fund’s average net assets.
C. The Vanguard Group furnishes at cost corporate management, administrative, marketing, and distribution services. The costs of such services are allocated to the fund under methods approved by the board of trustees. The fund has committed to provide up to 0.40% of its net assets in capital contributions to Vanguard. At September 30, 2012, the fund had contributed capital of $4,165,000 to Vanguard (included in Other Assets), representing 0.01% of the fund’s net assets and 1.67% of Vanguard’s capitalization. The fund’s trustees and officers are also directors and officers of Vanguard.
D. Various inputs may be used to determine the value of the fund’s investments. These inputs are summarized in three broad levels for financial statement purposes. The inputs or methodologies used to value securities are not necessarily an indication of the risk associated with investing in those securities.
Level 1—Quoted prices in active markets for identical securities.
Level 2—Other significant observable inputs (including quoted prices for similar securities, interest rates, prepayment speeds, credit risk, etc.).
Level 3—Significant unobservable inputs (including the fund’s own assumptions used to determine the fair value of investments).
The following table summarizes the market value of the fund’s investments as of September 30, 2012, based on the inputs used to value them:
| | | |
| | Level 1 | Level 2 | Level 3 |
| Investments | ($000) | ($000) | ($000) |
| Common Stocks | 27,483,074 | 1,239,275 | — |
| Temporary Cash Investments | 1,082,832 | — | — |
| Total | 28,565,906 | 1,239,275 | — |
24
PRIMECAP Fund
E. Distributions are determined on a tax basis and may differ from net investment income and realized capital gains for financial reporting purposes. Differences may be permanent or temporary. Permanent differences are reclassified among capital accounts in the financial statements to reflect their tax character. Temporary differences arise when certain items of income, expense, gain, or loss are recognized in different periods for financial statement and tax purposes; these differences will reverse at some time in the future. Differences in classification may also result from the treatment of short-term gains as ordinary income for tax purposes.
During the year ended September 30, 2012, the fund realized net foreign currency losses of $444,000, which decreased distributable net income for tax purposes; accordingly, such losses have been reclassified from accumulated net realized gains to undistributed net investment income.
The fund used a tax accounting practice to treat a portion of the price of capital shares redeemed during the year as distributions from net investment income and realized capital gains. Accordingly, the fund has reclassified $28,112,000 from undistributed net investment income, and $22,116,000 from accumulated net realized gains, to paid-in capital.
For tax purposes, at September 30, 2012, the fund had $275,080,000 of ordinary income and $281,976,000 of long-term capital gains available for distribution.
At September 30, 2012, the cost of investment securities for tax purposes was $18,848,420,000. Net unrealized appreciation of investment securities for tax purposes was $10,956,761,000, consisting of unrealized gains of $12,325,491,000 on securities that had risen in value since their purchase and $1,368,730,000 in unrealized losses on securities that had fallen in value since their purchase.
F. During the year ended September 30, 2012, the fund purchased $1,604,895,000 of investment securities and sold $3,591,698,000 of investment securities, other than temporary cash investments.
G. Capital share transactions for each class of shares were:
| | | | |
| | | | Year Ended September 30, |
| | | 2012 | | 2011 |
| | Amount | Shares | Amount | Shares |
| | ($000) | (000) | ($000) | (000) |
| Investor Shares | | | | |
| Issued | 1,018,574 | 15,661 | 1,479,247 | 22,334 |
| Issued in Lieu of Cash Distributions | 657,028 | 10,847 | 348,370 | 5,369 |
| Redeemed1 | (4,928,095) | (75,690) | (5,322,215) | (80,748) |
| Net Increase (Decrease) —Investor Shares | (3,252,493) | (49,182) | (3,494,598) | (53,045) |
| Admiral Shares | | | | |
| Issued | 3,650,726 | 54,056 | 3,378,773 | 49,378 |
| Issued in Lieu of Cash Distributions | 511,390 | 8,139 | 221,992 | 3,298 |
| Redeemed1 | (1,571,709) | (23,062) | (1,757,233) | (25,847) |
| Net Increase (Decrease) —Admiral Shares | 2,590,407 | 39,133 | 1,843,532 | 26,829 |
1 Net of redemption fees for fiscal 2012 and 2011 of $545,000 and $1,090,000, respectively (fund totals). Effective May 23, 2012, the redemption fee was eliminated.
25
PRIMECAP Fund
H. Certain of the fund’s investments are in companies that are considered to be affiliated companies of the fund because the fund owns more than 5% of the outstanding voting securities of the company. Transactions during the period in securities of these companies were as follows:
| | | | | |
| | | | Current Period Transactions | |
| | Sept. 30, 2011 | | Proceeds from | | Sept. 30, 2012 |
| | Market | Purchases | Securities | Dividend | Market |
| | Value | at Cost | Sold | Income | Value |
| | ($000) | ($000) | ($000) | ($000) | ($000) |
| Alaska Air Group Inc. | 135,096 | — | 54,721 | — | NA1 |
| Biogen Idec Inc. | 1,146,164 | — | 34,098 | — | 1,790,029 |
| Plantronics Inc. | 105,308 | — | — | 1,110 | 130,774 |
| Whirlpool Corp. | 294,469 | — | 253,120 | 9,731 | NA1 |
| | 1,681,037 | | | 10,841 | 1,920,803 |
| 1 Not applicable—At September 30, 2012, the security was still held, but the issuer was no longer an affiliated company of the fund. |
I. In preparing the financial statements as of September 30, 2012, management considered the impact of subsequent events for potential recognition or disclosure in these financial statements.
26
Report of Independent Registered
Public Accounting Firm
To the Trustees of Vanguard Chester Funds and the Shareholders of Vanguard PRIMECAP Fund:
In our opinion, the accompanying statement of net assets, the statement of assets and liabilities and the related statements of operations and of changes in net assets and the financial highlights present fairly, in all material respects, the financial position of Vanguard PRIMECAP Fund (constituting a separate portfolio of Vanguard Chester Funds, hereafter referred to as the “Fund”) at September 30, 2012, the results of its operations for the year then ended, the changes in its net assets for each of the two years in the period then ended and the financial highlights for each of the five years in the period then ended, in conformity with accounting principles generally accepted in the United States of America. These financial statements and financial highlights (hereafter referred to as “financial statements”) are the responsibility of the Fund’s management; our responsibility is to express an opinion on these financial statements based on our audits. We conducted our audits of these financial statements in accordance with the standards of the Public Company Accounting Oversight Board (United States). Those standards require that we plan and perform the audit to obtain reasonable assurance about whether the financial statements are free of material misstatement. An audit includes examining, on a test basis, evidence supporting the amounts and disclosures in the financial statements, assessing the accounting principles used and significant estimates made by management, and evaluating the overall financial statement presentation. We believe that our audits, which included confirmation of securities at September 30, 2012 by correspondence with the custodian and by agreement to the underlying ownership records of the transfer agent, provide a reasonable basis for our opinion.
PricewaterhouseCoopers LLP
Philadelphia, Pennsylvania
November 9, 2012
| |
| Special 2012 tax information (unaudited) for Vanguard PRIMECAP Fund |
This information for the fiscal year ended September 30, 2012, is included pursuant to provisions of the Internal Revenue Code.
The fund distributed $899,173,000 as capital gain dividends (from net long-term capital gains) to shareholders during the fiscal year.
The fund distributed $334,162,000 of qualified dividend income to shareholders during the fiscal year.
For corporate shareholders, 98.5% of investment income (dividend income plus short-term gains, if any) qualifies for the dividends-received deduction.
27
Your Fund’s After-Tax Returns
This table presents returns for your fund both before and after taxes. The after-tax returns are shown in two ways: (1) assuming that an investor owned the fund during the entire period and paid taxes on the fund’s distributions, and (2) assuming that an investor paid taxes on the fund’s distributions and sold all shares at the end of each period.
Calculations are based on the highest individual federal income tax and capital gains tax rates in effect at the times of the distributions and the hypothetical sales. State and local taxes were not considered. After-tax returns reflect any qualified dividend income , using actual prior-year figures and estimates for 2012. (In the example, returns after the sale of fund shares may be higher than those assuming no sale. This occurs when the sale would have produced a capital loss. The calculation assumes that the investor received a tax deduction for the loss.)
The table shows returns for one share class only; returns for other share classes will differ. Please note that your actual after-tax returns will depend on your tax situation and may differ from those shown. Also note that if you own the fund in a tax-deferred account, such as an individual retirement account or a 401(k) plan, this information does not apply to you. Such accounts are not subject to current taxes.
Finally, keep in mind that a fund’s performance—whether before or after taxes—does not guarantee future results.
Average Annual Total Returns: PRIMECAP Fund Investor Shares
Periods Ended September 30, 2012
| | | |
| | One | Five | Ten |
| | Year | Years | Years |
| Returns Before Taxes | 24.17% | 2.25% | 10.58% |
| Returns After Taxes on Distributions | 23.35 | 1.58 | 10.01 |
| Returns After Taxes on Distributions and Sale of Fund Shares | 16.60 | 1.79 | 9.33 |
28
About Your Fund’s Expenses
As a shareholder of the fund, you incur ongoing costs, which include costs for portfolio management, administrative services, and shareholder reports (like this one), among others. Operating expenses, which are deducted from a fund’s gross income, directly reduce the investment return of the fund.
A typical fund’s expenses are expressed as a percentage of its average net assets. This figure is known as the expense ratio. The following examples are intended to help you understand the ongoing costs (in dollars) of investing in your fund and to compare these costs with those of other mutual funds. The examples are based on an investment of $1,000 made at the beginning of the period shown and held for the entire period.
The accompanying table illustrates your fund’s costs in two ways:
• Based on actual fund return. This section helps you to estimate the actual expenses that you paid over the period. The ”Ending Account Value“ shown is derived from the fund‘s actual return, and the third column shows the dollar amount that would have been paid by an investor who started with $1,000 in the fund. You may use the information here, together with the amount you invested, to estimate the expenses that you paid over the period.
To do so, simply divide your account value by $1,000 (for example, an $8,600 account value divided by $1,000 = 8.6), then multiply the result by the number given for your fund under the heading ”Expenses Paid During Period.“
• Based on hypothetical 5% yearly return. This section is intended to help you compare your fund‘s costs with those of other mutual funds. It assumes that the fund had a yearly return of 5% before expenses, but that the expense ratio is unchanged. In this case—because the return used is not the fund’s actual return—the results do not apply to your investment. The example is useful in making comparisons because the Securities and Exchange Commission requires all mutual funds to calculate expenses based on a 5% return. You can assess your fund’s costs by comparing this hypothetical example with the hypothetical examples that appear in shareholder reports of other funds.
Note that the expenses shown in the table are meant to highlight and help you compare ongoing costs only and do not reflect transaction costs incurred by the fund for buying and selling securities. Further, the expenses do not include any purchase, redemption, or account service fees described in the fund prospectus. If such fees were applied to your account, your costs would be higher. Your fund does not carry a “sales load.”
The calculations assume no shares were bought or sold during the period. Your actual costs may have been higher or lower, depending on the amount of your investment and the timing of any purchases or redemptions.
You can find more information about the fund’s expenses, including annual expense ratios, in the Financial Statements section of this report. For additional information on operating expenses and other shareholder costs, please refer to your fund’s current prospectus.
29
| | | |
| Six Months Ended September 30, 2012 | | | |
| | Beginning | Ending | Expenses |
| | Account Value | Account Value | Paid During |
| PRIMECAP Fund | 3/31/2012 | 9/30/2012 | Period |
| Based on Actual Fund Return | | | |
| Investor Shares | $1,000.00 | $1,018.34 | $2.28 |
| Admiral Shares | 1,000.00 | 1,018.81 | 1.87 |
| Based on Hypothetical 5% Yearly Return | | | |
| Investor Shares | $1,000.00 | $1,022.81 | $2.28 |
| Admiral Shares | 1,000.00 | 1,023.21 | 1.88 |
The calculations are based on expenses incurred in the most recent six-month period. The fund’s annualized six-month expense ratios for that period are 0.45% for Investor Shares and 0.37% for Admiral Shares. The dollar amounts shown as “Expenses Paid” are equal to the annualized expense ratio multiplied by the average account value over the period, multiplied by the number of days in the most recent six-month period, then divided by the number of days in the most recent 12-month period.
30
Trustees Approve Advisory Agreement
The board of trustees of Vanguard PRIMECAP Fund has renewed the fund’s investment advisory agreement with PRIMECAP Management Company. The board determined that the retention of the advisor was in the best interests of the fund and its shareholders.
The board based its decision upon an evaluation of the advisor’s investment staff, portfolio management process, and performance. The trustees considered the factors discussed below, among others. However, no single factor determined whether the board approved the agreement. Rather, it was the totality of the circumstances that drove the board’s decision.
Nature, extent, and quality of services
The board considered the quality of the fund’s investment management over both the short and long term, and took into account the organizational depth and stability of the advisor. The board noted that PRIMECAP Management, founded in 1983, is recognized for its long-term approach to growth equity investing. Five experienced portfolio managers are responsible for separate subportfolios, and each portfolio manager employs a fundamental, research-driven approach in seeking to identify companies that have long-term growth potential overlooked by the market and are trading at attractive valuation levels. The firm has managed the fund since its inception in 1984.
The board concluded that the advisor’s experience, stability, depth, and performance, among other factors, warranted continuation of the advisory agreement.
Investment performance
The board considered the short- and long-term performance of the fund, including any periods of outperformance or underperformance of a relevant benchmark and peer group. The board noted that the fund has underperformed its benchmark and peer group over one- and three-year periods, but has outperformed over both five- and ten-year periods. The board concluded that the advisor has carried out the fund’s investment strategy in disciplined fashion. Information about the fund’s most recent performance can be found in the Performance Summary section of this report.
Cost
The board concluded that the fund’s expense ratio was well below the average expense ratio charged by funds in its peer group and that the fund’s advisory fee rate was also well below its peer-group average. Information about the fund’s expenses appears in the About Your Fund’s Expenses section of this report as well as in the Financial Statements section, which also includes information about the fund’s advisory fee rate.
The board did not consider profitability of PRIMECAP Management in determining whether to approve the advisory fee, because PRIMECAP Management is independent of Vanguard and the advisory fee is the result of arm’s-length negotiations.
The benefit of economies of scale
The board concluded that the fund’s shareholders benefit from economies of scale because of breakpoints in the advisory fee schedule. The breakpoints reduce the effective rate of the fee as the fund’s assets increase.
The board will consider whether to renew the advisory agreement again after a one-year period.
31
Glossary
30-Day SEC Yield. A fund’s 30-day SEC yield is derived using a formula specified by the U.S. Securities and Exchange Commission. Under the formula, data related to the fund’s security holdings in the previous 30 days are used to calculate the fund’s hypothetical net income for that period, which is then annualized and divided by the fund’s estimated average net assets over the calculation period. For the purposes of this calculation, a security’s income is based on its current market yield to maturity (for bonds), its actual income (for asset-backed securities), or its projected dividend yield (for stocks). Because the SEC yield represents hypothetical annualized income, it will differ—at times significantly—from the fund’s actual experience. As a result, the fund’s income distributions may be higher or lower than implied by the SEC yield.
Beta. A measure of the magnitude of a fund’s past share-price fluctuations in relation to the ups and downs of a given market index. The index is assigned a beta of 1.00. Compared with a given index, a fund with a beta of 1.20 typically would have seen its share price rise or fall by 12% when the index rose or fell by 10%. For this report, beta is based on returns over the past 36 months for both the fund and the index. Note that a fund’s beta should be reviewed in conjunction with its R-squared (see definition). The lower the R-squared, the less correlation there is between the fund and the index, and the less reliable beta is as an indicator of volatility.
Dividend Yield. Dividend income earned by stocks, expressed as a percentage of the aggregate market value (or of net asset value, for a fund). The yield is determined by dividing the amount of the annual dividends by the aggregate value (or net asset value) at the end of the period. For a fund, the dividend yield is based solely on stock holdings and does not include any income produced by other investments.
Earnings Growth Rate. The average annual rate of growth in earnings over the past five years for the stocks now in a fund.
Equity Exposure. A measure that reflects a fund’s investments in stocks and stock futures. Any holdings in short-term reserves are excluded.
Expense Ratio. A fund’s total annual operating expenses expressed as a percentage of the fund’s average net assets. The expense ratio includes management and administrative expenses, but does not include the transaction costs of buying and selling portfolio securities.
Foreign Holdings. The percentage of a fund represented by securities or depositary receipts of companies based outside the United States.
Inception Date. The date on which the assets of a fund (or one of its share classes) are first invested in accordance with the fund’s investment objective. For funds with a subscription period, the inception date is the day after that period ends. Investment performance is measured from the inception date.
Median Market Cap. An indicator of the size of companies in which a fund invests; the midpoint of market capitalization (market price x shares outstanding) of a fund’s stocks, weighted by the proportion of the fund’s assets invested in each stock. Stocks representing half of the fund’s assets have market capitalizations above the median, and the rest are below it.
Price/Book Ratio. The share price of a stock divided by its net worth, or book value, per share. For a fund, the weighted average price/book ratio of the stocks it holds.
32
Price/Earnings Ratio. The ratio of a stock’s current price to its per-share earnings over the past year. For a fund, the weighted average P/E of the stocks it holds. P/E is an indicator of market expectations about corporate prospects; the higher the P/E, the greater the expectations for a company’s future growth.
R-Squared. A measure of how much of a fund’s past returns can be explained by the returns from the market in general, as measured by a given index. If a fund’s total returns were precisely synchronized with an index’s returns, its R-squared would be 1.00. If the fund’s returns bore no relationship to the index’s returns, its R-squared would be 0. For this report, R-squared is based on returns over the past 36 months for both the fund and the index.
Return on Equity. The annual average rate of return generated by a company during the past five years for each dollar of shareholder’s equity (net income divided by shareholder’s equity). For a fund, the weighted average return on equity for the companies whose stocks it holds.
Short-Term Reserves. The percentage of a fund invested in highly liquid, short-term securities that can be readily converted to cash.
Turnover Rate. An indication of the fund’s trading activity. Funds with high turnover rates incur higher transaction costs and may be more likely to distribute capital gains (which may be taxable to investors). The turnover rate excludes in-kind transactions, which have minimal impact on costs.
33
This page intentionally left blank.
This page intentionally left blank.
The People Who Govern Your Fund
The trustees of your mutual fund are there to see that the fund is operated and managed in your best interests since, as a shareholder, you are a part owner of the fund. Your fund’s trustees also serve on the board of directors of The Vanguard Group, Inc., which is owned by the Vanguard funds and provides services to them on an at-cost basis.
A majority of Vanguard’s board members are independent, meaning that they have no affiliation with Vanguard or the funds they oversee, apart from the sizable personal investments they have made as private individuals. The independent board members have distinguished backgrounds in business, academia, and public service. Each of the trustees and executive officers oversees 179 Vanguard funds.
The following table provides information for each trustee and executive officer of the fund. More information about the trustees is in the Statement of Additional Information, which can be obtained, without charge, by contacting Vanguard at 800-662-7447, or online at vanguard.com.
| |
| InterestedTrustee1 | and Delphi Automotive LLP (automotive components); |
| | Senior Advisor at New Mountain Capital; Trustee of |
| | The Conference Board. |
| F. William McNabb III | |
| Board. Principal Occupation(s) During the Past Five | Amy Gutmann |
| Years: Chairman of the Board of The Vanguard Group, | Born 1949. Trustee Since June 2006. Principal |
| Inc., and of each of the investment companies served | Occupation(s) During the Past Five Years: President |
| by The Vanguard Group, since January 2010; Director | of the University of Pennsylvania; Christopher H. |
| of The Vanguard Group since 2008; Chief Executive | Browne Distinguished Professor of Political Science |
| Officer and President of The Vanguard Group and of | in the School of Arts and Sciences with secondary |
| each of the investment companies served by The | appointments at the Annenberg School for |
| Vanguard Group since 2008; Director of Vanguard | Communication and the Graduate School of Education |
| Marketing Corporation; Managing Director of The | of the University of Pennsylvania; Member of the |
| Vanguard Group (1995–2008). | National Commission on the Humanities and Social |
| | Sciences; Trustee of Carnegie Corporation of New |
| | York and of the National Constitution Center; Chair |
| IndependentTrustees | of the U. S. Presidential Commission for the Study |
| | of Bioethical Issues. |
| |
| Emerson U. Fullwood | JoAnn Heffernan Heisen |
| Born 1948. Trustee Since January 2008. Principal | Born 1950. Trustee Since July 1998. Principal |
| Occupation(s) During the Past Five Years: Executive | Occupation(s) During the Past Five Years: Corporate |
| Chief Staff and Marketing Officer for North America | Vice President and Chief Global Diversity Officer |
| and Corporate Vice President (retired 2008) of Xerox | (retired 2008) and Member of the Executive |
| Corporation (document management products and | Committee (1997–2008) of Johnson & Johnson |
| services); Executive in Residence and 2010 | (pharmaceuticals/medical devices/consumer |
| Distinguished Minett Professor at the Rochester | products); Director of Skytop Lodge Corporation |
| Institute of Technology; Director of SPX Corporation | (hotels), the University Medical Center at Princeton, |
| (multi-industry manufacturing), the United Way of | the Robert Wood Johnson Foundation, and the Center |
| Rochester, Amerigroup Corporation (managed health | for Talent Innovation; Member of the Advisory Board |
| care), the University of Rochester Medical Center, | of the Maxwell School of Citizenship and Public Affairs |
| Monroe Community College Foundation, and North | at Syracuse University. |
| Carolina A&T University. | |
| F. Joseph Loughrey |
| Rajiv L. Gupta | Born 1949. Trustee Since October 2009. Principal |
| Born 1945. Trustee Since December 2001.2 | Occupation(s) During the Past Five Years: President |
| Principal Occupation(s) During the Past Five Years: | and Chief Operating Officer (retired 2009) of Cummins |
| Chairman and Chief Executive Officer (retired 2009) | Inc. (industrial machinery); Director of SKF AB |
| and President (2006–2008) of Rohm and Haas Co. | (industrial machinery), Hillenbrand, Inc. (specialized |
| (chemicals); Director of Tyco International, Ltd. | consumer services), the Lumina Foundation for |
| (diversified manufacturing and services), Hewlett- | |
| Packard Co. (electronic computer manufacturing), | |
| |
| | |
| Education, and Oxfam America; Chairman of the | Executive Officers | |
| Advisory Council for the College of Arts and Letters | | |
| and Member of the Advisory Board to the Kellogg | Glenn Booraem | |
| Institute for International Studies at the University | Born 1967. Controller Since July 2010. Principal |
| of Notre Dame. | Occupation(s) During the Past Five Years: Principal |
| | of The Vanguard Group, Inc.; Controller of each of |
| Mark Loughridge | the investment companies served by The Vanguard |
| Born 1953. Trustee Since March 2012. Principal | Group; Assistant Controller of each of the investment |
| Occupation(s) During the Past Five Years: Senior Vice | companies served by The Vanguard Group (2001–2010). |
| President and Chief Financial Officer at IBM (information | | |
| technology services); Fiduciary Member of IBM’s | Thomas J. Higgins | |
| Retirement Plan Committee. | Born 1957. Chief Financial Officer Since September |
| | 2008. Principal Occupation(s) During the Past Five |
| Scott C. Malpass | Years: Principal of The Vanguard Group, Inc.; Chief |
| Born 1962. Trustee Since March 2012. Principal | Financial Officer of each of the investment companies |
| Occupation(s) During the Past Five Years: Chief | served by The Vanguard Group; Treasurer of each of |
| Investment Officer and Vice President at the University | the investment companies served by The Vanguard |
| of Notre Dame; Assistant Professor of Finance at the | Group (1998–2008). | |
| Mendoza College of Business at Notre Dame; Member | | |
| of the Notre Dame 403(b) Investment Committee; | Kathryn J. Hyatt | |
| Director of TIFF Advisory Services, Inc. (investment | Born 1955. Treasurer Since November 2008. Principal |
| advisor); Member of the Investment Advisory | Occupation(s) During the Past Five Years: Principal of |
| Committees of the Financial Industry Regulatory | The Vanguard Group, Inc.; Treasurer of each of the |
| Authority (FINRA) and of Major League Baseball. | investment companies served by The Vanguard |
| | Group; Assistant Treasurer of each of the investment |
| André F. Perold | companies served by The Vanguard Group (1988–2008). |
| Born 1952. Trustee Since December 2004. Principal | | |
| Occupation(s) During the Past Five Years: George | Heidi Stam | |
| Gund Professor of Finance and Banking at the Harvard | Born 1956. Secretary Since July 2005. Principal |
| Business School (retired 2011); Chief Investment | Occupation(s) During the Past Five Years: Managing |
| Officer and Managing Partner of HighVista Strategies | Director of The Vanguard Group, Inc.; General Counsel |
| LLC (private investment firm); Director of Rand | of The Vanguard Group; Secretary of The Vanguard |
| Merchant Bank; Overseer of the Museum of Fine | Group and of each of the investment companies |
| Arts Boston. | served by The Vanguard Group; Director and Senior |
| | Vice President of Vanguard Marketing Corporation. |
| Alfred M. Rankin, Jr. | | |
| Born 1941. Trustee Since January 1993. Principal | | |
| Occupation(s) During the Past Five Years: Chairman, | Vanguard Senior ManagementTeam |
| President, and Chief Executive Officer of NACCO | | |
| Industries, Inc. (forklift trucks/housewares/lignite); | Mortimer J. Buckley | Michael S. Miller |
| Director of Goodrich Corporation (industrial products/ | Kathleen C. Gubanich | James M. Norris |
| aircraft systems and services) and the National | Paul A. Heller | Glenn W. Reed |
| Association of Manufacturers; Chairman of the Board | Martha G. King | George U. Sauter |
| of the Federal Reserve Bank of Cleveland and of | Chris D. McIsaac | |
| University Hospitals of Cleveland; Advisory Chairman | | |
| of the Board of The Cleveland Museum of Art. | | |
| | Chairman Emeritus and Senior Advisor |
| Peter F. Volanakis | | |
| Born 1955. Trustee Since July 2009. Principal | John J. Brennan | |
| Occupation(s) During the Past Five Years: President | Chairman, 1996–2009 | |
| and Chief Operating Officer (retired 2010) of Corning | Chief Executive Officer and President, 1996–2008 | |
| Incorporated (communications equipment); Director | | |
| of SPX Corporation (multi-industry manufacturing); | |
| Overseer of the Amos Tuck School of Business | Founder | |
| Administration at Dartmouth College; Advisor to the | | |
| Norris Cotton Cancer Center. | John C. Bogle | |
| Chairman and Chief Executive Officer, 1974–1996 | |
| | |
1 Mr. McNabb is considered an “interested person,” as defined in the Investment Company Act of 1940, because he is an officer of the Vanguard funds.
2 December 2002 for Vanguard Equity Income Fund, Vanguard Growth Equity Fund, the Vanguard Municipal Bond Funds, and the Vanguard State Tax-Exempt Funds.
|  |
| P.O. Box 2600 |
| Valley Forge, PA 19482-2600 |
Connect with Vanguard® > vanguard.com
| |
| Fund Information > 800-662-7447 | |
| Direct Investor Account Services > 800-662-2739 | |
| Institutional Investor Services > 800-523-1036 | |
| Text Telephone for People | |
| With Hearing Impairment > 800-749-7273 | |
| |
| This material may be used in conjunction | |
| with the offering of shares of any Vanguard | |
| fund only if preceded or accompanied by | |
| the fund’s current prospectus. | |
| |
| All comparative mutual fund data are from Lipper Inc. or | |
| Morningstar, Inc., unless otherwise noted. | |
| |
| You can obtain a free copy of Vanguard’s proxy voting | |
| guidelines by visiting vanguard.com/proxyreporting or by | |
| calling Vanguard at 800-662-2739. The guidelines are | |
| also available from the SEC’s website, sec.gov. In | |
| addition, you may obtain a free report on how your fund | |
| voted the proxies for securities it owned during the 12 | |
| months ended June 30. To get the report, visit either | |
| vanguard.com/proxyreporting or sec.gov. | |
| |
| You can review and copy information about your fund at | |
| the SEC’s Public Reference Room in Washington, D.C. To | |
| find out more about this public service, call the SEC at | |
| 202-551-8090. Information about your fund is also | |
| available on the SEC’s website, and you can receive | |
| copies of this information, for a fee, by sending a | |
| request in either of two ways: via e-mail addressed to | |
| publicinfo@sec.gov or via regular mail addressed to the | |
| Public Reference Section, Securities and Exchange | |
| Commission, Washington, DC 20549-1520. | |
| |
| |
| | © 2012 The Vanguard Group, Inc. |
| | All rights reserved. |
| | Vanguard Marketing Corporation, Distributor. |
| |
| | Q590 112012 |

|
| Annual Report | September 30, 2012 |
| |
| Vanguard Target Retirement Funds |
| |
 |
| |
| Vanguard Target Retirement Income Fund |
| Vanguard Target Retirement 2010 Fund |
| Vanguard Target Retirement 2015 Fund |
| Vanguard Target Retirement 2020 Fund |
| Vanguard Target Retirement 2025 Fund |
| Vanguard Target Retirement 2030 Fund |
> For the 12 months ended September 30, 2012, returns for the six Target Retirement Funds in this report ranged from 11.74% to 21.43%.
> As global stock markets turned in double-digit gains, Target Retirement Funds with the largest stock allocations performed best.
> Of the five underlying funds that make up the portfolios, Vanguard Prime Money Market Fund posted the weakest return, while Vanguard Total Stock Market Index Fund had the strongest.
| |
| Contents | |
| Your Fund’s Total Returns. | 1 |
| Chairman’s Letter. | 2 |
| Target Retirement Income Fund. | 9 |
| Target Retirement 2010 Fund. | 19 |
| Target Retirement 2015 Fund. | 28 |
| Target Retirement 2020 Fund. | 37 |
| Target Retirement 2025 Fund. | 46 |
| Target Retirement 2030 Fund. | 55 |
| Your Fund’s After-Tax Returns. | 66 |
| About Your Fund’s Expenses. | 68 |
| Glossary. | 70 |
Please note: The opinions expressed in this report are just that—informed opinions. They should not be considered promises or advice. Also, please keep in mind that the information and opinions cover the period through the date on the front of this report. Of course, the risks of investing in your fund are spelled out in the prospectus.
See the Glossary for definitions of investment terms used in this report.
About the cover: Our cover photograph shows rigging on the HMSSurprise, a replica of an 18th-century Royal Navy frigate. It was featured in the 2003 movie Master and Commander: The Far Side of the World, which was based on Patrick O’Brian’s sea novels, set amid the Napoleonic Wars. Vanguard was named for another ship of that era, the HMSVanguard, which was the flagship of British Admiral Horatio Nelson at the Battle of the Nile.
| |
| Your Fund’s Total Returns | |
| |
| |
| |
| |
| Fiscal Year Ended September 30, 2012 | |
| | Total |
| | Returns |
| Vanguard Target Retirement Income Fund | 11.74% |
| Target Income Composite Index | 11.79 |
| Mixed-Asset Target Allocation Conservative Funds Average | 12.44 |
| Mixed-Asset Target Allocation Conservative Funds Average: Derived from data provided by Lipper Inc. | |
| |
| Vanguard Target Retirement 2010 Fund | 14.74% |
| Target 2010 Composite Index | 14.90 |
| Mixed-Asset Target 2010 Funds Average | 13.18 |
| Mixed-Asset Target 2010 Funds Average: Derived from data provided by Lipper Inc. | |
| |
| Vanguard Target Retirement 2015 Fund | 16.76% |
| Target 2015 Composite Index | 16.87 |
| Mixed-Asset Target 2015 Funds Average | 14.43 |
| Mixed-Asset Target 2015 Funds Average: Derived from data provided by Lipper Inc. | |
| |
| Vanguard Target Retirement 2020 Fund | 18.30% |
| Target 2020 Composite Index | 18.62 |
| Mixed-Asset Target 2020 Funds Average | 16.59 |
| Mixed-Asset Target 2020 Funds Average: Derived from data provided by Lipper Inc. | |
| |
| Vanguard Target Retirement 2025 Fund | 19.89% |
| Target 2025 Composite Index | 20.13 |
| Mixed-Asset Target 2025 Funds Average | 18.71 |
| Mixed-Asset Target 2025 Funds Average: Derived from data provided by Lipper Inc. | |
| |
| Vanguard Target Retirement 2030 Fund | 21.43% |
| Target 2030 Composite Index | 21.65 |
| Mixed-Asset Target 2030 Funds Average | 19.76 |
Mixed-Asset Target 2030 Funds Average: Derived from data provided by Lipper Inc.
For a benchmark description, see the Glossary.
Investments in Target Retirement Funds are subject to the risks of their underlying funds. The year in the fund name refers to the approximate year (the target date) when an investor in the fund would retire and leave the work force. The fund will gradually shift its emphasis from more aggressive investments to more conservative ones based on its target date. An investment in a Target Retirement Fund is not guaranteed at any time, including on or after the target date.
1

Chairman’s Letter
Dear Shareholder,
In contrast to the previous year, global stock markets trumped their bond counterparts for the fiscal year ended September 30, 2012. Despite continued worries about Europe’s debt crisis and a slowdown in emerging markets, the six Vanguard Target Retirement Funds covered in this report produced their best fiscal-year returns since inception.
This report features the performance of the Target Income Fund as well as the Target Retirement Funds dated 2010 through 2030. (Funds with target dates 2035 through 2060 are discussed in a separate report.) The funds covered in this report are designed for investors already in retirement or within 20 years of retirement; therefore, their allocations are more conservative, with a larger proportion of their assets in bonds than their longer-dated counterparts.
During the most recent fiscal year, the funds with larger stock allocations did best. Although investing in stocks can often result in more volatility, this time around, it turned out to be an advantage. Still, the fixed income portion of the funds’ portfolios also turned in respectable returns.
Please note that on October 2 we announced that we will transition to new benchmark indexes for 22 of our index funds, including Total Stock Market Index Fund and Total International Stock Market Index Fund. Both of those are among the underlying funds in the Target Retirement Funds. Total Stock’s new
2
benchmark will be the CRSP US Total Market Index, and the new benchmark for Total International will be the FTSE Global All Cap ex US Index. The transition, which will take place over several months, is expected to produce significant long-term savings for shareholders on licensing fees paid to index providers.
Stocks notched a powerful rally, with help from central bankers
U.S. stocks surged 30% in the 12 months ended September 30, 2012, outpacing the gains of their international counterparts. The rally came amid moves by U.S. and European central bankers to quiet—at least temporarily—investors’ concerns about the U.S. economy and the finances of European governments and banks.
While U.S. stocks were the standouts, European and emerging markets stocks also posted double-digit results. The developed markets of the Pacific region were the weakest performers but still recorded a modest advance.
In July, the president of the European Central Bank declared that policymakers would do whatever was needed to preserve the euro common currency. That pronouncement was encouraging to investors, but Europe’s financial troubles are by no means resolved. Vanguard economists believe the most likely scenario is that the Eurozone will “muddle through” for several years, with occasional spikes in market volatility, as fiscal tightening continues in the face of weak economic growth.
| | | |
| Market Barometer | | | |
| |
| | | Average Annual Total Returns |
| | Periods Ended September 30, 2012 |
| | One | Three | Five |
| | Year | Years | Years |
| Stocks | | | |
| Russell 1000 Index (Large-caps) | 30.06% | 13.27% | 1.22% |
| Russell 2000 Index (Small-caps) | 31.91 | 12.99 | 2.21 |
| Dow Jones U.S. Total Stock Market Index | 30.00 | 13.29 | 1.53 |
| MSCI All Country World Index ex USA (International) | 14.48 | 3.17 | -4.12 |
| |
| Bonds | | | |
| Barclays U.S. Aggregate Bond Index (Broad taxable market) | 5.16% | 6.19% | 6.53% |
| Barclays Municipal Bond Index (Broad tax-exempt market) | 8.32 | 5.99 | 6.06 |
| Citigroup Three-Month U.S. Treasury Bill Index | 0.05 | 0.08 | 0.63 |
| |
| CPI | | | |
| Consumer Price Index | 1.99% | 2.33% | 2.11% |
3
Bonds produced solid returns; future results may be more muted
Bonds once again advanced; the broad U.S. taxable market returned about 5% for the 12 months. Among U.S. Treasuries, long-term bonds were particularly strong as they benefited from the Federal Reserve’s bond-buying program.
As bond prices rose, the yield of the 10-year U.S. Treasury note fell to a record low in July, closing below 1.5%. (Bond yields and prices move in opposite directions.) By the end of the period, the yield had climbed, but it still remained low by historical standards.
Bondholders have enjoyed years of strong returns. But as Tim Buckley, our incoming chief investment officer, has noted, investors shouldn’t be surprised if future results are much more modest. As yields tumble, the scope for further declines—and price increases—diminishes.
The Federal Reserve announced on September 13 that it would continue to hold its target for short-term interest rates between 0% and 0.25% at least through mid-2015. The exceptionally low rates, in place since late 2008, kept a tight lid on returns from money market funds and savings accounts.
Expense Ratios
Your Fund Compared With Its Peer Group
| | |
| | Acquired Fund Fees | Peer Group |
| | and Expenses | Average |
| Target Retirement Income Fund | 0.17% | 0.86% |
| Target Retirement 2010 Fund | 0.17 | 0.59 |
| Target Retirement 2015 Fund | 0.17 | 0.57 |
| Target Retirement 2020 Fund | 0.17 | 0.63 |
| Target Retirement 2025 Fund | 0.18 | 0.55 |
| Target Retirement 2030 Fund | 0.18 | 0.62 |
The fund expense figures shown—drawn from the prospectus dated January 26, 2012—represent an estimate of the weighted average of the expense ratios and any transaction fees charged by the underlying mutual funds (the ”acquired” funds) in which the Target Retirement Funds invest. The Target Retirement Funds do not charge any expenses or fees of their own. For the fiscal year ended September 30, 2012, the acquired fund fees and expenses were 0.16% for the Income Fund, 0.16% for the 2010 Fund, 0.16% for the 2015 Fund, 0.16% for the 2020 Fund, 0.17% for the 2025 Fund, and 0.17% for the 2030 Fund. Peer-group expense ratios are derived from data provided by Lipper Inc. and capture information through year-end 2011.
Peer groups: For the Income Fund, Mixed-Asset Target Allocation Conservative Funds; for the 2010 Fund, Mixed-Asset Target 2010 Funds; for the 2015 Fund, Mixed-Asset Target 2015 Funds; for the 2020 Fund, Mixed-Asset Target 2020 Funds; for the 2025 Fund, Mixed-Asset Target 2025 Funds, and for the Target Retirement 2030 Fund, Mixed-Asset Target 2030 Funds.
4
Stock-heavy funds delivered highest returns
Target Retirement Funds are designed to enable investors who have neither the time nor the inclination to manage a retirement portfolio to hold a diversified “fund of funds” that adjusts its asset allocation over time. Each portfolio shifts from a growth-oriented, stock-heavy asset allocation to one that is more conservative, focused on bonds and money market funds, as the target retirement date approaches. This gradual shift is critical for investors nearing or in retirement who are increasingly concerned about income and preserving their wealth.
| |
| Total Returns | |
| Inception Through September 30, 2012 | |
| | Average |
| | Annual Return |
| Target Retirement Income Fund (Returns since inception: 10/27/2003) | 5.69% |
| Target Income Composite Index | 5.69 |
| Mixed-Asset Target Allocation Conservative Funds Average | 4.41 |
| Mixed-Asset Target Allocation Conservative Funds Average: Derived from data provided by Lipper Inc. | |
| Target Retirement 2010 Fund (Returns since inception: 6/7/2006) | 5.58% |
| Target 2010 Composite Index | 5.55 |
| Mixed-Asset Target 2010 Funds Average | 4.07 |
| Mixed-Asset Target 2010 Funds Average: Derived from data provided by Lipper Inc. | |
| Target Retirement 2015 Fund (Returns since inception: 10/27/2003) | 5.90% |
| Target 2015 Composite Index | 5.87 |
| Mixed-Asset Target 2015 Funds Average | 4.82 |
| Mixed-Asset Target 2015 Funds Average: Derived from data provided by Lipper Inc. | |
| Target Retirement 2020 Fund (Returns since inception: 6/7/2006) | 5.04% |
| Target 2020 Composite Index | 5.10 |
| Mixed-Asset Target 2020 Funds Average | 3.96 |
| Mixed-Asset Target 2020 Funds Average: Derived from data provided by Lipper Inc. | |
| |
| Target Retirement 2025 Fund (Returns since inception: 10/27/2003) | 5.79% |
| Target 2025 Composite Index | 5.85 |
| Mixed-Asset Target 2025 Funds Average | 5.37 |
| Mixed-Asset Target 2025 Funds Average: Derived from data provided by Lipper Inc. | |
| |
| Target Retirement 2030 Fund (Returns since inception: 6/7/2006) | 4.48% |
| Target 2030 Composite Index | 4.57 |
| Mixed-Asset Target 2030 Funds Average | 3.44 |
| Mixed-Asset Target 2030 Funds Average: Derived from data provided by Lipper Inc. | |
The figures shown represent past performance, which is not a guarantee of future results. (Current performance may be lower or higher than the performance data cited. For performance data current to the most recent month-end, visit our website at vanguard.com/performance.) Note, too, that both investment returns and principal value can fluctuate widely, so an investor’s shares, when sold, could be worth more or less than their original cost.
5
Returns for the Vanguard Target Retirement Funds were largely driven by the proportion of their assets allocated to the underlying stock funds. Target Retirement 2030, which invested nearly 80% of its assets in stocks, led the pack with a return of 21.43% for the fiscal year. (Returns for the funds and their underlying funds in this report are for Investor Shares.) The Target Retirement Income Fund, intended for people in retirement, invested only about 30% of its assets in stocks. It had the smallest gain, returning 11.74%. (You may recall from my previous letter for the semiannual reporting period that we merged Vanguard Target Retirement 2005 Fund into Vanguard Target Retirement Income Fund.)
Not surprisingly, among the funds’ underlying investments, the star was the U.S. stock market. Vanguard Total Stock Market Index Fund notched a 30% gain for the period. Vanguard Total International Stock Index Fund, which posted a 12-month return of –12% a year ago, made a significant turnaround during this latest fiscal period to return 15%.
Still, the underlying bond funds held their own. The standout performer was Vanguard Inflation-Protected Securities Fund, which aims to protect investors against the long-term effects of inflation by investing in bonds with a built-in inflation safeguard. As the Eurozone crisis reemerged in the spring and reports of slowing economic growth in the United States and other countries came with greater frequency, more investors turned to Treasury Inflation-Protected Securities (TIPS) because of their ability to protect purchasing power from unanticipated spikes in inflation. The Inflation-Protected Securities Fund returned about 9% for the fiscal year, the same as it did a year ago. Vanguard Total Bond Market II Index Fund returned about 5%, also similar to last year. Vanguard Prime Money Market Fund’s 0.04% return fell slightly, a result of the near-0% yields on short-term U.S. Treasury bills and other money market instruments.
As I mentioned, bond investors have enjoyed years of robust returns, but we anticipate that results will be more modest in the future. A key to managing this risk is to know what to expect. Just as the stock market cannot be counted on to return double-digit gains continually, bond market expectations should also be kept in perspective.
The funds’ impressive record of tracking their indexes
Inception dates for the six Vanguard Target Retirement Funds included in this report range from 2003 through 2006. During their relatively short lifespans, the funds have experienced frequently volatile stock market environments. They have tracked their indexes closely, even though the benchmarks’ returns don’t reflect any operating or transaction costs. In addition, each fund’s average annual return has surpassed that of its appropriate peer group.
The funds’ tight benchmark tracking is a tribute to the skill of their investment advisors, Vanguard’s Equity Investment Group and Fixed Income Group, whose combined knowledge of portfolio construction and management techniques
6
reflects more than 20 years of indexing experience. For a look at how the funds’ costs compare with the average expenses of their respective peer groups, please see the table on page 4.
The lessons of the financial crisis remain relevant four years later
In September, the end of your fund’s fiscal year, we marked the fourth anniversary of Lehman Brothers’ collapse, the start of the 2008–2009 financial crisis. When the Lehman news broke, I was speaking to institutional clients at an event in Washington, D.C., all of three weeks into my new role as Vanguard’s CEO.
In the ensuing months, I was struck both by how fortunate I was to work with a great team of Vanguard “crew” and by the remarkable steadiness demonstrated by our clients. Many clients experienced significant losses, but signs of panic were few. On balance, they remained committed to their long-term investment programs and managed to benefit from the financial markets’ subsequent recovery.
As the crisis recedes further in time, it’s important not to lose sight of the lessons that it illuminated about investing and sound financial practices generally. First among those lessons is that diversification does work. Diversification didn’t immunize investors from the market’s decline, but it certainly helped to insulate them from the worst of it.
Second, saving money and living within your means are critical. Investors are acting on this lesson as they pay off debt, which is a form of saving, and increase their savings rates from the dangerously low levels that prevailed before the crisis.
Third, having the courage to stick with a sound investment plan—as so many of our clients did—is important during volatile, uncertain times. Investors who resisted the urge to bail out of stocks at the depths of the crisis have largely been rewarded in the succeeding years.
I am very optimistic that, if investors embrace these lessons, they can give themselves a better chance of reaching their long-term goals.
Sincerely,

F. William McNabb III
Chairman and Chief Executive Officer
October 15, 2012
7
Your Fund’s Performance at a Glance
September 30, 2011, Through September 30, 2012
| | | | |
| | | | Distributions Per Share |
| | Starting | Ending | Income | Capital |
| | Share Price | Share Price | Dividends | Gains |
| Target Retirement Income Fund | $11.22 | $12.23 | $0.273 | $0.021 |
| Target Retirement 2010 Fund | $21.91 | $24.45 | $0.596 | $0.037 |
| Target Retirement 2015 Fund | $11.91 | $13.54 | $0.313 | $0.020 |
| Target Retirement 2020 Fund | $20.83 | $24.04 | $0.513 | $0.031 |
| Target Retirement 2025 Fund | $11.71 | $13.70 | $0.291 | $0.013 |
| Target Retirement 2030 Fund | $19.81 | $23.51 | $0.468 | $0.017 |
| | | |
| Asset Allocation on September 30, 2012 | | | |
| | | | Short-Term |
| | Stocks | Bonds | Reserves |
| Target Retirement Income Fund | 30.0% | 65.1% | 4.9% |
| Target Retirement 2010 Fund | 43.3% | 55.1% | 1.6% |
| Target Retirement 2015 Fund | 55.3% | 44.7% | 0.0% |
| Target Retirement 2020 Fund | 63.7% | 36.3% | 0.0% |
| Target Retirement 2025 Fund | 71.4% | 28.6% | 0.0% |
| Target Retirement 2030 Fund | 78.7% | 21.3% | 0.0% |
Note: The Income Fund’s allocations do not change. As of September 30, 2012, international stock weightings for the Income, 2010, 2015, 2020, 2025, and 2030 Funds were 9%, 13%, 17%, 19%, 22%, and 24% of assets, respectively.
8
Target Retirement Income Fund
Fund Profile
As of September 30, 2012
| |
| Total Fund Characteristics | |
| Ticker Symbol | VTINX |
| 30-Day SEC Yield | 2.01% |
| Acquired Fund Fees and Expenses1 | 0.17% |
| |
| Allocation to Underlying Vanguard Funds | |
| Vanguard Total Bond Market II Index Fund | |
| Investor Shares | 45.1% |
| Vanguard Total Stock Market Index Fund | |
| Investor Shares | 20.9 |
| Vanguard Inflation-Protected Securities | |
| Fund Investor Shares | 20.0 |
| Vanguard Total International Stock Index | |
| Fund Investor Shares | 9.1 |
| Vanguard Prime Money Market Fund | |
| Investor Shares | 4.9 |
| | |
| Total Fund Volatility Measures | |
| | Target | Barclays |
| | Income | Aggregate |
| | Composite | Bond |
| | Index | Index |
| R-Squared | 1.00 | 0.00 |
| Beta | 0.99 | -0.04 |
These measures show the degree and timing of the fund’s fluctuations compared with the indexes over 36 months.
Fund Asset Allocation
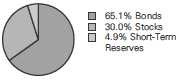
1 This figure—drawn from the prospectus dated January 26, 2012—represents an estimate of the weighted average of the expense ratios and any transaction fees charged by the underlying mutual funds (the ”acquired” funds) in which the Target Retirement Income Fund invests. The fund does not charge any expenses or fees of its own. For the fiscal year ended September 30, 2012, the acquired fund fees and expenses were 0.16%.
9
Target Retirement Income Fund
Performance Summary
All of the returns in this report represent past performance, which is not a guarantee of future results that may be achieved by the fund. (Current performance may be lower or higher than the performance data cited. For performance data current to the most recent month-end, visit our website at vanguard.com/performance.) Note, too, that both investment returns and principal value can fluctuate widely, so an investor’s shares, when sold, could be worth more or less than their original cost. The returns shown do not reflect taxes that a shareholder would pay on fund distributions or on the sale of fund shares.
Cumulative Performance: October 27, 2003, Through September 30, 2012
Initial Investment of $10,000

| | | | |
| | | Average Annual Total Returns | |
| | Periods Ended September 30, 2012 | |
| | | | Since | Final Value |
| | One | Five | Inception | of a $10,000 |
| | Year | Years | (10/27/2003) | Investment |
| Target Retirement Income Fund | 11.74% | 5.06% | 5.69% | $16,394 |
| Target Income Composite Index | 11.79 | 4.99 | 5.69 | 16,384 |
| Mixed-Asset Target Allocation | | | | |
| Conservative Funds Average | 12.44 | 3.31 | 4.41 | 14,699 |
| Barclays U.S. Aggregate Bond Index | 5.16 | 6.53 | 5.47 | 16,091 |
For a benchmark description, see the Glossary.
Mixed-Asset Target Allocation Conservative Funds Average: Derived from data provided by Lipper Inc.
"Since Inception" performance is calculated from the inception date for both the fund and its comparative standards.
See Financial Highlights for dividend and capital gains information.
10
Target Retirement Income Fund
Fiscal-Year Total Returns (%): October 27, 2003, Through September 30, 2012
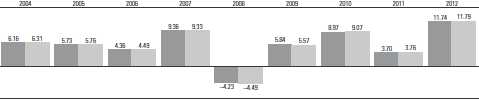
|
| Target Retirement Income Fund |
| Target Income Composite Index |
| For a benchmark description, see the Glossary. |
11
Target Retirement Income Fund
Financial Statements
Statement of Net Assets
As of September 30, 2012
The fund reports a complete list of its holdings in regulatory filings four times in each fiscal year, at the quarter-ends. For the second and fourth fiscal quarters, the lists appear in the fund’s semiannual and annual reports to shareholders. For the first and third fiscal quarters, the fund files the lists with the Securities and Exchange Commission on Form N-Q. Shareholders can look up the fund’s Forms N-Q on the SEC’s website at sec.gov. Forms N-Q may also be reviewed and copied at the SEC’s Public Reference Room (see the back cover of this report for further information).
| | |
| | | Market |
| | | Value |
| | Shares | ($000) |
| Investment Companies (99.9%) | | |
| U.S. Stock Fund (20.9%) | | |
| Vanguard Total Stock Market Index Fund Investor Shares | 54,652,194 | 1,958,735 |
| |
| International Stock Fund (9.1%) | | |
| Vanguard Total International Stock Index Fund Investor Shares | 59,790,919 | 850,825 |
| |
| Bond Funds (65.0%) | | |
| 1 Vanguard Total Bond Market II Index Fund Investor Shares | 381,655,090 | 4,228,738 |
| Vanguard Inflation-Protected Securities Fund Investor Shares | 126,301,622 | 1,875,579 |
| | | 6,104,317 |
| Money Market Fund (4.9%) | | |
| Vanguard Prime Money Market Fund Investor Shares | 461,847,390 | 461,847 |
| Total Investment Companies (Cost $8,435,184) | | 9,375,724 |
| Other Assets and Liabilities (0.1%) | | |
| Other Assets | | 27,239 |
| Liabilities | | (20,756) |
| | | 6,483 |
| Net Assets (100%) | | |
| Applicable to 767,197,756 outstanding $.001 par value shares of | | |
| beneficial interest (unlimited authorization) | | 9,382,207 |
| Net Asset Value Per Share | | $12.23 |
| |
| |
| At September 30, 2012, net assets consisted of: | | |
| | | Amount |
| | | ($000) |
| Paid-in Capital | | 8,478,008 |
| Undistributed Net Investment Income | | 5,357 |
| Accumulated Net Realized Losses | | (41,698) |
| Unrealized Appreciation (Depreciation) | | 940,540 |
| Net Assets | | 9,382,207 |
See Note A in Notes to Financial Statements.
1 Affiliated fund available only to Vanguard funds and certain trusts and accounts managed by Vanguard.
See accompanying Notes, which are an integral part of the Financial Statements.
12
| |
| Target Retirement Income Fund | |
| |
| |
| Statement of Operations | |
| |
| | Year Ended |
| | September 30, 2012 |
| | ($000) |
| Investment Income | |
| Income | |
| Income Distributions Received | 172,142 |
| Net Investment Income—Note B | 172,142 |
| Realized Net Gain (Loss) | |
| Capital Gain Distributions Received | 28,571 |
| Investment Securities Sold | 9,370 |
| Realized Net Gain (Loss) | 37,941 |
| Change in Unrealized Appreciation (Depreciation) of Investment Securities | 522,955 |
| Net Increase (Decrease) in Net Assets Resulting from Operations | 733,038 |
See accompanying Notes, which are an integral part of the Financial Statements.
13
| | |
| Target Retirement Income Fund | | |
| |
| |
| Statement of Changes in Net Assets | | |
| |
| | Year Ended September 30, |
| | 2012 | 2011 |
| | ($000) | ($000) |
| Increase (Decrease) in Net Assets | | |
| Operations | | |
| Net Investment Income | 172,142 | 113,850 |
| Realized Net Gain (Loss) | 37,941 | 26,169 |
| Change in Unrealized Appreciation (Depreciation) | 522,955 | (11,577) |
| Net Increase (Decrease) in Net Assets Resulting from Operations | 733,038 | 128,442 |
| Distributions | | |
| Net Investment Income | (168,784) | (113,803) |
| Realized Capital Gain1 | (9,699) | (8,254) |
| Total Distributions | (178,483) | (122,057) |
| Capital Share Transactions | | |
| Issued | 3,254,326 | 2,148,360 |
| Issued in Connection with Acquisition of | | |
| Vanguard Target Retirement 2005 Fund—Note G | 2,192,576 | — |
| Issued in Lieu of Cash Distributions | 171,526 | 116,593 |
| Redeemed | (1,555,508) | (1,129,601) |
| Net Increase (Decrease) from Capital Share Transactions | 4,062,920 | 1,135,352 |
| Total Increase (Decrease) | 4,617,475 | 1,141,737 |
| Net Assets | | |
| Beginning of Period | 4,764,732 | 3,622,995 |
| End of Period2 | 9,382,207 | 4,764,732 |
1 Includes fiscal 2012 and 2011 short-term gain distributions totaling $9,699,000 and $8,254,000, respectively. Short-term gain distributions are treated as ordinary income dividends for tax purposes.
2 Net Assets—End of Period includes undistributed net investment income of $5,357,000 and $1,999,000.
See accompanying Notes, which are an integral part of the Financial Statements.
14
| | | | | |
| Target Retirement Income Fund | | | | | |
| |
| |
| Financial Highlights | | | | | |
| |
| |
| |
| For a Share Outstanding | | | Year Ended September 30, |
| Throughout Each Period | 2012 | 2011 | 2010 | 2009 | 2008 |
| Net Asset Value, Beginning of Period | $11.22 | $11.13 | $10.49 | $10.19 | $11.08 |
| Investment Operations | | | | | |
| Net Investment Income | .275 | .3031 | .288 | .268 | .427 |
| Capital Gain Distributions Received | .052 | .0301 | — | — | — |
| Net Realized and Unrealized Gain (Loss) | | | | | |
| on Investments | .977 | .080 | .640 | .302 | (.878) |
| Total from Investment Operations | 1.304 | .413 | .928 | .570 | (.451) |
| Distributions | | | | | |
| Dividends from Net Investment Income | (.273) | (.299) | (.288) | (.270) | (.439) |
| Distributions from Realized Capital Gains | (.021) | (.024) | — | — | — |
| Total Distributions | (.294) | (.323) | (.288) | (.270) | (.439) |
| Net Asset Value, End of Period | $12.23 | $11.22 | $11.13 | $10.49 | $10.19 |
| |
| Total Return2 | 11.74% | 3.70% | 8.97% | 5.84% | -4.23% |
| |
| Ratios/Supplemental Data | | | | | |
| Net Assets, End of Period (Millions) | $9,382 | $4,765 | $3,623 | $2,463 | $2,046 |
| Ratio of Total Expenses to | | | | | |
| Average Net Assets | — | — | — | — | — |
| Acquired Fund Fees and Expenses | 0.16% | 0.17% | 0.17% | 0.21% | 0.19% |
| Ratio of Net Investment Income to | | | | | |
| Average Net Assets | 2.31% | 2.65% | 2.70% | 2.78% | 4.11% |
| Portfolio Turnover Rate | 7% | 14%3 | 12% | 29%4 | 14% |
1 Calculated based on average shares outstanding.
2 Total returns do not include account service fees that may have applied in the periods shown. Fund prospectuses provide information about any applicable account service fees.
3 Excludes the value of mutual fund shares delivered and received in connection with a change in the fund’s international equity investments from Vanguard European, Pacific, and Emerging Markets Stock Index Funds to Vanguard Total International Stock Index Fund because those transactions were effected in kind and did not cause the fund to incur transaction costs.
4 Excludes the value of mutual fund shares delivered and received in connection with a change in the fund’s bond investments from Vanguard Total Bond Market Index Fund to Vanguard Total Bond Market II Index Fund because those transactions were effected in kind and did not cause the fund to incur transaction costs.
See accompanying Notes, which are an integral part of the Financial Statements.
15
Target Retirement Income Fund
Notes to Financial Statements
Vanguard Target Retirement Income Fund is registered under the Investment Company Act of 1940 as an open-end investment company, or mutual fund. The fund follows a balanced investment strategy by investing in selected Vanguard funds to achieve its targeted allocation of assets to U.S. stocks, international stocks, bonds, and short-term reserves.
A. The following significant accounting policies conform to generally accepted accounting principles for U.S. mutual funds. The fund consistently follows such policies in preparing its financial statements.
1. Security Valuation: Investments are valued at the net asset value of each underlying Vanguard fund determined as of the close of the New York Stock Exchange (generally 4 p.m., Eastern time) on the valuation date.
2. Federal Income Taxes: The fund intends to continue to qualify as a regulated investment company and distribute all of its taxable income. Management has analyzed the fund’s tax positions taken for all open federal income tax years (September 30, 2009–2012), and has concluded that no provision for federal income tax is required in the fund’s financial statements.
3. Distributions: Distributions to shareholders are recorded on the ex-dividend date.
4. Other: Income and capital gain distributions received are recorded on the ex-dividend date. Security transactions are accounted for on the date securities are bought or sold. Costs used to determine realized gains (losses) on the sale of investment securities are those of the specific securities sold.
B. Under a service agreement, The Vanguard Group furnishes investment advisory, corporate management, administrative, marketing, and distribution services to the fund. The service agreement provides that the fund’s expenses may be reduced or eliminated to the extent of savings realized by the Vanguard funds by the operation of the fund. Accordingly, all incremental expenses for services provided by Vanguard and all other expenses incurred by the fund during the year ended September 30, 2012, were borne by the funds in which the fund invests. The fund’s trustees and officers are also directors and officers of Vanguard and the funds in which the fund invests.
C. Various inputs may be used to determine the value of the fund’s investments. These inputs are summarized in three broad levels for financial statement purposes. The inputs or methodologies used to value securities are not necessarily an indication of the risk associated with investing in those securities.
Level 1—Quoted prices in active markets for identical securities.
Level 2—Other significant observable inputs (including quoted prices for similar securities, interest rates, prepayment speeds, credit risk, etc.).
Level 3—Significant unobservable inputs (including the fund’s own assumptions used to determine the fair value of investments).
At September 30, 2012, 100% of the market value of the fund’s investments was determined based on Level 1 inputs.
D. Distributions are determined on a tax basis and may differ from net investment income and realized capital gains for financial reporting purposes. Differences may be permanent or temporary. Permanent differences are reclassified among capital accounts in the financial statements to reflect their tax character. Temporary differences arise when certain items of income, expense, gain, or loss are recognized in different periods for financial statement and tax purposes; these differences will reverse at some time in the future. Differences in classification may also result from the treatment of short-term gains as ordinary income for tax purposes.
16
Target Retirement Income Fund
For tax purposes, at September 30, 2012, the fund had $7,967,000 of ordinary income available for distribution. Tax-basis amounts required to be distributed in December 2011 included short term gain distributions received from Vanguard Total Bond Market II Index Fund in December 2011. Short-term capital gain distributions received are treated as ordinary income for tax purposes, and cannot be offset by capital losses. The fund used capital loss carryforwards of $14,940,000 to offset taxable capital gains realized during the year ended September 30, 2012. At September 30, 2012, the fund had available capital losses totaling $43,292,000 to offset future net capital gains of $36,768,000 through September 30, 2016, and $6,524,000 through September 30, 2018.
The fund acquired additional realized losses of $46,279,000 to offset future net capital gains in connection with the acquisition of Vanguard Target Retirement 2005 Fund in February 2012 (see Note G); these losses have been reclassified from paid-in capital to accumulated net realized losses.
At September 30, 2012, the cost of investment securities for tax purposes was $8,436,200,000. Net unrealized appreciation of investment securities for tax purposes was $939,524,000, consisting of unrealized gains of $968,512,000 on securities that had risen in value since their purchase and $28,988,000 in unrealized losses on securities that had fallen in value since their purchase.
E. During the year ended September 30, 2012, the fund purchased $4,361,476,000 of investment securities, including $2,223,588,000 of securities acquired in connection with acquisition of Vanguard Target Retirement 2005 Fund, and sold $516,050,000 of investment securities, other than temporary cash investments.
F. Capital shares issued and redeemed were:
| | |
| | Year Ended September 30, |
| | 2012 | 2011 |
| | Shares | Shares |
| | (000) | (000) |
| Issued | 274,845 | 187,588 |
| Issued in Connection with Acquisition of | | |
| Vanguard Target Retirement 2005 Fund | 184,543 | — |
| Issued in Lieu of Cash Distributions | 14,464 | 10,255 |
| Redeemed | (131,221) | (98,730) |
| Net Increase (Decrease) in Shares Outstanding | 342,631 | 99,113 |
G. On February 10, 2012, the fund acquired all the net assets of Vanguard Target Retirement 2005 Fund pursuant to a plan of reorganization approved by the funds’ board of trustees. The purpose of the transaction was to combine two funds with comparable investment objectives. The acquisition was accomplished by a tax-free exchange of 184,543,000 shares of the fund for 177,808,000 shares of the Vanguard Target Retirement 2005 Fund outstanding as of the close of business on February 10, 2012. The Vanguard Target Retirement 2005 Fund’s net assets as of the close of business on February 10, 2012, of $2,192,576,000, including $237,489,000 of unrealized appreciation, were combined with the fund’s net assets. The net assets of the fund immediately before the acquisition were $5,956,166,000. The net assets of the fund immediately following the acquisition were $8,148,742,000.
17
Target Retirement Income Fund
Assuming that the acquisition had been completed on October 1, 2011, the beginning of the fund’s reporting period, the fund’s pro forma results of operations for the year ended September 30, 2012, would be:
| |
| | ($000) |
| Net Investment Income | 197,664 |
| Realized Net Gain (Loss) | 53,470 |
| Change in Unrealized Appreciation (Depreciation) | 641,571 |
| Net Increase (Decrease) in Net Assets Resulting from Operations | 892,705 |
Because the combined funds have been managed as a single integrated fund since the acquisition was completed, it is not practical to separate the results of operations of Vanguard Target Retirement 2005 Fund that have been included in the fund’s statement of operations since February 10, 2012.
H. In preparing the financial statements as of September 30, 2012, management considered the impact of subsequent events for potential recognition or disclosure in these financial statements.
18
Target Retirement 2010 Fund
Fund Profile
As of September 30, 2012
| |
| Total Fund Characteristics | |
| Ticker Symbol | VTENX |
| 30-Day SEC Yield | 2.03% |
| Acquired Fund Fees and Expenses1 | 0.17% |
| |
| Allocation to Underlying Vanguard Funds | |
| Vanguard Total Bond Market II Index Fund | |
| Investor Shares | 41.8% |
| Vanguard Total Stock Market Index Fund | |
| Investor Shares | 30.1 |
| Vanguard Inflation-Protected Securities | |
| Fund Investor Shares | 13.3 |
| Vanguard Total International Stock Index | |
| Fund Investor Shares | 13.2 |
| Vanguard Prime Money Market Fund | |
| Investor Shares | 1.6 |
| | |
| Total Fund Volatility Measures | |
| | Target 2010 | MSCI US |
| | Composite | Broad Market |
| | Index | Index |
| R-Squared | 1.00 | 0.94 |
| Beta | 0.99 | 0.46 |
These measures show the degree and timing of the fund’s fluctuations compared with the indexes over 36 months.
Fund Asset Allocation
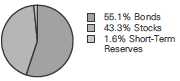
1 This figure—drawn from the prospectus dated January 26, 2012—represents an estimate of the weighted average of the expense ratios and any transaction fees charged by the underlying mutual funds (the ”acquired” funds) in which the Target Retirement 2010 Fund invests. The fund does not charge any expenses or fees of its own. For the fiscal year ended September 30, 2012, the acquired fund fees and expenses were 0.16%.
19
Target Retirement 2010 Fund
Performance Summary
All of the returns in this report represent past performance, which is not a guarantee of future results that may be achieved by the fund. (Current performance may be lower or higher than the performance data cited. For performance data current to the most recent month-end, visit our website at vanguard.com/performance.) Note, too, that both investment returns and principal value can fluctuate widely, so an investor’s shares, when sold, could be worth more or less than their original cost. The returns shown do not reflect taxes that a shareholder would pay on fund distributions or on the sale of fund shares.
Cumulative Performance: June 7, 2006, Through September 30, 2012
Initial Investment of $10,000
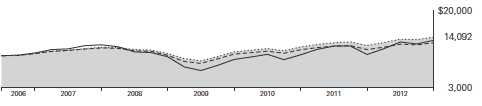
| | | | |
| | | Average Annual Total Returns | |
| | Periods Ended September 30, 2012 | |
| | | | Since | Final Value |
| | One | Five | Inception | of a $10,000 |
| | Year | Years | (6/7/2006) | Investment |
| Target Retirement 2010 Fund | 14.74% | 3.50% | 5.58% | $14,092 |
| Target 2010 Composite Index | 14.90 | 3.49 | 5.55 | 14,065 |
| Mixed-Asset Target 2010 Funds | | | | |
| Average | 13.18 | 1.89 | 4.07 | 12,862 |
| MSCI US Broad Market Index | 30.30 | 1.55 | 4.73 | 13,390 |
For a benchmark description, see the Glossary.
Mixed-Asset Target 2010 Funds Average: Derived from data provided by Lipper Inc.
"Since Inception" performance is calculated from the inception date for both the fund and its comparative standards.
See Financial Highlights for dividend and capital gains information.
20
Target Retirement 2010 Fund
Fiscal-Year Total Returns (%): June 7, 2006, Through September 30, 2012
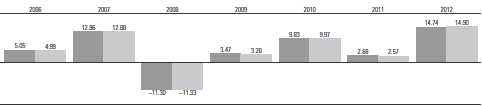
|
| Target Retirement 2010 Fund |
| Target 2010 Composite Index |
| For a benchmark description, see the Glossary. |
21
Target Retirement 2010 Fund
Financial Statements
Statement of Net Assets
As of September 30, 2012
The fund reports a complete list of its holdings in regulatory filings four times in each fiscal year, at the quarter-ends. For the second and fourth fiscal quarters, the lists appear in the fund’s semiannual and annual reports to shareholders. For the first and third fiscal quarters, the fund files the lists with the Securities and Exchange Commission on Form N-Q. Shareholders can look up the fund’s Forms N-Q on the SEC’s website at sec.gov. Forms N-Q may also be reviewed and copied at the SEC’s Public Reference Room (see the back cover of this report for further information).
| | |
| | | Market |
| | | Value |
| | Shares | ($000) |
| Investment Companies (100.0%) | | |
| U.S. Stock Fund (30.1%) | | |
| Vanguard Total Stock Market Index Fund Investor Shares | 51,686,723 | 1,852,452 |
| |
| International Stock Fund (13.2%) | | |
| Vanguard Total International Stock Index Fund Investor Shares | 56,967,820 | 810,652 |
| |
| Bond Funds (55.1%) | | |
| 1 Vanguard Total Bond Market II Index Fund Investor Shares | 232,717,452 | 2,578,510 |
| Vanguard Inflation-Protected Securities Fund Investor Shares | 54,947,129 | 815,965 |
| | | 3,394,475 |
| Money Market Fund (1.6%) | | |
| Vanguard Prime Money Market Fund Investor Shares | 96,748,216 | 96,748 |
| Total Investment Companies (Cost $5,557,780) | | 6,154,327 |
| Other Assets and Liabilities (0.0%) | | |
| Other Assets | | 15,703 |
| Liabilities | | (14,725) |
| | | 978 |
| Net Assets (100%) | | |
| Applicable to 251,712,062 outstanding $.001 par value shares of | | |
| beneficial interest (unlimited authorization) | | 6,155,305 |
| Net Asset Value Per Share | | $24.45 |
| |
| |
| At September 30, 2012, net assets consisted of: | | |
| | | Amount |
| | | ($000) |
| Paid-in Capital | | 5,535,540 |
| Undistributed Net Investment Income | | 86,217 |
| Accumulated Net Realized Losses | | (62,999) |
| Unrealized Appreciation (Depreciation) | | 596,547 |
| Net Assets | | 6,155,305 |
See Note A in Notes to Financial Statements.
1 Affiliated fund available only to Vanguard funds and certain trusts and accounts managed by Vanguard.
See accompanying Notes, which are an integral part of the Financial Statements.
22
| |
| Target Retirement 2010 Fund | |
| |
| |
| Statement of Operations | |
| |
| | Year Ended |
| | September 30, 2012 |
| | ($000) |
| Investment Income | |
| Income | |
| Income Distributions Received | 138,726 |
| Net Investment Income—Note B | 138,726 |
| Realized Net Gain (Loss) | |
| Capital Gain Distributions Received | 23,070 |
| Investment Securities Sold | 15,217 |
| Realized Net Gain (Loss) | 38,287 |
| Change in Unrealized Appreciation (Depreciation) of Investment Securities | 561,971 |
| Net Increase (Decrease) in Net Assets Resulting from Operations | 738,984 |
See accompanying Notes, which are an integral part of the Financial Statements.
23
| | |
| Target Retirement 2010 Fund | | |
| |
| |
| Statement of Changes in Net Assets | | |
| |
| | Year Ended September 30, |
| | 2012 | 2011 |
| | ($000) | ($000) |
| Increase (Decrease) in Net Assets | | |
| Operations | | |
| Net Investment Income | 138,726 | 116,426 |
| Realized Net Gain (Loss) | 38,287 | (17,864) |
| Change in Unrealized Appreciation (Depreciation) | 561,971 | (1,898) |
| Net Increase (Decrease) in Net Assets Resulting from Operations | 738,984 | 96,664 |
| Distributions | | |
| Net Investment Income | (132,211) | (100,684) |
| Realized Capital Gain1 | (8,208) | (8,472) |
| Total Distributions | (140,419) | (109,156) |
| Capital Share Transactions | | |
| Issued | 1,935,277 | 1,835,448 |
| Issued in Lieu of Cash Distributions | 138,772 | 107,920 |
| Redeemed | (1,264,685) | (1,430,032) |
| Net Increase (Decrease) from Capital Share Transactions | 809,364 | 513,336 |
| Total Increase (Decrease) | 1,407,929 | 500,844 |
| Net Assets | | |
| Beginning of Period | 4,747,376 | 4,246,532 |
| End of Period2 | 6,155,305 | 4,747,376 |
1 Includes fiscal 2012 and 2011 short-term gain distributions totaling $8,208,000 and $8,472,000, respectively. Short-term gain distributions are treated as ordinary income dividends for tax purposes.
2 Net Assets—End of Period includes undistributed net investment income of $86,217,000 and $79,702,000.
See accompanying Notes, which are an integral part of the Financial Statements.
24
| | | | | |
| Target Retirement 2010 Fund | | | | | |
| |
| |
| Financial Highlights | | | | | |
| |
| |
| |
| For a Share Outstanding | | | Year Ended September 30, |
| Throughout Each Period | 2012 | 2011 | 2010 | 2009 | 2008 |
| Net Asset Value, Beginning of Period | $21.91 | $21.87 | $20.39 | $20.47 | $23.54 |
| Investment Operations | | | | | |
| Net Investment Income | .571 | .5601 | .520 | .553 | .7441 |
| Capital Gain Distributions Received | .100 | .0561 | — | — | — |
| Net Realized and Unrealized Gain (Loss) | | | | | |
| on Investments | 2.502 | (.022) | 1.455 | .046 | (3.354) |
| Total from Investment Operations | 3.173 | .594 | 1.975 | .599 | (2.610) |
| Distributions | | | | | |
| Dividends from Net Investment Income | (.596) | (.511) | (.495) | (.679) | (.460) |
| Distributions from Realized Capital Gains | (.037) | (.043) | — | — | — |
| Total Distributions | (.633) | (.554) | (.495) | (.679) | (.460) |
| Net Asset Value, End of Period | $24.45 | $21.91 | $21.87 | $20.39 | $20.47 |
| |
| Total Return2 | 14.74% | 2.68% | 9.83% | 3.47% | -11.30% |
| |
| Ratios/Supplemental Data | | | | | |
| Net Assets, End of Period (Millions) | $6,155 | $4,747 | $4,247 | $3,065 | $2,567 |
| Ratio of Total Expenses to | | | | | |
| Average Net Assets | — | — | — | — | — |
| Acquired Fund Fees and Expenses | 0.16% | 0.17% | 0.17% | 0.21% | 0.19% |
| Ratio of Net Investment Income to | | | | | |
| Average Net Assets | 2.51% | 2.46% | 2.67% | 3.15% | 3.34% |
| Portfolio Turnover Rate | 12% | 27%3 | 19% | 41%4 | 18% |
1 Calculated based on average shares outstanding.
2 Total returns do not include account service fees that may have applied in the periods shown. Fund prospectuses provide information about any applicable account service fees.
3 Excludes the value of mutual fund shares delivered and received in connection with a change in the fund’s international equity investments from Vanguard European, Pacific, and Emerging Markets Stock Index Funds to Vanguard Total International Stock Index Fund because those transactions were effected in kind and did not cause the fund to incur transaction costs.
4 Excludes the value of mutual fund shares delivered and received in connection with a change in the fund’s bond investments from Vanguard Total Bond Market Index Fund to Vanguard Total Bond Market II Index Fund because those transactions were effected in kind and did not cause the fund to incur transaction costs.
See accompanying Notes, which are an integral part of the Financial Statements.
25
Target Retirement 2010 Fund
Notes to Financial Statements
Vanguard Target Retirement 2010 Fund is registered under the Investment Company Act of 1940 as an open-end investment company, or mutual fund. The fund follows a balanced investment strategy by investing in selected Vanguard funds to achieve its targeted allocation of assets to U.S. stocks, international stocks, bonds, and short-term reserves.
A. The following significant accounting policies conform to generally accepted accounting principles for U.S. mutual funds. The fund consistently follows such policies in preparing its financial statements.
1. Security Valuation: Investments are valued at the net asset value of each underlying Vanguard fund determined as of the close of the New York Stock Exchange (generally 4 p.m., Eastern time) on the valuation date.
2. Federal Income Taxes: The fund intends to continue to qualify as a regulated investment company and distribute all of its taxable income. Management has analyzed the fund’s tax positions taken for all open federal income tax years (September 30, 2009–2012), and has concluded that no provision for federal income tax is required in the fund’s financial statements.
3. Distributions: Distributions to shareholders are recorded on the ex-dividend date.
4. Other: Income and capital gain distributions received are recorded on the ex-dividend date. Security transactions are accounted for on the date securities are bought or sold. Costs used to determine realized gains (losses) on the sale of investment securities are those of the specific securities sold.
B. Under a service agreement, The Vanguard Group furnishes investment advisory, corporate management, administrative, marketing, and distribution services to the fund. The service agreement provides that the fund’s expenses may be reduced or eliminated to the extent of savings realized by the Vanguard funds by the operation of the fund. Accordingly, all incremental expenses for services provided by Vanguard and all other expenses incurred by the fund during the year ended September 30, 2012, were borne by the funds in which the fund invests. The fund’s trustees and officers are also directors and officers of Vanguard and the funds in which the fund invests.
C. Various inputs may be used to determine the value of the fund’s investments. These inputs are summarized in three broad levels for financial statement purposes. The inputs or methodologies used to value securities are not necessarily an indication of the risk associated with investing in those securities.
Level 1—Quoted prices in active markets for identical securities.
Level 2—Other significant observable inputs (including quoted prices for similar securities, interest rates, prepayment speeds, credit risk, etc.).
Level 3—Significant unobservable inputs (including the fund’s own assumptions used to determine the fair value of investments).
At September 30, 2012, 100% of the market value of the fund’s investments was determined based on Level 1 inputs.
D. Distributions are determined on a tax basis and may differ from net investment income and realized capital gains for financial reporting purposes. Differences may be permanent or temporary. Permanent differences are reclassified among capital accounts in the financial statements to reflect their tax character. Temporary differences arise when certain items of income, expense, gain, or loss are recognized in different periods for financial statement and tax purposes; these differences will reverse at some time in the future. Differences in classification may also result from the treatment of short-term gains as ordinary income for tax purposes.
26
Target Retirement 2010 Fund
For tax purposes, at September 30, 2012, the fund had $87,995,000 of ordinary income available for distribution. Tax-basis amounts required to be distributed in December 2011 included short term gain distributions received from Vanguard Total Bond Market II Index Fund in December 2011. Short-term capital gain distributions received are treated as ordinary income for tax purposes, and cannot be offset by capital losses. At September 30, 2012, the fund had available capital losses totaling $63,820,000 to offset future net capital gains. Of this amount, $47,220,000 is subject to expiration dates; $5,639,000 may be used to offset future net capital gains through September 30, 2017, $26,042,000 through September 30, 2018, and $15,539,000 through September 30, 2019. Capital losses of $16,600,000 realized beginning in fiscal 2012 may be carried forward indefinitely under the Regulated Investment Company Modernization Act of 2010, but must be used before any expiring loss carryforwards.
At September 30, 2012, the cost of investment securities for tax purposes was $5,558,737,000. Net unrealized appreciation of investment securities for tax purposes was $595,590,000, consisting of unrealized gains of $634,125,000 on securities that had risen in value since their purchase and $38,535,000 in unrealized losses on securities that had fallen in value since their purchase.
E. During the year ended September 30, 2012, the fund purchased $1,509,598,000 of investment securities and sold $679,859,000 of investment securities, other than temporary cash investments.
F. Capital shares issued and redeemed were:
| | |
| | Year Ended September 30, |
| | 2012 | 2011 |
| | Shares | Shares |
| | (000) | (000) |
| Issued | 82,983 | 80,703 |
| Issued in Lieu of Cash Distributions | 6,184 | 4,848 |
| Redeemed | (54,110) | (63,101) |
| Net Increase (Decrease) in Shares Outstanding | 35,057 | 22,450 |
G. In preparing the financial statements as of September 30, 2012, management considered the impact of subsequent events for potential recognition or disclosure in these financial statements.
27
Target Retirement 2015 Fund
Fund Profile
As of September 30, 2012
| |
| Total Fund Characteristics | |
| Ticker Symbol | VTXVX |
| 30-Day SEC Yield | 2.03% |
| Acquired Fund Fees and Expenses1 | 0.17% |
| |
| Allocation to Underlying Vanguard Funds | |
| Vanguard Total Bond Market II Index Fund | |
| Investor Shares | 40.3% |
| Vanguard Total Stock Market Index Fund | |
| Investor Shares | 38.6 |
| Vanguard Total International Stock Index | |
| Fund Investor Shares | 16.7 |
| Vanguard Inflation-Protected Securities | |
| Fund Investor Shares | 4.4 |
| | |
| Total Fund Volatility Measures | |
| | Target 2015 | MSCI US |
| | Composite | Broad Market |
| | Index | Index |
| R-Squared | 1.00 | 0.97 |
| Beta | 0.99 | 0.57 |
These measures show the degree and timing of the fund’s fluctuations compared with the indexes over 36 months.
Fund Asset Allocation
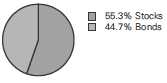
1 This figure—drawn from the prospectus dated January 26, 2012—represents an estimate of the weighted average of the expense ratios and any transaction fees charged by the underlying mutual funds (the ”acquired” funds) in which the Target Retirement 2015 Fund invests. The fund does not charge any expenses or fees of its own. For the fiscal year ended September 30, 2012, the acquired fund fees and expenses were 0.16%.
28
Target Retirement 2015 Fund
Performance Summary
All of the returns in this report represent past performance, which is not a guarantee of future results that may be achieved by the fund. (Current performance may be lower or higher than the performance data cited. For performance data current to the most recent month-end, visit our website at vanguard.com/performance.) Note, too, that both investment returns and principal value can fluctuate widely, so an investor’s shares, when sold, could be worth more or less than their original cost. The returns shown do not reflect taxes that a shareholder would pay on fund distributions or on the sale of fund shares.
Cumulative Performance: October 27, 2003, Through September 30, 2012
Initial Investment of $10,000
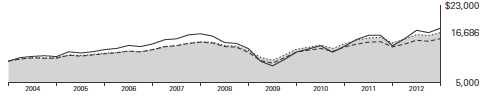
| | | | |
| | | Average Annual Total Returns | |
| | Periods Ended September 30, 2012 | |
| | | | Since | Final Value |
| | One | Five | Inception | of a $10,000 |
| | Year | Years | (10/27/2003) | Investment |
| Target Retirement 2015 Fund | 16.76% | 2.88% | 5.90% | $16,686 |
| Target 2015 Composite Index | 16.87 | 2.79 | 5.87 | 16,635 |
| Mixed-Asset Target 2015 Funds | | | | |
| Average | 14.43 | 1.11 | 4.82 | 15,219 |
| MSCI US Broad Market Index | 30.30 | 1.55 | 6.58 | 17,664 |
For a benchmark description, see the Glossary.
Mixed-Asset Target 2015 Funds Average: Derived from data provided by Lipper Inc.
"Since Inception" performance is calculated from the inception date for both the fund and its comparative standards.
See Financial Highlights for dividend and capital gains information.
29
Target Retirement 2015 Fund
Fiscal-Year Total Returns (%): October 27, 2003, Through September 30, 2012
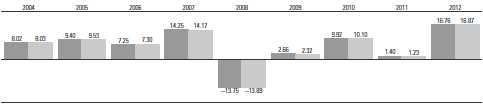
|
| Target Retirement 2015 Fund |
| Target 2015 Composite Index |
| For a benchmark description, see the Glossary. |
30
Target Retirement 2015 Fund
Financial Statements
Statement of Net Assets
As of September 30, 2012
The fund reports a complete list of its holdings in regulatory filings four times in each fiscal year, at the quarter-ends. For the second and fourth fiscal quarters, the lists appear in the fund’s semiannual and annual reports to shareholders. For the first and third fiscal quarters, the fund files the lists with the Securities and Exchange Commission on Form N-Q. Shareholders can look up the fund’s Forms N-Q on the SEC’s website at sec.gov. Forms N-Q may also be reviewed and copied at the SEC’s Public Reference Room (see the back cover of this report for further information).
| | |
| | | Market |
| | | Value |
| | Shares | ($000) |
| Investment Companies (99.9%) | | |
| U.S. Stock Fund (38.6%) | | |
| Vanguard Total Stock Market Index Fund Investor Shares | 181,437,430 | 6,502,717 |
| |
| International Stock Fund (16.7%) | | |
| Vanguard Total International Stock Index Fund Investor Shares | 197,496,533 | 2,810,377 |
| |
| Bond Funds (44.6%) | | |
| 1 Vanguard Total Bond Market II Index Fund Investor Shares | 610,611,235 | 6,765,572 |
| Vanguard Inflation-Protected Securities Fund Investor Shares | 50,410,837 | 748,601 |
| | | 7,514,173 |
| Total Investment Companies (Cost $14,911,232) | | 16,827,267 |
| Other Assets and Liabilities (0.1%) | | |
| Other Assets | | 60,245 |
| Liabilities | | (49,215) |
| | | 11,030 |
| Net Assets (100%) | | |
| Applicable to 1,243,979,492 outstanding $.001 par value shares of | | |
| beneficial interest (unlimited authorization) | | 16,838,297 |
| Net Asset Value Per Share | | $13.54 |
| |
| |
| At September 30, 2012, net assets consisted of: | | |
| | | Amount |
| | | ($000) |
| Paid-in Capital | | 14,738,913 |
| Undistributed Net Investment Income | | 247,068 |
| Accumulated Net Realized Losses | | (63,719) |
| Unrealized Appreciation (Depreciation) | | 1,916,035 |
| Net Assets | | 16,838,297 |
See Note A in Notes to Financial Statements.
1 Affiliated fund available only to Vanguard funds and certain trusts and accounts managed by Vanguard.
See accompanying Notes, which are an integral part of the Financial Statements.
31
| |
| Target Retirement 2015 Fund | |
| |
| |
| Statement of Operations | |
| |
| | Year Ended |
| | September 30, 2012 |
| | ($000) |
| Investment Income | |
| Income | |
| Income Distributions Received | 394,621 |
| Net Investment Income—Note B | 394,621 |
| Realized Net Gain (Loss) | |
| Capital Gain Distributions Received | 61,580 |
| Investment Securities Sold | 29,798 |
| Realized Net Gain (Loss) | 91,378 |
| Change in Unrealized Appreciation (Depreciation) of Investment Securities | 1,819,354 |
| Net Increase (Decrease) in Net Assets Resulting from Operations | 2,305,353 |
See accompanying Notes, which are an integral part of the Financial Statements.
32
| | |
| Target Retirement 2015 Fund | | |
| |
| |
| Statement of Changes in Net Assets | | |
| |
| | Year Ended September 30, |
| | 2012 | 2011 |
| | ($000) | ($000) |
| Increase (Decrease) in Net Assets | | |
| Operations | | |
| Net Investment Income | 394,621 | 311,191 |
| Realized Net Gain (Loss) | 91,378 | 68,394 |
| Change in Unrealized Appreciation (Depreciation) | 1,819,354 | (276,867) |
| Net Increase (Decrease) in Net Assets Resulting from Operations | 2,305,353 | 102,718 |
| Distributions | | |
| Net Investment Income | (356,688) | (288,841) |
| Realized Capital Gain1 | (22,792) | (25,117) |
| Total Distributions | (379,480) | (313,958) |
| Capital Share Transactions | | |
| Issued | 4,080,711 | 4,194,618 |
| Issued in Lieu of Cash Distributions | 375,872 | 311,203 |
| Redeemed | (2,978,853) | (3,325,763) |
| Net Increase (Decrease) from Capital Share Transactions | 1,477,730 | 1,180,058 |
| Total Increase (Decrease) | 3,403,603 | 968,818 |
| Net Assets | | |
| Beginning of Period | 13,434,694 | 12,465,876 |
| End of Period2 | 16,838,297 | 13,434,694 |
1 Includes fiscal 2012 and 2011 short-term gain distributions totaling $22,792,000 and $25,117,000, respectively. Short-term gain distributionsare treated as ordinary income dividends for tax purposes.
2 Net Assets—End of Period includes undistributed net investment income of $247,068,000 and $209,135,000.
See accompanying Notes, which are an integral part of the Financial Statements.
33
| | | | | |
| Target Retirement 2015 Fund | | | | | |
| |
| |
| Financial Highlights | | | | | |
| |
| |
| |
| For a Share Outstanding | | | Year Ended September 30, |
| Throughout Each Period | 2012 | 2011 | 2010 | 2009 | 2008 |
| Net Asset Value, Beginning of Period | $11.91 | $12.03 | $11.21 | $11.34 | $13.49 |
| Investment Operations | | | | | |
| Net Investment Income | .327 | .2831 | .285 | .307 | .3801 |
| Capital Gain Distributions Received | .053 | .0311 | — | — | — |
| Net Realized and Unrealized Gain (Loss) | | | | | |
| on Investments | 1.583 | (.134) | .811 | (.072) | (2.190) |
| Total from Investment Operations | 1.963 | .180 | 1.096 | .235 | (1.810) |
| Distributions | | | | | |
| Dividends from Net Investment Income | (.313) | (.276) | (.276) | (.365) | (.340) |
| Distributions from Realized Capital Gains | (.020) | (.024) | — | — | — |
| Total Distributions | (.333) | (.300) | (.276) | (.365) | (.340) |
| Net Asset Value, End of Period | $13.54 | $11.91 | $12.03 | $11.21 | $11.34 |
| |
| Total Return2 | 16.76% | 1.40% | 9.92% | 2.66% | -13.75% |
| |
| Ratios/Supplemental Data | | | | | |
| Net Assets, End of Period (Millions) | $16,838 | $13,435 | $12,466 | $9,507 | $7,804 |
| Ratio of Total Expenses to | | | | | |
| Average Net Assets | — | — | — | — | — |
| Acquired Fund Fees and Expenses | 0.16% | 0.17% | 0.17% | 0.21% | 0.18% |
| Ratio of Net Investment Income to | | | | | |
| Average Net Assets | 2.59% | 2.24% | 2.62% | 3.31% | 3.02% |
| Portfolio Turnover Rate | 13% | 27%3 | 19% | 37%4 | 24% |
1 Calculated based on average shares outstanding.
2 Total returns do not include account service fees that may have applied in the periods shown. Fund prospectuses provide information about any applicable account service fees.
3 Excludes the value of mutual fund shares delivered and received in connection with a change in the fund’s international equity investments from Vanguard European, Pacific, and Emerging Markets Stock Index Funds to Vanguard Total International Stock Index Fund because those transactions were effected in kind and did not cause the fund to incur transaction costs.
4 Excludes the value of mutual fund shares delivered and received in connection with a change in the fund’s bond investments from Vanguard Total Bond Market Index Fund to Vanguard Total Bond Market II Index Fund because those transactions were effected in kind and did not cause the fund to incur transaction costs.
See accompanying Notes, which are an integral part of the Financial Statements.
34
Target Retirement 2015 Fund
Notes to Financial Statements
Vanguard Target Retirement 2015 Fund is registered under the Investment Company Act of 1940 as an open-end investment company, or mutual fund. The fund follows a balanced investment strategy by investing in selected Vanguard funds to achieve its targeted allocation of assets to U.S. stocks, international stocks, and bonds.
A. The following significant accounting policies conform to generally accepted accounting principles for U.S. mutual funds. The fund consistently follows such policies in preparing its financial statements.
1. Security Valuation: Investments are valued at the net asset value of each underlying Vanguard fund determined as of the close of the New York Stock Exchange (generally 4 p.m., Eastern time) on the valuation date.
2. Federal Income Taxes: The fund intends to continue to qualify as a regulated investment company and distribute all of its taxable income. Management has analyzed the fund’s tax positions taken for all open federal income tax years (September 30, 2009–2012), and has concluded that no provision for federal income tax is required in the fund’s financial statements.
3. Distributions: Distributions to shareholders are recorded on the ex-dividend date.
4. Other: Income and capital gain distributions received are recorded on the ex-dividend date. Security transactions are accounted for on the date securities are bought or sold. Costs used to determine realized gains (losses) on the sale of investment securities are those of the specific securities sold.
B. Under a service agreement, The Vanguard Group furnishes investment advisory, corporate management, administrative, marketing, and distribution services to the fund. The service agreement provides that the fund’s expenses may be reduced or eliminated to the extent of savings realized by the Vanguard funds by the operation of the fund. Accordingly, all incremental expenses for services provided by Vanguard and all other expenses incurred by the fund during the year ended September 30, 2012, were borne by the funds in which the fund invests. The fund’s trustees and officers are also directors and officers of Vanguard and the funds in which the fund invests.
C. Various inputs may be used to determine the value of the fund’s investments. These inputs are summarized in three broad levels for financial statement purposes. The inputs or methodologies used to value securities are not necessarily an indication of the risk associated with investing in those securities.
Level 1—Quoted prices in active markets for identical securities.
Level 2—Other significant observable inputs (including quoted prices for similar securities, interest rates, prepayment speeds, credit risk, etc.).
Level 3—Significant unobservable inputs (including the fund’s own assumptions used to determine the fair value of investments).
At September 30, 2012, 100% of the market value of the fund’s investments was determined based on Level 1 inputs.
D. Distributions are determined on a tax basis and may differ from net investment income and realized capital gains for financial reporting purposes. Differences may be permanent or temporary. Permanent differences are reclassified among capital accounts in the financial statements to reflect their tax character. Temporary differences arise when certain items of income, expense, gain, or loss are recognized in different periods for financial statement and tax purposes; these differences will reverse at some time in the future. Differences in classification may also result from the treatment of short-term gains as ordinary income for tax purposes.
35
Target Retirement 2015 Fund
For tax purposes, at September 30, 2012, the fund had $251,411,000 of ordinary income available for distribution. Tax-basis amounts required to be distributed in December 2011 included short term gain distributions received from Vanguard Total Bond Market II Index Fund in December 2011. Short-term capital gain distributions received are treated as ordinary income for tax purposes, and cannot be offset by capital losses. At September 30, 2012, the fund had available capital losses totaling $64,723,000 to offset future net capital gains. Of this amount, $27,719,000 is subject to expiration on September 30, 2018. Capital losses of $37,004,000 realized beginning in fiscal 2012 may be carried forward indefinitely under the Regulated Investment Company Modernization Act of 2010, but must be used before any expiring loss carryforwards.
At September 30, 2012, the cost of investment securities for tax purposes was $14,914,571,000. Net unrealized appreciation of investment securities for tax purposes was $1,912,696,000, consisting of unrealized gains of $2,056,887,000 on securities that had risen in value since their purchase and $144,191,000 in unrealized losses on securities that had fallen in value since their purchase.
E. During the year ended September 30, 2012, the fund purchased $3,522,632,000 of investment securities and sold $1,973,507,000 of investment securities, other than temporary cash investments.
F. Capital shares issued and redeemed were:
| | |
| | Year Ended September 30, |
| | 2012 | 2011 |
| | Shares | Shares |
| | (000) | (000) |
| Issued | 317,087 | 332,265 |
| Issued in Lieu of Cash Distributions | 30,534 | 25,097 |
| Redeemed | (232,130) | (265,009) |
| Net Increase (Decrease) in Shares Outstanding | 115,491 | 92,353 |
G. In preparing the financial statements as of September 30, 2012, management considered the impact of subsequent events for potential recognition or disclosure in these financial statements.
36
Target Retirement 2020 Fund
Fund Profile
As of September 30, 2012
| |
| Total Fund Characteristics | |
| Ticker Symbol | VTWNX |
| 30-Day SEC Yield | 2.01% |
| Acquired Fund Fees and Expenses1 | 0.17% |
| |
| Allocation to Underlying Vanguard Funds | |
| Vanguard Total Stock Market Index Fund | |
| Investor Shares | 44.5% |
| Vanguard Total Bond Market II Index Fund | |
| Investor Shares | 36.3 |
| Vanguard Total International Stock Index | |
| Fund Investor Shares | 19.2 |
| | |
| Total Fund Volatility Measures | |
| | Target 2020 | MSCI US |
| | Composite | Broad Market |
| | Index | Index |
| R-Squared | 1.00 | 0.98 |
| Beta | 1.00 | 0.66 |
These measures show the degree and timing of the fund’s fluctuations compared with the indexes over 36 months.
Fund Asset Allocation
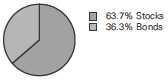
1 This figure—drawn from the prospectus dated January 26, 2012—represents an estimate of the weighted average of the expense ratios and any transaction fees charged by the underlying mutual funds (the ”acquired” funds) in which the Target Retirement 2020 Fund invests. The fund does not charge any expenses or fees of its own. For the fiscal year ended September 30, 2012, the acquired fund fees and expenses were 0.16%.
37
Target Retirement 2020 Fund
Performance Summary
All of the returns in this report represent past performance, which is not a guarantee of future results that may be achieved by the fund. (Current performance may be lower or higher than the performance data cited. For performance data current to the most recent month-end, visit our website at vanguard.com/performance.) Note, too, that both investment returns and principal value can fluctuate widely, so an investor’s shares, when sold, could be worth more or less than their original cost. The returns shown do not reflect taxes that a shareholder would pay on fund distributions or on the sale of fund shares.
Cumulative Performance: June 7, 2006, Through September 30, 2012
Initial Investment of $10,000
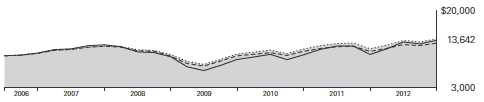
| | | | |
| | | Average Annual Total Returns | |
| | Periods Ended September 30, 2012 | |
| | | | Since | Final Value |
| | One | Five | Inception | of a $10,000 |
| | Year | Years | (6/7/2006) | Investment |
| Target Retirement 2020 Fund | 18.30% | 2.30% | 5.04% | $13,642 |
| Target 2020 Composite Index | 18.62 | 2.36 | 5.10 | 13,694 |
| Mixed-Asset Target 2020 Funds | | | | |
| Average | 16.59 | 1.11 | 3.96 | 12,781 |
| MSCI US Broad Market Index | 30.30 | 1.55 | 4.73 | 13,390 |
For a benchmark description, see the Glossary.
Mixed-Asset Target 2020 Funds Average: Derived from data provided by Lipper Inc.
"Since Inception" performance is calculated from the inception date for both the fund and its comparative standards.
See Financial Highlights for dividend and capital gains information.
38
Target Retirement 2020 Fund
Fiscal-Year Total Returns (%): June 7, 2006, Through September 30, 2012
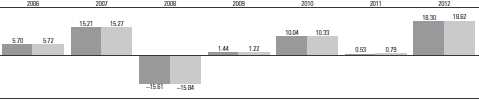
|
| Target Retirement 2020 Fund |
| Target 2020 Composite Index |
| For a benchmark description, see the Glossary. |
39
Target Retirement 2020 Fund
Financial Statements
Statement of Net Assets
As of September 30, 2012
The fund reports a complete list of its holdings in regulatory filings four times in each fiscal year, at the quarter-ends. For the second and fourth fiscal quarters, the lists appear in the fund’s semiannual and annual reports to shareholders. For the first and third fiscal quarters, the fund files the lists with the Securities and Exchange Commission on Form N-Q. Shareholders can look up the fund’s Forms N-Q on the SEC’s website at sec.gov. Forms N-Q may also be reviewed and copied at the SEC’s Public Reference Room (see the back cover of this report for further information).
| | |
| | | Market |
| | | Value |
| | Shares | ($000) |
| Investment Companies (99.9%) | | |
| U.S. Stock Fund (44.5%) | | |
| Vanguard Total Stock Market Index Fund Investor Shares | 199,480,055 | 7,149,365 |
| |
| International Stock Fund (19.1%) | | |
| Vanguard Total International Stock Index Fund Investor Shares | 216,536,307 | 3,081,311 |
| |
| Bond Fund (36.3%) | | |
| 1 Vanguard Total Bond Market II Index Fund Investor Shares | 526,410,612 | 5,832,630 |
| Total Investment Companies (Cost $14,457,483) | | 16,063,306 |
| Other Assets and Liabilities (0.1%) | | |
| Other Assets | | 48,442 |
| Liabilities | | (33,919) |
| | | 14,523 |
| Net Assets (100%) | | |
| Applicable to 668,727,769 outstanding $.001 par value shares of | | |
| beneficial interest (unlimited authorization) | | 16,077,829 |
| Net Asset Value Per Share | | $24.04 |
| |
| |
| At September 30, 2012, net assets consisted of: | | |
| | | Amount |
| | | ($000) |
| Paid-in Capital | | 14,291,664 |
| Undistributed Net Investment Income | | 232,148 |
| Accumulated Net Realized Losses | | (51,806) |
| Unrealized Appreciation (Depreciation) | | 1,605,823 |
| Net Assets | | 16,077,829 |
See Note A in Notes to Financial Statements.
1 Affiliated fund available only to Vanguard funds and certain trusts and accounts managed by Vanguard.
See accompanying Notes, which are an integral part of the Financial Statements.
40
| |
| Target Retirement 2020 Fund | |
| |
| |
| Statement of Operations | |
| |
| | Year Ended |
| | September 30, 2012 |
| | ($000) |
| Investment Income | |
| Income | |
| Income Distributions Received | 359,941 |
| Net Investment Income—Note B | 359,941 |
| Realized Net Gain (Loss) | |
| Capital Gain Distributions Received | 45,477 |
| Investment Securities Sold | 34,418 |
| Realized Net Gain (Loss) | 79,895 |
| Change in Unrealized Appreciation (Depreciation) of Investment Securities | 1,764,009 |
| Net Increase (Decrease) in Net Assets Resulting from Operations | 2,203,845 |
See accompanying Notes, which are an integral part of the Financial Statements.
41
| | |
| Target Retirement 2020 Fund | | |
| |
| |
| Statement of Changes in Net Assets | | |
| |
| | Year Ended September 30, |
| | 2012 | 2011 |
| | ($000) | ($000) |
| Increase (Decrease) in Net Assets | | |
| Operations | | |
| Net Investment Income | 359,941 | 229,705 |
| Realized Net Gain (Loss) | 79,895 | (20,395) |
| Change in Unrealized Appreciation (Depreciation) | 1,764,009 | (332,355) |
| Net Increase (Decrease) in Net Assets Resulting from Operations | 2,203,845 | (123,045) |
| Distributions | | |
| Net Investment Income | (281,924) | (195,538) |
| Realized Capital Gain1 | (17,036) | (15,414) |
| Total Distributions | (298,960) | (210,952) |
| Capital Share Transactions | | |
| Issued | 4,865,832 | 4,414,516 |
| Issued in Lieu of Cash Distributions | 296,988 | 209,835 |
| Redeemed | (2,021,399) | (2,149,043) |
| Net Increase (Decrease) from Capital Share Transactions | 3,141,421 | 2,475,308 |
| Total Increase (Decrease) | 5,046,306 | 2,141,311 |
| Net Assets | | |
| Beginning of Period | 11,031,523 | 8,890,212 |
| End of Period2 | 16,077,829 | 11,031,523 |
1 Includes fiscal 2012 and 2011 short-term gain distributions totaling $17,036,000 and $15,414,000, respectively. Short-term gain distributionsare treated as ordinary income dividends for tax purposes.
2 Net Assets—End of Period includes undistributed net investment income of $232,148,000 and $154,131,000.
See accompanying Notes, which are an integral part of the Financial Statements.
42
| | | | | |
| Target Retirement 2020 Fund | | | | | |
| |
| |
| Financial Highlights | | | | | |
| |
| |
| |
| For a Share Outstanding | | | Year Ended September 30, |
| Throughout Each Period | 2012 | 2011 | 2010 | 2009 | 2008 |
| Net Asset Value, Beginning of Period | $20.83 | $21.17 | $19.66 | $20.03 | $24.15 |
| Investment Operations | | | | | |
| Net Investment Income | .569 | .4731 | .5101 | .5391 | .6191 |
| Capital Gain Distributions Received | .079 | .0441 | — | — | — |
| Net Realized and Unrealized Gain (Loss) | | | | | |
| on Investments | 3.106 | (.378) | 1.440 | (.360) | (4.329) |
| Total from Investment Operations | 3.754 | .139 | 1.950 | .179 | (3.710) |
| Distributions | | | | | |
| Dividends from Net Investment Income | (.513) | (.444) | (.440) | (.549) | (.410) |
| Distributions from Realized Capital Gains | (.031) | (.035) | — | — | — |
| Total Distributions | (.544) | (.479) | (.440) | (.549) | (.410) |
| Net Asset Value, End of Period | $24.04 | $20.83 | $21.17 | $19.66 | $20.03 |
| |
| Total Return2 | 18.30% | 0.53% | 10.04% | 1.44% | -15.61% |
| |
| Ratios/Supplemental Data | | | | | |
| Net Assets, End of Period (Millions) | $16,078 | $11,032 | $8,890 | $5,706 | $3,859 |
| Ratio of Total Expenses to | | | | | |
| Average Net Assets | — | — | — | — | — |
| Acquired Fund Fees and Expenses | 0.16% | 0.17% | 0.17% | 0.21% | 0.19% |
| Ratio of Net Investment Income to | | | | | |
| Average Net Assets | 2.62% | 2.11% | 2.51% | 3.19% | 2.79% |
| Portfolio Turnover Rate | 8% | 23%3 | 14% | 27%4 | 15% |
1 Calculated based on average shares outstanding.
2 Total returns do not include account service fees that may have applied in the periods shown. Fund prospectuses provide information about any applicable account service fees.
3 Excludes the value of mutual fund shares delivered and received in connection with a change in the fund’s international equity investments from Vanguard European, Pacific, and Emerging Markets Stock Index Funds to Vanguard Total International Stock Index Fund because those transactions were effected in kind and did not cause the fund to incur transaction costs.
4 Excludes the value of mutual fund shares delivered and received in connection with a change in the fund’s bond investments from Vanguard Total Bond Market Index Fund to Vanguard Total Bond Market II Index Fund because those transactions were effected in kind and did not cause the fund to incur transaction costs.
See accompanying Notes, which are an integral part of the Financial Statements.
43
Target Retirement 2020 Fund
Notes to Financial Statements
Vanguard Target Retirement 2020 Fund is registered under the Investment Company Act of 1940 as an open-end investment company, or mutual fund. The fund follows a balanced investment strategy by investing in selected Vanguard funds to achieve its targeted allocation of assets to U.S. stocks, international stocks, and bonds.
A. The following significant accounting policies conform to generally accepted accounting principles for U.S. mutual funds. The fund consistently follows such policies in preparing its financial statements.
1. Security Valuation: Investments are valued at the net asset value of each underlying Vanguard fund determined as of the close of the New York Stock Exchange (generally 4 p.m., Eastern time) on the valuation date.
2. Federal Income Taxes: The fund intends to continue to qualify as a regulated investment company and distribute all of its taxable income. Management has analyzed the fund’s tax positions taken for all open federal income tax years (September 30, 2009–2012), and has concluded that no provision for federal income tax is required in the fund’s financial statements.
3. Distributions: Distributions to shareholders are recorded on the ex-dividend date.
4. Other: Income and capital gain distributions received are recorded on the ex-dividend date. Security transactions are accounted for on the date securities are bought or sold. Costs used to determine realized gains (losses) on the sale of investment securities are those of the specific securities sold.
B. Under a service agreement, The Vanguard Group furnishes investment advisory, corporate management, administrative, marketing, and distribution services to the fund. The service agreement provides that the fund’s expenses may be reduced or eliminated to the extent of savings realized by the Vanguard funds by the operation of the fund. Accordingly, all incremental expenses for services provided by Vanguard and all other expenses incurred by the fund during the year ended September 30, 2012, were borne by the funds in which the fund invests. The fund’s trustees and officers are also directors and officers of Vanguard and the funds in which the fund invests.
C. Various inputs may be used to determine the value of the fund’s investments. These inputs are summarized in three broad levels for financial statement purposes. The inputs or methodologies used to value securities are not necessarily an indication of the risk associated with investing in those securities.
Level 1—Quoted prices in active markets for identical securities.
Level 2—Other significant observable inputs (including quoted prices for similar securities, interest rates, prepayment speeds, credit risk, etc.).
Level 3—Significant unobservable inputs (including the fund’s own assumptions used to determine the fair value of investments).
At September 30, 2012, 100% of the market value of the fund’s investments was determined based on Level 1 inputs.
D. Distributions are determined on a tax basis and may differ from net investment income and realized capital gains for financial reporting purposes. Differences may be permanent or temporary. Permanent differences are reclassified among capital accounts in the financial statements to reflect their tax character. Temporary differences arise when certain items of income, expense, gain, or loss are recognized in different periods for financial statement and tax purposes; these differences will reverse at some time in the future. Differences in classification may also result from the treatment of short-term gains as ordinary income for tax purposes.
44
Target Retirement 2020 Fund
For tax purposes, at September 30, 2012, the fund had $235,551,000 of ordinary income available for distribution. Tax-basis amounts required to be distributed in December 2011 included short term gain distributions received from Vanguard Total Bond Market II Index Fund in December 2011. Short-term capital gain distributions received are treated as ordinary income for tax purposes, and cannot be offset by capital losses. At September 30, 2012, the fund had available capital losses totaling $46,452,000 to offset future net capital gains. Of this amount, $32,992,000 is subject to expiration dates; $6,167,000 may be used to offset future net capital gains through September 30, 2017, $21,253,000 through September 30, 2018, and $5,572,000 through September 30, 2019. Capital losses of $13,460,000 realized beginning in fiscal 2012 may be carried forward indefinitely under the Regulated Investment Company Modernization Act of 2010, but must be used before any expiring loss carryforwards.
At September 30, 2012, the cost of investment securities for tax purposes was $14,466,240,000. Net unrealized appreciation of investment securities for tax purposes was $1,597,066,000, consisting of unrealized gains of $1,738,888,000 on securities that had risen in value since their purchase and $141,822,000 in unrealized losses on securities that had fallen in value since their purchase.
E. During the year ended September 30, 2012, the fund purchased $4,282,042,000 of investment securities and sold $1,041,281,000 of investment securities, other than temporary cash investments.
F. Capital shares issued and redeemed were:
| | |
| | Year Ended September 30, |
| | 2012 | 2011 |
| | Shares | Shares |
| | (000) | (000) |
| Issued | 213,996 | 196,781 |
| Issued in Lieu of Cash Distributions | 13,680 | 9,508 |
| Redeemed | (88,615) | (96,606) |
| Net Increase (Decrease) in Shares Outstanding | 139,061 | 109,683 |
G. In preparing the financial statements as of September 30, 2012, management considered the impact of subsequent events for potential recognition or disclosure in these financial statements.
45
Target Retirement 2025 Fund
Fund Profile
As of September 30, 2012
| |
| Total Fund Characteristics | |
| Ticker Symbol | VTTVX |
| 30-Day SEC Yield | 2.00% |
| Acquired Fund Fees and Expenses1 | 0.18% |
| |
| Allocation to Underlying Vanguard Funds | |
| Vanguard Total Stock Market Index Fund | |
| Investor Shares | 49.8% |
| Vanguard Total Bond Market II Index Fund | |
| Investor Shares | 28.6 |
| Vanguard Total International Stock Index | |
| Fund Investor Shares | 21.6 |
| | |
| Total Fund Volatility Measures | |
| | Target 2025 | MSCI US |
| | Composite | Broad Market |
| | Index | Index |
| R-Squared | 1.00 | 0.98 |
| Beta | 1.00 | 0.75 |
These measures show the degree and timing of the fund’s fluctuations compared with the indexes over 36 months.
Fund Asset Allocation
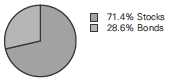
1 This figure—drawn from the prospectus dated January 26, 2012—represents an estimate of the weighted average of the expense ratios and any transaction fees charged by the underlying mutual funds (the ”acquired” funds) in which the Target Retirement 2025 Fund invests. The fund does not charge any expenses or fees of its own. For the fiscal year ended September 30, 2012, the acquired fund fees and expenses were 0.17%.
46
Target Retirement 2025 Fund
Performance Summary
All of the returns in this report represent past performance, which is not a guarantee of future results that may be achieved by the fund. (Current performance may be lower or higher than the performance data cited. For performance data current to the most recent month-end, visit our website at vanguard.com/performance.) Note, too, that both investment returns and principal value can fluctuate widely, so an investor’s shares, when sold, could be worth more or less than their original cost. The returns shown do not reflect taxes that a shareholder would pay on fund distributions or on the sale of fund shares.
Cumulative Performance: October 27, 2003, Through September 30, 2012
Initial Investment of $10,000
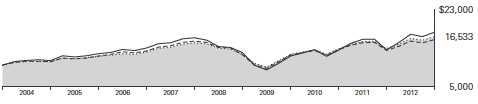
| | | | |
| | | Average Annual Total Returns | |
| | Periods Ended September 30, 2012 | |
| | | | Since | Final Value |
| | One | Five | Inception | of a $10,000 |
| | Year | Years | (10/27/2003) | Investment |
| Target Retirement 2025 Fund | 19.89% | 1.70% | 5.79% | $16,533 |
| Target 2025 Composite Index | 20.13 | 1.79 | 5.85 | 16,614 |
| Mixed-Asset Target 2025 Funds | | | | |
| Average | 18.71 | 0.46 | 5.37 | 15,947 |
| MSCI US Broad Market Index | 30.30 | 1.55 | 6.58 | 17,664 |
For a benchmark description, see the Glossary.
Mixed-Asset Target 2025 Funds Average: Derived from data provided by Lipper Inc.
"Since Inception" performance is calculated from the inception date for both the fund and its comparative standards.
See Financial Highlights for dividend and capital gains information.
47
Target Retirement 2025 Fund
Fiscal-Year Total Returns (%): October 27, 2003, Through September 30, 2012
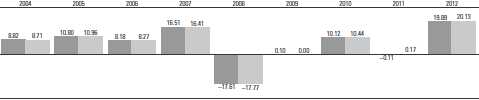
|
| Target Retirement 2025 Fund |
| Target 2025 Composite Index |
| For a benchmark description, see the Glossary. |
48
Target Retirement 2025 Fund
Financial Statements
Statement of Net Assets
As of September 30, 2012
The fund reports a complete list of its holdings in regulatory filings four times in each fiscal year, at the quarter-ends. For the second and fourth fiscal quarters, the lists appear in the fund’s semiannual and annual reports to shareholders. For the first and third fiscal quarters, the fund files the lists with the Securities and Exchange Commission on Form N-Q. Shareholders can look up the fund’s Forms N-Q on the SEC’s website at sec.gov. Forms N-Q may also be reviewed and copied at the SEC’s Public Reference Room (see the back cover of this report for further information).
| | |
| | | Market |
| | | Value |
| | Shares | ($000) |
| Investment Companies (99.9%) | | |
| U.S. Stock Fund (49.7%) | | |
| Vanguard Total Stock Market Index Fund Investor Shares | 277,621,300 | 9,949,947 |
| |
| International Stock Fund (21.6%) | | |
| Vanguard Total International Stock Index Fund Investor Shares | 303,815,060 | 4,323,288 |
| |
| Bond Fund (28.6%) | | |
| 1 Vanguard Total Bond Market II Index Fund Investor Shares | 516,880,841 | 5,727,040 |
| Total Investment Companies (Cost $17,684,215) | | 20,000,275 |
| Temporary Cash Investment (0.0%) | | |
| Money Market Fund (0.0%) | | |
| 1 Vanguard Market Liquidity Fund, 0.163% (Cost $2,107) | 2,107,095 | 2,107 |
| Total Investments (99.9%) (Cost $17,686,322) | | 20,002,382 |
| Other Assets and Liabilities (0.1%) | | |
| Other Assets | | 78,543 |
| Liabilities | | (59,345) |
| | | 19,198 |
| Net Assets (100%) | | |
| Applicable to 1,461,730,901 outstanding $.001 par value shares of | | |
| beneficial interest (unlimited authorization) | | 20,021,580 |
| Net Asset Value Per Share | | $13.70 |
| |
| |
| At September 30, 2012, net assets consisted of: | | |
| | | Amount |
| | | ($000) |
| Paid-in Capital | | 17,493,796 |
| Undistributed Net Investment Income | | 288,040 |
| Accumulated Net Realized Losses | | (76,316) |
| Unrealized Appreciation (Depreciation) | | 2,316,060 |
| Net Assets | | 20,021,580 |
See Note A in Notes to Financial Statements.
1 Affiliated fund available only to Vanguard funds and certain trusts and accounts managed by Vanguard. Rate shown for Vanguard Market Liquidity Fund is the 7-day yield.
See accompanying Notes, which are an integral part of the Financial Statements.
49
| |
| Target Retirement 2025 Fund | |
| |
| |
| Statement of Operations | |
| |
| | Year Ended |
| | September 30, 2012 |
| | ($000) |
| Investment Income | |
| Income | |
| Income Distributions Received | 465,615 |
| Net Investment Income—Note B | 465,615 |
| Realized Net Gain (Loss) | |
| Capital Gain Distributions Received | 47,682 |
| Investment Securities Sold | 29,986 |
| Realized Net Gain (Loss) | 77,668 |
| Change in Unrealized Appreciation (Depreciation) of Investment Securities | 2,539,930 |
| Net Increase (Decrease) in Net Assets Resulting from Operations | 3,083,213 |
See accompanying Notes, which are an integral part of the Financial Statements.
50
| | |
| Target Retirement 2025 Fund | | |
| |
| |
| Statement of Changes in Net Assets | | |
| |
| | Year Ended September 30, |
| | 2012 | 2011 |
| | ($000) | ($000) |
| Increase (Decrease) in Net Assets | | |
| Operations | | |
| Net Investment Income | 465,615 | 315,625 |
| Realized Net Gain (Loss) | 77,668 | 775 |
| Change in Unrealized Appreciation (Depreciation) | 2,539,930 | (492,656) |
| Net Increase (Decrease) in Net Assets Resulting from Operations | 3,083,213 | (176,256) |
| Distributions | | |
| Net Investment Income | (378,248) | (289,553) |
| Realized Capital Gain1 | (16,898) | (18,531) |
| Total Distributions | (395,146) | (308,084) |
| Capital Share Transactions | | |
| Issued | 4,781,176 | 4,556,327 |
| Issued in Lieu of Cash Distributions | 391,525 | 305,363 |
| Redeemed | (2,836,642) | (3,032,384) |
| Net Increase (Decrease) from Capital Share Transactions | 2,336,059 | 1,829,306 |
| Total Increase (Decrease) | 5,024,126 | 1,344,966 |
| Net Assets | | |
| Beginning of Period | 14,997,454 | 13,652,488 |
| End of Period2 | 20,021,580 | 14,997,454 |
1 Includes fiscal 2012 and 2011 short-term gain distributions totaling $16,898,000 and $18,531,000, respectively. Short-term gain distributions are treated as ordinary income dividends for tax purposes.
2 Net Assets—End of Period includes undistributed net investment income of $288,040,000 and $200,673,000.
See accompanying Notes, which are an integral part of the Financial Statements.
51
| | | | | |
| Target Retirement 2025 Fund | | | | | |
| |
| |
| Financial Highlights | | | | | |
| |
| |
| |
| For a Share Outstanding | | | Year Ended September 30, |
| Throughout Each Period | 2012 | 2011 | 2010 | 2009 | 2008 |
| Net Asset Value, Beginning of Period | $11.71 | $11.97 | $11.11 | $11.49 | $14.26 |
| Investment Operations | | | | | |
| Net Investment Income | .331 | .2571 | .262 | .279 | .307 |
| Capital Gain Distributions Received | .036 | .0201 | — | — | — |
| Net Realized and Unrealized Gain (Loss) | | | | | |
| on Investments | 1.927 | (.271) | .850 | (.336) | (2.767) |
| Total from Investment Operations | 2.294 | .006 | 1.112 | (.057) | (2.460) |
| Distributions | | | | | |
| Dividends from Net Investment Income | (.291) | (.250) | (.252) | (.323) | (.310) |
| Distributions from Realized Capital Gains | (.013) | (.016) | — | — | — |
| Total Distributions | (.304) | (.266) | (.252) | (.323) | (.310) |
| Net Asset Value, End of Period | $13.70 | $11.71 | $11.97 | $11.11 | $11.49 |
| |
| Total Return2 | 19.89% | -0.11% | 10.12% | 0.10% | -17.61% |
| |
| Ratios/Supplemental Data | | | | | |
| Net Assets, End of Period (Millions) | $20,022 | $14,997 | $13,652 | $9,932 | $7,769 |
| Ratio of Total Expenses to | | | | | |
| Average Net Assets | — | — | — | — | — |
| Acquired Fund Fees and Expenses | 0.17% | 0.18% | 0.18% | 0.21% | 0.18% |
| Ratio of Net Investment Income to | | | | | |
| Average Net Assets | 2.64% | 2.01% | 2.42% | 3.09% | 2.59% |
| Portfolio Turnover Rate | 9% | 23%3 | 11% | 21%4 | 17% |
1 Calculated based on average shares outstanding.
2 Total returns do not include account service fees that may have applied in the periods shown. Fund prospectuses provide information about any applicable account service fees.
3 Excludes the value of mutual fund shares delivered and received in connection with a change in the fund’s international equity investments from Vanguard European, Pacific, and Emerging Markets Stock Index Funds to Vanguard Total International Stock Index Fund because those transactions were effected in kind and did not cause the fund to incur transaction costs.
4 Excludes the value of mutual fund shares delivered and received in connection with a change in the fund’s bond investments from Vanguard Total Bond Market Index Fund to Vanguard Total Bond Market II Index Fund because those transactions were effected in kind and did not cause the fund to incur transaction costs.
See accompanying Notes, which are an integral part of the Financial Statements.
52
Target Retirement 2025 Fund
Notes to Financial Statements
Vanguard Target Retirement 2025 Fund is registered under the Investment Company Act of 1940 as an open-end investment company, or mutual fund. The fund follows a balanced investment strategy by investing in selected Vanguard funds to achieve its targeted allocation of assets to U.S. stocks, international stocks, and bonds.
A. The following significant accounting policies conform to generally accepted accounting principles for U.S. mutual funds. The fund consistently follows such policies in preparing its financial statements
1. Security Valuation: Investments are valued at the net asset value of each underlying Vanguard fund determined as of the close of the New York Stock Exchange (generally 4 p.m., Eastern time) on the valuation date.
2. Federal Income Taxes: The fund intends to continue to qualify as a regulated investment company and distribute all of its taxable income. Management has analyzed the fund’s tax positions taken for all open federal income tax years (September 30, 2009–2012), and has concluded that no provision for federal income tax is required in the fund’s financial statements.
3. Distributions: Distributions to shareholders are recorded on the ex-dividend date.
4. Other: Income and capital gain distributions received are recorded on the ex-dividend date. Security transactions are accounted for on the date securities are bought or sold. Costs used to determine realized gains (losses) on the sale of investment securities are those of the specific securities sold.
B. Under a service agreement, The Vanguard Group furnishes investment advisory, corporate management, administrative, marketing, and distribution services to the fund. The service agreement provides that the fund’s expenses may be reduced or eliminated to the extent of savings realized by the Vanguard funds by the operation of the fund. Accordingly, all incremental expenses for services provided by Vanguard and all other expenses incurred by the fund during the year ended September 30, 2012, were borne by the funds in which the fund invests. The fund’s trustees and officers are also directors and officers of Vanguard and the funds in which the fund invests.
C. Various inputs may be used to determine the value of the fund’s investments. These inputs are summarized in three broad levels for financial statement purposes. The inputs or methodologies used to value securities are not necessarily an indication of the risk associated with investing in those securities.
Level 1—Quoted prices in active markets for identical securities.
Level 2—Other significant observable inputs (including quoted prices for similar securities, interest rates, prepayment speeds, credit risk, etc.).
Level 3—Significant unobservable inputs (including the fund’s own assumptions used to determine the fair value of investments).
At September 30, 2012, 100% of the market value of the fund’s investments was determined based on Level 1 inputs.
D. Distributions are determined on a tax basis and may differ from net investment income and realized capital gains for financial reporting purposes. Differences may be permanent or temporary. Permanent differences are reclassified among capital accounts in the financial statements to reflect their tax character. Temporary differences arise when certain items of income, expense, gain, or loss are recognized in different periods for financial statement and tax purposes; these differences will reverse at some time in the future. Differences in classification may also result from the treatment of short-term gains as ordinary income for tax purposes.
53
Target Retirement 2025 Fund
For tax purposes, at September 30, 2012, the fund had $291,946,000 of ordinary income available for distribution. Tax-basis amounts required to be distributed in December 2011 included short term gain distributions received from Vanguard Total Bond Market II Index Fund in December 2011. Short-term capital gain distributions received are treated as ordinary income for tax purposes, and cannot be offset by capital losses. At September 30, 2012, the fund had available capital losses totaling $74,491,000 to offset future net capital gains. Of this amount, $7,742,000 is subject to expiration on September 30, 2018. Capital losses of $66,749,000 realized beginning in fiscal 2012 may be carried forward indefinitely under the Regulated Investment Company Modernization Act of 2010, but must be used before any expiring loss carryforwards.
At September 30, 2012, the cost of investment securities for tax purposes was $17,692,053,000. Net unrealized appreciation of investment securities for tax purposes was $2,310,329,000, consisting of unrealized gains of $2,544,957,000 on securities that had risen in value since their purchase and $234,628,000 in unrealized losses on securities that had fallen in value since their purchase.
E. During the year ended September 30, 2012, the fund purchased $4,010,871,000 of investment securities and sold $1,563,495,000 of investment securities, other than temporary cash investments.
F. Capital shares issued and redeemed were:
| | |
| | Year Ended September 30, |
| | 2012 | 2011 |
| | Shares | Shares |
| | (000) | (000) |
| Issued | 369,649 | 356,359 |
| Issued in Lieu of Cash Distributions | 31,883 | 24,235 |
| Redeemed | (220,958) | (239,602) |
| Net Increase (Decrease) in Shares Outstanding | 180,574 | 140,992 |
G. In preparing the financial statements as of September 30, 2012, management considered the impact of subsequent events for potential recognition or disclosure in these financial statements.
54
Target Retirement 2030 Fund
Fund Profile
As of September 30, 2012
| |
| Total Fund Characteristics | |
| Ticker Symbol | VTHRX |
| 30-Day SEC Yield | 1.98% |
| Acquired Fund Fees and Expenses1 | 0.18% |
| |
| Allocation to Underlying Vanguard Funds | |
| Vanguard Total Stock Market Index Fund | |
| Investor Shares | 55.1% |
| Vanguard Total International Stock Index | |
| Fund Investor Shares | 23.6 |
| Vanguard Total Bond Market II Index Fund | |
| Investor Shares | 21.3 |
| | |
| Total Fund Volatility Measures | |
| | Target 2030 | MSCI US |
| | Composite | Broad Market |
| | Index | Index |
| R-Squared | 1.00 | 0.98 |
| Beta | 1.00 | 0.83 |
These measures show the degree and timing of the fund’s fluctuations compared with the indexes over 36 months.
Fund Asset Allocation
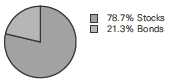
1 This figure—drawn from the prospectus dated January 26, 2012—represents an estimate of the weighted average of the expense ratios and any transaction fees charged by the underlying mutual funds (the ”acquired” funds) in which the Target Retirement 2030 Fund invests. The fund does not charge any expenses or fees of its own. For the fiscal year ended September 30, 2012, the acquired fund fees and expenses were 0.17%.
55
Target Retirement 2030 Fund
Performance Summary
All of the returns in this report represent past performance, which is not a guarantee of future results that may be achieved by the fund. (Current performance may be lower or higher than the performance data cited. For performance data current to the most recent month-end, visit our website at vanguard.com/performance.) Note, too, that both investment returns and principal value can fluctuate widely, so an investor’s shares, when sold, could be worth more or less than their original cost. The returns shown do not reflect taxes that a shareholder would pay on fund distributions or on the sale of fund shares.
Cumulative Performance: June 7, 2006, Through September 30, 2012
Initial Investment of $10,000
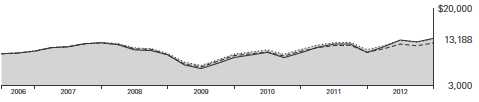
| | | | |
| | | Average Annual Total Returns | |
| | Periods Ended September 30, 2012 | |
| | | | Since | Final Value |
| | One | Five | Inception | of a $10,000 |
| | Year | Years | (6/7/2006) | Investment |
| Target Retirement 2030 Fund | 21.43% | 1.12% | 4.48% | $13,188 |
| Target 2030 Composite Index | 21.65 | 1.20 | 4.57 | 13,259 |
| Mixed-Asset Target 2030 Funds | | | | |
| Average | 19.76 | -0.02 | 3.44 | 12,378 |
| MSCI US Broad Market Index | 30.30 | 1.55 | 4.73 | 13,390 |
For a benchmark description, see the Glossary.
Mixed-Asset Target 2030 Funds Average: Derived from data provided by Lipper Inc.
"Since Inception" performance is calculated from the inception date for both the fund and its comparative standards.
See Financial Highlights for dividend and capital gains information.
56
Target Retirement 2030 Fund
Fiscal-Year Total Returns (%): June 7, 2006, Through September 30, 2012
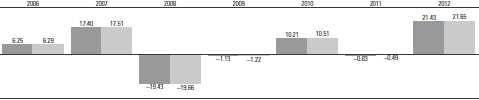
|
| Target Retirement 2030 Fund |
| Target 2030 Composite Index |
| For a benchmark description, see the Glossary. |
57
Target Retirement 2030 Fund
Financial Statements
Statement of Net Assets
As of September 30, 2012
The fund reports a complete list of its holdings in regulatory filings four times in each fiscal year, at the quarter-ends. For the second and fourth fiscal quarters, the lists appear in the fund’s semiannual and annual reports to shareholders. For the first and third fiscal quarters, the fund files the lists with the Securities and Exchange Commission on Form N-Q. Shareholders can look up the fund’s Forms N-Q on the SEC’s website at sec.gov. Forms N-Q may also be reviewed and copied at the SEC’s Public Reference Room (see the back cover of this report for further information).
| | |
| | | Market |
| | | Value |
| | Shares | ($000) |
| Investment Companies (99.9%) | | |
| U.S. Stock Fund (55.0%) | | |
| Vanguard Total Stock Market Index Fund Investor Shares | 193,938,435 | 6,950,753 |
| |
| International Stock Fund (23.6%) | | |
| Vanguard Total International Stock Index Fund Investor Shares | 209,827,122 | 2,985,840 |
| |
| Bond Fund (21.3%) | | |
| 1 Vanguard Total Bond Market II Index Fund Investor Shares | 242,921,482 | 2,691,570 |
| Total Investment Companies (Cost $11,244,266) | | 12,628,163 |
| Other Assets and Liabilities (0.1%) | | |
| Other Assets | | 40,469 |
| Liabilities | | (21,724) |
| | | 18,745 |
| Net Assets (100%) | | |
| Applicable to 537,857,496 outstanding $.001 par value shares of | | |
| beneficial interest (unlimited authorization) | | 12,646,908 |
| Net Asset Value Per Share | | $23.51 |
| |
| |
| At September 30, 2012, net assets consisted of: | | |
| | | Amount |
| | | ($000) |
| Paid-in Capital | | 11,099,752 |
| Undistributed Net Investment Income | | 177,537 |
| Accumulated Net Realized Losses | | (14,278) |
| Unrealized Appreciation (Depreciation) | | 1,383,897 |
| Net Assets | | 12,646,908 |
See Note A in Notes to Financial Statements.
1 Affiliated fund available only to Vanguard funds and certain trusts and accounts managed by Vanguard.
See accompanying Notes, which are an integral part of the Financial Statements.
58
| |
| Target Retirement 2030 Fund | |
| |
| |
| Statement of Operations | |
| |
| | Year Ended |
| | September 30, 2012 |
| | ($000) |
| Investment Income | |
| Income | |
| Income Distributions Received | 282,814 |
| Net Investment Income—Note B | 282,814 |
| Realized Net Gain (Loss) | |
| Capital Gain Distributions Received | 19,986 |
| Investment Securities Sold | 15,633 |
| Realized Net Gain (Loss) | 35,619 |
| Change in Unrealized Appreciation (Depreciation) of Investment Securities | 1,624,548 |
| Net Increase (Decrease) in Net Assets Resulting from Operations | 1,942,981 |
See accompanying Notes, which are an integral part of the Financial Statements.
59
| | |
| Target Retirement 2030 Fund | | |
| |
| |
| Statement of Changes in Net Assets | | |
| |
| | Year Ended September 30, |
| | 2012 | 2011 |
| | ($000) | ($000) |
| Increase (Decrease) in Net Assets | | |
| Operations | | |
| Net Investment Income | 282,814 | 155,961 |
| Realized Net Gain (Loss) | 35,619 | (14,238) |
| Change in Unrealized Appreciation (Depreciation) | 1,624,548 | (402,712) |
| Net Increase (Decrease) in Net Assets Resulting from Operations | 1,942,981 | (260,989) |
| Distributions | | |
| Net Investment Income | (204,000) | (132,260) |
| Realized Capital Gain1 | (7,410) | (7,366) |
| Total Distributions | (211,410) | (139,626) |
| Capital Share Transactions | | |
| Issued | 3,986,357 | 3,465,536 |
| Issued in Lieu of Cash Distributions | 209,803 | 138,834 |
| Redeemed | (1,525,373) | (1,491,969) |
| Net Increase (Decrease) from Capital Share Transactions | 2,670,787 | 2,112,401 |
| Total Increase (Decrease) | 4,402,358 | 1,711,786 |
| Net Assets | | |
| Beginning of Period | 8,244,550 | 6,532,764 |
| End of Period2 | 12,646,908 | 8,244,550 |
1 Includes fiscal 2012 and 2011 short-term gain distributions totaling $7,410,000 and $7,366,000, respectively. Short-term gain distributions are treated as ordinary income dividends for tax purposes.
2 Net Assets—End of Period includes undistributed net investment income of $177,537,000 and $98,723,000.
See accompanying Notes, which are an integral part of the Financial Statements.
60
| | | | | |
| Target Retirement 2030 Fund | | | | | |
| |
| |
| Financial Highlights | | | | | |
| |
| |
| |
| For a Share Outstanding | | | Year Ended September 30, |
| Throughout Each Period | 2012 | 2011 | 2010 | 2009 | 2008 |
| Net Asset Value, Beginning of Period | $19.81 | $20.36 | $18.84 | $19.63 | $24.74 |
| Investment Operations | | | | | |
| Net Investment Income | .561 | .398 | .4531 | .4661 | .5221 |
| Capital Gain Distributions Received | .044 | .011 | — | — | — |
| Net Realized and Unrealized Gain (Loss) | | | | | |
| on Investments | 3.580 | (.542) | 1.453 | (.793) | (5.262) |
| Total from Investment Operations | 4.185 | (.133) | 1.906 | (.327) | (4.740) |
| Distributions | | | | | |
| Dividends from Net Investment Income | (.468) | (.395) | (.386) | (.463) | (.370) |
| Distributions from Realized Capital Gains | (.017) | (.022) | — | — | — |
| Total Distributions | (.485) | (.417) | (.386) | (.463) | (.370) |
| Net Asset Value, End of Period | $23.51 | $19.81 | $20.36 | $18.84 | $19.63 |
| |
| Total Return2 | 21.43% | -0.83% | 10.21% | -1.13% | -19.43% |
| |
| Ratios/Supplemental Data | | | | | |
| Net Assets, End of Period (Millions) | $12,647 | $8,245 | $6,533 | $4,003 | $2,359 |
| Ratio of Total Expenses to | | | | | |
| Average Net Assets | — | — | — | — | — |
| Acquired Fund Fees and Expenses | 0.17% | 0.18% | 0.19% | 0.21% | 0.19% |
| Ratio of Net Investment Income to | | | | | |
| Average Net Assets | 2.66% | 1.91% | 2.32% | 2.92% | 2.35% |
| Portfolio Turnover Rate | 4% | 19%3 | 9% | 13%4 | 6% |
1 Calculated based on average shares outstanding.
2 Total returns do not include account service fees that may have applied in the periods shown. Fund prospectuses provide information about any applicable account service fees.
3 Excludes the value of mutual fund shares delivered and received in connection with a change in the fund’s international equity investments from Vanguard European, Pacific, and Emerging Markets Stock Index Funds to Vanguard Total International Stock Index Fund because those transactions were effected in kind and did not cause the fund to incur transaction costs.
4 Excludes the value of mutual fund shares delivered and received in connection with a change in the fund’s bond investments from Vanguard Total Bond Market Index Fund to Vanguard Total Bond Market II Index Fund because those transactions were effected in kind and did not cause the fund to incur transaction costs.
See accompanying Notes, which are an integral part of the Financial Statements.
61
Target Retirement 2030 Fund
Notes to Financial Statements
Vanguard Target Retirement 2030 Fund is registered under the Investment Company Act of 1940 as an open-end investment company, or mutual fund. The fund follows a balanced investment strategy by investing in selected Vanguard funds to achieve its targeted allocation of assets to U.S. stocks, international stocks, and bonds.
A. The following significant accounting policies conform to generally accepted accounting principles for U.S. mutual funds. The fund consistently follows such policies in preparing its financial statements.
1. Security Valuation: Investments are valued at the net asset value of each underlying Vanguard fund determined as of the close of the New York Stock Exchange (generally 4 p.m., Eastern time) on the valuation date.
2. Federal Income Taxes: The fund intends to continue to qualify as a regulated investment company and distribute all of its taxable income. Management has analyzed the fund’s tax positions taken for all open federal income tax years (September 30, 2009–2012), and has concluded that no provision for federal income tax is required in the fund’s financial statements.
3. Distributions: Distributions to shareholders are recorded on the ex-dividend date.
4. Other: Income and capital gain distributions received are recorded on the ex-dividend date. Security transactions are accounted for on the date securities are bought or sold. Costs used to determine realized gains (losses) on the sale of investment securities are those of the specific securities sold.
B. Under a service agreement, The Vanguard Group furnishes investment advisory, corporate management, administrative, marketing, and distribution services to the fund. The service agreement provides that the fund’s expenses may be reduced or eliminated to the extent of savings realized by the Vanguard funds by the operation of the fund. Accordingly, all incremental expenses for services provided by Vanguard and all other expenses incurred by the fund during the year ended September 30, 2012, were borne by the funds in which the fund invests. The fund’s trustees and officers are also directors and officers of Vanguard and the funds in which the fund invests.
C. Various inputs may be used to determine the value of the fund’s investments. These inputs are summarized in three broad levels for financial statement purposes. The inputs or methodologies used to value securities are not necessarily an indication of the risk associated with investing in those securities.
Level 1—Quoted prices in active markets for identical securities.
Level 2—Other significant observable inputs (including quoted prices for similar securities, interest rates, prepayment speeds, credit risk, etc.).
Level 3—Significant unobservable inputs (including the fund’s own assumptions used to determine the fair value of investments).
At September 30, 2012, 100% of the market value of the fund’s investments was determined based on Level 1 inputs.
D. Distributions are determined on a tax basis and may differ from net investment income and realized capital gains for financial reporting purposes. Differences may be permanent or temporary. Permanent differences are reclassified among capital accounts in the financial statements to reflect their tax character. Temporary differences arise when certain items of income, expense, gain, or loss are recognized in different periods for financial statement and tax purposes; these differences will reverse at some time in the future. Differences in classification may also result from the treatment of short-term gains as ordinary income for tax purposes.
62
Target Retirement 2030 Fund
For tax purposes, at September 30, 2012, the fund had $179,006,000 of ordinary income available for distribution. Tax-basis amounts required to be distributed in December 2011 included short term gain distributions received from Vanguard Total Bond Market II Index Fund in December 2011. Short-term capital gain distributions received are treated as ordinary income for tax purposes, and cannot be offset by capital losses. At September 30, 2012, the fund had available capital losses totaling $7,257,000 that may be carried forward indefinitely to offset future capital gains.
At September 30, 2012, the cost of investment securities for tax purposes was $11,252,755,000. Net unrealized appreciation of investment securities for tax purposes was $1,375,408,000, consisting of unrealized gains of $1,516,566,000 on securities that had risen in value since their purchase and $141,158,000 in unrealized losses on securities that had fallen in value since their purchase.
E. During the year ended September 30, 2012, the fund purchased $3,217,539,000 of investment securities and sold $465,100,000 of investment securities, other than temporary cash investments.
F. Capital shares issued and redeemed were:
| | |
| | Year Ended September 30, |
| | 2012 | 2011 |
| | Shares | Shares |
| | (000) | (000) |
| Issued | 180,472 | 157,714 |
| Issued in Lieu of Cash Distributions | 10,019 | 6,410 |
| Redeemed | (68,762) | (68,807) |
| Net Increase (Decrease) in Shares Outstanding | 121,729 | 95,317 |
G. In preparing the financial statements as of September 30, 2012, management considered the impact of subsequent events for potential recognition or disclosure in these financial statements.
63
Report of Independent Registered
Public Accounting Firm
To the Trustees of Vanguard Chester Funds and the Shareholders of Vanguard Target Retirement Income Fund, Vanguard Target Retirement 2010 Fund, Vanguard Target Retirement 2015 Fund, Vanguard Target Retirement 2020 Fund, Vanguard Target Retirement 2025 Fund and Vanguard Target Retirement 2030 Fund:
In our opinion, the accompanying statements of net assets and the related statements of operations and of changes in net assets and the financial highlights present fairly, in all material respects, the financial position of Vanguard Target Retirement Income Fund, Vanguard Target Retirement 2010 Fund, Vanguard Target Retirement 2015 Fund, Vanguard Target Retirement 2020 Fund and Vanguard Target Retirement 2025 Fund, and Vanguard Target Retirement 2030 Fund (collectively constituting six separate portfolios of Vanguard Chester Funds, hereafter referred to as the “Funds”) at September 30, 2012, the results of each of their operations for the year then ended, the changes in each of their net assets for each of the two years in the period then ended and the financial highlights for each of the five years in the period then ended, in conformity with accounting principles generally accepted in the United States of America. These financial statements and financial highlights (hereafter referred to as “financial statements”) are the responsibility of the Funds’ management; our responsibility is to express an opinion on these financial statements based on our audits. We conducted our audits of these financial statements in accordance with the standards of the Public Company Accounting Oversight Board (United States). Those standards require that we plan and perform the audit to obtain reasonable assurance about whether the financial statements are free of material misstatement. An audit includes examining, on a test basis, evidence supporting the amounts and disclosures in the financial statements, assessing the accounting principles used and significant estimates made by management, and evaluating the overall financial statement presentation. We believe that our audits, which included confirmation of securities at September 30, 2012 by agreement to the underlying ownership records of the transfer agent, provide a reasonable basis for our opinion.
PricewaterhouseCoopers LLP
Philadelphia, Pennsylvania
November 9, 2012
64
| |
| Special 2012 tax information (unaudited) for Vanguard Target Retirement Funds |
This information for the fiscal year ended September 30, 2012, is included pursuant to provisions of the Internal Revenue Code.
The funds distributed qualified dividend income to shareholders during the fiscal year as follows:
| |
| | Qualified Dividend Income |
| Fund | ($000) |
| Target Retirement Income Fund | 38,064 |
| Target Retirement 2010 Fund | 43,392 |
| Target Retirement 2015 Fund | 153,733 |
| Target Retirement 2020 Fund | 145,585 |
| Target Retirement 2025 Fund | 221,048 |
| Target Retirement 2030 Fund | 135,538 |
For corporate shareholders, the percentage of investment income (dividend income plus short-term gains, if any) that qualifies for the dividends-received deduction is as follows:
| |
| Fund | Percentage |
| Target Retirement Income Fund | 15.9% |
| Target Retirement 2010 Fund | 21.1 |
| Target Retirement 2015 Fund | 25.7 |
| Target Retirement 2020 Fund | 29.8 |
| Target Retirement 2025 Fund | 33.2 |
| Target Retirement 2030 Fund | 37.1 |
65
Your Fund’s After-Tax Returns
This table presents returns for your fund both before and after taxes. The after-tax returns are shown in two ways: (1) assuming that an investor owned the fund during the entire period and paid taxes on the fund’s distributions, and (2) assuming that an investor paid taxes on the fund’s distributions and sold all shares at the end of each period.
Calculations are based on the highest individual federal income tax and capital gains tax rates in effect at the times of the distributions and the hypothetical sales. State and local taxes were not considered. After-tax returns reflect any qualified dividend income , using actual prior-year figures and estimates for 2012. (In the example, returns after the sale of fund shares may be higher than those assuming no sale. This occurs when the sale would have produced a capital loss. The calculation assumes that the investor received a tax deduction for the loss.)
Please note that your actual after-tax returns will depend on your tax situation and may differ from those shown. Also note that if you own the fund in a tax-deferred account, such as an individual retirement account or a 401(k) plan, this information does not apply to you. Such accounts are not subject to current taxes.
Finally, keep in mind that a fund’s performance—whether before or after taxes—does not guarantee future results.
Average Annual Total Returns: Target Retirement Funds
Periods Ended September 30, 2012
| | | |
| | | | Since |
| | One | Five | Inception |
| | Year | Years | (10/27/2003) |
| Target Retirement Income Fund | | | |
| Returns Before Taxes | 11.74% | 5.06% | 5.69% |
| Returns After Taxes on Distributions | 10.89 | 4.10 | 4.60 |
| Returns After Taxes on Distributions and Sale of Fund Shares | 7.72 | 3.80 | 4.29 |
| |
| | | | Since |
| | One | Five | Inception |
| | Year | Years | (6/7/2006) |
| Target Retirement 2010 Fund | | | |
| Returns Before Taxes | 14.74% | 3.50% | 5.58% |
| Returns After Taxes on Distributions | 13.83 | 2.73 | 4.93 |
| Returns After Taxes on Distributions and Sale of Fund Shares | 9.71 | 2.58 | 4.47 |
| |
| | | | Since |
| | One | Five | Inception |
| | Year | Years | (10/27/2003) |
| Target Retirement 2015 Fund | | | |
| Returns Before Taxes | 16.76% | 2.88% | 5.90% |
| Returns After Taxes on Distributions | 15.93 | 2.13 | 5.24 |
| Returns After Taxes on Distributions and Sale of Fund Shares | 11.07 | 2.07 | 4.79 |
66
Average Annual Total Returns: Target Retirement Funds
Periods Ended September 30, 2012
| | | |
| | | | Since |
| | One | Five | Inception |
| | Year | Years | (6/7/2006) |
| Target Retirement 2020 Fund | | | |
| Returns Before Taxes | 18.30% | 2.30% | 5.04% |
| Returns After Taxes on Distributions | 17.57 | 1.71 | 4.53 |
| Returns After Taxes on Distributions and Sale of Fund Shares | 12.10 | 1.67 | 4.10 |
| |
| | | | Since |
| | One | Five | Inception |
| | Year | Years | (10/27/2003) |
| Target Retirement 2025 Fund | | | |
| Returns Before Taxes | 19.89% | 1.70% | 5.79% |
| Returns After Taxes on Distributions | 19.20 | 1.12 | 5.26 |
| Returns After Taxes on Distributions and Sale of Fund Shares | 13.17 | 1.19 | 4.80 |
| |
| | | | Since |
| | One | Five | Inception |
| | Year | Years | (6/7/2006) |
| Target Retirement 2030 Fund | | | |
| Returns Before Taxes | 21.43% | 1.12% | 4.48% |
| Returns After Taxes on Distributions | 20.82 | 0.67 | 4.08 |
| Returns After Taxes on Distributions and Sale of Fund Shares | 14.20 | 0.77 | 3.70 |
67
About Your Fund’s Expenses
As a shareholder of the fund, you incur ongoing costs, which include costs for portfolio management, administrative services, and shareholder reports (like this one), among others. Operating expenses, which are deducted from a fund’s gross income, directly reduce the investment return of the fund.
A typical fund’s expenses are expressed as a percentage of its average net assets. The Target Retirement Funds have no direct expenses, but each fund bears its proportionate share of the costs for the underlying funds in which it invests. These indirect expenses make up the acquired fund fees and expenses, also expressed as a percentage of average net assets.
The following examples are intended to help you understand the ongoing cost (in dollars) of investing in your fund and to compare these costs with those of other mutual funds. The examples are based on an investment of $1,000 made at the beginning of the period shown and held for the entire period. The costs were calculated using the acquired fund fees and expenses for each Target Retirement Fund.
The accompanying table illustrates your fund’s costs in two ways:
• Based on actual fund return. This section helps you to estimate the actual expenses that you paid over the period. The ”Ending Account Value“ shown is derived from the fund‘s actual return, and the third column shows the dollar amount that would have been paid by an investor who started with $1,000 in the fund. You may use the information here, together with the amount you invested, to estimate the expenses that you paid over the period.
To do so, simply divide your account value by $1,000 (for example, an $8,600 account value divided by $1,000 = 8.6), then multiply the result by the number given for your fund under the heading ”Expenses Paid During Period.“
• Based on hypothetical 5% yearly return. This section is intended to help you compare your fund‘s costs with those of other mutual funds. It assumes that the fund had a yearly return of 5% before expenses, but that the expense ratio is unchanged. In this case—because the return used is not the fund’s actual return—the results do not apply to your investment. The example is useful in making comparisons because the Securities and Exchange Commission requires all mutual funds to calculate expenses based on a 5% return. You can assess your fund’s costs by comparing this hypothetical example with the hypothetical examples that appear in shareholder reports of other funds.
Note that the expenses shown in the table are meant to highlight and help you compare ongoing costs only and do not reflect transaction costs incurred by the fund for buying and selling securities. Further, the expenses do not include any purchase, redemption, or account service fees described in the fund prospectus. If such fees were applied to your account, your costs would be higher. Your fund does not carry a “sales load.”
The calculations assume no shares were bought or sold during the period. Your actual costs may have been higher or lower, depending on the amount of your investment and the timing of any purchases or redemptions.
You can find more information about the fund’s expenses, including annual expense ratios, in the Financial Statements section of this report. For additional information on operating expenses and other shareholder costs, please refer to your fund’s current prospectus.
68
| | | |
| Six Months Ended September 30, 2012 | | | |
| | Beginning | Ending | Expenses |
| | Account Value | Account Value | Paid During |
| | 3/31/2012 | 9/30/2012 | Period |
| Based on Actual Fund Return | | | |
| Target Retirement Income Fund | $1,000.00 | $1,033.89 | $0.82 |
| Target Retirement 2010 Fund | $1,000.00 | $1,030.78 | $0.81 |
| Target Retirement 2015 Fund | $1,000.00 | $1,027.31 | $0.81 |
| Target Retirement 2020 Fund | $1,000.00 | $1,024.72 | $0.81 |
| Target Retirement 2025 Fund | $1,000.00 | $1,023.15 | $0.86 |
| Target Retirement 2030 Fund | $1,000.00 | $1,021.29 | $0.86 |
| Based on Hypothetical 5% Yearly Return | | | |
| Target Retirement Income Fund | $1,000.00 | $1,024.27 | $0.81 |
| Target Retirement 2010 Fund | $1,000.00 | $1,024.27 | $0.81 |
| Target Retirement 2015 Fund | $1,000.00 | $1,024.27 | $0.81 |
| Target Retirement 2020 Fund | $1,000.00 | $1,024.27 | $0.81 |
| Target Retirement 2025 Fund | $1,000.00 | $1,024.22 | $0.86 |
| Target Retirement 2030 Fund | $1,000.00 | $1,024.22 | $0.86 |
The calculations are based on the acquired fund fees and expenses for the most recent six-month period. The funds’ annualized expense figures for that period are (in order as listed from top to bottom above) 0.16%, 0.16%, 0.16%, 0.16%, 0.17%, and 0.17%. The dollar amounts shown as ”Expenses Paid” are equal to the annualized expense figures for the underlying funds multiplied by the average account value over the period, multiplied by the number of days in the most recent six-month period, then divided by the number of days in the most recent 12-month period.
69
Glossary
30-Day SEC Yield. A fund’s 30-day SEC yield is derived using a formula specified by the U.S. Securities and Exchange Commission. Under the formula, data related to the fund’s security holdings in the previous 30 days are used to calculate the fund’s hypothetical net income for that period, which is then annualized and divided by the fund’s estimated average net assets over the calculation period. For the purposes of this calculation, a security’s income is based on its current market yield to maturity (for bonds), its actual income (for asset-backed securities), or its projected dividend yield (for stocks). Because the SEC yield represents hypothetical annualized income, it will differ—at times significantly—from the fund’s actual experience. As a result, the fund’s income distributions may be higher or lower than implied by the SEC yield.
Acquired Fund Fees and Expenses. Funds that invest in other Vanguard funds incur no direct expenses, but they do bear proportionate shares of the operating, administrative, and advisory expenses of the underlying funds, and they must pay any fees charged by those funds. The figure for acquired fund fees and expenses represents a weighted average of these underlying costs. Acquired is a term that the Securities and Exchange Commission applies to any mutual fund whose shares are owned by another fund.
Beta. A measure of the magnitude of a fund’s past share-price fluctuations in relation to the ups and downs of a given market index. The index is assigned a beta of 1.00. Compared with a given index, a fund with a beta of 1.20 typically would have seen its share price rise or fall by 12% when the index rose or fell by 10%. For this report, beta is based on returns over the past 36 months for both the fund and the index. Note that a fund’s beta should be reviewed in conjunction with its R-squared (see definition). The lower the R-squared, the less correlation there is between the fund and the index, and the less reliable beta is as an indicator of volatility.
Expense Ratio. A fund’s total annual operating expenses expressed as a percentage of the fund’s average net assets. The expense ratio includes management and administrative expenses, but does not include the transaction costs of buying and selling portfolio securities.
Inception Date. The date on which the assets of a fund (or one of its share classes) are first invested in accordance with the fund’s investment objective. For funds with a subscription period, the inception date is the day after that period ends. Investment performance is measured from the inception date.
R-Squared. A measure of how much of a fund’s past returns can be explained by the returns from the market in general, as measured by a given index. If a fund’s total returns were precisely synchronized with an index’s returns, its R-squared would be 1.00. If the fund’s returns bore no relationship to the index’s returns, its R-squared would be 0. For this report, R-squared is based on returns over the past 36 months for both the fund and the index.
70
Benchmark Information
Target 2010 Composite Index: Derived by applying the fund’s target asset allocation to the results of the following benchmarks: for international stocks of developed markets, the MSCI EAFE Index through December 15, 2010, and the MSCI ACWI ex USA IMI Index thereafter; for emerging markets stocks, the Select Emerging Markets Index through August 23, 2006, the MSCI Emerging Markets Index through December 15, 2010, and the MSCI ACWI ex USA IMI Index thereafter; for bonds, the Barclays U.S. Aggregate Bond Index through December 31, 2009, and the Barclays U.S. Aggregate Float Adjusted Index thereafter, as well as the Barclays U.S. Treasury Inflation Protected Securities Index; for short-term reserves, the Citigroup Three-Month Treasury Bill Index; and for U.S. stocks, the MSCI US Broad Market Index. MSCI international benchmark returns are adjusted for withholding taxes.
Target 2015 Composite Index: Derived by applying the fund’s target asset allocation to the results of the following benchmarks: for international stocks of developed markets, the MSCI EAFE Index through December 15, 2010, and the MSCI ACWI ex USA IMI Index thereafter; for emerging markets stocks, the Select Emerging Markets Index through August 23, 2006, the MSCI Emerging Markets Index through December 15, 2010, and the MSCI ACWI ex USA IMI Index thereafter; for bonds, the Barclays U.S. Aggregate Bond Index through December 31, 2009, and the Barclays U.S. Aggregate Float Adjusted Index thereafter, as well as the Barclays U.S. Treasury Inflation Protected Securities Index; and for U.S. stocks, the Dow Jones Wilshire 5000 Index through April 22, 2005, and the MSCI US Broad Market Index thereafter. MSCI international benchmark returns are adjusted for withholding taxes.
Target 2020 Composite Index: Derived by applying the fund’s target asset allocation to the results of the following benchmarks: for international stocks of developed markets, the MSCI EAFE Index through December 15, 2010, and the MSCI ACWI ex USA IMI Index thereafter; for emerging markets stocks, the Select Emerging Markets Index through August 23, 2006, the MSCI Emerging Markets Index through December 15, 2010, and the MSCI ACWI ex USA IMI Index thereafter; for bonds, the Barclays U.S. Aggregate Bond Index through December 31, 2009, and the Barclays U.S. Aggregate Float Adjusted Index thereafter; and for U.S. stocks, the MSCI US Broad Market Index. MSCI international benchmark returns are adjusted for withholding taxes.
Target 2025 Composite Index: Derived by applying the fund’s target asset allocation to the results of the following benchmarks: for international stocks of developed markets, the MSCI EAFE Index through December 15, 2010, and the MSCI ACWI ex USA IMI Index thereafter; for emerging markets stocks, the Select Emerging Markets Index through August 23, 2006, the MSCI Emerging Markets Index through December 15, 2010, and the MSCI ACWI ex USA IMI Index thereafter; for bonds, the Barclays U.S. Aggregate Bond Index through December 31, 2009, and the Barclays U.S. Aggregate Float Adjusted Index thereafter; and for U.S. stocks, the Dow Jones Wilshire 5000 Index through April 22, 2005, and the MSCI US Broad Market Index thereafter. MSCI international benchmark returns are adjusted for withholding taxes.
71
Target 2030 Composite Index: Derived by applying the fund’s target asset allocation to the results of the following benchmarks: for international stocks of developed markets, the MSCI EAFE Index through December 15, 2010, and the MSCI ACWI ex USA IMI Index thereafter; for emerging markets stocks, the Select Emerging Markets Index through August 23, 2006, the MSCI Emerging Markets Index through December 15, 2010, and the MSCI ACWI ex USA IMI Index thereafter; for bonds, the Barclays U.S. Aggregate Bond Index through December 31, 2009, and the Barclays U.S. Aggregate Float Adjusted Index thereafter; and for U.S. stocks, the MSCI US Broad Market Index. MSCI international benchmark returns are adjusted for withholding taxes.
Target Income Composite Index: Derived by applying the fund’s target asset allocation to the results of the following benchmarks: for international stocks of developed markets, the MSCI EAFE Index through December 15, 2010, and the MSCI ACWI ex USA IMI Index thereafter; for emerging markets stocks, the Select Emerging Markets Index through August 23, 2006, the MSCI Emerging Markets Index through December 15, 2010, and the MSCI ACWI ex USA IMI Index thereafter; for bonds, the Barclays U.S. Aggregate Bond Index through December 31, 2009, and the Barclays U.S. Aggregate Float Adjusted Index thereafter, as well as the Barclays U.S. Treasury Inflation Protected Securities Index; for short-term reserves, the Citigroup Three-Month Treasury Bill Index; and for U.S. stocks, the Dow Jones Wilshire 5000 Index through April 22, 2005, and the MSCI US Broad Market Index thereafter. MSCI international benchmark returns are adjusted for withholding taxes.
72
This page intentionally left blank.
This page intentionally left blank.
This page intentionally left blank.
The People Who Govern Your Fund
The trustees of your mutual fund are there to see that the fund is operated and managed in your best interests since, as a shareholder, you are a part owner of the fund. Your fund’s trustees also serve on the board of directors of The Vanguard Group, Inc., which is owned by the Vanguard funds and provides services to them on an at-cost basis.
A majority of Vanguard’s board members are independent, meaning that they have no affiliation with Vanguard or the funds they oversee, apart from the sizable personal investments they have made as private individuals. The independent board members have distinguished backgrounds in business, academia, and public service. Each of the trustees and executive officers oversees 179 Vanguard funds.
The following table provides information for each trustee and executive officer of the fund. More information about the trustees is in the Statement of Additional Information, which can be obtained, without charge, by contacting Vanguard at 800-662-7447, or online at vanguard.com.
| |
| InterestedTrustee1 | and Delphi Automotive LLP (automotive components); |
| | Senior Advisor at New Mountain Capital; Trustee of |
| | The Conference Board. |
| F. William McNabb III | |
| Born 1957. Trustee Since July 2009. Chairman of the | Amy Gutmann |
| Board. Principal Occupation(s) During the Past Five | Born 1949. Trustee Since June 2006. Principal |
| Years: Chairman of the Board of The Vanguard Group, | Occupation(s) During the Past Five Years: President |
| Inc., and of each of the investment companies served | of the University of Pennsylvania; Christopher H. |
| by The Vanguard Group, since January 2010; Director | Browne Distinguished Professor of Political Science |
| of The Vanguard Group since 2008; Chief Executive | in the School of Arts and Sciences with secondary |
| Officer and President of The Vanguard Group and of | appointments at the Annenberg School for |
| each of the investment companies served by The | Communication and the Graduate School of Education |
| Vanguard Group since 2008; Director of Vanguard | of the University of Pennsylvania; Member of the |
| Marketing Corporation; Managing Director of The | National Commission on the Humanities and Social |
| Vanguard Group (1995–2008). | Sciences; Trustee of Carnegie Corporation of New |
| | York and of the National Constitution Center; Chair |
| of the U. S. Presidential Commission for the Study |
| IndependentTrustees | of Bioethical Issues. |
| |
| Emerson U. Fullwood | JoAnn Heffernan Heisen |
| Born 1948. Trustee Since January 2008. Principal | Born 1950. Trustee Since July 1998. Principal |
| Occupation(s) During the Past Five Years: Executive | Occupation(s) During the Past Five Years: Corporate |
| Chief Staff and Marketing Officer for North America | Vice President and Chief Global Diversity Officer |
| and Corporate Vice President (retired 2008) of Xerox | (retired 2008) and Member of the Executive |
| Corporation (document management products and | Committee (1997–2008) of Johnson & Johnson |
| services); Executive in Residence and 2010 | (pharmaceuticals/medical devices/consumer |
| Distinguished Minett Professor at the Rochester | products); Director of Skytop Lodge Corporation |
| Institute of Technology; Director of SPX Corporation | (hotels), the University Medical Center at Princeton, |
| (multi-industry manufacturing), the United Way of | the Robert Wood Johnson Foundation, and the Center |
| Rochester, Amerigroup Corporation (managed health | for Talent Innovation; Member of the Advisory Board |
| care), the University of Rochester Medical Center, | of the Maxwell School of Citizenship and Public Affairs |
| Monroe Community College Foundation, and North | at Syracuse University. |
| Carolina A&T University. | |
| | F. Joseph Loughrey |
| Rajiv L. Gupta | Born 1949. Trustee Since October 2009. Principal |
| Born 1945. Trustee Since December 2001.2 | Occupation(s) During the Past Five Years: President |
| Principal Occupation(s) During the Past Five Years: | and Chief Operating Officer (retired 2009) of Cummins |
| Chairman and Chief Executive Officer (retired 2009) | Inc. (industrial machinery); Director of SKF AB |
| and President (2006–2008) of Rohm and Haas Co. | (industrial machinery), Hillenbrand, Inc. (specialized |
| (chemicals); Director of Tyco International, Ltd. | consumer services), the Lumina Foundation for |
| (diversified manufacturing and services), Hewlett- | |
| Packard Co. (electronic computer manufacturing), | |
| |
| | |
| Education, and Oxfam America; Chairman of the | Executive Officers | |
| Advisory Council for the College of Arts and Letters | | |
| and Member of the Advisory Board to the Kellogg | Glenn Booraem | |
| Institute for International Studies at the University | Born 1967. Controller Since July 2010. Principal |
| of Notre Dame. | Occupation(s) During the Past Five Years: Principal |
| | of The Vanguard Group, Inc.; Controller of each of |
| Mark Loughridge | the investment companies served by The Vanguard |
| Born 1953. Trustee Since March 2012. Principal | Group; Assistant Controller of each of the investment |
| Occupation(s) During the Past Five Years: Senior Vice | companies served by The Vanguard Group (2001–2010). |
| President and Chief Financial Officer at IBM (information | | |
| technology services); Fiduciary Member of IBM’s | Thomas J. Higgins | |
| Retirement Plan Committee. | Born 1957. Chief Financial Officer Since September |
| | 2008. Principal Occupation(s) During the Past Five |
| Scott C. Malpass | Years: Principal of The Vanguard Group, Inc.; Chief |
| Born 1962. Trustee Since March 2012. Principal | Financial Officer of each of the investment companies |
| Occupation(s) During the Past Five Years: Chief | served by The Vanguard Group; Treasurer of each of |
| Investment Officer and Vice President at the University | the investment companies served by The Vanguard |
| of Notre Dame; Assistant Professor of Finance at the | Group (1998–2008). | |
| Mendoza College of Business at Notre Dame; Member | | |
| of the Notre Dame 403(b) Investment Committee; | Kathryn J. Hyatt | |
| Director of TIFF Advisory Services, Inc. (investment | Born 1955. Treasurer Since November 2008. Principal |
| advisor); Member of the Investment Advisory | Occupation(s) During the Past Five Years: Principal of |
| Committees of the Financial Industry Regulatory | The Vanguard Group, Inc.; Treasurer of each of the |
| Authority (FINRA) and of Major League Baseball. | investment companies served by The Vanguard |
| | Group; Assistant Treasurer of each of the investment |
| André F. Perold | companies served by The Vanguard Group (1988–2008). |
| Born 1952. Trustee Since December 2004. Principal | | |
| Occupation(s) During the Past Five Years: George | Heidi Stam | |
| Gund Professor of Finance and Banking at the Harvard | Born 1956. Secretary Since July 2005. Principal |
| Business School (retired 2011); Chief Investment | Occupation(s) During the Past Five Years: Managing |
| Officer and Managing Partner of HighVista Strategies | Director of The Vanguard Group, Inc.; General Counsel |
| LLC (private investment firm); Director of Rand | of The Vanguard Group; Secretary of The Vanguard |
| Merchant Bank; Overseer of the Museum of Fine | Group and of each of the investment companies |
| Arts Boston. | served by The Vanguard Group; Director and Senior |
| | Vice President of Vanguard Marketing Corporation. |
| Alfred M. Rankin, Jr. | | |
| Born 1941. Trustee Since January 1993. Principal | | |
| Occupation(s) During the Past Five Years: Chairman, | Vanguard Senior ManagementTeam |
| President, and Chief Executive Officer of NACCO | | |
| Industries, Inc. (forklift trucks/housewares/lignite); | Mortimer J. Buckley | Michael S. Miller |
| Director of Goodrich Corporation (industrial products/ | Kathleen C. Gubanich | James M. Norris |
| aircraft systems and services) and the National | Paul A. Heller | Glenn W. Reed |
| Association of Manufacturers; Chairman of the Board | Martha G. King | George U. Sauter |
| of the Federal Reserve Bank of Cleveland and of | Chris D. McIsaac | |
| University Hospitals of Cleveland; Advisory Chairman | | |
| of the Board of The Cleveland Museum of Art. | | |
| Chairman Emeritus and Senior Advisor |
| | |
| Peter F. Volanakis | John J. Brennan | |
| Born 1955. Trustee Since July 2009. Principal | Chairman, 1996–2009 | |
| Occupation(s) During the Past Five Years: President | Chief Executive Officer and President, 1996–2008 | |
| and Chief Operating Officer (retired 2010) of Corning | |
| Incorporated (communications equipment); Director | | |
| of SPX Corporation (multi-industry manufacturing); | | |
| Overseer of the Amos Tuck School of Business | Founder | |
| Administration at Dartmouth College; Advisor to the | | |
| Norris Cotton Cancer Center. | John C. Bogle | |
| Chairman and Chief Executive Officer, 1974–1996 | |
| |
1 Mr. McNabb is considered an “interested person,” as defined in the Investment Company Act of 1940, because he is an officer of the Vanguard funds.
2 December 2002 for Vanguard Equity Income Fund, Vanguard Growth Equity Fund, the Vanguard Municipal Bond Funds, and the Vanguard State Tax-Exempt Funds.
|  |
| P.O. Box 2600 |
| Valley Forge, PA 19482-2600 |
Connect with Vanguard® > vanguard.com
| |
| Fund Information > 800-662-7447 | |
| Direct Investor Account Services > 800-662-2739 | |
| Institutional Investor Services > 800-523-1036 | |
| Text Telephone for People | |
| With Hearing Impairment > 800-749-7273 | |
| |
| This material may be used in conjunction | |
| with the offering of shares of any Vanguard | |
| fund only if preceded or accompanied by | |
| the fund’s current prospectus. | |
| |
| All comparative mutual fund data are from Lipper Inc. or | |
| Morningstar, Inc., unless otherwise noted. | |
| |
| You can obtain a free copy of Vanguard’s proxy voting | |
| guidelines by visiting vanguard.com/proxyreporting or by | |
| calling Vanguard at 800-662-2739. The guidelines are | |
| also available from the SEC’s website, sec.gov. In | |
| addition, you may obtain a free report on how your fund | |
| voted the proxies for securities it owned during the 12 | |
| months ended June 30. To get the report, visit either | |
| vanguard.com/proxyreporting or sec.gov. | |
| |
| You can review and copy information about your fund at | |
| the SEC’s Public Reference Room in Washington, D.C. To | |
| find out more about this public service, call the SEC at | |
| 202-551-8090. Information about your fund is also | |
| available on the SEC’s website, and you can receive | |
| copies of this information, for a fee, by sending a | |
| request in either of two ways: via e-mail addressed to | |
| publicinfo@sec.gov or via regular mail addressed to the | |
| Public Reference Section, Securities and Exchange | |
| Commission, Washington, DC 20549-1520. | |
| |
| |
| | © 2012 The Vanguard Group, Inc. |
| | All rights reserved. |
| | Vanguard Marketing Corporation, Distributor. |
| |
| | Q3080 112012 |
| 
|
| Annual Report | September 30, 2012 |
| |
| Vanguard Target Retirement Funds |
| |
 |
| |
| Vanguard Target Retirement 2035 |
| Vanguard Target Retirement 2040 |
| Vanguard Target Retirement 2045 |
| Vanguard Target Retirement 2050 |
| Vanguard Target Retirement 2055 |
| Vanguard Target Retirement 2060 |
> For the 12 months ended September 30, 2012, the returns of the six Target Retirement Funds in this report ranged from 8.70% to 23.56%.
> The funds closely tracked their composite index benchmarks and were ahead of the average returns of their respective peer groups.
> Of the three underlying funds that make up the portfolios, Vanguard Total Bond Market II Index Fund posted the smallest return, while Vanguard Total Stock Market Index Fund had the strongest.
| |
| Contents | |
| Your Fund’s Total Returns. | 1 |
| Chairman’s Letter. | 2 |
| Target Retirement 2035 Fund. | 9 |
| Target Retirement 2040 Fund. | 18 |
| Target Retirement 2045 Fund. | 27 |
| Target Retirement 2050 Fund. | 36 |
| Target Retirement 2055 Fund. | 45 |
| Target Retirement 2060 Fund. | 54 |
| Your Fund’s After-Tax Returns. | 65 |
| About Your Fund’s Expenses. | 67 |
| Glossary. | 69 |
Please note: The opinions expressed in this report are just that—informed opinions. They should not be considered promises or advice.
Also, please keep in mind that the information and opinions cover the period through the date on the front of this report. Of course, the risks of investing in your fund are spelled out in the prospectus.
See the Glossary for definitions of investment terms used in this report.
About the cover: Our cover photograph shows rigging on the HMSSurprise, a replica of an 18th-century Royal Navy frigate. It was featured in the 2003 movie Master and Commander: The Far Side of the World, which was based on Patrick O’Brian’s sea novels, set amid the Napoleonic Wars. Vanguard was named for another ship of that era, the HMSVanguard, which was the flagship of British Admiral Horatio Nelson at the Battle of the Nile.
| |
| Your Fund’s Total Returns | |
| |
| |
| |
| |
| Fiscal Year Ended September 30, 2012 | |
| | Total |
| | Returns |
| Vanguard Target Retirement 2035 Fund | 22.98% |
| Target 2035 Composite Index | 23.16 |
| Mixed-Asset Target 2035 Funds Average | 21.38 |
| Mixed-Asset Target 2035 Funds Average: Derived from data provided by Lipper Inc. | |
| |
| Vanguard Target Retirement 2040 Fund | 23.43% |
| Target 2040 Composite Index | 23.58 |
| Mixed-Asset Target 2040 Funds Average | 21.50 |
| Mixed-Asset Target 2040 Funds Average: Derived from data provided by Lipper Inc. | |
| |
| Vanguard Target Retirement 2045 Fund | 23.47% |
| Target 2045 Composite Index | 23.58 |
| Mixed-Asset Target 2045 Funds Average | 22.95 |
| Mixed-Asset Target 2045 Funds Average: Derived from data provided by Lipper Inc. | |
| |
| Vanguard Target Retirement 2050 Fund | 23.46% |
| Target 2050 Composite Index | 23.58 |
| Mixed-Asset Target 2050+ Funds Average | 22.46 |
| Mixed-Asset Target 2050+ Funds Average: Derived from data provided by Lipper Inc. | |
| |
| Vanguard Target Retirement 2055 Fund | 23.56% |
| Target 2055 Composite Index | 23.58 |
| Mixed-Asset Target 2050+ Funds Average | 22.46 |
| Mixed-Asset Target 2050+ Funds Average: Derived from data provided by Lipper Inc. | |
| |
| Vanguard Target Retirement 2060 Fund (Inception: 1/19/2012) | 8.70% |
| Target 2060 Composite Index | 8.77 |
| Mixed-Asset Target 2050+ Funds Average | 7.83 |
| Mixed-Asset Target 2050+ Funds Average: Derived from data provided by Lipper Inc. | |
| For a benchmark description, see the Glossary. | |
Investments in Target Retirement Funds are subject to the risks of their underlying funds. The year in the fund name refers to the approximate year (the target date) when an investor in the fund would retire and leave the work force. The fund will gradually shift its emphasis from more aggressive investments to more conservative ones based on its target date. An investment in a Target Retirement Fund is not guaranteed at any time, including on or after the target date.
1

Chairman’s Letter
Dear Shareholder,
In sharp contrast to the previous year, global stock markets produced double-digit gains for the fiscal year ended September 30, 2012. Despite a few bumps tied to Europe’s debt problems and a slowdown in emerging markets, the Vanguard Target Retirement Funds covered in this report produced their best returns since inception.
This report covers the performance of Target Retirement Funds 2035 through 2060. (The Income Fund and the 2010 through 2030 Funds are discussed in a separate report.) Because the funds in this report are intended for investors who expect to retire in about 20 to 50 years, they’re more heavily invested in stocks than their shorter-dated counterparts. While a larger allocation to stocks can sometimes result in more volatility, during this past fiscal year it helped boost the funds’ performance. The fixed income portion of the funds’ portfolios turned in respectable but less notable returns.
Please note that on October 2 we announced that we will transition to new benchmark indexes for 22 of our index funds, including Total Stock Market Index Fund and Total International Stock Market Index Fund. Both of those funds are among the underlying funds in the Target Retirement Funds. Total Stock Market’s new benchmark will be the
2
CRSP US Total Market Index, and the new benchmark for Total International will be the FTSE Global All Cap ex US Index. The transition, which will take place over several months, is expected to provide shareholders with significant long-term savings on licensing fees paid to index providers.
Stocks notched a powerful rally, with help from central bankers
U.S. stocks surged 30% in the 12 months ended September 30, outpacing the gains of their international counterparts. The rally came amid moves by U.S. and European central bankers to quiet—at least temporarily—investors’ concerns about the U.S. economy and the finances of European governments and banks.
While U.S. stocks were the standouts, European and emerging markets stocks also posted double-digit results. The developed markets of the Pacific region were the weakest performers but still recorded a modest advance.
In July, the president of the European Central Bank declared that policymakers would do whatever was needed to preserve the euro common currency. That pronouncement was encouraging to investors, but Europe’s financial troubles are by no means resolved. Vanguard economists believe the most likely scenario is that the Eurozone will “muddle through” for several years, with occasional spikes in market volatility, as fiscal tightening continues in the face of weak economic growth.
| | | |
| Market Barometer | | | |
| |
| | | Average Annual Total Returns |
| | Periods Ended September 30, 2012 |
| | One | Three | Five |
| | Year | Years | Years |
| Stocks | | | |
| Russell 1000 Index (Large-caps) | 30.06% | 13.27% | 1.22% |
| Russell 2000 Index (Small-caps) | 31.91 | 12.99 | 2.21 |
| Dow Jones U.S. Total Stock Market Index | 30.00 | 13.29 | 1.53 |
| MSCI All Country World Index ex USA (International) | 14.48 | 3.17 | -4.12 |
| |
| Bonds | | | |
| Barclays U.S. Aggregate Bond Index (Broad taxable market) | 5.16% | 6.19% | 6.53% |
| Barclays Municipal Bond Index (Broad tax-exempt market) | 8.32 | 5.99 | 6.06 |
| Citigroup Three-Month U.S. Treasury Bill Index | 0.05 | 0.08 | 0.63 |
| |
| CPI | | | |
| Consumer Price Index | 1.99% | 2.33% | 2.11% |
3
Bonds produced solid returns; future results may be more muted
Bonds once again advanced; the broad U.S. taxable market returned about 5% for the 12 months. Among U.S. Treasuries, long-term bonds were particularly strong as they benefited from the Federal Reserve’s bond-buying program.
As bond prices rose, the yield of the 10-year U.S. Treasury note fell to a record low in July, closing below 1.5%. (Bond yields and prices move in opposite directions.) By the end of the period the yield had climbed, but it still remained low by historical standards.
Bondholders have enjoyed years of strong returns. But as Tim Buckley, our incoming chief investment officer, has noted, investors shouldn’t be surprised if future results are much more modest. As yields tumble, the scope for further declines—and price increases—diminishes.
The Federal Reserve announced on September 13 that it would continue to hold its target for short-term interest rates between 0% and 0.25% at least through mid-2015. The exceptionally low rates, in place since late 2008, kept a tight lid on returns from money market funds and savings accounts.
Expense Ratios
Your Fund Compared With Its Peer Group
| | |
| | Acquired Fund Fees | Peer Group |
| | and Expenses | Average |
| Target Retirement 2035 Fund | 0.19% | 0.54% |
| Target Retirement 2040 Fund | 0.19 | 0.63 |
| Target Retirement 2045 Fund | 0.19 | 0.54 |
| Target Retirement 2050 Fund | 0.19 | 0.62 |
| Target Retirement 2055 Fund | 0.19 | 0.62 |
| Target Retirement 2060 Fund | 0.18 | 0.62 |
The fund expense figures shown—drawn from the prospectus dated January 26, 2012—represent an estimate of the weighted average of the expense ratios and any transaction fees charged by the underlying mutual funds (the ”acquired” funds) in which the Target Retirement Funds invest. The Target Retirement Funds do not charge any expenses or fees of their own. For the fiscal year ended September 30, 2012, the acquired fund fees and expenses were 0.18% for the 2035 Fund, 0.18% for the 2040 Fund, 0.18% for the 2045 Fund, 0.18% for the 2050 Fund, 0.18% for the 2055 Fund, and 0.18% (annualized since inception) for the 2060 Fund. Peer-group expense ratios are derived from data provided by Lipper Inc. and capture information through year-end 2011.
Peer groups: For the 2035 Fund, Mixed-Asset Target 2035 Funds; for the 2040 Fund, Mixed-Asset Target 2040 Funds; for the 2045 Fund, Mixed-Asset Target 2045 Funds; for the 2050, 2055, and 2060 Funds, Mixed-Asset Target 2050+ Funds.
4
Funds’ returns strengthened as stock markets soared
The Target Retirement Funds are designed to enable investors who have neither the time nor the inclination to manage a retirement portfolio an opportunity to hold a diversified “fund of funds” that adjusts its asset allocation over time. Each portfolio shifts from a growth-oriented, stock-heavy asset allocation to one that is more conservative, focused on bonds, as the investor’s expected retirement date approaches.
As of September 30, the five funds with target dates from 2040 to 2060 held nearly 63% of their assets in U.S. stocks, 27% in international stocks, and 10% in bonds, while the 2035 Fund included slightly more bonds. The five funds’ returns ranged
Total Returns
Inception Through September 30, 2012
| |
| | Average |
| | Annual Return |
| Target Retirement 2035 Fund (Returns since inception: 10/27/2003) | 5.99% |
| Target 2035 Composite Index | 6.09 |
| Mixed-Asset Target 2035 Funds Average | 5.46 |
| Mixed-Asset Target 2035 Funds Average: Derived from data provided by Lipper Inc. | |
| |
| Target Retirement 2040 Fund (Returns since inception: 6/7/2006) | 4.26% |
| Target 2040 Composite Index | 4.31 |
| Mixed-Asset Target 2040 Funds Average | 3.13 |
| Mixed-Asset Target 2040 Funds Average: Derived from data provided by Lipper Inc. | |
| |
| Target Retirement 2045 Fund (Returns since inception: 10/27/2003) | 6.36% |
| Target 2045 Composite Index | 6.44 |
| Mixed-Asset Target 2045 Funds Average | 5.89 |
| Mixed-Asset Target 2045 Funds Average: Derived from data provided by Lipper Inc. | |
| |
| Target Retirement 2050 Fund (Returns since inception: 6/7/2006) | 4.34% |
| Target 2050 Composite Index | 4.39 |
| Mixed-Asset Target 2050+ Funds Average | 3.25 |
| Mixed-Asset Target 2050+ Funds Average: Derived from data provided by Lipper Inc. | |
The figures shown represent past performance, which is not a guarantee of future results. (Current performance may be lower or higher than the performance data cited. For performance data current to the most recent month-end, visit our website at vanguard.com/performance.) Note, too, that both investment returns and principal value can fluctuate widely, so an investor’s shares, when sold, could be worth more or less than their original cost.
The table does not include funds that have operated for less than three years.
5
from 8.70% for the 2060 Fund to 23.56% for the 2055 Fund. (The 2060 Fund was launched on January 19, 2012, and so its results reflect less than a full fiscal year of performance.)
Returns for the Target Retirement Funds were largely driven by the strength of their underlying stock funds. Vanguard Total Stock Market Index Fund briefly dipped into negative territory in the spring as worries about Europe’s debt crisis grew, but by the end of the fiscal period it had notched a 30% gain. (Returns for the underlying funds are for Investor Shares.) Vanguard Total International Stock Index Fund, which posted a 12-month return of –12% a year ago, made a significant turnaround during this latest fiscal period to return 15%. Surprisingly, the best performers in the international fund were European stocks, which were battered for parts of the year but surged in the wake of renewed commitments by the European Central Bank.
Vanguard Total Bond Market II Index Fund, the fixed income holding in each of the six funds, recorded a solid return of about 5%. Unlike last year, when the bond index fund was the best performer as investors sought the safety of U.S. Treasuries, investors this time around were more willing to take on risk.
The funds’ impressive record of tracking their indexes
The six Vanguard Target Retirement Funds included in this report have successfully tracked their indexes and produced competitive results since their inceptions.
The funds’ inception dates range from October 2003 to January 2012. During their relatively short lifespans, they have experienced frequently volatile stock market environments. They have tracked their indexes closely, even though the benchmarks’ returns don’t reflect any operating or transaction costs. In addition, each fund’s average annual return has surpassed that of its appropriate peer group.
The funds’ success is a tribute to the skill of their investment advisors, Vanguard’s Equity Investment Group and Fixed Income Group, whose combined experience in portfolio construction and management techniques reflect more than 20 years of indexing. For a look at how the funds’ costs compare with the average expenses of their respective peer groups, please see the table on page 4.
6
The lessons of the financial crisis remain relevant four years later
In September, the end of your fund’s fiscal year, we marked the fourth anniversary of Lehman Brothers’ collapse, the start of the 2008–2009 financial crisis. When the Lehman news broke, I was speaking to institutional clients at an event in Washington, D.C., all of three weeks into my new role as Vanguard’s CEO.
In the ensuing months, I was struck both by how fortunate I was to work with a great team of Vanguard “crew” and by the remarkable steadiness demonstrated by our clients. Many clients experienced significant losses, but signs of panic were few. On balance, they remained committed to their long-term investment programs and managed to benefit from the financial markets’ subsequent recovery.
As the crisis recedes further in time, it’s important not to lose sight of the lessons that it illuminated about investing and sound financial practices generally. First among those lessons is that diversification does work. Diversification didn’t immunize investors from the market’s decline, but it certainly helped to insulate them from the worst of it.
Second, saving money and living within your means are critical. Investors are acting on this lesson as they pay off debt, which is a form of saving, and increase their savings rates from the dangerously low levels that prevailed before the crisis.
Third, having the courage to stick with a sound investment plan—as so many of our clients did—is important during volatile, uncertain times. Investors who resisted the urge to bail out of stocks at the depths of the crisis have largely been rewarded in the succeeding years.
I am very optimistic that, if investors embrace these lessons, they can give themselves a better chance of reaching their long-term goals.
As always, thank you for entrusting your assets to Vanguard.
Sincerely,

F. William McNabb III
Chairman and Chief Executive Officer
October 10, 2012
7
Your Fund’s Performance at a Glance
September 30, 2011, Through September 30, 2012
| | | | |
| | | | Distributions Per Share |
| | Starting | Ending | Income | Capital |
| | Share Price | Share Price | Dividends | Gains |
| Target Retirement 2035 Fund | $11.77 | $14.15 | $0.281 | $0.006 |
| Target Retirement 2040 Fund | $19.26 | $23.26 | $0.444 | $0.009 |
| Target Retirement 2045 Fund | $12.10 | $14.61 | $0.286 | $0.005 |
| Target Retirement 2050 Fund | $19.17 | $23.16 | $0.439 | $0.008 |
| Target Retirement 2055 Fund | $20.45 | $24.81 | $0.391 | $0.013 |
| Target Retirement 2060 Fund (Inception: | | | | |
| 1/19/2012) | $20.00 | $21.74 | $0.000 | $0.000 |
| | | |
| Asset Allocation on September 30, 2012 | | | |
| | | | Short-Term |
| | Stocks | Bonds | Reserves |
| Target Retirement 2035 Fund | 86.3% | 13.7% | 0.0% |
| Target Retirement 2040 Fund | 89.9% | 10.1% | 0.0% |
| Target Retirement 2045 Fund | 89.8% | 10.2% | 0.0% |
| Target Retirement 2050 Fund | 89.8% | 10.2% | 0.0% |
| Target Retirement 2055 Fund | 90.0% | 10.0% | 0.0% |
| Target Retirement 2060 Fund | 90.1% | 9.9% | 0.0% |
Note: As of September 30, 2012, international stock weightings for the 2035, 2040, 2045, 2050, 2055, and 2060 Funds were 26%, 27%, 27%, 27%, 27%, and 27% of assets, respectively.
8
Target Retirement 2035 Fund
Fund Profile
As of September 30, 2012
| |
| Total Fund Characteristics | |
| Ticker Symbol | VTTHX |
| 30-Day SEC Yield | 1.97% |
| Acquired Fund Fees and Expenses1 | 0.19% |
| |
| Allocation to Underlying Vanguard Funds | |
| Vanguard Total Stock Market Index Fund | |
| Investor Shares | 60.3% |
| Vanguard Total International Stock Index | |
| Fund Investor Shares | 26.0 |
| Vanguard Total Bond Market II Index Fund | |
| Investor Shares | 13.7 |
| | |
| Total Fund Volatility Measures | |
| | Target 2035 | MSCI US |
| | Composite | Broad Market |
| | Index | Index |
| R-Squared | 1.00 | 0.99 |
| Beta | 1.00 | 0.91 |
These measures show the degree and timing of the fund’s fluctuations compared with the indexes over 36 months.
Fund Asset Allocation
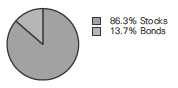
1 This figure—drawn from the prospectus dated January 26, 2012—represents an estimate of the weighted average of the expense ratios and any transaction fees charged by the underlying mutual funds (the ”acquired” funds) in which the Target Retirement 2035 Fund invests. The fund does not charge any expenses or fees of its own. For the fiscal year ended September 30, 2012, the acquired fund fees and expenses were 0.18%.
9
Target Retirement 2035 Fund
Performance Summary
All of the returns in this report represent past performance, which is not a guarantee of future results that may be achieved by the fund. (Current performance may be lower or higher than the performance data cited. For performance data current to the most recent month-end, visit our website at vanguard.com/performance.) Note, too, that both investment returns and principal value can fluctuate widely, so an investor’s shares, when sold, could be worth more or less than their original cost. The returns shown do not reflect taxes that a shareholder would pay on fund distributions or on the sale of fund shares.
Cumulative Performance: October 27, 2003, Through September 30, 2012
Initial Investment of $10,000
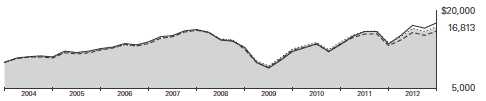
| | | | |
| | | Average Annual Total Returns | |
| | Periods Ended September 30, 2012 | |
| | | | Since | Final Value |
| | One | Five | Inception | of a $10,000 |
| | Year | Years | (10/27/2003) | Investment |
| Target Retirement 2035 Fund | 22.98% | 0.83% | 5.99% | $16,813 |
| Target 2035 Composite Index | 23.16 | 0.91 | 6.09 | 16,957 |
| Mixed-Asset Target 2035 Funds | | | | |
| Average | 21.38 | -0.15 | 5.46 | 16,076 |
| MSCI US Broad Market Index | 30.30 | 1.55 | 6.58 | 17,664 |
For a benchmark description, see the Glossary.
Mixed-Asset Target 2035 Funds Average: Derived from data provided by Lipper Inc.
"Since Inception" performance is calculated from the inception date for both the fund and its comparative standards.
See Financial Highlights for dividend and capital gains information.
10
Target Retirement 2035 Fund
Fiscal-Year Total Returns (%): October 27, 2003, Through September 30, 2012
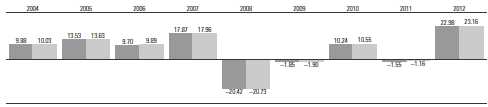
|
| Target Retirement 2035 Fund |
| Target 2035 Composite Index |
For a benchmark description, see the Glossary.
11
Target Retirement 2035 Fund
Financial Statements
Statement of Net Assets
As of September 30, 2012
The fund reports a complete list of its holdings in regulatory filings four times in each fiscal year, at the quarter-ends. For the second and fourth fiscal quarters, the lists appear in the fund’s semiannual and annual reports to shareholders. For the first and third fiscal quarters, the fund files the lists with the Securities and Exchange Commission on Form N-Q. Shareholders can look up the fund’s Forms N-Q on the SEC’s website at sec.gov. Forms N-Q may also be reviewed and copied at the SEC’s Public Reference Room (see the back cover of this report for further information).
| | |
| | | Market |
| | | Value |
| | Shares | ($000) |
| Investment Companies (99.9%) | | |
| U.S. Stock Fund (60.2%) | | |
| Vanguard Total Stock Market Index Fund Investor Shares | 238,956,741 | 8,564,210 |
| |
| International Stock Fund (26.0%) | | |
| Vanguard Total International Stock Index Fund Investor Shares | 259,431,590 | 3,691,711 |
| |
| Bond Fund (13.7%) | | |
| 1 Vanguard Total Bond Market II Index Fund Investor Shares | 175,510,300 | 1,944,654 |
| Total Investments (99.9%) (Cost $12,486,627) | | 14,200,575 |
| Other Assets and Liabilities (0.1%) | | |
| Other Assets | | 59,771 |
| Liabilities | | (40,340) |
| | | 19,431 |
| Net Assets (100%) | | |
| Applicable to 1,004,639,249 outstanding $.001 par value shares of | | |
| beneficial interest (unlimited authorization) | | 14,220,006 |
| Net Asset Value Per Share | | $14.15 |
| |
| |
| At September 30, 2012, net assets consisted of: | | |
| | | Amount |
| | | ($000) |
| Paid-in Capital | | 12,373,626 |
| Undistributed Net Investment Income | | 198,122 |
| Accumulated Net Realized Losses | | (65,690) |
| Unrealized Appreciation (Depreciation) | | 1,713,948 |
| Net Assets | | 14,220,006 |
See Note A in Notes to Financial Statements.
1 Affiliated fund available only to Vanguard funds and certain trusts and accounts managed by Vanguard.
See accompanying Notes, which are an integral part of the Financial Statements.
12
| |
| Target Retirement 2035 Fund | |
| |
| |
| Statement of Operations | |
| |
| | Year Ended |
| | September 30, 2012 |
| | ($000) |
| Investment Income | |
| Income | |
| Income Distributions Received | 331,291 |
| Net Investment Income—Note B | 331,291 |
| Realized Net Gain (Loss) | |
| Capital Gain Distributions Received | 14,954 |
| Investment Securities Sold | 16,841 |
| Realized Net Gain (Loss) | 31,795 |
| Change in Unrealized Appreciation (Depreciation) of Investment Securities | 2,077,103 |
| Net Increase (Decrease) in Net Assets Resulting from Operations | 2,440,189 |
See accompanying Notes, which are an integral part of the Financial Statements.
13
| | |
| Target Retirement 2035 Fund | | |
| |
| |
| Statement of Changes in Net Assets | | |
| |
| | Year Ended September 30, |
| | 2012 | 2011 |
| | ($000) | ($000) |
| Increase (Decrease) in Net Assets | | |
| Operations | | |
| Net Investment Income | 331,291 | 196,416 |
| Realized Net Gain (Loss) | 31,795 | 1,505 |
| Change in Unrealized Appreciation (Depreciation) | 2,077,103 | (502,631) |
| Net Increase (Decrease) in Net Assets Resulting from Operations | 2,440,189 | (304,710) |
| Distributions | | |
| Net Investment Income | (249,484) | (181,829) |
| Realized Capital Gain1 | (5,327) | (40,834) |
| Total Distributions | (254,811) | (222,663) |
| Capital Share Transactions | | |
| Issued | 3,574,347 | 3,401,770 |
| Issued in Lieu of Cash Distributions | 252,543 | 220,834 |
| Redeemed | (2,031,576) | (2,078,454) |
| Net Increase (Decrease) from Capital Share Transactions | 1,795,314 | 1,544,150 |
| Total Increase (Decrease) | 3,980,692 | 1,016,777 |
| Net Assets | | |
| Beginning of Period | 10,239,314 | 9,222,537 |
| End of Period2 | 14,220,006 | 10,239,314 |
1 Includes fiscal 2012 and 2011 short-term gain distributions totaling $5,327,000 and $9,246,000, respectively. Short-term gain distributions are treated as ordinary income dividends for tax purposes.
2 Net Assets—End of Period includes undistributed net investment income of $198,122,000 and $116,315,000.
See accompanying Notes, which are an integral part of the Financial Statements.
14
| | | | | |
| Target Retirement 2035 Fund | | | | | |
| |
| |
| Financial Highlights | | | | | |
| |
| |
| For a Share Outstanding | | | Year Ended September 30, |
| Throughout Each Period | 2012 | 2011 | 2010 | 2009 | 2008 |
| Net Asset Value, Beginning of Period | $11.77 | $12.22 | $11.31 | $11.90 | $15.25 |
| Investment Operations | | | | | |
| Net Investment Income | .344 | .235 | .250 | .2731 | .293 |
| Capital Gain Distributions Received | .016 | .006 | — | — | — |
| Net Realized and Unrealized Gain (Loss) | | | | | |
| on Investments | 2.307 | (.402) | .898 | (.564) | (3.353) |
| Total from Investment Operations | 2.667 | (.161) | 1.148 | (.291) | (3.060) |
| Distributions | | | | | |
| Dividends from Net Investment Income | (.281) | (.236) | (.238) | (.299) | (.290) |
| Distributions from Realized Capital Gains | (.006) | (.053) | — | — | — |
| Total Distributions | (.287) | (.289) | (.238) | (.299) | (.290) |
| Net Asset Value, End of Period | $14.15 | $11.77 | $12.22 | $11.31 | $11.90 |
| |
| Total Return2 | 22.98% | -1.55% | 10.24% | -1.85% | -20.42% |
| |
| Ratios/Supplemental Data | | | | | |
| Net Assets, End of Period (Millions) | $14,220 | $10,239 | $9,223 | $6,780 | $5,030 |
| Ratio of Total Expenses to Average Net Assets | — | — | — | — | — |
| Acquired Fund Fees and Expenses | 0.18% | 0.19% | 0.19% | 0.21% | 0.18% |
| Ratio of Net Investment Income to | | | | | |
| Average Net Assets | 2.68% | 1.81% | 2.24% | 2.88% | 2.28% |
| Portfolio Turnover Rate | 6% | 18%3 | 6% | 9%4 | 10% |
1 Calculated based on average shares outstanding.
2 Total returns do not include account service fees that may have applied in the periods shown. Fund prospectuses provide information aboutany applicable account service fees.
3 Excludes the value of mutual fund shares delivered and received in connection with a change in the fund’s international equity investments from Vanguard European, Pacific, and Emerging Markets Stock Index Funds to Vanguard Total International Stock Index Fund because those transactions were effected in kind and did not cause the fund to incur transaction costs.
4 Excludes the value of mutual fund shares delivered and received in connection with a change in the fund’s bond investments from Vanguard Total Bond Market Index Fund to Vanguard Total Bond Market II Index Fund because those transactions were effected in kind and did not cause the fund to incur transaction costs.
See accompanying Notes, which are an integral part of the Financial Statements.
15
Target Retirement 2035 Fund
Notes to Financial Statements
Vanguard Target Retirement 2035 Fund is registered under the Investment Company Act of 1940 as an open-end investment company, or mutual fund. The fund follows a balanced investment strategy by investing in selected Vanguard funds to achieve its targeted allocation of assets to U.S. stocks, international stocks, and bonds.
A. The following significant accounting policies conform to generally accepted accounting principles for U.S. mutual funds. The fund consistently follows such policies in preparing its financial statements.
1. Security Valuation: Investments are valued at the net asset value of each underlying Vanguard fund determined as of the close of the New York Stock Exchange (generally 4 p.m., Eastern time) on the valuation date.
2. Federal Income Taxes: The fund intends to continue to qualify as a regulated investment company and distribute all of its taxable income. Management has analyzed the fund’s tax positions taken for all open federal income tax years (September 30, 2009–2012), and has concluded that no provision for federal income tax is required in the fund’s financial statements.
3. Distributions: Distributions to shareholders are recorded on the ex-dividend date.
4. Other: Income and capital gain distributions received are recorded on the ex-dividend date. Security transactions are accounted for on the date securities are bought or sold. Costs used to determine realized gains (losses) on the sale of investment securities are those of the specific securities sold.
B. Under a service agreement, The Vanguard Group furnishes investment advisory, corporate management, administrative, marketing, and distribution services to the fund. The service agreement provides that the fund’s expenses may be reduced or eliminated to the extent of savings realized by the Vanguard funds by the operation of the fund. Accordingly, all incremental expenses for services provided by Vanguard and all other expenses incurred by the fund during the period ended September 30, 2012, were borne by the funds in which the fund invests. The fund’s trustees and officers are also directors and officers of Vanguard and the funds in which the fund invests.
C. Various inputs may be used to determine the value of the fund’s investments. These inputs are summarized in three broad levels for financial statement purposes. The inputs or methodologies used to value securities are not necessarily an indication of the risk associated with investing in those securities.
Level 1—Quoted prices in active markets for identical securities.
Level 2—Other significant observable inputs (including quoted prices for similar securities, interest rates, prepayment speeds, credit risk, etc.).
Level 3—Significant unobservable inputs (including the fund’s own assumptions used to determine the fair value of investments).
At September 30, 2012, 100% of the market value of the fund’s investments was determined based on Level 1 inputs.
D. Distributions are determined on a tax basis and may differ from net investment income and realized capital gains for financial reporting purposes. Differences may be permanent or temporary. Permanent differences are reclassified among capital accounts in the financial statements to reflect their tax character. Temporary differences arise when certain items of income, expense, gain, or loss are recognized in different periods for financial statement and tax purposes; these differences will reverse at some time in the future. Differences in classification may also result from the treatment of short-term gains as ordinary income for tax purposes.
16
Target Retirement 2035 Fund
For tax purposes, at September 30, 2012, the fund had $199,713,000 of ordinary income available for distribution. Tax-basis amounts required to be distributed in December 2011 included short term gain distributions received from Vanguard Total Bond Market II Index Fund in December 2011. Short-term capital gain distributions received are treated as ordinary income for tax purposes, and cannot be offset by capital losses. At September 30, 2012, the fund had available capital losses totaling $60,815,000 that may be carried forward indefinitely to offset future capital gains.
At September 30, 2012, the cost of investment securities for tax purposes was $12,493,094,000. Net unrealized appreciation of investment securities for tax purposes was $1,707,481,000, consisting of unrealized gains of $1,918,772,000 on securities that had risen in value since their purchase and $211,291,000 in unrealized losses on securities that had fallen in value since their purchase.
E. During the period ended September 30, 2012, the fund purchased $2,608,198,000 of investment securities and sold $729,608,000 of investment securities, other than temporary cash investments.
F. Capital shares issued and redeemed were:
| | |
| | Year Ended September 30, |
| | 2012 | 2011 |
| | Shares | Shares |
| | (000) | (000) |
| Issued | 269,022 | 257,014 |
| Issued in Lieu of Cash Distributions | 20,171 | 16,883 |
| Redeemed | (154,290) | (158,773) |
| Net Increase (Decrease) in Shares Outstanding | 134,903 | 115,124 |
G. In preparing the financial statements as of September 30, 2012, management considered the impact of subsequent events for potential recognition or disclosure in these financial statements.
17
Target Retirement 2040 Fund
Fund Profile
As of September 30, 2012
| |
| Total Fund Characteristics | |
| Ticker Symbol | VFORX |
| 30-Day SEC Yield | 1.96% |
| Acquired Fund Fees and Expenses1 | 0.19% |
| |
| Allocation to Underlying Vanguard Funds | |
| Vanguard Total Stock Market Index Fund | |
| Investor Shares | 62.7% |
| Vanguard Total International Stock Index | |
| Fund Investor Shares | 27.2 |
| Vanguard Total Bond Market II Index Fund | |
| Investor Shares | 10.1 |
| | |
| Total Fund Volatility Measures | |
| | Target 2040 | MSCI US |
| | Composite | Broad Market |
| | Index | Index |
| R-Squared | 1.00 | 0.99 |
| Beta | 1.01 | 0.93 |
These measures show the degree and timing of the fund’s fluctuations compared with the indexes over 36 months.
Fund Asset Allocation
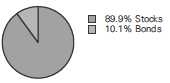
1 This figure—drawn from the prospectus dated January 26, 2012—represents an estimate of the weighted average of the expense ratios and any transaction fees charged by the underlying mutual funds (the ”acquired” funds) in which the Target Retirement 2040 Fund invests. The fund does not charge any expenses or fees of its own. For the fiscal year ended September 30, 2012, the acquired fund fees and expenses were 0.18%.
18
Target Retirement 2040 Fund
Performance Summary
All of the returns in this report represent past performance, which is not a guarantee of future results that may be achieved by the fund. (Current performance may be lower or higher than the performance data cited. For performance data current to the most recent month-end, visit our website at vanguard.com/performance.) Note, too, that both investment returns and principal value can fluctuate widely, so an investor’s shares, when sold, could be worth more or less than their original cost. The returns shown do not reflect taxes that a shareholder would pay on fund distributions or on the sale of fund shares.
Cumulative Performance: June 7, 2006, Through September 30, 2012
Initial Investment of $10,000
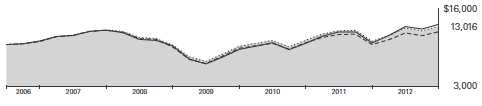
| | | | |
| | | Average Annual Total Returns | |
| | Periods Ended September 30, 2012 | |
| | | | Since | Final Value |
| | One | Five | Inception | of a $10,000 |
| | Year | Years | (6/7/2006) | Investment |
| Target Retirement 2040 Fund | 23.43% | 0.90% | 4.26% | $13,016 |
| Target 2040 Composite Index | 23.58 | 0.92 | 4.31 | 13,055 |
| Mixed-Asset Target 2040 Funds | | | | |
| Average | 21.50 | -0.44 | 3.13 | 12,148 |
| MSCI US Broad Market Index | 30.30 | 1.55 | 4.73 | 13,390 |
For a benchmark description, see the Glossary.
Mixed-Asset Target 2040 Funds Average: Derived from data provided by Lipper Inc.
"Since Inception" performance is calculated from the inception date for both the fund and its comparative standards
See Financial Highlights for dividend and capital gains information.
19
Target Retirement 2040 Fund
Fiscal-Year Total Returns (%): June 7, 2006, Through September 30, 2012
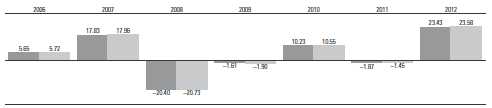
|
| Target Retirement 2040 Fund |
| Target 2040 Composite Index |
20
For a benchmark description, see the Glossary.
Target Retirement 2040 Fund
Financial Statements
Statement of Net Assets
As of September 30, 2012
The fund reports a complete list of its holdings in regulatory filings four times in each fiscal year, at the quarter-ends. For the second and fourth fiscal quarters, the lists appear in the fund’s semiannual and annual reports to shareholders. For the first and third fiscal quarters, the fund files the lists with the Securities and Exchange Commission on Form N-Q. Shareholders can look up the fund’s Forms N-Q on the SEC’s website at sec.gov. Forms N-Q may also be reviewed and copied at the SEC’s Public Reference Room (see the back cover of this report for further information).
| | |
| | | Market |
| | | Value |
| | Shares | ($000) |
| Investment Companies (99.8%) | | |
| U.S. Stock Fund (62.7%) | | |
| Vanguard Total Stock Market Index Fund Investor Shares | 139,526,471 | 5,000,629 |
| |
| International Stock Fund (27.1%) | | |
| Vanguard Total International Stock Index Fund Investor Shares | 152,105,073 | 2,164,455 |
| |
| Bond Fund (10.0%) | | |
| 1 Vanguard Total Bond Market II Index Fund Investor Shares | 72,252,619 | 800,559 |
| Total Investment Companies (Cost $7,025,045) | | 7,965,643 |
| Temporary Cash Investment (0.0%) | | |
| Money Market Fund (0.0%) | | |
| 1 Vanguard Market Liquidity Fund, 0.163% (Cost $994) | 994,230 | 994 |
| Total Investments (99.8%) (Cost $7,026,039) | | 7,966,637 |
| Other Assets and Liabilities (0.2%) | | |
| Other Assets | | 25,591 |
| Liabilities | | (9,898) |
| | | 15,693 |
| Net Assets (100%) | | |
| Applicable to 343,195,564 outstanding $.001 par value shares of | | |
| beneficial interest (unlimited authorization) | | 7,982,330 |
| Net Asset Value Per Share | | $23.26 |
| |
| |
| At September 30, 2012, net assets consisted of: | | |
| | | Amount |
| | | ($000) |
| Paid-in Capital | | 6,936,892 |
| Undistributed Net Investment Income | | 110,201 |
| Accumulated Net Realized Losses | | (5,361) |
| Unrealized Appreciation (Depreciation) | | 940,598 |
| Net Assets | | 7,982,330 |
See Note A in Notes to Financial Statements.
1 Affiliated fund available only to Vanguard funds and certain trusts and accounts managed by Vanguard. Rate shown for Vanguard Market Liquidity Fund is the 7-day yield.
See accompanying Notes, which are an integral part of the Financial Statements.
21
| |
| Target Retirement 2040 Fund | |
| |
| |
| Statement of Operations | |
| |
| | Year Ended |
| | September 30, 2012 |
| | ($000) |
| Investment Income | |
| Income | |
| Income Distributions Received | 178,202 |
| Net Investment Income—Note B | 178,202 |
| Realized Net Gain (Loss) | |
| Capital Gain Distributions Received | 6,250 |
| Investment Securities Sold | 5,071 |
| Realized Net Gain (Loss) | 11,321 |
| Change in Unrealized Appreciation (Depreciation) of Investment Securities | 1,107,410 |
| Net Increase (Decrease) in Net Assets Resulting from Operations | 1,296,933 |
See accompanying Notes, which are an integral part of the Financial Statements.
22
| | |
| Target Retirement 2040 Fund | | |
| |
| |
| Statement of Changes in Net Assets | | |
| |
| | Year Ended September 30, |
| | 2012 | 2011 |
| | ($000) | ($000) |
| Increase (Decrease) in Net Assets | | |
| Operations | | |
| Net Investment Income | 178,202 | 88,335 |
| Realized Net Gain (Loss) | 11,321 | 27,057 |
| Change in Unrealized Appreciation (Depreciation) | 1,107,410 | (344,764) |
| Net Increase (Decrease) in Net Assets Resulting from Operations | 1,296,933 | (229,372) |
| Distributions | | |
| Net Investment Income | (121,325) | (74,229) |
| Realized Capital Gain1 | (2,459) | (14,523) |
| Total Distributions | (123,784) | (88,752) |
| Capital Share Transactions | | |
| Issued | 2,765,586 | 2,363,000 |
| Issued in Lieu of Cash Distributions | 122,539 | 88,014 |
| Redeemed | (1,056,098) | (986,609) |
| Net Increase (Decrease) from Capital Share Transactions | 1,832,027 | 1,464,405 |
| Total Increase (Decrease) | 3,005,176 | 1,146,281 |
| Net Assets | | |
| Beginning of Period | 4,977,154 | 3,830,873 |
| End of Period2 | 7,982,330 | 4,977,154 |
1 Includes fiscal 2012 and 2011 short-term gain distributions totaling $2,459,000 and $14,523,000, respectively. Short-term gain distributions are treated as ordinary income dividends for tax purposes.
2 Net Assets—End of Period includes undistributed net investment income of $110,201,000 and $53,324,000.
See accompanying Notes, which are an integral part of the Financial Statements.
23
| | | | | |
| Target Retirement 2040 Fund | | | | | |
| |
| |
| Financial Highlights | | | | | |
| |
| |
| For a Share Outstanding | | | Year Ended September 30, |
| Throughout Each Period | 2012 | 2011 | 2010 | 2009 | 2008 |
| Net Asset Value, Beginning of Period | $19.26 | $20.03 | $18.52 | $19.36 | $24.70 |
| Investment Operations | | | | | |
| Net Investment Income | .559 | .369 | .393 | .4351 | .4941 |
| Capital Gain Distributions Received | .022 | .006 | — | — | — |
| Net Realized and Unrealized Gain (Loss) | | | | | |
| on Investments | 3.872 | (.705) | 1.485 | (.849) | (5.464) |
| Total from Investment Operations | 4.453 | (.330) | 1.878 | (.414) | (4.970) |
| Distributions | | | | | |
| Dividends from Net Investment Income | (.444) | (.368) | (.368) | (.426) | (.370) |
| Distributions from Realized Capital Gains | (.009) | (.072) | — | — | — |
| Total Distributions | (.453) | (.440) | (.368) | (.426) | (.370) |
| Net Asset Value, End of Period | $23.26 | $19.26 | $20.03 | $18.52 | $19.36 |
| |
| Total Return2 | 23.43% | -1.87% | 10.23% | -1.61% | -20.40% |
| |
| Ratios/Supplemental Data | | | | | |
| Net Assets, End of Period (Millions) | $7,982 | $4,977 | $3,831 | $2,330 | $1,199 |
| Ratio of Total Expenses to Average Net Assets | — | — | — | — | — |
| Acquired Fund Fees and Expenses | 0.18% | 0.19% | 0.19% | 0.21% | 0.19% |
| Ratio of Net Investment Income to | | | | | |
| Average Net Assets | 2.69% | 1.79% | 2.23% | 2.78% | 2.24% |
| Portfolio Turnover Rate | 3% | 15%3 | 7% | 9%4 | 4% |
1 Calculated based on average shares outstanding.
2 Total returns do not include account service fees that may have applied in the periods shown. Fund prospectuses provide information about any applicable account service fees.
3 Excludes the value of mutual fund shares delivered and received in connection with a change in the fund’s international equity investments from Vanguard European, Pacific, and Emerging Markets Stock Index Funds to Vanguard Total International Stock Index Fund because those transactions were effected in kind and did not cause the fund to incur transaction costs.
4 Excludes the value of mutual fund shares delivered and received in connection with a change in the fund’s bond investments from Vanguard Total Bond Market Index Fund to Vanguard Total Bond Market II Index Fund because those transactions were effected in kind and did not cause the fund to incur transaction costs.
See accompanying Notes, which are an integral part of the Financial Statements.
24
Target Retirement 2040 Fund
Notes to Financial Statements
Vanguard Target Retirement 2040 Fund is registered under the Investment Company Act of 1940 as an open-end investment company, or mutual fund. The fund follows a balanced investment strategy by investing in selected Vanguard funds to achieve its targeted allocation of assets to U.S. stocks, international stocks, and bonds.
A. The following significant accounting policies conform to generally accepted accounting principles for U.S. mutual funds. The fund consistently follows such policies in preparing its financial statements.
1. Security Valuation: Investments are valued at the net asset value of each underlying Vanguard fund determined as of the close of the New York Stock Exchange (generally 4 p.m., Eastern time) on the valuation date.
2. Federal Income Taxes: The fund intends to continue to qualify as a regulated investment company and distribute all of its taxable income. Management has analyzed the fund’s tax positions taken for all open federal income tax years (September 30, 2009–2012), and has concluded that no provision for federal income tax is required in the fund’s financial statements.
3. Distributions: Distributions to shareholders are recorded on the ex-dividend date.
4. Other: Income and capital gain distributions received are recorded on the ex-dividend date. Security transactions are accounted for on the date securities are bought or sold. Costs used to determine realized gains (losses) on the sale of investment securities are those of the specific securities sold.
B. Under a service agreement, The Vanguard Group furnishes investment advisory, corporate management, administrative, marketing, and distribution services to the fund. The service agreement provides that the fund’s expenses may be reduced or eliminated to the extent of savings realized by the Vanguard funds by the operation of the fund. Accordingly, all incremental expenses for services provided by Vanguard and all other expenses incurred by the fund during the year ended September 30, 2012, were borne by the funds in which the fund invests. The fund’s trustees and officers are also directors and officers of Vanguard and the funds in which the fund invests.
C. Various inputs may be used to determine the value of the fund’s investments. These inputs are summarized in three broad levels for financial statement purposes. The inputs or methodologies used to value securities are not necessarily an indication of the risk associated with investing in those securities.
Level 1—Quoted prices in active markets for identical securities.
Level 2—Other significant observable inputs (including quoted prices for similar securities, interest rates, prepayment speeds, credit risk, etc.).
Level 3—Significant unobservable inputs (including the fund’s own assumptions used to determine the fair value of investments).
At September 30, 2012, 100% of the market value of the fund’s investments was determined based on Level 1 inputs.
D. Distributions are determined on a tax basis and may differ from net investment income and realized capital gains for financial reporting purposes. Differences may be permanent or temporary. Permanent differences are reclassified among capital accounts in the financial statements to reflect their tax character. Temporary differences arise when certain items of income, expense, gain, or loss are recognized in different periods for financial statement and tax purposes; these differences will reverse at some time in the future. Differences in classification may also result from the treatment of short-term gains as ordinary income for tax purposes.
25
Target Retirement 2040 Fund
For tax purposes, at September 30, 2012, the fund had $110,636,000 of ordinary income available for distribution. Tax-basis amounts required to be distributed in December 2011 included short-term gain distributions received from Vanguard Total Bond Market II Index Fund in December 2011. Short-term capital gain distributions received are treated as ordinary income for tax purposes, and cannot be offset by capital losses.
At September 30, 2012, the cost of investment securities for tax purposes was $7,031,835,000. Net unrealized appreciation of investment securities for tax purposes was $934,802,000, consisting of unrealized gains of $1,030,036,000 on securities that had risen in value since their purchase and $95,234,000 in unrealized losses on securities that had fallen in value since their purchase.
E. During the year ended September 30, 2012, the fund purchased $2,088,588,000 of investment securities and sold $203,161,000 of investment securities, other than temporary cash investments.
F. Capital shares issued and redeemed were:
| | |
| | Year Ended September 30, |
| | 2012 | 2011 |
| | Shares | Shares |
| | (000) | (000) |
| Issued | 127,086 | 108,785 |
| Issued in Lieu of Cash Distributions | 5,969 | 4,097 |
| Redeemed | (48,337) | (45,683) |
| Net Increase (Decrease) in Shares Outstanding | 84,718 | 67,199 |
G. In preparing the financial statements as of September 30, 2012, management considered the impact of subsequent events for potential recognition or disclosure in these financial statements.
26
Target Retirement 2045 Fund
Fund Profile
As of September 30, 2012
| |
| Total Fund Characteristics | |
| Ticker Symbol | VTIVX |
| 30-Day SEC Yield | 1.96% |
| Acquired Fund Fees and Expenses1 | 0.19% |
| |
| Allocation to Underlying Vanguard Funds | |
| Vanguard Total Stock Market Index Fund | |
| Investor Shares | 62.8% |
| Vanguard Total International Stock Index | |
| Fund Investor Shares | 27.0 |
| Vanguard Total Bond Market II Index Fund | |
| Investor Shares | 10.2 |
| | |
| Total Fund Volatility Measures | |
| | Target 2045 | MSCI US |
| | Composite | Broad Market |
| | Index | Index |
| R-Squared | 1.00 | 0.99 |
| Beta | 1.01 | 0.93 |
These measures show the degree and timing of the fund’s fluctuations compared with the indexes over 36 months.
Fund Asset Allocation
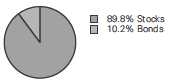
1 This figure—drawn from the prospectus dated January 26, 2012—represents an estimate of the weighted average of the expense ratios and any transaction fees charged by the underlying mutual funds (the ”acquired” funds) in which the Target Retirement 2045 Fund invests. The fund does not charge any expenses or fees of its own. For the fiscal year ended September 30, 2012, the acquired fund fees and expenses were 0.18%.
27
Target Retirement 2045 Fund
Performance Summary
All of the returns in this report represent past performance, which is not a guarantee of future results that may be achieved by the fund. (Current performance may be lower or higher than the performance data cited. For performance data current to the most recent month-end, visit our website at vanguard.com/performance.) Note, too, that both investment returns and principal value can fluctuate widely, so an investor’s shares, when sold, could be worth more or less than their original cost. The returns shown do not reflect taxes that a shareholder would pay on fund distributions or on the sale of fund shares.
Cumulative Performance: October 27, 2003, Through September 30, 2012
Initial Investment of $10,000
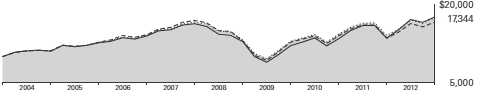
| | | | |
| | | Average Annual Total Returns | |
| | Periods Ended September 30, 2012 | |
| | | | Since | Final Value |
| | One | Five | Inception | of a $10,000 |
| | Year | Years | (10/27/2003) | Investment |
| Target Retirement 2045 Fund | 23.47% | 0.88% | 6.36% | $17,344 |
| Target 2045 Composite Index | 23.58 | 0.92 | 6.44 | 17,452 |
| Mixed-Asset Target 2045 Funds | | | | |
| Average | 22.95 | -0.37 | 5.89 | 16,670 |
| MSCI US Broad Market Index | 30.30 | 1.55 | 6.58 | 17,664 |
For a benchmark description, see the Glossary.
Mixed-Asset Target 2045 Funds Average: Derived from data provided by Lipper Inc.
"Since Inception" performance is calculated from the inception date for both the fund and its comparative standards.
See Financial Highlights for dividend and capital gains information.
28
Target Retirement 2045 Fund
Fiscal-Year Total Returns (%): October 27, 2003, Through September 30, 2012
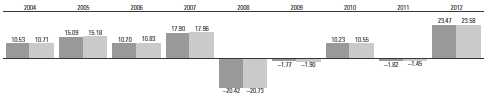
|
| Target Retirement 2045 Fund |
| Target 2045 Composite Index |
For a benchmark description, see the Glossary.
29
Target Retirement 2045 Fund
Financial Statements
Statement of Net Assets
As of September 30, 2012
The fund reports a complete list of its holdings in regulatory filings four times in each fiscal year, at the quarter-ends. For the second and fourth fiscal quarters, the lists appear in the fund’s semiannual and annual reports to shareholders. For the first and third fiscal quarters, the fund files the lists with the Securities and Exchange Commission on Form N-Q. Shareholders can look up the fund’s Forms N-Q on the SEC’s website at sec.gov. Forms N-Q may also be reviewed and copied at the SEC’s Public Reference Room (see the back cover of this report for further information).
| | |
| | | Market |
| | | Value |
| | Shares | ($000) |
| Investment Companies (99.8%) | | |
| U.S. Stock Fund (62.7%) | | |
| Vanguard Total Stock Market Index Fund Investor Shares | 142,842,943 | 5,119,491 |
| |
| International Stock Fund (27.0%) | | |
| Vanguard Total International Stock Index Fund Investor Shares | 154,615,017 | 2,200,172 |
| |
| Bond Fund (10.1%) | | |
| 1 Vanguard Total Bond Market II Index Fund Investor Shares | 74,679,824 | 827,453 |
| Total Investment Companies (Cost $7,168,191) | | 8,147,116 |
| Temporary Cash Investment (0.0%) | | |
| Money Market Fund (0.0%) | | |
| 1 Vanguard Market Liquidity Fund, 0.163% (Cost $1,270) | 1,270,433 | 1,270 |
| Total Investments (99.8%) (Cost $7,169,461) | | 8,148,386 |
| Other Assets and Liabilities (0.2%) | | |
| Other Assets | | 30,720 |
| Liabilities | | (16,080) |
| | | 14,640 |
| Net Assets (100%) | | |
| Applicable to 558,919,785 outstanding $.001 par value shares of | | |
| beneficial interest (unlimited authorization) | | 8,163,026 |
| Net Asset Value Per Share | | $14.61 |
| |
| |
| At September 30, 2012, net assets consisted of: | | |
| | | Amount |
| | | ($000) |
| Paid-in Capital | | 7,102,941 |
| Undistributed Net Investment Income | | 112,258 |
| Accumulated Net Realized Losses | | (31,098) |
| Unrealized Appreciation (Depreciation) | | 978,925 |
| Net Assets | | 8,163,026 |
See Note A in Notes to Financial Statements.
1 Affiliated fund available only to Vanguard funds and certain trusts and accounts managed by Vanguard. Rate shown for Vanguard Market Liquidity Fund is the 7-day yield.
See accompanying Notes, which are an integral part of the Financial Statements.
30
| |
| Target Retirement 2045 Fund | |
| |
| |
| Statement of Operations | |
| |
| | Year Ended |
| | September 30, 2012 |
| | ($000) |
| Investment Income | |
| Income | |
| Income Distributions Received | 188,310 |
| Net Investment Income—Note B | 188,310 |
| Realized Net Gain (Loss) | |
| Capital Gain Distributions Received | 6,866 |
| Investment Securities Sold | 17,379 |
| Realized Net Gain (Loss) | 24,245 |
| Change in Unrealized Appreciation (Depreciation) of Investment Securities | 1,185,281 |
| Net Increase (Decrease) in Net Assets Resulting from Operations | 1,397,836 |
See accompanying Notes, which are an integral part of the Financial Statements.
31
| | |
| Target Retirement 2045 Fund | | |
| |
| |
| Statement of Changes in Net Assets | | |
| |
| | Year Ended September 30, |
| | 2012 | 2011 |
| | ($000) | ($000) |
| Increase (Decrease) in Net Assets | | |
| Operations | | |
| Net Investment Income | 188,310 | 106,266 |
| Realized Net Gain (Loss) | 24,245 | 7,614 |
| Change in Unrealized Appreciation (Depreciation) | 1,185,281 | (321,143) |
| Net Increase (Decrease) in Net Assets Resulting from Operations | 1,397,836 | (207,263) |
| Distributions | | |
| Net Investment Income | (138,613) | (97,564) |
| Realized Capital Gain1 | (2,423) | (41,929) |
| Total Distributions | (141,036) | (139,493) |
| Capital Share Transactions | | |
| Issued | 2,414,872 | 2,176,140 |
| Issued in Lieu of Cash Distributions | 140,029 | 138,621 |
| Redeemed | (1,350,612) | (1,184,181) |
| Net Increase (Decrease) from Capital Share Transactions | 1,204,289 | 1,130,580 |
| Total Increase (Decrease) | 2,461,089 | 783,824 |
| Net Assets | | |
| Beginning of Period | 5,701,937 | 4,918,113 |
| End of Period2 | 8,163,026 | 5,701,937 |
1 Includes fiscal 2012 and 2011 short-term gain distributions totaling $2,423,000 and $20,965,000, respectively. Short-term gain distributions are treated as ordinary income dividends for tax purposes.
2 Net Assets—End of Period includes undistributed net investment income of $112,258,000 and $62,561,000.
See accompanying Notes, which are an integral part of the Financial Statements.
32
| | | | | |
| Target Retirement 2045 Fund | | | | | |
| |
| |
| Financial Highlights | | | | | |
| |
| |
| For a Share Outstanding | | | Year Ended September 30, |
| Throughout Each Period | 2012 | 2011 | 2010 | 2009 | 2008 |
| Net Asset Value, Beginning of Period | $12.10 | $12.64 | $11.70 | $12.29 | $15.75 |
| Investment Operations | | | | | |
| Net Investment Income | .354 | .237 | .257 | .2811 | .303 |
| Capital Gain Distributions Received | .014 | .005 | — | — | — |
| Net Realized and Unrealized Gain (Loss) | | | | | |
| on Investments | 2.433 | (.436) | .929 | (.570) | (3.463) |
| Total from Investment Operations | 2.801 | (.194) | 1.186 | (.289) | (3.160) |
| Distributions | | | | | |
| Dividends from Net Investment Income | (.286) | (.242) | (.246) | (.301) | (.300) |
| Distributions from Realized Capital Gains | (.005) | (.104) | — | — | — |
| Total Distributions | (.291) | (.346) | (.246) | (.301) | (.300) |
| Net Asset Value, End of Period | $14.61 | $12.10 | $12.64 | $11.70 | $12.29 |
| |
| Total Return2 | 23.47% | -1.82% | 10.23% | -1.77% | -20.42% |
| |
| Ratios/Supplemental Data | | | | | |
| Net Assets, End of Period (Millions) | $8,163 | $5,702 | $4,918 | $3,560 | $2,493 |
| Ratio of Total Expenses to Average Net Assets | — | — | — | — | — |
| Acquired Fund Fees and Expenses | 0.18% | 0.19% | 0.19% | 0.21% | 0.18% |
| Ratio of Net Investment Income to | | | | | |
| Average Net Assets | 2.70% | 1.79% | 2.24% | 2.86% | 2.28% |
| Portfolio Turnover Rate | 7% | 16%3 | 6% | 10%4 | 9% |
1 Calculated based on average shares outstanding.
2 Total returns do not include account service fees that may have applied in the periods shown. Fund prospectuses provide information about any applicable account service fees.
3 Excludes the value of mutual fund shares delivered and received in connection with a change in the fund’s international equity investments from Vanguard European, Pacific, and Emerging Markets Stock Index Funds to Vanguard Total International Stock Index Fund because those transactions were effected in kind and did not cause the fund to incur transaction costs.
4 Excludes the value of mutual fund shares delivered and received in connection with a change in the fund’s bond investments from Vanguard Total Bond Market Index Fund to Vanguard Total Bond Market II Index Fund because those transactions were effected in kind and did not cause the fund to incur transaction costs.
See accompanying Notes, which are an integral part of the Financial Statements.
33
Target Retirement 2045 Fund
Notes to Financial Statements
Vanguard Target Retirement 2045 Fund is registered under the Investment Company Act of 1940 as an open-end investment company, or mutual fund. The fund follows a balanced investment strategy by investing in selected Vanguard funds to achieve its targeted allocation of assets to U.S. stocks, international stocks, and bonds.
A. The following significant accounting policies conform to generally accepted accounting principles for U.S. mutual funds. The fund consistently follows such policies in preparing its financial statements.
1. Security Valuation: Investments are valued at the net asset value of each underlying Vanguard fund determined as of the close of the New York Stock Exchange (generally 4 p.m., Eastern time) on the valuation date.
2. Federal Income Taxes: The fund intends to continue to qualify as a regulated investment company and distribute all of its taxable income. Management has analyzed the fund’s tax positions taken for all open federal income tax years (September 30, 2009–2012), and has concluded that no provision for federal income tax is required in the fund’s financial statements.
3. Distributions: Distributions to shareholders are recorded on the ex-dividend date.
4. Other: Income and capital gain distributions received are recorded on the ex-dividend date. Security transactions are accounted for on the date securities are bought or sold. Costs used to determine realized gains (losses) on the sale of investment securities are those of the specific securities sold.
B. Under a service agreement, The Vanguard Group furnishes investment advisory, corporate management, administrative, marketing, and distribution services to the fund. The service agreement provides that the fund’s expenses may be reduced or eliminated to the extent of savings realized by the Vanguard funds by the operation of the fund. Accordingly, all incremental expenses for services provided by Vanguard and all other expenses incurred by the fund during the year ended September 30, 2012, were borne by the funds in which the fund invests. The fund’s trustees and officers are also directors and officers of Vanguard and the funds in which the fund invests.
C. Various inputs may be used to determine the value of the fund’s investments. These inputs are summarized in three broad levels for financial statement purposes. The inputs or methodologies used to value securities are not necessarily an indication of the risk associated with investing in those securities.
Level 1—Quoted prices in active markets for identical securities.
Level 2—Other significant observable inputs (including quoted prices for similar securities, interest rates, prepayment speeds, credit risk, etc.).
Level 3—Significant unobservable inputs (including the fund’s own assumptions used to determine the fair value of investments).
At September 30, 2012, 100% of the market value of the fund’s investments was determined based on Level 1 inputs.
D. Distributions are determined on a tax basis and may differ from net investment income and realized capital gains for financial reporting purposes. Differences may be permanent or temporary. Permanent differences are reclassified among capital accounts in the financial statements to reflect their tax character. Temporary differences arise when certain items of income, expense, gain, or loss are recognized in different periods for financial statement and tax purposes; these differences will reverse at some time in the future. Differences in classification may also result from the treatment of short-term gains as ordinary income for tax purposes.
34
Target Retirement 2045 Fund
For tax purposes, at September 30, 2012, the fund had $112,933,000 of ordinary income available for distribution. Tax-basis amounts required to be distributed in December 2011 included short-term gain distributions received from Vanguard Total Bond Market II Index Fund in December 2011. Short-term capital gain distributions received are treated as ordinary income for tax purposes, and cannot be offset by capital losses. At September 30, 2012, the fund had available capital losses totaling $30,381,000 that may be carried forward indefinitely to offset future net capital gains.
At September 30, 2012, the cost of investment securities for tax purposes was $7,170,853,000. Net unrealized appreciation of investment securities for tax purposes was $977,533,000, consisting of unrealized gains of $1,097,333,000 on securities that had risen in value since their purchase and $119,800,000 in unrealized losses on securities that had fallen in value since their purchase.
E. During the year ended September 30, 2012, the fund purchased $1,708,182,000 of investment securities and sold $455,381,000 of investment securities, other than temporary cash investments.
F. Capital shares issued and redeemed were:
| | |
| | Year Ended September 30, |
| | 2012 | 2011 |
| | Shares | Shares |
| | (000) | (000) |
| Issued | 176,519 | 159,565 |
| Issued in Lieu of Cash Distributions | 10,863 | 10,276 |
| Redeemed | (99,852) | (87,425) |
| Net Increase (Decrease) in Shares Outstanding | 87,530 | 82,416 |
G. In preparing the financial statements as of September 30, 2012, management considered the impact of subsequent events for potential recognition or disclosure in these financial statements.
35
Target Retirement 2050 Fund
Fund Profile
As of September 30, 2012
| |
| Total Fund Characteristics | |
| Ticker Symbol | VFIFX |
| 30-Day SEC Yield | 1.96% |
| Acquired Fund Fees and Expenses1 | 0.19% |
| |
| Allocation to Underlying Vanguard Funds | |
| Vanguard Total Stock Market Index Fund | |
| Investor Shares | 62.8% |
| Vanguard Total International Stock Index | |
| Fund Investor Shares | 27.0 |
| Vanguard Total Bond Market II Index Fund | |
| Investor Shares | 10.2 |
| | |
| Total Fund Volatility Measures | |
| | Target 2050 | MSCI US |
| | Composite | Broad Market |
| | Index | Index |
| R-Squared | 1.00 | 0.99 |
| Beta | 1.01 | 0.93 |
These measures show the degree and timing of the fund’s fluctuations compared with the indexes over 36 months.
Fund Asset Allocation
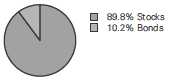
1 This figure—drawn from the prospectus dated January 26, 2012—represents an estimate of the weighted average of the expense ratios and any transaction fees charged by the underlying mutual funds (the ”acquired” funds) in which the Target Retirement 2050 Fund invests. The fund does not charge any expenses or fees of its own. For the fiscal year ended September 30, 2012, the acquired fund fees and expenses were 0.18%.
36
Target Retirement 2050 Fund
Performance Summary
All of the returns in this report represent past performance, which is not a guarantee of future results that may be achieved by the fund. (Current performance may be lower or higher than the performance data cited. For performance data current to the most recent month-end, visit our website at vanguard.com/performance.) Note, too, that both investment returns and principal value can fluctuate widely, so an investor’s shares, when sold, could be worth more or less than their original cost. The returns shown do not reflect taxes that a shareholder would pay on fund distributions or on the sale of fund shares.
Cumulative Performance: June 7, 2006, Through September 30, 2012
Initial Investment of $10,000
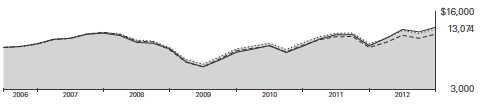
| | | | |
| | | Average Annual Total Returns | |
| | Periods Ended September 30, 2012 | |
| | | | Since | Final Value |
| | One | Five | Inception | of a $10,000 |
| | Year | Years | (6/7/2006) | Investment |
| Target Retirement 2050 Fund | 23.46% | 0.88% | 4.34% | $13,074 |
| Target 2050 Composite Index | 23.58 | 0.92 | 4.39 | 13,113 |
| Mixed-Asset Target 2050+ Funds | | | | |
| Average | 22.46 | -0.50 | 3.25 | 12,236 |
| MSCI US Broad Market Index | 30.30 | 1.55 | 4.73 | 13,390 |
For a benchmark description, see the Glossary.
Mixed-Asset Target 2050+ Funds Average: Derived from data provided by Lipper Inc.
"Since Inception" performance is calculated from the inception date for both the fund and its comparative standards.
See Financial Highlights for dividend and capital gains information.
37
Target Retirement 2050 Fund
Fiscal-Year Total Returns (%): June 7, 2006, Through September 30, 2012
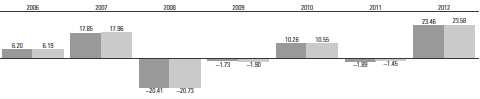
|
| Target Retirement 2050 Fund |
| Target 2050 Composite Index |
For a benchmark description, see the Glossary.
38
Target Retirement 2050 Fund
Financial Statements
Statement of Net Assets
As of September 30, 2012
The fund reports a complete list of its holdings in regulatory filings four times in each fiscal year, at the quarter-ends. For the second and fourth fiscal quarters, the lists appear in the fund’s semiannual and annual reports to shareholders. For the first and third fiscal quarters, the fund files the lists with the Securities and Exchange Commission on Form N-Q. Shareholders can look up the fund’s Forms N-Q on the SEC’s website at sec.gov. Forms N-Q may also be reviewed and copied at the SEC’s Public Reference Room (see the back cover of this report for further information).
| | |
| | | Market |
| | | Value |
| | Shares | ($000) |
| Investment Companies (99.7%) | | |
| U.S. Stock Fund (62.7%) | | |
| Vanguard Total Stock Market Index Fund Investor Shares | 60,606,332 | 2,172,131 |
| |
| International Stock Fund (26.9%) | | |
| Vanguard Total International Stock Index Fund Investor Shares | 65,630,504 | 933,922 |
| |
| Bond Fund (10.1%) | | |
| 1 Vanguard Total Bond Market II Index Fund Investor Shares | 31,672,163 | 350,928 |
| Total Investment Companies (Cost $3,051,246) | | 3,456,981 |
| Temporary Cash Investment (0.0%) | | |
| Money Market Fund (0.0%) | | |
| 1 Vanguard Market Liquidity Fund, 0.163% (Cost $600) | 600,448 | 600 |
| Total Investments (99.7%) (Cost $3,051,846) | | 3,457,581 |
| Other Assets and Liabilities (0.3%) | | |
| Other Assets | | 14,448 |
| Liabilities | | (4,711) |
| | | 9,737 |
| Net Assets (100%) | | |
| Applicable to 149,730,707 outstanding $.001 par value shares of | | |
| beneficial interest (unlimited authorization) | | 3,467,318 |
| Net Asset Value Per Share | | $23.16 |
| |
| |
| At September 30, 2012, net assets consisted of: | | |
| | | Amount |
| | | ($000) |
| Paid-in Capital | | 3,020,662 |
| Undistributed Net Investment Income | | 46,793 |
| Accumulated Net Realized Losses | | (5,872) |
| Unrealized Appreciation (Depreciation) | | 405,735 |
| Net Assets | | 3,467,318 |
See Note A in Notes to Financial Statements.
1 Affiliated fund available only to Vanguard funds and certain trusts and accounts managed by Vanguard. Rate shown for Vanguard Market Liquidity Fund is the 7-day yield.
See accompanying Notes, which are an integral part of the Financial Statements.
39
| |
| Target Retirement 2050 Fund | |
| |
| |
| Statement of Operations | |
| |
| | Year Ended |
| | September 30, 2012 |
| | ($000) |
| Investment Income | |
| Income | |
| Income Distributions Received | 75,474 |
| Net Investment Income—Note B | 75,474 |
| Realized Net Gain (Loss) | |
| Capital Gain Distributions Received | 2,605 |
| Investment Securities Sold | 1,261 |
| Realized Net Gain (Loss) | 3,866 |
| Change in Unrealized Appreciation (Depreciation) of Investment Securities | 465,291 |
| Net Increase (Decrease) in Net Assets Resulting from Operations | 544,631 |
See accompanying Notes, which are an integral part of the Financial Statements.
40
| | |
| Target Retirement 2050 Fund | | |
| |
| |
| Statement of Changes in Net Assets | | |
| |
| | Year Ended September 30, |
| | 2012 | 2011 |
| | ($000) | ($000) |
| Increase (Decrease) in Net Assets | | |
| Operations | | |
| Net Investment Income | 75,474 | 36,062 |
| Realized Net Gain (Loss) | 3,866 | 24,874 |
| Change in Unrealized Appreciation (Depreciation) | 465,291 | (159,824) |
| Net Increase (Decrease) in Net Assets Resulting from Operations | 544,631 | (98,888) |
| Distributions | | |
| Net Investment Income | (50,671) | (30,163) |
| Realized Capital Gain1 | (923) | (19,891) |
| Total Distributions | (51,594) | (50,054) |
| Capital Share Transactions | | |
| Issued | 1,387,997 | 1,174,424 |
| Issued in Lieu of Cash Distributions | 51,071 | 49,545 |
| Redeemed | (538,920) | (518,202) |
| Net Increase (Decrease) from Capital Share Transactions | 900,148 | 705,767 |
| Total Increase (Decrease) | 1,393,185 | 556,825 |
| Net Assets | | |
| Beginning of Period | 2,074,133 | 1,517,308 |
| End of Period2 | 3,467,318 | 2,074,133 |
1 Includes fiscal 2012 and 2011 short-term gain distributions totaling $923,000 and $10,109,000, respectively. Short-term gain distributions are treated as ordinary income dividends for tax purposes.
2 Net Assets—End of Period includes undistributed net investment income of $46,793,000 and $21,990,000.
See accompanying Notes, which are an integral part of the Financial Statements.
41
| | | | | |
| Target Retirement 2050 Fund | | | | | |
| |
| |
| Financial Highlights | | | | | |
| |
| |
| For a Share Outstanding | | | Year Ended September 30, |
| Throughout Each Period | 2012 | 2011 | 2010 | 2009 | 2008 |
| Net Asset Value, Beginning of Period | $19.17 | $20.10 | $18.58 | $19.43 | $24.79 |
| Investment Operations | | | | | |
| Net Investment Income | .549 | .360 | .399 | .4311 | .5031 |
| Capital Gain Distributions Received | .022 | .006 | — | — | — |
| Net Realized and Unrealized Gain (Loss) | | | | | |
| on Investments | 3.866 | (.682) | 1.492 | (.866) | (5.493) |
| Total from Investment Operations | 4.437 | (.316) | 1.891 | (.435) | (4.990) |
| Distributions | | | | | |
| Dividends from Net Investment Income | (.439) | (.370) | (.371) | (.415) | (.370) |
| Distributions from Realized Capital Gains | (.008) | (.244) | — | — | — |
| Total Distributions | (.447) | (.614) | (.371) | (.415) | (.370) |
| Net Asset Value, End of Period | $23.16 | $19.17 | $20.10 | $18.58 | $19.43 |
| |
| Total Return2 | 23.46% | -1.89% | 10.26% | -1.73% | -20.41% |
| |
| Ratios/Supplemental Data | | | | | |
| Net Assets, End of Period (Millions) | $3,467 | $2,074 | $1,517 | $924 | $409 |
| Ratio of Total Expenses to Average Net Assets | — | — | — | — | — |
| Acquired Fund Fees and Expenses | 0.18% | 0.19% | 0.19% | 0.21% | 0.19% |
| Ratio of Net Investment Income to | | | | | |
| Average Net Assets | 2.70% | 1.79% | 2.21% | 2.74% | 2.27% |
| Portfolio Turnover Rate | 4% | 15%3 | 10% | 8%4 | 4% |
1 Calculated based on average shares outstanding.
2 Total returns do not include account service fees that may have applied in the periods shown. Fund prospectuses provide information about any applicable account service fees.
3 Excludes the value of mutual fund shares delivered and received in connection with a change in the fund’s international equity investments from Vanguard European, Pacific, and Emerging Markets Stock Index Funds to Vanguard Total International Stock Index Fund because those transactions were effected in kind and did not cause the fund to incur transaction costs.
4 Excludes the value of mutual fund shares delivered and received in connection with a change in the fund’s bond investments from Vanguard Total Bond Market Index Fund to Vanguard Total Bond Market II Index Fund because those transactions were effected in kind and did not cause the fund to incur transaction costs.
See accompanying Notes, which are an integral part of the Financial Statements.
42
Target Retirement 2050 Fund
Notes to Financial Statements
Vanguard Target Retirement 2050 Fund is registered under the Investment Company Act of 1940 as an open-end investment company, or mutual fund. The fund follows a balanced investment strategy by investing in selected Vanguard funds to achieve its targeted allocation of assets to U.S. stocks, international stocks, and bonds.
A. The following significant accounting policies conform to generally accepted accounting principles for U.S. mutual funds. The fund consistently follows such policies in preparing its financial statements.
1. Security Valuation: Investments are valued at the net asset value of each underlying Vanguard fund determined as of the close of the New York Stock Exchange (generally 4 p.m., Eastern time) on the valuation date.
2. Federal Income Taxes: The fund intends to continue to qualify as a regulated investment company and distribute all of its taxable income. Management has analyzed the fund’s tax positions taken for all open federal income tax years (September 30, 2009–2012), and has concluded that no provision for federal income tax is required in the fund’s financial statements.
3. Distributions: Distributions to shareholders are recorded on the ex-dividend date.
4. Other: Income and capital gain distributions received are recorded on the ex-dividend date. Security transactions are accounted for on the date securities are bought or sold. Costs used to determine realized gains (losses) on the sale of investment securities are those of the specific securities sold.
B. Under a service agreement, The Vanguard Group furnishes investment advisory, corporate management, administrative, marketing, and distribution services to the fund. The service agreement provides that the fund’s expenses may be reduced or eliminated to the extent of savings realized by the Vanguard funds by the operation of the fund. Accordingly, all incremental expenses for services provided by Vanguard and all other expenses incurred by the fund during the year ended September 30, 2012, were borne by the funds in which the fund invests. The fund’s trustees and officers are also directors and officers of Vanguard and the funds in which the fund invests.
C. Various inputs may be used to determine the value of the fund’s investments. These inputs are summarized in three broad levels for financial statement purposes. The inputs or methodologies used to value securities are not necessarily an indication of the risk associated with investing in those securities.
Level 1—Quoted prices in active markets for identical securities.
Level 2—Other significant observable inputs (including quoted prices for similar securities, interest rates, prepayment speeds, credit risk, etc.).
Level 3—Significant unobservable inputs (including the fund’s own assumptions used to determine the fair value of investments).
At September 30, 2012, 100% of the market value of the fund’s investments was determined based on Level 1 inputs.
D. Distributions are determined on a tax basis and may differ from net investment income and realized capital gains for financial reporting purposes. Differences may be permanent or temporary. Permanent differences are reclassified among capital accounts in the financial statements to reflect their tax character. Temporary differences arise when certain items of income, expense, gain, or loss are recognized in different periods for financial statement and tax purposes; these differences will reverse at some time in the future. Differences in classification may also result from the treatment of short-term gains as ordinary income for tax purposes.
43
Target Retirement 2050 Fund
For tax purposes, at September 30, 2012, the fund had $46,986,000 of ordinary income available for distribution. Tax-basis amounts required to be distributed in December 2011 included short-term gain distributions received from Vanguard Total Bond II Index Fund in December 2011. Short-term capital gain distributions received are treated as ordinary income for tax purposes, and cannot be offset by capital losses. At September 30, 2012, the fund had available capital losses totaling $6,063,000 that may be carried forward indefinitely to offset future net capital gains.
At September 30, 2012, the cost of investment securities for tax purposes was $3,051,848,000. Net unrealized appreciation of investment securities for tax purposes was $405,733,000, consisting of unrealized gains of $443,094,000 on securities that had risen in value since their purchase and $37,361,000 in unrealized losses on securities that had fallen in value since their purchase.
E. During the year ended September 30, 2012, the fund purchased $1,020,461,000 of investment securities and sold $99,828,000 of investment securities, other than temporary cash investments.
F. Capital shares issued and redeemed were:
| | |
| | Year Ended September 30, |
| | 2012 | 2011 |
| | Shares | Shares |
| | (000) | (000) |
| Issued | 64,017 | 54,294 |
| Issued in Lieu of Cash Distributions | 2,499 | 2,317 |
| Redeemed | (25,002) | (23,901) |
| Net Increase (Decrease) in Shares Outstanding | 41,514 | 32,710 |
G. In preparing the financial statements as of September 30, 2012, management considered the impact of subsequent events for potential recognition or disclosure in these financial statements
44
Target Retirement 2055 Fund
Fund Profile
As of September 30, 2012
| |
| Total Fund Characteristics | |
| Ticker Symbol | VFFVX |
| 30-Day SEC Yield | 1.96% |
| Acquired Fund Fees and Expenses1 | 0.19% |
| |
| Allocation to Underlying Vanguard Funds | |
| Vanguard Total Stock Market Index Fund | |
| Investor Shares | 62.8% |
| Vanguard Total International Stock Index | |
| Fund Investor Shares | 27.2 |
| Vanguard Total Bond Market II Index Fund | |
| Investor Shares | 10.0 |
Fund Asset Allocation
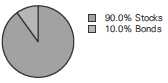
1 This figure—drawn from the prospectus dated January 26, 2012—represents an estimate of the weighted average of the expense ratios and any transaction fees charged by the underlying mutual funds (the ”acquired” funds) in which the Target Retirement 2055 Fund invests. The fund does not charge any expenses or fees of its own. For the fiscal year ended September 30, 2012, the acquired fund fees and expenses were 0.18%.
45
Target Retirement 2055 Fund
Performance Summary
All of the returns in this report represent past performance, which is not a guarantee of future results that may be achieved by the fund. (Current performance may be lower or higher than the performance data cited. For performance data current to the most recent month-end, visit our website at vanguard.com/performance.) Note, too, that both investment returns and principal value can fluctuate widely, so an investor’s shares, when sold, could be worth more or less than their original cost. The returns shown do not reflect taxes that a shareholder would pay on fund distributions or on the sale of fund shares.
Cumulative Performance: August 18, 2010, Through September 30, 2012
Initial Investment of $10,000
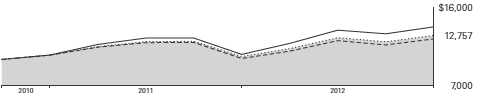
| | | |
| | Average Annual Total Returns | |
| | Periods Ended September 30, 2012 | |
| | | Since | Final Value |
| | One | Inception | of a $10,000 |
| | Year | (8/18/2010) | Investment |
| Target Retirement 2055 Fund | 23.56% | 12.18% | $12,757 |
| Target 2055 Composite Index | 23.58 | 12.32 | 12,792 |
| Mixed-Asset Target 2050+ Funds | | | |
| Average | 22.46 | 10.62 | 12,385 |
| MSCI US Broad Market Index | 30.30 | 16.38 | 13,789 |
For a benchmark description, see the Glossary.
Mixed-Asset Target 2050+ Funds Average: Derived from data provided by Lipper Inc.
"Since Inception" performance is calculated from the inception date for both the fund and its comparative standards.
See Financial Highlights for dividend and capital gains information.
46
Target Retirement 2055 Fund
Fiscal-Year Total Returns (%): August 18, 2010, Through September 30, 2012
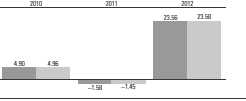
|
| Target Retirement 2055 Fund |
| Target 2055 Composite Index |
For a benchmark description, see the Glossary.
47
Target Retirement 2055 Fund
Financial Statements
Statement of Net Assets
As of September 30, 2012
The fund reports a complete list of its holdings in regulatory filings four times in each fiscal year, at the quarter-ends. For the second and fourth fiscal quarters, the lists appear in the fund’s semiannual and annual reports to shareholders. For the first and third fiscal quarters, the fund files the lists with the Securities and Exchange Commission on Form N-Q. Shareholders can look up the fund’s Forms N-Q on the SEC’s website at sec.gov. Forms N-Q may also be reviewed and copied at the SEC’s Public Reference Room (see the back cover of this report for further information).
| | |
| | | Market |
| | | Value |
| | Shares | ($000) |
| Investment Companies (99.3%) | | |
| U.S. Stock Fund (62.4%) | | |
| Vanguard Total Stock Market Index Fund Investor Shares | 6,625,092 | 237,443 |
| |
| International Stock Fund (27.0%) | | |
| Vanguard Total International Stock Index Fund Investor Shares | 7,228,698 | 102,864 |
| |
| Bond Fund (9.9%) | | |
| 1 Vanguard Total Bond Market II Index Fund Investor Shares | 3,410,724 | 37,791 |
| Total Investment Companies (Cost $358,276) | | 378,098 |
| Temporary Cash Investment (0.0%) | | |
| Money Market Fund (0.0%) | | |
| 1 Vanguard Market Liquidity Fund, 0.163% (Cost $179) | 178,673 | 179 |
| Total Investments (99.3%) (Cost $358,455) | | 378,277 |
| Other Assets and Liabilities (0.7%) | | |
| Other Assets | | 3,324 |
| Liabilities | | (827) |
| | | 2,497 |
| Net Assets (100%) | | |
| Applicable to 15,350,366 outstanding $.001 par value shares of | | |
| beneficial interest (unlimited authorization) | | 380,774 |
| Net Asset Value Per Share | | $24.81 |
| |
| |
| At September 30, 2012, net assets consisted of: | | |
| | | Amount |
| | | ($000) |
| Paid-in Capital | | 356,394 |
| Undistributed Net Investment Income | | 4,443 |
| Accumulated Net Realized Gains | | 115 |
| Unrealized Appreciation (Depreciation) | | 19,822 |
| Net Assets | | 380,774 |
See Note A in Notes to Financial Statements.
1 Affiliated fund available only to Vanguard funds and certain trusts and accounts managed by Vanguard. Rate shown for Vanguard Market Liquidity Fund is the 7-day yield.
See accompanying Notes, which are an integral part of the Financial Statements.
48
| |
| Target Retirement 2055 Fund | |
| |
| |
| Statement of Operations | |
| |
| | Year Ended |
| | September 30, 2012 |
| | ($000) |
| Investment Income | |
| Income | |
| Income Distributions Received | 6,645 |
| Net Investment Income—Note B | 6,645 |
| Realized Net Gain (Loss) | |
| Capital Gain Distributions Received | 186 |
| Investment Securities Sold | 228 |
| Realized Net Gain (Loss) | 414 |
| Change in Unrealized Appreciation (Depreciation) of Investment Securities | 35,775 |
| Net Increase (Decrease) in Net Assets Resulting from Operations | 42,834 |
See accompanying Notes, which are an integral part of the Financial Statements.
49
| | |
| Target Retirement 2055 Fund | | |
| |
| |
| Statement of Changes in Net Assets | | |
| |
| | Year Ended September 30, |
| | 2012 | 2011 |
| | ($000) | ($000) |
| Increase (Decrease) in Net Assets | | |
| Operations | | |
| Net Investment Income | 6,645 | 1,085 |
| Realized Net Gain (Loss) | 414 | (164) |
| Change in Unrealized Appreciation (Depreciation) | 35,775 | (16,009) |
| Net Increase (Decrease) in Net Assets Resulting from Operations | 42,834 | (15,088) |
| Distributions | | |
| Net Investment Income | (2,904) | (146) |
| Realized Capital Gain1 | (97) | (34) |
| Total Distributions | (3,001) | (180) |
| Capital Share Transactions | | |
| Issued | 286,736 | 163,181 |
| Issued in Lieu of Cash Distributions | 2,985 | 180 |
| Redeemed | (73,016) | (25,727) |
| Net Increase (Decrease) from Capital Share Transactions | 216,705 | 137,634 |
| Total Increase (Decrease) | 256,538 | 122,366 |
| Net Assets | | |
| Beginning of Period | 124,236 | 1,870 |
| End of Period2 | 380,774 | 124,236 |
1 Includes fiscal 2012 and 2011 short-term gain distributions totaling $97,000 and $34,000, respectively. Short-term gain distributions are treated as ordinary income dividends for tax purposes.
2 Net Assets—End of Period includes undistributed net investment income of $4,443,000 and $945,000.
See accompanying Notes, which are an integral part of the Financial Statements.
50
| | | |
| Target Retirement 2055 Fund | | | |
| |
| |
| Financial Highlights | | | |
| |
| |
| | | | Aug. 18, |
| | Year Ended | 20101 to |
| | September 30, | Sept. 30, |
| For a Share Outstanding Throughout Each Period | 2012 | 2011 | 2010 |
| Net Asset Value, Beginning of Period | $20.45 | $20.98 | $20.00 |
| Investment Operations | | | |
| Net Investment Income | .540 | .3882 | .063 |
| Capital Gain Distributions Received | .022 | .001 | — |
| Net Realized and Unrealized Gain (Loss) on Investments | 4.202 | (.698) | .917 |
| Total from Investment Operations | 4.764 | (.309) | .980 |
| Distributions | | | |
| Dividends from Net Investment Income | (.391) | (.179) | — |
| Distributions from Realized Capital Gains | (.013) | (.042) | — |
| Total Distributions | (.404) | (.221) | — |
| Net Asset Value, End of Period | $24.81 | $20.45 | $20.98 |
| |
| Total Return3 | 23.56% | -1.58% | 4.90% |
| |
| Ratios/Supplemental Data | | | |
| Net Assets, End of Period (Millions) | $381 | $124 | $2 |
| Ratio of Total Expenses to Average Net Assets | — | — | — |
| Acquired Fund Fees and Expenses | 0.18% | 0.19% | 0.22%4 |
| Ratio of Net Investment Income to Average Net Assets | 2.76% | 1.71% | 2.73%4 |
| Portfolio Turnover Rate | 3% | 12%5 | 3% |
1 Inception.
2 Calculated based on average shares outstanding.
3 Total returns do not include account service fees that may have applied in the periods shown. Fund prospectuses provide information about any applicable account service fees.
4 Annualized.
5 Excludes the value of mutual fund shares delivered and received in connection with a change in the fund’s international equity investments from Vanguard European, Pacific, and Emerging Markets Stock Index Funds to Vanguard Total International Stock Index Fund because those transactions were effected in kind and did not cause the fund to incur transaction costs.
See accompanying Notes, which are an integral part of the Financial Statements.
51
Target Retirement 2055 Fund
Notes to Financial Statements
Vanguard Target Retirement 2055 Fund is registered under the Investment Company Act of 1940 as an open-end investment company, or mutual fund. The fund follows a balanced investment strategy by investing in selected Vanguard funds to achieve its targeted allocation of assets to U.S. stocks, international stocks, and bonds.
A. The following significant accounting policies conform to generally accepted accounting principles for U.S. mutual funds. The fund consistently follows such policies in preparing its financial statements.
1. Security Valuation: Investments are valued at the net asset value of each underlying Vanguard fund determined as of the close of the New York Stock Exchange (generally 4 p.m., Eastern time) on the valuation date.
2. Federal Income Taxes: The fund intends to continue to qualify as a regulated investment company and distribute all of its taxable income. Management has analyzed the fund’s tax positions taken for all open federal income tax years (September 30, 2010–2012), and has concluded that no provision for federal income tax is required in the fund’s financial statements.
3. Distributions: Distributions to shareholders are recorded on the ex-dividend date.
4. Other: Income and capital gain distributions received are recorded on the ex-dividend date. Security transactions are accounted for on the date securities are bought or sold. Costs used to determine realized gains (losses) on the sale of investment securities are those of the specific securities sold.
B. Under a service agreement, The Vanguard Group furnishes investment advisory, corporate management, administrative, marketing, and distribution services to the fund. The service agreement provides that the fund’s expenses may be reduced or eliminated to the extent of savings realized by the Vanguard funds by the operation of the fund. Accordingly, all incremental expenses for services provided by Vanguard and all other expenses incurred by the fund during the year ended September 30, 2012, were borne by the funds in which the fund invests. The fund’s trustees and officers are also directors and officers of Vanguard and the funds in which the fund invests.
C. Various inputs may be used to determine the value of the fund’s investments. These inputs are summarized in three broad levels for financial statement purposes. The inputs or methodologies used to value securities are not necessarily an indication of the risk associated with investing in those securities.
Level 1—Quoted prices in active markets for identical securities.
Level 2—Other significant observable inputs (including quoted prices for similar securities, interest rates, prepayment speeds, credit risk, etc.).
Level 3—Significant unobservable inputs (including the fund’s own assumptions used to determine the fair value of investments).
At September 30, 2012, 100% of the market value of the fund’s investments was determined based on Level 1 inputs.
D. Distributions are determined on a tax basis and may differ from net investment income and realized capital gains for financial reporting purposes. Differences may be permanent or temporary. Permanent differences are reclassified among capital accounts in the financial statements to reflect their tax character. Temporary differences arise when certain items of income, expense, gain, or loss are recognized in different periods for financial statement and tax purposes; these differences will reverse at some time in the future. Differences in classification may also result from the treatment of short-term gains as ordinary income for tax purposes.
52
Target Retirement 2055 Fund
The fund used a tax accounting practice to treat a portion of the price of capital shares redeemed during the year as distributions from net investment income and realized capital gains. Accordingly, the fund has reclassified $243,000 from undistributed net investment income, and $4,000 from accumulated net realized gains, to paid-in capital.
For tax purposes, at September 30, 2012, the fund had $4,460,000 of ordinary income available for distribution. Tax-basis amounts required to be distributed in December 2011 included short-term gain distributions received from Vanguard Total Bond Market II Index Fund in December 2011. Short-term capital gain distributions received are treated as ordinary income for tax purposes, and cannot be offset by capital losses.
At September 30, 2012, the cost of investment securities for tax purposes was $358,455,000. Net unrealized appreciation of investment securities for tax purposes was $19,822,000, consisting of unrealized gains of $20,987,000 on securities that had risen in value since their purchase and $1,165,000 in unrealized losses on securities that had fallen in value since their purchase.
E. During the year ended September 30, 2012, the fund purchased $225,343,000 of investment securities and sold $7,434,000 of investment securities, other than temporary cash investments.
F. Capital shares issued and redeemed were:
| | |
| | Year Ended September 30, |
| | 2012 | 2011 |
| | Shares | Shares |
| | (000) | (000) |
| Issued | 12,295 | 7,096 |
| Issued in Lieu of Cash Distributions | 136 | 8 |
| Redeemed | (3,155) | (1,119) |
| Net Increase (Decrease) in Shares Outstanding | 9,276 | 5,985 |
G. In preparing the financial statements as of September 30, 2012, management considered the impact of subsequent events for potential recognition or disclosure in these financial statements.
53
Target Retirement 2060 Fund
Fund Profile
As of September 30, 2012
| |
| Total Fund Characteristics | |
| Ticker Symbol | VTTSX |
| 30-Day SEC Yield | 1.95% |
| Acquired Fund Fees and Expenses1 | 0.18% |
| |
| Allocation to Underlying Vanguard Funds | |
| Vanguard Total Stock Market Index Fund | |
| Investor Shares | 63.3% |
| Vanguard Total International Stock Index | |
| Fund Investor Shares | 26.8 |
| Vanguard Total Bond Market II Index Fund | |
| Investor Shares | 9.9 |
Fund Asset Allocation

1 This figure—drawn from the prospectus dated January 26, 2012—represents an estimate of the weighted average of the expense ratios and any transaction fees charged by the underlying mutual funds (the ”acquired” funds) in which the Target Retirement 2060 Fund invests. The fund does not charge any expenses or fees of its own. For the period from inception through September 30, 2012, the annualized acquired fund fees and expenses were 0.18%.
54
Target Retirement 2060 Fund
Performance Summary
All of the returns in this report represent past performance, which is not a guarantee of future results that may be achieved by the fund. (Current performance may be lower or higher than the performance data cited. For performance data current to the most recent month-end, visit our website at vanguard.com/performance.) Note, too, that both investment returns and principal value can fluctuate widely, so an investor’s shares, when sold, could be worth more or less than their original cost. The returns shown do not reflect taxes that a shareholder would pay on fund distributions or on the sale of fund shares.
Cumulative Performance: January 19, 2012, Through September 30, 2012
Initial Investment of $10,000
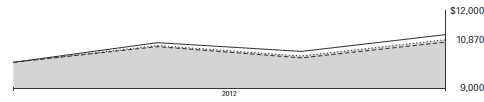
| | |
| | Total Returns | |
| | Period Ended September 30, 2012 | |
| | Since | Final Value |
| | Inception | of a $10,000 |
| | (1/19/2012) | Investment |
| Target Retirement 2060 Fund | 8.70% | $10,870 |
| Target 2060 Composite Index | 8.77 | 10,877 |
| Mixed-Asset Target 2050+ Funds | | |
| Average | 7.83 | 10,783 |
| MSCI US Broad Market Index | 10.73 | 11,073 |
For a benchmark description, see the Glossary.
Mixed-Asset Target 2050+ Funds Average: Derived from data provided by Lipper Inc.
"Since Inception" performance is calculated from the inception date for both the fund and its comparative standards.
See Financial Highlights for dividend and capital gains information.
55
Target Retirement 2060 Fund
Fiscal-Period Total Returns (%): January 19, 2012, Through September 30, 2012
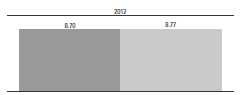
| |
| Target Retirement 2060 Fund |
| Target 2060 Composite Index |
For a benchmark description, see the Glossary.
56
Target Retirement 2060 Fund
Financial Statements
Statement of Net Assets
As of September 30, 2012
The fund reports a complete list of its holdings in regulatory filings four times in each fiscal year, at the quarter-ends. For the second and fourth fiscal quarters, the lists appear in the fund’s semiannual and annual reports to shareholders. For the first and third fiscal quarters, the fund files the lists with the Securities and Exchange Commission on Form N-Q. Shareholders can look up the fund’s Forms N-Q on the SEC’s website at sec.gov. Forms N-Q may also be reviewed and copied at the SEC’s Public Reference Room (see the back cover of this report for further information).
| | |
| | | Market |
| | | Value |
| | Shares | ($000) |
| Investment Companies (99.3%) | | |
| U.S. Stock Fund (62.9%) | | |
| Vanguard Total Stock Market Index Fund Investor Shares | 583,112 | 20,899 |
| |
| International Stock Fund (26.6%) | | |
| Vanguard Total International Stock Index Fund Investor Shares | 621,142 | 8,839 |
| |
| Bond Fund (9.8%) | | |
| 1 Vanguard Total Bond Market II Index Fund Investor Shares | 295,177 | 3,270 |
| Total Investment Companies (Cost $31,779) | | 33,008 |
| Temporary Cash Investment (1.0%) | | |
| Money Market Fund (1.0%) | | |
| 1 Vanguard Market Liquidity Fund, 0.163% (Cost $325) | 324,571 | 325 |
| Total Investments (100.3%) (Cost $32,104) | | 33,333 |
| Other Assets and Liabilities (-0.3%) | | |
| Other Assets | | 242 |
| Liabilities | | (346) |
| | | (104) |
| Net Assets (100%) | | |
| Applicable to 1,528,822 outstanding $.001 par value shares of | | |
| beneficial interest (unlimited authorization) | | 33,229 |
| Net Asset Value Per Share | | $21.74 |
| |
| |
| At September 30, 2012, net assets consisted of: | | |
| | | Amount |
| | | ($000) |
| Paid-in Capital | | 31,837 |
| Undistributed Net Investment Income | | 334 |
| Accumulated Net Realized Losses | | (171) |
| Unrealized Appreciation (Depreciation) | | 1,229 |
| Net Assets | | 33,229 |
See Note A in Notes to Financial Statements.
1 Affiliated fund available only to Vanguard funds and certain trusts and accounts managed by Vanguard. Rate shown for Vanguard Market Liquidity Fund is the 7-day yield.
See accompanying Notes, which are an integral part of the Financial Statements.
57
| |
| Target Retirement 2060 Fund | |
| |
| |
| Statement of Operations | |
| |
| | January 19, 20121 to |
| | September 30, 2012 |
| | ($000) |
| Investment Income | |
| Income | |
| Income Distributions Received | 334 |
| Net Investment Income—Note B | 334 |
| Realized Net Gain (Loss) | |
| Capital Gain Distributions Received | 1 |
| Investment Securities Sold | (172) |
| Realized Net Gain (Loss) | (171) |
| Change in Unrealized Appreciation (Depreciation) of Investment Securities | 1,229 |
| Net Increase (Decrease) in Net Assets Resulting from Operations | 1,392 |
| 1 Inception. | |
See accompanying Notes, which are an integral part of the Financial Statements.
58
| |
| Target Retirement 2060 Fund | |
| |
| |
| Statement of Changes in Net Assets | |
| |
| | January 19, 20121 to |
| | September 30, 2012 |
| | ($000) |
| Increase (Decrease) in Net Assets | |
| Operations | |
| Net Investment Income | 334 |
| Realized Net Gain (Loss) | (171) |
| Change in Unrealized Appreciation (Depreciation) | 1,229 |
| Net Increase (Decrease) in Net Assets Resulting from Operations | 1,392 |
| Distributions | |
| Net Investment Income | — |
| Realized Capital Gain | — |
| Capital Share Transactions | |
| Issued | 43,919 |
| Issued in Lieu of Cash Distributions | — |
| Redeemed | (12,082) |
| Net Increase (Decrease) from Capital Share Transactions | 31,837 |
| Total Increase (Decrease) | 33,229 |
| Net Assets | |
| Beginning of Period | — |
| End of Period2 | 33,229 |
1 Inception.
2 Net Assets—End of Period includes undistributed net investment income of $334,000.
See accompanying Notes, which are an integral part of the Financial Statements.
59
| |
| Target Retirement 2060 Fund | |
| |
| |
| Financial Highlights | |
| |
| |
| | January 19, 20121 to |
| For a Share Outstanding Throughout the Period | September 30, 2012 |
| Net Asset Value, Beginning of Period | $20.00 |
| Investment Operations | |
| Net Investment Income | .218 |
| Capital Gain Distributions Received | .002 |
| Net Realized and Unrealized Gain (Loss) on Investments | 1.520 |
| Total from Investment Operations | 1.740 |
| Distributions | |
| Dividends from Net Investment Income | — |
| Distributions from Realized Capital Gains | — |
| Total Distributions | — |
| Net Asset Value, End of Period | $21.74 |
| |
| Total Return2 | 8.70% |
| |
| Ratios/Supplemental Data | |
| Net Assets, End of Period (Millions) | $33 |
| Ratio of Total Expenses to Average Net Assets | — |
| Acquired Fund Fees and Expenses | 0.18%3 |
| Ratio of Net Investment Income to Average Net Assets | 2.99%3 |
| Portfolio Turnover Rate | 40% |
1 Inception.
2 Total returns do not include account service fees that may have applied in the period shown. Fund prospectuses provide information about any applicable account service fees.
3 Annualized.
See accompanying Notes, which are an integral part of the Financial Statements.
60
Target Retirement 2060 Fund
Notes to Financial Statements
Vanguard Target Retirement 2060 Fund is registered under the Investment Company Act of 1940 as an open-end investment company, or mutual fund. The fund follows a balanced investment strategy by investing in selected Vanguard funds to achieve its targeted allocation of assets to U.S. stocks, international stocks, and bonds.
A. The following significant accounting policies conform to generally accepted accounting principles for U.S. mutual funds. The fund consistently follows such policies in preparing its financial statements.
1. Security Valuation: Investments are valued at the net asset value of each underlying Vanguard fund determined as of the close of the New York Stock Exchange (generally 4 p.m., Eastern time) on the valuation date.
2. Federal Income Taxes: The fund intends to continue to qualify as a regulated investment company and distribute all of its taxable income. Management has analyzed the fund’s tax positions taken for its open federal income tax period ended September 30, 2012, and has concluded that no provision for federal income tax is required in the fund’s financial statements.
3. Distributions: Distributions to shareholders are recorded on the ex-dividend date.
4. Other: Income and capital gain distributions received are recorded on the ex-dividend date. Security transactions are accounted for on the date securities are bought or sold. Costs used to determine realized gains (losses) on the sale of investment securities are those of the specific securities sold.
B. Under a service agreement, The Vanguard Group furnishes investment advisory, corporate management, administrative, marketing, and distribution services to the fund. The service agreement provides that the fund’s expenses may be reduced or eliminated to the extent of savings realized by the Vanguard funds by the operation of the fund. Accordingly, all incremental expenses for services provided by Vanguard and all other expenses incurred by the fund during the period ended September 30, 2012, were borne by the funds in which the fund invests. The fund’s trustees and officers are also directors and officers of Vanguard and the funds in which the fund invests.
C. Various inputs may be used to determine the value of the fund’s investments. These inputs are summarized in three broad levels for financial statement purposes. The inputs or methodologies used to value securities are not necessarily an indication of the risk associated with investing in those securities.
Level 1—Quoted prices in active markets for identical securities.
Level 2—Other significant observable inputs (including quoted prices for similar securities, interest rates, prepayment speeds, credit risk, etc.).
Level 3—Significant unobservable inputs (including the fund’s own assumptions used to determine the fair value of investments).
At September 30, 2012, 100% of the market value of the fund’s investments was determined based on Level 1 inputs.
D. Distributions are determined on a tax basis and may differ from net investment income and realized capital gains for financial reporting purposes. Differences may be permanent or temporary. Permanent differences are reclassified among capital accounts in the financial statements to reflect their tax character. Temporary differences arise when certain items of income, expense, gain, or loss are recognized in different periods for financial statement and tax purposes; these differences are primarily attributed to tax deferral of losses on wash sales and will reverse at some time in the future. Differences in classification may also result from the treatment of short-term gains as ordinary income for tax purposes.
61
Target Retirement 2060 Fund
For tax purposes, at September 30, 2012, the fund had $335,000 of ordinary income available for distribution. At September 30, 2012, the fund had available capital losses totaling $4,000 that may be carried forward indefinitely to offset future net capital gains.
At September 30, 2012, the cost of investment securities for tax purposes was $32,272,000. Net unrealized appreciation of investment securities for tax purposes was $1,061,000, consisting of unrealized gains of $1,229,000 on securities that had risen in value since their purchase and $168,000 in unrealized losses on securities that had fallen in value since their purchase.
E. During the period ended September 30, 2012, the fund purchased $38,648,000 of investment securities and sold $6,696,000 of investment securities, other than temporary cash investments.
F. Capital shares issued and redeemed were:
| |
| | January 19, 20121 to |
| | September 30, 2012 |
| | Shares |
| | (000) |
| Issued | 2,110 |
| Issued in Lieu of Cash Distributions | — |
| Redeemed | (581) |
| Net Increase (Decrease) in Shares Outstanding | 1,529 |
| 1 Inception. | |
G. In preparing the financial statements as of September 30, 2012, management considered the impact of subsequent events for potential recognition or disclosure in these financial statements.
62
Report of Independent Registered
Public Accounting Firm
To the Trustees of Vanguard Chester Funds and the Shareholders of Vanguard Target Retirement 2035 Fund, Vanguard Target Retirement 2040 Fund, Vanguard Target Retirement 2045 Fund, Vanguard Target Retirement 2050 Fund, Vanguard Target Retirement 2055 Fund, and Vanguard Target Retirement 2060 Fund:
In our opinion, the accompanying statements of net assets and the related statements of operations and of changes in net assets and the financial highlights present fairly, in all material respects, the financial position of Vanguard Target Retirement 2035 Fund, Vanguard Target Retirement 2040 Fund, Vanguard Target Retirement 2045 Fund, Vanguard Target Retirement 2050 Fund, Vanguard Target Retirement 2055 Fund at September 30, 2012, the results of each of their operations, the changes in each of their net assets and the financial highlights for each of the periods indicated and the financial position of Vanguard Target Retirement 2060 Fund (collectively constituting six separate portfolios of Vanguard Chester Funds, hereafter referred to as the “Funds”) at September 30, 2012, the results of its operations, the changes in its net assets and the financial highlights for the period January 19, 2012 (commencement of operations) through September 30, 2012, in conformity with accounting principles generally accepted in the United States of America. These financial statements and financial highlights (hereafter referred to as “financial statements”) are the responsibility of the Funds’ management; our responsibility is to express an opinion on these financial statements based on our audits. We conducted our audits of these financial statements in accordance with the standards of the Public Company Accounting Oversight Board (United States). Those standards require that we plan and perform the audit to obtain reasonable assurance about whether the financial statements are free of material misstatement. An audit includes examining, on a test basis, evidence supporting the amounts and disclosures in the financial statements, assessing the accounting principles used and significant estimates made by management, and evaluating the overall financial statement presentation. We believe that our audits, which included confirmation of securities at September 30, 2012 by agreement to the underlying ownership records of the transfer agent, provide a reasonable basis for our opinion.
PricewaterhouseCoopers LLP
Philadelphia, Pennsylvania
November 9, 2012
63
| |
| Special 2012 tax information (unaudited) for Vanguard Target Retirement Funds |
This information for the fiscal year ended September 30, 2012, is included pursuant to provisions of the Internal Revenue Code.
The funds distributed capital gain dividends (from net long-term capital gains) to shareholders during the fiscal year as follows:
| |
| | Capital Gain Dividends |
| Fund | ($000) |
| Target Retirement 2035 Fund | — |
| Target Retirement 2040 Fund | — |
| Target Retirement 2045 Fund | — |
| Target Retirement 2050 Fund | — |
| Target Retirement 2055 Fund | 4 |
| Target Retirement 2060 Fund | — |
The funds distributed qualified dividend income to shareholders during the fiscal year as follows:
| |
| | Qualified Dividend Income |
| Fund | ($000) |
| Target Retirement 2035 Fund | 185,342 |
| Target Retirement 2040 Fund | 92,450 |
| Target Retirement 2045 Fund | 105,470 |
| Target Retirement 2050 Fund | 38,596 |
| Target Retirement 2055 Fund | 2,232 |
| Target Retirement 2060 Fund | — |
For corporate shareholders, the percentage of investment income (dividend income plus short-term gains, if any) that qualifies for the dividends-received deduction is as follows:
| |
| Fund | Percentage |
| Target Retirement 2035 Fund | 40.5% |
| Target Retirement 2040 Fund | 42.2 |
| Target Retirement 2045 Fund | 41.8 |
| Target Retirement 2050 Fund | 42.2 |
| Target Retirement 2055 Fund | 43.5 |
| Target Retirement 2060 Fund | 47.5 |
64
Your Fund’s After-Tax Returns
This table presents returns for your fund both before and after taxes. The after-tax returns are shown in two ways: (1) assuming that an investor owned the fund during the entire period and paid taxes on the fund’s distributions, and (2) assuming that an investor paid taxes on the fund’s distributions and sold all shares at the end of each period.
Calculations are based on the highest individual federal income tax and capital gains tax rates in effect at the times of the distributions and the hypothetical sales. State and local taxes were not considered. After-tax returns reflect any qualified dividend income , using actual prior-year figures and estimates for 2012. (In the example, returns after the sale of fund shares may be higher than those assuming no sale. This occurs when the sale would have produced a capital loss. The calculation assumes that the investor received a tax deduction for the loss.)
Please note that your actual after-tax returns will depend on your tax situation and may differ from those shown. Also note that if you own the fund in a tax-deferred account, such as an individual retirement account or a 401(k) plan, this information does not apply to you. Such accounts are not subject to current taxes.
Finally, keep in mind that a fund’s performance—whether before or after taxes—does not guarantee future results.
Average Annual Total Returns: Target Retirement Funds
Periods Ended September 30, 2012
| | | |
| | | | Since |
| | One | Five | Inception |
| | Year | Years | (10/27/2003) |
| Target Retirement 2035 Fund | | | |
| Returns Before Taxes | 22.98% | 0.83% | 5.99% |
| Returns After Taxes on Distributions | 22.41 | 0.37 | 5.57 |
| Returns After Taxes on Distributions and Sale of Fund Shares | 15.25 | 0.54 | 5.07 |
| |
| | | | Since |
| | One | Five | Inception |
| | Year | Years | (6/7/2006) |
| Target Retirement 2040 Fund | | | |
| Returns Before Taxes | 23.43% | 0.90% | 4.26% |
| Returns After Taxes on Distributions | 22.90 | 0.47 | 3.89 |
| Returns After Taxes on Distributions and Sale of Fund Shares | 15.54 | 0.61 | 3.53 |
| |
| | | | Since |
| | One | Five | Inception |
| | Year | Years | (10/27/2003) |
| Target Retirement 2045 Fund | | | |
| Returns Before Taxes | 23.47% | 0.88% | 6.36% |
| Returns After Taxes on Distributions | 22.92 | 0.40 | 5.95 |
| Returns After Taxes on Distributions and Sale of Fund Shares | 15.57 | 0.57 | 5.42 |
65
Average Annual Total Returns: Target Retirement Funds
Periods Ended September 30, 2012
| | | |
| | | | Since |
| | One | Five | Inception |
| | Year | Years | (6/7/2006) |
| Target Retirement 2050 Fund | | | |
| Returns Before Taxes | 23.46% | 0.88% | 4.34% |
| Returns After Taxes on Distributions | 22.93 | 0.43 | 3.94 |
| Returns After Taxes on Distributions and Sale of Fund Shares | 15.55 | 0.58 | 3.59 |
| |
| | | | Since |
| | One | | Inception |
| | Year | | (8/18/2010) |
| Target Retirement 2055 Fund | | | |
| Returns Before Taxes | 23.56% | | 12.18% |
| Returns After Taxes on Distributions | 23.11 | | 11.87 |
| Returns After Taxes on Distributions and Sale of Fund Shares | 15.57 | | 10.32 |
| |
| The Target Retirement 2060 Fund is not listed because the fund has operated for less than one year. | | |
66
About Your Fund’s Expenses
As a shareholder of the fund, you incur ongoing costs, which include costs for portfolio management, administrative services, and shareholder reports (like this one), among others. Operating expenses, which are deducted from a fund’s gross income, directly reduce the investment return of the fund.
A typical fund’s expenses are expressed as a percentage of its average net assets. The Target Retirement Funds have no direct expenses, but each fund bears its proportionate share of the costs for the underlying funds in which it invests. These indirect expenses make up the acquired fund fees and expenses, also expressed as a percentage of average net assets.
The following examples are intended to help you understand the ongoing cost (in dollars) of investing in your fund and to compare these costs with those of other mutual funds. The examples are based on an investment of $1,000 made at the beginning of the period shown and held for the entire period. The costs were calculated using the acquired fund fees and expenses for each Target Retirement Fund.
The accompanying table illustrates your fund’s costs in two ways:
• Based on actual fund return. This section helps you to estimate the actual expenses that you paid over the period. The ”Ending Account Value“ shown is derived from the fund‘s actual return, and the third column shows the dollar amount that would have been paid by an investor who started with $1,000 in the fund. You may use the information here, together with the amount you invested, to estimate the expenses that you paid over the period.
To do so, simply divide your account value by $1,000 (for example, an $8,600 account value divided by $1,000 = 8.6), then multiply the result by the number given for your fund under the heading ”Expenses Paid During Period.“
• Based on hypothetical 5% yearly return. This section is intended to help you compare your fund‘s costs with those of other mutual funds. It assumes that the fund had a yearly return of 5% before expenses, but that the expense ratio is unchanged. In this case—because the return used is not the fund’s actual return—the results do not apply to your investment. The example is useful in making comparisons because the Securities and Exchange Commission requires all mutual funds to calculate expenses based on a 5% return. You can assess your fund’s costs by comparing this hypothetical example with the hypothetical examples that appear in shareholder reports of other funds.
Note that the expenses shown in the table are meant to highlight and help you compare ongoing costs only and do not reflect transaction costs incurred by the fund for buying and selling securities. Further, the expenses do not include any purchase, redemption, or account service fees described in the fund prospectus. If such fees were applied to your account, your costs would be higher. Your fund does not carry a “sales load.”
The calculations assume no shares were bought or sold during the period. Your actual costs may have been higher or lower, depending on the amount of your investment and the timing of any purchases or redemptions.
You can find more information about the fund’s expenses, including annual expense ratios, in the Financial Statements section of this report. For additional information on operating expenses and other shareholder costs, please refer to your fund’s current prospectus.
67
| | | |
| Six Months Ended September 30, 2012 | | | |
| | Beginning | Ending | Expenses |
| | Account Value | Account Value | Paid During |
| | 3/31/2012 | 9/30/2012 | Period |
| Based on Actual Fund Return | | | |
| Target Retirement 2035 Fund | $1,000.00 | $1,019.45 | $0.91 |
| Target Retirement 2040 Fund | $1,000.00 | $1,019.28 | $0.91 |
| Target Retirement 2045 Fund | $1,000.00 | $1,019.54 | $0.91 |
| Target Retirement 2050 Fund | $1,000.00 | $1,019.37 | $0.91 |
| Target Retirement 2055 Fund | $1,000.00 | $1,019.73 | $0.91 |
| Target Retirement 2060 Fund | $1,000.00 | $1,022.58 | $0.91 |
| Based on Hypothetical 5% Yearly Return | | | |
| Target Retirement 2035 Fund | $1,000.00 | $1,024.17 | $0.91 |
| Target Retirement 2040 Fund | $1,000.00 | $1,024.17 | $0.91 |
| Target Retirement 2045 Fund | $1,000.00 | $1,024.17 | $0.91 |
| Target Retirement 2050 Fund | $1,000.00 | $1,024.17 | $0.91 |
| Target Retirement 2055 Fund | $1,000.00 | $1,024.17 | $0.91 |
| Target Retirement 2060 Fund | $1,000.00 | $1,024.17 | $0.91 |
The calculations are based on the acquired fund fees and expenses for the most recent six-month period. The funds’ annualized expense figures for the period are (in order as listed from top to bottom above) 0.18%, 0.18%, 0.18%, 0.18%, 0.18%, and 0.18%. The dollar amounts shown as ”Expenses Paid” are equal to the annualized average weighted expense ratio for the underlying funds multiplied by the average account value over the period, multiplied by the number of days in the most recent six-month period, then divided by the number of days in the most recent 12-month period.
68
Glossary
30-Day SEC Yield. A fund’s 30-day SEC yield is derived using a formula specified by the U.S. Securities and Exchange Commission. Under the formula, data related to the fund’s security holdings in the previous 30 days are used to calculate the fund’s hypothetical net income for that period, which is then annualized and divided by the fund’s estimated average net assets over the calculation period. For the purposes of this calculation, a security’s income is based on its current market yield to maturity (for bonds), its actual income (for asset-backed securities), or its projected dividend yield (for stocks). Because the SEC yield represents hypothetical annualized income, it will differ—at times significantly—from the fund’s actual experience. As a result, the fund’s income distributions may be higher or lower than implied by the SEC yield.
Acquired Fund Fees and Expenses. Funds that invest in other Vanguard funds incur no direct expenses, but they do bear proportionate shares of the operating, administrative, and advisory expenses of the underlying funds, and they must pay any fees charged by those funds. The figure for acquired fund fees and expenses represents a weighted average of these underlying costs. Acquired is a term that the Securities and Exchange Commission applies to any mutual fund whose shares are owned by another fund.
Beta. A measure of the magnitude of a fund’s past share-price fluctuations in relation to the ups and downs of a given market index. The index is assigned a beta of 1.00. Compared with a given index, a fund with a beta of 1.20 typically would have seen its share price rise or fall by 12% when the index rose or fell by 10%. For this report, beta is based on returns over the past 36 months for both the fund and the index. Note that a fund’s beta should be reviewed in conjunction with its R-squared (see definition). The lower the R-squared, the less correlation there is between the fund and the index, and the less reliable beta is as an indicator of volatility.
Expense Ratio. A fund’s total annual operating expenses expressed as a percentage of the fund’s average net assets. The expense ratio includes management and administrative expenses, but does not include the transaction costs of buying and selling portfolio securities.
Inception Date. The date on which the assets of a fund (or one of its share classes) are first invested in accordance with the fund’s investment objective. For funds with a subscription period, the inception date is the day after that period ends. Investment performance is measured from the inception date.
R-Squared. A measure of how much of a fund’s past returns can be explained by the returns from the market in general, as measured by a given index. If a fund’s total returns were precisely synchronized with an index’s returns, its R-squared would be 1.00. If the fund’s returns bore no relationship to the index’s returns, its R-squared would be 0. For this report, R-squared is based on returns over the past 36 months for both the fund and the index.
69
Benchmark Information
Target 2035 Composite Index: Derived by applying the fund’s target asset allocation to the results of the following benchmarks: for international stocks of developed markets, the MSCI EAFE Index through December 15, 2010, and the MSCI ACWI ex USA IMI Index thereafter; for emerging markets stocks, the Select Emerging Markets Index through August 23, 2006, the MSCI Emerging Markets Index through December 15, 2010, and the MSCI ACWI ex USA IMI Index thereafter; for bonds, the Barclays U.S. Aggregate Bond Index through December 31, 2009, and the Barclays U.S. Aggregate Float Adjusted Index thereafter; and for U.S. stocks, the Dow Jones Wilshire 5000 Index through April 22, 2005, and the MSCI US Broad Market Index thereafter. MSCI international benchmark returns are adjusted for withholding taxes.
Target 2040 Composite Index: Derived by applying the fund’s target asset allocation to the results of the following benchmarks: for international stocks of developed markets, the MSCI EAFE Index through December 15, 2010, and the MSCI ACWI ex USA IMI Index thereafter; for emerging markets stocks, the Select Emerging Markets Index through August 23, 2006, the MSCI Emerging Markets Index through December 15, 2010, and the MSCI ACWI ex USA IMI Index thereafter; for bonds, the Barclays U.S. Aggregate Bond Index through December 31, 2009, and the Barclays U.S. Aggregate Float Adjusted Index thereafter; and for U.S. stocks, the MSCI US Broad Market Index. MSCI international benchmark returns are adjusted for withholding taxes.
Target 2045 Composite Index: Derived by applying the fund’s target asset allocation to the results of the following benchmarks: for international stocks of developed markets, the MSCI EAFE Index through December 15, 2010, and the MSCI ACWI ex USA IMI Index thereafter; for emerging markets stocks, the Select Emerging Markets Index through August 23, 2006, the MSCI Emerging Markets Index through December 15, 2010, and the MSCI ACWI ex USA IMI Index thereafter; for bonds, the Barclays U.S. Aggregate Bond Index through December 31, 2009, and the Barclays U.S. Aggregate Float Adjusted Index thereafter; and for U.S. stocks, the Dow Jones Wilshire 5000 Index through April 22, 2005, and the MSCI US Broad Market Index thereafter. MSCI international benchmark returns are adjusted for withholding taxes.
Target 2050 Composite Index: Derived by applying the fund’s target asset allocation to the results of the following benchmarks: for international stocks of developed markets, the MSCI EAFE Index through December 15, 2010, and the MSCI ACWI ex USA IMI Index thereafter; for emerging markets stocks, the Select Emerging Markets Index through August 23, 2006, the MSCI Emerging Markets Index through December 15, 2010, and the MSCI ACWI ex USA IMI Index thereafter; for bonds, the Barclays U.S. Aggregate Bond Index through December 31, 2009, and the Barclays U.S. Aggregate Float Adjusted Index thereafter; and for U.S. stocks, the MSCI US Broad Market Index. MSCI international benchmark returns are adjusted for withholding taxes.
70
Target 2055 Composite Index: Derived by applying the fund’s target asset allocation to the results of the following benchmarks: for international stocks of developed markets, the MSCI EAFE Index through December 15, 2010, and the MSCI ACWI ex USA IMI Index thereafter; for emerging markets stocks, the MSCI Emerging Markets Index through December 15, 2010, and the MSCI ACWI ex USA IMI Index thereafter; for bonds, the Barclays U.S. Aggregate Float Adjusted Index; and for U.S. stocks, the MSCI US Broad Market Index. MSCI international benchmark returns are adjusted for withholding taxes.
Target 2060 Composite Index: Derived by applying the fund’s target asset allocation to the results of the following benchmarks: for international stocks, the MSCI ACWI ex USA IMI Index; for U.S. stocks, the MSCI US Broad Market Index; and for bonds, the Barclays U.S. Aggregate Float Adjusted Index. MSCI international benchmark returns are adjusted for withholding taxes.
71
The People Who Govern Your Fund
The trustees of your mutual fund are there to see that the fund is operated and managed in your best interests since, as a shareholder, you are a part owner of the fund. Your fund’s trustees also serve on the board of directors of The Vanguard Group, Inc., which is owned by the Vanguard funds and provides services to them on an at-cost basis.
A majority of Vanguard’s board members are independent, meaning that they have no affiliation with Vanguard or the funds they oversee, apart from the sizable personal investments they have made as private individuals. The independent board members have distinguished backgrounds in business, academia, and public service. Each of the trustees and executive officers oversees 179 Vanguard funds.
The following table provides information for each trustee and executive officer of the fund. More information about the trustees is in the Statement of Additional Information, which can be obtained, without charge, by contacting Vanguard at 800-662-7447, or online at vanguard.com.
| |
| InterestedTrustee1 | and Delphi Automotive LLP (automotive components); |
| | Senior Advisor at New Mountain Capital; Trustee of |
| | The Conference Board. |
| F. William McNabb III | |
| Born 1957. Trustee Since July 2009. Chairman of the | Amy Gutmann |
| Board. Principal Occupation(s) During the Past Five | Born 1949. Trustee Since June 2006. Principal |
| Years: Chairman of the Board of The Vanguard Group, | Occupation(s) During the Past Five Years: President |
| Inc., and of each of the investment companies served | of the University of Pennsylvania; Christopher H. |
| by The Vanguard Group, since January 2010; Director | Browne Distinguished Professor of Political Science |
| of The Vanguard Group since 2008; Chief Executive | in the School of Arts and Sciences with secondary |
| Officer and President of The Vanguard Group and of | appointments at the Annenberg School for |
| each of the investment companies served by The | Communication and the Graduate School of Education |
| Vanguard Group since 2008; Director of Vanguard | of the University of Pennsylvania; Member of the |
| Marketing Corporation; Managing Director of The | National Commission on the Humanities and Social |
| Vanguard Group (1995–2008). | Sciences; Trustee of Carnegie Corporation of New |
| | York and of the National Constitution Center; Chair |
| | of the U. S. Presidential Commission for the Study |
| IndependentTrustees | of Bioethical Issues. |
| | |
| | JoAnn Heffernan Heisen |
| Emerson U. Fullwood | Born 1950. Trustee Since July 1998. Principal |
| Born 1948. Trustee Since January 2008. Principal | Occupation(s) During the Past Five Years: Corporate |
| Occupation(s) During the Past Five Years: Executive | Vice President and Chief Global Diversity Officer |
| Chief Staff and Marketing Officer for North America | (retired 2008) and Member of the Executive |
| and Corporate Vice President (retired 2008) of Xerox | Committee (1997–2008) of Johnson & Johnson |
| Corporation (document management products and | (pharmaceuticals/medical devices/consumer |
| services); Executive in Residence and 2010 | products); Director of Skytop Lodge Corporation |
| Distinguished Minett Professor at the Rochester | (hotels), the University Medical Center at Princeton, |
| Institute of Technology; Director of SPX Corporation | the Robert Wood Johnson Foundation, and the Center |
| (multi-industry manufacturing), the United Way of | for Talent Innovation; Member of the Advisory Board |
| Rochester, Amerigroup Corporation (managed health | of the Maxwell School of Citizenship and Public Affairs |
| care), the University of Rochester Medical Center, | at Syracuse University. |
| Monroe Community College Foundation, and North | |
| Carolina A&T University. | F. Joseph Loughrey |
| Born 1949. Trustee Since October 2009. Principal |
| Rajiv L. Gupta | Occupation(s) During the Past Five Years: President |
| Born 1945. Trustee Since December 2001.2 | and Chief Operating Officer (retired 2009) of Cummins |
| Principal Occupation(s) During the Past Five Years: | Inc. (industrial machinery); Director of SKF AB |
| Chairman and Chief Executive Officer (retired 2009) | (industrial machinery), Hillenbrand, Inc. (specialized |
| and President (2006–2008) of Rohm and Haas Co. | consumer services), the Lumina Foundation for |
| (chemicals); Director of Tyco International, Ltd. | |
| (diversified manufacturing and services), Hewlett- | |
| Packard Co. (electronic computer manufacturing), | |
| |
| | |
| Education, and Oxfam America; Chairman of the | Executive Officers | |
| Advisory Council for the College of Arts and Letters | | |
| and Member of the Advisory Board to the Kellogg | Glenn Booraem | |
| Institute for International Studies at the University | Born 1967. Controller Since July 2010. Principal |
| of Notre Dame. | Occupation(s) During the Past Five Years: Principal |
| | of The Vanguard Group, Inc.; Controller of each of |
| Mark Loughridge | the investment companies served by The Vanguard |
| Born 1953. Trustee Since March 2012. Principal | Group; Assistant Controller of each of the investment |
| Occupation(s) During the Past Five Years: Senior Vice | companies served by The Vanguard Group (2001–2010). |
| President and Chief Financial Officer at IBM (information | | |
| technology services); Fiduciary Member of IBM’s | Thomas J. Higgins | |
| Retirement Plan Committee. | Born 1957. Chief Financial Officer Since September |
| | 2008. Principal Occupation(s) During the Past Five |
| Scott C. Malpass | Years: Principal of The Vanguard Group, Inc.; Chief |
| Born 1962. Trustee Since March 2012. Principal | Financial Officer of each of the investment companies |
| Occupation(s) During the Past Five Years: Chief | served by The Vanguard Group; Treasurer of each of |
| Investment Officer and Vice President at the University | the investment companies served by The Vanguard |
| of Notre Dame; Assistant Professor of Finance at the | Group (1998–2008). | |
| Mendoza College of Business at Notre Dame; Member | | |
| of the Notre Dame 403(b) Investment Committee; | Kathryn J. Hyatt | |
| Director of TIFF Advisory Services, Inc. (investment | Born 1955. Treasurer Since November 2008. Principal |
| advisor); Member of the Investment Advisory | Occupation(s) During the Past Five Years: Principal of |
| Committees of the Financial Industry Regulatory | The Vanguard Group, Inc.; Treasurer of each of the |
| Authority (FINRA) and of Major League Baseball. | investment companies served by The Vanguard |
| | Group; Assistant Treasurer of each of the investment |
| André F. Perold | companies served by The Vanguard Group (1988–2008). |
| Born 1952. Trustee Since December 2004. Principal | | |
| Occupation(s) During the Past Five Years: George | Heidi Stam | |
| Gund Professor of Finance and Banking at the Harvard | Born 1956. Secretary Since July 2005. Principal |
| Business School (retired 2011); Chief Investment | Occupation(s) During the Past Five Years: Managing |
| Officer and Managing Partner of HighVista Strategies | Director of The Vanguard Group, Inc.; General Counsel |
| LLC (private investment firm); Director of Rand | of The Vanguard Group; Secretary of The Vanguard |
| Merchant Bank; Overseer of the Museum of Fine | Group and of each of the investment companies |
| Arts Boston. | served by The Vanguard Group; Director and Senior |
| | Vice President of Vanguard Marketing Corporation. |
| Alfred M. Rankin, Jr. | | |
| Born 1941. Trustee Since January 1993. Principal | | |
| Occupation(s) During the Past Five Years: Chairman, | Vanguard Senior ManagementTeam |
| President, and Chief Executive Officer of NACCO | | |
| Industries, Inc. (forklift trucks/housewares/lignite); | Mortimer J. Buckley | Michael S. Miller |
| Director of Goodrich Corporation (industrial products/ | Kathleen C. Gubanich | James M. Norris |
| aircraft systems and services) and the National | Paul A. Heller | Glenn W. Reed |
| Association of Manufacturers; Chairman of the Board | Martha G. King | George U. Sauter |
| of the Federal Reserve Bank of Cleveland and of | Chris D. McIsaac | |
| University Hospitals of Cleveland; Advisory Chairman | | |
| of the Board of The Cleveland Museum of Art. | | |
| | Chairman Emeritus and Senior Advisor |
| Peter F. Volanakis | | |
| Born 1955. Trustee Since July 2009. Principal | John J. Brennan | |
| Occupation(s) During the Past Five Years: President | Chairman, 1996–2009 | |
| and Chief Operating Officer (retired 2010) of Corning | Chief Executive Officer and President, 1996–2008 | |
| Incorporated (communications equipment); Director | | |
| of SPX Corporation (multi-industry manufacturing); | |
| Overseer of the Amos Tuck School of Business | Founder | |
| Administration at Dartmouth College; Advisor to the | | |
| Norris Cotton Cancer Center. | John C. Bogle | |
| Chairman and Chief Executive Officer, 1974–1996 | |
1 Mr. McNabb is considered an “interested person,” as defined in the Investment Company Act of 1940, because he is an officer of the Vanguard funds.
2 December 2002 for Vanguard Equity Income Fund, Vanguard Growth Equity Fund, the Vanguard Municipal Bond Funds, and the Vanguard State Tax-Exempt Funds.
|  |
| P.O. Box 2600 |
| Valley Forge, PA 19482-2600 |
Connect with Vanguard® > vanguard.com
| |
| Fund Information > 800-662-7447 | |
| Direct Investor Account Services > 800-662-2739 | |
| Institutional Investor Services > 800-523-1036 | |
| Text Telephone for People | |
| With Hearing Impairment > 800-749-7273 | |
| |
| This material may be used in conjunction | |
| with the offering of shares of any Vanguard | |
| fund only if preceded or accompanied by | |
| the fund’s current prospectus. | |
| |
| All comparative mutual fund data are from Lipper Inc. or | |
| Morningstar, Inc., unless otherwise noted. | |
| |
| You can obtain a free copy of Vanguard’s proxy voting | |
| guidelines by visiting vanguard.com/proxyreporting or by | |
| calling Vanguard at 800-662-2739. The guidelines are | |
| also available from the SEC’s website, sec.gov. In | |
| addition, you may obtain a free report on how your fund | |
| voted the proxies for securities it owned during the 12 | |
| months ended June 30. To get the report, visit either | |
| vanguard.com/proxyreporting or sec.gov. | |
| |
| You can review and copy information about your fund at | |
| the SEC’s Public Reference Room in Washington, D.C. To | |
| find out more about this public service, call the SEC at | |
| 202-551-8090. Information about your fund is also | |
| available on the SEC’s website, and you can receive | |
| copies of this information, for a fee, by sending a | |
| request in either of two ways: via e-mail addressed to | |
| publicinfo@sec.gov or via regular mail addressed to the | |
| Public Reference Section, Securities and Exchange | |
| Commission, Washington, DC 20549-1520. | |
| |
| |
| | © 2012 The Vanguard Group, Inc. |
| | All rights reserved. |
| | Vanguard Marketing Corporation, Distributor. |
| |
| | Q3080B 112012 |
Item 2: Code of Ethics. The Registrant has adopted a code of ethics that applies to the Registrant’s principal executive officer, principal financial officer, principal accounting officer or controller or persons performing similar functions. The Code of Ethics was amended during the reporting period covered by this report to make certain technical, non-material changes.
Item 3: Audit Committee Financial Expert. The following members of the Audit Committee have been determined by the Registrant’s Board of Trustees to be Audit Committee Financial Experts serving on its Audit Committee, and to be independent: Rajiv L. Gupta, Amy Gutmann, JoAnn Heffernan Heisen, F. Joseph Loughrey, Mark Loughridge, Scott C. Malpass, André F. Perold, and Alfred M. Rankin, Jr.
Item 4: Principal Accountant Fees and Services.
(a) Audit Fees.
Audit Fees of the Registrant
Fiscal Year Ended September 30, 2012: $204,000 Fiscal Year Ended September 30, 2011: $206,000
Aggregate Audit Fees of Registered Investment Companies in the Vanguard Group.
Fiscal Year Ended September 30, 2012: $4,809,780
Fiscal Year Ended September 30, 2011: $3,978,540
(b) Audit-Related Fees.
Fiscal Year Ended September 30, 2012: $1,812,565
Fiscal Year Ended September 30, 2011: $1,341,750
Includes fees billed in connection with assurance and related services provided to the Registrant, The Vanguard Group, Inc., Vanguard Marketing Corporation, and other registered investment companies in the Vanguard Group.
(c) Tax Fees.
Fiscal Year Ended September 30, 2012: $490,518
Fiscal Year Ended September 30, 2011: $373,830
Includes fees billed in connection with tax compliance, planning and advice services provided to the Registrant, The Vanguard Group, Inc., Vanguard Marketing Corporation, and other registered investment companies in the Vanguard Group and related to income and excise taxes.
(d) All Other Fees.
Fiscal Year Ended September 30, 2012: $16,000
Fiscal Year Ended September 30, 2011: $16,000
Includes fees billed for services related to risk management and privacy matters. Services were provided to the Registrant, The Vanguard Group, Inc., Vanguard Marketing Corporation, and other registered investment companies in the Vanguard Group.
(e) (1) Pre-Approval Policies. The policy of the Registrant’s Audit Committee is to consider and, if appropriate, approve before the principal accountant is engaged for such services, all specific audit and non-audit services provided to: (1) the Registrant; (2) The Vanguard Group, Inc.; (3) other entities controlled by The Vanguard Group, Inc. that provide ongoing services to the Registrant; and (4) other registered investment companies in the Vanguard Group. In making a determination, the Audit Committee considers whether the services are consistent with maintaining the principal accountant’s independence.
In the event of a contingency situation in which the principal accountant is needed to provide services in between scheduled Audit Committee meetings, the Chairman of the Audit Committee would be called on to consider and, if appropriate, pre-approve audit or permitted non-audit services in an amount sufficient to complete services through the next Audit Committee meeting, and to determine if such services would be consistent with maintaining the accountant’s independence. At the next scheduled Audit Committee meeting, services and fees would be presented to the Audit Committee for formal consideration, and, if appropriate,
approval by the entire Audit Committee. The Audit Committee would again consider whether such services and fees are consistent with maintaining the principal accountant’s independence.
The Registrant’s Audit Committee is informed at least annually of all audit and non-audit services provided by the principal accountant to the Vanguard complex, whether such services are provided to: (1) the Registrant; (2) The Vanguard Group, Inc.; (3) other entities controlled by The Vanguard Group, Inc. that provide ongoing services to the Registrant; or (4) other registered investment companies in the Vanguard Group.
(2) No percentage of the principal accountant’s fees or services were approved pursuant to the waiver provision of paragraph (c)(7)(i)(C) of Rule 2-01 of Regulation S-X.
(f) For the most recent fiscal year, over 50% of the hours worked under the principal accountant’s engagement were not performed by persons other than full-time, permanent employees of the principal accountant.
(g) Aggregate Non-Audit Fees.
Fiscal Year Ended September 30, 2012: $506,518
Fiscal Year Ended September 30, 2011: $389,830
Includes fees billed for non-audit services provided to the Registrant, The Vanguard Group, Inc., Vanguard Marketing Corporation, and other registered investment companies in the Vanguard Group.
(h) For the most recent fiscal year, the Audit Committee has determined that the provision of all non-audit services was consistent with maintaining the principal accountant’s independence.
Item 5: Audit Committee of Listed Registrants.
Not Applicable.
Item 6: Investments.
Not Applicable.
Item 7: Disclosure of Proxy Voting Policies and Procedures for Closed-End Management Investment Companies.
Not Applicable.
Item 8: Portfolio Managers of Closed-End Management Investment Companies.
Not Applicable.
Item 9: Purchase of Equity Securities by Closed-End Management Investment Company and Affiliated Purchasers.
Not Applicable.
Item 10: Submission of Matters to a Vote of Security Holders.
Not Applicable.
Item 11: Controls and Procedures.
(a) Disclosure Controls and Procedures. The Principal Executive and Financial Officers concluded that the Registrant's Disclosure Controls and Procedures are effective based on their evaluation of the Disclosure Controls and Procedures as of a date within 90 days of the filing date of this report.
(b) Internal Control Over Financial Reporting. There were no significant changes in Registrant’s Internal Control Over Financial Reporting or in other factors that could significantly affect this control subsequent to the date of the evaluation, including any corrective actions with regard to significant deficiencies and material weaknesses.
Item 12: Exhibits.
(a) Code of Ethics.
(b) Certifications.
Pursuant to the requirements of the Securities Exchange Act of 1934 and the Investment Company Act of 1940, the registrant has duly caused this report to be signed on its behalf by the undersigned, thereunto duly authorized.
| |
| | VANGUARD CHESTER FUNDS |
| |
| By: | /s/ F. WILLIAM MCNABB III* |
| | F. WILLIAM MCNABB III |
| | CHIEF EXECUTIVE OFFICER |
| |
| Date: November 16, 2012 |
Pursuant to the requirements of the Securities Exchange Act of 1934 and the Investment Company Act of 1940, this report has been signed below by the following persons on behalf of the registrant and in the capacities and on the dates indicated.
| |
| | VANGUARD CHESTER FUNDS |
| |
| By: | /s/ F. WILLIAM MCNABB III* |
| | F. WILLIAM MCNABB III |
| | CHIEF EXECUTIVE OFFICER |
| |
| Date: November 16, 2012 |
| |
| | VANGUARD CHESTER FUNDS |
| |
| By: | /s/ THOMAS J. HIGGINS* |
| | THOMAS J. HIGGINS |
| | CHIEF FINANCIAL OFFICER |
| |
| Date: November 16, 2012 |
* By: /s/ Heidi Stam
Heidi Stam, pursuant to a Power of Attorney filed on March 27, 2012 see file Number 2-11444, Incorporated by Reference.