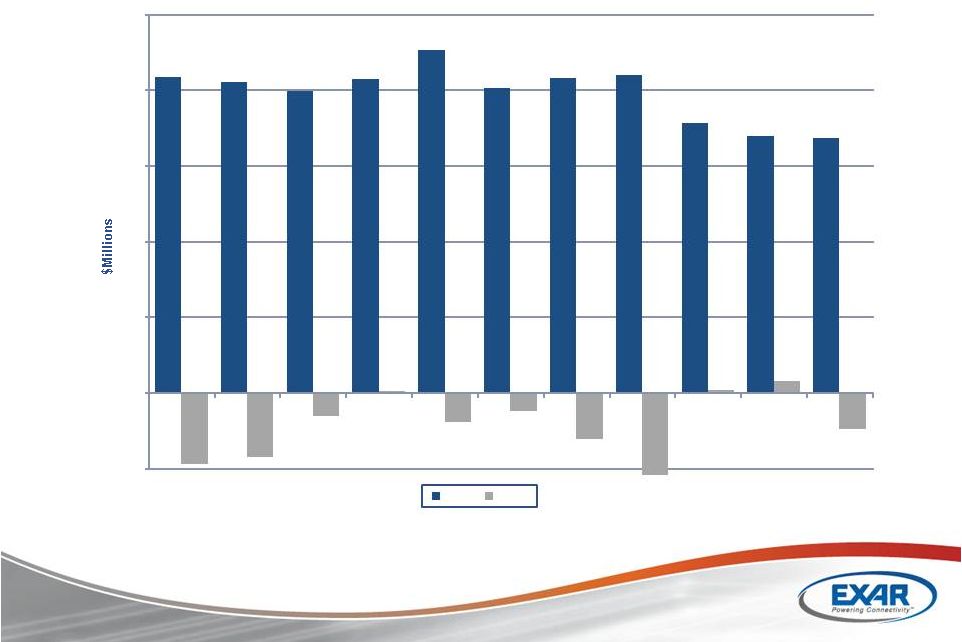
47 March 12, 2012 24 Annual ROTH Conference Institutional Investor Meetings th Reconciliation of Unaudited GAAP to Non-GAAP Results (1/2) (Thousands except per share amounts) NINE MONTHS ENDED JUN 27, SEP 26, DEC 26, MAR 27, JULY 3, OCT 2, JAN 1, JAN 1, MAR 27, MAR 28, 2010 2010 2010 2011 2011 2011 2012 2012 2011 2010 Net Sales 39,636 $ 37,233 $ 35,365 $ 33,771 $ 36,978 $ 36,120 $ 29,679 $ 102,777 $ 146,005 $ 134,878 $ GAAP gross profit 18,816 $ 17,291 $ 16,083 $ 11,807 $ 16,841 $ 16,729 $ 13,345 $ 46,915 $ 63,997 $ 63,382 $ GAAP gross margin 47.5% 46.4% 45.5% 35.0% 45.5% 46.3% 45.0% 45.6% 43.8% 47.0% Stock-based compensation 220 98 78 93 59 69 104 232 489 528 Amortization of acquired intangible assets 1,553 1,515 1,533 1,443 905 905 905 2,715 6,044 5,187 Fair value adjustment of acquired inventories 42 - - - - 42 2,398 Acquisition-related costs - - - - - - 24 Exit costs - - 2,212 152 - - 152 2,212 - Non-GAAP gross profit 20,631 $ 18,904 $ 17,694 $ 15,555 $ 17,957 $ 17,703 $ 14,354 $ 50,014 $ 72,784 $ 71,519 $ Non-GAAP gross margin 52.1% 50.8% 50.0% 46.1% 48.6% 49.0% 48.4% 48.7% 49.9% 53.0% GAAP research and development expenses 14,443 $ 11,840 $ 12,071 $ 12,744 $ 9,395 $ 8,838 $ 8,871 $ 27,104 $ 51,098 $ 48,511 $ Stock-based compensation 1,556 665 645 375 302 488 576 1,366 3,241 2,325 Amortization of acquired intangible assets 1,074 1,074 72 72 - - - - 2,292 2,785 Acquisition-related costs - - - - - - - - - 887 Exit costs - - - 1,210 115 - - 115 1,210 - Non-GAAP research and development expenses 11,813 $ 10,101 $ 11,354 $ 11,087 $ 8,978 $ 8,350 $ 8,295 $ 25,623 $ 44,355 $ 42,514 $ GAAP selling, general and administrative expenses 12,957 $ 11,083 $ 10,298 $ 11,094 $ 9,600 $ 9,373 $ 9,909 $ 28,882 $ 45,432 $ 48,861 $ Stock-based compensation 1,546 751 585 769 523 620 653 1,796 3,651 3,112 Amortization of acquired intangible assets 298 297 294 254 174 174 174 522 1,143 697 Acquisition-related costs 328 - - - - - - - 328 5,385 Exit costs - - - 165 58 - - 58 165 - Separation costs of executive officer - - - - - - 575 575 - 162 Accelaration of depreciation on abandoned equipment - - - - - - - - - 50 Non-GAAP selling, general and administrative expenses 10,785 $ 10,035 $ 9,419 $ 9,906 $ 8,845 $ 8,579 $ 8,507 $ 25,931 $ 40,145 $ 39,455 $ GAAP operating expenses 27,400 $ 22,923 $ 22,369 $ 31,323 $ 18,995 $ 18,211 $ 18,780 $ 55,986 $ 104,015 $ 97,372 $ Stock-based compensation 3,102 1,416 1,230 1,144 825 1,108 1,229 3,162 6,892 5,437 Amortization of acquired intangible assets 1,372 1,371 366 326 174 174 174 522 3,435 3,482 Acquisition-related costs 328 - - - - - - - 328 6,272 Exit costs - - - 1,375 173 - - 173 1,375 - Separation costs of executive officers - - - - - - 575 575 - 162 Accelaration of depreciation on abandoned equipment - - - - - - - - - 50 Goodwill and intangible assets impairment - - - 7,485 - - - - 7,485 - Non-GAAP operating expenses 22,598 $ 20,136 $ 20,773 $ 20,993 $ 17,823 $ 16,929 $ 16,802 $ 51,554 $ 84,500 $ 81,969 $ GAAP operating loss (8,584) $ (5,632) $ (6,286) $ (19,516) $ (2,154) $ (1,482) $ (5,435) $ (9,071) $ (40,018) $ (33,990) $ Stock-based compensation 3,322 1,514 1,308 1,237 884 1,177 1,333 3,394 7,381 5,965 Amortization of acquired intangible assets 2,925 2,886 1,899 1,769 1,079 1,079 1,079 3,237 9,479 8,669 Fair value adjustment of acquired inventories 42 - - - - - - - 42 2,398 Acquisition-related costs 328 - - - - - - - 328 6,296 Exit costs - - - 3,587 325 - - 325 3,587 - Separation costs of executive officers - - - - - - 575 575 - 162 Accelaration of depreciation on abandoned equipment - - - - - - - - - 50 Goodwill and intangible assets impairment - - - 7,485 - - - - 7,485 - Non-GAAP operating income (loss) (1,967) $ (1,232) $ (3,079) $ (5,438) $ 134 $ 774 $ (2,448) $ (1,540) $ (11,716) $ (10,450) $ TWELVE MONTHS ENDED - - - - - - - |