UNITED STATES
SECURITIES AND EXCHANGE COMMISSION
Washington, D.C. 20549
FORM N-CSR
CERTIFIED SHAREHOLDER REPORT OF REGISTERED
MANAGEMENT INVESTMENT COMPANIES
Investment Company Act file number 811-4118
Fidelity Securities Fund
(Exact name of registrant as specified in charter)
82 Devonshire St., Boston, Massachusetts 02109
(Address of principal executive offices) (Zip code)
Scott C. Goebel, Secretary
82 Devonshire St.
Boston, Massachusetts 02109
(Name and address of agent for service)
Registrant's telephone number, including area code: 617-563-7000
Date of fiscal year end: | July 31 |
| |
Date of reporting period: | July 31, 2010 |
Item 1. Reports to Stockholders
Fidelity®
Blue Chip Growth
Fund
Annual Report
July 31, 2010
(2_fidelity_logos) (Registered_Trademark)
Contents
Chairman's Message | <Click Here> | The Chairman's message to shareholders. |
Performance | <Click Here> | How the fund has done over time. |
Management's Discussion of Fund Performance | <Click Here> | The Portfolio Manager's review of fund performance and strategy. |
Shareholder Expense Example | <Click Here> | An example of shareholder expenses. |
Investment Changes | <Click Here> | A summary of major shifts in the fund's investments over the past six months. |
Investments | <Click Here> | A complete list of the fund's investments with their market values. |
Financial Statements | <Click Here> | Statements of assets and liabilities, operations, and changes in net assets,
as well as financial highlights. |
Notes | <Click Here> | Notes to the financial statements. |
Report of Independent Registered Public Accounting Firm | <Click Here> | |
Trustees and Officers | <Click Here> | |
Distributions | <Click Here> | |
Board Approval of Investment Advisory Contracts and Management Fees | <Click Here> | |
To view a fund's proxy voting guidelines and proxy voting record for the 12-month period ended June 30, visit http://www.fidelity.com/proxyvotingresults or visit the Securities and Exchange Commission's (SEC) web site at http://www.sec.gov. You may also call 1-800-544-8544 to request a free copy of the proxy voting guidelines.
Standard & Poor's, S&P and S&P 500 are registered service marks of The McGraw-Hill Companies, Inc. and have been licensed for use by Fidelity Distributors Corporation.
Other third party marks appearing herein are the property of their respective owners.
All other marks appearing herein are registered or unregistered trademarks or service marks of FMR LLC or an affiliated company.
Annual Report
This report and the financial statements contained herein are submitted for the general information of the shareholders of the fund. This report is not authorized for distribution to prospective investors in the fund unless preceded or accompanied by an effective prospectus.
A fund files its complete schedule of portfolio holdings with the SEC for the first and third quarters of each fiscal year on Form N-Q. Forms N-Q are available on the SEC's web site at http://www.sec.gov. A fund's Forms N-Q may be reviewed and copied at the SEC's Public Reference Room in Washington, DC. Information regarding the operation of the SEC's Public Reference Room may be obtained by calling 1-800-SEC-0330. For a complete list of a fund's portfolio holdings, view the most recent holdings listing, semiannual report, or annual report on Fidelity's web site at http://www.fidelity.com or http://www.advisor.fidelity.com, as applicable.
NOT FDIC INSURED • MAY LOSE VALUE • NO BANK GUARANTEE
Neither the fund nor Fidelity Distributors Corporation is a bank.
Annual Report
(photo_of_Edward_C_Johnson_3d)
Dear Shareholder:
A yearlong uptrend in global equity markets reversed course in late April 2010 when investor sentiment turned bearish due in great measure to concern that Europe's debt crisis would expand and slow or derail economic recovery. However, a bounceback in July helped to recover some of the ground that was lost. Financial markets are always unpredictable, of course, but there also are several time-tested investment principles that can help put the odds in your favor.
One of the basic tenets is to invest for the long term. Over time, riding out the markets' inevitable ups and downs has proven much more effective than selling into panic or chasing the hottest trend. Even missing only a few of the markets' best days can significantly diminish investor returns. Patience also affords the benefits of compounding - of earning interest on additional income or reinvested dividends and capital gains. There can be tax advantages and cost benefits to consider as well. While staying the course doesn't eliminate risk, it can considerably lessen the effect of short-term declines.
You can further manage your investing risk through diversification. And today, more than ever, geographic diversification should be taken into account. Studies indicate that asset allocation is the single most important determinant of a portfolio's long-term success. The right mix of stocks, bonds and cash - aligned to your particular risk tolerance and investment objective - is very important. Age-appropriate rebalancing is also an essential aspect of asset allocation. For younger investors, an emphasis on equities - which historically have been the best-performing asset class over time - is encouraged. As investors near their specific goal, such as retirement or sending a child to college, consideration may be given to replacing volatile assets (e.g. common stocks) with more-stable fixed investments (bonds or savings plans).
A third principle - investing regularly - can help lower the average cost of your purchases. Investing a certain amount of money each month or quarter helps ensure you won't pay for all your shares at market highs. This strategy - known as dollar cost averaging - also reduces "emotion" from investing, helping shareholders avoid selling weak performers just prior to an upswing, or chasing a hot performer just before a correction.
We invite you to contact us via the Internet, through our Investor Centers or by phone. It is our privilege to provide you the information you need to make the investments that are right for you.
Sincerely,
(The chairman's signature appears here.)
Edward C. Johnson 3d
Annual Report
Average annual total return reflects the change in the value of an investment, assuming reinvestment of the class' distributions from dividend income and capital gains (the profits earned upon the sale of securities that have grown in value, if any) and assuming a constant rate of performance each year. The $10,000 table and the fund's returns do not reflect the deduction of taxes that a shareholder would pay on fund distributions or the redemption of fund shares. During periods of reimbursement by Fidelity, a fund's total return will be greater than it would be had the reimbursement not occurred. How a fund did yesterday is no guarantee of how it will do tomorrow.
Average Annual Total Returns
Periods ended July 31, 2010 | Past 1
year | Past 5
years | Past 10
years |
Fidelity Blue Chip Growth Fund | 18.29% | 1.19% | -2.22% |
$10,000 Over 10 Years
Let's say hypothetically that $10,000 was invested in Fidelity® Blue Chip Growth Fund, a class of the fund, on July 31, 2000. The chart shows how the value of your investment would have changed, and also shows how the Russell 1000® Growth Index performed over the same period.
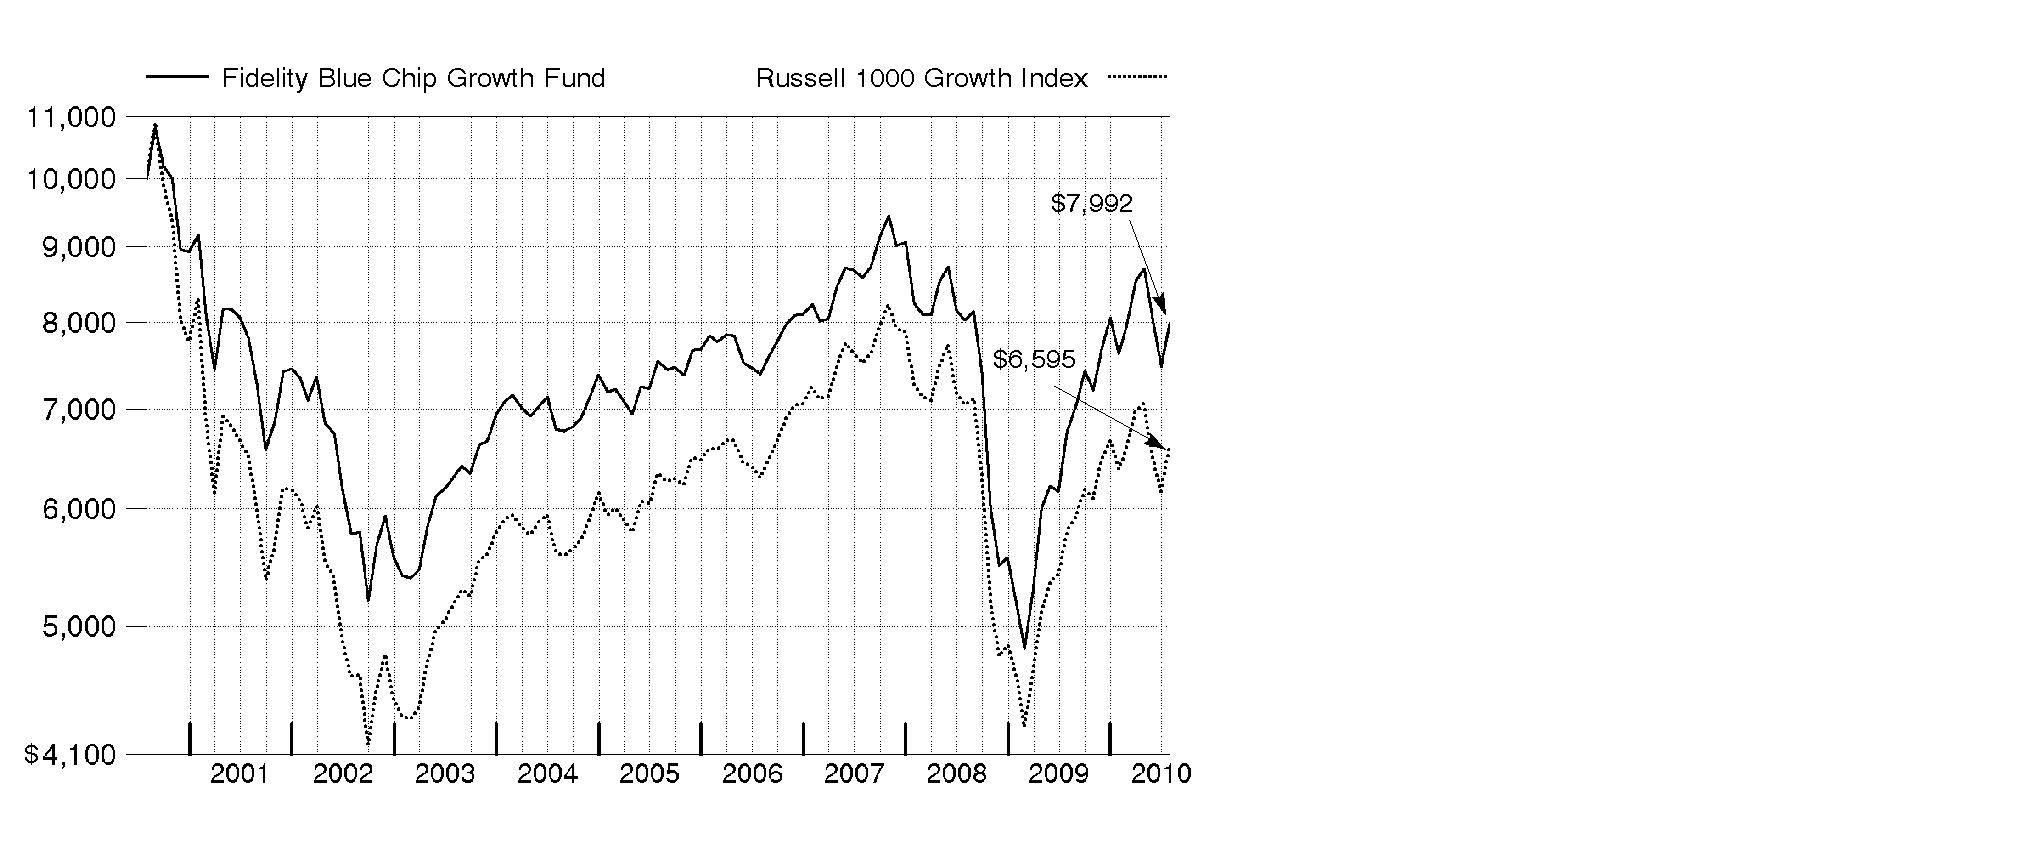
Annual Report
Market Recap: U.S. stock markets saw double-digit gains for the year ending July 31, 2010, despite the return of market volatility and risk aversion during the first half of 2010. An impressive bull run continued through 2009, bolstered by improvement in the economy and credit markets. Early in the new year, however, stocks fell sharply amid concerns about the global economic recovery, fueled by European debt woes and China's efforts to restrain inflation. After this brief dip, markets regained their upward momentum, as government stimulus and significant corporate cost cutting led to encouraging earnings reports, improved credit conditions and rising consumer confidence. Positive news continued through mid-April, when the Dow Jones Industrial AverageSM pushed above the 11,000 mark for the first time in 19 months. That milestone was short-lived, however, as heightened concern about the European debt crisis sparked an abrupt sell-off in May, leading to the first official correction since the rally began in March 2009. Although the market's malaise continued through June, stocks saw solid gains in July. For the year, the Dow rose 17.28%, while the S&P 500® Index was up 13.84%. Elsewhere, the technology-laden Nasdaq Composite® Index returned 14.99%. Small- and mid-cap stocks performed best, as measured by the 18.43% increase of the Russell 2000® Index and the 23.21% gain of the Russell Midcap® Index.
Comments from Sonu Kalra, Portfolio Manager of Fidelity® Blue Chip Growth Fund: For the one-year period, the fund's Retail Class shares gained 18.29%, solidly outpacing the 13.65% return of the Russell 1000® Growth Index. Strong stock selection in technology, industrials, consumer discretionary, financials and materials fueled performance, while my picks in health care and industry positioning within financials nicked results. Several tech stocks helped, including Apple, Baidu and SanDisk. Apple - the fund's largest holding - performed well amid the launch of its iPad tablet device and continued success of its iPhone and personal computers. Baidu, China's largest search engine, rose on news that its U.S.- based competitor Google considered leaving the Chinese market. SanDisk benefited from maintaining supply of the flash memory used in smart phones during an industrywide shortage. UAL (parent company of United Airlines) was the top contributor, benefiting from a recovery in travel and leisure spending. Notable detractors were Marvell Technology Group, a semiconductor manufacturer that faced oversupply issues in the hard-disk drive industry, and diversified financials firms Morgan Stanley and Bank of America, which were hurt due in part to uncertainty regarding potential regulatory reform. I sold Bank of America by period end.
The views expressed above reflect those of the portfolio manager(s) only through the end of the period as stated on the cover of this report and do not necessarily represent the views of Fidelity or any other person in the Fidelity organization. Any such views are subject to change at any time based upon market or other conditions and Fidelity disclaims any responsibility to update such views. These views may not be relied on as investment advice and, because investment decisions for a Fidelity fund are based on numerous factors, may not be relied on as an indication of trading intent on behalf of any Fidelity fund.
Annual Report
Shareholder Expense Example
As a shareholder of the Fund, you incur two types of costs: (1) transaction costs, and (2) ongoing costs, including management fees and other Fund expenses. This Example is intended to help you understand your ongoing costs (in dollars) of investing in the Fund and to compare these costs with the ongoing costs of investing in other mutual funds.
The Example is based on an investment of $1,000 invested at the beginning of the period and held for the entire period (February 1, 2010 to July 31, 2010).
Actual Expenses
The first line of the accompanying table for each class of the Fund provides information about actual account values and actual expenses. You may use the information in this line, together with the amount you invested, to estimate the expenses that you paid over the period. Simply divide your account value by $1,000.00 (for example, an $8,600 account value divided by $1,000.00 = 8.6), then multiply the result by the number in the first line for a class of the Fund under the heading entitled "Expenses Paid During Period" to estimate the expenses you paid on your account during this period. A small balance maintenance fee of $12.00 that is charged once a year may apply for certain accounts with a value of less than $2,000. This fee is not included in the table below. If it was, the estimate of expenses you paid during the period would be higher, and your ending account value lower, by this amount. In addition, the Fund, as a shareholder in the underlying Fidelity Central Funds, will indirectly bear its pro-rata share of the fees and expenses incurred by the underlying Fidelity Central Funds. These fees and expenses are not included in the Fund's annualized expense ratio used to calculate the expense estimate in the table below.
Hypothetical Example for Comparison Purposes
The second line of the accompanying table for each class of the Fund provides information about hypothetical account values and hypothetical expenses based on a Class' actual expense ratio and an assumed rate of return of 5% per year before expenses, which is not the Class' actual return. The hypothetical account values and expenses may not be used to estimate the actual ending account balance or expenses you paid for the period. You may use this information to compare the ongoing costs of investing in the Fund and other funds. To do so, compare this 5% hypothetical example with the 5% hypothetical examples that appear in the shareholder reports of the other funds. A small balance maintenance fee of $12.00 that is charged once a year may apply for certain accounts with a value of less than $2,000. This fee is not included in the table below. If it was, the estimate of expenses you paid during the period would be higher, and your ending account value lower, by this amount. In addition, the Fund, as a shareholder in the underlying Fidelity Central Funds, will indirectly bear its pro-rata share of the fees and expenses incurred by the underlying Fidelity Central Funds. These fees and expenses are not included in the Fund's annualized expense ratio used to calculate the expense estimate in the table below.
Please note that the expenses shown in the table are meant to highlight your ongoing costs only and do not reflect any transaction costs. Therefore, the second line of the table is useful in comparing ongoing costs only, and will not help you determine the relative total costs of owning different funds.
Annual Report
Shareholder Expense Example - continued
| Annualized
Expense Ratio | Beginning
Account Value
February 1, 2010 | Ending
Account Value
July 31, 2010 | Expenses Paid
During Period*
February 1, 2010 to July 31, 2010 |
Blue Chip Growth | .97% | | | |
Actual | | $ 1,000.00 | $ 1,048.20 | $ 4.93 |
HypotheticalA | | $ 1,000.00 | $ 1,019.98 | $ 4.86 |
Class K | .78% | | | |
Actual | | $ 1,000.00 | $ 1,049.00 | $ 3.96 |
HypotheticalA | | $ 1,000.00 | $ 1,020.93 | $ 3.91 |
Class F | .71% | | | |
Actual | | $ 1,000.00 | $ 1,049.30 | $ 3.61 |
HypotheticalA | | $ 1,000.00 | $ 1,021.27 | $ 3.56 |
A 5% return per year before expenses
* Expenses are equal to each Class' annualized expense ratio, multiplied by the average account value over the period, multiplied by 181/365 (to reflect the one-half year period).
Annual Report
Investment Changes (Unaudited)
Top Ten Stocks as of July 31, 2010 |
| % of fund's
net assets | % of fund's net assets
6 months ago |
Apple, Inc. | 6.6 | 5.1 |
Google, Inc. Class A | 3.2 | 4.2 |
Hewlett-Packard Co. | 3.0 | 2.7 |
Exxon Mobil Corp. | 2.4 | 0.0 |
Amazon.com, Inc. | 2.1 | 1.8 |
Cisco Systems, Inc. | 2.0 | 2.1 |
QUALCOMM, Inc. | 1.7 | 1.6 |
Philip Morris International, Inc. | 1.6 | 0.8 |
Target Corp. | 1.4 | 1.7 |
Research In Motion Ltd. | 1.4 | 1.1 |
| 25.4 | |
Top Five Market Sectors as of July 31, 2010 |
| % of fund's
net assets | % of fund's net assets
6 months ago |
Information Technology | 35.1 | 36.4 |
Consumer Discretionary | 15.1 | 12.7 |
Industrials | 13.6 | 9.1 |
Consumer Staples | 8.1 | 11.4 |
Financials | 7.8 | 8.8 |
Asset Allocation (% of fund's net assets) |
As of July 31, 2010* | As of January 31, 2010** |
 | Stocks 99.5% | | | Stocks 99.7% | |
 | Convertible
Securities 0.0% | |  | Convertible
Securities 0.1% | |
 | Short-Term
Investments and
Net Other Assets 0.5% | | | Short-Term
Investments and
Net Other Assets 0.2% | |
* Foreign investments | 8.6% | | ** Foreign investments | 7.7% | |

Annual Report
Investments July 31, 2010
Showing Percentage of Net Assets
Common Stocks - 99.3% |
| Shares | | Value (000s) |
CONSUMER DISCRETIONARY - 14.9% |
Automobiles - 1.2% |
Bajaj Auto Ltd. | 307,614 | | $ 17,826 |
Bayerische Motoren Werke AG (BMW) | 513,708 | | 27,659 |
Ford Motor Co. (a) | 5,046,300 | | 64,441 |
Hyundai Motor Co. | 95,676 | | 12,053 |
Tesla Motors, Inc. (a) | 1,059,000 | | 21,116 |
| | 143,095 |
Diversified Consumer Services - 0.3% |
Coinstar, Inc. (a) | 743,594 | | 33,834 |
Hotels, Restaurants & Leisure - 3.8% |
Chipotle Mexican Grill, Inc. (a) | 125,500 | | 18,561 |
Genting International PLC (a) | 7,982,000 | | 7,454 |
Las Vegas Sands Corp. (a)(d) | 3,715,000 | | 99,785 |
Marriott International, Inc. Class A | 1,213,400 | | 41,146 |
McDonald's Corp. | 344,000 | | 23,987 |
Starbucks Corp. | 4,457,400 | | 110,766 |
Starwood Hotels & Resorts Worldwide, Inc. | 1,248,000 | | 60,466 |
WMS Industries, Inc. (a) | 623,800 | | 24,023 |
Wyndham Worldwide Corp. | 1,872,885 | | 47,815 |
| | 434,003 |
Household Durables - 0.9% |
Furniture Brands International, Inc. (a)(e) | 2,927,549 | | 16,160 |
Harman International Industries, Inc. (a) | 613,400 | | 18,653 |
Stanley Black & Decker, Inc. | 780,700 | | 45,296 |
Tempur-Pedic International, Inc. (a) | 789,200 | | 24,205 |
| | 104,314 |
Internet & Catalog Retail - 2.1% |
Amazon.com, Inc. (a) | 2,080,800 | | 245,306 |
Media - 1.4% |
Comcast Corp. Class A | 1,223,700 | | 23,825 |
DIRECTV (a) | 1,778,019 | | 66,071 |
DISH Network Corp. Class A | 898,200 | | 18,036 |
ReachLocal, Inc. | 19,922 | | 277 |
The Walt Disney Co. | 857,300 | | 28,882 |
Time Warner Cable, Inc. | 520,700 | | 29,768 |
| | 166,859 |
Multiline Retail - 2.7% |
Kohl's Corp. (a) | 822,400 | | 39,220 |
Common Stocks - continued |
| Shares | | Value (000s) |
CONSUMER DISCRETIONARY - continued |
Multiline Retail - continued |
Macy's, Inc. | 5,592,700 | | $ 104,304 |
Target Corp. | 3,220,200 | | 165,261 |
| | 308,785 |
Specialty Retail - 1.6% |
Foot Locker, Inc. | 1,739,600 | | 23,641 |
Home Depot, Inc. | 1,148,800 | | 32,752 |
Limited Brands, Inc. | 594,800 | | 15,251 |
Lowe's Companies, Inc. | 3,326,400 | | 68,990 |
RadioShack Corp. | 1,136,433 | | 24,479 |
rue21, Inc. | 458,250 | | 13,899 |
| | 179,012 |
Textiles, Apparel & Luxury Goods - 0.9% |
Coach, Inc. | 798,400 | | 29,517 |
Liz Claiborne, Inc. (a)(d) | 1,478,217 | | 7,007 |
NIKE, Inc. Class B | 257,300 | | 18,948 |
Phillips-Van Heusen Corp. | 269,300 | | 13,974 |
Polo Ralph Lauren Corp. Class A | 224,600 | | 17,746 |
Under Armour, Inc. Class A (sub. vtg.) (a)(d) | 413,000 | | 15,512 |
| | 102,704 |
TOTAL CONSUMER DISCRETIONARY | | 1,717,912 |
CONSUMER STAPLES - 8.1% |
Beverages - 3.0% |
Anheuser-Busch InBev SA NV | 798,981 | | 42,315 |
Coca-Cola Enterprises, Inc. | 509,100 | | 14,611 |
Dr Pepper Snapple Group, Inc. | 2,471,300 | | 92,797 |
PepsiCo, Inc. | 558,500 | | 36,252 |
The Coca-Cola Co. | 2,864,500 | | 157,863 |
| | 343,838 |
Food & Staples Retailing - 1.7% |
CVS Caremark Corp. | 2,088,500 | | 64,096 |
Kroger Co. | 1,943,000 | | 41,153 |
Walgreen Co. | 1,643,600 | | 46,925 |
Whole Foods Market, Inc. (a) | 1,102,100 | | 41,847 |
| | 194,021 |
Food Products - 0.5% |
Diamond Foods, Inc. (d) | 374,000 | | 16,658 |
Common Stocks - continued |
| Shares | | Value (000s) |
CONSUMER STAPLES - continued |
Food Products - continued |
Green Mountain Coffee Roasters, Inc. (a) | 1,044,400 | | $ 32,157 |
Mead Johnson Nutrition Co. Class A | 103,400 | | 5,495 |
| | 54,310 |
Household Products - 1.3% |
Kimberly-Clark Corp. | 1,176,200 | | 75,418 |
Procter & Gamble Co. | 1,193,600 | | 73,001 |
| | 148,419 |
Personal Products - 0.0% |
Emami Ltd. | 631,338 | | 6,231 |
Tobacco - 1.6% |
Philip Morris International, Inc. | 3,675,000 | | 187,572 |
TOTAL CONSUMER STAPLES | | 934,391 |
ENERGY - 7.4% |
Energy Equipment & Services - 1.4% |
Halliburton Co. | 356,400 | | 10,649 |
National Oilwell Varco, Inc. | 935,700 | | 36,642 |
Schlumberger Ltd. | 1,251,200 | | 74,647 |
Transocean Ltd. (a) | 400,200 | | 18,493 |
Weatherford International Ltd. (a) | 1,116,200 | | 18,082 |
| | 158,513 |
Oil, Gas & Consumable Fuels - 6.0% |
Alpha Natural Resources, Inc. (a) | 560,000 | | 21,465 |
Anadarko Petroleum Corp. | 961,700 | | 47,277 |
Chevron Corp. | 578,400 | | 44,080 |
ConocoPhillips | 233,500 | | 12,894 |
EOG Resources, Inc. | 1,027,100 | | 100,142 |
Exxon Mobil Corp. | 4,575,300 | | 273,054 |
Marathon Oil Corp. | 540,800 | | 18,090 |
Massey Energy Co. | 1,253,800 | | 38,341 |
Occidental Petroleum Corp. | 1,111,200 | | 86,596 |
Reliance Industries Ltd. | 373,169 | | 8,123 |
Sunoco, Inc. | 1,284,200 | | 45,807 |
| | 695,869 |
TOTAL ENERGY | | 854,382 |
Common Stocks - continued |
| Shares | | Value (000s) |
FINANCIALS - 7.8% |
Capital Markets - 1.4% |
Goldman Sachs Group, Inc. | 270,900 | | $ 40,857 |
Morgan Stanley | 4,212,500 | | 113,695 |
| | 154,552 |
Commercial Banks - 1.5% |
Axis Bank Ltd. | 311,281 | | 9,016 |
Bank of Baroda | 158,405 | | 2,672 |
Punjab National Bank | 327,071 | | 8,118 |
Regions Financial Corp. | 4,116,900 | | 30,177 |
SunTrust Banks, Inc. | 680,700 | | 17,664 |
Synovus Financial Corp. | 2,594,976 | | 6,799 |
Wells Fargo & Co. | 3,707,100 | | 102,798 |
| | 177,244 |
Consumer Finance - 0.9% |
American Express Co. | 2,368,200 | | 105,716 |
Diversified Financial Services - 2.6% |
Citigroup, Inc. (a) | 32,696,800 | | 134,057 |
Infrastructure Development Finance Co. Ltd. | 852,826 | | 3,419 |
JPMorgan Chase & Co. | 3,525,700 | | 142,015 |
NBH Holdings Corp. Class A (a)(f) | 347,410 | | 6,774 |
Rural Electrification Corp. Ltd. | 2,406,330 | | 16,357 |
| | 302,622 |
Insurance - 0.7% |
Assured Guaranty Ltd. | 1,971,300 | | 30,949 |
Genworth Financial, Inc. Class A (a) | 3,268,300 | | 44,384 |
| | 75,333 |
Real Estate Management & Development - 0.7% |
Ackruti City Ltd. | 1,950,000 | | 21,009 |
CB Richard Ellis Group, Inc. Class A (a) | 1,461,000 | | 24,837 |
Emami Infrastructure Ltd. (a) | 105,223 | | 204 |
Indiabulls Real Estate Ltd. (a) | 5,411,272 | | 19,103 |
Parsvnath Developers Ltd. (a) | 6,435,670 | | 18,023 |
| | 83,176 |
TOTAL FINANCIALS | | 898,643 |
HEALTH CARE - 7.4% |
Biotechnology - 3.2% |
Alkermes, Inc. (a) | 917,100 | | 11,831 |
Amgen, Inc. (a) | 1,321,500 | | 72,061 |
Amylin Pharmaceuticals, Inc. (a) | 2,132,700 | | 40,351 |
Common Stocks - continued |
| Shares | | Value (000s) |
HEALTH CARE - continued |
Biotechnology - continued |
Cephalon, Inc. (a) | 187,600 | | $ 10,646 |
Dendreon Corp. (a) | 1,039,281 | | 34,203 |
Genzyme Corp. (a) | 372,700 | | 25,925 |
Gilead Sciences, Inc. (a) | 2,202,800 | | 73,397 |
Human Genome Sciences, Inc. (a) | 1,012,500 | | 26,264 |
ImmunoGen, Inc. (a) | 547,037 | | 5,159 |
Micromet, Inc. (a) | 1,322,420 | | 9,059 |
Vertex Pharmaceuticals, Inc. (a) | 1,674,100 | | 56,350 |
| | 365,246 |
Health Care Equipment & Supplies - 0.2% |
Hologic, Inc. (a) | 425,800 | | 6,021 |
NuVasive, Inc. (a) | 640,300 | | 20,983 |
| | 27,004 |
Health Care Providers & Services - 2.5% |
Express Scripts, Inc. (a) | 3,218,980 | | 145,434 |
McKesson Corp. | 1,063,100 | | 66,784 |
Medco Health Solutions, Inc. (a) | 1,687,100 | | 80,981 |
| | 293,199 |
Health Care Technology - 0.7% |
Allscripts-Misys Healthcare Solutions, Inc. (a) | 1,355,300 | | 22,620 |
Cerner Corp. (a) | 679,300 | | 52,612 |
| | 75,232 |
Life Sciences Tools & Services - 0.3% |
Illumina, Inc. (a) | 300,000 | | 13,449 |
Life Technologies Corp. (a) | 524,300 | | 22,540 |
| | 35,989 |
Pharmaceuticals - 0.5% |
Allergan, Inc. | 590,700 | | 36,068 |
Forest Laboratories, Inc. (a) | 400,000 | | 11,100 |
Merck & Co., Inc. | 442,500 | | 15,249 |
| | 62,417 |
TOTAL HEALTH CARE | | 859,087 |
INDUSTRIALS - 13.6% |
Aerospace & Defense - 2.9% |
Honeywell International, Inc. | 1,338,900 | | 57,385 |
Precision Castparts Corp. | 666,600 | | 81,452 |
Common Stocks - continued |
| Shares | | Value (000s) |
INDUSTRIALS - continued |
Aerospace & Defense - continued |
The Boeing Co. | 618,200 | | $ 42,124 |
United Technologies Corp. | 2,131,700 | | 151,564 |
| | 332,525 |
Air Freight & Logistics - 0.5% |
C.H. Robinson Worldwide, Inc. | 94,800 | | 6,181 |
United Parcel Service, Inc. Class B | 799,500 | | 51,968 |
| | 58,149 |
Airlines - 1.9% |
Continental Airlines, Inc. Class B (a) | 1,243,300 | | 31,107 |
Delta Air Lines, Inc. (a) | 5,031,700 | | 59,777 |
UAL Corp. (a) | 4,742,800 | | 112,594 |
US Airways Group, Inc. (a) | 1,991,700 | | 21,610 |
| | 225,088 |
Commercial Services & Supplies - 0.1% |
Republic Services, Inc. | 384,800 | | 12,260 |
Construction & Engineering - 1.2% |
Fluor Corp. | 1,750,800 | | 84,546 |
Jacobs Engineering Group, Inc. (a) | 1,212,771 | | 44,351 |
KBR, Inc. | 608,300 | | 13,614 |
| | 142,511 |
Industrial Conglomerates - 1.1% |
3M Co. | 731,200 | | 62,547 |
General Electric Co. | 2,982,800 | | 48,083 |
Textron, Inc. | 630,200 | | 13,083 |
| | 123,713 |
Machinery - 4.3% |
ArvinMeritor, Inc. (a) | 476,024 | | 7,812 |
Bucyrus International, Inc. Class A | 1,187,800 | | 73,905 |
Caterpillar, Inc. | 667,500 | | 46,558 |
Cummins, Inc. | 1,066,500 | | 84,904 |
Danaher Corp. | 1,397,700 | | 53,686 |
Ingersoll-Rand Co. Ltd. | 3,423,400 | | 128,241 |
Joy Global, Inc. | 224,137 | | 13,307 |
PACCAR, Inc. | 1,522,500 | | 69,761 |
Pall Corp. | 319,900 | | 12,233 |
Thermax Ltd. | 211,215 | | 3,456 |
| | 493,863 |
Common Stocks - continued |
| Shares | | Value (000s) |
INDUSTRIALS - continued |
Professional Services - 0.3% |
Manpower, Inc. | 798,700 | | $ 38,322 |
Road & Rail - 1.2% |
CSX Corp. | 843,400 | | 44,464 |
Union Pacific Corp. | 1,275,700 | | 95,257 |
| | 139,721 |
Trading Companies & Distributors - 0.1% |
Adani Enterprises Ltd. | 571,688 | | 7,196 |
TOTAL INDUSTRIALS | | 1,573,348 |
INFORMATION TECHNOLOGY - 35.1% |
Communications Equipment - 5.9% |
Acme Packet, Inc. (a) | 579,500 | | 16,377 |
Cisco Systems, Inc. (a) | 9,875,700 | | 227,832 |
DG FastChannel, Inc. (a) | 854,760 | | 32,592 |
Juniper Networks, Inc. (a) | 638,000 | | 17,724 |
Motorola, Inc. (a) | 3,811,700 | | 28,550 |
QUALCOMM, Inc. | 5,182,400 | | 197,346 |
Research In Motion Ltd. (a) | 2,756,700 | | 158,593 |
| | 679,014 |
Computers & Peripherals - 11.1% |
Apple, Inc. (a) | 2,946,300 | | 757,927 |
Dell, Inc. (a) | 1,180,700 | | 15,632 |
Hewlett-Packard Co. | 7,541,400 | | 347,206 |
Isilon Systems, Inc. (a) | 351,700 | | 6,169 |
NetApp, Inc. (a) | 1,877,700 | | 79,427 |
SanDisk Corp. (a) | 795,187 | | 34,750 |
STEC, Inc. (a) | 230,500 | | 3,596 |
Western Digital Corp. (a) | 1,290,400 | | 34,054 |
| | 1,278,761 |
Electronic Equipment & Components - 0.8% |
Agilent Technologies, Inc. (a) | 3,466,655 | | 96,824 |
Internet Software & Services - 5.1% |
Akamai Technologies, Inc. (a) | 2,064,300 | | 79,187 |
Baidu.com, Inc. sponsored ADR (a) | 668,800 | | 54,447 |
Google, Inc. Class A (a) | 760,900 | | 368,922 |
Monster Worldwide, Inc. (a)(d) | 2,970,649 | | 40,757 |
Common Stocks - continued |
| Shares | | Value (000s) |
INFORMATION TECHNOLOGY - continued |
Internet Software & Services - continued |
OpenTable, Inc. (a)(d) | 337,051 | | $ 15,066 |
Rackspace Hosting, Inc. (a) | 1,459,800 | | 27,298 |
| | 585,677 |
IT Services - 3.1% |
Alliance Data Systems Corp. (a) | 202,400 | | 11,634 |
Cognizant Technology Solutions Corp. Class A (a) | 1,139,800 | | 62,187 |
MasterCard, Inc. Class A | 749,100 | | 157,341 |
Visa, Inc. Class A | 1,780,400 | | 130,592 |
| | 361,754 |
Office Electronics - 0.4% |
Xerox Corp. | 5,282,200 | | 51,449 |
Semiconductors & Semiconductor Equipment - 4.3% |
Altera Corp. | 2,393,000 | | 66,334 |
ARM Holdings PLC sponsored ADR | 409,500 | | 6,327 |
Avago Technologies Ltd. | 1,641,700 | | 35,723 |
Broadcom Corp. Class A | 2,672,400 | | 96,287 |
Cree, Inc. (a) | 200,500 | | 14,203 |
First Solar, Inc. (a) | 130,400 | | 16,359 |
Intel Corp. | 1,109,217 | | 22,850 |
Lam Research Corp. (a) | 1,911,700 | | 80,655 |
Marvell Technology Group Ltd. (a) | 7,311,000 | | 109,080 |
MEMC Electronic Materials, Inc. (a) | 2,111,200 | | 20,183 |
Silicon Laboratories, Inc. (a) | 461,100 | | 18,467 |
Trina Solar Ltd. ADR (a)(d) | 539,700 | | 11,733 |
| | 498,201 |
Software - 4.4% |
Autonomy Corp. PLC (a) | 324,900 | | 8,382 |
Check Point Software Technologies Ltd. (a) | 1,523,600 | | 51,833 |
Citrix Systems, Inc. (a) | 630,500 | | 34,690 |
Informatica Corp. (a) | 1,193,700 | | 35,966 |
Microsoft Corp. | 6,000,600 | | 154,875 |
Nuance Communications, Inc. (a) | 1,889,000 | | 31,187 |
Oracle Corp. | 1,900,500 | | 44,928 |
QLIK Technologies, Inc. | 484,100 | | 6,957 |
Red Hat, Inc. (a) | 2,023,300 | | 65,049 |
Salesforce.com, Inc. (a) | 158,800 | | 15,713 |
SuccessFactors, Inc. (a) | 199,100 | | 4,044 |
Common Stocks - continued |
| Shares | | Value (000s) |
INFORMATION TECHNOLOGY - continued |
Software - continued |
TeleNav, Inc. | 125,000 | | $ 680 |
VMware, Inc. Class A (a) | 618,500 | | 47,952 |
| | 502,256 |
TOTAL INFORMATION TECHNOLOGY | | 4,053,936 |
MATERIALS - 3.9% |
Chemicals - 2.5% |
Asian Paints India Ltd. | 44,645 | | 2,506 |
CF Industries Holdings, Inc. | 401,400 | | 32,590 |
Dow Chemical Co. | 3,468,700 | | 94,800 |
Monsanto Co. | 1,943,700 | | 112,424 |
The Mosaic Co. | 1,054,900 | | 50,266 |
| | 292,586 |
Containers & Packaging - 0.8% |
Ball Corp. | 220,500 | | 12,842 |
Owens-Illinois, Inc. (a) | 1,020,762 | | 28,224 |
Pactiv Corp. (a) | 1,524,300 | | 46,369 |
| | 87,435 |
Metals & Mining - 0.6% |
Allegheny Technologies, Inc. | 155,800 | | 7,418 |
Carpenter Technology Corp. | 218,500 | | 7,637 |
Freeport-McMoRan Copper & Gold, Inc. | 584,600 | | 41,822 |
Titanium Metals Corp. (a) | 369,600 | | 8,183 |
| | 65,060 |
TOTAL MATERIALS | | 445,081 |
TELECOMMUNICATION SERVICES - 1.1% |
Diversified Telecommunication Services - 0.0% |
China Unicom (Hong Kong) Ltd. sponsored ADR | 423,500 | | 5,777 |
Wireless Telecommunication Services - 1.1% |
NII Holdings, Inc. (a) | 306,000 | | 11,463 |
Reliance Communication Ltd. | 887,130 | | 3,418 |
Common Stocks - continued |
| Shares | | Value (000s) |
TELECOMMUNICATION SERVICES - continued |
Wireless Telecommunication Services - continued |
SOFTBANK CORP. | 714,900 | | $ 21,383 |
Sprint Nextel Corp. (a) | 19,819,900 | | 90,577 |
| | 126,841 |
TOTAL TELECOMMUNICATION SERVICES | | 132,618 |
TOTAL COMMON STOCKS (Cost $9,668,137) | 11,469,398 |
Nonconvertible Preferred Stocks - 0.2% |
| | | |
CONSUMER DISCRETIONARY - 0.2% |
Automobiles - 0.2% |
Volkswagen AG | 170,700 | | 18,090 |
TOTAL NONCONVERTIBLE PREFERRED STOCKS (Cost $18,090) | 18,090 |
Money Market Funds - 1.1% |
| | | |
Fidelity Cash Central Fund, 0.24% (b) | 28,827,628 | | 28,828 |
Fidelity Securities Lending Cash Central Fund, 0.27% (b)(c) | 96,631,450 | | 96,631 |
TOTAL MONEY MARKET FUNDS (Cost $125,459) | 125,459 |
TOTAL INVESTMENT PORTFOLIO - 100.6% (Cost $9,811,686) | | 11,612,947 |
NET OTHER ASSETS (LIABILITIES) - (0.6)% | | (64,727) |
NET ASSETS - 100% | $ 11,548,220 |
Legend |
(a) Non-income producing |
(b) Affiliated fund that is available only to investment companies and other accounts managed by Fidelity Investments. The rate quoted is the annualized seven-day yield of the fund at period end. A complete unaudited listing of the fund's holdings as of its most recent quarter end is available upon request. |
(c) Investment made with cash collateral received from securities on loan. |
(d) Security or a portion of the security is on loan at period end. |
(e) Affiliated company |
(f) Security exempt from registration under Rule 144A of the Securities Act of 1933. These securities may be resold in transactions exempt from registration, normally to qualified institutional buyers. At the end of the period, the value of these securities amounted to $6,774,000 or 0.1% of net assets. |
Affiliated Central Funds |
Information regarding fiscal year to date income earned by the Fund from investments in Fidelity Central Funds is as follows: |
Fund | Income earned
(Amounts in thousands) |
Fidelity Cash Central Fund | $ 33 |
Fidelity Securities Lending Cash Central Fund | 263 |
Total | $ 296 |
Other Affiliated Issuers |
An affiliated company is a company in which the fund has ownership of at least 5% of the voting securities. Fiscal year to date transactions with companies which are or were affiliates are as follows: |
Affiliate
(Amounts in thousands) | Value, beginning of period | Purchases | Sales Proceeds | Dividend Income | Value,
end of
period |
Furniture Brands International, Inc. | $ 19,567 | $ 202 | $ 12,871 | $ - | $ 16,160 |
Total | $ 19,567 | $ 202 | $ 12,871 | $ - | $ 16,160 |
Other Information |
The following is a summary of the inputs used, as of July 31, 2010, involving the Fund's assets and liabilities carried at fair value. The inputs or methodology used for valuing securities may not be an indication of the risk associated with investing in those securities. For more information on valuation inputs, and their aggregation into the levels used in the tables below, please refer to the Security Valuation section in the accompanying Notes to Financial Statements. |
Valuation Inputs at Reporting Date: |
Description
(Amounts in thousands) | Total | Level 1 | Level 2 | Level 3 |
Investments in Securities: | | | | |
Equities: | | | | |
Consumer Discretionary | $ 1,736,002 | $ 1,736,002 | $ - | $ - |
Consumer Staples | 934,595 | 934,595 | - | - |
Energy | 854,382 | 854,382 | - | - |
Financials | 898,439 | 864,518 | 27,147 | 6,774 |
Health Care | 859,087 | 859,087 | - | - |
Industrials | 1,573,348 | 1,573,348 | - | - |
Information Technology | 4,053,936 | 4,053,936 | - | - |
Materials | 445,081 | 445,081 | - | - |
Telecommunication Services | 132,618 | 132,618 | - | - |
Money Market Funds | 125,459 | 125,459 | - | - |
Total Investments in Securities: | $ 11,612,947 | $ 11,579,026 | $ 27,147 | $ 6,774 |
The following is a reconciliation of Investments in Securities for which Level 3 inputs were used in determining value: |
(Amounts in thousands) | |
Investments in Securities: | |
Beginning Balance | $ - |
Total Realized Gain (Loss) | (74) |
Total Unrealized Gain (Loss) | (175) |
Cost of Purchases | 8,882 |
Proceeds of Sales | (1,859) |
Amortization/Accretion | - |
Transfers in to Level 3 | - |
Transfers out of Level 3 | - |
Ending Balance | $ 6,774 |
The change in unrealized gain (loss) for the period attributable to Level 3 securities held at July 31, 2010 | $ (175) |
The information used in the above reconciliation represents fiscal year to date activity for any Investments in Securities identified as using Level 3 inputs at either the beginning or the end of the current fiscal period. Transfers in or out of Level 3 represent the beginning value of any Security or Instrument where a change in the pricing level occurred from the beginning to the end of the period. The cost of purchases and the proceeds of sales may include securities received or delivered through corporate actions or exchanges. Realized and unrealized gains (losses) disclosed in the reconciliation are included in Net Gain (Loss) on the Fund's Statement of Operations. |
Income Tax Information |
At July 31, 2010, the Fund had a capital loss carryforward of approximately $1,028,059,000 of which $671,371,000 and $356,688,000 will expire on July 31, 2017 and 2018, respectively. Capital loss carryforwards are only available to offset future capital gains of the Fund to the extent provided by regulations and may be limited. |
See accompanying notes which are an integral part of the financial statements.
Annual Report
Statement of Assets and Liabilities
Amounts in thousands (except per-share amounts) | July 31, 2010 |
| | |
Assets | | |
Investment in securities, at value (including securities loaned of $94,422) - See accompanying schedule: Unaffiliated issuers (cost $9,661,717) | $ 11,471,328 | |
Fidelity Central Funds (cost $125,459) | 125,459 | |
Other affiliated issuers (cost $24,510) | 16,160 | |
Total Investments (cost $9,811,686) | | $ 11,612,947 |
Foreign currency held at value (cost $300) | | 291 |
Receivable for investments sold | | 247,977 |
Receivable for fund shares sold | | 10,336 |
Dividends receivable | | 3,356 |
Distributions receivable from Fidelity Central Funds | | 32 |
Other receivables | | 1,561 |
Total assets | | 11,876,500 |
| | |
Liabilities | | |
Payable for investments purchased | $ 206,290 | |
Payable for fund shares redeemed | 16,071 | |
Accrued management fee | 6,463 | |
Other affiliated payables | 2,267 | |
Other payables and accrued expenses | 558 | |
Collateral on securities loaned, at value | 96,631 | |
Total liabilities | | 328,280 |
| | |
Net Assets | | $ 11,548,220 |
Net Assets consist of: | | |
Paid in capital | | $ 10,852,889 |
Undistributed net investment income | | 2,062 |
Accumulated undistributed net realized gain (loss) on investments and foreign currency transactions | | (1,107,768) |
Net unrealized appreciation (depreciation) on investments and assets and liabilities in foreign currencies | | 1,801,037 |
Net Assets | | $ 11,548,220 |
See accompanying notes which are an integral part of the financial statements.
Annual Report
Statement of Assets and Liabilities - continued
Amounts in thousands (except per-share amounts) | July 31, 2010 |
| | |
Blue Chip Growth:
Net Asset Value, offering price and redemption price per share ($10,295,210 ÷ 273,613 shares) | | $ 37.63 |
| | |
Class K:
Net Asset Value, offering price and redemption price per share ($931,601 ÷ 24,735 shares) | | $ 37.66 |
| | |
Class F:
Net Asset Value, offering price and redemption price per share ($321,409 ÷ 8,528 shares) | | $ 37.69 |
See accompanying notes which are an integral part of the financial statements.
Annual Report
Financial Statements - continued
Statement of Operations
Amounts in thousands | Year ended July 31, 2010 |
| | |
Investment Income | | |
Dividends | | $ 119,693 |
Interest | | 1 |
Income from Fidelity Central Funds | | 296 |
Total income | | 119,990 |
| | |
Expenses | | |
Management fee
Basic fee | $ 65,083 | |
Performance adjustment | 13,734 | |
Transfer agent fees | 27,053 | |
Accounting and security lending fees | 1,459 | |
Custodian fees and expenses | 297 | |
Independent trustees' compensation | 67 | |
Registration fees | 121 | |
Audit | 93 | |
Legal | 65 | |
Interest | 11 | |
Miscellaneous | 190 | |
Total expenses before reductions | 108,173 | |
Expense reductions | (1,805) | 106,368 |
Net investment income (loss) | | 13,622 |
Realized and Unrealized Gain (Loss) Net realized gain (loss) on: | | |
Investment securities: | | |
Unaffiliated issuers | 1,074,390 | |
Other affiliated issuers | (18,675) | |
Foreign currency transactions | (690) | |
Capital gain distributions from Fidelity Central Funds | 3 | |
Total net realized gain (loss) | | 1,055,028 |
Change in net unrealized appreciation (depreciation) on: Investment securities (net of increase in deferred foreign taxes of $49) | 793,523 | |
Assets and liabilities in foreign currencies | (176) | |
Total change in net unrealized appreciation (depreciation) | | 793,347 |
Net gain (loss) | | 1,848,375 |
Net increase (decrease) in net assets resulting from operations | | $ 1,861,997 |
See accompanying notes which are an integral part of the financial statements.
Annual Report
Statement of Changes in Net Assets
Amounts in thousands | Year ended
July 31,
2010 | Year ended
July 31,
2009 |
Increase (Decrease) in Net Assets | | |
Operations | | |
Net investment income (loss) | $ 13,622 | $ 90,600 |
Net realized gain (loss) | 1,055,028 | (2,127,104) |
Change in net unrealized appreciation (depreciation) | 793,347 | (205,346) |
Net increase (decrease) in net assets resulting
from operations | 1,861,997 | (2,241,850) |
Distributions to shareholders from net investment income | (57,433) | (99,426) |
Distributions to shareholders from net realized gain | - | (242,439) |
Total distributions | (57,433) | (341,865) |
Share transactions - net increase (decrease) | (538,131) | (483,151) |
Total increase (decrease) in net assets | 1,266,433 | (3,066,866) |
| | |
Net Assets | | |
Beginning of period | 10,281,787 | 13,348,653 |
End of period (including undistributed net investment income of $2,062 and undistributed net investment income of $39,489, respectively) | $ 11,548,220 | $ 10,281,787 |
See accompanying notes which are an integral part of the financial statements.
Annual Report
Financial Highlights - Blue Chip Growth
Years ended July 31, | 2010 | 2009 | 2008 | 2007 | 2006 |
Selected Per-Share Data | | | | | |
Net asset value, beginning of period | $ 31.97 | $ 39.06 | $ 46.88 | $ 41.54 | $ 42.60 |
Income from Investment Operations | | | | | |
Net investment income (loss) B | .04 | .27 | .35 | .32 | .23 |
Net realized and unrealized gain (loss) | 5.80 | (6.36) | (2.89) | 6.19 | (1.06) |
Total from investment operations | 5.84 | (6.09) | (2.54) | 6.51 | (.83) |
Distributions from net investment income | (.18) | (.29) | (.33) | (.24) | (.23) |
Distributions from net realized gain | - | (.71) | (4.95) | (.93) | - |
Total distributions | (.18) | (1.00) | (5.28) | (1.17) | (.23) |
Net asset value, end of period | $ 37.63 | $ 31.97 | $ 39.06 | $ 46.88 | $ 41.54 |
Total Return A | 18.29% | (15.85)% | (6.30)% | 16.02% | (1.97)% |
Ratios to Average Net Assets C, E | | | | | |
Expenses before reductions | .94% | .76% | .58% | .60% | .63% |
Expenses net of fee waivers, if any | .94% | .76% | .58% | .60% | .63% |
Expenses net of all reductions | .93% | .76% | .57% | .59% | .61% |
Net investment income (loss) | .10% | .93% | .81% | .72% | .54% |
Supplemental Data | | | | | |
Net assets, end of period (in millions) | $ 10,295 | $ 9,691 | $ 13,349 | $ 18,616 | $ 19,571 |
Portfolio turnover rate D | 135% | 134% | 82% | 87% | 48% |
A Total returns would have been lower had certain expenses not been reduced during the periods shown.
B Calculated based on average shares outstanding during the period.
C Fees and expenses of the underlying Fidelity Central Funds are not included in the Fund's expense ratio. The Fund indirectly bears its proportionate share of the expenses of any underlying Fidelity Central Funds.
D Amount does not include the portfolio activity of any underlying Fidelity Central Funds.
E Expense ratios reflect operating expenses of the class. Expenses before reductions do not reflect amounts reimbursed by the investment adviser or reductions from brokerage service arrangements or reductions from other expense offset arrangements and do not represent the amount paid by the class during periods when reimbursements or reductions occur. Expenses net of fee waivers reflect expenses after reimbursement by the investment adviser but prior to reductions from brokerage service arrangements or other expense offset arrangements. Expenses net of all reductions represent the net expenses paid by the class.
See accompanying notes which are an integral part of the financial statements.
Annual Report
Financial Highlights - Class K
Years ended July 31, | 2010 | 2009 | 2008 G |
Selected Per-Share Data | | | |
Net asset value, beginning of period | $ 32.01 | $ 39.07 | $ 41.81 |
Income from Investment Operations | | | |
Net investment income (loss) D | .11 | .32 | .10 |
Net realized and unrealized gain (loss) | 5.79 | (6.33) | (2.84) |
Total from investment operations | 5.90 | (6.01) | (2.74) |
Distributions from net investment income | (.25) | (.34) | - |
Distributions from net realized gain | - | (.71) | - |
Total distributions | (.25) | (1.05) | - |
Net asset value, end of period | $ 37.66 | $ 32.01 | $ 39.07 |
Total Return B, C | 18.48% | (15.61)% | (6.55)% |
Ratios to Average Net Assets E, H | | | |
Expenses before reductions | .75% | .53% | .41% A |
Expenses net of fee waivers, if any | .75% | .53% | .41% A |
Expenses net of all reductions | .74% | .52% | .41% A |
Net investment income (loss) | .30% | 1.16% | 1.09% A |
Supplemental Data | | | |
Net assets, end of period (000 omitted) | $ 931,601 | $ 590,673 | $ 93 |
Portfolio turnover rate F | 135% | 134% | 82% |
A Annualized
B Total returns for periods of less than one year are not annualized.
C Total returns would have been lower had certain expenses not been reduced during the periods shown.
D Calculated based on average shares outstanding during the period.
E Fees and expenses of the underlying Fidelity Central Funds are not included in the Fund's expense ratio. The Fund indirectly bears its proportionate share of the expenses of any underlying Fidelity Central Funds.
F Amount does not include the portfolio activity of any underlying Fidelity Central Funds.
G For the period May 9, 2008 (commencement of sale of shares) to July 31, 2008.
H Expense ratios reflect operating expenses of the class. Expenses before reductions do not reflect amounts reimbursed by the investment adviser or reductions from brokerage service arrangements or reductions from other expense offset arrangements and do not represent the amount paid by the class during periods when reimbursements or reductions occur. Expense ratios before reductions for start-up periods may not be representative of longer-term operating periods. Expenses net of fee waivers reflect expenses after reimbursement by the investment adviser but prior to reductions from brokerage service arrangements or other expense offset arrangements. Expenses net of all reductions represent the net expenses paid by the class.
See accompanying notes which are an integral part of the financial statements.
Annual Report
Financial Highlights - Class F
Years ended July 31, | 2010 | 2009 H |
Selected Per-Share Data | | |
Net asset value, beginning of period | $ 31.98 | $ 29.16 |
Income from Investment Operations | | |
Net investment income (loss) D | .13 | - J |
Net realized and unrealized gain (loss) | 5.80 | 2.82 G |
Total from investment operations | 5.93 | 2.82 |
Distributions from net investment income | (.22) | - |
Net asset value, end of period | $ 37.69 | $ 31.98 |
Total Return B, C | 18.59% | 9.67% |
Ratios to Average Net Assets E, I | | |
Expenses before reductions | .70% | .51% A |
Expenses net of fee waivers, if any | .70% | .51% A |
Expenses net of all reductions | .68% | .51% A |
Net investment income (loss) | .35% | (.05)% A |
Supplemental Data | | |
Net assets, end of period (000 omitted) | $ 321,409 | $ 261 |
Portfolio turnover rate F | 135% | 134% |
A Annualized
B Total returns for periods of less than one year are not annualized.
C Total returns would have been lower had certain expenses not been reduced during the periods shown.
D Calculated based on average shares outstanding during the period.
E Fees and expenses of the underlying Fidelity Central Funds are not included in the Fund's expense ratio. The Fund indirectly bears its proportionate share of the expenses of any underlying Fidelity Central Funds.
F Amount does not include the portfolio activity of any underlying Fidelity Central Funds.
G The amount shown for a share outstanding does not correspond with the aggregate net gain (loss) on investments for the period due to the timing of sales and repurchases of shares in relation to fluctuating market values of the investments of the Fund.
H For the period June 26, 2009 (commencement of sale of shares) to July 31, 2009.
I Expense ratios reflect operating expenses of the class. Expenses before reductions do not reflect amounts reimbursed by the investment adviser or reductions from brokerage service arrangements or reductions from other expense offset arrangements and do not represent the amount paid by the class during periods when reimbursements or reductions occur. Expense ratios before reductions for start-up periods may not be representative of longer-term operating periods. Expenses net of fee waivers reflect expenses after reimbursement by the investment adviser but prior to reductions from brokerage service arrangements or other expense offset arrangements. Expenses net of all reductions represent the net expenses paid by the class.
J Amount represents less than $.01 per share.
See accompanying notes which are an integral part of the financial statements.
Annual Report
Notes to Financial Statements
For the period ended July 31, 2010
1. Organization.
Fidelity Blue Chip Growth Fund (the Fund) is a fund of Fidelity Securities Fund (the Trust) and is authorized to issue an unlimited number of shares. The Trust is registered under the Investment Company Act of 1940, as amended (the 1940 Act), as an open-end management investment company organized as a Massachusetts business trust. The Fund offers Blue Chip Growth, Class K and Class F shares, each of which has equal rights as to assets and voting privileges. Each class has exclusive voting rights with respect to matters that affect that class. After the commencement of Class K, the Fund began offering conversion privileges between Blue Chip Growth and Class K to eligible shareholders of Blue Chip Growth. In order to disclose class level financial information dollar amounts presented in the notes are unrounded. Class F shares of the Fund are only available for purchase by mutual funds for which Fidelity Management & Research Company (FMR) or an affiliate serves as investment manager. Investment income, realized and unrealized capital gains and losses, the common expenses of the Fund, and certain fund-level expense reductions, if any, are allocated on a pro-rata basis to each class based on the relative net assets of each class to the total net assets of the Fund. Each class differs with respect to transfer agent fees incurred. Certain expense reductions also differ by class.
2. Investments in Fidelity Central Funds.
The Fund may invest in Fidelity Central Funds, which are open-end investment companies available only to other investment companies and accounts managed by FMR and its affiliates. The Fund's Schedule of Investments lists each of the Fidelity Central Funds held as of period end, if any, as an investment of the Fund, but does not include the underlying holdings of each Fidelity Central Fund. As an Investing Fund, the Fund indirectly bears its proportionate share of the expenses of the underlying Fidelity Central Funds.
The Money Market Central Funds seek preservation of capital and current income and are managed by Fidelity Investments Money Management, Inc. (FIMM), an affiliate of FMR.
A complete unaudited list of holdings for each Fidelity Central Fund is available upon request or at the Securities and Exchange Commission (the SEC) web site at www.sec.gov. In addition, the financial statements of the Fidelity Central Funds which are not covered by the Fund's Report of Independent Registered Public Accounting Firm, are available on the SEC web site or upon request.
Annual Report
Notes to Financial Statements - continued
3. Significant Accounting Policies.
The financial statements have been prepared in conformity with accounting principles generally accepted in the United States of America (GAAP), which require management to make certain estimates and assumptions at the date of the financial statements. Actual results could differ from those estimates. The following summarizes the significant accounting policies of the Fund:
Security Valuation. Investments are valued as of 4:00 p.m. Eastern time on the last calendar day of the period. The Fund uses independent pricing services approved by the Board of Trustees to value its investments. When current market prices or quotations are not readily available or reliable, valuations may be determined in good faith in accordance with procedures adopted by the Board of Trustees. Factors used in determining value may include market or security specific events. The frequency with which these procedures are used cannot be predicted and they may be utilized to a significant extent. The value used for net asset value (NAV) calculation under these procedures may differ from published prices for the same securities.
The Fund categorizes the inputs to valuation techniques used to value its investments into a disclosure hierarchy consisting of three levels as shown below.
Level 1 - quoted prices in active markets for identical investments
Level 2 - other significant observable inputs (including quoted prices for similar investments, interest rates, prepayment speeds, etc.)
Level 3 - unobservable inputs (including the fund's own assumptions based on the best information available)
Changes in valuation techniques may result in transfers in or out of an assigned level within the disclosure hierarchy. The aggregate value of investments by input level, as of July 31, 2010, as well as a roll forward of Level 3 securities, is included at the end of the Fund's Schedule of Investments. Valuation techniques used to value the Fund's investments by major category are as follows.
Equity securities, including restricted securities, for which market quotations are readily available, are valued at the last reported sale price or official closing price as reported by an independent pricing service on the primary market or exchange on which they are traded and are categorized as Level 1 in the hierarchy. In the event there were no sales during the day or closing prices are not available, securities are valued at the last quoted bid price or may be valued using the last available price and are generally categorized as Level 2 in the hierarchy. For foreign equity securities, when significant market or security specific events arise, comparisons to the valuation of American Depositary Receipts (ADRs), futures contracts, Exchange-traded funds (ETFs) and certain indexes as well as
Annual Report
3. Significant Accounting Policies - continued
Security Valuation - continued
quoted prices for similar securities are used and are categorized as Level 2 in the hierarchy in these circumstances. Utilizing these techniques may result in transfers between Level 1 and Level 2. For restricted equity securities and private placements where observable inputs are limited, assumptions about market activity and risk are used and are categorized as Level 3 in the hierarchy.
Investments in open-end mutual funds, including the Fidelity Central Funds, are valued at their closing net asset value each business day and are categorized as Level 1 in the hierarchy. Short-term securities with remaining maturities of sixty days or less for which quotations are not readily available are valued at amortized cost, which approximates fair value and are categorized as Level 2 in the hierarchy.
Foreign Currency. The Fund uses foreign currency contracts to facilitate transactions in foreign-denominated securities. Gains and losses from these transactions may arise from changes in the value of the foreign currency or if the counterparties do not perform under the contracts' terms.
Foreign-denominated assets, including investment securities, and liabilities are translated into U.S. dollars at the exchange rate at period end. Purchases and sales of investment securities, income and dividends received and expenses denominated in foreign currencies are translated into U.S. dollars at the exchange rate in effect on the transaction date.
The effects of exchange rate fluctuations on investments are included with the net realized and unrealized gain (loss) on investment securities. Other foreign currency transactions resulting in realized and unrealized gain (loss) are disclosed separately.
Investment Transactions and Income. For financial reporting purposes, the Fund's investment holdings and NAV include trades executed through the end of the last business day of the period. The NAV per share for processing shareholder transactions is calculated as of the close of business of the New York Stock Exchange (NYSE), normally 4:00 p.m. Eastern time and includes trades executed through the end of the prior business day. Gains and losses on securities sold are determined on the basis of identified cost and may include proceeds received from litigation. Dividend income is recorded on the ex-dividend date, except for certain dividends from foreign securities where the ex-dividend date may have passed, which are recorded as soon as the Fund is informed of the ex-dividend date. Non-cash dividends included in dividend income, if any, are recorded at the fair market value of the securities received. Distributions received on securities that represent a return of capital or capital gain are recorded as a reduction of cost of investments and/or as a realized gain. The Fund estimates the components of distributions received that may be considered return of capital distributions or capital
Annual Report
Notes to Financial Statements - continued
3. Significant Accounting Policies - continued
Investment Transactions and Income - continued
gain distributions. Interest income and distributions from the Fidelity Central Funds are accrued as earned. Interest income includes coupon interest and amortization of premium and accretion of discount on debt securities. Investment income is recorded net of foreign taxes withheld where recovery of such taxes is uncertain.
Expenses. Most expenses of the Trust can be directly attributed to a fund. Expenses which cannot be directly attributed are apportioned amongst each fund in the Trust. Expense estimates are accrued in the period to which they relate and adjustments are made when actual amounts are known.
Deferred Trustee Compensation. Under a Deferred Compensation Plan (the Plan), independent Trustees may elect to defer receipt of a portion of their annual compensation. Deferred amounts are invested in a cross-section of Fidelity funds, are marked-to-market and remain in the Fund until distributed in accordance with the Plan. The investment of deferred amounts and the offsetting payable to the Trustees are included in the accompanying Statement of Assets and Liabilities.
Income Tax Information and Distributions to Shareholders. Each year the Fund intends to qualify as a regulated investment company, including distributing substantially all of its taxable income and realized gains under Subchapter M of the Internal Revenue Code and filing its U.S. federal tax return. As a result, no provision for income taxes is required. As of July 31, 2010, the Fund did not have any unrecognized tax benefits in the accompanying financial statements. A fund's federal tax return is subject to examination by the Internal Revenue Service (IRS) for a period of three years. Foreign taxes are provided for based on the Fund's understanding of the tax rules and rates that exist in the foreign markets in which it invests. The Fund is subject to a tax imposed on short term capital gains on securities of certain issuers domiciled in India. The Fund records an estimated deferred tax liability included in Other payables and accrued expenses in the accompanying Statement of Assets & Liabilities for net unrealized gains on these securities in an amount that would be payable if the securities were disposed of at period end.
Distributions are recorded on the ex-dividend date. Income dividends and capital gain distributions are declared separately for each class. Income and capital gain distributions are determined in accordance with income tax regulations, which may differ from GAAP.
Capital accounts within the financial statements are adjusted for permanent book-tax differences. These adjustments have no impact on net assets or the results of operations. Temporary book-tax differences will reverse in a subsequent period.
Annual Report
3. Significant Accounting Policies - continued
Income Tax Information and Distributions to Shareholders - continued
Book-tax differences are primarily due to the short-term gain distributions from the Fidelity Central Funds, foreign currency transactions, partnerships, deferred trustees compensation, capital loss carryforwards and losses due to deferred wash sales and excise tax regulations.
The federal tax cost of investment securities and unrealized appreciation (depreciation) as of period end were as follows:
Gross unrealized appreciation | $ 2,014,864,694 |
Gross unrealized depreciation | (293,312,547) |
Net unrealized appreciation (depreciation) | $ 1,721,552,147 |
| |
Tax Cost | $ 9,891,394,551 |
The tax-based components of distributable earnings as of period end were as follows:
Undistributed ordinary income | $ 2,446,191 |
Capital loss carryforward | $ (1,028,058,871) |
Net unrealized appreciation (depreciation) | $ 1,721,377,970 |
The tax character of distributions paid was as follows:
| July 31, 2010 | July 31, 2009 |
Ordinary Income | $ 57,433,084 | $ 99,425,655 |
Long-term Capital Gains | - | 242,439,162 |
Total | $ 57,433,084 | $ 341,864,817 |
4. Operating Policies.
Restricted Securities. The Fund may invest in securities that are subject to legal or contractual restrictions on resale. These securities generally may be resold in transactions exempt from registration or to the public if the securities are registered. Disposal of these securities may involve time-consuming negotiations and expense, and prompt sale at an acceptable price may be difficult. Information regarding restricted securities is included at the end of the Fund's Schedule of Investments.
5. Purchases and Sales of Investments.
Purchases and sales of securities, other than short-term securities, aggregated $15,348,328,246 and $15,969,181,366, respectively.
Annual Report
Notes to Financial Statements - continued
6. Fees and Other Transactions with Affiliates.
Management Fee. FMR and its affiliates provide the Fund with investment management related services for which the Fund pays a monthly management fee. The management fee is the sum of an individual fund fee rate that is based on an annual rate of .30% of the Fund's average net assets and a group fee rate that averaged .26% during the period. The group fee rate is based upon the average net assets of all the mutual funds advised by FMR. The group fee rate decreases as assets under management increase and increases as assets under management decrease. In addition, the management fee is subject to a performance adjustment (up to a maximum of ± .20% of the Fund's average net assets over a 36 month performance period). The upward or downward adjustment to the management fee is based on the relative investment performance of the retail class of the Fund, Blue Chip Growth as compared to an appropriate benchmark index. For the period, the total annual management fee rate, including the performance adjustment, was .68% of the Fund's average net assets.
Transfer Agent Fees. Fidelity Investments Institutional Operations Company, Inc. (FIIOC), an affiliate of FMR, is the transfer, dividend disbursing and shareholder servicing agent for each class of the Fund. FIIOC receives account fees and asset-based fees that vary according to the account size and type of account of the shareholders of Blue Chip Growth. FIIOC receives an asset-based fee of Class K's average net assets. FIIOC receives no fees for providing transfer agency services to Class F. FIIOC pays for typesetting, printing and mailing of shareholder reports, except proxy statements. For the period, the total transfer agent fees paid by each applicable class were as follows:
| Amount | % of
Average
Net Assets |
Blue Chip Growth | $ 26,634,828 | .25 |
Class K | 418,549 | .05 |
| $ 27,053,377 | |
Accounting and Security Lending Fees. Fidelity Service Company, Inc. (FSC), an affiliate of FMR, maintains the Fund's accounting records. The accounting fee is based on the level of average net assets for the month. Under a separate contract, FSC administers the security lending program. The security lending fee is based on the number and duration of lending transactions.
Brokerage Commissions. The Fund placed a portion of its portfolio transactions with brokerage firms which are affiliates of the investment adviser. The commissions paid to these affiliated firms were $364,789 for the period.
Annual Report
6. Fees and Other Transactions with Affiliates - continued
Interfund Lending Program. Pursuant to an Exemptive Order issued by the SEC, the Fund, along with other registered investment companies having management contracts with FMR, may participate in an interfund lending program. This program provides an alternative credit facility allowing the funds to borrow from, or lend money to, other participating affiliated funds. At period end, there were no interfund loans outstanding. The Fund's activity in this program during the period for which loans were outstanding was as follows:
Borrower or Lender | Average Daily
Loan Balance | Weighted Average Interest Rate | Interest
Expense |
Borrower | $ 12,993,271 | .43% | $ 10,743 |
7. Committed Line of Credit.
The Fund participates with other funds managed by FMR in a $3.75 billion credit facility (the "line of credit") to be utilized for temporary or emergency purposes to fund shareholder redemptions or for other short-term liquidity purposes. The Fund has agreed to pay commitment fees on its pro-rata portion of the line of credit, which amounted to $45,855 and is reflected in Miscellaneous expenses on the Statement of Operations. During the period, there were no borrowings on this line of credit.
8. Security Lending.
The Fund lends portfolio securities from time to time in order to earn additional income. On the settlement date of the loan, the Fund receives collateral (in the form of U.S. Treasury obligations, letters of credit and/or cash) against the loaned securities and maintains collateral in an amount not less than 100% of the market value of the loaned securities during the period of the loan. The market value of the loaned securities is determined at the close of business of the Fund and any additional required collateral is delivered to the Fund on the next business day. If the borrower defaults on its obligation to return the securities loaned because of insolvency or other reasons, a fund could experience delays and costs in recovering the securities loaned or in gaining access to the collateral. Any cash collateral received is invested in the Fidelity Securities Lending Cash Central Fund. The value of loaned securities and cash collateral at period end are disclosed on the Fund's Statement of Assets and Liabilities. Security lending income represents the income earned on investing cash collateral, less fees and expenses associated with the loan, plus any premium payments that may be received on the loan of certain types of securities. Security lending income is presented in the Statement of Operations as a component of income from Fidelity Central Funds. Net income from lending portfolio securities during the period amounted to $262,621.
Annual Report
Notes to Financial Statements - continued
9. Bank Borrowings.
The Fund is permitted to have bank borrowings for temporary or emergency purposes to fund shareholder redemptions. The Fund has established borrowing arrangements with certain banks. The interest rate on the borrowings is the bank's base rate, as revised from time to time. The average daily loan balance during the period for which loans were outstanding amounted to $6,248,000. The weighted average interest rate was .64%. The interest expense amounted to $111 under the bank borrowing program. At period end, there were no bank borrowings outstanding.
10. Expense Reductions.
Many of the brokers with whom FMR places trades on behalf of the Fund provided services to the Fund in addition to trade execution. These services included payments of certain expenses on behalf of the Fund totaling $1,804,798 for the period.
11. Distributions to Shareholders.
Distributions to shareholders of each class were as follows:
Years ended July 31, | 2010 | 2009 A |
From net investment income | | |
Blue Chip Growth | $ 52,296,116 | $ 97,802,886 |
Class K | 4,902,403 | 1,622,768 |
Class F | 234,565 | - |
Total | $ 57,433,084 | $ 99,425,654 |
From net realized gain | | |
Blue Chip Growth | $ - | $ 242,437,464 |
Class K | - | 1,698 |
Total | $ - | $ 242,439,162 |
A Distributions for Class F are for the period June 26, 2009 (commencement of sale of shares) to July 31, 2009.
12. Share Transactions.
Transactions for each class of shares were as follows:
| Shares | Dollars |
Years ended July 31, | 2010 B | 2009 A | 2010 B | 2009 A |
Blue Chip Growth | | | | |
Shares sold | 41,698,431 | 53,777,391 | $ 1,553,486,290 | $ 1,546,167,445 |
Conversion to Class K | (604,280) | (17,667,860) | (19,980,833) | (497,271,491) |
Reinvestment of distributions | 1,459,019 | 9,381,064 | 51,337,601 | 335,422,205 |
Shares redeemed | (72,051,092) | (84,149,947) | (2,676,740,842) | (2,387,026,199) |
Net increase (decrease) | (29,497,922) | (38,659,352) | $ (1,091,897,784) | $ (1,002,708,040) |
Annual Report
12. Share Transactions - continued
| Shares | Dollars |
Years ended July 31, | 2010 B | 2009 A | 2010 B | 2009 A |
Class K | | | | |
Shares sold | 11,376,828 | 2,762,243 | $ 427,049,740 | $ 75,103,611 |
Conversion from Blue Chip Growth | 603,548 | 17,662,621 | 19,980,833 | 497,271,492 |
Reinvestment of distributions | 138,546 | 62,647 | 4,902,403 | 1,624,466 |
Shares redeemed | (5,839,246) | (2,034,629) | (218,810,942) | (54,677,110) |
Net increase (decrease) | 6,279,676 | 18,452,882 | $ 233,122,034 | $ 519,322,459 |
Class F | | | | |
Shares sold | 8,795,556 | 8,183 | $ 331,309,580 | $ 235,350 |
Reinvestment of distributions | 6,315 | - | 234,565 | - |
Shares redeemed | (281,880) | (10) | (10,900,065) | (294) |
Net increase (decrease) | 8,519,991 | 8,173 | $ 320,644,080 | $ 235,056 |
A Share transactions for Class F are for the period June 26, 2009 (commencement of sale of shares) to July 31, 2009.
B Conversion transactions for Class K and Blue Chip Growth are presented for the period August 1, 2009 through August 31, 2009.
13. Other.
The Fund's organizational documents provide former and current trustees and officers with a limited indemnification against liabilities arising in connection with the performance of their duties to the Fund. In the normal course of business, the Fund may also enter into contracts that provide general indemnifications. The Fund's maximum exposure under these arrangements is unknown as this would be dependent on future claims that may be made against the Fund. The risk of material loss from such claims is considered remote.
Annual Report
To the Trustees of Fidelity Securities Fund and Shareholders of Fidelity Blue Chip Growth Fund:
We have audited the accompanying statement of assets and liabilities of Fidelity Blue Chip Growth Fund (the Fund), a fund of Fidelity Securities Fund, including the schedule of investments, as of July 31, 2010, and the related statement of operations for the year then ended, the statement of changes in net assets for each of the two years in the period then ended, and the financial highlights for each of the five years in the period then ended. These financial statements and financial highlights are the responsibility of the Fund's management. Our responsibility is to express an opinion on these financial statements and financial highlights based on our audits.
We conducted our audits in accordance with standards of the Public Company Accounting Oversight Board (United States). Those standards require that we plan and perform the audit to obtain reasonable assurance about whether the financial statements and financial highlights are free of material misstatement. The Fund is not required to have, nor were we engaged to perform, an audit of its internal control over financial reporting. Our audits included consideration of internal control over financial reporting as a basis for designing audit procedures that are appropriate in the circumstances, but not for the purpose of expressing an opinion on the effectiveness of the Fund's internal control over financial reporting. Accordingly, we express no such opinion. An audit also includes examining, on a test basis, evidence supporting the amounts and disclosures in the financial statements, assessing the accounting principles used and significant estimates made by management, as well as evaluating the overall financial statement presentation. Our procedures included confirmation of securities owned as of July 31, 2010, by correspondence with the custodians and brokers; where replies were not received from brokers, we performed other auditing procedures. We believe that our audits provide a reasonable basis for our opinion.
In our opinion, the financial statements and financial highlights referred to above present fairly, in all material respects, the financial position of Fidelity Blue Chip Growth Fund as of July 31, 2010, the results of its operations for the year then ended, the changes in its net assets for each of the two years in the period then ended, and the financial highlights for each of the five years in the period then ended, in conformity with accounting principles generally accepted in the United States of America.
/s/ Deloitte & Touche LLP
DELOITTE & TOUCHE LLP
Boston, Massachusetts
September 13, 2010
Annual Report
The Trustees, Member of the Advisory Board, and executive officers of the trust and fund, as applicable, are listed below. The Board of Trustees governs the fund and is responsible for protecting the interests of shareholders. The Trustees are experienced executives who meet periodically throughout the year to oversee the fund's activities, review contractual arrangements with companies that provide services to the fund, oversee management of the risks associated with such activities and contractual arrangements, and review the fund's performance. Except for James C. Curvey, each of the Trustees oversees 222 funds advised by FMR or an affiliate. Mr. Curvey oversees 411 funds advised by FMR or an affiliate.
The Trustees hold office without limit in time except that (a) any Trustee may resign; (b) any Trustee may be removed by written instrument, signed by at least two-thirds of the number of Trustees prior to such removal; (c) any Trustee who requests to be retired or who has become incapacitated by illness or injury may be retired by written instrument signed by a majority of the other Trustees; and (d) any Trustee may be removed at any special meeting of shareholders by a two-thirds vote of the outstanding voting securities of the trust. Each Trustee who is not an interested person (as defined in the 1940 Act) (Independent Trustee), shall retire not later than the last day of the calendar year in which his or her 72nd birthday occurs. The Independent Trustees may waive this mandatory retirement age policy with respect to individual Trustees. The executive officers and Advisory Board Member hold office without limit in time, except that any officer and Advisory Board Member may resign or may be removed by a vote of a majority of the Trustees at any regular meeting or any special meeting of the Trustees. Except as indicated, each individual has held the office shown or other offices in the same company for the past five years.
Experience, Skills, Attributes, and Qualifications of the Fund's Trustees. The Governance and Nominating Committee has adopted a statement of policy that describes the experience, qualifications, attributes, and skills that are necessary and desirable for potential Independent Trustee candidates (Statement of Policy). The Board believes that each Trustee satisfied at the time he or she was initially elected or appointed a Trustee, and continues to satisfy, the standards contemplated by the Statement of Policy. The Governance and Nominating Committee also engages professional search firms to help identify potential Independent Trustee candidates who have the experience, qualifications, attributes, and skills consistent with the Statement of Policy. From time to time, additional criteria based on the composition and skills of the current Independent Trustees, as well as experience or skills that may be appropriate in light of future changes to board composition, business conditions, and regulatory or other developments, have also been considered by the professional search firms and the Governance and Nominating Committee. In addition, the Board takes into account the Trustees' commitment and participation in Board and committee meetings, as well as their leadership of standing and ad hoc committees throughout their tenure.
In determining that a particular Trustee was and continues to be qualified to serve as a Trustee, the Board has considered a variety of criteria, none of which, in isolation, was controlling. The Board believes that, collectively, the Trustees have balanced and diverse experience, qualifications, attributes, and skills, which allow the Board to operate effectively in governing the fund and protecting the interests of shareholders. Information about the specific experience, skills, attributes, and qualifications of each Trustee, which in each case led to the Board's conclusion that the Trustee should serve (or continue to serve) as a trustee of the fund, is provided below.
Annual Report
Board Structure and Oversight Function. Edward C. Johnson 3d is an interested person (as defined in the 1940 Act) and currently serves as Chairman. The Trustees have determined that an interested Chairman is appropriate and benefits shareholders because an interested Chairman has a personal and professional stake in the quality and continuity of services provided to the fund. Independent Trustees exercise their informed business judgment to appoint an individual of their choosing to serve as Chairman, regardless of whether the Trustee happens to be independent or a member of management. The Independent Trustees have determined that they can act independently and effectively without having an Independent Trustee serve as Chairman and that a key structural component for assuring that they are in a position to do so is for the Independent Trustees to constitute a substantial majority for the Board. The Independent Trustees also regularly meet in executive session. Ned C. Lautenbach serves as Chairman of the Independent Trustees and as such (i) acts as a liaison between the Independent Trustees and management with respect to matters important to the Independent Trustees and (ii) with management prepares agendas for Board meetings.
Fidelity funds are overseen by different Boards of Trustees. The fund's Board oversees Fidelity's equity and high income funds and another Board oversees Fidelity's investment-grade bond, money market, and asset allocation funds. The asset allocation funds may invest in Fidelity funds overseen by the fund's Board. The use of separate Boards, each with its own committee structure, allows the Trustees of each group of Fidelity funds to focus on the unique issues of the funds they oversee, including common research, investment, and operational issues. On occasion, the separate Boards establish joint committees to address issues of overlapping consequences for the Fidelity funds overseen by each Board.
The Trustees operate using a system of committees to facilitate the timely and efficient consideration of all matters of importance to the Trustees, the fund, and fund shareholders and to facilitate compliance with legal and regulatory requirements and oversight of the fund's activities and associated risks. The Board, acting through its committees, has charged FMR and its affiliates with (i) identifying events or circumstances the occurrence of which could have demonstrably adverse effects on the fund's business and/or reputation; (ii) implementing processes and controls to lessen the possibility that such events or circumstances occur or to mitigate the effects of such events or circumstances if they do occur; and (iii) creating and maintaining a system designed to evaluate continuously business and market conditions in order to facilitate the identification and implementation processes described in (i) and (ii) above. Because the day-to-day operations and activities of the fund are carried out by or through FMR, its affiliates and other service providers, the fund's exposure to risks is mitigated but not eliminated by the processes overseen by the Trustees. While each of the Board's committees has responsibility for overseeing different aspects of the fund's activities, oversight is exercised primarily through the Operations, Audit, and Compliance Committees. Appropriate personnel, including but not limited to the fund's Chief Compliance Officer (CCO), FMR's internal auditor, the independent accountants, the fund's Treasurer and portfolio management personnel, make periodic reports to the Board's committees, as appropriate. The responsibilities of each committee, including their oversight responsibilities, are described further under "Standing Committees of the Fund's Trustees."
Annual Report
Trustees and Officers - continued
The fund's Statement of Additional Information (SAI) includes more information about the Trustees. To request a free copy, call Fidelity at 1-800-544-8544.
Interested Trustees*:
Correspondence intended for each Trustee who is an interested person may be sent to Fidelity Investments, 82 Devonshire Street, Boston, Massachusetts 02109.
Name, Age; Principal Occupations and Other Relevant Experience+ |
Edward C. Johnson 3d (80) |
| Year of Election or Appointment: 1984 Mr. Johnson is Trustee and Chairman of the Board of Trustees of certain Trusts. Mr. Johnson serves as Chief Executive Officer, Chairman, and a Director of FMR LLC; Chairman and a Director of FMR; Chairman and a Director of Fidelity Research & Analysis Company (FRAC); Chairman and a Director of Fidelity Investments Money Management, Inc.; and Chairman and a Director of FMR Co., Inc. In addition, Mr. Johnson serves as Chairman and Director of FIL Limited. Previously, Mr. Johnson served as President of FMR LLC (2006-2007). |
James C. Curvey (75) |
| Year of Election or Appointment: 2007 Mr. Curvey also serves as Trustee (2007-present) of other investment companies advised by FMR. Mr. Curvey is a Director of FMR and FMR Co., Inc. (2007-present). Mr. Curvey is also Vice Chairman (2006-
present) and Director of FMR LLC. In addition, Mr. Curvey serves as an Overseer for the Boston Symphony Orchestra and a member of the Trustees of Villanova University. |
* Trustees have been determined to be "Interested Trustees" by virtue of, among other things, their affiliation with the trust or various entities under common control with FMR.
+ The information above includes each Trustee's principal occupation during the last five years and other information relating to the experience, attributes, and skills relevant to each Trustee's qualifications to serve as a Trustee, which led to the conclusion that each Trustee should serve as a Trustee for the fund.
Annual Report
Independent Trustees:
Correspondence intended for each Independent Trustee (that is, the Trustees other than the Interested Trustees) may be sent to Fidelity Investments, P.O. Box 55235, Boston, Massachusetts 02205-5235.
Name, Age; Principal Occupations and Other Relevant Experience+ |
Dennis J. Dirks (62) |
| Year of Election or Appointment: 2005 Prior to his retirement in May 2003, Mr. Dirks was Chief Operating Officer and a member of the Board of The Depository Trust & Clearing Corporation (DTCC). He also served as President, Chief Operating Officer, and Board member of The Depository Trust Company (DTC) and President and Board member of the National Securities Clearing Corporation (NSCC). In addition, Mr. Dirks served as Chief Executive Officer and Board member of the Government Securities Clearing Corporation, Chief Executive Officer and Board member of the Mortgage-Backed Securities Clearing Corporation, as a Trustee and a member of the Finance Committee of Manhattan College (2005-2008), and as a Trustee and a member of the Finance Committee of AHRC of Nassau County (2006-2008). Currently, Mr. Dirks serves as a member of the Board of Directors for The Brookville Center for Children's Services, Inc. (2009-present). |
Alan J. Lacy (56) |
| Year of Election or Appointment: 2008 Mr. Lacy serves as Senior Adviser (2007-present) of Oak Hill Capital Partners, L.P. (private equity). Mr. Lacy also served as Chief Executive Officer (2000-2005) and Vice Chairman (2005-2006) of Sears Holdings Corporation and Sears, Roebuck and Co. (retail). In addition, Mr. Lacy serves as a member of the Board of Directors of The Western Union Company (global money transfer, 2006-present) and Bristol-Myers Squibb Company (global pharmaceuticals, 2007-present). Mr. Lacy is Chairman (2008-present) and a member (2006-present) of the Board of Trustees of The National Parks Conservation Association. |
Ned C. Lautenbach (66) |
| Year of Election or Appointment: 2000 Mr. Lautenbach is Chairman of the Independent Trustees of the Equity and High Income Funds (2006-present). Mr. Lautenbach is an Advisory Partner of Clayton, Dubilier & Rice, Inc. (private equity investment, 2008-present) and was previously a Partner of Clayton, Dubilier & Rice, Inc. (1998-2008). Previously, Mr. Lautenbach was with the International Business Machines Corporation (IBM) from 1968 until his retirement in 1998. Mr. Lautenbach serves as a Director of Eaton Corporation (diversified industrial) as well as the Philharmonic Center for the Arts in Naples, Florida. Mr. Lautenbach is also a member of the Board of Trustees of Fairfield University (2005-present), as well as a member of the Council on Foreign Relations. Previously, Mr. Lautenbach served as a Director of Sony Corporation (2006-2007). |
Joseph Mauriello (65) |
| Year of Election or Appointment: 2008 Prior to his retirement in January 2006, Mr. Mauriello served in numerous senior management positions including Deputy Chairman and Chief Operating Officer (2004-2005), and Vice Chairman of Financial Services (2002-2004) of KPMG LLP US (professional services, 1965-2005). Mr. Mauriello currently serves as a member of the Board of Directors of XL Capital Ltd. (global insurance and re-insurance, 2006-present) and of Arcadia Resources Inc. (health care services and products, 2007-
present). Previously, Mr. Mauriello served as a Director of the Hamilton Funds of the Bank of New York (2006-2007). |
Cornelia M. Small (66) |
| Year of Election or Appointment: 2005 Ms. Small is a member of the Board of Directors of the Teagle Foundation (2009-present). Ms. Small is also a member of the Investment Committee, and Chair (2008-present) and a member of the Board of Trustees of Smith College. In addition, Ms. Small serves on the Investment Committee of the Berkshire Taconic Community Foundation (2008-present). Previously, Ms. Small served as Chairperson of the Investment Committee (2002-2008) of Smith College. In addition, Ms. Small served as Chief Investment Officer, Director of Global Equity Investments, and a member of the Board of Directors of Scudder, Stevens & Clark and Scudder Kemper Investments. |
William S. Stavropoulos (71) |
| Year of Election or Appointment: 2002 Mr. Stavropoulos is Vice Chairman of the Independent Trustees of the Equity and High Income Funds (2006-present). Mr. Stavropoulos serves as President and Founder of the Michigan Baseball Foundation, the Great Lakes Loons (2007-present). Mr. Stavropoulos is Chairman Emeritus of the Board of Directors of The Dow Chemical Company, where he previously served in numerous senior management positions, including President, CEO (1995-2000; 2002-2004), Chairman of the Executive Committee (2000-2006), and as a member of the Board of Directors (1990-2006). Currently, Mr. Stavropoulos is a Director of Teradata Corporation (data warehousing and technology solutions, 2008-present), Chemical Financial Corporation, Maersk Inc. (industrial conglomerate), Tyco International, Inc. (multinational manufacturing and services, 2007-present), and a member of the Advisory Board for Metalmark Capital (private equity investment, 2005-present). Mr. Stavropoulos is a special advisor to Clayton, Dubilier & Rice, Inc. (private equity investment). In addition, Mr. Stavropoulos is a member of the University of Notre Dame Advisory Council for the College of Science. |
David M. Thomas (61) |
| Year of Election or Appointment: 2008 Previously, Mr. Thomas served as Executive Chairman (2005-2006) and Chairman and Chief Executive Officer (2000-2005) of IMS Health, Inc. (pharmaceutical and healthcare information solutions). In addition, Mr. Thomas serves as a member of the Board of Directors of Fortune Brands, Inc. (consumer products), and Interpublic Group of Companies, Inc. (marketing communication, 2004-present). |
Michael E. Wiley (59) |
| Year of Election or Appointment: 2008 Mr. Wiley also serves as a Director of Asia Pacific Exploration Consolidated (international oil and gas exploration and production, 2008-
present), and as a member of the Board of Trustees of the University of Tulsa (2000-2006; 2007-present). Mr. Wiley serves as a Director of Tesoro Corporation (independent oil refiner and marketer, 2005-present), and a Director of Bill Barrett Corporation (exploration and production, 2005-present). In addition, Mr. Wiley also serves as a Director of Post Oak Bank (privately-held bank, 2004-present). Previously, Mr. Wiley served as a Sr. Energy Advisor of Katzenbach Partners, LLC (consulting, 2006-2007), as an Advisory Director of Riverstone Holdings (private investment), Chairman, President, and CEO of Baker Hughes, Inc. (oilfield services, 2000-2004), and as Director of Spinnaker Exploration Company (exploration and production, 2001-2005). |
Annual Report
Trustees and Officers - continued
+ The information above includes each Trustee's principal occupation during the last five years and other information relating to the experience, attributes, and skills relevant to each Trustee's qualifications to serve as a Trustee, which led to the conclusion that each Trustee should serve as a Trustee for the fund.
Advisory Board Member and Executive Officers:
Correspondence intended for each executive officer and Peter S. Lynch may be sent to Fidelity Investments, 82 Devonshire Street, Boston, Massachusetts 02109.
Name, Age; Principal Occupation |
Peter S. Lynch (66) |
| Year of Election or Appointment: 2003 Member of the Advisory Board of Fidelity's Equity and High Income Funds. Mr. Lynch is Vice Chairman and a Director of FMR and FMR Co., Inc. In addition, Mr. Lynch serves as a Trustee of Boston College and as the Chairman of the Inner-City Scholarship Fund. Previously, Mr. Lynch served on the Special Olympics International Board of Directors (1997-2006). |
Kenneth B. Robins (40) |
| Year of Election or Appointment: 2008 President and Treasurer of Fidelity's Equity and High Income Funds. Mr. Robins also serves as President and Treasurer (2010-present) and Assistant Treasurer (2009-present) of other Fidelity funds and is an employee of Fidelity Investments (2004-present). Previously, Mr. Robins served as Deputy Treasurer of the Fidelity funds (2005-2008) and Treasurer and Chief Financial Officer of The North Carolina Capital Management Trust: Cash and Term Portfolios (2006-2008). |
Bruce T. Herring (44) |
| Year of Election or Appointment: 2006 Vice President of certain Equity Funds. Mr. Herring also serves as Group Chief Investments Officer of FMR. Previously, Mr. Herring served as a portfolio manager for Fidelity U.S. Equity Funds. |
Brian B. Hogan (45) |
| Year of Election or Appointment: 2009 Vice President of certain Equity Funds and Vice President of Sector Funds. Mr. Hogan also serves as Senior Vice President, Equity Research of FMR (2006-present) and President of FMR's Equity Division (2009-present). Previously, Mr. Hogan served as a portfolio manager. |
Scott C. Goebel (42) |
| Year of Election or Appointment: 2008 Secretary and Chief Legal Officer (CLO) of the Fidelity funds. Mr. Goebel also serves as General Counsel, Secretary, and Senior Vice President of FMR (2008-present) and FMR Co., Inc. (2008-present); Deputy General Counsel of FMR LLC; Chief Legal Officer of Fidelity Management & Research (Hong Kong) Limited (2008-present) and Assistant Secretary of Fidelity Management & Research (Japan) Inc. (2008-present), Fidelity Investments Money Management, Inc. (2008-present), Fidelity Management & Research (U.K.) Inc. (2008-present), and Fidelity Research and Analysis Company (2008-present). Previously, Mr. Goebel served as Assistant Secretary of the Funds (2007-2008) and as Vice President and Secretary of Fidelity Distributors Corporation (FDC) (2005-2007). |
William C. Coffey (41) |
| Year of Election or Appointment: 2009 Assistant Secretary of Fidelity's Equity and High Income Funds. Mr. Coffey also serves as Senior Vice President and Deputy General Counsel of FMR LLC (2010-present), and is an employee of Fidelity Investments. Previously, Mr. Coffey served as Vice President and Associate General Counsel of FMR LLC (2005-2009). |
Holly C. Laurent (56) |
| Year of Election or Appointment: 2008 Anti-Money Laundering (AML) Officer of the Fidelity funds. Ms. Laurent is an employee of Fidelity Investments. Previously, Ms. Laurent was Senior Vice President and Head of Legal for Fidelity Business Services India Pvt. Ltd. (2006-2008), and Senior Vice President, Deputy General Counsel and Group Head for FMR LLC (2005-2006). |
Christine Reynolds (51) |
| Year of Election or Appointment: 2008 Chief Financial Officer of the Fidelity funds. Ms. Reynolds became President of Fidelity Pricing and Cash Management Services (FPCMS) in August 2008. Ms. Reynolds served as Chief Operating Officer of FPCMS (2007-2008). Previously, Ms. Reynolds served as President, Treasurer, and Anti-Money Laundering officer of the Fidelity funds (2004-2007). |
Kenneth A. Rathgeber (63) |
| Year of Election or Appointment: 2004 Chief Compliance Officer of Fidelity's Equity and High Income Funds. Mr. Rathgeber is Chief Compliance Officer of Fidelity Management & Research (Hong Kong) Limited (2008-present), Fidelity Management & Research (Japan) Inc. (2008-present), FMR (2005-present), FMR Co., Inc. (2005-present), Fidelity Management & Research (U.K.) Inc. (2005-present), Fidelity Research & Analysis Company (2005-present), Fidelity Investments Money Management, Inc. (2005-present), Pyramis Global Advisors, LLC (2005-present), and Strategic Advisers, Inc. (2005-present). |
Jeffrey S. Christian (48) |
| Year of Election or Appointment: 2009 Deputy Treasurer of the Fidelity funds. Mr. Christian is an employee of Fidelity Investments. Previously, Mr. Christian served as Chief Financial Officer (2008-2009) of certain Fidelity funds and Senior Vice President of Fidelity Pricing and Cash Management Services (FPCMS) (2004-2009). |
Bryan A. Mehrmann (49) |
| Year of Election or Appointment: 2005 Deputy Treasurer of the Fidelity funds. Mr. Mehrmann is an employee of Fidelity Investments. |
Adrien E. Deberghes (42) |
| Year of Election or Appointment: 2008 Deputy Treasurer of Fidelity's Equity and High Income Funds. Mr. Deberghes also serves as Assistant Treasurer of other Fidelity funds (2010-present) and is an employee of Fidelity Investments (2008-
present). Previously, Mr. Deberghes served as Senior Vice President of Mutual Fund Administration at State Street Corporation (2007-2008), Senior Director of Mutual Fund Administration at Investors Bank & Trust (2005-2007), and Director of Finance for Dunkin' Brands (2000-2005). |
Stephanie J. Dorsey (41) |
| Year of Election or Appointment: 2010 Assistant Treasurer of Fidelity's Equity and High Income Funds. Ms. Dorsey also serves as Deputy Treasurer of other Fidelity funds (2008-
present) and is an employee of Fidelity Investments (2008-present). Previously, Ms. Dorsey served as Treasurer (2004-2008) of the JPMorgan Mutual Funds and Vice President (2004-2008) of JPMorgan Chase Bank. |
Name, Age; Principal Occupation |
John R. Hebble (52) |
| Year of Election or Appointment: 2009 Assistant Treasurer of Fidelity's Equity and High Income Funds. Mr. Hebble also serves as Treasurer and Chief Financial Officer of The North Carolina Capital Management Trust: Cash and Term Portfolio (2008-present), President and Treasurer of other Fidelity funds (2008-present) and is an employee of Fidelity Investments. |
Gary W. Ryan (51) |
| Year of Election or Appointment: 2005 Assistant Treasurer of the Fidelity funds. Mr. Ryan is an employee of Fidelity Investments. Previously, Mr. Ryan served as Vice President of Fund Reporting in Fidelity Pricing and Cash Management Services (FPCMS) (1999-2005). |
Annual Report
The fund designates 100% of the dividends distributed during the fiscal year as qualifying for the dividends-received deduction for corporate shareholders.
The fund designates 100% of the dividends distributed during the fiscal year as amounts which can be taken into account as a dividend for the purposes of the maximum rate under section 1(h)(11) of the Internal Revenue Code.
The fund will notify shareholders in January 2011 of amounts for use in preparing 2010 income tax returns.
Annual Report
Board Approval of Investment Advisory Contracts and Management Fees
Fidelity Blue Chip Growth Fund
Each year, the Board of Trustees, including the Independent Trustees (together, the Board), votes on the renewal of the management contract and sub-advisory agreements (together, the Advisory Contracts) for the fund. The Board, assisted by the advice of fund counsel and Independent Trustees' counsel, requests and considers a broad range of information relevant to the renewal of the Advisory Contracts throughout the year.
The Board meets regularly and considers at each of its meetings factors that are relevant to its annual consideration of the renewal of the fund's Advisory Contracts, including the services and support provided to the fund and its shareholders. The Board has established various standing committees, each composed of Independent Trustees with varying backgrounds, to which the Board has assigned specific subject matter responsibilities in order to enhance effective decision-making by the Board. The Board, acting directly and through its Committees, requests and receives information concerning the annual consideration of the renewal of the fund's Advisory Contracts. The Board also meets as needed to consider matters specifically related to the Board's annual consideration of the renewal of Advisory Contracts. Members of the Board may also meet with trustees of other Fidelity funds through ad hoc joint committees to discuss certain matters relevant to the Fidelity funds.
At its July 2010 meeting, the Board of Trustees, including the Independent Trustees, unanimously determined to renew the fund's Advisory Contracts. In reaching its determination, the Board considered all factors it believed relevant, including (i) the nature, extent, and quality of the services to be provided to the fund and its shareholders (including the investment performance of the fund); (ii) the competitiveness of the fund's management fee and total expenses; (iii) the total costs of the services to be provided by and the profits to be realized by Fidelity from its relationship with the fund; (iv) the extent to which economies of scale would be realized as the fund grows; and (v) whether fee levels reflect these economies of scale, if any, for the benefit of fund shareholders.
In considering whether to renew the Advisory Contracts for the fund, the Board reached a determination, with the assistance of fund counsel and Independent Trustees' counsel and through the exercise of its business judgment, that the renewal of the Advisory Contracts is in the best interests of fund shareholders and that the compensation to be received by Fidelity under the management contract is fair and reasonable. The Board's decision to renew the Advisory Contracts was not based on any single factor noted above, but rather was based on a comprehensive consideration of all the information provided to the Board at its meetings throughout the year. The Board, in reaching its determination to renew the Advisory Contracts, is aware that shareholders in the fund have a broad range of investment choices available to them, including a wide choice among mutual funds offered by Fidelity's competitors, and that the fund's shareholders, with the opportunity to review and weigh the disclosure provided by the fund in its prospectus and other public disclosures, have chosen to invest in this fund, managed by Fidelity.
Annual Report
Board Approval of Investment Advisory Contracts and
Management Fees - continued
Nature, Extent, and Quality of Services Provided. The Board considered the staffing within the investment adviser, FMR, and the sub-advisers (together, the Investment Advisers), including the backgrounds of the fund's investment personnel and the fund's investment objective and discipline. The Independent Trustees also had discussions with senior management of Fidelity's investment operations and investment groups. The Board considered the structure of the portfolio manager compensation program and whether this structure provides appropriate incentives to act in the best interest of the fund.
Resources Dedicated to Investment Management and Support Services. The Board and the equity research subcommittee of the Board's Fund Oversight Committee reviewed the size, education, and experience of the Investment Advisers' investment staff, their use of technology, and the Investment Advisers' approach to recruiting, training, and retaining portfolio managers and other research, advisory, and management personnel. The Board noted that Fidelity's analysts have access to a variety of technological tools and market and securities data that enable them to perform both fundamental and quantitative analysis and to specialize in various disciplines. The Board considered Fidelity's extensive global research capabilities that enable the Investment Advisers to aggregate data from various sources in an effort to produce positive investment results. The Board also considered that Fidelity's portfolio managers and analysts have access to daily portfolio attribution that allows for monitoring of a fund's portfolio, as well as an electronic communication system that provides immediate real-time access to research concerning issuers and credit enhancers. The Board noted FMR's continued focus on strengthening the organization and discipline of equity portfolio management and research.
Shareholder and Administrative Services. The Board considered (i) the nature, extent, quality, and cost of advisory, administrative, and shareholder services performed by the Investment Advisers and their affiliates under the Advisory Contracts and under separate agreements covering transfer agency, pricing and bookkeeping, and securities lending services for the fund; (ii) the nature and extent of the investment adviser's supervision of third party service providers, principally custodians and subcustodians; and (iii) the resources devoted to, and the record of compliance with, the fund's compliance policies and procedures. The Board also reviewed the allocation of fund brokerage, including allocations to brokers affiliated with the Investment Advisers, the use of brokerage commissions to pay fund expenses, and the use of "soft" commission dollars to pay for research services.
The Board noted that the growth of fund assets over time across the complex allows Fidelity to reinvest in the development of services designed to enhance the value or convenience of the Fidelity funds as investment vehicles. These services include 24-hour access to account information and market information through phone representatives and over the Internet, and investor education materials and asset allocation tools.
Annual Report
Investment in a Large Fund Family. The Board considered the benefits to shareholders of investing in a Fidelity fund, including the benefits of investing in a fund that is part of a large family of funds offering a variety of investment disciplines and providing a large variety of mutual fund investor services. The Board noted that Fidelity had taken, or had made recommendations that resulted in the Fidelity funds taking, a number of actions over the previous year that benefited particular funds, including (i) dedicating additional resources to investment research and restructuring and broadening the focus of the investment research teams; (ii) bolstering the senior management team that oversees asset management; (iii) launching Class F of certain funds as a lower-fee class available to Freedom K and Freedom Index Funds; (iv) lowering the initial investment minimums and ongoing balance requirements for Real Estate High Income Fund; (v) eliminating subsequent purchase minimums for all funds and adding a waiver of the investment minimum requirement for new accounts opened with the proceeds of a systematic withdrawal plan; (vi) eliminating the withdrawal minimum and maximum limits for systematic withdrawals from Advisor funds; (vii) expanding sales load waivers on Class A shares for Destiny Planholders and expanding Institutional Class eligibility for Class O Destiny Planholders; and (viii) changing certain Class A and Class T sales charge structures to further align them with industry practices.
Investment Performance. The Board considered whether the fund has operated in accordance with its investment objective, as well as its record of compliance with its investment restrictions. It also reviewed the fund's absolute investment performance for each class (except Class F), as well as the fund's relative investment performance for each class (except Class F) measured over multiple periods against (i) a broad-based securities market index, and (ii) a peer group of mutual funds deemed appropriate by Fidelity and reviewed by the Board. The following charts considered by the Board show, over the one-, three-, and five-year periods ended December 31, 2009, as available, the cumulative total returns of Class K and the retail class of the fund, the cumulative total returns of a broad-based securities market index ("benchmark"), and a range of cumulative total returns of a peer group of mutual funds identified by Morningstar, Inc. as having an investment style similar to that of the fund based on underlying portfolio holdings. (Class F of the fund had less than one year of performance as of December 31, 2009.) The box within each chart shows the 25th percentile return (bottom of box) and the 75th percentile return (top of box) of the peer group. Returns shown above the box are in the first quartile and returns shown below the box are in the fourth quartile. The percentage beaten numbers noted below each chart correspond to the percentile box and represent the percentage of funds in the peer group whose performance was equal to or lower than that of the class indicated.
Annual Report
Board Approval of Investment Advisory Contracts and
Management Fees - continued
Fidelity Blue Chip Growth Fund

The Board reviewed the fund's relative investment performance against its peer group and noted that the performance of the retail class of the fund (the class with the longer performance record) was in the first quartile for the one- and three-year periods and the second quartile for the five-year period. The Board also noted that the investment performance of the retail class of the fund compared favorably to its benchmark for all the periods shown. The Board considered that the variations in performance between the fund's classes reflect the variations in class expenses, which result in lower performance for the higher expense class. The Board also reviewed the fund's performance since inception as well as performance in the current year.
The Board also considered that the fund's management fee is subject to upward or downward adjustment depending upon whether, and to what extent, the fund's investment performance for the performance period exceeds, or is exceeded by, the record (over the same period) of a Board-approved performance adjustment index. The Board realizes that the performance adjustment provides FMR with a strong economic incentive to seek to achieve superior performance for the fund's shareholders and helps to more closely align the interests of FMR and the fund's shareholders.
Based on its review, and giving particular weight to the nature and quality of the resources dedicated by the Investment Advisers to maintain and improve relative performance and factoring in the unprecedented market events in recent years, the Board concluded that the nature, extent, and quality of investment management and support services and of shareholder and administrative services provided to the fund will benefit the fund's shareholders, particularly in light of the Board's view that the fund's shareholders benefit from investing in a fund that is part of a large family of funds offering a variety of investment disciplines and services.
Annual Report
Competitiveness of Management Fee and Total Fund Expenses. The Board considered the fund's management fee and total expenses compared to "mapped groups" of competitive funds and classes. Fidelity creates "mapped groups" by combining similar Lipper investment objective categories that have comparable management fee characteristics. Combining Lipper investment objective categories aids the Board's management fee and total expense comparisons by broadening the competitive group used for comparison and by reducing the number of universes to which various Fidelity funds are compared.
Management Fee. The Board considered two proprietary management fee comparisons for the 12-month periods shown in the chart below. The group of Lipper funds used by the Board for management fee comparisons is referred to below as the "Total Mapped Group." The Total Mapped Group comparison focuses on a fund's standing relative to the total universe of comparable funds available to investors, in terms of gross management fees before expense reimbursements or caps, and without giving effect to the fund's performance adjustment. "TMG %" represents the percentage of funds in the Total Mapped Group that had management fees that were lower than the fund's. For example, a TMG % of 10% means that 90% of the funds in the Total Mapped Group had higher management fees than the fund. The "Asset-Size Peer Group" (ASPG) comparison focuses on a fund's standing relative to non-Fidelity funds similar in size to the fund within the Total Mapped Group. The ASPG represents at least 15% of the funds in the Total Mapped Group with comparable asset size and management fee characteristics, subject to a minimum of 50 funds (or all funds in the Total Mapped Group if fewer than 50). Additional information, such as the ASPG quartile in which the fund's management fee ranked and the impact of the fund's performance adjustment, is also included in the chart and considered by the Board.
Annual Report
Board Approval of Investment Advisory Contracts and
Management Fees - continued
Fidelity Blue Chip Growth Fund
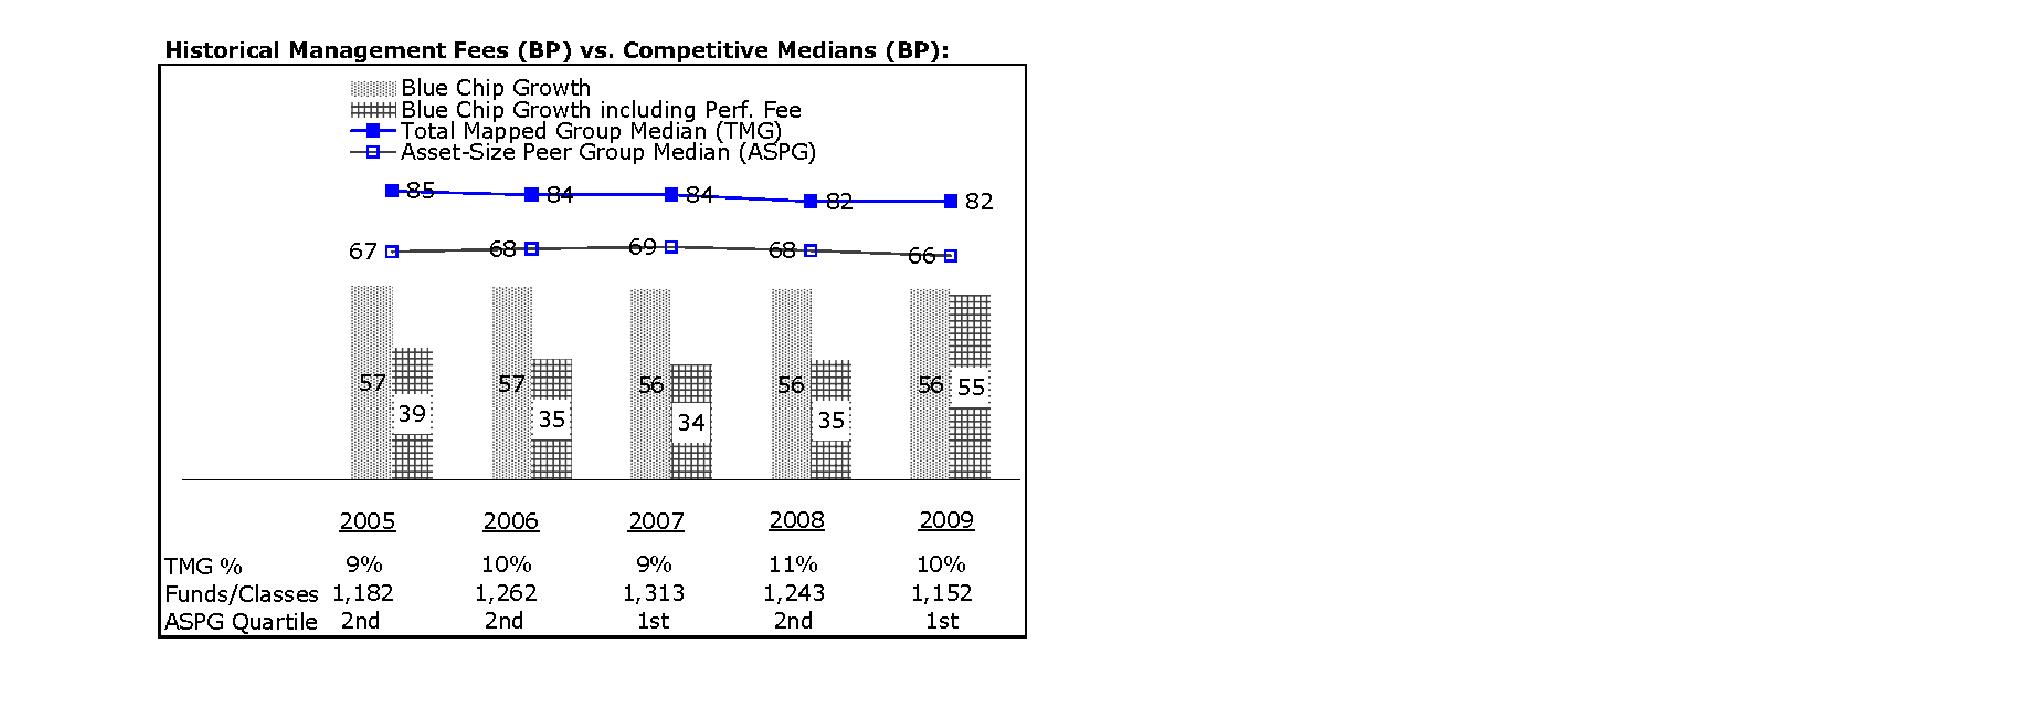
The Board noted that the fund's management fee ranked below the median of its Total Mapped Group and below the median of its ASPG for 2009. The Board also noted the effect of the fund's negative performance adjustment on the fund's management fee ranking. The Board noted that the performance adjustment for each year represents calculations for performance periods that differ from the periods shown in the performance charts above.
Furthermore, the Board considered that shareholders approved a prospective change in the index used to calculate the fund's performance adjustment beginning June 1, 2006. The Board also considered that, because the performance adjustment is based on a rolling 36-month measurement period, during a transition period the fund's performance is compared to a blended index return that reflects the performance of the former index for the portion of the measurement period prior to June 1, 2006 and the performance of the current index for the remainder of the measurement period. The Board noted that the fund's performance adjustments for 2006 through 2009 shown in the chart above reflect the effect of using the blended index return to calculate the fund's performance adjustment.
Based on its review, the Board concluded that the fund's management fee is fair and reasonable in light of the services that the fund receives and the other factors considered.
Total Expenses. In its review of each class's total expenses, the Board considered the fund's management fee as well as other fund or class expenses, as applicable, such as transfer agent fees, pricing and bookkeeping fees, and custodial, legal, and audit fees. The Board also noted the effects of any waivers and reimbursements on fees and expenses, as well as the impact of the fund's performance adjustment. As part of its review, the Board also considered current and historical total expenses of each class of the fund compared to competitive fund median expenses. Each class of the fund is compared to those funds and classes in the Total Mapped Group (used by the Board for management fee comparisons) that have a similar sales load structure.
Annual Report
The Board noted that the total expenses of each class ranked below its competitive median for the period.
Fees Charged to Other Fidelity Clients. The Board also considered Fidelity fee structures and other information with respect to clients of FMR and its affiliates, such as other mutual funds advised or subadvised by FMR or its affiliates, pension plan clients, and other institutional clients. In March 2010, the Board created an ad hoc joint committee with the board of other Fidelity funds (the Committee) to review and compare Fidelity's institutional investment advisory business with its business of providing services to the Fidelity funds, including the differences in services provided, fees charged, and costs incurred, as well as competition in their respective marketplaces.
Based on its review of total expenses and fees charged to other Fidelity clients, the Board concluded that the total expenses of each class of the fund were reasonable in light of the services that the fund and its shareholders receive and the other factors considered, including the findings of the Committee.
Costs of the Services and Profitability. The Board considered the revenues earned and the expenses incurred by Fidelity in conducting the business of developing, marketing, distributing, managing, administering and servicing the fund and its shareholders. The Board also considered the level of Fidelity's profits in respect of all the Fidelity funds.
On an annual basis, FMR presents to the Board Fidelity's profitability for the fund. Fidelity calculates the profitability for each fund, as well as aggregate profitability for groups of Fidelity funds and all Fidelity funds, using a series of detailed revenue and cost allocation methodologies which originate with the audited books and records of Fidelity. The Audit Committee of the Board reviews any significant changes from the prior year's methodologies.
PricewaterhouseCoopers LLP (PwC), independent registered public accounting firm and auditor to Fidelity and certain Fidelity funds, has been engaged annually by the Board as part of the Board's assessment of Fidelity's profitability analysis. PwC's engagement includes the review and assessment of Fidelity's methodologies used in determining the revenues and expenses attributable to Fidelity's mutual fund business, and completion of agreed-upon procedures surrounding the mathematical accuracy of fund profitability and its conformity to allocation methodologies. After considering PwC's reports issued under the engagement and information provided by Fidelity, the Board believes that while other allocation methods may also be reasonable, Fidelity's profitability methodologies are reasonable in all material respects.
Annual Report
Board Approval of Investment Advisory Contracts and
Management Fees - continued
The Board has also reviewed Fidelity's non-fund businesses and fall-out benefits related to the mutual fund business as well as cases where Fidelity's affiliates may benefit from or be related to the fund's business.
The Board considered the costs of the services provided by and the profits realized by Fidelity in connection with the operation of the fund and were satisfied that the profitability was not excessive in the circumstances.
Economies of Scale. The Board considered whether there have been economies of scale in respect of the management of the Fidelity funds, whether the Fidelity funds (including the fund) have appropriately benefited from any such economies of scale, and whether there is potential for realization of any further economies of scale. The Board considered the extent to which the fund will benefit from economies of scale through increased services to the fund, through waivers or reimbursements, or through fee or expense reductions.
In February 2009, the Board and the board of other Fidelity funds created an ad hoc committee (the Economies of Scale Committee) to analyze whether FMR attains economies of scale in respect of the management and servicing of the Fidelity funds, whether the Fidelity funds have appropriately benefited from such economies of scale, and whether there is potential for realization of any further economies of scale.
The Board recognized that the fund's management contract incorporates a "group fee" structure, which provides for lower group fee rates as total fund assets under FMR's management increase, and for higher group fee rates as total fund assets under FMR's management decrease. FMR calculates the group fee rates based on a tiered asset "breakpoint" schedule that varies based on asset class. The Board considered that the group fee is designed to deliver the benefits of economies of scale to fund shareholders when total Fidelity fund assets increase, even if assets of any particular fund are unchanged or have declined, because some portion of Fidelity's costs are attributable to services provided to all Fidelity funds, and all funds benefit if those costs can be allocated among more assets. The Board concluded that, given the group fee structure, fund shareholders will benefit from lower management fees as assets under FMR's management increase at the fund complex level, regardless of whether Fidelity achieves any such economies of scale.
The Board concluded, considering the findings of the Economies of Scale Committee, that any potential economies of scale are being appropriately shared between fund shareholders and Fidelity.
Annual Report
Additional Information Requested by the Board. In order to develop fully the factual basis for consideration of the Fidelity funds' Advisory Contracts, the Board requested and received additional information on certain topics, including (i) fund performance trends, actions to be taken by FMR to improve certain funds' overall performance, and Fidelity's long-term strategies for certain funds; (ii) portfolio manager changes that have occurred during the past year and length of portfolio manager tenure for different categories of funds over time; (iii) Fidelity's compensation structure for portfolio managers, research analysts, and other key personnel, the rationale for the compensation structure, and how the compensation structure provides appropriate performance incentives; (iv) the amount of the investment that each portfolio manager has made in the Fidelity fund(s) that he or she manages; (v) management and other fees paid by FMR to affiliated sub-advisers on behalf of the Fidelity funds; (vi) Fidelity's fee structures and rationale for recommending different fees among different categories of funds; (vii) Fidelity's rationale for recommending which funds should have a performance adjustment component as part of their management fees; (viii) the rationale for any differences between fund fee structures and fee structures in place for other Fidelity clients; and (ix) explanations regarding the relative total expenses borne by certain funds and classes, total expense competitive trends, and actions that might be taken by FMR to reduce total expenses for certain funds and classes.
Based on its evaluation of all of the conclusions noted above, and after considering all factors it believed relevant, the Board ultimately concluded that the advisory fee structures are fair and reasonable, and that the fund's Advisory Contracts should be renewed.
Annual Report
Managing Your Investments
Fidelity offers several ways to conveniently manage your personal investments via your telephone or PC. You can access your account information, conduct trades and research your investments 24 hours a day.
By Phone
Fidelity Automated Service Telephone provides a single toll-free number to access account balances, positions, quotes and trading. It's easy to navigate the service, and on your first call, the system will help you create a personal identification number (PIN) for security.
(phone_graphic)
Fidelity Automated
Service Telephone (FAST®)
1-800-544-5555
Press
 For mutual fund and brokerage trading.
 For quotes.*
 For account balances and holdings.
 To review orders and mutual
fund activity.
 To change your PIN.

 To speak to a Fidelity representative.
By PC
Fidelity's web site on the Internet provides a wide range of information, including daily financial news, fund performance, interactive planning tools and news about Fidelity products and services.
(computer_graphic)
Fidelity's Web Site
www.fidelity.com
* When you call the quotes line, please remember that a fund's yield and return will vary and, except for money market funds, share price will also vary. This means that you may have a gain or loss when you sell your shares. There is no assurance that money market funds will be able to maintain a stable $1 share price; an investment in a money market fund is not insured or guaranteed by the U.S. government. Total returns are historical and include changes in share price, reinvestment of dividends and capital gains, and the effects of any sales charges.
Annual Report
To Write Fidelity
We'll give your correspondence immediate attention and send you written confirmation upon completion of your request.
(letter_graphic)
Making Changes
To Your Account
(such as changing name, address, bank, etc.)
Fidelity Investments
P.O. Box 770001
Cincinnati, OH 45277-0002
(letter_graphic)
For Non-Retirement
Accounts
Buying shares
Fidelity Investments
P.O. Box 770001
Cincinnati, OH 45277-0003
Overnight Express
Fidelity Investments
Attn: Distribution Services
100 Crosby Parkway - KC1H
Covington, KY 41015
Selling shares
Fidelity Investments
P.O. Box 770001
Cincinnati, OH 45277-0035
Overnight Express
Fidelity Investments
Attn: Distribution Services
100 Crosby Parkway - KC1H
Covington, KY 41015
General Correspondence
Fidelity Investments
P.O. Box 500
Merrimack, NH 03054-0500
(letter_graphic)
For Retirement
Accounts
Buying shares
Fidelity Investments
P.O. Box 770001
Cincinnati, OH 45277-0003
Selling shares
Fidelity Investments
P.O. Box 770001
Cincinnati, OH 45277-0035
Overnight Express
Fidelity Investments
Attn: Distribution Services
100 Crosby Parkway - KC1H
Covington, KY 41015
General Correspondence
Fidelity Investments
P.O. Box 500
Merrimack, NH 03054-0500
Annual Report
To Visit Fidelity
For directions and hours,
please call 1-800-544-9797.
Arizona
7001 West Ray Road
Chandler, AZ
15445 N. Scottsdale Road
Scottsdale, AZ
17550 North 75th Avenue
Glendale, AZ
5330 E. Broadway Blvd
Tucson, AZ
California
815 East Birch Street
Brea, CA
1411 Chapin Avenue
Burlingame, CA
851 East Hamilton Avenue
Campbell, CA
601 Larkspur Landing Circle
Larkspur, CA
2000 Avenue of the Stars
Los Angeles, CA
27101 Puerta Real
Mission Viejo, CA
73575 El Paseo
Palm Desert, CA
251 University Avenue
Palo Alto, CA
123 South Lake Avenue
Pasadena, CA
16656 Bernardo Ctr. Drive
Rancho Bernardo, CA
1220 Roseville Parkway
Roseville, CA
1740 Arden Way
Sacramento, CA
7676 Hazard Center Drive
San Diego, CA
11943 El Camino Real
San Diego, CA
8 Montgomery Street
San Francisco, CA
3793 State Street
Santa Barbara, CA
1200 Wilshire Boulevard
Santa Monica, CA
398 West El Camino Real
Sunnyvale, CA
111 South Westlake Blvd
Thousand Oaks, CA
21701 Hawthorne Boulevard
Torrance, CA
2001 North Main Street
Walnut Creek, CA
6326 Canoga Avenue
Woodland Hills, CA
2211 Michelson Drive
Irvine, CA
Colorado
281 East Flatiron Circle
Broomfield, CO
1625 Broadway
Denver, CO
9185 Westview Road
Lone Tree, CO
Connecticut
48 West Putnam Avenue
Greenwich, CT
265 Church Street
New Haven, CT
300 Atlantic Street
Stamford, CT
29 South Main Street
West Hartford, CT
1261 Post Road
Fairfield, CT
Delaware
400 Delaware Avenue
Wilmington, DE
Florida
175 East Altamonte Drive
Altamonte Springs, FL
1400 Glades Road
Boca Raton, FL
121 Alhambra Plaza
Coral Gables, FL
2948 N. Federal Highway
Ft. Lauderdale, FL
4671 Town Center Parkway
Jacksonville, FL
8880 Tamiami Trail, North
Naples, FL
230 Royal Palm Way
Palm Beach, FL
3501 PGA Boulevard
Palm Beach Gardens, FL
3550 Tamiami Trail, South
Sarasota, FL
1502 N. Westshore Blvd.
Tampa, FL
2465 State Road 7
Wellington, FL
Georgia
3242 Peachtree Road
Atlanta, GA
1000 Abernathy Road
Atlanta, GA
Illinois
One North LaSalle Street
Chicago, IL
401 North Michigan Avenue
Chicago, IL
One Skokie Valley Road
Highland Park, IL
1415 West 22nd Street
Oak Brook, IL
15105 S LaGrange Road
Orland Park, IL
1572 East Golf Road
Schaumburg, IL
1823 Freedom Drive
Naperville, IL
Indiana
8480 Keystone Crossing
Indianapolis, IN
Kansas
5400 College Boulevard
Overland Park, KS
Maine
Three Canal Plaza
Portland, ME
Maryland
7315 Wisconsin Avenue
Bethesda, MD
610 York Road
Towson, MD
Massachusetts
801 Boylston Street
Boston, MA
155 Congress Street
Boston, MA
300 Granite Street
Braintree, MA
44 Mall Road
Burlington, MA
238 Main Street
Cambridge, MA
200 Endicott Street
Danvers, MA
Annual Report
405 Cochituate Road
Framingham, MA
551 Boston Turnpike
Shrewsbury, MA
Michigan
500 E. Eisenhower Pkwy.
Ann Arbor, MI
280 N. Old Woodward Ave.
Birmingham, MI
30200 Northwestern Hwy.
Farmington Hills, MI
43420 Grand River Avenue
Novi, MI
3480 28th Street
Grand Rapids, MI
2425 S. Linden Road STE E
Flint, MI
Minnesota
7740 France Avenue South
Edina, MN
8342 3rd Street North
Oakdale, MN
Missouri
1524 South Lindbergh Blvd.
St. Louis, MO
Nevada
2225 Village Walk Drive
Henderson, NV
New Jersey
501 Route 73 South
Marlton, NJ
150 Essex Street
Millburn, NJ
35 Morris Street
Morristown, NJ
396 Route 17, North
Paramus, NJ
3518 Route 1 North
Princeton, NJ
530 Broad Street
Shrewsbury, NJ
New Mexico
2261 Q Street NE
Albuquerque, NM
New York
1130 Franklin Avenue
Garden City, NY
37 West Jericho Turnpike
Huntington Station, NY
1271 Avenue of the Americas
New York, NY
980 Madison Avenue
New York, NY
61 Broadway
New York, NY
350 Park Avenue
New York, NY
200 Fifth Avenue
New York, NY
733 Third Avenue
New York, NY
2070 Broadway
New York, NY
1075 Northern Blvd.
Roslyn, NY
799 Central Park Avenue
Scarsdale, NY
3349 Monroe Avenue
Rochester, NY
North Carolina
4611 Sharon Road
Charlotte, NC
7011 Fayetteville Road
Durham, NC
Ohio
3805 Edwards Road
Cincinnati, OH
1324 Polaris Parkway
Columbus, OH
1800 Crocker Road
Westlake, OH
28699 Chagrin Boulevard
Woodmere Village, OH
Oregon
7493 SW Bridgeport Road
Tigard, OR
Pennsylvania
600 West DeKalb Pike
King of Prussia, PA
1735 Market Street
Philadelphia, PA
12001 Perry Highway
Wexford, PA
Rhode Island
10 Memorial Boulevard
Providence, RI
Tennessee
3018 Peoples Street
Johnson City, TN
7628 West Farmington Blvd.
Germantown, TN
2035 Mallory Lane
Franklin, TN
Texas
10000 Research Boulevard
Austin, TX
4001 Northwest Parkway
Dallas, TX
12532 Memorial Drive
Houston, TX
2701 Drexel Drive
Houston, TX
6560 Fannin Street
Houston, TX
1701 Lake Robbins Drive
The Woodlands, TX
6500 N. MacArthur Blvd.
Irving, TX
6005 West Park Boulevard
Plano, TX
1576 East Southlake Blvd.
Southlake, TX
15600 Southwest Freeway
Sugar Land, TX
139 N. Loop 1604 East
San Antonio, TX
Utah
279 West South Temple
Salt Lake City, UT
Virginia
1861 International Drive
McLean, VA
11957 Democracy Drive
Reston, VA
Washington
10500 NE 8th Street
Bellevue, WA
1518 6th Avenue
Seattle, WA
304 Strander Blvd
Tukwila, WA
Washington, DC
1900 K Street, N.W.
Washington, DC
Wisconsin
16020 West Bluemound Road
Brookfield, WI
Fidelity Brokerage Services, Inc., 100 Summer St., Boston, MA 02110 Member NYSE/SIPC
Annual Report
Investment Adviser
Fidelity Management & Research Company
Boston, MA
Investment Sub-Advisers
FMR Co., Inc.
Fidelity Research & Analysis Company
Fidelity Management & Research
(U.K.) Inc.
Fidelity Management & Research
(Hong Kong) Limited
Fidelity Management & Research
(Japan) Inc.
General Distributor
Fidelity Distributors Corporation
Boston, MA
Transfer and Service Agents
Fidelity Investments Institutional
Operations Company, Inc.
Boston, MA
Fidelity Service Company, Inc.
Boston, MA
Custodian
Citibank, N.A.
New York, NY
The Fidelity Telephone Connection
Mutual Fund 24-Hour Service
Exchanges/Redemptions
and Account Assistance 1-800-544-6666
Product Information 1-800-544-6666
Retirement Accounts 1-800-544-4774
(8 a.m. - 9 p.m.)
TDD Service 1-800-544-0118
for the deaf and hearing impaired
(9 a.m. - 9 p.m. Eastern time)
Fidelity Automated Service
Telephone (FAST®) 1-800-544-5555
Automated line for quickest service
BCF-UANN-0910
1.789244.107

Fidelity®
Blue Chip Growth
Fund -
Class F
Annual Report
July 31, 2010
(2_fidelity_logos) (Registered_Trademark)
Contents
Performance | <Click Here> | How the fund has done over time. |
Management's Discussion of Fund Performance | <Click Here> | The Portfolio Manager's review of fund performance and strategy. |
Shareholder Expense Example | <Click Here> | An example of shareholder expenses. |
Investment Changes | <Click Here> | A summary of major shifts in the fund's investments over the past six months. |
Investments | <Click Here> | A complete list of the fund's investments with their market values. |
Financial Statements | <Click Here> | Statements of assets and liabilities, operations, and changes in net assets,
as well as financial highlights. |
Notes | <Click Here> | Notes to the financial statements. |
Report of Independent Registered Public Accounting Firm | <Click Here> | |
Trustees and Officers | <Click Here> | |
Distributions | <Click Here> | |
Board Approval of Investment Advisory Contracts and Management Fees | <Click Here> | |
To view a fund's proxy voting guidelines and proxy voting record for the 12-month period ended June 30, visit http://www.fidelity.com/proxyvotingresults or visit the Securities and Exchange Commission's (SEC) web site at http://www.sec.gov. You may also call 1-800-835-5092 to request a free copy of the proxy voting guidelines.
Standard & Poor's, S&P and S&P 500 are registered service marks of The McGraw-Hill Companies, Inc. and have been licensed for use by Fidelity Distributors Corporation.
Other third party marks appearing herein are the property of their respective owners.
All other marks appearing herein are registered or unregistered trademarks or service marks of FMR LLC or an affiliated company.
Annual Report
This report and the financial statements contained herein are submitted for the general information of the shareholders of the fund. This report is not authorized for distribution to prospective investors in the fund unless preceded or accompanied by an effective prospectus.
A fund files its complete schedule of portfolio holdings with the SEC for the first and third quarters of each fiscal year on Form N-Q. Forms N-Q are available on the SEC's web site at http://www.sec.gov. A fund's Forms N-Q may be reviewed and copied at the SEC's Public Reference Room in Washington, DC. Information regarding the operation of the SEC's Public Reference Room may be obtained by calling 1-800-SEC-0330. For a complete list of a fund's portfolio holdings, view the most recent holdings listing, semiannual report, or annual report on Fidelity's web site at http://www.fidelity.com or http://www.advisor.fidelity.com, as applicable.
NOT FDIC INSURED • MAY LOSE VALUE • NO BANK GUARANTEE
Neither the fund nor Fidelity Distributors Corporation is a bank.
Annual Report
Average annual total return reflects the change in the value of an investment, assuming reinvestment of the class' distributions from dividend income and capital gains (the profits earned upon the sale of securities that have grown in value, if any) and assuming a constant rate of performance each year. The $10,000 table and the fund's returns do not reflect the deduction of taxes that a shareholder would pay on fund distributions or the redemption of fund shares. During periods of reimbursement by Fidelity, a fund's total return will be greater than it would be had the reimbursement not occurred. How a fund did yesterday is no guarantee of how it will do tomorrow.
Average Annual Total Returns
Periods ended July 31, 2010 | Past 1
year | Past 5
years | Past 10
years |
Class F A | 18.59% | 1.25% | -2.19% |
A The initial offering of Class F shares took place on June 26, 2009. Returns prior to June 26, 2009 are those of Fidelity Blue Chip Growth Fund, the original class of the fund.
$10,000 Over 10 Years
Let's say hypothetically that $10,000 was invested in Fidelity® Blue Chip Growth Fund - Class F on July 31, 2000. The chart shows how the value of your investment would have changed, and also shows how the Russell 1000® Growth Index performed over the same period. The initial offering of Class F took place on June 26, 2009. See above for additional information regarding the performance of Class F.
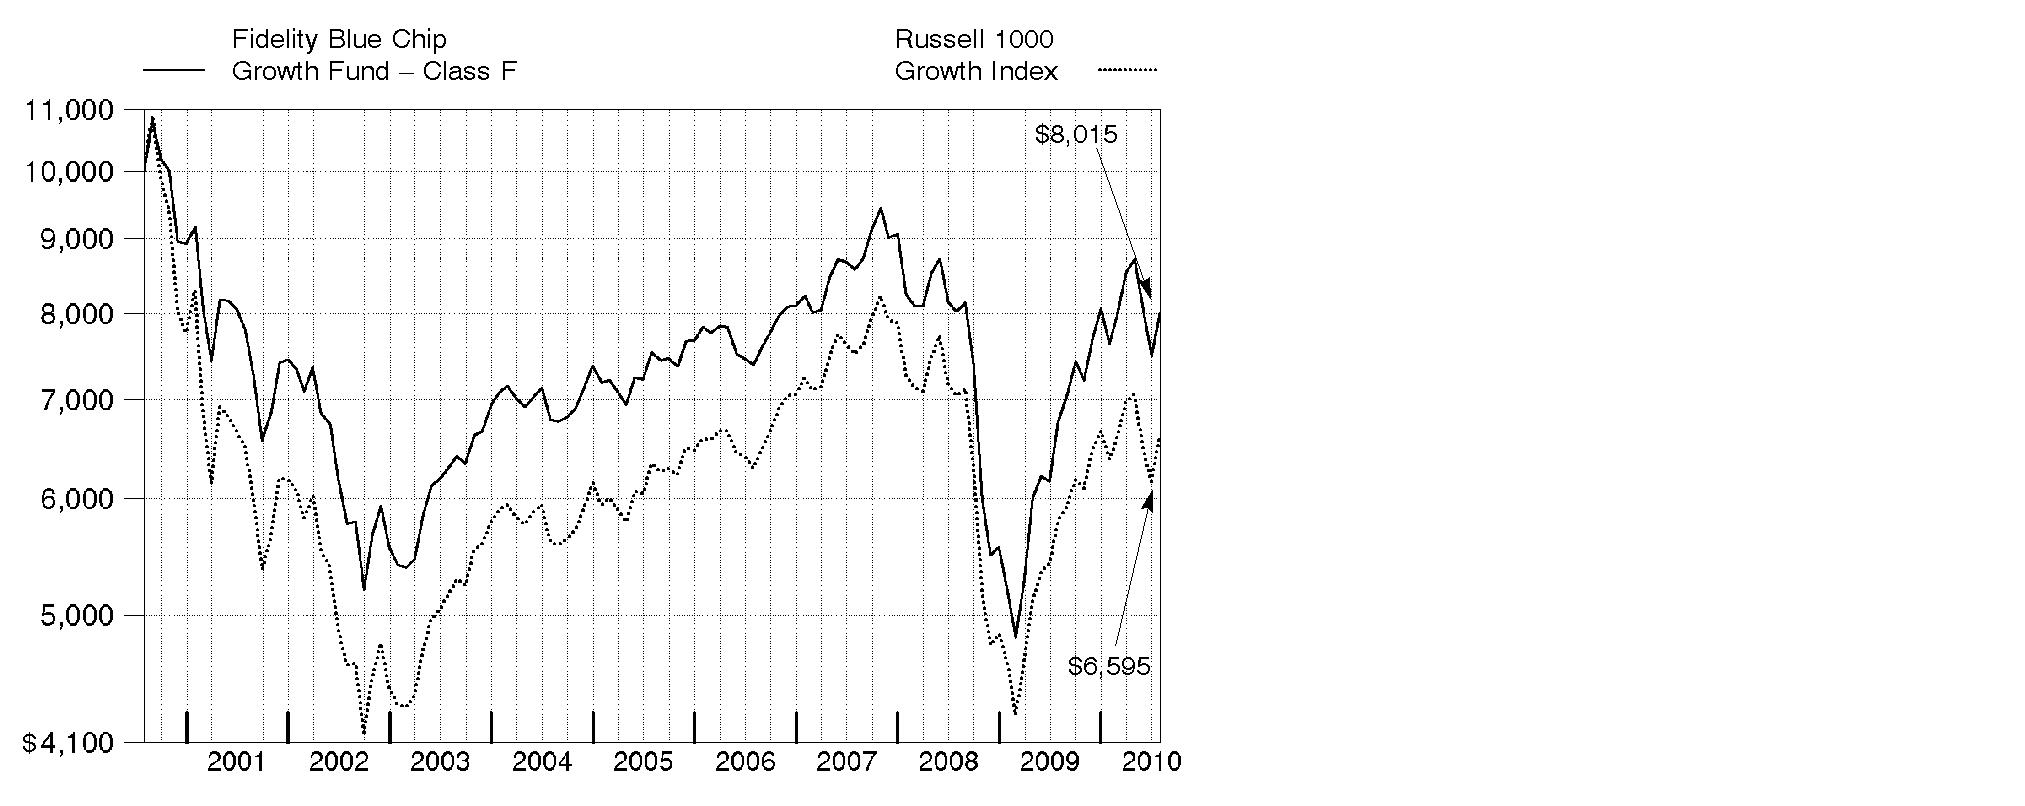
Annual Report
Market Recap: U.S. stock markets saw double-digit gains for the year ending July 31, 2010, despite the return of market volatility and risk aversion during the first half of 2010. An impressive bull run continued through 2009, bolstered by improvement in the economy and credit markets. Early in the new year, however, stocks fell sharply amid concerns about the global economic recovery, fueled by European debt woes and China's efforts to restrain inflation. After this brief dip, markets regained their upward momentum, as government stimulus and significant corporate cost cutting led to encouraging earnings reports, improved credit conditions and rising consumer confidence. Positive news continued through mid-April, when the Dow Jones Industrial AverageSM pushed above the 11,000 mark for the first time in 19 months. That milestone was short-lived, however, as heightened concern about the European debt crisis sparked an abrupt sell-off in May, leading to the first official correction since the rally began in March 2009. Although the market's malaise continued through June, stocks saw solid gains in July. For the year, the Dow rose 17.28%, while the S&P 500® Index was up 13.84%. Elsewhere, the technology-laden Nasdaq Composite® Index returned 14.99%. Small- and mid-cap stocks performed best, as measured by the 18.43% increase of the Russell 2000® Index and the 23.21% gain of the Russell Midcap® Index.
Comments from Sonu Kalra, Portfolio Manager of Fidelity® Blue Chip Growth Fund: For the one-year period, the fund's Class F shares gained 18.59%, solidly outpacing the 13.65% return of the Russell 1000® Growth Index. Strong stock selection in technology, industrials, consumer discretionary, financials and materials fueled performance, while my picks in health care and industry positioning within financials nicked results. Several tech stocks helped, including Apple, Baidu and SanDisk. Apple - the fund's largest holding - performed well amid the launch of its iPad tablet device and continued success of its iPhone and personal computers. Baidu, China's largest search engine, rose on news that its U.S.- based competitor Google considered leaving the Chinese market. SanDisk benefited from maintaining supply of the flash memory used in smart phones during an industrywide shortage. UAL (parent company of United Airlines) was the top contributor, benefiting from a recovery in travel and leisure spending. Notable detractors were Marvell Technology Group, a semiconductor manufacturer that faced oversupply issues in the hard-disk drive industry, and diversified financials firms Morgan Stanley and Bank of America, which were hurt due in part to uncertainty regarding potential regulatory reform. I sold Bank of America by period end.
The views expressed above reflect those of the portfolio manager(s) only through the end of the period as stated on the cover of this report and do not necessarily represent the views of Fidelity or any other person in the Fidelity organization. Any such views are subject to change at any time based upon market or other conditions and Fidelity disclaims any responsibility to update such views. These views may not be relied on as investment advice and, because investment decisions for a Fidelity fund are based on numerous factors, may not be relied on as an indication of trading intent on behalf of any Fidelity fund.
Annual Report
Shareholder Expense Example
As a shareholder of the Fund, you incur two types of costs: (1) transaction costs, and (2) ongoing costs, including management fees and other Fund expenses. This Example is intended to help you understand your ongoing costs (in dollars) of investing in the Fund and to compare these costs with the ongoing costs of investing in other mutual funds.
The Example is based on an investment of $1,000 invested at the beginning of the period and held for the entire period (February 1, 2010 to July 31, 2010).
Actual Expenses
The first line of the accompanying table for each class of the Fund provides information about actual account values and actual expenses. You may use the information in this line, together with the amount you invested, to estimate the expenses that you paid over the period. Simply divide your account value by $1,000.00 (for example, an $8,600 account value divided by $1,000.00 = 8.6), then multiply the result by the number in the first line for a class of the Fund under the heading entitled "Expenses Paid During Period" to estimate the expenses you paid on your account during this period. A small balance maintenance fee of $12.00 that is charged once a year may apply for certain accounts with a value of less than $2,000. This fee is not included in the table below. If it was, the estimate of expenses you paid during the period would be higher, and your ending account value lower, by this amount. In addition, the Fund, as a shareholder in the underlying Fidelity Central Funds, will indirectly bear its pro-rata share of the fees and expenses incurred by the underlying Fidelity Central Funds. These fees and expenses are not included in the Fund's annualized expense ratio used to calculate the expense estimate in the table below.
Hypothetical Example for Comparison Purposes
The second line of the accompanying table for each class of the Fund provides information about hypothetical account values and hypothetical expenses based on a Class' actual expense ratio and an assumed rate of return of 5% per year before expenses, which is not the Class' actual return. The hypothetical account values and expenses may not be used to estimate the actual ending account balance or expenses you paid for the period. You may use this information to compare the ongoing costs of investing in the Fund and other funds. To do so, compare this 5% hypothetical example with the 5% hypothetical examples that appear in the shareholder reports of the other funds. A small balance maintenance fee of $12.00 that is charged once a year may apply for certain accounts with a value of less than $2,000. This fee is not included in the table below. If it was, the estimate of expenses you paid during the period would be higher, and your ending account value lower, by this amount. In addition, the Fund, as a shareholder in the underlying Fidelity Central Funds, will indirectly bear its pro-rata share of the fees and expenses incurred by the underlying Fidelity Central Funds. These fees and expenses are not included in the Fund's annualized expense ratio used to calculate the expense estimate in the table below.
Please note that the expenses shown in the table are meant to highlight your ongoing costs only and do not reflect any transaction costs. Therefore, the second line of the table is useful in comparing ongoing costs only, and will not help you determine the relative total costs of owning different funds.
Annual Report
| Annualized
Expense Ratio | Beginning
Account Value
February 1, 2010 | Ending
Account Value
July 31, 2010 | Expenses Paid
During Period*
February 1, 2010 to July 31, 2010 |
Blue Chip Growth | .97% | | | |
Actual | | $ 1,000.00 | $ 1,048.20 | $ 4.93 |
HypotheticalA | | $ 1,000.00 | $ 1,019.98 | $ 4.86 |
Class K | .78% | | | |
Actual | | $ 1,000.00 | $ 1,049.00 | $ 3.96 |
HypotheticalA | | $ 1,000.00 | $ 1,020.93 | $ 3.91 |
Class F | .71% | | | |
Actual | | $ 1,000.00 | $ 1,049.30 | $ 3.61 |
HypotheticalA | | $ 1,000.00 | $ 1,021.27 | $ 3.56 |
A 5% return per year before expenses
* Expenses are equal to each Class' annualized expense ratio, multiplied by the average account value over the period, multiplied by 181/365 (to reflect the one-half year period).
Annual Report
Investment Changes (Unaudited)
Top Ten Stocks as of July 31, 2010 |
| % of fund's
net assets | % of fund's net assets
6 months ago |
Apple, Inc. | 6.6 | 5.1 |
Google, Inc. Class A | 3.2 | 4.2 |
Hewlett-Packard Co. | 3.0 | 2.7 |
Exxon Mobil Corp. | 2.4 | 0.0 |
Amazon.com, Inc. | 2.1 | 1.8 |
Cisco Systems, Inc. | 2.0 | 2.1 |
QUALCOMM, Inc. | 1.7 | 1.6 |
Philip Morris International, Inc. | 1.6 | 0.8 |
Target Corp. | 1.4 | 1.7 |
Research In Motion Ltd. | 1.4 | 1.1 |
| 25.4 | |
Top Five Market Sectors as of July 31, 2010 |
| % of fund's
net assets | % of fund's net assets
6 months ago |
Information Technology | 35.1 | 36.4 |
Consumer Discretionary | 15.1 | 12.7 |
Industrials | 13.6 | 9.1 |
Consumer Staples | 8.1 | 11.4 |
Financials | 7.8 | 8.8 |
Asset Allocation (% of fund's net assets) |
As of July 31, 2010* | As of January 31, 2010** |
| Stocks 99.5% | | | Stocks 99.7% | |
| Convertible
Securities 0.0% | |  | Convertible
Securities 0.1% | |
| Short-Term
Investments and
Net Other Assets 0.5% | | | Short-Term
Investments and
Net Other Assets 0.2% | |
* Foreign investments | 8.6% | | ** Foreign investments | 7.7% | |

Annual Report
Investments July 31, 2010
Showing Percentage of Net Assets
Common Stocks - 99.3% |
| Shares | | Value (000s) |
CONSUMER DISCRETIONARY - 14.9% |
Automobiles - 1.2% |
Bajaj Auto Ltd. | 307,614 | | $ 17,826 |
Bayerische Motoren Werke AG (BMW) | 513,708 | | 27,659 |
Ford Motor Co. (a) | 5,046,300 | | 64,441 |
Hyundai Motor Co. | 95,676 | | 12,053 |
Tesla Motors, Inc. (a) | 1,059,000 | | 21,116 |
| | 143,095 |
Diversified Consumer Services - 0.3% |
Coinstar, Inc. (a) | 743,594 | | 33,834 |
Hotels, Restaurants & Leisure - 3.8% |
Chipotle Mexican Grill, Inc. (a) | 125,500 | | 18,561 |
Genting International PLC (a) | 7,982,000 | | 7,454 |
Las Vegas Sands Corp. (a)(d) | 3,715,000 | | 99,785 |
Marriott International, Inc. Class A | 1,213,400 | | 41,146 |
McDonald's Corp. | 344,000 | | 23,987 |
Starbucks Corp. | 4,457,400 | | 110,766 |
Starwood Hotels & Resorts Worldwide, Inc. | 1,248,000 | | 60,466 |
WMS Industries, Inc. (a) | 623,800 | | 24,023 |
Wyndham Worldwide Corp. | 1,872,885 | | 47,815 |
| | 434,003 |
Household Durables - 0.9% |
Furniture Brands International, Inc. (a)(e) | 2,927,549 | | 16,160 |
Harman International Industries, Inc. (a) | 613,400 | | 18,653 |
Stanley Black & Decker, Inc. | 780,700 | | 45,296 |
Tempur-Pedic International, Inc. (a) | 789,200 | | 24,205 |
| | 104,314 |
Internet & Catalog Retail - 2.1% |
Amazon.com, Inc. (a) | 2,080,800 | | 245,306 |
Media - 1.4% |
Comcast Corp. Class A | 1,223,700 | | 23,825 |
DIRECTV (a) | 1,778,019 | | 66,071 |
DISH Network Corp. Class A | 898,200 | | 18,036 |
ReachLocal, Inc. | 19,922 | | 277 |
The Walt Disney Co. | 857,300 | | 28,882 |
Time Warner Cable, Inc. | 520,700 | | 29,768 |
| | 166,859 |
Multiline Retail - 2.7% |
Kohl's Corp. (a) | 822,400 | | 39,220 |
Common Stocks - continued |
| Shares | | Value (000s) |
CONSUMER DISCRETIONARY - continued |
Multiline Retail - continued |
Macy's, Inc. | 5,592,700 | | $ 104,304 |
Target Corp. | 3,220,200 | | 165,261 |
| | 308,785 |
Specialty Retail - 1.6% |
Foot Locker, Inc. | 1,739,600 | | 23,641 |
Home Depot, Inc. | 1,148,800 | | 32,752 |
Limited Brands, Inc. | 594,800 | | 15,251 |
Lowe's Companies, Inc. | 3,326,400 | | 68,990 |
RadioShack Corp. | 1,136,433 | | 24,479 |
rue21, Inc. | 458,250 | | 13,899 |
| | 179,012 |
Textiles, Apparel & Luxury Goods - 0.9% |
Coach, Inc. | 798,400 | | 29,517 |
Liz Claiborne, Inc. (a)(d) | 1,478,217 | | 7,007 |
NIKE, Inc. Class B | 257,300 | | 18,948 |
Phillips-Van Heusen Corp. | 269,300 | | 13,974 |
Polo Ralph Lauren Corp. Class A | 224,600 | | 17,746 |
Under Armour, Inc. Class A (sub. vtg.) (a)(d) | 413,000 | | 15,512 |
| | 102,704 |
TOTAL CONSUMER DISCRETIONARY | | 1,717,912 |
CONSUMER STAPLES - 8.1% |
Beverages - 3.0% |
Anheuser-Busch InBev SA NV | 798,981 | | 42,315 |
Coca-Cola Enterprises, Inc. | 509,100 | | 14,611 |
Dr Pepper Snapple Group, Inc. | 2,471,300 | | 92,797 |
PepsiCo, Inc. | 558,500 | | 36,252 |
The Coca-Cola Co. | 2,864,500 | | 157,863 |
| | 343,838 |
Food & Staples Retailing - 1.7% |
CVS Caremark Corp. | 2,088,500 | | 64,096 |
Kroger Co. | 1,943,000 | | 41,153 |
Walgreen Co. | 1,643,600 | | 46,925 |
Whole Foods Market, Inc. (a) | 1,102,100 | | 41,847 |
| | 194,021 |
Food Products - 0.5% |
Diamond Foods, Inc. (d) | 374,000 | | 16,658 |
Common Stocks - continued |
| Shares | | Value (000s) |
CONSUMER STAPLES - continued |
Food Products - continued |
Green Mountain Coffee Roasters, Inc. (a) | 1,044,400 | | $ 32,157 |
Mead Johnson Nutrition Co. Class A | 103,400 | | 5,495 |
| | 54,310 |
Household Products - 1.3% |
Kimberly-Clark Corp. | 1,176,200 | | 75,418 |
Procter & Gamble Co. | 1,193,600 | | 73,001 |
| | 148,419 |
Personal Products - 0.0% |
Emami Ltd. | 631,338 | | 6,231 |
Tobacco - 1.6% |
Philip Morris International, Inc. | 3,675,000 | | 187,572 |
TOTAL CONSUMER STAPLES | | 934,391 |
ENERGY - 7.4% |
Energy Equipment & Services - 1.4% |
Halliburton Co. | 356,400 | | 10,649 |
National Oilwell Varco, Inc. | 935,700 | | 36,642 |
Schlumberger Ltd. | 1,251,200 | | 74,647 |
Transocean Ltd. (a) | 400,200 | | 18,493 |
Weatherford International Ltd. (a) | 1,116,200 | | 18,082 |
| | 158,513 |
Oil, Gas & Consumable Fuels - 6.0% |
Alpha Natural Resources, Inc. (a) | 560,000 | | 21,465 |
Anadarko Petroleum Corp. | 961,700 | | 47,277 |
Chevron Corp. | 578,400 | | 44,080 |
ConocoPhillips | 233,500 | | 12,894 |
EOG Resources, Inc. | 1,027,100 | | 100,142 |
Exxon Mobil Corp. | 4,575,300 | | 273,054 |
Marathon Oil Corp. | 540,800 | | 18,090 |
Massey Energy Co. | 1,253,800 | | 38,341 |
Occidental Petroleum Corp. | 1,111,200 | | 86,596 |
Reliance Industries Ltd. | 373,169 | | 8,123 |
Sunoco, Inc. | 1,284,200 | | 45,807 |
| | 695,869 |
TOTAL ENERGY | | 854,382 |
Common Stocks - continued |
| Shares | | Value (000s) |
FINANCIALS - 7.8% |
Capital Markets - 1.4% |
Goldman Sachs Group, Inc. | 270,900 | | $ 40,857 |
Morgan Stanley | 4,212,500 | | 113,695 |
| | 154,552 |
Commercial Banks - 1.5% |
Axis Bank Ltd. | 311,281 | | 9,016 |
Bank of Baroda | 158,405 | | 2,672 |
Punjab National Bank | 327,071 | | 8,118 |
Regions Financial Corp. | 4,116,900 | | 30,177 |
SunTrust Banks, Inc. | 680,700 | | 17,664 |
Synovus Financial Corp. | 2,594,976 | | 6,799 |
Wells Fargo & Co. | 3,707,100 | | 102,798 |
| | 177,244 |
Consumer Finance - 0.9% |
American Express Co. | 2,368,200 | | 105,716 |
Diversified Financial Services - 2.6% |
Citigroup, Inc. (a) | 32,696,800 | | 134,057 |
Infrastructure Development Finance Co. Ltd. | 852,826 | | 3,419 |
JPMorgan Chase & Co. | 3,525,700 | | 142,015 |
NBH Holdings Corp. Class A (a)(f) | 347,410 | | 6,774 |
Rural Electrification Corp. Ltd. | 2,406,330 | | 16,357 |
| | 302,622 |
Insurance - 0.7% |
Assured Guaranty Ltd. | 1,971,300 | | 30,949 |
Genworth Financial, Inc. Class A (a) | 3,268,300 | | 44,384 |
| | 75,333 |
Real Estate Management & Development - 0.7% |
Ackruti City Ltd. | 1,950,000 | | 21,009 |
CB Richard Ellis Group, Inc. Class A (a) | 1,461,000 | | 24,837 |
Emami Infrastructure Ltd. (a) | 105,223 | | 204 |
Indiabulls Real Estate Ltd. (a) | 5,411,272 | | 19,103 |
Parsvnath Developers Ltd. (a) | 6,435,670 | | 18,023 |
| | 83,176 |
TOTAL FINANCIALS | | 898,643 |
HEALTH CARE - 7.4% |
Biotechnology - 3.2% |
Alkermes, Inc. (a) | 917,100 | | 11,831 |
Amgen, Inc. (a) | 1,321,500 | | 72,061 |
Amylin Pharmaceuticals, Inc. (a) | 2,132,700 | | 40,351 |
Common Stocks - continued |
| Shares | | Value (000s) |
HEALTH CARE - continued |
Biotechnology - continued |
Cephalon, Inc. (a) | 187,600 | | $ 10,646 |
Dendreon Corp. (a) | 1,039,281 | | 34,203 |
Genzyme Corp. (a) | 372,700 | | 25,925 |
Gilead Sciences, Inc. (a) | 2,202,800 | | 73,397 |
Human Genome Sciences, Inc. (a) | 1,012,500 | | 26,264 |
ImmunoGen, Inc. (a) | 547,037 | | 5,159 |
Micromet, Inc. (a) | 1,322,420 | | 9,059 |
Vertex Pharmaceuticals, Inc. (a) | 1,674,100 | | 56,350 |
| | 365,246 |
Health Care Equipment & Supplies - 0.2% |
Hologic, Inc. (a) | 425,800 | | 6,021 |
NuVasive, Inc. (a) | 640,300 | | 20,983 |
| | 27,004 |
Health Care Providers & Services - 2.5% |
Express Scripts, Inc. (a) | 3,218,980 | | 145,434 |
McKesson Corp. | 1,063,100 | | 66,784 |
Medco Health Solutions, Inc. (a) | 1,687,100 | | 80,981 |
| | 293,199 |
Health Care Technology - 0.7% |
Allscripts-Misys Healthcare Solutions, Inc. (a) | 1,355,300 | | 22,620 |
Cerner Corp. (a) | 679,300 | | 52,612 |
| | 75,232 |
Life Sciences Tools & Services - 0.3% |
Illumina, Inc. (a) | 300,000 | | 13,449 |
Life Technologies Corp. (a) | 524,300 | | 22,540 |
| | 35,989 |
Pharmaceuticals - 0.5% |
Allergan, Inc. | 590,700 | | 36,068 |
Forest Laboratories, Inc. (a) | 400,000 | | 11,100 |
Merck & Co., Inc. | 442,500 | | 15,249 |
| | 62,417 |
TOTAL HEALTH CARE | | 859,087 |
INDUSTRIALS - 13.6% |
Aerospace & Defense - 2.9% |
Honeywell International, Inc. | 1,338,900 | | 57,385 |
Precision Castparts Corp. | 666,600 | | 81,452 |
Common Stocks - continued |
| Shares | | Value (000s) |
INDUSTRIALS - continued |
Aerospace & Defense - continued |
The Boeing Co. | 618,200 | | $ 42,124 |
United Technologies Corp. | 2,131,700 | | 151,564 |
| | 332,525 |
Air Freight & Logistics - 0.5% |
C.H. Robinson Worldwide, Inc. | 94,800 | | 6,181 |
United Parcel Service, Inc. Class B | 799,500 | | 51,968 |
| | 58,149 |
Airlines - 1.9% |
Continental Airlines, Inc. Class B (a) | 1,243,300 | | 31,107 |
Delta Air Lines, Inc. (a) | 5,031,700 | | 59,777 |
UAL Corp. (a) | 4,742,800 | | 112,594 |
US Airways Group, Inc. (a) | 1,991,700 | | 21,610 |
| | 225,088 |
Commercial Services & Supplies - 0.1% |
Republic Services, Inc. | 384,800 | | 12,260 |
Construction & Engineering - 1.2% |
Fluor Corp. | 1,750,800 | | 84,546 |
Jacobs Engineering Group, Inc. (a) | 1,212,771 | | 44,351 |
KBR, Inc. | 608,300 | | 13,614 |
| | 142,511 |
Industrial Conglomerates - 1.1% |
3M Co. | 731,200 | | 62,547 |
General Electric Co. | 2,982,800 | | 48,083 |
Textron, Inc. | 630,200 | | 13,083 |
| | 123,713 |
Machinery - 4.3% |
ArvinMeritor, Inc. (a) | 476,024 | | 7,812 |
Bucyrus International, Inc. Class A | 1,187,800 | | 73,905 |
Caterpillar, Inc. | 667,500 | | 46,558 |
Cummins, Inc. | 1,066,500 | | 84,904 |
Danaher Corp. | 1,397,700 | | 53,686 |
Ingersoll-Rand Co. Ltd. | 3,423,400 | | 128,241 |
Joy Global, Inc. | 224,137 | | 13,307 |
PACCAR, Inc. | 1,522,500 | | 69,761 |
Pall Corp. | 319,900 | | 12,233 |
Thermax Ltd. | 211,215 | | 3,456 |
| | 493,863 |
Common Stocks - continued |
| Shares | | Value (000s) |
INDUSTRIALS - continued |
Professional Services - 0.3% |
Manpower, Inc. | 798,700 | | $ 38,322 |
Road & Rail - 1.2% |
CSX Corp. | 843,400 | | 44,464 |
Union Pacific Corp. | 1,275,700 | | 95,257 |
| | 139,721 |
Trading Companies & Distributors - 0.1% |
Adani Enterprises Ltd. | 571,688 | | 7,196 |
TOTAL INDUSTRIALS | | 1,573,348 |
INFORMATION TECHNOLOGY - 35.1% |
Communications Equipment - 5.9% |
Acme Packet, Inc. (a) | 579,500 | | 16,377 |
Cisco Systems, Inc. (a) | 9,875,700 | | 227,832 |
DG FastChannel, Inc. (a) | 854,760 | | 32,592 |
Juniper Networks, Inc. (a) | 638,000 | | 17,724 |
Motorola, Inc. (a) | 3,811,700 | | 28,550 |
QUALCOMM, Inc. | 5,182,400 | | 197,346 |
Research In Motion Ltd. (a) | 2,756,700 | | 158,593 |
| | 679,014 |
Computers & Peripherals - 11.1% |
Apple, Inc. (a) | 2,946,300 | | 757,927 |
Dell, Inc. (a) | 1,180,700 | | 15,632 |
Hewlett-Packard Co. | 7,541,400 | | 347,206 |
Isilon Systems, Inc. (a) | 351,700 | | 6,169 |
NetApp, Inc. (a) | 1,877,700 | | 79,427 |
SanDisk Corp. (a) | 795,187 | | 34,750 |
STEC, Inc. (a) | 230,500 | | 3,596 |
Western Digital Corp. (a) | 1,290,400 | | 34,054 |
| | 1,278,761 |
Electronic Equipment & Components - 0.8% |
Agilent Technologies, Inc. (a) | 3,466,655 | | 96,824 |
Internet Software & Services - 5.1% |
Akamai Technologies, Inc. (a) | 2,064,300 | | 79,187 |
Baidu.com, Inc. sponsored ADR (a) | 668,800 | | 54,447 |
Google, Inc. Class A (a) | 760,900 | | 368,922 |
Monster Worldwide, Inc. (a)(d) | 2,970,649 | | 40,757 |
Common Stocks - continued |
| Shares | | Value (000s) |
INFORMATION TECHNOLOGY - continued |
Internet Software & Services - continued |
OpenTable, Inc. (a)(d) | 337,051 | | $ 15,066 |
Rackspace Hosting, Inc. (a) | 1,459,800 | | 27,298 |
| | 585,677 |
IT Services - 3.1% |
Alliance Data Systems Corp. (a) | 202,400 | | 11,634 |
Cognizant Technology Solutions Corp. Class A (a) | 1,139,800 | | 62,187 |
MasterCard, Inc. Class A | 749,100 | | 157,341 |
Visa, Inc. Class A | 1,780,400 | | 130,592 |
| | 361,754 |
Office Electronics - 0.4% |
Xerox Corp. | 5,282,200 | | 51,449 |
Semiconductors & Semiconductor Equipment - 4.3% |
Altera Corp. | 2,393,000 | | 66,334 |
ARM Holdings PLC sponsored ADR | 409,500 | | 6,327 |
Avago Technologies Ltd. | 1,641,700 | | 35,723 |
Broadcom Corp. Class A | 2,672,400 | | 96,287 |
Cree, Inc. (a) | 200,500 | | 14,203 |
First Solar, Inc. (a) | 130,400 | | 16,359 |
Intel Corp. | 1,109,217 | | 22,850 |
Lam Research Corp. (a) | 1,911,700 | | 80,655 |
Marvell Technology Group Ltd. (a) | 7,311,000 | | 109,080 |
MEMC Electronic Materials, Inc. (a) | 2,111,200 | | 20,183 |
Silicon Laboratories, Inc. (a) | 461,100 | | 18,467 |
Trina Solar Ltd. ADR (a)(d) | 539,700 | | 11,733 |
| | 498,201 |
Software - 4.4% |
Autonomy Corp. PLC (a) | 324,900 | | 8,382 |
Check Point Software Technologies Ltd. (a) | 1,523,600 | | 51,833 |
Citrix Systems, Inc. (a) | 630,500 | | 34,690 |
Informatica Corp. (a) | 1,193,700 | | 35,966 |
Microsoft Corp. | 6,000,600 | | 154,875 |
Nuance Communications, Inc. (a) | 1,889,000 | | 31,187 |
Oracle Corp. | 1,900,500 | | 44,928 |
QLIK Technologies, Inc. | 484,100 | | 6,957 |
Red Hat, Inc. (a) | 2,023,300 | | 65,049 |
Salesforce.com, Inc. (a) | 158,800 | | 15,713 |
SuccessFactors, Inc. (a) | 199,100 | | 4,044 |
Common Stocks - continued |
| Shares | | Value (000s) |
INFORMATION TECHNOLOGY - continued |
Software - continued |
TeleNav, Inc. | 125,000 | | $ 680 |
VMware, Inc. Class A (a) | 618,500 | | 47,952 |
| | 502,256 |
TOTAL INFORMATION TECHNOLOGY | | 4,053,936 |
MATERIALS - 3.9% |
Chemicals - 2.5% |
Asian Paints India Ltd. | 44,645 | | 2,506 |
CF Industries Holdings, Inc. | 401,400 | | 32,590 |
Dow Chemical Co. | 3,468,700 | | 94,800 |
Monsanto Co. | 1,943,700 | | 112,424 |
The Mosaic Co. | 1,054,900 | | 50,266 |
| | 292,586 |
Containers & Packaging - 0.8% |
Ball Corp. | 220,500 | | 12,842 |
Owens-Illinois, Inc. (a) | 1,020,762 | | 28,224 |
Pactiv Corp. (a) | 1,524,300 | | 46,369 |
| | 87,435 |
Metals & Mining - 0.6% |
Allegheny Technologies, Inc. | 155,800 | | 7,418 |
Carpenter Technology Corp. | 218,500 | | 7,637 |
Freeport-McMoRan Copper & Gold, Inc. | 584,600 | | 41,822 |
Titanium Metals Corp. (a) | 369,600 | | 8,183 |
| | 65,060 |
TOTAL MATERIALS | | 445,081 |
TELECOMMUNICATION SERVICES - 1.1% |
Diversified Telecommunication Services - 0.0% |
China Unicom (Hong Kong) Ltd. sponsored ADR | 423,500 | | 5,777 |
Wireless Telecommunication Services - 1.1% |
NII Holdings, Inc. (a) | 306,000 | | 11,463 |
Reliance Communication Ltd. | 887,130 | | 3,418 |
Common Stocks - continued |
| Shares | | Value (000s) |
TELECOMMUNICATION SERVICES - continued |
Wireless Telecommunication Services - continued |
SOFTBANK CORP. | 714,900 | | $ 21,383 |
Sprint Nextel Corp. (a) | 19,819,900 | | 90,577 |
| | 126,841 |
TOTAL TELECOMMUNICATION SERVICES | | 132,618 |
TOTAL COMMON STOCKS (Cost $9,668,137) | 11,469,398 |
Nonconvertible Preferred Stocks - 0.2% |
| | | |
CONSUMER DISCRETIONARY - 0.2% |
Automobiles - 0.2% |
Volkswagen AG | 170,700 | | 18,090 |
TOTAL NONCONVERTIBLE PREFERRED STOCKS (Cost $18,090) | 18,090 |
Money Market Funds - 1.1% |
| | | |
Fidelity Cash Central Fund, 0.24% (b) | 28,827,628 | | 28,828 |
Fidelity Securities Lending Cash Central Fund, 0.27% (b)(c) | 96,631,450 | | 96,631 |
TOTAL MONEY MARKET FUNDS (Cost $125,459) | 125,459 |
TOTAL INVESTMENT PORTFOLIO - 100.6% (Cost $9,811,686) | | 11,612,947 |
NET OTHER ASSETS (LIABILITIES) - (0.6)% | | (64,727) |
NET ASSETS - 100% | $ 11,548,220 |
Legend |
(a) Non-income producing |
(b) Affiliated fund that is available only to investment companies and other accounts managed by Fidelity Investments. The rate quoted is the annualized seven-day yield of the fund at period end. A complete unaudited listing of the fund's holdings as of its most recent quarter end is available upon request. |
(c) Investment made with cash collateral received from securities on loan. |
(d) Security or a portion of the security is on loan at period end. |
(e) Affiliated company |
(f) Security exempt from registration under Rule 144A of the Securities Act of 1933. These securities may be resold in transactions exempt from registration, normally to qualified institutional buyers. At the end of the period, the value of these securities amounted to $6,774,000 or 0.1% of net assets. |
Affiliated Central Funds |
Information regarding fiscal year to date income earned by the Fund from investments in Fidelity Central Funds is as follows: |
Fund | Income earned
(Amounts in thousands) |
Fidelity Cash Central Fund | $ 33 |
Fidelity Securities Lending Cash Central Fund | 263 |
Total | $ 296 |
Other Affiliated Issuers |
An affiliated company is a company in which the fund has ownership of at least 5% of the voting securities. Fiscal year to date transactions with companies which are or were affiliates are as follows: |
Affiliate
(Amounts in thousands) | Value, beginning of period | Purchases | Sales Proceeds | Dividend Income | Value,
end of
period |
Furniture Brands International, Inc. | $ 19,567 | $ 202 | $ 12,871 | $ - | $ 16,160 |
Total | $ 19,567 | $ 202 | $ 12,871 | $ - | $ 16,160 |
Other Information |
The following is a summary of the inputs used, as of July 31, 2010, involving the Fund's assets and liabilities carried at fair value. The inputs or methodology used for valuing securities may not be an indication of the risk associated with investing in those securities. For more information on valuation inputs, and their aggregation into the levels used in the tables below, please refer to the Security Valuation section in the accompanying Notes to Financial Statements. |
Valuation Inputs at Reporting Date: |
Description
(Amounts in thousands) | Total | Level 1 | Level 2 | Level 3 |
Investments in Securities: | | | | |
Equities: | | | | |
Consumer Discretionary | $ 1,736,002 | $ 1,736,002 | $ - | $ - |
Consumer Staples | 934,595 | 934,595 | - | - |
Energy | 854,382 | 854,382 | - | - |
Financials | 898,439 | 864,518 | 27,147 | 6,774 |
Health Care | 859,087 | 859,087 | - | - |
Industrials | 1,573,348 | 1,573,348 | - | - |
Information Technology | 4,053,936 | 4,053,936 | - | - |
Materials | 445,081 | 445,081 | - | - |
Telecommunication Services | 132,618 | 132,618 | - | - |
Money Market Funds | 125,459 | 125,459 | - | - |
Total Investments in Securities: | $ 11,612,947 | $ 11,579,026 | $ 27,147 | $ 6,774 |
The following is a reconciliation of Investments in Securities for which Level 3 inputs were used in determining value: |
(Amounts in thousands) | |
Investments in Securities: | |
Beginning Balance | $ - |
Total Realized Gain (Loss) | (74) |
Total Unrealized Gain (Loss) | (175) |
Cost of Purchases | 8,882 |
Proceeds of Sales | (1,859) |
Amortization/Accretion | - |
Transfers in to Level 3 | - |
Transfers out of Level 3 | - |
Ending Balance | $ 6,774 |
The change in unrealized gain (loss) for the period attributable to Level 3 securities held at July 31, 2010 | $ (175) |
The information used in the above reconciliation represents fiscal year to date activity for any Investments in Securities identified as using Level 3 inputs at either the beginning or the end of the current fiscal period. Transfers in or out of Level 3 represent the beginning value of any Security or Instrument where a change in the pricing level occurred from the beginning to the end of the period. The cost of purchases and the proceeds of sales may include securities received or delivered through corporate actions or exchanges. Realized and unrealized gains (losses) disclosed in the reconciliation are included in Net Gain (Loss) on the Fund's Statement of Operations. |
Income Tax Information |
At July 31, 2010, the Fund had a capital loss carryforward of approximately $1,028,059,000 of which $671,371,000 and $356,688,000 will expire on July 31, 2017 and 2018, respectively. Capital loss carryforwards are only available to offset future capital gains of the Fund to the extent provided by regulations and may be limited. |
See accompanying notes which are an integral part of the financial statements.
Annual Report
Statement of Assets and Liabilities
Amounts in thousands (except per-share amounts) | July 31, 2010 |
| | |
Assets | | |
Investment in securities, at value (including securities loaned of $94,422) - See accompanying schedule: Unaffiliated issuers (cost $9,661,717) | $ 11,471,328 | |
Fidelity Central Funds (cost $125,459) | 125,459 | |
Other affiliated issuers (cost $24,510) | 16,160 | |
Total Investments (cost $9,811,686) | | $ 11,612,947 |
Foreign currency held at value (cost $300) | | 291 |
Receivable for investments sold | | 247,977 |
Receivable for fund shares sold | | 10,336 |
Dividends receivable | | 3,356 |
Distributions receivable from Fidelity Central Funds | | 32 |
Other receivables | | 1,561 |
Total assets | | 11,876,500 |
| | |
Liabilities | | |
Payable for investments purchased | $ 206,290 | |
Payable for fund shares redeemed | 16,071 | |
Accrued management fee | 6,463 | |
Other affiliated payables | 2,267 | |
Other payables and accrued expenses | 558 | |
Collateral on securities loaned, at value | 96,631 | |
Total liabilities | | 328,280 |
| | |
Net Assets | | $ 11,548,220 |
Net Assets consist of: | | |
Paid in capital | | $ 10,852,889 |
Undistributed net investment income | | 2,062 |
Accumulated undistributed net realized gain (loss) on investments and foreign currency transactions | | (1,107,768) |
Net unrealized appreciation (depreciation) on investments and assets and liabilities in foreign currencies | | 1,801,037 |
Net Assets | | $ 11,548,220 |
See accompanying notes which are an integral part of the financial statements.
Annual Report
Financial Statements - continued
Statement of Assets and Liabilities - continued
Amounts in thousands (except per-share amounts) | July 31, 2010 |
| | |
Blue Chip Growth:
Net Asset Value, offering price and redemption price per share ($10,295,210 ÷ 273,613 shares) | | $ 37.63 |
| | |
Class K:
Net Asset Value, offering price and redemption price per share ($931,601 ÷ 24,735 shares) | | $ 37.66 |
| | |
Class F:
Net Asset Value, offering price and redemption price per share ($321,409 ÷ 8,528 shares) | | $ 37.69 |
See accompanying notes which are an integral part of the financial statements.
Annual Report
Statement of Operations
Amounts in thousands | Year ended July 31, 2010 |
| | |
Investment Income | | |
Dividends | | $ 119,693 |
Interest | | 1 |
Income from Fidelity Central Funds | | 296 |
Total income | | 119,990 |
| | |
Expenses | | |
Management fee
Basic fee | $ 65,083 | |
Performance adjustment | 13,734 | |
Transfer agent fees | 27,053 | |
Accounting and security lending fees | 1,459 | |
Custodian fees and expenses | 297 | |
Independent trustees' compensation | 67 | |
Registration fees | 121 | |
Audit | 93 | |
Legal | 65 | |
Interest | 11 | |
Miscellaneous | 190 | |
Total expenses before reductions | 108,173 | |
Expense reductions | (1,805) | 106,368 |
Net investment income (loss) | | 13,622 |
Realized and Unrealized Gain (Loss) Net realized gain (loss) on: | | |
Investment securities: | | |
Unaffiliated issuers | 1,074,390 | |
Other affiliated issuers | (18,675) | |
Foreign currency transactions | (690) | |
Capital gain distributions from Fidelity Central Funds | 3 | |
Total net realized gain (loss) | | 1,055,028 |
Change in net unrealized appreciation (depreciation) on: Investment securities (net of increase in deferred foreign taxes of $49) | 793,523 | |
Assets and liabilities in foreign currencies | (176) | |
Total change in net unrealized appreciation (depreciation) | | 793,347 |
Net gain (loss) | | 1,848,375 |
Net increase (decrease) in net assets resulting from operations | | $ 1,861,997 |
See accompanying notes which are an integral part of the financial statements.
Annual Report
Financial Statements - continued
Statement of Changes in Net Assets
Amounts in thousands | Year ended
July 31,
2010 | Year ended
July 31,
2009 |
Increase (Decrease) in Net Assets | | |
Operations | | |
Net investment income (loss) | $ 13,622 | $ 90,600 |
Net realized gain (loss) | 1,055,028 | (2,127,104) |
Change in net unrealized appreciation (depreciation) | 793,347 | (205,346) |
Net increase (decrease) in net assets resulting
from operations | 1,861,997 | (2,241,850) |
Distributions to shareholders from net investment income | (57,433) | (99,426) |
Distributions to shareholders from net realized gain | - | (242,439) |
Total distributions | (57,433) | (341,865) |
Share transactions - net increase (decrease) | (538,131) | (483,151) |
Total increase (decrease) in net assets | 1,266,433 | (3,066,866) |
| | |
Net Assets | | |
Beginning of period | 10,281,787 | 13,348,653 |
End of period (including undistributed net investment income of $2,062 and undistributed net investment income of $39,489, respectively) | $ 11,548,220 | $ 10,281,787 |
See accompanying notes which are an integral part of the financial statements.
Annual Report
Financial Highlights - Blue Chip Growth
Years ended July 31, | 2010 | 2009 | 2008 | 2007 | 2006 |
Selected Per-Share Data | | | | | |
Net asset value, beginning of period | $ 31.97 | $ 39.06 | $ 46.88 | $ 41.54 | $ 42.60 |
Income from Investment Operations | | | | | |
Net investment income (loss) B | .04 | .27 | .35 | .32 | .23 |
Net realized and unrealized gain (loss) | 5.80 | (6.36) | (2.89) | 6.19 | (1.06) |
Total from investment operations | 5.84 | (6.09) | (2.54) | 6.51 | (.83) |
Distributions from net investment income | (.18) | (.29) | (.33) | (.24) | (.23) |
Distributions from net realized gain | - | (.71) | (4.95) | (.93) | - |
Total distributions | (.18) | (1.00) | (5.28) | (1.17) | (.23) |
Net asset value, end of period | $ 37.63 | $ 31.97 | $ 39.06 | $ 46.88 | $ 41.54 |
Total Return A | 18.29% | (15.85)% | (6.30)% | 16.02% | (1.97)% |
Ratios to Average Net Assets C, E | | | | | |
Expenses before reductions | .94% | .76% | .58% | .60% | .63% |
Expenses net of fee waivers, if any | .94% | .76% | .58% | .60% | .63% |
Expenses net of all reductions | .93% | .76% | .57% | .59% | .61% |
Net investment income (loss) | .10% | .93% | .81% | .72% | .54% |
Supplemental Data | | | | | |
Net assets, end of period (in millions) | $ 10,295 | $ 9,691 | $ 13,349 | $ 18,616 | $ 19,571 |
Portfolio turnover rate D | 135% | 134% | 82% | 87% | 48% |
A Total returns would have been lower had certain expenses not been reduced during the periods shown.
B Calculated based on average shares outstanding during the period.
C Fees and expenses of the underlying Fidelity Central Funds are not included in the Fund's expense ratio. The Fund indirectly bears its proportionate share of the expenses of any underlying Fidelity Central Funds.
D Amount does not include the portfolio activity of any underlying Fidelity Central Funds.
E Expense ratios reflect operating expenses of the class. Expenses before reductions do not reflect amounts reimbursed by the investment adviser or reductions from brokerage service arrangements or reductions from other expense offset arrangements and do not represent the amount paid by the class during periods when reimbursements or reductions occur. Expenses net of fee waivers reflect expenses after reimbursement by the investment adviser but prior to reductions from brokerage service arrangements or other expense offset arrangements. Expenses net of all reductions represent the net expenses paid by the class.
See accompanying notes which are an integral part of the financial statements.
Annual Report
Financial Highlights - Class K
Years ended July 31, | 2010 | 2009 | 2008 G |
Selected Per-Share Data | | | |
Net asset value, beginning of period | $ 32.01 | $ 39.07 | $ 41.81 |
Income from Investment Operations | | | |
Net investment income (loss) D | .11 | .32 | .10 |
Net realized and unrealized gain (loss) | 5.79 | (6.33) | (2.84) |
Total from investment operations | 5.90 | (6.01) | (2.74) |
Distributions from net investment income | (.25) | (.34) | - |
Distributions from net realized gain | - | (.71) | - |
Total distributions | (.25) | (1.05) | - |
Net asset value, end of period | $ 37.66 | $ 32.01 | $ 39.07 |
Total Return B, C | 18.48% | (15.61)% | (6.55)% |
Ratios to Average Net Assets E, H | | | |
Expenses before reductions | .75% | .53% | .41% A |
Expenses net of fee waivers, if any | .75% | .53% | .41% A |
Expenses net of all reductions | .74% | .52% | .41% A |
Net investment income (loss) | .30% | 1.16% | 1.09% A |
Supplemental Data | | | |
Net assets, end of period (000 omitted) | $ 931,601 | $ 590,673 | $ 93 |
Portfolio turnover rate F | 135% | 134% | 82% |
A Annualized
B Total returns for periods of less than one year are not annualized.
C Total returns would have been lower had certain expenses not been reduced during the periods shown.
D Calculated based on average shares outstanding during the period.
E Fees and expenses of the underlying Fidelity Central Funds are not included in the Fund's expense ratio. The Fund indirectly bears its proportionate share of the expenses of any underlying Fidelity Central Funds.
F Amount does not include the portfolio activity of any underlying Fidelity Central Funds.
G For the period May 9, 2008 (commencement of sale of shares) to July 31, 2008.
H Expense ratios reflect operating expenses of the class. Expenses before reductions do not reflect amounts reimbursed by the investment adviser or reductions from brokerage service arrangements or reductions from other expense offset arrangements and do not represent the amount paid by the class during periods when reimbursements or reductions occur. Expense ratios before reductions for start-up periods may not be representative of longer-term operating periods. Expenses net of fee waivers reflect expenses after reimbursement by the investment adviser but prior to reductions from brokerage service arrangements or other expense offset arrangements. Expenses net of all reductions represent the net expenses paid by the class.
See accompanying notes which are an integral part of the financial statements.
Annual Report
Financial Highlights - Class F
Years ended July 31, | 2010 | 2009 H |
Selected Per-Share Data | | |
Net asset value, beginning of period | $ 31.98 | $ 29.16 |
Income from Investment Operations | | |
Net investment income (loss) D | .13 | - J |
Net realized and unrealized gain (loss) | 5.80 | 2.82 G |
Total from investment operations | 5.93 | 2.82 |
Distributions from net investment income | (.22) | - |
Net asset value, end of period | $ 37.69 | $ 31.98 |
Total Return B, C | 18.59% | 9.67% |
Ratios to Average Net Assets E, I | | |
Expenses before reductions | .70% | .51% A |
Expenses net of fee waivers, if any | .70% | .51% A |
Expenses net of all reductions | .68% | .51% A |
Net investment income (loss) | .35% | (.05)% A |
Supplemental Data | | |
Net assets, end of period (000 omitted) | $ 321,409 | $ 261 |
Portfolio turnover rate F | 135% | 134% |
A Annualized
B Total returns for periods of less than one year are not annualized.
C Total returns would have been lower had certain expenses not been reduced during the periods shown.
D Calculated based on average shares outstanding during the period.
E Fees and expenses of the underlying Fidelity Central Funds are not included in the Fund's expense ratio. The Fund indirectly bears its proportionate share of the expenses of any underlying Fidelity Central Funds.
F Amount does not include the portfolio activity of any underlying Fidelity Central Funds.
G The amount shown for a share outstanding does not correspond with the aggregate net gain (loss) on investments for the period due to the timing of sales and repurchases of shares in relation to fluctuating market values of the investments of the Fund.
H For the period June 26, 2009 (commencement of sale of shares) to July 31, 2009.
I Expense ratios reflect operating expenses of the class. Expenses before reductions do not reflect amounts reimbursed by the investment adviser or reductions from brokerage service arrangements or reductions from other expense offset arrangements and do not represent the amount paid by the class during periods when reimbursements or reductions occur. Expense ratios before reductions for start-up periods may not be representative of longer-term operating periods. Expenses net of fee waivers reflect expenses after reimbursement by the investment adviser but prior to reductions from brokerage service arrangements or other expense offset arrangements. Expenses net of all reductions represent the net expenses paid by the class.
J Amount represents less than $.01 per share.
See accompanying notes which are an integral part of the financial statements.
Annual Report
Notes to Financial Statements
For the period ended July 31, 2010
1. Organization.
Fidelity Blue Chip Growth Fund (the Fund) is a fund of Fidelity Securities Fund (the Trust) and is authorized to issue an unlimited number of shares. The Trust is registered under the Investment Company Act of 1940, as amended (the 1940 Act), as an open-end management investment company organized as a Massachusetts business trust. The Fund offers Blue Chip Growth, Class K and Class F shares, each of which has equal rights as to assets and voting privileges. Each class has exclusive voting rights with respect to matters that affect that class. After the commencement of Class K, the Fund began offering conversion privileges between Blue Chip Growth and Class K to eligible shareholders of Blue Chip Growth. In order to disclose class level financial information dollar amounts presented in the notes are unrounded. Class F shares of the Fund are only available for purchase by mutual funds for which Fidelity Management & Research Company (FMR) or an affiliate serves as investment manager. Investment income, realized and unrealized capital gains and losses, the common expenses of the Fund, and certain fund-level expense reductions, if any, are allocated on a pro-rata basis to each class based on the relative net assets of each class to the total net assets of the Fund. Each class differs with respect to transfer agent fees incurred. Certain expense reductions also differ by class.
2. Investments in Fidelity Central Funds.
The Fund may invest in Fidelity Central Funds, which are open-end investment companies available only to other investment companies and accounts managed by FMR and its affiliates. The Fund's Schedule of Investments lists each of the Fidelity Central Funds held as of period end, if any, as an investment of the Fund, but does not include the underlying holdings of each Fidelity Central Fund. As an Investing Fund, the Fund indirectly bears its proportionate share of the expenses of the underlying Fidelity Central Funds.
The Money Market Central Funds seek preservation of capital and current income and are managed by Fidelity Investments Money Management, Inc. (FIMM), an affiliate of FMR.
A complete unaudited list of holdings for each Fidelity Central Fund is available upon request or at the Securities and Exchange Commission (the SEC) web site at www.sec.gov. In addition, the financial statements of the Fidelity Central Funds which are not covered by the Fund's Report of Independent Registered Public Accounting Firm, are available on the SEC web site or upon request.
Annual Report
Notes to Financial Statements - continued
3. Significant Accounting Policies.
The financial statements have been prepared in conformity with accounting principles generally accepted in the United States of America (GAAP), which require management to make certain estimates and assumptions at the date of the financial statements. Actual results could differ from those estimates. The following summarizes the significant accounting policies of the Fund:
Security Valuation. Investments are valued as of 4:00 p.m. Eastern time on the last calendar day of the period. The Fund uses independent pricing services approved by the Board of Trustees to value its investments. When current market prices or quotations are not readily available or reliable, valuations may be determined in good faith in accordance with procedures adopted by the Board of Trustees. Factors used in determining value may include market or security specific events. The frequency with which these procedures are used cannot be predicted and they may be utilized to a significant extent. The value used for net asset value (NAV) calculation under these procedures may differ from published prices for the same securities.
The Fund categorizes the inputs to valuation techniques used to value its investments into a disclosure hierarchy consisting of three levels as shown below.
Level 1 - quoted prices in active markets for identical investments
Level 2 - other significant observable inputs (including quoted prices for similar investments, interest rates, prepayment speeds, etc.)
Level 3 - unobservable inputs (including the fund's own assumptions based on the best information available)
Changes in valuation techniques may result in transfers in or out of an assigned level within the disclosure hierarchy. The aggregate value of investments by input level, as of July 31, 2010, as well as a roll forward of Level 3 securities, is included at the end of the Fund's Schedule of Investments. Valuation techniques used to value the Fund's investments by major category are as follows.
Equity securities, including restricted securities, for which market quotations are readily available, are valued at the last reported sale price or official closing price as reported by an independent pricing service on the primary market or exchange on which they are traded and are categorized as Level 1 in the hierarchy. In the event there were no sales during the day or closing prices are not available, securities are valued at the last quoted bid price or may be valued using the last available price and are generally categorized as Level 2 in the hierarchy. For foreign equity securities, when significant market or security specific events arise, comparisons to the valuation of American Depositary Receipts (ADRs), futures contracts, Exchange-traded funds (ETFs) and certain indexes as well as
Annual Report
3. Significant Accounting Policies - continued
Security Valuation - continued
quoted prices for similar securities are used and are categorized as Level 2 in the hierarchy in these circumstances. Utilizing these techniques may result in transfers between Level 1 and Level 2. For restricted equity securities and private placements where observable inputs are limited, assumptions about market activity and risk are used and are categorized as Level 3 in the hierarchy.
Investments in open-end mutual funds, including the Fidelity Central Funds, are valued at their closing net asset value each business day and are categorized as Level 1 in the hierarchy. Short-term securities with remaining maturities of sixty days or less for which quotations are not readily available are valued at amortized cost, which approximates fair value and are categorized as Level 2 in the hierarchy.
Foreign Currency. The Fund uses foreign currency contracts to facilitate transactions in foreign-denominated securities. Gains and losses from these transactions may arise from changes in the value of the foreign currency or if the counterparties do not perform under the contracts' terms.
Foreign-denominated assets, including investment securities, and liabilities are translated into U.S. dollars at the exchange rate at period end. Purchases and sales of investment securities, income and dividends received and expenses denominated in foreign currencies are translated into U.S. dollars at the exchange rate in effect on the transaction date.
The effects of exchange rate fluctuations on investments are included with the net realized and unrealized gain (loss) on investment securities. Other foreign currency transactions resulting in realized and unrealized gain (loss) are disclosed separately.
Investment Transactions and Income. For financial reporting purposes, the Fund's investment holdings and NAV include trades executed through the end of the last business day of the period. The NAV per share for processing shareholder transactions is calculated as of the close of business of the New York Stock Exchange (NYSE), normally 4:00 p.m. Eastern time and includes trades executed through the end of the prior business day. Gains and losses on securities sold are determined on the basis of identified cost and may include proceeds received from litigation. Dividend income is recorded on the ex-dividend date, except for certain dividends from foreign securities where the ex-dividend date may have passed, which are recorded as soon as the Fund is informed of the ex-dividend date. Non-cash dividends included in dividend income, if any, are recorded at the fair market value of the securities received. Distributions received on securities that represent a return of capital or capital gain are recorded as a reduction of cost of investments and/or as a realized gain. The Fund estimates the components of distributions received that may be considered return of capital distributions or capital
Annual Report
Notes to Financial Statements - continued
3. Significant Accounting Policies - continued
Investment Transactions and Income - continued
gain distributions. Interest income and distributions from the Fidelity Central Funds are accrued as earned. Interest income includes coupon interest and amortization of premium and accretion of discount on debt securities. Investment income is recorded net of foreign taxes withheld where recovery of such taxes is uncertain.
Expenses. Most expenses of the Trust can be directly attributed to a fund. Expenses which cannot be directly attributed are apportioned amongst each fund in the Trust. Expense estimates are accrued in the period to which they relate and adjustments are made when actual amounts are known.
Deferred Trustee Compensation. Under a Deferred Compensation Plan (the Plan), independent Trustees may elect to defer receipt of a portion of their annual compensation. Deferred amounts are invested in a cross-section of Fidelity funds, are marked-to-market and remain in the Fund until distributed in accordance with the Plan. The investment of deferred amounts and the offsetting payable to the Trustees are included in the accompanying Statement of Assets and Liabilities.
Income Tax Information and Distributions to Shareholders. Each year the Fund intends to qualify as a regulated investment company, including distributing substantially all of its taxable income and realized gains under Subchapter M of the Internal Revenue Code and filing its U.S. federal tax return. As a result, no provision for income taxes is required. As of July 31, 2010, the Fund did not have any unrecognized tax benefits in the accompanying financial statements. A fund's federal tax return is subject to examination by the Internal Revenue Service (IRS) for a period of three years. Foreign taxes are provided for based on the Fund's understanding of the tax rules and rates that exist in the foreign markets in which it invests. The Fund is subject to a tax imposed on short term capital gains on securities of certain issuers domiciled in India. The Fund records an estimated deferred tax liability included in Other payables and accrued expenses in the accompanying Statement of Assets & Liabilities for net unrealized gains on these securities in an amount that would be payable if the securities were disposed of at period end.
Distributions are recorded on the ex-dividend date. Income dividends and capital gain distributions are declared separately for each class. Income and capital gain distributions are determined in accordance with income tax regulations, which may differ from GAAP.
Capital accounts within the financial statements are adjusted for permanent book-tax differences. These adjustments have no impact on net assets or the results of operations. Temporary book-tax differences will reverse in a subsequent period.
Annual Report
3. Significant Accounting Policies - continued
Income Tax Information and Distributions to Shareholders - continued
Book-tax differences are primarily due to the short-term gain distributions from the Fidelity Central Funds, foreign currency transactions, partnerships, deferred trustees compensation, capital loss carryforwards and losses due to deferred wash sales and excise tax regulations.
The federal tax cost of investment securities and unrealized appreciation (depreciation) as of period end were as follows:
Gross unrealized appreciation | $ 2,014,864,694 |
Gross unrealized depreciation | (293,312,547) |
Net unrealized appreciation (depreciation) | $ 1,721,552,147 |
| |
Tax Cost | $ 9,891,394,551 |
The tax-based components of distributable earnings as of period end were as follows:
Undistributed ordinary income | $ 2,446,191 |
Capital loss carryforward | $ (1,028,058,871) |
Net unrealized appreciation (depreciation) | $ 1,721,377,970 |
The tax character of distributions paid was as follows:
| July 31, 2010 | July 31, 2009 |
Ordinary Income | $ 57,433,084 | $ 99,425,655 |
Long-term Capital Gains | - | 242,439,162 |
Total | $ 57,433,084 | $ 341,864,817 |
4. Operating Policies.
Restricted Securities. The Fund may invest in securities that are subject to legal or contractual restrictions on resale. These securities generally may be resold in transactions exempt from registration or to the public if the securities are registered. Disposal of these securities may involve time-consuming negotiations and expense, and prompt sale at an acceptable price may be difficult. Information regarding restricted securities is included at the end of the Fund's Schedule of Investments.
5. Purchases and Sales of Investments.
Purchases and sales of securities, other than short-term securities, aggregated $15,348,328,246 and $15,969,181,366, respectively.
Annual Report
Notes to Financial Statements - continued
6. Fees and Other Transactions with Affiliates.
Management Fee. FMR and its affiliates provide the Fund with investment management related services for which the Fund pays a monthly management fee. The management fee is the sum of an individual fund fee rate that is based on an annual rate of .30% of the Fund's average net assets and a group fee rate that averaged .26% during the period. The group fee rate is based upon the average net assets of all the mutual funds advised by FMR. The group fee rate decreases as assets under management increase and increases as assets under management decrease. In addition, the management fee is subject to a performance adjustment (up to a maximum of ± .20% of the Fund's average net assets over a 36 month performance period). The upward or downward adjustment to the management fee is based on the relative investment performance of the retail class of the Fund, Blue Chip Growth as compared to an appropriate benchmark index. For the period, the total annual management fee rate, including the performance adjustment, was .68% of the Fund's average net assets.
Transfer Agent Fees. Fidelity Investments Institutional Operations Company, Inc. (FIIOC), an affiliate of FMR, is the transfer, dividend disbursing and shareholder servicing agent for each class of the Fund. FIIOC receives account fees and asset-based fees that vary according to the account size and type of account of the shareholders of Blue Chip Growth. FIIOC receives an asset-based fee of Class K's average net assets. FIIOC receives no fees for providing transfer agency services to Class F. FIIOC pays for typesetting, printing and mailing of shareholder reports, except proxy statements. For the period, the total transfer agent fees paid by each applicable class were as follows:
| Amount | % of
Average
Net Assets |
Blue Chip Growth | $ 26,634,828 | .25 |
Class K | 418,549 | .05 |
| $ 27,053,377 | |
Accounting and Security Lending Fees. Fidelity Service Company, Inc. (FSC), an affiliate of FMR, maintains the Fund's accounting records. The accounting fee is based on the level of average net assets for the month. Under a separate contract, FSC administers the security lending program. The security lending fee is based on the number and duration of lending transactions.
Brokerage Commissions. The Fund placed a portion of its portfolio transactions with brokerage firms which are affiliates of the investment adviser. The commissions paid to these affiliated firms were $364,789 for the period.
Annual Report
6. Fees and Other Transactions with Affiliates - continued
Interfund Lending Program. Pursuant to an Exemptive Order issued by the SEC, the Fund, along with other registered investment companies having management contracts with FMR, may participate in an interfund lending program. This program provides an alternative credit facility allowing the funds to borrow from, or lend money to, other participating affiliated funds. At period end, there were no interfund loans outstanding. The Fund's activity in this program during the period for which loans were outstanding was as follows:
Borrower or Lender | Average Daily
Loan Balance | Weighted Average Interest Rate | Interest
Expense |
Borrower | $ 12,993,271 | .43% | $ 10,743 |
7. Committed Line of Credit.
The Fund participates with other funds managed by FMR in a $3.75 billion credit facility (the "line of credit") to be utilized for temporary or emergency purposes to fund shareholder redemptions or for other short-term liquidity purposes. The Fund has agreed to pay commitment fees on its pro-rata portion of the line of credit, which amounted to $45,855 and is reflected in Miscellaneous expenses on the Statement of Operations. During the period, there were no borrowings on this line of credit.
8. Security Lending.
The Fund lends portfolio securities from time to time in order to earn additional income. On the settlement date of the loan, the Fund receives collateral (in the form of U.S. Treasury obligations, letters of credit and/or cash) against the loaned securities and maintains collateral in an amount not less than 100% of the market value of the loaned securities during the period of the loan. The market value of the loaned securities is determined at the close of business of the Fund and any additional required collateral is delivered to the Fund on the next business day. If the borrower defaults on its obligation to return the securities loaned because of insolvency or other reasons, a fund could experience delays and costs in recovering the securities loaned or in gaining access to the collateral. Any cash collateral received is invested in the Fidelity Securities Lending Cash Central Fund. The value of loaned securities and cash collateral at period end are disclosed on the Fund's Statement of Assets and Liabilities. Security lending income represents the income earned on investing cash collateral, less fees and expenses associated with the loan, plus any premium payments that may be received on the loan of certain types of securities. Security lending income is presented in the Statement of Operations as a component of income from Fidelity Central Funds. Net income from lending portfolio securities during the period amounted to $262,621.
Annual Report
Notes to Financial Statements - continued
9. Bank Borrowings.
The Fund is permitted to have bank borrowings for temporary or emergency purposes to fund shareholder redemptions. The Fund has established borrowing arrangements with certain banks. The interest rate on the borrowings is the bank's base rate, as revised from time to time. The average daily loan balance during the period for which loans were outstanding amounted to $6,248,000. The weighted average interest rate was .64%. The interest expense amounted to $111 under the bank borrowing program. At period end, there were no bank borrowings outstanding.
10. Expense Reductions.
Many of the brokers with whom FMR places trades on behalf of the Fund provided services to the Fund in addition to trade execution. These services included payments of certain expenses on behalf of the Fund totaling $1,804,798 for the period.
11. Distributions to Shareholders.
Distributions to shareholders of each class were as follows:
Years ended July 31, | 2010 | 2009 A |
From net investment income | | |
Blue Chip Growth | $ 52,296,116 | $ 97,802,886 |
Class K | 4,902,403 | 1,622,768 |
Class F | 234,565 | - |
Total | $ 57,433,084 | $ 99,425,654 |
From net realized gain | | |
Blue Chip Growth | $ - | $ 242,437,464 |
Class K | - | 1,698 |
Total | $ - | $ 242,439,162 |
A Distributions for Class F are for the period June 26, 2009 (commencement of sale of shares) to July 31, 2009.
12. Share Transactions.
Transactions for each class of shares were as follows:
| Shares | Dollars |
Years ended July 31, | 2010 B | 2009 A | 2010 B | 2009 A |
Blue Chip Growth | | | | |
Shares sold | 41,698,431 | 53,777,391 | $ 1,553,486,290 | $ 1,546,167,445 |
Conversion to Class K | (604,280) | (17,667,860) | (19,980,833) | (497,271,491) |
Reinvestment of distributions | 1,459,019 | 9,381,064 | 51,337,601 | 335,422,205 |
Shares redeemed | (72,051,092) | (84,149,947) | (2,676,740,842) | (2,387,026,199) |
Net increase (decrease) | (29,497,922) | (38,659,352) | $ (1,091,897,784) | $ (1,002,708,040) |
Annual Report
12. Share Transactions - continued
| Shares | Dollars |
Years ended July 31, | 2010 B | 2009 A | 2010 B | 2009 A |
Class K | | | | |
Shares sold | 11,376,828 | 2,762,243 | $ 427,049,740 | $ 75,103,611 |
Conversion from Blue Chip Growth | 603,548 | 17,662,621 | 19,980,833 | 497,271,492 |
Reinvestment of distributions | 138,546 | 62,647 | 4,902,403 | 1,624,466 |
Shares redeemed | (5,839,246) | (2,034,629) | (218,810,942) | (54,677,110) |
Net increase (decrease) | 6,279,676 | 18,452,882 | $ 233,122,034 | $ 519,322,459 |
Class F | | | | |
Shares sold | 8,795,556 | 8,183 | $ 331,309,580 | $ 235,350 |
Reinvestment of distributions | 6,315 | - | 234,565 | - |
Shares redeemed | (281,880) | (10) | (10,900,065) | (294) |
Net increase (decrease) | 8,519,991 | 8,173 | $ 320,644,080 | $ 235,056 |
A Share transactions for Class F are for the period June 26, 2009 (commencement of sale of shares) to July 31, 2009.
B Conversion transactions for Class K and Blue Chip Growth are presented for the period August 1, 2009 through August 31, 2009.
13. Other.
The Fund's organizational documents provide former and current trustees and officers with a limited indemnification against liabilities arising in connection with the performance of their duties to the Fund. In the normal course of business, the Fund may also enter into contracts that provide general indemnifications. The Fund's maximum exposure under these arrangements is unknown as this would be dependent on future claims that may be made against the Fund. The risk of material loss from such claims is considered remote.
Annual Report
To the Trustees of Fidelity Securities Fund and Shareholders of Fidelity Blue Chip Growth Fund:
We have audited the accompanying statement of assets and liabilities of Fidelity Blue Chip Growth Fund (the Fund), a fund of Fidelity Securities Fund, including the schedule of investments, as of July 31, 2010, and the related statement of operations for the year then ended, the statement of changes in net assets for each of the two years in the period then ended, and the financial highlights for each of the five years in the period then ended. These financial statements and financial highlights are the responsibility of the Fund's management. Our responsibility is to express an opinion on these financial statements and financial highlights based on our audits.
We conducted our audits in accordance with standards of the Public Company Accounting Oversight Board (United States). Those standards require that we plan and perform the audit to obtain reasonable assurance about whether the financial statements and financial highlights are free of material misstatement. The Fund is not required to have, nor were we engaged to perform, an audit of its internal control over financial reporting. Our audits included consideration of internal control over financial reporting as a basis for designing audit procedures that are appropriate in the circumstances, but not for the purpose of expressing an opinion on the effectiveness of the Fund's internal control over financial reporting. Accordingly, we express no such opinion. An audit also includes examining, on a test basis, evidence supporting the amounts and disclosures in the financial statements, assessing the accounting principles used and significant estimates made by management, as well as evaluating the overall financial statement presentation. Our procedures included confirmation of securities owned as of July 31, 2010, by correspondence with the custodians and brokers; where replies were not received from brokers, we performed other auditing procedures. We believe that our audits provide a reasonable basis for our opinion.
In our opinion, the financial statements and financial highlights referred to above present fairly, in all material respects, the financial position of Fidelity Blue Chip Growth Fund as of July 31, 2010, the results of its operations for the year then ended, the changes in its net assets for each of the two years in the period then ended, and the financial highlights for each of the five years in the period then ended, in conformity with accounting principles generally accepted in the United States of America.
/s/ Deloitte & Touche LLP
DELOITTE & TOUCHE LLP
Boston, Massachusetts
September 13, 2010
Annual Report
The Trustees, Member of the Advisory Board, and executive officers of the trust and fund, as applicable, are listed below. The Board of Trustees governs the fund and is responsible for protecting the interests of shareholders. The Trustees are experienced executives who meet periodically throughout the year to oversee the fund's activities, review contractual arrangements with companies that provide services to the fund, oversee management of the risks associated with such activities and contractual arrangements, and review the fund's performance. Except for James C. Curvey, each of the Trustees oversees 222 funds advised by FMR or an affiliate. Mr. Curvey oversees 411 funds advised by FMR or an affiliate.
The Trustees hold office without limit in time except that (a) any Trustee may resign; (b) any Trustee may be removed by written instrument, signed by at least two-thirds of the number of Trustees prior to such removal; (c) any Trustee who requests to be retired or who has become incapacitated by illness or injury may be retired by written instrument signed by a majority of the other Trustees; and (d) any Trustee may be removed at any special meeting of shareholders by a two-thirds vote of the outstanding voting securities of the trust. Each Trustee who is not an interested person (as defined in the 1940 Act) (Independent Trustee), shall retire not later than the last day of the calendar year in which his or her 72nd birthday occurs. The Independent Trustees may waive this mandatory retirement age policy with respect to individual Trustees. The executive officers and Advisory Board Member hold office without limit in time, except that any officer and Advisory Board Member may resign or may be removed by a vote of a majority of the Trustees at any regular meeting or any special meeting of the Trustees. Except as indicated, each individual has held the office shown or other offices in the same company for the past five years.
Experience, Skills, Attributes, and Qualifications of the Fund's Trustees. The Governance and Nominating Committee has adopted a statement of policy that describes the experience, qualifications, attributes, and skills that are necessary and desirable for potential Independent Trustee candidates (Statement of Policy). The Board believes that each Trustee satisfied at the time he or she was initially elected or appointed a Trustee, and continues to satisfy, the standards contemplated by the Statement of Policy. The Governance and Nominating Committee also engages professional search firms to help identify potential Independent Trustee candidates who have the experience, qualifications, attributes, and skills consistent with the Statement of Policy. From time to time, additional criteria based on the composition and skills of the current Independent Trustees, as well as experience or skills that may be appropriate in light of future changes to board composition, business conditions, and regulatory or other developments, have also been considered by the professional search firms and the Governance and Nominating Committee. In addition, the Board takes into account the Trustees' commitment and participation in Board and committee meetings, as well as their leadership of standing and ad hoc committees throughout their tenure.
In determining that a particular Trustee was and continues to be qualified to serve as a Trustee, the Board has considered a variety of criteria, none of which, in isolation, was controlling. The Board believes that, collectively, the Trustees have balanced and diverse experience, qualifications, attributes, and skills, which allow the Board to operate effectively in governing the fund and protecting the interests of shareholders. Information about the specific experience, skills, attributes, and qualifications of each Trustee, which in each case led to the Board's conclusion that the Trustee should serve (or continue to serve) as a trustee of the fund, is provided below.
Annual Report
Board Structure and Oversight Function. Edward C. Johnson 3d is an interested person (as defined in the 1940 Act) and currently serves as Chairman. The Trustees have determined that an interested Chairman is appropriate and benefits shareholders because an interested Chairman has a personal and professional stake in the quality and continuity of services provided to the fund. Independent Trustees exercise their informed business judgment to appoint an individual of their choosing to serve as Chairman, regardless of whether the Trustee happens to be independent or a member of management. The Independent Trustees have determined that they can act independently and effectively without having an Independent Trustee serve as Chairman and that a key structural component for assuring that they are in a position to do so is for the Independent Trustees to constitute a substantial majority for the Board. The Independent Trustees also regularly meet in executive session. Ned C. Lautenbach serves as Chairman of the Independent Trustees and as such (i) acts as a liaison between the Independent Trustees and management with respect to matters important to the Independent Trustees and (ii) with management prepares agendas for Board meetings.
Fidelity funds are overseen by different Boards of Trustees. The fund's Board oversees Fidelity's equity and high income funds and another Board oversees Fidelity's investment-grade bond, money market, and asset allocation funds. The asset allocation funds may invest in Fidelity funds overseen by the fund's Board. The use of separate Boards, each with its own committee structure, allows the Trustees of each group of Fidelity funds to focus on the unique issues of the funds they oversee, including common research, investment, and operational issues. On occasion, the separate Boards establish joint committees to address issues of overlapping consequences for the Fidelity funds overseen by each Board.
The Trustees operate using a system of committees to facilitate the timely and efficient consideration of all matters of importance to the Trustees, the fund, and fund shareholders and to facilitate compliance with legal and regulatory requirements and oversight of the fund's activities and associated risks. The Board, acting through its committees, has charged FMR and its affiliates with (i) identifying events or circumstances the occurrence of which could have demonstrably adverse effects on the fund's business and/or reputation; (ii) implementing processes and controls to lessen the possibility that such events or circumstances occur or to mitigate the effects of such events or circumstances if they do occur; and (iii) creating and maintaining a system designed to evaluate continuously business and market conditions in order to facilitate the identification and implementation processes described in (i) and (ii) above. Because the day-to-day operations and activities of the fund are carried out by or through FMR, its affiliates and other service providers, the fund's exposure to risks is mitigated but not eliminated by the processes overseen by the Trustees. While each of the Board's committees has responsibility for overseeing different aspects of the fund's activities, oversight is exercised primarily through the Operations, Audit, and Compliance Committees. Appropriate personnel, including but not limited to the fund's Chief Compliance Officer (CCO), FMR's internal auditor, the independent accountants, the fund's Treasurer and portfolio management personnel, make periodic reports to the Board's committees, as appropriate. The responsibilities of each committee, including their oversight responsibilities, are described further under "Standing Committees of the Fund's Trustees."
Annual Report
Trustees and Officers - continued
The fund's Statement of Additional Information (SAI) includes more information about the Trustees. To request a free copy, call Fidelity at 1-800-835-5092.
Interested Trustees*:
Correspondence intended for each Trustee who is an interested person may be sent to Fidelity Investments, 82 Devonshire Street, Boston, Massachusetts 02109.
Name, Age; Principal Occupations and Other Relevant Experience+ |
Edward C. Johnson 3d (80) |
| Year of Election or Appointment: 1984 Mr. Johnson is Trustee and Chairman of the Board of Trustees of certain Trusts. Mr. Johnson serves as Chief Executive Officer, Chairman, and a Director of FMR LLC; Chairman and a Director of FMR; Chairman and a Director of Fidelity Research & Analysis Company (FRAC); Chairman and a Director of Fidelity Investments Money Management, Inc.; and Chairman and a Director of FMR Co., Inc. In addition, Mr. Johnson serves as Chairman and Director of FIL Limited. Previously, Mr. Johnson served as President of FMR LLC (2006-2007). |
James C. Curvey (75) |
| Year of Election or Appointment: 2007 Mr. Curvey also serves as Trustee (2007-present) of other investment companies advised by FMR. Mr. Curvey is a Director of FMR and FMR Co., Inc. (2007-present). Mr. Curvey is also Vice Chairman (2006-
present) and Director of FMR LLC. In addition, Mr. Curvey serves as an Overseer for the Boston Symphony Orchestra and a member of the Trustees of Villanova University. |
* Trustees have been determined to be "Interested Trustees" by virtue of, among other things, their affiliation with the trust or various entities under common control with FMR.
+ The information above includes each Trustee's principal occupation during the last five years and other information relating to the experience, attributes, and skills relevant to each Trustee's qualifications to serve as a Trustee, which led to the conclusion that each Trustee should serve as a Trustee for the fund.
Annual Report
Independent Trustees:
Correspondence intended for each Independent Trustee (that is, the Trustees other than the Interested Trustees) may be sent to Fidelity Investments, P.O. Box 55235, Boston, Massachusetts 02205-5235.
Name, Age; Principal Occupations and Other Relevant Experience+ |
Dennis J. Dirks (62) |
| Year of Election or Appointment: 2005 Prior to his retirement in May 2003, Mr. Dirks was Chief Operating Officer and a member of the Board of The Depository Trust & Clearing Corporation (DTCC). He also served as President, Chief Operating Officer, and Board member of The Depository Trust Company (DTC) and President and Board member of the National Securities Clearing Corporation (NSCC). In addition, Mr. Dirks served as Chief Executive Officer and Board member of the Government Securities Clearing Corporation, Chief Executive Officer and Board member of the Mortgage-Backed Securities Clearing Corporation, as a Trustee and a member of the Finance Committee of Manhattan College (2005-2008), and as a Trustee and a member of the Finance Committee of AHRC of Nassau County (2006-2008). Currently, Mr. Dirks serves as a member of the Board of Directors for The Brookville Center for Children's Services, Inc. (2009-present). |
Alan J. Lacy (56) |
| Year of Election or Appointment: 2008 Mr. Lacy serves as Senior Adviser (2007-present) of Oak Hill Capital Partners, L.P. (private equity). Mr. Lacy also served as Chief Executive Officer (2000-2005) and Vice Chairman (2005-2006) of Sears Holdings Corporation and Sears, Roebuck and Co. (retail). In addition, Mr. Lacy serves as a member of the Board of Directors of The Western Union Company (global money transfer, 2006-present) and Bristol-Myers Squibb Company (global pharmaceuticals, 2007-present). Mr. Lacy is Chairman (2008-present) and a member (2006-present) of the Board of Trustees of The National Parks Conservation Association. |
Ned C. Lautenbach (66) |
| Year of Election or Appointment: 2000 Mr. Lautenbach is Chairman of the Independent Trustees of the Equity and High Income Funds (2006-present). Mr. Lautenbach is an Advisory Partner of Clayton, Dubilier & Rice, Inc. (private equity investment, 2008-present) and was previously a Partner of Clayton, Dubilier & Rice, Inc. (1998-2008). Previously, Mr. Lautenbach was with the International Business Machines Corporation (IBM) from 1968 until his retirement in 1998. Mr. Lautenbach serves as a Director of Eaton Corporation (diversified industrial) as well as the Philharmonic Center for the Arts in Naples, Florida. Mr. Lautenbach is also a member of the Board of Trustees of Fairfield University (2005-present), as well as a member of the Council on Foreign Relations. Previously, Mr. Lautenbach served as a Director of Sony Corporation (2006-2007). |
Joseph Mauriello (65) |
| Year of Election or Appointment: 2008 Prior to his retirement in January 2006, Mr. Mauriello served in numerous senior management positions including Deputy Chairman and Chief Operating Officer (2004-2005), and Vice Chairman of Financial Services (2002-2004) of KPMG LLP US (professional services, 1965-2005). Mr. Mauriello currently serves as a member of the Board of Directors of XL Capital Ltd. (global insurance and re-insurance, 2006-present) and of Arcadia Resources Inc. (health care services and products, 2007-
present). Previously, Mr. Mauriello served as a Director of the Hamilton Funds of the Bank of New York (2006-2007). |
Cornelia M. Small (66) |
| Year of Election or Appointment: 2005 Ms. Small is a member of the Board of Directors of the Teagle Foundation (2009-present). Ms. Small is also a member of the Investment Committee, and Chair (2008-present) and a member of the Board of Trustees of Smith College. In addition, Ms. Small serves on the Investment Committee of the Berkshire Taconic Community Foundation (2008-
present). Previously, Ms. Small served as Chairperson of the Investment Committee (2002-2008) of Smith College. In addition, Ms. Small served as Chief Investment Officer, Director of Global Equity Investments, and a member of the Board of Directors of Scudder, Stevens & Clark and Scudder Kemper Investments. |
William S. Stavropoulos (71) |
| Year of Election or Appointment: 2002 Mr. Stavropoulos is Vice Chairman of the Independent Trustees of the Equity and High Income Funds (2006-present). Mr. Stavropoulos serves as President and Founder of the Michigan Baseball Foundation, the Great Lakes Loons (2007-present). Mr. Stavropoulos is Chairman Emeritus of the Board of Directors of The Dow Chemical Company, where he previously served in numerous senior management positions, including President, CEO (1995-2000; 2002-2004), Chairman of the Executive Committee (2000-2006), and as a member of the Board of Directors (1990-2006). Currently, Mr. Stavropoulos is a Director of Teradata Corporation (data warehousing and technology solutions, 2008-present), Chemical Financial Corporation, Maersk Inc. (industrial conglomerate), Tyco International, Inc. (multinational manufacturing and services, 2007-present), and a member of the Advisory Board for Metalmark Capital (private equity investment, 2005-present). Mr. Stavropoulos is a special advisor to Clayton, Dubilier & Rice, Inc. (private equity investment). In addition, Mr. Stavropoulos is a member of the University of Notre Dame Advisory Council for the College of Science. |
David M. Thomas (61) |
| Year of Election or Appointment: 2008 Previously, Mr. Thomas served as Executive Chairman (2005-2006) and Chairman and Chief Executive Officer (2000-2005) of IMS Health, Inc. (pharmaceutical and healthcare information solutions). In addition, Mr. Thomas serves as a member of the Board of Directors of Fortune Brands, Inc. (consumer products), and Interpublic Group of Companies, Inc. (marketing communication, 2004-present). |
Michael E. Wiley (59) |
| Year of Election or Appointment: 2008 Mr. Wiley also serves as a Director of Asia Pacific Exploration Consolidated (international oil and gas exploration and production, 2008-
present), and as a member of the Board of Trustees of the University of Tulsa (2000-2006; 2007-present). Mr. Wiley serves as a Director of Tesoro Corporation (independent oil refiner and marketer, 2005-present), and a Director of Bill Barrett Corporation (exploration and production, 2005-
present). In addition, Mr. Wiley also serves as a Director of Post Oak Bank (privately-held bank, 2004-present). Previously, Mr. Wiley served as a Sr. Energy Advisor of Katzenbach Partners, LLC (consulting, 2006-
2007), as an Advisory Director of Riverstone Holdings (private investment), Chairman, President, and CEO of Baker Hughes, Inc. (oilfield services, 2000-2004), and as Director of Spinnaker Exploration Company (exploration and production, 2001-2005). |
Annual Report
Trustees and Officers - continued
+ The information above includes each Trustee's principal occupation during the last five years and other information relating to the experience, attributes, and skills relevant to each Trustee's qualifications to serve as a Trustee, which led to the conclusion that each Trustee should serve as a Trustee for the fund.
Advisory Board Member and Executive Officers:
Correspondence intended for each executive officer and Peter S. Lynch may be sent to Fidelity Investments, 82 Devonshire Street, Boston, Massachusetts 02109.
Name, Age; Principal Occupation |
Peter S. Lynch (66) |
| Year of Election or Appointment: 2003 Member of the Advisory Board of Fidelity's Equity and High Income Funds. Mr. Lynch is Vice Chairman and a Director of FMR and FMR Co., Inc. In addition, Mr. Lynch serves as a Trustee of Boston College and as the Chairman of the Inner-City Scholarship Fund. Previously, Mr. Lynch served on the Special Olympics International Board of Directors (1997-2006). |
Kenneth B. Robins (40) |
| Year of Election or Appointment: 2008 President and Treasurer of Fidelity's Equity and High Income Funds. Mr. Robins also serves as President and Treasurer (2010-present) and Assistant Treasurer (2009-present) of other Fidelity funds and is an employee of Fidelity Investments (2004-present). Previously, Mr. Robins served as Deputy Treasurer of the Fidelity funds (2005-2008) and Treasurer and Chief Financial Officer of The North Carolina Capital Management Trust: Cash and Term Portfolios (2006-2008). |
Bruce T. Herring (44) |
| Year of Election or Appointment: 2006 Vice President of certain Equity Funds. Mr. Herring also serves as Group Chief Investments Officer of FMR. Previously, Mr. Herring served as a portfolio manager for Fidelity U.S. Equity Funds. |
Brian B. Hogan (45) |
| Year of Election or Appointment: 2009 Vice President of certain Equity Funds and Vice President of Sector Funds. Mr. Hogan also serves as Senior Vice President, Equity Research of FMR (2006-present) and President of FMR's Equity Division (2009-
present). Previously, Mr. Hogan served as a portfolio manager. |
Scott C. Goebel (42) |
| Year of Election or Appointment: 2008 Secretary and Chief Legal Officer (CLO) of the Fidelity funds. Mr. Goebel also serves as General Counsel, Secretary, and Senior Vice President of FMR (2008-present) and FMR Co., Inc. (2008-present); Deputy General Counsel of FMR LLC; Chief Legal Officer of Fidelity Management & Research (Hong Kong) Limited (2008-present) and Assistant Secretary of Fidelity Management & Research (Japan) Inc. (2008-present), Fidelity Investments Money Management, Inc. (2008-present), Fidelity Management & Research (U.K.) Inc. (2008-present), and Fidelity Research and Analysis Company (2008-present). Previously, Mr. Goebel served as Assistant Secretary of the Funds (2007-2008) and as Vice President and Secretary of Fidelity Distributors Corporation (FDC) (2005-2007). |
William C. Coffey (41) |
| Year of Election or Appointment: 2009 Assistant Secretary of Fidelity's Equity and High Income Funds. Mr. Coffey also serves as Senior Vice President and Deputy General Counsel of FMR LLC (2010-present), and is an employee of Fidelity Investments. Previously, Mr. Coffey served as Vice President and Associate General Counsel of FMR LLC (2005-2009). |
Holly C. Laurent (56) |
| Year of Election or Appointment: 2008 Anti-Money Laundering (AML) Officer of the Fidelity funds. Ms. Laurent is an employee of Fidelity Investments. Previously, Ms. Laurent was Senior Vice President and Head of Legal for Fidelity Business Services India Pvt. Ltd. (2006-2008), and Senior Vice President, Deputy General Counsel and Group Head for FMR LLC (2005-2006). |
Christine Reynolds (51) |
| Year of Election or Appointment: 2008 Chief Financial Officer of the Fidelity funds. Ms. Reynolds became President of Fidelity Pricing and Cash Management Services (FPCMS) in August 2008. Ms. Reynolds served as Chief Operating Officer of FPCMS (2007-2008). Previously, Ms. Reynolds served as President, Treasurer, and Anti-Money Laundering officer of the Fidelity funds (2004-2007). |
Kenneth A. Rathgeber (63) |
| Year of Election or Appointment: 2004 Chief Compliance Officer of Fidelity's Equity and High Income Funds. Mr. Rathgeber is Chief Compliance Officer of Fidelity Management & Research (Hong Kong) Limited (2008-present), Fidelity Management & Research (Japan) Inc. (2008-present), FMR (2005-present), FMR Co., Inc. (2005-present), Fidelity Management & Research (U.K.) Inc. (2005-
present), Fidelity Research & Analysis Company (2005-present), Fidelity Investments Money Management, Inc. (2005-present), Pyramis Global Advisors, LLC (2005-present), and Strategic Advisers, Inc.
(2005-present). |
Jeffrey S. Christian (48) |
| Year of Election or Appointment: 2009 Deputy Treasurer of the Fidelity funds. Mr. Christian is an employee of Fidelity Investments. Previously, Mr. Christian served as Chief Financial Officer (2008-2009) of certain Fidelity funds and Senior Vice President of Fidelity Pricing and Cash Management Services (FPCMS) (2004-2009). |
Bryan A. Mehrmann (49) |
| Year of Election or Appointment: 2005 Deputy Treasurer of the Fidelity funds. Mr. Mehrmann is an employee of Fidelity Investments. |
Adrien E. Deberghes (42) |
| Year of Election or Appointment: 2008 Deputy Treasurer of Fidelity's Equity and High Income Funds. Mr. Deberghes also serves as Assistant Treasurer of other Fidelity funds (2010-present) and is an employee of Fidelity Investments (2008-
present). Previously, Mr. Deberghes served as Senior Vice President of Mutual Fund Administration at State Street Corporation (2007-2008), Senior Director of Mutual Fund Administration at Investors Bank & Trust (2005-2007), and Director of Finance for Dunkin' Brands (2000-2005). |
Stephanie J. Dorsey (41) |
| Year of Election or Appointment: 2010 Assistant Treasurer of Fidelity's Equity and High Income Funds. Ms. Dorsey also serves as Deputy Treasurer of other Fidelity funds (2008-
present) and is an employee of Fidelity Investments (2008-present). Previously, Ms. Dorsey served as Treasurer (2004-2008) of the JPMorgan Mutual Funds and Vice President (2004-2008) of JPMorgan Chase Bank. |
Name, Age; Principal Occupation |
John R. Hebble (52) |
| Year of Election or Appointment: 2009 Assistant Treasurer of Fidelity's Equity and High Income Funds. Mr. Hebble also serves as Treasurer and Chief Financial Officer of The North Carolina Capital Management Trust: Cash and Term Portfolio (2008-present), President and Treasurer of other Fidelity funds (2008-present) and is an employee of Fidelity Investments. |
Gary W. Ryan (51) |
| Year of Election or Appointment: 2005 Assistant Treasurer of the Fidelity funds. Mr. Ryan is an employee of Fidelity Investments. Previously, Mr. Ryan served as Vice President of Fund Reporting in Fidelity Pricing and Cash Management Services (FPCMS) (1999-2005). |
Annual Report
Class F designates 100% of the dividends distributed during the fiscal year as qualifying for the dividends-received deduction for corporate shareholders.
Class F designates 100% of the dividends distributed during the fiscal year as amounts which can be taken into account as a dividend for the purposes of the maximum rate under section 1(h)(11) of the Internal Revenue Code.
The fund will notify shareholders in January 2011 of amounts for use in preparing 2010 income tax returns.
Annual Report
Board Approval of Investment Advisory Contracts and Management Fees
Fidelity Blue Chip Growth Fund
Each year, the Board of Trustees, including the Independent Trustees (together, the Board), votes on the renewal of the management contract and sub-advisory agreements (together, the Advisory Contracts) for the fund. The Board, assisted by the advice of fund counsel and Independent Trustees' counsel, requests and considers a broad range of information relevant to the renewal of the Advisory Contracts throughout the year.
The Board meets regularly and considers at each of its meetings factors that are relevant to its annual consideration of the renewal of the fund's Advisory Contracts, including the services and support provided to the fund and its shareholders. The Board has established various standing committees, each composed of Independent Trustees with varying backgrounds, to which the Board has assigned specific subject matter responsibilities in order to enhance effective decision-making by the Board. The Board, acting directly and through its Committees, requests and receives information concerning the annual consideration of the renewal of the fund's Advisory Contracts. The Board also meets as needed to consider matters specifically related to the Board's annual consideration of the renewal of Advisory Contracts. Members of the Board may also meet with trustees of other Fidelity funds through ad hoc joint committees to discuss certain matters relevant to the Fidelity funds.
At its July 2010 meeting, the Board of Trustees, including the Independent Trustees, unanimously determined to renew the fund's Advisory Contracts. In reaching its determination, the Board considered all factors it believed relevant, including (i) the nature, extent, and quality of the services to be provided to the fund and its shareholders (including the investment performance of the fund); (ii) the competitiveness of the fund's management fee and total expenses; (iii) the total costs of the services to be provided by and the profits to be realized by Fidelity from its relationship with the fund; (iv) the extent to which economies of scale would be realized as the fund grows; and (v) whether fee levels reflect these economies of scale, if any, for the benefit of fund shareholders.
In considering whether to renew the Advisory Contracts for the fund, the Board reached a determination, with the assistance of fund counsel and Independent Trustees' counsel and through the exercise of its business judgment, that the renewal of the Advisory Contracts is in the best interests of fund shareholders and that the compensation to be received by Fidelity under the management contract is fair and reasonable. The Board's decision to renew the Advisory Contracts was not based on any single factor noted above, but rather was based on a comprehensive consideration of all the information provided to the Board at its meetings throughout the year. The Board, in reaching its determination to renew the Advisory Contracts, is aware that shareholders in the fund have a broad range of investment choices available to them, including a wide choice among mutual funds offered by Fidelity's competitors, and that the fund's shareholders, with the opportunity to review and weigh the disclosure provided by the fund in its prospectus and other public disclosures, have chosen to invest in this fund, managed by Fidelity.
Annual Report
Board Approval of Investment Advisory Contracts and
Management Fees - continued
Nature, Extent, and Quality of Services Provided. The Board considered the staffing within the investment adviser, FMR, and the sub-advisers (together, the Investment Advisers), including the backgrounds of the fund's investment personnel and the fund's investment objective and discipline. The Independent Trustees also had discussions with senior management of Fidelity's investment operations and investment groups. The Board considered the structure of the portfolio manager compensation program and whether this structure provides appropriate incentives to act in the best interest of the fund.
Resources Dedicated to Investment Management and Support Services. The Board and the equity research subcommittee of the Board's Fund Oversight Committee reviewed the size, education, and experience of the Investment Advisers' investment staff, their use of technology, and the Investment Advisers' approach to recruiting, training, and retaining portfolio managers and other research, advisory, and management personnel. The Board noted that Fidelity's analysts have access to a variety of technological tools and market and securities data that enable them to perform both fundamental and quantitative analysis and to specialize in various disciplines. The Board considered Fidelity's extensive global research capabilities that enable the Investment Advisers to aggregate data from various sources in an effort to produce positive investment results. The Board also considered that Fidelity's portfolio managers and analysts have access to daily portfolio attribution that allows for monitoring of a fund's portfolio, as well as an electronic communication system that provides immediate real-time access to research concerning issuers and credit enhancers. The Board noted FMR's continued focus on strengthening the organization and discipline of equity portfolio management and research.
Shareholder and Administrative Services. The Board considered (i) the nature, extent, quality, and cost of advisory, administrative, and shareholder services performed by the Investment Advisers and their affiliates under the Advisory Contracts and under separate agreements covering transfer agency, pricing and bookkeeping, and securities lending services for the fund; (ii) the nature and extent of the investment adviser's supervision of third party service providers, principally custodians and subcustodians; and (iii) the resources devoted to, and the record of compliance with, the fund's compliance policies and procedures. The Board also reviewed the allocation of fund brokerage, including allocations to brokers affiliated with the Investment Advisers, the use of brokerage commissions to pay fund expenses, and the use of "soft" commission dollars to pay for research services.
The Board noted that the growth of fund assets over time across the complex allows Fidelity to reinvest in the development of services designed to enhance the value or convenience of the Fidelity funds as investment vehicles. These services include 24-hour access to account information and market information through phone representatives and over the Internet, and investor education materials and asset allocation tools.
Annual Report
Investment in a Large Fund Family. The Board considered the benefits to shareholders of investing in a Fidelity fund, including the benefits of investing in a fund that is part of a large family of funds offering a variety of investment disciplines and providing a large variety of mutual fund investor services. The Board noted that Fidelity had taken, or had made recommendations that resulted in the Fidelity funds taking, a number of actions over the previous year that benefited particular funds, including (i) dedicating additional resources to investment research and restructuring and broadening the focus of the investment research teams; (ii) bolstering the senior management team that oversees asset management; (iii) launching Class F of certain funds as a lower-fee class available to Freedom K and Freedom Index Funds; (iv) lowering the initial investment minimums and ongoing balance requirements for Real Estate High Income Fund; (v) eliminating subsequent purchase minimums for all funds and adding a waiver of the investment minimum requirement for new accounts opened with the proceeds of a systematic withdrawal plan; (vi) eliminating the withdrawal minimum and maximum limits for systematic withdrawals from Advisor funds; (vii) expanding sales load waivers on Class A shares for Destiny Planholders and expanding Institutional Class eligibility for Class O Destiny Planholders; and (viii) changing certain Class A and Class T sales charge structures to further align them with industry practices.
Investment Performance. The Board considered whether the fund has operated in accordance with its investment objective, as well as its record of compliance with its investment restrictions. It also reviewed the fund's absolute investment performance for each class (except Class F), as well as the fund's relative investment performance for each class (except Class F) measured over multiple periods against (i) a broad-based securities market index, and (ii) a peer group of mutual funds deemed appropriate by Fidelity and reviewed by the Board. The following charts considered by the Board show, over the one-, three-, and five-year periods ended December 31, 2009, as available, the cumulative total returns of Class K and the retail class of the fund, the cumulative total returns of a broad-based securities market index ("benchmark"), and a range of cumulative total returns of a peer group of mutual funds identified by Morningstar, Inc. as having an investment style similar to that of the fund based on underlying portfolio holdings. (Class F of the fund had less than one year of performance as of December 31, 2009.) The box within each chart shows the 25th percentile return (bottom of box) and the 75th percentile return (top of box) of the peer group. Returns shown above the box are in the first quartile and returns shown below the box are in the fourth quartile. The percentage beaten numbers noted below each chart correspond to the percentile box and represent the percentage of funds in the peer group whose performance was equal to or lower than that of the class indicated.
Annual Report
Board Approval of Investment Advisory Contracts and
Management Fees - continued
Fidelity Blue Chip Growth Fund

The Board reviewed the fund's relative investment performance against its peer group and noted that the performance of the retail class of the fund (the class with the longer performance record) was in the first quartile for the one- and three-year periods and the second quartile for the five-year period. The Board also noted that the investment performance of the retail class of the fund compared favorably to its benchmark for all the periods shown. The Board considered that the variations in performance between the fund's classes reflect the variations in class expenses, which result in lower performance for the higher expense class. The Board also reviewed the fund's performance since inception as well as performance in the current year.
The Board also considered that the fund's management fee is subject to upward or downward adjustment depending upon whether, and to what extent, the fund's investment performance for the performance period exceeds, or is exceeded by, the record (over the same period) of a Board-approved performance adjustment index. The Board realizes that the performance adjustment provides FMR with a strong economic incentive to seek to achieve superior performance for the fund's shareholders and helps to more closely align the interests of FMR and the fund's shareholders.
Based on its review, and giving particular weight to the nature and quality of the resources dedicated by the Investment Advisers to maintain and improve relative performance and factoring in the unprecedented market events in recent years, the Board concluded that the nature, extent, and quality of investment management and support services and of shareholder and administrative services provided to the fund will benefit the fund's shareholders, particularly in light of the Board's view that the fund's shareholders benefit from investing in a fund that is part of a large family of funds offering a variety of investment disciplines and services.
Annual Report
Competitiveness of Management Fee and Total Fund Expenses. The Board considered the fund's management fee and total expenses compared to "mapped groups" of competitive funds and classes. Fidelity creates "mapped groups" by combining similar Lipper investment objective categories that have comparable management fee characteristics. Combining Lipper investment objective categories aids the Board's management fee and total expense comparisons by broadening the competitive group used for comparison and by reducing the number of universes to which various Fidelity funds are compared.
Management Fee. The Board considered two proprietary management fee comparisons for the 12-month periods shown in the chart below. The group of Lipper funds used by the Board for management fee comparisons is referred to below as the "Total Mapped Group." The Total Mapped Group comparison focuses on a fund's standing relative to the total universe of comparable funds available to investors, in terms of gross management fees before expense reimbursements or caps, and without giving effect to the fund's performance adjustment. "TMG %" represents the percentage of funds in the Total Mapped Group that had management fees that were lower than the fund's. For example, a TMG % of 10% means that 90% of the funds in the Total Mapped Group had higher management fees than the fund. The "Asset-Size Peer Group" (ASPG) comparison focuses on a fund's standing relative to non-Fidelity funds similar in size to the fund within the Total Mapped Group. The ASPG represents at least 15% of the funds in the Total Mapped Group with comparable asset size and management fee characteristics, subject to a minimum of 50 funds (or all funds in the Total Mapped Group if fewer than 50). Additional information, such as the ASPG quartile in which the fund's management fee ranked and the impact of the fund's performance adjustment, is also included in the chart and considered by the Board.
Annual Report
Board Approval of Investment Advisory Contracts and
Management Fees - continued
Fidelity Blue Chip Growth Fund

The Board noted that the fund's management fee ranked below the median of its Total Mapped Group and below the median of its ASPG for 2009. The Board also noted the effect of the fund's negative performance adjustment on the fund's management fee ranking. The Board noted that the performance adjustment for each year represents calculations for performance periods that differ from the periods shown in the performance charts above.
Furthermore, the Board considered that shareholders approved a prospective change in the index used to calculate the fund's performance adjustment beginning June 1, 2006. The Board also considered that, because the performance adjustment is based on a rolling 36-month measurement period, during a transition period the fund's performance is compared to a blended index return that reflects the performance of the former index for the portion of the measurement period prior to June 1, 2006 and the performance of the current index for the remainder of the measurement period. The Board noted that the fund's performance adjustments for 2006 through 2009 shown in the chart above reflect the effect of using the blended index return to calculate the fund's performance adjustment.
Based on its review, the Board concluded that the fund's management fee is fair and reasonable in light of the services that the fund receives and the other factors considered.
Total Expenses. In its review of each class's total expenses, the Board considered the fund's management fee as well as other fund or class expenses, as applicable, such as transfer agent fees, pricing and bookkeeping fees, and custodial, legal, and audit fees. The Board also noted the effects of any waivers and reimbursements on fees and expenses, as well as the impact of the fund's performance adjustment. As part of its review, the Board also considered current and historical total expenses of each class of the fund compared to competitive fund median expenses. Each class of the fund is compared to those funds and classes in the Total Mapped Group (used by the Board for management fee comparisons) that have a similar sales load structure.
Annual Report
The Board noted that the total expenses of each class ranked below its competitive median for the period.
Fees Charged to Other Fidelity Clients. The Board also considered Fidelity fee structures and other information with respect to clients of FMR and its affiliates, such as other mutual funds advised or subadvised by FMR or its affiliates, pension plan clients, and other institutional clients. In March 2010, the Board created an ad hoc joint committee with the board of other Fidelity funds (the Committee) to review and compare Fidelity's institutional investment advisory business with its business of providing services to the Fidelity funds, including the differences in services provided, fees charged, and costs incurred, as well as competition in their respective marketplaces.
Based on its review of total expenses and fees charged to other Fidelity clients, the Board concluded that the total expenses of each class of the fund were reasonable in light of the services that the fund and its shareholders receive and the other factors considered, including the findings of the Committee.
Costs of the Services and Profitability. The Board considered the revenues earned and the expenses incurred by Fidelity in conducting the business of developing, marketing, distributing, managing, administering and servicing the fund and its shareholders. The Board also considered the level of Fidelity's profits in respect of all the Fidelity funds.
On an annual basis, FMR presents to the Board Fidelity's profitability for the fund. Fidelity calculates the profitability for each fund, as well as aggregate profitability for groups of Fidelity funds and all Fidelity funds, using a series of detailed revenue and cost allocation methodologies which originate with the audited books and records of Fidelity. The Audit Committee of the Board reviews any significant changes from the prior year's methodologies.
PricewaterhouseCoopers LLP (PwC), independent registered public accounting firm and auditor to Fidelity and certain Fidelity funds, has been engaged annually by the Board as part of the Board's assessment of Fidelity's profitability analysis. PwC's engagement includes the review and assessment of Fidelity's methodologies used in determining the revenues and expenses attributable to Fidelity's mutual fund business, and completion of agreed-upon procedures surrounding the mathematical accuracy of fund profitability and its conformity to allocation methodologies. After considering PwC's reports issued under the engagement and information provided by Fidelity, the Board believes that while other allocation methods may also be reasonable, Fidelity's profitability methodologies are reasonable in all material respects.
Annual Report
Board Approval of Investment Advisory Contracts and
Management Fees - continued
The Board has also reviewed Fidelity's non-fund businesses and fall-out benefits related to the mutual fund business as well as cases where Fidelity's affiliates may benefit from or be related to the fund's business.
The Board considered the costs of the services provided by and the profits realized by Fidelity in connection with the operation of the fund and were satisfied that the profitability was not excessive in the circumstances.
Economies of Scale. The Board considered whether there have been economies of scale in respect of the management of the Fidelity funds, whether the Fidelity funds (including the fund) have appropriately benefited from any such economies of scale, and whether there is potential for realization of any further economies of scale. The Board considered the extent to which the fund will benefit from economies of scale through increased services to the fund, through waivers or reimbursements, or through fee or expense reductions.
In February 2009, the Board and the board of other Fidelity funds created an ad hoc committee (the Economies of Scale Committee) to analyze whether FMR attains economies of scale in respect of the management and servicing of the Fidelity funds, whether the Fidelity funds have appropriately benefited from such economies of scale, and whether there is potential for realization of any further economies of scale.
The Board recognized that the fund's management contract incorporates a "group fee" structure, which provides for lower group fee rates as total fund assets under FMR's management increase, and for higher group fee rates as total fund assets under FMR's management decrease. FMR calculates the group fee rates based on a tiered asset "breakpoint" schedule that varies based on asset class. The Board considered that the group fee is designed to deliver the benefits of economies of scale to fund shareholders when total Fidelity fund assets increase, even if assets of any particular fund are unchanged or have declined, because some portion of Fidelity's costs are attributable to services provided to all Fidelity funds, and all funds benefit if those costs can be allocated among more assets. The Board concluded that, given the group fee structure, fund shareholders will benefit from lower management fees as assets under FMR's management increase at the fund complex level, regardless of whether Fidelity achieves any such economies of scale.
The Board concluded, considering the findings of the Economies of Scale Committee, that any potential economies of scale are being appropriately shared between fund shareholders and Fidelity.
Annual Report
Additional Information Requested by the Board. In order to develop fully the factual basis for consideration of the Fidelity funds' Advisory Contracts, the Board requested and received additional information on certain topics, including (i) fund performance trends, actions to be taken by FMR to improve certain funds' overall performance, and Fidelity's long-term strategies for certain funds; (ii) portfolio manager changes that have occurred during the past year and length of portfolio manager tenure for different categories of funds over time; (iii) Fidelity's compensation structure for portfolio managers, research analysts, and other key personnel, the rationale for the compensation structure, and how the compensation structure provides appropriate performance incentives; (iv) the amount of the investment that each portfolio manager has made in the Fidelity fund(s) that he or she manages; (v) management and other fees paid by FMR to affiliated sub-advisers on behalf of the Fidelity funds; (vi) Fidelity's fee structures and rationale for recommending different fees among different categories of funds; (vii) Fidelity's rationale for recommending which funds should have a performance adjustment component as part of their management fees; (viii) the rationale for any differences between fund fee structures and fee structures in place for other Fidelity clients; and (ix) explanations regarding the relative total expenses borne by certain funds and classes, total expense competitive trends, and actions that might be taken by FMR to reduce total expenses for certain funds and classes.
Based on its evaluation of all of the conclusions noted above, and after considering all factors it believed relevant, the Board ultimately concluded that the advisory fee structures are fair and reasonable, and that the fund's Advisory Contracts should be renewed.
Annual Report
Managing Your Investments
Fidelity offers several ways to conveniently manage your workplace benefits (including your workplace savings plan, investments, and additional services) via your telephone or PC. You can access your plan and account information and research your investments 24 hours a day.
By Phone
Fidelity provides a single toll-free number to access plan information, account balances, positions, and quotes*. It's easy to navigate the service, and on your first call, the system will help you create a personal identification number (PIN) for security.
(phone_graphic)
Fidelity Workplace
Investing
1-800-835-5092
By PC
Fidelity's web site on the Internet provides a wide range of information, including plan information, daily financial news, fund performance, interactive planning tools, and news about Fidelity products and services.
(computer_graphic)
Fidelity's Web Site
www.401k.com
* When you call the quotes line, please remember that a fund's yield and return will vary and, except for money market funds, share price will also vary. This means that you may have a gain or loss when you sell your shares. There is no assurance that money market funds will be able to maintain a stable $1 share price; an investment in a money market fund is not insured or guaranteed by the U.S. government. Total returns are historical and include changes in share price, reinvestment of dividends and capital gains, and the effects of any sales charges.
Annual Report
To Write Fidelity
We'll give your correspondence immediate attention and send you written confirmation upon completion of your request.
(letter_graphic)
For Non-Retirement
Accounts
Buying shares
Fidelity Investments
P.O. Box 770001
Cincinnati, OH 45277-0003
Overnight Express
Fidelity Investments
Attn: Distribution Services
100 Crosby Parkway - KC1H
Covington, KY 41015
Selling shares
Fidelity Investments
P.O. Box 770001
Cincinnati, OH 45277-0035
Overnight Express
Fidelity Investments
Attn: Distribution Services
100 Crosby Parkway - KC1H
Covington, KY 41015
General Correspondence
Fidelity Investments
P.O. Box 500
Merrimack, NH 03054-0500
(letter_graphic)
For Retirement
Accounts
Buying shares
Fidelity Investments
P.O. Box 770001
Cincinnati, OH 45277-0003
Selling shares
Fidelity Investments
P.O. Box 770001
Cincinnati, OH 45277-0035
Overnight Express
Fidelity Investments
Attn: Distribution Services
100 Crosby Parkway - KC1H
Covington, KY 41015
General Correspondence
Fidelity Investments
P.O. Box 500
Merrimack, NH 03054-0500
Annual Report
Investment Adviser
Fidelity Management & Research Company
Boston, MA
Investment Sub-Advisers
FMR Co., Inc.
Fidelity Research & Analysis Company
Fidelity Management & Research
(U.K.) Inc.
Fidelity Management & Research
(Hong Kong) Limited
Fidelity Management & Research
(Japan) Inc.
General Distributor
Fidelity Distributors Corporation
Boston, MA
Transfer and Service Agents
Fidelity Investments Institutional
Operations Company, Inc.
Boston, MA
Fidelity Service Company, Inc.
Boston, MA
Custodian
Citibank, N.A.
New York, NY
BCF-F-ANN-0910
1.891663.101
Fidelity®
Blue Chip Growth
Fund -
Class K
Annual Report
July 31, 2010
(2_fidelity_logos) (Registered_Trademark)
Contents
Chairman's Message | <Click Here> | The Chairman's message to shareholders. |
Performance | <Click Here> | How the fund has done over time. |
Management's Discussion of Fund Performance | <Click Here> | The Portfolio Manager's review of fund performance and strategy. |
Shareholder Expense Example | <Click Here> | An example of shareholder expenses. |
Investment Changes | <Click Here> | A summary of major shifts in the fund's investments over the past six months. |
Investments | <Click Here> | A complete list of the fund's investments with their market values. |
Financial Statements | <Click Here> | Statements of assets and liabilities, operations, and changes in net assets,
as well as financial highlights. |
Notes | <Click Here> | Notes to the financial statements. |
Report of Independent Registered Public Accounting Firm | <Click Here> | |
Trustees and Officers | <Click Here> | |
Distributions | <Click Here> | |
Board Approval of Investment Advisory Contracts and Management Fees | <Click Here> | |
To view a fund's proxy voting guidelines and proxy voting record for the 12-month period ended June 30, visit http://www.fidelity.com/proxyvotingresults or visit the Securities and Exchange Commission's (SEC) web site at http://www.sec.gov. You may also call 1-800-835-5092 to request a free copy of the proxy voting guidelines.
Standard & Poor's, S&P and S&P 500 are registered service marks of The McGraw-Hill Companies, Inc. and have been licensed for use by Fidelity Distributors Corporation.
Other third party marks appearing herein are the property of their respective owners.
All other marks appearing herein are registered or unregistered trademarks or service marks of FMR LLC or an affiliated company.
Annual Report
This report and the financial statements contained herein are submitted for the general information of the shareholders of the fund. This report is not authorized for distribution to prospective investors in the fund unless preceded or accompanied by an effective prospectus.
A fund files its complete schedule of portfolio holdings with the SEC for the first and third quarters of each fiscal year on Form N-Q. Forms N-Q are available on the SEC's web site at http://www.sec.gov. A fund's Forms N-Q may be reviewed and copied at the SEC's Public Reference Room in Washington, DC. Information regarding the operation of the SEC's Public Reference Room may be obtained by calling 1-800-SEC-0330. For a complete list of a fund's portfolio holdings, view the most recent holdings listing, semiannual report, or annual report on Fidelity's web site at http://www.fidelity.com or http://www.advisor.fidelity.com, as applicable.
NOT FDIC INSURED • MAY LOSE VALUE • NO BANK GUARANTEE
Neither the fund nor Fidelity Distributors Corporation is a bank.
Annual Report
(photo_of_Edward_C_Johnson_3d)
Dear Shareholder:
A yearlong uptrend in global equity markets reversed course in late April 2010 when investor sentiment turned bearish due in great measure to concern that Europe's debt crisis would expand and slow or derail economic recovery. However, a bounceback in July helped to recover some of the ground that was lost. Financial markets are always unpredictable, of course, but there also are several time-tested investment principles that can help put the odds in your favor.
One of the basic tenets is to invest for the long term. Over time, riding out the markets' inevitable ups and downs has proven much more effective than selling into panic or chasing the hottest trend. Even missing only a few of the markets' best days can significantly diminish investor returns. Patience also affords the benefits of compounding - of earning interest on additional income or reinvested dividends and capital gains. There can be tax advantages and cost benefits to consider as well. While staying the course doesn't eliminate risk, it can considerably lessen the effect of short-term declines.
You can further manage your investing risk through diversification. And today, more than ever, geographic diversification should be taken into account. Studies indicate that asset allocation is the single most important determinant of a portfolio's long-term success. The right mix of stocks, bonds and cash - aligned to your particular risk tolerance and investment objective - is very important. Age-appropriate rebalancing is also an essential aspect of asset allocation. For younger investors, an emphasis on equities - which historically have been the best-performing asset class over time - is encouraged. As investors near their specific goal, such as retirement or sending a child to college, consideration may be given to replacing volatile assets (e.g. common stocks) with more-stable fixed investments (bonds or savings plans).
A third principle - investing regularly - can help lower the average cost of your purchases. Investing a certain amount of money each month or quarter helps ensure you won't pay for all your shares at market highs. This strategy - known as dollar cost averaging - also reduces "emotion" from investing, helping shareholders avoid selling weak performers just prior to an upswing, or chasing a hot performer just before a correction.
We invite you to contact us via the Internet, through our Investor Centers or by phone. It is our privilege to provide you the information you need to make the investments that are right for you.
Sincerely,
(The chairman's signature appears here.)
Edward C. Johnson 3d
Annual Report
Average annual total return reflects the change in the value of an investment, assuming reinvestment of the class' distributions from dividend income and capital gains (the profits earned upon the sale of securities that have grown in value, if any) and assuming a constant rate of performance each year. The $10,000 table and the fund's returns do not reflect the deduction of taxes that a shareholder would pay on fund distributions or the redemption of fund shares. During periods of reimbursement by Fidelity, a fund's total return will be greater than it would be had the reimbursement not occurred. How a fund did yesterday is no guarantee of how it will do tomorrow.
Average Annual Total Returns
Periods ended July 31, 2010 | Past 1
year | Past 5
years | Past 10
years |
Class K A | 18.48% | 1.28% | -2.17% |
A The initial offering of Class K shares took place on May 9, 2008. Returns prior to May 9, 2008 are those of Fidelity Blue Chip Growth Fund, the original class of the fund.
$10,000 Over 10 Years
Let's say hypothetically that $10,000 was invested in Fidelity® Blue Chip Growth Fund - Class K on July 31, 2000. The chart shows how the value of your investment would have changed, and also shows how the Russell 1000® Growth Index performed over the same period. The initial offering of Class K took place on May 9, 2008. See above for additional information regarding the performance of Class K.
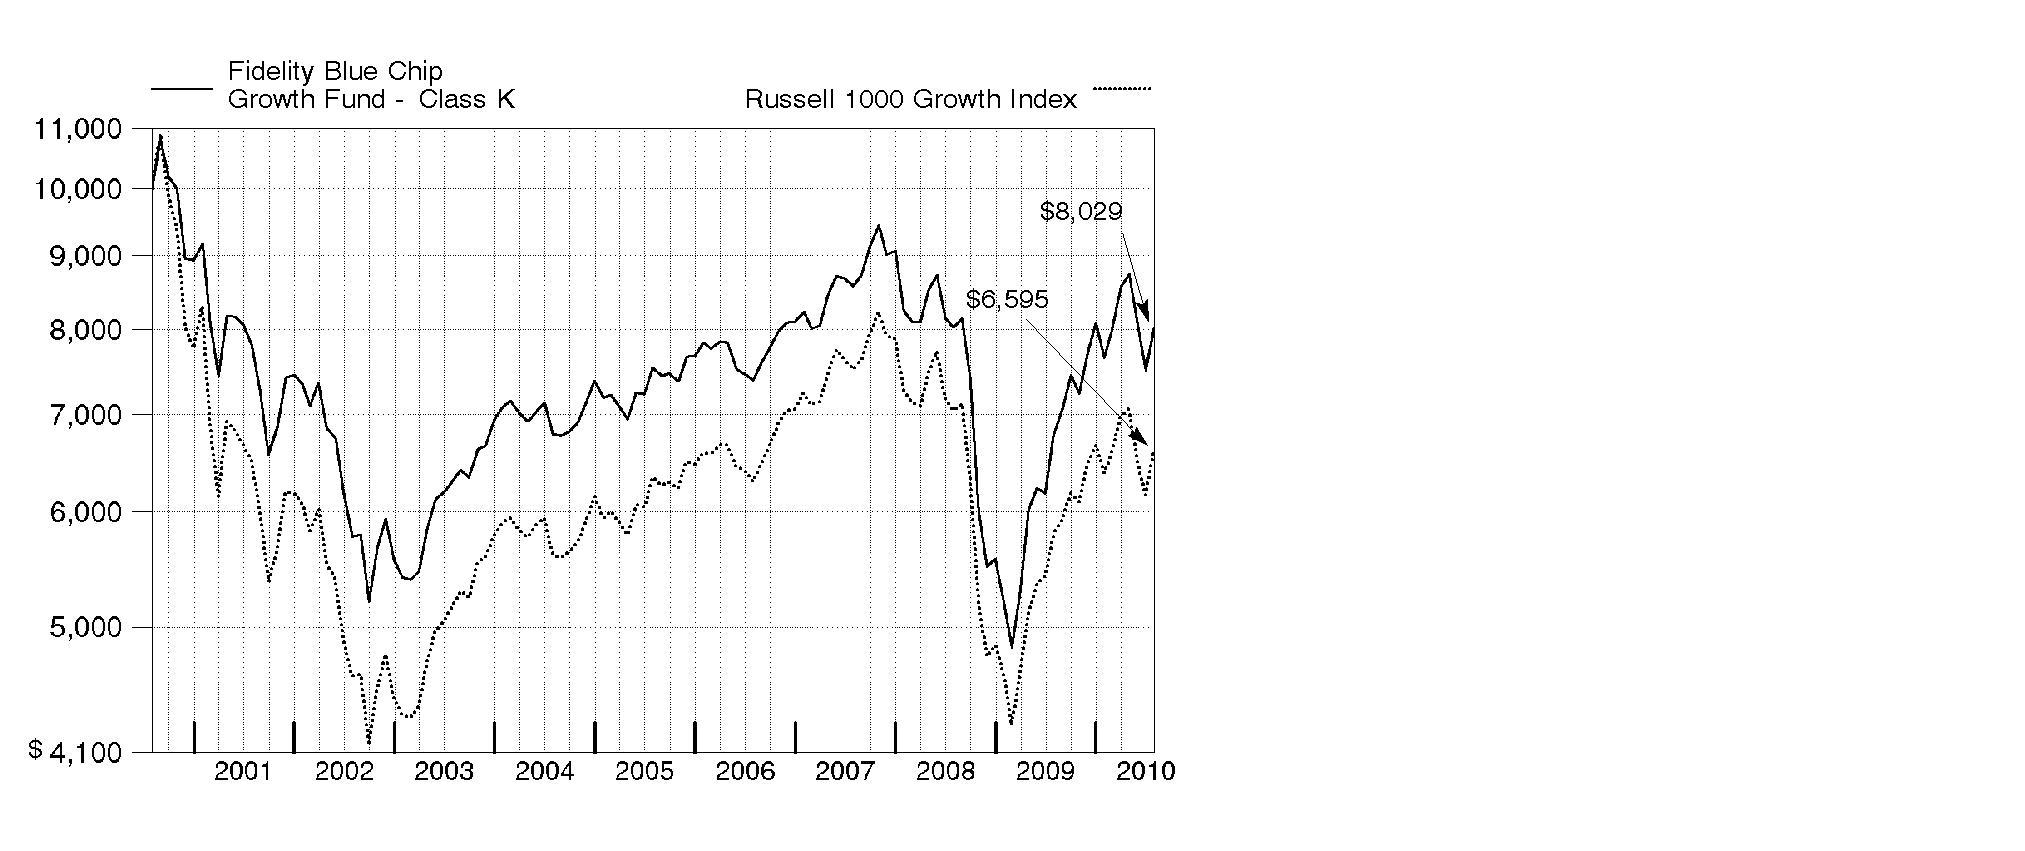
Annual Report
Market Recap: U.S. stock markets saw double-digit gains for the year ending July 31, 2010, despite the return of market volatility and risk aversion during the first half of 2010. An impressive bull run continued through 2009, bolstered by improvement in the economy and credit markets. Early in the new year, however, stocks fell sharply amid concerns about the global economic recovery, fueled by European debt woes and China's efforts to restrain inflation. After this brief dip, markets regained their upward momentum, as government stimulus and significant corporate cost cutting led to encouraging earnings reports, improved credit conditions and rising consumer confidence. Positive news continued through mid-April, when the Dow Jones Industrial AverageSM pushed above the 11,000 mark for the first time in 19 months. That milestone was short-lived, however, as heightened concern about the European debt crisis sparked an abrupt sell-off in May, leading to the first official correction since the rally began in March 2009. Although the market's malaise continued through June, stocks saw solid gains in July. For the year, the Dow rose 17.28%, while the S&P 500® Index was up 13.84%. Elsewhere, the technology-laden Nasdaq Composite® Index returned 14.99%. Small- and mid-cap stocks performed best, as measured by the 18.43% increase of the Russell 2000® Index and the 23.21% gain of the Russell Midcap® Index.
Comments from Sonu Kalra, Portfolio Manager of Fidelity® Blue Chip Growth Fund: For the one-year period, the fund's Class K shares gained 18.48%, solidly outpacing the 13.65% return of the Russell 1000® Growth Index. Strong stock selection in technology, industrials, consumer discretionary, financials and materials fueled performance, while my picks in health care and industry positioning within financials nicked results. Several tech stocks helped, including Apple, Baidu and SanDisk. Apple - the fund's largest holding - performed well amid the launch of its iPad tablet device and continued success of its iPhone and personal computers. Baidu, China's largest search engine, rose on news that its U.S.- based competitor Google considered leaving the Chinese market. SanDisk benefited from maintaining supply of the flash memory used in smart phones during an industrywide shortage. UAL (parent company of United Airlines) was the top contributor, benefiting from a recovery in travel and leisure spending. Notable detractors were Marvell Technology Group, a semiconductor manufacturer that faced oversupply issues in the hard-disk drive industry, and diversified financials firms Morgan Stanley and Bank of America, which were hurt due in part to uncertainty regarding potential regulatory reform. I sold Bank of America by period end.
The views expressed above reflect those of the portfolio manager(s) only through the end of the period as stated on the cover of this report and do not necessarily represent the views of Fidelity or any other person in the Fidelity organization. Any such views are subject to change at any time based upon market or other conditions and Fidelity disclaims any responsibility to update such views. These views may not be relied on as investment advice and, because investment decisions for a Fidelity fund are based on numerous factors, may not be relied on as an indication of trading intent on behalf of any Fidelity fund.
Annual Report
Shareholder Expense Example
As a shareholder of the Fund, you incur two types of costs: (1) transaction costs, and (2) ongoing costs, including management fees and other Fund expenses. This Example is intended to help you understand your ongoing costs (in dollars) of investing in the Fund and to compare these costs with the ongoing costs of investing in other mutual funds.
The Example is based on an investment of $1,000 invested at the beginning of the period and held for the entire period (February 1, 2010 to July 31, 2010).
Actual Expenses
The first line of the accompanying table for each class of the Fund provides information about actual account values and actual expenses. You may use the information in this line, together with the amount you invested, to estimate the expenses that you paid over the period. Simply divide your account value by $1,000.00 (for example, an $8,600 account value divided by $1,000.00 = 8.6), then multiply the result by the number in the first line for a class of the Fund under the heading entitled "Expenses Paid During Period" to estimate the expenses you paid on your account during this period. A small balance maintenance fee of $12.00 that is charged once a year may apply for certain accounts with a value of less than $2,000. This fee is not included in the table below. If it was, the estimate of expenses you paid during the period would be higher, and your ending account value lower, by this amount. In addition, the Fund, as a shareholder in the underlying Fidelity Central Funds, will indirectly bear its pro-rata share of the fees and expenses incurred by the underlying Fidelity Central Funds. These fees and expenses are not included in the Fund's annualized expense ratio used to calculate the expense estimate in the table below.
Hypothetical Example for Comparison Purposes
The second line of the accompanying table for each class of the Fund provides information about hypothetical account values and hypothetical expenses based on a Class' actual expense ratio and an assumed rate of return of 5% per year before expenses, which is not the Class' actual return. The hypothetical account values and expenses may not be used to estimate the actual ending account balance or expenses you paid for the period. You may use this information to compare the ongoing costs of investing in the Fund and other funds. To do so, compare this 5% hypothetical example with the 5% hypothetical examples that appear in the shareholder reports of the other funds. A small balance maintenance fee of $12.00 that is charged once a year may apply for certain accounts with a value of less than $2,000. This fee is not included in the table below. If it was, the estimate of expenses you paid during the period would be higher, and your ending account value lower, by this amount. In addition, the Fund, as a shareholder in the underlying Fidelity Central Funds, will indirectly bear its pro-rata share of the fees and expenses incurred by the underlying Fidelity Central Funds. These fees and expenses are not included in the Fund's annualized expense ratio used to calculate the expense estimate in the table below.
Please note that the expenses shown in the table are meant to highlight your ongoing costs only and do not reflect any transaction costs. Therefore, the second line of the table is useful in comparing ongoing costs only, and will not help you determine the relative total costs of owning different funds.
Annual Report
| Annualized
Expense Ratio | Beginning
Account Value
February 1, 2010 | Ending
Account Value
July 31, 2010 | Expenses Paid
During Period*
February 1, 2010 to July 31, 2010 |
Blue Chip Growth | .97% | | | |
Actual | | $ 1,000.00 | $ 1,048.20 | $ 4.93 |
HypotheticalA | | $ 1,000.00 | $ 1,019.98 | $ 4.86 |
Class K | .78% | | | |
Actual | | $ 1,000.00 | $ 1,049.00 | $ 3.96 |
HypotheticalA | | $ 1,000.00 | $ 1,020.93 | $ 3.91 |
Class F | .71% | | | |
Actual | | $ 1,000.00 | $ 1,049.30 | $ 3.61 |
HypotheticalA | | $ 1,000.00 | $ 1,021.27 | $ 3.56 |
A 5% return per year before expenses
* Expenses are equal to each Class' annualized expense ratio, multiplied by the average account value over the period, multiplied by 181/365 (to reflect the one-half year period).
Annual Report
Investment Changes (Unaudited)
Top Ten Stocks as of July 31, 2010 |
| % of fund's
net assets | % of fund's net assets
6 months ago |
Apple, Inc. | 6.6 | 5.1 |
Google, Inc. Class A | 3.2 | 4.2 |
Hewlett-Packard Co. | 3.0 | 2.7 |
Exxon Mobil Corp. | 2.4 | 0.0 |
Amazon.com, Inc. | 2.1 | 1.8 |
Cisco Systems, Inc. | 2.0 | 2.1 |
QUALCOMM, Inc. | 1.7 | 1.6 |
Philip Morris International, Inc. | 1.6 | 0.8 |
Target Corp. | 1.4 | 1.7 |
Research In Motion Ltd. | 1.4 | 1.1 |
| 25.4 | |
Top Five Market Sectors as of July 31, 2010 |
| % of fund's
net assets | % of fund's net assets
6 months ago |
Information Technology | 35.1 | 36.4 |
Consumer Discretionary | 15.1 | 12.7 |
Industrials | 13.6 | 9.1 |
Consumer Staples | 8.1 | 11.4 |
Financials | 7.8 | 8.8 |
Asset Allocation (% of fund's net assets) |
As of July 31, 2010* | As of January 31, 2010** |
| Stocks 99.5% | | | Stocks 99.7% | |
| Convertible
Securities 0.0% | | | Convertible
Securities 0.1% | |
| Short-Term
Investments and
Net Other Assets 0.5% | | | Short-Term
Investments and
Net Other Assets 0.2% | |
* Foreign investments | 8.6% | | ** Foreign investments | 7.7% | |

Annual Report
Investments July 31, 2010
Showing Percentage of Net Assets
Common Stocks - 99.3% |
| Shares | | Value (000s) |
CONSUMER DISCRETIONARY - 14.9% |
Automobiles - 1.2% |
Bajaj Auto Ltd. | 307,614 | | $ 17,826 |
Bayerische Motoren Werke AG (BMW) | 513,708 | | 27,659 |
Ford Motor Co. (a) | 5,046,300 | | 64,441 |
Hyundai Motor Co. | 95,676 | | 12,053 |
Tesla Motors, Inc. (a) | 1,059,000 | | 21,116 |
| | 143,095 |
Diversified Consumer Services - 0.3% |
Coinstar, Inc. (a) | 743,594 | | 33,834 |
Hotels, Restaurants & Leisure - 3.8% |
Chipotle Mexican Grill, Inc. (a) | 125,500 | | 18,561 |
Genting International PLC (a) | 7,982,000 | | 7,454 |
Las Vegas Sands Corp. (a)(d) | 3,715,000 | | 99,785 |
Marriott International, Inc. Class A | 1,213,400 | | 41,146 |
McDonald's Corp. | 344,000 | | 23,987 |
Starbucks Corp. | 4,457,400 | | 110,766 |
Starwood Hotels & Resorts Worldwide, Inc. | 1,248,000 | | 60,466 |
WMS Industries, Inc. (a) | 623,800 | | 24,023 |
Wyndham Worldwide Corp. | 1,872,885 | | 47,815 |
| | 434,003 |
Household Durables - 0.9% |
Furniture Brands International, Inc. (a)(e) | 2,927,549 | | 16,160 |
Harman International Industries, Inc. (a) | 613,400 | | 18,653 |
Stanley Black & Decker, Inc. | 780,700 | | 45,296 |
Tempur-Pedic International, Inc. (a) | 789,200 | | 24,205 |
| | 104,314 |
Internet & Catalog Retail - 2.1% |
Amazon.com, Inc. (a) | 2,080,800 | | 245,306 |
Media - 1.4% |
Comcast Corp. Class A | 1,223,700 | | 23,825 |
DIRECTV (a) | 1,778,019 | | 66,071 |
DISH Network Corp. Class A | 898,200 | | 18,036 |
ReachLocal, Inc. | 19,922 | | 277 |
The Walt Disney Co. | 857,300 | | 28,882 |
Time Warner Cable, Inc. | 520,700 | | 29,768 |
| | 166,859 |
Multiline Retail - 2.7% |
Kohl's Corp. (a) | 822,400 | | 39,220 |
Common Stocks - continued |
| Shares | | Value (000s) |
CONSUMER DISCRETIONARY - continued |
Multiline Retail - continued |
Macy's, Inc. | 5,592,700 | | $ 104,304 |
Target Corp. | 3,220,200 | | 165,261 |
| | 308,785 |
Specialty Retail - 1.6% |
Foot Locker, Inc. | 1,739,600 | | 23,641 |
Home Depot, Inc. | 1,148,800 | | 32,752 |
Limited Brands, Inc. | 594,800 | | 15,251 |
Lowe's Companies, Inc. | 3,326,400 | | 68,990 |
RadioShack Corp. | 1,136,433 | | 24,479 |
rue21, Inc. | 458,250 | | 13,899 |
| | 179,012 |
Textiles, Apparel & Luxury Goods - 0.9% |
Coach, Inc. | 798,400 | | 29,517 |
Liz Claiborne, Inc. (a)(d) | 1,478,217 | | 7,007 |
NIKE, Inc. Class B | 257,300 | | 18,948 |
Phillips-Van Heusen Corp. | 269,300 | | 13,974 |
Polo Ralph Lauren Corp. Class A | 224,600 | | 17,746 |
Under Armour, Inc. Class A (sub. vtg.) (a)(d) | 413,000 | | 15,512 |
| | 102,704 |
TOTAL CONSUMER DISCRETIONARY | | 1,717,912 |
CONSUMER STAPLES - 8.1% |
Beverages - 3.0% |
Anheuser-Busch InBev SA NV | 798,981 | | 42,315 |
Coca-Cola Enterprises, Inc. | 509,100 | | 14,611 |
Dr Pepper Snapple Group, Inc. | 2,471,300 | | 92,797 |
PepsiCo, Inc. | 558,500 | | 36,252 |
The Coca-Cola Co. | 2,864,500 | | 157,863 |
| | 343,838 |
Food & Staples Retailing - 1.7% |
CVS Caremark Corp. | 2,088,500 | | 64,096 |
Kroger Co. | 1,943,000 | | 41,153 |
Walgreen Co. | 1,643,600 | | 46,925 |
Whole Foods Market, Inc. (a) | 1,102,100 | | 41,847 |
| | 194,021 |
Food Products - 0.5% |
Diamond Foods, Inc. (d) | 374,000 | | 16,658 |
Common Stocks - continued |
| Shares | | Value (000s) |
CONSUMER STAPLES - continued |
Food Products - continued |
Green Mountain Coffee Roasters, Inc. (a) | 1,044,400 | | $ 32,157 |
Mead Johnson Nutrition Co. Class A | 103,400 | | 5,495 |
| | 54,310 |
Household Products - 1.3% |
Kimberly-Clark Corp. | 1,176,200 | | 75,418 |
Procter & Gamble Co. | 1,193,600 | | 73,001 |
| | 148,419 |
Personal Products - 0.0% |
Emami Ltd. | 631,338 | | 6,231 |
Tobacco - 1.6% |
Philip Morris International, Inc. | 3,675,000 | | 187,572 |
TOTAL CONSUMER STAPLES | | 934,391 |
ENERGY - 7.4% |
Energy Equipment & Services - 1.4% |
Halliburton Co. | 356,400 | | 10,649 |
National Oilwell Varco, Inc. | 935,700 | | 36,642 |
Schlumberger Ltd. | 1,251,200 | | 74,647 |
Transocean Ltd. (a) | 400,200 | | 18,493 |
Weatherford International Ltd. (a) | 1,116,200 | | 18,082 |
| | 158,513 |
Oil, Gas & Consumable Fuels - 6.0% |
Alpha Natural Resources, Inc. (a) | 560,000 | | 21,465 |
Anadarko Petroleum Corp. | 961,700 | | 47,277 |
Chevron Corp. | 578,400 | | 44,080 |
ConocoPhillips | 233,500 | | 12,894 |
EOG Resources, Inc. | 1,027,100 | | 100,142 |
Exxon Mobil Corp. | 4,575,300 | | 273,054 |
Marathon Oil Corp. | 540,800 | | 18,090 |
Massey Energy Co. | 1,253,800 | | 38,341 |
Occidental Petroleum Corp. | 1,111,200 | | 86,596 |
Reliance Industries Ltd. | 373,169 | | 8,123 |
Sunoco, Inc. | 1,284,200 | | 45,807 |
| | 695,869 |
TOTAL ENERGY | | 854,382 |
Common Stocks - continued |
| Shares | | Value (000s) |
FINANCIALS - 7.8% |
Capital Markets - 1.4% |
Goldman Sachs Group, Inc. | 270,900 | | $ 40,857 |
Morgan Stanley | 4,212,500 | | 113,695 |
| | 154,552 |
Commercial Banks - 1.5% |
Axis Bank Ltd. | 311,281 | | 9,016 |
Bank of Baroda | 158,405 | | 2,672 |
Punjab National Bank | 327,071 | | 8,118 |
Regions Financial Corp. | 4,116,900 | | 30,177 |
SunTrust Banks, Inc. | 680,700 | | 17,664 |
Synovus Financial Corp. | 2,594,976 | | 6,799 |
Wells Fargo & Co. | 3,707,100 | | 102,798 |
| | 177,244 |
Consumer Finance - 0.9% |
American Express Co. | 2,368,200 | | 105,716 |
Diversified Financial Services - 2.6% |
Citigroup, Inc. (a) | 32,696,800 | | 134,057 |
Infrastructure Development Finance Co. Ltd. | 852,826 | | 3,419 |
JPMorgan Chase & Co. | 3,525,700 | | 142,015 |
NBH Holdings Corp. Class A (a)(f) | 347,410 | | 6,774 |
Rural Electrification Corp. Ltd. | 2,406,330 | | 16,357 |
| | 302,622 |
Insurance - 0.7% |
Assured Guaranty Ltd. | 1,971,300 | | 30,949 |
Genworth Financial, Inc. Class A (a) | 3,268,300 | | 44,384 |
| | 75,333 |
Real Estate Management & Development - 0.7% |
Ackruti City Ltd. | 1,950,000 | | 21,009 |
CB Richard Ellis Group, Inc. Class A (a) | 1,461,000 | | 24,837 |
Emami Infrastructure Ltd. (a) | 105,223 | | 204 |
Indiabulls Real Estate Ltd. (a) | 5,411,272 | | 19,103 |
Parsvnath Developers Ltd. (a) | 6,435,670 | | 18,023 |
| | 83,176 |
TOTAL FINANCIALS | | 898,643 |
HEALTH CARE - 7.4% |
Biotechnology - 3.2% |
Alkermes, Inc. (a) | 917,100 | | 11,831 |
Amgen, Inc. (a) | 1,321,500 | | 72,061 |
Amylin Pharmaceuticals, Inc. (a) | 2,132,700 | | 40,351 |
Common Stocks - continued |
| Shares | | Value (000s) |
HEALTH CARE - continued |
Biotechnology - continued |
Cephalon, Inc. (a) | 187,600 | | $ 10,646 |
Dendreon Corp. (a) | 1,039,281 | | 34,203 |
Genzyme Corp. (a) | 372,700 | | 25,925 |
Gilead Sciences, Inc. (a) | 2,202,800 | | 73,397 |
Human Genome Sciences, Inc. (a) | 1,012,500 | | 26,264 |
ImmunoGen, Inc. (a) | 547,037 | | 5,159 |
Micromet, Inc. (a) | 1,322,420 | | 9,059 |
Vertex Pharmaceuticals, Inc. (a) | 1,674,100 | | 56,350 |
| | 365,246 |
Health Care Equipment & Supplies - 0.2% |
Hologic, Inc. (a) | 425,800 | | 6,021 |
NuVasive, Inc. (a) | 640,300 | | 20,983 |
| | 27,004 |
Health Care Providers & Services - 2.5% |
Express Scripts, Inc. (a) | 3,218,980 | | 145,434 |
McKesson Corp. | 1,063,100 | | 66,784 |
Medco Health Solutions, Inc. (a) | 1,687,100 | | 80,981 |
| | 293,199 |
Health Care Technology - 0.7% |
Allscripts-Misys Healthcare Solutions, Inc. (a) | 1,355,300 | | 22,620 |
Cerner Corp. (a) | 679,300 | | 52,612 |
| | 75,232 |
Life Sciences Tools & Services - 0.3% |
Illumina, Inc. (a) | 300,000 | | 13,449 |
Life Technologies Corp. (a) | 524,300 | | 22,540 |
| | 35,989 |
Pharmaceuticals - 0.5% |
Allergan, Inc. | 590,700 | | 36,068 |
Forest Laboratories, Inc. (a) | 400,000 | | 11,100 |
Merck & Co., Inc. | 442,500 | | 15,249 |
| | 62,417 |
TOTAL HEALTH CARE | | 859,087 |
INDUSTRIALS - 13.6% |
Aerospace & Defense - 2.9% |
Honeywell International, Inc. | 1,338,900 | | 57,385 |
Precision Castparts Corp. | 666,600 | | 81,452 |
Common Stocks - continued |
| Shares | | Value (000s) |
INDUSTRIALS - continued |
Aerospace & Defense - continued |
The Boeing Co. | 618,200 | | $ 42,124 |
United Technologies Corp. | 2,131,700 | | 151,564 |
| | 332,525 |
Air Freight & Logistics - 0.5% |
C.H. Robinson Worldwide, Inc. | 94,800 | | 6,181 |
United Parcel Service, Inc. Class B | 799,500 | | 51,968 |
| | 58,149 |
Airlines - 1.9% |
Continental Airlines, Inc. Class B (a) | 1,243,300 | | 31,107 |
Delta Air Lines, Inc. (a) | 5,031,700 | | 59,777 |
UAL Corp. (a) | 4,742,800 | | 112,594 |
US Airways Group, Inc. (a) | 1,991,700 | | 21,610 |
| | 225,088 |
Commercial Services & Supplies - 0.1% |
Republic Services, Inc. | 384,800 | | 12,260 |
Construction & Engineering - 1.2% |
Fluor Corp. | 1,750,800 | | 84,546 |
Jacobs Engineering Group, Inc. (a) | 1,212,771 | | 44,351 |
KBR, Inc. | 608,300 | | 13,614 |
| | 142,511 |
Industrial Conglomerates - 1.1% |
3M Co. | 731,200 | | 62,547 |
General Electric Co. | 2,982,800 | | 48,083 |
Textron, Inc. | 630,200 | | 13,083 |
| | 123,713 |
Machinery - 4.3% |
ArvinMeritor, Inc. (a) | 476,024 | | 7,812 |
Bucyrus International, Inc. Class A | 1,187,800 | | 73,905 |
Caterpillar, Inc. | 667,500 | | 46,558 |
Cummins, Inc. | 1,066,500 | | 84,904 |
Danaher Corp. | 1,397,700 | | 53,686 |
Ingersoll-Rand Co. Ltd. | 3,423,400 | | 128,241 |
Joy Global, Inc. | 224,137 | | 13,307 |
PACCAR, Inc. | 1,522,500 | | 69,761 |
Pall Corp. | 319,900 | | 12,233 |
Thermax Ltd. | 211,215 | | 3,456 |
| | 493,863 |
Common Stocks - continued |
| Shares | | Value (000s) |
INDUSTRIALS - continued |
Professional Services - 0.3% |
Manpower, Inc. | 798,700 | | $ 38,322 |
Road & Rail - 1.2% |
CSX Corp. | 843,400 | | 44,464 |
Union Pacific Corp. | 1,275,700 | | 95,257 |
| | 139,721 |
Trading Companies & Distributors - 0.1% |
Adani Enterprises Ltd. | 571,688 | | 7,196 |
TOTAL INDUSTRIALS | | 1,573,348 |
INFORMATION TECHNOLOGY - 35.1% |
Communications Equipment - 5.9% |
Acme Packet, Inc. (a) | 579,500 | | 16,377 |
Cisco Systems, Inc. (a) | 9,875,700 | | 227,832 |
DG FastChannel, Inc. (a) | 854,760 | | 32,592 |
Juniper Networks, Inc. (a) | 638,000 | | 17,724 |
Motorola, Inc. (a) | 3,811,700 | | 28,550 |
QUALCOMM, Inc. | 5,182,400 | | 197,346 |
Research In Motion Ltd. (a) | 2,756,700 | | 158,593 |
| | 679,014 |
Computers & Peripherals - 11.1% |
Apple, Inc. (a) | 2,946,300 | | 757,927 |
Dell, Inc. (a) | 1,180,700 | | 15,632 |
Hewlett-Packard Co. | 7,541,400 | | 347,206 |
Isilon Systems, Inc. (a) | 351,700 | | 6,169 |
NetApp, Inc. (a) | 1,877,700 | | 79,427 |
SanDisk Corp. (a) | 795,187 | | 34,750 |
STEC, Inc. (a) | 230,500 | | 3,596 |
Western Digital Corp. (a) | 1,290,400 | | 34,054 |
| | 1,278,761 |
Electronic Equipment & Components - 0.8% |
Agilent Technologies, Inc. (a) | 3,466,655 | | 96,824 |
Internet Software & Services - 5.1% |
Akamai Technologies, Inc. (a) | 2,064,300 | | 79,187 |
Baidu.com, Inc. sponsored ADR (a) | 668,800 | | 54,447 |
Google, Inc. Class A (a) | 760,900 | | 368,922 |
Monster Worldwide, Inc. (a)(d) | 2,970,649 | | 40,757 |
Common Stocks - continued |
| Shares | | Value (000s) |
INFORMATION TECHNOLOGY - continued |
Internet Software & Services - continued |
OpenTable, Inc. (a)(d) | 337,051 | | $ 15,066 |
Rackspace Hosting, Inc. (a) | 1,459,800 | | 27,298 |
| | 585,677 |
IT Services - 3.1% |
Alliance Data Systems Corp. (a) | 202,400 | | 11,634 |
Cognizant Technology Solutions Corp. Class A (a) | 1,139,800 | | 62,187 |
MasterCard, Inc. Class A | 749,100 | | 157,341 |
Visa, Inc. Class A | 1,780,400 | | 130,592 |
| | 361,754 |
Office Electronics - 0.4% |
Xerox Corp. | 5,282,200 | | 51,449 |
Semiconductors & Semiconductor Equipment - 4.3% |
Altera Corp. | 2,393,000 | | 66,334 |
ARM Holdings PLC sponsored ADR | 409,500 | | 6,327 |
Avago Technologies Ltd. | 1,641,700 | | 35,723 |
Broadcom Corp. Class A | 2,672,400 | | 96,287 |
Cree, Inc. (a) | 200,500 | | 14,203 |
First Solar, Inc. (a) | 130,400 | | 16,359 |
Intel Corp. | 1,109,217 | | 22,850 |
Lam Research Corp. (a) | 1,911,700 | | 80,655 |
Marvell Technology Group Ltd. (a) | 7,311,000 | | 109,080 |
MEMC Electronic Materials, Inc. (a) | 2,111,200 | | 20,183 |
Silicon Laboratories, Inc. (a) | 461,100 | | 18,467 |
Trina Solar Ltd. ADR (a)(d) | 539,700 | | 11,733 |
| | 498,201 |
Software - 4.4% |
Autonomy Corp. PLC (a) | 324,900 | | 8,382 |
Check Point Software Technologies Ltd. (a) | 1,523,600 | | 51,833 |
Citrix Systems, Inc. (a) | 630,500 | | 34,690 |
Informatica Corp. (a) | 1,193,700 | | 35,966 |
Microsoft Corp. | 6,000,600 | | 154,875 |
Nuance Communications, Inc. (a) | 1,889,000 | | 31,187 |
Oracle Corp. | 1,900,500 | | 44,928 |
QLIK Technologies, Inc. | 484,100 | | 6,957 |
Red Hat, Inc. (a) | 2,023,300 | | 65,049 |
Salesforce.com, Inc. (a) | 158,800 | | 15,713 |
SuccessFactors, Inc. (a) | 199,100 | | 4,044 |
Common Stocks - continued |
| Shares | | Value (000s) |
INFORMATION TECHNOLOGY - continued |
Software - continued |
TeleNav, Inc. | 125,000 | | $ 680 |
VMware, Inc. Class A (a) | 618,500 | | 47,952 |
| | 502,256 |
TOTAL INFORMATION TECHNOLOGY | | 4,053,936 |
MATERIALS - 3.9% |
Chemicals - 2.5% |
Asian Paints India Ltd. | 44,645 | | 2,506 |
CF Industries Holdings, Inc. | 401,400 | | 32,590 |
Dow Chemical Co. | 3,468,700 | | 94,800 |
Monsanto Co. | 1,943,700 | | 112,424 |
The Mosaic Co. | 1,054,900 | | 50,266 |
| | 292,586 |
Containers & Packaging - 0.8% |
Ball Corp. | 220,500 | | 12,842 |
Owens-Illinois, Inc. (a) | 1,020,762 | | 28,224 |
Pactiv Corp. (a) | 1,524,300 | | 46,369 |
| | 87,435 |
Metals & Mining - 0.6% |
Allegheny Technologies, Inc. | 155,800 | | 7,418 |
Carpenter Technology Corp. | 218,500 | | 7,637 |
Freeport-McMoRan Copper & Gold, Inc. | 584,600 | | 41,822 |
Titanium Metals Corp. (a) | 369,600 | | 8,183 |
| | 65,060 |
TOTAL MATERIALS | | 445,081 |
TELECOMMUNICATION SERVICES - 1.1% |
Diversified Telecommunication Services - 0.0% |
China Unicom (Hong Kong) Ltd. sponsored ADR | 423,500 | | 5,777 |
Wireless Telecommunication Services - 1.1% |
NII Holdings, Inc. (a) | 306,000 | | 11,463 |
Reliance Communication Ltd. | 887,130 | | 3,418 |
Common Stocks - continued |
| Shares | | Value (000s) |
TELECOMMUNICATION SERVICES - continued |
Wireless Telecommunication Services - continued |
SOFTBANK CORP. | 714,900 | | $ 21,383 |
Sprint Nextel Corp. (a) | 19,819,900 | | 90,577 |
| | 126,841 |
TOTAL TELECOMMUNICATION SERVICES | | 132,618 |
TOTAL COMMON STOCKS (Cost $9,668,137) | 11,469,398 |
Nonconvertible Preferred Stocks - 0.2% |
| | | |
CONSUMER DISCRETIONARY - 0.2% |
Automobiles - 0.2% |
Volkswagen AG | 170,700 | | 18,090 |
TOTAL NONCONVERTIBLE PREFERRED STOCKS (Cost $18,090) | 18,090 |
Money Market Funds - 1.1% |
| | | |
Fidelity Cash Central Fund, 0.24% (b) | 28,827,628 | | 28,828 |
Fidelity Securities Lending Cash Central Fund, 0.27% (b)(c) | 96,631,450 | | 96,631 |
TOTAL MONEY MARKET FUNDS (Cost $125,459) | 125,459 |
TOTAL INVESTMENT PORTFOLIO - 100.6% (Cost $9,811,686) | | 11,612,947 |
NET OTHER ASSETS (LIABILITIES) - (0.6)% | | (64,727) |
NET ASSETS - 100% | $ 11,548,220 |
Legend |
(a) Non-income producing |
(b) Affiliated fund that is available only to investment companies and other accounts managed by Fidelity Investments. The rate quoted is the annualized seven-day yield of the fund at period end. A complete unaudited listing of the fund's holdings as of its most recent quarter end is available upon request. |
(c) Investment made with cash collateral received from securities on loan. |
(d) Security or a portion of the security is on loan at period end. |
(e) Affiliated company |
(f) Security exempt from registration under Rule 144A of the Securities Act of 1933. These securities may be resold in transactions exempt from registration, normally to qualified institutional buyers. At the end of the period, the value of these securities amounted to $6,774,000 or 0.1% of net assets. |
Affiliated Central Funds |
Information regarding fiscal year to date income earned by the Fund from investments in Fidelity Central Funds is as follows: |
Fund | Income earned
(Amounts in thousands) |
Fidelity Cash Central Fund | $ 33 |
Fidelity Securities Lending Cash Central Fund | 263 |
Total | $ 296 |
Other Affiliated Issuers |
An affiliated company is a company in which the fund has ownership of at least 5% of the voting securities. Fiscal year to date transactions with companies which are or were affiliates are as follows: |
Affiliate
(Amounts in thousands) | Value, beginning of period | Purchases | Sales Proceeds | Dividend Income | Value,
end of
period |
Furniture Brands International, Inc. | $ 19,567 | $ 202 | $ 12,871 | $ - | $ 16,160 |
Total | $ 19,567 | $ 202 | $ 12,871 | $ - | $ 16,160 |
Other Information |
The following is a summary of the inputs used, as of July 31, 2010, involving the Fund's assets and liabilities carried at fair value. The inputs or methodology used for valuing securities may not be an indication of the risk associated with investing in those securities. For more information on valuation inputs, and their aggregation into the levels used in the tables below, please refer to the Security Valuation section in the accompanying Notes to Financial Statements. |
Valuation Inputs at Reporting Date: |
Description
(Amounts in thousands) | Total | Level 1 | Level 2 | Level 3 |
Investments in Securities: | | | | |
Equities: | | | | |
Consumer Discretionary | $ 1,736,002 | $ 1,736,002 | $ - | $ - |
Consumer Staples | 934,595 | 934,595 | - | - |
Energy | 854,382 | 854,382 | - | - |
Financials | 898,439 | 864,518 | 27,147 | 6,774 |
Health Care | 859,087 | 859,087 | - | - |
Industrials | 1,573,348 | 1,573,348 | - | - |
Information Technology | 4,053,936 | 4,053,936 | - | - |
Materials | 445,081 | 445,081 | - | - |
Telecommunication Services | 132,618 | 132,618 | - | - |
Money Market Funds | 125,459 | 125,459 | - | - |
Total Investments in Securities: | $ 11,612,947 | $ 11,579,026 | $ 27,147 | $ 6,774 |
The following is a reconciliation of Investments in Securities for which Level 3 inputs were used in determining value: |
(Amounts in thousands) | |
Investments in Securities: | |
Beginning Balance | $ - |
Total Realized Gain (Loss) | (74) |
Total Unrealized Gain (Loss) | (175) |
Cost of Purchases | 8,882 |
Proceeds of Sales | (1,859) |
Amortization/Accretion | - |
Transfers in to Level 3 | - |
Transfers out of Level 3 | - |
Ending Balance | $ 6,774 |
The change in unrealized gain (loss) for the period attributable to Level 3 securities held at July 31, 2010 | $ (175) |
The information used in the above reconciliation represents fiscal year to date activity for any Investments in Securities identified as using Level 3 inputs at either the beginning or the end of the current fiscal period. Transfers in or out of Level 3 represent the beginning value of any Security or Instrument where a change in the pricing level occurred from the beginning to the end of the period. The cost of purchases and the proceeds of sales may include securities received or delivered through corporate actions or exchanges. Realized and unrealized gains (losses) disclosed in the reconciliation are included in Net Gain (Loss) on the Fund's Statement of Operations. |
Income Tax Information |
At July 31, 2010, the Fund had a capital loss carryforward of approximately $1,028,059,000 of which $671,371,000 and $356,688,000 will expire on July 31, 2017 and 2018, respectively. Capital loss carryforwards are only available to offset future capital gains of the Fund to the extent provided by regulations and may be limited. |
See accompanying notes which are an integral part of the financial statements.
Annual Report
Statement of Assets and Liabilities
Amounts in thousands (except per-share amounts) | July 31, 2010 |
| | |
Assets | | |
Investment in securities, at value (including securities loaned of $94,422) - See accompanying schedule: Unaffiliated issuers (cost $9,661,717) | $ 11,471,328 | |
Fidelity Central Funds (cost $125,459) | 125,459 | |
Other affiliated issuers (cost $24,510) | 16,160 | |
Total Investments (cost $9,811,686) | | $ 11,612,947 |
Foreign currency held at value (cost $300) | | 291 |
Receivable for investments sold | | 247,977 |
Receivable for fund shares sold | | 10,336 |
Dividends receivable | | 3,356 |
Distributions receivable from Fidelity Central Funds | | 32 |
Other receivables | | 1,561 |
Total assets | | 11,876,500 |
| | |
Liabilities | | |
Payable for investments purchased | $ 206,290 | |
Payable for fund shares redeemed | 16,071 | |
Accrued management fee | 6,463 | |
Other affiliated payables | 2,267 | |
Other payables and accrued expenses | 558 | |
Collateral on securities loaned, at value | 96,631 | |
Total liabilities | | 328,280 |
| | |
Net Assets | | $ 11,548,220 |
Net Assets consist of: | | |
Paid in capital | | $ 10,852,889 |
Undistributed net investment income | | 2,062 |
Accumulated undistributed net realized gain (loss) on investments and foreign currency transactions | | (1,107,768) |
Net unrealized appreciation (depreciation) on investments and assets and liabilities in foreign currencies | | 1,801,037 |
Net Assets | | $ 11,548,220 |
See accompanying notes which are an integral part of the financial statements.
Annual Report
Financial Statements - continued
Statement of Assets and Liabilities - continued
Amounts in thousands (except per-share amounts) | July 31, 2010 |
| | |
Blue Chip Growth:
Net Asset Value, offering price and redemption price per share ($10,295,210 ÷ 273,613 shares) | | $ 37.63 |
| | |
Class K:
Net Asset Value, offering price and redemption price per share ($931,601 ÷ 24,735 shares) | | $ 37.66 |
| | |
Class F:
Net Asset Value, offering price and redemption price per share ($321,409 ÷ 8,528 shares) | | $ 37.69 |
See accompanying notes which are an integral part of the financial statements.
Annual Report
Statement of Operations
Amounts in thousands | Year ended July 31, 2010 |
| | |
Investment Income | | |
Dividends | | $ 119,693 |
Interest | | 1 |
Income from Fidelity Central Funds | | 296 |
Total income | | 119,990 |
| | |
Expenses | | |
Management fee
Basic fee | $ 65,083 | |
Performance adjustment | 13,734 | |
Transfer agent fees | 27,053 | |
Accounting and security lending fees | 1,459 | |
Custodian fees and expenses | 297 | |
Independent trustees' compensation | 67 | |
Registration fees | 121 | |
Audit | 93 | |
Legal | 65 | |
Interest | 11 | |
Miscellaneous | 190 | |
Total expenses before reductions | 108,173 | |
Expense reductions | (1,805) | 106,368 |
Net investment income (loss) | | 13,622 |
Realized and Unrealized Gain (Loss) Net realized gain (loss) on: | | |
Investment securities: | | |
Unaffiliated issuers | 1,074,390 | |
Other affiliated issuers | (18,675) | |
Foreign currency transactions | (690) | |
Capital gain distributions from Fidelity Central Funds | 3 | |
Total net realized gain (loss) | | 1,055,028 |
Change in net unrealized appreciation (depreciation) on: Investment securities (net of increase in deferred foreign taxes of $49) | 793,523 | |
Assets and liabilities in foreign currencies | (176) | |
Total change in net unrealized appreciation (depreciation) | | 793,347 |
Net gain (loss) | | 1,848,375 |
Net increase (decrease) in net assets resulting from operations | | $ 1,861,997 |
See accompanying notes which are an integral part of the financial statements.
Annual Report
Financial Statements - continued
Statement of Changes in Net Assets
Amounts in thousands | Year ended
July 31,
2010 | Year ended
July 31,
2009 |
Increase (Decrease) in Net Assets | | |
Operations | | |
Net investment income (loss) | $ 13,622 | $ 90,600 |
Net realized gain (loss) | 1,055,028 | (2,127,104) |
Change in net unrealized appreciation (depreciation) | 793,347 | (205,346) |
Net increase (decrease) in net assets resulting
from operations | 1,861,997 | (2,241,850) |
Distributions to shareholders from net investment income | (57,433) | (99,426) |
Distributions to shareholders from net realized gain | - | (242,439) |
Total distributions | (57,433) | (341,865) |
Share transactions - net increase (decrease) | (538,131) | (483,151) |
Total increase (decrease) in net assets | 1,266,433 | (3,066,866) |
| | |
Net Assets | | |
Beginning of period | 10,281,787 | 13,348,653 |
End of period (including undistributed net investment income of $2,062 and undistributed net investment income of $39,489, respectively) | $ 11,548,220 | $ 10,281,787 |
See accompanying notes which are an integral part of the financial statements.
Annual Report
Financial Highlights - Blue Chip Growth
Years ended July 31, | 2010 | 2009 | 2008 | 2007 | 2006 |
Selected Per-Share Data | | | | | |
Net asset value, beginning of period | $ 31.97 | $ 39.06 | $ 46.88 | $ 41.54 | $ 42.60 |
Income from Investment Operations | | | | | |
Net investment income (loss) B | .04 | .27 | .35 | .32 | .23 |
Net realized and unrealized gain (loss) | 5.80 | (6.36) | (2.89) | 6.19 | (1.06) |
Total from investment operations | 5.84 | (6.09) | (2.54) | 6.51 | (.83) |
Distributions from net investment income | (.18) | (.29) | (.33) | (.24) | (.23) |
Distributions from net realized gain | - | (.71) | (4.95) | (.93) | - |
Total distributions | (.18) | (1.00) | (5.28) | (1.17) | (.23) |
Net asset value, end of period | $ 37.63 | $ 31.97 | $ 39.06 | $ 46.88 | $ 41.54 |
Total Return A | 18.29% | (15.85)% | (6.30)% | 16.02% | (1.97)% |
Ratios to Average Net Assets C, E | | | | | |
Expenses before reductions | .94% | .76% | .58% | .60% | .63% |
Expenses net of fee waivers, if any | .94% | .76% | .58% | .60% | .63% |
Expenses net of all reductions | .93% | .76% | .57% | .59% | .61% |
Net investment income (loss) | .10% | .93% | .81% | .72% | .54% |
Supplemental Data | | | | | |
Net assets, end of period (in millions) | $ 10,295 | $ 9,691 | $ 13,349 | $ 18,616 | $ 19,571 |
Portfolio turnover rate D | 135% | 134% | 82% | 87% | 48% |
A Total returns would have been lower had certain expenses not been reduced during the periods shown.
B Calculated based on average shares outstanding during the period.
C Fees and expenses of the underlying Fidelity Central Funds are not included in the Fund's expense ratio. The Fund indirectly bears its proportionate share of the expenses of any underlying Fidelity Central Funds.
D Amount does not include the portfolio activity of any underlying Fidelity Central Funds.
E Expense ratios reflect operating expenses of the class. Expenses before reductions do not reflect amounts reimbursed by the investment adviser or reductions from brokerage service arrangements or reductions from other expense offset arrangements and do not represent the amount paid by the class during periods when reimbursements or reductions occur. Expenses net of fee waivers reflect expenses after reimbursement by the investment adviser but prior to reductions from brokerage service arrangements or other expense offset arrangements. Expenses net of all reductions represent the net expenses paid by the class.
See accompanying notes which are an integral part of the financial statements.
Annual Report
Financial Highlights - Class K
Years ended July 31, | 2010 | 2009 | 2008 G |
Selected Per-Share Data | | | |
Net asset value, beginning of period | $ 32.01 | $ 39.07 | $ 41.81 |
Income from Investment Operations | | | |
Net investment income (loss) D | .11 | .32 | .10 |
Net realized and unrealized gain (loss) | 5.79 | (6.33) | (2.84) |
Total from investment operations | 5.90 | (6.01) | (2.74) |
Distributions from net investment income | (.25) | (.34) | - |
Distributions from net realized gain | - | (.71) | - |
Total distributions | (.25) | (1.05) | - |
Net asset value, end of period | $ 37.66 | $ 32.01 | $ 39.07 |
Total Return B, C | 18.48% | (15.61)% | (6.55)% |
Ratios to Average Net Assets E, H | | | |
Expenses before reductions | .75% | .53% | .41% A |
Expenses net of fee waivers, if any | .75% | .53% | .41% A |
Expenses net of all reductions | .74% | .52% | .41% A |
Net investment income (loss) | .30% | 1.16% | 1.09% A |
Supplemental Data | | | |
Net assets, end of period (000 omitted) | $ 931,601 | $ 590,673 | $ 93 |
Portfolio turnover rate F | 135% | 134% | 82% |
A Annualized
B Total returns for periods of less than one year are not annualized.
C Total returns would have been lower had certain expenses not been reduced during the periods shown.
D Calculated based on average shares outstanding during the period.
E Fees and expenses of the underlying Fidelity Central Funds are not included in the Fund's expense ratio. The Fund indirectly bears its proportionate share of the expenses of any underlying Fidelity Central Funds.
F Amount does not include the portfolio activity of any underlying Fidelity Central Funds.
G For the period May 9, 2008 (commencement of sale of shares) to July 31, 2008.
H Expense ratios reflect operating expenses of the class. Expenses before reductions do not reflect amounts reimbursed by the investment adviser or reductions from brokerage service arrangements or reductions from other expense offset arrangements and do not represent the amount paid by the class during periods when reimbursements or reductions occur. Expense ratios before reductions for start-up periods may not be representative of longer-term operating periods. Expenses net of fee waivers reflect expenses after reimbursement by the investment adviser but prior to reductions from brokerage service arrangements or other expense offset arrangements. Expenses net of all reductions represent the net expenses paid by the class.
See accompanying notes which are an integral part of the financial statements.
Annual Report
Financial Highlights - Class F
Years ended July 31, | 2010 | 2009 H |
Selected Per-Share Data | | |
Net asset value, beginning of period | $ 31.98 | $ 29.16 |
Income from Investment Operations | | |
Net investment income (loss) D | .13 | - J |
Net realized and unrealized gain (loss) | 5.80 | 2.82 G |
Total from investment operations | 5.93 | 2.82 |
Distributions from net investment income | (.22) | - |
Net asset value, end of period | $ 37.69 | $ 31.98 |
Total Return B, C | 18.59% | 9.67% |
Ratios to Average Net Assets E, I | | |
Expenses before reductions | .70% | .51% A |
Expenses net of fee waivers, if any | .70% | .51% A |
Expenses net of all reductions | .68% | .51% A |
Net investment income (loss) | .35% | (.05)% A |
Supplemental Data | | |
Net assets, end of period (000 omitted) | $ 321,409 | $ 261 |
Portfolio turnover rate F | 135% | 134% |
A Annualized
B Total returns for periods of less than one year are not annualized.
C Total returns would have been lower had certain expenses not been reduced during the periods shown.
D Calculated based on average shares outstanding during the period.
E Fees and expenses of the underlying Fidelity Central Funds are not included in the Fund's expense ratio. The Fund indirectly bears its proportionate share of the expenses of any underlying Fidelity Central Funds.
F Amount does not include the portfolio activity of any underlying Fidelity Central Funds.
G The amount shown for a share outstanding does not correspond with the aggregate net gain (loss) on investments for the period due to the timing of sales and repurchases of shares in relation to fluctuating market values of the investments of the Fund.
H For the period June 26, 2009 (commencement of sale of shares) to July 31, 2009.
I Expense ratios reflect operating expenses of the class. Expenses before reductions do not reflect amounts reimbursed by the investment adviser or reductions from brokerage service arrangements or reductions from other expense offset arrangements and do not represent the amount paid by the class during periods when reimbursements or reductions occur. Expense ratios before reductions for start-up periods may not be representative of longer-term operating periods. Expenses net of fee waivers reflect expenses after reimbursement by the investment adviser but prior to reductions from brokerage service arrangements or other expense offset arrangements. Expenses net of all reductions represent the net expenses paid by the class.
J Amount represents less than $.01 per share.
See accompanying notes which are an integral part of the financial statements.
Annual Report
Notes to Financial Statements
For the period ended July 31, 2010
1. Organization.
Fidelity Blue Chip Growth Fund (the Fund) is a fund of Fidelity Securities Fund (the Trust) and is authorized to issue an unlimited number of shares. The Trust is registered under the Investment Company Act of 1940, as amended (the 1940 Act), as an open-end management investment company organized as a Massachusetts business trust. The Fund offers Blue Chip Growth, Class K and Class F shares, each of which has equal rights as to assets and voting privileges. Each class has exclusive voting rights with respect to matters that affect that class. After the commencement of Class K, the Fund began offering conversion privileges between Blue Chip Growth and Class K to eligible shareholders of Blue Chip Growth. In order to disclose class level financial information dollar amounts presented in the notes are unrounded. Class F shares of the Fund are only available for purchase by mutual funds for which Fidelity Management & Research Company (FMR) or an affiliate serves as investment manager. Investment income, realized and unrealized capital gains and losses, the common expenses of the Fund, and certain fund-level expense reductions, if any, are allocated on a pro-rata basis to each class based on the relative net assets of each class to the total net assets of the Fund. Each class differs with respect to transfer agent fees incurred. Certain expense reductions also differ by class.
2. Investments in Fidelity Central Funds.
The Fund may invest in Fidelity Central Funds, which are open-end investment companies available only to other investment companies and accounts managed by FMR and its affiliates. The Fund's Schedule of Investments lists each of the Fidelity Central Funds held as of period end, if any, as an investment of the Fund, but does not include the underlying holdings of each Fidelity Central Fund. As an Investing Fund, the Fund indirectly bears its proportionate share of the expenses of the underlying Fidelity Central Funds.
The Money Market Central Funds seek preservation of capital and current income and are managed by Fidelity Investments Money Management, Inc. (FIMM), an affiliate of FMR.
A complete unaudited list of holdings for each Fidelity Central Fund is available upon request or at the Securities and Exchange Commission (the SEC) web site at www.sec.gov. In addition, the financial statements of the Fidelity Central Funds which are not covered by the Fund's Report of Independent Registered Public Accounting Firm, are available on the SEC web site or upon request.
Annual Report
Notes to Financial Statements - continued
3. Significant Accounting Policies.
The financial statements have been prepared in conformity with accounting principles generally accepted in the United States of America (GAAP), which require management to make certain estimates and assumptions at the date of the financial statements. Actual results could differ from those estimates. The following summarizes the significant accounting policies of the Fund:
Security Valuation. Investments are valued as of 4:00 p.m. Eastern time on the last calendar day of the period. The Fund uses independent pricing services approved by the Board of Trustees to value its investments. When current market prices or quotations are not readily available or reliable, valuations may be determined in good faith in accordance with procedures adopted by the Board of Trustees. Factors used in determining value may include market or security specific events. The frequency with which these procedures are used cannot be predicted and they may be utilized to a significant extent. The value used for net asset value (NAV) calculation under these procedures may differ from published prices for the same securities.
The Fund categorizes the inputs to valuation techniques used to value its investments into a disclosure hierarchy consisting of three levels as shown below.
Level 1 - quoted prices in active markets for identical investments
Level 2 - other significant observable inputs (including quoted prices for similar investments, interest rates, prepayment speeds, etc.)
Level 3 - unobservable inputs (including the fund's own assumptions based on the best information available)
Changes in valuation techniques may result in transfers in or out of an assigned level within the disclosure hierarchy. The aggregate value of investments by input level, as of July 31, 2010, as well as a roll forward of Level 3 securities, is included at the end of the Fund's Schedule of Investments. Valuation techniques used to value the Fund's investments by major category are as follows.
Equity securities, including restricted securities, for which market quotations are readily available, are valued at the last reported sale price or official closing price as reported by an independent pricing service on the primary market or exchange on which they are traded and are categorized as Level 1 in the hierarchy. In the event there were no sales during the day or closing prices are not available, securities are valued at the last quoted bid price or may be valued using the last available price and are generally categorized as Level 2 in the hierarchy. For foreign equity securities, when significant market or security specific events arise, comparisons to the valuation of American Depositary Receipts (ADRs), futures contracts, Exchange-traded funds (ETFs) and certain indexes as well as
Annual Report
3. Significant Accounting Policies - continued
Security Valuation - continued
quoted prices for similar securities are used and are categorized as Level 2 in the hierarchy in these circumstances. Utilizing these techniques may result in transfers between Level 1 and Level 2. For restricted equity securities and private placements where observable inputs are limited, assumptions about market activity and risk are used and are categorized as Level 3 in the hierarchy.
Investments in open-end mutual funds, including the Fidelity Central Funds, are valued at their closing net asset value each business day and are categorized as Level 1 in the hierarchy. Short-term securities with remaining maturities of sixty days or less for which quotations are not readily available are valued at amortized cost, which approximates fair value and are categorized as Level 2 in the hierarchy.
Foreign Currency. The Fund uses foreign currency contracts to facilitate transactions in foreign-denominated securities. Gains and losses from these transactions may arise from changes in the value of the foreign currency or if the counterparties do not perform under the contracts' terms.
Foreign-denominated assets, including investment securities, and liabilities are translated into U.S. dollars at the exchange rate at period end. Purchases and sales of investment securities, income and dividends received and expenses denominated in foreign currencies are translated into U.S. dollars at the exchange rate in effect on the transaction date.
The effects of exchange rate fluctuations on investments are included with the net realized and unrealized gain (loss) on investment securities. Other foreign currency transactions resulting in realized and unrealized gain (loss) are disclosed separately.
Investment Transactions and Income. For financial reporting purposes, the Fund's investment holdings and NAV include trades executed through the end of the last business day of the period. The NAV per share for processing shareholder transactions is calculated as of the close of business of the New York Stock Exchange (NYSE), normally 4:00 p.m. Eastern time and includes trades executed through the end of the prior business day. Gains and losses on securities sold are determined on the basis of identified cost and may include proceeds received from litigation. Dividend income is recorded on the ex-dividend date, except for certain dividends from foreign securities where the ex-dividend date may have passed, which are recorded as soon as the Fund is informed of the ex-dividend date. Non-cash dividends included in dividend income, if any, are recorded at the fair market value of the securities received. Distributions received on securities that represent a return of capital or capital gain are recorded as a reduction of cost of investments and/or as a realized gain. The Fund estimates the components of distributions received that may be considered return of capital distributions or capital
Annual Report
Notes to Financial Statements - continued
3. Significant Accounting Policies - continued
Investment Transactions and Income - continued
gain distributions. Interest income and distributions from the Fidelity Central Funds are accrued as earned. Interest income includes coupon interest and amortization of premium and accretion of discount on debt securities. Investment income is recorded net of foreign taxes withheld where recovery of such taxes is uncertain.
Expenses. Most expenses of the Trust can be directly attributed to a fund. Expenses which cannot be directly attributed are apportioned amongst each fund in the Trust. Expense estimates are accrued in the period to which they relate and adjustments are made when actual amounts are known.
Deferred Trustee Compensation. Under a Deferred Compensation Plan (the Plan), independent Trustees may elect to defer receipt of a portion of their annual compensation. Deferred amounts are invested in a cross-section of Fidelity funds, are marked-to-market and remain in the Fund until distributed in accordance with the Plan. The investment of deferred amounts and the offsetting payable to the Trustees are included in the accompanying Statement of Assets and Liabilities.
Income Tax Information and Distributions to Shareholders. Each year the Fund intends to qualify as a regulated investment company, including distributing substantially all of its taxable income and realized gains under Subchapter M of the Internal Revenue Code and filing its U.S. federal tax return. As a result, no provision for income taxes is required. As of July 31, 2010, the Fund did not have any unrecognized tax benefits in the accompanying financial statements. A fund's federal tax return is subject to examination by the Internal Revenue Service (IRS) for a period of three years. Foreign taxes are provided for based on the Fund's understanding of the tax rules and rates that exist in the foreign markets in which it invests. The Fund is subject to a tax imposed on short term capital gains on securities of certain issuers domiciled in India. The Fund records an estimated deferred tax liability included in Other payables and accrued expenses in the accompanying Statement of Assets & Liabilities for net unrealized gains on these securities in an amount that would be payable if the securities were disposed of at period end.
Distributions are recorded on the ex-dividend date. Income dividends and capital gain distributions are declared separately for each class. Income and capital gain distributions are determined in accordance with income tax regulations, which may differ from GAAP.
Capital accounts within the financial statements are adjusted for permanent book-tax differences. These adjustments have no impact on net assets or the results of operations. Temporary book-tax differences will reverse in a subsequent period.
Annual Report
3. Significant Accounting Policies - continued
Income Tax Information and Distributions to Shareholders - continued
Book-tax differences are primarily due to the short-term gain distributions from the Fidelity Central Funds, foreign currency transactions, partnerships, deferred trustees compensation, capital loss carryforwards and losses due to deferred wash sales and excise tax regulations.
The federal tax cost of investment securities and unrealized appreciation (depreciation) as of period end were as follows:
Gross unrealized appreciation | $ 2,014,864,694 |
Gross unrealized depreciation | (293,312,547) |
Net unrealized appreciation (depreciation) | $ 1,721,552,147 |
| |
Tax Cost | $ 9,891,394,551 |
The tax-based components of distributable earnings as of period end were as follows:
Undistributed ordinary income | $ 2,446,191 |
Capital loss carryforward | $ (1,028,058,871) |
Net unrealized appreciation (depreciation) | $ 1,721,377,970 |
The tax character of distributions paid was as follows:
| July 31, 2010 | July 31, 2009 |
Ordinary Income | $ 57,433,084 | $ 99,425,655 |
Long-term Capital Gains | - | 242,439,162 |
Total | $ 57,433,084 | $ 341,864,817 |
4. Operating Policies.
Restricted Securities. The Fund may invest in securities that are subject to legal or contractual restrictions on resale. These securities generally may be resold in transactions exempt from registration or to the public if the securities are registered. Disposal of these securities may involve time-consuming negotiations and expense, and prompt sale at an acceptable price may be difficult. Information regarding restricted securities is included at the end of the Fund's Schedule of Investments.
5. Purchases and Sales of Investments.
Purchases and sales of securities, other than short-term securities, aggregated $15,348,328,246 and $15,969,181,366, respectively.
Annual Report
Notes to Financial Statements - continued
6. Fees and Other Transactions with Affiliates.
Management Fee. FMR and its affiliates provide the Fund with investment management related services for which the Fund pays a monthly management fee. The management fee is the sum of an individual fund fee rate that is based on an annual rate of .30% of the Fund's average net assets and a group fee rate that averaged .26% during the period. The group fee rate is based upon the average net assets of all the mutual funds advised by FMR. The group fee rate decreases as assets under management increase and increases as assets under management decrease. In addition, the management fee is subject to a performance adjustment (up to a maximum of ± .20% of the Fund's average net assets over a 36 month performance period). The upward or downward adjustment to the management fee is based on the relative investment performance of the retail class of the Fund, Blue Chip Growth as compared to an appropriate benchmark index. For the period, the total annual management fee rate, including the performance adjustment, was .68% of the Fund's average net assets.
Transfer Agent Fees. Fidelity Investments Institutional Operations Company, Inc. (FIIOC), an affiliate of FMR, is the transfer, dividend disbursing and shareholder servicing agent for each class of the Fund. FIIOC receives account fees and asset-based fees that vary according to the account size and type of account of the shareholders of Blue Chip Growth. FIIOC receives an asset-based fee of Class K's average net assets. FIIOC receives no fees for providing transfer agency services to Class F. FIIOC pays for typesetting, printing and mailing of shareholder reports, except proxy statements. For the period, the total transfer agent fees paid by each applicable class were as follows:
| Amount | % of
Average
Net Assets |
Blue Chip Growth | $ 26,634,828 | .25 |
Class K | 418,549 | .05 |
| $ 27,053,377 | |
Accounting and Security Lending Fees. Fidelity Service Company, Inc. (FSC), an affiliate of FMR, maintains the Fund's accounting records. The accounting fee is based on the level of average net assets for the month. Under a separate contract, FSC administers the security lending program. The security lending fee is based on the number and duration of lending transactions.
Brokerage Commissions. The Fund placed a portion of its portfolio transactions with brokerage firms which are affiliates of the investment adviser. The commissions paid to these affiliated firms were $364,789 for the period.
Annual Report
6. Fees and Other Transactions with Affiliates - continued
Interfund Lending Program. Pursuant to an Exemptive Order issued by the SEC, the Fund, along with other registered investment companies having management contracts with FMR, may participate in an interfund lending program. This program provides an alternative credit facility allowing the funds to borrow from, or lend money to, other participating affiliated funds. At period end, there were no interfund loans outstanding. The Fund's activity in this program during the period for which loans were outstanding was as follows:
Borrower or Lender | Average Daily
Loan Balance | Weighted Average Interest Rate | Interest
Expense |
Borrower | $ 12,993,271 | .43% | $ 10,743 |
7. Committed Line of Credit.
The Fund participates with other funds managed by FMR in a $3.75 billion credit facility (the "line of credit") to be utilized for temporary or emergency purposes to fund shareholder redemptions or for other short-term liquidity purposes. The Fund has agreed to pay commitment fees on its pro-rata portion of the line of credit, which amounted to $45,855 and is reflected in Miscellaneous expenses on the Statement of Operations. During the period, there were no borrowings on this line of credit.
8. Security Lending.
The Fund lends portfolio securities from time to time in order to earn additional income. On the settlement date of the loan, the Fund receives collateral (in the form of U.S. Treasury obligations, letters of credit and/or cash) against the loaned securities and maintains collateral in an amount not less than 100% of the market value of the loaned securities during the period of the loan. The market value of the loaned securities is determined at the close of business of the Fund and any additional required collateral is delivered to the Fund on the next business day. If the borrower defaults on its obligation to return the securities loaned because of insolvency or other reasons, a fund could experience delays and costs in recovering the securities loaned or in gaining access to the collateral. Any cash collateral received is invested in the Fidelity Securities Lending Cash Central Fund. The value of loaned securities and cash collateral at period end are disclosed on the Fund's Statement of Assets and Liabilities. Security lending income represents the income earned on investing cash collateral, less fees and expenses associated with the loan, plus any premium payments that may be received on the loan of certain types of securities. Security lending income is presented in the Statement of Operations as a component of income from Fidelity Central Funds. Net income from lending portfolio securities during the period amounted to $262,621.
Annual Report
Notes to Financial Statements - continued
9. Bank Borrowings.
The Fund is permitted to have bank borrowings for temporary or emergency purposes to fund shareholder redemptions. The Fund has established borrowing arrangements with certain banks. The interest rate on the borrowings is the bank's base rate, as revised from time to time. The average daily loan balance during the period for which loans were outstanding amounted to $6,248,000. The weighted average interest rate was .64%. The interest expense amounted to $111 under the bank borrowing program. At period end, there were no bank borrowings outstanding.
10. Expense Reductions.
Many of the brokers with whom FMR places trades on behalf of the Fund provided services to the Fund in addition to trade execution. These services included payments of certain expenses on behalf of the Fund totaling $1,804,798 for the period.
11. Distributions to Shareholders.
Distributions to shareholders of each class were as follows:
Years ended July 31, | 2010 | 2009 A |
From net investment income | | |
Blue Chip Growth | $ 52,296,116 | $ 97,802,886 |
Class K | 4,902,403 | 1,622,768 |
Class F | 234,565 | - |
Total | $ 57,433,084 | $ 99,425,654 |
From net realized gain | | |
Blue Chip Growth | $ - | $ 242,437,464 |
Class K | - | 1,698 |
Total | $ - | $ 242,439,162 |
A Distributions for Class F are for the period June 26, 2009 (commencement of sale of shares) to July 31, 2009.
12. Share Transactions.
Transactions for each class of shares were as follows:
| Shares | Dollars |
Years ended July 31, | 2010 B | 2009 A | 2010 B | 2009 A |
Blue Chip Growth | | | | |
Shares sold | 41,698,431 | 53,777,391 | $ 1,553,486,290 | $ 1,546,167,445 |
Conversion to Class K | (604,280) | (17,667,860) | (19,980,833) | (497,271,491) |
Reinvestment of distributions | 1,459,019 | 9,381,064 | 51,337,601 | 335,422,205 |
Shares redeemed | (72,051,092) | (84,149,947) | (2,676,740,842) | (2,387,026,199) |
Net increase (decrease) | (29,497,922) | (38,659,352) | $ (1,091,897,784) | $ (1,002,708,040) |
Annual Report
12. Share Transactions - continued
| Shares | Dollars |
Years ended July 31, | 2010 B | 2009 A | 2010 B | 2009 A |
Class K | | | | |
Shares sold | 11,376,828 | 2,762,243 | $ 427,049,740 | $ 75,103,611 |
Conversion from Blue Chip Growth | 603,548 | 17,662,621 | 19,980,833 | 497,271,492 |
Reinvestment of distributions | 138,546 | 62,647 | 4,902,403 | 1,624,466 |
Shares redeemed | (5,839,246) | (2,034,629) | (218,810,942) | (54,677,110) |
Net increase (decrease) | 6,279,676 | 18,452,882 | $ 233,122,034 | $ 519,322,459 |
Class F | | | | |
Shares sold | 8,795,556 | 8,183 | $ 331,309,580 | $ 235,350 |
Reinvestment of distributions | 6,315 | - | 234,565 | - |
Shares redeemed | (281,880) | (10) | (10,900,065) | (294) |
Net increase (decrease) | 8,519,991 | 8,173 | $ 320,644,080 | $ 235,056 |
A Share transactions for Class F are for the period June 26, 2009 (commencement of sale of shares) to July 31, 2009.
B Conversion transactions for Class K and Blue Chip Growth are presented for the period August 1, 2009 through August 31, 2009.
13. Other.
The Fund's organizational documents provide former and current trustees and officers with a limited indemnification against liabilities arising in connection with the performance of their duties to the Fund. In the normal course of business, the Fund may also enter into contracts that provide general indemnifications. The Fund's maximum exposure under these arrangements is unknown as this would be dependent on future claims that may be made against the Fund. The risk of material loss from such claims is considered remote.
Annual Report
To the Trustees of Fidelity Securities Fund and Shareholders of Fidelity Blue Chip Growth Fund:
We have audited the accompanying statement of assets and liabilities of Fidelity Blue Chip Growth Fund (the Fund), a fund of Fidelity Securities Fund, including the schedule of investments, as of July 31, 2010, and the related statement of operations for the year then ended, the statement of changes in net assets for each of the two years in the period then ended, and the financial highlights for each of the five years in the period then ended. These financial statements and financial highlights are the responsibility of the Fund's management. Our responsibility is to express an opinion on these financial statements and financial highlights based on our audits.
We conducted our audits in accordance with standards of the Public Company Accounting Oversight Board (United States). Those standards require that we plan and perform the audit to obtain reasonable assurance about whether the financial statements and financial highlights are free of material misstatement. The Fund is not required to have, nor were we engaged to perform, an audit of its internal control over financial reporting. Our audits included consideration of internal control over financial reporting as a basis for designing audit procedures that are appropriate in the circumstances, but not for the purpose of expressing an opinion on the effectiveness of the Fund's internal control over financial reporting. Accordingly, we express no such opinion. An audit also includes examining, on a test basis, evidence supporting the amounts and disclosures in the financial statements, assessing the accounting principles used and significant estimates made by management, as well as evaluating the overall financial statement presentation. Our procedures included confirmation of securities owned as of July 31, 2010, by correspondence with the custodians and brokers; where replies were not received from brokers, we performed other auditing procedures. We believe that our audits provide a reasonable basis for our opinion.
In our opinion, the financial statements and financial highlights referred to above present fairly, in all material respects, the financial position of Fidelity Blue Chip Growth Fund as of July 31, 2010, the results of its operations for the year then ended, the changes in its net assets for each of the two years in the period then ended, and the financial highlights for each of the five years in the period then ended, in conformity with accounting principles generally accepted in the United States of America.
/s/ Deloitte & Touche LLP
DELOITTE & TOUCHE LLP
Boston, Massachusetts
September 13, 2010
Annual Report
The Trustees, Member of the Advisory Board, and executive officers of the trust and fund, as applicable, are listed below. The Board of Trustees governs the fund and is responsible for protecting the interests of shareholders. The Trustees are experienced executives who meet periodically throughout the year to oversee the fund's activities, review contractual arrangements with companies that provide services to the fund, oversee management of the risks associated with such activities and contractual arrangements, and review the fund's performance. Except for James C. Curvey, each of the Trustees oversees 222 funds advised by FMR or an affiliate. Mr. Curvey oversees 411 funds advised by FMR or an affiliate.
The Trustees hold office without limit in time except that (a) any Trustee may resign; (b) any Trustee may be removed by written instrument, signed by at least two-thirds of the number of Trustees prior to such removal; (c) any Trustee who requests to be retired or who has become incapacitated by illness or injury may be retired by written instrument signed by a majority of the other Trustees; and (d) any Trustee may be removed at any special meeting of shareholders by a two-thirds vote of the outstanding voting securities of the trust. Each Trustee who is not an interested person (as defined in the 1940 Act) (Independent Trustee), shall retire not later than the last day of the calendar year in which his or her 72nd birthday occurs. The Independent Trustees may waive this mandatory retirement age policy with respect to individual Trustees. The executive officers and Advisory Board Member hold office without limit in time, except that any officer and Advisory Board Member may resign or may be removed by a vote of a majority of the Trustees at any regular meeting or any special meeting of the Trustees. Except as indicated, each individual has held the office shown or other offices in the same company for the past five years.
Experience, Skills, Attributes, and Qualifications of the Fund's Trustees. The Governance and Nominating Committee has adopted a statement of policy that describes the experience, qualifications, attributes, and skills that are necessary and desirable for potential Independent Trustee candidates (Statement of Policy). The Board believes that each Trustee satisfied at the time he or she was initially elected or appointed a Trustee, and continues to satisfy, the standards contemplated by the Statement of Policy. The Governance and Nominating Committee also engages professional search firms to help identify potential Independent Trustee candidates who have the experience, qualifications, attributes, and skills consistent with the Statement of Policy. From time to time, additional criteria based on the composition and skills of the current Independent Trustees, as well as experience or skills that may be appropriate in light of future changes to board composition, business conditions, and regulatory or other developments, have also been considered by the professional search firms and the Governance and Nominating Committee. In addition, the Board takes into account the Trustees' commitment and participation in Board and committee meetings, as well as their leadership of standing and ad hoc committees throughout their tenure.
In determining that a particular Trustee was and continues to be qualified to serve as a Trustee, the Board has considered a variety of criteria, none of which, in isolation, was controlling. The Board believes that, collectively, the Trustees have balanced and diverse experience, qualifications, attributes, and skills, which allow the Board to operate effectively in governing the fund and protecting the interests of shareholders. Information about the specific experience, skills, attributes, and qualifications of each Trustee, which in each case led to the Board's conclusion that the Trustee should serve (or continue to serve) as a trustee of the fund, is provided below.
Annual Report
Board Structure and Oversight Function. Edward C. Johnson 3d is an interested person (as defined in the 1940 Act) and currently serves as Chairman. The Trustees have determined that an interested Chairman is appropriate and benefits shareholders because an interested Chairman has a personal and professional stake in the quality and continuity of services provided to the fund. Independent Trustees exercise their informed business judgment to appoint an individual of their choosing to serve as Chairman, regardless of whether the Trustee happens to be independent or a member of management. The Independent Trustees have determined that they can act independently and effectively without having an Independent Trustee serve as Chairman and that a key structural component for assuring that they are in a position to do so is for the Independent Trustees to constitute a substantial majority for the Board. The Independent Trustees also regularly meet in executive session. Ned C. Lautenbach serves as Chairman of the Independent Trustees and as such (i) acts as a liaison between the Independent Trustees and management with respect to matters important to the Independent Trustees and (ii) with management prepares agendas for Board meetings.
Fidelity funds are overseen by different Boards of Trustees. The fund's Board oversees Fidelity's equity and high income funds and another Board oversees Fidelity's investment-grade bond, money market, and asset allocation funds. The asset allocation funds may invest in Fidelity funds overseen by the fund's Board. The use of separate Boards, each with its own committee structure, allows the Trustees of each group of Fidelity funds to focus on the unique issues of the funds they oversee, including common research, investment, and operational issues. On occasion, the separate Boards establish joint committees to address issues of overlapping consequences for the Fidelity funds overseen by each Board.
The Trustees operate using a system of committees to facilitate the timely and efficient consideration of all matters of importance to the Trustees, the fund, and fund shareholders and to facilitate compliance with legal and regulatory requirements and oversight of the fund's activities and associated risks. The Board, acting through its committees, has charged FMR and its affiliates with (i) identifying events or circumstances the occurrence of which could have demonstrably adverse effects on the fund's business and/or reputation; (ii) implementing processes and controls to lessen the possibility that such events or circumstances occur or to mitigate the effects of such events or circumstances if they do occur; and (iii) creating and maintaining a system designed to evaluate continuously business and market conditions in order to facilitate the identification and implementation processes described in (i) and (ii) above. Because the day-to-day operations and activities of the fund are carried out by or through FMR, its affiliates and other service providers, the fund's exposure to risks is mitigated but not eliminated by the processes overseen by the Trustees. While each of the Board's committees has responsibility for overseeing different aspects of the fund's activities, oversight is exercised primarily through the Operations, Audit, and Compliance Committees. Appropriate personnel, including but not limited to the fund's Chief Compliance Officer (CCO), FMR's internal auditor, the independent accountants, the fund's Treasurer and portfolio management personnel, make periodic reports to the Board's committees, as appropriate. The responsibilities of each committee, including their oversight responsibilities, are described further under "Standing Committees of the Fund's Trustees."
Annual Report
Trustees and Officers - continued
The fund's Statement of Additional Information (SAI) includes more information about the Trustees. To request a free copy, call Fidelity at 1-800-835-5092.
Interested Trustees*:
Correspondence intended for each Trustee who is an interested person may be sent to Fidelity Investments, 82 Devonshire Street, Boston, Massachusetts 02109.
Name, Age; Principal Occupations and Other Relevant Experience+ |
Edward C. Johnson 3d (80) |
| Year of Election or Appointment: 1984 Mr. Johnson is Trustee and Chairman of the Board of Trustees of certain Trusts. Mr. Johnson serves as Chief Executive Officer, Chairman, and a Director of FMR LLC; Chairman and a Director of FMR; Chairman and a Director of Fidelity Research & Analysis Company (FRAC); Chairman and a Director of Fidelity Investments Money Management, Inc.; and Chairman and a Director of FMR Co., Inc. In addition, Mr. Johnson serves as Chairman and Director of FIL Limited. Previously, Mr. Johnson served as President of FMR LLC (2006-2007). |
James C. Curvey (75) |
| Year of Election or Appointment: 2007 Mr. Curvey also serves as Trustee (2007-present) of other investment companies advised by FMR. Mr. Curvey is a Director of FMR and FMR Co., Inc. (2007-present). Mr. Curvey is also Vice Chairman (2006-
present) and Director of FMR LLC. In addition, Mr. Curvey serves as an Overseer for the Boston Symphony Orchestra and a member of the Trustees of Villanova University. |
* Trustees have been determined to be "Interested Trustees" by virtue of, among other things, their affiliation with the trust or various entities under common control with FMR.
+ The information above includes each Trustee's principal occupation during the last five years and other information relating to the experience, attributes, and skills relevant to each Trustee's qualifications to serve as a Trustee, which led to the conclusion that each Trustee should serve as a Trustee for the fund.
Annual Report
Independent Trustees:
Correspondence intended for each Independent Trustee (that is, the Trustees other than the Interested Trustees) may be sent to Fidelity Investments, P.O. Box 55235, Boston, Massachusetts 02205-5235.
Name, Age; Principal Occupations and Other Relevant Experience+ |
Dennis J. Dirks (62) |
| Year of Election or Appointment: 2005 Prior to his retirement in May 2003, Mr. Dirks was Chief Operating Officer and a member of the Board of The Depository Trust & Clearing Corporation (DTCC). He also served as President, Chief Operating Officer, and Board member of The Depository Trust Company (DTC) and President and Board member of the National Securities Clearing Corporation (NSCC). In addition, Mr. Dirks served as Chief Executive Officer and Board member of the Government Securities Clearing Corporation, Chief Executive Officer and Board member of the Mortgage-Backed Securities Clearing Corporation, as a Trustee and a member of the Finance Committee of Manhattan College (2005-2008), and as a Trustee and a member of the Finance Committee of AHRC of Nassau County (2006-2008). Currently, Mr. Dirks serves as a member of the Board of Directors for The Brookville Center for Children's Services, Inc. (2009-present). |
Alan J. Lacy (56) |
| Year of Election or Appointment: 2008 Mr. Lacy serves as Senior Adviser (2007-present) of Oak Hill Capital Partners, L.P. (private equity). Mr. Lacy also served as Chief Executive Officer (2000-2005) and Vice Chairman (2005-2006) of Sears Holdings Corporation and Sears, Roebuck and Co. (retail). In addition, Mr. Lacy serves as a member of the Board of Directors of The Western Union Company (global money transfer, 2006-present) and Bristol-Myers Squibb Company (global pharmaceuticals, 2007-present). Mr. Lacy is Chairman (2008-present) and a member (2006-present) of the Board of Trustees of The National Parks Conservation Association. |
Ned C. Lautenbach (66) |
| Year of Election or Appointment: 2000 Mr. Lautenbach is Chairman of the Independent Trustees of the Equity and High Income Funds (2006-present). Mr. Lautenbach is an Advisory Partner of Clayton, Dubilier & Rice, Inc. (private equity investment, 2008-present) and was previously a Partner of Clayton, Dubilier & Rice, Inc. (1998-2008). Previously, Mr. Lautenbach was with the International Business Machines Corporation (IBM) from 1968 until his retirement in 1998. Mr. Lautenbach serves as a Director of Eaton Corporation (diversified industrial) as well as the Philharmonic Center for the Arts in Naples, Florida. Mr. Lautenbach is also a member of the Board of Trustees of Fairfield University (2005-present), as well as a member of the Council on Foreign Relations. Previously, Mr. Lautenbach served as a Director of Sony Corporation (2006-2007). |
Joseph Mauriello (65) |
| Year of Election or Appointment: 2008 Prior to his retirement in January 2006, Mr. Mauriello served in numerous senior management positions including Deputy Chairman and Chief Operating Officer (2004-2005), and Vice Chairman of Financial Services (2002-2004) of KPMG LLP US (professional services, 1965-2005). Mr. Mauriello currently serves as a member of the Board of Directors of XL Capital Ltd. (global insurance and re-insurance, 2006-present) and of Arcadia Resources Inc. (health care services and products, 2007-
present). Previously, Mr. Mauriello served as a Director of the Hamilton Funds of the Bank of New York (2006-2007). |
Cornelia M. Small (66) |
| Year of Election or Appointment: 2005 Ms. Small is a member of the Board of Directors of the Teagle Foundation (2009-present). Ms. Small is also a member of the Investment Committee, and Chair (2008-present) and a member of the Board of Trustees of Smith College. In addition, Ms. Small serves on the Investment Committee of the Berkshire Taconic Community Foundation (2008-
present). Previously, Ms. Small served as Chairperson of the Investment Committee (2002-2008) of Smith College. In addition, Ms. Small served as Chief Investment Officer, Director of Global Equity Investments, and a member of the Board of Directors of Scudder, Stevens & Clark and Scudder Kemper Investments. |
William S. Stavropoulos (71) |
| Year of Election or Appointment: 2002 Mr. Stavropoulos is Vice Chairman of the Independent Trustees of the Equity and High Income Funds (2006-present). Mr. Stavropoulos serves as President and Founder of the Michigan Baseball Foundation, the Great Lakes Loons (2007-present). Mr. Stavropoulos is Chairman Emeritus of the Board of Directors of The Dow Chemical Company, where he previously served in numerous senior management positions, including President, CEO (1995-2000; 2002-2004), Chairman of the Executive Committee (2000-2006), and as a member of the Board of Directors (1990-2006). Currently, Mr. Stavropoulos is a Director of Teradata Corporation (data warehousing and technology solutions, 2008-present), Chemical Financial Corporation, Maersk Inc. (industrial conglomerate), Tyco International, Inc. (multinational manufacturing and services, 2007-present), and a member of the Advisory Board for Metalmark Capital (private equity investment, 2005-present). Mr. Stavropoulos is a special advisor to Clayton, Dubilier & Rice, Inc. (private equity investment). In addition, Mr. Stavropoulos is a member of the University of Notre Dame Advisory Council for the College of Science. |
David M. Thomas (61) |
| Year of Election or Appointment: 2008 Previously, Mr. Thomas served as Executive Chairman (2005-2006) and Chairman and Chief Executive Officer (2000-2005) of IMS Health, Inc. (pharmaceutical and healthcare information solutions). In addition, Mr. Thomas serves as a member of the Board of Directors of Fortune Brands, Inc. (consumer products), and Interpublic Group of Companies, Inc. (marketing communication, 2004-present). |
Michael E. Wiley (59) |
| Year of Election or Appointment: 2008 Mr. Wiley also serves as a Director of Asia Pacific Exploration Consolidated (international oil and gas exploration and production, 2008-
present), and as a member of the Board of Trustees of the University of Tulsa (2000-2006; 2007-present). Mr. Wiley serves as a Director of Tesoro Corporation (independent oil refiner and marketer, 2005-present), and a Director of Bill Barrett Corporation (exploration and production, 2005-
present). In addition, Mr. Wiley also serves as a Director of Post Oak Bank (privately-held bank, 2004-present). Previously, Mr. Wiley served as a Sr. Energy Advisor of Katzenbach Partners, LLC (consulting, 2006-
2007), as an Advisory Director of Riverstone Holdings (private investment), Chairman, President, and CEO of Baker Hughes, Inc. (oilfield services, 2000-2004), and as Director of Spinnaker Exploration Company (exploration and production, 2001-2005). |
Annual Report
Trustees and Officers - continued
+ The information above includes each Trustee's principal occupation during the last five years and other information relating to the experience, attributes, and skills relevant to each Trustee's qualifications to serve as a Trustee, which led to the conclusion that each Trustee should serve as a Trustee for the fund.
Advisory Board Member and Executive Officers:
Correspondence intended for each executive officer and Peter S. Lynch may be sent to Fidelity Investments, 82 Devonshire Street, Boston, Massachusetts 02109.
Name, Age; Principal Occupation |
Peter S. Lynch (66) |
| Year of Election or Appointment: 2003 Member of the Advisory Board of Fidelity's Equity and High Income Funds. Mr. Lynch is Vice Chairman and a Director of FMR and FMR Co., Inc. In addition, Mr. Lynch serves as a Trustee of Boston College and as the Chairman of the Inner-City Scholarship Fund. Previously, Mr. Lynch served on the Special Olympics International Board of Directors (1997-2006). |
Kenneth B. Robins (40) |
| Year of Election or Appointment: 2008 President and Treasurer of Fidelity's Equity and High Income Funds. Mr. Robins also serves as President and Treasurer (2010-present) and Assistant Treasurer (2009-present) of other Fidelity funds and is an employee of Fidelity Investments (2004-present). Previously, Mr. Robins served as Deputy Treasurer of the Fidelity funds (2005-2008) and Treasurer and Chief Financial Officer of The North Carolina Capital Management Trust: Cash and Term Portfolios (2006-2008). |
Bruce T. Herring (44) |
| Year of Election or Appointment: 2006 Vice President of certain Equity Funds. Mr. Herring also serves as Group Chief Investments Officer of FMR. Previously, Mr. Herring served as a portfolio manager for Fidelity U.S. Equity Funds. |
Brian B. Hogan (45) |
| Year of Election or Appointment: 2009 Vice President of certain Equity Funds and Vice President of Sector Funds. Mr. Hogan also serves as Senior Vice President, Equity Research of FMR (2006-present) and President of FMR's Equity Division (2009-
present). Previously, Mr. Hogan served as a portfolio manager. |
Scott C. Goebel (42) |
| Year of Election or Appointment: 2008 Secretary and Chief Legal Officer (CLO) of the Fidelity funds. Mr. Goebel also serves as General Counsel, Secretary, and Senior Vice President of FMR (2008-present) and FMR Co., Inc. (2008-present); Deputy General Counsel of FMR LLC; Chief Legal Officer of Fidelity Management & Research (Hong Kong) Limited (2008-present) and Assistant Secretary of Fidelity Management & Research (Japan) Inc. (2008-present), Fidelity Investments Money Management, Inc. (2008-present), Fidelity Management & Research (U.K.) Inc. (2008-present), and Fidelity Research and Analysis Company (2008-present). Previously, Mr. Goebel served as Assistant Secretary of the Funds (2007-2008) and as Vice President and Secretary of Fidelity Distributors Corporation (FDC) (2005-2007). |
William C. Coffey (41) |
| Year of Election or Appointment: 2009 Assistant Secretary of Fidelity's Equity and High Income Funds. Mr. Coffey also serves as Senior Vice President and Deputy General Counsel of FMR LLC (2010-present), and is an employee of Fidelity Investments. Previously, Mr. Coffey served as Vice President and Associate General Counsel of FMR LLC (2005-2009). |
Holly C. Laurent (56) |
| Year of Election or Appointment: 2008 Anti-Money Laundering (AML) Officer of the Fidelity funds. Ms. Laurent is an employee of Fidelity Investments. Previously, Ms. Laurent was Senior Vice President and Head of Legal for Fidelity Business Services India Pvt. Ltd. (2006-2008), and Senior Vice President, Deputy General Counsel and Group Head for FMR LLC (2005-2006). |
Christine Reynolds (51) |
| Year of Election or Appointment: 2008 Chief Financial Officer of the Fidelity funds. Ms. Reynolds became President of Fidelity Pricing and Cash Management Services (FPCMS) in August 2008. Ms. Reynolds served as Chief Operating Officer of FPCMS (2007-2008). Previously, Ms. Reynolds served as President, Treasurer, and Anti-Money Laundering officer of the Fidelity funds (2004-2007). |
Kenneth A. Rathgeber (63) |
| Year of Election or Appointment: 2004 Chief Compliance Officer of Fidelity's Equity and High Income Funds. Mr. Rathgeber is Chief Compliance Officer of Fidelity Management & Research (Hong Kong) Limited (2008-present), Fidelity Management & Research (Japan) Inc. (2008-present), FMR (2005-present), FMR Co., Inc. (2005-present), Fidelity Management & Research (U.K.) Inc. (2005-
present), Fidelity Research & Analysis Company (2005-present), Fidelity Investments Money Management, Inc. (2005-present), Pyramis Global Advisors, LLC (2005-present), and Strategic Advisers, Inc.
(2005-present). |
Jeffrey S. Christian (48) |
| Year of Election or Appointment: 2009 Deputy Treasurer of the Fidelity funds. Mr. Christian is an employee of Fidelity Investments. Previously, Mr. Christian served as Chief Financial Officer (2008-2009) of certain Fidelity funds and Senior Vice President of Fidelity Pricing and Cash Management Services (FPCMS) (2004-2009). |
Bryan A. Mehrmann (49) |
| Year of Election or Appointment: 2005 Deputy Treasurer of the Fidelity funds. Mr. Mehrmann is an employee of Fidelity Investments. |
Adrien E. Deberghes (42) |
| Year of Election or Appointment: 2008 Deputy Treasurer of Fidelity's Equity and High Income Funds. Mr. Deberghes also serves as Assistant Treasurer of other Fidelity funds (2010-present) and is an employee of Fidelity Investments (2008-
present). Previously, Mr. Deberghes served as Senior Vice President of Mutual Fund Administration at State Street Corporation (2007-2008), Senior Director of Mutual Fund Administration at Investors Bank & Trust (2005-2007), and Director of Finance for Dunkin' Brands (2000-2005). |
Stephanie J. Dorsey (41) |
| Year of Election or Appointment: 2010 Assistant Treasurer of Fidelity's Equity and High Income Funds. Ms. Dorsey also serves as Deputy Treasurer of other Fidelity funds (2008-
present) and is an employee of Fidelity Investments (2008-present). Previously, Ms. Dorsey served as Treasurer (2004-2008) of the JPMorgan Mutual Funds and Vice President (2004-2008) of JPMorgan Chase Bank. |
Name, Age; Principal Occupation |
John R. Hebble (52) |
| Year of Election or Appointment: 2009 Assistant Treasurer of Fidelity's Equity and High Income Funds. Mr. Hebble also serves as Treasurer and Chief Financial Officer of The North Carolina Capital Management Trust: Cash and Term Portfolio (2008-present), President and Treasurer of other Fidelity funds (2008-present) and is an employee of Fidelity Investments. |
Gary W. Ryan (51) |
| Year of Election or Appointment: 2005 Assistant Treasurer of the Fidelity funds. Mr. Ryan is an employee of Fidelity Investments. Previously, Mr. Ryan served as Vice President of Fund Reporting in Fidelity Pricing and Cash Management Services (FPCMS) (1999-2005). |
Annual Report
Class K designates 100% of the dividends distributed during the fiscal year as qualifying for the dividends-received deduction for corporate shareholders.
Class K designates 100% of the dividends distributed during the fiscal year as amounts which can be taken into account as a dividend for the purposes of the maximum rate under section 1(h)(11) of the Internal Revenue Code.
The fund will notify shareholders in January 2011 of amounts for use in preparing 2010 income tax returns.
Annual Report
Board Approval of Investment Advisory Contracts and Management Fees
Fidelity Blue Chip Growth Fund
Each year, the Board of Trustees, including the Independent Trustees (together, the Board), votes on the renewal of the management contract and sub-advisory agreements (together, the Advisory Contracts) for the fund. The Board, assisted by the advice of fund counsel and Independent Trustees' counsel, requests and considers a broad range of information relevant to the renewal of the Advisory Contracts throughout the year.
The Board meets regularly and considers at each of its meetings factors that are relevant to its annual consideration of the renewal of the fund's Advisory Contracts, including the services and support provided to the fund and its shareholders. The Board has established various standing committees, each composed of Independent Trustees with varying backgrounds, to which the Board has assigned specific subject matter responsibilities in order to enhance effective decision-making by the Board. The Board, acting directly and through its Committees, requests and receives information concerning the annual consideration of the renewal of the fund's Advisory Contracts. The Board also meets as needed to consider matters specifically related to the Board's annual consideration of the renewal of Advisory Contracts. Members of the Board may also meet with trustees of other Fidelity funds through ad hoc joint committees to discuss certain matters relevant to the Fidelity funds.
At its July 2010 meeting, the Board of Trustees, including the Independent Trustees, unanimously determined to renew the fund's Advisory Contracts. In reaching its determination, the Board considered all factors it believed relevant, including (i) the nature, extent, and quality of the services to be provided to the fund and its shareholders (including the investment performance of the fund); (ii) the competitiveness of the fund's management fee and total expenses; (iii) the total costs of the services to be provided by and the profits to be realized by Fidelity from its relationship with the fund; (iv) the extent to which economies of scale would be realized as the fund grows; and (v) whether fee levels reflect these economies of scale, if any, for the benefit of fund shareholders.
In considering whether to renew the Advisory Contracts for the fund, the Board reached a determination, with the assistance of fund counsel and Independent Trustees' counsel and through the exercise of its business judgment, that the renewal of the Advisory Contracts is in the best interests of fund shareholders and that the compensation to be received by Fidelity under the management contract is fair and reasonable. The Board's decision to renew the Advisory Contracts was not based on any single factor noted above, but rather was based on a comprehensive consideration of all the information provided to the Board at its meetings throughout the year. The Board, in reaching its determination to renew the Advisory Contracts, is aware that shareholders in the fund have a broad range of investment choices available to them, including a wide choice among mutual funds offered by Fidelity's competitors, and that the fund's shareholders, with the opportunity to review and weigh the disclosure provided by the fund in its prospectus and other public disclosures, have chosen to invest in this fund, managed by Fidelity.
Annual Report
Board Approval of Investment Advisory Contracts and
Management Fees - continued
Nature, Extent, and Quality of Services Provided. The Board considered the staffing within the investment adviser, FMR, and the sub-advisers (together, the Investment Advisers), including the backgrounds of the fund's investment personnel and the fund's investment objective and discipline. The Independent Trustees also had discussions with senior management of Fidelity's investment operations and investment groups. The Board considered the structure of the portfolio manager compensation program and whether this structure provides appropriate incentives to act in the best interest of the fund.
Resources Dedicated to Investment Management and Support Services. The Board and the equity research subcommittee of the Board's Fund Oversight Committee reviewed the size, education, and experience of the Investment Advisers' investment staff, their use of technology, and the Investment Advisers' approach to recruiting, training, and retaining portfolio managers and other research, advisory, and management personnel. The Board noted that Fidelity's analysts have access to a variety of technological tools and market and securities data that enable them to perform both fundamental and quantitative analysis and to specialize in various disciplines. The Board considered Fidelity's extensive global research capabilities that enable the Investment Advisers to aggregate data from various sources in an effort to produce positive investment results. The Board also considered that Fidelity's portfolio managers and analysts have access to daily portfolio attribution that allows for monitoring of a fund's portfolio, as well as an electronic communication system that provides immediate real-time access to research concerning issuers and credit enhancers. The Board noted FMR's continued focus on strengthening the organization and discipline of equity portfolio management and research.
Shareholder and Administrative Services. The Board considered (i) the nature, extent, quality, and cost of advisory, administrative, and shareholder services performed by the Investment Advisers and their affiliates under the Advisory Contracts and under separate agreements covering transfer agency, pricing and bookkeeping, and securities lending services for the fund; (ii) the nature and extent of the investment adviser's supervision of third party service providers, principally custodians and subcustodians; and (iii) the resources devoted to, and the record of compliance with, the fund's compliance policies and procedures. The Board also reviewed the allocation of fund brokerage, including allocations to brokers affiliated with the Investment Advisers, the use of brokerage commissions to pay fund expenses, and the use of "soft" commission dollars to pay for research services.
The Board noted that the growth of fund assets over time across the complex allows Fidelity to reinvest in the development of services designed to enhance the value or convenience of the Fidelity funds as investment vehicles. These services include 24-hour access to account information and market information through phone representatives and over the Internet, and investor education materials and asset allocation tools.
Annual Report
Investment in a Large Fund Family. The Board considered the benefits to shareholders of investing in a Fidelity fund, including the benefits of investing in a fund that is part of a large family of funds offering a variety of investment disciplines and providing a large variety of mutual fund investor services. The Board noted that Fidelity had taken, or had made recommendations that resulted in the Fidelity funds taking, a number of actions over the previous year that benefited particular funds, including (i) dedicating additional resources to investment research and restructuring and broadening the focus of the investment research teams; (ii) bolstering the senior management team that oversees asset management; (iii) launching Class F of certain funds as a lower-fee class available to Freedom K and Freedom Index Funds; (iv) lowering the initial investment minimums and ongoing balance requirements for Real Estate High Income Fund; (v) eliminating subsequent purchase minimums for all funds and adding a waiver of the investment minimum requirement for new accounts opened with the proceeds of a systematic withdrawal plan; (vi) eliminating the withdrawal minimum and maximum limits for systematic withdrawals from Advisor funds; (vii) expanding sales load waivers on Class A shares for Destiny Planholders and expanding Institutional Class eligibility for Class O Destiny Planholders; and (viii) changing certain Class A and Class T sales charge structures to further align them with industry practices.
Investment Performance. The Board considered whether the fund has operated in accordance with its investment objective, as well as its record of compliance with its investment restrictions. It also reviewed the fund's absolute investment performance for each class (except Class F), as well as the fund's relative investment performance for each class (except Class F) measured over multiple periods against (i) a broad-based securities market index, and (ii) a peer group of mutual funds deemed appropriate by Fidelity and reviewed by the Board. The following charts considered by the Board show, over the one-, three-, and five-year periods ended December 31, 2009, as available, the cumulative total returns of Class K and the retail class of the fund, the cumulative total returns of a broad-based securities market index ("benchmark"), and a range of cumulative total returns of a peer group of mutual funds identified by Morningstar, Inc. as having an investment style similar to that of the fund based on underlying portfolio holdings. (Class F of the fund had less than one year of performance as of December 31, 2009.) The box within each chart shows the 25th percentile return (bottom of box) and the 75th percentile return (top of box) of the peer group. Returns shown above the box are in the first quartile and returns shown below the box are in the fourth quartile. The percentage beaten numbers noted below each chart correspond to the percentile box and represent the percentage of funds in the peer group whose performance was equal to or lower than that of the class indicated.
Annual Report
Board Approval of Investment Advisory Contracts and
Management Fees - continued
Fidelity Blue Chip Growth Fund
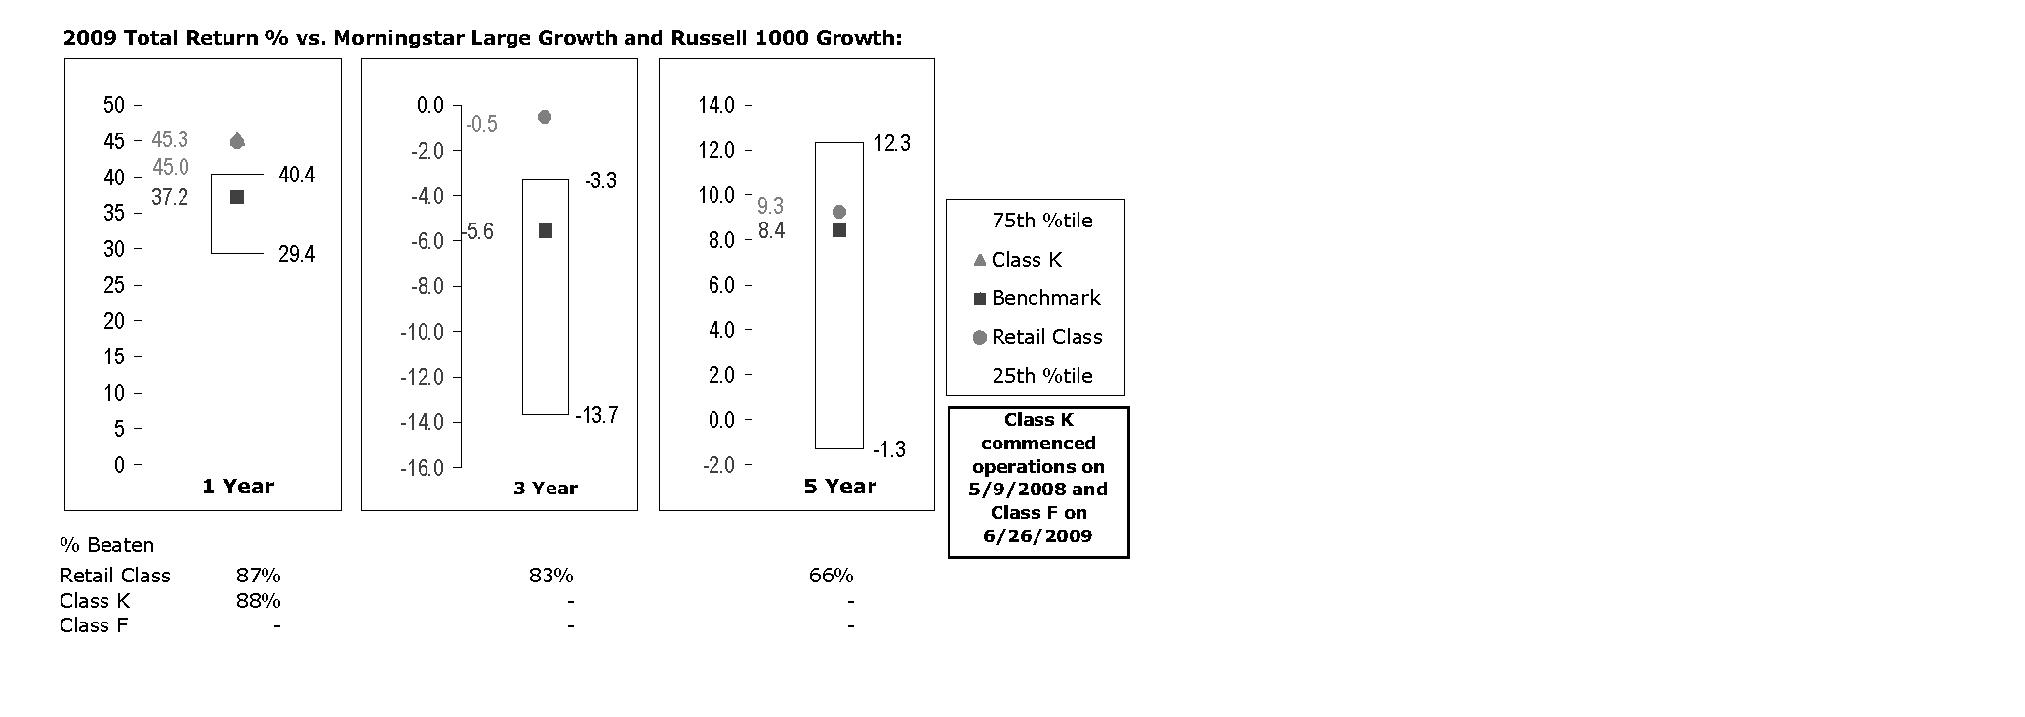
The Board reviewed the fund's relative investment performance against its peer group and noted that the performance of the retail class of the fund (the class with the longer performance record) was in the first quartile for the one- and three-year periods and the second quartile for the five-year period. The Board also noted that the investment performance of the retail class of the fund compared favorably to its benchmark for all the periods shown. The Board considered that the variations in performance between the fund's classes reflect the variations in class expenses, which result in lower performance for the higher expense class. The Board also reviewed the fund's performance since inception as well as performance in the current year.
The Board also considered that the fund's management fee is subject to upward or downward adjustment depending upon whether, and to what extent, the fund's investment performance for the performance period exceeds, or is exceeded by, the record (over the same period) of a Board-approved performance adjustment index. The Board realizes that the performance adjustment provides FMR with a strong economic incentive to seek to achieve superior performance for the fund's shareholders and helps to more closely align the interests of FMR and the fund's shareholders.
Based on its review, and giving particular weight to the nature and quality of the resources dedicated by the Investment Advisers to maintain and improve relative performance and factoring in the unprecedented market events in recent years, the Board concluded that the nature, extent, and quality of investment management and support services and of shareholder and administrative services provided to the fund will benefit the fund's shareholders, particularly in light of the Board's view that the fund's shareholders benefit from investing in a fund that is part of a large family of funds offering a variety of investment disciplines and services.
Annual Report
Competitiveness of Management Fee and Total Fund Expenses. The Board considered the fund's management fee and total expenses compared to "mapped groups" of competitive funds and classes. Fidelity creates "mapped groups" by combining similar Lipper investment objective categories that have comparable management fee characteristics. Combining Lipper investment objective categories aids the Board's management fee and total expense comparisons by broadening the competitive group used for comparison and by reducing the number of universes to which various Fidelity funds are compared.
Management Fee. The Board considered two proprietary management fee comparisons for the 12-month periods shown in the chart below. The group of Lipper funds used by the Board for management fee comparisons is referred to below as the "Total Mapped Group." The Total Mapped Group comparison focuses on a fund's standing relative to the total universe of comparable funds available to investors, in terms of gross management fees before expense reimbursements or caps, and without giving effect to the fund's performance adjustment. "TMG %" represents the percentage of funds in the Total Mapped Group that had management fees that were lower than the fund's. For example, a TMG % of 10% means that 90% of the funds in the Total Mapped Group had higher management fees than the fund. The "Asset-Size Peer Group" (ASPG) comparison focuses on a fund's standing relative to non-Fidelity funds similar in size to the fund within the Total Mapped Group. The ASPG represents at least 15% of the funds in the Total Mapped Group with comparable asset size and management fee characteristics, subject to a minimum of 50 funds (or all funds in the Total Mapped Group if fewer than 50). Additional information, such as the ASPG quartile in which the fund's management fee ranked and the impact of the fund's performance adjustment, is also included in the chart and considered by the Board.
Annual Report
Board Approval of Investment Advisory Contracts and
Management Fees - continued
Fidelity Blue Chip Growth Fund

The Board noted that the fund's management fee ranked below the median of its Total Mapped Group and below the median of its ASPG for 2009. The Board also noted the effect of the fund's negative performance adjustment on the fund's management fee ranking. The Board noted that the performance adjustment for each year represents calculations for performance periods that differ from the periods shown in the performance charts above.
Furthermore, the Board considered that shareholders approved a prospective change in the index used to calculate the fund's performance adjustment beginning June 1, 2006. The Board also considered that, because the performance adjustment is based on a rolling 36-month measurement period, during a transition period the fund's performance is compared to a blended index return that reflects the performance of the former index for the portion of the measurement period prior to June 1, 2006 and the performance of the current index for the remainder of the measurement period. The Board noted that the fund's performance adjustments for 2006 through 2009 shown in the chart above reflect the effect of using the blended index return to calculate the fund's performance adjustment.
Based on its review, the Board concluded that the fund's management fee is fair and reasonable in light of the services that the fund receives and the other factors considered.
Total Expenses. In its review of each class's total expenses, the Board considered the fund's management fee as well as other fund or class expenses, as applicable, such as transfer agent fees, pricing and bookkeeping fees, and custodial, legal, and audit fees. The Board also noted the effects of any waivers and reimbursements on fees and expenses, as well as the impact of the fund's performance adjustment. As part of its review, the Board also considered current and historical total expenses of each class of the fund compared to competitive fund median expenses. Each class of the fund is compared to those funds and classes in the Total Mapped Group (used by the Board for management fee comparisons) that have a similar sales load structure.
Annual Report
The Board noted that the total expenses of each class ranked below its competitive median for the period.
Fees Charged to Other Fidelity Clients. The Board also considered Fidelity fee structures and other information with respect to clients of FMR and its affiliates, such as other mutual funds advised or subadvised by FMR or its affiliates, pension plan clients, and other institutional clients. In March 2010, the Board created an ad hoc joint committee with the board of other Fidelity funds (the Committee) to review and compare Fidelity's institutional investment advisory business with its business of providing services to the Fidelity funds, including the differences in services provided, fees charged, and costs incurred, as well as competition in their respective marketplaces.
Based on its review of total expenses and fees charged to other Fidelity clients, the Board concluded that the total expenses of each class of the fund were reasonable in light of the services that the fund and its shareholders receive and the other factors considered, including the findings of the Committee.
Costs of the Services and Profitability. The Board considered the revenues earned and the expenses incurred by Fidelity in conducting the business of developing, marketing, distributing, managing, administering and servicing the fund and its shareholders. The Board also considered the level of Fidelity's profits in respect of all the Fidelity funds.
On an annual basis, FMR presents to the Board Fidelity's profitability for the fund. Fidelity calculates the profitability for each fund, as well as aggregate profitability for groups of Fidelity funds and all Fidelity funds, using a series of detailed revenue and cost allocation methodologies which originate with the audited books and records of Fidelity. The Audit Committee of the Board reviews any significant changes from the prior year's methodologies.
PricewaterhouseCoopers LLP (PwC), independent registered public accounting firm and auditor to Fidelity and certain Fidelity funds, has been engaged annually by the Board as part of the Board's assessment of Fidelity's profitability analysis. PwC's engagement includes the review and assessment of Fidelity's methodologies used in determining the revenues and expenses attributable to Fidelity's mutual fund business, and completion of agreed-upon procedures surrounding the mathematical accuracy of fund profitability and its conformity to allocation methodologies. After considering PwC's reports issued under the engagement and information provided by Fidelity, the Board believes that while other allocation methods may also be reasonable, Fidelity's profitability methodologies are reasonable in all material respects.
Annual Report
Board Approval of Investment Advisory Contracts and
Management Fees - continued
The Board has also reviewed Fidelity's non-fund businesses and fall-out benefits related to the mutual fund business as well as cases where Fidelity's affiliates may benefit from or be related to the fund's business.
The Board considered the costs of the services provided by and the profits realized by Fidelity in connection with the operation of the fund and were satisfied that the profitability was not excessive in the circumstances.
Economies of Scale. The Board considered whether there have been economies of scale in respect of the management of the Fidelity funds, whether the Fidelity funds (including the fund) have appropriately benefited from any such economies of scale, and whether there is potential for realization of any further economies of scale. The Board considered the extent to which the fund will benefit from economies of scale through increased services to the fund, through waivers or reimbursements, or through fee or expense reductions.
In February 2009, the Board and the board of other Fidelity funds created an ad hoc committee (the Economies of Scale Committee) to analyze whether FMR attains economies of scale in respect of the management and servicing of the Fidelity funds, whether the Fidelity funds have appropriately benefited from such economies of scale, and whether there is potential for realization of any further economies of scale.
The Board recognized that the fund's management contract incorporates a "group fee" structure, which provides for lower group fee rates as total fund assets under FMR's management increase, and for higher group fee rates as total fund assets under FMR's management decrease. FMR calculates the group fee rates based on a tiered asset "breakpoint" schedule that varies based on asset class. The Board considered that the group fee is designed to deliver the benefits of economies of scale to fund shareholders when total Fidelity fund assets increase, even if assets of any particular fund are unchanged or have declined, because some portion of Fidelity's costs are attributable to services provided to all Fidelity funds, and all funds benefit if those costs can be allocated among more assets. The Board concluded that, given the group fee structure, fund shareholders will benefit from lower management fees as assets under FMR's management increase at the fund complex level, regardless of whether Fidelity achieves any such economies of scale.
The Board concluded, considering the findings of the Economies of Scale Committee, that any potential economies of scale are being appropriately shared between fund shareholders and Fidelity.
Annual Report
Additional Information Requested by the Board. In order to develop fully the factual basis for consideration of the Fidelity funds' Advisory Contracts, the Board requested and received additional information on certain topics, including (i) fund performance trends, actions to be taken by FMR to improve certain funds' overall performance, and Fidelity's long-term strategies for certain funds; (ii) portfolio manager changes that have occurred during the past year and length of portfolio manager tenure for different categories of funds over time; (iii) Fidelity's compensation structure for portfolio managers, research analysts, and other key personnel, the rationale for the compensation structure, and how the compensation structure provides appropriate performance incentives; (iv) the amount of the investment that each portfolio manager has made in the Fidelity fund(s) that he or she manages; (v) management and other fees paid by FMR to affiliated sub-advisers on behalf of the Fidelity funds; (vi) Fidelity's fee structures and rationale for recommending different fees among different categories of funds; (vii) Fidelity's rationale for recommending which funds should have a performance adjustment component as part of their management fees; (viii) the rationale for any differences between fund fee structures and fee structures in place for other Fidelity clients; and (ix) explanations regarding the relative total expenses borne by certain funds and classes, total expense competitive trends, and actions that might be taken by FMR to reduce total expenses for certain funds and classes.
Based on its evaluation of all of the conclusions noted above, and after considering all factors it believed relevant, the Board ultimately concluded that the advisory fee structures are fair and reasonable, and that the fund's Advisory Contracts should be renewed.
Annual Report
Managing Your Investments
Fidelity offers several ways to conveniently manage your workplace benefits (including your workplace savings plan, investments, and additional services) via your telephone or PC. You can access your plan and account information and research your investments 24 hours a day.
By Phone
Fidelity provides a single toll-free number to access plan information, account balances, positions, and quotes*. It's easy to navigate the service, and on your first call, the system will help you create a personal identification number (PIN) for security.
(phone_graphic)
Fidelity Workplace
Investing
1-800-835-5092
By PC
Fidelity's web site on the Internet provides a wide range of information, including plan information, daily financial news, fund performance, interactive planning tools, and news about Fidelity products and services.
(computer_graphic)
Fidelity's Web Site
www.401k.com
* When you call the quotes line, please remember that a fund's yield and return will vary and, except for money market funds, share price will also vary. This means that you may have a gain or loss when you sell your shares. There is no assurance that money market funds will be able to maintain a stable $1 share price; an investment in a money market fund is not insured or guaranteed by the U.S. government. Total returns are historical and include changes in share price, reinvestment of dividends and capital gains, and the effects of any sales charges.
Annual Report
To Write Fidelity
We'll give your correspondence immediate attention and send you written confirmation upon completion of your request.
(letter_graphic)
For Non-Retirement
Accounts
Buying shares
Fidelity Investments
P.O. Box 770001
Cincinnati, OH 45277-0003
Overnight Express
Fidelity Investments
Attn: Distribution Services
100 Crosby Parkway - KC1H
Covington, KY 41015
Selling shares
Fidelity Investments
P.O. Box 770001
Cincinnati, OH 45277-0035
Overnight Express
Fidelity Investments
Attn: Distribution Services
100 Crosby Parkway - KC1H
Covington, KY 41015
General Correspondence
Fidelity Investments
P.O. Box 500
Merrimack, NH 03054-0500
(letter_graphic)
For Retirement
Accounts
Buying shares
Fidelity Investments
P.O. Box 770001
Cincinnati, OH 45277-0003
Selling shares
Fidelity Investments
P.O. Box 770001
Cincinnati, OH 45277-0035
Overnight Express
Fidelity Investments
Attn: Distribution Services
100 Crosby Parkway - KC1H
Covington, KY 41015
General Correspondence
Fidelity Investments
P.O. Box 500
Merrimack, NH 03054-0500
Annual Report
Investment Adviser
Fidelity Management & Research Company
Boston, MA
Investment Sub-Advisers
FMR Co., Inc.
Fidelity Research & Analysis Company
Fidelity Management & Research
(U.K.) Inc.
Fidelity Management & Research
(Hong Kong) Limited
Fidelity Management & Research
(Japan) Inc.
General Distributor
Fidelity Distributors Corporation
Boston, MA
Transfer and Service Agents
Fidelity Investments Institutional
Operations Company, Inc.
Boston, MA
Fidelity Service Company, Inc.
Boston, MA
Custodian
Citibank, N.A.
New York, NY
BCF-K-UANN-0910
1.863112.101
Fidelity®
Blue Chip Value
Fund
Annual Report
July 31, 2010
(2_fidelity_logos) (Registered_Trademark)
Contents
Chairman's Message | <Click Here> | The Chairman's message to shareholders. |
Performance | <Click Here> | How the fund has done over time. |
Management's Discussion of Fund Performance | <Click Here> | The Portfolio Manager's review of fund performance and strategy. |
Shareholder Expense Example | <Click Here> | An example of shareholder expenses. |
Investment Changes | <Click Here> | A summary of major shifts in the fund's investments over the past 6 months. |
Investments | <Click Here> | A complete list of the fund's investments with their market values. |
Financial Statements | <Click Here> | Statements of assets and liabilities, operations, and changes in net assets,
as well as financial highlights. |
Notes | <Click Here> | Notes to the financial statements. |
Report of Independent Registered Public Accounting Firm | <Click Here> | |
Trustees and Officers | <Click Here> | |
Distributions | <Click Here> | |
Board Approval of Investment Advisory Contracts and Management Fees | <Click Here> | |
To view a fund's proxy voting guidelines and proxy voting record for the 12-month period ended June 30, visit http://www.fidelity.com/proxyvotingresults or visit the Securities and Exchange Commission's (SEC) web site at http://www.sec.gov. You may also call 1-800-544-8544 to request a free copy of the proxy voting guidelines.
Standard & Poor's, S&P and S&P 500 are registered service marks of The McGraw-Hill Companies, Inc. and have been licensed for use by Fidelity Distributors Corporation.
Other third party marks appearing herein are the property of their respective owners.
All other marks appearing herein are registered or unregistered trademarks or service marks of FMR LLC or an affiliated company.
Annual Report
This report and the financial statements contained herein are submitted for the general information of the shareholders of the fund. This report is not authorized for distribution to prospective investors in the fund unless preceded or accompanied by an effective prospectus.
A fund files its complete schedule of portfolio holdings with the SEC for the first and third quarters of each fiscal year on Form N-Q. Forms N-Q are available on the SEC's web site at http://www.sec.gov. A fund's Forms N-Q may be reviewed and copied at the SEC's Public Reference Room in Washington, DC. Information regarding the operation of the SEC's Public Reference Room may be obtained by calling 1-800-SEC-0330. For a complete list of a fund's portfolio holdings, view the most recent holdings listing, semiannual report, or annual report on Fidelity's web site at http://www.fidelity.com or http://www.advisor.fidelity.com, as applicable.
NOT FDIC INSURED • MAY LOSE VALUE • NO BANK GUARANTEE
Neither the fund nor Fidelity Distributors Corporation is a bank.
Annual Report
(photo_of_Edward_C_Johnson_3d)
Dear Shareholder:
A yearlong uptrend in global equity markets reversed course in late April 2010 when investor sentiment turned bearish due in great measure to concern that Europe's debt crisis would expand and slow or derail economic recovery. However, a bounceback in July helped to recover some of the ground that was lost. Financial markets are always unpredictable, of course, but there also are several time-tested investment principles that can help put the odds in your favor.
One of the basic tenets is to invest for the long term. Over time, riding out the markets' inevitable ups and downs has proven much more effective than selling into panic or chasing the hottest trend. Even missing only a few of the markets' best days can significantly diminish investor returns. Patience also affords the benefits of compounding - of earning interest on additional income or reinvested dividends and capital gains. There can be tax advantages and cost benefits to consider as well. While staying the course doesn't eliminate risk, it can considerably lessen the effect of short-term declines.
You can further manage your investing risk through diversification. And today, more than ever, geographic diversification should be taken into account. Studies indicate that asset allocation is the single most important determinant of a portfolio's long-term success. The right mix of stocks, bonds and cash - aligned to your particular risk tolerance and investment objective - is very important. Age-appropriate rebalancing is also an essential aspect of asset allocation. For younger investors, an emphasis on equities - which historically have been the best-performing asset class over time - is encouraged. As investors near their specific goal, such as retirement or sending a child to college, consideration may be given to replacing volatile assets (e.g. common stocks) with more-stable fixed investments (bonds or savings plans).
A third principle - investing regularly - can help lower the average cost of your purchases. Investing a certain amount of money each month or quarter helps ensure you won't pay for all your shares at market highs. This strategy - known as dollar cost averaging - also reduces "emotion" from investing, helping shareholders avoid selling weak performers just prior to an upswing, or chasing a hot performer just before a correction.
We invite you to contact us via the Internet, through our Investor Centers or by phone. It is our privilege to provide you the information you need to make the investments that are right for you.
Sincerely,
(The chairman's signature appears here.)
Edward C. Johnson 3d
Annual Report
Average annual total return reflects the change in the value of an investment, assuming reinvestment of the fund's distributions from dividend income and capital gains (the profits earned upon the sale of securities that have grown in value, if any) and assuming a constant rate of performance each year. The $10,000 table and the fund's returns do not reflect the deduction of taxes that a shareholder would pay on fund distributions or the redemption of fund shares. During periods of reimbursement by Fidelity, a fund's total return will be greater than it would be had the reimbursement not occurred. How a fund did yesterday is no guarantee of how it will do tomorrow.
Average Annual Total Returns
Periods ended July 31, 2010 | Past 1
year | Past 5
years | Life of
fund A |
Fidelity® Blue Chip Value Fund | 11.20% | -2.64% | 2.33% |
A From June 17, 2003.
$10,000 Over Life of Fund
Let's say hypothetically that $10,000 was invested in Fidelity® Blue Chip Value Fund on June 17, 2003, when the fund started. The chart shows how the value of your investment would have changed, and also shows how the Russell 1000® Value Index performed over the same period.
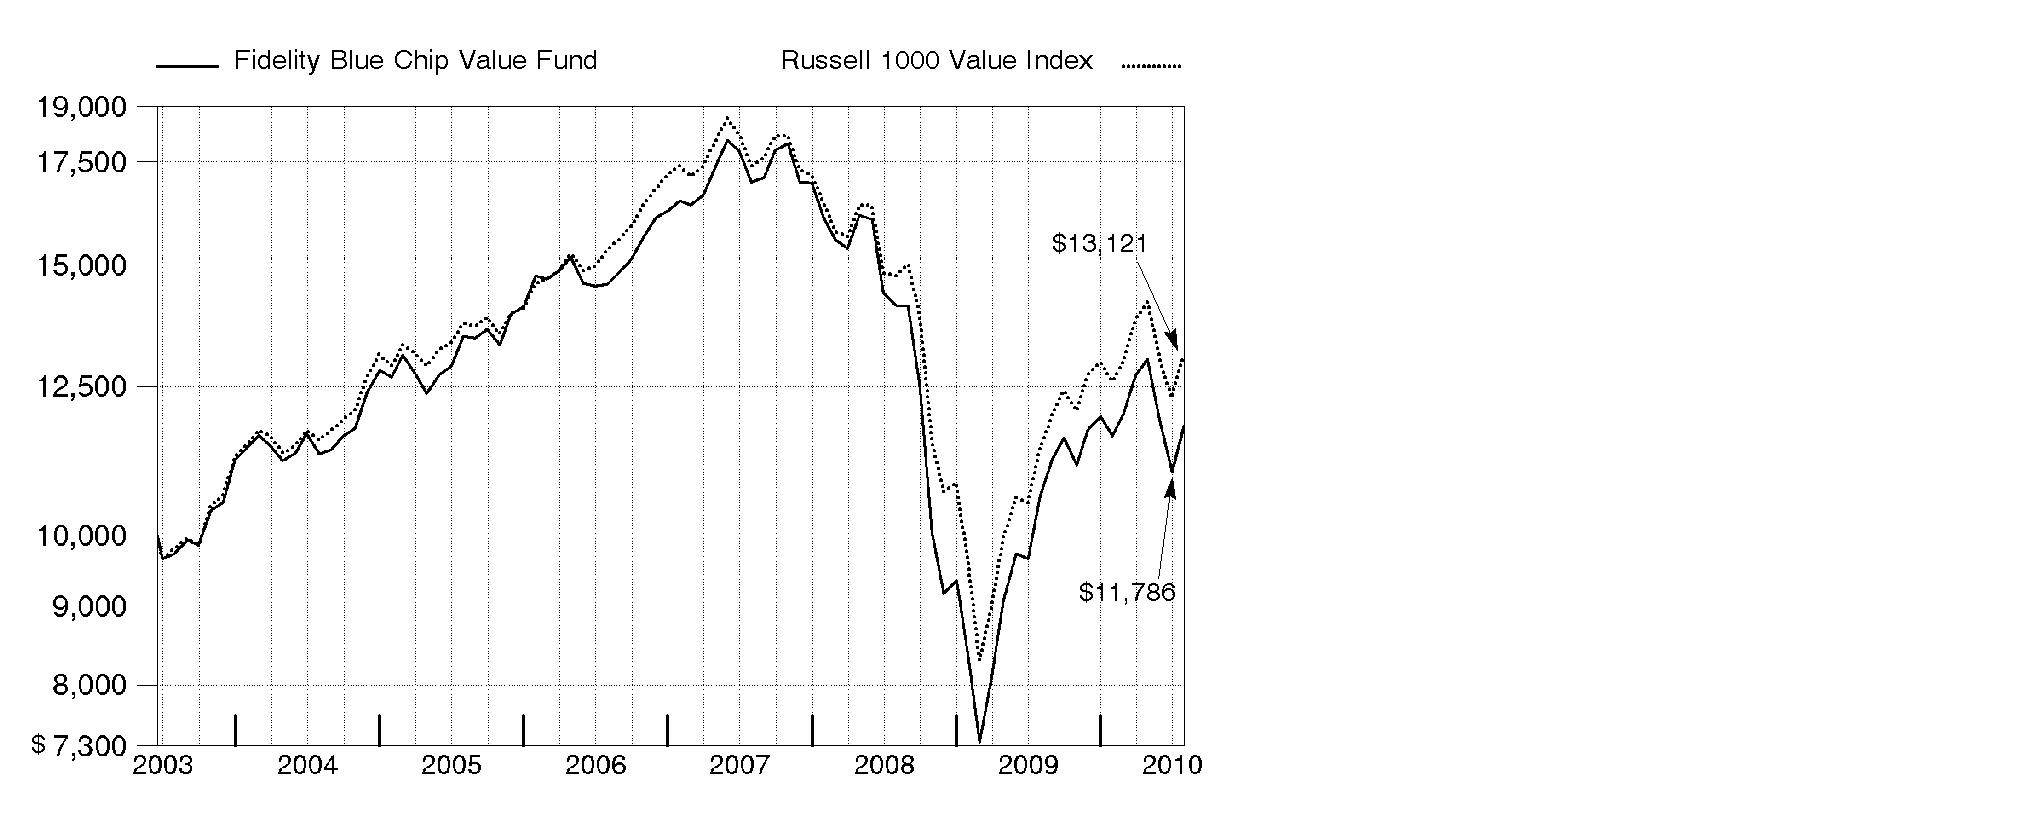
Annual Report
Market Recap: U.S. stock markets saw double-digit gains for the year ending July 31, 2010, despite the return of market volatility and risk aversion during the first half of 2010. An impressive bull run continued through 2009, bolstered by improvement in the economy and credit markets. Early in the new year, however, stocks fell sharply amid concerns about the global economic recovery, fueled by European debt woes and China's efforts to restrain inflation. After this brief dip, markets regained their upward momentum, as government stimulus and significant corporate cost cutting led to encouraging earnings reports, improved credit conditions and rising consumer confidence. Positive news continued through mid-April, when the Dow Jones Industrial AverageSM pushed above the 11,000 mark for the first time in 19 months. That milestone was short-lived, however, as heightened concern about the European debt crisis sparked an abrupt sell-off in May, leading to the first official correction since the rally began in March 2009. Although the market's malaise continued through June, stocks saw solid gains in July. For the year, the Dow rose 17.28%, while the S&P 500® Index was up 13.84%. Elsewhere, the technology-laden Nasdaq Composite® Index returned 14.99%. Small- and mid-cap stocks performed best, as measured by the 18.43% increase of the Russell 2000® Index and the 23.21% gain of the Russell Midcap® Index.
Comments from Charles Hebard, Portfolio Manager of Fidelity® Blue Chip Value Fund: During the year, the fund gained 11.20%, lagging the 15.39% gain of the Russell 1000® Value Index. Weak results in homebuilding, including KB Home and PulteGroup, detracted when both stocks fell after the expiration of the homebuyer tax credit. Diversified financials hurt, with Bank of America and others suffering from fears of increased government regulation. Underweighting real estate, the top-performing group, detracted, despite overall good stock picking there. We had poor stock selection in energy, including natural gas producer Petrohawk Energy, offset in part by underweighting integrated oil giant Exxon Mobil, which lagged. Capital goods was weak, with building products maker Masco weighing on returns. Unfavorable security selection in technology hardware/equipment hurt. Conversely, stock picking in industrials was the top contributor, including truck engine manufacturer Cummins and industrial products conglomerate Ingersoll Rand. Elsewhere, despite financials' overall drag on performance, we had some solid investments there, including commercial real estate broker CB Richard Ellis Group, an out-of-index position, and banker PNC Financial Services Group.
The views expressed above reflect those of the portfolio manager(s) only through the end of the period as stated on the cover of this report and do not necessarily represent the views of Fidelity or any other person in the Fidelity organization. Any such views are subject to change at any time based upon market or other conditions and Fidelity disclaims any responsibility to update such views. These views may not be relied on as investment advice and, because investment decisions for a Fidelity fund are based on numerous factors, may not be relied on as an indication of trading intent on behalf of any Fidelity fund.
Annual Report
Shareholder Expense Example
As a shareholder of the Fund, you incur two types of costs: (1) transaction costs, and (2) ongoing costs, including management fees and other Fund expenses. This Example is intended to help you understand your ongoing costs (in dollars) of investing in the Fund and to compare these costs with the ongoing costs of investing in other mutual funds.
The Example is based on an investment of $1,000 invested at the beginning of the period and held for the entire period (February 1, 2010 to July 31, 2010).
Actual Expenses
The first line of the accompanying table provides information about actual account values and actual expenses. You may use the information in this line, together with the amount you invested, to estimate the expenses that you paid over the period. Simply divide your account value by $1,000.00 (for example, an $8,600 account value divided by $1,000.00 = 8.6), then multiply the result by the number in the first line under the heading entitled "Expenses Paid During Period" to estimate the expenses you paid on your account during this period. A small balance maintenance fee of $12.00 that is charged once a year may apply for certain accounts with a value of less than $2,000. This fee is not included in the table below. If it was, the estimate of expenses you paid during the period would be higher, and your ending account value lower, by this amount. In addition, the Fund, as a shareholder in the underlying Fidelity Central Funds, will indirectly bear its pro-rata share of the fees and expenses incurred by the underlying Fidelity Central Funds. These fees and expenses are not included in the Fund's annualized expense ratio used to calculate the expense estimate in the table below.
Hypothetical Example for Comparison Purposes
The second line of the accompanying table provides information about hypothetical account values and hypothetical expenses based on the Fund's actual expense ratio and an assumed rate of return of 5% per year before expenses, which is not the Fund's actual return. The hypothetical account values and expenses may not be used to estimate the actual ending account balance or expenses you paid for the period. You may use this information to compare the ongoing costs of investing in the Fund and other funds. To do so, compare this 5% hypothetical example with the 5% hypothetical examples that appear in the shareholder reports of the other funds. A small balance maintenance fee of $12.00 that is charged once a year may apply for certain accounts with a value of less than $2,000. This fee is not included in the table below. If it was, the estimate of expenses you paid during the period would be higher, and your ending account value lower, by this amount. In addition, the Fund, as a shareholder in the underlying Fidelity Central Funds, will indirectly bear its pro-rata share of the fees and expenses incurred by the underlying Fidelity Central Funds. These fees and expenses are not included in the Fund's annualized expense ratio used to calculate the expense estimate in the table below.
Please note that the expenses shown in the table are meant to highlight your ongoing costs only and do not reflect any transaction costs. Therefore, the second line of the table is useful in comparing ongoing costs only, and will not help you determine the relative total costs of owning different funds.
Annual Report
Shareholder Expense Example - continued
| Annualized
Expense Ratio | Beginning
Account Value
February 1, 2010 | Ending
Account Value
July 31, 2010 | Expenses Paid
During Period*
February 1, 2010 to
July 31, 2010 |
Actual | .82% | $ 1,000.00 | $ 1,015.50 | $ 4.10 |
Hypothetical (5% return per year before expenses) | | $ 1,000.00 | $ 1,020.73 | $ 4.11 |
* Expenses are equal to the Fund's annualized expense ratio, multiplied by the average account value over the period, multiplied by 181/365 (to reflect the one-half year period).
Annual Report
Investment Changes (Unaudited)
Top Ten Stocks as of July 31, 2010 |
| % of fund's
net assets | % of fund's net assets
6 months ago |
JPMorgan Chase & Co. | 5.0 | 4.7 |
Wells Fargo & Co. | 4.8 | 4.7 |
Bank of America Corp. | 3.8 | 3.9 |
Pfizer, Inc. | 3.3 | 4.1 |
Chevron Corp. | 3.1 | 3.5 |
Merck & Co., Inc. | 2.9 | 2.1 |
Johnson & Johnson | 2.7 | 0.0 |
Procter & Gamble Co. | 2.0 | 1.2 |
Citigroup, Inc. | 1.9 | 0.0 |
Verizon Communications, Inc. | 1.8 | 3.0 |
| 31.3 | |
Top Five Market Sectors as of July 31, 2010 |
| % of fund's
net assets | % of fund's net assets
6 months ago |
Financials | 29.9 | 27.2 |
Health Care | 13.9 | 11.5 |
Energy | 13.9 | 18.2 |
Industrials | 11.5 | 9.5 |
Consumer Staples | 7.8 | 5.0 |
Asset Allocation (% of fund's net assets) |
As of July 31, 2010 * | As of January 31, 2010 ** |
| Stocks 99.5% | | | Stocks 98.8% | |
| Convertible
Securities 0.0% | |  | Convertible
Securities 0.2% | |
| Short-Term
Investments and
Net Other Assets 0.5% | | | Short-Term
Investments and
Net Other Assets 1.0% | |
* Foreign investments | 9.3% | | ** Foreign investments | 9.2% | |

Annual Report
Investments July 31, 2010
Showing Percentage of Net Assets
Common Stocks - 99.5% |
| Shares | | Value |
CONSUMER DISCRETIONARY - 5.3% |
Auto Components - 0.4% |
Johnson Controls, Inc. | 43,200 | | $ 1,244,592 |
Household Durables - 2.0% |
KB Home (d) | 285,400 | | 3,247,852 |
Pulte Group, Inc. (a) | 167,602 | | 1,471,546 |
Stanley Black & Decker, Inc. | 30,600 | | 1,775,412 |
| | 6,494,810 |
Media - 1.8% |
Time Warner Cable, Inc. | 59,167 | | 3,382,577 |
Time Warner, Inc. | 76,600 | | 2,409,836 |
| | 5,792,413 |
Specialty Retail - 1.1% |
Best Buy Co., Inc. | 21,900 | | 759,054 |
Lowe's Companies, Inc. | 87,065 | | 1,805,728 |
Staples, Inc. | 49,500 | | 1,006,335 |
| | 3,571,117 |
TOTAL CONSUMER DISCRETIONARY | | 17,102,932 |
CONSUMER STAPLES - 7.8% |
Beverages - 1.9% |
Anheuser-Busch InBev SA NV | 21,368 | | 1,131,684 |
Grupo Modelo SAB de CV Series C | 156,500 | | 849,485 |
The Coca-Cola Co. | 78,400 | | 4,320,624 |
| | 6,301,793 |
Food & Staples Retailing - 1.8% |
CVS Caremark Corp. | 103,400 | | 3,173,346 |
Kroger Co. | 47,600 | | 1,008,168 |
Walgreen Co. | 35,000 | | 999,250 |
Winn-Dixie Stores, Inc. (a) | 71,862 | | 704,966 |
| | 5,885,730 |
Food Products - 0.7% |
Nestle SA | 44,182 | | 2,184,603 |
Household Products - 2.0% |
Procter & Gamble Co. | 104,280 | | 6,377,765 |
Personal Products - 0.4% |
Avon Products, Inc. | 46,200 | | 1,438,206 |
Common Stocks - continued |
| Shares | | Value |
CONSUMER STAPLES - continued |
Tobacco - 1.0% |
British American Tobacco PLC sponsored ADR | 20,400 | | $ 1,406,172 |
Philip Morris International, Inc. | 33,700 | | 1,720,048 |
| | 3,126,220 |
TOTAL CONSUMER STAPLES | | 25,314,317 |
ENERGY - 13.9% |
Energy Equipment & Services - 4.0% |
Baker Hughes, Inc. | 80,657 | | 3,893,313 |
Ensco International Ltd. ADR | 31,950 | | 1,335,830 |
Halliburton Co. | 108,415 | | 3,239,440 |
Noble Corp. | 36,500 | | 1,186,250 |
Transocean Ltd. (a) | 18,800 | | 868,748 |
Weatherford International Ltd. (a) | 153,800 | | 2,491,560 |
| | 13,015,141 |
Oil, Gas & Consumable Fuels - 9.9% |
Alpha Natural Resources, Inc. (a) | 32,300 | | 1,238,059 |
Apache Corp. | 5,400 | | 516,132 |
BP PLC sponsored ADR | 38,800 | | 1,492,636 |
Chevron Corp. | 131,900 | | 10,052,099 |
Exxon Mobil Corp. | 75,050 | | 4,478,984 |
Marathon Oil Corp. | 127,100 | | 4,251,495 |
Massey Energy Co. | 29,000 | | 886,820 |
Occidental Petroleum Corp. | 50,116 | | 3,905,540 |
Petrohawk Energy Corp. (a) | 84,200 | | 1,327,834 |
Plains Exploration & Production Co. (a) | 45,200 | | 1,019,260 |
Royal Dutch Shell PLC Class B ADR | 24,500 | | 1,308,790 |
Southwestern Energy Co. (a) | 42,525 | | 1,550,036 |
| | 32,027,685 |
TOTAL ENERGY | | 45,042,826 |
FINANCIALS - 29.9% |
Capital Markets - 2.6% |
Franklin Resources, Inc. | 12,800 | | 1,287,424 |
Morgan Stanley | 189,400 | | 5,111,906 |
State Street Corp. | 52,270 | | 2,034,348 |
| | 8,433,678 |
Commercial Banks - 8.8% |
BB&T Corp. | 95,000 | | 2,358,850 |
Common Stocks - continued |
| Shares | | Value |
FINANCIALS - continued |
Commercial Banks - continued |
Huntington Bancshares, Inc. | 157,400 | | $ 953,844 |
PNC Financial Services Group, Inc. | 94,172 | | 5,592,875 |
Regions Financial Corp. | 229,640 | | 1,683,261 |
SVB Financial Group (a) | 23,000 | | 993,370 |
U.S. Bancorp, Delaware | 58,900 | | 1,407,710 |
Wells Fargo & Co. | 564,477 | | 15,652,947 |
| | 28,642,857 |
Consumer Finance - 0.9% |
Capital One Financial Corp. | 68,900 | | 2,916,537 |
Diversified Financial Services - 11.3% |
Bank of America Corp. | 867,802 | | 12,183,940 |
Citigroup, Inc. (a) | 1,533,900 | | 6,288,990 |
JPMorgan Chase & Co. | 402,652 | | 16,218,821 |
KKR Financial Holdings LLC | 126,500 | | 1,000,615 |
Moody's Corp. | 38,500 | | 906,675 |
| | 36,599,041 |
Insurance - 4.0% |
ACE Ltd. | 21,166 | | 1,123,491 |
Allstate Corp. | 65,200 | | 1,841,248 |
Everest Re Group Ltd. | 14,400 | | 1,117,728 |
Genworth Financial, Inc. Class A (a) | 198,827 | | 2,700,071 |
Lincoln National Corp. | 44,800 | | 1,166,592 |
MetLife, Inc. | 44,900 | | 1,888,494 |
Old Republic International Corp. | 57,900 | | 724,329 |
Unum Group | 47,200 | | 1,077,104 |
XL Capital Ltd. Class A | 70,132 | | 1,243,440 |
| | 12,882,497 |
Real Estate Investment Trusts - 0.9% |
ProLogis Trust | 41,900 | | 455,034 |
Public Storage | 13,400 | | 1,314,808 |
SL Green Realty Corp. | 21,200 | | 1,277,088 |
| | 3,046,930 |
Real Estate Management & Development - 1.1% |
CB Richard Ellis Group, Inc. Class A (a) | 216,400 | | 3,678,800 |
Thrifts & Mortgage Finance - 0.3% |
Radian Group, Inc. | 94,000 | | 808,400 |
TOTAL FINANCIALS | | 97,008,740 |
Common Stocks - continued |
| Shares | | Value |
HEALTH CARE - 13.9% |
Biotechnology - 2.1% |
Amgen, Inc. (a) | 73,100 | | $ 3,986,143 |
Biogen Idec, Inc. (a) | 33,600 | | 1,877,568 |
Genzyme Corp. (a) | 2,700 | | 187,812 |
Gilead Sciences, Inc. (a) | 22,800 | | 759,696 |
| | 6,811,219 |
Health Care Equipment & Supplies - 1.3% |
C. R. Bard, Inc. | 14,600 | | 1,146,538 |
Covidien PLC | 63,085 | | 2,354,332 |
Stryker Corp. | 15,900 | | 740,463 |
| | 4,241,333 |
Health Care Providers & Services - 1.4% |
Brookdale Senior Living, Inc. (a) | 69,500 | | 985,510 |
CIGNA Corp. | 44,400 | | 1,365,744 |
Humana, Inc. (a) | 49,100 | | 2,308,682 |
| | 4,659,936 |
Pharmaceuticals - 9.1% |
Johnson & Johnson | 152,037 | | 8,831,829 |
Merck & Co., Inc. | 268,600 | | 9,255,956 |
Pfizer, Inc. | 706,819 | | 10,602,285 |
Teva Pharmaceutical Industries Ltd. sponsored ADR | 14,800 | | 722,980 |
| | 29,413,050 |
TOTAL HEALTH CARE | | 45,125,538 |
INDUSTRIALS - 11.5% |
Aerospace & Defense - 2.0% |
Goodrich Corp. | 17,100 | | 1,246,077 |
Honeywell International, Inc. | 31,660 | | 1,356,948 |
Precision Castparts Corp. | 7,000 | | 855,330 |
United Technologies Corp. | 42,800 | | 3,043,080 |
| | 6,501,435 |
Building Products - 1.0% |
Masco Corp. | 212,400 | | 2,183,472 |
Owens Corning (a) | 35,800 | | 1,126,984 |
| | 3,310,456 |
Common Stocks - continued |
| Shares | | Value |
INDUSTRIALS - continued |
Commercial Services & Supplies - 0.7% |
Avery Dennison Corp. | 25,100 | | $ 899,835 |
Republic Services, Inc. | 43,330 | | 1,380,494 |
| | 2,280,329 |
Construction & Engineering - 0.9% |
Fluor Corp. | 34,700 | | 1,675,663 |
Jacobs Engineering Group, Inc. (a) | 27,150 | | 992,876 |
KBR, Inc. | 7,400 | | 165,612 |
| | 2,834,151 |
Electrical Equipment - 0.3% |
Regal-Beloit Corp. | 14,591 | | 887,571 |
Industrial Conglomerates - 1.9% |
General Electric Co. | 262,000 | | 4,223,440 |
Textron, Inc. | 97,600 | | 2,026,176 |
| | 6,249,616 |
Machinery - 2.3% |
Caterpillar, Inc. | 20,500 | | 1,429,875 |
Cummins, Inc. | 15,687 | | 1,248,842 |
Ingersoll-Rand Co. Ltd. | 105,600 | | 3,955,776 |
Navistar International Corp. (a) | 20,000 | | 1,034,200 |
| | 7,668,693 |
Road & Rail - 2.2% |
CSX Corp. | 53,500 | | 2,820,520 |
Union Pacific Corp. | 58,200 | | 4,345,794 |
| | 7,166,314 |
Trading Companies & Distributors - 0.2% |
WESCO International, Inc. (a) | 15,800 | | 567,694 |
TOTAL INDUSTRIALS | | 37,466,259 |
INFORMATION TECHNOLOGY - 7.1% |
Communications Equipment - 1.1% |
Cisco Systems, Inc. (a) | 119,000 | | 2,745,330 |
Juniper Networks, Inc. (a) | 33,200 | | 922,296 |
| | 3,667,626 |
Computers & Peripherals - 1.5% |
Hewlett-Packard Co. | 102,900 | | 4,737,516 |
Electronic Equipment & Components - 1.7% |
Agilent Technologies, Inc. (a) | 34,250 | | 956,603 |
Common Stocks - continued |
| Shares | | Value |
INFORMATION TECHNOLOGY - continued |
Electronic Equipment & Components - continued |
Avnet, Inc. (a) | 78,346 | | $ 1,970,402 |
Flextronics International Ltd. (a) | 144,100 | | 896,302 |
Tyco Electronics Ltd. | 60,085 | | 1,622,295 |
| | 5,445,602 |
Internet Software & Services - 0.5% |
eBay, Inc. (a) | 85,400 | | 1,785,714 |
IT Services - 0.3% |
International Business Machines Corp. | 7,200 | | 924,480 |
Semiconductors & Semiconductor Equipment - 2.0% |
Applied Materials, Inc. | 99,700 | | 1,176,460 |
KLA-Tencor Corp. | 82,900 | | 2,625,443 |
Lam Research Corp. (a) | 63,600 | | 2,683,284 |
| | 6,485,187 |
TOTAL INFORMATION TECHNOLOGY | | 23,046,125 |
MATERIALS - 2.7% |
Chemicals - 1.2% |
Celanese Corp. Class A | 27,700 | | 778,093 |
Dow Chemical Co. | 114,600 | | 3,132,018 |
| | 3,910,111 |
Construction Materials - 0.3% |
HeidelbergCement AG | 23,592 | | 1,188,281 |
Containers & Packaging - 0.4% |
Owens-Illinois, Inc. (a) | 43,800 | | 1,211,070 |
Metals & Mining - 0.7% |
ArcelorMittal SA Class A unit (d) | 29,200 | | 896,440 |
Freeport-McMoRan Copper & Gold, Inc. | 10,450 | | 747,593 |
Newcrest Mining Ltd. | 20,531 | | 607,669 |
| | 2,251,702 |
Paper & Forest Products - 0.1% |
Weyerhaeuser Co. | 24,405 | | 395,849 |
TOTAL MATERIALS | | 8,957,013 |
Common Stocks - continued |
| Shares | | Value |
TELECOMMUNICATION SERVICES - 2.9% |
Diversified Telecommunication Services - 2.0% |
Qwest Communications International, Inc. | 130,200 | | $ 736,932 |
Verizon Communications, Inc. | 203,418 | | 5,911,327 |
| | 6,648,259 |
Wireless Telecommunication Services - 0.9% |
Sprint Nextel Corp. (a) | 625,645 | | 2,859,198 |
TOTAL TELECOMMUNICATION SERVICES | | 9,507,457 |
UTILITIES - 4.5% |
Electric Utilities - 2.8% |
American Electric Power Co., Inc. | 57,900 | | 2,083,242 |
Entergy Corp. | 22,600 | | 1,751,726 |
FirstEnergy Corp. | 49,500 | | 1,866,150 |
NextEra Energy, Inc. | 39,400 | | 2,060,620 |
PPL Corp. | 52,300 | | 1,427,267 |
| | 9,189,005 |
Independent Power Producers & Energy Traders - 0.2% |
AES Corp. (a) | 58,800 | | 606,228 |
Multi-Utilities - 1.5% |
Alliant Energy Corp. | 36,651 | | 1,266,659 |
CMS Energy Corp. | 93,300 | | 1,485,336 |
PG&E Corp. | 50,100 | | 2,224,440 |
| | 4,976,435 |
TOTAL UTILITIES | | 14,771,668 |
TOTAL COMMON STOCKS (Cost $340,086,929) | 323,342,875 |
Money Market Funds - 1.0% |
| Shares | | Value |
Fidelity Cash Central Fund, 0.24% (b) | 1,255,294 | | $ 1,255,294 |
Fidelity Securities Lending Cash Central Fund, 0.27% (b)(c) | 1,931,250 | | 1,931,250 |
TOTAL MONEY MARKET FUNDS (Cost $3,186,544) | 3,186,544 |
TOTAL INVESTMENT PORTFOLIO - 100.5% (Cost $343,273,473) | | 326,529,419 |
NET OTHER ASSETS (LIABILITIES) - (0.5)% | | (1,616,282) |
NET ASSETS - 100% | $ 324,913,137 |
Legend |
(a) Non-income producing |
(b) Affiliated fund that is available only to investment companies and other accounts managed by Fidelity Investments. The rate quoted is the annualized seven-day yield of the fund at period end. A complete unaudited listing of the fund's holdings as of its most recent quarter end is available upon request. |
(c) Investment made with cash collateral received from securities on loan. |
(d) Security or a portion of the security is on loan at period end. |
Affiliated Central Funds |
Information regarding fiscal year to date income earned by the Fund from investments in Fidelity Central Funds is as follows: |
Fund | Income earned |
Fidelity Cash Central Fund | $ 3,762 |
Fidelity Securities Lending Cash Central Fund | 9,111 |
Total | $ 12,873 |
Other Information |
All investments are categorized as Level 1 under the Fair Value Hierarchy. The inputs or methodology used for valuing securities may not be an indication of the risk associated with investing in those securities. For more information on valuation inputs, please refer to the Security Valuation section in the accompanying Notes to Financial Statements. |
Income Tax Information |
At July 31, 2010, the Fund had a capital loss carryforward of approximately $168,260,098 of which $112,736,963 and $55,523,135 will expire on July 31, 2017 and 2018, respectively. Capital loss carryforwards are only available to offset future capital gains of the Fund to the extent provided by regulations and may be limited. |
See accompanying notes which are an integral part of the financial statements.
Annual Report
Statement of Assets and Liabilities
| July 31, 2010 |
| | |
Assets | | |
Investment in securities, at value (including securities loaned of $1,868,980) - See accompanying schedule: Unaffiliated issuers (cost $340,086,929) | $ 323,342,875 | |
Fidelity Central Funds (cost $3,186,544) | 3,186,544 | |
Total Investments (cost $343,273,473) | | $ 326,529,419 |
Receivable for investments sold | | 1,266,311 |
Receivable for fund shares sold | | 257,497 |
Dividends receivable | | 968,094 |
Distributions receivable from Fidelity Central Funds | | 602 |
Other receivables | | 6,320 |
Total assets | | 329,028,243 |
| | |
Liabilities | | |
Payable for investments purchased | $ 1,210,853 | |
Payable for fund shares redeemed | 569,181 | |
Accrued management fee | 105,282 | |
Other affiliated payables | 91,893 | |
Other payables and accrued expenses | 206,647 | |
Collateral on securities loaned, at value | 1,931,250 | |
Total liabilities | | 4,115,106 |
| | |
Net Assets | | $ 324,913,137 |
Net Assets consist of: | | |
Paid in capital | | $ 518,610,254 |
Undistributed net investment income | | 2,421,761 |
Accumulated undistributed net realized gain (loss) on investments and foreign currency transactions | | (179,214,844) |
Net unrealized appreciation (depreciation) on investments and assets and liabilities in foreign currencies | | (16,904,034) |
Net Assets, for 33,097,862 shares outstanding | | $ 324,913,137 |
Net Asset Value, offering price and redemption price per share ($324,913,137 ÷ 33,097,862 shares) | | $ 9.82 |
See accompanying notes which are an integral part of the financial statements.
Annual Report
Statement of Operations
| Year ended July 31, 2010 |
| | |
Investment Income | | |
Dividends | | $ 6,685,978 |
Interest | | 729 |
Income from Fidelity Central Funds | | 12,873 |
Total income | | 6,699,580 |
| | |
Expenses | | |
Management fee
Basic fee | $ 1,964,653 | |
Performance adjustment | (292,944) | |
Transfer agent fees | 1,130,159 | |
Accounting and security lending fees | 137,621 | |
Custodian fees and expenses | 22,911 | |
Independent trustees' compensation | 2,041 | |
Registration fees | 24,905 | |
Audit | 53,315 | |
Legal | 1,699 | |
Miscellaneous | 6,031 | |
Total expenses before reductions | 3,050,391 | |
Expense reductions | (22,719) | 3,027,672 |
Net investment income (loss) | | 3,671,908 |
Realized and Unrealized Gain (Loss) Net realized gain (loss) on: | | |
Investment securities: | | |
Unaffiliated issuers | 15,230,148 | |
Foreign currency transactions | (8,581) | |
Total net realized gain (loss) | | 15,221,567 |
Change in net unrealized appreciation (depreciation) on: Investment securities | 18,523,936 | |
Assets and liabilities in foreign currencies | 112 | |
Total change in net unrealized appreciation (depreciation) | | 18,524,048 |
Net gain (loss) | | 33,745,615 |
Net increase (decrease) in net assets resulting from operations | | $ 37,417,523 |
See accompanying notes which are an integral part of the financial statements.
Annual Report
Financial Statements - continued
Statement of Changes in Net Assets
| Year ended
July 31,
2010 | Year ended
July 31,
2009 |
Increase (Decrease) in Net Assets | | |
Operations | | |
Net investment income (loss) | $ 3,671,908 | $ 6,086,193 |
Net realized gain (loss) | 15,221,567 | (145,127,515) |
Change in net unrealized appreciation (depreciation) | 18,524,048 | 11,005,366 |
Net increase (decrease) in net assets resulting
from operations | 37,417,523 | (128,035,956) |
Distributions to shareholders from net investment income | (4,762,190) | (7,269,944) |
Distributions to shareholders from net realized gain | - | (412,628) |
Total distributions | (4,762,190) | (7,682,572) |
Share transactions
Proceeds from sales of shares | 59,027,300 | 80,005,344 |
Reinvestment of distributions | 4,632,338 | 7,439,489 |
Cost of shares redeemed | (104,167,012) | (136,690,953) |
Net increase (decrease) in net assets resulting from share transactions | (40,507,374) | (49,246,120) |
Total increase (decrease) in net assets | (7,852,041) | (184,964,648) |
| | |
Net Assets | | |
Beginning of period | 332,765,178 | 517,729,826 |
End of period (including undistributed net investment income of $2,421,761 and undistributed net investment income of $3,423,873, respectively) | $ 324,913,137 | $ 332,765,178 |
Other Information Shares | | |
Sold | 5,931,222 | 9,742,336 |
Issued in reinvestment of distributions | 479,700 | 760,861 |
Redeemed | (10,487,025) | (15,943,607) |
Net increase (decrease) | (4,076,103) | (5,440,410) |
See accompanying notes which are an integral part of the financial statements.
Annual Report
Financial Highlights
Years ended July 31, | 2010 | 2009 | 2008 | 2007 | 2006 |
Selected Per-Share Data | | | | | |
Net asset value, beginning of period | $ 8.95 | $ 12.15 | $ 15.46 | $ 13.95 | $ 13.21 |
Income from Investment Operations | | | | | |
Net investment income (loss) B | .10 | .16 | .21 | .19 | .10 |
Net realized and unrealized gain (loss) | .90 | (3.17) | (2.68) | 2.05 | .95 |
Total from investment operations | 1.00 | (3.01) | (2.47) | 2.24 | 1.05 |
Distributions from net investment income | (.13) | (.18) | (.16) | (.13) | (.08) |
Distributions from net realized gain | - | (.01) | (.68) | (.60) | (.23) |
Total distributions | (.13) | (.19) | (.84) | (.73) | (.31) |
Net asset value, end of period | $ 9.82 | $ 8.95 | $ 12.15 | $ 15.46 | $ 13.95 |
Total Return A | 11.20% | (24.89)% | (16.86)% | 16.60% | 8.05% |
Ratios to Average Net Assets C, E | | | | | |
Expenses before reductions | .87% | .77% | .92% | .87% | .94% |
Expenses net of fee waivers, if any | .87% | .77% | .92% | .87% | .94% |
Expenses net of all reductions | .86% | .77% | .91% | .87% | .93% |
Net investment income (loss) | 1.05% | 1.87% | 1.46% | 1.25% | .76% |
Supplemental Data | | | | | |
Net assets, end of period (000 omitted) | $ 324,913 | $ 332,765 | $ 517,730 | $ 731,351 | $ 272,702 |
Portfolio turnover rate D | 59% | 69% | 61% | 92% | 74% |
A Total returns would have been lower had certain expenses not been reduced during the periods shown.
B Calculated based on average shares outstanding during the period.
C Fees and expenses of the underlying Fidelity Central Funds are not included in the Fund's expense ratio. The Fund indirectly bears its proportionate share of the expenses of any underlying Fidelity Central Funds.
D Amount does not include the portfolio activity of any underlying Fidelity Central Funds.
E Expense ratios reflect operating expenses of the Fund. Expenses before reductions do not reflect amounts reimbursed by the investment adviser or reductions from brokerage service arrangements or reductions from other expense offset arrangements and do not represent the amount paid by the Fund during periods when reimbursements or reductions occur. Expenses net of fee waivers reflect expenses after reimbursement by the investment adviser but prior to reductions from brokerage service arrangements or other expense offset arrangements. Expenses net of all reductions represent the net expenses paid by the Fund.
See accompanying notes which are an integral part of the financial statements.
Annual Report
Notes to Financial Statements
For the period ended July 31, 2010
1. Organization.
Fidelity Blue Chip Value Fund (the Fund) is a fund of Fidelity Securities Fund (the Trust) and is authorized to issue an unlimited number of shares. The Trust is registered under the Investment Company Act of 1940, as amended (the 1940 Act), as an open-end management investment company organized as a Massachusetts business trust.
2. Investments in Fidelity Central Funds.
The Fund may invest in Fidelity Central Funds, which are open-end investment companies available only to other investment companies and accounts managed by Fidelity Management & Research Company (FMR) and its affiliates. The Fund's Schedule of Investments lists each of the Fidelity Central Funds held as of period end, if any, as an investment of the Fund, but does not include the underlying holdings of each Fidelity Central Fund. As an Investing Fund, the Fund indirectly bears its proportionate share of the expenses of the underlying Fidelity Central Funds.
The Money Market Central Funds seek preservation of capital and current income and are managed by Fidelity Investments Money Management, Inc. (FIMM), an affiliate of FMR.
A complete unaudited list of holdings for each Fidelity Central Fund is available upon request or at the Securities and Exchange Commission (the SEC) web site at www.sec.gov. In addition, the financial statements of the Fidelity Central Funds, which are not covered by the Fund's Report of Independent Registered Public Accounting Firm, are available on the SEC web site or upon request.
3. Significant Accounting Policies.
The financial statements have been prepared in conformity with accounting principles generally accepted in the United States of America (GAAP), which require management to make certain estimates and assumptions at the date of the financial statements. Actual results could differ from those estimates. The following summarizes the significant accounting policies of the Fund:
Security Valuation. Investments are valued as of 4:00 p.m. Eastern time on the last calendar day of the period. The Fund uses independent pricing services approved by the Board of Trustees to value its investments. When current market prices or quotations are not readily available or reliable, valuations may be determined in good faith in accordance with procedures adopted by the Board of Trustees. Factors used in determining value may include market or security specific events. The frequency with which these procedures are used cannot be predicted and they may be utilized to a significant extent. The value used for net asset value (NAV) calculation under these procedures may differ from published prices for the same securities.
Annual Report
3. Significant Accounting Policies - continued
Security Valuation - continued
The Fund categorizes the inputs to valuation techniques used to value its investments into a disclosure hierarchy consisting of three levels as shown below.
Level 1 - quoted prices in active markets for identical investments
Level 2 - other significant observable inputs (including quoted prices for similar investments, interest rates, prepayment speeds, etc.)
Level 3 - unobservable inputs (including the fund's own assumptions based on the best information available)
Changes in valuation techniques may result in transfers in or out of an assigned level within the disclosure hierarchy. Valuation techniques used to value the Fund's investments by major category are as follows.
Equity securities, including restricted securities, for which market quotations are readily available, are valued at the last reported sale price or official closing price as reported by an independent pricing service on the primary market or exchange on which they are traded and are categorized as Level 1 in the hierarchy. In the event there were no sales during the day or closing prices are not available, securities are valued at the last quoted bid price or may be valued using the last available price and are generally categorized as Level 2 in the hierarchy. For foreign equity securities, when significant market or security specific events arise, comparisons to the valuation of American Depositary Receipts (ADRs), futures contracts, Exchange-traded funds (ETFs) and certain indexes as well as quoted prices for similar securities are used and are categorized as Level 2 in the hierarchy in these circumstances. Utilizing these techniques may result in transfers between Level 1 and Level 2. For restricted equity securities and private placements where observable inputs are limited, assumptions about market activity and risk are used and are categorized as Level 3 in the hierarchy.
Investments in open-end mutual funds, including the Fidelity Central Funds, are valued at their closing net asset value each business day and are categorized as Level 1 in the hierarchy. Short-term securities with remaining maturities of sixty days or less for which quotations are not readily available are valued at amortized cost, which approximates fair value and are categorized as Level 2 in the hierarchy.
Foreign Currency. The Fund uses foreign currency contracts to facilitate transactions in foreign-denominated securities. Gains and losses from these transactions may arise from changes in the value of the foreign currency or if the counterparties do not perform under the contracts' terms.
Annual Report
Notes to Financial Statements - continued
3. Significant Accounting Policies - continued
Foreign Currency - continued
Foreign-denominated assets, including investment securities, and liabilities are translated into U.S. dollars at the exchange rate at period end. Purchases and sales of investment securities, income and dividends received and expenses denominated in foreign currencies are translated into U.S. dollars at the exchange rate in effect on the transaction date.
The effects of exchange rate fluctuations on investments are included with the net realized and unrealized gain (loss) on investment securities. Other foreign currency transactions resulting in realized and unrealized gain (loss) are disclosed separately.
Investment Transactions and Income. For financial reporting purposes, the Fund's investment holdings and NAV include trades executed through the end of the last business day of the period. The NAV per share for processing shareholder transactions is calculated as of the close of business of the New York Stock Exchange (NYSE), normally 4:00 p.m. Eastern time and includes trades executed through the end of the prior business day. Gains and losses on securities sold are determined on the basis of identified cost and may include proceeds received from litigation. Dividend income is recorded on the ex-dividend date, except for certain dividends from foreign securities where the ex-dividend date may have passed, which are recorded as soon as the Fund is informed of the ex-dividend date. Non-cash dividends included in dividend income, if any, are recorded at the fair market value of the securities received. Distributions received on securities that represent a return of capital or capital gain are recorded as a reduction of cost of investments and/or as a realized gain. The Fund estimates the components of distributions received that may be considered return of capital distributions or capital gain distributions. Interest income and distributions from the Fidelity Central Funds are accrued as earned. Interest income includes coupon interest and amortization of premium and accretion of discount on debt securities. Investment income is recorded net of foreign taxes withheld where recovery of such taxes is uncertain.
Expenses. Most expenses of the Trust can be directly attributed to a fund. Expenses which cannot be directly attributed are apportioned amongst each fund in the Trust. Expense estimates are accrued in the period to which they relate and adjustments are made when actual amounts are known.
Income Tax Information and Distributions to Shareholders. Each year the Fund intends to qualify as a regulated investment company, including distributing substantially all of its taxable income and realized gains under Subchapter M of the Internal Revenue Code and filing its U.S. federal tax return. As a result, no provision for income taxes is required. As of July 31, 2010, the Fund did not have any unrecognized tax benefits in
Annual Report
3. Significant Accounting Policies - continued
Income Tax Information and Distributions to Shareholders - continued
the accompanying financial statements. A fund's federal tax return is subject to examination by the Internal Revenue Service (IRS) for a period of three years. Foreign taxes are provided for based on the Fund's understanding of the tax rules and rates that exist in the foreign markets in which it invests.
Distributions are recorded on the ex-dividend date. Income and capital gain distributions are determined in accordance with income tax regulations, which may differ from GAAP.
Capital accounts within the financial statements are adjusted for permanent book-tax differences. These adjustments have no impact on net assets or the results of operations. Temporary book-tax differences will reverse in a subsequent period.
Book-tax differences are primarily due to short-term gain distributions from the Fidelity Central Funds, foreign currency transactions, partnerships, capital loss carryforwards, losses deferred due to wash sales and excise tax regulations.
The federal tax cost of investment securities and unrealized appreciation (depreciation) as of period end were as follows:
Gross unrealized appreciation | $ 27,404,692 |
Gross unrealized depreciation | (55,103,490) |
Net unrealized appreciation (depreciation) | $ (27,698,798) |
| |
Tax Cost | $ 354,228,217 |
The tax-based components of distributable earnings as of period end were as follows:
Undistributed ordinary income | $ 2,421,761 |
Capital loss carryforward | $ (168,260,098) |
Net unrealized appreciation (depreciation) | $ (27,698,539) |
The tax character of distributions paid was as follows:
| July 31, 2010 | July 31, 2009 |
Ordinary Income | $ 4,762,190 | $ 7,269,944 |
Long-term Capital Gains | - | 412,628 |
Total | $ 4,762,190 | $ 7,682,572 |
Annual Report
Notes to Financial Statements - continued
4. Purchases and Sales of Investments.
Purchases and sales of securities, other than short-term securities, aggregated $202,718,960 and $243,585,019, respectively.
5. Fees and Other Transactions with Affiliates.
Management Fee. FMR and its affiliates provide the Fund with investment management related services for which the Fund pays a monthly management fee. The management fee is the sum of an individual fund fee rate that is based on an annual rate of .30% of the Fund's average net assets and a group fee rate that averaged .26% during the period. The group fee rate is based upon the average net assets of all the mutual funds advised by FMR. The group fee rate decreases as assets under management increase and increases as assets under management decrease. In addition, the management fee is subject to a performance adjustment (up to a maximum of ± .20% of the Fund's average net assets over a 36 month performance period). The upward or downward adjustment to the management fee is based on the Fund's relative investment performance as compared to an appropriate benchmark index. For the period, the total annual management fee rate, including the performance adjustment, was .48% of the Fund's average net assets.
Transfer Agent Fees. Fidelity Investments Institutional Operations Company, Inc. (FIIOC), an affiliate of FMR, is the Fund's transfer, dividend disbursing and shareholder servicing agent. FIIOC receives account fees and asset-based fees that vary according to account size and type of account. FIIOC pays for typesetting, printing and mailing of shareholder reports, except proxy statements. For the period, the transfer agent fees were equivalent to an annual rate of .32% of average net assets.
Accounting and Security Lending Fees. Fidelity Service Company, Inc. (FSC), an affiliate of FMR, maintains the Fund's accounting records. The accounting fee is based on the level of average net assets for the month. Under a separate contract, FSC administers the security lending program. The security lending fee is based on the number and duration of lending transactions.
Brokerage Commissions. The Fund placed a portion of its portfolio transactions with brokerage firms which are affiliates of the investment adviser. The commissions paid to these affiliated firms were $10,754 for the period.
6. Committed Line of Credit.
The Fund participates with other funds managed by FMR in a $3.75 billion credit facility (the "line of credit") to be utilized for temporary or emergency purposes to fund shareholder redemptions or for other short-term liquidity purposes. The Fund has agreed to pay commitment fees on its pro-rata portion of the line of credit, which amounted to $1,401 and is reflected in Miscellaneous expenses on the Statement of Operations. During the period, there were no borrowings on this line of credit.
Annual Report
7. Security Lending.
The Fund lends portfolio securities from time to time in order to earn additional income. On the settlement date of the loan, the Fund receives collateral (in the form of U.S. Treasury obligations, letters of credit and/or cash) against the loaned securities and maintains collateral in an amount not less than 100% of the market value of the loaned securities during the period of the loan. The market value of the loaned securities is determined at the close of business of the Fund and any additional required collateral is delivered to the Fund on the next business day. If the borrower defaults on its obligation to return the securities loaned because of insolvency or other reasons, a fund could experience delays and costs in recovering the securities loaned or in gaining access to the collateral. Any cash collateral received is invested in the Fidelity Securities Lending Cash Central Fund. The value of loaned securities and cash collateral at period end are disclosed on the Fund's Statement of Assets and Liabilities. Security lending income represents the income earned on investing cash collateral, less fees and expenses associated with the loan, plus any premium payments that may be received on the loan of certain types of securities. Security lending income is presented in the Statement of Operations as a component of income from Fidelity Central Funds. Net income from lending portfolio securities during the period amounted to $9,111.
8. Expense Reductions.
Many of the brokers with whom FMR places trades on behalf of the Fund provided services to the Fund in addition to trade execution. These services included payments of certain expenses on behalf of the Fund totaling $22,719 for the period.
9. Other.
The Fund's organizational documents provide former and current trustees and officers with a limited indemnification against liabilities arising in connection with the performance of their duties to the Fund. In the normal course of business, the Fund may also enter into contracts that provide general indemnifications. The Fund's maximum exposure under these arrangements is unknown as this would be dependent on future claims that may be made against the Fund. The risk of material loss from such claims is considered remote.
Annual Report
To the Trustees of Fidelity Securities Fund and the Shareholders of Fidelity Blue Chip Value Fund:
In our opinion, the accompanying statement of assets and liabilities, including the schedule of investments, and the related statements of operations and of changes in net assets and the financial highlights present fairly, in all material respects, the financial position of Fidelity Blue Chip Value Fund (a fund of Fidelity Securities Fund) at July 31, 2010, the results of its operations for the year then ended, the changes in its net assets for each of the two years in the period then ended and the financial highlights for each of the five years in the period then ended, in conformity with accounting principles generally accepted in the United States of America. These financial statements and financial highlights (hereafter referred to as "financial statements") are the responsibility of the Fidelity Blue Chip Value Fund's management. Our responsibility is to express an opinion on these financial statements based on our audits. We conducted our audits of these financial statements in accordance with the standards of the Public Company Accounting Oversight Board (United States). Those standards require that we plan and perform the audit to obtain reasonable assurance about whether the financial statements are free of material misstatement. An audit includes examining, on a test basis, evidence supporting the amounts and disclosures in the financial statements, assessing the accounting principles used and significant estimates made by management, and evaluating the overall financial statement presentation. We believe that our audits, which included confirmation of securities at July 31, 2010 by correspondence with the custodian and brokers, provide a reasonable basis for our opinion.
/s/ PricewaterhouseCoopers LLP
PricewaterhouseCoopers LLP
Boston, Massachusetts
September 13, 2010
Annual Report
The Trustees, Member of the Advisory Board, and executive officers of the trust and fund, as applicable, are listed below. The Board of Trustees governs the fund and is responsible for protecting the interests of shareholders. The Trustees are experienced executives who meet periodically throughout the year to oversee the fund's activities, review contractual arrangements with companies that provide services to the fund, oversee management of the risks associated with such activities and contractual arrangements, and review the fund's performance. Except for James C. Curvey, each of the Trustees oversees 222 funds advised by FMR or an affiliate. Mr. Curvey oversees 411 funds advised by FMR or an affiliate.
The Trustees hold office without limit in time except that (a) any Trustee may resign; (b) any Trustee may be removed by written instrument, signed by at least two-thirds of the number of Trustees prior to such removal; (c) any Trustee who requests to be retired or who has become incapacitated by illness or injury may be retired by written instrument signed by a majority of the other Trustees; and (d) any Trustee may be removed at any special meeting of shareholders by a two-thirds vote of the outstanding voting securities of the trust. Each Trustee who is not an interested person (as defined in the 1940 Act) (Independent Trustee), shall retire not later than the last day of the calendar year in which his or her 72nd birthday occurs. The Independent Trustees may waive this mandatory retirement age policy with respect to individual Trustees. The executive officers and Advisory Board Member hold office without limit in time, except that any officer and Advisory Board Member may resign or may be removed by a vote of a majority of the Trustees at any regular meeting or any special meeting of the Trustees. Except as indicated, each individual has held the office shown or other offices in the same company for the past five years.
Experience, Skills, Attributes, and Qualifications of the Fund's Trustees. The Governance and Nominating Committee has adopted a statement of policy that describes the experience, qualifications, attributes, and skills that are necessary and desirable for potential Independent Trustee candidates (Statement of Policy). The Board believes that each Trustee satisfied at the time he or she was initially elected or appointed a Trustee, and continues to satisfy, the standards contemplated by the Statement of Policy. The Governance and Nominating Committee also engages professional search firms to help identify potential Independent Trustee candidates who have the experience, qualifications, attributes, and skills consistent with the Statement of Policy. From time to time, additional criteria based on the composition and skills of the current Independent Trustees, as well as experience or skills that may be appropriate in light of future changes to board composition, business conditions, and regulatory or other developments, have also been considered by the professional search firms and the Governance and Nominating Committee. In addition, the Board takes into account the Trustees' commitment and participation in Board and committee meetings, as well as their leadership of standing and ad hoc committees throughout their tenure.
In determining that a particular Trustee was and continues to be qualified to serve as a Trustee, the Board has considered a variety of criteria, none of which, in isolation, was controlling. The Board believes that, collectively, the Trustees have balanced and diverse experience, qualifications, attributes, and skills, which allow the Board to operate effectively in governing the fund and protecting the interests of shareholders. Information about the specific experience, skills, attributes, and qualifications of each Trustee, which in each case led to the Board's conclusion that the Trustee should serve (or continue to serve) as a trustee of the fund, is provided below.
Annual Report
Board Structure and Oversight Function. Edward C. Johnson 3d is an interested person (as defined in the 1940 Act) and currently serves as Chairman. The Trustees have determined that an interested Chairman is appropriate and benefits shareholders because an interested Chairman has a personal and professional stake in the quality and continuity of services provided to the fund. Independent Trustees exercise their informed business judgment to appoint an individual of their choosing to serve as Chairman, regardless of whether the Trustee happens to be independent or a member of management. The Independent Trustees have determined that they can act independently and effectively without having an Independent Trustee serve as Chairman and that a key structural component for assuring that they are in a position to do so is for the Independent Trustees to constitute a substantial majority for the Board. The Independent Trustees also regularly meet in executive session. Ned C. Lautenbach serves as Chairman of the Independent Trustees and as such (i) acts as a liaison between the Independent Trustees and management with respect to matters important to the Independent Trustees and (ii) with management prepares agendas for Board meetings.
Fidelity funds are overseen by different Boards of Trustees. The fund's Board oversees Fidelity's equity and high income funds and another Board oversees Fidelity's investment-grade bond, money market, and asset allocation funds. The asset allocation funds may invest in Fidelity funds overseen by the fund's Board. The use of separate Boards, each with its own committee structure, allows the Trustees of each group of Fidelity funds to focus on the unique issues of the funds they oversee, including common research, investment, and operational issues. On occasion, the separate Boards establish joint committees to address issues of overlapping consequences for the Fidelity funds overseen by each Board.
The Trustees operate using a system of committees to facilitate the timely and efficient consideration of all matters of importance to the Trustees, the fund, and fund shareholders and to facilitate compliance with legal and regulatory requirements and oversight of the fund's activities and associated risks. The Board, acting through its committees, has charged FMR and its affiliates with (i) identifying events or circumstances the occurrence of which could have demonstrably adverse effects on the fund's business and/or reputation; (ii) implementing processes and controls to lessen the possibility that such events or circumstances occur or to mitigate the effects of such events or circumstances if they do occur; and (iii) creating and maintaining a system designed to evaluate continuously business and market conditions in order to facilitate the identification and implementation processes described in (i) and (ii) above. Because the day-to-day operations and activities of the fund are carried out by or through FMR, its affiliates and other service providers, the fund's exposure to risks is mitigated but not eliminated by the processes overseen by the Trustees. While each of the Board's committees has responsibility for overseeing different aspects of the fund's activities, oversight is exercised primarily through the Operations, Audit, and Compliance Committees. Appropriate personnel, including but not limited to the fund's Chief Compliance Officer (CCO), FMR's internal auditor, the independent accountants, the fund's Treasurer and portfolio management personnel, make periodic reports to the Board's committees, as appropriate. The responsibilities of each committee, including their oversight responsibilities, are described further under "Standing Committees of the Fund's Trustees."
Annual Report
Trustees and Officers - continued
The fund's Statement of Additional Information (SAI) includes more information about the Trustees. To request a free copy, call Fidelity at 1-800-544-8544.
Interested Trustees*:
Correspondence intended for each Trustee who is an interested person may be sent to Fidelity Investments, 82 Devonshire Street, Boston, Massachusetts 02109.
Name, Age; Principal Occupations and Other Relevant Experience+ |
Edward C. Johnson 3d (80) |
| Year of Election or Appointment: 1984 Mr. Johnson is Trustee and Chairman of the Board of Trustees of certain Trusts. Mr. Johnson serves as Chief Executive Officer, Chairman, and a Director of FMR LLC; Chairman and a Director of FMR; Chairman and a Director of Fidelity Research & Analysis Company (FRAC); Chairman and a Director of Fidelity Investments Money Management, Inc.; and Chairman and a Director of FMR Co., Inc. In addition, Mr. Johnson serves as Chairman and Director of FIL Limited. Previously, Mr. Johnson served as President of FMR LLC (2006-2007). |
James C. Curvey (75) |
| Year of Election or Appointment: 2007 Mr. Curvey also serves as Trustee (2007-present) of other investment companies advised by FMR. Mr. Curvey is a Director of FMR and FMR Co., Inc. (2007-present). Mr. Curvey is also Vice Chairman (2006-present) and Director of FMR LLC. In addition, Mr. Curvey serves as an Overseer for the Boston Symphony Orchestra and a member of the Trustees of Villanova University. |
* Trustees have been determined to be "Interested Trustees" by virtue of, among other things, their affiliation with the trust or various entities under common control with FMR.
+ The information above includes each Trustee's principal occupation during the last five years and other information relating to the experience, attributes, and skills relevant to each Trustee's qualifications to serve as a Trustee, which led to the conclusion that each Trustee should serve as a Trustee for the fund.
Annual Report
Independent Trustees:
Correspondence intended for each Independent Trustee (that is, the Trustees other than the Interested Trustees) may be sent to Fidelity Investments, P.O. Box 55235, Boston, Massachusetts 02205-5235.
Name, Age; Principal Occupations and Other Relevant Experience+ |
Dennis J. Dirks (62) |
| Year of Election or Appointment: 2005 Prior to his retirement in May 2003, Mr. Dirks was Chief Operating Officer and a member of the Board of The Depository Trust & Clearing Corporation (DTCC). He also served as President, Chief Operating Officer, and Board member of The Depository Trust Company (DTC) and President and Board member of the National Securities Clearing Corporation (NSCC). In addition, Mr. Dirks served as Chief Executive Officer and Board member of the Government Securities Clearing Corporation, Chief Executive Officer and Board member of the Mortgage-Backed Securities Clearing Corporation, as a Trustee and a member of the Finance Committee of Manhattan College (2005-2008), and as a Trustee and a member of the Finance Committee of AHRC of Nassau County (2006-2008). Currently, Mr. Dirks serves as a member of the Board of Directors for The Brookville Center for Children's Services, Inc. (2009-present). |
Alan J. Lacy (56) |
| Year of Election or Appointment: 2008 Mr. Lacy serves as Senior Adviser (2007-present) of Oak Hill Capital Partners, L.P. (private equity). Mr. Lacy also served as Chief Executive Officer (2000-2005) and Vice Chairman (2005-2006) of Sears Holdings Corporation and Sears, Roebuck and Co. (retail). In addition, Mr. Lacy serves as a member of the Board of Directors of The Western Union Company (global money transfer, 2006-present) and Bristol-Myers Squibb Company (global pharmaceuticals, 2007-present). Mr. Lacy is Chairman (2008-present) and a member (2006-present) of the Board of Trustees of The National Parks Conservation Association. |
Ned C. Lautenbach (66) |
| Year of Election or Appointment: 2000 Mr. Lautenbach is Chairman of the Independent Trustees of the Equity and High Income Funds (2006-present). Mr. Lautenbach is an Advisory Partner of Clayton, Dubilier & Rice, Inc. (private equity investment, 2008-present) and was previously a Partner of Clayton, Dubilier & Rice, Inc. (1998-2008). Previously, Mr. Lautenbach was with the International Business Machines Corporation (IBM) from 1968 until his retirement in 1998. Mr. Lautenbach serves as a Director of Eaton Corporation (diversified industrial) as well as the Philharmonic Center for the Arts in Naples, Florida. Mr. Lautenbach is also a member of the Board of Trustees of Fairfield University (2005-present), as well as a member of the Council on Foreign Relations. Previously, Mr. Lautenbach served as a Director of Sony Corporation (2006-2007). |
Joseph Mauriello (65) |
| Year of Election or Appointment: 2008 Prior to his retirement in January 2006, Mr. Mauriello served in numerous senior management positions including Deputy Chairman and Chief Operating Officer (2004-2005), and Vice Chairman of Financial Services (2002-2004) of KPMG LLP US (professional services, 1965-2005). Mr. Mauriello currently serves as a member of the Board of Directors of XL Capital Ltd. (global insurance and re-insurance, 2006-present) and of Arcadia Resources Inc. (health care services and products, 2007-present). Previously, Mr. Mauriello served as a Director of the Hamilton Funds of the Bank of New York (2006-2007). |
Cornelia M. Small (66) |
| Year of Election or Appointment: 2005 Ms. Small is a member of the Board of Directors of the Teagle Foundation (2009-present). Ms. Small is also a member of the Investment Committee, and Chair (2008-present) and a member of the Board of Trustees of Smith College. In addition, Ms. Small serves on the Investment Committee of the Berkshire Taconic Community Foundation (2008-present). Previously, Ms. Small served as Chairperson of the Investment Committee (2002-2008) of Smith College. In addition, Ms. Small served as Chief Investment Officer, Director of Global Equity Investments, and a member of the Board of Directors of Scudder, Stevens & Clark and Scudder Kemper Investments. |
William S. Stavropoulos (71) |
| Year of Election or Appointment: 2002 Mr. Stavropoulos is Vice Chairman of the Independent Trustees of the Equity and High Income Funds (2006-present). Mr. Stavropoulos serves as President and Founder of the Michigan Baseball Foundation, the Great Lakes Loons (2007-present). Mr. Stavropoulos is Chairman Emeritus of the Board of Directors of The Dow Chemical Company, where he previously served in numerous senior management positions, including President, CEO (1995-2000; 2002-2004), Chairman of the Executive Committee (2000-2006), and as a member of the Board of Directors (1990-2006). Currently, Mr. Stavropoulos is a Director of Teradata Corporation (data warehousing and technology solutions, 2008-present), Chemical Financial Corporation, Maersk Inc. (industrial conglomerate), Tyco International, Inc. (multinational manufacturing and services, 2007-present), and a member of the Advisory Board for Metalmark Capital (private equity investment, 2005-present). Mr. Stavropoulos is a special advisor to Clayton, Dubilier & Rice, Inc. (private equity investment). In addition, Mr. Stavropoulos is a member of the University of Notre Dame Advisory Council for the College of Science. |
David M. Thomas (61) |
| Year of Election or Appointment: 2008 Previously, Mr. Thomas served as Executive Chairman (2005-2006) and Chairman and Chief Executive Officer (2000-2005) of IMS Health, Inc. (pharmaceutical and healthcare information solutions). In addition, Mr. Thomas serves as a member of the Board of Directors of Fortune Brands, Inc. (consumer products), and Interpublic Group of Companies, Inc. (marketing communication, 2004-present). |
Michael E. Wiley (59) |
| Year of Election or Appointment: 2008 Mr. Wiley also serves as a Director of Asia Pacific Exploration Consolidated (international oil and gas exploration and production, 2008-present), and as a member of the Board of Trustees of the University of Tulsa (2000-2006; 2007-present). Mr. Wiley serves as a Director of Tesoro Corporation (independent oil refiner and marketer, 2005-present), and a Director of Bill Barrett Corporation (exploration and production, 2005-present). In addition, Mr. Wiley also serves as a Director of Post Oak Bank (privately-held bank, 2004-present). Previously, Mr. Wiley served as a Sr. Energy Advisor of Katzenbach Partners, LLC (consulting, 2006-2007), as an Advisory Director of Riverstone Holdings (private investment), Chairman, President, and CEO of Baker Hughes, Inc. (oilfield services, 2000-2004), and as Director of Spinnaker Exploration Company (exploration and production, 2001-2005). |
Annual Report
Trustees and Officers - continued
+ The information above includes each Trustee's principal occupation during the last five years and other information relating to the experience, attributes, and skills relevant to each Trustee's qualifications to serve as a Trustee, which led to the conclusion that each Trustee should serve as a Trustee for the fund.
Advisory Board Member and Executive Officers:
Correspondence intended for each executive officer and Peter S. Lynch may be sent to Fidelity Investments, 82 Devonshire Street, Boston, Massachusetts 02109.
Name, Age; Principal Occupation |
Peter S. Lynch (66) |
| Year of Election or Appointment: 2003 Member of the Advisory Board of Fidelity's Equity and High Income Funds. Mr. Lynch is Vice Chairman and a Director of FMR and FMR Co., Inc. In addition, Mr. Lynch serves as a Trustee of Boston College and as the Chairman of the Inner-City Scholarship Fund. Previously, Mr. Lynch served on the Special Olympics International Board of Directors (1997-2006). |
Kenneth B. Robins (40) |
| Year of Election or Appointment: 2008 President and Treasurer of Fidelity's Equity and High Income Funds. Mr. Robins also serves as President and Treasurer (2010-present) and Assistant Treasurer (2009-present) of other Fidelity funds and is an employee of Fidelity Investments (2004-present). Previously, Mr. Robins served as Deputy Treasurer of the Fidelity funds (2005-2008) and Treasurer and Chief Financial Officer of The North Carolina Capital Management Trust: Cash and Term Portfolios (2006-2008). |
Bruce T. Herring (44) |
| Year of Election or Appointment: 2006 Vice President of certain Equity Funds. Mr. Herring also serves as Group Chief Investments Officer of FMR. Previously, Mr. Herring served as a portfolio manager for Fidelity U.S. Equity Funds. |
Brian B. Hogan (45) |
| Year of Election or Appointment: 2009 Vice President of certain Equity Funds and Vice President of Sector Funds. Mr. Hogan also serves as Senior Vice President, Equity Research of FMR (2006-present) and President of FMR's Equity Division (2009-present). Previously, Mr. Hogan served as a portfolio manager. |
Scott C. Goebel (42) |
| Year of Election or Appointment: 2008 Secretary and Chief Legal Officer (CLO) of the Fidelity funds. Mr. Goebel also serves as General Counsel, Secretary, and Senior Vice President of FMR (2008-present) and FMR Co., Inc. (2008-present); Deputy General Counsel of FMR LLC; Chief Legal Officer of Fidelity Management & Research (Hong Kong) Limited (2008-present) and Assistant Secretary of Fidelity Management & Research (Japan) Inc. (2008-present), Fidelity Investments Money Management, Inc. (2008-present), Fidelity Management & Research (U.K.) Inc. (2008-present), and Fidelity Research and Analysis Company (2008-present). Previously, Mr. Goebel served as Assistant Secretary of the Funds (2007-2008) and as Vice President and Secretary of Fidelity Distributors Corporation (FDC) (2005-2007). |
William C. Coffey (41) |
| Year of Election or Appointment: 2009 Assistant Secretary of Fidelity's Equity and High Income Funds. Mr. Coffey also serves as Senior Vice President and Deputy General Counsel of FMR LLC (2010-present), and is an employee of Fidelity Investments. Previously, Mr. Coffey served as Vice President and Associate General Counsel of FMR LLC (2005-2009). |
Holly C. Laurent (56) |
| Year of Election or Appointment: 2008 Anti-Money Laundering (AML) Officer of the Fidelity funds. Ms. Laurent is an employee of Fidelity Investments. Previously, Ms. Laurent was Senior Vice President and Head of Legal for Fidelity Business Services India Pvt. Ltd. (2006-2008), and Senior Vice President, Deputy General Counsel and Group Head for FMR LLC (2005-2006). |
Christine Reynolds (51) |
| Year of Election or Appointment: 2008 Chief Financial Officer of the Fidelity funds. Ms. Reynolds became President of Fidelity Pricing and Cash Management Services (FPCMS) in August 2008. Ms. Reynolds served as Chief Operating Officer of FPCMS (2007-2008). Previously, Ms. Reynolds served as President, Treasurer, and Anti-Money Laundering officer of the Fidelity funds (2004-2007). |
Kenneth A. Rathgeber (63) |
| Year of Election or Appointment: 2004 Chief Compliance Officer of Fidelity's Equity and High Income Funds. Mr. Rathgeber is Chief Compliance Officer of Fidelity Management & Research (Hong Kong) Limited (2008-present), Fidelity Management & Research (Japan) Inc. (2008-present), FMR (2005-present), FMR Co., Inc. (2005-present), Fidelity Management & Research (U.K.) Inc. (2005-present), Fidelity Research & Analysis Company (2005-present), Fidelity Investments Money Management, Inc. (2005-present), Pyramis Global Advisors, LLC (2005-present), and Strategic Advisers, Inc. (2005-present). |
Jeffrey S. Christian (48) |
| Year of Election or Appointment: 2009 Deputy Treasurer of the Fidelity funds. Mr. Christian is an employee of Fidelity Investments. Previously, Mr. Christian served as Chief Financial Officer (2008-2009) of certain Fidelity funds and Senior Vice President of Fidelity Pricing and Cash Management Services (FPCMS) (2004-2009). |
Bryan A. Mehrmann (49) |
| Year of Election or Appointment: 2005 Deputy Treasurer of the Fidelity funds. Mr. Mehrmann is an employee of Fidelity Investments. |
Adrien E. Deberghes (42) |
| Year of Election or Appointment: 2008 Deputy Treasurer of Fidelity's Equity and High Income Funds. Mr. Deberghes also serves as Assistant Treasurer of other Fidelity funds (2010-present) and is an employee of Fidelity Investments (2008-present). Previously, Mr. Deberghes served as Senior Vice President of Mutual Fund Administration at State Street Corporation (2007-2008), Senior Director of Mutual Fund Administration at Investors Bank & Trust (2005-2007), and Director of Finance for Dunkin' Brands (2000-2005). |
Stephanie J. Dorsey (41) |
| Year of Election or Appointment: 2010 Assistant Treasurer of Fidelity's Equity and High Income Funds. Ms. Dorsey also serves as Deputy Treasurer of other Fidelity funds (2008-present) and is an employee of Fidelity Investments (2008-present). Previously, Ms. Dorsey served as Treasurer (2004-2008) of the JPMorgan Mutual Funds and Vice President (2004-2008) of JPMorgan Chase Bank. |
John R. Hebble (52) |
| Year of Election or Appointment: 2009 Assistant Treasurer of Fidelity's Equity and High Income Funds. Mr. Hebble also serves as Treasurer and Chief Financial Officer of The North Carolina Capital Management Trust: Cash and Term Portfolio (2008-present), President and Treasurer of other Fidelity funds (2008-present) and is an employee of Fidelity Investments. |
Gary W. Ryan (51) |
| Year of Election or Appointment: 2005 Assistant Treasurer of the Fidelity funds. Mr. Ryan is an employee of Fidelity Investments. Previously, Mr. Ryan served as Vice President of Fund Reporting in Fidelity Pricing and Cash Management Services (FPCMS) (1999-2005). |
Annual Report
The fund designates 100% of the dividends distributed during the fiscal year as qualifying for the dividends-received deduction for corporate shareholders.
The fund designates 100% of the dividends distributed during the fiscal year as amounts which may be taken into account as a dividend for the purposes of the maximum rate under section 1(h)(11) of the Internal Revenue Code.
The fund will notify shareholders in January 2011 of amounts for use in preparing 2010 income tax returns.
Annual Report
Board Approval of Investment Advisory Contracts and Management Fees
Fidelity Blue Chip Value Fund
Each year, the Board of Trustees, including the Independent Trustees (together, the Board), votes on the renewal of the management contract and sub-advisory agreements (together, the Advisory Contracts) for the fund. The Board, assisted by the advice of fund counsel and Independent Trustees' counsel, requests and considers a broad range of information relevant to the renewal of the Advisory Contracts throughout the year.
The Board meets regularly and considers at each of its meetings factors that are relevant to its annual consideration of the renewal of the fund's Advisory Contracts, including the services and support provided to the fund and its shareholders. The Board has established various standing committees, each composed of Independent Trustees with varying backgrounds, to which the Board has assigned specific subject matter responsibilities in order to enhance effective decision-making by the Board. The Board, acting directly and through its Committees, requests and receives information concerning the annual consideration of the renewal of the fund's Advisory Contracts. The Board also meets as needed to consider matters specifically related to the Board's annual consideration of the renewal of Advisory Contracts. Members of the Board may also meet with trustees of other Fidelity funds through ad hoc joint committees to discuss certain matters relevant to the Fidelity funds.
At its July 2010 meeting, the Board of Trustees, including the Independent Trustees, unanimously determined to renew the fund's Advisory Contracts. In reaching its determination, the Board considered all factors it believed relevant, including (i) the nature, extent, and quality of the services to be provided to the fund and its shareholders (including the investment performance of the fund); (ii) the competitiveness of the fund's management fee and total expenses; (iii) the total costs of the services to be provided by and the profits to be realized by Fidelity from its relationship with the fund; (iv) the extent to which economies of scale would be realized as the fund grows; and (v) whether fee levels reflect these economies of scale, if any, for the benefit of fund shareholders.
In considering whether to renew the Advisory Contracts for the fund, the Board reached a determination, with the assistance of fund counsel and Independent Trustees' counsel and through the exercise of its business judgment, that the renewal of the Advisory Contracts is in the best interests of fund shareholders and that the compensation to be received by Fidelity under the management contract is fair and reasonable. The Board's decision to renew the Advisory Contracts was not based on any single factor noted above, but rather was based on a comprehensive consideration of all the information provided to the Board at its meetings throughout the year. The Board, in reaching its determination to renew the Advisory Contracts, is aware that shareholders in the fund have a broad range of investment choices available to them, including a wide choice among mutual funds offered by Fidelity's competitors, and that the fund's shareholders, with the opportunity to review and weigh the disclosure provided by the fund in its prospectus and other public disclosures, have chosen to invest in this fund, managed by Fidelity.
Annual Report
Board Approval of Investment Advisory Contracts and
Management Fees - continued
Nature, Extent, and Quality of Services Provided. The Board considered the staffing within the investment adviser, FMR, and the sub-advisers (together, the Investment Advisers), including the backgrounds of the fund's investment personnel and the fund's investment objective and discipline. The Independent Trustees also had discussions with senior management of Fidelity's investment operations and investment groups. The Board considered the structure of the portfolio manager compensation program and whether this structure provides appropriate incentives to act in the best interest of the fund.
Resources Dedicated to Investment Management and Support Services. The Board and the equity research subcommittee of the Board's Fund Oversight Committee reviewed the size, education, and experience of the Investment Advisers' investment staff, their use of technology, and the Investment Advisers' approach to recruiting, training, and retaining portfolio managers and other research, advisory, and management personnel. The Board noted that Fidelity's analysts have access to a variety of technological tools and market and securities data that enable them to perform both fundamental and quantitative analysis and to specialize in various disciplines. The Board considered Fidelity's extensive global research capabilities that enable the Investment Advisers to aggregate data from various sources in an effort to produce positive investment results. The Board also considered that Fidelity's portfolio managers and analysts have access to daily portfolio attribution that allows for monitoring of a fund's portfolio, as well as an electronic communication system that provides immediate real-time access to research concerning issuers and credit enhancers. The Board noted FMR's continued focus on strengthening the organization and discipline of equity portfolio management and research.
Shareholder and Administrative Services. The Board considered (i) the nature, extent, quality, and cost of advisory, administrative, and shareholder services performed by the Investment Advisers and their affiliates under the Advisory Contracts and under separate agreements covering transfer agency, pricing and bookkeeping, and securities lending services for the fund; (ii) the nature and extent of the investment adviser's supervision of third party service providers, principally custodians and subcustodians; and (iii) the resources devoted to, and the record of compliance with, the fund's compliance policies and procedures. The Board also reviewed the allocation of fund brokerage, including allocations to brokers affiliated with the Investment Advisers, the use of brokerage commissions to pay fund expenses, and the use of "soft" commission dollars to pay for research services.
The Board noted that the growth of fund assets over time across the complex allows Fidelity to reinvest in the development of services designed to enhance the value or convenience of the Fidelity funds as investment vehicles. These services include 24-hour access to account information and market information through phone representatives and over the Internet, and investor education materials and asset allocation tools.
Annual Report
Investment in a Large Fund Family. The Board considered the benefits to shareholders of investing in a Fidelity fund, including the benefits of investing in a fund that is part of a large family of funds offering a variety of investment disciplines and providing a large variety of mutual fund investor services. The Board noted that Fidelity had taken, or had made recommendations that resulted in the Fidelity funds taking, a number of actions over the previous year that benefited particular funds, including (i) dedicating additional resources to investment research and restructuring and broadening the focus of the investment research teams; (ii) bolstering the senior management team that oversees asset management; (iii) launching Class F of certain funds as a lower-fee class available to Freedom K and Freedom Index Funds; (iv) lowering the initial investment minimums and ongoing balance requirements for Real Estate High Income Fund; (v) eliminating subsequent purchase minimums for all funds and adding a waiver of the investment minimum requirement for new accounts opened with the proceeds of a systematic withdrawal plan; (vi) eliminating the withdrawal minimum and maximum limits for systematic withdrawals from Advisor funds; (vii) expanding sales load waivers on Class A shares for Destiny Planholders and expanding Institutional Class eligibility for Class O Destiny Planholders; and (viii) changing certain Class A and Class T sales charge structures to further align them with industry practices.
Investment Performance. The Board considered whether the fund has operated in accordance with its investment objective, as well as its record of compliance with its investment restrictions. It also reviewed the fund's absolute investment performance, as well as the fund's relative investment performance measured over multiple periods against (i) a broad-based securities market index, and (ii) a peer group of mutual funds deemed appropriate by Fidelity and reviewed by the Board. The following charts considered by the Board show, over the one-, three-, and five-year periods ended December 31, 2009, the fund's cumulative total returns, the cumulative total returns of a broad-based securities market index ("benchmark"), and a range of cumulative total returns of a peer group of mutual funds identified by Morningstar, Inc. as having an investment style similar to that of the fund based on underlying portfolio holdings. The box within each chart shows the 25th percentile return (bottom of box) and the 75th percentile return (top of box) of the peer group. Returns shown above the box are in the first quartile and returns shown below the box are in the fourth quartile. The percentage beaten number noted below each chart corresponds to the percentile box and represents the percentage of funds in the peer group whose performance was equal to or lower than that of the fund.
Annual Report
Board Approval of Investment Advisory Contracts and
Management Fees - continued
Fidelity Blue Chip Value Fund
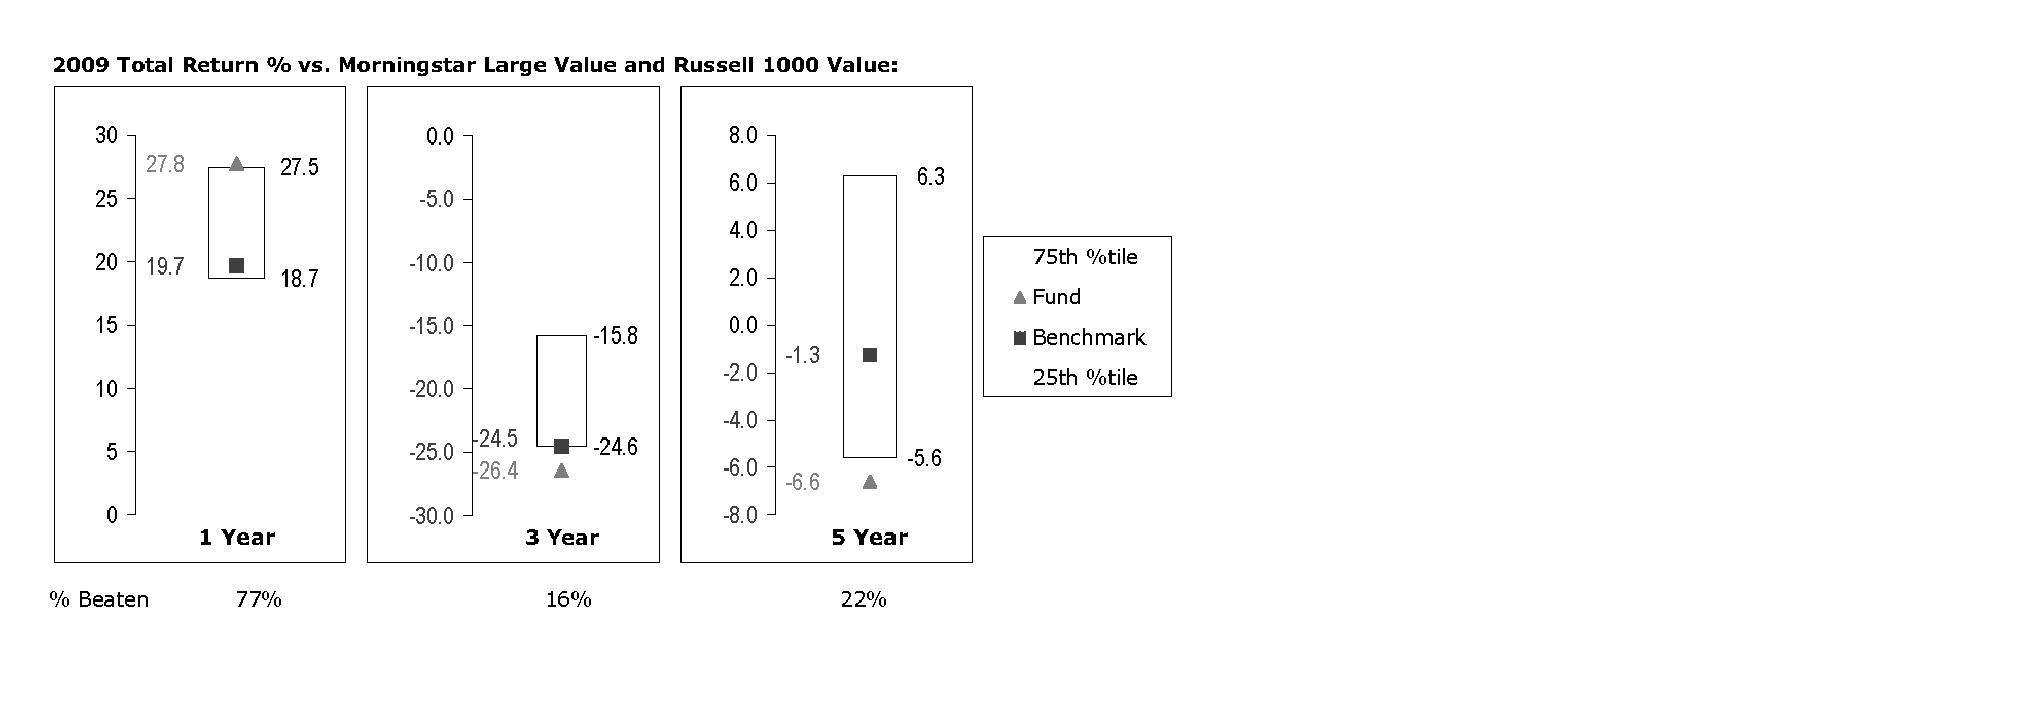
The Board reviewed the fund's relative investment performance against its peer group and noted that the performance of the fund was in the first quartile for the one-year period and the fourth quartile for the three- and five-year periods. The Board also noted that the investment performance of the fund was lower than its benchmark for the three- and five-year periods, although the fund's one-year cumulative total return compared favorably to its benchmark. The Board also reviewed the fund's performance since inception as well as performance in the current year.
The Board also considered that the fund's management fee is subject to upward or downward adjustment depending upon whether, and to what extent, the fund's investment performance for the performance period exceeds, or is exceeded by, the record (over the same period) of a Board-approved performance adjustment index. The Board realizes that the performance adjustment provides FMR with a strong economic incentive to seek to achieve superior performance for the fund's shareholders and helps to more closely align the interests of FMR and the fund's shareholders.
Based on its review, and giving particular weight to the nature and quality of the resources dedicated by the Investment Advisers to maintain and improve relative performance and factoring in the unprecedented market events in recent years, the Board concluded that the nature, extent, and quality of investment management and support services and of shareholder and administrative services provided to the fund will benefit the fund's shareholders, particularly in light of the Board's view that the fund's shareholders benefit from investing in a fund that is part of a large family of funds offering a variety of investment disciplines and services.
Annual Report
Competitiveness of Management Fee and Total Fund Expenses. The Board considered the fund's management fee and total expenses compared to "mapped groups" of competitive funds and classes. Fidelity creates "mapped groups" by combining similar Lipper investment objective categories that have comparable management fee characteristics. Combining Lipper investment objective categories aids the Board's management fee and total expense comparisons by broadening the competitive group used for comparison and by reducing the number of universes to which various Fidelity funds are compared.
Management Fee. The Board considered two proprietary management fee comparisons for the 12-month periods shown in the chart below. The group of Lipper funds used by the Board for management fee comparisons is referred to below as the "Total Mapped Group." The Total Mapped Group comparison focuses on a fund's standing relative to the total universe of comparable funds available to investors, in terms of gross management fees before expense reimbursements or caps, and without giving effect to the fund's performance adjustment. "TMG %" represents the percentage of funds in the Total Mapped Group that had management fees that were lower than the fund's. For example, a TMG % of 10% means that 90% of the funds in the Total Mapped Group had higher management fees than the fund. The "Asset-Size Peer Group" (ASPG) comparison focuses on a fund's standing relative to non-Fidelity funds similar in size to the fund within the Total Mapped Group. The ASPG represents at least 15% of the funds in the Total Mapped Group with comparable asset size and management fee characteristics, subject to a minimum of 50 funds (or all funds in the Total Mapped Group if fewer than 50). Additional information, such as the ASPG quartile in which the fund's management fee ranked and the impact of the fund's performance adjustment, is also included in the chart and considered by the Board.
Annual Report
Board Approval of Investment Advisory Contracts and
Management Fees - continued
Fidelity Blue Chip Value Fund

The Board noted that the fund's management fee ranked below the median of its Total Mapped Group and below the median of its ASPG for 2009. The Board also noted the effect of the fund's negative performance adjustment on the fund's management fee ranking. The Board noted that the performance adjustment for each year represents calculations for performance periods that differ from the periods shown in the performance charts above.
Based on its review, the Board concluded that the fund's management fee is fair and reasonable in light of the services that the fund receives and the other factors considered.
Total Expenses. In its review of the fund's total expenses, the Board considered the fund's management fee as well as other fund expenses, such as transfer agent fees, pricing and bookkeeping fees, and custodial, legal, and audit fees. The Board also noted the effects of any waivers and reimbursements on fees and expenses, as well as the impact of the fund's performance adjustment. As part of its review, the Board also considered current and historical total expenses of the fund compared to competitive fund median expenses. The fund is compared to those funds and classes in the Total Mapped Group (used by the Board for management fee comparisons) that have a similar sales load structure.
The Board noted that the fund's total expenses ranked below its competitive median for 2009.
Fees Charged to Other Fidelity Clients. The Board also considered Fidelity fee structures and other information with respect to clients of FMR and its affiliates, such as other mutual funds advised or subadvised by FMR or its affiliates, pension plan clients, and other institutional clients. In March 2010, the Board created an ad hoc joint committee with the board of other Fidelity funds (the Committee) to review and compare Fidelity's institutional investment advisory business with its business of providing services to the Fidelity funds, including the differences in services provided, fees charged, and costs incurred, as well as competition in their respective marketplaces.
Annual Report
Based on its review of total expenses and fees charged to other Fidelity clients, the Board concluded that the fund's total expenses were reasonable in light of the services that the fund and its shareholders receive and the other factors considered, including the findings of the Committee.
Costs of the Services and Profitability. The Board considered the revenues earned and the expenses incurred by Fidelity in conducting the business of developing, marketing, distributing, managing, administering and servicing the fund and its shareholders. The Board also considered the level of Fidelity's profits in respect of all the Fidelity funds.
On an annual basis, FMR presents to the Board Fidelity's profitability for the fund. Fidelity calculates the profitability for each fund, as well as aggregate profitability for groups of Fidelity funds and all Fidelity funds, using a series of detailed revenue and cost allocation methodologies which originate with the audited books and records of Fidelity. The Audit Committee of the Board reviews any significant changes from the prior year's methodologies.
PricewaterhouseCoopers LLP (PwC), independent registered public accounting firm and auditor to Fidelity and certain Fidelity funds, has been engaged annually by the Board as part of the Board's assessment of Fidelity's profitability analysis. PwC's engagement includes the review and assessment of Fidelity's methodologies used in determining the revenues and expenses attributable to Fidelity's mutual fund business, and completion of agreed-upon procedures surrounding the mathematical accuracy of fund profitability and its conformity to allocation methodologies. After considering PwC's reports issued under the engagement and information provided by Fidelity, the Board believes that while other allocation methods may also be reasonable, Fidelity's profitability methodologies are reasonable in all material respects.
The Board has also reviewed Fidelity's non-fund businesses and fall-out benefits related to the mutual fund business as well as cases where Fidelity's affiliates may benefit from or be related to the fund's business.
The Board considered the costs of the services provided by and the profits realized by Fidelity in connection with the operation of the fund and were satisfied that the profitability was not excessive in the circumstances.
Annual Report
Board Approval of Investment Advisory Contracts and
Management Fees - continued
Economies of Scale. The Board considered whether there have been economies of scale in respect of the management of the Fidelity funds, whether the Fidelity funds (including the fund) have appropriately benefited from any such economies of scale, and whether there is potential for realization of any further economies of scale. The Board considered the extent to which the fund will benefit from economies of scale through increased services to the fund, through waivers or reimbursements, or through fee or expense reductions.
In February 2009, the Board and the board of other Fidelity funds created an ad hoc committee (the Economies of Scale Committee) to analyze whether FMR attains economies of scale in respect of the management and servicing of the Fidelity funds, whether the Fidelity funds have appropriately benefited from such economies of scale, and whether there is potential for realization of any further economies of scale.
The Board recognized that the fund's management contract incorporates a "group fee" structure, which provides for lower group fee rates as total fund assets under FMR's management increase, and for higher group fee rates as total fund assets under FMR's management decrease. FMR calculates the group fee rates based on a tiered asset "breakpoint" schedule that varies based on asset class. The Board considered that the group fee is designed to deliver the benefits of economies of scale to fund shareholders when total Fidelity fund assets increase, even if assets of any particular fund are unchanged or have declined, because some portion of Fidelity's costs are attributable to services provided to all Fidelity funds, and all funds benefit if those costs can be allocated among more assets. The Board concluded that, given the group fee structure, fund shareholders will benefit from lower management fees as assets under FMR's management increase at the fund complex level, regardless of whether Fidelity achieves any such economies of scale.
The Board concluded, considering the findings of the Economies of Scale Committee, that any potential economies of scale are being appropriately shared between fund shareholders and Fidelity.
Additional Information Requested by the Board. In order to develop fully the factual basis for consideration of the Fidelity funds' Advisory Contracts, the Board requested and received additional information on certain topics, including (i) fund performance trends, actions to be taken by FMR to improve certain funds' overall performance, and Fidelity's long-term strategies for certain funds; (ii) portfolio manager changes that have occurred during the past year and length of portfolio manager tenure for different categories of funds over time; (iii) Fidelity's compensation structure for portfolio managers, research analysts, and other key personnel, the rationale for the compensation structure, and how the compensation structure provides appropriate performance incentives; (iv) the amount of the investment that each portfolio manager has made in the Fidelity fund(s) that he or she manages; (v) management and other fees paid by FMR to affiliated sub-advisers on behalf of the Fidelity funds; (vi) Fidelity's fee structures and rationale for recommending different fees among different categories of funds; (vii) Fidelity's rationale for recommending which funds should have a performance adjustment component as part of their management fees; (viii) the rationale for any differences between fund fee structures and fee structures in place for other Fidelity clients; and (ix) explanations regarding the relative total expenses borne by certain funds and classes, total expense competitive trends, and actions that might be taken by FMR to reduce total expenses for certain funds and classes.
Annual Report
Based on its evaluation of all of the conclusions noted above, and after considering all factors it believed relevant, the Board ultimately concluded that the advisory fee structures are fair and reasonable, and that the fund's Advisory Contracts should be renewed.
Annual Report
Managing Your Investments
Fidelity offers several ways to conveniently manage your personal investments via your telephone or PC. You can access your account information, conduct trades and research your investments 24 hours a day.
By Phone
Fidelity Automated Service Telephone provides a single toll-free number to access account balances, positions, quotes and trading. It's easy to navigate the service, and on your first call, the system will help you create a personal identification number (PIN) for security.
(phone_graphic)
Fidelity Automated
Service Telephone (FAST®)
1-800-544-5555
Press
For mutual fund and brokerage trading.
For quotes.*
For account balances and holdings.
To review orders and mutual
fund activity.
To change your PIN.
To speak to a Fidelity representative.
By PC
Fidelity's web site on the Internet provides a wide range of information, including daily financial news, fund performance, interactive planning tools and news about Fidelity products and services.
(computer_graphic)
Fidelity's Web Site
www.fidelity.com
* When you call the quotes line, please remember that a fund's yield and return will vary and, except for money market funds, share price will also vary. This means that you may have a gain or loss when you sell your shares. There is no assurance that money market funds will be able to maintain a stable $1 share price; an investment in a money market fund is not insured or guaranteed by the U.S. government. Total returns are historical and include changes in share price, reinvestment of dividends and capital gains, and the effects of any sales charges.
Annual Report
To Visit Fidelity
For directions and hours,
please call 1-800-544-9797.
Arizona
7001 West Ray Road
Chandler, AZ
15445 N. Scottsdale Road
Scottsdale, AZ
17550 North 75th Avenue
Glendale, AZ
5330 E. Broadway Blvd
Tucson, AZ
California
815 East Birch Street
Brea, CA
1411 Chapin Avenue
Burlingame, CA
851 East Hamilton Avenue
Campbell, CA
601 Larkspur Landing Circle
Larkspur, CA
2000 Avenue of the Stars
Los Angeles, CA
27101 Puerta Real
Mission Viejo, CA
73575 El Paseo
Palm Desert, CA
251 University Avenue
Palo Alto, CA
123 South Lake Avenue
Pasadena, CA
16656 Bernardo Ctr. Drive
Rancho Bernardo, CA
1220 Roseville Parkway
Roseville, CA
1740 Arden Way
Sacramento, CA
7676 Hazard Center Drive
San Diego, CA
11943 El Camino Real
San Diego, CA
8 Montgomery Street
San Francisco, CA
3793 State Street
Santa Barbara, CA
1200 Wilshire Boulevard
Santa Monica, CA
398 West El Camino Real
Sunnyvale, CA
111 South Westlake Blvd
Thousand Oaks, CA
21701 Hawthorne Boulevard
Torrance, CA
2001 North Main Street
Walnut Creek, CA
6326 Canoga Avenue
Woodland Hills, CA
2211 Michelson Drive
Irvine, CA
Colorado
281 East Flatiron Circle
Broomfield, CO
1625 Broadway
Denver, CO
9185 Westview Road
Lone Tree, CO
Connecticut
48 West Putnam Avenue
Greenwich, CT
265 Church Street
New Haven, CT
300 Atlantic Street
Stamford, CT
29 South Main Street
West Hartford, CT
1261 Post Road
Fairfield, CT
Delaware
400 Delaware Avenue
Wilmington, DE
Florida
175 East Altamonte Drive
Altamonte Springs, FL
1400 Glades Road
Boca Raton, FL
121 Alhambra Plaza
Coral Gables, FL
2948 N. Federal Highway
Ft. Lauderdale, FL
4671 Town Center Parkway
Jacksonville, FL
8880 Tamiami Trail, North
Naples, FL
230 Royal Palm Way
Palm Beach, FL
3501 PGA Boulevard
Palm Beach Gardens, FL
3550 Tamiami Trail, South
Sarasota, FL
1502 N. Westshore Blvd.
Tampa, FL
2465 State Road 7
Wellington, FL
Georgia
3242 Peachtree Road
Atlanta, GA
1000 Abernathy Road
Atlanta, GA
Illinois
One North LaSalle Street
Chicago, IL
401 North Michigan Avenue
Chicago, IL
One Skokie Valley Road
Highland Park, IL
1415 West 22nd Street
Oak Brook, IL
15105 S LaGrange Road
Orland Park, IL
1572 East Golf Road
Schaumburg, IL
1823 Freedom Drive
Naperville, IL
Indiana
8480 Keystone Crossing
Indianapolis, IN
Kansas
5400 College Boulevard
Overland Park, KS
Maine
Three Canal Plaza
Portland, ME
Maryland
7315 Wisconsin Avenue
Bethesda, MD
610 York Road
Towson, MD
Massachusetts
801 Boylston Street
Boston, MA
155 Congress Street
Boston, MA
300 Granite Street
Braintree, MA
44 Mall Road
Burlington, MA
238 Main Street
Cambridge, MA
200 Endicott Street
Danvers, MA
Annual Report
405 Cochituate Road
Framingham, MA
551 Boston Turnpike
Shrewsbury, MA
Michigan
500 E. Eisenhower Pkwy.
Ann Arbor, MI
280 N. Old Woodward Ave.
Birmingham, MI
30200 Northwestern Hwy.
Farmington Hills, MI
43420 Grand River Avenue
Novi, MI
3480 28th Street
Grand Rapids, MI
2425 S. Linden Road STE E
Flint, MI
Minnesota
7740 France Avenue South
Edina, MN
8342 3rd Street North
Oakdale, MN
Missouri
1524 South Lindbergh Blvd.
St. Louis, MO
Nevada
2225 Village Walk Drive
Henderson, NV
New Jersey
501 Route 73 South
Marlton, NJ
150 Essex Street
Millburn, NJ
35 Morris Street
Morristown, NJ
396 Route 17, North
Paramus, NJ
3518 Route 1 North
Princeton, NJ
530 Broad Street
Shrewsbury, NJ
New Mexico
2261 Q Street NE
Albuquerque, NM
New York
1130 Franklin Avenue
Garden City, NY
37 West Jericho Turnpike
Huntington Station, NY
1271 Avenue of the Americas
New York, NY
980 Madison Avenue
New York, NY
61 Broadway
New York, NY
350 Park Avenue
New York, NY
200 Fifth Avenue
New York, NY
733 Third Avenue
New York, NY
2070 Broadway
New York, NY
1075 Northern Blvd.
Roslyn, NY
799 Central Park Avenue
Scarsdale, NY
3349 Monroe Avenue
Rochester, NY
North Carolina
4611 Sharon Road
Charlotte, NC
7011 Fayetteville Road
Durham, NC
Ohio
3805 Edwards Road
Cincinnati, OH
1324 Polaris Parkway
Columbus, OH
1800 Crocker Road
Westlake, OH
28699 Chagrin Boulevard
Woodmere Village, OH
Oregon
7493 SW Bridgeport Road
Tigard, OR
Pennsylvania
600 West DeKalb Pike
King of Prussia, PA
1735 Market Street
Philadelphia, PA
12001 Perry Highway
Wexford, PA
Rhode Island
10 Memorial Boulevard
Providence, RI
Tennessee
3018 Peoples Street
Johnson City, TN
7628 West Farmington Blvd.
Germantown, TN
2035 Mallory Lane
Franklin, TN
Texas
10000 Research Boulevard
Austin, TX
4001 Northwest Parkway
Dallas, TX
12532 Memorial Drive
Houston, TX
2701 Drexel Drive
Houston, TX
6560 Fannin Street
Houston, TX
1701 Lake Robbins Drive
The Woodlands, TX
6500 N. MacArthur Blvd.
Irving, TX
6005 West Park Boulevard
Plano, TX
1576 East Southlake Blvd.
Southlake, TX
15600 Southwest Freeway
Sugar Land, TX
139 N. Loop 1604 East
San Antonio, TX
Utah
279 West South Temple
Salt Lake City, UT
Virginia
1861 International Drive
McLean, VA
11957 Democracy Drive
Reston, VA
Washington
10500 NE 8th Street
Bellevue, WA
1518 6th Avenue
Seattle, WA
304 Strander Blvd
Tukwila, WA
Washington, DC
1900 K Street, N.W.
Washington, DC
Wisconsin
16020 West Bluemound Road
Brookfield, WI
Fidelity Brokerage Services, Inc., 100 Summer St., Boston, MA 02110 Member NYSE/SIPC
Annual Report
To Write Fidelity
We'll give your correspondence immediate attention and send you written confirmation upon completion of your request.
(letter_graphic)
Making Changes
To Your Account
(such as changing name, address, bank, etc.)
Fidelity Investments
P.O. Box 770001
Cincinnati, OH 45277-0002
(letter_graphic)
For Non-Retirement
Accounts
Buying shares
Fidelity Investments
P.O. Box 770001
Cincinnati, OH 45277-0003
Overnight Express
Fidelity Investments
Attn: Distribution Services
100 Crosby Parkway - KC1H
Covington, KY 41015
Selling shares
Fidelity Investments
P.O. Box 770001
Cincinnati, OH 45277-0035
Overnight Express
Fidelity Investments
Attn: Distribution Services
100 Crosby Parkway - KC1H
Covington, KY 41015
General Correspondence
Fidelity Investments
P.O. Box 500
Merrimack, NH 03054-0500
(letter_graphic)
For Retirement
Accounts
Buying shares
Fidelity Investments
P.O. Box 770001
Cincinnati, OH 45277-0003
Selling shares
Fidelity Investments
P.O. Box 770001
Cincinnati, OH 45277-0035
Overnight Express
Fidelity Investments
Attn: Distribution Services
100 Crosby Parkway - KC1H
Covington, KY 41015
General Correspondence
Fidelity Investments
P.O. Box 500
Merrimack, NH 03054-0500
Annual Report
Investment Adviser
Fidelity Management & Research Company
Boston, MA
Investment Sub-Advisers
FMR Co., Inc.
Fidelity Research & Analysis Company
Fidelity Management & Research
(U.K.) Inc.
Fidelity Management & Research
(Japan) Inc.
Fidelity Management & Research
(Hong Kong) Limited
General Distributor
Fidelity Distributors Corporation
Boston, MA
Transfer and Service Agents
Fidelity Investments Institutional
Operations Company, Inc.
Boston, MA
Fidelity Service Company, Inc.
Boston, MA
Custodian
Brown Brothers Harriman & Co.
Boston, MA
The Fidelity Telephone Connection
Mutual Fund 24-Hour Service
Exchanges/Redemptions
and Account Assistance 1-800-544-6666
Product Information 1-800-544-6666
Retirement Accounts 1-800-544-4774
(8 a.m. - 9 p.m.)
TDD Service 1-800-544-0118
for the deaf and hearing impaired
(9 a.m. - 9 p.m. Eastern time)
Fidelity Automated Service
Telephone (FAST®) 1-800-544-5555
Automated line for quickest service
BCV-UANN-0910
1.789709.107
Fidelity®
Dividend Growth
Fund
Annual Report
July 31, 2010
(2_fidelity_logos) (Registered_Trademark)
Contents
Chairman's Message | <Click Here> | The Chairman's message to shareholders. |
Performance | <Click Here> | How the fund has done over time. |
Management's Discussion of Fund Performance | <Click Here> | The Portfolio Manager's review of fund performance and strategy. |
Shareholder Expense Example | <Click Here> | An example of shareholder expenses. |
Investment Changes | <Click Here> | A summary of major shifts in the fund's investments over the past six months. |
Investments | <Click Here> | A complete list of the fund's investments with their market values. |
Financial Statements | <Click Here> | Statements of assets and liabilities, operations, and changes in net assets,
as well as financial highlights. |
Notes | <Click Here> | Notes to the financial statements. |
Report of Independent Registered Public Accounting Firm | <Click Here> | |
Trustees and Officers | <Click Here> | |
Distributions | <Click Here> | |
Board Approval of Investment Advisory Contracts and Management Fees | <Click Here> | |
To view a fund's proxy voting guidelines and proxy voting record for the 12-month period ended June 30, visit http://www.fidelity.com/proxyvotingresults or visit the Securities and Exchange Commission's (SEC) web site at http://www.sec.gov. You may also call 1-800-544-8544 to request a free copy of the proxy voting guidelines.
Standard & Poor's, S&P and S&P 500 are registered service marks of The McGraw-Hill Companies, Inc. and have been licensed for use by Fidelity Distributors Corporation.
Other third party marks appearing herein are the property of their respective owners.
All other marks appearing herein are registered or unregistered trademarks or service marks of FMR LLC or an affiliated company.
Annual Report
This report and the financial statements contained herein are submitted for the general information of the shareholders of the fund. This report is not authorized for distribution to prospective investors in the fund unless preceded or accompanied by an effective prospectus.
A fund files its complete schedule of portfolio holdings with the SEC for the first and third quarters of each fiscal year on Form N-Q. Forms N-Q are available on the SEC's web site at http://www.sec.gov. A fund's Forms N-Q may be reviewed and copied at the SEC's Public Reference Room in Washington, DC. Information regarding the operation of the SEC's Public Reference Room may be obtained by calling 1-800-SEC-0330. For a complete list of a fund's portfolio holdings, view the most recent holdings listing, semiannual report, or annual report on Fidelity's web site at http://www.fidelity.com or http://www.advisor.fidelity.com, as applicable.
NOT FDIC INSURED • MAY LOSE VALUE • NO BANK GUARANTEE
Neither the fund nor Fidelity Distributors Corporation is a bank.
Annual Report
(photo_of_Edward_C_Johnson_3d)
Dear Shareholder:
A yearlong uptrend in global equity markets reversed course in late April 2010 when investor sentiment turned bearish due in great measure to concern that Europe's debt crisis would expand and slow or derail economic recovery. However, a bounceback in July helped to recover some of the ground that was lost. Financial markets are always unpredictable, of course, but there also are several time-tested investment principles that can help put the odds in your favor.
One of the basic tenets is to invest for the long term. Over time, riding out the markets' inevitable ups and downs has proven much more effective than selling into panic or chasing the hottest trend. Even missing only a few of the markets' best days can significantly diminish investor returns. Patience also affords the benefits of compounding - of earning interest on additional income or reinvested dividends and capital gains. There can be tax advantages and cost benefits to consider as well. While staying the course doesn't eliminate risk, it can considerably lessen the effect of short-term declines.
You can further manage your investing risk through diversification. And today, more than ever, geographic diversification should be taken into account. Studies indicate that asset allocation is the single most important determinant of a portfolio's long-term success. The right mix of stocks, bonds and cash - aligned to your particular risk tolerance and investment objective - is very important. Age-appropriate rebalancing is also an essential aspect of asset allocation. For younger investors, an emphasis on equities - which historically have been the best-performing asset class over time - is encouraged. As investors near their specific goal, such as retirement or sending a child to college, consideration may be given to replacing volatile assets (e.g. common stocks) with more-stable fixed investments (bonds or savings plans).
A third principle - investing regularly - can help lower the average cost of your purchases. Investing a certain amount of money each month or quarter helps ensure you won't pay for all your shares at market highs. This strategy - known as dollar cost averaging - also reduces "emotion" from investing, helping shareholders avoid selling weak performers just prior to an upswing, or chasing a hot performer just before a correction.
We invite you to contact us via the Internet, through our Investor Centers or by phone. It is our privilege to provide you the information you need to make the investments that are right for you.
Sincerely,
(The chairman's signature appears here.)
Edward C. Johnson 3d
Annual Report
Average annual total return reflects the change in the value of an investment, assuming reinvestment of the class' distributions from dividend income and capital gains (the profits earned upon the sale of securities that have grown in value, if any) and assuming a constant rate of performance each year. The $10,000 table and the fund's returns do not reflect the deduction of taxes that a shareholder would pay on fund distributions or the redemption of fund shares. During periods of reimbursement by Fidelity, a fund's total return will be greater than it would be had the reimbursement not occurred. How a fund did yesterday is no guarantee of how it will do tomorrow.
Average Annual Total Returns
Periods ended July 31, 2010 | Past 1
year | Past 5
years | Past 10
years |
Fidelity Dividend Growth Fund | 18.59% | 0.55% | 0.92% |
$10,000 Over 10 Years
Let's say hypothetically that $10,000 was invested in Fidelity Dividend Growth Fund, a class of the fund, on July 31, 2000. The chart shows how the value of your investment would have changed, and also shows how the S&P 500® Index performed over the same period.
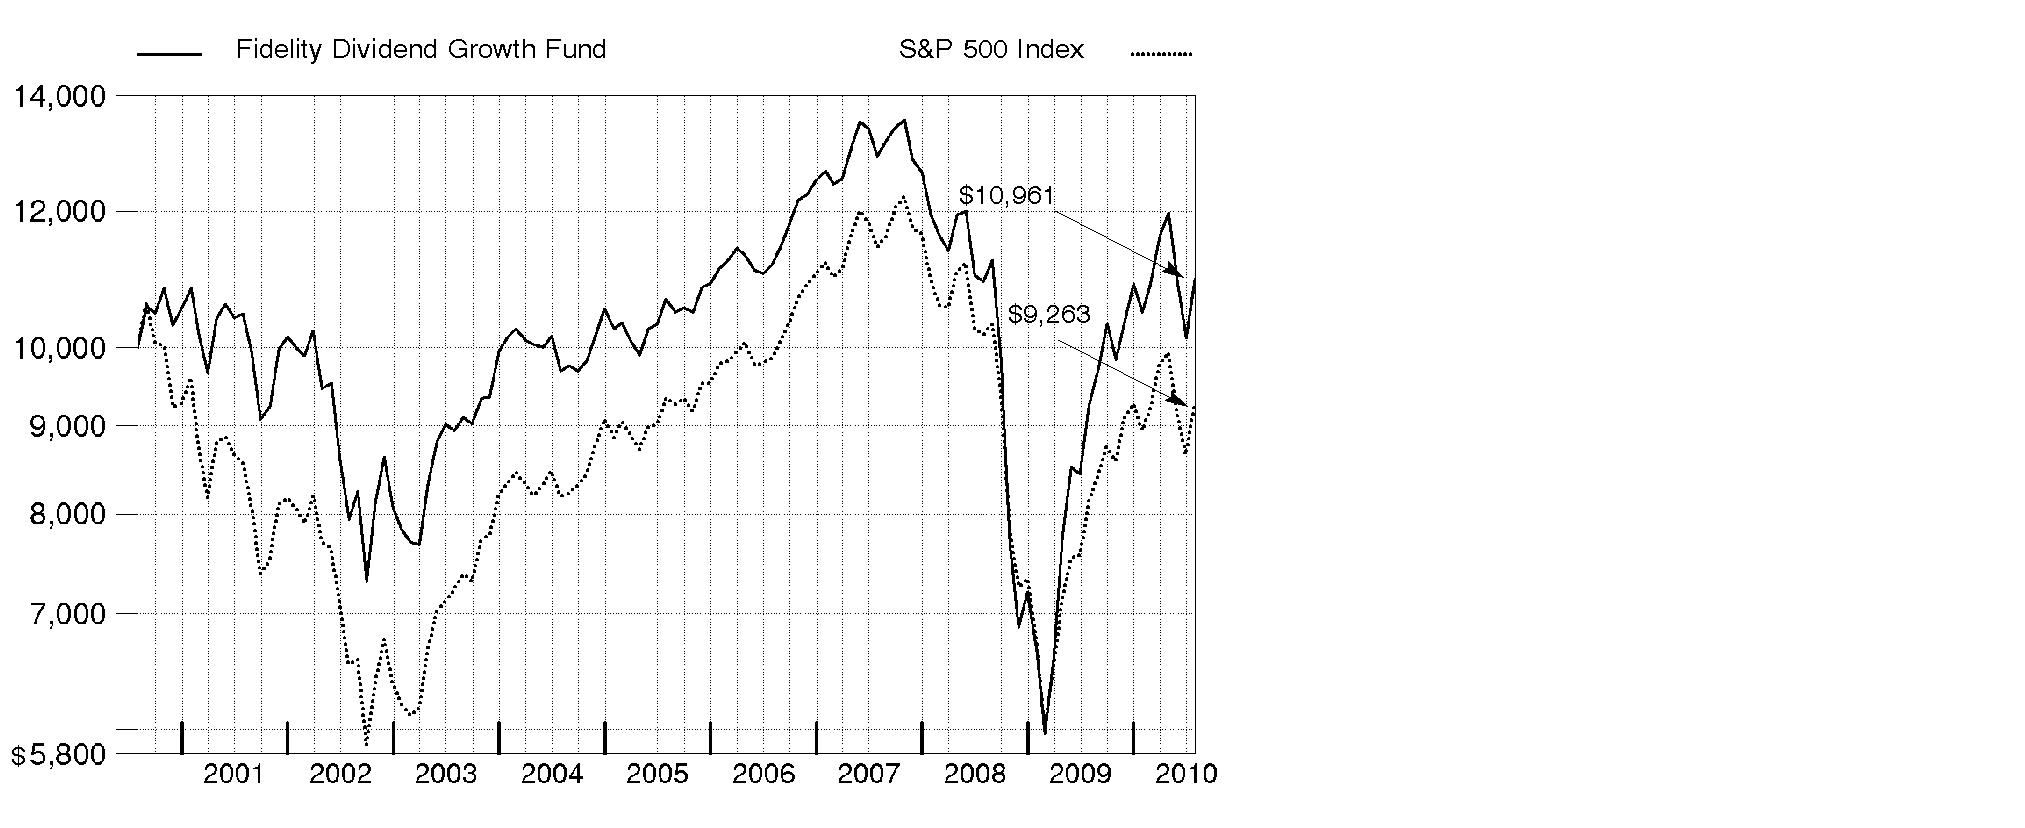
Annual Report
Market Recap: U.S. stock markets saw double-digit gains for the year ending July 31, 2010, despite the return of market volatility and risk aversion during the first half of 2010. An impressive bull run continued through 2009, bolstered by improvement in the economy and credit markets. Early in the new year, however, stocks fell sharply amid concerns about the global economic recovery, fueled by European debt woes and China's efforts to restrain inflation. After this brief dip, markets regained their upward momentum, as government stimulus and significant corporate cost cutting led to encouraging earnings reports, improved credit conditions and rising consumer confidence. Positive news continued through mid-April, when the Dow Jones Industrial AverageSM pushed above the 11,000 mark for the first time in 19 months. That milestone was short-lived, however, as heightened concern about the European debt crisis sparked an abrupt sell-off in May, leading to the first official correction since the rally began in March 2009. Although the market's malaise continued through June, stocks saw solid gains in July. For the year, the Dow rose 17.28%, while the S&P 500® Index was up 13.84%. Elsewhere, the technology-laden Nasdaq Composite® Index returned 14.99%. Small- and mid-cap stocks performed best, as measured by the 18.43% increase of the Russell 2000® Index and the 23.21% gain of the Russell Midcap® Index.
Comments from Lawrence Rakers, Portfolio Manager of Fidelity® Dividend Growth Fund: During the past year, the fund's Retail Class shares posted an 18.59% return, handily outpacing the S&P 500®. Versus the index, stock and industry positioning in financials made meaningful contributions. In materials, several strong-performing out-of-index positions were particularly beneficial. Favorable picks and a slight underweighting in the relatively weak-performing health care sector also helped. From a market-capitalization perspective, big overweightings in small- and mid-cap companies - those under $10 billion - bolstered results. At the stock level, underweighting energy giant and index heavyweight Exxon Mobil contributed, as the stock posted a double-digit loss. Bank holding PNC Financial Services Group added value, as did an out-of-index position in Brigham Exploration, a crude oil and natural gas exploration and production holding that I sold, and hospitality company Wyndham Worldwide. Not owning health care products provider Johnson & Johnson, a poorly performing benchmark constituent, also helped. Conversely, underweighting smart phone and computer maker Apple, a strong-performing index component, worked against us, along with disappointing out-of-index positions in natural gas producer Petrohawk Energy and energy services provider Weatherford International. Underweighting industrial conglomerate General Electric while the stock was enjoying a sharp advance also detracted.
The views expressed above reflect those of the portfolio manager(s) only through the end of the period as stated on the cover of this report and do not necessarily represent the views of Fidelity or any other person in the Fidelity organization. Any such views are subject to change at any time based upon market or other conditions and Fidelity disclaims any responsibility to update such views. These views may not be relied on as investment advice and, because investment decisions for a Fidelity fund are based on numerous factors, may not be relied on as an indication of trading intent on behalf of any Fidelity fund.
Annual Report
Shareholder Expense Example
As a shareholder of the Fund, you incur two types of costs: (1) transaction costs, and (2) ongoing costs, including management fees and other Fund expenses. This Example is intended to help you understand your ongoing costs (in dollars) of investing in the Fund and to compare these costs with the ongoing costs of investing in other mutual funds.
The Example is based on an investment of $1,000 invested at the beginning of the period and held for the entire period (February 1, 2010 to July 31, 2010).
Actual Expenses
The first line of the accompanying table for each class of the Fund provides information about actual account values and actual expenses. You may use the information in this line, together with the amount you invested, to estimate the expenses that you paid over the period. Simply divide your account value by $1,000.00 (for example, an $8,600 account value divided by $1,000.00 = 8.6), then multiply the result by the number in the first line for a class of the Fund under the heading entitled "Expenses Paid During Period" to estimate the expenses you paid on your account during this period. A small balance maintenance fee of $12.00 that is charged once a year may apply for certain accounts with a value of less than $2,000. This fee is not included in the table below. If it was, the estimate of expenses you paid during the period would be higher, and your ending account value lower, by this amount. In addition, the Fund, as a shareholder in the underlying Fidelity Central Funds, will indirectly bear its pro-rata share of the fees and expenses incurred by the underlying Fidelity Central Funds. These fees and expenses are not included in the Fund's annualized expense ratio used to calculate the expense estimate in the table below.
Hypothetical Example for Comparison Purposes
The second line of the accompanying table for each class of the Fund provides information about hypothetical account values and hypothetical expenses based on a Class' actual expense ratio and an assumed rate of return of 5% per year before expenses, which is not the Class' actual return. The hypothetical account values and expenses may not be used to estimate the actual ending account balance or expenses you paid for the period. You may use this information to compare the ongoing costs of investing in the Fund and other funds. To do so, compare this 5% hypothetical example with the 5% hypothetical examples that appear in the shareholder reports of the other funds. A small balance maintenance fee of $12.00 that is charged once a year may apply for certain accounts with a value of less than $2,000. This fee is not included in the table below. If it was, the estimate of expenses you paid during the period would be higher, and your ending account value lower, by this amount. In addition, the Fund, as a shareholder in the underlying Fidelity Central Funds, will indirectly bear its pro-rata share of the fees and expenses incurred by the underlying Fidelity Central Funds. These fees and expenses are not included in the Fund's annualized expense ratio used to calculate the expense estimate in the table below.
Please note that the expenses shown in the table are meant to highlight your ongoing costs only and do not reflect any transaction costs. Therefore, the second line of the table is useful in comparing ongoing costs only, and will not help you determine the relative total costs of owning different funds.
Annual Report
Shareholder Expense Example - continued
| Annualized
Expense Ratio | Beginning
Account Value
February 1, 2010 | Ending
Account Value
July 31, 2010 | Expenses Paid
During Period*
February 1, 2010
to July 31, 2010 |
Dividend Growth | .94% | | | |
Actual | | $ 1,000.00 | $ 1,046.10 | $ 4.77 |
HypotheticalA | | $ 1,000.00 | $ 1,020.13 | $ 4.71 |
Class K | .73% | | | |
Actual | | $ 1,000.00 | $ 1,047.40 | $ 3.71 |
HypotheticalA | | $ 1,000.00 | $ 1,021.17 | $ 3.66 |
A 5% return per year before expenses
* Expenses are equal to each Class' annualized expense ratio, multiplied by the average account value over the period, multiplied by 181/365 (to reflect the one-half year period).
Annual Report
Investment Changes (Unaudited)
Top Ten Stocks as of July 31, 2010 |
| % of fund's
net assets | % of fund's net assets
6 months ago |
Apple, Inc. | 2.2 | 0.1 |
Wells Fargo & Co. | 1.9 | 2.5 |
JPMorgan Chase & Co. | 1.8 | 1.8 |
General Electric Co. | 1.6 | 0.0 |
Cisco Systems, Inc. | 1.3 | 1.4 |
Bank of America Corp. | 1.2 | 1.6 |
Hewlett-Packard Co. | 1.1 | 1.2 |
Merck & Co., Inc. | 1.1 | 1.2 |
Lam Research Corp. | 1.0 | 0.9 |
Oracle Corp. | 0.9 | 0.4 |
| 14.1 | |
Top Five Market Sectors as of July 31, 2010 |
| % of fund's
net assets | % of fund's net assets
6 months ago |
Financials | 17.5 | 18.3 |
Information Technology | 17.4 | 17.0 |
Industrials | 13.9 | 10.2 |
Energy | 11.2 | 11.4 |
Consumer Discretionary | 10.4 | 9.9 |
Asset Allocation (% of fund's net assets) |
As of July 31, 2010* | As of January 31, 2010** |
| Stocks and
Investment
Companies 97.7% | | | Stocks and
Investment
Companies 97.6% | |
 | Bonds 0.3% | | | Bonds 0.3% | |
 | Convertible
Securities 1.3% | | | Convertible
Securities 1.6% | |
| Short-Term
Investments and
Net Other Assets 0.7% | | | Short-Term
Investments and
Net Other Assets 0.5% | |
* Foreign investments | 16.6% | | ** Foreign investments | 15.6% | |

Annual Report
Investments July 31, 2010
Showing Percentage of Net Assets
Common Stocks - 97.4% |
| Shares | | Value (000s) |
CONSUMER DISCRETIONARY - 10.4% |
Auto Components - 0.3% |
Stoneridge, Inc. (a) | 950,982 | | $ 10,185 |
Tenneco, Inc. (a) | 365,528 | | 10,089 |
The Goodyear Tire & Rubber Co. (a) | 203,014 | | 2,166 |
| | 22,440 |
Automobiles - 0.7% |
Bayerische Motoren Werke AG (BMW) | 154,323 | | 8,309 |
Fiat SpA | 166,500 | | 2,133 |
Harley-Davidson, Inc. | 176,487 | | 4,806 |
Mazda Motor Corp. | 2,500,000 | | 6,046 |
Thor Industries, Inc. | 562,046 | | 15,647 |
Winnebago Industries, Inc. (a)(e)(f) | 1,556,036 | | 16,261 |
| | 53,202 |
Diversified Consumer Services - 0.3% |
Service Corp. International | 1,072,000 | | 9,133 |
Stewart Enterprises, Inc. Class A | 2,318,532 | | 12,451 |
Universal Technical Institute, Inc. | 296,159 | | 6,033 |
| | 27,617 |
Hotels, Restaurants & Leisure - 2.3% |
Accor SA | 121,834 | | 3,947 |
Ameristar Casinos, Inc. | 256,918 | | 4,054 |
Bally Technologies, Inc. (a) | 356,387 | | 11,511 |
Brinker International, Inc. | 1,088,764 | | 17,115 |
China Lodging Group Ltd. ADR (e) | 243,900 | | 4,512 |
DineEquity, Inc. (a)(e) | 853,349 | | 31,113 |
International Game Technology | 511,712 | | 7,798 |
NH Hoteles SA (a) | 2,119,573 | | 8,592 |
O'Charleys, Inc. (a)(f) | 1,311,500 | | 9,141 |
Sol Melia SA | 767,567 | | 6,418 |
Sonic Corp. (a) | 528,081 | | 4,647 |
The Cheesecake Factory, Inc. (a) | 81,300 | | 1,906 |
WMS Industries, Inc. (a) | 634,600 | | 24,438 |
Wyndham Worldwide Corp. | 2,069,515 | | 52,835 |
| | 188,027 |
Household Durables - 0.8% |
Ethan Allen Interiors, Inc. | 155,200 | | 2,381 |
Gafisa SA sponsored ADR | 522,600 | | 7,912 |
La-Z-Boy, Inc. (a) | 150,300 | | 1,287 |
Newell Rubbermaid, Inc. | 367,400 | | 5,695 |
Pulte Group, Inc. (a) | 1,018,282 | | 8,941 |
Common Stocks - continued |
| Shares | | Value (000s) |
CONSUMER DISCRETIONARY - continued |
Household Durables - continued |
Stanley Black & Decker, Inc. | 440,501 | | $ 25,558 |
Techtronic Industries Co. Ltd. | 4,062,000 | | 3,352 |
Tempur-Pedic International, Inc. (a) | 297,100 | | 9,112 |
| | 64,238 |
Internet & Catalog Retail - 0.1% |
Expedia, Inc. | 300,490 | | 6,815 |
Media - 2.6% |
CC Media Holdings, Inc. Class A (a) | 1,200,000 | | 7,800 |
Comcast Corp.: | | | |
Class A | 51,870 | | 1,010 |
Class A (special) (non-vtg.) | 2,065,543 | | 38,130 |
Informa PLC | 1,664,921 | | 10,247 |
Interpublic Group of Companies, Inc. (a) | 527,997 | | 4,826 |
Lamar Advertising Co. Class A (a) | 336,011 | | 9,190 |
Liberty Media Corp. Starz Series A (a) | 209,479 | | 11,498 |
McGraw-Hill Companies, Inc. | 460,900 | | 14,145 |
MDC Partners, Inc. Class A (sub. vtg.) | 1,398,539 | | 17,244 |
SuperMedia, Inc. (a)(e) | 231,513 | | 4,883 |
The Walt Disney Co. | 660,115 | | 22,239 |
Time Warner Cable, Inc. | 761,826 | | 43,554 |
United Business Media Ltd. | 623,900 | | 5,387 |
Valassis Communications, Inc. (a) | 113,713 | | 3,931 |
Viacom, Inc. Class B (non-vtg.) | 193,867 | | 6,405 |
Virgin Media, Inc. | 223,077 | | 4,803 |
Wolters Kluwer NV (Certificaten Van Aandelen) | 422,400 | | 8,522 |
| | 213,814 |
Multiline Retail - 0.6% |
Target Corp. | 897,638 | | 46,067 |
Specialty Retail - 2.5% |
Advance Auto Parts, Inc. | 485,400 | | 25,983 |
AnnTaylor Stores Corp. (a) | 434,499 | | 7,621 |
Asbury Automotive Group, Inc. (a) | 432,400 | | 5,820 |
Best Buy Co., Inc. | 421,495 | | 14,609 |
Big 5 Sporting Goods Corp. | 510,000 | | 7,007 |
Carphone Warehouse Group PLC (a) | 1,419,949 | | 5,122 |
Casual Male Retail Group, Inc. (a) | 2,353,500 | | 8,143 |
Collective Brands, Inc. (a) | 73,100 | | 1,171 |
Foot Locker, Inc. | 568,559 | | 7,727 |
Hengdeli Holdings Ltd. | 25,940,000 | | 11,889 |
Home Depot, Inc. | 382,368 | | 10,901 |
Common Stocks - continued |
| Shares | | Value (000s) |
CONSUMER DISCRETIONARY - continued |
Specialty Retail - continued |
Lowe's Companies, Inc. | 1,895,854 | | $ 39,320 |
Lumber Liquidators Holdings, Inc. (a)(e) | 236,797 | | 5,877 |
MarineMax, Inc. (a) | 555,800 | | 4,224 |
OfficeMax, Inc. (a) | 919,756 | | 13,143 |
Sally Beauty Holdings, Inc. (a) | 995,281 | | 9,415 |
Staples, Inc. | 965,707 | | 19,633 |
West Marine, Inc. (a) | 125,903 | | 1,307 |
| | 198,912 |
Textiles, Apparel & Luxury Goods - 0.2% |
Bosideng International Holdings Ltd. | 1,218,000 | | 376 |
G-III Apparel Group Ltd. (a) | 173,502 | | 4,476 |
Peak Sport Products Co. Ltd. | 1,218,000 | | 853 |
Phillips-Van Heusen Corp. | 229,800 | | 11,924 |
| | 17,629 |
TOTAL CONSUMER DISCRETIONARY | | 838,761 |
CONSUMER STAPLES - 8.6% |
Beverages - 1.4% |
Anheuser-Busch InBev SA NV | 318,950 | | 16,892 |
Carlsberg AS Series B | 112,000 | | 9,932 |
Dr Pepper Snapple Group, Inc. | 342,587 | | 12,864 |
Molson Coors Brewing Co. Class B | 172,705 | | 7,773 |
The Coca-Cola Co. | 1,149,494 | | 63,349 |
| | 110,810 |
Food & Staples Retailing - 2.8% |
CVS Caremark Corp. | 1,051,897 | | 32,283 |
Drogasil SA | 113,700 | | 2,366 |
Kroger Co. | 2,694,640 | | 57,072 |
PriceSmart, Inc. | 331,383 | | 9,279 |
Susser Holdings Corp. (a) | 101,554 | | 1,220 |
Sysco Corp. | 714,121 | | 22,116 |
Wal-Mart Stores, Inc. | 1,104,963 | | 56,563 |
Walgreen Co. | 1,018,718 | | 29,084 |
Winn-Dixie Stores, Inc. (a) | 1,720,396 | | 16,877 |
| | 226,860 |
Food Products - 1.8% |
Ausnutria Dairy Hunan Co. Ltd. Class H | 12,992,000 | | 7,861 |
Bunge Ltd. | 12,200 | | 606 |
Common Stocks - continued |
| Shares | | Value (000s) |
CONSUMER STAPLES - continued |
Food Products - continued |
Calavo Growers, Inc. | 394,332 | | $ 8,328 |
Chiquita Brands International, Inc. (a) | 398,078 | | 5,844 |
Diamond Foods, Inc. | 96,700 | | 4,307 |
Kellogg Co. | 205,911 | | 10,306 |
Kerry Group PLC Class A | 80,972 | | 2,575 |
Leroy Seafood Group ASA | 29,868 | | 612 |
M. Dias Branco SA | 12,100 | | 274 |
Marine Harvest ASA | 52,008,379 | | 39,211 |
Nestle SA | 390,315 | | 19,299 |
Ralcorp Holdings, Inc. (a) | 39,090 | | 2,283 |
Seneca Foods Group Class A (a) | 20,299 | | 621 |
Smithfield Foods, Inc. (a) | 1,843,400 | | 26,268 |
Tingyi (Cayman Islands) Holding Corp. | 2,414,000 | | 6,122 |
TreeHouse Foods, Inc. (a) | 33,900 | | 1,617 |
Unilever NV (Certificaten Van Aandelen) (Bearer) unit | 450,300 | | 13,246 |
| | 149,380 |
Household Products - 1.1% |
Energizer Holdings, Inc. (a) | 217,987 | | 13,411 |
Kimberly-Clark Corp. | 170,557 | | 10,936 |
Procter & Gamble Co. | 1,084,753 | | 66,343 |
| | 90,690 |
Personal Products - 0.6% |
Avon Products, Inc. | 720,428 | | 22,427 |
BaWang International (Group) Holding Ltd. | 18,804,000 | | 11,475 |
Hengan International Group Co. Ltd. | 1,154,500 | | 9,943 |
Herbalife Ltd. | 113,300 | | 5,624 |
| | 49,469 |
Tobacco - 0.9% |
Imperial Tobacco Group PLC | 247,779 | | 7,011 |
Lorillard, Inc. | 121,525 | | 9,265 |
Philip Morris International, Inc. | 1,042,800 | | 53,225 |
| | 69,501 |
TOTAL CONSUMER STAPLES | | 696,710 |
ENERGY - 10.9% |
Energy Equipment & Services - 3.6% |
Aker Solutions ASA | 699,697 | | 9,072 |
Baker Hughes, Inc. | 972,566 | | 46,946 |
Common Stocks - continued |
| Shares | | Value (000s) |
ENERGY - continued |
Energy Equipment & Services - continued |
Global Industries Ltd. (a) | 1,068,176 | | $ 5,063 |
Halliburton Co. | 895,250 | | 26,750 |
Helix Energy Solutions Group, Inc. (a) | 1,413,863 | | 13,276 |
ION Geophysical Corp. (a) | 1,871,858 | | 8,217 |
National Oilwell Varco, Inc. | 1,261,070 | | 49,384 |
Noble Corp. | 384,508 | | 12,497 |
Schlumberger Ltd. | 707,344 | | 42,200 |
Smith International, Inc. | 311,277 | | 12,912 |
Superior Energy Services, Inc. (a) | 109,700 | | 2,500 |
Superior Well Services, Inc. (a)(e) | 296,050 | | 5,498 |
Transocean Ltd. (a) | 197,776 | | 9,139 |
Union Drilling, Inc. (a) | 584,843 | | 3,468 |
Vantage Drilling Co. (a) | 5,143,000 | | 6,840 |
Weatherford International Ltd. (a) | 2,494,761 | | 40,415 |
| | 294,177 |
Oil, Gas & Consumable Fuels - 7.3% |
Anadarko Petroleum Corp. | 463,017 | | 22,762 |
Apache Corp. | 352,229 | | 33,666 |
Arch Coal, Inc. | 308,305 | | 7,304 |
Berry Petroleum Co. Class A | 743,300 | | 22,165 |
BP PLC sponsored ADR | 700,300 | | 26,941 |
Chesapeake Energy Corp. | 1,082,597 | | 22,767 |
Chevron Corp. | 65,005 | | 4,954 |
Compton Petroleum Corp. (a) | 2,385,100 | | 1,230 |
Concho Resources, Inc. (a) | 136,931 | | 8,213 |
Concho Resources, Inc. (a)(h) | 230,820 | | 12,460 |
Denbury Resources, Inc. (a) | 1,070,040 | | 16,949 |
EOG Resources, Inc. | 284,700 | | 27,758 |
EXCO Resources, Inc. | 731,863 | | 10,619 |
Exxon Mobil Corp. | 328,592 | | 19,610 |
Heritage Oil PLC (a) | 324,900 | | 2,091 |
Holly Corp. | 342,399 | | 9,152 |
International Coal Group, Inc. (a)(e) | 2,349,935 | | 10,575 |
InterOil Corp. (a)(e) | 128,700 | | 7,722 |
Marathon Oil Corp. | 566,106 | | 18,936 |
Massey Energy Co. | 634,129 | | 19,392 |
Niko Resources Ltd. | 64,700 | | 6,979 |
Northern Oil & Gas, Inc. (a)(e) | 2,171,695 | | 31,880 |
Occidental Petroleum Corp. | 195,247 | | 15,216 |
OPTI Canada, Inc. (a) | 6,807,000 | | 10,926 |
Common Stocks - continued |
| Shares | | Value (000s) |
ENERGY - continued |
Oil, Gas & Consumable Fuels - continued |
OPTI Canada, Inc. (a)(g) | 2,661,400 | | $ 4,272 |
Pan Orient Energy Corp. (a) | 938,500 | | 5,478 |
PetroBakken Energy Ltd. Class A (e) | 573,626 | | 12,584 |
Petrohawk Energy Corp. (a) | 2,823,438 | | 44,526 |
Petroplus Holdings AG | 511,750 | | 7,930 |
Plains Exploration & Production Co. (a) | 3,028,322 | | 68,289 |
Southwestern Energy Co. (a) | 754,637 | | 27,507 |
Suncor Energy, Inc. | 423,100 | | 13,949 |
Sunoco, Inc. | 247,700 | | 8,835 |
Talisman Energy, Inc. | 586,900 | | 10,020 |
Valero Energy Corp. | 876,361 | | 14,889 |
| | 588,546 |
TOTAL ENERGY | | 882,723 |
FINANCIALS - 16.9% |
Capital Markets - 2.4% |
AllianceBernstein Holding LP | 155,300 | | 4,143 |
Bank of New York Mellon Corp. | 940,752 | | 23,585 |
Bank Sarasin & Co. Ltd. Series B (Reg.) | 200,299 | | 7,423 |
BlueBay Asset Management | 1,397,468 | | 6,159 |
Charles Schwab Corp. | 420,069 | | 6,213 |
GCA Savvian Group Corp. (a) | 3,249 | | 3,308 |
Goldman Sachs Group, Inc. | 384,886 | | 58,049 |
Janus Capital Group, Inc. | 643,400 | | 6,743 |
Morgan Stanley | 1,882,624 | | 50,812 |
Northern Trust Corp. | 154,821 | | 7,275 |
State Street Corp. | 450,238 | | 17,523 |
TD Ameritrade Holding Corp. (a) | 182,517 | | 2,873 |
| | 194,106 |
Commercial Banks - 4.9% |
Agricultural Bank of China (H Shares) | 9,336,000 | | 4,207 |
Associated Banc-Corp. | 1,373,043 | | 18,660 |
Banco Do Brasil SA | 288,000 | | 4,979 |
CapitalSource, Inc. | 5,651,145 | | 30,403 |
CIT Group, Inc. (a) | 133,988 | | 4,872 |
Huntington Bancshares, Inc. | 2,484,600 | | 15,057 |
Itau Unibanco Banco Multiplo SA ADR (g) | 253,800 | | 5,683 |
Mitsubishi UFJ Financial Group, Inc. | 4,360,200 | | 21,593 |
Mizuho Financial Group, Inc. | 4,564,700 | | 7,397 |
Common Stocks - continued |
| Shares | | Value (000s) |
FINANCIALS - continued |
Commercial Banks - continued |
PNC Financial Services Group, Inc. | 1,206,042 | | $ 71,627 |
Regions Financial Corp. | 1,141,747 | | 8,369 |
SunTrust Banks, Inc. | 422,400 | | 10,961 |
Susquehanna Bancshares, Inc., Pennsylvania | 182,800 | | 1,581 |
SVB Financial Group (a) | 422,500 | | 18,248 |
Wells Fargo & Co. | 5,705,841 | | 158,223 |
Wilmington Trust Corp., Delaware | 1,477,790 | | 14,985 |
| | 396,845 |
Consumer Finance - 0.7% |
American Express Co. | 398,004 | | 17,767 |
Capital One Financial Corp. | 285,600 | | 12,089 |
Discover Financial Services | 951,232 | | 14,525 |
ORIX Corp. | 65,660 | | 5,166 |
SLM Corp. (a) | 357,433 | | 4,289 |
| | 53,836 |
Diversified Financial Services - 4.6% |
Bank of America Corp. | 6,883,220 | | 96,640 |
BM&F BOVESPA SA | 1,479,200 | | 10,935 |
Citigroup, Inc. (a) | 16,163,680 | | 66,271 |
Deutsche Boerse AG | 128,642 | | 9,007 |
JPMorgan Chase & Co. | 3,648,624 | | 146,967 |
PICO Holdings, Inc. (a)(f) | 1,240,314 | | 38,871 |
| | 368,691 |
Insurance - 1.8% |
Aegon NV (a) | 1,379,227 | | 8,286 |
Allstate Corp. | 16,100 | | 455 |
Assured Guaranty Ltd. | 1,262,840 | | 19,827 |
Axis Capital Holdings Ltd. | 36,544 | | 1,139 |
Delphi Financial Group, Inc. Class A | 328,935 | | 8,536 |
Endurance Specialty Holdings Ltd. | 226,900 | | 8,756 |
Everest Re Group Ltd. | 145,500 | | 11,294 |
Genworth Financial, Inc. Class A (a) | 2,000,600 | | 27,168 |
Lincoln National Corp. | 685,850 | | 17,860 |
Maiden Holdings Ltd. | 692,542 | | 4,751 |
MBIA, Inc. (a)(e) | 1,777,500 | | 15,429 |
Old Republic International Corp. | 356,169 | | 4,456 |
Platinum Underwriters Holdings Ltd. | 172,000 | | 6,722 |
Protective Life Corp. | 539,000 | | 12,122 |
| | 146,801 |
Common Stocks - continued |
| Shares | | Value (000s) |
FINANCIALS - continued |
Real Estate Investment Trusts - 1.1% |
Boston Properties, Inc. | 60,991 | | $ 4,995 |
CBL & Associates Properties, Inc. | 633,200 | | 8,909 |
Education Realty Trust, Inc. | 423,700 | | 2,945 |
Franklin Street Properties Corp. | 606,400 | | 7,404 |
ProLogis Trust | 928,100 | | 10,079 |
Public Storage | 133,419 | | 13,091 |
Segro PLC | 1,035,273 | | 4,546 |
SL Green Realty Corp. | 299,600 | | 18,048 |
The Macerich Co. | 125,654 | | 5,208 |
U-Store-It Trust | 568,200 | | 4,585 |
Vornado Realty Trust | 129,638 | | 10,731 |
Westfield Group unit | 168,768 | | 1,865 |
| | 92,406 |
Real Estate Management & Development - 1.4% |
CB Richard Ellis Group, Inc. Class A (a) | 4,274,600 | | 72,668 |
Forest City Enterprises, Inc. Class A (a) | 12,196 | | 155 |
Iguatemi Empresa de Shopping Centers SA | 444,800 | | 8,843 |
Jones Lang LaSalle, Inc. | 267,100 | | 20,690 |
Kenedix, Inc. (a) | 46,567 | | 7,802 |
Unite Group PLC (a) | 873,814 | | 2,600 |
| | 112,758 |
Thrifts & Mortgage Finance - 0.0% |
Bank Mutual Corp. | 491,235 | | 2,888 |
Ocwen Financial Corp. (a) | 32,534 | | 344 |
| | 3,232 |
TOTAL FINANCIALS | | 1,368,675 |
HEALTH CARE - 9.4% |
Biotechnology - 2.8% |
Alexion Pharmaceuticals, Inc. (a) | 126,500 | | 6,877 |
Allos Therapeutics, Inc. (a) | 610,000 | | 2,940 |
Amgen, Inc. (a) | 750,259 | | 40,912 |
Amylin Pharmaceuticals, Inc. (a) | 436,570 | | 8,260 |
ARIAD Pharmaceuticals, Inc. (a) | 1,734,479 | | 5,550 |
Biogen Idec, Inc. (a) | 259,822 | | 14,519 |
Cephalon, Inc. (a) | 145,400 | | 8,251 |
China Biologic Products, Inc. (a)(e) | 512,400 | | 6,548 |
Clinical Data, Inc. (a) | 780,409 | | 10,879 |
Genzyme Corp. (a) | 308,844 | | 21,483 |
Common Stocks - continued |
| Shares | | Value (000s) |
HEALTH CARE - continued |
Biotechnology - continued |
Gilead Sciences, Inc. (a) | 142,200 | | $ 4,738 |
Human Genome Sciences, Inc. (a) | 555,400 | | 14,407 |
ImmunoGen, Inc. (a) | 295,200 | | 2,784 |
InterMune, Inc. (a) | 170,606 | | 1,665 |
Micromet, Inc. (a) | 963,800 | | 6,602 |
Neurocrine Biosciences, Inc. (a) | 832,600 | | 4,729 |
NPS Pharmaceuticals, Inc. (a) | 562,210 | | 3,890 |
OREXIGEN Therapeutics, Inc. (a)(e) | 2,006,657 | | 10,435 |
PDL BioPharma, Inc. | 1,011,700 | | 6,293 |
Protalix BioTherapeutics, Inc. (a)(e) | 846,481 | | 5,528 |
SIGA Technologies, Inc. (a)(e) | 1,307,624 | | 10,958 |
Theravance, Inc. (a) | 1,065,461 | | 15,779 |
United Therapeutics Corp. (a) | 225,400 | | 11,020 |
ZIOPHARM Oncology, Inc. (a) | 946,152 | | 3,539 |
| | 228,586 |
Health Care Equipment & Supplies - 1.7% |
AGA Medical Holdings, Inc. | 528,700 | | 7,661 |
C. R. Bard, Inc. | 270,130 | | 21,213 |
Cooper Companies, Inc. | 105,600 | | 4,104 |
Covidien PLC | 326,127 | | 12,171 |
Hill-Rom Holdings, Inc. | 300,500 | | 9,929 |
Hologic, Inc. (a) | 308,600 | | 4,364 |
Kinetic Concepts, Inc. (a) | 227,325 | | 8,072 |
Orthofix International NV (a) | 326,188 | | 9,877 |
Orthovita, Inc. (a) | 1,391,500 | | 2,574 |
St. Jude Medical, Inc. (a) | 262,849 | | 9,665 |
Stryker Corp. | 305,500 | | 14,227 |
Symmetry Medical, Inc. (a) | 767,751 | | 7,470 |
William Demant Holding AS (a) | 135,454 | | 9,927 |
Wright Medical Group, Inc. (a) | 649,608 | | 10,140 |
Zimmer Holdings, Inc. (a) | 101,500 | | 5,378 |
| | 136,772 |
Health Care Providers & Services - 2.1% |
Brookdale Senior Living, Inc. (a) | 1,149,700 | | 16,303 |
CIGNA Corp. | 1,021,800 | | 31,431 |
Emeritus Corp. (a) | 283,281 | | 4,875 |
Express Scripts, Inc. (a) | 831,500 | | 37,567 |
LHC Group, Inc. (a) | 142,200 | | 3,269 |
McKesson Corp. | 233,406 | | 14,663 |
Medco Health Solutions, Inc. (a) | 523,356 | | 25,121 |
Common Stocks - continued |
| Shares | | Value (000s) |
HEALTH CARE - continued |
Health Care Providers & Services - continued |
MEDNAX, Inc. (a) | 156,480 | | $ 7,378 |
Quest Diagnostics, Inc. | 316,647 | | 14,879 |
RehabCare Group, Inc. (a) | 205,678 | | 4,358 |
VCA Antech, Inc. (a) | 325,800 | | 6,790 |
| | 166,634 |
Health Care Technology - 0.0% |
Computer Programs & Systems, Inc. | 88,700 | | 3,989 |
SXC Health Solutions Corp. (a) | 12,200 | | 836 |
| | 4,825 |
Life Sciences Tools & Services - 0.2% |
Charles River Laboratories International, Inc. (a) | 178,678 | | 5,553 |
Life Technologies Corp. (a) | 155,100 | | 6,668 |
Lonza Group AG | 20,305 | | 1,577 |
PerkinElmer, Inc. | 219,300 | | 4,268 |
| | 18,066 |
Pharmaceuticals - 2.6% |
Abbott Laboratories | 252,300 | | 12,383 |
Ardea Biosciences, Inc. (a) | 684,100 | | 13,648 |
Biovail Corp. | 333,000 | | 7,273 |
Cadence Pharmaceuticals, Inc. (a)(e) | 1,608,595 | | 12,322 |
Merck & Co., Inc. | 2,507,404 | | 86,405 |
Novartis AG sponsored ADR | 185,047 | | 9,019 |
Novo Nordisk AS Series B | 194,299 | | 16,628 |
Pfizer, Inc. | 379,945 | | 5,699 |
Pronova BioPharma ASA (a) | 3,794,531 | | 9,309 |
Sanofi-Aventis | 349,005 | | 20,292 |
Teva Pharmaceutical Industries Ltd. sponsored ADR | 312,490 | | 15,265 |
| | 208,243 |
TOTAL HEALTH CARE | | 763,126 |
INDUSTRIALS - 13.8% |
Aerospace & Defense - 2.6% |
BE Aerospace, Inc. (a) | 227,300 | | 6,683 |
DigitalGlobe, Inc. (a) | 235,513 | | 6,420 |
Esterline Technologies Corp. (a) | 162,221 | | 8,327 |
European Aeronautic Defence and Space Co. EADS NV (a) | 258,000 | | 6,113 |
GeoEye, Inc. (a) | 543,850 | | 18,774 |
Goodrich Corp. | 262,977 | | 19,163 |
Common Stocks - continued |
| Shares | | Value (000s) |
INDUSTRIALS - continued |
Aerospace & Defense - continued |
Heico Corp. New Class A | 427,878 | | $ 12,357 |
Honeywell International, Inc. | 610,420 | | 26,163 |
Orbital Sciences Corp. (a) | 176,144 | | 2,579 |
Precision Castparts Corp. | 253,972 | | 31,033 |
Raytheon Co. | 422,398 | | 19,544 |
United Technologies Corp. | 805,639 | | 57,281 |
| | 214,437 |
Airlines - 0.4% |
AMR Corp. (a) | 491,263 | | 3,478 |
Delta Air Lines, Inc. (a) | 823,765 | | 9,786 |
Southwest Airlines Co. | 1,306,234 | | 15,740 |
UAL Corp. (a) | 150,172 | | 3,565 |
| | 32,569 |
Building Products - 0.4% |
Masco Corp. | 1,332,600 | | 13,699 |
Owens Corning (a) | 519,607 | | 16,357 |
| | 30,056 |
Commercial Services & Supplies - 1.5% |
Avery Dennison Corp. | 300,471 | | 10,772 |
Casella Waste Systems, Inc. Class A (a) | 591,609 | | 2,361 |
Corrections Corp. of America (a) | 190,865 | | 3,735 |
Interface, Inc. Class A | 2,004,878 | | 24,921 |
Knoll, Inc. | 695,566 | | 9,759 |
Pitney Bowes, Inc. | 186,820 | | 4,560 |
Quad/Graphics, Inc. (a) | 113,149 | | 4,813 |
R.R. Donnelley & Sons Co. | 972,100 | | 16,399 |
Republic Services, Inc. | 487,995 | | 15,548 |
Schawk, Inc. Class A | 108,332 | | 1,607 |
Steelcase, Inc. Class A | 297,346 | | 2,055 |
The Brink's Co. | 494,700 | | 10,834 |
The Geo Group, Inc. (a) | 649,733 | | 14,021 |
| | 121,385 |
Construction & Engineering - 0.9% |
Aveng Ltd. | 890,100 | | 4,395 |
Fluor Corp. | 526,027 | | 25,402 |
Foster Wheeler AG (a) | 487,350 | | 11,219 |
Granite Construction, Inc. | 318,097 | | 7,396 |
Great Lakes Dredge & Dock Corp. | 1,275,885 | | 7,145 |
Jacobs Engineering Group, Inc. (a) | 221,200 | | 8,089 |
Common Stocks - continued |
| Shares | | Value (000s) |
INDUSTRIALS - continued |
Construction & Engineering - continued |
KBR, Inc. | 432,600 | | $ 9,682 |
MasTec, Inc. (a) | 345,300 | | 3,667 |
| | 76,995 |
Electrical Equipment - 0.8% |
AMETEK, Inc. | 195,455 | | 8,653 |
Cooper Industries PLC Class A | 365,312 | | 16,494 |
Emerson Electric Co. | 129,972 | | 6,439 |
Prysmian SpA | 648,000 | | 10,963 |
Schneider Electric SA | 99,449 | | 11,471 |
Zumtobel AG | 450,805 | | 8,540 |
| | 62,560 |
Industrial Conglomerates - 2.5% |
General Electric Co. | 8,137,367 | | 131,174 |
Koninklijke Philips Electronics NV | 518,400 | | 16,118 |
Rheinmetall AG | 228,900 | | 13,703 |
Siemens AG sponsored ADR | 121,810 | | 11,863 |
Textron, Inc. | 1,270,674 | | 26,379 |
| | 199,237 |
Machinery - 2.4% |
Actuant Corp. Class A | 418,323 | | 8,626 |
ArvinMeritor, Inc. (a) | 709,600 | | 11,645 |
Briggs & Stratton Corp. | 418,432 | | 7,938 |
Bucyrus International, Inc. Class A | 168,818 | | 10,504 |
Caterpillar, Inc. | 89,346 | | 6,232 |
CLARCOR, Inc. | 12,200 | | 458 |
Commercial Vehicle Group, Inc. (a) | 557,400 | | 6,271 |
Cummins, Inc. | 305,394 | | 24,312 |
Hardinge, Inc. | 300,507 | | 2,542 |
Ingersoll-Rand Co. Ltd. | 559,024 | | 20,941 |
Navistar International Corp. (a) | 858,500 | | 44,393 |
NSK Ltd. | 1,098,000 | | 7,813 |
Pall Corp. | 219,284 | | 8,385 |
Timken Co. | 246,304 | | 8,281 |
Trinity Industries, Inc. | 324,594 | | 6,612 |
Vallourec SA | 143,566 | | 13,979 |
WABCO Holdings, Inc. (a) | 44,700 | | 1,729 |
| | 190,661 |
Professional Services - 0.4% |
Equifax, Inc. | 57,628 | | 1,806 |
Common Stocks - continued |
| Shares | | Value (000s) |
INDUSTRIALS - continued |
Professional Services - continued |
Kforce, Inc. (a) | 876,700 | | $ 11,844 |
Robert Half International, Inc. | 525,300 | | 13,227 |
Towers Watson & Co. | 73,102 | | 3,254 |
| | 30,131 |
Road & Rail - 1.7% |
Arkansas Best Corp. | 307,497 | | 6,940 |
Con-way, Inc. | 334,510 | | 11,270 |
CSX Corp. | 707,700 | | 37,310 |
Norfolk Southern Corp. | 209,366 | | 11,781 |
Saia, Inc. (a) | 767,075 | | 11,583 |
Union Pacific Corp. | 732,700 | | 54,711 |
Universal Truckload Services, Inc. (a) | 536,978 | | 8,157 |
| | 141,752 |
Trading Companies & Distributors - 0.2% |
Finning International, Inc. | 264,000 | | 5,080 |
Kaman Corp. | 356,900 | | 8,152 |
| | 13,232 |
TOTAL INDUSTRIALS | | 1,113,015 |
INFORMATION TECHNOLOGY - 17.1% |
Communications Equipment - 2.3% |
Calix Networks, Inc. (a) | 247,695 | | 2,645 |
Cisco Systems, Inc. (a) | 4,541,900 | | 104,782 |
Comverse Technology, Inc. (a) | 1,628,700 | | 12,215 |
Infinera Corp. (a) | 972,768 | | 8,804 |
Juniper Networks, Inc. (a) | 1,434,000 | | 39,837 |
QUALCOMM, Inc. | 471,400 | | 17,951 |
| | 186,234 |
Computers & Peripherals - 3.4% |
Apple, Inc. (a) | 684,158 | | 175,995 |
Hewlett-Packard Co. | 1,890,800 | | 87,052 |
HTC Corp. | 59,850 | | 1,100 |
NCR Corp. (a) | 645,230 | | 8,840 |
| | 272,987 |
Electronic Equipment & Components - 1.6% |
Agilent Technologies, Inc. (a) | 1,367,122 | | 38,184 |
Anixter International, Inc. (a) | 85,215 | | 4,118 |
Avnet, Inc. (a) | 962,385 | | 24,204 |
Common Stocks - continued |
| Shares | | Value (000s) |
INFORMATION TECHNOLOGY - continued |
Electronic Equipment & Components - continued |
Corning, Inc. | 1,500,900 | | $ 27,196 |
Keyence Corp. | 55,000 | | 12,664 |
Molex, Inc. (e) | 442,752 | | 8,727 |
Tyco Electronics Ltd. | 582,256 | | 15,721 |
| | 130,814 |
Internet Software & Services - 1.2% |
Akamai Technologies, Inc. (a) | 108,701 | | 4,170 |
DealerTrack Holdings, Inc. (a) | 230,173 | | 3,593 |
eBay, Inc. (a) | 1,051,142 | | 21,979 |
Google, Inc. Class A (a) | 70,825 | | 34,340 |
Monster Worldwide, Inc. (a) | 585,500 | | 8,033 |
NetEase.com, Inc. sponsored ADR (a) | 393,702 | | 15,079 |
Open Text Corp. (a) | 208,500 | | 8,253 |
| | 95,447 |
IT Services - 1.2% |
Acxiom Corp. (a) | 569,628 | | 8,738 |
Alliance Data Systems Corp. (a) | 226,892 | | 13,042 |
Atos Origin SA (a) | 205,101 | | 8,808 |
China Information Security Technology, Inc. (a)(e) | 385,900 | | 2,258 |
Echo Global Logistics, Inc. (e) | 4,038 | | 48 |
Fidelity National Information Services, Inc. | 467,447 | | 13,402 |
Fiserv, Inc. (a) | 123,968 | | 6,211 |
MasterCard, Inc. Class A | 80,416 | | 16,891 |
Visa, Inc. Class A | 363,700 | | 26,677 |
| | 96,075 |
Office Electronics - 0.2% |
Xerox Corp. | 2,095,477 | | 20,410 |
Semiconductors & Semiconductor Equipment - 4.7% |
Advanced Micro Devices, Inc. (a) | 995,153 | | 7,454 |
Altera Corp. | 32,500 | | 901 |
Analog Devices, Inc. | 676,100 | | 20,087 |
ASML Holding NV | 637,100 | | 20,508 |
Atmel Corp. (a) | 7,596,658 | | 39,731 |
Avago Technologies Ltd. | 1,054,200 | | 22,939 |
Cymer, Inc. (a) | 195,100 | | 6,493 |
Fairchild Semiconductor International, Inc. (a) | 2,144,417 | | 19,471 |
First Solar, Inc. (a) | 73,200 | | 9,183 |
Himax Technologies, Inc. sponsored ADR | 2,332,136 | | 7,136 |
Intersil Corp. Class A | 456,441 | | 5,185 |
Kulicke & Soffa Industries, Inc. (a) | 1,580,200 | | 10,619 |
Common Stocks - continued |
| Shares | | Value (000s) |
INFORMATION TECHNOLOGY - continued |
Semiconductors & Semiconductor Equipment - continued |
Lam Research Corp. (a) | 2,000,093 | | $ 84,384 |
Linear Technology Corp. | 56,844 | | 1,812 |
LTX-Credence Corp. (a)(f) | 8,571,343 | | 24,000 |
Mattson Technology, Inc. (a)(e) | 1,194,133 | | 3,499 |
Maxim Integrated Products, Inc. | 789,957 | | 13,848 |
Microchip Technology, Inc. (e) | 162,479 | | 4,947 |
Micron Technology, Inc. (a) | 4,055,852 | | 29,527 |
National Semiconductor Corp. | 675,877 | | 9,327 |
NVIDIA Corp. (a) | 654,496 | | 6,015 |
ON Semiconductor Corp. (a) | 3,074,454 | | 20,753 |
Standard Microsystems Corp. (a) | 398,292 | | 8,770 |
Teradyne, Inc. (a) | 646,400 | | 6,955 |
| | 383,544 |
Software - 2.5% |
BMC Software, Inc. (a) | 537,090 | | 19,110 |
CA, Inc. | 349,300 | | 6,832 |
Citrix Systems, Inc. (a) | 339,190 | | 18,662 |
ICSA (India) Ltd. | 885,139 | | 2,528 |
Informatica Corp. (a) | 580,650 | | 17,495 |
MacDonald Dettwiler & Associates Ltd. (a) | 73,100 | | 3,413 |
Microsoft Corp. | 1,950,250 | | 50,336 |
Oracle Corp. | 3,119,096 | | 73,735 |
Radiant Systems, Inc. (a) | 361,488 | | 5,137 |
Sage Group PLC | 406,100 | | 1,522 |
Ultimate Software Group, Inc. (a) | 60,882 | | 1,964 |
| | 200,734 |
TOTAL INFORMATION TECHNOLOGY | | 1,386,245 |
MATERIALS - 6.5% |
Chemicals - 2.9% |
Air Products & Chemicals, Inc. | 182,753 | | 13,264 |
Arkema | 56,900 | | 2,481 |
Arkema sponsored ADR | 160,800 | | 7,019 |
Celanese Corp. Class A | 736,659 | | 20,693 |
CF Industries Holdings, Inc. | 65,300 | | 5,302 |
Clariant AG (Reg.) (a) | 1,068,150 | | 14,152 |
Dow Chemical Co. | 1,218,336 | | 33,297 |
Huabao International Holdings Ltd. | 8,132,000 | | 10,490 |
Israel Chemicals Ltd. | 734,300 | | 9,137 |
Common Stocks - continued |
| Shares | | Value (000s) |
MATERIALS - continued |
Chemicals - continued |
Monsanto Co. | 266,063 | | $ 15,389 |
Solutia, Inc. (a) | 1,299,300 | | 18,333 |
Spartech Corp. (a) | 1,508,151 | | 15,775 |
STR Holdings, Inc. (e) | 383,050 | | 8,580 |
The Mosaic Co. | 264,200 | | 12,589 |
W.R. Grace & Co. (a) | 1,424,625 | | 36,570 |
Yara International ASA | 150,300 | | 5,667 |
| | 228,738 |
Construction Materials - 0.2% |
HeidelbergCement AG | 357,344 | | 17,999 |
Containers & Packaging - 0.4% |
Owens-Illinois, Inc. (a) | 644,776 | | 17,828 |
Pactiv Corp. (a) | 465,966 | | 14,175 |
| | 32,003 |
Metals & Mining - 2.9% |
Agnico-Eagle Mines Ltd. (Canada) | 155,700 | | 8,699 |
Anglo American PLC (United Kingdom) | 233,600 | | 9,249 |
Camino Minerals Corp. (a) | 60,400 | | 18 |
Commercial Metals Co. | 1,232,000 | | 17,728 |
Compass Minerals International, Inc. | 32,450 | | 2,294 |
Eldorado Gold Corp. | 1,813,578 | | 29,463 |
Freeport-McMoRan Copper & Gold, Inc. | 275,487 | | 19,708 |
Grande Cache Coal Corp. (a) | 657,900 | | 3,578 |
Gulf Resources, Inc. (a)(e) | 582,180 | | 5,042 |
Gulf Resources, Inc. (h) | 1,894,460 | | 16,406 |
Ivanhoe Mines Ltd. (a) | 1,825,700 | | 32,218 |
Lihir Gold Ltd. | 2,108,474 | | 7,837 |
Mitsubishi Materials Corp. (a) | 1,689,000 | | 4,495 |
Newcrest Mining Ltd. | 667,728 | | 19,763 |
Orko Silver Corp. (a) | 93,300 | | 125 |
Pan American Silver Corp. | 111,000 | | 2,549 |
Randgold Resources Ltd. sponsored ADR | 359,523 | | 32,314 |
Red Back Mining, Inc. (a) | 338,800 | | 8,576 |
Seabridge Gold, Inc. (a) | 97,900 | | 2,508 |
Silver Standard Resources, Inc. (a) | 174,700 | | 2,858 |
Silver Wheaton Corp. (a) | 364,800 | | 6,881 |
Steel Dynamics, Inc. | 197,600 | | 2,830 |
| | 235,139 |
Common Stocks - continued |
| Shares | | Value (000s) |
MATERIALS - continued |
Paper & Forest Products - 0.1% |
Weyerhaeuser Co. | 569,800 | | $ 9,242 |
TOTAL MATERIALS | | 523,121 |
TELECOMMUNICATION SERVICES - 1.3% |
Diversified Telecommunication Services - 0.6% |
Frontier Communications Corp. | 588,879 | | 4,499 |
Iliad Group SA | 129,004 | | 11,358 |
Qwest Communications International, Inc. | 4,666,700 | | 26,414 |
Telefonica SA sponsored ADR | 105,320 | | 7,208 |
| | 49,479 |
Wireless Telecommunication Services - 0.7% |
SOFTBANK CORP. | 154,300 | | 4,615 |
Sprint Nextel Corp. (a) | 8,806,115 | | 40,244 |
Syniverse Holdings, Inc. (a) | 133,549 | | 2,982 |
Vivo Participacoes SA sponsored ADR | 201,200 | | 5,380 |
| | 53,221 |
TOTAL TELECOMMUNICATION SERVICES | | 102,700 |
UTILITIES - 2.5% |
Electric Utilities - 0.8% |
American Electric Power Co., Inc. | 105,580 | | 3,799 |
Centrais Eletricas Brasileiras SA (Electrobras) (PN-B) sponsored ADR (e) | 502,200 | | 7,859 |
Entergy Corp. | 215,712 | | 16,720 |
FirstEnergy Corp. | 311,953 | | 11,761 |
NextEra Energy, Inc. | 52,719 | | 2,757 |
PPL Corp. | 710,000 | | 19,376 |
| | 62,272 |
Gas Utilities - 0.1% |
China Gas Holdings Ltd. | 122,000 | | 62 |
Xinao Gas Holdings Ltd. | 3,280,000 | | 7,761 |
| | 7,823 |
Independent Power Producers & Energy Traders - 0.8% |
AES Corp. (a) | 6,036,156 | | 62,233 |
Multi-Utilities - 0.8% |
Alliant Energy Corp. | 325,655 | | 11,255 |
CMS Energy Corp. | 1,817,884 | | 28,941 |
PG&E Corp. | 319,757 | | 14,197 |
Common Stocks - continued |
| Shares | | Value (000s) |
UTILITIES - continued |
Multi-Utilities - continued |
Public Service Enterprise Group, Inc. | 178,741 | | $ 5,881 |
Sempra Energy | 170,586 | | 8,487 |
| | 68,761 |
TOTAL UTILITIES | | 201,089 |
TOTAL COMMON STOCKS (Cost $7,628,804) | 7,876,165 |
Convertible Preferred Stocks - 0.6% |
| | | |
ENERGY - 0.2% |
Oil, Gas & Consumable Fuels - 0.2% |
SandRidge Energy, Inc. 8.50% | 80,500 | | 7,718 |
Whiting Petroleum Corp. 6.25% | 47,500 | | 10,165 |
| | 17,883 |
FINANCIALS - 0.3% |
Diversified Financial Services - 0.3% |
Citigroup, Inc. 7.50% | 157,200 | | 19,131 |
UTILITIES - 0.1% |
Electric Utilities - 0.1% |
PPL Corp. 9.50% (a) | 187,100 | | 10,363 |
TOTAL CONVERTIBLE PREFERRED STOCKS (Cost $41,419) | 47,377 |
Investment Companies - 0.3% |
| | | |
Ares Capital Corp.
(Cost $24,047) | 1,902,715 | | 26,657 |
Corporate Bonds - 1.0% |
| Principal Amount (000s) | | |
Convertible Bonds - 0.7% |
FINANCIALS - 0.3% |
Real Estate Management & Development - 0.1% |
Forest City Enterprises, Inc. 5% 10/15/16 (g) | | $ 6,170 | | 7,122 |
Corporate Bonds - continued |
| Principal Amount (000s) | | Value (000s) |
Convertible Bonds - continued |
FINANCIALS - continued |
Thrifts & Mortgage Finance - 0.2% |
MGIC Investment Corp. 0% 4/1/63 (a)(d)(g) | | $ 18,163 | | $ 18,345 |
TOTAL FINANCIALS | | 25,467 |
HEALTH CARE - 0.2% |
Biotechnology - 0.1% |
Incyte Corp. 4.75% 10/1/15 (g) | | 5,630 | | 9,555 |
Pharmaceuticals - 0.1% |
Endo Pharmaceuticals Holdings, Inc. 1.75% 4/15/15 (g) | | 8,010 | | 8,125 |
TOTAL HEALTH CARE | | 17,680 |
INDUSTRIALS - 0.1% |
Trading Companies & Distributors - 0.1% |
United Rentals, Inc. 4% 11/15/15 | | 1,820 | | 2,510 |
INFORMATION TECHNOLOGY - 0.1% |
Semiconductors & Semiconductor Equipment - 0.1% |
Amkor Technology, Inc. 6% 4/15/14 | | 4,010 | | 8,253 |
TOTAL CONVERTIBLE BONDS | | 53,910 |
Nonconvertible Bonds - 0.3% |
ENERGY - 0.1% |
Oil, Gas & Consumable Fuels - 0.1% |
OPTI Canada, Inc.: | | | | |
7.875% 12/15/14 | | 5,385 | | 4,658 |
8.25% 12/15/14 | | 5,330 | | 4,624 |
| | 9,282 |
INFORMATION TECHNOLOGY - 0.2% |
Semiconductors & Semiconductor Equipment - 0.2% |
Freescale Semiconductor, Inc. 10.125% 12/15/16 | | 19,510 | | 17,559 |
TOTAL NONCONVERTIBLE BONDS | | 26,841 |
TOTAL CORPORATE BONDS (Cost $58,434) | 80,751 |
Money Market Funds - 1.2% |
| Shares | | Value (000s) |
Fidelity Cash Central Fund, 0.24% (b) | 23,618,305 | | $ 23,618 |
Fidelity Securities Lending Cash Central Fund, 0.27% (b)(c) | 73,349,762 | | 73,350 |
TOTAL MONEY MARKET FUNDS (Cost $96,968) | 96,968 |
TOTAL INVESTMENT PORTFOLIO - 100.5% (Cost $7,849,672) | | 8,127,918 |
NET OTHER ASSETS (LIABILITIES) - (0.5)% | | (42,506) |
NET ASSETS - 100% | $ 8,085,412 |
Legend |
(a) Non-income producing |
(b) Affiliated fund that is available only to investment companies and other accounts managed by Fidelity Investments. The rate quoted is the annualized seven-day yield of the fund at period end. A complete unaudited listing of the fund's holdings as of its most recent quarter end is available upon request. |
(c) Investment made with cash collateral received from securities on loan. |
(d) Security initially issued in zero coupon form which converts to coupon form at a specified rate and date. The rate shown is the rate at period end. |
(e) Security or a portion of the security is on loan at period end. |
(f) Affiliated company |
(g) Security exempt from registration under Rule 144A of the Securities Act of 1933. These securities may be resold in transactions exempt from registration, normally to qualified institutional buyers. At the end of the period, the value of these securities amounted to $53,102,000 or 0.7% of net assets. |
(h) Restricted securities - Investment in securities not registered under the Securities Act of 1933 (excluding 144A issues). At the end of the period, the value of restricted securities (excluding 144A issues) amounted to $28,866,000 or 0.4% of net assets. |
Additional information on each holding is as follows: |
Security | Acquisition Date | Acquisition Cost (000s) |
Concho Resources, Inc. | 7/20/10 | $ 10,456 |
Gulf Resources, Inc. | 12/11/09 | $ 16,103 |
Affiliated Central Funds |
Information regarding fiscal year to date income earned by the Fund from investments in Fidelity Central Funds is as follows: |
Fund | Income earned
(Amounts in thousands) |
Fidelity Cash Central Fund | $ 88 |
Fidelity Securities Lending Cash Central Fund | 1,545 |
Total | $ 1,633 |
Other Affiliated Issuers |
An affiliated company is a company in which the fund has ownership of at least 5% of the voting securities. Fiscal year to date transactions with companies which are or were affiliates are as follows: |
Affiliate
(Amounts in thousands) | Value, beginning of period | Purchases | Sales Proceeds | Dividend Income | Value, end of period |
Bell Microproducts, Inc. | $ 3,211 | $ 109 | $ 14,231 | $ - | $ - |
DUSA Pharmaceuticals, Inc. | 1,459 | - | 1,841 | - | - |
Great Lakes Dredge & Dock Corp. | 17,803 | 297 | 11,920 | 127 | - |
LTX-Credence Corp. | 6,783 | 4,071 | 730 | - | 24,000 |
O'Charleys, Inc. | - | 9,851 | - | - | 9,141 |
PICO Holdings, Inc. | 3,397 | - | 11,918 | - | 38,871 |
Tween Brands, Inc. | 14,547 | - | 17,581 | - | - |
Universal Truckload Services, Inc. | 18,364 | 413 | 11,184 | - | - |
Winnebago Industries, Inc. | 3,273 | 16,718 | - | - | 16,261 |
Total | $ 68,837 | $ 31,459 | $ 69,405 | $ 127 | $ 88,273 |
Other Information |
The following is a summary of the inputs used, as of July 31, 2010, involving the Fund's assets and liabilities carried at fair value. The inputs or methodology used for valuing securities may not be an indication of the risk associated with investing in those securities. For more information on valuation inputs, and their aggregation into the levels used in the table below, please refer to the Security Valuation section in the accompanying Notes to Financial Statements. |
Valuation Inputs at Reporting Date: |
Description
(Amounts in thousands) | Total | Level 1 | Level 2 | Level 3 |
Investments in Securities: | | | | |
Equities: | | | | |
Consumer Discretionary | $ 838,761 | $ 838,761 | $ - | $ - |
Consumer Staples | 696,710 | 683,464 | 13,246 | - |
Energy | 900,606 | 880,428 | 20,178 | - |
Financials | 1,387,806 | 1,331,399 | 56,407 | - |
Health Care | 763,126 | 726,206 | 36,920 | - |
Industrials | 1,113,015 | 1,096,897 | 16,118 | - |
Information Technology | 1,386,245 | 1,386,245 | - | - |
Materials | 523,121 | 515,284 | 7,837 | - |
Telecommunication Services | 102,700 | 102,700 | - | - |
Utilities | 211,452 | 201,089 | 10,363 | - |
Investment Companies | 26,657 | 26,657 | - | - |
Corporate Bonds | 80,751 | - | 80,751 | - |
Money Market Funds | 96,968 | 96,968 | - | - |
Total Investments in Securities: | $ 8,127,918 | $ 7,886,098 | $ 241,820 | $ - |
Distribution of investments by country of issue, as a percentage of total net assets, is as follows: (Unaudited) |
United States of America | 83.4% |
Canada | 2.9% |
Switzerland | 1.7% |
Japan | 1.2% |
Others (Individually Less Than 1%) | 10.8% |
| 100.0% |
Income Tax Information |
At July 31, 2010, the Fund had a capital loss carryforward of approximately $804,929,000 of which $691,258,000 and $113,671,000 will expire on July 31, 2017 and 2018, respectively. Capital loss carryforwards are only available to offset future capital gains of the Fund to the extent provided by regulations and may be limited. |
See accompanying notes which are an integral part of the financial statements.
Annual Report
Statement of Assets and Liabilities
Amounts in thousands (except per-share amounts) | July 31, 2010 |
| | |
Assets | | |
Investment in securities, at value (including securities loaned of $71,738) - See accompanying schedule: Unaffiliated issuers (cost $7,661,481) | $ 7,942,677 | |
Fidelity Central Funds (cost $96,968) | 96,968 | |
Other affiliated issuers (cost $91,223) | 88,273 | |
Total Investments (cost $7,849,672) | | $ 8,127,918 |
Receivable for investments sold | | 32,794 |
Receivable for fund shares sold | | 42,146 |
Dividends receivable | | 16,606 |
Interest receivable | | 660 |
Distributions receivable from Fidelity Central Funds | | 86 |
Other receivables | | 781 |
Total assets | | 8,220,991 |
| | |
Liabilities | | |
Payable for investments purchased | $ 47,783 | |
Payable for fund shares redeemed | 6,999 | |
Accrued management fee | 4,243 | |
Other affiliated payables | 1,864 | |
Other payables and accrued expenses | 1,340 | |
Collateral on securities loaned, at value | 73,350 | |
Total liabilities | | 135,579 |
| | |
Net Assets | | $ 8,085,412 |
Net Assets consist of: | | |
Paid in capital | | $ 8,665,907 |
Undistributed net investment income | | 31,691 |
Accumulated undistributed net realized gain (loss) on investments and foreign currency transactions | | (889,457) |
Net unrealized appreciation (depreciation) on investments and assets and liabilities in foreign currencies | | 277,271 |
Net Assets | | $ 8,085,412 |
| | |
Dividend Growth:
Net Asset Value, offering price and redemption price per share ($7,729,949 ÷ 324,293 shares) | | $ 23.84 |
| | |
Class K:
Net Asset Value, offering price and redemption price per share ($355,463 ÷ 14,898 shares) | | $ 23.86 |
See accompanying notes which are an integral part of the financial statements.
Annual Report
Statement of Operations
Amounts in thousands | Year ended July 31, 2010 |
| | |
Investment Income | | |
Dividends (including $127 earned from other affiliated issuers) | | $ 96,285 |
Special dividends | | 12,624 |
Interest | | 6,185 |
Income from Fidelity Central Funds | | 1,633 |
Total income | | 116,727 |
| | |
Expenses | | |
Management fee
Basic fee | $ 44,284 | |
Performance adjustment | 6,215 | |
Transfer agent fees | 20,117 | |
Accounting and security lending fees | 1,308 | |
Custodian fees and expenses | 340 | |
Independent trustees' compensation | 48 | |
Registration fees | 199 | |
Audit | 79 | |
Legal | 47 | |
Interest | 1 | |
Miscellaneous | 125 | |
Total expenses before reductions | 72,763 | |
Expense reductions | (726) | 72,037 |
Net investment income (loss) | | 44,690 |
Realized and Unrealized Gain (Loss) Net realized gain (loss) on: | | |
Investment securities: | | |
Unaffiliated issuers | 920,983 | |
Other affiliated issuers | 2,194 | |
Foreign currency transactions | (650) | |
Capital gain distributions from Fidelity Central Funds | 5 | |
Total net realized gain (loss) | | 922,532 |
Change in net unrealized appreciation (depreciation) on: Investment securities | 264,045 | |
Assets and liabilities in foreign currencies | (7) | |
Total change in net unrealized appreciation (depreciation) | | 264,038 |
Net gain (loss) | | 1,186,570 |
Net increase (decrease) in net assets resulting from operations | | $ 1,231,260 |
See accompanying notes which are an integral part of the financial statements.
Annual Report
Financial Statements - continued
Statement of Changes in Net Assets
Amounts in thousands | Year ended
July 31,
2010 | Year ended
July 31,
2009 |
Increase (Decrease) in Net Assets | | |
Operations | | |
Net investment income (loss) | $ 44,690 | $ 82,873 |
Net realized gain (loss) | 922,532 | (1,751,666) |
Change in net unrealized appreciation (depreciation) | 264,038 | 144,851 |
Net increase (decrease) in net assets resulting
from operations | 1,231,260 | (1,523,942) |
Distributions to shareholders from net investment income | (39,369) | (132,865) |
Distributions to shareholders from net realized gain | (16,428) | (361,284) |
Total distributions | (55,797) | (494,149) |
Share transactions - net increase (decrease) | 104,895 | (678,997) |
Total increase (decrease) in net assets | 1,280,358 | (2,697,088) |
| | |
Net Assets | | |
Beginning of period | 6,805,054 | 9,502,142 |
End of period (including undistributed net investment income of $31,691 and undistributed net investment income of $23,975, respectively) | $ 8,085,412 | $ 6,805,054 |
See accompanying notes which are an integral part of the financial statements.
Annual Report
Financial Highlights - Dividend Growth
Years ended July 31, | 2010 | 2009 | 2008 | 2007 | 2006 |
Selected Per-Share Data | | | | | |
Net asset value, beginning of period | $ 20.25 | $ 25.40 | $ 32.73 | $ 29.50 | $ 28.85 |
Income from Investment Operations | | | | | |
Net investment income (loss)B | .13E | .24 | .43 | .52F | .35 |
Net realized and unrealized gain (loss) | 3.63 | (4.01) | (5.08) | 3.98 | .99 |
Total from investment operations | 3.76 | (3.77) | (4.65) | 4.50 | 1.34 |
Distributions from net investment income | (.12) | (.37) | (.45) | (.45) | (.31) |
Distributions from net realized gain | (.05) | (1.01) | (2.23) | (.82) | (.38) |
Total distributions | (.17) | (1.38)H | (2.68) | (1.27) | (.69) |
Net asset value, end of period | $ 23.84 | $ 20.25 | $ 25.40 | $ 32.73 | $ 29.50 |
Total ReturnA | 18.59% | (15.33)% | (15.45)% | 15.62% | 4.73% |
Ratios to Average Net AssetsC,G | | | | | |
Expenses before reductions | .93% | .62% | .64% | .61% | .60% |
Expenses net of fee waivers, if any | .93% | .62% | .64% | .61% | .60% |
Expenses net of all reductions | .92% | .62% | .63% | .60% | .59% |
Net investment income (loss) | .56%E | 1.34% | 1.47% | 1.62%F | 1.21% |
Supplemental Data | | | | | |
Net assets, end of period (in millions) | $ 7,730 | $ 6,603 | $ 9,502 | $ 16,265 | $ 15,523 |
Portfolio turnover rateD | 85% | 177% | 52% | 36% | 30% |
A Total returns would have been lower had certain expenses not been reduced during the periods shown.
B Calculated based on average shares outstanding during the period.
C Fees and expenses of the underlying Fidelity Central Funds are not included in the Fund's expense ratio. The Fund indirectly bears its proportionate share of the expenses of any underlying Fidelity Central Funds.
D Amount does not include the portfolio activity of any underlying Fidelity Central Funds.
E Investment income per share reflects a special dividend which amounted to $.04 per share. Excluding the special dividend, the ratio of net investment income (loss) to average net assets would have been .40%.
F Investment income per share reflects a special dividend which amounted to $.07 per share. Excluding the special dividend, the ratio of net investment income (loss) to average net assets would have been 1.40%.
G Expense ratios reflect operating expenses of the class. Expenses before reductions do not reflect amounts reimbursed by the investment adviser or reductions from brokerage service arrangements or reductions from other expense offset arrangements and do not represent the amount paid by the class during periods when reimbursements or reductions occur. Expenses net of fee waivers reflect expenses after reimbursement by the investment adviser but prior to reductions from brokerage service arrangements or other expense offset arrangements. Expenses net of all reductions represent the net expenses paid by the class.
H Total distributions of $1.38 per share is comprised of distributions from net investment income of $.374 and distributions from net realized gain of $1.005 per share.
See accompanying notes which are an integral part of the financial statements.
Annual Report
Financial Highlights - Class K
Years ended July 31, | 2010 | 2009 | 2008H |
Selected Per-Share Data | | | |
Net asset value, beginning of period | $ 20.26 | $ 25.41 | $ 27.72 |
Income from Investment Operations | | | |
Net investment income (loss)D | .18G | .26 | .10 |
Net realized and unrealized gain (loss) | 3.63 | (4.00) | (2.41) |
Total from investment operations | 3.81 | (3.74) | (2.31) |
Distributions from net investment income | (.16) | (.41) | - |
Distributions from net realized gain | (.05) | (1.01) | - |
Total distributions | (.21) | (1.41)J | - |
Net asset value, end of period | $ 23.86 | $ 20.26 | $ 25.41 |
Total ReturnB,C | 18.86% | (15.16)% | (8.33)% |
Ratios to Average Net AssetsE,I | | | |
Expenses before reductions | .72% | .40% | .47%A |
Expenses net of fee waivers, if any | .72% | .40% | .47%A |
Expenses net of all reductions | .71% | .39% | .47%A |
Net investment income (loss) | .76%G | 1.57% | 1.66%A |
Supplemental Data | | | |
Net assets, end of period (000 omitted) | $ 355,463 | $ 201,625 | $ 92 |
Portfolio turnover rateF | 85% | 177% | 52% |
A Annualized
B Total returns for periods of less than one year are not annualized.
C Total returns would have been lower had certain expenses not been reduced during the periods shown.
D Calculated based on average shares outstanding during the period.
E Fees and expenses of the underlying Fidelity Central Funds are not included in the Fund's expense ratio. The Fund indirectly bears its proportionate share of the expenses of any underlying Fidelity Central Funds.
F Amount does not include the portfolio activity of any underlying Fidelity Central Funds.
G Investment income per share reflects a special dividend which amounted to $.04 per share. Excluding the special dividend, the ratio of net investment income (loss) to average net assets would have been .60%.
H For the period May 9, 2008 (commencement of sale of shares) to July 31, 2008.
I Expense ratios reflect operating expenses of the class. Expenses before reductions do not reflect amounts reimbursed by the investment adviser or reductions from brokerage service arrangements or reductions from other expense offset arrangements and do not represent the amount paid by the class during periods when reimbursements or reductions occur. Expense ratios before reductions for start-up periods may not be representative of longer-term operating periods. Expenses net of fee waivers reflect expenses after reimbursement by the investment adviser but prior to reductions from brokerage service arrangements or other expense offset arrangements. Expenses net of all reductions represent the net expenses paid by the class.
J Total distributions of $1.41 per share is comprised of distributions from net investment income of $.407 and distributions from net realized gain of $1.005 per share.
See accompanying notes which are an integral part of the financial statements.
Annual Report
Notes to Financial Statements
For the period ended July 31, 2010
(Amounts in thousands except ratios)
1. Organization.
Fidelity Dividend Growth Fund (the Fund) is a fund of Fidelity Securities Fund (the Trust) and is authorized to issue an unlimited number of shares. The Trust is registered under the Investment Company Act of 1940, as amended (the 1940 Act), as an open-end management investment company organized as a Massachusetts business trust. The Fund offers Dividend Growth and Class K shares, each of which has equal rights as to assets and voting privileges. Each class has exclusive voting rights with respect to matters that affect that class. After the commencement of Class K, the Fund began offering conversion privileges between Dividend Growth and Class K to eligible shareholders of Dividend Growth. Investment income, realized and unrealized capital gains and losses, the common expenses of the Fund, and certain fund-level expense reductions, if any, are allocated on a pro-rata basis to each class based on the relative net assets of each class to the total net assets of the Fund. Each class differs with respect to transfer agent fees incurred. Certain expense reductions also differ by class.
2. Investments in Fidelity Central Funds.
The Fund may invest in Fidelity Central Funds, which are open-end investment companies available only to other investment companies and accounts managed by Fidelity Management & Research Company (FMR) and its affiliates. The Fund's Schedule of Investments lists each of the Fidelity Central Funds held as of period end, if any, as an investment of the Fund, but does not include the underlying holdings of each Fidelity Central Fund. As an Investing Fund, the Fund indirectly bears its proportionate share of the expenses of the underlying Fidelity Central Funds.
The Money Market Central Funds seek preservation of capital and current income and are managed by Fidelity Investments Money Management, Inc. (FIMM), an affiliate of FMR.
A complete unaudited list of holdings for each Fidelity Central Fund is available upon request or at the Securities and Exchange Commission (the SEC) web site at www.sec.gov. In addition, the financial statements of the Fidelity Central Funds, which are not covered by the Fund's Report of Independent Registered Public Accounting Firm, are available on the SEC web site or upon request.
3. Significant Accounting Policies.
The financial statements have been prepared in conformity with accounting principles generally accepted in the United States of America (GAAP), which require management to make certain estimates and assumptions at the date of the financial statements. Actual results could differ from those estimates. The following summarizes the significant accounting policies of the Fund:
Annual Report
Notes to Financial Statements - continued
(Amounts in thousands except ratios)
3. Significant Accounting Policies - continued
Security Valuation. Investments are valued as of 4:00 p.m. Eastern time on the last calendar day of the period. The Fund uses independent pricing services approved by the Board of Trustees to value its investments. When current market prices or quotations are not readily available or reliable, valuations may be determined in good faith in accordance with procedures adopted by the Board of Trustees. Factors used in determining value may include market or security specific events, changes in interest rates and credit quality. The frequency with which these procedures are used cannot be predicted and they may be utilized to a significant extent. The value used for net asset value (NAV) calculation under these procedures may differ from published prices for the same securities.
The Fund categorizes the inputs to valuation techniques used to value its investments into a disclosure hierarchy consisting of three levels as shown below.
Level 1 - quoted prices in active markets for identical investments
Level 2 - other significant observable inputs (including quoted prices for similar investments, interest rates, prepayment speeds, etc.)
Level 3 - unobservable inputs (including the fund's own assumptions based on the best information available)
Changes in valuation techniques may result in transfers in or out of an assigned level within the disclosure hierarchy. The aggregate value of investments by input level, as of July 31, 2010 is included at the end of the Fund's Schedule of Investments. Valuation techniques used to value the Fund's investments by major category are as follows.
Equity securities, including restricted securities, for which market quotations are readily available, are valued at the last reported sale price or official closing price as reported by an independent pricing service on the primary market or exchange on which they are traded and are categorized as Level 1 in the hierarchy. In the event there were no sales during the day or closing prices are not available, securities are valued at the last quoted bid price or may be valued using the last available price and are generally categorized as Level 2 in the hierarchy. For foreign equity securities, when significant market or security specific events arise, comparisons to the valuation of American Depositary Receipts (ADRs), futures contracts, Exchange-traded funds (ETFs)and certain indexes as well as quoted prices for similar securities are used and are categorized as Level 2 in the hierarchy in these circumstances. Utilizing these techniques may result in transfers between Level 1 and Level 2. For restricted equity securities and private placements where observable inputs are limited, assumptions about market activity and risk are used and are categorized as Level 3 in the hierarchy.
Annual Report
3. Significant Accounting Policies - continued
Security Valuation - continued
Debt securities, including restricted securities, are valued based on evaluated prices received from independent pricing services or from dealers who make markets in such securities. For corporate bonds, pricing services utilize matrix pricing which considers yield or price of bonds of comparable quality, coupon, maturity and type as well as dealer supplied prices and are generally categorized as Level 2 in the hierarchy.
Investments in open-end mutual funds, including the Fidelity Central Funds, are valued at their closing net asset value each business day and are categorized as Level 1 in the hierarchy. Short-term securities with remaining maturities of sixty days or less for which quotations are not readily available are valued at amortized cost, which approximates fair value and are categorized as Level 2 in the hierarchy.
When independent prices are unavailable or unreliable, debt securities may be valued utilizing pricing matrices which consider similar factors that would be used by independent pricing services. These are generally categorized as Level 2 in the hierarchy but may be Level 3 depending on the circumstances.
Foreign Currency. The Fund uses foreign currency contracts to facilitate transactions in foreign-denominated securities. Gains and losses from these transactions may arise from changes in the value of the foreign currency or if the counterparties do not perform under the contracts' terms.
Foreign-denominated assets, including investment securities, and liabilities are translated into U.S. dollars at the exchange rate at period end. Purchases and sales of investment securities, income and dividends received and expenses denominated in foreign currencies are translated into U.S. dollars at the exchange rate in effect on the transaction date.
The effects of exchange rate fluctuations on investments are included with the net realized and unrealized gain (loss) on investment securities. Other foreign currency transactions resulting in realized and unrealized gain (loss) are disclosed separately.
Investment Transactions and Income. For financial reporting purposes, the Fund's investment holdings and NAV include trades executed through the end of the last business day of the period. The NAV per share for processing shareholder transactions is calculated as of the close of business of the New York Stock Exchange (NYSE), normally 4:00 p.m. Eastern time and includes trades executed through the end of the prior business day. Gains and losses on securities sold are determined on the basis of identified cost and may include proceeds received from litigation. Dividend income is recorded on the ex-dividend date, except for certain dividends from foreign securities where the ex-dividend date may have passed, which are recorded as soon as the Fund is informed of
Annual Report
Notes to Financial Statements - continued
(Amounts in thousands except ratios)
3. Significant Accounting Policies - continued
Investment Transactions and Income - continued
the ex-dividend date. Non-cash dividends included in dividend income, if any, are recorded at the fair market value of the securities received. Distributions received on securities that represent a return of capital or capital gain are recorded as a reduction of cost of investments and/or as a realized gain. The Fund estimates the components of distributions received that may be considered return of capital distributions or capital gain distributions. Large, non-recurring dividends recognized by the Fund are presented separately on the Statement of Operations as "Special Dividends" and the impact of these dividends is presented in the Financial Highlights. Interest income and distributions from the Fidelity Central Funds are accrued as earned. Interest income includes coupon interest and amortization of premium and accretion of discount on debt securities. Investment income is recorded net of foreign taxes withheld where recovery of such taxes is uncertain. Debt obligations may be placed on non-accrual status and related interest income may be reduced by ceasing current accruals and writing off interest receivables when the collection of all or a portion of interest has become doubtful based on consistently applied procedures. A debt obligation is removed from non-accrual status when the issuer resumes interest payments or when collectability of interest is reasonably assured.
Expenses. Most expenses of the Trust can be directly attributed to a fund. Expenses which cannot be directly attributed are apportioned amongst each fund in the Trust. Expense estimates are accrued in the period to which they relate and adjustments are made when actual amounts are known.
Deferred Trustee Compensation. Under a Deferred Compensation Plan (the Plan), independent Trustees may elect to defer receipt of a portion of their annual compensation. Deferred amounts are invested in a cross-section of Fidelity funds, are marked-to-market and remain in the Fund until distributed in accordance with the Plan. The investment of deferred amounts and the offsetting payable to the Trustees are included in the accompanying Statement of Assets and Liabilities.
Income Tax Information and Distributions to Shareholders. Each year the Fund intends to qualify as a regulated investment company, including distributing substantially all of its taxable income and realized gains under Subchapter M of the Internal Revenue Code and filing its U.S. federal tax return. As a result, no provision for income taxes is required. As of July 31, 2010, the Fund did not have any unrecognized tax benefits in the accompanying financial statements. A fund's federal tax return is subject to examination by the Internal Revenue Service (IRS) for a period of three years. Foreign taxes are provided for based on the Fund's understanding of the tax rules and rates that exist in the foreign markets in which it invests.
Distributions are recorded on the ex-dividend date. Income dividends and capital gain distributions are declared separately for each class. Income and capital gain distributions are determined in accordance with income tax regulations, which may differ from GAAP.
Annual Report
3. Significant Accounting Policies - continued
Income Tax Information and Distributions to Shareholders - continued
Capital accounts within the financial statements are adjusted for permanent book-tax differences. These adjustments have no impact on net assets or the results of operations. Temporary book-tax differences will reverse in a subsequent period.
Book-tax differences are primarily due to the short-term gain distributions from the Fidelity Central Funds, foreign currency transactions, passive foreign investment companies (PFIC), market discount, partnerships, deferred trustees compensation, capital loss carryforwards, losses deferred due to wash sales and excise tax regulations.
The federal tax cost of investment securities and unrealized appreciation (depreciation) as of period end were as follows:
Gross unrealized appreciation | $ 913,175 |
Gross unrealized depreciation | (730,732) |
Net unrealized appreciation (depreciation) | $ 182,443 |
Tax Cost | $ 7,945,475 |
The tax-based components of distributable earnings as of period end were as follows:
Undistributed ordinary income | $ 43,191 |
Capital loss carryforward | $ (804,929) |
Net unrealized appreciation (depreciation) | $ 181,467 |
The tax character of distributions paid was as follows:
| July 31, 2010 | July 31, 2009 |
Ordinary Income | $ 55,797 | $ 134,581 |
Long-term Capital Gains | - | 359,568 |
Total | $ 55,797 | $ 494,149 |
4. Operating Policies.
Restricted Securities. The Fund may invest in securities that are subject to legal or contractual restrictions on resale. These securities generally may be resold in transactions exempt from registration or to the public if the securities are registered. Disposal of these securities may involve time-consuming negotiations and expense, and prompt sale at an acceptable price may be difficult. Information regarding restricted securities is included at the end of the Fund's Schedule of Investments.
5. Purchases and Sales of Investments.
Purchases and sales of securities, other than short-term securities, aggregated $6,671,911 and $6,583,311, respectively.
Annual Report
Notes to Financial Statements - continued
(Amounts in thousands except ratios)
6. Fees and Other Transactions with Affiliates.
Management Fee. FMR and its affiliates provide the Fund with investment management related services for which the Fund pays a monthly management fee. The management fee is the sum of an individual fund fee rate that is based on an annual rate of .30% of the Fund's average net assets and a group fee rate that averaged .26% during the period. The group fee rate is based upon the average net assets of all the mutual funds advised by FMR. The group fee rate decreases as assets under management increase and increases as assets under management decrease. In addition, the management fee is subject to a performance adjustment (up to a maximum of ± .20% of the Fund's average net assets over a 36 month performance period). The upward or downward adjustment to the management fee is based on the relative investment performance of the retail class of the Fund, Dividend Growth, as compared to an appropriate benchmark index. For the period, the total annual management fee rate, including the performance adjustment, was .64% of the Fund's average net assets.
Transfer Agent Fees. Fidelity Investments Institutional Operations Company, Inc. (FIIOC), an affiliate of FMR, is the transfer, dividend disbursing and shareholder servicing agent for each class of the Fund. FIIOC receives account fees and asset-based fees that vary according to the account size and type of account of the shareholders of Dividend Growth. FIIOC receives an asset-based fee of Class K's average net assets. FIIOC pays for typesetting, printing and mailing of shareholder reports, except proxy statements. For the period, the total transfer agent fees paid by each class were as follows:
| Amount | % of
Average
Net Assets |
Dividend Growth | $ 19,960 | .26 |
Class K | 157 | .05 |
| $ 20,117 | |
Accounting and Security Lending Fees. Fidelity Service Company, Inc. (FSC), an affiliate of FMR, maintains the Fund's accounting records. The accounting fee is based on the level of average net assets for the month. Under a separate contract, FSC administers the security lending program. The security lending fee is based on the number and duration of lending transactions.
Brokerage Commissions. The Fund placed a portion of its portfolio transactions with brokerage firms which are affiliates of the investment adviser. The commissions paid to these affiliated firms were $106 for the period.
Annual Report
6. Fees and Other Transactions with Affiliates - continued
Interfund Lending Program. Pursuant to an Exemptive Order issued by the SEC, the Fund, along with other registered investment companies having management contracts with FMR, may participate in an interfund lending program. This program provides an alternative credit facility allowing the funds to borrow from, or lend money to, other participating affiliated funds. At period end, there were no interfund loans outstanding. The Fund's activity in this program during the period for which loans were outstanding was as follows:
Borrower or Lender | Average Daily
Loan Balance | Weighted Average
Interest Rate | Interest
Expense |
Borrower | $ 25,396 | .38% | $ 1 |
7. Committed Line of Credit.
The Fund participates with other funds managed by FMR in a $3.75 billion credit facility (the "line of credit") to be utilized for temporary or emergency purposes to fund shareholder redemptions or for other short-term liquidity purposes. The Fund has agreed to pay commitment fees on its pro-rata portion of the line of credit, which amounted to $31 and is reflected in Miscellaneous expenses on the Statement of Operations. During the period, there were no borrowings on this line of credit.
8. Security Lending.
The Fund lends portfolio securities from time to time in order to earn additional income. On the settlement date of the loan, the Fund receives collateral (in the form of U.S. Treasury obligations, letters of credit and/or cash) against the loaned securities and maintains collateral in an amount not less than 100% of the market value of the loaned securities during the period of the loan. The market value of the loaned securities is determined at the close of business of the Fund and any additional required collateral is delivered to the Fund on the next business day. If the borrower defaults on its obligation to return the securities loaned because of insolvency or other reasons, a fund could experience delays and costs in recovering the securities loaned or in gaining access to the collateral. Any cash collateral received is invested in the Fidelity Securities Lending Cash Central Fund. The value of loaned securities and cash collateral at period end are disclosed on the Fund's Statement of Assets and Liabilities. Security lending income represents the income earned on investing cash collateral, less fees and expenses associated with the loan, plus any premium payments that may be received on the loan of certain types of securities. Security lending income is presented in the Statement of Operations as a component of income from Fidelity Central Funds. Net income from lending portfolio securities during the period amounted to $1,545.
Annual Report
Notes to Financial Statements - continued
(Amounts in thousands except ratios)
9. Expense Reductions.
Many of the brokers with whom FMR places trades on behalf of the Fund provided services to the Fund in addition to trade execution. These services included payments of certain expenses on behalf of the Fund totaling $726 for the period.
10. Distributions to Shareholders.
Distributions to shareholders of each class were as follows:
Years ended July 31, | 2010 | 2009 |
From net investment income | | |
Dividend Growth | $ 37,603 | $ 131,611 |
Class K | 1,766 | 1,254 |
Total | $ 39,369 | $ 132,865 |
From net realized gain | | |
Dividend Growth | $ 15,884 | $ 361,247 |
Class K | 544 | 37 |
Total | $ 16,428 | $ 361,284 |
11. Share Transactions.
Transactions for each class of shares were as follows:
| Shares | Dollars |
Years ended July 31, | 2010A | 2009 | 2010A | 2009 |
Dividend Growth | | | | |
Shares sold | 100,583 | 75,287 | $ 2,382,785 | $ 1,282,313 |
Conversion to Class K | (734) | (9,623) | (15,619) | (178,188) |
Reinvestment of distributions | 2,281 | 21,264 | 51,426 | 478,613 |
Shares redeemed | (104,010) | (134,869) | (2,429,464) | (2,446,584) |
Net increase (decrease) | (1,880) | (47,941) | $ (10,872) | $ (863,846) |
Class K | | | | |
Shares sold | 6,982 | 2,088 | $ 165,346 | $ 35,139 |
Conversion from Dividend Growth | 733 | 9,623 | 15,619 | 178,188 |
Reinvestment of distributions | 102 | 86 | 2,310 | 1,291 |
Shares redeemed | (2,870) | (1,850) | (67,508) | (29,769) |
Net increase (decrease) | 4,947 | 9,947 | $ 115,767 | $ 184,849 |
A Conversion transactions for Class K and Dividend Growth are presented for the period August 1, 2009 through August 31, 2009.
Annual Report
12. Other.
The Fund's organizational documents provide former and current trustees and officers with a limited indemnification against liabilities arising in connection with the performance of their duties to the Fund. In the normal course of business, the Fund may also enter into contracts that provide general indemnifications. The Fund's maximum exposure under these arrangements is unknown as this would be dependent on future claims that may be made against the Fund. The risk of material loss from such claims is considered remote.
Annual Report
To the Trustees of Fidelity Securities Fund and the Shareholders of Fidelity Dividend Growth Fund:
In our opinion, the accompanying statement of assets and liabilities, including the schedule of investments, and the related statements of operations and of changes in net assets and the financial highlights present fairly, in all material respects, the financial position of Fidelity Dividend Growth Fund (a fund of Fidelity Securities Fund) at July 31, 2010, the results of its operations for the year then ended, the changes in its net assets for each of the two years in the period then ended and the financial highlights for each of the periods indicated, in conformity with accounting principles generally accepted in the United States of America. These financial statements and financial highlights (hereafter referred to as "financial statements") are the responsibility of the Fidelity Dividend Growth Fund's management. Our responsibility is to express an opinion on these financial statements based on our audits. We conducted our audits of these financial statements in accordance with the standards of the Public Company Accounting Oversight Board (United States). Those standards require that we plan and perform the audit to obtain reasonable assurance about whether the financial statements are free of material misstatement. An audit includes examining, on a test basis, evidence supporting the amounts and disclosures in the financial statements, assessing the accounting principles used and significant estimates made by management, and evaluating the overall financial statement presentation. We believe that our audits, which included confirmation of securities at July 31, 2010 by correspondence with the custodian and brokers, provide a reasonable basis for our opinion.
/s/ PricewaterhouseCoopers LLP
PricewaterhouseCoopers LLP
Boston, Massachusetts
September 10, 2010
Annual Report
The Trustees, Member of the Advisory Board, and executive officers of the trust and fund, as applicable, are listed below. The Board of Trustees governs the fund and is responsible for protecting the interests of shareholders. The Trustees are experienced executives who meet periodically throughout the year to oversee the fund's activities, review contractual arrangements with companies that provide services to the fund, oversee management of the risks associated with such activities and contractual arrangements, and review the fund's performance. Except for James C. Curvey, each of the Trustees oversees 222 funds advised by FMR or an affiliate. Mr. Curvey oversees 411 funds advised by FMR or an affiliate.
The Trustees hold office without limit in time except that (a) any Trustee may resign; (b) any Trustee may be removed by written instrument, signed by at least two-thirds of the number of Trustees prior to such removal; (c) any Trustee who requests to be retired or who has become incapacitated by illness or injury may be retired by written instrument signed by a majority of the other Trustees; and (d) any Trustee may be removed at any special meeting of shareholders by a two-thirds vote of the outstanding voting securities of the trust. Each Trustee who is not an interested person (as defined in the 1940 Act) (Independent Trustee), shall retire not later than the last day of the calendar year in which his or her 72nd birthday occurs. The Independent Trustees may waive this mandatory retirement age policy with respect to individual Trustees. The executive officers and Advisory Board Member hold office without limit in time, except that any officer and Advisory Board Member may resign or may be removed by a vote of a majority of the Trustees at any regular meeting or any special meeting of the Trustees. Except as indicated, each individual has held the office shown or other offices in the same company for the past five years.
Experience, Skills, Attributes, and Qualifications of the Fund's Trustees. The Governance and Nominating Committee has adopted a statement of policy that describes the experience, qualifications, attributes, and skills that are necessary and desirable for potential Independent Trustee candidates (Statement of Policy). The Board believes that each Trustee satisfied at the time he or she was initially elected or appointed a Trustee, and continues to satisfy, the standards contemplated by the Statement of Policy. The Governance and Nominating Committee also engages professional search firms to help identify potential Independent Trustee candidates who have the experience, qualifications, attributes, and skills consistent with the Statement of Policy. From time to time, additional criteria based on the composition and skills of the current Independent Trustees, as well as experience or skills that may be appropriate in light of future changes to board composition, business conditions, and regulatory or other developments, have also been considered by the professional search firms and the Governance and Nominating Committee. In addition, the Board takes into account the Trustees' commitment and participation in Board and committee meetings, as well as their leadership of standing and ad hoc committees throughout their tenure.
In determining that a particular Trustee was and continues to be qualified to serve as a Trustee, the Board has considered a variety of criteria, none of which, in isolation, was controlling. The Board believes that, collectively, the Trustees have balanced and diverse experience, qualifications, attributes, and skills, which allow the Board to operate effectively in governing the fund and protecting the interests of shareholders. Information about the specific experience, skills, attributes, and qualifications of each Trustee, which in each case led to the Board's conclusion that the Trustee should serve (or continue to serve) as a trustee of the fund, is provided below.
Annual Report
Board Structure and Oversight Function. Edward C. Johnson 3d is an interested person (as defined in the 1940 Act) and currently serves as Chairman. The Trustees have determined that an interested Chairman is appropriate and benefits shareholders because an interested Chairman has a personal and professional stake in the quality and continuity of services provided to the fund. Independent Trustees exercise their informed business judgment to appoint an individual of their choosing to serve as Chairman, regardless of whether the Trustee happens to be independent or a member of management. The Independent Trustees have determined that they can act independently and effectively without having an Independent Trustee serve as Chairman and that a key structural component for assuring that they are in a position to do so is for the Independent Trustees to constitute a substantial majority for the Board. The Independent Trustees also regularly meet in executive session. Ned C. Lautenbach serves as Chairman of the Independent Trustees and as such (i) acts as a liaison between the Independent Trustees and management with respect to matters important to the Independent Trustees and (ii) with management prepares agendas for Board meetings.
Fidelity funds are overseen by different Boards of Trustees. The fund's Board oversees Fidelity's equity and high income funds and another Board oversees Fidelity's investment-grade bond, money market, and asset allocation funds. The asset allocation funds may invest in Fidelity funds overseen by the fund's Board. The use of separate Boards, each with its own committee structure, allows the Trustees of each group of Fidelity funds to focus on the unique issues of the funds they oversee, including common research, investment, and operational issues. On occasion, the separate Boards establish joint committees to address issues of overlapping consequences for the Fidelity funds overseen by each Board.
The Trustees operate using a system of committees to facilitate the timely and efficient consideration of all matters of importance to the Trustees, the fund, and fund shareholders and to facilitate compliance with legal and regulatory requirements and oversight of the fund's activities and associated risks. The Board, acting through its committees, has charged FMR and its affiliates with (i) identifying events or circumstances the occurrence of which could have demonstrably adverse effects on the fund's business and/or reputation; (ii) implementing processes and controls to lessen the possibility that such events or circumstances occur or to mitigate the effects of such events or circumstances if they do occur; and (iii) creating and maintaining a system designed to evaluate continuously business and market conditions in order to facilitate the identification and implementation processes described in (i) and (ii) above. Because the day-to-day operations and activities of the fund are carried out by or through FMR, its affiliates and other service providers, the fund's exposure to risks is mitigated but not eliminated by the processes overseen by the Trustees. While each of the Board's committees has responsibility for overseeing different aspects of the fund's activities, oversight is exercised primarily through the Operations, Audit, and Compliance Committees. Appropriate personnel, including but not limited to the fund's Chief Compliance Officer (CCO), FMR's internal auditor, the independent accountants, the fund's Treasurer and portfolio management personnel, make periodic reports to the Board's committees, as appropriate. The responsibilities of each committee, including their oversight responsibilities, are described further under "Standing Committees of the Fund's Trustees."
Annual Report
Trustees and Officers - continued
The fund's Statement of Additional Information (SAI) includes more information about the Trustees. To request a free copy, call Fidelity at 1-800-544-8544.
Interested Trustees*:
Correspondence intended for each Trustee who is an interested person may be sent to Fidelity Investments, 82 Devonshire Street, Boston, Massachusetts 02109.
Name, Age; Principal Occupations and Other Relevant Experience+ |
Edward C. Johnson 3d (80) |
| Year of Election or Appointment: 1984 Mr. Johnson is Trustee and Chairman of the Board of Trustees of certain Trusts. Mr. Johnson serves as Chief Executive Officer, Chairman, and a Director of FMR LLC; Chairman and a Director of FMR; Chairman and a Director of Fidelity Research & Analysis Company (FRAC); Chairman and a Director of Fidelity Investments Money Management, Inc.; and Chairman and a Director of FMR Co., Inc. In addition, Mr. Johnson serves as Chairman and Director of FIL Limited. Previously, Mr. Johnson served as President of FMR LLC (2006-2007). |
James C. Curvey (75) |
| Year of Election or Appointment: 2007 Mr. Curvey also serves as Trustee (2007-present) of other investment companies advised by FMR. Mr. Curvey is a Director of FMR and FMR Co., Inc. (2007-present). Mr. Curvey is also Vice Chairman (2006-present) and Director of FMR LLC. In addition, Mr. Curvey serves as an Overseer for the Boston Symphony Orchestra and a member of the Trustees of Villanova University. |
* Trustees have been determined to be "Interested Trustees" by virtue of, among other things, their affiliation with the trust or various entities under common control with FMR.
+ The information above includes each Trustee's principal occupation during the last five years and other information relating to the experience, attributes, and skills relevant to each Trustee's qualifications to serve as a Trustee, which led to the conclusion that each Trustee should serve as a Trustee for the fund.
Annual Report
Independent Trustees:
Correspondence intended for each Independent Trustee (that is, the Trustees other than the Interested Trustees) may be sent to Fidelity Investments, P.O. Box 55235, Boston, Massachusetts 02205-5235.
Name, Age; Principal Occupations and Other Relevant Experience+ |
Dennis J. Dirks (62) |
| Year of Election or Appointment: 2005 Prior to his retirement in May 2003, Mr. Dirks was Chief Operating Officer and a member of the Board of The Depository Trust & Clearing Corporation (DTCC). He also served as President, Chief Operating Officer, and Board member of The Depository Trust Company (DTC) and President and Board member of the National Securities Clearing Corporation (NSCC). In addition, Mr. Dirks served as Chief Executive Officer and Board member of the Government Securities Clearing Corporation, Chief Executive Officer and Board member of the Mortgage-Backed Securities Clearing Corporation, as a Trustee and a member of the Finance Committee of Manhattan College (2005-2008), and as a Trustee and a member of the Finance Committee of AHRC of Nassau County (2006-2008). Currently, Mr. Dirks serves as a member of the Board of Directors for The Brookville Center for Children's Services, Inc. (2009-present). |
Alan J. Lacy (56) |
| Year of Election or Appointment: 2008 Mr. Lacy serves as Senior Adviser (2007-present) of Oak Hill Capital Partners, L.P. (private equity). Mr. Lacy also served as Chief Executive Officer (2000-2005) and Vice Chairman (2005-2006) of Sears Holdings Corporation and Sears, Roebuck and Co. (retail). In addition, Mr. Lacy serves as a member of the Board of Directors of The Western Union Company (global money transfer, 2006-present) and Bristol-Myers Squibb Company (global pharmaceuticals, 2007-present). Mr. Lacy is Chairman (2008-present) and a member (2006-present) of the Board of Trustees of The National Parks Conservation Association. |
Ned C. Lautenbach (66) |
| Year of Election or Appointment: 2000 Mr. Lautenbach is Chairman of the Independent Trustees of the Equity and High Income Funds (2006-present). Mr. Lautenbach is an Advisory Partner of Clayton, Dubilier & Rice, Inc. (private equity investment, 2008-present) and was previously a Partner of Clayton, Dubilier & Rice, Inc. (1998-2008). Previously, Mr. Lautenbach was with the International Business Machines Corporation (IBM) from 1968 until his retirement in 1998. Mr. Lautenbach serves as a Director of Eaton Corporation (diversified industrial) as well as the Philharmonic Center for the Arts in Naples, Florida. Mr. Lautenbach is also a member of the Board of Trustees of Fairfield University (2005-present), as well as a member of the Council on Foreign Relations. Previously, Mr. Lautenbach served as a Director of Sony Corporation (2006-2007). |
Joseph Mauriello (65) |
| Year of Election or Appointment: 2008 Prior to his retirement in January 2006, Mr. Mauriello served in numerous senior management positions including Deputy Chairman and Chief Operating Officer (2004-2005), and Vice Chairman of Financial Services (2002-2004) of KPMG LLP US (professional services, 1965-2005). Mr. Mauriello currently serves as a member of the Board of Directors of XL Capital Ltd. (global insurance and re-insurance, 2006-present) and of Arcadia Resources Inc. (health care services and products, 2007-present). Previously, Mr. Mauriello served as a Director of the Hamilton Funds of the Bank of New York (2006-2007). |
Cornelia M. Small (66) |
| Year of Election or Appointment: 2005 Ms. Small is a member of the Board of Directors of the Teagle Foundation (2009-present). Ms. Small is also a member of the Investment Committee, and Chair (2008-present) and a member of the Board of Trustees of Smith College. In addition, Ms. Small serves on the Investment Committee of the Berkshire Taconic Community Foundation (2008-present). Previously, Ms. Small served as Chairperson of the Investment Committee (2002-2008) of Smith College. In addition, Ms. Small served as Chief Investment Officer, Director of Global Equity Investments, and a member of the Board of Directors of Scudder, Stevens & Clark and Scudder Kemper Investments. |
William S. Stavropoulos (71) |
| Year of Election or Appointment: 2002 Mr. Stavropoulos is Vice Chairman of the Independent Trustees of the Equity and High Income Funds (2006-present). Mr. Stavropoulos serves as President and Founder of the Michigan Baseball Foundation, the Great Lakes Loons (2007-present). Mr. Stavropoulos is Chairman Emeritus of the Board of Directors of The Dow Chemical Company, where he previously served in numerous senior management positions, including President, CEO (1995-2000; 2002-2004), Chairman of the Executive Committee (2000-2006), and as a member of the Board of Directors (1990-2006). Currently, Mr. Stavropoulos is a Director of Teradata Corporation (data warehousing and technology solutions, 2008-present), Chemical Financial Corporation, Maersk Inc. (industrial conglomerate), Tyco International, Inc. (multinational manufacturing and services, 2007-present), and a member of the Advisory Board for Metalmark Capital (private equity investment, 2005-present). Mr. Stavropoulos is a special advisor to Clayton, Dubilier & Rice, Inc. (private equity investment). In addition, Mr. Stavropoulos is a member of the University of Notre Dame Advisory Council for the College of Science. |
David M. Thomas (61) |
| Year of Election or Appointment: 2008 Previously, Mr. Thomas served as Executive Chairman (2005-2006) and Chairman and Chief Executive Officer (2000-2005) of IMS Health, Inc. (pharmaceutical and healthcare information solutions). In addition, Mr. Thomas serves as a member of the Board of Directors of Fortune Brands, Inc. (consumer products), and Interpublic Group of Companies, Inc. (marketing communication, 2004-present). |
Michael E. Wiley (59) |
| Year of Election or Appointment: 2008 Mr. Wiley also serves as a Director of Asia Pacific Exploration Consolidated (international oil and gas exploration and production, 2008-present), and as a member of the Board of Trustees of the University of Tulsa (2000-2006; 2007-present). Mr. Wiley serves as a Director of Tesoro Corporation (independent oil refiner and marketer, 2005-present), and a Director of Bill Barrett Corporation (exploration and production, 2005-present). In addition, Mr. Wiley also serves as a Director of Post Oak Bank (privately-held bank, 2004-present). Previously, Mr. Wiley served as a Sr. Energy Advisor of Katzenbach Partners, LLC (consulting, 2006-2007), as an Advisory Director of Riverstone Holdings (private investment), Chairman, President, and CEO of Baker Hughes, Inc. (oilfield services, 2000-2004), and as Director of Spinnaker Exploration Company (exploration and production, 2001-2005). |
Annual Report
Trustees and Officers - continued
+ The information above includes each Trustee's principal occupation during the last five years and other information relating to the experience, attributes, and skills relevant to each Trustee's qualifications to serve as a Trustee, which led to the conclusion that each Trustee should serve as a Trustee for the fund.
Advisory Board Member and Executive Officers:
Correspondence intended for each executive officer and Peter S. Lynch may be sent to Fidelity Investments, 82 Devonshire Street, Boston, Massachusetts 02109.
Name, Age; Principal Occupation |
Peter S. Lynch (66) |
| Year of Election or Appointment: 2003 Member of the Advisory Board of Fidelity's Equity and High Income Funds. Mr. Lynch is Vice Chairman and a Director of FMR and FMR Co., Inc. In addition, Mr. Lynch serves as a Trustee of Boston College and as the Chairman of the Inner-City Scholarship Fund. Previously, Mr. Lynch served on the Special Olympics International Board of Directors (1997-2006). |
Kenneth B. Robins (40) |
| Year of Election or Appointment: 2008 President and Treasurer of Fidelity's Equity and High Income Funds. Mr. Robins also serves as President and Treasurer (2010-present) and Assistant Treasurer (2009-present) of other Fidelity funds and is an employee of Fidelity Investments (2004-present). Previously, Mr. Robins served as Deputy Treasurer of the Fidelity funds (2005-2008) and Treasurer and Chief Financial Officer of The North Carolina Capital Management Trust: Cash and Term Portfolios (2006-2008). |
Bruce T. Herring (44) |
| Year of Election or Appointment: 2006 Vice President of certain Equity Funds. Mr. Herring also serves as Group Chief Investments Officer of FMR. Previously, Mr. Herring served as a portfolio manager for Fidelity U.S. Equity Funds. |
Brian B. Hogan (45) |
| Year of Election or Appointment: 2009 Vice President of certain Equity Funds and Vice President of Sector Funds. Mr. Hogan also serves as Senior Vice President, Equity Research of FMR (2006-present) and President of FMR's Equity Division (2009-present). Previously, Mr. Hogan served as a portfolio manager. |
Scott C. Goebel (42) |
| Year of Election or Appointment: 2008 Secretary and Chief Legal Officer (CLO) of the Fidelity funds. Mr. Goebel also serves as General Counsel, Secretary, and Senior Vice President of FMR (2008-present) and FMR Co., Inc. (2008-present); Deputy General Counsel of FMR LLC; Chief Legal Officer of Fidelity Management & Research (Hong Kong) Limited (2008-present) and Assistant Secretary of Fidelity Management & Research (Japan) Inc. (2008-present), Fidelity Investments Money Management, Inc. (2008-present), Fidelity Management & Research (U.K.) Inc. (2008-present), and Fidelity Research and Analysis Company (2008-present). Previously, Mr. Goebel served as Assistant Secretary of the Funds (2007-2008) and as Vice President and Secretary of Fidelity Distributors Corporation (FDC) (2005-2007). |
William C. Coffey (41) |
| Year of Election or Appointment: 2009 Assistant Secretary of Fidelity's Equity and High Income Funds. Mr. Coffey also serves as Senior Vice President and Deputy General Counsel of FMR LLC (2010-present), and is an employee of Fidelity Investments. Previously, Mr. Coffey served as Vice President and Associate General Counsel of FMR LLC (2005-2009). |
Holly C. Laurent (56) |
| Year of Election or Appointment: 2008 Anti-Money Laundering (AML) Officer of the Fidelity funds. Ms. Laurent is an employee of Fidelity Investments. Previously, Ms. Laurent was Senior Vice President and Head of Legal for Fidelity Business Services India Pvt. Ltd. (2006-2008), and Senior Vice President, Deputy General Counsel and Group Head for FMR LLC (2005-2006). |
Christine Reynolds (51) |
| Year of Election or Appointment: 2008 Chief Financial Officer of the Fidelity funds. Ms. Reynolds became President of Fidelity Pricing and Cash Management Services (FPCMS) in August 2008. Ms. Reynolds served as Chief Operating Officer of FPCMS (2007-2008). Previously, Ms. Reynolds served as President, Treasurer, and Anti-Money Laundering officer of the Fidelity funds (2004-2007). |
Kenneth A. Rathgeber (63) |
| Year of Election or Appointment: 2004 Chief Compliance Officer of Fidelity's Equity and High Income Funds. Mr. Rathgeber is Chief Compliance Officer of Fidelity Management & Research (Hong Kong) Limited (2008-present), Fidelity Management & Research (Japan) Inc. (2008-present), FMR (2005-present), FMR Co., Inc. (2005-present), Fidelity Management & Research (U.K.) Inc. (2005-present), Fidelity Research & Analysis Company (2005-present), Fidelity Investments Money Management, Inc. (2005-present), Pyramis Global Advisors, LLC (2005-present), and Strategic Advisers, Inc. (2005-present). |
Jeffrey S. Christian (48) |
| Year of Election or Appointment: 2009 Deputy Treasurer of the Fidelity funds. Mr. Christian is an employee of Fidelity Investments. Previously, Mr. Christian served as Chief Financial Officer (2008-2009) of certain Fidelity funds and Senior Vice President of Fidelity Pricing and Cash Management Services (FPCMS) (2004-2009). |
Bryan A. Mehrmann (49) |
| Year of Election or Appointment: 2005 Deputy Treasurer of the Fidelity funds. Mr. Mehrmann is an employee of Fidelity Investments. |
Adrien E. Deberghes (42) |
| Year of Election or Appointment: 2008 Deputy Treasurer of Fidelity's Equity and High Income Funds. Mr. Deberghes also serves as Assistant Treasurer of other Fidelity funds (2010-present) and is an employee of Fidelity Investments (2008-present). Previously, Mr. Deberghes served as Senior Vice President of Mutual Fund Administration at State Street Corporation (2007-2008), Senior Director of Mutual Fund Administration at Investors Bank & Trust (2005-2007), and Director of Finance for Dunkin' Brands (2000-2005). |
Stephanie J. Dorsey (41) |
| Year of Election or Appointment: 2010 Assistant Treasurer of Fidelity's Equity and High Income Funds. Ms. Dorsey also serves as Deputy Treasurer of other Fidelity funds (2008-present) and is an employee of Fidelity Investments (2008-present). Previously, Ms. Dorsey served as Treasurer (2004-2008) of the JPMorgan Mutual Funds and Vice President (2004-2008) of JPMorgan Chase Bank. |
John R. Hebble (52) |
| Year of Election or Appointment: 2009 Assistant Treasurer of Fidelity's Equity and High Income Funds. Mr. Hebble also serves as Treasurer and Chief Financial Officer of The North Carolina Capital Management Trust: Cash and Term Portfolio (2008-present), President and Treasurer of other Fidelity funds (2008-present) and is an employee of Fidelity Investments. |
Gary W. Ryan (51) |
| Year of Election or Appointment: 2005 Assistant Treasurer of the Fidelity funds. Mr. Ryan is an employee of Fidelity Investments. Previously, Mr. Ryan served as Vice President of Fund Reporting in Fidelity Pricing and Cash Management Services (FPCMS) (1999-2005). |
Annual Report
The Board of Trustees of Fidelity Dividend Growth Fund voted to pay on record date, the following distributions per share derived from capital gains realized from sales of portfolio securities, and dividends derived from net investment income:
| Pay Date | Record Date | Dividends | Capital Gains |
Dividend Growth | 9/09/10 | 9/08/10 | $0.087 | $0.042 |
Dividend Growth designates 100% of the dividends distributed in September and December, respectively during the fiscal year as qualifying for the dividends-received deduction for corporate shareholders.
Dividend Growth designates 100% of the dividends distributed in September and December, respectively during the fiscal year as amounts which may be taken into account as a dividend for the purposes of the maximum rate under section 1(h)(11) of the Internal Revenue Code.
The fund will notify shareholders in January 2011 of amounts for use in preparing 2010 income tax returns.
Annual Report
Board Approval of Investment Advisory Contracts and Management Fees
Fidelity Dividend Growth Fund
Each year, the Board of Trustees, including the Independent Trustees (together, the Board), votes on the renewal of the management contract and sub-advisory agreements (together, the Advisory Contracts) for the fund. The Board, assisted by the advice of fund counsel and Independent Trustees' counsel, requests and considers a broad range of information relevant to the renewal of the Advisory Contracts throughout the year.
The Board meets regularly and considers at each of its meetings factors that are relevant to its annual consideration of the renewal of the fund's Advisory Contracts, including the services and support provided to the fund and its shareholders. The Board has established various standing committees, each composed of Independent Trustees with varying backgrounds, to which the Board has assigned specific subject matter responsibilities in order to enhance effective decision-making by the Board. The Board, acting directly and through its Committees, requests and receives information concerning the annual consideration of the renewal of the fund's Advisory Contracts. The Board also meets as needed to consider matters specifically related to the Board's annual consideration of the renewal of Advisory Contracts. Members of the Board may also meet with trustees of other Fidelity funds through ad hoc joint committees to discuss certain matters relevant to the Fidelity funds.
At its July 2010 meeting, the Board of Trustees, including the Independent Trustees, unanimously determined to renew the fund's Advisory Contracts. In reaching its determination, the Board considered all factors it believed relevant, including (i) the nature, extent, and quality of the services to be provided to the fund and its shareholders (including the investment performance of the fund); (ii) the competitiveness of the fund's management fee and total expenses; (iii) the total costs of the services to be provided by and the profits to be realized by Fidelity from its relationship with the fund; (iv) the extent to which economies of scale would be realized as the fund grows; and (v) whether fee levels reflect these economies of scale, if any, for the benefit of fund shareholders.
In considering whether to renew the Advisory Contracts for the fund, the Board reached a determination, with the assistance of fund counsel and Independent Trustees' counsel and through the exercise of its business judgment, that the renewal of the Advisory Contracts is in the best interests of fund shareholders and that the compensation to be received by Fidelity under the management contract is fair and reasonable. The Board's decision to renew the Advisory Contracts was not based on any single factor noted above, but rather was based on a comprehensive consideration of all the information provided to the Board at its meetings throughout the year. The Board, in reaching its determination to renew the Advisory Contracts, is aware that shareholders in the fund have a broad range of investment choices available to them, including a wide choice among mutual funds offered by Fidelity's competitors, and that the fund's shareholders, with the opportunity to review and weigh the disclosure provided by the fund in its prospectus and other public disclosures, have chosen to invest in this fund, managed by Fidelity.
Annual Report
Board Approval of Investment Advisory Contracts and
Management Fees - continued
Nature, Extent, and Quality of Services Provided. The Board considered the staffing within the investment adviser, FMR, and the sub-advisers (together, the Investment Advisers), including the backgrounds of the fund's investment personnel and the fund's investment objective and discipline. The Independent Trustees also had discussions with senior management of Fidelity's investment operations and investment groups. The Board considered the structure of the portfolio manager compensation program and whether this structure provides appropriate incentives to act in the best interest of the fund.
Resources Dedicated to Investment Management and Support Services. The Board and the equity research subcommittee of the Board's Fund Oversight Committee reviewed the size, education, and experience of the Investment Advisers' investment staff, their use of technology, and the Investment Advisers' approach to recruiting, training, and retaining portfolio managers and other research, advisory, and management personnel. The Board noted that Fidelity's analysts have access to a variety of technological tools and market and securities data that enable them to perform both fundamental and quantitative analysis and to specialize in various disciplines. The Board considered Fidelity's extensive global research capabilities that enable the Investment Advisers to aggregate data from various sources in an effort to produce positive investment results. The Board also considered that Fidelity's portfolio managers and analysts have access to daily portfolio attribution that allows for monitoring of a fund's portfolio, as well as an electronic communication system that provides immediate real-time access to research concerning issuers and credit enhancers. The Board noted FMR's continued focus on strengthening the organization and discipline of equity portfolio management and research.
Shareholder and Administrative Services. The Board considered (i) the nature, extent, quality, and cost of advisory, administrative, and shareholder services performed by the Investment Advisers and their affiliates under the Advisory Contracts and under separate agreements covering transfer agency, pricing and bookkeeping, and securities lending services for the fund; (ii) the nature and extent of the investment adviser's supervision of third party service providers, principally custodians and subcustodians; and (iii) the resources devoted to, and the record of compliance with, the fund's compliance policies and procedures. The Board also reviewed the allocation of fund brokerage, including allocations to brokers affiliated with the Investment Advisers, the use of brokerage commissions to pay fund expenses, and the use of "soft" commission dollars to pay for research services.
The Board noted that the growth of fund assets over time across the complex allows Fidelity to reinvest in the development of services designed to enhance the value or convenience of the Fidelity funds as investment vehicles. These services include 24-hour access to account information and market information through phone representatives and over the Internet, and investor education materials and asset allocation tools.
Annual Report
Investment in a Large Fund Family. The Board considered the benefits to shareholders of investing in a Fidelity fund, including the benefits of investing in a fund that is part of a large family of funds offering a variety of investment disciplines and providing a large variety of mutual fund investor services. The Board noted that Fidelity had taken, or had made recommendations that resulted in the Fidelity funds taking, a number of actions over the previous year that benefited particular funds, including (i) dedicating additional resources to investment research and restructuring and broadening the focus of the investment research teams; (ii) bolstering the senior management team that oversees asset management; (iii) launching Class F of certain funds as a lower-fee class available to Freedom K and Freedom Index Funds; (iv) lowering the initial investment minimums and ongoing balance requirements for Real Estate High Income Fund; (v) eliminating subsequent purchase minimums for all funds and adding a waiver of the investment minimum requirement for new accounts opened with the proceeds of a systematic withdrawal plan; (vi) eliminating the withdrawal minimum and maximum limits for systematic withdrawals from Advisor funds; (vii) expanding sales load waivers on Class A shares for Destiny Planholders and expanding Institutional Class eligibility for Class O Destiny Planholders; and (viii) changing certain Class A and Class T sales charge structures to further align them with industry practices.
Investment Performance. The Board considered whether the fund has operated in accordance with its investment objective, as well as its record of compliance with its investment restrictions. It also reviewed the fund's absolute investment performance for each class, as well as the fund's relative investment performance for each class measured over multiple periods against (i) a broad-based securities market index, and (ii) a peer group of mutual funds deemed appropriate by Fidelity and reviewed by the Board. The following charts considered by the Board show, over the one-, three-, and five-year periods ended December 31, 2009, as available, the cumulative total returns of Class K and the retail class of the fund, the cumulative total returns of a broad-based securities market index ("benchmark"), and a range of cumulative total returns of a peer group of mutual funds identified by Morningstar, Inc. as having an investment style similar to that of the fund based on underlying portfolio holdings. The box within each chart shows the 25th percentile return (bottom of box) and the 75th percentile return (top of box) of the peer group. Returns shown above the box are in the first quartile and returns shown below the box are in the fourth quartile. The percentage beaten numbers noted below each chart correspond to the percentile box and represent the percentage of funds in the peer group whose performance was equal to or lower than that of the class indicated.
Annual Report
Board Approval of Investment Advisory Contracts and
Management Fees - continued
Fidelity Dividend Growth Fund
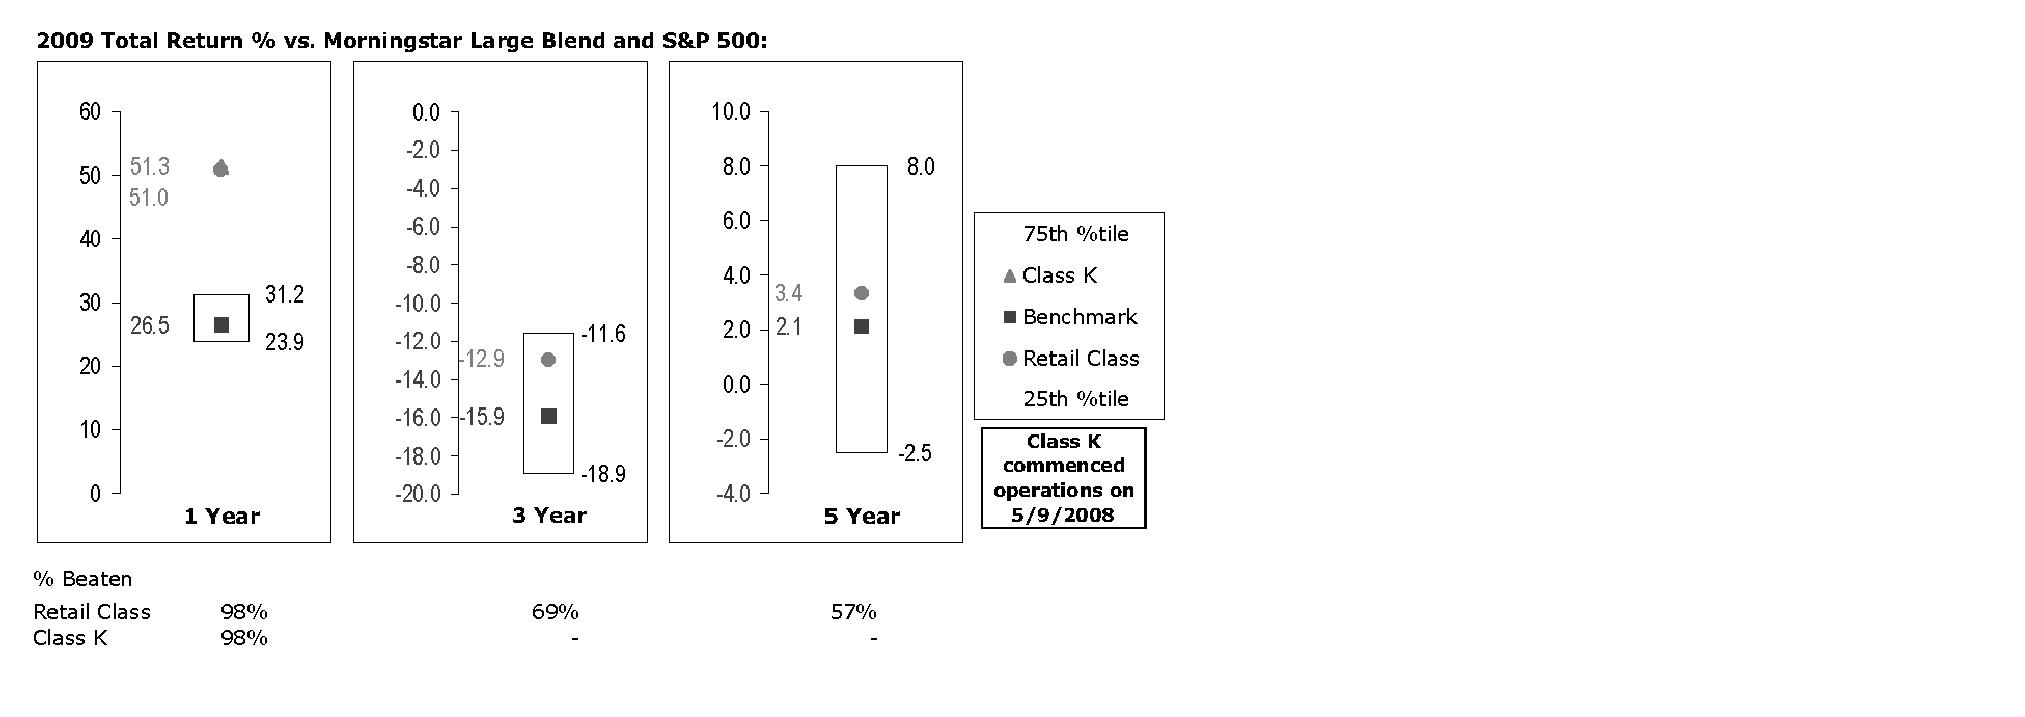
The Board reviewed the fund's relative investment performance against its peer group and noted that the performance of the retail class of the fund (the class with the longer performance record) was in the first quartile for the one-year period and the second quartile for the three- and five-year periods. The Board also noted that the investment performance of the retail class of the fund compared favorably to its benchmark for all the periods shown. The Board considered that the variations in performance between the fund's classes reflect the variations in class expenses, which result in lower performance for the higher expense class. The Board also reviewed the fund's performance since inception as well as performance in the current year.
The Board also considered that the fund's management fee is subject to upward or downward adjustment depending upon whether, and to what extent, the fund's investment performance for the performance period exceeds, or is exceeded by, the record (over the same period) of a Board-approved performance adjustment index. The Board realizes that the performance adjustment provides FMR with a strong economic incentive to seek to achieve superior performance for the fund's shareholders and helps to more closely align the interests of FMR and the fund's shareholders.
Based on its review, and giving particular weight to the nature and quality of the resources dedicated by the Investment Advisers to maintain and improve relative performance and factoring in the unprecedented market events in recent years, the Board concluded that the nature, extent, and quality of investment management and support services and of shareholder and administrative services provided to the fund will benefit the fund's shareholders, particularly in light of the Board's view that the fund's shareholders benefit from investing in a fund that is part of a large family of funds offering a variety of investment disciplines and services.
Annual Report
Competitiveness of Management Fee and Total Fund Expenses. The Board considered the fund's management fee and total expenses compared to "mapped groups" of competitive funds and classes. Fidelity creates "mapped groups" by combining similar Lipper investment objective categories that have comparable management fee characteristics. Combining Lipper investment objective categories aids the Board's management fee and total expense comparisons by broadening the competitive group used for comparison and by reducing the number of universes to which various Fidelity funds are compared.
Management Fee. The Board considered two proprietary management fee comparisons for the 12-month periods shown in the chart below. The group of Lipper funds used by the Board for management fee comparisons is referred to below as the "Total Mapped Group." The Total Mapped Group comparison focuses on a fund's standing relative to the total universe of comparable funds available to investors, in terms of gross management fees before expense reimbursements or caps, and without giving effect to the fund's performance adjustment. "TMG %" represents the percentage of funds in the Total Mapped Group that had management fees that were lower than the fund's. For example, a TMG % of 10% means that 90% of the funds in the Total Mapped Group had higher management fees than the fund. The "Asset-Size Peer Group" (ASPG) comparison focuses on a fund's standing relative to non-Fidelity funds similar in size to the fund within the Total Mapped Group. The ASPG represents at least 15% of the funds in the Total Mapped Group with comparable asset size and management fee characteristics, subject to a minimum of 50 funds (or all funds in the Total Mapped Group if fewer than 50). Additional information, such as the ASPG quartile in which the fund's management fee ranked and the impact of the fund's performance adjustment, is also included in the chart and considered by the Board.
Annual Report
Board Approval of Investment Advisory Contracts and
Management Fees - continued
Fidelity Dividend Growth Fund
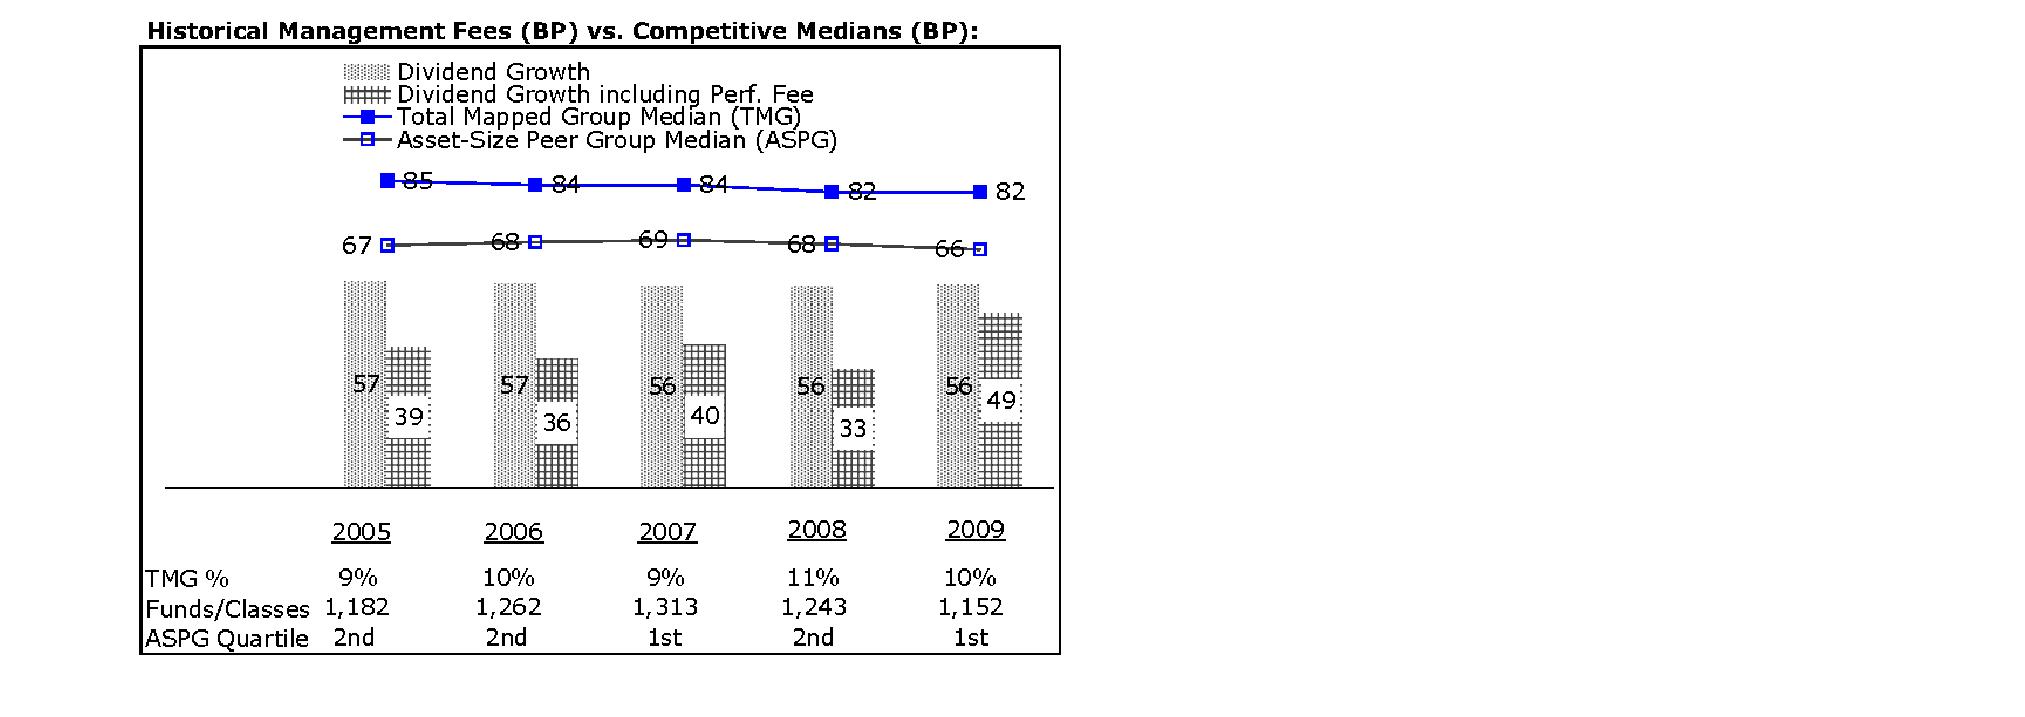
The Board noted that the fund's management fee ranked below the median of its Total Mapped Group and below the median of its ASPG for 2009. The Board also noted the effect of the fund's negative performance adjustment on the fund's management fee ranking. The Board noted that the performance adjustment for each year represents calculations for performance periods that differ from the periods shown in the performance charts above.
Based on its review, the Board concluded that the fund's management fee is fair and reasonable in light of the services that the fund receives and the other factors considered.
Total Expenses. In its review of each class's total expenses, the Board considered the fund's management fee as well as other fund or class expenses, as applicable, such as transfer agent fees, pricing and bookkeeping fees, and custodial, legal, and audit fees. The Board also noted the effects of any waivers and reimbursements on fees and expenses, as well as the impact of the fund's performance adjustment. As part of its review, the Board also considered current and historical total expenses of each class of the fund compared to competitive fund median expenses. Each class of the fund is compared to those funds and classes in the Total Mapped Group (used by the Board for management fee comparisons) that have a similar sales load structure.
The Board noted that the total expenses of each class ranked below its competitive median for 2009.
Annual Report
Fees Charged to Other Fidelity Clients. The Board also considered Fidelity fee structures and other information with respect to clients of FMR and its affiliates, such as other mutual funds advised or subadvised by FMR or its affiliates, pension plan clients, and other institutional clients. In March 2010, the Board created an ad hoc joint committee with the board of other Fidelity funds (the Committee) to review and compare Fidelity's institutional investment advisory business with its business of providing services to the Fidelity funds, including the differences in services provided, fees charged, and costs incurred, as well as competition in their respective marketplaces.
Based on its review of total expenses and fees charged to other Fidelity clients, the Board concluded that the total expenses of each class of the fund were reasonable in light of the services that the fund and its shareholders receive and the other factors considered, including the findings of the Committee.
Costs of the Services and Profitability. The Board considered the revenues earned and the expenses incurred by Fidelity in conducting the business of developing, marketing, distributing, managing, administering and servicing the fund and its shareholders. The Board also considered the level of Fidelity's profits in respect of all the Fidelity funds.
On an annual basis, FMR presents to the Board Fidelity's profitability for the fund. Fidelity calculates the profitability for each fund, as well as aggregate profitability for groups of Fidelity funds and all Fidelity funds, using a series of detailed revenue and cost allocation methodologies which originate with the audited books and records of Fidelity. The Audit Committee of the Board reviews any significant changes from the prior year's methodologies.
PricewaterhouseCoopers LLP (PwC), independent registered public accounting firm and auditor to Fidelity and certain Fidelity funds, has been engaged annually by the Board as part of the Board's assessment of Fidelity's profitability analysis. PwC's engagement includes the review and assessment of Fidelity's methodologies used in determining the revenues and expenses attributable to Fidelity's mutual fund business, and completion of agreed-upon procedures surrounding the mathematical accuracy of fund profitability and its conformity to allocation methodologies. After considering PwC's reports issued under the engagement and information provided by Fidelity, the Board believes that while other allocation methods may also be reasonable, Fidelity's profitability methodologies are reasonable in all material respects.
The Board has also reviewed Fidelity's non-fund businesses and fall-out benefits related to the mutual fund business as well as cases where Fidelity's affiliates may benefit from or be related to the fund's business.
Annual Report
Board Approval of Investment Advisory Contracts and
Management Fees - continued
The Board considered the costs of the services provided by and the profits realized by Fidelity in connection with the operation of the fund and were satisfied that the profitability was not excessive in the circumstances.
Economies of Scale. The Board considered whether there have been economies of scale in respect of the management of the Fidelity funds, whether the Fidelity funds (including the fund) have appropriately benefited from any such economies of scale, and whether there is potential for realization of any further economies of scale. The Board considered the extent to which the fund will benefit from economies of scale through increased services to the fund, through waivers or reimbursements, or through fee or expense reductions.
In February 2009, the Board and the board of other Fidelity funds created an ad hoc committee (the Economies of Scale Committee) to analyze whether FMR attains economies of scale in respect of the management and servicing of the Fidelity funds, whether the Fidelity funds have appropriately benefited from such economies of scale, and whether there is potential for realization of any further economies of scale.
The Board recognized that the fund's management contract incorporates a "group fee" structure, which provides for lower group fee rates as total fund assets under FMR's management increase, and for higher group fee rates as total fund assets under FMR's management decrease. FMR calculates the group fee rates based on a tiered asset "breakpoint" schedule that varies based on asset class. The Board considered that the group fee is designed to deliver the benefits of economies of scale to fund shareholders when total Fidelity fund assets increase, even if assets of any particular fund are unchanged or have declined, because some portion of Fidelity's costs are attributable to services provided to all Fidelity funds, and all funds benefit if those costs can be allocated among more assets. The Board concluded that, given the group fee structure, fund shareholders will benefit from lower management fees as assets under FMR's management increase at the fund complex level, regardless of whether Fidelity achieves any such economies of scale.
The Board concluded, considering the findings of the Economies of Scale Committee, that any potential economies of scale are being appropriately shared between fund shareholders and Fidelity.
Additional Information Requested by the Board. In order to develop fully the factual basis for consideration of the Fidelity funds' Advisory Contracts, the Board requested and received additional information on certain topics, including (i) fund performance trends, actions to be taken by FMR to improve certain funds' overall performance, and Fidelity's long-term strategies for certain funds; (ii) portfolio manager changes that have occurred during the past year and length of portfolio manager tenure for different categories of funds over time; (iii) Fidelity's compensation structure for portfolio managers, research analysts, and other key personnel, the rationale for the compensation structure, and how the compensation structure provides appropriate performance incentives; (iv) the amount of the investment that each portfolio manager has made in the Fidelity fund(s) that he or she manages; (v) management and other fees paid by FMR to affiliated sub-advisers on behalf of the Fidelity funds; (vi) Fidelity's fee structures and rationale for recommending different fees among different categories of funds; (vii) Fidelity's rationale for recommending which funds should have a performance adjustment component as part of their management fees; (viii) the rationale for any differences between fund fee structures and fee structures in place for other Fidelity clients; and (ix) explanations regarding the relative total expenses borne by certain funds and classes, total expense competitive trends, and actions that might be taken by FMR to reduce total expenses for certain funds and classes.
Annual Report
Based on its evaluation of all of the conclusions noted above, and after considering all factors it believed relevant, the Board ultimately concluded that the advisory fee structures are fair and reasonable, and that the fund's Advisory Contracts should be renewed.
Annual Report
Managing Your Investments
Fidelity offers several ways to conveniently manage your personal investments via your telephone or PC. You can access your account information, conduct trades and research your investments 24 hours a day.
By Phone
Fidelity Automated Service Telephone provides a single toll-free number to access account balances, positions, quotes and trading. It's easy to navigate the service, and on your first call, the system will help you create a personal identification number (PIN) for security.
(phone_graphic)
Fidelity Automated
Service Telephone (FAST®)
1-800-544-5555
Press
For mutual fund and brokerage trading.
For quotes.*
For account balances and holdings.
To review orders and mutual
fund activity.
To change your PIN.
To speak to a Fidelity representative.
By PC
Fidelity's web site on the Internet provides a wide range of information, including daily financial news, fund performance, interactive planning tools and news about Fidelity products and services.
(computer_graphic)
Fidelity's Web Site
www.fidelity.com
* When you call the quotes line, please remember that a fund's yield and return will vary and, except for money market funds, share price will also vary. This means that you may have a gain or loss when you sell your shares. There is no assurance that money market funds will be able to maintain a stable $1 share price; an investment in a money market fund is not insured or guaranteed by the U.S. government. Total returns are historical and include changes in share price, reinvestment of dividends and capital gains, and the effects of any sales charges.
Annual Report
To Visit Fidelity
For directions and hours,
please call 1-800-544-9797.
Arizona
7001 West Ray Road
Chandler, AZ
15445 N. Scottsdale Road
Scottsdale, AZ
17550 North 75th Avenue
Glendale, AZ
5330 E. Broadway Blvd
Tucson, AZ
California
815 East Birch Street
Brea, CA
1411 Chapin Avenue
Burlingame, CA
851 East Hamilton Avenue
Campbell, CA
601 Larkspur Landing Circle
Larkspur, CA
2000 Avenue of the Stars
Los Angeles, CA
27101 Puerta Real
Mission Viejo, CA
73575 El Paseo
Palm Desert, CA
251 University Avenue
Palo Alto, CA
123 South Lake Avenue
Pasadena, CA
16656 Bernardo Ctr. Drive
Rancho Bernardo, CA
1220 Roseville Parkway
Roseville, CA
1740 Arden Way
Sacramento, CA
7676 Hazard Center Drive
San Diego, CA
11943 El Camino Real
San Diego, CA
8 Montgomery Street
San Francisco, CA
3793 State Street
Santa Barbara, CA
1200 Wilshire Boulevard
Santa Monica, CA
398 West El Camino Real
Sunnyvale, CA
111 South Westlake Blvd
Thousand Oaks, CA
21701 Hawthorne Boulevard
Torrance, CA
2001 North Main Street
Walnut Creek, CA
6326 Canoga Avenue
Woodland Hills, CA
2211 Michelson Drive
Irvine, CA
Colorado
281 East Flatiron Circle
Broomfield, CO
1625 Broadway
Denver, CO
9185 Westview Road
Lone Tree, CO
Connecticut
48 West Putnam Avenue
Greenwich, CT
265 Church Street
New Haven, CT
300 Atlantic Street
Stamford, CT
29 South Main Street
West Hartford, CT
1261 Post Road
Fairfield, CT
Delaware
400 Delaware Avenue
Wilmington, DE
Florida
175 East Altamonte Drive
Altamonte Springs, FL
1400 Glades Road
Boca Raton, FL
121 Alhambra Plaza
Coral Gables, FL
2948 N. Federal Highway
Ft. Lauderdale, FL
4671 Town Center Parkway
Jacksonville, FL
8880 Tamiami Trail, North
Naples, FL
230 Royal Palm Way
Palm Beach, FL
3501 PGA Boulevard
Palm Beach Gardens, FL
3550 Tamiami Trail, South
Sarasota, FL
1502 N. Westshore Blvd.
Tampa, FL
2465 State Road 7
Wellington, FL
Georgia
3242 Peachtree Road
Atlanta, GA
1000 Abernathy Road
Atlanta, GA
Illinois
One North LaSalle Street
Chicago, IL
401 North Michigan Avenue
Chicago, IL
One Skokie Valley Road
Highland Park, IL
1415 West 22nd Street
Oak Brook, IL
15105 S LaGrange Road
Orland Park, IL
1572 East Golf Road
Schaumburg, IL
1823 Freedom Drive
Naperville, IL
Indiana
8480 Keystone Crossing
Indianapolis, IN
Kansas
5400 College Boulevard
Overland Park, KS
Maine
Three Canal Plaza
Portland, ME
Maryland
7315 Wisconsin Avenue
Bethesda, MD
610 York Road
Towson, MD
Massachusetts
801 Boylston Street
Boston, MA
155 Congress Street
Boston, MA
300 Granite Street
Braintree, MA
44 Mall Road
Burlington, MA
238 Main Street
Cambridge, MA
200 Endicott Street
Danvers, MA
Annual Report
405 Cochituate Road
Framingham, MA
551 Boston Turnpike
Shrewsbury, MA
Michigan
500 E. Eisenhower Pkwy.
Ann Arbor, MI
280 N. Old Woodward Ave.
Birmingham, MI
30200 Northwestern Hwy.
Farmington Hills, MI
43420 Grand River Avenue
Novi, MI
3480 28th Street
Grand Rapids, MI
2425 S. Linden Road STE E
Flint, MI
Minnesota
7740 France Avenue South
Edina, MN
8342 3rd Street North
Oakdale, MN
Missouri
1524 South Lindbergh Blvd.
St. Louis, MO
Nevada
2225 Village Walk Drive
Henderson, NV
New Jersey
501 Route 73 South
Marlton, NJ
150 Essex Street
Millburn, NJ
35 Morris Street
Morristown, NJ
396 Route 17, North
Paramus, NJ
3518 Route 1 North
Princeton, NJ
530 Broad Street
Shrewsbury, NJ
New Mexico
2261 Q Street NE
Albuquerque, NM
New York
1130 Franklin Avenue
Garden City, NY
37 West Jericho Turnpike
Huntington Station, NY
1271 Avenue of the Americas
New York, NY
980 Madison Avenue
New York, NY
61 Broadway
New York, NY
350 Park Avenue
New York, NY
200 Fifth Avenue
New York, NY
733 Third Avenue
New York, NY
2070 Broadway
New York, NY
1075 Northern Blvd.
Roslyn, NY
799 Central Park Avenue
Scarsdale, NY
3349 Monroe Avenue
Rochester, NY
North Carolina
4611 Sharon Road
Charlotte, NC
7011 Fayetteville Road
Durham, NC
Ohio
3805 Edwards Road
Cincinnati, OH
1324 Polaris Parkway
Columbus, OH
1800 Crocker Road
Westlake, OH
28699 Chagrin Boulevard
Woodmere Village, OH
Oregon
7493 SW Bridgeport Road
Tigard, OR
Pennsylvania
600 West DeKalb Pike
King of Prussia, PA
1735 Market Street
Philadelphia, PA
12001 Perry Highway
Wexford, PA
Rhode Island
10 Memorial Boulevard
Providence, RI
Tennessee
3018 Peoples Street
Johnson City, TN
7628 West Farmington Blvd.
Germantown, TN
2035 Mallory Lane
Franklin, TN
Texas
10000 Research Boulevard
Austin, TX
4001 Northwest Parkway
Dallas, TX
12532 Memorial Drive
Houston, TX
2701 Drexel Drive
Houston, TX
6560 Fannin Street
Houston, TX
1701 Lake Robbins Drive
The Woodlands, TX
6500 N. MacArthur Blvd.
Irving, TX
6005 West Park Boulevard
Plano, TX
1576 East Southlake Blvd.
Southlake, TX
15600 Southwest Freeway
Sugar Land, TX
139 N. Loop 1604 East
San Antonio, TX
Utah
279 West South Temple
Salt Lake City, UT
Virginia
1861 International Drive
McLean, VA
11957 Democracy Drive
Reston, VA
Washington
10500 NE 8th Street
Bellevue, WA
1518 6th Avenue
Seattle, WA
304 Strander Blvd
Tukwila, WA
Washington, DC
1900 K Street, N.W.
Washington, DC
Wisconsin
16020 West Bluemound Road
Brookfield, WI
Fidelity Brokerage Services, Inc., 100 Summer St., Boston, MA 02110 Member NYSE/SIPC
Annual Report
To Write Fidelity
We'll give your correspondence immediate attention and send you written confirmation upon completion of your request.
(letter_graphic)
Making Changes
To Your Account
(such as changing name, address, bank, etc.)
Fidelity Investments
P.O. Box 770001
Cincinnati, OH 45277-0002
(letter_graphic)
For Non-Retirement
Accounts
Buying shares
Fidelity Investments
P.O. Box 770001
Cincinnati, OH 45277-0003
Overnight Express
Fidelity Investments
Attn: Distribution Services
100 Crosby Parkway - KC1H
Covington, KY 41015
Selling shares
Fidelity Investments
P.O. Box 770001
Cincinnati, OH 45277-0035
Overnight Express
Fidelity Investments
Attn: Distribution Services
100 Crosby Parkway - KC1H
Covington, KY 41015
General Correspondence
Fidelity Investments
P.O. Box 500
Merrimack, NH 03054-0500
(letter_graphic)
For Retirement
Accounts
Buying shares
Fidelity Investments
P.O. Box 770001
Cincinnati, OH 45277-0003
Selling shares
Fidelity Investments
P.O. Box 770001
Cincinnati, OH 45277-0035
Overnight Express
Fidelity Investments
Attn: Distribution Services
100 Crosby Parkway - KC1H
Covington, KY 41015
General Correspondence
Fidelity Investments
P.O. Box 500
Merrimack, NH 03054-0500
Annual Report
Investment Adviser
Fidelity Management & Research Company
Boston, MA
Investment Sub Advisers
FMR Co., Inc.
Fidelity Research & Analysis Company
Fidelity Management & Research
(U.K.) Inc.
Fidelity Management & Research
(Hong Kong) Limited
Fidelity Management & Research
(Japan) Inc.
General Distributor
Fidelity Distributors Corporation
Boston, MA
Transfer and Service Agents
Fidelity Investments Institutional
Operations Company, Inc.
Boston, MA
Fidelity Service Company, Inc.
Boston, MA
Custodian
Citibank, N.A.,
New York, NY
The Fidelity Telephone Connection
Mutual Fund 24-Hour Service
Exchanges/Redemptions
and Account Assistance 1-800-544-6666
Product Information 1-800-544-8888
Retirement Accounts 1-800-544-4774 (8 a.m. - 9 p.m.)
TDD Service 1-800-544-0118 for the deaf and hearing impaired
(9 a.m. - 9 p.m. Eastern time)
Fidelity Automated Service
Telephone (FAST®) 1-800-544-5555
Automated line for quickest service
DGF-UANN-0910
1.789245.107
Fidelity®
Dividend Growth
Fund -
Class K
Annual Report
July 31, 2010
(2_fidelity_logos) (Registered_Trademark)
Contents
Chairman's Message | <Click Here> | The Chairman's message to shareholders. |
Performance | <Click Here> | How the fund has done over time. |
Management's Discussion of Fund Performance | <Click Here> | The Portfolio Manager's review of fund performance and strategy. |
Shareholder Expense Example | <Click Here> | An example of shareholder expenses. |
Investment Changes | <Click Here> | A summary of major shifts in the fund's investments over the past six months. |
Investments | <Click Here> | A complete list of the fund's investments with their market values. |
Financial Statements | <Click Here> | Statements of assets and liabilities, operations, and changes in net assets,
as well as financial highlights. |
Notes | <Click Here> | Notes to the financial statements. |
Report of Independent Registered Public Accounting Firm | <Click Here> | |
Trustees and Officers | <Click Here> | |
Distributions | <Click Here> | |
Board Approval of Investment Advisory Contracts and Management Fees | <Click Here> | |
To view a fund's proxy voting guidelines and proxy voting record for the 12-month period ended June 30, visit http://www.fidelity.com/proxyvotingresults or visit the Securities and Exchange Commission's (SEC) web site at http://www.sec.gov. You may also call 1-800-835-5092 to request a free copy of the proxy voting guidelines.
Standard & Poor's, S&P and S&P 500 are registered service marks of The McGraw-Hill Companies, Inc. and have been licensed for use by Fidelity Distributors Corporation.
Other third party marks appearing herein are the property of their respective owners.
All other marks appearing herein are registered or unregistered trademarks or service marks of FMR LLC or an affiliated company.
Annual Report
This report and the financial statements contained herein are submitted for the general information of the shareholders of the fund. This report is not authorized for distribution to prospective investors in the fund unless preceded or accompanied by an effective prospectus.
A fund files its complete schedule of portfolio holdings with the SEC for the first and third quarters of each fiscal year on Form N-Q. Forms N-Q are available on the SEC's web site at http://www.sec.gov. A fund's Forms N-Q may be reviewed and copied at the SEC's Public Reference Room in Washington, DC. Information regarding the operation of the SEC's Public Reference Room may be obtained by calling 1-800-SEC-0330. For a complete list of a fund's portfolio holdings, view the most recent holdings listing, semiannual report, or annual report on Fidelity's web site at http://www.fidelity.com or http://www.advisor.fidelity.com, as applicable.
NOT FDIC INSURED • MAY LOSE VALUE • NO BANK GUARANTEE
Neither the fund nor Fidelity Distributors Corporation is a bank.
Annual Report
(photo_of_Edward_C_Johnson_3d)
Dear Shareholder:
A yearlong uptrend in global equity markets reversed course in late April 2010 when investor sentiment turned bearish due in great measure to concern that Europe's debt crisis would expand and slow or derail economic recovery. However, a bounceback in July helped to recover some of the ground that was lost. Financial markets are always unpredictable, of course, but there also are several time-tested investment principles that can help put the odds in your favor.
One of the basic tenets is to invest for the long term. Over time, riding out the markets' inevitable ups and downs has proven much more effective than selling into panic or chasing the hottest trend. Even missing only a few of the markets' best days can significantly diminish investor returns. Patience also affords the benefits of compounding - of earning interest on additional income or reinvested dividends and capital gains. There can be tax advantages and cost benefits to consider as well. While staying the course doesn't eliminate risk, it can considerably lessen the effect of short-term declines.
You can further manage your investing risk through diversification. And today, more than ever, geographic diversification should be taken into account. Studies indicate that asset allocation is the single most important determinant of a portfolio's long-term success. The right mix of stocks, bonds and cash - aligned to your particular risk tolerance and investment objective - is very important. Age-appropriate rebalancing is also an essential aspect of asset allocation. For younger investors, an emphasis on equities - which historically have been the best-performing asset class over time - is encouraged. As investors near their specific goal, such as retirement or sending a child to college, consideration may be given to replacing volatile assets (e.g. common stocks) with more-stable fixed investments (bonds or savings plans).
A third principle - investing regularly - can help lower the average cost of your purchases. Investing a certain amount of money each month or quarter helps ensure you won't pay for all your shares at market highs. This strategy - known as dollar cost averaging - also reduces "emotion" from investing, helping shareholders avoid selling weak performers just prior to an upswing, or chasing a hot performer just before a correction.
We invite you to contact us via the Internet, through our Investor Centers or by phone. It is our privilege to provide you the information you need to make the investments that are right for you.
Sincerely,
(The chairman's signature appears here.)
Edward C. Johnson 3d
Annual Report
Average annual total return reflects the change in the value of an investment, assuming reinvestment of the class' distributions from dividend income and capital gains (the profits earned upon the sale of securities that have grown in value, if any) and assuming a constant rate of performance each year. The $10,000 table and the fund's returns do not reflect the deduction of taxes that a shareholder would pay on fund distributions or the redemption of fund shares. During periods of reimbursement by Fidelity, a fund's total return will be greater than it would be had the reimbursement not occurred. How a fund did yesterday is no guarantee of how it will do tomorrow.
Average Annual Total Returns
Periods ended July 31, 2010 | Past 1
year | Past 5
years | Past 10
years |
Class K A | 18.86% | 0.65% | 0.97% |
A The initial offering of Class K shares took place on May 9, 2008. Returns prior to May 9, 2008 are those of Fidelity Dividend Growth Fund, the original class of the fund.
$10,000 Over 10 Years
Let's say hypothetically that $10,000 was invested in Fidelity Dividend Growth Fund - Class K, a class of the fund, on July 31, 2000. The chart shows how the value of your investment would have changed, and also shows how the S&P 500® Index performed over the same period. The initial offering of Class K took place on May 9, 2008. See above for additional information regarding the performance of Class K.
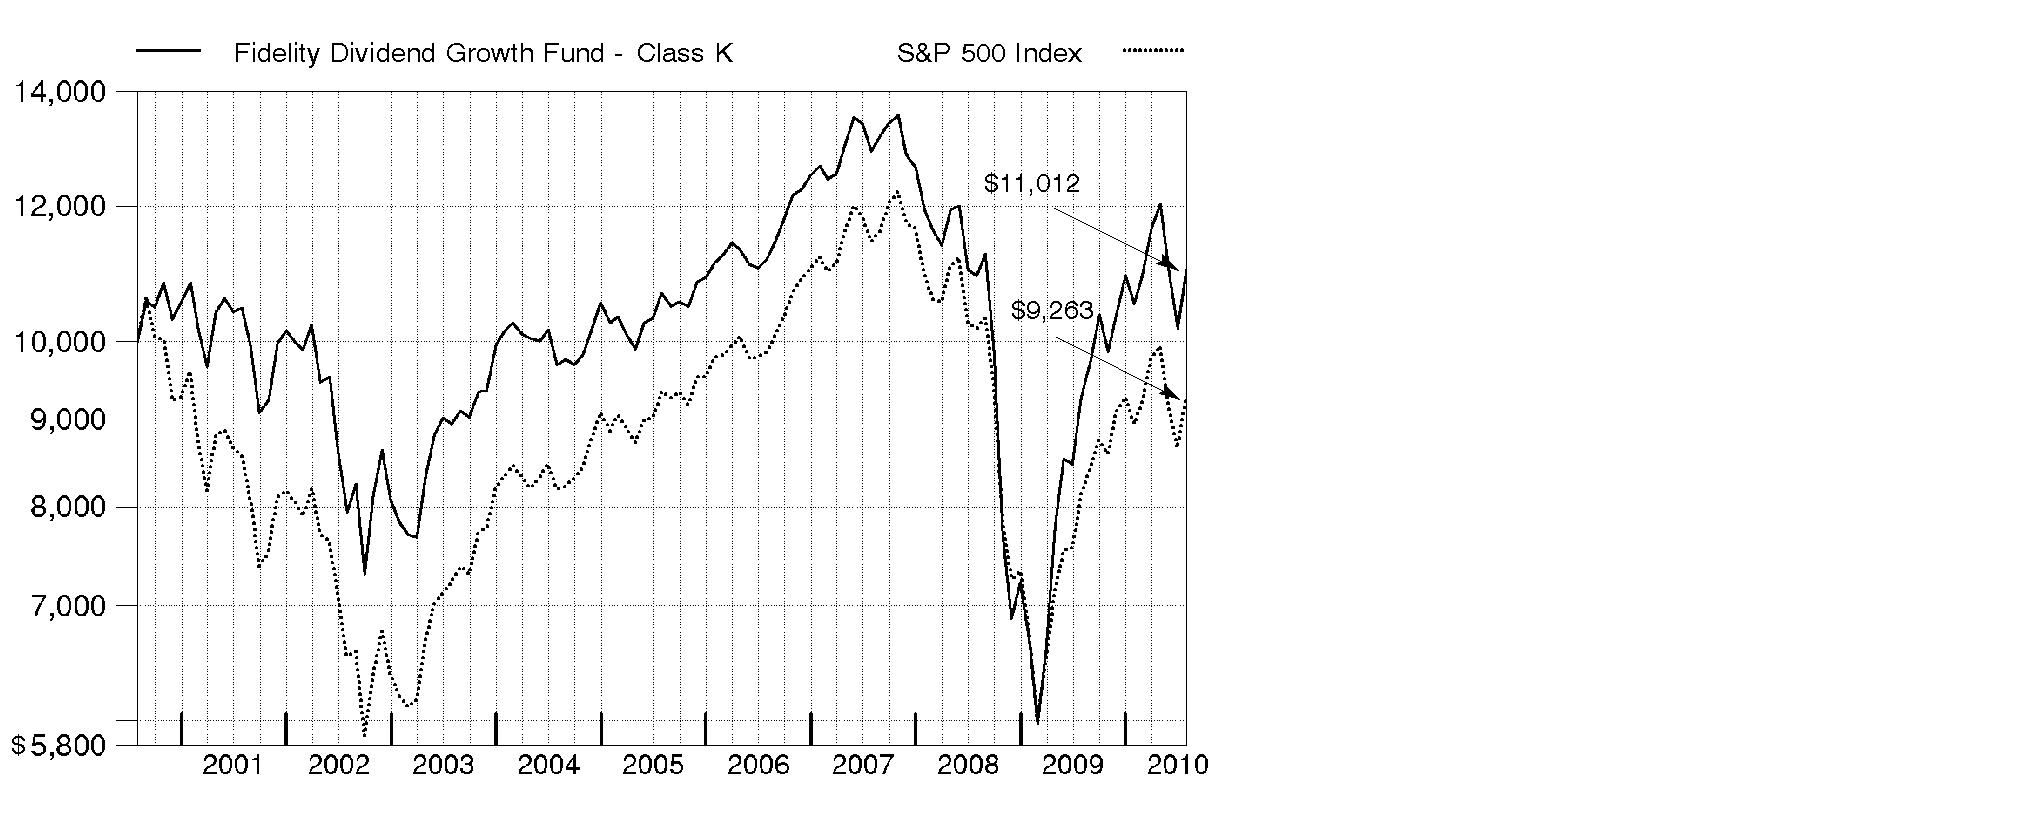
Annual Report
Market Recap: U.S. stock markets saw double-digit gains for the year ending July 31, 2010, despite the return of market volatility and risk aversion during the first half of 2010. An impressive bull run continued through 2009, bolstered by improvement in the economy and credit markets. Early in the new year, however, stocks fell sharply amid concerns about the global economic recovery, fueled by European debt woes and China's efforts to restrain inflation. After this brief dip, markets regained their upward momentum, as government stimulus and significant corporate cost cutting led to encouraging earnings reports, improved credit conditions and rising consumer confidence. Positive news continued through mid-April, when the Dow Jones Industrial AverageSM pushed above the 11,000 mark for the first time in 19 months. That milestone was short-lived, however, as heightened concern about the European debt crisis sparked an abrupt sell-off in May, leading to the first official correction since the rally began in March 2009. Although the market's malaise continued through June, stocks saw solid gains in July. For the year, the Dow rose 17.28%, while the S&P 500® Index was up 13.84%. Elsewhere, the technology-laden Nasdaq Composite® Index returned 14.99%. Small- and mid-cap stocks performed best, as measured by the 18.43% increase of the Russell 2000® Index and the 23.21% gain of the Russell Midcap® Index.
Comments from Lawrence Rakers, Portfolio Manager of Fidelity® Dividend Growth Fund: During the past year, the fund's Class K shares posted an 18.86% return, handily outpacing the S&P 500®. Versus the index, stock and industry positioning in financials made meaningful contributions. In materials, several strong-performing out-of-index positions were particularly beneficial. Favorable picks and a slight underweighting in the relatively weak-performing health care sector also helped. From a market-capitalization perspective, big overweightings in small- and mid-cap companies - those under $10 billion - bolstered results. At the stock level, underweighting energy giant and index heavyweight Exxon Mobil contributed, as the stock posted a double-digit loss. Bank holding PNC Financial Services Group added value, as did an out-of-index position in Brigham Exploration, a crude oil and natural gas exploration and production holding that I sold, and hospitality company Wyndham Worldwide. Not owning health care products provider Johnson & Johnson, a poorly performing benchmark constituent, also helped. Conversely, underweighting smart phone and computer maker Apple, a strong-performing index component, worked against us, along with disappointing out-of-index positions in natural gas producer Petrohawk Energy and energy services provider Weatherford International. Underweighting industrial conglomerate General Electric while the stock was enjoying a sharp advance also detracted.
The views expressed above reflect those of the portfolio manager(s) only through the end of the period as stated on the cover of this report and do not necessarily represent the views of Fidelity or any other person in the Fidelity organization. Any such views are subject to change at any time based upon market or other conditions and Fidelity disclaims any responsibility to update such views. These views may not be relied on as investment advice and, because investment decisions for a Fidelity fund are based on numerous factors, may not be relied on as an indication of trading intent on behalf of any Fidelity fund.
Annual Report
Shareholder Expense Example
As a shareholder of the Fund, you incur two types of costs: (1) transaction costs, and (2) ongoing costs, including management fees and other Fund expenses. This Example is intended to help you understand your ongoing costs (in dollars) of investing in the Fund and to compare these costs with the ongoing costs of investing in other mutual funds.
The Example is based on an investment of $1,000 invested at the beginning of the period and held for the entire period (February 1, 2010 to July 31, 2010).
Actual Expenses
The first line of the accompanying table for each class of the Fund provides information about actual account values and actual expenses. You may use the information in this line, together with the amount you invested, to estimate the expenses that you paid over the period. Simply divide your account value by $1,000.00 (for example, an $8,600 account value divided by $1,000.00 = 8.6), then multiply the result by the number in the first line for a class of the Fund under the heading entitled "Expenses Paid During Period" to estimate the expenses you paid on your account during this period. A small balance maintenance fee of $12.00 that is charged once a year may apply for certain accounts with a value of less than $2,000. This fee is not included in the table below. If it was, the estimate of expenses you paid during the period would be higher, and your ending account value lower, by this amount. In addition, the Fund, as a shareholder in the underlying Fidelity Central Funds, will indirectly bear its pro-rata share of the fees and expenses incurred by the underlying Fidelity Central Funds. These fees and expenses are not included in the Fund's annualized expense ratio used to calculate the expense estimate in the table below.
Hypothetical Example for Comparison Purposes
The second line of the accompanying table for each class of the Fund provides information about hypothetical account values and hypothetical expenses based on a Class' actual expense ratio and an assumed rate of return of 5% per year before expenses, which is not the Class' actual return. The hypothetical account values and expenses may not be used to estimate the actual ending account balance or expenses you paid for the period. You may use this information to compare the ongoing costs of investing in the Fund and other funds. To do so, compare this 5% hypothetical example with the 5% hypothetical examples that appear in the shareholder reports of the other funds. A small balance maintenance fee of $12.00 that is charged once a year may apply for certain accounts with a value of less than $2,000. This fee is not included in the table below. If it was, the estimate of expenses you paid during the period would be higher, and your ending account value lower, by this amount. In addition, the Fund, as a shareholder in the underlying Fidelity Central Funds, will indirectly bear its pro-rata share of the fees and expenses incurred by the underlying Fidelity Central Funds. These fees and expenses are not included in the Fund's annualized expense ratio used to calculate the expense estimate in the table below.
Please note that the expenses shown in the table are meant to highlight your ongoing costs only and do not reflect any transaction costs. Therefore, the second line of the table is useful in comparing ongoing costs only, and will not help you determine the relative total costs of owning different funds.
Annual Report
| Annualized
Expense Ratio | Beginning
Account Value
February 1, 2010 | Ending
Account Value
July 31, 2010 | Expenses Paid
During Period*
February 1, 2010
to July 31, 2010 |
Dividend Growth | .94% | | | |
Actual | | $ 1,000.00 | $ 1,046.10 | $ 4.77 |
HypotheticalA | | $ 1,000.00 | $ 1,020.13 | $ 4.71 |
Class K | .73% | | | |
Actual | | $ 1,000.00 | $ 1,047.40 | $ 3.71 |
HypotheticalA | | $ 1,000.00 | $ 1,021.17 | $ 3.66 |
A 5% return per year before expenses
* Expenses are equal to each Class' annualized expense ratio, multiplied by the average account value over the period, multiplied by 181/365 (to reflect the one-half year period).
Annual Report
Investment Changes (Unaudited)
Top Ten Stocks as of July 31, 2010 |
| % of fund's
net assets | % of fund's net assets
6 months ago |
Apple, Inc. | 2.2 | 0.1 |
Wells Fargo & Co. | 1.9 | 2.5 |
JPMorgan Chase & Co. | 1.8 | 1.8 |
General Electric Co. | 1.6 | 0.0 |
Cisco Systems, Inc. | 1.3 | 1.4 |
Bank of America Corp. | 1.2 | 1.6 |
Hewlett-Packard Co. | 1.1 | 1.2 |
Merck & Co., Inc. | 1.1 | 1.2 |
Lam Research Corp. | 1.0 | 0.9 |
Oracle Corp. | 0.9 | 0.4 |
| 14.1 | |
Top Five Market Sectors as of July 31, 2010 |
| % of fund's
net assets | % of fund's net assets
6 months ago |
Financials | 17.5 | 18.3 |
Information Technology | 17.4 | 17.0 |
Industrials | 13.9 | 10.2 |
Energy | 11.2 | 11.4 |
Consumer Discretionary | 10.4 | 9.9 |
Asset Allocation (% of fund's net assets) |
As of July 31, 2010* | As of January 31, 2010** |
| Stocks and
Investment
Companies 97.7% | | | Stocks and
Investment
Companies 97.6% | |
| Bonds 0.3% | | | Bonds 0.3% | |
| Convertible
Securities 1.3% | | | Convertible
Securities 1.6% | |
| Short-Term
Investments and
Net Other Assets 0.7% | | | Short-Term
Investments and
Net Other Assets 0.5% | |
* Foreign investments | 16.6% | | ** Foreign investments | 15.6% | |

Annual Report
Investments July 31, 2010
Showing Percentage of Net Assets
Common Stocks - 97.4% |
| Shares | | Value (000s) |
CONSUMER DISCRETIONARY - 10.4% |
Auto Components - 0.3% |
Stoneridge, Inc. (a) | 950,982 | | $ 10,185 |
Tenneco, Inc. (a) | 365,528 | | 10,089 |
The Goodyear Tire & Rubber Co. (a) | 203,014 | | 2,166 |
| | 22,440 |
Automobiles - 0.7% |
Bayerische Motoren Werke AG (BMW) | 154,323 | | 8,309 |
Fiat SpA | 166,500 | | 2,133 |
Harley-Davidson, Inc. | 176,487 | | 4,806 |
Mazda Motor Corp. | 2,500,000 | | 6,046 |
Thor Industries, Inc. | 562,046 | | 15,647 |
Winnebago Industries, Inc. (a)(e)(f) | 1,556,036 | | 16,261 |
| | 53,202 |
Diversified Consumer Services - 0.3% |
Service Corp. International | 1,072,000 | | 9,133 |
Stewart Enterprises, Inc. Class A | 2,318,532 | | 12,451 |
Universal Technical Institute, Inc. | 296,159 | | 6,033 |
| | 27,617 |
Hotels, Restaurants & Leisure - 2.3% |
Accor SA | 121,834 | | 3,947 |
Ameristar Casinos, Inc. | 256,918 | | 4,054 |
Bally Technologies, Inc. (a) | 356,387 | | 11,511 |
Brinker International, Inc. | 1,088,764 | | 17,115 |
China Lodging Group Ltd. ADR (e) | 243,900 | | 4,512 |
DineEquity, Inc. (a)(e) | 853,349 | | 31,113 |
International Game Technology | 511,712 | | 7,798 |
NH Hoteles SA (a) | 2,119,573 | | 8,592 |
O'Charleys, Inc. (a)(f) | 1,311,500 | | 9,141 |
Sol Melia SA | 767,567 | | 6,418 |
Sonic Corp. (a) | 528,081 | | 4,647 |
The Cheesecake Factory, Inc. (a) | 81,300 | | 1,906 |
WMS Industries, Inc. (a) | 634,600 | | 24,438 |
Wyndham Worldwide Corp. | 2,069,515 | | 52,835 |
| | 188,027 |
Household Durables - 0.8% |
Ethan Allen Interiors, Inc. | 155,200 | | 2,381 |
Gafisa SA sponsored ADR | 522,600 | | 7,912 |
La-Z-Boy, Inc. (a) | 150,300 | | 1,287 |
Newell Rubbermaid, Inc. | 367,400 | | 5,695 |
Pulte Group, Inc. (a) | 1,018,282 | | 8,941 |
Common Stocks - continued |
| Shares | | Value (000s) |
CONSUMER DISCRETIONARY - continued |
Household Durables - continued |
Stanley Black & Decker, Inc. | 440,501 | | $ 25,558 |
Techtronic Industries Co. Ltd. | 4,062,000 | | 3,352 |
Tempur-Pedic International, Inc. (a) | 297,100 | | 9,112 |
| | 64,238 |
Internet & Catalog Retail - 0.1% |
Expedia, Inc. | 300,490 | | 6,815 |
Media - 2.6% |
CC Media Holdings, Inc. Class A (a) | 1,200,000 | | 7,800 |
Comcast Corp.: | | | |
Class A | 51,870 | | 1,010 |
Class A (special) (non-vtg.) | 2,065,543 | | 38,130 |
Informa PLC | 1,664,921 | | 10,247 |
Interpublic Group of Companies, Inc. (a) | 527,997 | | 4,826 |
Lamar Advertising Co. Class A (a) | 336,011 | | 9,190 |
Liberty Media Corp. Starz Series A (a) | 209,479 | | 11,498 |
McGraw-Hill Companies, Inc. | 460,900 | | 14,145 |
MDC Partners, Inc. Class A (sub. vtg.) | 1,398,539 | | 17,244 |
SuperMedia, Inc. (a)(e) | 231,513 | | 4,883 |
The Walt Disney Co. | 660,115 | | 22,239 |
Time Warner Cable, Inc. | 761,826 | | 43,554 |
United Business Media Ltd. | 623,900 | | 5,387 |
Valassis Communications, Inc. (a) | 113,713 | | 3,931 |
Viacom, Inc. Class B (non-vtg.) | 193,867 | | 6,405 |
Virgin Media, Inc. | 223,077 | | 4,803 |
Wolters Kluwer NV (Certificaten Van Aandelen) | 422,400 | | 8,522 |
| | 213,814 |
Multiline Retail - 0.6% |
Target Corp. | 897,638 | | 46,067 |
Specialty Retail - 2.5% |
Advance Auto Parts, Inc. | 485,400 | | 25,983 |
AnnTaylor Stores Corp. (a) | 434,499 | | 7,621 |
Asbury Automotive Group, Inc. (a) | 432,400 | | 5,820 |
Best Buy Co., Inc. | 421,495 | | 14,609 |
Big 5 Sporting Goods Corp. | 510,000 | | 7,007 |
Carphone Warehouse Group PLC (a) | 1,419,949 | | 5,122 |
Casual Male Retail Group, Inc. (a) | 2,353,500 | | 8,143 |
Collective Brands, Inc. (a) | 73,100 | | 1,171 |
Foot Locker, Inc. | 568,559 | | 7,727 |
Hengdeli Holdings Ltd. | 25,940,000 | | 11,889 |
Home Depot, Inc. | 382,368 | | 10,901 |
Common Stocks - continued |
| Shares | | Value (000s) |
CONSUMER DISCRETIONARY - continued |
Specialty Retail - continued |
Lowe's Companies, Inc. | 1,895,854 | | $ 39,320 |
Lumber Liquidators Holdings, Inc. (a)(e) | 236,797 | | 5,877 |
MarineMax, Inc. (a) | 555,800 | | 4,224 |
OfficeMax, Inc. (a) | 919,756 | | 13,143 |
Sally Beauty Holdings, Inc. (a) | 995,281 | | 9,415 |
Staples, Inc. | 965,707 | | 19,633 |
West Marine, Inc. (a) | 125,903 | | 1,307 |
| | 198,912 |
Textiles, Apparel & Luxury Goods - 0.2% |
Bosideng International Holdings Ltd. | 1,218,000 | | 376 |
G-III Apparel Group Ltd. (a) | 173,502 | | 4,476 |
Peak Sport Products Co. Ltd. | 1,218,000 | | 853 |
Phillips-Van Heusen Corp. | 229,800 | | 11,924 |
| | 17,629 |
TOTAL CONSUMER DISCRETIONARY | | 838,761 |
CONSUMER STAPLES - 8.6% |
Beverages - 1.4% |
Anheuser-Busch InBev SA NV | 318,950 | | 16,892 |
Carlsberg AS Series B | 112,000 | | 9,932 |
Dr Pepper Snapple Group, Inc. | 342,587 | | 12,864 |
Molson Coors Brewing Co. Class B | 172,705 | | 7,773 |
The Coca-Cola Co. | 1,149,494 | | 63,349 |
| | 110,810 |
Food & Staples Retailing - 2.8% |
CVS Caremark Corp. | 1,051,897 | | 32,283 |
Drogasil SA | 113,700 | | 2,366 |
Kroger Co. | 2,694,640 | | 57,072 |
PriceSmart, Inc. | 331,383 | | 9,279 |
Susser Holdings Corp. (a) | 101,554 | | 1,220 |
Sysco Corp. | 714,121 | | 22,116 |
Wal-Mart Stores, Inc. | 1,104,963 | | 56,563 |
Walgreen Co. | 1,018,718 | | 29,084 |
Winn-Dixie Stores, Inc. (a) | 1,720,396 | | 16,877 |
| | 226,860 |
Food Products - 1.8% |
Ausnutria Dairy Hunan Co. Ltd. Class H | 12,992,000 | | 7,861 |
Bunge Ltd. | 12,200 | | 606 |
Common Stocks - continued |
| Shares | | Value (000s) |
CONSUMER STAPLES - continued |
Food Products - continued |
Calavo Growers, Inc. | 394,332 | | $ 8,328 |
Chiquita Brands International, Inc. (a) | 398,078 | | 5,844 |
Diamond Foods, Inc. | 96,700 | | 4,307 |
Kellogg Co. | 205,911 | | 10,306 |
Kerry Group PLC Class A | 80,972 | | 2,575 |
Leroy Seafood Group ASA | 29,868 | | 612 |
M. Dias Branco SA | 12,100 | | 274 |
Marine Harvest ASA | 52,008,379 | | 39,211 |
Nestle SA | 390,315 | | 19,299 |
Ralcorp Holdings, Inc. (a) | 39,090 | | 2,283 |
Seneca Foods Group Class A (a) | 20,299 | | 621 |
Smithfield Foods, Inc. (a) | 1,843,400 | | 26,268 |
Tingyi (Cayman Islands) Holding Corp. | 2,414,000 | | 6,122 |
TreeHouse Foods, Inc. (a) | 33,900 | | 1,617 |
Unilever NV (Certificaten Van Aandelen) (Bearer) unit | 450,300 | | 13,246 |
| | 149,380 |
Household Products - 1.1% |
Energizer Holdings, Inc. (a) | 217,987 | | 13,411 |
Kimberly-Clark Corp. | 170,557 | | 10,936 |
Procter & Gamble Co. | 1,084,753 | | 66,343 |
| | 90,690 |
Personal Products - 0.6% |
Avon Products, Inc. | 720,428 | | 22,427 |
BaWang International (Group) Holding Ltd. | 18,804,000 | | 11,475 |
Hengan International Group Co. Ltd. | 1,154,500 | | 9,943 |
Herbalife Ltd. | 113,300 | | 5,624 |
| | 49,469 |
Tobacco - 0.9% |
Imperial Tobacco Group PLC | 247,779 | | 7,011 |
Lorillard, Inc. | 121,525 | | 9,265 |
Philip Morris International, Inc. | 1,042,800 | | 53,225 |
| | 69,501 |
TOTAL CONSUMER STAPLES | | 696,710 |
ENERGY - 10.9% |
Energy Equipment & Services - 3.6% |
Aker Solutions ASA | 699,697 | | 9,072 |
Baker Hughes, Inc. | 972,566 | | 46,946 |
Common Stocks - continued |
| Shares | | Value (000s) |
ENERGY - continued |
Energy Equipment & Services - continued |
Global Industries Ltd. (a) | 1,068,176 | | $ 5,063 |
Halliburton Co. | 895,250 | | 26,750 |
Helix Energy Solutions Group, Inc. (a) | 1,413,863 | | 13,276 |
ION Geophysical Corp. (a) | 1,871,858 | | 8,217 |
National Oilwell Varco, Inc. | 1,261,070 | | 49,384 |
Noble Corp. | 384,508 | | 12,497 |
Schlumberger Ltd. | 707,344 | | 42,200 |
Smith International, Inc. | 311,277 | | 12,912 |
Superior Energy Services, Inc. (a) | 109,700 | | 2,500 |
Superior Well Services, Inc. (a)(e) | 296,050 | | 5,498 |
Transocean Ltd. (a) | 197,776 | | 9,139 |
Union Drilling, Inc. (a) | 584,843 | | 3,468 |
Vantage Drilling Co. (a) | 5,143,000 | | 6,840 |
Weatherford International Ltd. (a) | 2,494,761 | | 40,415 |
| | 294,177 |
Oil, Gas & Consumable Fuels - 7.3% |
Anadarko Petroleum Corp. | 463,017 | | 22,762 |
Apache Corp. | 352,229 | | 33,666 |
Arch Coal, Inc. | 308,305 | | 7,304 |
Berry Petroleum Co. Class A | 743,300 | | 22,165 |
BP PLC sponsored ADR | 700,300 | | 26,941 |
Chesapeake Energy Corp. | 1,082,597 | | 22,767 |
Chevron Corp. | 65,005 | | 4,954 |
Compton Petroleum Corp. (a) | 2,385,100 | | 1,230 |
Concho Resources, Inc. (a) | 136,931 | | 8,213 |
Concho Resources, Inc. (a)(h) | 230,820 | | 12,460 |
Denbury Resources, Inc. (a) | 1,070,040 | | 16,949 |
EOG Resources, Inc. | 284,700 | | 27,758 |
EXCO Resources, Inc. | 731,863 | | 10,619 |
Exxon Mobil Corp. | 328,592 | | 19,610 |
Heritage Oil PLC (a) | 324,900 | | 2,091 |
Holly Corp. | 342,399 | | 9,152 |
International Coal Group, Inc. (a)(e) | 2,349,935 | | 10,575 |
InterOil Corp. (a)(e) | 128,700 | | 7,722 |
Marathon Oil Corp. | 566,106 | | 18,936 |
Massey Energy Co. | 634,129 | | 19,392 |
Niko Resources Ltd. | 64,700 | | 6,979 |
Northern Oil & Gas, Inc. (a)(e) | 2,171,695 | | 31,880 |
Occidental Petroleum Corp. | 195,247 | | 15,216 |
OPTI Canada, Inc. (a) | 6,807,000 | | 10,926 |
Common Stocks - continued |
| Shares | | Value (000s) |
ENERGY - continued |
Oil, Gas & Consumable Fuels - continued |
OPTI Canada, Inc. (a)(g) | 2,661,400 | | $ 4,272 |
Pan Orient Energy Corp. (a) | 938,500 | | 5,478 |
PetroBakken Energy Ltd. Class A (e) | 573,626 | | 12,584 |
Petrohawk Energy Corp. (a) | 2,823,438 | | 44,526 |
Petroplus Holdings AG | 511,750 | | 7,930 |
Plains Exploration & Production Co. (a) | 3,028,322 | | 68,289 |
Southwestern Energy Co. (a) | 754,637 | | 27,507 |
Suncor Energy, Inc. | 423,100 | | 13,949 |
Sunoco, Inc. | 247,700 | | 8,835 |
Talisman Energy, Inc. | 586,900 | | 10,020 |
Valero Energy Corp. | 876,361 | | 14,889 |
| | 588,546 |
TOTAL ENERGY | | 882,723 |
FINANCIALS - 16.9% |
Capital Markets - 2.4% |
AllianceBernstein Holding LP | 155,300 | | 4,143 |
Bank of New York Mellon Corp. | 940,752 | | 23,585 |
Bank Sarasin & Co. Ltd. Series B (Reg.) | 200,299 | | 7,423 |
BlueBay Asset Management | 1,397,468 | | 6,159 |
Charles Schwab Corp. | 420,069 | | 6,213 |
GCA Savvian Group Corp. (a) | 3,249 | | 3,308 |
Goldman Sachs Group, Inc. | 384,886 | | 58,049 |
Janus Capital Group, Inc. | 643,400 | | 6,743 |
Morgan Stanley | 1,882,624 | | 50,812 |
Northern Trust Corp. | 154,821 | | 7,275 |
State Street Corp. | 450,238 | | 17,523 |
TD Ameritrade Holding Corp. (a) | 182,517 | | 2,873 |
| | 194,106 |
Commercial Banks - 4.9% |
Agricultural Bank of China (H Shares) | 9,336,000 | | 4,207 |
Associated Banc-Corp. | 1,373,043 | | 18,660 |
Banco Do Brasil SA | 288,000 | | 4,979 |
CapitalSource, Inc. | 5,651,145 | | 30,403 |
CIT Group, Inc. (a) | 133,988 | | 4,872 |
Huntington Bancshares, Inc. | 2,484,600 | | 15,057 |
Itau Unibanco Banco Multiplo SA ADR (g) | 253,800 | | 5,683 |
Mitsubishi UFJ Financial Group, Inc. | 4,360,200 | | 21,593 |
Mizuho Financial Group, Inc. | 4,564,700 | | 7,397 |
Common Stocks - continued |
| Shares | | Value (000s) |
FINANCIALS - continued |
Commercial Banks - continued |
PNC Financial Services Group, Inc. | 1,206,042 | | $ 71,627 |
Regions Financial Corp. | 1,141,747 | | 8,369 |
SunTrust Banks, Inc. | 422,400 | | 10,961 |
Susquehanna Bancshares, Inc., Pennsylvania | 182,800 | | 1,581 |
SVB Financial Group (a) | 422,500 | | 18,248 |
Wells Fargo & Co. | 5,705,841 | | 158,223 |
Wilmington Trust Corp., Delaware | 1,477,790 | | 14,985 |
| | 396,845 |
Consumer Finance - 0.7% |
American Express Co. | 398,004 | | 17,767 |
Capital One Financial Corp. | 285,600 | | 12,089 |
Discover Financial Services | 951,232 | | 14,525 |
ORIX Corp. | 65,660 | | 5,166 |
SLM Corp. (a) | 357,433 | | 4,289 |
| | 53,836 |
Diversified Financial Services - 4.6% |
Bank of America Corp. | 6,883,220 | | 96,640 |
BM&F BOVESPA SA | 1,479,200 | | 10,935 |
Citigroup, Inc. (a) | 16,163,680 | | 66,271 |
Deutsche Boerse AG | 128,642 | | 9,007 |
JPMorgan Chase & Co. | 3,648,624 | | 146,967 |
PICO Holdings, Inc. (a)(f) | 1,240,314 | | 38,871 |
| | 368,691 |
Insurance - 1.8% |
Aegon NV (a) | 1,379,227 | | 8,286 |
Allstate Corp. | 16,100 | | 455 |
Assured Guaranty Ltd. | 1,262,840 | | 19,827 |
Axis Capital Holdings Ltd. | 36,544 | | 1,139 |
Delphi Financial Group, Inc. Class A | 328,935 | | 8,536 |
Endurance Specialty Holdings Ltd. | 226,900 | | 8,756 |
Everest Re Group Ltd. | 145,500 | | 11,294 |
Genworth Financial, Inc. Class A (a) | 2,000,600 | | 27,168 |
Lincoln National Corp. | 685,850 | | 17,860 |
Maiden Holdings Ltd. | 692,542 | | 4,751 |
MBIA, Inc. (a)(e) | 1,777,500 | | 15,429 |
Old Republic International Corp. | 356,169 | | 4,456 |
Platinum Underwriters Holdings Ltd. | 172,000 | | 6,722 |
Protective Life Corp. | 539,000 | | 12,122 |
| | 146,801 |
Common Stocks - continued |
| Shares | | Value (000s) |
FINANCIALS - continued |
Real Estate Investment Trusts - 1.1% |
Boston Properties, Inc. | 60,991 | | $ 4,995 |
CBL & Associates Properties, Inc. | 633,200 | | 8,909 |
Education Realty Trust, Inc. | 423,700 | | 2,945 |
Franklin Street Properties Corp. | 606,400 | | 7,404 |
ProLogis Trust | 928,100 | | 10,079 |
Public Storage | 133,419 | | 13,091 |
Segro PLC | 1,035,273 | | 4,546 |
SL Green Realty Corp. | 299,600 | | 18,048 |
The Macerich Co. | 125,654 | | 5,208 |
U-Store-It Trust | 568,200 | | 4,585 |
Vornado Realty Trust | 129,638 | | 10,731 |
Westfield Group unit | 168,768 | | 1,865 |
| | 92,406 |
Real Estate Management & Development - 1.4% |
CB Richard Ellis Group, Inc. Class A (a) | 4,274,600 | | 72,668 |
Forest City Enterprises, Inc. Class A (a) | 12,196 | | 155 |
Iguatemi Empresa de Shopping Centers SA | 444,800 | | 8,843 |
Jones Lang LaSalle, Inc. | 267,100 | | 20,690 |
Kenedix, Inc. (a) | 46,567 | | 7,802 |
Unite Group PLC (a) | 873,814 | | 2,600 |
| | 112,758 |
Thrifts & Mortgage Finance - 0.0% |
Bank Mutual Corp. | 491,235 | | 2,888 |
Ocwen Financial Corp. (a) | 32,534 | | 344 |
| | 3,232 |
TOTAL FINANCIALS | | 1,368,675 |
HEALTH CARE - 9.4% |
Biotechnology - 2.8% |
Alexion Pharmaceuticals, Inc. (a) | 126,500 | | 6,877 |
Allos Therapeutics, Inc. (a) | 610,000 | | 2,940 |
Amgen, Inc. (a) | 750,259 | | 40,912 |
Amylin Pharmaceuticals, Inc. (a) | 436,570 | | 8,260 |
ARIAD Pharmaceuticals, Inc. (a) | 1,734,479 | | 5,550 |
Biogen Idec, Inc. (a) | 259,822 | | 14,519 |
Cephalon, Inc. (a) | 145,400 | | 8,251 |
China Biologic Products, Inc. (a)(e) | 512,400 | | 6,548 |
Clinical Data, Inc. (a) | 780,409 | | 10,879 |
Genzyme Corp. (a) | 308,844 | | 21,483 |
Common Stocks - continued |
| Shares | | Value (000s) |
HEALTH CARE - continued |
Biotechnology - continued |
Gilead Sciences, Inc. (a) | 142,200 | | $ 4,738 |
Human Genome Sciences, Inc. (a) | 555,400 | | 14,407 |
ImmunoGen, Inc. (a) | 295,200 | | 2,784 |
InterMune, Inc. (a) | 170,606 | | 1,665 |
Micromet, Inc. (a) | 963,800 | | 6,602 |
Neurocrine Biosciences, Inc. (a) | 832,600 | | 4,729 |
NPS Pharmaceuticals, Inc. (a) | 562,210 | | 3,890 |
OREXIGEN Therapeutics, Inc. (a)(e) | 2,006,657 | | 10,435 |
PDL BioPharma, Inc. | 1,011,700 | | 6,293 |
Protalix BioTherapeutics, Inc. (a)(e) | 846,481 | | 5,528 |
SIGA Technologies, Inc. (a)(e) | 1,307,624 | | 10,958 |
Theravance, Inc. (a) | 1,065,461 | | 15,779 |
United Therapeutics Corp. (a) | 225,400 | | 11,020 |
ZIOPHARM Oncology, Inc. (a) | 946,152 | | 3,539 |
| | 228,586 |
Health Care Equipment & Supplies - 1.7% |
AGA Medical Holdings, Inc. | 528,700 | | 7,661 |
C. R. Bard, Inc. | 270,130 | | 21,213 |
Cooper Companies, Inc. | 105,600 | | 4,104 |
Covidien PLC | 326,127 | | 12,171 |
Hill-Rom Holdings, Inc. | 300,500 | | 9,929 |
Hologic, Inc. (a) | 308,600 | | 4,364 |
Kinetic Concepts, Inc. (a) | 227,325 | | 8,072 |
Orthofix International NV (a) | 326,188 | | 9,877 |
Orthovita, Inc. (a) | 1,391,500 | | 2,574 |
St. Jude Medical, Inc. (a) | 262,849 | | 9,665 |
Stryker Corp. | 305,500 | | 14,227 |
Symmetry Medical, Inc. (a) | 767,751 | | 7,470 |
William Demant Holding AS (a) | 135,454 | | 9,927 |
Wright Medical Group, Inc. (a) | 649,608 | | 10,140 |
Zimmer Holdings, Inc. (a) | 101,500 | | 5,378 |
| | 136,772 |
Health Care Providers & Services - 2.1% |
Brookdale Senior Living, Inc. (a) | 1,149,700 | | 16,303 |
CIGNA Corp. | 1,021,800 | | 31,431 |
Emeritus Corp. (a) | 283,281 | | 4,875 |
Express Scripts, Inc. (a) | 831,500 | | 37,567 |
LHC Group, Inc. (a) | 142,200 | | 3,269 |
McKesson Corp. | 233,406 | | 14,663 |
Medco Health Solutions, Inc. (a) | 523,356 | | 25,121 |
Common Stocks - continued |
| Shares | | Value (000s) |
HEALTH CARE - continued |
Health Care Providers & Services - continued |
MEDNAX, Inc. (a) | 156,480 | | $ 7,378 |
Quest Diagnostics, Inc. | 316,647 | | 14,879 |
RehabCare Group, Inc. (a) | 205,678 | | 4,358 |
VCA Antech, Inc. (a) | 325,800 | | 6,790 |
| | 166,634 |
Health Care Technology - 0.0% |
Computer Programs & Systems, Inc. | 88,700 | | 3,989 |
SXC Health Solutions Corp. (a) | 12,200 | | 836 |
| | 4,825 |
Life Sciences Tools & Services - 0.2% |
Charles River Laboratories International, Inc. (a) | 178,678 | | 5,553 |
Life Technologies Corp. (a) | 155,100 | | 6,668 |
Lonza Group AG | 20,305 | | 1,577 |
PerkinElmer, Inc. | 219,300 | | 4,268 |
| | 18,066 |
Pharmaceuticals - 2.6% |
Abbott Laboratories | 252,300 | | 12,383 |
Ardea Biosciences, Inc. (a) | 684,100 | | 13,648 |
Biovail Corp. | 333,000 | | 7,273 |
Cadence Pharmaceuticals, Inc. (a)(e) | 1,608,595 | | 12,322 |
Merck & Co., Inc. | 2,507,404 | | 86,405 |
Novartis AG sponsored ADR | 185,047 | | 9,019 |
Novo Nordisk AS Series B | 194,299 | | 16,628 |
Pfizer, Inc. | 379,945 | | 5,699 |
Pronova BioPharma ASA (a) | 3,794,531 | | 9,309 |
Sanofi-Aventis | 349,005 | | 20,292 |
Teva Pharmaceutical Industries Ltd. sponsored ADR | 312,490 | | 15,265 |
| | 208,243 |
TOTAL HEALTH CARE | | 763,126 |
INDUSTRIALS - 13.8% |
Aerospace & Defense - 2.6% |
BE Aerospace, Inc. (a) | 227,300 | | 6,683 |
DigitalGlobe, Inc. (a) | 235,513 | | 6,420 |
Esterline Technologies Corp. (a) | 162,221 | | 8,327 |
European Aeronautic Defence and Space Co. EADS NV (a) | 258,000 | | 6,113 |
GeoEye, Inc. (a) | 543,850 | | 18,774 |
Goodrich Corp. | 262,977 | | 19,163 |
Common Stocks - continued |
| Shares | | Value (000s) |
INDUSTRIALS - continued |
Aerospace & Defense - continued |
Heico Corp. New Class A | 427,878 | | $ 12,357 |
Honeywell International, Inc. | 610,420 | | 26,163 |
Orbital Sciences Corp. (a) | 176,144 | | 2,579 |
Precision Castparts Corp. | 253,972 | | 31,033 |
Raytheon Co. | 422,398 | | 19,544 |
United Technologies Corp. | 805,639 | | 57,281 |
| | 214,437 |
Airlines - 0.4% |
AMR Corp. (a) | 491,263 | | 3,478 |
Delta Air Lines, Inc. (a) | 823,765 | | 9,786 |
Southwest Airlines Co. | 1,306,234 | | 15,740 |
UAL Corp. (a) | 150,172 | | 3,565 |
| | 32,569 |
Building Products - 0.4% |
Masco Corp. | 1,332,600 | | 13,699 |
Owens Corning (a) | 519,607 | | 16,357 |
| | 30,056 |
Commercial Services & Supplies - 1.5% |
Avery Dennison Corp. | 300,471 | | 10,772 |
Casella Waste Systems, Inc. Class A (a) | 591,609 | | 2,361 |
Corrections Corp. of America (a) | 190,865 | | 3,735 |
Interface, Inc. Class A | 2,004,878 | | 24,921 |
Knoll, Inc. | 695,566 | | 9,759 |
Pitney Bowes, Inc. | 186,820 | | 4,560 |
Quad/Graphics, Inc. (a) | 113,149 | | 4,813 |
R.R. Donnelley & Sons Co. | 972,100 | | 16,399 |
Republic Services, Inc. | 487,995 | | 15,548 |
Schawk, Inc. Class A | 108,332 | | 1,607 |
Steelcase, Inc. Class A | 297,346 | | 2,055 |
The Brink's Co. | 494,700 | | 10,834 |
The Geo Group, Inc. (a) | 649,733 | | 14,021 |
| | 121,385 |
Construction & Engineering - 0.9% |
Aveng Ltd. | 890,100 | | 4,395 |
Fluor Corp. | 526,027 | | 25,402 |
Foster Wheeler AG (a) | 487,350 | | 11,219 |
Granite Construction, Inc. | 318,097 | | 7,396 |
Great Lakes Dredge & Dock Corp. | 1,275,885 | | 7,145 |
Jacobs Engineering Group, Inc. (a) | 221,200 | | 8,089 |
Common Stocks - continued |
| Shares | | Value (000s) |
INDUSTRIALS - continued |
Construction & Engineering - continued |
KBR, Inc. | 432,600 | | $ 9,682 |
MasTec, Inc. (a) | 345,300 | | 3,667 |
| | 76,995 |
Electrical Equipment - 0.8% |
AMETEK, Inc. | 195,455 | | 8,653 |
Cooper Industries PLC Class A | 365,312 | | 16,494 |
Emerson Electric Co. | 129,972 | | 6,439 |
Prysmian SpA | 648,000 | | 10,963 |
Schneider Electric SA | 99,449 | | 11,471 |
Zumtobel AG | 450,805 | | 8,540 |
| | 62,560 |
Industrial Conglomerates - 2.5% |
General Electric Co. | 8,137,367 | | 131,174 |
Koninklijke Philips Electronics NV | 518,400 | | 16,118 |
Rheinmetall AG | 228,900 | | 13,703 |
Siemens AG sponsored ADR | 121,810 | | 11,863 |
Textron, Inc. | 1,270,674 | | 26,379 |
| | 199,237 |
Machinery - 2.4% |
Actuant Corp. Class A | 418,323 | | 8,626 |
ArvinMeritor, Inc. (a) | 709,600 | | 11,645 |
Briggs & Stratton Corp. | 418,432 | | 7,938 |
Bucyrus International, Inc. Class A | 168,818 | | 10,504 |
Caterpillar, Inc. | 89,346 | | 6,232 |
CLARCOR, Inc. | 12,200 | | 458 |
Commercial Vehicle Group, Inc. (a) | 557,400 | | 6,271 |
Cummins, Inc. | 305,394 | | 24,312 |
Hardinge, Inc. | 300,507 | | 2,542 |
Ingersoll-Rand Co. Ltd. | 559,024 | | 20,941 |
Navistar International Corp. (a) | 858,500 | | 44,393 |
NSK Ltd. | 1,098,000 | | 7,813 |
Pall Corp. | 219,284 | | 8,385 |
Timken Co. | 246,304 | | 8,281 |
Trinity Industries, Inc. | 324,594 | | 6,612 |
Vallourec SA | 143,566 | | 13,979 |
WABCO Holdings, Inc. (a) | 44,700 | | 1,729 |
| | 190,661 |
Professional Services - 0.4% |
Equifax, Inc. | 57,628 | | 1,806 |
Common Stocks - continued |
| Shares | | Value (000s) |
INDUSTRIALS - continued |
Professional Services - continued |
Kforce, Inc. (a) | 876,700 | | $ 11,844 |
Robert Half International, Inc. | 525,300 | | 13,227 |
Towers Watson & Co. | 73,102 | | 3,254 |
| | 30,131 |
Road & Rail - 1.7% |
Arkansas Best Corp. | 307,497 | | 6,940 |
Con-way, Inc. | 334,510 | | 11,270 |
CSX Corp. | 707,700 | | 37,310 |
Norfolk Southern Corp. | 209,366 | | 11,781 |
Saia, Inc. (a) | 767,075 | | 11,583 |
Union Pacific Corp. | 732,700 | | 54,711 |
Universal Truckload Services, Inc. (a) | 536,978 | | 8,157 |
| | 141,752 |
Trading Companies & Distributors - 0.2% |
Finning International, Inc. | 264,000 | | 5,080 |
Kaman Corp. | 356,900 | | 8,152 |
| | 13,232 |
TOTAL INDUSTRIALS | | 1,113,015 |
INFORMATION TECHNOLOGY - 17.1% |
Communications Equipment - 2.3% |
Calix Networks, Inc. (a) | 247,695 | | 2,645 |
Cisco Systems, Inc. (a) | 4,541,900 | | 104,782 |
Comverse Technology, Inc. (a) | 1,628,700 | | 12,215 |
Infinera Corp. (a) | 972,768 | | 8,804 |
Juniper Networks, Inc. (a) | 1,434,000 | | 39,837 |
QUALCOMM, Inc. | 471,400 | | 17,951 |
| | 186,234 |
Computers & Peripherals - 3.4% |
Apple, Inc. (a) | 684,158 | | 175,995 |
Hewlett-Packard Co. | 1,890,800 | | 87,052 |
HTC Corp. | 59,850 | | 1,100 |
NCR Corp. (a) | 645,230 | | 8,840 |
| | 272,987 |
Electronic Equipment & Components - 1.6% |
Agilent Technologies, Inc. (a) | 1,367,122 | | 38,184 |
Anixter International, Inc. (a) | 85,215 | | 4,118 |
Avnet, Inc. (a) | 962,385 | | 24,204 |
Common Stocks - continued |
| Shares | | Value (000s) |
INFORMATION TECHNOLOGY - continued |
Electronic Equipment & Components - continued |
Corning, Inc. | 1,500,900 | | $ 27,196 |
Keyence Corp. | 55,000 | | 12,664 |
Molex, Inc. (e) | 442,752 | | 8,727 |
Tyco Electronics Ltd. | 582,256 | | 15,721 |
| | 130,814 |
Internet Software & Services - 1.2% |
Akamai Technologies, Inc. (a) | 108,701 | | 4,170 |
DealerTrack Holdings, Inc. (a) | 230,173 | | 3,593 |
eBay, Inc. (a) | 1,051,142 | | 21,979 |
Google, Inc. Class A (a) | 70,825 | | 34,340 |
Monster Worldwide, Inc. (a) | 585,500 | | 8,033 |
NetEase.com, Inc. sponsored ADR (a) | 393,702 | | 15,079 |
Open Text Corp. (a) | 208,500 | | 8,253 |
| | 95,447 |
IT Services - 1.2% |
Acxiom Corp. (a) | 569,628 | | 8,738 |
Alliance Data Systems Corp. (a) | 226,892 | | 13,042 |
Atos Origin SA (a) | 205,101 | | 8,808 |
China Information Security Technology, Inc. (a)(e) | 385,900 | | 2,258 |
Echo Global Logistics, Inc. (e) | 4,038 | | 48 |
Fidelity National Information Services, Inc. | 467,447 | | 13,402 |
Fiserv, Inc. (a) | 123,968 | | 6,211 |
MasterCard, Inc. Class A | 80,416 | | 16,891 |
Visa, Inc. Class A | 363,700 | | 26,677 |
| | 96,075 |
Office Electronics - 0.2% |
Xerox Corp. | 2,095,477 | | 20,410 |
Semiconductors & Semiconductor Equipment - 4.7% |
Advanced Micro Devices, Inc. (a) | 995,153 | | 7,454 |
Altera Corp. | 32,500 | | 901 |
Analog Devices, Inc. | 676,100 | | 20,087 |
ASML Holding NV | 637,100 | | 20,508 |
Atmel Corp. (a) | 7,596,658 | | 39,731 |
Avago Technologies Ltd. | 1,054,200 | | 22,939 |
Cymer, Inc. (a) | 195,100 | | 6,493 |
Fairchild Semiconductor International, Inc. (a) | 2,144,417 | | 19,471 |
First Solar, Inc. (a) | 73,200 | | 9,183 |
Himax Technologies, Inc. sponsored ADR | 2,332,136 | | 7,136 |
Intersil Corp. Class A | 456,441 | | 5,185 |
Kulicke & Soffa Industries, Inc. (a) | 1,580,200 | | 10,619 |
Common Stocks - continued |
| Shares | | Value (000s) |
INFORMATION TECHNOLOGY - continued |
Semiconductors & Semiconductor Equipment - continued |
Lam Research Corp. (a) | 2,000,093 | | $ 84,384 |
Linear Technology Corp. | 56,844 | | 1,812 |
LTX-Credence Corp. (a)(f) | 8,571,343 | | 24,000 |
Mattson Technology, Inc. (a)(e) | 1,194,133 | | 3,499 |
Maxim Integrated Products, Inc. | 789,957 | | 13,848 |
Microchip Technology, Inc. (e) | 162,479 | | 4,947 |
Micron Technology, Inc. (a) | 4,055,852 | | 29,527 |
National Semiconductor Corp. | 675,877 | | 9,327 |
NVIDIA Corp. (a) | 654,496 | | 6,015 |
ON Semiconductor Corp. (a) | 3,074,454 | | 20,753 |
Standard Microsystems Corp. (a) | 398,292 | | 8,770 |
Teradyne, Inc. (a) | 646,400 | | 6,955 |
| | 383,544 |
Software - 2.5% |
BMC Software, Inc. (a) | 537,090 | | 19,110 |
CA, Inc. | 349,300 | | 6,832 |
Citrix Systems, Inc. (a) | 339,190 | | 18,662 |
ICSA (India) Ltd. | 885,139 | | 2,528 |
Informatica Corp. (a) | 580,650 | | 17,495 |
MacDonald Dettwiler & Associates Ltd. (a) | 73,100 | | 3,413 |
Microsoft Corp. | 1,950,250 | | 50,336 |
Oracle Corp. | 3,119,096 | | 73,735 |
Radiant Systems, Inc. (a) | 361,488 | | 5,137 |
Sage Group PLC | 406,100 | | 1,522 |
Ultimate Software Group, Inc. (a) | 60,882 | | 1,964 |
| | 200,734 |
TOTAL INFORMATION TECHNOLOGY | | 1,386,245 |
MATERIALS - 6.5% |
Chemicals - 2.9% |
Air Products & Chemicals, Inc. | 182,753 | | 13,264 |
Arkema | 56,900 | | 2,481 |
Arkema sponsored ADR | 160,800 | | 7,019 |
Celanese Corp. Class A | 736,659 | | 20,693 |
CF Industries Holdings, Inc. | 65,300 | | 5,302 |
Clariant AG (Reg.) (a) | 1,068,150 | | 14,152 |
Dow Chemical Co. | 1,218,336 | | 33,297 |
Huabao International Holdings Ltd. | 8,132,000 | | 10,490 |
Israel Chemicals Ltd. | 734,300 | | 9,137 |
Common Stocks - continued |
| Shares | | Value (000s) |
MATERIALS - continued |
Chemicals - continued |
Monsanto Co. | 266,063 | | $ 15,389 |
Solutia, Inc. (a) | 1,299,300 | | 18,333 |
Spartech Corp. (a) | 1,508,151 | | 15,775 |
STR Holdings, Inc. (e) | 383,050 | | 8,580 |
The Mosaic Co. | 264,200 | | 12,589 |
W.R. Grace & Co. (a) | 1,424,625 | | 36,570 |
Yara International ASA | 150,300 | | 5,667 |
| | 228,738 |
Construction Materials - 0.2% |
HeidelbergCement AG | 357,344 | | 17,999 |
Containers & Packaging - 0.4% |
Owens-Illinois, Inc. (a) | 644,776 | | 17,828 |
Pactiv Corp. (a) | 465,966 | | 14,175 |
| | 32,003 |
Metals & Mining - 2.9% |
Agnico-Eagle Mines Ltd. (Canada) | 155,700 | | 8,699 |
Anglo American PLC (United Kingdom) | 233,600 | | 9,249 |
Camino Minerals Corp. (a) | 60,400 | | 18 |
Commercial Metals Co. | 1,232,000 | | 17,728 |
Compass Minerals International, Inc. | 32,450 | | 2,294 |
Eldorado Gold Corp. | 1,813,578 | | 29,463 |
Freeport-McMoRan Copper & Gold, Inc. | 275,487 | | 19,708 |
Grande Cache Coal Corp. (a) | 657,900 | | 3,578 |
Gulf Resources, Inc. (a)(e) | 582,180 | | 5,042 |
Gulf Resources, Inc. (h) | 1,894,460 | | 16,406 |
Ivanhoe Mines Ltd. (a) | 1,825,700 | | 32,218 |
Lihir Gold Ltd. | 2,108,474 | | 7,837 |
Mitsubishi Materials Corp. (a) | 1,689,000 | | 4,495 |
Newcrest Mining Ltd. | 667,728 | | 19,763 |
Orko Silver Corp. (a) | 93,300 | | 125 |
Pan American Silver Corp. | 111,000 | | 2,549 |
Randgold Resources Ltd. sponsored ADR | 359,523 | | 32,314 |
Red Back Mining, Inc. (a) | 338,800 | | 8,576 |
Seabridge Gold, Inc. (a) | 97,900 | | 2,508 |
Silver Standard Resources, Inc. (a) | 174,700 | | 2,858 |
Silver Wheaton Corp. (a) | 364,800 | | 6,881 |
Steel Dynamics, Inc. | 197,600 | | 2,830 |
| | 235,139 |
Common Stocks - continued |
| Shares | | Value (000s) |
MATERIALS - continued |
Paper & Forest Products - 0.1% |
Weyerhaeuser Co. | 569,800 | | $ 9,242 |
TOTAL MATERIALS | | 523,121 |
TELECOMMUNICATION SERVICES - 1.3% |
Diversified Telecommunication Services - 0.6% |
Frontier Communications Corp. | 588,879 | | 4,499 |
Iliad Group SA | 129,004 | | 11,358 |
Qwest Communications International, Inc. | 4,666,700 | | 26,414 |
Telefonica SA sponsored ADR | 105,320 | | 7,208 |
| | 49,479 |
Wireless Telecommunication Services - 0.7% |
SOFTBANK CORP. | 154,300 | | 4,615 |
Sprint Nextel Corp. (a) | 8,806,115 | | 40,244 |
Syniverse Holdings, Inc. (a) | 133,549 | | 2,982 |
Vivo Participacoes SA sponsored ADR | 201,200 | | 5,380 |
| | 53,221 |
TOTAL TELECOMMUNICATION SERVICES | | 102,700 |
UTILITIES - 2.5% |
Electric Utilities - 0.8% |
American Electric Power Co., Inc. | 105,580 | | 3,799 |
Centrais Eletricas Brasileiras SA (Electrobras) (PN-B) sponsored ADR (e) | 502,200 | | 7,859 |
Entergy Corp. | 215,712 | | 16,720 |
FirstEnergy Corp. | 311,953 | | 11,761 |
NextEra Energy, Inc. | 52,719 | | 2,757 |
PPL Corp. | 710,000 | | 19,376 |
| | 62,272 |
Gas Utilities - 0.1% |
China Gas Holdings Ltd. | 122,000 | | 62 |
Xinao Gas Holdings Ltd. | 3,280,000 | | 7,761 |
| | 7,823 |
Independent Power Producers & Energy Traders - 0.8% |
AES Corp. (a) | 6,036,156 | | 62,233 |
Multi-Utilities - 0.8% |
Alliant Energy Corp. | 325,655 | | 11,255 |
CMS Energy Corp. | 1,817,884 | | 28,941 |
PG&E Corp. | 319,757 | | 14,197 |
Common Stocks - continued |
| Shares | | Value (000s) |
UTILITIES - continued |
Multi-Utilities - continued |
Public Service Enterprise Group, Inc. | 178,741 | | $ 5,881 |
Sempra Energy | 170,586 | | 8,487 |
| | 68,761 |
TOTAL UTILITIES | | 201,089 |
TOTAL COMMON STOCKS (Cost $7,628,804) | 7,876,165 |
Convertible Preferred Stocks - 0.6% |
| | | |
ENERGY - 0.2% |
Oil, Gas & Consumable Fuels - 0.2% |
SandRidge Energy, Inc. 8.50% | 80,500 | | 7,718 |
Whiting Petroleum Corp. 6.25% | 47,500 | | 10,165 |
| | 17,883 |
FINANCIALS - 0.3% |
Diversified Financial Services - 0.3% |
Citigroup, Inc. 7.50% | 157,200 | | 19,131 |
UTILITIES - 0.1% |
Electric Utilities - 0.1% |
PPL Corp. 9.50% (a) | 187,100 | | 10,363 |
TOTAL CONVERTIBLE PREFERRED STOCKS (Cost $41,419) | 47,377 |
Investment Companies - 0.3% |
| | | |
Ares Capital Corp.
(Cost $24,047) | 1,902,715 | | 26,657 |
Corporate Bonds - 1.0% |
| Principal Amount (000s) | | |
Convertible Bonds - 0.7% |
FINANCIALS - 0.3% |
Real Estate Management & Development - 0.1% |
Forest City Enterprises, Inc. 5% 10/15/16 (g) | | $ 6,170 | | 7,122 |
Corporate Bonds - continued |
| Principal Amount (000s) | | Value (000s) |
Convertible Bonds - continued |
FINANCIALS - continued |
Thrifts & Mortgage Finance - 0.2% |
MGIC Investment Corp. 0% 4/1/63 (a)(d)(g) | | $ 18,163 | | $ 18,345 |
TOTAL FINANCIALS | | 25,467 |
HEALTH CARE - 0.2% |
Biotechnology - 0.1% |
Incyte Corp. 4.75% 10/1/15 (g) | | 5,630 | | 9,555 |
Pharmaceuticals - 0.1% |
Endo Pharmaceuticals Holdings, Inc. 1.75% 4/15/15 (g) | | 8,010 | | 8,125 |
TOTAL HEALTH CARE | | 17,680 |
INDUSTRIALS - 0.1% |
Trading Companies & Distributors - 0.1% |
United Rentals, Inc. 4% 11/15/15 | | 1,820 | | 2,510 |
INFORMATION TECHNOLOGY - 0.1% |
Semiconductors & Semiconductor Equipment - 0.1% |
Amkor Technology, Inc. 6% 4/15/14 | | 4,010 | | 8,253 |
TOTAL CONVERTIBLE BONDS | | 53,910 |
Nonconvertible Bonds - 0.3% |
ENERGY - 0.1% |
Oil, Gas & Consumable Fuels - 0.1% |
OPTI Canada, Inc.: | | | | |
7.875% 12/15/14 | | 5,385 | | 4,658 |
8.25% 12/15/14 | | 5,330 | | 4,624 |
| | 9,282 |
INFORMATION TECHNOLOGY - 0.2% |
Semiconductors & Semiconductor Equipment - 0.2% |
Freescale Semiconductor, Inc. 10.125% 12/15/16 | | 19,510 | | 17,559 |
TOTAL NONCONVERTIBLE BONDS | | 26,841 |
TOTAL CORPORATE BONDS (Cost $58,434) | 80,751 |
Money Market Funds - 1.2% |
| Shares | | Value (000s) |
Fidelity Cash Central Fund, 0.24% (b) | 23,618,305 | | $ 23,618 |
Fidelity Securities Lending Cash Central Fund, 0.27% (b)(c) | 73,349,762 | | 73,350 |
TOTAL MONEY MARKET FUNDS (Cost $96,968) | 96,968 |
TOTAL INVESTMENT PORTFOLIO - 100.5% (Cost $7,849,672) | | 8,127,918 |
NET OTHER ASSETS (LIABILITIES) - (0.5)% | | (42,506) |
NET ASSETS - 100% | $ 8,085,412 |
Legend |
(a) Non-income producing |
(b) Affiliated fund that is available only to investment companies and other accounts managed by Fidelity Investments. The rate quoted is the annualized seven-day yield of the fund at period end. A complete unaudited listing of the fund's holdings as of its most recent quarter end is available upon request. |
(c) Investment made with cash collateral received from securities on loan. |
(d) Security initially issued in zero coupon form which converts to coupon form at a specified rate and date. The rate shown is the rate at period end. |
(e) Security or a portion of the security is on loan at period end. |
(f) Affiliated company |
(g) Security exempt from registration under Rule 144A of the Securities Act of 1933. These securities may be resold in transactions exempt from registration, normally to qualified institutional buyers. At the end of the period, the value of these securities amounted to $53,102,000 or 0.7% of net assets. |
(h) Restricted securities - Investment in securities not registered under the Securities Act of 1933 (excluding 144A issues). At the end of the period, the value of restricted securities (excluding 144A issues) amounted to $28,866,000 or 0.4% of net assets. |
Additional information on each holding is as follows: |
Security | Acquisition Date | Acquisition Cost (000s) |
Concho Resources, Inc. | 7/20/10 | $ 10,456 |
Gulf Resources, Inc. | 12/11/09 | $ 16,103 |
Affiliated Central Funds |
Information regarding fiscal year to date income earned by the Fund from investments in Fidelity Central Funds is as follows: |
Fund | Income earned
(Amounts in thousands) |
Fidelity Cash Central Fund | $ 88 |
Fidelity Securities Lending Cash Central Fund | 1,545 |
Total | $ 1,633 |
Other Affiliated Issuers |
An affiliated company is a company in which the fund has ownership of at least 5% of the voting securities. Fiscal year to date transactions with companies which are or were affiliates are as follows: |
Affiliate
(Amounts in thousands) | Value, beginning of period | Purchases | Sales Proceeds | Dividend Income | Value, end of period |
Bell Microproducts, Inc. | $ 3,211 | $ 109 | $ 14,231 | $ - | $ - |
DUSA Pharmaceuticals, Inc. | 1,459 | - | 1,841 | - | - |
Great Lakes Dredge & Dock Corp. | 17,803 | 297 | 11,920 | 127 | - |
LTX-Credence Corp. | 6,783 | 4,071 | 730 | - | 24,000 |
O'Charleys, Inc. | - | 9,851 | - | - | 9,141 |
PICO Holdings, Inc. | 3,397 | - | 11,918 | - | 38,871 |
Tween Brands, Inc. | 14,547 | - | 17,581 | - | - |
Universal Truckload Services, Inc. | 18,364 | 413 | 11,184 | - | - |
Winnebago Industries, Inc. | 3,273 | 16,718 | - | - | 16,261 |
Total | $ 68,837 | $ 31,459 | $ 69,405 | $ 127 | $ 88,273 |
Other Information |
The following is a summary of the inputs used, as of July 31, 2010, involving the Fund's assets and liabilities carried at fair value. The inputs or methodology used for valuing securities may not be an indication of the risk associated with investing in those securities. For more information on valuation inputs, and their aggregation into the levels used in the table below, please refer to the Security Valuation section in the accompanying Notes to Financial Statements. |
Valuation Inputs at Reporting Date: |
Description
(Amounts in thousands) | Total | Level 1 | Level 2 | Level 3 |
Investments in Securities: | | | | |
Equities: | | | | |
Consumer Discretionary | $ 838,761 | $ 838,761 | $ - | $ - |
Consumer Staples | 696,710 | 683,464 | 13,246 | - |
Energy | 900,606 | 880,428 | 20,178 | - |
Financials | 1,387,806 | 1,331,399 | 56,407 | - |
Health Care | 763,126 | 726,206 | 36,920 | - |
Industrials | 1,113,015 | 1,096,897 | 16,118 | - |
Information Technology | 1,386,245 | 1,386,245 | - | - |
Materials | 523,121 | 515,284 | 7,837 | - |
Telecommunication Services | 102,700 | 102,700 | - | - |
Utilities | 211,452 | 201,089 | 10,363 | - |
Investment Companies | 26,657 | 26,657 | - | - |
Corporate Bonds | 80,751 | - | 80,751 | - |
Money Market Funds | 96,968 | 96,968 | - | - |
Total Investments in Securities: | $ 8,127,918 | $ 7,886,098 | $ 241,820 | $ - |
Distribution of investments by country of issue, as a percentage of total net assets, is as follows: (Unaudited) |
United States of America | 83.4% |
Canada | 2.9% |
Switzerland | 1.7% |
Japan | 1.2% |
Others (Individually Less Than 1%) | 10.8% |
| 100.0% |
Income Tax Information |
At July 31, 2010, the Fund had a capital loss carryforward of approximately $804,929,000 of which $691,258,000 and $113,671,000 will expire on July 31, 2017 and 2018, respectively. Capital loss carryforwards are only available to offset future capital gains of the Fund to the extent provided by regulations and may be limited. |
See accompanying notes which are an integral part of the financial statements.
Annual Report
Statement of Assets and Liabilities
Amounts in thousands (except per-share amounts) | July 31, 2010 |
| | |
Assets | | |
Investment in securities, at value (including securities loaned of $71,738) - See accompanying schedule: Unaffiliated issuers (cost $7,661,481) | $ 7,942,677 | |
Fidelity Central Funds (cost $96,968) | 96,968 | |
Other affiliated issuers (cost $91,223) | 88,273 | |
Total Investments (cost $7,849,672) | | $ 8,127,918 |
Receivable for investments sold | | 32,794 |
Receivable for fund shares sold | | 42,146 |
Dividends receivable | | 16,606 |
Interest receivable | | 660 |
Distributions receivable from Fidelity Central Funds | | 86 |
Other receivables | | 781 |
Total assets | | 8,220,991 |
| | |
Liabilities | | |
Payable for investments purchased | $ 47,783 | |
Payable for fund shares redeemed | 6,999 | |
Accrued management fee | 4,243 | |
Other affiliated payables | 1,864 | |
Other payables and accrued expenses | 1,340 | |
Collateral on securities loaned, at value | 73,350 | |
Total liabilities | | 135,579 |
| | |
Net Assets | | $ 8,085,412 |
Net Assets consist of: | | |
Paid in capital | | $ 8,665,907 |
Undistributed net investment income | | 31,691 |
Accumulated undistributed net realized gain (loss) on investments and foreign currency transactions | | (889,457) |
Net unrealized appreciation (depreciation) on investments and assets and liabilities in foreign currencies | | 277,271 |
Net Assets | | $ 8,085,412 |
| | |
Dividend Growth:
Net Asset Value, offering price and redemption price per share ($7,729,949 ÷ 324,293 shares) | | $ 23.84 |
| | |
Class K:
Net Asset Value, offering price and redemption price per share ($355,463 ÷ 14,898 shares) | | $ 23.86 |
See accompanying notes which are an integral part of the financial statements.
Annual Report
Financial Statements - continued
Statement of Operations
Amounts in thousands | Year ended July 31, 2010 |
| | |
Investment Income | | |
Dividends (including $127 earned from other affiliated issuers) | | $ 96,285 |
Special dividends | | 12,624 |
Interest | | 6,185 |
Income from Fidelity Central Funds | | 1,633 |
Total income | | 116,727 |
| | |
Expenses | | |
Management fee
Basic fee | $ 44,284 | |
Performance adjustment | 6,215 | |
Transfer agent fees | 20,117 | |
Accounting and security lending fees | 1,308 | |
Custodian fees and expenses | 340 | |
Independent trustees' compensation | 48 | |
Registration fees | 199 | |
Audit | 79 | |
Legal | 47 | |
Interest | 1 | |
Miscellaneous | 125 | |
Total expenses before reductions | 72,763 | |
Expense reductions | (726) | 72,037 |
Net investment income (loss) | | 44,690 |
Realized and Unrealized Gain (Loss) Net realized gain (loss) on: | | |
Investment securities: | | |
Unaffiliated issuers | 920,983 | |
Other affiliated issuers | 2,194 | |
Foreign currency transactions | (650) | |
Capital gain distributions from Fidelity Central Funds | 5 | |
Total net realized gain (loss) | | 922,532 |
Change in net unrealized appreciation (depreciation) on: Investment securities | 264,045 | |
Assets and liabilities in foreign currencies | (7) | |
Total change in net unrealized appreciation (depreciation) | | 264,038 |
Net gain (loss) | | 1,186,570 |
Net increase (decrease) in net assets resulting from operations | | $ 1,231,260 |
See accompanying notes which are an integral part of the financial statements.
Annual Report
Statement of Changes in Net Assets
Amounts in thousands | Year ended
July 31,
2010 | Year ended
July 31,
2009 |
Increase (Decrease) in Net Assets | | |
Operations | | |
Net investment income (loss) | $ 44,690 | $ 82,873 |
Net realized gain (loss) | 922,532 | (1,751,666) |
Change in net unrealized appreciation (depreciation) | 264,038 | 144,851 |
Net increase (decrease) in net assets resulting
from operations | 1,231,260 | (1,523,942) |
Distributions to shareholders from net investment income | (39,369) | (132,865) |
Distributions to shareholders from net realized gain | (16,428) | (361,284) |
Total distributions | (55,797) | (494,149) |
Share transactions - net increase (decrease) | 104,895 | (678,997) |
Total increase (decrease) in net assets | 1,280,358 | (2,697,088) |
| | |
Net Assets | | |
Beginning of period | 6,805,054 | 9,502,142 |
End of period (including undistributed net investment income of $31,691 and undistributed net investment income of $23,975, respectively) | $ 8,085,412 | $ 6,805,054 |
See accompanying notes which are an integral part of the financial statements.
Annual Report
Financial Highlights - Dividend Growth
Years ended July 31, | 2010 | 2009 | 2008 | 2007 | 2006 |
Selected Per-Share Data | | | | | |
Net asset value, beginning of period | $ 20.25 | $ 25.40 | $ 32.73 | $ 29.50 | $ 28.85 |
Income from Investment Operations | | | | | |
Net investment income (loss)B | .13E | .24 | .43 | .52F | .35 |
Net realized and unrealized gain (loss) | 3.63 | (4.01) | (5.08) | 3.98 | .99 |
Total from investment operations | 3.76 | (3.77) | (4.65) | 4.50 | 1.34 |
Distributions from net investment income | (.12) | (.37) | (.45) | (.45) | (.31) |
Distributions from net realized gain | (.05) | (1.01) | (2.23) | (.82) | (.38) |
Total distributions | (.17) | (1.38)H | (2.68) | (1.27) | (.69) |
Net asset value, end of period | $ 23.84 | $ 20.25 | $ 25.40 | $ 32.73 | $ 29.50 |
Total ReturnA | 18.59% | (15.33)% | (15.45)% | 15.62% | 4.73% |
Ratios to Average Net AssetsC,G | | | | | |
Expenses before reductions | .93% | .62% | .64% | .61% | .60% |
Expenses net of fee waivers, if any | .93% | .62% | .64% | .61% | .60% |
Expenses net of all reductions | .92% | .62% | .63% | .60% | .59% |
Net investment income (loss) | .56%E | 1.34% | 1.47% | 1.62%F | 1.21% |
Supplemental Data | | | | | |
Net assets, end of period (in millions) | $ 7,730 | $ 6,603 | $ 9,502 | $ 16,265 | $ 15,523 |
Portfolio turnover rateD | 85% | 177% | 52% | 36% | 30% |
A Total returns would have been lower had certain expenses not been reduced during the periods shown.
B Calculated based on average shares outstanding during the period.
C Fees and expenses of the underlying Fidelity Central Funds are not included in the Fund's expense ratio. The Fund indirectly bears its proportionate share of the expenses of any underlying Fidelity Central Funds.
D Amount does not include the portfolio activity of any underlying Fidelity Central Funds.
E Investment income per share reflects a special dividend which amounted to $.04 per share. Excluding the special dividend, the ratio of net investment income (loss) to average net assets would have been .40%.
F Investment income per share reflects a special dividend which amounted to $.07 per share. Excluding the special dividend, the ratio of net investment income (loss) to average net assets would have been 1.40%.
G Expense ratios reflect operating expenses of the class. Expenses before reductions do not reflect amounts reimbursed by the investment adviser or reductions from brokerage service arrangements or reductions from other expense offset arrangements and do not represent the amount paid by the class during periods when reimbursements or reductions occur. Expenses net of fee waivers reflect expenses after reimbursement by the investment adviser but prior to reductions from brokerage service arrangements or other expense offset arrangements. Expenses net of all reductions represent the net expenses paid by the class.
H Total distributions of $1.38 per share is comprised of distributions from net investment income of $.374 and distributions from net realized gain of $1.005 per share.
See accompanying notes which are an integral part of the financial statements.
Annual Report
Financial Highlights - Class K
Years ended July 31, | 2010 | 2009 | 2008H |
Selected Per-Share Data | | | |
Net asset value, beginning of period | $ 20.26 | $ 25.41 | $ 27.72 |
Income from Investment Operations | | | |
Net investment income (loss)D | .18G | .26 | .10 |
Net realized and unrealized gain (loss) | 3.63 | (4.00) | (2.41) |
Total from investment operations | 3.81 | (3.74) | (2.31) |
Distributions from net investment income | (.16) | (.41) | - |
Distributions from net realized gain | (.05) | (1.01) | - |
Total distributions | (.21) | (1.41)J | - |
Net asset value, end of period | $ 23.86 | $ 20.26 | $ 25.41 |
Total ReturnB,C | 18.86% | (15.16)% | (8.33)% |
Ratios to Average Net AssetsE,I | | | |
Expenses before reductions | .72% | .40% | .47%A |
Expenses net of fee waivers, if any | .72% | .40% | .47%A |
Expenses net of all reductions | .71% | .39% | .47%A |
Net investment income (loss) | .76%G | 1.57% | 1.66%A |
Supplemental Data | | | |
Net assets, end of period (000 omitted) | $ 355,463 | $ 201,625 | $ 92 |
Portfolio turnover rateF | 85% | 177% | 52% |
A Annualized
B Total returns for periods of less than one year are not annualized.
C Total returns would have been lower had certain expenses not been reduced during the periods shown.
D Calculated based on average shares outstanding during the period.
E Fees and expenses of the underlying Fidelity Central Funds are not included in the Fund's expense ratio. The Fund indirectly bears its proportionate share of the expenses of any underlying Fidelity Central Funds.
F Amount does not include the portfolio activity of any underlying Fidelity Central Funds.
G Investment income per share reflects a special dividend which amounted to $.04 per share. Excluding the special dividend, the ratio of net investment income (loss) to average net assets would have been .60%.
H For the period May 9, 2008 (commencement of sale of shares) to July 31, 2008.
I Expense ratios reflect operating expenses of the class. Expenses before reductions do not reflect amounts reimbursed by the investment adviser or reductions from brokerage service arrangements or reductions from other expense offset arrangements and do not represent the amount paid by the class during periods when reimbursements or reductions occur. Expense ratios before reductions for start-up periods may not be representative of longer-term operating periods. Expenses net of fee waivers reflect expenses after reimbursement by the investment adviser but prior to reductions from brokerage service arrangements or other expense offset arrangements. Expenses net of all reductions represent the net expenses paid by the class.
J Total distributions of $1.41 per share is comprised of distributions from net investment income of $.407 and distributions from net realized gain of $1.005 per share.
See accompanying notes which are an integral part of the financial statements.
Annual Report
Notes to Financial Statements
For the period ended July 31, 2010
(Amounts in thousands except ratios)
1. Organization.
Fidelity Dividend Growth Fund (the Fund) is a fund of Fidelity Securities Fund (the Trust) and is authorized to issue an unlimited number of shares. The Trust is registered under the Investment Company Act of 1940, as amended (the 1940 Act), as an open-end management investment company organized as a Massachusetts business trust. The Fund offers Dividend Growth and Class K shares, each of which has equal rights as to assets and voting privileges. Each class has exclusive voting rights with respect to matters that affect that class. After the commencement of Class K, the Fund began offering conversion privileges between Dividend Growth and Class K to eligible shareholders of Dividend Growth. Investment income, realized and unrealized capital gains and losses, the common expenses of the Fund, and certain fund-level expense reductions, if any, are allocated on a pro-rata basis to each class based on the relative net assets of each class to the total net assets of the Fund. Each class differs with respect to transfer agent fees incurred. Certain expense reductions also differ by class.
2. Investments in Fidelity Central Funds.
The Fund may invest in Fidelity Central Funds, which are open-end investment companies available only to other investment companies and accounts managed by Fidelity Management & Research Company (FMR) and its affiliates. The Fund's Schedule of Investments lists each of the Fidelity Central Funds held as of period end, if any, as an investment of the Fund, but does not include the underlying holdings of each Fidelity Central Fund. As an Investing Fund, the Fund indirectly bears its proportionate share of the expenses of the underlying Fidelity Central Funds.
The Money Market Central Funds seek preservation of capital and current income and are managed by Fidelity Investments Money Management, Inc. (FIMM), an affiliate of FMR.
A complete unaudited list of holdings for each Fidelity Central Fund is available upon request or at the Securities and Exchange Commission (the SEC) web site at www.sec.gov. In addition, the financial statements of the Fidelity Central Funds, which are not covered by the Fund's Report of Independent Registered Public Accounting Firm, are available on the SEC web site or upon request.
3. Significant Accounting Policies.
The financial statements have been prepared in conformity with accounting principles generally accepted in the United States of America (GAAP), which require management to make certain estimates and assumptions at the date of the financial statements. Actual results could differ from those estimates. The following summarizes the significant accounting policies of the Fund:
Annual Report
3. Significant Accounting Policies - continued
Security Valuation. Investments are valued as of 4:00 p.m. Eastern time on the last calendar day of the period. The Fund uses independent pricing services approved by the Board of Trustees to value its investments. When current market prices or quotations are not readily available or reliable, valuations may be determined in good faith in accordance with procedures adopted by the Board of Trustees. Factors used in determining value may include market or security specific events, changes in interest rates and credit quality. The frequency with which these procedures are used cannot be predicted and they may be utilized to a significant extent. The value used for net asset value (NAV) calculation under these procedures may differ from published prices for the same securities.
The Fund categorizes the inputs to valuation techniques used to value its investments into a disclosure hierarchy consisting of three levels as shown below.
Level 1 - quoted prices in active markets for identical investments
Level 2 - other significant observable inputs (including quoted prices for similar investments, interest rates, prepayment speeds, etc.)
Level 3 - unobservable inputs (including the fund's own assumptions based on the best information available)
Changes in valuation techniques may result in transfers in or out of an assigned level within the disclosure hierarchy. The aggregate value of investments by input level, as of July 31, 2010 is included at the end of the Fund's Schedule of Investments. Valuation techniques used to value the Fund's investments by major category are as follows.
Equity securities, including restricted securities, for which market quotations are readily available, are valued at the last reported sale price or official closing price as reported by an independent pricing service on the primary market or exchange on which they are traded and are categorized as Level 1 in the hierarchy. In the event there were no sales during the day or closing prices are not available, securities are valued at the last quoted bid price or may be valued using the last available price and are generally categorized as Level 2 in the hierarchy. For foreign equity securities, when significant market or security specific events arise, comparisons to the valuation of American Depositary Receipts (ADRs), futures contracts, Exchange-traded funds (ETFs)and certain indexes as well as quoted prices for similar securities are used and are categorized as Level 2 in the hierarchy in these circumstances. Utilizing these techniques may result in transfers between Level 1 and Level 2. For restricted equity securities and private placements where observable inputs are limited, assumptions about market activity and risk are used and are categorized as Level 3 in the hierarchy.
Annual Report
Notes to Financial Statements - continued
(Amounts in thousands except ratios)
3. Significant Accounting Policies - continued
Security Valuation - continued
Debt securities, including restricted securities, are valued based on evaluated prices received from independent pricing services or from dealers who make markets in such securities. For corporate bonds, pricing services utilize matrix pricing which considers yield or price of bonds of comparable quality, coupon, maturity and type as well as dealer supplied prices and are generally categorized as Level 2 in the hierarchy.
Investments in open-end mutual funds, including the Fidelity Central Funds, are valued at their closing net asset value each business day and are categorized as Level 1 in the hierarchy. Short-term securities with remaining maturities of sixty days or less for which quotations are not readily available are valued at amortized cost, which approximates fair value and are categorized as Level 2 in the hierarchy.
When independent prices are unavailable or unreliable, debt securities may be valued utilizing pricing matrices which consider similar factors that would be used by independent pricing services. These are generally categorized as Level 2 in the hierarchy but may be Level 3 depending on the circumstances.
Foreign Currency. The Fund uses foreign currency contracts to facilitate transactions in foreign-denominated securities. Gains and losses from these transactions may arise from changes in the value of the foreign currency or if the counterparties do not perform under the contracts' terms.
Foreign-denominated assets, including investment securities, and liabilities are translated into U.S. dollars at the exchange rate at period end. Purchases and sales of investment securities, income and dividends received and expenses denominated in foreign currencies are translated into U.S. dollars at the exchange rate in effect on the transaction date.
The effects of exchange rate fluctuations on investments are included with the net realized and unrealized gain (loss) on investment securities. Other foreign currency transactions resulting in realized and unrealized gain (loss) are disclosed separately.
Investment Transactions and Income. For financial reporting purposes, the Fund's investment holdings and NAV include trades executed through the end of the last business day of the period. The NAV per share for processing shareholder transactions is calculated as of the close of business of the New York Stock Exchange (NYSE), normally 4:00 p.m. Eastern time and includes trades executed through the end of the prior business day. Gains and losses on securities sold are determined on the basis of identified cost and may include proceeds received from litigation. Dividend income is recorded on the ex-dividend date, except for certain dividends from foreign securities where the ex-dividend date may have passed, which are recorded as soon as the Fund is informed of
Annual Report
3. Significant Accounting Policies - continued
Investment Transactions and Income - continued
the ex-dividend date. Non-cash dividends included in dividend income, if any, are recorded at the fair market value of the securities received. Distributions received on securities that represent a return of capital or capital gain are recorded as a reduction of cost of investments and/or as a realized gain. The Fund estimates the components of distributions received that may be considered return of capital distributions or capital gain distributions. Large, non-recurring dividends recognized by the Fund are presented separately on the Statement of Operations as "Special Dividends" and the impact of these dividends is presented in the Financial Highlights. Interest income and distributions from the Fidelity Central Funds are accrued as earned. Interest income includes coupon interest and amortization of premium and accretion of discount on debt securities. Investment income is recorded net of foreign taxes withheld where recovery of such taxes is uncertain. Debt obligations may be placed on non-accrual status and related interest income may be reduced by ceasing current accruals and writing off interest receivables when the collection of all or a portion of interest has become doubtful based on consistently applied procedures. A debt obligation is removed from non-accrual status when the issuer resumes interest payments or when collectability of interest is reasonably assured.
Expenses. Most expenses of the Trust can be directly attributed to a fund. Expenses which cannot be directly attributed are apportioned amongst each fund in the Trust. Expense estimates are accrued in the period to which they relate and adjustments are made when actual amounts are known.
Deferred Trustee Compensation. Under a Deferred Compensation Plan (the Plan), independent Trustees may elect to defer receipt of a portion of their annual compensation. Deferred amounts are invested in a cross-section of Fidelity funds, are marked-to-market and remain in the Fund until distributed in accordance with the Plan. The investment of deferred amounts and the offsetting payable to the Trustees are included in the accompanying Statement of Assets and Liabilities.
Income Tax Information and Distributions to Shareholders. Each year the Fund intends to qualify as a regulated investment company, including distributing substantially all of its taxable income and realized gains under Subchapter M of the Internal Revenue Code and filing its U.S. federal tax return. As a result, no provision for income taxes is required. As of July 31, 2010, the Fund did not have any unrecognized tax benefits in the accompanying financial statements. A fund's federal tax return is subject to examination by the Internal Revenue Service (IRS) for a period of three years. Foreign taxes are provided for based on the Fund's understanding of the tax rules and rates that exist in the foreign markets in which it invests.
Distributions are recorded on the ex-dividend date. Income dividends and capital gain distributions are declared separately for each class. Income and capital gain distributions are determined in accordance with income tax regulations, which may differ from GAAP.
Annual Report
Notes to Financial Statements - continued
(Amounts in thousands except ratios)
3. Significant Accounting Policies - continued
Income Tax Information and Distributions to Shareholders - continued
Capital accounts within the financial statements are adjusted for permanent book-tax differences. These adjustments have no impact on net assets or the results of operations. Temporary book-tax differences will reverse in a subsequent period.
Book-tax differences are primarily due to the short-term gain distributions from the Fidelity Central Funds, foreign currency transactions, passive foreign investment companies (PFIC), market discount, partnerships, deferred trustees compensation, capital loss carryforwards, losses deferred due to wash sales and excise tax regulations.
The federal tax cost of investment securities and unrealized appreciation (depreciation) as of period end were as follows:
Gross unrealized appreciation | $ 913,175 |
Gross unrealized depreciation | (730,732) |
Net unrealized appreciation (depreciation) | $ 182,443 |
Tax Cost | $ 7,945,475 |
The tax-based components of distributable earnings as of period end were as follows:
Undistributed ordinary income | $ 43,191 |
Capital loss carryforward | $ (804,929) |
Net unrealized appreciation (depreciation) | $ 181,467 |
The tax character of distributions paid was as follows:
| July 31, 2010 | July 31, 2009 |
Ordinary Income | $ 55,797 | $ 134,581 |
Long-term Capital Gains | - | 359,568 |
Total | $ 55,797 | $ 494,149 |
4. Operating Policies.
Restricted Securities. The Fund may invest in securities that are subject to legal or contractual restrictions on resale. These securities generally may be resold in transactions exempt from registration or to the public if the securities are registered. Disposal of these securities may involve time-consuming negotiations and expense, and prompt sale at an acceptable price may be difficult. Information regarding restricted securities is included at the end of the Fund's Schedule of Investments.
5. Purchases and Sales of Investments.
Purchases and sales of securities, other than short-term securities, aggregated $6,671,911 and $6,583,311, respectively.
Annual Report
6. Fees and Other Transactions with Affiliates.
Management Fee. FMR and its affiliates provide the Fund with investment management related services for which the Fund pays a monthly management fee. The management fee is the sum of an individual fund fee rate that is based on an annual rate of .30% of the Fund's average net assets and a group fee rate that averaged .26% during the period. The group fee rate is based upon the average net assets of all the mutual funds advised by FMR. The group fee rate decreases as assets under management increase and increases as assets under management decrease. In addition, the management fee is subject to a performance adjustment (up to a maximum of ± .20% of the Fund's average net assets over a 36 month performance period). The upward or downward adjustment to the management fee is based on the relative investment performance of the retail class of the Fund, Dividend Growth, as compared to an appropriate benchmark index. For the period, the total annual management fee rate, including the performance adjustment, was .64% of the Fund's average net assets.
Transfer Agent Fees. Fidelity Investments Institutional Operations Company, Inc. (FIIOC), an affiliate of FMR, is the transfer, dividend disbursing and shareholder servicing agent for each class of the Fund. FIIOC receives account fees and asset-based fees that vary according to the account size and type of account of the shareholders of Dividend Growth. FIIOC receives an asset-based fee of Class K's average net assets. FIIOC pays for typesetting, printing and mailing of shareholder reports, except proxy statements. For the period, the total transfer agent fees paid by each class were as follows:
| Amount | % of
Average
Net Assets |
Dividend Growth | $ 19,960 | .26 |
Class K | 157 | .05 |
| $ 20,117 | |
Accounting and Security Lending Fees. Fidelity Service Company, Inc. (FSC), an affiliate of FMR, maintains the Fund's accounting records. The accounting fee is based on the level of average net assets for the month. Under a separate contract, FSC administers the security lending program. The security lending fee is based on the number and duration of lending transactions.
Brokerage Commissions. The Fund placed a portion of its portfolio transactions with brokerage firms which are affiliates of the investment adviser. The commissions paid to these affiliated firms were $106 for the period.
Annual Report
Notes to Financial Statements - continued
(Amounts in thousands except ratios)
6. Fees and Other Transactions with Affiliates - continued
Interfund Lending Program. Pursuant to an Exemptive Order issued by the SEC, the Fund, along with other registered investment companies having management contracts with FMR, may participate in an interfund lending program. This program provides an alternative credit facility allowing the funds to borrow from, or lend money to, other participating affiliated funds. At period end, there were no interfund loans outstanding. The Fund's activity in this program during the period for which loans were outstanding was as follows:
Borrower or Lender | Average Daily
Loan Balance | Weighted Average
Interest Rate | Interest
Expense |
Borrower | $ 25,396 | .38% | $ 1 |
7. Committed Line of Credit.
The Fund participates with other funds managed by FMR in a $3.75 billion credit facility (the "line of credit") to be utilized for temporary or emergency purposes to fund shareholder redemptions or for other short-term liquidity purposes. The Fund has agreed to pay commitment fees on its pro-rata portion of the line of credit, which amounted to $31 and is reflected in Miscellaneous expenses on the Statement of Operations. During the period, there were no borrowings on this line of credit.
8. Security Lending.
The Fund lends portfolio securities from time to time in order to earn additional income. On the settlement date of the loan, the Fund receives collateral (in the form of U.S. Treasury obligations, letters of credit and/or cash) against the loaned securities and maintains collateral in an amount not less than 100% of the market value of the loaned securities during the period of the loan. The market value of the loaned securities is determined at the close of business of the Fund and any additional required collateral is delivered to the Fund on the next business day. If the borrower defaults on its obligation to return the securities loaned because of insolvency or other reasons, a fund could experience delays and costs in recovering the securities loaned or in gaining access to the collateral. Any cash collateral received is invested in the Fidelity Securities Lending Cash Central Fund. The value of loaned securities and cash collateral at period end are disclosed on the Fund's Statement of Assets and Liabilities. Security lending income represents the income earned on investing cash collateral, less fees and expenses associated with the loan, plus any premium payments that may be received on the loan of certain types of securities. Security lending income is presented in the Statement of Operations as a component of income from Fidelity Central Funds. Net income from lending portfolio securities during the period amounted to $1,545.
Annual Report
9. Expense Reductions.
Many of the brokers with whom FMR places trades on behalf of the Fund provided services to the Fund in addition to trade execution. These services included payments of certain expenses on behalf of the Fund totaling $726 for the period.
10. Distributions to Shareholders.
Distributions to shareholders of each class were as follows:
Years ended July 31, | 2010 | 2009 |
From net investment income | | |
Dividend Growth | $ 37,603 | $ 131,611 |
Class K | 1,766 | 1,254 |
Total | $ 39,369 | $ 132,865 |
From net realized gain | | |
Dividend Growth | $ 15,884 | $ 361,247 |
Class K | 544 | 37 |
Total | $ 16,428 | $ 361,284 |
11. Share Transactions.
Transactions for each class of shares were as follows:
| Shares | Dollars |
Years ended July 31, | 2010A | 2009 | 2010A | 2009 |
Dividend Growth | | | | |
Shares sold | 100,583 | 75,287 | $ 2,382,785 | $ 1,282,313 |
Conversion to Class K | (734) | (9,623) | (15,619) | (178,188) |
Reinvestment of distributions | 2,281 | 21,264 | 51,426 | 478,613 |
Shares redeemed | (104,010) | (134,869) | (2,429,464) | (2,446,584) |
Net increase (decrease) | (1,880) | (47,941) | $ (10,872) | $ (863,846) |
Class K | | | | |
Shares sold | 6,982 | 2,088 | $ 165,346 | $ 35,139 |
Conversion from Dividend Growth | 733 | 9,623 | 15,619 | 178,188 |
Reinvestment of distributions | 102 | 86 | 2,310 | 1,291 |
Shares redeemed | (2,870) | (1,850) | (67,508) | (29,769) |
Net increase (decrease) | 4,947 | 9,947 | $ 115,767 | $ 184,849 |
A Conversion transactions for Class K and Dividend Growth are presented for the period August 1, 2009 through August 31, 2009.
Annual Report
Notes to Financial Statements - continued
(Amounts in thousands except ratios)
12. Other.
The Fund's organizational documents provide former and current trustees and officers with a limited indemnification against liabilities arising in connection with the performance of their duties to the Fund. In the normal course of business, the Fund may also enter into contracts that provide general indemnifications. The Fund's maximum exposure under these arrangements is unknown as this would be dependent on future claims that may be made against the Fund. The risk of material loss from such claims is considered remote.
Annual Report
To the Trustees of Fidelity Securities Fund and the Shareholders of Fidelity Dividend Growth Fund:
In our opinion, the accompanying statement of assets and liabilities, including the schedule of investments, and the related statements of operations and of changes in net assets and the financial highlights present fairly, in all material respects, the financial position of Fidelity Dividend Growth Fund (a fund of Fidelity Securities Fund) at July 31, 2010, the results of its operations for the year then ended, the changes in its net assets for each of the two years in the period then ended and the financial highlights for each of the periods indicated, in conformity with accounting principles generally accepted in the United States of America. These financial statements and financial highlights (hereafter referred to as "financial statements") are the responsibility of the Fidelity Dividend Growth Fund's management. Our responsibility is to express an opinion on these financial statements based on our audits. We conducted our audits of these financial statements in accordance with the standards of the Public Company Accounting Oversight Board (United States). Those standards require that we plan and perform the audit to obtain reasonable assurance about whether the financial statements are free of material misstatement. An audit includes examining, on a test basis, evidence supporting the amounts and disclosures in the financial statements, assessing the accounting principles used and significant estimates made by management, and evaluating the overall financial statement presentation. We believe that our audits, which included confirmation of securities at July 31, 2010 by correspondence with the custodian and brokers, provide a reasonable basis for our opinion.
/s/ PricewaterhouseCoopers LLP
PricewaterhouseCoopers LLP
Boston, Massachusetts
September 10, 2010
Annual Report
The Trustees, Member of the Advisory Board, and executive officers of the trust and fund, as applicable, are listed below. The Board of Trustees governs the fund and is responsible for protecting the interests of shareholders. The Trustees are experienced executives who meet periodically throughout the year to oversee the fund's activities, review contractual arrangements with companies that provide services to the fund, oversee management of the risks associated with such activities and contractual arrangements, and review the fund's performance. Except for James C. Curvey, each of the Trustees oversees 222 funds advised by FMR or an affiliate. Mr. Curvey oversees 411 funds advised by FMR or an affiliate.
The Trustees hold office without limit in time except that (a) any Trustee may resign; (b) any Trustee may be removed by written instrument, signed by at least two-thirds of the number of Trustees prior to such removal; (c) any Trustee who requests to be retired or who has become incapacitated by illness or injury may be retired by written instrument signed by a majority of the other Trustees; and (d) any Trustee may be removed at any special meeting of shareholders by a two-thirds vote of the outstanding voting securities of the trust. Each Trustee who is not an interested person (as defined in the 1940 Act) (Independent Trustee), shall retire not later than the last day of the calendar year in which his or her 72nd birthday occurs. The Independent Trustees may waive this mandatory retirement age policy with respect to individual Trustees. The executive officers and Advisory Board Member hold office without limit in time, except that any officer and Advisory Board Member may resign or may be removed by a vote of a majority of the Trustees at any regular meeting or any special meeting of the Trustees. Except as indicated, each individual has held the office shown or other offices in the same company for the past five years.
Experience, Skills, Attributes, and Qualifications of the Fund's Trustees. The Governance and Nominating Committee has adopted a statement of policy that describes the experience, qualifications, attributes, and skills that are necessary and desirable for potential Independent Trustee candidates (Statement of Policy). The Board believes that each Trustee satisfied at the time he or she was initially elected or appointed a Trustee, and continues to satisfy, the standards contemplated by the Statement of Policy. The Governance and Nominating Committee also engages professional search firms to help identify potential Independent Trustee candidates who have the experience, qualifications, attributes, and skills consistent with the Statement of Policy. From time to time, additional criteria based on the composition and skills of the current Independent Trustees, as well as experience or skills that may be appropriate in light of future changes to board composition, business conditions, and regulatory or other developments, have also been considered by the professional search firms and the Governance and Nominating Committee. In addition, the Board takes into account the Trustees' commitment and participation in Board and committee meetings, as well as their leadership of standing and ad hoc committees throughout their tenure.
In determining that a particular Trustee was and continues to be qualified to serve as a Trustee, the Board has considered a variety of criteria, none of which, in isolation, was controlling. The Board believes that, collectively, the Trustees have balanced and diverse experience, qualifications, attributes, and skills, which allow the Board to operate effectively in governing the fund and protecting the interests of shareholders. Information about the specific experience, skills, attributes, and qualifications of each Trustee, which in each case led to the Board's conclusion that the Trustee should serve (or continue to serve) as a trustee of the fund, is provided below.
Annual Report
Trustees and Officers - continued
Board Structure and Oversight Function. Edward C. Johnson 3d is an interested person (as defined in the 1940 Act) and currently serves as Chairman. The Trustees have determined that an interested Chairman is appropriate and benefits shareholders because an interested Chairman has a personal and professional stake in the quality and continuity of services provided to the fund. Independent Trustees exercise their informed business judgment to appoint an individual of their choosing to serve as Chairman, regardless of whether the Trustee happens to be independent or a member of management. The Independent Trustees have determined that they can act independently and effectively without having an Independent Trustee serve as Chairman and that a key structural component for assuring that they are in a position to do so is for the Independent Trustees to constitute a substantial majority for the Board. The Independent Trustees also regularly meet in executive session. Ned C. Lautenbach serves as Chairman of the Independent Trustees and as such (i) acts as a liaison between the Independent Trustees and management with respect to matters important to the Independent Trustees and (ii) with management prepares agendas for Board meetings.
Fidelity funds are overseen by different Boards of Trustees. The fund's Board oversees Fidelity's equity and high income funds and another Board oversees Fidelity's investment-grade bond, money market, and asset allocation funds. The asset allocation funds may invest in Fidelity funds overseen by the fund's Board. The use of separate Boards, each with its own committee structure, allows the Trustees of each group of Fidelity funds to focus on the unique issues of the funds they oversee, including common research, investment, and operational issues. On occasion, the separate Boards establish joint committees to address issues of overlapping consequences for the Fidelity funds overseen by each Board.
The Trustees operate using a system of committees to facilitate the timely and efficient consideration of all matters of importance to the Trustees, the fund, and fund shareholders and to facilitate compliance with legal and regulatory requirements and oversight of the fund's activities and associated risks. The Board, acting through its committees, has charged FMR and its affiliates with (i) identifying events or circumstances the occurrence of which could have demonstrably adverse effects on the fund's business and/or reputation; (ii) implementing processes and controls to lessen the possibility that such events or circumstances occur or to mitigate the effects of such events or circumstances if they do occur; and (iii) creating and maintaining a system designed to evaluate continuously business and market conditions in order to facilitate the identification and implementation processes described in (i) and (ii) above. Because the day-to-day operations and activities of the fund are carried out by or through FMR, its affiliates and other service providers, the fund's exposure to risks is mitigated but not eliminated by the processes overseen by the Trustees. While each of the Board's committees has responsibility for overseeing different aspects of the fund's activities, oversight is exercised primarily through the Operations, Audit, and Compliance Committees. Appropriate personnel, including but not limited to the fund's Chief Compliance Officer (CCO), FMR's internal auditor, the independent accountants, the fund's Treasurer and portfolio management personnel, make periodic reports to the Board's committees, as appropriate. The responsibilities of each committee, including their oversight responsibilities, are described further under "Standing Committees of the Fund's Trustees."
Annual Report
The fund's Statement of Additional Information (SAI) includes more information about the Trustees. To request a free copy, call Fidelity at 1-800-835-5092.
Interested Trustees*:
Correspondence intended for each Trustee who is an interested person may be sent to Fidelity Investments, 82 Devonshire Street, Boston, Massachusetts 02109.
Name, Age; Principal Occupations and Other Relevant Experience+ |
Edward C. Johnson 3d (80) |
| Year of Election or Appointment: 1984 Mr. Johnson is Trustee and Chairman of the Board of Trustees of certain Trusts. Mr. Johnson serves as Chief Executive Officer, Chairman, and a Director of FMR LLC; Chairman and a Director of FMR; Chairman and a Director of Fidelity Research & Analysis Company (FRAC); Chairman and a Director of Fidelity Investments Money Management, Inc.; and Chairman and a Director of FMR Co., Inc. In addition, Mr. Johnson serves as Chairman and Director of FIL Limited. Previously, Mr. Johnson served as President of FMR LLC (2006-2007). |
James C. Curvey (75) |
| Year of Election or Appointment: 2007 Mr. Curvey also serves as Trustee (2007-present) of other investment companies advised by FMR. Mr. Curvey is a Director of FMR and FMR Co., Inc. (2007-present). Mr. Curvey is also Vice Chairman (2006-present) and Director of FMR LLC. In addition, Mr. Curvey serves as an Overseer for the Boston Symphony Orchestra and a member of the Trustees of Villanova University. |
* Trustees have been determined to be "Interested Trustees" by virtue of, among other things, their affiliation with the trust or various entities under common control with FMR.
+ The information above includes each Trustee's principal occupation during the last five years and other information relating to the experience, attributes, and skills relevant to each Trustee's qualifications to serve as a Trustee, which led to the conclusion that each Trustee should serve as a Trustee for the fund.
Annual Report
Trustees and Officers - continued
Independent Trustees:
Correspondence intended for each Independent Trustee (that is, the Trustees other than the Interested Trustees) may be sent to Fidelity Investments, P.O. Box 55235, Boston, Massachusetts 02205-5235.
Name, Age; Principal Occupations and Other Relevant Experience+ |
Dennis J. Dirks (62) |
| Year of Election or Appointment: 2005 Prior to his retirement in May 2003, Mr. Dirks was Chief Operating Officer and a member of the Board of The Depository Trust & Clearing Corporation (DTCC). He also served as President, Chief Operating Officer, and Board member of The Depository Trust Company (DTC) and President and Board member of the National Securities Clearing Corporation (NSCC). In addition, Mr. Dirks served as Chief Executive Officer and Board member of the Government Securities Clearing Corporation, Chief Executive Officer and Board member of the Mortgage-Backed Securities Clearing Corporation, as a Trustee and a member of the Finance Committee of Manhattan College (2005-2008), and as a Trustee and a member of the Finance Committee of AHRC of Nassau County (2006-2008). Currently, Mr. Dirks serves as a member of the Board of Directors for The Brookville Center for Children's Services, Inc. (2009-present). |
Alan J. Lacy (56) |
| Year of Election or Appointment: 2008 Mr. Lacy serves as Senior Adviser (2007-present) of Oak Hill Capital Partners, L.P. (private equity). Mr. Lacy also served as Chief Executive Officer (2000-2005) and Vice Chairman (2005-2006) of Sears Holdings Corporation and Sears, Roebuck and Co. (retail). In addition, Mr. Lacy serves as a member of the Board of Directors of The Western Union Company (global money transfer, 2006-present) and Bristol-Myers Squibb Company (global pharmaceuticals, 2007-present). Mr. Lacy is Chairman (2008-present) and a member (2006-present) of the Board of Trustees of The National Parks Conservation Association. |
Ned C. Lautenbach (66) |
| Year of Election or Appointment: 2000 Mr. Lautenbach is Chairman of the Independent Trustees of the Equity and High Income Funds (2006-present). Mr. Lautenbach is an Advisory Partner of Clayton, Dubilier & Rice, Inc. (private equity investment, 2008-present) and was previously a Partner of Clayton, Dubilier & Rice, Inc. (1998-2008). Previously, Mr. Lautenbach was with the International Business Machines Corporation (IBM) from 1968 until his retirement in 1998. Mr. Lautenbach serves as a Director of Eaton Corporation (diversified industrial) as well as the Philharmonic Center for the Arts in Naples, Florida. Mr. Lautenbach is also a member of the Board of Trustees of Fairfield University (2005-present), as well as a member of the Council on Foreign Relations. Previously, Mr. Lautenbach served as a Director of Sony Corporation (2006-2007). |
Joseph Mauriello (65) |
| Year of Election or Appointment: 2008 Prior to his retirement in January 2006, Mr. Mauriello served in numerous senior management positions including Deputy Chairman and Chief Operating Officer (2004-2005), and Vice Chairman of Financial Services (2002-2004) of KPMG LLP US (professional services, 1965-2005). Mr. Mauriello currently serves as a member of the Board of Directors of XL Capital Ltd. (global insurance and re-insurance, 2006-present) and of Arcadia Resources Inc. (health care services and products, 2007-present). Previously, Mr. Mauriello served as a Director of the Hamilton Funds of the Bank of New York (2006-2007). |
Cornelia M. Small (66) |
| Year of Election or Appointment: 2005 Ms. Small is a member of the Board of Directors of the Teagle Foundation (2009-present). Ms. Small is also a member of the Investment Committee, and Chair (2008-present) and a member of the Board of Trustees of Smith College. In addition, Ms. Small serves on the Investment Committee of the Berkshire Taconic Community Foundation (2008-present). Previously, Ms. Small served as Chairperson of the Investment Committee (2002-2008) of Smith College. In addition, Ms. Small served as Chief Investment Officer, Director of Global Equity Investments, and a member of the Board of Directors of Scudder, Stevens & Clark and Scudder Kemper Investments. |
William S. Stavropoulos (71) |
| Year of Election or Appointment: 2002 Mr. Stavropoulos is Vice Chairman of the Independent Trustees of the Equity and High Income Funds (2006-present). Mr. Stavropoulos serves as President and Founder of the Michigan Baseball Foundation, the Great Lakes Loons (2007-present). Mr. Stavropoulos is Chairman Emeritus of the Board of Directors of The Dow Chemical Company, where he previously served in numerous senior management positions, including President, CEO (1995-2000; 2002-2004), Chairman of the Executive Committee (2000-2006), and as a member of the Board of Directors (1990-2006). Currently, Mr. Stavropoulos is a Director of Teradata Corporation (data warehousing and technology solutions, 2008-present), Chemical Financial Corporation, Maersk Inc. (industrial conglomerate), Tyco International, Inc. (multinational manufacturing and services, 2007-present), and a member of the Advisory Board for Metalmark Capital (private equity investment, 2005-present). Mr. Stavropoulos is a special advisor to Clayton, Dubilier & Rice, Inc. (private equity investment). In addition, Mr. Stavropoulos is a member of the University of Notre Dame Advisory Council for the College of Science. |
David M. Thomas (61) |
| Year of Election or Appointment: 2008 Previously, Mr. Thomas served as Executive Chairman (2005-2006) and Chairman and Chief Executive Officer (2000-2005) of IMS Health, Inc. (pharmaceutical and healthcare information solutions). In addition, Mr. Thomas serves as a member of the Board of Directors of Fortune Brands, Inc. (consumer products), and Interpublic Group of Companies, Inc. (marketing communication, 2004-present). |
Michael E. Wiley (59) |
| Year of Election or Appointment: 2008 Mr. Wiley also serves as a Director of Asia Pacific Exploration Consolidated (international oil and gas exploration and production, 2008-present), and as a member of the Board of Trustees of the University of Tulsa (2000-2006; 2007-present). Mr. Wiley serves as a Director of Tesoro Corporation (independent oil refiner and marketer, 2005-present), and a Director of Bill Barrett Corporation (exploration and production, 2005-present). In addition, Mr. Wiley also serves as a Director of Post Oak Bank (privately-held bank, 2004-present). Previously, Mr. Wiley served as a Sr. Energy Advisor of Katzenbach Partners, LLC (consulting, 2006-2007), as an Advisory Director of Riverstone Holdings (private investment), Chairman, President, and CEO of Baker Hughes, Inc. (oilfield services, 2000-2004), and as Director of Spinnaker Exploration Company (exploration and production, 2001-2005). |
Annual Report
+ The information above includes each Trustee's principal occupation during the last five years and other information relating to the experience, attributes, and skills relevant to each Trustee's qualifications to serve as a Trustee, which led to the conclusion that each Trustee should serve as a Trustee for the fund.
Advisory Board Member and Executive Officers:
Correspondence intended for each executive officer and Peter S. Lynch may be sent to Fidelity Investments, 82 Devonshire Street, Boston, Massachusetts 02109.
Name, Age; Principal Occupation |
Peter S. Lynch (66) |
| Year of Election or Appointment: 2003 Member of the Advisory Board of Fidelity's Equity and High Income Funds. Mr. Lynch is Vice Chairman and a Director of FMR and FMR Co., Inc. In addition, Mr. Lynch serves as a Trustee of Boston College and as the Chairman of the Inner-City Scholarship Fund. Previously, Mr. Lynch served on the Special Olympics International Board of Directors (1997-2006). |
Kenneth B. Robins (40) |
| Year of Election or Appointment: 2008 President and Treasurer of Fidelity's Equity and High Income Funds. Mr. Robins also serves as President and Treasurer (2010-present) and Assistant Treasurer (2009-present) of other Fidelity funds and is an employee of Fidelity Investments (2004-present). Previously, Mr. Robins served as Deputy Treasurer of the Fidelity funds (2005-2008) and Treasurer and Chief Financial Officer of The North Carolina Capital Management Trust: Cash and Term Portfolios (2006-2008). |
Bruce T. Herring (44) |
| Year of Election or Appointment: 2006 Vice President of certain Equity Funds. Mr. Herring also serves as Group Chief Investments Officer of FMR. Previously, Mr. Herring served as a portfolio manager for Fidelity U.S. Equity Funds. |
Brian B. Hogan (45) |
| Year of Election or Appointment: 2009 Vice President of certain Equity Funds and Vice President of Sector Funds. Mr. Hogan also serves as Senior Vice President, Equity Research of FMR (2006-present) and President of FMR's Equity Division (2009-present). Previously, Mr. Hogan served as a portfolio manager. |
Scott C. Goebel (42) |
| Year of Election or Appointment: 2008 Secretary and Chief Legal Officer (CLO) of the Fidelity funds. Mr. Goebel also serves as General Counsel, Secretary, and Senior Vice President of FMR (2008-present) and FMR Co., Inc. (2008-present); Deputy General Counsel of FMR LLC; Chief Legal Officer of Fidelity Management & Research (Hong Kong) Limited (2008-present) and Assistant Secretary of Fidelity Management & Research (Japan) Inc. (2008-present), Fidelity Investments Money Management, Inc. (2008-present), Fidelity Management & Research (U.K.) Inc. (2008-present), and Fidelity Research and Analysis Company (2008-present). Previously, Mr. Goebel served as Assistant Secretary of the Funds (2007-2008) and as Vice President and Secretary of Fidelity Distributors Corporation (FDC) (2005-2007). |
William C. Coffey (41) |
| Year of Election or Appointment: 2009 Assistant Secretary of Fidelity's Equity and High Income Funds. Mr. Coffey also serves as Senior Vice President and Deputy General Counsel of FMR LLC (2010-present), and is an employee of Fidelity Investments. Previously, Mr. Coffey served as Vice President and Associate General Counsel of FMR LLC (2005-2009). |
Holly C. Laurent (56) |
| Year of Election or Appointment: 2008 Anti-Money Laundering (AML) Officer of the Fidelity funds. Ms. Laurent is an employee of Fidelity Investments. Previously, Ms. Laurent was Senior Vice President and Head of Legal for Fidelity Business Services India Pvt. Ltd. (2006-2008), and Senior Vice President, Deputy General Counsel and Group Head for FMR LLC (2005-2006). |
Christine Reynolds (51) |
| Year of Election or Appointment: 2008 Chief Financial Officer of the Fidelity funds. Ms. Reynolds became President of Fidelity Pricing and Cash Management Services (FPCMS) in August 2008. Ms. Reynolds served as Chief Operating Officer of FPCMS (2007-2008). Previously, Ms. Reynolds served as President, Treasurer, and Anti-Money Laundering officer of the Fidelity funds (2004-2007). |
Kenneth A. Rathgeber (63) |
| Year of Election or Appointment: 2004 Chief Compliance Officer of Fidelity's Equity and High Income Funds. Mr. Rathgeber is Chief Compliance Officer of Fidelity Management & Research (Hong Kong) Limited (2008-present), Fidelity Management & Research (Japan) Inc. (2008-present), FMR (2005-present), FMR Co., Inc. (2005-present), Fidelity Management & Research (U.K.) Inc. (2005-present), Fidelity Research & Analysis Company (2005-present), Fidelity Investments Money Management, Inc. (2005-present), Pyramis Global Advisors, LLC (2005-present), and Strategic Advisers, Inc. (2005-present). |
Jeffrey S. Christian (48) |
| Year of Election or Appointment: 2009 Deputy Treasurer of the Fidelity funds. Mr. Christian is an employee of Fidelity Investments. Previously, Mr. Christian served as Chief Financial Officer (2008-2009) of certain Fidelity funds and Senior Vice President of Fidelity Pricing and Cash Management Services (FPCMS) (2004-2009). |
Bryan A. Mehrmann (49) |
| Year of Election or Appointment: 2005 Deputy Treasurer of the Fidelity funds. Mr. Mehrmann is an employee of Fidelity Investments. |
Adrien E. Deberghes (42) |
| Year of Election or Appointment: 2008 Deputy Treasurer of Fidelity's Equity and High Income Funds. Mr. Deberghes also serves as Assistant Treasurer of other Fidelity funds (2010-present) and is an employee of Fidelity Investments (2008-present). Previously, Mr. Deberghes served as Senior Vice President of Mutual Fund Administration at State Street Corporation (2007-2008), Senior Director of Mutual Fund Administration at Investors Bank & Trust (2005-2007), and Director of Finance for Dunkin' Brands (2000-2005). |
Stephanie J. Dorsey (41) |
| Year of Election or Appointment: 2010 Assistant Treasurer of Fidelity's Equity and High Income Funds. Ms. Dorsey also serves as Deputy Treasurer of other Fidelity funds (2008-present) and is an employee of Fidelity Investments (2008-present). Previously, Ms. Dorsey served as Treasurer (2004-2008) of the JPMorgan Mutual Funds and Vice President (2004-2008) of JPMorgan Chase Bank. |
John R. Hebble (52) |
| Year of Election or Appointment: 2009 Assistant Treasurer of Fidelity's Equity and High Income Funds. Mr. Hebble also serves as Treasurer and Chief Financial Officer of The North Carolina Capital Management Trust: Cash and Term Portfolio (2008-present), President and Treasurer of other Fidelity funds (2008-present) and is an employee of Fidelity Investments. |
Gary W. Ryan (51) |
| Year of Election or Appointment: 2005 Assistant Treasurer of the Fidelity funds. Mr. Ryan is an employee of Fidelity Investments. Previously, Mr. Ryan served as Vice President of Fund Reporting in Fidelity Pricing and Cash Management Services (FPCMS) (1999-2005). |
Annual Report
The Board of Trustees of Fidelity Dividend Growth Fund voted to pay on record date, the following distributions per share derived from capital gains realized from sales of portfolio securities, and dividends derived from net investment income:
| Pay Date | Record Date | Dividends | Capital Gains |
Class K | 9/09/10 | 9/08/10 | $0.117 | $0.042 |
Class K designates 100% of the dividends distributed in September and December, respectively during the fiscal year as qualifying for the dividends-received deduction for corporate shareholders.
Class K designates 100% of the dividends distributed in September and December, respectively during the fiscal year as amounts which may be taken into account as a dividend for the purposes of the maximum rate under section 1(h)(11) of the Internal Revenue Code.
The fund will notify shareholders in January 2011 of amounts for use in preparing 2010 income tax returns.
Annual Report
Board Approval of Investment Advisory Contracts and Management Fees
Fidelity Dividend Growth Fund
Each year, the Board of Trustees, including the Independent Trustees (together, the Board), votes on the renewal of the management contract and sub-advisory agreements (together, the Advisory Contracts) for the fund. The Board, assisted by the advice of fund counsel and Independent Trustees' counsel, requests and considers a broad range of information relevant to the renewal of the Advisory Contracts throughout the year.
The Board meets regularly and considers at each of its meetings factors that are relevant to its annual consideration of the renewal of the fund's Advisory Contracts, including the services and support provided to the fund and its shareholders. The Board has established various standing committees, each composed of Independent Trustees with varying backgrounds, to which the Board has assigned specific subject matter responsibilities in order to enhance effective decision-making by the Board. The Board, acting directly and through its Committees, requests and receives information concerning the annual consideration of the renewal of the fund's Advisory Contracts. The Board also meets as needed to consider matters specifically related to the Board's annual consideration of the renewal of Advisory Contracts. Members of the Board may also meet with trustees of other Fidelity funds through ad hoc joint committees to discuss certain matters relevant to the Fidelity funds.
At its July 2010 meeting, the Board of Trustees, including the Independent Trustees, unanimously determined to renew the fund's Advisory Contracts. In reaching its determination, the Board considered all factors it believed relevant, including (i) the nature, extent, and quality of the services to be provided to the fund and its shareholders (including the investment performance of the fund); (ii) the competitiveness of the fund's management fee and total expenses; (iii) the total costs of the services to be provided by and the profits to be realized by Fidelity from its relationship with the fund; (iv) the extent to which economies of scale would be realized as the fund grows; and (v) whether fee levels reflect these economies of scale, if any, for the benefit of fund shareholders.
In considering whether to renew the Advisory Contracts for the fund, the Board reached a determination, with the assistance of fund counsel and Independent Trustees' counsel and through the exercise of its business judgment, that the renewal of the Advisory Contracts is in the best interests of fund shareholders and that the compensation to be received by Fidelity under the management contract is fair and reasonable. The Board's decision to renew the Advisory Contracts was not based on any single factor noted above, but rather was based on a comprehensive consideration of all the information provided to the Board at its meetings throughout the year. The Board, in reaching its determination to renew the Advisory Contracts, is aware that shareholders in the fund have a broad range of investment choices available to them, including a wide choice among mutual funds offered by Fidelity's competitors, and that the fund's shareholders, with the opportunity to review and weigh the disclosure provided by the fund in its prospectus and other public disclosures, have chosen to invest in this fund, managed by Fidelity.
Annual Report
Nature, Extent, and Quality of Services Provided. The Board considered the staffing within the investment adviser, FMR, and the sub-advisers (together, the Investment Advisers), including the backgrounds of the fund's investment personnel and the fund's investment objective and discipline. The Independent Trustees also had discussions with senior management of Fidelity's investment operations and investment groups. The Board considered the structure of the portfolio manager compensation program and whether this structure provides appropriate incentives to act in the best interest of the fund.
Resources Dedicated to Investment Management and Support Services. The Board and the equity research subcommittee of the Board's Fund Oversight Committee reviewed the size, education, and experience of the Investment Advisers' investment staff, their use of technology, and the Investment Advisers' approach to recruiting, training, and retaining portfolio managers and other research, advisory, and management personnel. The Board noted that Fidelity's analysts have access to a variety of technological tools and market and securities data that enable them to perform both fundamental and quantitative analysis and to specialize in various disciplines. The Board considered Fidelity's extensive global research capabilities that enable the Investment Advisers to aggregate data from various sources in an effort to produce positive investment results. The Board also considered that Fidelity's portfolio managers and analysts have access to daily portfolio attribution that allows for monitoring of a fund's portfolio, as well as an electronic communication system that provides immediate real-time access to research concerning issuers and credit enhancers. The Board noted FMR's continued focus on strengthening the organization and discipline of equity portfolio management and research.
Shareholder and Administrative Services. The Board considered (i) the nature, extent, quality, and cost of advisory, administrative, and shareholder services performed by the Investment Advisers and their affiliates under the Advisory Contracts and under separate agreements covering transfer agency, pricing and bookkeeping, and securities lending services for the fund; (ii) the nature and extent of the investment adviser's supervision of third party service providers, principally custodians and subcustodians; and (iii) the resources devoted to, and the record of compliance with, the fund's compliance policies and procedures. The Board also reviewed the allocation of fund brokerage, including allocations to brokers affiliated with the Investment Advisers, the use of brokerage commissions to pay fund expenses, and the use of "soft" commission dollars to pay for research services.
The Board noted that the growth of fund assets over time across the complex allows Fidelity to reinvest in the development of services designed to enhance the value or convenience of the Fidelity funds as investment vehicles. These services include 24-hour access to account information and market information through phone representatives and over the Internet, and investor education materials and asset allocation tools.
Annual Report
Board Approval of Investment Advisory Contracts and
Management Fees - continued
Investment in a Large Fund Family. The Board considered the benefits to shareholders of investing in a Fidelity fund, including the benefits of investing in a fund that is part of a large family of funds offering a variety of investment disciplines and providing a large variety of mutual fund investor services. The Board noted that Fidelity had taken, or had made recommendations that resulted in the Fidelity funds taking, a number of actions over the previous year that benefited particular funds, including (i) dedicating additional resources to investment research and restructuring and broadening the focus of the investment research teams; (ii) bolstering the senior management team that oversees asset management; (iii) launching Class F of certain funds as a lower-fee class available to Freedom K and Freedom Index Funds; (iv) lowering the initial investment minimums and ongoing balance requirements for Real Estate High Income Fund; (v) eliminating subsequent purchase minimums for all funds and adding a waiver of the investment minimum requirement for new accounts opened with the proceeds of a systematic withdrawal plan; (vi) eliminating the withdrawal minimum and maximum limits for systematic withdrawals from Advisor funds; (vii) expanding sales load waivers on Class A shares for Destiny Planholders and expanding Institutional Class eligibility for Class O Destiny Planholders; and (viii) changing certain Class A and Class T sales charge structures to further align them with industry practices.
Investment Performance. The Board considered whether the fund has operated in accordance with its investment objective, as well as its record of compliance with its investment restrictions. It also reviewed the fund's absolute investment performance for each class, as well as the fund's relative investment performance for each class measured over multiple periods against (i) a broad-based securities market index, and (ii) a peer group of mutual funds deemed appropriate by Fidelity and reviewed by the Board. The following charts considered by the Board show, over the one-, three-, and five-year periods ended December 31, 2009, as available, the cumulative total returns of Class K and the retail class of the fund, the cumulative total returns of a broad-based securities market index ("benchmark"), and a range of cumulative total returns of a peer group of mutual funds identified by Morningstar, Inc. as having an investment style similar to that of the fund based on underlying portfolio holdings. The box within each chart shows the 25th percentile return (bottom of box) and the 75th percentile return (top of box) of the peer group. Returns shown above the box are in the first quartile and returns shown below the box are in the fourth quartile. The percentage beaten numbers noted below each chart correspond to the percentile box and represent the percentage of funds in the peer group whose performance was equal to or lower than that of the class indicated.
Annual Report
Fidelity Dividend Growth Fund

The Board reviewed the fund's relative investment performance against its peer group and noted that the performance of the retail class of the fund (the class with the longer performance record) was in the first quartile for the one-year period and the second quartile for the three- and five-year periods. The Board also noted that the investment performance of the retail class of the fund compared favorably to its benchmark for all the periods shown. The Board considered that the variations in performance between the fund's classes reflect the variations in class expenses, which result in lower performance for the higher expense class. The Board also reviewed the fund's performance since inception as well as performance in the current year.
The Board also considered that the fund's management fee is subject to upward or downward adjustment depending upon whether, and to what extent, the fund's investment performance for the performance period exceeds, or is exceeded by, the record (over the same period) of a Board-approved performance adjustment index. The Board realizes that the performance adjustment provides FMR with a strong economic incentive to seek to achieve superior performance for the fund's shareholders and helps to more closely align the interests of FMR and the fund's shareholders.
Based on its review, and giving particular weight to the nature and quality of the resources dedicated by the Investment Advisers to maintain and improve relative performance and factoring in the unprecedented market events in recent years, the Board concluded that the nature, extent, and quality of investment management and support services and of shareholder and administrative services provided to the fund will benefit the fund's shareholders, particularly in light of the Board's view that the fund's shareholders benefit from investing in a fund that is part of a large family of funds offering a variety of investment disciplines and services.
Annual Report
Board Approval of Investment Advisory Contracts and
Management Fees - continued
Competitiveness of Management Fee and Total Fund Expenses. The Board considered the fund's management fee and total expenses compared to "mapped groups" of competitive funds and classes. Fidelity creates "mapped groups" by combining similar Lipper investment objective categories that have comparable management fee characteristics. Combining Lipper investment objective categories aids the Board's management fee and total expense comparisons by broadening the competitive group used for comparison and by reducing the number of universes to which various Fidelity funds are compared.
Management Fee. The Board considered two proprietary management fee comparisons for the 12-month periods shown in the chart below. The group of Lipper funds used by the Board for management fee comparisons is referred to below as the "Total Mapped Group." The Total Mapped Group comparison focuses on a fund's standing relative to the total universe of comparable funds available to investors, in terms of gross management fees before expense reimbursements or caps, and without giving effect to the fund's performance adjustment. "TMG %" represents the percentage of funds in the Total Mapped Group that had management fees that were lower than the fund's. For example, a TMG % of 10% means that 90% of the funds in the Total Mapped Group had higher management fees than the fund. The "Asset-Size Peer Group" (ASPG) comparison focuses on a fund's standing relative to non-Fidelity funds similar in size to the fund within the Total Mapped Group. The ASPG represents at least 15% of the funds in the Total Mapped Group with comparable asset size and management fee characteristics, subject to a minimum of 50 funds (or all funds in the Total Mapped Group if fewer than 50). Additional information, such as the ASPG quartile in which the fund's management fee ranked and the impact of the fund's performance adjustment, is also included in the chart and considered by the Board.
Annual Report
Fidelity Dividend Growth Fund

The Board noted that the fund's management fee ranked below the median of its Total Mapped Group and below the median of its ASPG for 2009. The Board also noted the effect of the fund's negative performance adjustment on the fund's management fee ranking. The Board noted that the performance adjustment for each year represents calculations for performance periods that differ from the periods shown in the performance charts above.
Based on its review, the Board concluded that the fund's management fee is fair and reasonable in light of the services that the fund receives and the other factors considered.
Total Expenses. In its review of each class's total expenses, the Board considered the fund's management fee as well as other fund or class expenses, as applicable, such as transfer agent fees, pricing and bookkeeping fees, and custodial, legal, and audit fees. The Board also noted the effects of any waivers and reimbursements on fees and expenses, as well as the impact of the fund's performance adjustment. As part of its review, the Board also considered current and historical total expenses of each class of the fund compared to competitive fund median expenses. Each class of the fund is compared to those funds and classes in the Total Mapped Group (used by the Board for management fee comparisons) that have a similar sales load structure.
The Board noted that the total expenses of each class ranked below its competitive median for 2009.
Annual Report
Board Approval of Investment Advisory Contracts and
Management Fees - continued
Fees Charged to Other Fidelity Clients. The Board also considered Fidelity fee structures and other information with respect to clients of FMR and its affiliates, such as other mutual funds advised or subadvised by FMR or its affiliates, pension plan clients, and other institutional clients. In March 2010, the Board created an ad hoc joint committee with the board of other Fidelity funds (the Committee) to review and compare Fidelity's institutional investment advisory business with its business of providing services to the Fidelity funds, including the differences in services provided, fees charged, and costs incurred, as well as competition in their respective marketplaces.
Based on its review of total expenses and fees charged to other Fidelity clients, the Board concluded that the total expenses of each class of the fund were reasonable in light of the services that the fund and its shareholders receive and the other factors considered, including the findings of the Committee.
Costs of the Services and Profitability. The Board considered the revenues earned and the expenses incurred by Fidelity in conducting the business of developing, marketing, distributing, managing, administering and servicing the fund and its shareholders. The Board also considered the level of Fidelity's profits in respect of all the Fidelity funds.
On an annual basis, FMR presents to the Board Fidelity's profitability for the fund. Fidelity calculates the profitability for each fund, as well as aggregate profitability for groups of Fidelity funds and all Fidelity funds, using a series of detailed revenue and cost allocation methodologies which originate with the audited books and records of Fidelity. The Audit Committee of the Board reviews any significant changes from the prior year's methodologies.
PricewaterhouseCoopers LLP (PwC), independent registered public accounting firm and auditor to Fidelity and certain Fidelity funds, has been engaged annually by the Board as part of the Board's assessment of Fidelity's profitability analysis. PwC's engagement includes the review and assessment of Fidelity's methodologies used in determining the revenues and expenses attributable to Fidelity's mutual fund business, and completion of agreed-upon procedures surrounding the mathematical accuracy of fund profitability and its conformity to allocation methodologies. After considering PwC's reports issued under the engagement and information provided by Fidelity, the Board believes that while other allocation methods may also be reasonable, Fidelity's profitability methodologies are reasonable in all material respects.
The Board has also reviewed Fidelity's non-fund businesses and fall-out benefits related to the mutual fund business as well as cases where Fidelity's affiliates may benefit from or be related to the fund's business.
Annual Report
The Board considered the costs of the services provided by and the profits realized by Fidelity in connection with the operation of the fund and were satisfied that the profitability was not excessive in the circumstances.
Economies of Scale. The Board considered whether there have been economies of scale in respect of the management of the Fidelity funds, whether the Fidelity funds (including the fund) have appropriately benefited from any such economies of scale, and whether there is potential for realization of any further economies of scale. The Board considered the extent to which the fund will benefit from economies of scale through increased services to the fund, through waivers or reimbursements, or through fee or expense reductions.
In February 2009, the Board and the board of other Fidelity funds created an ad hoc committee (the Economies of Scale Committee) to analyze whether FMR attains economies of scale in respect of the management and servicing of the Fidelity funds, whether the Fidelity funds have appropriately benefited from such economies of scale, and whether there is potential for realization of any further economies of scale.
The Board recognized that the fund's management contract incorporates a "group fee" structure, which provides for lower group fee rates as total fund assets under FMR's management increase, and for higher group fee rates as total fund assets under FMR's management decrease. FMR calculates the group fee rates based on a tiered asset "breakpoint" schedule that varies based on asset class. The Board considered that the group fee is designed to deliver the benefits of economies of scale to fund shareholders when total Fidelity fund assets increase, even if assets of any particular fund are unchanged or have declined, because some portion of Fidelity's costs are attributable to services provided to all Fidelity funds, and all funds benefit if those costs can be allocated among more assets. The Board concluded that, given the group fee structure, fund shareholders will benefit from lower management fees as assets under FMR's management increase at the fund complex level, regardless of whether Fidelity achieves any such economies of scale.
The Board concluded, considering the findings of the Economies of Scale Committee, that any potential economies of scale are being appropriately shared between fund shareholders and Fidelity.
Additional Information Requested by the Board. In order to develop fully the factual basis for consideration of the Fidelity funds' Advisory Contracts, the Board requested and received additional information on certain topics, including (i) fund performance trends, actions to be taken by FMR to improve certain funds' overall performance, and Fidelity's long-term strategies for certain funds; (ii) portfolio manager changes that have occurred during the past year and length of portfolio manager tenure for different categories of funds over time; (iii) Fidelity's compensation structure for portfolio managers, research analysts, and other key personnel, the rationale for the compensation structure, and how the compensation structure provides appropriate performance incentives; (iv) the amount of the investment that each portfolio manager has made in the Fidelity fund(s) that he or she manages; (v) management and other fees paid by FMR to affiliated sub-advisers on behalf of the Fidelity funds; (vi) Fidelity's fee structures and rationale for recommending different fees among different categories of funds; (vii) Fidelity's rationale for recommending which funds should have a performance adjustment component as part of their management fees; (viii) the rationale for any differences between fund fee structures and fee structures in place for other Fidelity clients; and (ix) explanations regarding the relative total expenses borne by certain funds and classes, total expense competitive trends, and actions that might be taken by FMR to reduce total expenses for certain funds and classes.
Annual Report
Board Approval of Investment Advisory Contracts and
Management Fees - continued
Based on its evaluation of all of the conclusions noted above, and after considering all factors it believed relevant, the Board ultimately concluded that the advisory fee structures are fair and reasonable, and that the fund's Advisory Contracts should be renewed.
Annual Report
Managing Your Investments
Fidelity offers several ways to conveniently manage your workplace benefits (including your workplace savings plan, investments, and additional services) via your telephone or PC. You can access your plan and account information and research your investments 24 hours a day.
By Phone
Fidelity provides a single toll-free number to access plan information, account balances, positions, and quotes*. It's easy to navigate the service, and on your first call, the system will help you create a personal identification number (PIN) for security.
(phone_graphic)
Fidelity Workplace
Investing
1-800-835-5092
By PC
Fidelity's web site on the Internet provides a wide range of information, including plan information, daily financial news, fund performance, interactive planning tools, and news about Fidelity products and services.
(computer_graphic)
Fidelity's Web Site
www.401k.com
* When you call the quotes line, please remember that a fund's yield and return will vary and, except for money market funds, share price will also vary. This means that you may have a gain or loss when you sell your shares. There is no assurance that money market funds will be able to maintain a stable $1 share price; an investment in a money market fund is not insured or guaranteed by the U.S. government. Total returns are historical and include changes in share price, reinvestment of dividends and capital gains, and the effects of any sales charges.
Annual Report
To Write Fidelity
We'll give your correspondence immediate attention and send you written confirmation upon completion of your request.
(letter_graphic)
For Non-Retirement
Accounts
Buying shares
Fidelity Investments
P.O. Box 770001
Cincinnati, OH 45277-0003
Overnight Express
Fidelity Investments
Attn: Distribution Services
100 Crosby Parkway - KC1H
Covington, KY 41015
Selling shares
Fidelity Investments
P.O. Box 770001
Cincinnati, OH 45277-0035
Overnight Express
Fidelity Investments
Attn: Distribution Services
100 Crosby Parkway - KC1H
Covington, KY 41015
General Correspondence
Fidelity Investments
P.O. Box 500
Merrimack, NH 03054-0500
(letter_graphic)
For Retirement
Accounts
Buying shares
Fidelity Investments
P.O. Box 770001
Cincinnati, OH 45277-0003
Selling shares
Fidelity Investments
P.O. Box 770001
Cincinnati, OH 45277-0035
Overnight Express
Fidelity Investments
Attn: Distribution Services
100 Crosby Parkway - KC1H
Covington, KY 41015
General Correspondence
Fidelity Investments
P.O. Box 500
Merrimack, NH 03054-0500
Annual Report
Investment Adviser
Fidelity Management & Research Company
Boston, MA
Investment Sub Advisers
FMR Co., Inc.
Fidelity Research & Analysis Company
Fidelity Management & Research
(U.K.) Inc.
Fidelity Management & Research
(Hong Kong) Limited
Fidelity Management & Research
(Japan) Inc.
General Distributor
Fidelity Distributors Corporation
Boston, MA
Transfer and Service Agents
Fidelity Investments Institutional
Operations Company, Inc.
Boston, MA
Fidelity Service Company, Inc.
Boston, MA
Custodian
Citibank, N.A.,
New York, NY
DGF-K-UANN-0910
1.863064.101
Fidelity®
Growth & Income
Portfolio
Annual Report
July 31, 2010
(2_fidelity_logos) (Registered_Trademark)
Contents
Chairman's Message | <Click Here> | The Chairman's message to shareholders. |
Performance | <Click Here> | How the fund has done over time. |
Management's Discussion of Fund Performance | <Click Here> | The Portfolio Manager's review of fund
performance and strategy. |
Shareholder Expense Example | <Click Here> | An example of shareholder expenses. |
Investment Changes | <Click Here> | A summary of major shifts in the fund's investments over the past six months. |
Investments | <Click Here> | A complete list of the fund's investments with their market values. |
Financial Statements | <Click Here> | Statements of assets and liabilities, operations, and changes in net assets,
as well as financial highlights. |
Notes | <Click Here> | Notes to the financial statements. |
Report of Independent Registered Public Accounting Firm | <Click Here> | |
Trustees and Officers | <Click Here> | |
Distributions | <Click Here> | |
Board Approval of Investment Advisory Contracts and Management Fees | <Click Here> | |
To view a fund's proxy voting guidelines and proxy voting record for the 12-month period ended June 30, visit http://www.fidelity.com/proxyvotingresults or visit the Securities and Exchange Commission's (SEC) web site at http://www.sec.gov. You may also call 1-800-544-8544 to request a free copy of the proxy voting guidelines.
Standard & Poor's, S&P and S&P 500 are registered service marks of The McGraw-Hill Companies, Inc. and have been licensed for use by Fidelity Distributors Corporation.
Other third party marks appearing herein are the property of their respective owners.
All other marks appearing herein are registered or unregistered trademarks or service marks of FMR LLC or an affiliated company.
Annual Report
This report and the financial statements contained herein are submitted for the general information of the shareholders of the fund. This report is not authorized for distribution to prospective investors in the fund unless preceded or accompanied by an effective prospectus.
A fund files its complete schedule of portfolio holdings with the SEC for the first and third quarters of each fiscal year on Form N-Q. Forms N-Q are available on the SEC's web site at http://www.sec.gov. A fund's Forms N-Q may be reviewed and copied at the SEC's Public Reference Room in Washington, DC. Information regarding the operation of the SEC's Public Reference Room may be obtained by calling 1-800-SEC-0330. For a complete list of a fund's portfolio holdings, view the most recent holdings listing, semiannual report, or annual report on Fidelity's web site at http://www.fidelity.com or http://www.fidelity.advisor.com, as applicable.
NOT FDIC INSURED • MAY LOSE VALUE • NO BANK GUARANTEE
Neither the fund nor Fidelity Distributors Corporation is a bank.
Annual Report
(photo_of_Edward_C_Johnson_3d)
Dear Shareholder:
A yearlong uptrend in global equity markets reversed course in late April 2010 when investor sentiment turned bearish due in great measure to concern that Europe's debt crisis would expand and slow or derail economic recovery. However, a bounceback in July helped to recover some of the ground that was lost. Financial markets are always unpredictable, of course, but there also are several time-tested investment principles that can help put the odds in your favor.
One of the basic tenets is to invest for the long term. Over time, riding out the markets' inevitable ups and downs has proven much more effective than selling into panic or chasing the hottest trend. Even missing only a few of the markets' best days can significantly diminish investor returns. Patience also affords the benefits of compounding - of earning interest on additional income or reinvested dividends and capital gains. There can be tax advantages and cost benefits to consider as well. While staying the course doesn't eliminate risk, it can considerably lessen the effect of short-term declines.
You can further manage your investing risk through diversification. And today, more than ever, geographic diversification should be taken into account. Studies indicate that asset allocation is the single most important determinant of a portfolio's long-term success. The right mix of stocks, bonds and cash - aligned to your particular risk tolerance and investment objective - is very important. Age-appropriate rebalancing is also an essential aspect of asset allocation. For younger investors, an emphasis on equities - which historically have been the best-performing asset class over time - is encouraged. As investors near their specific goal, such as retirement or sending a child to college, consideration may be given to replacing volatile assets (e.g. common stocks) with more-stable fixed investments (bonds or savings plans).
A third principle - investing regularly - can help lower the average cost of your purchases. Investing a certain amount of money each month or quarter helps ensure you won't pay for all your shares at market highs. This strategy - known as dollar cost averaging - also reduces "emotion" from investing, helping shareholders avoid selling weak performers just prior to an upswing, or chasing a hot performer just before a correction.
We invite you to contact us via the Internet, through our Investor Centers or by phone. It is our privilege to provide you the information you need to make the investments that are right for you.
Sincerely,
(The chairman's signature appears here.)
Edward C. Johnson 3d
Annual Report
Average annual total return reflects the change in the value of an investment, assuming reinvestment of the class' distributions from dividend income and capital gains (the profits earned upon the sale of securities that have grown in value, if any) and assuming a constant rate of performance each year. The $10,000 table and the fund's returns do not reflect the deduction of taxes that a shareholder would pay on fund distributions or the redemption of fund shares. During periods of reimbursement by Fidelity, a fund's total return will be greater than it would be had the reimbursement not occurred. How a fund did yesterday is no guarantee of how it will do tomorrow.
Average Annual Total Returns
Periods ended July 31, 2010 | Past 1
year | Past 5
years | Past 10
years |
Fidelity Growth & Income Portfolio | 10.25% | -7.63% | -4.22% |
$10,000 Over 10 Years
Let's say hypothetically that $10,000 was invested in Fidelity Growth & Income Portfolio, a class of the fund, on July 31, 2000. The chart shows how the value of your investment would have changed, and also shows how the S&P 500® Index performed over the same period.
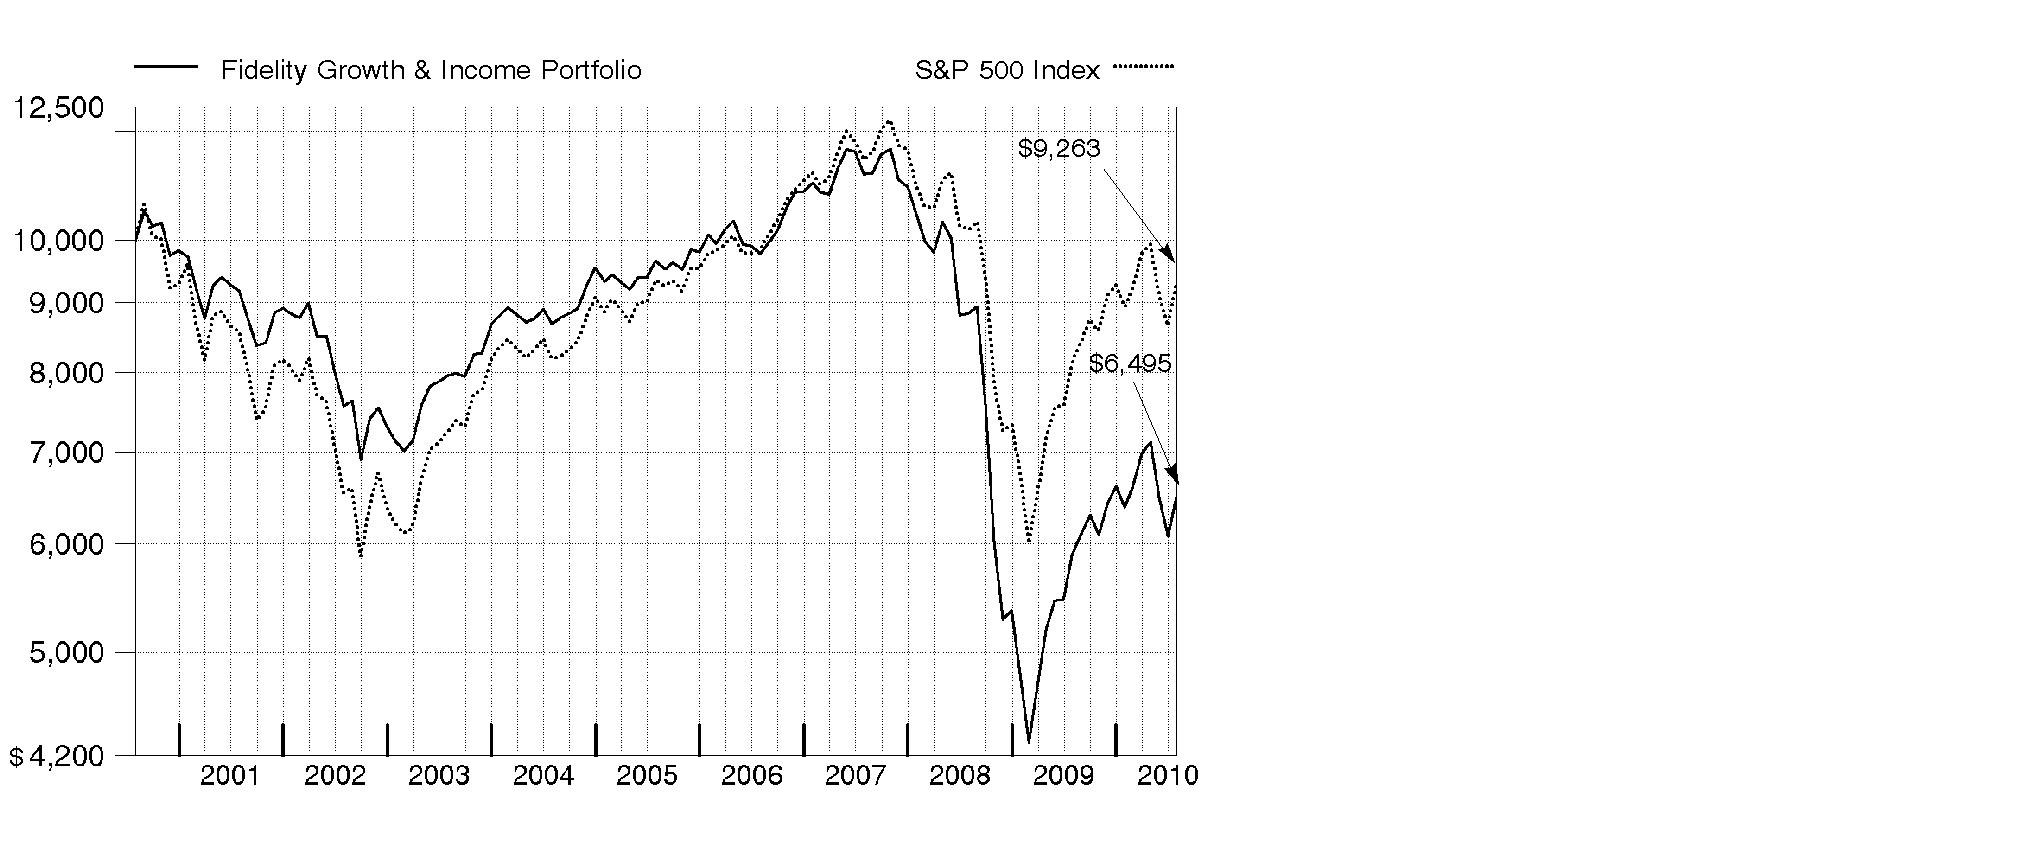
Annual Report
Market Recap: U.S. stock markets saw double-digit gains for the year ending July 31, 2010, despite the return of market volatility and risk aversion during the first half of 2010. An impressive bull run continued through 2009, bolstered by improvement in the economy and credit markets. Early in the new year, however, stocks fell sharply amid concerns about the global economic recovery, fueled by European debt woes and China's efforts to restrain inflation. After this brief dip, markets regained their upward momentum, as government stimulus and significant corporate cost cutting led to encouraging earnings reports, improved credit conditions and rising consumer confidence. Positive news continued through mid-April, when the Dow Jones Industrial AverageSM pushed above the 11,000 mark for the first time in 19 months. That milestone was short-lived, however, as heightened concern about the European debt crisis sparked an abrupt sell-off in May, leading to the first official correction since the rally began in March 2009. Although the market's malaise continued through June, stocks saw solid gains in July. For the year, the Dow rose 17.28%, while the S&P 500® Index was up 13.84%. Elsewhere, the technology-laden Nasdaq Composite® Index returned 14.99%. Small- and mid-cap stocks performed best, as measured by the 18.43% increase of the Russell 2000® Index and the 23.21% gain of the Russell Midcap® Index.
Comments from James Catudal, Portfolio Manager of Fidelity® Growth & Income Portfolio: For the year, the fund's Retail Class shares rose 10.25%, lagging the S&P 500®. The fund was hurt by stock picking in the consumer discretionary, energy and technology sectors, and positioning within consumer staples and financials. At the stock level, financial services provider State Street saw its stock drop due to a slowdown in business and compressed margins due to low interest rates. The fund also was hurt by overweighting solar equipment provider Applied Materials, which was stung by weakness in the solar arena. Builder KB Home detracted, hit by weak housing starts and the end of a federal tax credit program for first-time homebuyers. The fund benefited from stock picks in the materials sector and from overweightings in the strong-performing consumer discretionary and industrials sectors. An investment in truck-engine maker Cummins helped, as its stock rose on increased global sales. Another boost came from an out-of-benchmark position in AP Alternative Assets, a closed-end limited partnership that invests in private equity and capital markets opportunities. Underweighting agricultural products giant Monsanto also contributed, as the stock dropped following cuts in earnings projections.
The views expressed above reflect those of the portfolio manager(s) only through the end of the period as stated on the cover of this report and do not necessarily represent the views of Fidelity or any other person in the Fidelity organization. Any such views are subject to change at any time based upon market or other conditions and Fidelity disclaims any responsibility to update such views. These views may not be relied on as investment advice and, because investment decisions for a Fidelity fund are based on numerous factors, may not be relied on as an indication of trading intent on behalf of any Fidelity fund.
Annual Report
Shareholder Expense Example
As a shareholder of the Fund, you incur two types of costs: (1) transaction costs, and (2) ongoing costs, including management fees and other Fund expenses. This Example is intended to help you understand your ongoing costs (in dollars) of investing in the Fund and to compare these costs with the ongoing costs of investing in other mutual funds.
The Example is based on an investment of $1,000 invested at the beginning of the period and held for the entire period (February 1, 2010 to July 31, 2010).
Actual Expenses
The first line of the accompanying table for each class of the Fund provides information about actual account values and actual expenses. You may use the information in this line, together with the amount you invested, to estimate the expenses that you paid over the period. Simply divide your account value by $1,000.00 (for example, an $8,600 account value divided by $1,000.00 = 8.6), then multiply the result by the number in the first line for a class of the Fund under the heading entitled "Expenses Paid During Period" to estimate the expenses you paid on your account during this period. A small balance maintenance fee of $12.00 that is charged once a year may apply for certain accounts with a value of less than $2,000. This fee is not included in the table below. If it was, the estimate of expenses you paid during the period would be higher, and your ending account value lower, by this amount. In addition, the Fund, as a shareholder in the underlying Fidelity Central Funds, will indirectly bear its pro-rata share of the fees and expenses incurred by the underlying Fidelity Central Funds. These fees and expenses are not included in the Fund's annualized expense ratio used to calculate the expense estimate in the table below.
Hypothetical Example for Comparison Purposes
The second line of the accompanying table for each class of the Fund provides information about hypothetical account values and hypothetical expenses based on a Class' actual expense ratio and an assumed rate of return of 5% per year before expenses, which is not the Class' actual return. The hypothetical account values and expenses may not be used to estimate the actual ending account balance or expenses you paid for the period. You may use this information to compare the ongoing costs of investing in the Fund and other funds. To do so, compare this 5% hypothetical example with the 5% hypothetical examples that appear in the shareholder reports of the other funds. A small balance maintenance fee of $12.00 that is charged once a year may apply for certain accounts with a value of less than $2,000. This fee is not included in the table below. If it was, the estimate of expenses you paid during the period would be higher, and your ending account value lower, by this amount. In addition, the Fund, as a shareholder in the underlying Fidelity Central Funds, will indirectly bear its pro-rata share of the fees and expenses incurred by the underlying Fidelity Central Funds. These fees and expenses are not included in the Fund's annualized expense ratio used to calculate the expense estimate in the table below.
Annual Report
Shareholder Expense Example - continued
Please note that the expenses shown in the table are meant to highlight your ongoing costs only and do not reflect any transaction costs. Therefore, the second line of the table is useful in comparing ongoing costs only, and will not help you determine the relative total costs of owning different funds.
|
Annualized
Expense Ratio
|
Beginning
Account Value
February 1, 2010
|
Ending
Account Value
July 31, 2010
| Expenses Paid
During Period*
February 1, 2010 to
July 31, 2010 |
Growth & Income | .74% | | | |
Actual | | $ 1,000.00 | $ 1,018.70 | $ 3.70 |
Hypothetical A | | $ 1,000.00 | $ 1,021.12 | $ 3.71 |
Class K | .54% | | | |
Actual | | $ 1,000.00 | $ 1,019.80 | $ 2.70 |
Hypothetical A | | $ 1,000.00 | $ 1,022.12 | $ 2.71 |
A 5% return per year before expenses
* Expenses are equal to each Class' annualized expense ratio, multiplied by the average account value over the period, multiplied by 181/365 (to reflect the one-half year period).
Annual Report
Investment Changes (Unaudited)
Top Ten Stocks as of July 31, 2010 |
| % of fund's
net assets | % of fund's net assets
6 months ago |
Apple, Inc. | 3.8 | 2.2 |
Exxon Mobil Corp. | 3.5 | 2.2 |
JPMorgan Chase & Co. | 2.5 | 2.0 |
Hewlett-Packard Co. | 2.4 | 1.9 |
United Technologies Corp. | 2.1 | 1.5 |
Wells Fargo & Co. | 1.9 | 2.3 |
The Coca-Cola Co. | 1.8 | 1.4 |
Microsoft Corp. | 1.7 | 2.4 |
Cisco Systems, Inc. | 1.7 | 2.1 |
Google, Inc. Class A | 1.6 | 1.8 |
| 23.0 | |
Top Five Market Sectors as of July 31, 2010 |
| % of fund's
net assets | % of fund's net assets
6 months ago |
Information Technology | 20.8 | 22.3 |
Financials | 19.1 | 18.3 |
Industrials | 15.6 | 9.7 |
Energy | 11.1 | 10.8 |
Consumer Discretionary | 10.5 | 12.7 |
Asset Allocation (% of fund's net assets) |
As of July 31, 2010* | As of January 31, 2010** |
| Stocks 99.6% | | | Stocks 99.2% | |
 | Convertible
Securities 0.0% | | | Convertible
Securities 0.2% | |
| Short-Term
Investments and
Net Other Assets 0.4% | | | Short-Term
Investments and
Net Other Assets 0.6% | |
* Foreign investments | 8.1% | | ** Foreign investments | 9.1% | |

Annual Report
Investments July 31, 2010
Showing Percentage of Net Assets
Common Stocks - 99.6% |
| Shares | | Value (000s) |
CONSUMER DISCRETIONARY - 10.5% |
Auto Components - 0.2% |
Fuel Systems Solutions, Inc. (a) | 67,500 | | $ 2,053 |
Tenneco, Inc. (a) | 365,300 | | 10,082 |
| | 12,135 |
Automobiles - 0.4% |
Ford Motor Co. (a) | 1,400,000 | | 17,878 |
Harley-Davidson, Inc. | 270,000 | | 7,352 |
| | 25,230 |
Distributors - 0.2% |
Li & Fung Ltd. | 1,880,000 | | 8,616 |
Hotels, Restaurants & Leisure - 1.4% |
Buffalo Wild Wings, Inc. (a) | 318,489 | | 13,580 |
Darden Restaurants, Inc. | 190,000 | | 7,959 |
Jack in the Box, Inc. (a) | 180,000 | | 3,713 |
Little Sheep Group Ltd. | 447,000 | | 265 |
Marriott International, Inc. Class A | 630,618 | | 21,384 |
Sonic Corp. (a) | 397,600 | | 3,499 |
Starbucks Corp. | 1,185,000 | | 29,447 |
| | 79,847 |
Household Durables - 2.1% |
Ethan Allen Interiors, Inc. | 40,000 | | 614 |
KB Home | 2,250,000 | | 25,605 |
Newell Rubbermaid, Inc. | 405,000 | | 6,278 |
Pulte Group, Inc. (a) | 2,252,370 | | 19,776 |
Ryland Group, Inc. | 1,480,000 | | 24,154 |
Stanley Black & Decker, Inc. | 550,000 | | 31,911 |
Toll Brothers, Inc. (a) | 210,292 | | 3,651 |
Whirlpool Corp. | 83,100 | | 6,922 |
| | 118,911 |
Internet & Catalog Retail - 0.4% |
Amazon.com, Inc. (a) | 178,000 | | 20,984 |
Media - 2.5% |
Comcast Corp. Class A | 1,300,000 | | 25,311 |
DIRECTV (a) | 650,000 | | 24,154 |
Lamar Advertising Co. Class A (a) | 215,000 | | 5,880 |
McGraw-Hill Companies, Inc. | 345,000 | | 10,588 |
The Walt Disney Co. | 1,235,000 | | 41,607 |
Time Warner, Inc. | 1,115,233 | | 35,085 |
| | 142,625 |
Common Stocks - continued |
| Shares | | Value (000s) |
CONSUMER DISCRETIONARY - continued |
Multiline Retail - 1.6% |
Kohl's Corp. (a) | 525,000 | | $ 25,037 |
Target Corp. | 1,346,000 | | 69,077 |
| | 94,114 |
Specialty Retail - 1.3% |
Best Buy Co., Inc. | 720,000 | | 24,955 |
Lowe's Companies, Inc. | 1,220,000 | | 25,303 |
RadioShack Corp. | 790,000 | | 17,017 |
Staples, Inc. | 355,000 | | 7,217 |
| | 74,492 |
Textiles, Apparel & Luxury Goods - 0.4% |
Polo Ralph Lauren Corp. Class A | 310,000 | | 24,493 |
TOTAL CONSUMER DISCRETIONARY | | 601,447 |
CONSUMER STAPLES - 8.0% |
Beverages - 2.4% |
Coca-Cola Enterprises, Inc. | 775,000 | | 22,243 |
Dr Pepper Snapple Group, Inc. | 300,000 | | 11,265 |
The Coca-Cola Co. | 1,860,000 | | 102,505 |
| | 136,013 |
Food & Staples Retailing - 1.2% |
CVS Caremark Corp. | 842,900 | | 25,869 |
Wal-Mart Stores, Inc. | 567,900 | | 29,071 |
Whole Foods Market, Inc. (a) | 420,000 | | 15,947 |
| | 70,887 |
Food Products - 1.5% |
Bunge Ltd. | 310,000 | | 15,392 |
Kraft Foods, Inc. Class A | 300,000 | | 8,763 |
Mead Johnson Nutrition Co. Class A | 280,000 | | 14,879 |
Nestle SA | 907,000 | | 44,847 |
| | 83,881 |
Household Products - 1.4% |
Colgate-Palmolive Co. | 470,000 | | 37,121 |
Procter & Gamble Co. | 710,000 | | 43,424 |
| | 80,545 |
Common Stocks - continued |
| Shares | | Value (000s) |
CONSUMER STAPLES - continued |
Tobacco - 1.5% |
Philip Morris International, Inc. | 1,690,000 | | $ 86,258 |
TOTAL CONSUMER STAPLES | | 457,584 |
ENERGY - 11.1% |
Energy Equipment & Services - 4.2% |
Baker Hughes, Inc. | 785,000 | | 37,892 |
Cameron International Corp. (a) | 734,100 | | 29,063 |
Ensco International Ltd. ADR | 5,000 | | 209 |
Halliburton Co. | 2,410,000 | | 72,011 |
Nabors Industries Ltd. (a) | 500 | | 9 |
Oil States International, Inc. (a) | 255,000 | | 11,715 |
Schlumberger Ltd. | 789,500 | | 47,102 |
Weatherford International Ltd. (a) | 2,361,800 | | 38,261 |
| | 236,262 |
Oil, Gas & Consumable Fuels - 6.9% |
Anadarko Petroleum Corp. | 90,000 | | 4,424 |
Apache Corp. | 260,800 | | 24,927 |
Cameco Corp. | 290,000 | | 7,386 |
Chesapeake Energy Corp. | 20,000 | | 421 |
Exxon Mobil Corp. | 3,386,300 | | 202,094 |
Falkland Oil & Gas Ltd. (a) | 300,000 | | 598 |
Occidental Petroleum Corp. | 697,900 | | 54,387 |
Peabody Energy Corp. | 630,000 | | 28,445 |
Petrohawk Energy Corp. (a) | 975,000 | | 15,376 |
Plains Exploration & Production Co. (a) | 484,300 | | 10,921 |
Range Resources Corp. | 180,000 | | 6,682 |
Southwestern Energy Co. (a) | 690,000 | | 25,151 |
Ultra Petroleum Corp. (a) | 340,000 | | 14,406 |
| | 395,218 |
TOTAL ENERGY | | 631,480 |
FINANCIALS - 19.1% |
Capital Markets - 3.7% |
Ameriprise Financial, Inc. | 745,000 | | 31,581 |
AP Alternative Assets, L.P. Restricted Depositary Units (e) | 4,449,200 | | 27,363 |
Charles Schwab Corp. | 40,000 | | 592 |
Goldman Sachs Group, Inc. | 191,300 | | 28,852 |
Janus Capital Group, Inc. | 693,375 | | 7,267 |
Common Stocks - continued |
| Shares | | Value (000s) |
FINANCIALS - continued |
Capital Markets - continued |
Morgan Stanley | 1,293,800 | | $ 34,920 |
State Street Corp. | 1,457,400 | | 56,722 |
T. Rowe Price Group, Inc. | 470,000 | | 22,668 |
| | 209,965 |
Commercial Banks - 4.8% |
Banco Santander SA (d) | 825,000 | | 10,719 |
BB&T Corp. | 305,000 | | 7,573 |
FirstMerit Corp. | 404,500 | | 7,973 |
Huntington Bancshares, Inc. | 888,800 | | 5,386 |
PNC Financial Services Group, Inc. | 1,151,900 | | 68,411 |
Sterling Bancshares, Inc. | 375,000 | | 1,946 |
SunTrust Banks, Inc. | 670,000 | | 17,387 |
Synovus Financial Corp. | 100,000 | | 262 |
U.S. Bancorp, Delaware | 1,915,000 | | 45,769 |
Wells Fargo & Co. | 3,824,600 | | 106,056 |
| | 271,482 |
Consumer Finance - 1.3% |
American Express Co. | 1,102,700 | | 49,225 |
Capital One Financial Corp. | 601,900 | | 25,478 |
Discover Financial Services | 43,321 | | 662 |
| | 75,365 |
Diversified Financial Services - 5.3% |
Bank of America Corp. | 4,178,000 | | 58,659 |
Citigroup, Inc. (a) | 21,502,900 | | 88,162 |
CME Group, Inc. | 42,000 | | 11,710 |
JPMorgan Chase & Co. | 3,525,100 | | 141,991 |
NBH Holdings Corp. Class A (a)(e) | 166,200 | | 3,241 |
| | 303,763 |
Insurance - 2.5% |
Berkshire Hathaway, Inc. Class B (a) | 1,062,500 | | 83,003 |
Hartford Financial Services Group, Inc. | 5,000 | | 117 |
MetLife, Inc. | 1,185,000 | | 49,841 |
Prudential Financial, Inc. | 200,000 | | 11,458 |
| | 144,419 |
Real Estate Investment Trusts - 0.9% |
CBL & Associates Properties, Inc. | 459,200 | | 6,461 |
Public Storage | 270,000 | | 26,492 |
Common Stocks - continued |
| Shares | | Value (000s) |
FINANCIALS - continued |
Real Estate Investment Trusts - continued |
Simon Property Group, Inc. | 114,121 | | $ 10,182 |
SL Green Realty Corp. | 161,600 | | 9,735 |
| | 52,870 |
Real Estate Management & Development - 0.5% |
CB Richard Ellis Group, Inc. Class A (a) | 1,530,000 | | 26,010 |
Thrifts & Mortgage Finance - 0.1% |
Radian Group, Inc. | 575,000 | | 4,945 |
TOTAL FINANCIALS | | 1,088,819 |
HEALTH CARE - 9.1% |
Biotechnology - 1.4% |
Amgen, Inc. (a) | 476,800 | | 26,000 |
Amylin Pharmaceuticals, Inc. (a) | 900,000 | | 17,028 |
ARIAD Pharmaceuticals, Inc. (a) | 519,738 | | 1,663 |
Biogen Idec, Inc. (a) | 12,800 | | 715 |
BioMarin Pharmaceutical, Inc. (a) | 281,157 | | 6,143 |
Cephalon, Inc. (a) | 93,000 | | 5,278 |
Gilead Sciences, Inc. (a) | 75,000 | | 2,499 |
Incyte Corp. (a) | 250,000 | | 3,255 |
SIGA Technologies, Inc. (a) | 240,000 | | 2,011 |
Vertex Pharmaceuticals, Inc. (a) | 440,000 | | 14,810 |
| | 79,402 |
Health Care Equipment & Supplies - 1.1% |
Alcon, Inc. | 55,000 | | 8,529 |
Covidien PLC | 1,035,800 | | 38,656 |
Hill-Rom Holdings, Inc. | 285,000 | | 9,416 |
St. Jude Medical, Inc. (a) | 237,800 | | 8,744 |
| | 65,345 |
Health Care Providers & Services - 2.1% |
Brookdale Senior Living, Inc. (a) | 325,000 | | 4,609 |
CIGNA Corp. | 230,000 | | 7,075 |
Express Scripts, Inc. (a) | 704,200 | | 31,816 |
Henry Schein, Inc. (a) | 530,000 | | 27,820 |
McKesson Corp. | 300,000 | | 18,846 |
Medco Health Solutions, Inc. (a) | 180,000 | | 8,640 |
UnitedHealth Group, Inc. | 645,000 | | 19,640 |
| | 118,446 |
Common Stocks - continued |
| Shares | | Value (000s) |
HEALTH CARE - continued |
Life Sciences Tools & Services - 0.3% |
Illumina, Inc. (a) | 265,000 | | $ 11,880 |
Life Technologies Corp. (a) | 185,000 | | 7,953 |
| | 19,833 |
Pharmaceuticals - 4.2% |
Abbott Laboratories | 555,000 | | 27,239 |
Allergan, Inc. | 135,000 | | 8,243 |
Auxilium Pharmaceuticals, Inc. (a) | 100,000 | | 2,256 |
Johnson & Johnson | 1,049,800 | | 60,983 |
Merck & Co., Inc. | 2,018,078 | | 69,543 |
Perrigo Co. | 86,000 | | 4,817 |
Pfizer, Inc. | 3,472,500 | | 52,088 |
Teva Pharmaceutical Industries Ltd. sponsored ADR | 255,000 | | 12,457 |
| | 237,626 |
TOTAL HEALTH CARE | | 520,652 |
INDUSTRIALS - 15.6% |
Aerospace & Defense - 4.5% |
AeroVironment, Inc. (a) | 185,000 | | 4,423 |
BE Aerospace, Inc. (a) | 985,000 | | 28,959 |
Goodrich Corp. | 315,000 | | 22,954 |
Honeywell International, Inc. | 30,000 | | 1,286 |
Lockheed Martin Corp. | 500 | | 38 |
Precision Castparts Corp. | 260,000 | | 31,769 |
The Boeing Co. | 750,000 | | 51,105 |
United Technologies Corp. | 1,660,000 | | 118,026 |
| | 258,560 |
Air Freight & Logistics - 1.3% |
C.H. Robinson Worldwide, Inc. | 385,000 | | 25,102 |
United Parcel Service, Inc. Class B | 770,000 | | 50,050 |
| | 75,152 |
Airlines - 0.4% |
Delta Air Lines, Inc. (a) | 1,520,000 | | 18,058 |
UAL Corp. (a) | 300,000 | | 7,122 |
| | 25,180 |
Commercial Services & Supplies - 0.3% |
Avery Dennison Corp. | 505,000 | | 18,104 |
Construction & Engineering - 0.8% |
Fluor Corp. | 520,000 | | 25,111 |
Common Stocks - continued |
| Shares | | Value (000s) |
INDUSTRIALS - continued |
Construction & Engineering - continued |
Jacobs Engineering Group, Inc. (a) | 400,000 | | $ 14,628 |
Orion Marine Group, Inc. (a) | 305,000 | | 3,788 |
| | 43,527 |
Electrical Equipment - 0.0% |
Vestas Wind Systems AS (a) | 500 | | 24 |
Industrial Conglomerates - 2.2% |
3M Co. | 774,700 | | 66,268 |
General Electric Co. | 2,581,000 | | 41,606 |
Textron, Inc. | 828,100 | | 17,191 |
| | 125,065 |
Machinery - 2.9% |
Caterpillar, Inc. | 80,000 | | 5,580 |
Cummins, Inc. | 575,000 | | 45,776 |
Danaher Corp. | 910,000 | | 34,953 |
Ingersoll-Rand Co. Ltd. | 1,505,000 | | 56,377 |
NN, Inc. (a) | 100,000 | | 589 |
PACCAR, Inc. | 480,000 | | 21,994 |
| | 165,269 |
Professional Services - 0.3% |
Robert Half International, Inc. | 775,000 | | 19,515 |
Road & Rail - 2.9% |
Avis Budget Group, Inc. (a) | 465,300 | | 5,742 |
CSX Corp. | 1,182,700 | | 62,352 |
Hertz Global Holdings, Inc. (a) | 575,000 | | 6,751 |
Landstar System, Inc. | 685,000 | | 27,770 |
Union Pacific Corp. | 815,000 | | 60,856 |
| | 163,471 |
TOTAL INDUSTRIALS | | 893,867 |
INFORMATION TECHNOLOGY - 20.8% |
Communications Equipment - 3.1% |
Cisco Systems, Inc. (a) | 4,164,900 | | 96,084 |
Juniper Networks, Inc. (a) | 913,000 | | 25,363 |
Motorola, Inc. (a) | 700,000 | | 5,243 |
QUALCOMM, Inc. | 1,265,000 | | 48,171 |
| | 174,861 |
Computers & Peripherals - 6.3% |
Apple, Inc. (a) | 853,800 | | 219,630 |
Common Stocks - continued |
| Shares | | Value (000s) |
INFORMATION TECHNOLOGY - continued |
Computers & Peripherals - continued |
EMC Corp. (a) | 235,000 | | $ 4,651 |
Hewlett-Packard Co. | 2,929,700 | | 134,883 |
| | 359,164 |
Electronic Equipment & Components - 0.4% |
Agilent Technologies, Inc. (a) | 513,000 | | 14,328 |
Corning, Inc. | 631,900 | | 11,450 |
| | 25,778 |
Internet Software & Services - 2.7% |
eBay, Inc. (a) | 2,350,000 | | 49,139 |
Google, Inc. Class A (a) | 189,000 | | 91,637 |
Move, Inc. (a) | 1,846,025 | | 4,172 |
Rackspace Hosting, Inc. (a) | 415,000 | | 7,761 |
Tencent Holdings Ltd. | 3,000 | | 58 |
| | 152,767 |
IT Services - 1.9% |
Cognizant Technology Solutions Corp. Class A (a) | 345,000 | | 18,823 |
International Business Machines Corp. | 220,000 | | 28,248 |
MasterCard, Inc. Class A | 185,000 | | 38,857 |
Visa, Inc. Class A | 334,400 | | 24,528 |
| | 110,456 |
Semiconductors & Semiconductor Equipment - 2.7% |
Altera Corp. | 141,800 | | 3,931 |
Applied Materials, Inc. | 1,061,100 | | 12,521 |
ASML Holding NV | 2,010,000 | | 64,702 |
Intel Corp. | 763,500 | | 15,728 |
Lam Research Corp. (a) | 457,200 | | 19,289 |
Marvell Technology Group Ltd. (a) | 746,300 | | 11,135 |
MEMC Electronic Materials, Inc. (a) | 1,370,000 | | 13,097 |
Micron Technology, Inc. (a) | 1,305,900 | | 9,507 |
Xilinx, Inc. | 135,000 | | 3,769 |
| | 153,679 |
Software - 3.7% |
BMC Software, Inc. (a) | 537,400 | | 19,121 |
Citrix Systems, Inc. (a) | 245,000 | | 13,480 |
Informatica Corp. (a) | 300,000 | | 9,039 |
Longtop Financial Technologies Ltd. ADR (a) | 37,600 | | 1,253 |
Microsoft Corp. | 3,755,100 | | 96,919 |
Novell, Inc. (a) | 950,000 | | 5,738 |
Nuance Communications, Inc. (a) | 410,000 | | 6,769 |
Common Stocks - continued |
| Shares | | Value (000s) |
INFORMATION TECHNOLOGY - continued |
Software - continued |
Oracle Corp. | 1,847,200 | | $ 43,668 |
Red Hat, Inc. (a) | 240,000 | | 7,716 |
VMware, Inc. Class A (a) | 100,000 | | 7,753 |
| | 211,456 |
TOTAL INFORMATION TECHNOLOGY | | 1,188,161 |
MATERIALS - 4.0% |
Chemicals - 2.8% |
Albemarle Corp. | 575,000 | | 25,082 |
CF Industries Holdings, Inc. | 110,000 | | 8,931 |
Dow Chemical Co. | 1,300,000 | | 35,529 |
Ecolab, Inc. | 525,000 | | 25,678 |
FMC Corp. | 435,000 | | 27,183 |
Praxair, Inc. | 338,800 | | 29,415 |
The Mosaic Co. | 200,000 | | 9,530 |
| | 161,348 |
Metals & Mining - 1.2% |
AngloGold Ashanti Ltd. sponsored ADR | 617,700 | | 25,029 |
Barrick Gold Corp. | 570,000 | | 23,433 |
Carpenter Technology Corp. | 485,000 | | 16,951 |
Freeport-McMoRan Copper & Gold, Inc. | 1,000 | | 72 |
| | 65,485 |
TOTAL MATERIALS | | 226,833 |
TELECOMMUNICATION SERVICES - 1.0% |
Diversified Telecommunication Services - 0.3% |
Verizon Communications, Inc. | 650,000 | | 18,889 |
Wireless Telecommunication Services - 0.7% |
American Tower Corp. Class A (a) | 415,000 | | 19,190 |
Sprint Nextel Corp. (a) | 4,175,000 | | 19,080 |
| | 38,270 |
TOTAL TELECOMMUNICATION SERVICES | | 57,159 |
UTILITIES - 0.4% |
Electric Utilities - 0.3% |
FirstEnergy Corp. | 475,000 | | 17,908 |
Common Stocks - continued |
| Shares | | Value (000s) |
UTILITIES - continued |
Independent Power Producers & Energy Traders - 0.1% |
Constellation Energy Group, Inc. | 150,000 | | $ 4,740 |
TOTAL UTILITIES | | 22,648 |
TOTAL COMMON STOCKS (Cost $5,180,327) | 5,688,650 |
Money Market Funds - 0.5% |
| | | |
Fidelity Cash Central Fund, 0.24% (b) | 20,170,266 | | 20,170 |
Fidelity Securities Lending Cash Central Fund, 0.27% (b)(c) | 9,729,000 | | 9,729 |
TOTAL MONEY MARKET FUNDS (Cost $29,899) | 29,899 |
Cash Equivalents - 0.1% |
| Maturity Amount (000s) | | |
Investments in repurchase agreements in a joint trading account at 0.21%, dated 7/30/10 due 8/2/10 (Collateralized by U.S. Government Obligations) #
(Cost $2,387) | $ 2,387 | | 2,387 |
TOTAL INVESTMENT PORTFOLIO - 100.2% (Cost $5,212,613) | | 5,720,936 |
NET OTHER ASSETS (LIABILITIES) - (0.2)% | | (11,520) |
NET ASSETS - 100% | $ 5,709,416 |
Legend |
(a) Non-income producing |
(b) Affiliated fund that is available only to investment companies and other accounts managed by Fidelity Investments. The rate quoted is the annualized seven-day yield of the fund at period end. A complete unaudited listing of the fund's holdings as of its most recent quarter end is available upon request. |
(c) Investment made with cash collateral received from securities on loan. |
(d) Security or a portion of the security is on loan at period end. |
(e) Security exempt from registration under Rule 144A of the Securities Act of 1933. These securities may be resold in transactions exempt from registration, normally to qualified institutional buyers. At the end of the period, the value of these securities amounted to $30,604,000 or 0.5% of net assets. |
# Additional information on each counterparty to the repurchase agreement is as follows: |
Repurchase Agreement / Counterparty | Value
(Amounts in thousands) |
$2,387,000 due 8/02/10 at 0.21% |
BNP Paribas Securities Corp. | $ 954 |
Banc of America Securities LLC | 361 |
Barclays Capital, Inc. | 1,072 |
| $ 2,387 |
Affiliated Central Funds |
Information regarding fiscal year to date income earned by the Fund from investments in Fidelity Central Funds is as follows: |
Fund | Income earned
(Amounts in thousands) |
Fidelity Cash Central Fund | $ 83 |
Fidelity Securities Lending Cash Central Fund | 143 |
Total | $ 226 |
Other Information |
The following is a summary of the inputs used, as of July 31, 2010, involving the Fund's assets and liabilities carried at fair value. The inputs or methodology used for valuing securities may not be an indication of the risk associated with investing in those securities. For more information on valuation inputs, and their aggregation into the levels used in the tables below, please refer to the Security Valuation section in the accompanying Notes to Financial Statements. |
Valuation Inputs at Reporting Date: |
Description
(Amounts in thousands) | Total | Level 1 | Level 2 | Level 3 |
Investments in Securities: | | | | |
Equities: | | | | |
Consumer Discretionary | $ 601,447 | $ 601,447 | $ - | $ - |
Consumer Staples | 457,584 | 457,584 | - | - |
Energy | 631,480 | 631,480 | - | - |
Financials | 1,088,819 | 1,085,578 | - | 3,241 |
Health Care | 520,652 | 520,652 | - | - |
Industrials | 893,867 | 893,867 | - | - |
Information Technology | 1,188,161 | 1,188,161 | - | - |
Materials | 226,833 | 226,833 | - | - |
Telecommunication Services | 57,159 | 57,159 | - | - |
Utilities | 22,648 | 22,648 | - | - |
Money Market Funds | 29,899 | 29,899 | - | - |
Cash Equivalents | 2,387 | - | 2,387 | - |
Total Investments in Securities: | $ 5,720,936 | $ 5,715,308 | $ 2,387 | $ 3,241 |
Other Information - continued |
The following is a reconciliation of Investments in Securities for which Level 3 inputs were used in determining value: |
(Amounts in thousands) | |
Investments in Securities: | |
Beginning Balance | $ - |
Total Realized Gain (Loss) | - |
Total Unrealized Gain (Loss) | (83) |
Cost of Purchases | 3,324 |
Proceeds of Sales | - |
Amortization/Accretion | - |
Transfers in to Level 3 | - |
Transfers out of Level 3 | - |
Ending Balance | $ 3,241 |
The change in unrealized gain (loss) for the period attributable to Level 3 securities held at July 31, 2010 | $ (83) |
The information used in the above reconciliation represents fiscal year to date activity for any Investments in Securities identified as using Level 3 inputs at either the beginning or the end of the current fiscal period. Transfers in or out of Level 3 represent the beginning value of any Security or Instrument where a change in the pricing level occurred from the beginning to the end of the period. The cost of purchases and the proceeds of sales may include securities received or delivered through corporate actions or exchanges. Realized and unrealized gains (losses) disclosed in the reconciliation are included in Net Gain (Loss) on the Fund's Statement of Operations. |
Income Tax Information |
At July 31, 2010, the Fund had a capital loss carryforward of approximately $6,214,141,000 of which $3,048,336,000 and $3,165,805,000 will expire on July 31, 2017 and 2018, respectively. Capital loss carryforwards are only available to offset future capital gains of the Fund to the extent provided by regulations and may be limited. |
See accompanying notes which are an integral part of the financial statements.
Annual Report
Statement of Assets and Liabilities
Amounts in thousands (except per-share amounts) | July 31, 2010 |
| | |
Assets | | |
Investment in securities, at value (including securities loaned of $8,961 and repurchase agreements of $2,387) - See accompanying schedule: Unaffiliated issuers (cost $5,182,714) | $ 5,691,037 | |
Fidelity Central Funds (cost $29,899) | 29,899 | |
Total Investments (cost $5,212,613) | | $ 5,720,936 |
Receivable for investments sold | | 76,652 |
Receivable for fund shares sold | | 2,329 |
Dividends receivable | | 2,922 |
Distributions receivable from Fidelity Central Funds | | 3 |
Other receivables | | 1,033 |
Total assets | | 5,803,875 |
| | |
Liabilities | | |
Payable for investments purchased | $ 74,597 | |
Payable for fund shares redeemed | 6,081 | |
Accrued management fee | 2,159 | |
Other affiliated payables | 1,299 | |
Other payables and accrued expenses | 594 | |
Collateral on securities loaned, at value | 9,729 | |
Total liabilities | | 94,459 |
| | |
Net Assets | | $ 5,709,416 |
Net Assets consist of: | | |
Paid in capital | | $ 11,476,265 |
Undistributed net investment income | | 1,085 |
Accumulated undistributed net realized gain (loss) on investments and foreign currency transactions | | (6,276,264) |
Net unrealized appreciation (depreciation) on investments and assets and liabilities in foreign currencies | | 508,330 |
Net Assets | | $ 5,709,416 |
See accompanying notes which are an integral part of the financial statements.
Annual Report
Statement of Assets and Liabilities - continued
Amounts in thousands (except per-share amounts) | July 31, 2010 |
| | |
Growth & Income:
Net Asset Value, offering price and redemption price per share ($5,417,395 ÷ 343,972 shares) | | $ 15.75 |
| | |
Class K:
Net Asset Value, offering price and redemption price per share ($292,021 ÷ 18,551 shares) | | $ 15.74 |
See accompanying notes which are an integral part of the financial statements.
Annual Report
Financial Statements - continued
Statement of Operations
Amounts in thousands | Year ended July 31, 2010 |
| | |
Investment Income | | |
Dividends | | $ 86,682 |
Interest | | 1 |
Income from Fidelity Central Funds | | 226 |
Total income | | 86,909 |
| | |
Expenses | | |
Management fee | $ 29,104 | |
Transfer agent fees | 16,070 | |
Accounting and security lending fees | 1,231 | |
Custodian fees and expenses | 122 | |
Independent trustees' compensation | 42 | |
Registration fees | 50 | |
Audit | 84 | |
Legal | 59 | |
Interest | 5 | |
Miscellaneous | 123 | |
Total expenses before reductions | 46,890 | |
Expense reductions | (547) | 46,343 |
Net investment income (loss) | | 40,566 |
Realized and Unrealized Gain (Loss) Net realized gain (loss) on: | | |
Investment securities: | | |
Unaffiliated issuers | 535,178 | |
Foreign currency transactions | (351) | |
Capital gain distributions from Fidelity Central Funds | 4 | |
Total net realized gain (loss) | | 534,831 |
Change in net unrealized appreciation (depreciation) on: Investment securities | 81,647 | |
Assets and liabilities in foreign currencies | 15 | |
Total change in net unrealized appreciation (depreciation) | | 81,662 |
Net gain (loss) | | 616,493 |
Net increase (decrease) in net assets resulting from operations | | $ 657,059 |
See accompanying notes which are an integral part of the financial statements.
Annual Report
Statement of Changes in Net Assets
Amounts in thousands | Year ended
July 31,
2010 | Year ended
July 31,
2009 |
Increase (Decrease) in Net Assets | | |
Operations | | |
Net investment income (loss) | $ 40,566 | $ 76,215 |
Net realized gain (loss) | 534,831 | (6,629,356) |
Change in net unrealized appreciation (depreciation) | 81,662 | 2,408,298 |
Net increase (decrease) in net assets resulting
from operations | 657,059 | (4,144,843) |
Distributions to shareholders from net investment income | (38,583) | (95,086) |
Distributions to shareholders from net realized gain | (3,482) | (16,566) |
Total distributions | (42,065) | (111,652) |
Share transactions - net increase (decrease) | (1,247,688) | (1,953,179) |
Total increase (decrease) in net assets | (632,694) | (6,209,674) |
| | |
Net Assets | | |
Beginning of period | 6,342,110 | 12,551,784 |
End of period (including undistributed net investment income of $1,085 and distributions in excess of net investment income of $94, respectively) | $ 5,709,416 | $ 6,342,110 |
See accompanying notes which are an integral part of the financial statements.
Annual Report
Financial Highlights - Growth & Income
Years ended July 31, | 2010 | 2009 | 2008 | 2007 | 2006 |
Selected Per-Share Data | | | | | |
Net asset value, beginning of period | $ 14.38 | $ 21.88 | $ 31.92 | $ 34.16 | $ 38.42 |
Income from Investment Operations | | | | | |
Net investment income (loss) B | .10 | .15 | .35 | .27 | .34 |
Net realized and
unrealized gain (loss) | 1.37 | (7.43) | (6.25) | 3.84 | .18 |
Total from investment operations | 1.47 | (7.28) | (5.90) | 4.11 | .52 |
Distributions from net investment income | (.10) | (.19) | (.33) | (.27) | (.38) |
Distributions from net
realized gain | (.01) | (.03) | (3.81) | (6.08) | (4.40) |
Total distributions | (.10) F | (.22) | (4.14) | (6.35) | (4.78) |
Net asset value, end of period | $ 15.75 | $ 14.38 | $ 21.88 | $ 31.92 | $ 34.16 |
Total Return A | 10.25% | (33.32)% | (20.91)% | 14.28% | 1.22% |
Ratios to Average Net Assets C, E | | | | |
Expenses before reductions | .75% | .78% | .68% | .68% | .69% |
Expenses net of
fee waivers, if any | .75% | .78% | .68% | .68% | .69% |
Expenses net of all reductions | .74% | .78% | .67% | .67% | .65% |
Net investment income (loss) | .63% | 1.07% | 1.29% | .84% | .94% |
Supplemental Data | | | | | |
Net assets, end of period
(in millions) | $ 5,417 | $ 5,993 | $ 12,552 | $ 22,693 | $ 28,861 |
Portfolio turnover rate D | 98% | 122% | 52% | 52% | 120% |
A Total returns would have been lower had certain expenses not been reduced during the periods shown.
B Calculated based on average shares outstanding during the period.
C Fees and expenses of the underlying Fidelity Central Funds are not included in the Fund's expense ratio. The Fund indirectly bears its proportionate share of the expenses of any underlying Fidelity Central Funds.
D Amount does not include the portfolio activity of any underlying Fidelity Central Funds.
E Expense ratios reflect operating expenses of the class. Expenses before reductions do not reflect amounts reimbursed by the investment adviser or reductions from brokerage service arrangements or reductions from other expense offset arrangements and do not represent the amount paid by the class during periods when reimbursements or reductions occur. Expenses net of fee waivers reflect expenses after reimbursement by the investment adviser but prior to reductions from brokerage service arrangements or other expense offset arrangements. Expenses net of all reductions represent the net expenses paid by the class.
F Total distributions of $.10 per share is comprised of distributions from net investment income of $.095 and distributions from net realized gain of $.008 per share.
See accompanying notes which are an integral part of the financial statements.
Annual Report
Financial Highlights - Class K
Years ended July 31, | 2010 | 2009 | 2008 G |
Selected Per-Share Data | | | |
Net asset value, beginning of period | $ 14.38 | $ 21.88 | $ 25.34 |
Income from Investment Operations | | | |
Net investment income (loss) D | .13 | .16 | .09 |
Net realized and unrealized gain (loss) | 1.37 | (7.40) | (3.45) |
Total from investment operations | 1.50 | (7.24) | (3.36) |
Distributions from net investment income | (.13) | (.23) | (.10) |
Distributions from net realized gain | (.01) | (.03) | - |
Total distributions | (.14) I | (.26) | (.10) |
Net asset value, end of period | $ 15.74 | $ 14.38 | $ 21.88 |
Total Return B, C | 10.41% | (33.12)% | (13.22)% |
Ratios to Average Net Assets E, H | | | |
Expenses before reductions | .54% | .56% | .55% A |
Expenses net of fee waivers, if any | .54% | .56% | .55% A |
Expenses net of all reductions | .53% | .55% | .55% A |
Net investment income (loss) | .84% | 1.29% | 1.73% A |
Supplemental Data | | | |
Net assets, end of period (000 omitted) | $ 292,021 | $ 349,324 | $ 87 |
Portfolio turnover rate F | 98% | 122% | 52% |
A Annualized
B Total returns for periods of less than one year are not annualized.
C Total returns would have been lower had certain expenses not been reduced during the periods shown.
D Calculated based on average shares outstanding during the period.
E Fees and expenses of the underlying Fidelity Central Funds are not included in the Fund's expense ratio. The Fund indirectly bears its proportionate share of the expenses of any underlying Fidelity Central Funds.
F Amount does not include the portfolio activity of any underlying Fidelity Central Funds.
G For the period May 9, 2008 (commencement of sale of shares) to July 31, 2008.
H Expense ratios reflect operating expenses of the class. Expenses before reductions do not reflect amounts reimbursed by the investment adviser or reductions from brokerage service arrangements or reductions from other expense offset arrangements and do not represent the amount paid by the class during periods when reimbursements or reductions occur. Expense ratios before reductions for start-up periods may not be representative of longer-term operating periods. Expenses net of fee waivers reflect expenses after reimbursement by the investment adviser but prior to reductions from brokerage service arrangements or other expense offset arrangements. Expenses net of all reductions represent the net expenses paid by the class.
I Total distributions of $.14 per share is comprised of distributions from net investment income of $.129 and distributions from net realized gain of $.008 per share.
See accompanying notes which are an integral part of the financial statements.
Annual Report
Notes to Financial Statements
For the period ended July 31, 2010
(Amounts in thousands except ratios)
1. Organization.
Fidelity Growth & Income Portfolio (the Fund) is a fund of Fidelity Securities Fund (the Trust) and is authorized to issue an unlimited number of shares. The Trust is registered under the Investment Company Act of 1940, as amended (the 1940 Act), as an open-end management investment company organized as a Massachusetts business trust. The Fund offers Growth & Income and Class K shares, each of which has equal rights as to assets and voting privileges. Each class has exclusive voting rights with respect to matters that affect that class. After the commencement of Class K, the Fund began offering conversion privileges between Growth & Income and Class K to eligible shareholders of Growth & Income. Investment income, realized and unrealized capital gains and losses, the common expenses of the Fund, and certain fund-level expense reductions, if any, are allocated on a pro-rata basis to each class based on the relative net assets of each class to the total net assets of the Fund. Each class differs with respect to transfer agent fees incurred. Certain expense reductions also differ by class.
2. Investments in Fidelity Central Funds.
The Fund may invest in Fidelity Central Funds, which are open-end investment companies available only to other investment companies and accounts managed by Fidelity Management & Research Company (FMR) and its affiliates. The Fund's Schedule of Investments lists each of the Fidelity Central Funds held as of period end, if any, as an investment of the Fund, but does not include the underlying holdings of each Fidelity Central Fund. As an Investing Fund, the Fund indirectly bears its proportionate share of the expenses of the underlying Fidelity Central Funds.
The Money Market Central Funds seek preservation of capital and current income and are managed by Fidelity Investments Money Management, Inc. (FIMM), an affiliate of FMR.
A complete unaudited list of holdings for each Fidelity Central Fund is available upon request or at the Securities and Exchange Commission (the SEC) web site at www.sec.gov. In addition, the financial statements of the Fidelity Central Funds, which are not covered by the Fund's Report of Independent Registered Public Accounting Firm, are available on the SEC web site or upon request.
3. Significant Accounting Policies.
The financial statements have been prepared in conformity with accounting principles generally accepted in the United States of America (GAAP), which require management to make certain estimates and assumptions at the date of the financial statements. Actual results could differ from those estimates. The following summarizes the significant accounting policies of the Fund:
Security Valuation. Investments are valued as of 4:00 p.m. Eastern time on the last calendar day of the period. The Fund uses independent pricing services approved by the
Annual Report
Notes to Financial Statements - continued
(Amounts in thousands except ratios)
3. Significant Accounting Policies - continued
Security Valuation - continued
Board of Trustees to value its investments. When current market prices or quotations are not readily available or reliable, valuations may be determined in good faith in accordance with procedures adopted by the Board of Trustees. Factors used in determining value may include market or security specific events. The frequency with which these procedures are used cannot be predicted and they may be utilized to a significant extent. The value used for net asset value (NAV) calculation under these procedures may differ from published prices for the same securities.
The Fund categorizes the inputs to valuation techniques used to value its investments into a disclosure hierarchy consisting of three levels as shown below.
Level 1 - quoted prices in active markets for identical investments
Level 2 - other significant observable inputs (including quoted prices for similar investments, interest rates, prepayment speeds, etc.)
Level 3 - unobservable inputs (including the fund's own assumptions based on the best information available)
Changes in valuation techniques may result in transfers in or out of an assigned level within the disclosure hierarchy. The aggregate value of investments by input level, as of July 31, 2010, as well as a roll forward of Level 3 securities, is included at the end of the Fund's Schedule of Investments. Valuation techniques used to value the Fund's investments by major category are as follows.
Equity securities, including restricted securities, for which market quotations are readily available, are valued at the last reported sale price or official closing price as reported by an independent pricing service on the primary market or exchange on which they are traded and are categorized as Level 1 in the hierarchy. In the event there were no sales during the day or closing prices are not available, securities are valued at the last quoted bid price or may be valued using the last available price and are generally categorized as Level 2 in the hierarchy. For foreign equity securities, when significant market or security specific events arise, comparisons to the valuation of American Depositary Receipts (ADRs), futures contracts, Exchange-traded funds (ETFs) and certain indexes as well as quoted prices for similar securities are used and are categorized as Level 2 in the hierarchy in these circumstances. Utilizing these techniques may result in transfers between Level 1 and Level 2. For restricted equity securities and private placements where observable inputs are limited, assumptions about market activity and risk are used and are categorized as Level 3 in the hierarchy.
Annual Report
3. Significant Accounting Policies - continued
Security Valuation - continued
Investments in open-end mutual funds, including the Fidelity Central Funds, are valued at their closing net asset value each business day and are categorized as Level 1 in the hierarchy. Short-term securities with remaining maturities of sixty days or less for which quotations are not readily available are valued at amortized cost, which approximates fair value and are categorized as Level 2 in the hierarchy.
Foreign Currency. The Fund uses foreign currency contracts to facilitate transactions in foreign-denominated securities. Gains and losses from these transactions may arise from changes in the value of the foreign currency or if the counterparties do not perform under the contracts' terms.
Foreign-denominated assets, including investment securities, and liabilities are translated into U.S. dollars at the exchange rate at period end. Purchases and sales of investment securities, income and dividends received and expenses denominated in foreign currencies are translated into U.S. dollars at the exchange rate in effect on the transaction date.
The effects of exchange rate fluctuations on investments are included with the net realized and unrealized gain (loss) on investment securities. Other foreign currency transactions resulting in realized and unrealized gain (loss) are disclosed separately.
Investment Transactions and Income. For financial reporting purposes, the Fund's investment holdings and NAV include trades executed through the end of the last business day of the period. The NAV per share for processing shareholder transactions is calculated as of the close of business of the New York Stock Exchange (NYSE), normally 4:00 p.m. Eastern time and includes trades executed through the end of the prior business day. Gains and losses on securities sold are determined on the basis of identified cost and may include proceeds received from litigation. Dividend income is recorded on the ex-dividend date, except for certain dividends from foreign securities where the ex-dividend date may have passed, which are recorded as soon as the Fund is informed of the ex-dividend date. Non-cash dividends included in dividend income, if any, are recorded at the fair market value of the securities received. Distributions received on securities that represent a return of capital or capital gain are recorded as a reduction of cost of investments and/or as a realized gain. The Fund estimates the components of distributions received that may be considered return of capital distributions or capital gain distributions. Interest income and distributions from the Fidelity Central Funds are accrued as earned. Interest income includes coupon interest and amortization of premium and accretion of discount on debt securities. Investment income is recorded net of foreign taxes withheld where recovery of such taxes is uncertain.
Annual Report
Notes to Financial Statements - continued
(Amounts in thousands except ratios)
3. Significant Accounting Policies - continued
Expenses. Most expenses of the Trust can be directly attributed to a fund. Expenses which cannot be directly attributed are apportioned amongst each fund in the Trust. Expense estimates are accrued in the period to which they relate and adjustments are made when actual amounts are known.
Deferred Trustee Compensation. Under a Deferred Compensation Plan (the Plan), independent Trustees may elect to defer receipt of a portion of their annual compensation. Deferred amounts are invested in a cross-section of Fidelity funds, are marked-to-market and remain in the Fund until distributed in accordance with the Plan. The investment of deferred amounts and the offsetting payable to the Trustees are included in the accompanying Statement of Assets and Liabilities.
Income Tax Information and Distributions to Shareholders. Each year the Fund intends to qualify as a regulated investment company, including distributing substantially all of its taxable income and realized gains under Subchapter M of the Internal Revenue Code and filing its U.S. federal tax return. As a result, no provision for income taxes is required. As of July 31, 2010, the Fund did not have any unrecognized tax benefits in the accompanying financial statements. A fund's federal tax return is subject to examination by the Internal Revenue Service (IRS) for a period of three years. Foreign taxes are provided for based on the Fund's understanding of the tax rules and rates that exist in the foreign markets in which it invests.
Distributions are recorded on the ex-dividend date. Income dividends and capital gain distributions are declared separately for each class. Income and capital gain distributions are determined in accordance with income tax regulations, which may differ from GAAP.
Capital accounts within the financial statements are adjusted for permanent book-tax differences. These adjustments have no impact on net assets or the results of operations. Temporary book-tax differences will reverse in a subsequent period.
Book-tax differences are primarily due to foreign currency transactions, short term gain distributions from the Fidelity Central Funds, partnerships, deferred trustees compensation, capital loss carryforwards and losses deferred due to wash sales and excise tax regulations.
The federal tax cost of investment securities and unrealized appreciation (depreciation) as of period end were as follows:
Gross unrealized appreciation | $ 840,726 |
Gross unrealized depreciation | (394,526) |
Net unrealized appreciation (depreciation) | $ 446,200 |
| |
Tax Cost | $ 5,274,736 |
Annual Report
3. Significant Accounting Policies - continued
Income Tax Information and Distributions to Shareholders - continued
The tax-based components of distributable earnings as of period end were as follows:
Undistributed ordinary income | $ 1,602 |
Capital loss carryforward | $ (6,214,141) |
Net unrealized appreciation (depreciation) | $ 446,193 |
The tax character of distributions paid was as follows:
| July 31, 2010 | July 31, 2009 |
Ordinary Income | $ 42,065 | $ 95,086 |
Long-term Capital Gains | - | 16,566 |
Total | $ 42,065 | $ 111,652 |
4. Operating Policies.
Repurchase Agreements. FMR has received an Exemptive Order from the SEC which permits the Fund and other affiliated entities of FMR to transfer uninvested cash balances into joint trading accounts which are then invested in repurchase agreements. The Fund may also invest directly with institutions in repurchase agreements. Repurchase agreements are collateralized by government or non-government securities. Upon settlement date, collateral is held in segregated accounts with custodian banks and may be obtained in the event of a default of the counterparty. The Fund monitors, on a daily basis, the value of the collateral to ensure it is at least equal to the principal amount of the repurchase agreement (including accrued interest). In the event of a default by the counterparty, realization of the collateral proceeds could be delayed, during which time the value of the collateral may decline.
Restricted Securities. The Fund may invest in securities that are subject to legal or contractual restrictions on resale. These securities generally may be resold in transactions exempt from registration or to the public if the securities are registered. Disposal of these securities may involve time-consuming negotiations and expense, and prompt sale at an acceptable price may be difficult. Information regarding restricted securities is included at the end of the Fund's Schedule of Investments.
5. Purchases and Sales of Investments.
Purchases and sales of securities, other than short-term securities, aggregated $6,089,032 and $7,246,765, respectively.
Annual Report
Notes to Financial Statements - continued
(Amounts in thousands except ratios)
6. Fees and Other Transactions with Affiliates.
Management Fee. FMR and its affiliates provide the Fund with investment management related services for which the Fund pays a monthly management fee. The management fee is the sum of an individual fund fee rate that is based on an annual rate of .20% of the Fund's average net assets and a group fee rate that averaged .26% during the period. The group fee rate is based upon the average net assets of all the mutual funds advised by FMR. The group fee rate decreases as assets under management increase and increases as assets under management decrease. For the period, the total annual management fee rate was .46% of the Fund's average net assets.
Transfer Agent Fees. Fidelity Investments Institutional Operations Company, Inc. (FIIOC), an affiliate of FMR, is the transfer, dividend disbursing and shareholder servicing agent for each class of the Fund. FIIOC receives account fees and asset-based fees that vary according to the account size and type of account of the shareholders of Growth & Income. FIIOC receives an asset-based fee of Class K's average net assets. FIIOC pays for typesetting, printing and mailing of shareholder reports, except proxy statements. For the period, the total transfer agent fees paid by each class were as follows:
| Amount | % of
Average
Net Assets |
Growth & Income | $ 15,910 | .26 |
Class K | 160 | .06 |
| $ 16,070 | |
Accounting and Security Lending Fees. Fidelity Service Company, Inc. (FSC), an affiliate of FMR, maintains the Fund's accounting records. The accounting fee is based on the level of average net assets for the month. Under a separate contract, FSC administers the security lending program. The security lending fee is based on the number and duration of lending transactions.
Brokerage Commissions. The Fund placed a portion of its portfolio transactions with brokerage firms which are affiliates of the investment adviser. The commissions paid to these affiliated firms were $110 for the period.
Interfund Lending Program. Pursuant to an Exemptive Order issued by the SEC, the Fund, along with other registered investment companies having management contracts with FMR, may participate in an interfund lending program. This program provides an alternative credit facility allowing the funds to borrow from, or lend money to, other participating affiliated funds. At period end, there were no interfund loans outstanding.
Annual Report
6. Fees and Other Transactions with Affiliates - continued
Interfund Lending Program - continued
The Fund's activity in this program during the period for which loans were outstanding was as follows:
Borrower or Lender | Average Daily
Loan Balance | Weighted Average
Interest Rate | Interest
Expense |
Borrower | $ 13,789 | .41% | $ 5 |
7. Committed Line of Credit.
The Fund participates with other funds managed by FMR in a $3.75 billion credit facility (the "line of credit") to be utilized for temporary or emergency purposes to fund shareholder redemptions or for other short-term liquidity purposes. The Fund has agreed to pay commitment fees on its pro-rata portion of the line of credit, which amounted to $26 and is reflected in Miscellaneous expenses on the Statement of Operations. During the period, there were no borrowings on this line of credit.
8. Security Lending.
The Fund lends portfolio securities from time to time in order to earn additional income. On the settlement date of the loan, the Fund receives collateral (in the form of U.S. Treasury obligations, letters of credit and/or cash) against the loaned securities and maintains collateral in an amount not less than 100% of the market value of the loaned securities during the period of the loan. The market value of the loaned securities is determined at the close of business of the Fund and any additional required collateral is delivered to the Fund on the next business day. If the borrower defaults on its obligation to return the securities loaned because of insolvency or other reasons, a fund could experience delays and costs in recovering the securities loaned or in gaining access to the collateral. Any cash collateral received is invested in the Fidelity Securities Lending Cash Central Fund. The value of loaned securities and cash collateral at period end are disclosed on the Fund's Statement of Assets and Liabilities. Security lending income represents the income earned on investing cash collateral, less fees and expenses associated with the loan, plus any premium payments that may be received on the loan of certain types of securities. Security lending income is presented in the Statement of Operations as a component of income from Fidelity Central Funds. Net income from lending portfolio securities during the period amounted to $143.
9. Expense Reductions.
Many of the brokers with whom FMR places trades on behalf of the Fund provided services to the Fund in addition to trade execution. These services included payments of certain expenses on behalf of the Fund totaling $547 for the period.
Annual Report
Notes to Financial Statements - continued
(Amounts in thousands except ratios)
10. Distributions to Shareholders.
Distributions to shareholders of each class were as follows:
Years ended July 31, | 2010 | 2009 |
From net investment income | | |
Growth & Income | $ 36,263 | $ 92,019 |
Class K | 2,320 | 3,067 |
Total | $ 38,583 | $ 95,086 |
From net realized gain | | |
Growth & Income | $ 3,285 | $ 16,537 |
Class K | 197 | 29 |
Total | $ 3,482 | $ 16,566 |
11. Share Transactions.
Transactions for each class of shares were as follows:
| Shares | Dollars |
Years ended July 31, | 2010 A | 2009 | 2010 A | 2009 |
Growth & Income | | | | |
Shares sold | 18,939 | 34,825 | $ 300,805 | $ 492,141 |
Conversion to Class K | (593) | (26,363) | (8,751) | (389,259) |
Reinvestment of distributions | 2,436 | 6,899 | 38,201 | 105,157 |
Shares redeemed | (93,499) | (172,362) | (1,487,904) | (2,530,518) |
Net increase (decrease) | (72,717) | (157,001) | $ (1,157,649) | $ (2,322,479) |
Class K | | | | |
Shares sold | 8,408 | 3,336 | $ 133,367 | $ 44,336 |
Conversion from Growth & Income | 593 | 26,372 | 8,751 | 389,259 |
Reinvestment of distributions | 161 | 232 | 2,517 | 3,096 |
Shares redeemed | (14,911) | (5,644) | (234,674) | (67,387) |
Net increase (decrease) | (5,749) | 24,296 | $ (90,039) | $ 369,304 |
A Conversion transactions for Class K and Growth & Income are presented for the period August 1, 2009 through August 31, 2009.
12. Other.
The Fund's organizational documents provide former and current trustees and officers with a limited indemnification against liabilities arising in connection with the performance of their duties to the Fund. In the normal course of business, the Fund may also enter into contracts that provide general indemnifications. The Fund's maximum exposure under these arrangements is unknown as this would be dependent on future claims that may be made against the Fund. The risk of material loss from such claims is considered remote.
Annual Report
To the Trustees of Fidelity Securities Fund and the Shareholders of Fidelity Growth & Income Portfolio:
In our opinion, the accompanying statement of assets and liabilities, including the schedule of investments, and the related statements of operations and of changes in net assets and the financial highlights present fairly, in all material respects, the financial position of Fidelity Growth & Income Portfolio (a fund of Fidelity Securities Fund) at July 31, 2010, the results of its operations for the year then ended, the changes in its net assets for each of the two years in the period then ended and the financial highlights for each of the periods indicated, in conformity with accounting principles generally accepted in the United States of America. These financial statements and financial highlights (hereafter referred to as "financial statements") are the responsibility of the Fidelity Growth & Income Portfolio's management. Our responsibility is to express an opinion on these financial statements based on our audits. We conducted our audits of these financial statements in accordance with the standards of the Public Company Accounting Oversight Board (United States). Those standards require that we plan and perform the audit to obtain reasonable assurance about whether the financial statements are free of material misstatement. An audit includes examining, on a test basis, evidence supporting the amounts and disclosures in the financial statements, assessing the accounting principles used and significant estimates made by management, and evaluating the overall financial statement presentation. We believe that our audits, which included confirmation of securities at July 31, 2010 by correspondence with the custodian and brokers, provide a reasonable basis for our opinion.
/s/ PricewaterhouseCoopers LLP
PricewaterhouseCoopers LLP
Boston, Massachusetts
September 13, 2010
Annual Report
The Trustees, Member of the Advisory Board, and executive officers of the trust and fund, as applicable, are listed below. The Board of Trustees governs the fund and is responsible for protecting the interests of shareholders. The Trustees are experienced executives who meet periodically throughout the year to oversee the fund's activities, review contractual arrangements with companies that provide services to the fund, oversee management of the risks associated with such activities and contractual arrangements, and review the fund's performance. Except for James C. Curvey, each of the Trustees oversees 222 funds advised by FMR or an affiliate. Mr. Curvey oversees 411 funds advised by FMR or an affiliate.
The Trustees hold office without limit in time except that (a) any Trustee may resign; (b) any Trustee may be removed by written instrument, signed by at least two-thirds of the number of Trustees prior to such removal; (c) any Trustee who requests to be retired or who has become incapacitated by illness or injury may be retired by written instrument signed by a majority of the other Trustees; and (d) any Trustee may be removed at any special meeting of shareholders by a two-thirds vote of the outstanding voting securities of the trust. Each Trustee who is not an interested person (as defined in the 1940 Act) (Independent Trustee), shall retire not later than the last day of the calendar year in which his or her 72nd birthday occurs. The Independent Trustees may waive this mandatory retirement age policy with respect to individual Trustees. The executive officers and Advisory Board Member hold office without limit in time, except that any officer and Advisory Board Member may resign or may be removed by a vote of a majority of the Trustees at any regular meeting or any special meeting of the Trustees. Except as indicated, each individual has held the office shown or other offices in the same company for the past five years.
Experience, Skills, Attributes, and Qualifications of the Fund's Trustees. The Governance and Nominating Committee has adopted a statement of policy that describes the experience, qualifications, attributes, and skills that are necessary and desirable for potential Independent Trustee candidates (Statement of Policy). The Board believes that each Trustee satisfied at the time he or she was initially elected or appointed a Trustee, and continues to satisfy, the standards contemplated by the Statement of Policy. The Governance and Nominating Committee also engages professional search firms to help identify potential Independent Trustee candidates who have the experience, qualifications, attributes, and skills consistent with the Statement of Policy. From time to time, additional criteria based on the composition and skills of the current Independent Trustees, as well as experience or skills that may be appropriate in light of future changes to board composition, business conditions, and regulatory or other developments, have also been considered by the professional search firms and the Governance and Nominating Committee. In addition, the Board takes into account the Trustees' commitment and participation in Board and committee meetings, as well as their leadership of standing and ad hoc committees throughout their tenure.
In determining that a particular Trustee was and continues to be qualified to serve as a Trustee, the Board has considered a variety of criteria, none of which, in isolation, was controlling. The Board believes that, collectively, the Trustees have balanced and diverse experience, qualifications, attributes, and skills, which allow the Board to operate effectively in governing the fund and protecting the interests of shareholders. Information about the specific experience, skills, attributes, and qualifications of each Trustee, which in each case led to the Board's conclusion that the Trustee should serve (or continue to serve) as a trustee of the fund, is provided below.
Annual Report
Board Structure and Oversight Function. Edward C. Johnson 3d is an interested person (as defined in the 1940 Act) and currently serves as Chairman. The Trustees have determined that an interested Chairman is appropriate and benefits shareholders because an interested Chairman has a personal and professional stake in the quality and continuity of services provided to the fund. Independent Trustees exercise their informed business judgment to appoint an individual of their choosing to serve as Chairman, regardless of whether the Trustee happens to be independent or a member of management. The Independent Trustees have determined that they can act independently and effectively without having an Independent Trustee serve as Chairman and that a key structural component for assuring that they are in a position to do so is for the Independent Trustees to constitute a substantial majority for the Board. The Independent Trustees also regularly meet in executive session. Ned C. Lautenbach serves as Chairman of the Independent Trustees and as such (i) acts as a liaison between the Independent Trustees and management with respect to matters important to the Independent Trustees and (ii) with management prepares agendas for Board meetings.
Fidelity funds are overseen by different Boards of Trustees. The fund's Board oversees Fidelity's equity and high income funds and another Board oversees Fidelity's investment-grade bond, money market, and asset allocation funds. The asset allocation funds may invest in Fidelity funds overseen by the fund's Board. The use of separate Boards, each with its own committee structure, allows the Trustees of each group of Fidelity funds to focus on the unique issues of the funds they oversee, including common research, investment, and operational issues. On occasion, the separate Boards establish joint committees to address issues of overlapping consequences for the Fidelity funds overseen by each Board.
The Trustees operate using a system of committees to facilitate the timely and efficient consideration of all matters of importance to the Trustees, the fund, and fund shareholders and to facilitate compliance with legal and regulatory requirements and oversight of the fund's activities and associated risks. The Board, acting through its committees, has charged FMR and its affiliates with (i) identifying events or circumstances the occurrence of which could have demonstrably adverse effects on the fund's business and/or reputation; (ii) implementing processes and controls to lessen the possibility that such events or circumstances occur or to mitigate the effects of such events or circumstances if they do occur; and (iii) creating and maintaining a system designed to evaluate continuously business and market conditions in order to facilitate the identification and implementation processes described in (i) and (ii) above. Because the day-to-day operations and activities of the fund are carried out by or through FMR, its affiliates and other service providers, the fund's exposure to risks is mitigated but not eliminated by the processes overseen by the Trustees. While each of the Board's committees has responsibility for overseeing different aspects of the fund's activities, oversight is exercised primarily through the Operations, Audit, and Compliance Committees. Appropriate personnel, including but not limited to the fund's Chief Compliance Officer (CCO), FMR's internal auditor, the independent accountants, the fund's Treasurer and portfolio management personnel, make periodic reports to the Board's committees, as appropriate. The responsibilities of each committee, including their oversight responsibilities, are described further under "Standing Committees of the Fund's Trustees."
Annual Report
Trustees and Officers - continued
The fund's Statement of Additional Information (SAI) includes more information about the Trustees. To request a free copy, call Fidelity at 1-800-544-8544.
Interested Trustees*:
Correspondence intended for each Trustee who is an interested person may be sent to Fidelity Investments, 82 Devonshire Street, Boston, Massachusetts 02109.
Name, Age; Principal Occupations and Other Relevant Experience+ |
Edward C. Johnson 3d (80) |
| Year of Election or Appointment: 1984 Mr. Johnson is Trustee and Chairman of the Board of Trustees of certain Trusts. Mr. Johnson serves as Chief Executive Officer, Chairman, and a Director of FMR LLC; Chairman and a Director of FMR; Chairman and a Director of Fidelity Research & Analysis Company (FRAC); Chairman and a Director of Fidelity Investments Money Management, Inc.; and Chairman and a Director of FMR Co., Inc. In addition, Mr. Johnson serves as Chairman and Director of FIL Limited. Previously, Mr. Johnson served as President of FMR LLC (2006-2007). |
James C. Curvey (75) |
| Year of Election or Appointment: 2007 Mr. Curvey also serves as Trustee (2007-present) of other investment companies advised by FMR. Mr. Curvey is a Director of FMR and FMR Co., Inc. (2007-present). Mr. Curvey is also Vice Chairman (2006-present) and Director of FMR LLC. In addition, Mr. Curvey serves as an Overseer for the Boston Symphony Orchestra and a member of the Trustees of Villanova University. |
* Trustees have been determined to be "Interested Trustees" by virtue of, among other things, their affiliation with the trust or various entities under common control with FMR.
+ The information above includes each Trustee's principal occupation during the last five years and other information relating to the experience, attributes, and skills relevant to each Trustee's qualifications to serve as a Trustee, which led to the conclusion that each Trustee should serve as a Trustee for the fund.
Annual Report
Independent Trustees:
Correspondence intended for each Independent Trustee (that is, the Trustees other than the Interested Trustees) may be sent to Fidelity Investments, P.O. Box 55235, Boston, Massachusetts 02205-5235.
Name, Age; Principal Occupations and Other Relevant Experience+ |
Dennis J. Dirks (62) |
| Year of Election or Appointment: 2005 Prior to his retirement in May 2003, Mr. Dirks was Chief Operating Officer and a member of the Board of The Depository Trust & Clearing Corporation (DTCC). He also served as President, Chief Operating Officer, and Board member of The Depository Trust Company (DTC) and President and Board member of the National Securities Clearing Corporation (NSCC). In addition, Mr. Dirks served as Chief Executive Officer and Board member of the Government Securities Clearing Corporation, Chief Executive Officer and Board member of the Mortgage-Backed Securities Clearing Corporation, as a Trustee and a member of the Finance Committee of Manhattan College (2005-2008), and as a Trustee and a member of the Finance Committee of AHRC of Nassau County (2006-2008). Currently, Mr. Dirks serves as a member of the Board of Directors for The Brookville Center for Children's Services, Inc. (2009-present). |
Alan J. Lacy (56) |
| Year of Election or Appointment: 2008 Mr. Lacy serves as Senior Adviser (2007-present) of Oak Hill Capital Partners, L.P. (private equity). Mr. Lacy also served as Chief Executive Officer (2000-2005) and Vice Chairman (2005-2006) of Sears Holdings Corporation and Sears, Roebuck and Co. (retail). In addition, Mr. Lacy serves as a member of the Board of Directors of The Western Union Company (global money transfer, 2006-present) and Bristol-Myers Squibb Company (global pharmaceuticals, 2007-present). Mr. Lacy is Chairman (2008-present) and a member (2006-present) of the Board of Trustees of The National Parks Conservation Association. |
Ned C. Lautenbach (66) |
| Year of Election or Appointment: 2000 Mr. Lautenbach is Chairman of the Independent Trustees of the Equity and High Income Funds (2006-present). Mr. Lautenbach is an Advisory Partner of Clayton, Dubilier & Rice, Inc. (private equity investment, 2008-present) and was previously a Partner of Clayton, Dubilier & Rice, Inc. (1998-2008). Previously, Mr. Lautenbach was with the International Business Machines Corporation (IBM) from 1968 until his retirement in 1998. Mr. Lautenbach serves as a Director of Eaton Corporation (diversified industrial) as well as the Philharmonic Center for the Arts in Naples, Florida. Mr. Lautenbach is also a member of the Board of Trustees of Fairfield University (2005-present), as well as a member of the Council on Foreign Relations. Previously, Mr. Lautenbach served as a Director of Sony Corporation (2006-2007). |
Joseph Mauriello (65) |
| Year of Election or Appointment: 2008 Prior to his retirement in January 2006, Mr. Mauriello served in numerous senior management positions including Deputy Chairman and Chief Operating Officer (2004-2005), and Vice Chairman of Financial Services (2002-2004) of KPMG LLP US (professional services, 1965-2005). Mr. Mauriello currently serves as a member of the Board of Directors of XL Capital Ltd. (global insurance and re-insurance, 2006-present) and of Arcadia Resources Inc. (health care services and products, 2007-present). Previously, Mr. Mauriello served as a Director of the Hamilton Funds of the Bank of New York (2006-2007). |
Cornelia M. Small (66) |
| Year of Election or Appointment: 2005 Ms. Small is a member of the Board of Directors of the Teagle Foundation (2009-present). Ms. Small is also a member of the Investment Committee, and Chair (2008-present) and a member of the Board of Trustees of Smith College. In addition, Ms. Small serves on the Investment Committee of the Berkshire Taconic Community Foundation (2008-present). Previously, Ms. Small served as Chairperson of the Investment Committee (2002-2008) of Smith College. In addition, Ms. Small served as Chief Investment Officer, Director of Global Equity Investments, and a member of the Board of Directors of Scudder, Stevens & Clark and Scudder Kemper Investments. |
William S. Stavropoulos (71) |
| Year of Election or Appointment: 2002 Mr. Stavropoulos is Vice Chairman of the Independent Trustees of the Equity and High Income Funds (2006-present). Mr. Stavropoulos serves as President and Founder of the Michigan Baseball Foundation, the Great Lakes Loons (2007-present). Mr. Stavropoulos is Chairman Emeritus of the Board of Directors of The Dow Chemical Company, where he previously served in numerous senior management positions, including President, CEO (1995-2000; 2002-2004), Chairman of the Executive Committee (2000-2006), and as a member of the Board of Directors (1990-2006). Currently, Mr. Stavropoulos is a Director of Teradata Corporation (data warehousing and technology solutions, 2008-present), Chemical Financial Corporation, Maersk Inc. (industrial conglomerate), Tyco International, Inc. (multinational manufacturing and services, 2007-present), and a member of the Advisory Board for Metalmark Capital (private equity investment, 2005-present). Mr. Stavropoulos is a special advisor to Clayton, Dubilier & Rice, Inc. (private equity investment). In addition, Mr. Stavropoulos is a member of the University of Notre Dame Advisory Council for the College of Science. |
David M. Thomas (61) |
| Year of Election or Appointment: 2008 Previously, Mr. Thomas served as Executive Chairman (2005-2006) and Chairman and Chief Executive Officer (2000-2005) of IMS Health, Inc. (pharmaceutical and healthcare information solutions). In addition, Mr. Thomas serves as a member of the Board of Directors of Fortune Brands, Inc. (consumer products), and Interpublic Group of Companies, Inc. (marketing communication, 2004-present). |
Michael E. Wiley (59) |
| Year of Election or Appointment: 2008 Mr. Wiley also serves as a Director of Asia Pacific Exploration Consolidated (international oil and gas exploration and production, 2008-present), and as a member of the Board of Trustees of the University of Tulsa (2000-2006; 2007-present). Mr. Wiley serves as a Director of Tesoro Corporation (independent oil refiner and marketer, 2005-present), and a Director of Bill Barrett Corporation (exploration and production, 2005-present). In addition, Mr. Wiley also serves as a Director of Post Oak Bank (privately-held bank, 2004-present). Previously, Mr. Wiley served as a Sr. Energy Advisor of Katzenbach Partners, LLC (consulting, 2006-2007), as an Advisory Director of Riverstone Holdings (private investment), Chairman, President, and CEO of Baker Hughes, Inc. (oilfield services, 2000-2004), and as Director of Spinnaker Exploration Company (exploration and production, 2001-2005). |
+ The information above includes each Trustee's principal occupation during the last five years and other information relating to the experience, attributes, and skills relevant to each Trustee's qualifications to serve as a Trustee, which led to the conclusion that each Trustee should serve as a Trustee for the fund.
Advisory Board Member and Executive Officers:
Correspondence intended for each executive officer and Peter S. Lynch may be sent to Fidelity Investments, 82 Devonshire Street, Boston, Massachusetts 02109.
Name, Age; Principal Occupation |
Peter S. Lynch (66) |
| Year of Election or Appointment: 2003 Member of the Advisory Board of Fidelity's Equity and High Income Funds. Mr. Lynch is Vice Chairman and a Director of FMR and FMR Co., Inc. In addition, Mr. Lynch serves as a Trustee of Boston College and as the Chairman of the Inner-City Scholarship Fund. Previously, Mr. Lynch served on the Special Olympics International Board of Directors (1997-2006). |
Kenneth B. Robins (40) |
| Year of Election or Appointment: 2008 President and Treasurer of Fidelity's Equity and High Income Funds. Mr. Robins also serves as President and Treasurer (2010-present) and Assistant Treasurer (2009-present) of other Fidelity funds and is an employee of Fidelity Investments (2004-present). Previously, Mr. Robins served as Deputy Treasurer of the Fidelity funds (2005-2008) and Treasurer and Chief Financial Officer of The North Carolina Capital Management Trust: Cash and Term Portfolios (2006-2008). |
Bruce T. Herring (44) |
| Year of Election or Appointment: 2006 Vice President of certain Equity Funds. Mr. Herring also serves as Group Chief Investments Officer of FMR. Previously, Mr. Herring served as a portfolio manager for Fidelity U.S. Equity Funds. |
Brian B. Hogan (45) |
| Year of Election or Appointment: 2009 Vice President of certain Equity Funds and Vice President of Sector Funds. Mr. Hogan also serves as Senior Vice President, Equity Research of FMR (2006-present) and President of FMR's Equity Division (2009-present). Previously, Mr. Hogan served as a portfolio manager. |
Scott C. Goebel (42) |
| Year of Election or Appointment: 2008 Secretary and Chief Legal Officer (CLO) of the Fidelity funds. Mr. Goebel also serves as General Counsel, Secretary, and Senior Vice President of FMR (2008-present) and FMR Co., Inc. (2008-present); Deputy General Counsel of FMR LLC; Chief Legal Officer of Fidelity Management & Research (Hong Kong) Limited (2008-present) and Assistant Secretary of Fidelity Management & Research (Japan) Inc. (2008-present), Fidelity Investments Money Management, Inc. (2008-present), Fidelity Management & Research (U.K.) Inc. (2008-present), and Fidelity Research and Analysis Company (2008-present). Previously, Mr. Goebel served as Assistant Secretary of the Funds (2007-2008) and as Vice President and Secretary of Fidelity Distributors Corporation (FDC) (2005-2007). |
William C. Coffey (41) |
| Year of Election or Appointment: 2009 Assistant Secretary of Fidelity's Equity and High Income Funds. Mr. Coffey also serves as Senior Vice President and Deputy General Counsel of FMR LLC (2010-present), and is an employee of Fidelity Investments. Previously, Mr. Coffey served as Vice President and Associate General Counsel of FMR LLC (2005-2009). |
Holly C. Laurent (56) |
| Year of Election or Appointment: 2008 Anti-Money Laundering (AML) Officer of the Fidelity funds. Ms. Laurent is an employee of Fidelity Investments. Previously, Ms. Laurent was Senior Vice President and Head of Legal for Fidelity Business Services India Pvt. Ltd. (2006-2008), and Senior Vice President, Deputy General Counsel and Group Head for FMR LLC (2005-2006). |
Christine Reynolds (51) |
| Year of Election or Appointment: 2008 Chief Financial Officer of the Fidelity funds. Ms. Reynolds became President of Fidelity Pricing and Cash Management Services (FPCMS) in August 2008. Ms. Reynolds served as Chief Operating Officer of FPCMS (2007-2008). Previously, Ms. Reynolds served as President, Treasurer, and Anti-Money Laundering officer of the Fidelity funds (2004-2007). |
Kenneth A. Rathgeber (63) |
| Year of Election or Appointment: 2004 Chief Compliance Officer of Fidelity's Equity and High Income Funds. Mr. Rathgeber is Chief Compliance Officer of Fidelity Management & Research (Hong Kong) Limited (2008-present), Fidelity Management & Research (Japan) Inc. (2008-present), FMR (2005-present), FMR Co., Inc. (2005-present), Fidelity Management & Research (U.K.) Inc. (2005-present), Fidelity Research & Analysis Company (2005-present), Fidelity Investments Money Management, Inc. (2005-present), Pyramis Global Advisors, LLC (2005-present), and Strategic Advisers, Inc. (2005-present). |
Jeffrey S. Christian (48) |
| Year of Election or Appointment: 2009 Deputy Treasurer of the Fidelity funds. Mr. Christian is an employee of Fidelity Investments. Previously, Mr. Christian served as Chief Financial Officer (2008-2009) of certain Fidelity funds and Senior Vice President of Fidelity Pricing and Cash Management Services (FPCMS) (2004-2009). |
Bryan A. Mehrmann (49) |
| Year of Election or Appointment: 2005 Deputy Treasurer of the Fidelity funds. Mr. Mehrmann is an employee of Fidelity Investments. |
Adrien E. Deberghes (42) |
| Year of Election or Appointment: 2008 Deputy Treasurer of Fidelity's Equity and High Income Funds. Mr. Deberghes also serves as Assistant Treasurer of other Fidelity funds (2010-present) and is an employee of Fidelity Investments (2008-present). Previously, Mr. Deberghes served as Senior Vice President of Mutual Fund Administration at State Street Corporation (2007-2008), Senior Director of Mutual Fund Administration at Investors Bank & Trust (2005-2007), and Director of Finance for Dunkin' Brands (2000-2005). |
Stephanie J. Dorsey (41) |
| Year of Election or Appointment: 2010 Assistant Treasurer of Fidelity's Equity and High Income Funds. Ms. Dorsey also serves as Deputy Treasurer of other Fidelity funds (2008-present) and is an employee of Fidelity Investments (2008-present). Previously, Ms. Dorsey served as Treasurer (2004-2008) of the JPMorgan Mutual Funds and Vice President (2004-2008) of JPMorgan Chase Bank. |
John R. Hebble (52) |
| Year of Election or Appointment: 2009 Assistant Treasurer of Fidelity's Equity and High Income Funds. Mr. Hebble also serves as Treasurer and Chief Financial Officer of The North Carolina Capital Management Trust: Cash and Term Portfolio (2008-present), President and Treasurer of other Fidelity funds (2008-present) and is an employee of Fidelity Investments. |
Gary W. Ryan (51) |
| Year of Election or Appointment: 2005 Assistant Treasurer of the Fidelity funds. Mr. Ryan is an employee of Fidelity Investments. Previously, Mr. Ryan served as Vice President of Fund Reporting in Fidelity Pricing and Cash Management Services (FPCMS) (1999-2005). |
Annual Report
Growth & Income designates 100% during the fiscal year as qualifying for the dividends-received deduction for corporate shareholders.
Growth & Income designates 100% of the dividends distributed during the fiscal year as amounts which may be taken into account as a dividend for the purposes of the maximum rate under section 1(h)(11) of the Internal Revenue Code.
A total of 0.05% of the dividends distributed during the fiscal year was derived from interest on U.S. Government securities which is generally exempt from state income tax.
The fund will notify shareholders in January 2011 of amounts for use in preparing 2010 income tax returns.
Annual Report
Board Approval of Investment Advisory Contracts and Management Fees
Fidelity Growth & Income Portfolio
Each year, the Board of Trustees, including the Independent Trustees (together, the Board), votes on the renewal of the management contract and sub-advisory agreements (together, the Advisory Contracts) for the fund. The Board, assisted by the advice of fund counsel and Independent Trustees' counsel, requests and considers a broad range of information relevant to the renewal of the Advisory Contracts throughout the year.
The Board meets regularly and considers at each of its meetings factors that are relevant to its annual consideration of the renewal of the fund's Advisory Contracts, including the services and support provided to the fund and its shareholders. The Board has established various standing committees, each composed of Independent Trustees with varying backgrounds, to which the Board has assigned specific subject matter responsibilities in order to enhance effective decision-making by the Board. The Board, acting directly and through its Committees, requests and receives information concerning the annual consideration of the renewal of the fund's Advisory Contracts. The Board also meets as needed to consider matters specifically related to the Board's annual consideration of the renewal of Advisory Contracts. Members of the Board may also meet with trustees of other Fidelity funds through ad hoc joint committees to discuss certain matters relevant to the Fidelity funds.
At its July 2010 meeting, the Board of Trustees, including the Independent Trustees, unanimously determined to renew the fund's Advisory Contracts. In reaching its determination, the Board considered all factors it believed relevant, including (i) the nature, extent, and quality of the services to be provided to the fund and its shareholders (including the investment performance of the fund); (ii) the competitiveness of the fund's management fee and total expenses; (iii) the total costs of the services to be provided by and the profits to be realized by Fidelity from its relationship with the fund; (iv) the extent to which economies of scale would be realized as the fund grows; and (v) whether fee levels reflect these economies of scale, if any, for the benefit of fund shareholders.
In considering whether to renew the Advisory Contracts for the fund, the Board reached a determination, with the assistance of fund counsel and Independent Trustees' counsel and through the exercise of its business judgment, that the renewal of the Advisory Contracts is in the best interests of fund shareholders and that the compensation to be received by Fidelity under the management contract is fair and reasonable. The Board's decision to renew the Advisory Contracts was not based on any single factor noted above, but rather was based on a comprehensive consideration of all the information provided to the Board at its meetings throughout the year. The Board, in reaching its determination to renew the Advisory Contracts, is aware that shareholders in the fund have a broad range of investment choices available to them, including a wide choice among mutual funds offered by Fidelity's competitors, and that the fund's shareholders, with the opportunity to review and weigh the disclosure provided by the fund in its prospectus and other public disclosures, have chosen to invest in this fund, managed by Fidelity.
Annual Report
Board Approval of Investment Advisory Contracts and
Management Fees - continued
Nature, Extent, and Quality of Services Provided. The Board considered the staffing within the investment adviser, FMR, and the sub-advisers (together, the Investment Advisers), including the backgrounds of the fund's investment personnel and the fund's investment objective and discipline. The Independent Trustees also had discussions with senior management of Fidelity's investment operations and investment groups. The Board considered the structure of the portfolio manager compensation program and whether this structure provides appropriate incentives to act in the best interest of the fund.
Resources Dedicated to Investment Management and Support Services. The Board and the equity research subcommittee of the Board's Fund Oversight Committee reviewed the size, education, and experience of the Investment Advisers' investment staff, their use of technology, and the Investment Advisers' approach to recruiting, training, and retaining portfolio managers and other research, advisory, and management personnel. The Board noted that Fidelity's analysts have access to a variety of technological tools and market and securities data that enable them to perform both fundamental and quantitative analysis and to specialize in various disciplines. The Board considered Fidelity's extensive global research capabilities that enable the Investment Advisers to aggregate data from various sources in an effort to produce positive investment results. The Board also considered that Fidelity's portfolio managers and analysts have access to daily portfolio attribution that allows for monitoring of a fund's portfolio, as well as an electronic communication system that provides immediate real-time access to research concerning issuers and credit enhancers. The Board noted FMR's continued focus on strengthening the organization and discipline of equity portfolio management and research.
Shareholder and Administrative Services. The Board considered (i) the nature, extent, quality, and cost of advisory, administrative, and shareholder services performed by the Investment Advisers and their affiliates under the Advisory Contracts and under separate agreements covering transfer agency, pricing and bookkeeping, and securities lending services for the fund; (ii) the nature and extent of the investment adviser's supervision of third party service providers, principally custodians and subcustodians; and (iii) the resources devoted to, and the record of compliance with, the fund's compliance policies and procedures. The Board also reviewed the allocation of fund brokerage, including allocations to brokers affiliated with the Investment Advisers, the use of brokerage commissions to pay fund expenses, and the use of "soft" commission dollars to pay for research services.
The Board noted that the growth of fund assets over time across the complex allows Fidelity to reinvest in the development of services designed to enhance the value or convenience of the Fidelity funds as investment vehicles. These services include 24-hour access to account information and market information through phone representatives and over the Internet, and investor education materials and asset allocation tools.
Annual Report
Investment in a Large Fund Family. The Board considered the benefits to shareholders of investing in a Fidelity fund, including the benefits of investing in a fund that is part of a large family of funds offering a variety of investment disciplines and providing a large variety of mutual fund investor services. The Board noted that Fidelity had taken, or had made recommendations that resulted in the Fidelity funds taking, a number of actions over the previous year that benefited particular funds, including (i) dedicating additional resources to investment research and restructuring and broadening the focus of the investment research teams; (ii) bolstering the senior management team that oversees asset management; (iii) launching Class F of certain funds as a lower-fee class available to Freedom K and Freedom Index Funds; (iv) lowering the initial investment minimums and ongoing balance requirements for Real Estate High Income Fund; (v) eliminating subsequent purchase minimums for all funds and adding a waiver of the investment minimum requirement for new accounts opened with the proceeds of a systematic withdrawal plan; (vi) eliminating the withdrawal minimum and maximum limits for systematic withdrawals from Advisor funds; (vii) expanding sales load waivers on Class A shares for Destiny Planholders and expanding Institutional Class eligibility for Class O Destiny Planholders; and (viii) changing certain Class A and Class T sales charge structures to further align them with industry practices.
Investment Performance. The Board considered whether the fund has operated in accordance with its investment objective, as well as its record of compliance with its investment restrictions. It also reviewed the fund's absolute investment performance for each class, as well as the fund's relative investment performance for each class measured over multiple periods against (i) a broad-based securities market index, and (ii) a peer group of mutual funds deemed appropriate by Fidelity and reviewed by the Board. The following charts considered by the Board show, over the one-, three-, and five-year periods ended December 31, 2009, as available, the cumulative total returns of Class K and the retail class of the fund, the cumulative total returns of a broad-based securities market index ("benchmark"), and a range of cumulative total returns of a peer group of mutual funds identified by Morningstar, Inc. as having an investment style similar to that of the fund based on underlying portfolio holdings. The box within each chart shows the 25th percentile return (bottom of box) and the 75th percentile return (top of box) of the peer group. Returns shown above the box are in the first quartile and returns shown below the box are in the fourth quartile. The percentage beaten numbers noted below each chart correspond to the percentile box and represent the percentage of funds in the peer group whose performance was equal to or lower than that of the class indicated.
Annual Report
Board Approval of Investment Advisory Contracts and
Management Fees - continued
Fidelity Growth & Income Portfolio
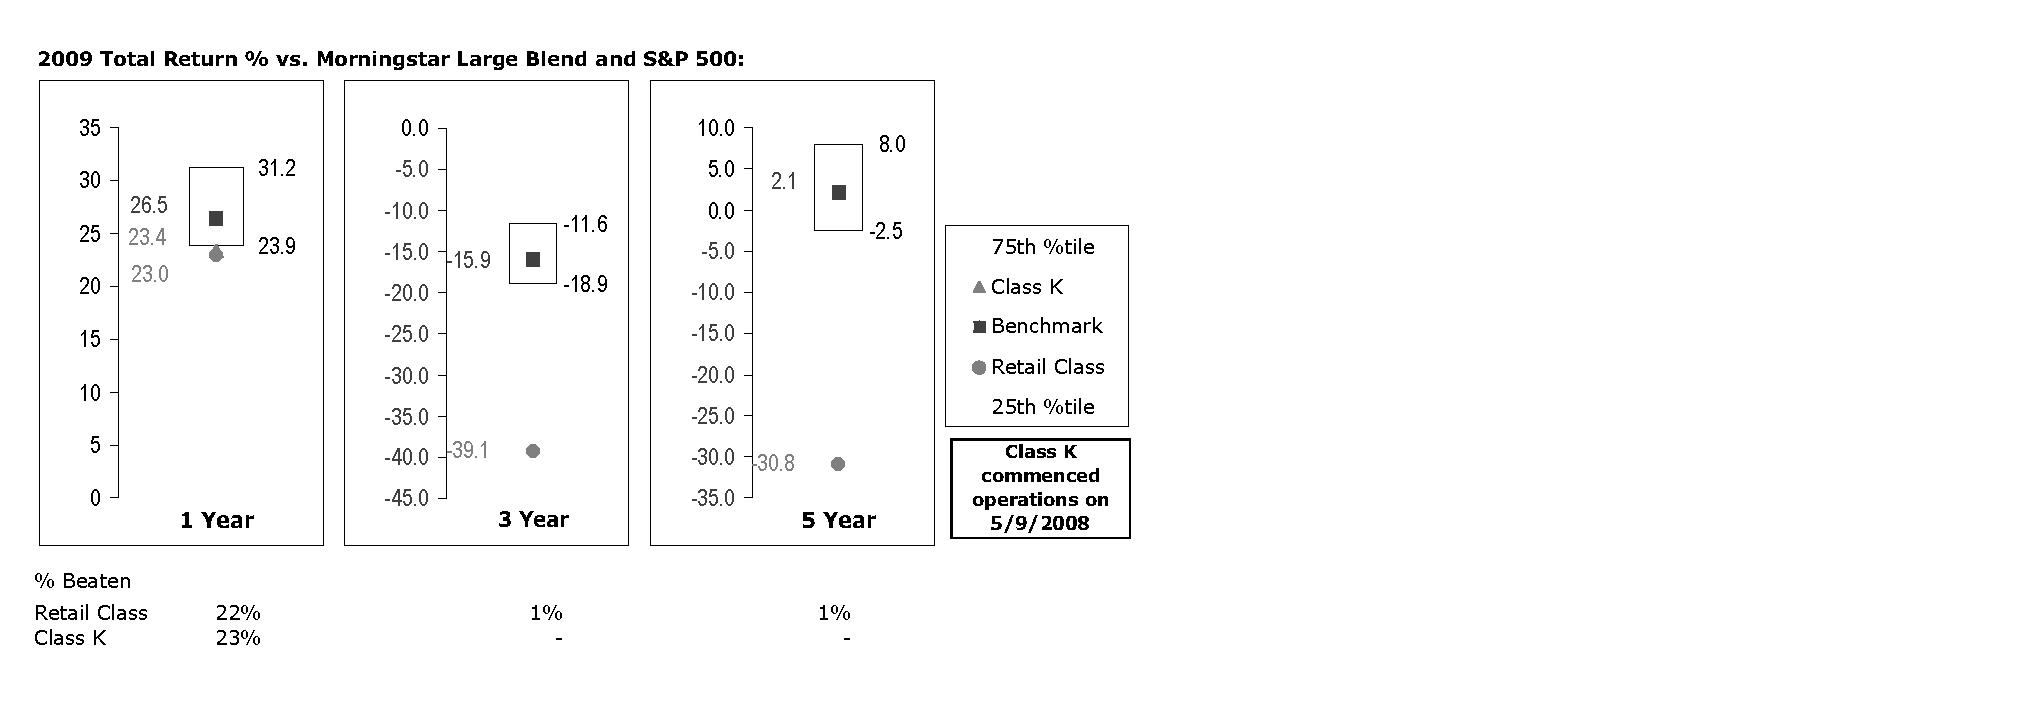
The Board reviewed the fund's relative investment performance against its peer group and noted that the performance of the retail class of the fund (the class with the longer performance record) was in the fourth quartile for all the periods shown. The Board also noted that the investment performance of the fund was lower than its benchmark for all the periods shown. The Board considered that the variations in performance between the fund's classes reflect the variations in class expenses, which result in lower performance for the higher expense class. The Board discussed with FMR actions that have been taken by FMR to improve the fund's disappointing performance relative to its peer group and benchmark. The Board noted that this fund had underperformed in the previous year and discussed with FMR its disappointment with the continued underperformance of the fund. The Board also reviewed the fund's performance since inception as well as performance in the current year. The Board will continue to closely monitor the performance of the fund in the coming year and discuss with FMR other appropriate actions to address the performance of the fund.
Based on its review, and giving particular weight to the nature and quality of the resources dedicated by the Investment Advisers to maintain and improve relative performance and factoring in the unprecedented market events in recent years, the Board concluded that the nature, extent, and quality of investment management and support services and of shareholder and administrative services provided to the fund will benefit the fund's shareholders, particularly in light of the Board's view that the fund's shareholders benefit from investing in a fund that is part of a large family of funds offering a variety of investment disciplines and services.
Annual Report
Competitiveness of Management Fee and Total Fund Expenses. The Board considered the fund's management fee and total expenses compared to "mapped groups" of competitive funds and classes. Fidelity creates "mapped groups" by combining similar Lipper investment objective categories that have comparable management fee characteristics. Combining Lipper investment objective categories aids the Board's management fee and total expense comparisons by broadening the competitive group used for comparison and by reducing the number of universes to which various Fidelity funds are compared.
Management Fee. The Board considered two proprietary management fee comparisons for the 12-month periods shown in the chart below. The group of Lipper funds used by the Board for management fee comparisons is referred to below as the "Total Mapped Group." The Total Mapped Group comparison focuses on a fund's standing relative to the total universe of comparable funds available to investors, in terms of gross management fees before expense reimbursements or caps. "TMG %" represents the percentage of funds in the Total Mapped Group that had management fees that were lower than the fund's. For example, a TMG % of 12% means that 88% of the funds in the Total Mapped Group had higher management fees than the fund. The "Asset-Size Peer Group" (ASPG) comparison focuses on a fund's standing relative to non-Fidelity funds similar in size to the fund within the Total Mapped Group. The ASPG represents at least 15% of the funds in the Total Mapped Group with comparable asset size and management fee characteristics, subject to a minimum of 50 funds (or all funds in the Total Mapped Group if fewer than 50). Additional information, such as the ASPG quartile in which the fund's management fee ranked, is also included in the chart and considered by the Board.
Fidelity Growth & Income Portfolio
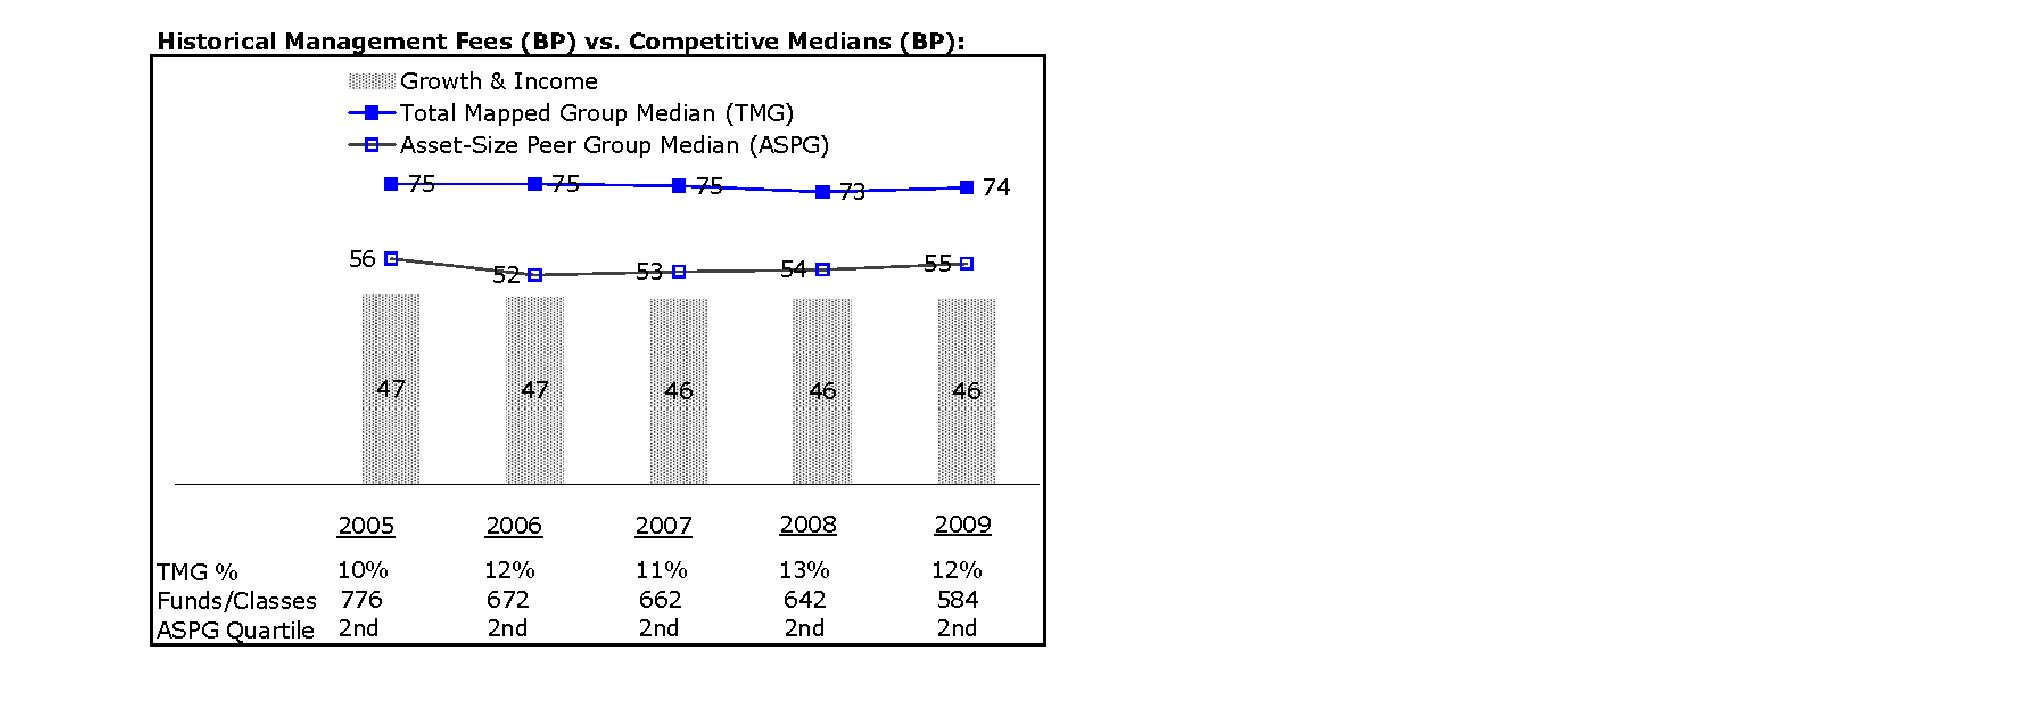
Annual Report
Board Approval of Investment Advisory Contracts and
Management Fees - continued
The Board noted that the fund's management fee ranked below the median of its Total Mapped Group and below the median of its ASPG for 2009.
Based on its review, the Board concluded that the fund's management fee is fair and reasonable in light of the services that the fund receives and the other factors considered.
Total Expenses. In its review of each class's total expenses, the Board considered the fund's management fee as well as other fund or class expenses, as applicable, such as transfer agent fees, pricing and bookkeeping fees, and custodial, legal, and audit fees. The Board also noted the effects of any waivers and reimbursements on fees and expenses. As part of its review, the Board also considered current and historical total expenses of each class of the fund compared to competitive fund median expenses. Each class of the fund is compared to those funds and classes in the Total Mapped Group (used by the Board for management fee comparisons) that have a similar sales load structure.
The Board noted that the total expenses of each class ranked below its competitive median for 2009.
Fees Charged to Other Fidelity Clients. The Board also considered Fidelity fee structures and other information with respect to clients of FMR and its affiliates, such as other mutual funds advised or subadvised by FMR or its affiliates, pension plan clients, and other institutional clients. In March 2010, the Board created an ad hoc joint committee with the board of other Fidelity funds (the Committee) to review and compare Fidelity's institutional investment advisory business with its business of providing services to the Fidelity funds, including the differences in services provided, fees charged, and costs incurred, as well as competition in their respective marketplaces.
Based on its review of total expenses and fees charged to other Fidelity clients, the Board concluded that the total expenses of each class of the fund were reasonable in light of the services that the fund and its shareholders receive and the other factors considered, including the findings of the Committee.
Costs of the Services and Profitability. The Board considered the revenues earned and the expenses incurred by Fidelity in conducting the business of developing, marketing, distributing, managing, administering and servicing the fund and its shareholders. The Board also considered the level of Fidelity's profits in respect of all the Fidelity funds.
On an annual basis, FMR presents to the Board Fidelity's profitability for the fund. Fidelity calculates the profitability for each fund, as well as aggregate profitability for groups of Fidelity funds and all Fidelity funds, using a series of detailed revenue and cost allocation methodologies which originate with the audited books and records of Fidelity. The Audit Committee of the Board reviews any significant changes from the prior year's methodologies.
Annual Report
PricewaterhouseCoopers LLP (PwC), independent registered public accounting firm and auditor to Fidelity and certain Fidelity funds, has been engaged annually by the Board as part of the Board's assessment of Fidelity's profitability analysis. PwC's engagement includes the review and assessment of Fidelity's methodologies used in determining the revenues and expenses attributable to Fidelity's mutual fund business, and completion of agreed-upon procedures surrounding the mathematical accuracy of fund profitability and its conformity to allocation methodologies. After considering PwC's reports issued under the engagement and information provided by Fidelity, the Board believes that while other allocation methods may also be reasonable, Fidelity's profitability methodologies are reasonable in all material respects.
The Board has also reviewed Fidelity's non-fund businesses and fall-out benefits related to the mutual fund business as well as cases where Fidelity's affiliates may benefit from or be related to the fund's business.
The Board considered the costs of the services provided by and the profits realized by Fidelity in connection with the operation of the fund and were satisfied that the profitability was not excessive in the circumstances.
Economies of Scale. The Board considered whether there have been economies of scale in respect of the management of the Fidelity funds, whether the Fidelity funds (including the fund) have appropriately benefited from any such economies of scale, and whether there is potential for realization of any further economies of scale. The Board considered the extent to which the fund will benefit from economies of scale through increased services to the fund, through waivers or reimbursements, or through fee or expense reductions.
In February 2009, the Board and the board of other Fidelity funds created an ad hoc committee (the Economies of Scale Committee) to analyze whether FMR attains economies of scale in respect of the management and servicing of the Fidelity funds, whether the Fidelity funds have appropriately benefited from such economies of scale, and whether there is potential for realization of any further economies of scale.
The Board recognized that the fund's management contract incorporates a "group fee" structure, which provides for lower group fee rates as total fund assets under FMR's management increase, and for higher group fee rates as total fund assets under FMR's management decrease. FMR calculates the group fee rates based on a tiered asset "breakpoint" schedule that varies based on asset class. The Board considered that the group fee is designed to deliver the benefits of economies of scale to fund shareholders when total Fidelity fund assets increase, even if assets of any particular fund are unchanged or have declined, because some portion of Fidelity's costs are attributable to services provided to all Fidelity funds, and all funds benefit if those costs can be allocated among more assets. The Board concluded that, given the group fee structure, fund shareholders will benefit from lower management fees as assets under FMR's management increase at the fund complex level, regardless of whether Fidelity achieves any such economies of scale.
Annual Report
Board Approval of Investment Advisory Contracts and
Management Fees - continued
The Board concluded, considering the findings of the Economies of Scale Committee, that any potential economies of scale are being appropriately shared between fund shareholders and Fidelity.
Additional Information Requested by the Board. In order to develop fully the factual basis for consideration of the Fidelity funds' Advisory Contracts, the Board requested and received additional information on certain topics, including (i) fund performance trends, actions to be taken by FMR to improve certain funds' overall performance, and Fidelity's long-term strategies for certain funds; (ii) portfolio manager changes that have occurred during the past year and length of portfolio manager tenure for different categories of funds over time; (iii) Fidelity's compensation structure for portfolio managers, research analysts, and other key personnel, the rationale for the compensation structure, and how the compensation structure provides appropriate performance incentives; (iv) the amount of the investment that each portfolio manager has made in the Fidelity fund(s) that he or she manages; (v) management and other fees paid by FMR to affiliated sub-advisers on behalf of the Fidelity funds; (vi) Fidelity's fee structures and rationale for recommending different fees among different categories of funds; (vii) Fidelity's rationale for recommending which funds should have a performance adjustment component as part of their management fees; (viii) the rationale for any differences between fund fee structures and fee structures in place for other Fidelity clients; and (ix) explanations regarding the relative total expenses borne by certain funds and classes, total expense competitive trends, and actions that might be taken by FMR to reduce total expenses for certain funds and classes.
Based on its evaluation of all of the conclusions noted above, and after considering all factors it believed relevant, the Board ultimately concluded that the advisory fee structures are fair and reasonable, and that the fund's Advisory Contracts should be renewed.
Annual Report
Managing Your Investments
Fidelity offers several ways to conveniently manage your personal investments via your telephone or PC. You can access your account information, conduct trades and research your investments 24 hours a day.
By Phone
Fidelity Automated Service Telephone provides a single toll-free number to access account balances, positions, quotes and trading. It's easy to navigate the service, and on your first call, the system will help you create a personal identification number (PIN) for security.
(phone_graphic)
Fidelity Automated
Service Telephone (FAST®)
1-800-544-5555
Press
For mutual fund and brokerage trading.
For quotes.*
For account balances and holdings.
To review orders and mutual
fund activity.
To change your PIN.
To speak to a Fidelity representative.
By PC
Fidelity's web site on the Internet provides a wide range of information, including daily financial news, fund performance, interactive planning tools and news about Fidelity products and services.
(computer_graphic)
Fidelity's Web Site
www.fidelity.com
* When you call the quotes line, please remember that a fund's yield and return will vary and, except for money market funds, share price will also vary. This means that you may have a gain or loss when you sell your shares. There is no assurance that money market funds will be able to maintain a stable $1 share price; an investment in a money market fund is not insured or guaranteed by the U.S. government. Total returns are historical and include changes in share price, reinvestment of dividends and capital gains, and the effects of any sales charges.
Annual Report
To Visit Fidelity
For directions and hours,
please call 1-800-544-9797.
Arizona
7001 West Ray Road
Chandler, AZ
15445 N. Scottsdale Road
Scottsdale, AZ
17550 North 75th Avenue
Glendale, AZ
5330 E. Broadway Blvd
Tucson, AZ
California
815 East Birch Street
Brea, CA
1411 Chapin Avenue
Burlingame, CA
851 East Hamilton Avenue
Campbell, CA
601 Larkspur Landing Circle
Larkspur, CA
2000 Avenue of the Stars
Los Angeles, CA
27101 Puerta Real
Mission Viejo, CA
73575 El Paseo
Palm Desert, CA
251 University Avenue
Palo Alto, CA
123 South Lake Avenue
Pasadena, CA
16656 Bernardo Ctr. Drive
Rancho Bernardo, CA
1220 Roseville Parkway
Roseville, CA
1740 Arden Way
Sacramento, CA
7676 Hazard Center Drive
San Diego, CA
11943 El Camino Real
San Diego, CA
8 Montgomery Street
San Francisco, CA
3793 State Street
Santa Barbara, CA
1200 Wilshire Boulevard
Santa Monica, CA
398 West El Camino Real
Sunnyvale, CA
111 South Westlake Blvd
Thousand Oaks, CA
21701 Hawthorne Boulevard
Torrance, CA
2001 North Main Street
Walnut Creek, CA
6326 Canoga Avenue
Woodland Hills, CA
2211 Michelson Drive
Irvine, CA
Colorado
281 East Flatiron Circle
Broomfield, CO
1625 Broadway
Denver, CO
9185 Westview Road
Lone Tree, CO
Connecticut
48 West Putnam Avenue
Greenwich, CT
265 Church Street
New Haven, CT
300 Atlantic Street
Stamford, CT
29 South Main Street
West Hartford, CT
1261 Post Road
Fairfield, CT
Delaware
400 Delaware Avenue
Wilmington, DE
Florida
175 East Altamonte Drive
Altamonte Springs, FL
1400 Glades Road
Boca Raton, FL
121 Alhambra Plaza
Coral Gables, FL
2948 N. Federal Highway
Ft. Lauderdale, FL
4671 Town Center Parkway
Jacksonville, FL
8880 Tamiami Trail, North
Naples, FL
230 Royal Palm Way
Palm Beach, FL
3501 PGA Boulevard
Palm Beach Gardens, FL
3550 Tamiami Trail, South
Sarasota, FL
1502 N. Westshore Blvd.
Tampa, FL
2465 State Road 7
Wellington, FL
Georgia
3242 Peachtree Road
Atlanta, GA
1000 Abernathy Road
Atlanta, GA
Illinois
One North LaSalle Street
Chicago, IL
401 North Michigan Avenue
Chicago, IL
One Skokie Valley Road
Highland Park, IL
1415 West 22nd Street
Oak Brook, IL
15105 S LaGrange Road
Orland Park, IL
1572 East Golf Road
Schaumburg, IL
1823 Freedom Drive
Naperville, IL
Indiana
8480 Keystone Crossing
Indianapolis, IN
Kansas
5400 College Boulevard
Overland Park, KS
Maine
Three Canal Plaza
Portland, ME
Maryland
7315 Wisconsin Avenue
Bethesda, MD
610 York Road
Towson, MD
Massachusetts
801 Boylston Street
Boston, MA
155 Congress Street
Boston, MA
300 Granite Street
Braintree, MA
44 Mall Road
Burlington, MA
238 Main Street
Cambridge, MA
200 Endicott Street
Danvers, MA
Annual Report
405 Cochituate Road
Framingham, MA
551 Boston Turnpike
Shrewsbury, MA
Michigan
500 E. Eisenhower Pkwy.
Ann Arbor, MI
280 N. Old Woodward Ave.
Birmingham, MI
30200 Northwestern Hwy.
Farmington Hills, MI
43420 Grand River Avenue
Novi, MI
3480 28th Street
Grand Rapids, MI
2425 S. Linden Road STE E
Flint, MI
Minnesota
7740 France Avenue South
Edina, MN
8342 3rd Street North
Oakdale, MN
Missouri
1524 South Lindbergh Blvd.
St. Louis, MO
Nevada
2225 Village Walk Drive
Henderson, NV
New Jersey
501 Route 73 South
Marlton, NJ
150 Essex Street
Millburn, NJ
35 Morris Street
Morristown, NJ
396 Route 17, North
Paramus, NJ
3518 Route 1 North
Princeton, NJ
530 Broad Street
Shrewsbury, NJ
New Mexico
2261 Q Street NE
Albuquerque, NM
New York
1130 Franklin Avenue
Garden City, NY
37 West Jericho Turnpike
Huntington Station, NY
1271 Avenue of the Americas
New York, NY
980 Madison Avenue
New York, NY
61 Broadway
New York, NY
350 Park Avenue
New York, NY
200 Fifth Avenue
New York, NY
733 Third Avenue
New York, NY
2070 Broadway
New York, NY
1075 Northern Blvd.
Roslyn, NY
799 Central Park Avenue
Scarsdale, NY
3349 Monroe Avenue
Rochester, NY
North Carolina
4611 Sharon Road
Charlotte, NC
7011 Fayetteville Road
Durham, NC
Ohio
3805 Edwards Road
Cincinnati, OH
1324 Polaris Parkway
Columbus, OH
1800 Crocker Road
Westlake, OH
28699 Chagrin Boulevard
Woodmere Village, OH
Oregon
7493 SW Bridgeport Road
Tigard, OR
Pennsylvania
600 West DeKalb Pike
King of Prussia, PA
1735 Market Street
Philadelphia, PA
12001 Perry Highway
Wexford, PA
Rhode Island
10 Memorial Boulevard
Providence, RI
Tennessee
3018 Peoples Street
Johnson City, TN
7628 West Farmington Blvd.
Germantown, TN
2035 Mallory Lane
Franklin, TN
Texas
10000 Research Boulevard
Austin, TX
4001 Northwest Parkway
Dallas, TX
12532 Memorial Drive
Houston, TX
2701 Drexel Drive
Houston, TX
6560 Fannin Street
Houston, TX
1701 Lake Robbins Drive
The Woodlands, TX
6500 N. MacArthur Blvd.
Irving, TX
6005 West Park Boulevard
Plano, TX
1576 East Southlake Blvd.
Southlake, TX
15600 Southwest Freeway
Sugar Land, TX
139 N. Loop 1604 East
San Antonio, TX
Utah
279 West South Temple
Salt Lake City, UT
Virginia
1861 International Drive
McLean, VA
11957 Democracy Drive
Reston, VA
Washington
10500 NE 8th Street
Bellevue, WA
1518 6th Avenue
Seattle, WA
304 Strander Blvd
Tukwila, WA
Washington, DC
1900 K Street, N.W.
Washington, DC
Wisconsin
16020 West Bluemound Road
Brookfield, WI
Fidelity Brokerage Services, Inc., 100 Summer St., Boston, MA 02110 Member NYSE/SIPC
Annual Report
To Write Fidelity
We'll give your correspondence immediate attention and send you written confirmation upon completion of your request.
(letter_graphic)
Making Changes
To Your Account
(such as changing name, address, bank, etc.)
Fidelity Investments
P.O. Box 770001
Cincinnati, OH 45277-0002
(letter_graphic)
For Non-Retirement
Accounts
Buying shares
Fidelity Investments
P.O. Box 770001
Cincinnati, OH 45277-0003
Overnight Express
Fidelity Investments
Attn: Distribution Services
100 Crosby Parkway - KC1H
Covington, KY 41015
Selling shares
Fidelity Investments
P.O. Box 770001
Cincinnati, OH 45277-0035
Overnight Express
Fidelity Investments
Attn: Distribution Services
100 Crosby Parkway - KC1H
Covington, KY 41015
General Correspondence
Fidelity Investments
P.O. Box 500
Merrimack, NH 03054-0500
(letter_graphic)
For Retirement
Accounts
Buying shares
Fidelity Investments
P.O. Box 770001
Cincinnati, OH 45277-0003
Selling shares
Fidelity Investments
P.O. Box 770001
Cincinnati, OH 45277-0035
Overnight Express
Fidelity Investments
Attn: Distribution Services
100 Crosby Parkway - KC1H
Covington, KY 41015
General Correspondence
Fidelity Investments
P.O. Box 500
Merrimack, NH 03054-0500
Annual Report
Investment Adviser
Fidelity Management & Research Company
Boston, MA
Investment Sub-Advisers
FMR Co., Inc.
Fidelity Research & Analysis Company
Fidelity Management & Research
(U.K.) Inc.
Fidelity Management & Research
(Japan) Inc.
Fidelity Management & Research
(Hong Kong) Limited
General Distributor
Fidelity Distributors Corporation
Boston, MA
Transfer and Service Agents
Fidelity Investments Institutional
Operations Company, Inc.
Boston, MA
Fidelity Service Company, Inc.
Boston, MA
Custodian
JPMorgan Chase Bank
New York, NY
GAI-UANN-0910
1.874515.102
Fidelity®
Growth & Income
Portfolio -
Class K
Annual Report
July 31, 2010
(2_fidelity_logos) (Registered_Trademark)
Contents
Chairman's Message | <Click Here> | The Chairman's message to shareholders. |
Performance | <Click Here> | How the fund has done over time. |
Management's Discussion of Fund Performance | <Click Here> | The Portfolio Manager's review of fund
performance and strategy. |
Shareholder Expense Example | <Click Here> | An example of shareholder expenses. |
Investment Changes | <Click Here> | A summary of major shifts in the fund's investments over the past six months. |
Investments | <Click Here> | A complete list of the fund's investments with their market values. |
Financial Statements | <Click Here> | Statements of assets and liabilities, operations, and changes in net assets,
as well as financial highlights. |
Notes | <Click Here> | Notes to the financial statements. |
Report of Independent Registered Public Accounting Firm | <Click Here> | |
Trustees and Officers | <Click Here> | |
Distributions | <Click Here> | |
Board Approval of Investment Advisory Contracts and Management Fees | <Click Here> | |
To view a fund's proxy voting guidelines and proxy voting record for the 12-month period ended June 30, visit http://www.fidelity.com/proxyvotingresults or visit the Securities and Exchange Commission's (SEC) web site at http://www.sec.gov. You may also call 1-800-835-5092 to request a free copy of the proxy voting guidelines.
Standard & Poor's, S&P and S&P 500 are registered service marks of The McGraw-Hill Companies, Inc. and have been licensed for use by Fidelity Distributors Corporation.
Other third party marks appearing herein are the property of their respective owners.
All other marks appearing herein are registered or unregistered trademarks or service marks of FMR LLC or an affiliated company.
Annual Report
This report and the financial statements contained herein are submitted for the general information of the shareholders of the fund. This report is not authorized for distribution to prospective investors in the fund unless preceded or accompanied by an effective prospectus.
A fund files its complete schedule of portfolio holdings with the SEC for the first and third quarters of each fiscal year on Form N-Q. Forms N-Q are available on the SEC's web site at http://www.sec.gov. A fund's Forms N-Q may be reviewed and copied at the SEC's Public Reference Room in Washington, DC. Information regarding the operation of the SEC's Public Reference Room may be obtained by calling 1-800-SEC-0330. For a complete list of a fund's portfolio holdings, view the most recent holdings listing, semiannual report, or annual report on Fidelity's web site at http://www.fidelity.com or http://www.fidelity.advisor.com, as applicable.
NOT FDIC INSURED • MAY LOSE VALUE • NO BANK GUARANTEE
Neither the fund nor Fidelity Distributors Corporation is a bank.
Annual Report
(photo_of_Edward_C_Johnson_3d)
Dear Shareholder:
A yearlong uptrend in global equity markets reversed course in late April 2010 when investor sentiment turned bearish due in great measure to concern that Europe's debt crisis would expand and slow or derail economic recovery. However, a bounceback in July helped to recover some of the ground that was lost. Financial markets are always unpredictable, of course, but there also are several time-tested investment principles that can help put the odds in your favor.
One of the basic tenets is to invest for the long term. Over time, riding out the markets' inevitable ups and downs has proven much more effective than selling into panic or chasing the hottest trend. Even missing only a few of the markets' best days can significantly diminish investor returns. Patience also affords the benefits of compounding - of earning interest on additional income or reinvested dividends and capital gains. There can be tax advantages and cost benefits to consider as well. While staying the course doesn't eliminate risk, it can considerably lessen the effect of short-term declines.
You can further manage your investing risk through diversification. And today, more than ever, geographic diversification should be taken into account. Studies indicate that asset allocation is the single most important determinant of a portfolio's long-term success. The right mix of stocks, bonds and cash - aligned to your particular risk tolerance and investment objective - is very important. Age-appropriate rebalancing is also an essential aspect of asset allocation. For younger investors, an emphasis on equities - which historically have been the best-performing asset class over time - is encouraged. As investors near their specific goal, such as retirement or sending a child to college, consideration may be given to replacing volatile assets (e.g. common stocks) with more-stable fixed investments (bonds or savings plans).
A third principle - investing regularly - can help lower the average cost of your purchases. Investing a certain amount of money each month or quarter helps ensure you won't pay for all your shares at market highs. This strategy - known as dollar cost averaging - also reduces "emotion" from investing, helping shareholders avoid selling weak performers just prior to an upswing, or chasing a hot performer just before a correction.
We invite you to contact us via the Internet, through our Investor Centers or by phone. It is our privilege to provide you the information you need to make the investments that are right for you.
Sincerely,
(The chairman's signature appears here.)
Edward C. Johnson 3d
Annual Report
Average annual total return reflects the change in the value of an investment, assuming reinvestment of the class' distributions from dividend income and capital gains (the profits earned upon the sale of securities that have grown in value, if any) and assuming a constant rate of performance each year. The $10,000 table and the fund's returns do not reflect the deduction of taxes that a shareholder would pay on fund distributions or the redemption of fund shares. During periods of reimbursement by Fidelity, a fund's total return will be greater than it would be had the reimbursement not occurred. How a fund did yesterday is no guarantee of how it will do tomorrow.
Average Annual Total Returns
Periods ended July 31, 2010 | Past 1
year | Past 5
years | Past 10
years |
Class K A | 10.41% | -7.54% | -4.18% |
A The initial offering of Class K shares took place on May 9, 2008. Returns prior to May 9, 2008 are those of Fidelity Growth & Income Portfolio, the
original class of the fund.
$10,000 Over 10 Years
Let's say hypothetically that $10,000 was invested in Fidelity® Growth & Income Portfolio - Class K on July 31, 2000. The chart shows how the value of your investment would have changed, and also shows how the S&P 500® Index performed over the same period. The initial offering of Class K took place on May 9, 2008. See above for additional information regarding the performance of Class K.
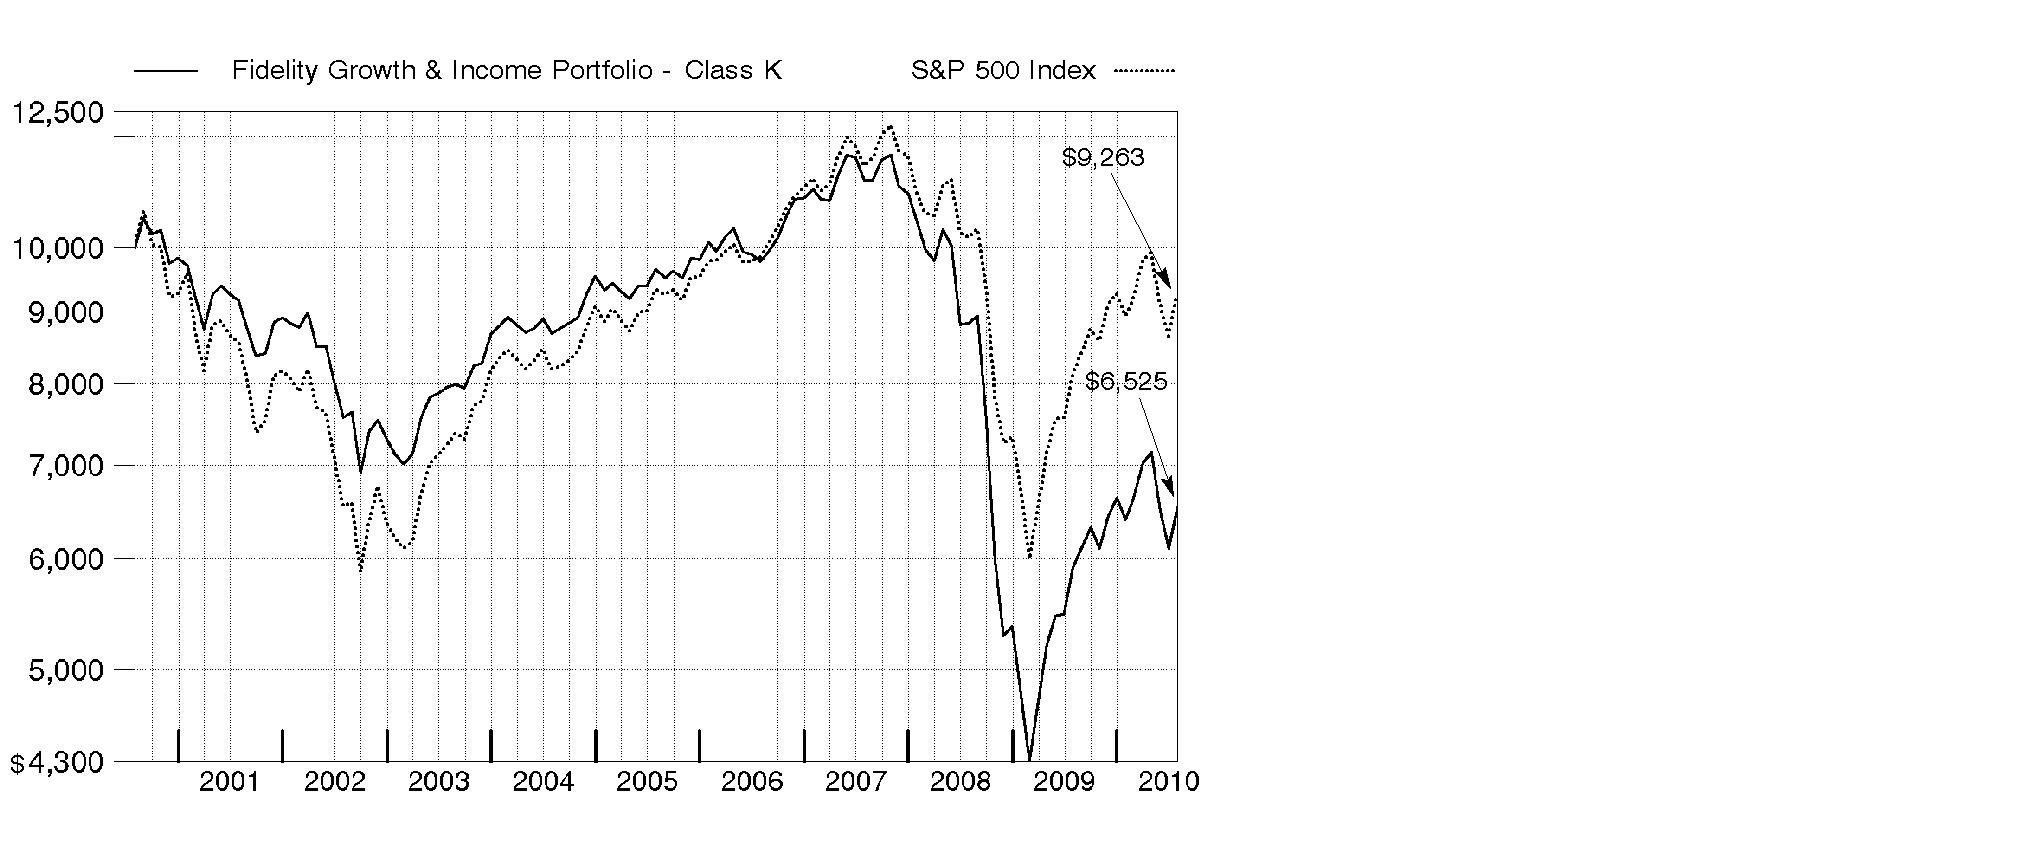
Annual Report
Market Recap: U.S. stock markets saw double-digit gains for the year ending July 31, 2010, despite the return of market volatility and risk aversion during the first half of 2010. An impressive bull run continued through 2009, bolstered by improvement in the economy and credit markets. Early in the new year, however, stocks fell sharply amid concerns about the global economic recovery, fueled by European debt woes and China's efforts to restrain inflation. After this brief dip, markets regained their upward momentum, as government stimulus and significant corporate cost cutting led to encouraging earnings reports, improved credit conditions and rising consumer confidence. Positive news continued through mid-April, when the Dow Jones Industrial AverageSM pushed above the 11,000 mark for the first time in 19 months. That milestone was short-lived, however, as heightened concern about the European debt crisis sparked an abrupt sell-off in May, leading to the first official correction since the rally began in March 2009. Although the market's malaise continued through June, stocks saw solid gains in July. For the year, the Dow rose 17.28%, while the S&P 500® Index was up 13.84%. Elsewhere, the technology-laden Nasdaq Composite® Index returned 14.99%. Small- and mid-cap stocks performed best, as measured by the 18.43% increase of the Russell 2000® Index and the 23.21% gain of the Russell Midcap® Index.
Comments from James Catudal, Portfolio Manager of Fidelity® Growth & Income Portfolio: For the year, the fund's Class K shares rose 10.41%, lagging the S&P 500®. The fund was hurt by stock picking in the consumer discretionary, energy and technology sectors, and positioning within consumer staples and financials. At the stock level, financial services provider State Street saw its stock drop due to a slowdown in business and compressed margins due to low interest rates. The fund also was hurt by overweighting solar equipment provider Applied Materials, which was stung by weakness in the solar arena. Builder KB Home detracted, hit by weak housing starts and the end of a federal tax credit program for first-time homebuyers. The fund benefited from stock picks in the materials sector and from overweightings in the strong-performing consumer discretionary and industrials sectors. An investment in truck-engine maker Cummins helped, as its stock rose on increased global sales. Another boost came from an out-of-benchmark position in AP Alternative Assets, a closed-end limited partnership that invests in private equity and capital markets opportunities. Underweighting agricultural products giant Monsanto contributed, as the stock dropped following cuts in earnings projections.
The views expressed above reflect those of the portfolio manager(s) only through the end of the period as stated on the cover of this report and do not necessarily represent the views of Fidelity or any other person in the Fidelity organization. Any such views are subject to change at any time based upon market or other conditions and Fidelity disclaims any responsibility to update such views. These views may not be relied on as investment advice and, because investment decisions for a Fidelity fund are based on numerous factors, may not be relied on as an indication of trading intent on behalf of any Fidelity fund.
Annual Report
Shareholder Expense Example
As a shareholder of the Fund, you incur two types of costs: (1) transaction costs, and (2) ongoing costs, including management fees and other Fund expenses. This Example is intended to help you understand your ongoing costs (in dollars) of investing in the Fund and to compare these costs with the ongoing costs of investing in other mutual funds.
The Example is based on an investment of $1,000 invested at the beginning of the period and held for the entire period (February 1, 2010 to July 31, 2010).
Actual Expenses
The first line of the accompanying table for each class of the Fund provides information about actual account values and actual expenses. You may use the information in this line, together with the amount you invested, to estimate the expenses that you paid over the period. Simply divide your account value by $1,000.00 (for example, an $8,600 account value divided by $1,000.00 = 8.6), then multiply the result by the number in the first line for a class of the Fund under the heading entitled "Expenses Paid During Period" to estimate the expenses you paid on your account during this period. A small balance maintenance fee of $12.00 that is charged once a year may apply for certain accounts with a value of less than $2,000. This fee is not included in the table below. If it was, the estimate of expenses you paid during the period would be higher, and your ending account value lower, by this amount. In addition, the Fund, as a shareholder in the underlying Fidelity Central Funds, will indirectly bear its pro-rata share of the fees and expenses incurred by the underlying Fidelity Central Funds. These fees and expenses are not included in the Fund's annualized expense ratio used to calculate the expense estimate in the table below.
Hypothetical Example for Comparison Purposes
The second line of the accompanying table for each class of the Fund provides information about hypothetical account values and hypothetical expenses based on a Class' actual expense ratio and an assumed rate of return of 5% per year before expenses, which is not the Class' actual return. The hypothetical account values and expenses may not be used to estimate the actual ending account balance or expenses you paid for the period. You may use this information to compare the ongoing costs of investing in the Fund and other funds. To do so, compare this 5% hypothetical example with the 5% hypothetical examples that appear in the shareholder reports of the other funds. A small balance maintenance fee of $12.00 that is charged once a year may apply for certain accounts with a value of less than $2,000. This fee is not included in the table below. If it was, the estimate of expenses you paid during the period would be higher, and your ending account value lower, by this amount. In addition, the Fund, as a shareholder in the underlying Fidelity Central Funds, will indirectly bear its pro-rata share of the fees and expenses incurred by the underlying Fidelity Central Funds. These fees and expenses are not included in the Fund's annualized expense ratio used to calculate the expense estimate in the table below.
Annual Report
Please note that the expenses shown in the table are meant to highlight your ongoing costs only and do not reflect any transaction costs. Therefore, the second line of the table is useful in comparing ongoing costs only, and will not help you determine the relative total costs of owning different funds.
|
Annualized
Expense Ratio
|
Beginning
Account Value
February 1, 2010
|
Ending
Account Value
July 31, 2010
| Expenses Paid
During Period*
February 1, 2010 to
July 31, 2010 |
Growth & Income | .74% | | | |
Actual | | $ 1,000.00 | $ 1,018.70 | $ 3.70 |
Hypothetical A | | $ 1,000.00 | $ 1,021.12 | $ 3.71 |
Class K | .54% | | | |
Actual | | $ 1,000.00 | $ 1,019.80 | $ 2.70 |
Hypothetical A | | $ 1,000.00 | $ 1,022.12 | $ 2.71 |
A 5% return per year before expenses
* Expenses are equal to each Class' annualized expense ratio, multiplied by the average account value over the period, multiplied by 181/365 (to reflect the one-half year period).
Annual Report
Investment Changes (Unaudited)
Top Ten Stocks as of July 31, 2010 |
| % of fund's
net assets | % of fund's net assets
6 months ago |
Apple, Inc. | 3.8 | 2.2 |
Exxon Mobil Corp. | 3.5 | 2.2 |
JPMorgan Chase & Co. | 2.5 | 2.0 |
Hewlett-Packard Co. | 2.4 | 1.9 |
United Technologies Corp. | 2.1 | 1.5 |
Wells Fargo & Co. | 1.9 | 2.3 |
The Coca-Cola Co. | 1.8 | 1.4 |
Microsoft Corp. | 1.7 | 2.4 |
Cisco Systems, Inc. | 1.7 | 2.1 |
Google, Inc. Class A | 1.6 | 1.8 |
| 23.0 | |
Top Five Market Sectors as of July 31, 2010 |
| % of fund's
net assets | % of fund's net assets
6 months ago |
Information Technology | 20.8 | 22.3 |
Financials | 19.1 | 18.3 |
Industrials | 15.6 | 9.7 |
Energy | 11.1 | 10.8 |
Consumer Discretionary | 10.5 | 12.7 |
Asset Allocation (% of fund's net assets) |
As of July 31, 2010* | As of January 31, 2010** |
| Stocks 99.6% | | | Stocks 99.2% | |
| Convertible
Securities 0.0% | | | Convertible
Securities 0.2% | |
| Short-Term
Investments and
Net Other Assets 0.4% | | | Short-Term
Investments and
Net Other Assets 0.6% | |
* Foreign investments | 8.1% | | ** Foreign investments | 9.1% | |

Annual Report
Investments July 31, 2010
Showing Percentage of Net Assets
Common Stocks - 99.6% |
| Shares | | Value (000s) |
CONSUMER DISCRETIONARY - 10.5% |
Auto Components - 0.2% |
Fuel Systems Solutions, Inc. (a) | 67,500 | | $ 2,053 |
Tenneco, Inc. (a) | 365,300 | | 10,082 |
| | 12,135 |
Automobiles - 0.4% |
Ford Motor Co. (a) | 1,400,000 | | 17,878 |
Harley-Davidson, Inc. | 270,000 | | 7,352 |
| | 25,230 |
Distributors - 0.2% |
Li & Fung Ltd. | 1,880,000 | | 8,616 |
Hotels, Restaurants & Leisure - 1.4% |
Buffalo Wild Wings, Inc. (a) | 318,489 | | 13,580 |
Darden Restaurants, Inc. | 190,000 | | 7,959 |
Jack in the Box, Inc. (a) | 180,000 | | 3,713 |
Little Sheep Group Ltd. | 447,000 | | 265 |
Marriott International, Inc. Class A | 630,618 | | 21,384 |
Sonic Corp. (a) | 397,600 | | 3,499 |
Starbucks Corp. | 1,185,000 | | 29,447 |
| | 79,847 |
Household Durables - 2.1% |
Ethan Allen Interiors, Inc. | 40,000 | | 614 |
KB Home | 2,250,000 | | 25,605 |
Newell Rubbermaid, Inc. | 405,000 | | 6,278 |
Pulte Group, Inc. (a) | 2,252,370 | | 19,776 |
Ryland Group, Inc. | 1,480,000 | | 24,154 |
Stanley Black & Decker, Inc. | 550,000 | | 31,911 |
Toll Brothers, Inc. (a) | 210,292 | | 3,651 |
Whirlpool Corp. | 83,100 | | 6,922 |
| | 118,911 |
Internet & Catalog Retail - 0.4% |
Amazon.com, Inc. (a) | 178,000 | | 20,984 |
Media - 2.5% |
Comcast Corp. Class A | 1,300,000 | | 25,311 |
DIRECTV (a) | 650,000 | | 24,154 |
Lamar Advertising Co. Class A (a) | 215,000 | | 5,880 |
McGraw-Hill Companies, Inc. | 345,000 | | 10,588 |
The Walt Disney Co. | 1,235,000 | | 41,607 |
Time Warner, Inc. | 1,115,233 | | 35,085 |
| | 142,625 |
Common Stocks - continued |
| Shares | | Value (000s) |
CONSUMER DISCRETIONARY - continued |
Multiline Retail - 1.6% |
Kohl's Corp. (a) | 525,000 | | $ 25,037 |
Target Corp. | 1,346,000 | | 69,077 |
| | 94,114 |
Specialty Retail - 1.3% |
Best Buy Co., Inc. | 720,000 | | 24,955 |
Lowe's Companies, Inc. | 1,220,000 | | 25,303 |
RadioShack Corp. | 790,000 | | 17,017 |
Staples, Inc. | 355,000 | | 7,217 |
| | 74,492 |
Textiles, Apparel & Luxury Goods - 0.4% |
Polo Ralph Lauren Corp. Class A | 310,000 | | 24,493 |
TOTAL CONSUMER DISCRETIONARY | | 601,447 |
CONSUMER STAPLES - 8.0% |
Beverages - 2.4% |
Coca-Cola Enterprises, Inc. | 775,000 | | 22,243 |
Dr Pepper Snapple Group, Inc. | 300,000 | | 11,265 |
The Coca-Cola Co. | 1,860,000 | | 102,505 |
| | 136,013 |
Food & Staples Retailing - 1.2% |
CVS Caremark Corp. | 842,900 | | 25,869 |
Wal-Mart Stores, Inc. | 567,900 | | 29,071 |
Whole Foods Market, Inc. (a) | 420,000 | | 15,947 |
| | 70,887 |
Food Products - 1.5% |
Bunge Ltd. | 310,000 | | 15,392 |
Kraft Foods, Inc. Class A | 300,000 | | 8,763 |
Mead Johnson Nutrition Co. Class A | 280,000 | | 14,879 |
Nestle SA | 907,000 | | 44,847 |
| | 83,881 |
Household Products - 1.4% |
Colgate-Palmolive Co. | 470,000 | | 37,121 |
Procter & Gamble Co. | 710,000 | | 43,424 |
| | 80,545 |
Common Stocks - continued |
| Shares | | Value (000s) |
CONSUMER STAPLES - continued |
Tobacco - 1.5% |
Philip Morris International, Inc. | 1,690,000 | | $ 86,258 |
TOTAL CONSUMER STAPLES | | 457,584 |
ENERGY - 11.1% |
Energy Equipment & Services - 4.2% |
Baker Hughes, Inc. | 785,000 | | 37,892 |
Cameron International Corp. (a) | 734,100 | | 29,063 |
Ensco International Ltd. ADR | 5,000 | | 209 |
Halliburton Co. | 2,410,000 | | 72,011 |
Nabors Industries Ltd. (a) | 500 | | 9 |
Oil States International, Inc. (a) | 255,000 | | 11,715 |
Schlumberger Ltd. | 789,500 | | 47,102 |
Weatherford International Ltd. (a) | 2,361,800 | | 38,261 |
| | 236,262 |
Oil, Gas & Consumable Fuels - 6.9% |
Anadarko Petroleum Corp. | 90,000 | | 4,424 |
Apache Corp. | 260,800 | | 24,927 |
Cameco Corp. | 290,000 | | 7,386 |
Chesapeake Energy Corp. | 20,000 | | 421 |
Exxon Mobil Corp. | 3,386,300 | | 202,094 |
Falkland Oil & Gas Ltd. (a) | 300,000 | | 598 |
Occidental Petroleum Corp. | 697,900 | | 54,387 |
Peabody Energy Corp. | 630,000 | | 28,445 |
Petrohawk Energy Corp. (a) | 975,000 | | 15,376 |
Plains Exploration & Production Co. (a) | 484,300 | | 10,921 |
Range Resources Corp. | 180,000 | | 6,682 |
Southwestern Energy Co. (a) | 690,000 | | 25,151 |
Ultra Petroleum Corp. (a) | 340,000 | | 14,406 |
| | 395,218 |
TOTAL ENERGY | | 631,480 |
FINANCIALS - 19.1% |
Capital Markets - 3.7% |
Ameriprise Financial, Inc. | 745,000 | | 31,581 |
AP Alternative Assets, L.P. Restricted Depositary Units (e) | 4,449,200 | | 27,363 |
Charles Schwab Corp. | 40,000 | | 592 |
Goldman Sachs Group, Inc. | 191,300 | | 28,852 |
Janus Capital Group, Inc. | 693,375 | | 7,267 |
Common Stocks - continued |
| Shares | | Value (000s) |
FINANCIALS - continued |
Capital Markets - continued |
Morgan Stanley | 1,293,800 | | $ 34,920 |
State Street Corp. | 1,457,400 | | 56,722 |
T. Rowe Price Group, Inc. | 470,000 | | 22,668 |
| | 209,965 |
Commercial Banks - 4.8% |
Banco Santander SA (d) | 825,000 | | 10,719 |
BB&T Corp. | 305,000 | | 7,573 |
FirstMerit Corp. | 404,500 | | 7,973 |
Huntington Bancshares, Inc. | 888,800 | | 5,386 |
PNC Financial Services Group, Inc. | 1,151,900 | | 68,411 |
Sterling Bancshares, Inc. | 375,000 | | 1,946 |
SunTrust Banks, Inc. | 670,000 | | 17,387 |
Synovus Financial Corp. | 100,000 | | 262 |
U.S. Bancorp, Delaware | 1,915,000 | | 45,769 |
Wells Fargo & Co. | 3,824,600 | | 106,056 |
| | 271,482 |
Consumer Finance - 1.3% |
American Express Co. | 1,102,700 | | 49,225 |
Capital One Financial Corp. | 601,900 | | 25,478 |
Discover Financial Services | 43,321 | | 662 |
| | 75,365 |
Diversified Financial Services - 5.3% |
Bank of America Corp. | 4,178,000 | | 58,659 |
Citigroup, Inc. (a) | 21,502,900 | | 88,162 |
CME Group, Inc. | 42,000 | | 11,710 |
JPMorgan Chase & Co. | 3,525,100 | | 141,991 |
NBH Holdings Corp. Class A (a)(e) | 166,200 | | 3,241 |
| | 303,763 |
Insurance - 2.5% |
Berkshire Hathaway, Inc. Class B (a) | 1,062,500 | | 83,003 |
Hartford Financial Services Group, Inc. | 5,000 | | 117 |
MetLife, Inc. | 1,185,000 | | 49,841 |
Prudential Financial, Inc. | 200,000 | | 11,458 |
| | 144,419 |
Real Estate Investment Trusts - 0.9% |
CBL & Associates Properties, Inc. | 459,200 | | 6,461 |
Public Storage | 270,000 | | 26,492 |
Common Stocks - continued |
| Shares | | Value (000s) |
FINANCIALS - continued |
Real Estate Investment Trusts - continued |
Simon Property Group, Inc. | 114,121 | | $ 10,182 |
SL Green Realty Corp. | 161,600 | | 9,735 |
| | 52,870 |
Real Estate Management & Development - 0.5% |
CB Richard Ellis Group, Inc. Class A (a) | 1,530,000 | | 26,010 |
Thrifts & Mortgage Finance - 0.1% |
Radian Group, Inc. | 575,000 | | 4,945 |
TOTAL FINANCIALS | | 1,088,819 |
HEALTH CARE - 9.1% |
Biotechnology - 1.4% |
Amgen, Inc. (a) | 476,800 | | 26,000 |
Amylin Pharmaceuticals, Inc. (a) | 900,000 | | 17,028 |
ARIAD Pharmaceuticals, Inc. (a) | 519,738 | | 1,663 |
Biogen Idec, Inc. (a) | 12,800 | | 715 |
BioMarin Pharmaceutical, Inc. (a) | 281,157 | | 6,143 |
Cephalon, Inc. (a) | 93,000 | | 5,278 |
Gilead Sciences, Inc. (a) | 75,000 | | 2,499 |
Incyte Corp. (a) | 250,000 | | 3,255 |
SIGA Technologies, Inc. (a) | 240,000 | | 2,011 |
Vertex Pharmaceuticals, Inc. (a) | 440,000 | | 14,810 |
| | 79,402 |
Health Care Equipment & Supplies - 1.1% |
Alcon, Inc. | 55,000 | | 8,529 |
Covidien PLC | 1,035,800 | | 38,656 |
Hill-Rom Holdings, Inc. | 285,000 | | 9,416 |
St. Jude Medical, Inc. (a) | 237,800 | | 8,744 |
| | 65,345 |
Health Care Providers & Services - 2.1% |
Brookdale Senior Living, Inc. (a) | 325,000 | | 4,609 |
CIGNA Corp. | 230,000 | | 7,075 |
Express Scripts, Inc. (a) | 704,200 | | 31,816 |
Henry Schein, Inc. (a) | 530,000 | | 27,820 |
McKesson Corp. | 300,000 | | 18,846 |
Medco Health Solutions, Inc. (a) | 180,000 | | 8,640 |
UnitedHealth Group, Inc. | 645,000 | | 19,640 |
| | 118,446 |
Common Stocks - continued |
| Shares | | Value (000s) |
HEALTH CARE - continued |
Life Sciences Tools & Services - 0.3% |
Illumina, Inc. (a) | 265,000 | | $ 11,880 |
Life Technologies Corp. (a) | 185,000 | | 7,953 |
| | 19,833 |
Pharmaceuticals - 4.2% |
Abbott Laboratories | 555,000 | | 27,239 |
Allergan, Inc. | 135,000 | | 8,243 |
Auxilium Pharmaceuticals, Inc. (a) | 100,000 | | 2,256 |
Johnson & Johnson | 1,049,800 | | 60,983 |
Merck & Co., Inc. | 2,018,078 | | 69,543 |
Perrigo Co. | 86,000 | | 4,817 |
Pfizer, Inc. | 3,472,500 | | 52,088 |
Teva Pharmaceutical Industries Ltd. sponsored ADR | 255,000 | | 12,457 |
| | 237,626 |
TOTAL HEALTH CARE | | 520,652 |
INDUSTRIALS - 15.6% |
Aerospace & Defense - 4.5% |
AeroVironment, Inc. (a) | 185,000 | | 4,423 |
BE Aerospace, Inc. (a) | 985,000 | | 28,959 |
Goodrich Corp. | 315,000 | | 22,954 |
Honeywell International, Inc. | 30,000 | | 1,286 |
Lockheed Martin Corp. | 500 | | 38 |
Precision Castparts Corp. | 260,000 | | 31,769 |
The Boeing Co. | 750,000 | | 51,105 |
United Technologies Corp. | 1,660,000 | | 118,026 |
| | 258,560 |
Air Freight & Logistics - 1.3% |
C.H. Robinson Worldwide, Inc. | 385,000 | | 25,102 |
United Parcel Service, Inc. Class B | 770,000 | | 50,050 |
| | 75,152 |
Airlines - 0.4% |
Delta Air Lines, Inc. (a) | 1,520,000 | | 18,058 |
UAL Corp. (a) | 300,000 | | 7,122 |
| | 25,180 |
Commercial Services & Supplies - 0.3% |
Avery Dennison Corp. | 505,000 | | 18,104 |
Construction & Engineering - 0.8% |
Fluor Corp. | 520,000 | | 25,111 |
Common Stocks - continued |
| Shares | | Value (000s) |
INDUSTRIALS - continued |
Construction & Engineering - continued |
Jacobs Engineering Group, Inc. (a) | 400,000 | | $ 14,628 |
Orion Marine Group, Inc. (a) | 305,000 | | 3,788 |
| | 43,527 |
Electrical Equipment - 0.0% |
Vestas Wind Systems AS (a) | 500 | | 24 |
Industrial Conglomerates - 2.2% |
3M Co. | 774,700 | | 66,268 |
General Electric Co. | 2,581,000 | | 41,606 |
Textron, Inc. | 828,100 | | 17,191 |
| | 125,065 |
Machinery - 2.9% |
Caterpillar, Inc. | 80,000 | | 5,580 |
Cummins, Inc. | 575,000 | | 45,776 |
Danaher Corp. | 910,000 | | 34,953 |
Ingersoll-Rand Co. Ltd. | 1,505,000 | | 56,377 |
NN, Inc. (a) | 100,000 | | 589 |
PACCAR, Inc. | 480,000 | | 21,994 |
| | 165,269 |
Professional Services - 0.3% |
Robert Half International, Inc. | 775,000 | | 19,515 |
Road & Rail - 2.9% |
Avis Budget Group, Inc. (a) | 465,300 | | 5,742 |
CSX Corp. | 1,182,700 | | 62,352 |
Hertz Global Holdings, Inc. (a) | 575,000 | | 6,751 |
Landstar System, Inc. | 685,000 | | 27,770 |
Union Pacific Corp. | 815,000 | | 60,856 |
| | 163,471 |
TOTAL INDUSTRIALS | | 893,867 |
INFORMATION TECHNOLOGY - 20.8% |
Communications Equipment - 3.1% |
Cisco Systems, Inc. (a) | 4,164,900 | | 96,084 |
Juniper Networks, Inc. (a) | 913,000 | | 25,363 |
Motorola, Inc. (a) | 700,000 | | 5,243 |
QUALCOMM, Inc. | 1,265,000 | | 48,171 |
| | 174,861 |
Computers & Peripherals - 6.3% |
Apple, Inc. (a) | 853,800 | | 219,630 |
Common Stocks - continued |
| Shares | | Value (000s) |
INFORMATION TECHNOLOGY - continued |
Computers & Peripherals - continued |
EMC Corp. (a) | 235,000 | | $ 4,651 |
Hewlett-Packard Co. | 2,929,700 | | 134,883 |
| | 359,164 |
Electronic Equipment & Components - 0.4% |
Agilent Technologies, Inc. (a) | 513,000 | | 14,328 |
Corning, Inc. | 631,900 | | 11,450 |
| | 25,778 |
Internet Software & Services - 2.7% |
eBay, Inc. (a) | 2,350,000 | | 49,139 |
Google, Inc. Class A (a) | 189,000 | | 91,637 |
Move, Inc. (a) | 1,846,025 | | 4,172 |
Rackspace Hosting, Inc. (a) | 415,000 | | 7,761 |
Tencent Holdings Ltd. | 3,000 | | 58 |
| | 152,767 |
IT Services - 1.9% |
Cognizant Technology Solutions Corp. Class A (a) | 345,000 | | 18,823 |
International Business Machines Corp. | 220,000 | | 28,248 |
MasterCard, Inc. Class A | 185,000 | | 38,857 |
Visa, Inc. Class A | 334,400 | | 24,528 |
| | 110,456 |
Semiconductors & Semiconductor Equipment - 2.7% |
Altera Corp. | 141,800 | | 3,931 |
Applied Materials, Inc. | 1,061,100 | | 12,521 |
ASML Holding NV | 2,010,000 | | 64,702 |
Intel Corp. | 763,500 | | 15,728 |
Lam Research Corp. (a) | 457,200 | | 19,289 |
Marvell Technology Group Ltd. (a) | 746,300 | | 11,135 |
MEMC Electronic Materials, Inc. (a) | 1,370,000 | | 13,097 |
Micron Technology, Inc. (a) | 1,305,900 | | 9,507 |
Xilinx, Inc. | 135,000 | | 3,769 |
| | 153,679 |
Software - 3.7% |
BMC Software, Inc. (a) | 537,400 | | 19,121 |
Citrix Systems, Inc. (a) | 245,000 | | 13,480 |
Informatica Corp. (a) | 300,000 | | 9,039 |
Longtop Financial Technologies Ltd. ADR (a) | 37,600 | | 1,253 |
Microsoft Corp. | 3,755,100 | | 96,919 |
Novell, Inc. (a) | 950,000 | | 5,738 |
Nuance Communications, Inc. (a) | 410,000 | | 6,769 |
Common Stocks - continued |
| Shares | | Value (000s) |
INFORMATION TECHNOLOGY - continued |
Software - continued |
Oracle Corp. | 1,847,200 | | $ 43,668 |
Red Hat, Inc. (a) | 240,000 | | 7,716 |
VMware, Inc. Class A (a) | 100,000 | | 7,753 |
| | 211,456 |
TOTAL INFORMATION TECHNOLOGY | | 1,188,161 |
MATERIALS - 4.0% |
Chemicals - 2.8% |
Albemarle Corp. | 575,000 | | 25,082 |
CF Industries Holdings, Inc. | 110,000 | | 8,931 |
Dow Chemical Co. | 1,300,000 | | 35,529 |
Ecolab, Inc. | 525,000 | | 25,678 |
FMC Corp. | 435,000 | | 27,183 |
Praxair, Inc. | 338,800 | | 29,415 |
The Mosaic Co. | 200,000 | | 9,530 |
| | 161,348 |
Metals & Mining - 1.2% |
AngloGold Ashanti Ltd. sponsored ADR | 617,700 | | 25,029 |
Barrick Gold Corp. | 570,000 | | 23,433 |
Carpenter Technology Corp. | 485,000 | | 16,951 |
Freeport-McMoRan Copper & Gold, Inc. | 1,000 | | 72 |
| | 65,485 |
TOTAL MATERIALS | | 226,833 |
TELECOMMUNICATION SERVICES - 1.0% |
Diversified Telecommunication Services - 0.3% |
Verizon Communications, Inc. | 650,000 | | 18,889 |
Wireless Telecommunication Services - 0.7% |
American Tower Corp. Class A (a) | 415,000 | | 19,190 |
Sprint Nextel Corp. (a) | 4,175,000 | | 19,080 |
| | 38,270 |
TOTAL TELECOMMUNICATION SERVICES | | 57,159 |
UTILITIES - 0.4% |
Electric Utilities - 0.3% |
FirstEnergy Corp. | 475,000 | | 17,908 |
Common Stocks - continued |
| Shares | | Value (000s) |
UTILITIES - continued |
Independent Power Producers & Energy Traders - 0.1% |
Constellation Energy Group, Inc. | 150,000 | | $ 4,740 |
TOTAL UTILITIES | | 22,648 |
TOTAL COMMON STOCKS (Cost $5,180,327) | 5,688,650 |
Money Market Funds - 0.5% |
| | | |
Fidelity Cash Central Fund, 0.24% (b) | 20,170,266 | | 20,170 |
Fidelity Securities Lending Cash Central Fund, 0.27% (b)(c) | 9,729,000 | | 9,729 |
TOTAL MONEY MARKET FUNDS (Cost $29,899) | 29,899 |
Cash Equivalents - 0.1% |
| Maturity Amount (000s) | | |
Investments in repurchase agreements in a joint trading account at 0.21%, dated 7/30/10 due 8/2/10 (Collateralized by U.S. Government Obligations) #
(Cost $2,387) | $ 2,387 | | 2,387 |
TOTAL INVESTMENT PORTFOLIO - 100.2% (Cost $5,212,613) | | 5,720,936 |
NET OTHER ASSETS (LIABILITIES) - (0.2)% | | (11,520) |
NET ASSETS - 100% | $ 5,709,416 |
Legend |
(a) Non-income producing |
(b) Affiliated fund that is available only to investment companies and other accounts managed by Fidelity Investments. The rate quoted is the annualized seven-day yield of the fund at period end. A complete unaudited listing of the fund's holdings as of its most recent quarter end is available upon request. |
(c) Investment made with cash collateral received from securities on loan. |
(d) Security or a portion of the security is on loan at period end. |
(e) Security exempt from registration under Rule 144A of the Securities Act of 1933. These securities may be resold in transactions exempt from registration, normally to qualified institutional buyers. At the end of the period, the value of these securities amounted to $30,604,000 or 0.5% of net assets. |
# Additional information on each counterparty to the repurchase agreement is as follows: |
Repurchase Agreement / Counterparty | Value
(Amounts in thousands) |
$2,387,000 due 8/02/10 at 0.21% |
BNP Paribas Securities Corp. | $ 954 |
Banc of America Securities LLC | 361 |
Barclays Capital, Inc. | 1,072 |
| $ 2,387 |
Affiliated Central Funds |
Information regarding fiscal year to date income earned by the Fund from investments in Fidelity Central Funds is as follows: |
Fund | Income earned
(Amounts in thousands) |
Fidelity Cash Central Fund | $ 83 |
Fidelity Securities Lending Cash Central Fund | 143 |
Total | $ 226 |
Other Information |
The following is a summary of the inputs used, as of July 31, 2010, involving the Fund's assets and liabilities carried at fair value. The inputs or methodology used for valuing securities may not be an indication of the risk associated with investing in those securities. For more information on valuation inputs, and their aggregation into the levels used in the tables below, please refer to the Security Valuation section in the accompanying Notes to Financial Statements. |
Valuation Inputs at Reporting Date: |
Description
(Amounts in thousands) | Total | Level 1 | Level 2 | Level 3 |
Investments in Securities: | | | | |
Equities: | | | | |
Consumer Discretionary | $ 601,447 | $ 601,447 | $ - | $ - |
Consumer Staples | 457,584 | 457,584 | - | - |
Energy | 631,480 | 631,480 | - | - |
Financials | 1,088,819 | 1,085,578 | - | 3,241 |
Health Care | 520,652 | 520,652 | - | - |
Industrials | 893,867 | 893,867 | - | - |
Information Technology | 1,188,161 | 1,188,161 | - | - |
Materials | 226,833 | 226,833 | - | - |
Telecommunication Services | 57,159 | 57,159 | - | - |
Utilities | 22,648 | 22,648 | - | - |
Money Market Funds | 29,899 | 29,899 | - | - |
Cash Equivalents | 2,387 | - | 2,387 | - |
Total Investments in Securities: | $ 5,720,936 | $ 5,715,308 | $ 2,387 | $ 3,241 |
Other Information - continued |
The following is a reconciliation of Investments in Securities for which Level 3 inputs were used in determining value: |
(Amounts in thousands) | |
Investments in Securities: | |
Beginning Balance | $ - |
Total Realized Gain (Loss) | - |
Total Unrealized Gain (Loss) | (83) |
Cost of Purchases | 3,324 |
Proceeds of Sales | - |
Amortization/Accretion | - |
Transfers in to Level 3 | - |
Transfers out of Level 3 | - |
Ending Balance | $ 3,241 |
The change in unrealized gain (loss) for the period attributable to Level 3 securities held at July 31, 2010 | $ (83) |
The information used in the above reconciliation represents fiscal year to date activity for any Investments in Securities identified as using Level 3 inputs at either the beginning or the end of the current fiscal period. Transfers in or out of Level 3 represent the beginning value of any Security or Instrument where a change in the pricing level occurred from the beginning to the end of the period. The cost of purchases and the proceeds of sales may include securities received or delivered through corporate actions or exchanges. Realized and unrealized gains (losses) disclosed in the reconciliation are included in Net Gain (Loss) on the Fund's Statement of Operations. |
Income Tax Information |
At July 31, 2010, the Fund had a capital loss carryforward of approximately $6,214,141,000 of which $3,048,336,000 and $3,165,805,000 will expire on July 31, 2017 and 2018, respectively. Capital loss carryforwards are only available to offset future capital gains of the Fund to the extent provided by regulations and may be limited. |
See accompanying notes which are an integral part of the financial statements.
Annual Report
Statement of Assets and Liabilities
Amounts in thousands (except per-share amounts) | July 31, 2010 |
| | |
Assets | | |
Investment in securities, at value (including securities loaned of $8,961 and repurchase agreements of $2,387) - See accompanying schedule: Unaffiliated issuers (cost $5,182,714) | $ 5,691,037 | |
Fidelity Central Funds (cost $29,899) | 29,899 | |
Total Investments (cost $5,212,613) | | $ 5,720,936 |
Receivable for investments sold | | 76,652 |
Receivable for fund shares sold | | 2,329 |
Dividends receivable | | 2,922 |
Distributions receivable from Fidelity Central Funds | | 3 |
Other receivables | | 1,033 |
Total assets | | 5,803,875 |
| | |
Liabilities | | |
Payable for investments purchased | $ 74,597 | |
Payable for fund shares redeemed | 6,081 | |
Accrued management fee | 2,159 | |
Other affiliated payables | 1,299 | |
Other payables and accrued expenses | 594 | |
Collateral on securities loaned, at value | 9,729 | |
Total liabilities | | 94,459 |
| | |
Net Assets | | $ 5,709,416 |
Net Assets consist of: | | |
Paid in capital | | $ 11,476,265 |
Undistributed net investment income | | 1,085 |
Accumulated undistributed net realized gain (loss) on investments and foreign currency transactions | | (6,276,264) |
Net unrealized appreciation (depreciation) on investments and assets and liabilities in foreign currencies | | 508,330 |
Net Assets | | $ 5,709,416 |
See accompanying notes which are an integral part of the financial statements.
Annual Report
Financial Statements - continued
Statement of Assets and Liabilities - continued
Amounts in thousands (except per-share amounts) | July 31, 2010 |
| | |
Growth & Income:
Net Asset Value, offering price and redemption price per share ($5,417,395 ÷ 343,972 shares) | | $ 15.75 |
| | |
Class K:
Net Asset Value, offering price and redemption price per share ($292,021 ÷ 18,551 shares) | | $ 15.74 |
See accompanying notes which are an integral part of the financial statements.
Annual Report
Statement of Operations
Amounts in thousands | Year ended July 31, 2010 |
| | |
Investment Income | | |
Dividends | | $ 86,682 |
Interest | | 1 |
Income from Fidelity Central Funds | | 226 |
Total income | | 86,909 |
| | |
Expenses | | |
Management fee | $ 29,104 | |
Transfer agent fees | 16,070 | |
Accounting and security lending fees | 1,231 | |
Custodian fees and expenses | 122 | |
Independent trustees' compensation | 42 | |
Registration fees | 50 | |
Audit | 84 | |
Legal | 59 | |
Interest | 5 | |
Miscellaneous | 123 | |
Total expenses before reductions | 46,890 | |
Expense reductions | (547) | 46,343 |
Net investment income (loss) | | 40,566 |
Realized and Unrealized Gain (Loss) Net realized gain (loss) on: | | |
Investment securities: | | |
Unaffiliated issuers | 535,178 | |
Foreign currency transactions | (351) | |
Capital gain distributions from Fidelity Central Funds | 4 | |
Total net realized gain (loss) | | 534,831 |
Change in net unrealized appreciation (depreciation) on: Investment securities | 81,647 | |
Assets and liabilities in foreign currencies | 15 | |
Total change in net unrealized appreciation (depreciation) | | 81,662 |
Net gain (loss) | | 616,493 |
Net increase (decrease) in net assets resulting from operations | | $ 657,059 |
See accompanying notes which are an integral part of the financial statements.
Annual Report
Financial Statements - continued
Statement of Changes in Net Assets
Amounts in thousands | Year ended
July 31,
2010 | Year ended
July 31,
2009 |
Increase (Decrease) in Net Assets | | |
Operations | | |
Net investment income (loss) | $ 40,566 | $ 76,215 |
Net realized gain (loss) | 534,831 | (6,629,356) |
Change in net unrealized appreciation (depreciation) | 81,662 | 2,408,298 |
Net increase (decrease) in net assets resulting
from operations | 657,059 | (4,144,843) |
Distributions to shareholders from net investment income | (38,583) | (95,086) |
Distributions to shareholders from net realized gain | (3,482) | (16,566) |
Total distributions | (42,065) | (111,652) |
Share transactions - net increase (decrease) | (1,247,688) | (1,953,179) |
Total increase (decrease) in net assets | (632,694) | (6,209,674) |
| | |
Net Assets | | |
Beginning of period | 6,342,110 | 12,551,784 |
End of period (including undistributed net investment income of $1,085 and distributions in excess of net investment income of $94, respectively) | $ 5,709,416 | $ 6,342,110 |
See accompanying notes which are an integral part of the financial statements.
Annual Report
Financial Highlights - Growth & Income
Years ended July 31, | 2010 | 2009 | 2008 | 2007 | 2006 |
Selected Per-Share Data | | | | | |
Net asset value, beginning of period | $ 14.38 | $ 21.88 | $ 31.92 | $ 34.16 | $ 38.42 |
Income from Investment Operations | | | | | |
Net investment income (loss) B | .10 | .15 | .35 | .27 | .34 |
Net realized and
unrealized gain (loss) | 1.37 | (7.43) | (6.25) | 3.84 | .18 |
Total from investment operations | 1.47 | (7.28) | (5.90) | 4.11 | .52 |
Distributions from net investment income | (.10) | (.19) | (.33) | (.27) | (.38) |
Distributions from net
realized gain | (.01) | (.03) | (3.81) | (6.08) | (4.40) |
Total distributions | (.10) F | (.22) | (4.14) | (6.35) | (4.78) |
Net asset value, end of period | $ 15.75 | $ 14.38 | $ 21.88 | $ 31.92 | $ 34.16 |
Total Return A | 10.25% | (33.32)% | (20.91)% | 14.28% | 1.22% |
Ratios to Average Net Assets C, E | | | | |
Expenses before reductions | .75% | .78% | .68% | .68% | .69% |
Expenses net of
fee waivers, if any | .75% | .78% | .68% | .68% | .69% |
Expenses net of all reductions | .74% | .78% | .67% | .67% | .65% |
Net investment income (loss) | .63% | 1.07% | 1.29% | .84% | .94% |
Supplemental Data | | | | | |
Net assets, end of period
(in millions) | $ 5,417 | $ 5,993 | $ 12,552 | $ 22,693 | $ 28,861 |
Portfolio turnover rate D | 98% | 122% | 52% | 52% | 120% |
A Total returns would have been lower had certain expenses not been reduced during the periods shown.
B Calculated based on average shares outstanding during the period.
C Fees and expenses of the underlying Fidelity Central Funds are not included in the Fund's expense ratio. The Fund indirectly bears its proportionate share of the expenses of any underlying Fidelity Central Funds.
D Amount does not include the portfolio activity of any underlying Fidelity Central Funds.
E Expense ratios reflect operating expenses of the class. Expenses before reductions do not reflect amounts reimbursed by the investment adviser or reductions from brokerage service arrangements or reductions from other expense offset arrangements and do not represent the amount paid by the class during periods when reimbursements or reductions occur. Expenses net of fee waivers reflect expenses after reimbursement by the investment adviser but prior to reductions from brokerage service arrangements or other expense offset arrangements. Expenses net of all reductions represent the net expenses paid by the class.
F Total distributions of $.10 per share is comprised of distributions from net investment income of $.095 and distributions from net realized gain of $.008 per share.
See accompanying notes which are an integral part of the financial statements.
Annual Report
Financial Highlights - Class K
Years ended July 31, | 2010 | 2009 | 2008 G |
Selected Per-Share Data | | | |
Net asset value, beginning of period | $ 14.38 | $ 21.88 | $ 25.34 |
Income from Investment Operations | | | |
Net investment income (loss) D | .13 | .16 | .09 |
Net realized and unrealized gain (loss) | 1.37 | (7.40) | (3.45) |
Total from investment operations | 1.50 | (7.24) | (3.36) |
Distributions from net investment income | (.13) | (.23) | (.10) |
Distributions from net realized gain | (.01) | (.03) | - |
Total distributions | (.14) I | (.26) | (.10) |
Net asset value, end of period | $ 15.74 | $ 14.38 | $ 21.88 |
Total Return B, C | 10.41% | (33.12)% | (13.22)% |
Ratios to Average Net Assets E, H | | | |
Expenses before reductions | .54% | .56% | .55% A |
Expenses net of fee waivers, if any | .54% | .56% | .55% A |
Expenses net of all reductions | .53% | .55% | .55% A |
Net investment income (loss) | .84% | 1.29% | 1.73% A |
Supplemental Data | | | |
Net assets, end of period (000 omitted) | $ 292,021 | $ 349,324 | $ 87 |
Portfolio turnover rate F | 98% | 122% | 52% |
A Annualized
B Total returns for periods of less than one year are not annualized.
C Total returns would have been lower had certain expenses not been reduced during the periods shown.
D Calculated based on average shares outstanding during the period.
E Fees and expenses of the underlying Fidelity Central Funds are not included in the Fund's expense ratio. The Fund indirectly bears its proportionate share of the expenses of any underlying Fidelity Central Funds.
F Amount does not include the portfolio activity of any underlying Fidelity Central Funds.
G For the period May 9, 2008 (commencement of sale of shares) to July 31, 2008.
H Expense ratios reflect operating expenses of the class. Expenses before reductions do not reflect amounts reimbursed by the investment adviser or reductions from brokerage service arrangements or reductions from other expense offset arrangements and do not represent the amount paid by the class during periods when reimbursements or reductions occur. Expense ratios before reductions for start-up periods may not be representative of longer-term operating periods. Expenses net of fee waivers reflect expenses after reimbursement by the investment adviser but prior to reductions from brokerage service arrangements or other expense offset arrangements. Expenses net of all reductions represent the net expenses paid by the class.
I Total distributions of $.14 per share is comprised of distributions from net investment income of $.129 and distributions from net realized gain of $.008 per share.
See accompanying notes which are an integral part of the financial statements.
Annual Report
Notes to Financial Statements
For the period ended July 31, 2010
(Amounts in thousands except ratios)
1. Organization.
Fidelity Growth & Income Portfolio (the Fund) is a fund of Fidelity Securities Fund (the Trust) and is authorized to issue an unlimited number of shares. The Trust is registered under the Investment Company Act of 1940, as amended (the 1940 Act), as an open-end management investment company organized as a Massachusetts business trust. The Fund offers Growth & Income and Class K shares, each of which has equal rights as to assets and voting privileges. Each class has exclusive voting rights with respect to matters that affect that class. After the commencement of Class K, the Fund began offering conversion privileges between Growth & Income and Class K to eligible shareholders of Growth & Income. Investment income, realized and unrealized capital gains and losses, the common expenses of the Fund, and certain fund-level expense reductions, if any, are allocated on a pro-rata basis to each class based on the relative net assets of each class to the total net assets of the Fund. Each class differs with respect to transfer agent fees incurred. Certain expense reductions also differ by class.
2. Investments in Fidelity Central Funds.
The Fund may invest in Fidelity Central Funds, which are open-end investment companies available only to other investment companies and accounts managed by Fidelity Management & Research Company (FMR) and its affiliates. The Fund's Schedule of Investments lists each of the Fidelity Central Funds held as of period end, if any, as an investment of the Fund, but does not include the underlying holdings of each Fidelity Central Fund. As an Investing Fund, the Fund indirectly bears its proportionate share of the expenses of the underlying Fidelity Central Funds.
The Money Market Central Funds seek preservation of capital and current income and are managed by Fidelity Investments Money Management, Inc. (FIMM), an affiliate of FMR.
A complete unaudited list of holdings for each Fidelity Central Fund is available upon request or at the Securities and Exchange Commission (the SEC) web site at www.sec.gov. In addition, the financial statements of the Fidelity Central Funds, which are not covered by the Fund's Report of Independent Registered Public Accounting Firm, are available on the SEC web site or upon request.
3. Significant Accounting Policies.
The financial statements have been prepared in conformity with accounting principles generally accepted in the United States of America (GAAP), which require management to make certain estimates and assumptions at the date of the financial statements. Actual results could differ from those estimates. The following summarizes the significant accounting policies of the Fund:
Security Valuation. Investments are valued as of 4:00 p.m. Eastern time on the last calendar day of the period. The Fund uses independent pricing services approved by the
Annual Report
3. Significant Accounting Policies - continued
Security Valuation - continued
Board of Trustees to value its investments. When current market prices or quotations are not readily available or reliable, valuations may be determined in good faith in accordance with procedures adopted by the Board of Trustees. Factors used in determining value may include market or security specific events. The frequency with which these procedures are used cannot be predicted and they may be utilized to a significant extent. The value used for net asset value (NAV) calculation under these procedures may differ from published prices for the same securities.
The Fund categorizes the inputs to valuation techniques used to value its investments into a disclosure hierarchy consisting of three levels as shown below.
Level 1 - quoted prices in active markets for identical investments
Level 2 - other significant observable inputs (including quoted prices for similar investments, interest rates, prepayment speeds, etc.)
Level 3 - unobservable inputs (including the fund's own assumptions based on the best information available)
Changes in valuation techniques may result in transfers in or out of an assigned level within the disclosure hierarchy. The aggregate value of investments by input level, as of July 31, 2010, as well as a roll forward of Level 3 securities, is included at the end of the Fund's Schedule of Investments. Valuation techniques used to value the Fund's investments by major category are as follows.
Equity securities, including restricted securities, for which market quotations are readily available, are valued at the last reported sale price or official closing price as reported by an independent pricing service on the primary market or exchange on which they are traded and are categorized as Level 1 in the hierarchy. In the event there were no sales during the day or closing prices are not available, securities are valued at the last quoted bid price or may be valued using the last available price and are generally categorized as Level 2 in the hierarchy. For foreign equity securities, when significant market or security specific events arise, comparisons to the valuation of American Depositary Receipts (ADRs), futures contracts, Exchange-traded funds (ETFs) and certain indexes as well as quoted prices for similar securities are used and are categorized as Level 2 in the hierarchy in these circumstances. Utilizing these techniques may result in transfers between Level 1 and Level 2. For restricted equity securities and private placements where observable inputs are limited, assumptions about market activity and risk are used and are categorized as Level 3 in the hierarchy.
Annual Report
Notes to Financial Statements - continued
(Amounts in thousands except ratios)
3. Significant Accounting Policies - continued
Security Valuation - continued
Investments in open-end mutual funds, including the Fidelity Central Funds, are valued at their closing net asset value each business day and are categorized as Level 1 in the hierarchy. Short-term securities with remaining maturities of sixty days or less for which quotations are not readily available are valued at amortized cost, which approximates fair value and are categorized as Level 2 in the hierarchy.
Foreign Currency. The Fund uses foreign currency contracts to facilitate transactions in foreign-denominated securities. Gains and losses from these transactions may arise from changes in the value of the foreign currency or if the counterparties do not perform under the contracts' terms.
Foreign-denominated assets, including investment securities, and liabilities are translated into U.S. dollars at the exchange rate at period end. Purchases and sales of investment securities, income and dividends received and expenses denominated in foreign currencies are translated into U.S. dollars at the exchange rate in effect on the transaction date.
The effects of exchange rate fluctuations on investments are included with the net realized and unrealized gain (loss) on investment securities. Other foreign currency transactions resulting in realized and unrealized gain (loss) are disclosed separately.
Investment Transactions and Income. For financial reporting purposes, the Fund's investment holdings and NAV include trades executed through the end of the last business day of the period. The NAV per share for processing shareholder transactions is calculated as of the close of business of the New York Stock Exchange (NYSE), normally 4:00 p.m. Eastern time and includes trades executed through the end of the prior business day. Gains and losses on securities sold are determined on the basis of identified cost and may include proceeds received from litigation. Dividend income is recorded on the ex-dividend date, except for certain dividends from foreign securities where the ex-dividend date may have passed, which are recorded as soon as the Fund is informed of the ex-dividend date. Non-cash dividends included in dividend income, if any, are recorded at the fair market value of the securities received. Distributions received on securities that represent a return of capital or capital gain are recorded as a reduction of cost of investments and/or as a realized gain. The Fund estimates the components of distributions received that may be considered return of capital distributions or capital gain distributions. Interest income and distributions from the Fidelity Central Funds are accrued as earned. Interest income includes coupon interest and amortization of premium and accretion of discount on debt securities. Investment income is recorded net of foreign taxes withheld where recovery of such taxes is uncertain.
Annual Report
3. Significant Accounting Policies - continued
Expenses. Most expenses of the Trust can be directly attributed to a fund. Expenses which cannot be directly attributed are apportioned amongst each fund in the Trust. Expense estimates are accrued in the period to which they relate and adjustments are made when actual amounts are known.
Deferred Trustee Compensation. Under a Deferred Compensation Plan (the Plan), independent Trustees may elect to defer receipt of a portion of their annual compensation. Deferred amounts are invested in a cross-section of Fidelity funds, are marked-to-market and remain in the Fund until distributed in accordance with the Plan. The investment of deferred amounts and the offsetting payable to the Trustees are included in the accompanying Statement of Assets and Liabilities.
Income Tax Information and Distributions to Shareholders. Each year the Fund intends to qualify as a regulated investment company, including distributing substantially all of its taxable income and realized gains under Subchapter M of the Internal Revenue Code and filing its U.S. federal tax return. As a result, no provision for income taxes is required. As of July 31, 2010, the Fund did not have any unrecognized tax benefits in the accompanying financial statements. A fund's federal tax return is subject to examination by the Internal Revenue Service (IRS) for a period of three years. Foreign taxes are provided for based on the Fund's understanding of the tax rules and rates that exist in the foreign markets in which it invests.
Distributions are recorded on the ex-dividend date. Income dividends and capital gain distributions are declared separately for each class. Income and capital gain distributions are determined in accordance with income tax regulations, which may differ from GAAP.
Capital accounts within the financial statements are adjusted for permanent book-tax differences. These adjustments have no impact on net assets or the results of operations. Temporary book-tax differences will reverse in a subsequent period.
Book-tax differences are primarily due to foreign currency transactions, short term gain distributions from the Fidelity Central Funds, partnerships, deferred trustees compensation, capital loss carryforwards and losses deferred due to wash sales and excise tax regulations.
The federal tax cost of investment securities and unrealized appreciation (depreciation) as of period end were as follows:
Gross unrealized appreciation | $ 840,726 |
Gross unrealized depreciation | (394,526) |
Net unrealized appreciation (depreciation) | $ 446,200 |
| |
Tax Cost | $ 5,274,736 |
Annual Report
Notes to Financial Statements - continued
(Amounts in thousands except ratios)
3. Significant Accounting Policies - continued
Income Tax Information and Distributions to Shareholders - continued
The tax-based components of distributable earnings as of period end were as follows:
Undistributed ordinary income | $ 1,602 |
Capital loss carryforward | $ (6,214,141) |
Net unrealized appreciation (depreciation) | $ 446,193 |
The tax character of distributions paid was as follows:
| July 31, 2010 | July 31, 2009 |
Ordinary Income | $ 42,065 | $ 95,086 |
Long-term Capital Gains | - | 16,566 |
Total | $ 42,065 | $ 111,652 |
4. Operating Policies.
Repurchase Agreements. FMR has received an Exemptive Order from the SEC which permits the Fund and other affiliated entities of FMR to transfer uninvested cash balances into joint trading accounts which are then invested in repurchase agreements. The Fund may also invest directly with institutions in repurchase agreements. Repurchase agreements are collateralized by government or non-government securities. Upon settlement date, collateral is held in segregated accounts with custodian banks and may be obtained in the event of a default of the counterparty. The Fund monitors, on a daily basis, the value of the collateral to ensure it is at least equal to the principal amount of the repurchase agreement (including accrued interest). In the event of a default by the counterparty, realization of the collateral proceeds could be delayed, during which time the value of the collateral may decline.
Restricted Securities. The Fund may invest in securities that are subject to legal or contractual restrictions on resale. These securities generally may be resold in transactions exempt from registration or to the public if the securities are registered. Disposal of these securities may involve time-consuming negotiations and expense, and prompt sale at an acceptable price may be difficult. Information regarding restricted securities is included at the end of the Fund's Schedule of Investments.
5. Purchases and Sales of Investments.
Purchases and sales of securities, other than short-term securities, aggregated $6,089,032 and $7,246,765, respectively.
Annual Report
6. Fees and Other Transactions with Affiliates.
Management Fee. FMR and its affiliates provide the Fund with investment management related services for which the Fund pays a monthly management fee. The management fee is the sum of an individual fund fee rate that is based on an annual rate of .20% of the Fund's average net assets and a group fee rate that averaged .26% during the period. The group fee rate is based upon the average net assets of all the mutual funds advised by FMR. The group fee rate decreases as assets under management increase and increases as assets under management decrease. For the period, the total annual management fee rate was .46% of the Fund's average net assets.
Transfer Agent Fees. Fidelity Investments Institutional Operations Company, Inc. (FIIOC), an affiliate of FMR, is the transfer, dividend disbursing and shareholder servicing agent for each class of the Fund. FIIOC receives account fees and asset-based fees that vary according to the account size and type of account of the shareholders of Growth & Income. FIIOC receives an asset-based fee of Class K's average net assets. FIIOC pays for typesetting, printing and mailing of shareholder reports, except proxy statements. For the period, the total transfer agent fees paid by each class were as follows:
| Amount | % of
Average
Net Assets |
Growth & Income | $ 15,910 | .26 |
Class K | 160 | .06 |
| $ 16,070 | |
Accounting and Security Lending Fees. Fidelity Service Company, Inc. (FSC), an affiliate of FMR, maintains the Fund's accounting records. The accounting fee is based on the level of average net assets for the month. Under a separate contract, FSC administers the security lending program. The security lending fee is based on the number and duration of lending transactions.
Brokerage Commissions. The Fund placed a portion of its portfolio transactions with brokerage firms which are affiliates of the investment adviser. The commissions paid to these affiliated firms were $110 for the period.
Interfund Lending Program. Pursuant to an Exemptive Order issued by the SEC, the Fund, along with other registered investment companies having management contracts with FMR, may participate in an interfund lending program. This program provides an alternative credit facility allowing the funds to borrow from, or lend money to, other participating affiliated funds. At period end, there were no interfund loans outstanding.
Annual Report
Notes to Financial Statements - continued
(Amounts in thousands except ratios)
6. Fees and Other Transactions with Affiliates - continued
Interfund Lending Program - continued
The Fund's activity in this program during the period for which loans were outstanding was as follows:
Borrower or Lender | Average Daily
Loan Balance | Weighted Average
Interest Rate | Interest
Expense |
Borrower | $ 13,789 | .41% | $ 5 |
7. Committed Line of Credit.
The Fund participates with other funds managed by FMR in a $3.75 billion credit facility (the "line of credit") to be utilized for temporary or emergency purposes to fund shareholder redemptions or for other short-term liquidity purposes. The Fund has agreed to pay commitment fees on its pro-rata portion of the line of credit, which amounted to $26 and is reflected in Miscellaneous expenses on the Statement of Operations. During the period, there were no borrowings on this line of credit.
8. Security Lending.
The Fund lends portfolio securities from time to time in order to earn additional income. On the settlement date of the loan, the Fund receives collateral (in the form of U.S. Treasury obligations, letters of credit and/or cash) against the loaned securities and maintains collateral in an amount not less than 100% of the market value of the loaned securities during the period of the loan. The market value of the loaned securities is determined at the close of business of the Fund and any additional required collateral is delivered to the Fund on the next business day. If the borrower defaults on its obligation to return the securities loaned because of insolvency or other reasons, a fund could experience delays and costs in recovering the securities loaned or in gaining access to the collateral. Any cash collateral received is invested in the Fidelity Securities Lending Cash Central Fund. The value of loaned securities and cash collateral at period end are disclosed on the Fund's Statement of Assets and Liabilities. Security lending income represents the income earned on investing cash collateral, less fees and expenses associated with the loan, plus any premium payments that may be received on the loan of certain types of securities. Security lending income is presented in the Statement of Operations as a component of income from Fidelity Central Funds. Net income from lending portfolio securities during the period amounted to $143.
9. Expense Reductions.
Many of the brokers with whom FMR places trades on behalf of the Fund provided services to the Fund in addition to trade execution. These services included payments of certain expenses on behalf of the Fund totaling $547 for the period.
Annual Report
10. Distributions to Shareholders.
Distributions to shareholders of each class were as follows:
Years ended July 31, | 2010 | 2009 |
From net investment income | | |
Growth & Income | $ 36,263 | $ 92,019 |
Class K | 2,320 | 3,067 |
Total | $ 38,583 | $ 95,086 |
From net realized gain | | |
Growth & Income | $ 3,285 | $ 16,537 |
Class K | 197 | 29 |
Total | $ 3,482 | $ 16,566 |
11. Share Transactions.
Transactions for each class of shares were as follows:
| Shares | Dollars |
Years ended July 31, | 2010 A | 2009 | 2010 A | 2009 |
Growth & Income | | | | |
Shares sold | 18,939 | 34,825 | $ 300,805 | $ 492,141 |
Conversion to Class K | (593) | (26,363) | (8,751) | (389,259) |
Reinvestment of distributions | 2,436 | 6,899 | 38,201 | 105,157 |
Shares redeemed | (93,499) | (172,362) | (1,487,904) | (2,530,518) |
Net increase (decrease) | (72,717) | (157,001) | $ (1,157,649) | $ (2,322,479) |
Class K | | | | |
Shares sold | 8,408 | 3,336 | $ 133,367 | $ 44,336 |
Conversion from Growth & Income | 593 | 26,372 | 8,751 | 389,259 |
Reinvestment of distributions | 161 | 232 | 2,517 | 3,096 |
Shares redeemed | (14,911) | (5,644) | (234,674) | (67,387) |
Net increase (decrease) | (5,749) | 24,296 | $ (90,039) | $ 369,304 |
A Conversion transactions for Class K and Growth & Income are presented for the period August 1, 2009 through August 31, 2009.
12. Other.
The Fund's organizational documents provide former and current trustees and officers with a limited indemnification against liabilities arising in connection with the performance of their duties to the Fund. In the normal course of business, the Fund may also enter into contracts that provide general indemnifications. The Fund's maximum exposure under these arrangements is unknown as this would be dependent on future claims that may be made against the Fund. The risk of material loss from such claims is considered remote.
Annual Report
To the Trustees of Fidelity Securities Fund and the Shareholders of Fidelity Growth & Income Portfolio:
In our opinion, the accompanying statement of assets and liabilities, including the schedule of investments, and the related statements of operations and of changes in net assets and the financial highlights present fairly, in all material respects, the financial position of Fidelity Growth & Income Portfolio (a fund of Fidelity Securities Fund) at July 31, 2010, the results of its operations for the year then ended, the changes in its net assets for each of the two years in the period then ended and the financial highlights for each of the periods indicated, in conformity with accounting principles generally accepted in the United States of America. These financial statements and financial highlights (hereafter referred to as "financial statements") are the responsibility of the Fidelity Growth & Income Portfolio's management. Our responsibility is to express an opinion on these financial statements based on our audits. We conducted our audits of these financial statements in accordance with the standards of the Public Company Accounting Oversight Board (United States). Those standards require that we plan and perform the audit to obtain reasonable assurance about whether the financial statements are free of material misstatement. An audit includes examining, on a test basis, evidence supporting the amounts and disclosures in the financial statements, assessing the accounting principles used and significant estimates made by management, and evaluating the overall financial statement presentation. We believe that our audits, which included confirmation of securities at July 31, 2010 by correspondence with the custodian and brokers, provide a reasonable basis for our opinion.
/s/ PricewaterhouseCoopers LLP
PricewaterhouseCoopers LLP
Boston, Massachusetts
September 13, 2010
Annual Report
The Trustees, Member of the Advisory Board, and executive officers of the trust and fund, as applicable, are listed below. The Board of Trustees governs the fund and is responsible for protecting the interests of shareholders. The Trustees are experienced executives who meet periodically throughout the year to oversee the fund's activities, review contractual arrangements with companies that provide services to the fund, oversee management of the risks associated with such activities and contractual arrangements, and review the fund's performance. Except for James C. Curvey, each of the Trustees oversees 222 funds advised by FMR or an affiliate. Mr. Curvey oversees 411 funds advised by FMR or an affiliate.
The Trustees hold office without limit in time except that (a) any Trustee may resign; (b) any Trustee may be removed by written instrument, signed by at least two-thirds of the number of Trustees prior to such removal; (c) any Trustee who requests to be retired or who has become incapacitated by illness or injury may be retired by written instrument signed by a majority of the other Trustees; and (d) any Trustee may be removed at any special meeting of shareholders by a two-thirds vote of the outstanding voting securities of the trust. Each Trustee who is not an interested person (as defined in the 1940 Act) (Independent Trustee), shall retire not later than the last day of the calendar year in which his or her 72nd birthday occurs. The Independent Trustees may waive this mandatory retirement age policy with respect to individual Trustees. The executive officers and Advisory Board Member hold office without limit in time, except that any officer and Advisory Board Member may resign or may be removed by a vote of a majority of the Trustees at any regular meeting or any special meeting of the Trustees. Except as indicated, each individual has held the office shown or other offices in the same company for the past five years.
Experience, Skills, Attributes, and Qualifications of the Fund's Trustees. The Governance and Nominating Committee has adopted a statement of policy that describes the experience, qualifications, attributes, and skills that are necessary and desirable for potential Independent Trustee candidates (Statement of Policy). The Board believes that each Trustee satisfied at the time he or she was initially elected or appointed a Trustee, and continues to satisfy, the standards contemplated by the Statement of Policy. The Governance and Nominating Committee also engages professional search firms to help identify potential Independent Trustee candidates who have the experience, qualifications, attributes, and skills consistent with the Statement of Policy. From time to time, additional criteria based on the composition and skills of the current Independent Trustees, as well as experience or skills that may be appropriate in light of future changes to board composition, business conditions, and regulatory or other developments, have also been considered by the professional search firms and the Governance and Nominating Committee. In addition, the Board takes into account the Trustees' commitment and participation in Board and committee meetings, as well as their leadership of standing and ad hoc committees throughout their tenure.
In determining that a particular Trustee was and continues to be qualified to serve as a Trustee, the Board has considered a variety of criteria, none of which, in isolation, was controlling. The Board believes that, collectively, the Trustees have balanced and diverse experience, qualifications, attributes, and skills, which allow the Board to operate effectively in governing the fund and protecting the interests of shareholders. Information about the specific experience, skills, attributes, and qualifications of each Trustee, which in each case led to the Board's conclusion that the Trustee should serve (or continue to serve) as a trustee of the fund, is provided below.
Annual Report
Board Structure and Oversight Function. Edward C. Johnson 3d is an interested person (as defined in the 1940 Act) and currently serves as Chairman. The Trustees have determined that an interested Chairman is appropriate and benefits shareholders because an interested Chairman has a personal and professional stake in the quality and continuity of services provided to the fund. Independent Trustees exercise their informed business judgment to appoint an individual of their choosing to serve as Chairman, regardless of whether the Trustee happens to be independent or a member of management. The Independent Trustees have determined that they can act independently and effectively without having an Independent Trustee serve as Chairman and that a key structural component for assuring that they are in a position to do so is for the Independent Trustees to constitute a substantial majority for the Board. The Independent Trustees also regularly meet in executive session. Ned C. Lautenbach serves as Chairman of the Independent Trustees and as such (i) acts as a liaison between the Independent Trustees and management with respect to matters important to the Independent Trustees and (ii) with management prepares agendas for Board meetings.
Fidelity funds are overseen by different Boards of Trustees. The fund's Board oversees Fidelity's equity and high income funds and another Board oversees Fidelity's investment-grade bond, money market, and asset allocation funds. The asset allocation funds may invest in Fidelity funds overseen by the fund's Board. The use of separate Boards, each with its own committee structure, allows the Trustees of each group of Fidelity funds to focus on the unique issues of the funds they oversee, including common research, investment, and operational issues. On occasion, the separate Boards establish joint committees to address issues of overlapping consequences for the Fidelity funds overseen by each Board.
The Trustees operate using a system of committees to facilitate the timely and efficient consideration of all matters of importance to the Trustees, the fund, and fund shareholders and to facilitate compliance with legal and regulatory requirements and oversight of the fund's activities and associated risks. The Board, acting through its committees, has charged FMR and its affiliates with (i) identifying events or circumstances the occurrence of which could have demonstrably adverse effects on the fund's business and/or reputation; (ii) implementing processes and controls to lessen the possibility that such events or circumstances occur or to mitigate the effects of such events or circumstances if they do occur; and (iii) creating and maintaining a system designed to evaluate continuously business and market conditions in order to facilitate the identification and implementation processes described in (i) and (ii) above. Because the day-to-day operations and activities of the fund are carried out by or through FMR, its affiliates and other service providers, the fund's exposure to risks is mitigated but not eliminated by the processes overseen by the Trustees. While each of the Board's committees has responsibility for overseeing different aspects of the fund's activities, oversight is exercised primarily through the Operations, Audit, and Compliance Committees. Appropriate personnel, including but not limited to the fund's Chief Compliance Officer (CCO), FMR's internal auditor, the independent accountants, the fund's Treasurer and portfolio management personnel, make periodic reports to the Board's committees, as appropriate. The responsibilities of each committee, including their oversight responsibilities, are described further under "Standing Committees of the Fund's Trustees."
Annual Report
Trustees and Officers - continued
The fund's Statement of Additional Information (SAI) includes more information about the Trustees. To request a free copy, call Fidelity at 1-800-835-5092.
Interested Trustees*:
Correspondence intended for each Trustee who is an interested person may be sent to Fidelity Investments, 82 Devonshire Street, Boston, Massachusetts 02109.
Name, Age; Principal Occupations and Other Relevant Experience+ |
Edward C. Johnson 3d (80) |
| Year of Election or Appointment: 1984 Mr. Johnson is Trustee and Chairman of the Board of Trustees of certain Trusts. Mr. Johnson serves as Chief Executive Officer, Chairman, and a Director of FMR LLC; Chairman and a Director of FMR; Chairman and a Director of Fidelity Research & Analysis Company (FRAC); Chairman and a Director of Fidelity Investments Money Management, Inc.; and Chairman and a Director of FMR Co., Inc. In addition, Mr. Johnson serves as Chairman and Director of FIL Limited. Previously, Mr. Johnson served as President of FMR LLC (2006-2007). |
James C. Curvey (75) |
| Year of Election or Appointment: 2007 Mr. Curvey also serves as Trustee (2007-present) of other investment companies advised by FMR. Mr. Curvey is a Director of FMR and FMR Co., Inc. (2007-present). Mr. Curvey is also Vice Chairman (2006-present) and Director of FMR LLC. In addition, Mr. Curvey serves as an Overseer for the Boston Symphony Orchestra and a member of the Trustees of Villanova University. |
* Trustees have been determined to be "Interested Trustees" by virtue of, among other things, their affiliation with the trust or various entities under common control with FMR.
+ The information above includes each Trustee's principal occupation during the last five years and other information relating to the experience, attributes, and skills relevant to each Trustee's qualifications to serve as a Trustee, which led to the conclusion that each Trustee should serve as a Trustee for the fund.
Annual Report
Independent Trustees:
Correspondence intended for each Independent Trustee (that is, the Trustees other than the Interested Trustees) may be sent to Fidelity Investments, P.O. Box 55235, Boston, Massachusetts 02205-5235.
Name, Age; Principal Occupations and Other Relevant Experience+ |
Dennis J. Dirks (62) |
| Year of Election or Appointment: 2005 Prior to his retirement in May 2003, Mr. Dirks was Chief Operating Officer and a member of the Board of The Depository Trust & Clearing Corporation (DTCC). He also served as President, Chief Operating Officer, and Board member of The Depository Trust Company (DTC) and President and Board member of the National Securities Clearing Corporation (NSCC). In addition, Mr. Dirks served as Chief Executive Officer and Board member of the Government Securities Clearing Corporation, Chief Executive Officer and Board member of the Mortgage-Backed Securities Clearing Corporation, as a Trustee and a member of the Finance Committee of Manhattan College (2005-2008), and as a Trustee and a member of the Finance Committee of AHRC of Nassau County (2006-2008). Currently, Mr. Dirks serves as a member of the Board of Directors for The Brookville Center for Children's Services, Inc. (2009-present). |
Alan J. Lacy (56) |
| Year of Election or Appointment: 2008 Mr. Lacy serves as Senior Adviser (2007-present) of Oak Hill Capital Partners, L.P. (private equity). Mr. Lacy also served as Chief Executive Officer (2000-2005) and Vice Chairman (2005-2006) of Sears Holdings Corporation and Sears, Roebuck and Co. (retail). In addition, Mr. Lacy serves as a member of the Board of Directors of The Western Union Company (global money transfer, 2006-present) and Bristol-Myers Squibb Company (global pharmaceuticals, 2007-present). Mr. Lacy is Chairman (2008-present) and a member (2006-present) of the Board of Trustees of The National Parks Conservation Association. |
Ned C. Lautenbach (66) |
| Year of Election or Appointment: 2000 Mr. Lautenbach is Chairman of the Independent Trustees of the Equity and High Income Funds (2006-present). Mr. Lautenbach is an Advisory Partner of Clayton, Dubilier & Rice, Inc. (private equity investment, 2008-present) and was previously a Partner of Clayton, Dubilier & Rice, Inc. (1998-2008). Previously, Mr. Lautenbach was with the International Business Machines Corporation (IBM) from 1968 until his retirement in 1998. Mr. Lautenbach serves as a Director of Eaton Corporation (diversified industrial) as well as the Philharmonic Center for the Arts in Naples, Florida. Mr. Lautenbach is also a member of the Board of Trustees of Fairfield University (2005-present), as well as a member of the Council on Foreign Relations. Previously, Mr. Lautenbach served as a Director of Sony Corporation (2006-2007). |
Joseph Mauriello (65) |
| Year of Election or Appointment: 2008 Prior to his retirement in January 2006, Mr. Mauriello served in numerous senior management positions including Deputy Chairman and Chief Operating Officer (2004-2005), and Vice Chairman of Financial Services (2002-2004) of KPMG LLP US (professional services, 1965-2005). Mr. Mauriello currently serves as a member of the Board of Directors of XL Capital Ltd. (global insurance and re-insurance, 2006-present) and of Arcadia Resources Inc. (health care services and products, 2007-present). Previously, Mr. Mauriello served as a Director of the Hamilton Funds of the Bank of New York (2006-2007). |
Cornelia M. Small (66) |
| Year of Election or Appointment: 2005 Ms. Small is a member of the Board of Directors of the Teagle Foundation (2009-present). Ms. Small is also a member of the Investment Committee, and Chair (2008-present) and a member of the Board of Trustees of Smith College. In addition, Ms. Small serves on the Investment Committee of the Berkshire Taconic Community Foundation (2008-present). Previously, Ms. Small served as Chairperson of the Investment Committee (2002-2008) of Smith College. In addition, Ms. Small served as Chief Investment Officer, Director of Global Equity Investments, and a member of the Board of Directors of Scudder, Stevens & Clark and Scudder Kemper Investments. |
William S. Stavropoulos (71) |
| Year of Election or Appointment: 2002 Mr. Stavropoulos is Vice Chairman of the Independent Trustees of the Equity and High Income Funds (2006-present). Mr. Stavropoulos serves as President and Founder of the Michigan Baseball Foundation, the Great Lakes Loons (2007-present). Mr. Stavropoulos is Chairman Emeritus of the Board of Directors of The Dow Chemical Company, where he previously served in numerous senior management positions, including President, CEO (1995-2000; 2002-2004), Chairman of the Executive Committee (2000-2006), and as a member of the Board of Directors (1990-2006). Currently, Mr. Stavropoulos is a Director of Teradata Corporation (data warehousing and technology solutions, 2008-present), Chemical Financial Corporation, Maersk Inc. (industrial conglomerate), Tyco International, Inc. (multinational manufacturing and services, 2007-present), and a member of the Advisory Board for Metalmark Capital (private equity investment, 2005-present). Mr. Stavropoulos is a special advisor to Clayton, Dubilier & Rice, Inc. (private equity investment). In addition, Mr. Stavropoulos is a member of the University of Notre Dame Advisory Council for the College of Science. |
David M. Thomas (61) |
| Year of Election or Appointment: 2008 Previously, Mr. Thomas served as Executive Chairman (2005-2006) and Chairman and Chief Executive Officer (2000-2005) of IMS Health, Inc. (pharmaceutical and healthcare information solutions). In addition, Mr. Thomas serves as a member of the Board of Directors of Fortune Brands, Inc. (consumer products), and Interpublic Group of Companies, Inc. (marketing communication, 2004-present). |
Michael E. Wiley (59) |
| Year of Election or Appointment: 2008 Mr. Wiley also serves as a Director of Asia Pacific Exploration Consolidated (international oil and gas exploration and production, 2008-present), and as a member of the Board of Trustees of the University of Tulsa (2000-2006; 2007-present). Mr. Wiley serves as a Director of Tesoro Corporation (independent oil refiner and marketer, 2005-present), and a Director of Bill Barrett Corporation (exploration and production, 2005-present). In addition, Mr. Wiley also serves as a Director of Post Oak Bank (privately-held bank, 2004-present). Previously, Mr. Wiley served as a Sr. Energy Advisor of Katzenbach Partners, LLC (consulting, 2006-2007), as an Advisory Director of Riverstone Holdings (private investment), Chairman, President, and CEO of Baker Hughes, Inc. (oilfield services, 2000-2004), and as Director of Spinnaker Exploration Company (exploration and production, 2001-2005). |
+ The information above includes each Trustee's principal occupation during the last five years and other information relating to the experience, attributes, and skills relevant to each Trustee's qualifications to serve as a Trustee, which led to the conclusion that each Trustee should serve as a Trustee for the fund.
Advisory Board Member and Executive Officers:
Correspondence intended for each executive officer and Peter S. Lynch may be sent to Fidelity Investments, 82 Devonshire Street, Boston, Massachusetts 02109.
Name, Age; Principal Occupation |
Peter S. Lynch (66) |
| Year of Election or Appointment: 2003 Member of the Advisory Board of Fidelity's Equity and High Income Funds. Mr. Lynch is Vice Chairman and a Director of FMR and FMR Co., Inc. In addition, Mr. Lynch serves as a Trustee of Boston College and as the Chairman of the Inner-City Scholarship Fund. Previously, Mr. Lynch served on the Special Olympics International Board of Directors (1997-2006). |
Kenneth B. Robins (40) |
| Year of Election or Appointment: 2008 President and Treasurer of Fidelity's Equity and High Income Funds. Mr. Robins also serves as President and Treasurer (2010-present) and Assistant Treasurer (2009-present) of other Fidelity funds and is an employee of Fidelity Investments (2004-present). Previously, Mr. Robins served as Deputy Treasurer of the Fidelity funds (2005-2008) and Treasurer and Chief Financial Officer of The North Carolina Capital Management Trust: Cash and Term Portfolios (2006-2008). |
Bruce T. Herring (44) |
| Year of Election or Appointment: 2006 Vice President of certain Equity Funds. Mr. Herring also serves as Group Chief Investments Officer of FMR. Previously, Mr. Herring served as a portfolio manager for Fidelity U.S. Equity Funds. |
Brian B. Hogan (45) |
| Year of Election or Appointment: 2009 Vice President of certain Equity Funds and Vice President of Sector Funds. Mr. Hogan also serves as Senior Vice President, Equity Research of FMR (2006-present) and President of FMR's Equity Division (2009-present). Previously, Mr. Hogan served as a portfolio manager. |
Scott C. Goebel (42) |
| Year of Election or Appointment: 2008 Secretary and Chief Legal Officer (CLO) of the Fidelity funds. Mr. Goebel also serves as General Counsel, Secretary, and Senior Vice President of FMR (2008-present) and FMR Co., Inc. (2008-present); Deputy General Counsel of FMR LLC; Chief Legal Officer of Fidelity Management & Research (Hong Kong) Limited (2008-present) and Assistant Secretary of Fidelity Management & Research (Japan) Inc. (2008-present), Fidelity Investments Money Management, Inc. (2008-present), Fidelity Management & Research (U.K.) Inc. (2008-present), and Fidelity Research and Analysis Company (2008-present). Previously, Mr. Goebel served as Assistant Secretary of the Funds (2007-2008) and as Vice President and Secretary of Fidelity Distributors Corporation (FDC) (2005-2007). |
William C. Coffey (41) |
| Year of Election or Appointment: 2009 Assistant Secretary of Fidelity's Equity and High Income Funds. Mr. Coffey also serves as Senior Vice President and Deputy General Counsel of FMR LLC (2010-present), and is an employee of Fidelity Investments. Previously, Mr. Coffey served as Vice President and Associate General Counsel of FMR LLC (2005-2009). |
Holly C. Laurent (56) |
| Year of Election or Appointment: 2008 Anti-Money Laundering (AML) Officer of the Fidelity funds. Ms. Laurent is an employee of Fidelity Investments. Previously, Ms. Laurent was Senior Vice President and Head of Legal for Fidelity Business Services India Pvt. Ltd. (2006-2008), and Senior Vice President, Deputy General Counsel and Group Head for FMR LLC (2005-2006). |
Christine Reynolds (51) |
| Year of Election or Appointment: 2008 Chief Financial Officer of the Fidelity funds. Ms. Reynolds became President of Fidelity Pricing and Cash Management Services (FPCMS) in August 2008. Ms. Reynolds served as Chief Operating Officer of FPCMS (2007-2008). Previously, Ms. Reynolds served as President, Treasurer, and Anti-Money Laundering officer of the Fidelity funds (2004-2007). |
Kenneth A. Rathgeber (63) |
| Year of Election or Appointment: 2004 Chief Compliance Officer of Fidelity's Equity and High Income Funds. Mr. Rathgeber is Chief Compliance Officer of Fidelity Management & Research (Hong Kong) Limited (2008-present), Fidelity Management & Research (Japan) Inc. (2008-present), FMR (2005-present), FMR Co., Inc. (2005-present), Fidelity Management & Research (U.K.) Inc. (2005-present), Fidelity Research & Analysis Company (2005-present), Fidelity Investments Money Management, Inc. (2005-present), Pyramis Global Advisors, LLC (2005-present), and Strategic Advisers, Inc. (2005-present). |
Jeffrey S. Christian (48) |
| Year of Election or Appointment: 2009 Deputy Treasurer of the Fidelity funds. Mr. Christian is an employee of Fidelity Investments. Previously, Mr. Christian served as Chief Financial Officer (2008-2009) of certain Fidelity funds and Senior Vice President of Fidelity Pricing and Cash Management Services (FPCMS) (2004-2009). |
Bryan A. Mehrmann (49) |
| Year of Election or Appointment: 2005 Deputy Treasurer of the Fidelity funds. Mr. Mehrmann is an employee of Fidelity Investments. |
Adrien E. Deberghes (42) |
| Year of Election or Appointment: 2008 Deputy Treasurer of Fidelity's Equity and High Income Funds. Mr. Deberghes also serves as Assistant Treasurer of other Fidelity funds (2010-present) and is an employee of Fidelity Investments (2008-present). Previously, Mr. Deberghes served as Senior Vice President of Mutual Fund Administration at State Street Corporation (2007-2008), Senior Director of Mutual Fund Administration at Investors Bank & Trust (2005-2007), and Director of Finance for Dunkin' Brands (2000-2005). |
Stephanie J. Dorsey (41) |
| Year of Election or Appointment: 2010 Assistant Treasurer of Fidelity's Equity and High Income Funds. Ms. Dorsey also serves as Deputy Treasurer of other Fidelity funds (2008-present) and is an employee of Fidelity Investments (2008-present). Previously, Ms. Dorsey served as Treasurer (2004-2008) of the JPMorgan Mutual Funds and Vice President (2004-2008) of JPMorgan Chase Bank. |
John R. Hebble (52) |
| Year of Election or Appointment: 2009 Assistant Treasurer of Fidelity's Equity and High Income Funds. Mr. Hebble also serves as Treasurer and Chief Financial Officer of The North Carolina Capital Management Trust: Cash and Term Portfolio (2008-present), President and Treasurer of other Fidelity funds (2008-present) and is an employee of Fidelity Investments. |
Gary W. Ryan (51) |
| Year of Election or Appointment: 2005 Assistant Treasurer of the Fidelity funds. Mr. Ryan is an employee of Fidelity Investments. Previously, Mr. Ryan served as Vice President of Fund Reporting in Fidelity Pricing and Cash Management Services (FPCMS) (1999-2005). |
Annual Report
Class K designates 100% during the fiscal year as qualifying for the dividends-received deduction for corporate shareholders.
Class K designates 100% of the dividends distributed during the fiscal year as amounts which may be taken into account as a dividend for the purposes of the maximum rate under section 1(h)(11) of the Internal Revenue Code.
A total of 0.05% of the dividends distributed during the fiscal year was derived from interest on U.S. Government securities which is generally exempt from state income tax.
The fund will notify shareholders in January 2011 of amounts for use in preparing 2010 income tax returns.
Annual Report
Board Approval of Investment Advisory Contracts and Management Fees
Fidelity Growth & Income Portfolio
Each year, the Board of Trustees, including the Independent Trustees (together, the Board), votes on the renewal of the management contract and sub-advisory agreements (together, the Advisory Contracts) for the fund. The Board, assisted by the advice of fund counsel and Independent Trustees' counsel, requests and considers a broad range of information relevant to the renewal of the Advisory Contracts throughout the year.
The Board meets regularly and considers at each of its meetings factors that are relevant to its annual consideration of the renewal of the fund's Advisory Contracts, including the services and support provided to the fund and its shareholders. The Board has established various standing committees, each composed of Independent Trustees with varying backgrounds, to which the Board has assigned specific subject matter responsibilities in order to enhance effective decision-making by the Board. The Board, acting directly and through its Committees, requests and receives information concerning the annual consideration of the renewal of the fund's Advisory Contracts. The Board also meets as needed to consider matters specifically related to the Board's annual consideration of the renewal of Advisory Contracts. Members of the Board may also meet with trustees of other Fidelity funds through ad hoc joint committees to discuss certain matters relevant to the Fidelity funds.
At its July 2010 meeting, the Board of Trustees, including the Independent Trustees, unanimously determined to renew the fund's Advisory Contracts. In reaching its determination, the Board considered all factors it believed relevant, including (i) the nature, extent, and quality of the services to be provided to the fund and its shareholders (including the investment performance of the fund); (ii) the competitiveness of the fund's management fee and total expenses; (iii) the total costs of the services to be provided by and the profits to be realized by Fidelity from its relationship with the fund; (iv) the extent to which economies of scale would be realized as the fund grows; and (v) whether fee levels reflect these economies of scale, if any, for the benefit of fund shareholders.
In considering whether to renew the Advisory Contracts for the fund, the Board reached a determination, with the assistance of fund counsel and Independent Trustees' counsel and through the exercise of its business judgment, that the renewal of the Advisory Contracts is in the best interests of fund shareholders and that the compensation to be received by Fidelity under the management contract is fair and reasonable. The Board's decision to renew the Advisory Contracts was not based on any single factor noted above, but rather was based on a comprehensive consideration of all the information provided to the Board at its meetings throughout the year. The Board, in reaching its determination to renew the Advisory Contracts, is aware that shareholders in the fund have a broad range of investment choices available to them, including a wide choice among mutual funds offered by Fidelity's competitors, and that the fund's shareholders, with the opportunity to review and weigh the disclosure provided by the fund in its prospectus and other public disclosures, have chosen to invest in this fund, managed by Fidelity.
Annual Report
Board Approval of Investment Advisory Contracts and
Management Fees - continued
Nature, Extent, and Quality of Services Provided. The Board considered the staffing within the investment adviser, FMR, and the sub-advisers (together, the Investment Advisers), including the backgrounds of the fund's investment personnel and the fund's investment objective and discipline. The Independent Trustees also had discussions with senior management of Fidelity's investment operations and investment groups. The Board considered the structure of the portfolio manager compensation program and whether this structure provides appropriate incentives to act in the best interest of the fund.
Resources Dedicated to Investment Management and Support Services. The Board and the equity research subcommittee of the Board's Fund Oversight Committee reviewed the size, education, and experience of the Investment Advisers' investment staff, their use of technology, and the Investment Advisers' approach to recruiting, training, and retaining portfolio managers and other research, advisory, and management personnel. The Board noted that Fidelity's analysts have access to a variety of technological tools and market and securities data that enable them to perform both fundamental and quantitative analysis and to specialize in various disciplines. The Board considered Fidelity's extensive global research capabilities that enable the Investment Advisers to aggregate data from various sources in an effort to produce positive investment results. The Board also considered that Fidelity's portfolio managers and analysts have access to daily portfolio attribution that allows for monitoring of a fund's portfolio, as well as an electronic communication system that provides immediate real-time access to research concerning issuers and credit enhancers. The Board noted FMR's continued focus on strengthening the organization and discipline of equity portfolio management and research.
Shareholder and Administrative Services. The Board considered (i) the nature, extent, quality, and cost of advisory, administrative, and shareholder services performed by the Investment Advisers and their affiliates under the Advisory Contracts and under separate agreements covering transfer agency, pricing and bookkeeping, and securities lending services for the fund; (ii) the nature and extent of the investment adviser's supervision of third party service providers, principally custodians and subcustodians; and (iii) the resources devoted to, and the record of compliance with, the fund's compliance policies and procedures. The Board also reviewed the allocation of fund brokerage, including allocations to brokers affiliated with the Investment Advisers, the use of brokerage commissions to pay fund expenses, and the use of "soft" commission dollars to pay for research services.
The Board noted that the growth of fund assets over time across the complex allows Fidelity to reinvest in the development of services designed to enhance the value or convenience of the Fidelity funds as investment vehicles. These services include 24-hour access to account information and market information through phone representatives and over the Internet, and investor education materials and asset allocation tools.
Annual Report
Investment in a Large Fund Family. The Board considered the benefits to shareholders of investing in a Fidelity fund, including the benefits of investing in a fund that is part of a large family of funds offering a variety of investment disciplines and providing a large variety of mutual fund investor services. The Board noted that Fidelity had taken, or had made recommendations that resulted in the Fidelity funds taking, a number of actions over the previous year that benefited particular funds, including (i) dedicating additional resources to investment research and restructuring and broadening the focus of the investment research teams; (ii) bolstering the senior management team that oversees asset management; (iii) launching Class F of certain funds as a lower-fee class available to Freedom K and Freedom Index Funds; (iv) lowering the initial investment minimums and ongoing balance requirements for Real Estate High Income Fund; (v) eliminating subsequent purchase minimums for all funds and adding a waiver of the investment minimum requirement for new accounts opened with the proceeds of a systematic withdrawal plan; (vi) eliminating the withdrawal minimum and maximum limits for systematic withdrawals from Advisor funds; (vii) expanding sales load waivers on Class A shares for Destiny Planholders and expanding Institutional Class eligibility for Class O Destiny Planholders; and (viii) changing certain Class A and Class T sales charge structures to further align them with industry practices.
Investment Performance. The Board considered whether the fund has operated in accordance with its investment objective, as well as its record of compliance with its investment restrictions. It also reviewed the fund's absolute investment performance for each class, as well as the fund's relative investment performance for each class measured over multiple periods against (i) a broad-based securities market index, and (ii) a peer group of mutual funds deemed appropriate by Fidelity and reviewed by the Board. The following charts considered by the Board show, over the one-, three-, and five-year periods ended December 31, 2009, as available, the cumulative total returns of Class K and the retail class of the fund, the cumulative total returns of a broad-based securities market index ("benchmark"), and a range of cumulative total returns of a peer group of mutual funds identified by Morningstar, Inc. as having an investment style similar to that of the fund based on underlying portfolio holdings. The box within each chart shows the 25th percentile return (bottom of box) and the 75th percentile return (top of box) of the peer group. Returns shown above the box are in the first quartile and returns shown below the box are in the fourth quartile. The percentage beaten numbers noted below each chart correspond to the percentile box and represent the percentage of funds in the peer group whose performance was equal to or lower than that of the class indicated.
Annual Report
Board Approval of Investment Advisory Contracts and
Management Fees - continued
Fidelity Growth & Income Portfolio

The Board reviewed the fund's relative investment performance against its peer group and noted that the performance of the retail class of the fund (the class with the longer performance record) was in the fourth quartile for all the periods shown. The Board also noted that the investment performance of the fund was lower than its benchmark for all the periods shown. The Board considered that the variations in performance between the fund's classes reflect the variations in class expenses, which result in lower performance for the higher expense class. The Board discussed with FMR actions that have been taken by FMR to improve the fund's disappointing performance relative to its peer group and benchmark. The Board noted that this fund had underperformed in the previous year and discussed with FMR its disappointment with the continued underperformance of the fund. The Board also reviewed the fund's performance since inception as well as performance in the current year. The Board will continue to closely monitor the performance of the fund in the coming year and discuss with FMR other appropriate actions to address the performance of the fund.
Based on its review, and giving particular weight to the nature and quality of the resources dedicated by the Investment Advisers to maintain and improve relative performance and factoring in the unprecedented market events in recent years, the Board concluded that the nature, extent, and quality of investment management and support services and of shareholder and administrative services provided to the fund will benefit the fund's shareholders, particularly in light of the Board's view that the fund's shareholders benefit from investing in a fund that is part of a large family of funds offering a variety of investment disciplines and services.
Annual Report
Competitiveness of Management Fee and Total Fund Expenses. The Board considered the fund's management fee and total expenses compared to "mapped groups" of competitive funds and classes. Fidelity creates "mapped groups" by combining similar Lipper investment objective categories that have comparable management fee characteristics. Combining Lipper investment objective categories aids the Board's management fee and total expense comparisons by broadening the competitive group used for comparison and by reducing the number of universes to which various Fidelity funds are compared.
Management Fee. The Board considered two proprietary management fee comparisons for the 12-month periods shown in the chart below. The group of Lipper funds used by the Board for management fee comparisons is referred to below as the "Total Mapped Group." The Total Mapped Group comparison focuses on a fund's standing relative to the total universe of comparable funds available to investors, in terms of gross management fees before expense reimbursements or caps. "TMG %" represents the percentage of funds in the Total Mapped Group that had management fees that were lower than the fund's. For example, a TMG % of 12% means that 88% of the funds in the Total Mapped Group had higher management fees than the fund. The "Asset-Size Peer Group" (ASPG) comparison focuses on a fund's standing relative to non-Fidelity funds similar in size to the fund within the Total Mapped Group. The ASPG represents at least 15% of the funds in the Total Mapped Group with comparable asset size and management fee characteristics, subject to a minimum of 50 funds (or all funds in the Total Mapped Group if fewer than 50). Additional information, such as the ASPG quartile in which the fund's management fee ranked, is also included in the chart and considered by the Board.
Fidelity Growth & Income Portfolio

Annual Report
Board Approval of Investment Advisory Contracts and
Management Fees - continued
The Board noted that the fund's management fee ranked below the median of its Total Mapped Group and below the median of its ASPG for 2009.
Based on its review, the Board concluded that the fund's management fee is fair and reasonable in light of the services that the fund receives and the other factors considered.
Total Expenses. In its review of each class's total expenses, the Board considered the fund's management fee as well as other fund or class expenses, as applicable, such as transfer agent fees, pricing and bookkeeping fees, and custodial, legal, and audit fees. The Board also noted the effects of any waivers and reimbursements on fees and expenses. As part of its review, the Board also considered current and historical total expenses of each class of the fund compared to competitive fund median expenses. Each class of the fund is compared to those funds and classes in the Total Mapped Group (used by the Board for management fee comparisons) that have a similar sales load structure.
The Board noted that the total expenses of each class ranked below its competitive median for 2009.
Fees Charged to Other Fidelity Clients. The Board also considered Fidelity fee structures and other information with respect to clients of FMR and its affiliates, such as other mutual funds advised or subadvised by FMR or its affiliates, pension plan clients, and other institutional clients. In March 2010, the Board created an ad hoc joint committee with the board of other Fidelity funds (the Committee) to review and compare Fidelity's institutional investment advisory business with its business of providing services to the Fidelity funds, including the differences in services provided, fees charged, and costs incurred, as well as competition in their respective marketplaces.
Based on its review of total expenses and fees charged to other Fidelity clients, the Board concluded that the total expenses of each class of the fund were reasonable in light of the services that the fund and its shareholders receive and the other factors considered, including the findings of the Committee.
Costs of the Services and Profitability. The Board considered the revenues earned and the expenses incurred by Fidelity in conducting the business of developing, marketing, distributing, managing, administering and servicing the fund and its shareholders. The Board also considered the level of Fidelity's profits in respect of all the Fidelity funds.
On an annual basis, FMR presents to the Board Fidelity's profitability for the fund. Fidelity calculates the profitability for each fund, as well as aggregate profitability for groups of Fidelity funds and all Fidelity funds, using a series of detailed revenue and cost allocation methodologies which originate with the audited books and records of Fidelity. The Audit Committee of the Board reviews any significant changes from the prior year's methodologies.
Annual Report
PricewaterhouseCoopers LLP (PwC), independent registered public accounting firm and auditor to Fidelity and certain Fidelity funds, has been engaged annually by the Board as part of the Board's assessment of Fidelity's profitability analysis. PwC's engagement includes the review and assessment of Fidelity's methodologies used in determining the revenues and expenses attributable to Fidelity's mutual fund business, and completion of agreed-upon procedures surrounding the mathematical accuracy of fund profitability and its conformity to allocation methodologies. After considering PwC's reports issued under the engagement and information provided by Fidelity, the Board believes that while other allocation methods may also be reasonable, Fidelity's profitability methodologies are reasonable in all material respects.
The Board has also reviewed Fidelity's non-fund businesses and fall-out benefits related to the mutual fund business as well as cases where Fidelity's affiliates may benefit from or be related to the fund's business.
The Board considered the costs of the services provided by and the profits realized by Fidelity in connection with the operation of the fund and were satisfied that the profitability was not excessive in the circumstances.
Economies of Scale. The Board considered whether there have been economies of scale in respect of the management of the Fidelity funds, whether the Fidelity funds (including the fund) have appropriately benefited from any such economies of scale, and whether there is potential for realization of any further economies of scale. The Board considered the extent to which the fund will benefit from economies of scale through increased services to the fund, through waivers or reimbursements, or through fee or expense reductions.
In February 2009, the Board and the board of other Fidelity funds created an ad hoc committee (the Economies of Scale Committee) to analyze whether FMR attains economies of scale in respect of the management and servicing of the Fidelity funds, whether the Fidelity funds have appropriately benefited from such economies of scale, and whether there is potential for realization of any further economies of scale.
The Board recognized that the fund's management contract incorporates a "group fee" structure, which provides for lower group fee rates as total fund assets under FMR's management increase, and for higher group fee rates as total fund assets under FMR's management decrease. FMR calculates the group fee rates based on a tiered asset "breakpoint" schedule that varies based on asset class. The Board considered that the group fee is designed to deliver the benefits of economies of scale to fund shareholders when total Fidelity fund assets increase, even if assets of any particular fund are unchanged or have declined, because some portion of Fidelity's costs are attributable to services provided to all Fidelity funds, and all funds benefit if those costs can be allocated among more assets. The Board concluded that, given the group fee structure, fund shareholders will benefit from lower management fees as assets under FMR's management increase at the fund complex level, regardless of whether Fidelity achieves any such economies of scale.
Annual Report
Board Approval of Investment Advisory Contracts and
Management Fees - continued
The Board concluded, considering the findings of the Economies of Scale Committee, that any potential economies of scale are being appropriately shared between fund shareholders and Fidelity.
Additional Information Requested by the Board. In order to develop fully the factual basis for consideration of the Fidelity funds' Advisory Contracts, the Board requested and received additional information on certain topics, including (i) fund performance trends, actions to be taken by FMR to improve certain funds' overall performance, and Fidelity's long-term strategies for certain funds; (ii) portfolio manager changes that have occurred during the past year and length of portfolio manager tenure for different categories of funds over time; (iii) Fidelity's compensation structure for portfolio managers, research analysts, and other key personnel, the rationale for the compensation structure, and how the compensation structure provides appropriate performance incentives; (iv) the amount of the investment that each portfolio manager has made in the Fidelity fund(s) that he or she manages; (v) management and other fees paid by FMR to affiliated sub-advisers on behalf of the Fidelity funds; (vi) Fidelity's fee structures and rationale for recommending different fees among different categories of funds; (vii) Fidelity's rationale for recommending which funds should have a performance adjustment component as part of their management fees; (viii) the rationale for any differences between fund fee structures and fee structures in place for other Fidelity clients; and (ix) explanations regarding the relative total expenses borne by certain funds and classes, total expense competitive trends, and actions that might be taken by FMR to reduce total expenses for certain funds and classes.
Based on its evaluation of all of the conclusions noted above, and after considering all factors it believed relevant, the Board ultimately concluded that the advisory fee structures are fair and reasonable, and that the fund's Advisory Contracts should be renewed.
Annual Report
Managing Your Investments
Fidelity offers several ways to conveniently manage your workplace benefits (including your workplace savings plan, investments, and additional services) via your telephone or PC. You can access your plan and account information and research your investments 24 hours a day.
By Phone
Fidelity provides a single toll-free number to access plan information, account balances, positions, and quotes*. It's easy to navigate the service, and on your first call, the system will help you create a personal identification number (PIN) for security.
(phone_graphic)
Fidelity Workplace
Investing
1-800-835-5092
By PC
Fidelity's web site on the Internet provides a wide range of information, including plan information, daily financial news, fund performance, interactive planning tools, and news about Fidelity products and services.
(computer_graphic)
Fidelity's Web Site
www.401k.com
* When you call the quotes line, please remember that a fund's yield and return will vary and, except for money market funds, share price will also vary. This means that you may have a gain or loss when you sell your shares. There is no assurance that money market funds will be able to maintain a stable $1 share price; an investment in a money market fund is not insured or guaranteed by the U.S. government. Total returns are historical and include changes in share price, reinvestment of dividends and capital gains, and the effects of any sales charges.
Annual Report
To Write Fidelity
We'll give your correspondence immediate attention and send you written confirmation upon completion of your request.
(letter_graphic)
For Non-Retirement
Accounts
Buying shares
Fidelity Investments
P.O. Box 770001
Cincinnati, OH 45277-0003
Overnight Express
Fidelity Investments
Attn: Distribution Services
100 Crosby Parkway - KC1H
Covington, KY 41015
Selling shares
Fidelity Investments
P.O. Box 770001
Cincinnati, OH 45277-0035
Overnight Express
Fidelity Investments
Attn: Distribution Services
100 Crosby Parkway - KC1H
Covington, KY 41015
General Correspondence
Fidelity Investments
P.O. Box 500
Merrimack, NH 03054-0500
(letter_graphic)
For Retirement
Accounts
Buying shares
Fidelity Investments
P.O. Box 770001
Cincinnati, OH 45277-0003
Selling shares
Fidelity Investments
P.O. Box 770001
Cincinnati, OH 45277-0035
Overnight Express
Fidelity Investments
Attn: Distribution Services
100 Crosby Parkway - KC1H
Covington, KY 41015
General Correspondence
Fidelity Investments
P.O. Box 500
Merrimack, NH 03054-0500
Annual Report
Investment Adviser
Fidelity Management & Research Company
Boston, MA
Investment Sub-Advisers
FMR Co., Inc.
Fidelity Research & Analysis Company
Fidelity Management & Research
(U.K.) Inc.
Fidelity Management & Research
(Japan) Inc.
Fidelity Management & Research
(Hong Kong) Limited
General Distributor
Fidelity Distributors Corporation
Boston, MA
Transfer and Service Agents
Fidelity Investments Institutional
Operations Company, Inc.
Boston, MA
Fidelity Service Company, Inc.
Boston, MA
Custodian
JPMorgan Chase Bank
New York, NY
GAI-K-UANN-0910
1.863229.101
Fidelity®
International Real Estate
Fund
Annual Report
July 31, 2010
(2_fidelity_logos) (Registered_Trademark)
Contents
Chairman's Message | <Click Here> | The Chairman's message to shareholders. |
Performance | <Click Here> | How the fund has done over time. |
Management's Discussion of Fund Performance | <Click Here> | The Portfolio Manager's review of fund performance and strategy. |
Shareholder Expense Example | <Click Here> | An example of shareholder expenses. |
Investment Changes | <Click Here> | A summary of major shifts in the fund's investments over the past six months. |
Investments | <Click Here> | A complete list of the fund's investments with their market values. |
Financial Statements | <Click Here> | Statements of assets and liabilities, operations, and changes in net assets,
as well as financial highlights. |
Notes | <Click Here> | Notes to the financial statements. |
Report of Independent Registered Public Accounting Firm | <Click Here> | |
Trustees and Officers | <Click Here> | |
Distributions | <Click Here> | |
Board Approval of Investment Advisory Contracts and Management Fees | <Click Here> | |
To view a fund's proxy voting guidelines and proxy voting record for the 12-month period ended June 30, visit http://www.fidelity.com/proxyvotingresults or visit the Securities and Exchange Commission's (SEC) web site at http://www.sec.gov. You may also call 1-800-544-8544 to request a free copy of the proxy voting guidelines.
Standard & Poor's, S&P and S&P 500 are registered service marks of The McGraw-Hill Companies, Inc. and have been licensed for use by Fidelity Distributors Corporation.
Other third party marks appearing herein are the property of their respective owners.
All other marks appearing herein are registered or unregistered trademarks or service marks of FMR LLC or an affiliated company.
Annual Report
This report and the financial statements contained herein are submitted for the general information of the shareholders of the fund. This report is not authorized for distribution to prospective investors in the fund unless preceded or accompanied by an effective prospectus.
A fund files its complete schedule of portfolio holdings with the SEC for the first and third quarters of each fiscal year on Form N-Q. Forms N-Q are available on the SEC's web site at http://www.sec.gov. A fund's Forms N-Q may be reviewed and copied at the SEC's Public Reference Room in Washington, DC. Information regarding the operation of the SEC's Public Reference Room may be obtained by calling 1-800-SEC-0330. For a complete list of a fund's portfolio holdings, view the most recent holdings listing, semiannual report, or annual report on Fidelity's web site at http://www.fidelity.com or http://www.advisor.fidelity.com, as applicable.
NOT FDIC INSURED • MAY LOSE VALUE • NO BANK GUARANTEE
Neither the fund nor Fidelity Distributors Corporation is a bank.
Annual Report
(photo_of_Edward_C_Johnson_3d)
Dear Shareholder:
A yearlong uptrend in global equity markets reversed course in late April 2010 when investor sentiment turned bearish due in great measure to concern that Europe's debt crisis would expand and slow or derail economic recovery. However, a bounceback in July helped to recover some of the ground that was lost. Financial markets are always unpredictable, of course, but there also are several time-tested investment principles that can help put the odds in your favor.
One of the basic tenets is to invest for the long term. Over time, riding out the markets' inevitable ups and downs has proven much more effective than selling into panic or chasing the hottest trend. Even missing only a few of the markets' best days can significantly diminish investor returns. Patience also affords the benefits of compounding - of earning interest on additional income or reinvested dividends and capital gains. There can be tax advantages and cost benefits to consider as well. While staying the course doesn't eliminate risk, it can considerably lessen the effect of short-term declines.
You can further manage your investing risk through diversification. And today, more than ever, geographic diversification should be taken into account. Studies indicate that asset allocation is the single most important determinant of a portfolio's long-term success. The right mix of stocks, bonds and cash - aligned to your particular risk tolerance and investment objective - is very important. Age-appropriate rebalancing is also an essential aspect of asset allocation. For younger investors, an emphasis on equities - which historically have been the best-performing asset class over time - is encouraged. As investors near their specific goal, such as retirement or sending a child to college, consideration may be given to replacing volatile assets (e.g. common stocks) with more-stable fixed investments (bonds or savings plans).
A third principle - investing regularly - can help lower the average cost of your purchases. Investing a certain amount of money each month or quarter helps ensure you won't pay for all your shares at market highs. This strategy - known as dollar cost averaging - also reduces "emotion" from investing, helping shareholders avoid selling weak performers just prior to an upswing, or chasing a hot performer just before a correction.
We invite you to contact us via the Internet, through our Investor Centers or by phone. It is our privilege to provide you the information you need to make the investments that are right for you.
Sincerely,
(The chairman's signature appears here.)
Edward C. Johnson 3d
Annual Report
Average annual total return reflects the change in the value of an investment, assuming reinvestment of the class' dividend income and capital gains (the profits earned upon the sale of securities that have grown in value, if any) and assuming a constant rate of performance each year. The $10,000 table and the fund's returns do not reflect the deduction of taxes that a shareholder would pay on fund distributions or the redemption of fund shares. During periods of reimbursement by Fidelity, a fund's total return will be greater than it would be had the reimbursement not occurred. How a fund did yesterday is no guarantee of how it will do tomorrow.
Average Annual Total Returns
Periods ended July 31, 2010 | Past 1
year | Past 5
years | Life of fund A |
Fidelity International Real Estate Fund | 5.29% | -0.86% | 2.61% |
A From September 8, 2004.
$10,000 Over Life of Fund
Let's say hypothetically that $10,000 was invested in Fidelity International Real Estate Fund, a class of the fund, on September 8, 2004, when the fund started. The chart shows how the value of your investment would have changed, and also shows how the MSCI® EAFE® Index (Europe, Australasia, Far East) performed over the same period.
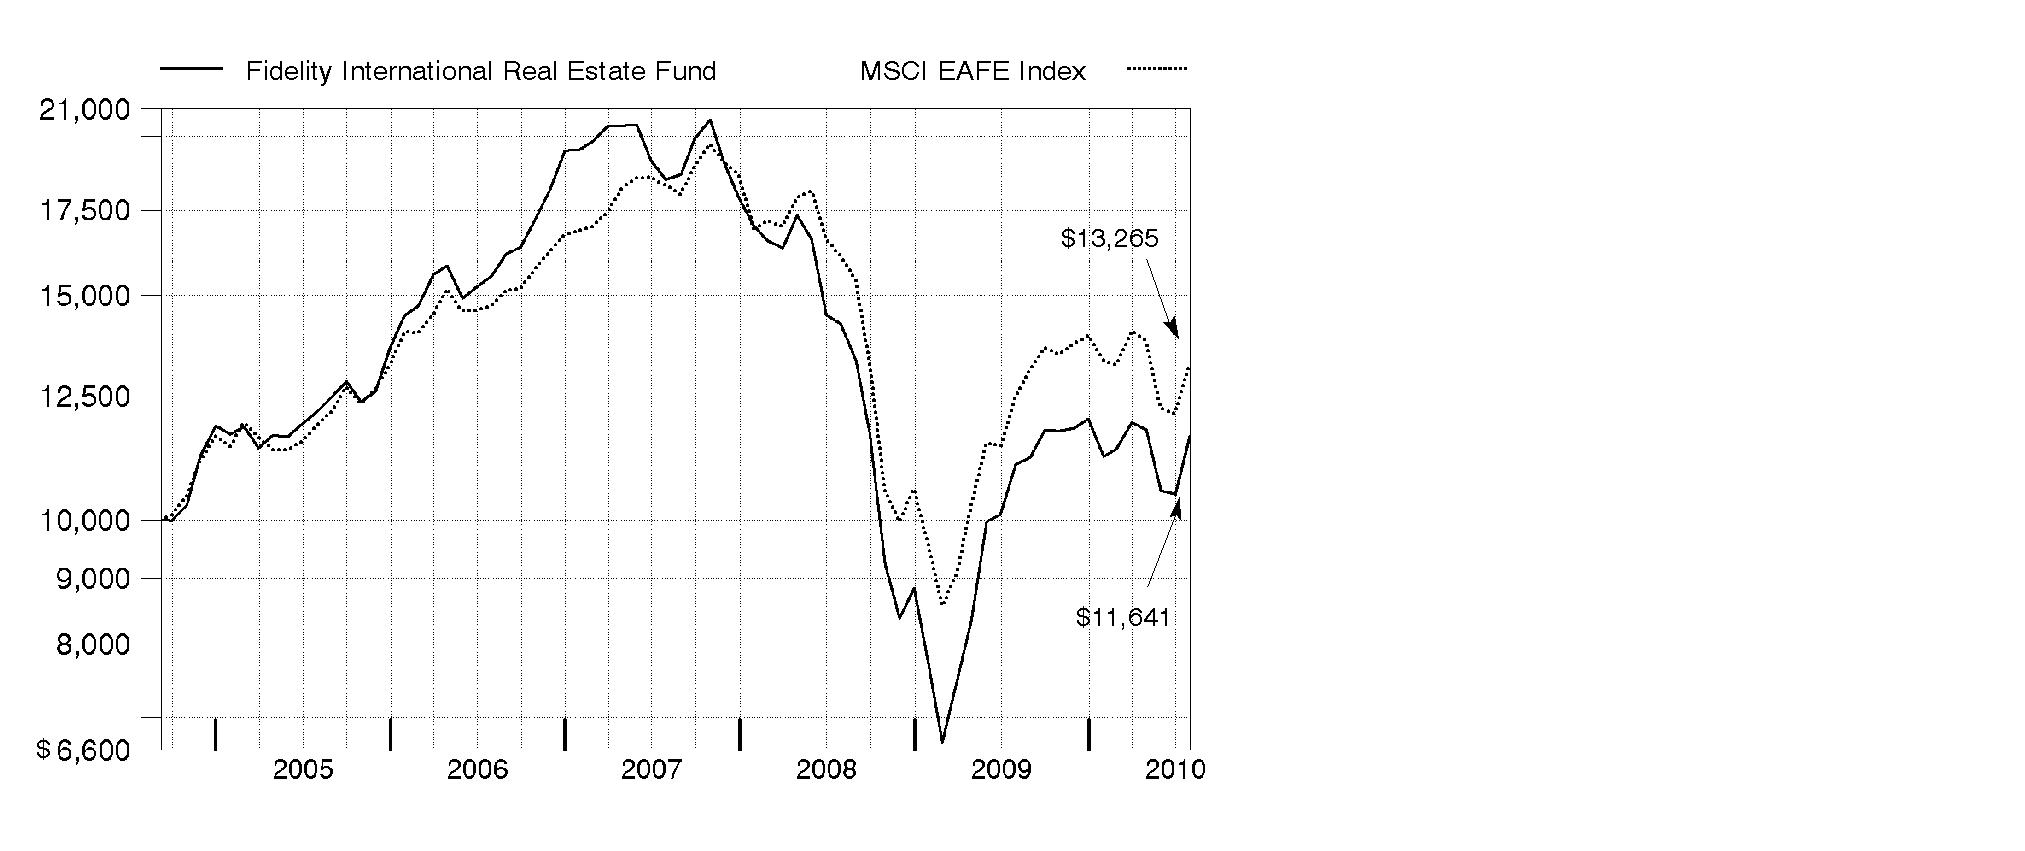
Annual Report
Market Recap: During the year ending July 31, 2010, investors in international real estate securities moved from having an appetite for risk to severe distaste for it. Following investors' exuberance after the global financial crisis, they became less willing to own international real estate securities, based on the sovereign debt crisis in Europe, the slowdown in U.S. employment and China's policies to restrain economic growth. Risk-averse investors strongly favored companies that displayed defensive qualities such as strong balance sheets and rental covenants. As a result, since April, stocks perceived to have less risk did much better than their more "offensive" counterparts. As of the end of July, offensive companies were trading at significant valuation discounts. In this environment, the FTSE EPRA/NAREIT Developed ex North America Index - a measure of international property stocks - returned 8.08%. The U.S. real estate stock market did much better, with the Dow Jones U.S. Select Real Estate Securities IndexSM increasing 55.21%. Meanwhile, the MSCI® EAFE® (Europe, Australasia, Far East Index), a proxy for the broad international stock market, rose 6.36% for the past 12 months.
Comments from Guillermo de las Casas, who became Portfolio Manager of Fidelity® International Real Estate Fund on April 1, 2010: For the year, the fund's Retail Class shares returned 5.29%, trailing the FTSE EPRA/NAREIT index. Compared with this index during the past 12 months - the last four of which I was managing the fund - an underweighting and disappointing security selection in offices was a significant negative. Stock picking in Japan and Australia were detractors, as was a modest underweighting in Europe. In contrast, the fund benefited from its overweighting in Norway and good stock selection in Brazil - which is not in the index - especially later in the period. Positive security selection among residential property developers more than offset the negative impact of being substantially overweighed in the group. Currency fluctuations modestly boosted performance. The biggest individual detractors were Chinese property company China Overseas Land & Investment; NTT Urban Development, a Japanese office property company that hurt the fund due to untimely ownership; Nomura Real Estate Holdings, a commercial and residential property developer; and Australian property company GPT Group. In contrast, U.K.-based UNITE Group, a manager and developer of student housing, did well, as did property developers Hongkong Land Holdings and Mitsubishi Estate, based in Hong Kong and Japan, respectively. Some of the stocks I've mentioned were not in the portfolio at period end.
The views expressed above reflect those of the portfolio manager(s) only through the end of the period as stated on the cover of this report and do not necessarily represent the views of Fidelity or any other person in the Fidelity organization. Any such views are subject to change at any time based upon market or other conditions and Fidelity disclaims any responsibility to update such views. These views may not be relied on as investment advice and, because investment decisions for a Fidelity fund are based on numerous factors, may not be relied on as an indication of trading intent on behalf of any Fidelity fund.
Annual Report
Shareholder Expense Example
As a shareholder of the Fund, you incur two types of costs: (1) transaction costs, including sales charges (loads) on purchase payments or redemption proceeds, redemption fees, and (2) ongoing costs, including management fees, distribution and/or service (12b-1) fees and other Fund expenses. This Example is intended to help you understand your ongoing costs (in dollars) of investing in the Fund and to compare these costs with the ongoing costs of investing in other mutual funds.
The Example is based on an investment of $1,000 invested at the beginning of the period and held for the entire period (February 1, 2010 to July 31, 2010).
Actual Expenses
The first line of the accompanying table for each class of the Fund provides information about actual account values and actual expenses. You may use the information in this line, together with the amount you invested, to estimate the expenses that you paid over the period. Simply divide your account value by $1,000.00 (for example, an $8,600 account value divided by $1,000.00 = 8.6), then multiply the result by the number in the first line for a class of the Fund under the heading entitled "Expenses Paid During Period" to estimate the expenses you paid on your account during this period. A small balance maintenance fee of $12.00 that is charged once a year may apply for certain accounts with a value of less than $2,000. This fee is not included in the table below. If it was, the estimate of expenses you paid during the period would be higher, and your ending account value lower, by this amount. In addition, the Fund, as a shareholder in the underlying Fidelity Central Funds, will indirectly bear its pro-rata share of the fees and expenses incurred by the underlying Fidelity Central Funds. These fees and expenses are not included in the Fund's annualized expense ratio used to calculate the expense estimate in the table below.
Hypothetical Example for Comparison Purposes
The second line of the accompanying table for each class of the Fund provides information about hypothetical account values and hypothetical expenses based on a Class' actual expense ratio and an assumed rate of return of 5% per year before expenses, which is not the Class' actual return. The hypothetical account values and expenses may not be used to estimate the actual ending account balance or expenses you paid for the period. You may use this information to compare the ongoing costs of investing in the Fund and other funds. To do so, compare this 5% hypothetical example with the 5% hypothetical examples that appear in the shareholder reports of the other funds. A small balance maintenance fee of $12.00 that is charged once a year may apply for certain accounts with a value of less than $2,000. This fee is not included in the table below. If it was, the estimate of expenses you paid during the period would be higher, and your ending account value lower, by this amount. In addition, the Fund, as a shareholder in the underlying Fidelity Central Funds, will indirectly bear its pro-rata share of the fees and expenses incurred by the underlying Fidelity Central Funds. These fees and expenses are not included in the Fund's annualized expense ratio used to calculate the expense estimate in the table below.
Annual Report
Please note that the expenses shown in the table are meant to highlight your ongoing costs only and do not reflect any transaction costs. Therefore, the second line of the table is useful in comparing ongoing costs only, and will not help you determine the relative total costs of owning different funds. In addition, if these transactional costs were included, your costs would have been higher.
| Annualized Expense Ratio | Beginning
Account Value
February 1, 2010 | Ending
Account Value
July 31, 2010 | Expenses Paid
During Period*
February 1, 2010 to July 31, 2010 |
Class A | 1.41% | | | |
Actual | | $ 1,000.00 | $ 1,038.00 | $ 7.12 |
HypotheticalA | | $ 1,000.00 | $ 1,017.80 | $ 7.05 |
Class T | 1.67% | | | |
Actual | | $ 1,000.00 | $ 1,037.00 | $ 8.43 |
HypotheticalA | | $ 1,000.00 | $ 1,016.51 | $ 8.35 |
Class B | 2.16% | | | |
Actual | | $ 1,000.00 | $ 1,033.50 | $ 10.89 |
HypotheticalA | | $ 1,000.00 | $ 1,014.08 | $ 10.79 |
Class C | 2.16% | | | |
Actual | | $ 1,000.00 | $ 1,033.60 | $ 10.89 |
HypotheticalA | | $ 1,000.00 | $ 1,014.08 | $ 10.79 |
International Real Estate | 1.16% | | | |
Actual | | $ 1,000.00 | $ 1,039.00 | $ 5.86 |
HypotheticalA | | $ 1,000.00 | $ 1,019.04 | $ 5.81 |
Institutional Class | 1.16% | | | |
Actual | | $ 1,000.00 | $ 1,039.10 | $ 5.86 |
HypotheticalA | | $ 1,000.00 | $ 1,019.04 | $ 5.81 |
A 5% return per year before expenses
* Expenses are equal to each Class' annualized expense ratio, multiplied by the average account value over the period, multiplied by 181/365 (to reflect the one-half year period).
Annual Report
Investment Changes (Unaudited)
Top Ten Stocks as of July 31, 2010 |
| % of fund's
net assets | % of fund's net assets
6 months ago |
Sun Hung Kai Properties Ltd. | 8.6 | 7.9 |
Westfield Group unit | 7.4 | 7.9 |
Unibail-Rodamco | 6.6 | 6.5 |
Mitsui Fudosan Co. Ltd. | 5.3 | 4.6 |
Wharf Holdings Ltd. | 4.4 | 2.2 |
Sumitomo Realty & Development Co. Ltd. | 3.3 | 2.9 |
CapitaLand Ltd. | 3.2 | 1.6 |
Hang Lung Properties Ltd. | 2.8 | 3.0 |
British Land Co. PLC | 2.6 | 3.4 |
Kerry Properties Ltd. | 2.5 | 0.0 |
| 46.7 | |
Top Five Countries as of July 31, 2010 |
(excluding cash equivalents) | % of fund's
net assets | % of fund's net assets
6 months ago |
Hong Kong | 23.6 | 26.4 |
Japan | 17.7 | 17.7 |
Australia | 14.1 | 16.1 |
Singapore | 10.5 | 5.5 |
United Kingdom | 9.2 | 9.8 |
Percentages are adjusted for the effect of open futures contracts, if applicable. |
Top Five REIT Sectors as of July 31, 2010 |
| % of fund's
net assets | % of fund's net assets
6 months ago |
REITs - Management/Investment | 20.9 | 27.3 |
REITs - Office Buildings | 6.0 | 10.4 |
REITs - Shopping Centers | 4.2 | 4.6 |
REITs - Industrial Buildings | 3.2 | 5.6 |
REITs - Malls | 0.4 | 0.0 |
Asset Allocation (% of fund's net assets) |
As of July 31, 2010* | As of January 31, 2010** |
| Stocks and Investment Companies 99.5% | | | Stocks and Investment Companies 95.9% | |
| Short-Term
Investments and
Net Other Assets 0.5% | | | Short-Term
Investments and
Net Other Assets 4.1% | |
* Foreign investments | 99.5% | | ** Foreign investments | 95.9% | |

Annual Report
Investments July 31, 2010
Showing Percentage of Net Assets
Common Stocks - 99.5% |
| Shares | | Value |
Australia - 14.1% |
Charter Hall Group unit | 6,124,957 | | $ 3,325,300 |
DEXUS Property Group unit | 6,940,140 | | 5,118,025 |
FKP Property Group unit | 3,701,859 | | 2,344,739 |
Goodman Group unit | 9,610,282 | | 5,347,956 |
Macquarie CountryWide Trust | 6,121,441 | | 2,935,663 |
Stockland Corp. Ltd. unit | 954,596 | | 3,273,674 |
Westfield Group unit | 2,242,258 | | 24,772,956 |
TOTAL AUSTRALIA | | 47,118,313 |
Bailiwick of Jersey - 1.0% |
Atrium European Real Estate Ltd. | 416,196 | | 2,142,674 |
LXB Retail Properties PLC | 821,700 | | 1,166,323 |
TOTAL BAILIWICK OF JERSEY | | 3,308,997 |
Brazil - 1.0% |
BR Properties SA | 43,600 | | 345,874 |
Cyrela Brazil Realty SA | 103,400 | | 1,448,247 |
Iguatemi Empresa de Shopping Centers SA | 79,500 | | 1,580,506 |
TOTAL BRAZIL | | 3,374,627 |
Cayman Islands - 4.1% |
Agile Property Holdings Ltd. | 4,135,000 | | 5,387,345 |
Central China Real Estate Ltd. | 3,803,000 | | 979,208 |
IFM Investments Ltd. ADR (a) | 23,300 | | 131,645 |
KWG Property Holding Ltd. | 7,210,500 | | 5,337,673 |
SOHO China Ltd. | 2,668,500 | | 1,645,589 |
TOTAL CAYMAN ISLANDS | | 13,481,460 |
China - 2.1% |
China Resources Land Ltd. | 3,297,000 | | 6,995,116 |
Finland - 0.8% |
Citycon Oyj | 823,403 | | 2,822,469 |
France - 7.2% |
Societe de la Tour Eiffel | 31,000 | | 2,103,020 |
Unibail-Rodamco | 111,077 | | 21,918,512 |
TOTAL FRANCE | | 24,021,532 |
Germany - 1.0% |
alstria office REIT-AG | 129,465 | | 1,498,395 |
DIC Asset AG | 148,900 | | 1,214,871 |
IVG Immobilien AG (a) | 102,600 | | 712,346 |
TOTAL GERMANY | | 3,425,612 |
Common Stocks - continued |
| Shares | | Value |
Greece - 0.1% |
Babis Vovos International Technical SA (a) | 104,074 | | $ 389,301 |
Hong Kong - 23.6% |
Hang Lung Properties Ltd. | 2,241,000 | | 9,347,718 |
Henderson Land Development Co. Ltd. | 884,000 | | 5,502,594 |
Hongkong Land Holdings Ltd. | 994,000 | | 5,327,840 |
Kerry Properties Ltd. | 1,669,500 | | 8,414,667 |
New World Development Co. Ltd. | 3,678,000 | | 6,572,339 |
Sun Hung Kai Properties Ltd. | 1,942,000 | | 28,526,838 |
Wharf Holdings Ltd. | 2,693,000 | | 14,734,792 |
TOTAL HONG KONG | | 78,426,788 |
Italy - 1.9% |
Beni Stabili SpA (d) | 4,602,900 | | 3,806,486 |
Immobiliare Grande Distribuzione SpA | 1,605,876 | | 2,427,901 |
TOTAL ITALY | | 6,234,387 |
Japan - 17.7% |
Aeon Mall Co. Ltd. | 100,800 | | 2,209,027 |
Goldcrest Co. Ltd. | 197,070 | | 4,026,909 |
Japan Retail Fund Investment Corp. | 2,976 | | 3,832,558 |
Kenedix Realty Investment Corp. | 1,394 | | 4,577,578 |
Kenedix, Inc. (a)(d) | 18,256 | | 3,058,685 |
Mitsui Fudosan Co. Ltd. | 1,199,000 | | 17,757,825 |
Nomura Real Estate Holdings, Inc. | 284,100 | | 3,497,627 |
NTT Urban Development Co. | 2,822 | | 2,288,946 |
ORIX JREIT, Inc. | 506 | | 2,479,502 |
Park24 Co. Ltd. | 142,800 | | 1,531,682 |
Sumitomo Realty & Development Co. Ltd. | 617,000 | | 11,108,499 |
Toc Co. Ltd. | 248,300 | | 916,491 |
Tokyo Tatemono Co. Ltd. | 494,000 | | 1,611,895 |
TOTAL JAPAN | | 58,897,224 |
Netherlands - 1.5% |
Corio NV | 86,911 | | 5,099,661 |
Poland - 0.5% |
Globe Trade Centre SA (a) | 225,400 | | 1,767,584 |
Russia - 0.6% |
LSR Group OJSC GDR (Reg. S) (a) | 229,100 | | 2,084,810 |
Singapore - 10.5% |
Allgreen Properties Ltd. | 3,563,000 | | 3,065,453 |
Ascendas Real Estate Investment Trust (A-REIT) | 1,121,000 | | 1,747,570 |
CapitaLand Ltd. | 3,616,900 | | 10,532,336 |
Common Stocks - continued |
| Shares | | Value |
Singapore - continued |
City Developments Ltd. | 889,000 | | $ 7,910,067 |
Parkway Life REIT | 640,000 | | 701,228 |
Wing Tai Holdings Ltd. | 5,369,000 | | 7,106,552 |
Yanlord Land Group Ltd. | 2,785,000 | | 3,809,177 |
TOTAL SINGAPORE | | 34,872,383 |
Spain - 0.2% |
Realia Business SA (a) | 349,294 | | 662,392 |
Sweden - 2.4% |
Castellum AB | 406,200 | | 4,209,443 |
Klovern AB (d) | 395,600 | | 1,463,358 |
Wihlborgs Fastigheter AB | 104,800 | | 2,352,120 |
TOTAL SWEDEN | | 8,024,921 |
United Kingdom - 9.2% |
Big Yellow Group PLC | 796,200 | | 3,871,156 |
British Land Co. PLC | 1,194,723 | | 8,653,225 |
Capital & Counties Properties PLC (a) | 786,300 | | 1,356,556 |
Derwent London PLC | 115,200 | | 2,422,915 |
Great Portland Estates PLC | 705,054 | | 3,331,796 |
Hammerson PLC | 735,499 | | 4,480,414 |
Land Securities Group PLC | 138,373 | | 1,329,273 |
Metric Property Investments PLC (a) | 777,300 | | 1,249,595 |
Quintain Estates & Development PLC (a) | 737,200 | | 453,818 |
Songbird Estates PLC Class B (a) | 17,975 | | 42,288 |
St. Modwen Properties PLC | 1,251,100 | | 3,410,347 |
TOTAL UNITED KINGDOM | | 30,601,383 |
TOTAL COMMON STOCKS (Cost $362,739,810) | 331,608,960 |
Money Market Funds - 1.5% |
| Shares | | Value |
Fidelity Cash Central Fund, 0.24% (b) | 3,490,245 | | $ 3,490,245 |
Fidelity Securities Lending Cash Central Fund, 0.27% (b)(c) | 1,444,564 | | 1,444,564 |
TOTAL MONEY MARKET FUNDS (Cost $4,934,809) | 4,934,809 |
TOTAL INVESTMENT PORTFOLIO - 101.0% (Cost $367,674,619) | | 336,543,769 |
NET OTHER ASSETS (LIABILITIES) - (1.0)% | | (3,496,038) |
NET ASSETS - 100% | $ 333,047,731 |
Legend |
(a) Non-income producing |
(b) Affiliated fund that is available only to investment companies and other accounts managed by Fidelity Investments. The rate quoted is the annualized seven-day yield of the fund at period end. A complete unaudited listing of the fund's holdings as of its most recent quarter end is available upon request. |
(c) Investment made with cash collateral received from securities on loan. |
(d) Security or a portion of the security is on loan at period end. |
Affiliated Central Funds |
Information regarding fiscal year to date income earned by the Fund from investments in Fidelity Central Funds is as follows: |
Fund | Income earned |
Fidelity Cash Central Fund | $ 13,216 |
Fidelity Securities Lending Cash Central Fund | 109,121 |
Total | $ 122,337 |
Other Information |
All investments are categorized as Level 1 under the Fair Value Hierarchy. The inputs or methodology used for valuing securities may not be an indication of the risk associated with investing in those securities. For more information on valuation inputs, please refer to the Security Valuation section in the accompanying Notes to Financial Statements. |
Income Tax Information |
At July 31, 2010, the Fund had a capital loss carryforward of approximately $296,042,629 of which $159,443,097 and $136,599,532 will expire on July 31, 2017 and 2018, respectively. Capital loss carryforwards are only available to offset future capital gains of the Fund to the extent provided by regulations and may be limited. |
The Fund intends to elect to defer to its fiscal year ending July 31, 2011 approximately $17,770,782 of losses recognized during the period November 1, 2009 to July 31, 2010. |
See accompanying notes which are an integral part of the financial statements.
Annual Report
Statement of Assets and Liabilities
| July 31, 2010 |
| | |
Assets | | |
Investment in securities, at value (including securities loaned of $1,365,388) - See accompanying schedule: Unaffiliated issuers (cost $362,739,810) | $ 331,608,960 | |
Fidelity Central Funds (cost $4,934,809) | 4,934,809 | |
Total Investments (cost $367,674,619) | | $ 336,543,769 |
Cash | | 413,491 |
Foreign currency held at value (cost $51,029) | | 51,029 |
Receivable for investments sold | | 3,340,186 |
Receivable for fund shares sold | | 247,448 |
Dividends receivable | | 1,238,333 |
Distributions receivable from Fidelity Central Funds | | 7,202 |
Other receivables | | 90,653 |
Total assets | | 341,932,111 |
| | |
Liabilities | | |
Payable for investments purchased | $ 6,691,428 | |
Payable for fund shares redeemed | 344,790 | |
Accrued management fee | 190,477 | |
Distribution fees payable | 5,552 | |
Other affiliated payables | 91,610 | |
Other payables and accrued expenses | 115,959 | |
Collateral on securities loaned, at value | 1,444,564 | |
Total liabilities | | 8,884,380 |
| | |
Net Assets | | $ 333,047,731 |
Net Assets consist of: | | |
Paid in capital | | $ 673,949,184 |
Undistributed net investment income | | 4,719,742 |
Accumulated undistributed net realized gain (loss) on investments and foreign currency transactions | | (314,475,883) |
Net unrealized appreciation (depreciation) on investments and assets and liabilities in foreign currencies | | (31,145,312) |
Net Assets | | $ 333,047,731 |
See accompanying notes which are an integral part of the financial statements.
Annual Report
Financial Statements - continued
Statement of Assets and Liabilities - continued
| July 31, 2010 |
| | |
Calculation of Maximum Offering Price Class A:
Net Asset Value and redemption price per share ($7,249,830 ÷ 857,301 shares) | | $ 8.46 |
| | |
Maximum offering price per share (100/94.25 of $8.46) | | $ 8.98 |
Class T:
Net Asset Value and redemption price per share ($2,509,693 ÷ 298,568 shares) | | $ 8.41 |
| | |
Maximum offering price per share (100/96.50 of $8.41) | | $ 8.72 |
Class B:
Net Asset Value and offering price per share ($629,375 ÷ 75,682 shares)A | | $ 8.32 |
| | |
Class C:
Net Asset Value and offering price per share ($3,201,487 ÷ 385,566 shares)A | | $ 8.30 |
| | |
International Real Estate:
Net Asset Value, offering price and redemption price per share ($318,032,094 ÷ 37,293,275 shares) | | $ 8.53 |
| | |
Institutional Class:
Net Asset Value, offering price and redemption price per share ($1,425,252 ÷ 167,467 shares) | | $ 8.51 |
A Redemption price per share is equal to net asset value less any applicable contingent deferred sales charge.
See accompanying notes which are an integral part of the financial statements.
Annual Report
Statement of Operations
| Year ended July 31, 2010 |
| | |
Investment Income | | |
Dividends | | $ 12,489,573 |
Interest | | 54 |
Income from Fidelity Central Funds | | 122,337 |
Income before foreign taxes withheld | | 12,611,964 |
Less foreign taxes withheld | | (557,267) |
Total income | | 12,054,697 |
| | |
Expenses | | |
Management fee | $ 2,510,053 | |
Transfer agent fees | 1,144,482 | |
Distribution fees | 65,699 | |
Accounting and security lending fees | 184,993 | |
Custodian fees and expenses | 192,213 | |
Independent trustees' compensation | 2,059 | |
Registration fees | 82,990 | |
Audit | 71,231 | |
Legal | 1,306 | |
Miscellaneous | 6,202 | |
Total expenses before reductions | 4,261,228 | |
Expense reductions | (162,042) | 4,099,186 |
Net investment income (loss) | | 7,955,511 |
Realized and Unrealized Gain (Loss) Net realized gain (loss) on: | | |
Investment securities: | | |
Unaffiliated issuers (net of foreign taxes of $36,571) | 376,370 | |
Foreign currency transactions | (28,299) | |
Total net realized gain (loss) | | 348,071 |
Change in net unrealized appreciation (depreciation) on: Investment securities (net of decrease in deferred foreign taxes of $15,863) | 9,586,175 | |
Assets and liabilities in foreign currencies | (21,167) | |
Total change in net unrealized appreciation (depreciation) | | 9,565,008 |
Net gain (loss) | | 9,913,079 |
Net increase (decrease) in net assets resulting from operations | | $ 17,868,590 |
See accompanying notes which are an integral part of the financial statements.
Annual Report
Financial Statements - continued
Statement of Changes in Net Assets
| Year ended
July 31,
2010 | Year ended
July 31,
2009 |
Increase (Decrease) in Net Assets | | |
Operations | | |
Net investment income (loss) | $ 7,955,511 | $ 9,003,508 |
Net realized gain (loss) | 348,071 | (205,492,245) |
Change in net unrealized appreciation (depreciation) | 9,565,008 | 43,065,853 |
Net increase (decrease) in net assets resulting
from operations | 17,868,590 | (153,422,884) |
Distributions to shareholders from net investment income | (3,235,770) | - |
Distributions to shareholders from net realized gain | (5,017,915) | - |
Total distributions | (8,253,685) | - |
Share transactions - net increase (decrease) | (26,300,777) | (95,264,955) |
Redemption fees | 80,485 | 117,919 |
Total increase (decrease) in net assets | (16,605,387) | (248,569,920) |
| | |
Net Assets | | |
Beginning of period | 349,653,118 | 598,223,038 |
End of period (including undistributed net investment income of $4,719,742 and $0, respectively) | $ 333,047,731 | $ 349,653,118 |
See accompanying notes which are an integral part of the financial statements.
Annual Report
Financial Highlights - Class A
Years ended July 31, | 2010 | 2009 | 2008 | 2007 H |
Selected Per-Share Data | | | | |
Net asset value, beginning of period | $ 8.24 | $ 10.63 | $ 15.71 | $ 17.46 |
Income from Investment Operations | | | | |
Net investment income (loss) E | .17 | .18 | .20 | .11 |
Net realized and unrealized gain (loss) | .24 | (2.57) | (3.48) | (1.87) |
Total from investment operations | .41 | (2.39) | (3.28) | (1.76) |
Distributions from net investment income | (.07) | - | (.31) | - |
Distributions from net realized gain | (.12) | - | (1.50) | - |
Total distributions | (.19) | - | (1.81) | - |
Redemption fees added to paid in capital E | - J | - J | .01 | .01 |
Net asset value, end of period | $ 8.46 | $ 8.24 | $ 10.63 | $ 15.71 |
Total Return B, C, D | 4.97% | (22.48)% | (23.20)% | (10.02)% |
Ratios to Average Net Assets F, I | | | | |
Expenses before reductions | 1.44% | 1.45% | 1.38% | 1.37% A |
Expenses net of fee waivers, if any | 1.44% | 1.45% | 1.38% | 1.37% A |
Expenses net of all reductions | 1.39% | 1.42% | 1.35% | 1.26% A |
Net investment income (loss) | 2.02% | 2.55% | 1.58% | 2.08% A |
Supplemental Data | | | | |
Net assets, end of period (000 omitted) | $ 7,250 | $ 6,745 | $ 9,976 | $ 5,087 |
Portfolio turnover rate G | 95% | 55% | 63% | 144% |
A Annualized
B Total returns for periods of less than one year are not annualized.
C Total returns would have been lower had certain expenses not been reduced during the periods shown.
D Total returns do not include the effect of the sales charges.
E Calculated based on average shares outstanding during the period.
F Fees and expenses of the underlying Fidelity Central Funds are not included in the Fund's expense ratio. The Fund indirectly bears its proportionate share of the expenses of any underlying Fidelity Central Funds.
G Amount does not include the portfolio activity of any underlying Fidelity Central Funds.
H For the period April 4, 2007 (commencement of sale of shares) to July 31, 2007.
I Expense ratios reflect operating expenses of the class. Expenses before reductions do not reflect amounts reimbursed by the investment adviser or reductions from brokerage service arrangements or reductions from other expense offset arrangements and do not represent the amount paid by the class during periods when reimbursements or reductions occur. Expense ratios before reductions for start-up periods may not be representative of longer-term operating periods. Expenses net of fee waivers reflect expenses after reimbursement by the investment adviser but prior to reductions from brokerage service arrangements or other expense offset arrangements. Expenses net of all reductions represent the net expenses paid by the class.
J Amount represents less than $.01 per share.
See accompanying notes which are an integral part of the financial statements.
Annual Report
Financial Highlights - Class T
Years ended July 31, | 2010 | 2009 | 2008 | 2007 H |
Selected Per-Share Data | | | | |
Net asset value, beginning of period | $ 8.21 | $ 10.62 | $ 15.70 | $ 17.46 |
Income from Investment Operations | | | | |
Net investment income (loss) E | .15 | .17 | .17 | .10 |
Net realized and unrealized gain (loss) | .23 | (2.58) | (3.48) | (1.87) |
Total from investment operations | .38 | (2.41) | (3.31) | (1.77) |
Distributions from net investment income | (.06) | - | (.28) | - |
Distributions from net realized gain | (.12) | - | (1.50) | - |
Total distributions | (.18) | - | (1.78) | - |
Redemption fees added to paid in capital E | - J | - J | .01 | .01 |
Net asset value, end of period | $ 8.41 | $ 8.21 | $ 10.62 | $ 15.70 |
Total Return B, C, D | 4.68% | (22.69)% | (23.39)% | (10.08)% |
Ratios to Average Net Assets F, I | | | | |
Expenses before reductions | 1.70% | 1.71% | 1.64% | 1.61% A |
Expenses net of fee waivers, if any | 1.70% | 1.71% | 1.64% | 1.61% A |
Expenses net of all reductions | 1.65% | 1.68% | 1.60% | 1.51% A |
Net investment income (loss) | 1.75% | 2.29% | 1.32% | 1.90% A |
Supplemental Data | | | | |
Net assets, end of period (000 omitted) | $ 2,510 | $ 2,080 | $ 7,566 | $ 2,398 |
Portfolio turnover rate G | 95% | 55% | 63% | 144% |
A Annualized
B Total returns for periods of less than one year are not annualized.
C Total returns would have been lower had certain expenses not been reduced during the periods shown.
D Total returns do not include the effect of the sales charges.
E Calculated based on average shares outstanding during the period.
F Fees and expenses of the underlying Fidelity Central Funds are not included in the Fund's expense ratio. The Fund indirectly bears its proportionate share of the expenses of any underlying Fidelity Central Funds.
G Amount does not include the portfolio activity of any underlying Fidelity Central Funds.
H For the period April 4, 2007 (commencement of sale of shares) to July 31, 2007.
I Expense ratios reflect operating expenses of the class. Expenses before reductions do not reflect amounts reimbursed by the investment adviser or reductions from brokerage service arrangements or reductions from other expense offset arrangements and do not represent the amount paid by the class during periods when reimbursements or reductions occur. Expense ratios before reductions for start-up periods may not be representative of longer-term operating periods. Expenses net of fee waivers reflect expenses after reimbursement by the investment adviser but prior to reductions from brokerage service arrangements or other expense offset arrangements. Expenses net of all reductions represent the net expenses paid by the class.
J Amount represents less than $.01 per share.
See accompanying notes which are an integral part of the financial statements.
Annual Report
Financial Highlights - Class B
Years ended July 31, | 2010 | 2009 | 2008 | 2007 H |
Selected Per-Share Data | | | | |
Net asset value, beginning of period | $ 8.14 | $ 10.58 | $ 15.67 | $ 17.46 |
Income from Investment Operations | | | | |
Net investment income (loss) E | .11 | .13 | .11 | .07 |
Net realized and unrealized gain (loss) | .23 | (2.57) | (3.48) | (1.87) |
Total from investment operations | .34 | (2.44) | (3.37) | (1.80) |
Distributions from net investment income | (.04) | - | (.23) | - |
Distributions from net realized gain | (.12) | - | (1.50) | - |
Total distributions | (.16) | - | (1.73) | - |
Redemption fees added to paid in capital E | - J | - J | .01 | .01 |
Net asset value, end of period | $ 8.32 | $ 8.14 | $ 10.58 | $ 15.67 |
Total Return B, C, D | 4.20% | (23.06)% | (23.80)% | (10.25)% |
Ratios to Average Net Assets F, I | | | | |
Expenses before reductions | 2.19% | 2.19% | 2.14% | 2.11% A |
Expenses net of fee waivers, if any | 2.19% | 2.19% | 2.14% | 2.11% A |
Expenses net of all reductions | 2.14% | 2.17% | 2.11% | 2.01% A |
Net investment income (loss) | 1.26% | 1.81% | .82% | 1.38% A |
Supplemental Data | | | | |
Net assets, end of period (000 omitted) | $ 629 | $ 606 | $ 930 | $ 1,158 |
Portfolio turnover rate G | 95% | 55% | 63% | 144% |
A Annualized
B Total returns for periods of less than one year are not annualized.
C Total returns would have been lower had certain expenses not been reduced during the periods shown.
D Total returns do not include the effect of the contingent deferred sales charge.
E Calculated based on average shares outstanding during the period.
F Fees and expenses of the underlying Fidelity Central Funds are not included in the Fund's expense ratio. The Fund indirectly bears its proportionate share of the expenses of any underlying Fidelity Central Funds.
G Amount does not include the portfolio activity of any underlying Fidelity Central Funds.
H For the period April 4, 2007 (commencement of sale of shares) to July 31, 2007.
I Expense ratios reflect operating expenses of the class. Expenses before reductions do not reflect amounts reimbursed by the investment adviser or reductions from brokerage service arrangements or reductions from other expense offset arrangements and do not represent the amount paid by the class during periods when reimbursements or reductions occur. Expense ratios before reductions for start-up periods may not be representative of longer-term operating periods. Expenses net of fee waivers reflect expenses after reimbursement by the investment adviser but prior to reductions from brokerage service arrangements or other expense offset arrangements. Expenses net of all reductions represent the net expenses paid by the class.
J Amount represents less than $.01 per share.
See accompanying notes which are an integral part of the financial statements.
Annual Report
Financial Highlights - Class C
Years ended July 31, | 2010 | 2009 | 2008 | 2007 H |
Selected Per-Share Data | | | | |
Net asset value, beginning of period | $ 8.13 | $ 10.57 | $ 15.67 | $ 17.46 |
Income from Investment Operations | | | | |
Net investment income (loss) E | .11 | .13 | .11 | .07 |
Net realized and unrealized gain (loss) | .22 | (2.57) | (3.48) | (1.87) |
Total from investment operations | .33 | (2.44) | (3.37) | (1.80) |
Distributions from net investment income | (.04) | - | (.24) | - |
Distributions from net realized gain | (.12) | - | (1.50) | - |
Total distributions | (.16) | - | (1.74) | - |
Redemption fees added to paid in capital E | - J | - J | .01 | .01 |
Net asset value, end of period | $ 8.30 | $ 8.13 | $ 10.57 | $ 15.67 |
Total Return B, C, D | 4.10% | (23.08)% | (23.78)% | (10.25)% |
Ratios to Average Net Assets F, I | | | | |
Expenses before reductions | 2.18% | 2.19% | 2.14% | 2.10% A |
Expenses net of fee waivers, if any | 2.18% | 2.19% | 2.14% | 2.10% A |
Expenses net of all reductions | 2.14% | 2.17% | 2.11% | 2.00% A |
Net investment income (loss) | 1.27% | 1.81% | .82% | 1.35% A |
Supplemental Data | | | | |
Net assets, end of period (000 omitted) | $ 3,201 | $ 2,496 | $ 3,477 | $ 2,629 |
Portfolio turnover rate G | 95% | 55% | 63% | 144% |
A Annualized
B Total returns for periods of less than one year are not annualized.
C Total returns would have been lower had certain expenses not been reduced during the periods shown.
D Total returns do not include the effect of the contingent deferred sales charge.
E Calculated based on average shares outstanding during the period.
F Fees and expenses of the underlying Fidelity Central Funds are not included in the Fund's expense ratio. The Fund indirectly bears its proportionate share of the expenses of any underlying Fidelity Central Funds.
G Amount does not include the portfolio activity of any underlying Fidelity Central Funds.
H For the period April 4, 2007 (commencement of sale of shares) to July 31, 2007.
I Expense ratios reflect operating expenses of the class. Expenses before reductions do not reflect amounts reimbursed by the investment adviser or reductions from brokerage service arrangements or reductions from other expense offset arrangements and do not represent the amount paid by the class during periods when reimbursements or reductions occur. Expense ratios before reductions for start-up periods may not be representative of longer-term operating periods. Expenses net of fee waivers reflect expenses after reimbursement by the investment adviser but prior to reductions from brokerage service arrangements or other expense offset arrangements. Expenses net of all reductions represent the net expenses paid by the class.
J Amount represents less than $.01 per share.
See accompanying notes which are an integral part of the financial statements.
Annual Report
Financial Highlights - International Real Estate
Years ended July 31, | 2010 | 2009 | 2008 | 2007 | 2006 |
Selected Per-Share Data | | | | | |
Net asset value, beginning of period | $ 8.29 | $ 10.68 | $ 15.73 | $ 14.69 | $ 12.09 |
Income from Investment Operations | | | | | |
Net investment income (loss) B | .19 | .20 | .25 | .31 | .30 |
Net realized and unrealized gain (loss) | .25 | (2.59) | (3.50) | 2.35 | 2.93 |
Total from investment operations | .44 | (2.39) | (3.25) | 2.66 | 3.23 |
Distributions from net investment income | (.08) | - | (.31) | (.22) | (.24) |
Distributions from net realized gain | (.12) | - | (1.50) | (1.42) | (.40) |
Total distributions | (.20) | - | (1.81) | (1.64) | (.64) |
Redemption fees added to paid in capital B | - F | - F | .01 | .02 | .01 |
Net asset value, end of period | $ 8.53 | $ 8.29 | $ 10.68 | $ 15.73 | $ 14.69 |
Total Return A | 5.29% | (22.38)% | (22.97)% | 19.01% | 27.85% |
Ratios to Average Net Assets C, E | | | | |
Expenses before reductions | 1.19% | 1.19% | 1.11% | 1.07% | 1.12% |
Expenses net of fee waivers, if any | 1.19% | 1.19% | 1.10% | 1.06% | 1.12% |
Expenses net of all reductions | 1.14% | 1.16% | 1.07% | .96% | .91% |
Net investment income (loss) | 2.27% | 2.81% | 1.86% | 1.86% | 2.23% |
Supplemental Data | | | | | |
Net assets, end of period (000 omitted) | $ 318,032 | $ 336,126 | $ 572,985 | $ 1,032,138 | $ 447,854 |
Portfolio turnover rate D | 95% | 55% | 63% | 144% | 234% |
A Total returns would have been lower had certain expenses not been reduced during the periods shown.
B Calculated based on average shares outstanding during the period.
C Fees and expenses of the underlying Fidelity Central Funds are not included in the Fund's expense ratio. The Fund indirectly bears its proportionate share of the expenses of any underlying Fidelity Central Funds.
D Amount does not include the portfolio activity of any underlying Fidelity Central Funds.
E Expense ratios reflect operating expenses of the class. Expenses before reductions do not reflect amounts reimbursed by the investment adviser or reductions from brokerage service arrangements or reductions from other expense offset arrangements and do not represent the amount paid by the class during periods when reimbursements or reductions occur. Expenses net of fee waivers reflect expenses after reimbursement by the investment adviser but prior to reductions from brokerage service arrangements or other expense offset arrangements. Expenses net of all reductions represent the net expenses paid by the class.
F Amount represents less than $.01 per share.
See accompanying notes which are an integral part of the financial statements.
Annual Report
Financial Highlights - Institutional Class
Years ended July 31, | 2010 | 2009 | 2008 | 2007 G |
Selected Per-Share Data | | | | |
Net asset value, beginning of period | $ 8.28 | $ 10.66 | $ 15.73 | $ 17.46 |
Income from Investment Operations | | | | |
Net investment income (loss) D | .19 | .20 | .24 | .12 |
Net realized and unrealized gain (loss) | .24 | (2.58) | (3.49) | (1.86) |
Total from investment operations | .43 | (2.38) | (3.25) | (1.74) |
Distributions from net investment income | (.08) | - | (.33) | - |
Distributions from net realized gain | (.12) | - | (1.50) | - |
Total distributions | (.20) | - | (1.83) | - |
Redemption fees added to paid in capital D | - I | - I | .01 | .01 |
Net asset value, end of period | $ 8.51 | $ 8.28 | $ 10.66 | $ 15.73 |
Total Return B, C | 5.18% | (22.33)% | (22.98)% | (9.91)% |
Ratios to Average Net Assets E, H | | | | |
Expenses before reductions | 1.18% | 1.19% | 1.13% | 1.08% A |
Expenses net of fee waivers, if any | 1.18% | 1.19% | 1.13% | 1.08% A |
Expenses net of all reductions | 1.14% | 1.17% | 1.10% | .97% A |
Net investment income (loss) | 2.27% | 2.81% | 1.83% | 2.27% A |
Supplemental Data | | | | |
Net assets, end of period (000 omitted) | $ 1,425 | $ 1,600 | $ 3,289 | $ 2,477 |
Portfolio turnover rate F | 95% | 55% | 63% | 144% |
A Annualized
B Total returns for periods of less than one year are not annualized.
C Total returns would have been lower had certain expenses not been reduced during the periods shown.
D Calculated based on average shares outstanding during the period.
E Fees and expenses of the underlying Fidelity Central Funds are not included in the Fund's expense ratio. The Fund indirectly bears its proportionate share of the expenses of any underlying Fidelity Central Funds.
F Amount does not include the portfolio activity of any underlying Fidelity Central Funds.
G For the period April 4, 2007 (commencement of sale of shares) to July 31, 2007.
H Expense ratios reflect operating expenses of the class. Expenses before reductions do not reflect amounts reimbursed by the investment adviser or reductions from brokerage service arrangements or reductions from other expense offset arrangements and do not represent the amount paid by the class during periods when reimbursements or reductions occur. Expense ratios before reductions for start-up periods may not be representative of longer-term operating periods. Expenses net of fee waivers reflect expenses after reimbursement by the investment adviser but prior to reductions from brokerage service arrangements or other expense offset arrangements. Expenses net of all reductions represent the net expenses paid by the class.
I Amount represents less than $.01 per share.
See accompanying notes which are an integral part of the financial statements.
Annual Report
Notes to Financial Statements
For the period ended July 31, 2010
1. Organization.
Fidelity International Real Estate Fund (the Fund) is a non-diversified fund of Fidelity Securities Fund (the Trust) and is authorized to issue an unlimited number of shares. The Trust is registered under the Investment Company Act of 1940, as amended (the 1940 Act), as an open-end management investment company organized as a Massachusetts business trust. The Fund offers Class A, Class T, Class B, Class C, International Real Estate, and Institutional Class shares, each of which has equal rights as to assets and voting privileges. Effective after the close of business on September 1, 2010, Class B shares will be closed to new accounts and additional purchases by existing shareholders. Each class has exclusive voting rights with respect to matters that affect that class. Class B shares will automatically convert to Class A shares after a holding period of seven years from the initial date of purchase. Investment income, realized and unrealized capital gains and losses, the common expenses of the Fund, and certain fund-level expense reductions, if any, are allocated on a pro-rata basis to each class based on the relative net assets of each class to the total net assets of the Fund. Each class differs with respect to transfer agent and distribution and service plan fees incurred. Certain expense reductions also differ by class. The Fund's investments in emerging markets can be subject to social, economic, regulatory, and political uncertainties and can be extremely volatile.
2. Investments in Fidelity Central Funds.
The Fund may invest in Fidelity Central Funds, which are open-end investment companies available only to other investment companies and accounts managed by Fidelity Management & Research Company (FMR) and its affiliates. The Fund's Schedule of Investments lists each of the Fidelity Central Funds held as of period end, if any, as an investment of the Fund, but does not include the underlying holdings of each Fidelity Central Fund. As an Investing Fund, the Fund indirectly bears its proportionate share of the expenses of the underlying Fidelity Central Funds.
The Money Market Central Funds seek preservation of capital and current income and are managed by Fidelity Investments Money Management, Inc. (FIMM), an affiliate of FMR.
A complete unaudited list of holdings for each Fidelity Central Fund is available upon request or at the Securities and Exchange Commission (the SEC) web site at www.sec.gov. In addition, the financial statements of the Fidelity Central Funds which are not covered by the Fund's Report of Independent Registered Public Accounting Firm, are available on the SEC web site or upon request.
Annual Report
Notes to Financial Statements - continued
3. Significant Accounting Policies.
The financial statements have been prepared in conformity with accounting principles generally accepted in the United States of America (GAAP), which require management to make certain estimates and assumptions at the date of the financial statements. Actual results could differ from those estimates. The following summarizes the significant accounting policies of the Fund:
Security Valuation. Investments are valued as of 4:00 p.m. Eastern time on the last calendar day of the period. The Fund uses independent pricing services approved by the Board of Trustees to value its investments. When current market prices or quotations are not readily available or reliable, valuations may be determined in good faith in accordance with procedures adopted by the Board of Trustees. Factors used in determining value may include market or security specific events. The frequency with which these procedures are used cannot be predicted and they may be utilized to a significant extent. The value used for net asset value (NAV) calculation under these procedures may differ from published prices for the same securities.
The Fund categorizes the inputs to valuation techniques used to value its investments into a disclosure hierarchy consisting of three levels as shown below.
Level 1 - quoted prices in active markets for identical investments
Level 2 - other significant observable inputs (including quoted prices for similar investments, interest rates, prepayment speeds, etc.)
Level 3 - unobservable inputs (including the fund's own assumptions based on the best information available)
Changes in valuation techniques may result in transfers in or out of an assigned level within the disclosure hierarchy. Valuation techniques used to value the Fund's investments by major category are as follows.
Equity securities, including restricted securities, for which market quotations are readily available, are valued at the last reported sale price or official closing price as reported by an independent pricing service on the primary market or exchange on which they are traded and are categorized as Level 1 in the hierarchy. In the event there were no sales during the day or closing prices are not available, securities are valued at the last quoted bid price or may be valued using the last available price and are generally categorized as Level 2 in the hierarchy. For foreign equity securities, when significant market or security specific events arise, comparisons to the valuation of American Depositary Receipts (ADRs), futures contracts, Exchange-traded funds (ETFs) and certain indexes as well as quoted prices for similar securities are used and are categorized as Level 2 in the hierarchy in these circumstances. Utilizing these techniques may result in transfers between Level 1 and Level 2. For restricted equity securities and private placements where
Annual Report
3. Significant Accounting Policies - continued
Security Valuation - continued
observable inputs are limited, assumptions about market activity and risk are used and are categorized as Level 3 in the hierarchy.
Investments in open-end mutual funds, including the Fidelity Central Funds, are valued at their closing net asset value each business day and are categorized as Level 1 in the hierarchy. Short-term securities with remaining maturities of sixty days or less for which quotations are not readily available are valued at amortized cost, which approximates fair value and are categorized as Level 2 in the hierarchy.
Foreign Currency. The Fund uses foreign currency contracts to facilitate transactions in foreign-denominated securities. Gains and losses from these transactions may arise from changes in the value of the foreign currency or if the counterparties do not perform under the contracts' terms.
Foreign-denominated assets, including investment securities, and liabilities are translated into U.S. dollars at the exchange rate at period end. Purchases and sales of investment securities, income and dividends received and expenses denominated in foreign currencies are translated into U.S. dollars at the exchange rate in effect on the transaction date.
The effects of exchange rate fluctuations on investments are included with the net realized and unrealized gain (loss) on investment securities. Other foreign currency transactions resulting in realized and unrealized gain (loss) are disclosed separately.
Investment Transactions and Income. For financial reporting purposes, the Fund's investment holdings and NAV include trades executed through the end of the last business day of the period. The NAV per share for processing shareholder transactions is calculated as of the close of business of the New York Stock Exchange (NYSE), normally 4:00 p.m. Eastern time and includes trades executed through the end of the prior business day. Gains and losses on securities sold are determined on the basis of identified cost and may include proceeds received from litigation. Dividend income is recorded on the ex-dividend date, except for certain dividends from foreign securities where the ex-dividend date may have passed, which are recorded as soon as the Fund is informed of the ex-dividend date. Non-cash dividends included in dividend income, if any, are recorded at the fair market value of the securities received. Distributions received on securities that represent a return of capital or capital gain are recorded as a reduction of cost of investments and/or as a realized gain. The Fund estimates the components of distributions received that may be considered return of capital distributions or capital gain distributions. Interest income and distributions from the Fidelity Central Funds are accrued as earned. Interest income includes coupon interest and amortization of
Annual Report
Notes to Financial Statements - continued
3. Significant Accounting Policies - continued
Investment Transactions and Income - continued
premium and accretion of discount on debt securities. Investment income is recorded net of foreign taxes withheld where recovery of such taxes is uncertain.
Expenses. Most expenses of the Trust can be directly attributed to a fund. Expenses which cannot be directly attributed are apportioned amongst each fund in the Trust. Expense estimates are accrued in the period to which they relate and adjustments are made when actual amounts are known.
Income Tax Information and Distributions to Shareholders. Each year the Fund intends to qualify as a regulated investment company, including distributing substantially all of its taxable income and realized gains under Subchapter M of the Internal Revenue Code and filing its U.S. federal tax return. As a result, no provision for income taxes is required. As of July 31, 2010, the Fund did not have any unrecognized tax benefits in the accompanying financial statements. A fund's federal tax return is subject to examination by the Internal Revenue Service (IRS) for a period of three years. Foreign taxes are provided for based on the Fund's understanding of the tax rules and rates that exist in the foreign markets in which it invests.
Distributions are recorded on the ex-dividend date. Income dividends and capital gain distributions are declared separately for each class. Income and capital gain distributions are determined in accordance with income tax regulations, which may differ from GAAP.
Capital accounts within the financial statements are adjusted for permanent book-tax differences. These adjustments have no impact on net assets or the results of operations. Temporary book-tax differences will reverse in a subsequent period.
Book-tax differences are primarily due to the short-term gain distributions from the Fidelity Central Funds, foreign currency transactions, certain foreign taxes, passive foreign investment companies (PFIC), capital loss carryforwards and losses deferred due to wash sales and excise tax regulations.
The federal tax cost of investment securities and unrealized appreciation (depreciation) as of period end were as follows:
Gross unrealized appreciation | $ 15,966,603 |
Gross unrealized depreciation | (53,722,570) |
Net unrealized appreciation (depreciation) | $ (37,755,967) |
| |
Tax Cost | $ 374,299,736 |
Annual Report
3. Significant Accounting Policies - continued
Income Tax Information and Distributions to Shareholders - continued
The tax-based components of distributable earnings as of period end were as follows:
Undistributed ordinary income | $ 10,682,386 |
Capital loss carryforward | $ (296,042,629) |
Net unrealized appreciation (depreciation) | $ (37,770,429) |
The tax character of distributions paid was as follows:
| July 31, 2010 | July 31, 2009 |
Ordinary Income | $ 8,253,685 | $ - |
Short-Term Trading (Redemption) Fees. Shares held in the Fund less than 90 days are subject to a redemption fee equal to 1.50% of the proceeds of the redeemed shares. All redemption fees, including any estimated redemption fees paid by FMR, are retained by the Fund and accounted for as an addition to paid in capital.
4. Purchases and Sales of Investments.
Purchases and sales of securities, other than short-term securities, aggregated $325,000,207 and $341,062,548, respectively.
5. Fees and Other Transactions with Affiliates.
Management Fee. FMR and its affiliates provide the Fund with investment management related services for which the Fund pays a monthly management fee. The management fee is the sum of an individual fund fee rate that is based on an annual rate of .45% of the Fund's average net assets and a group fee rate that averaged .26% during the period. The group fee rate is based upon the average net assets of all the mutual funds advised by FMR. The group fee rate decreases as assets under management increase and increases as assets under management decrease. For the period, the total annual management fee rate was .71% of the Fund's average net assets.
Annual Report
Notes to Financial Statements - continued
5. Fees and Other Transactions with Affiliates - continued
Distribution and Service Plan. In accordance with Rule 12b-1 of the 1940 Act, the Fund has adopted separate Distribution and Service Plans for each class of shares. Certain classes pay Fidelity Distributors Corporation (FDC), an affiliate of FMR, separate Distribution and Service Fees, each of which is based on an annual percentage of each class' average net assets. In addition, FDC may pay financial intermediaries for selling shares of the Fund and providing shareholder support services. For the period, the Distribution and Service Fee rates and the total amounts paid to and retained by FDC were as follows:
| Distribution
Fee | Service
Fee | Paid to
FDC | Retained
by FDC |
Class A | -% | .25% | $ 18,350 | $ 84 |
Class T | .25% | .25% | 12,516 | - |
Class B | .75% | .25% | 6,499 | 4,878 |
Class C | .75% | .25% | 28,334 | 5,047 |
| | | $ 65,699 | $ 10,009 |
Sales Load. FDC receives a front-end sales charge of up to 5.75% for selling Class A shares, and 3.50% for selling Class T shares, some of which is paid to financial intermediaries for selling shares of the Fund. FDC receives the proceeds of contingent deferred sales charges levied on Class A, Class T, Class B, and Class C redemptions. These charges depend on the holding period. The deferred sales charges range from 5% to 1% for Class B, 1% for Class C, 1.00% for certain purchases of Class A (1.00% to .50% prior to July 12, 2010) shares and .25% for certain purchases of Class T shares.
For the period, sales charge amounts retained by FDC were as follows:
| Retained
by FDC |
Class A | $ 5,334 |
Class T | 1,005 |
Class B* | 1,954 |
Class C* | 226 |
| $ 8,519 |
* When Class B and Class C shares are initially sold, FDC pays commissions from its own resources to financial intermediaries through which the sales are made.
Transfer Agent Fees. Fidelity Investments Institutional Operations Company, Inc. (FIIOC), an affiliate of FMR, is the transfer, dividend disbursing and shareholder servicing agent for each class of the Fund. FIIOC receives account fees and asset-based fees that vary according to the account size and type of account of the shareholders of the
Annual Report
5. Fees and Other Transactions with Affiliates - continued
Transfer Agent Fees - continued
respective classes of the Fund. FIIOC pays for typesetting, printing and mailing of shareholder reports, except proxy statements. For the period, the total transfer agent fees paid by each class were as follows:
| Amount | % of
Average
Net Assets |
Class A | $ 23,744 | .32 |
Class T | 8,383 | .34 |
Class B | 2,112 | .32 |
Class C | 9,107 | .32 |
International Real Estate | 1,096,002 | .32 |
Institutional Class | 5,134 | .32 |
| $ 1,144,482 | |
Accounting and Security Lending Fees. Fidelity Service Company, Inc. (FSC), an affiliate of FMR, maintains the Fund's accounting records. The accounting fee is based on the level of average net assets for the month. Under a separate contract, FSC administers the security lending program. The security lending fee is based on the number and duration of lending transactions.
Brokerage Commissions. The Fund placed a portion of its portfolio transactions with brokerage firms which are affiliates of the investment adviser. The commissions paid to these affiliated firms were $27 for the period.
6. Committed Line of Credit.
The Fund participates with other funds managed by FMR in a $3.75 billion credit facility (the "line of credit") to be utilized for temporary or emergency purposes to fund shareholder redemptions or for other short-term liquidity purposes. The Fund has agreed to pay commitment fees on its pro-rata portion of the line of credit, which amounted to $1,415 and is reflected in Miscellaneous expenses on the Statement of Operations. During the period, there were no borrowings on this line of credit.
7. Security Lending.
The Fund lends portfolio securities from time to time in order to earn additional income. On the settlement date of the loan, the Fund receives collateral (in the form of U.S. Treasury obligations, letters of credit and/or cash) against the loaned securities and maintains collateral in an amount not less than 100% of the market value of the loaned securities during the period of the loan. The market value of the loaned securities is
Annual Report
Notes to Financial Statements - continued
7. Security Lending - continued
determined at the close of business of the Fund and any additional required collateral is delivered to the Fund on the next business day. If the borrower defaults on its obligation to return the securities loaned because of insolvency or other reasons, a fund could experience delays and costs in recovering the securities loaned or in gaining access to the collateral. Any cash collateral received is invested in the Fidelity Securities Lending Cash Central Fund. The value of loaned securities and cash collateral at period end are disclosed on the Fund's Statement of Assets and Liabilities. Security lending income represents the income earned on investing cash collateral, less fees and expenses associated with the loan, plus any premium payments that may be received on the loan of certain types of securities. Security lending income is presented in the Statement of Operations as a component of income from Fidelity Central Funds. Net income from lending portfolio securities during the period amounted to $109,121.
8. Expense Reductions.
Many of the brokers with whom FMR places trades on behalf of the Fund provided services to the Fund in addition to trade execution. These services included payments of certain expenses on behalf of the Fund totaling $161,983 for the period. In addition, through arrangements with the Fund's custodian, credits realized as a result of uninvested cash balances were used to reduce the Fund's expenses. During the period, these credits reduced the Fund's custody expenses by $59.
9. Distributions to Shareholders.
Distributions to shareholders of each class were as follows:
Years ended July 31, | 2010 | 2009 |
From net investment income | | |
Class A | $ 58,598 | $ - |
Class T | 19,755 | - |
Class B | 3,225 | - |
Class C | 14,423 | - |
International Real Estate | 3,124,751 | - |
Institutional Class | 15,018 | - |
Total | $ 3,235,770 | $ - |
From net realized gain | | |
Class A | $ 101,910 | $ - |
Class T | 37,040 | - |
Class B | 9,214 | - |
Class C | 39,337 | - |
International Real Estate | 4,807,309 | - |
Institutional Class | 23,105 | - |
Total | $ 5,017,915 | $ - |
Annual Report
10. Share Transactions.
Transactions for each class of shares were as follows:
| Shares | Dollars |
Years ended July 31, | 2010 | 2009 | 2010 | 2009 |
Class A | | | | |
Shares sold | 365,681 | 276,074 | $ 3,120,303 | $ 2,073,370 |
Reinvestment of distributions | 15,947 | - | 134,591 | - |
Shares redeemed | (343,205) | (395,339) | (2,901,988) | (2,671,924) |
Net increase (decrease) | 38,423 | (119,265) | $ 352,906 | $ (598,554) |
Class T | | | | |
Shares sold | 132,643 | 127,919 | $ 1,140,128 | $ 986,052 |
Reinvestment of distributions | 6,259 | - | 52,641 | - |
Shares redeemed | (93,841) | (586,866) | (767,585) | (4,132,628) |
Net increase (decrease) | 45,061 | (458,947) | $ 425,184 | $ (3,146,576) |
Class B | | | | |
Shares sold | 20,099 | 23,179 | $ 169,130 | $ 177,395 |
Reinvestment of distributions | 1,355 | - | 11,297 | - |
Shares redeemed | (20,259) | (36,555) | (169,049) | (251,823) |
Net increase (decrease) | 1,195 | (13,376) | $ 11,378 | $ (74,428) |
Class C | | | | |
Shares sold | 164,953 | 103,043 | $ 1,381,947 | $ 772,724 |
Reinvestment of distributions | 5,842 | - | 48,663 | - |
Shares redeemed | (92,347) | (124,838) | (761,918) | (872,457) |
Net increase (decrease) | 78,448 | (21,795) | $ 668,692 | $ (99,733) |
International Real Estate | | | | |
Shares sold | 9,224,310 | 11,251,723 | $ 79,406,931 | $ 83,151,001 |
Reinvestment of distributions | 875,447 | - | 7,441,303 | - |
Shares redeemed | (13,336,716) | (24,377,998) | (114,385,841) | (173,652,133) |
Net increase (decrease) | (3,236,959) | (13,126,275) | $ (27,537,607) | $ (90,501,132) |
Institutional Class | | | | |
Shares sold | 40,774 | 83,584 | $ 351,025 | $ 621,361 |
Reinvestment of distributions | 4,247 | - | 36,016 | - |
Shares redeemed | (70,819) | (198,948) | (608,371) | (1,465,893) |
Net increase (decrease) | (25,798) | (115,364) | $ (221,330) | $ (844,532) |
11. Other.
The Fund's organizational documents provide former and current trustees and officers with a limited indemnification against liabilities arising in connection with the performance of their duties to the Fund. In the normal course of business, the Fund may also enter into contracts that provide general indemnifications. The Fund's maximum exposure under these arrangements is unknown as this would be dependent on future claims that may be made against the Fund. The risk of material loss from such claims is considered remote.
Annual Report
To the Trustees of Fidelity Securities Fund and the Shareholders of Fidelity International Real Estate Fund:
In our opinion, the accompanying statement of assets and liabilities, including the schedule of investments, and the related statements of operations and of changes in net assets and the financial highlights present fairly, in all material respects, the financial position of Fidelity International Real Estate Fund (a fund of Fidelity Securities Fund) at July 31, 2010, the results of its operations for the year then ended, the changes in its net assets for each of the two years in the period then ended and the financial highlights for the periods indicated, in conformity with accounting principles generally accepted in the United States of America. These financial statements and financial highlights (hereafter referred to as "financial statements") are the responsibility of the Fidelity International Real Estate Fund's management. Our responsibility is to express an opinion on these financial statements based on our audits. We conducted our audits of these financial statements in accordance with the standards of the Public Company Accounting Oversight Board (United States). Those standards require that we plan and perform the audit to obtain reasonable assurance about whether the financial statements are free of material misstatement. An audit includes examining, on a test basis, evidence supporting the amounts and disclosures in the financial statements, assessing the accounting principles used and significant estimates made by management, and evaluating the overall financial statement presentation. We believe that our audits, which included confirmation of securities at July 31, 2010 by correspondence with the custodian and brokers, provide a reasonable basis for our opinion.
/s/ PricewaterhouseCoopers LLP
PricewaterhouseCoopers LLP
Boston, Massachusetts
September 17, 2010
Annual Report
The Trustees, Member of the Advisory Board, and executive officers of the trust and fund, as applicable, are listed below. The Board of Trustees governs the fund and is responsible for protecting the interests of shareholders. The Trustees are experienced executives who meet periodically throughout the year to oversee the fund's activities, review contractual arrangements with companies that provide services to the fund, oversee management of the risks associated with such activities and contractual arrangements, and review the fund's performance. Except for James C. Curvey, each of the Trustees oversees 222 funds advised by FMR or an affiliate. Mr. Curvey oversees 411 funds advised by FMR or an affiliate.
The Trustees hold office without limit in time except that (a) any Trustee may resign; (b) any Trustee may be removed by written instrument, signed by at least two-thirds of the number of Trustees prior to such removal; (c) any Trustee who requests to be retired or who has become incapacitated by illness or injury may be retired by written instrument signed by a majority of the other Trustees; and (d) any Trustee may be removed at any special meeting of shareholders by a two-thirds vote of the outstanding voting securities of the trust. Each Trustee who is not an interested person (as defined in the 1940 Act) (Independent Trustee), shall retire not later than the last day of the calendar year in which his or her 72nd birthday occurs. The Independent Trustees may waive this mandatory retirement age policy with respect to individual Trustees. The executive officers and Advisory Board Member hold office without limit in time, except that any officer and Advisory Board Member may resign or may be removed by a vote of a majority of the Trustees at any regular meeting or any special meeting of the Trustees. Except as indicated, each individual has held the office shown or other offices in the same company for the past five years.
Experience, Skills, Attributes, and Qualifications of the Fund's Trustees. The Governance and Nominating Committee has adopted a statement of policy that describes the experience, qualifications, attributes, and skills that are necessary and desirable for potential Independent Trustee candidates (Statement of Policy). The Board believes that each Trustee satisfied at the time he or she was initially elected or appointed a Trustee, and continues to satisfy, the standards contemplated by the Statement of Policy. The Governance and Nominating Committee also engages professional search firms to help identify potential Independent Trustee candidates who have the experience, qualifications, attributes, and skills consistent with the Statement of Policy. From time to time, additional criteria based on the composition and skills of the current Independent Trustees, as well as experience or skills that may be appropriate in light of future changes to board composition, business conditions, and regulatory or other developments, have also been considered by the professional search firms and the Governance and Nominating Committee. In addition, the Board takes into account the Trustees' commitment and participation in Board and committee meetings, as well as their leadership of standing and ad hoc committees throughout their tenure.
Annual Report
Trustees and Officers - continued
In determining that a particular Trustee was and continues to be qualified to serve as a Trustee, the Board has considered a variety of criteria, none of which, in isolation, was controlling. The Board believes that, collectively, the Trustees have balanced and diverse experience, qualifications, attributes, and skills, which allow the Board to operate effectively in governing the fund and protecting the interests of shareholders. Information about the specific experience, skills, attributes, and qualifications of each Trustee, which in each case led to the Board's conclusion that the Trustee should serve (or continue to serve) as a trustee of the fund, is provided below.
Board Structure and Oversight Function. Edward C. Johnson 3d is an interested person (as defined in the 1940 Act) and currently serves as Chairman. The Trustees have determined that an interested Chairman is appropriate and benefits shareholders because an interested Chairman has a personal and professional stake in the quality and continuity of services provided to the fund. Independent Trustees exercise their informed business judgment to appoint an individual of their choosing to serve as Chairman, regardless of whether the Trustee happens to be independent or a member of management. The Independent Trustees have determined that they can act independently and effectively without having an Independent Trustee serve as Chairman and that a key structural component for assuring that they are in a position to do so is for the Independent Trustees to constitute a substantial majority for the Board. The Independent Trustees also regularly meet in executive session. Ned C. Lautenbach serves as Chairman of the Independent Trustees and as such (i) acts as a liaison between the Independent Trustees and management with respect to matters important to the Independent Trustees and (ii) with management prepares agendas for Board meetings.
Fidelity funds are overseen by different Boards of Trustees. The fund's Board oversees Fidelity's equity and high income funds and another Board oversees Fidelity's investment-grade bond, money market, and asset allocation funds. The asset allocation funds may invest in Fidelity funds overseen by the fund's Board. The use of separate Boards, each with its own committee structure, allows the Trustees of each group of Fidelity funds to focus on the unique issues of the funds they oversee, including common research, investment, and operational issues. On occasion, the separate Boards establish joint committees to address issues of overlapping consequences for the Fidelity funds overseen by each Board.
The Trustees operate using a system of committees to facilitate the timely and efficient consideration of all matters of importance to the Trustees, the fund, and fund shareholders and to facilitate compliance with legal and regulatory requirements and oversight of the fund's activities and associated risks. The Board, acting through its committees, has charged FMR and its affiliates with (i) identifying events or circumstances the occurrence of which could have demonstrably adverse effects on the fund's business and/or reputation; (ii) implementing processes and controls to lessen the possibility that such events or circumstances occur or to mitigate the effects of such events or circumstances if they do occur; and (iii) creating and maintaining a system designed to evaluate continuously business and market conditions in order to facilitate the identification and implementation processes described in (i) and (ii) above. Because the day-to-day operations and activities of the fund are carried out by or through FMR, its affiliates and other service providers, the fund's exposure to risks is mitigated but not eliminated by the processes overseen by the Trustees. While each of the Board's committees has responsibility for overseeing different aspects of the fund's activities, oversight is exercised primarily through the Operations, Audit, and Compliance Committees. Appropriate personnel, including but not limited to the fund's Chief Compliance Officer (CCO), FMR's internal auditor, the independent accountants, the fund's Treasurer and portfolio management personnel, make periodic reports to the Board's committees, as appropriate. The responsibilities of each committee, including their oversight responsibilities, are described further under "Standing Committees of the Fund's Trustees."
Annual Report
The fund's Statement of Additional Information (SAI) includes more information about the Trustees. To request a free copy, call Fidelity at 1-800-544-8544.
Interested Trustees*:
Correspondence intended for each Trustee who is an interested person may be sent to Fidelity Investments, 82 Devonshire Street, Boston, Massachusetts 02109.
Name, Age; Principal Occupations and Other Relevant Experience+ |
Edward C. Johnson 3d (80) |
| Year of Election or Appointment: 1984 Mr. Johnson is Trustee and Chairman of the Board of Trustees of certain Trusts. Mr. Johnson serves as Chief Executive Officer, Chairman, and a Director of FMR LLC; Chairman and a Director of FMR; Chairman and a Director of Fidelity Research & Analysis Company (FRAC); Chairman and a Director of Fidelity Investments Money Management, Inc.; and Chairman and a Director of FMR Co., Inc. In addition, Mr. Johnson serves as Chairman and Director of FIL Limited. Previously, Mr. Johnson served as President of FMR LLC (2006-2007). |
James C. Curvey (75) |
| Year of Election or Appointment: 2007 Mr. Curvey also serves as Trustee (2007-present) of other investment companies advised by FMR. Mr. Curvey is a Director of FMR and FMR Co., Inc. (2007-present). Mr. Curvey is also Vice Chairman (2006-present) and Director of FMR LLC. In addition, Mr. Curvey serves as an Overseer for the Boston Symphony Orchestra and a member of the Trustees of Villanova University. |
* Trustees have been determined to be "Interested Trustees" by virtue of, among other things, their affiliation with the trust or various entities under common control with FMR.
+ The information above includes each Trustee's principal occupation during the last five years and other information relating to the experience, attributes, and skills relevant to each Trustee's qualifications to serve as a Trustee, which led to the conclusion that each Trustee should serve as a Trustee for the fund.
Annual Report
Trustees and Officers - continued
Independent Trustees:
Correspondence intended for each Independent Trustee (that is, the Trustees other than the Interested Trustees) may be sent to Fidelity Investments, P.O. Box 55235, Boston, Massachusetts 02205-5235.
Name, Age; Principal Occupations and Other Relevant Experience+ |
Dennis J. Dirks (62) |
| Year of Election or Appointment: 2005 Prior to his retirement in May 2003, Mr. Dirks was Chief Operating Officer and a member of the Board of The Depository Trust & Clearing Corporation (DTCC). He also served as President, Chief Operating Officer, and Board member of The Depository Trust Company (DTC) and President and Board member of the National Securities Clearing Corporation (NSCC). In addition, Mr. Dirks served as Chief Executive Officer and Board member of the Government Securities Clearing Corporation, Chief Executive Officer and Board member of the Mortgage-Backed Securities Clearing Corporation, as a Trustee and a member of the Finance Committee of Manhattan College (2005-2008), and as a Trustee and a member of the Finance Committee of AHRC of Nassau County (2006-2008). Currently, Mr. Dirks serves as a member of the Board of Directors for The Brookville Center for Children's Services, Inc. (2009-present). |
Alan J. Lacy (56) |
| Year of Election or Appointment: 2008 Mr. Lacy serves as Senior Adviser (2007-present) of Oak Hill Capital Partners, L.P. (private equity). Mr. Lacy also served as Chief Executive Officer (2000-2005) and Vice Chairman (2005-2006) of Sears Holdings Corporation and Sears, Roebuck and Co. (retail). In addition, Mr. Lacy serves as a member of the Board of Directors of The Western Union Company (global money transfer, 2006-present) and Bristol-Myers Squibb Company (global pharmaceuticals, 2007-present). Mr. Lacy is Chairman (2008-present) and a member (2006-present) of the Board of Trustees of The National Parks Conservation Association. |
Ned C. Lautenbach (66) |
| Year of Election or Appointment: 2000 Mr. Lautenbach is Chairman of the Independent Trustees of the Equity and High Income Funds (2006-present). Mr. Lautenbach is an Advisory Partner of Clayton, Dubilier & Rice, Inc. (private equity investment, 2008-present) and was previously a Partner of Clayton, Dubilier & Rice, Inc. (1998-2008). Previously, Mr. Lautenbach was with the International Business Machines Corporation (IBM) from 1968 until his retirement in 1998. Mr. Lautenbach serves as a Director of Eaton Corporation (diversified industrial) as well as the Philharmonic Center for the Arts in Naples, Florida. Mr. Lautenbach is also a member of the Board of Trustees of Fairfield University (2005-present), as well as a member of the Council on Foreign Relations. Previously, Mr. Lautenbach served as a Director of Sony Corporation (2006-2007). |
Joseph Mauriello (65) |
| Year of Election or Appointment: 2008 Prior to his retirement in January 2006, Mr. Mauriello served in numerous senior management positions including Deputy Chairman and Chief Operating Officer (2004-2005), and Vice Chairman of Financial Services (2002-2004) of KPMG LLP US (professional services, 1965-2005). Mr. Mauriello currently serves as a member of the Board of Directors of XL Capital Ltd. (global insurance and re-insurance, 2006-present) and of Arcadia Resources Inc. (health care services and products, 2007-present). Previously, Mr. Mauriello served as a Director of the Hamilton Funds of the Bank of New York (2006-2007). |
Cornelia M. Small (66) |
| Year of Election or Appointment: 2005 Ms. Small is a member of the Board of Directors of the Teagle Foundation (2009-present). Ms. Small is also a member of the Investment Committee, and Chair (2008-present) and a member of the Board of Trustees of Smith College. In addition, Ms. Small serves on the Investment Committee of the Berkshire Taconic Community Foundation (2008-present). Previously, Ms. Small served as Chairperson of the Investment Committee (2002-2008) of Smith College. In addition, Ms. Small served as Chief Investment Officer, Director of Global Equity Investments, and a member of the Board of Directors of Scudder, Stevens & Clark and Scudder Kemper Investments. |
William S. Stavropoulos (71) |
| Year of Election or Appointment: 2002 Mr. Stavropoulos is Vice Chairman of the Independent Trustees of the Equity and High Income Funds (2006-present). Mr. Stavropoulos serves as President and Founder of the Michigan Baseball Foundation, the Great Lakes Loons (2007-present). Mr. Stavropoulos is Chairman Emeritus of the Board of Directors of The Dow Chemical Company, where he previously served in numerous senior management positions, including President, CEO (1995-2000; 2002-2004), Chairman of the Executive Committee (2000-2006), and as a member of the Board of Directors (1990-2006). Currently, Mr. Stavropoulos is a Director of Teradata Corporation (data warehousing and technology solutions, 2008-present), Chemical Financial Corporation, Maersk Inc. (industrial conglomerate), Tyco International, Inc. (multinational manufacturing and services, 2007-present), and a member of the Advisory Board for Metalmark Capital (private equity investment, 2005-present). Mr. Stavropoulos is a special advisor to Clayton, Dubilier & Rice, Inc. (private equity investment). In addition, Mr. Stavropoulos is a member of the University of Notre Dame Advisory Council for the College of Science. |
David M. Thomas (61) |
| Year of Election or Appointment: 2008 Previously, Mr. Thomas served as Executive Chairman (2005-2006) and Chairman and Chief Executive Officer (2000-2005) of IMS Health, Inc. (pharmaceutical and healthcare information solutions). In addition, Mr. Thomas serves as a member of the Board of Directors of Fortune Brands, Inc. (consumer products), and Interpublic Group of Companies, Inc. (marketing communication, 2004-present). |
Michael E. Wiley (59) |
| Year of Election or Appointment: 2008 Mr. Wiley also serves as a Director of Asia Pacific Exploration Consolidated (international oil and gas exploration and production, 2008-
present), and as a member of the Board of Trustees of the University of Tulsa (2000-2006; 2007-present). Mr. Wiley serves as a Director of Tesoro Corporation (independent oil refiner and marketer, 2005-present), and a Director of Bill Barrett Corporation (exploration and production, 2005-present). In addition, Mr. Wiley also serves as a Director of Post Oak Bank (privately-held bank, 2004-present). Previously, Mr. Wiley served as a Sr. Energy Advisor of Katzenbach Partners, LLC (consulting, 2006-2007), as an Advisory Director of Riverstone Holdings (private investment), Chairman, President, and CEO of Baker Hughes, Inc. (oilfield services, 2000-2004), and as Director of Spinnaker Exploration Company (exploration and production, 2001-2005). |
Annual Report
+ The information above includes each Trustee's principal occupation during the last five years and other information relating to the experience, attributes, and skills relevant to each Trustee's qualifications to serve as a Trustee, which led to the conclusion that each Trustee should serve as a Trustee for the fund.
Advisory Board Member and Executive Officers:
Correspondence intended for each executive officer and Peter S. Lynch may be sent to Fidelity Investments, 82 Devonshire Street, Boston, Massachusetts 02109.
Name, Age; Principal Occupation |
Peter S. Lynch (66) |
| Year of Election or Appointment: 2003 Member of the Advisory Board of Fidelity's Equity and High Income Funds. Mr. Lynch is Vice Chairman and a Director of FMR and FMR Co., Inc. In addition, Mr. Lynch serves as a Trustee of Boston College and as the Chairman of the Inner-City Scholarship Fund. Previously, Mr. Lynch served on the Special Olympics International Board of Directors (1997-2006). |
Kenneth B. Robins (40) |
| Year of Election or Appointment: 2008 President and Treasurer of Fidelity's Equity and High Income Funds. Mr. Robins also serves as President and Treasurer (2010-present) and Assistant Treasurer (2009-present) of other Fidelity funds and is an employee of Fidelity Investments (2004-present). Previously, Mr. Robins served as Deputy Treasurer of the Fidelity funds (2005-2008) and Treasurer and Chief Financial Officer of The North Carolina Capital Management Trust: Cash and Term Portfolios (2006-2008). |
Brian B. Hogan (45) |
| Year of Election or Appointment: 2009 Vice President of certain Equity Funds and Vice President of Sector Funds. Mr. Hogan also serves as Senior Vice President, Equity Research of FMR (2006-present) and President of FMR's Equity Division (2009-present). Previously, Mr. Hogan served as a portfolio manager. |
Christopher S. Bartel (38) |
| Year of Election or Appointment: 2009 Vice President of Fidelity's Sector and Real Estate Equity Funds. Mr. Bartel also serves as Senior Vice President of Equity Research (2009-present). Previously, Mr. Bartel served as Managing Director of Research (2006-2009) and an analyst and portfolio manager (2000-2006). |
Scott C. Goebel (42) |
| Year of Election or Appointment: 2008 Secretary and Chief Legal Officer (CLO) of the Fidelity funds. Mr. Goebel also serves as General Counsel, Secretary, and Senior Vice President of FMR (2008-present) and FMR Co., Inc. (2008-present); Deputy General Counsel of FMR LLC; Chief Legal Officer of Fidelity Management & Research (Hong Kong) Limited (2008-present) and Assistant Secretary of Fidelity Management & Research (Japan) Inc. (2008-present), Fidelity Investments Money Management, Inc. (2008-present), Fidelity Management & Research (U.K.) Inc. (2008-present), and Fidelity Research and Analysis Company (2008-present). Previously, Mr. Goebel served as Assistant Secretary of the Funds (2007-2008) and as Vice President and Secretary of Fidelity Distributors Corporation (FDC) (2005-2007). |
William C. Coffey (41) |
| Year of Election or Appointment: 2009 Assistant Secretary of Fidelity's Equity and High Income Funds. Mr. Coffey also serves as Senior Vice President and Deputy General Counsel of FMR LLC (2010-present), and is an employee of Fidelity Investments. Previously, Mr. Coffey served as Vice President and Associate General Counsel of FMR LLC (2005-2009). |
Holly C. Laurent (56) |
| Year of Election or Appointment: 2008 Anti-Money Laundering (AML) Officer of the Fidelity funds. Ms. Laurent is an employee of Fidelity Investments. Previously, Ms. Laurent was Senior Vice President and Head of Legal for Fidelity Business Services India Pvt. Ltd. (2006-2008), and Senior Vice President, Deputy General Counsel and Group Head for FMR LLC (2005-2006). |
Christine Reynolds (51) |
| Year of Election or Appointment: 2008 Chief Financial Officer of the Fidelity funds. Ms. Reynolds became President of Fidelity Pricing and Cash Management Services (FPCMS) in August 2008. Ms. Reynolds served as Chief Operating Officer of FPCMS (2007-2008). Previously, Ms. Reynolds served as President, Treasurer, and Anti-Money Laundering officer of the Fidelity funds (2004-2007). |
Kenneth A. Rathgeber (63) |
| Year of Election or Appointment: 2004 Chief Compliance Officer of Fidelity's Equity and High Income Funds. Mr. Rathgeber is Chief Compliance Officer of Fidelity Management & Research (Hong Kong) Limited (2008-present), Fidelity Management & Research (Japan) Inc. (2008-present), FMR (2005-present), FMR Co., Inc. (2005-present), Fidelity Management & Research (U.K.) Inc. (2005-present), Fidelity Research & Analysis Company (2005-present), Fidelity Investments Money Management, Inc. (2005-present), Pyramis Global Advisors, LLC (2005-present), and Strategic Advisers, Inc.(2005-present). |
Jeffrey S. Christian (48) |
| Year of Election or Appointment: 2009 Deputy Treasurer of the Fidelity funds. Mr. Christian is an employee of Fidelity Investments. Previously, Mr. Christian served as Chief Financial Officer (2008-2009) of certain Fidelity funds and Senior Vice President of Fidelity Pricing and Cash Management Services (FPCMS) (2004-2009). |
Bryan A. Mehrmann (49) |
| Year of Election or Appointment: 2005 Deputy Treasurer of the Fidelity funds. Mr. Mehrmann is an employee of Fidelity Investments. |
Adrien E. Deberghes (42) |
| Year of Election or Appointment: 2008 Deputy Treasurer of Fidelity's Equity and High Income Funds. Mr. Deberghes also serves as Assistant Treasurer of other Fidelity funds (2010-present) and is an employee of Fidelity Investments (2008-present). Previously, Mr. Deberghes served as Senior Vice President of Mutual Fund Administration at State Street Corporation (2007-2008), Senior Director of Mutual Fund Administration at Investors Bank & Trust (2005-2007), and Director of Finance for Dunkin' Brands (2000-2005). |
Stephanie J. Dorsey (41) |
| Year of Election or Appointment: 2010 Assistant Treasurer of Fidelity's Equity and High Income Funds. Ms. Dorsey also serves as Deputy Treasurer of other Fidelity funds (2008-present) and is an employee of Fidelity Investments (2008-present). Previously, Ms. Dorsey served as Treasurer (2004-2008) of the JPMorgan Mutual Funds and Vice President (2004-2008) of JPMorgan Chase Bank. |
Name, Age; Principal Occupation |
John R. Hebble (52) |
| Year of Election or Appointment: 2009 Assistant Treasurer of Fidelity's Equity and High Income Funds. Mr. Hebble also serves as Treasurer and Chief Financial Officer of The North Carolina Capital Management Trust: Cash and Term Portfolio (2008-present), President and Treasurer of other Fidelity funds (2008-present) and is an employee of Fidelity Investments. |
Gary W. Ryan (51) |
| Year of Election or Appointment: 2005 Assistant Treasurer of the Fidelity funds. Mr. Ryan is an employee of Fidelity Investments. Previously, Mr. Ryan served as Vice President of Fund Reporting in Fidelity Pricing and Cash Management Services (FPCMS) (1999-2005). |
Annual Report
The Board of Trustees of Fidelity International Real Estate Fund voted to pay on September 9, 2010, to shareholders of record at the opening of business on September 8, 2010, a distribution of $.158 per share derived from capital gains realized from sales of portfolio securities and a dividend of $.124 per share from net investment income.
International Real Estate designates 9% of the dividends distributed in December 2009 during the fiscal year as amounts which may be taken into account as a dividend for purposes of the maximum rate under section 1(h)(11) of the Internal Revenue Code.
The amounts per share which represents income derived from sources within, and taxes paid to, foreign countries or possessions of the United States are as follows:
Pay Date | Income | Taxes |
12/21/09 | $.078 | $.0049 |
The fund will notify shareholders in January 2011 of amounts for use in preparing 2010 income tax returns.
Annual Report
Board Approval of Investment Advisory Contracts and Management Fees
Fidelity International Real Estate Fund
Each year, the Board of Trustees, including the Independent Trustees (together, the Board), votes on the renewal of the management contract and sub-advisory agreements (together, the Advisory Contracts) for the fund. The Board, assisted by the advice of fund counsel and Independent Trustees' counsel, requests and considers a broad range of information relevant to the renewal of the Advisory Contracts throughout the year.
The Board meets regularly and considers at each of its meetings factors that are relevant to its annual consideration of the renewal of the fund's Advisory Contracts, including the services and support provided to the fund and its shareholders. The Board has established various standing committees, each composed of Independent Trustees with varying backgrounds, to which the Board has assigned specific subject matter responsibilities in order to enhance effective decision-making by the Board. The Board, acting directly and through its Committees, requests and receives information concerning the annual consideration of the renewal of the fund's Advisory Contracts. The Board also meets as needed to consider matters specifically related to the Board's annual consideration of the renewal of Advisory Contracts. Members of the Board may also meet with trustees of other Fidelity funds through ad hoc joint committees to discuss certain matters relevant to the Fidelity funds.
At its July 2010 meeting, the Board of Trustees, including the Independent Trustees, unanimously determined to renew the fund's Advisory Contracts. In reaching its determination, the Board considered all factors it believed relevant, including (i) the nature, extent, and quality of the services to be provided to the fund and its shareholders (including the investment performance of the fund); (ii) the competitiveness of the fund's management fee and total expenses; (iii) the total costs of the services to be provided by and the profits to be realized by Fidelity from its relationship with the fund; (iv) the extent to which economies of scale would be realized as the fund grows; and (v) whether fee levels reflect these economies of scale, if any, for the benefit of fund shareholders.
In considering whether to renew the Advisory Contracts for the fund, the Board reached a determination, with the assistance of fund counsel and Independent Trustees' counsel and through the exercise of its business judgment, that the renewal of the Advisory Contracts is in the best interests of fund shareholders and that the compensation to be received by Fidelity under the management contract is fair and reasonable. The Board's decision to renew the Advisory Contracts was not based on any single factor noted above, but rather was based on a comprehensive consideration of all the information provided to the Board at its meetings throughout the year. The Board, in reaching its determination to renew the Advisory Contracts, is aware that shareholders in the fund have a broad range of investment choices available to them, including a wide choice among mutual funds offered by Fidelity's competitors, and that the fund's shareholders, with the opportunity to review and weigh the disclosure provided by the fund in its prospectus and other public disclosures, have chosen to invest in this fund, managed by Fidelity.
Annual Report
Board Approval of Investment Advisory Contracts and
Management Fees - continued
Nature, Extent, and Quality of Services Provided. The Board considered the staffing within the investment adviser, FMR, and the sub-advisers (together, the Investment Advisers), including the backgrounds of the fund's investment personnel and the fund's investment objective and discipline. The Independent Trustees also had discussions with senior management of Fidelity's investment operations and investment groups. The Board considered the structure of the portfolio manager compensation program and whether this structure provides appropriate incentives to act in the best interest of the fund.
Resources Dedicated to Investment Management and Support Services. The Board and the equity research subcommittee of the Board's Fund Oversight Committee reviewed the size, education, and experience of the Investment Advisers' investment staff, their use of technology, and the Investment Advisers' approach to recruiting, training, and retaining portfolio managers and other research, advisory, and management personnel. The Board noted that Fidelity's analysts have access to a variety of technological tools and market and securities data that enable them to perform both fundamental and quantitative analysis and to specialize in various disciplines. The Board considered Fidelity's extensive global research capabilities that enable the Investment Advisers to aggregate data from various sources in an effort to produce positive investment results. The Board also considered that Fidelity's portfolio managers and analysts have access to daily portfolio attribution that allows for monitoring of a fund's portfolio, as well as an electronic communication system that provides immediate real-time access to research concerning issuers and credit enhancers. The Board noted FMR's continued focus on strengthening the organization and discipline of equity portfolio management and research.
Shareholder and Administrative Services. The Board considered (i) the nature, extent, quality, and cost of advisory, administrative, and shareholder services performed by the Investment Advisers and their affiliates under the Advisory Contracts and under separate agreements covering transfer agency, pricing and bookkeeping, and securities lending services for the fund; (ii) the nature and extent of the investment adviser's supervision of third party service providers, principally custodians and subcustodians; and (iii) the resources devoted to, and the record of compliance with, the fund's compliance policies and procedures. The Board also reviewed the allocation of fund brokerage, including allocations to brokers affiliated with the Investment Advisers, the use of brokerage commissions to pay fund expenses, and the use of "soft" commission dollars to pay for research services.
The Board noted that the growth of fund assets over time across the complex allows Fidelity to reinvest in the development of services designed to enhance the value or convenience of the Fidelity funds as investment vehicles. These services include 24-hour access to account information and market information through phone representatives and over the Internet, and investor education materials and asset allocation tools.
Annual Report
Investment in a Large Fund Family. The Board considered the benefits to shareholders of investing in a Fidelity fund, including the benefits of investing in a fund that is part of a large family of funds offering a variety of investment disciplines and providing a large variety of mutual fund investor services. The Board noted that Fidelity had taken, or had made recommendations that resulted in the Fidelity funds taking, a number of actions over the previous year that benefited particular funds, including (i) dedicating additional resources to investment research and restructuring and broadening the focus of the investment research teams; (ii) bolstering the senior management team that oversees asset management; (iii) launching Class F of certain funds as a lower-fee class available to Freedom K and Freedom Index Funds; (iv) lowering the initial investment minimums and ongoing balance requirements for Real Estate High Income Fund; (v) eliminating subsequent purchase minimums for all funds and adding a waiver of the investment minimum requirement for new accounts opened with the proceeds of a systematic withdrawal plan; (vi) eliminating the withdrawal minimum and maximum limits for systematic withdrawals from Advisor funds; (vii) expanding sales load waivers on Class A shares for Destiny Planholders and expanding Institutional Class eligibility for Class O Destiny Planholders; and (viii) changing certain Class A and Class T sales charge structures to further align them with industry practices.
Investment Performance. The Board considered whether the fund has operated in accordance with its investment objective, as well as its record of compliance with its investment restrictions. It also reviewed the fund's absolute investment performance for each class, as well as the fund's relative investment performance for each class measured over multiple periods against a broad-based securities market index. The Board noted that FMR does not believe that a meaningful peer group exists against which to compare the fund's performance. The following charts considered by the Board show, over the one-, three, and five-year periods ended December 31, 2009, as available, the cumulative total returns of Institutional Class (Class I) and the retail class of the fund and the cumulative total returns of a broad-based securities market index ("benchmark").
Annual Report
Board Approval of Investment Advisory Contracts and
Management Fees - continued
Fidelity International Real Estate Fund
The Board noted that the investment performance of the fund was lower than its benchmark for all the periods shown. The Board discussed with FMR actions that have been taken by FMR to improve the fund's below-benchmark performance. The Board also reviewed the fund's performance since inception as well as performance in the current year. The Board will continue to closely monitor the performance of the fund in the coming year and discuss with FMR other appropriate actions to address the performance of the fund. The Board considered that the variations in performance among the fund's classes reflect the variations in class expenses, which result in lower performance for higher expense classes.
Based on its review, and giving particular weight to the nature and quality of the resources dedicated by the Investment Advisers to maintain and improve relative performance and factoring in the unprecedented market events in recent years, the Board concluded that the nature, extent, and quality of investment management and support services and of shareholder and administrative services provided to the fund will benefit the fund's shareholders, particularly in light of the Board's view that the fund's shareholders benefit from investing in a fund that is part of a large family of funds offering a variety of investment disciplines and services.
Competitiveness of Management Fee and Total Fund Expenses. The Board considered the fund's management fee and total expenses compared to "mapped groups" of competitive funds and classes. Fidelity creates "mapped groups" by combining similar Lipper investment objective categories that have comparable management fee characteristics. Combining Lipper investment objective categories aids the Board's management fee and total expense comparisons by broadening the competitive group used for comparison and by reducing the number of universes to which various Fidelity funds are compared.
Annual Report
Management Fee. The Board considered two proprietary management fee comparisons for the 12-month periods shown in the chart below. The group of Lipper funds used by the Board for management fee comparisons is referred to below as the "Total Mapped Group." The Total Mapped Group comparison focuses on a fund's standing relative to the total universe of comparable funds available to investors, in terms of gross management fees before expense reimbursements or caps. "TMG %" represents the percentage of funds in the Total Mapped Group that had management fees that were lower than the fund's. For example, a TMG % of 29% means that 71% of the funds in the Total Mapped Group had higher management fees than the fund. The "Asset-Size Peer Group" (ASPG) comparison focuses on a fund's standing relative to non-Fidelity funds similar in size to the fund within the Total Mapped Group. The ASPG represents at least 15% of the funds in the Total Mapped Group with comparable asset size and management fee characteristics, subject to a minimum of 50 funds (or all funds in the Total Mapped Group if fewer than 50). Additional information, such as the ASPG quartile in which the fund's management fee ranked, is also included in the chart and considered by the Board.
Fidelity International Real Estate Fund
The Board noted that the fund's management fee ranked below the median of its Total Mapped Group and below the median of its ASPG for 2009.
Annual Report
Board Approval of Investment Advisory Contracts and
Management Fees - continued
Based on its review, the Board concluded that the fund's management fee is fair and reasonable in light of the services that the fund receives and the other factors considered.
Total Expenses. In its review of each class's total expenses, the Board considered the fund's management fee as well as other fund or class expenses, as applicable, such as transfer agent fees, pricing and bookkeeping fees, fund-paid 12b-1 fees, and custodial, legal, and audit fees. The Board also noted the effects of any waivers and reimbursements on fees and expenses. As part of its review, the Board also considered current and historical total expenses of each class of the fund compared to competitive fund median expenses. Each class of the fund is compared to those funds and classes in the Total Mapped Group (used by the Board for management fee comparisons) that have a similar sales load structure.
The Board noted that the total expenses of each of Class A, Class C, and the retail class ranked below its competitive median for 2009 and the total expenses of each of Class T, Class B, and Institutional Class ranked above its competitive median for 2009. The Board considered that the total expenses for Class T were above the median primarily because its 12b-1 fee is higher than the typical front-end load class. The Board noted that the fund offers multiple classes, each of which has a different sales load and 12b-1 fee structure, and that the multiple structures are intended to offer a range of pricing options for the intermediary market. The Board also noted that the total expenses of the classes vary primarily by the level of their 12b-1 fees, although differences in transfer agent fees may also cause expenses to vary from class to class.
Fees Charged to Other Fidelity Clients. The Board also considered Fidelity fee structures and other information with respect to clients of FMR and its affiliates, such as other mutual funds advised or subadvised by FMR or its affiliates, pension plan clients, and other institutional clients. In March 2010, the Board created an ad hoc joint committee with the board of other Fidelity funds (the Committee) to review and compare Fidelity's institutional investment advisory business with its business of providing services to the Fidelity funds, including the differences in services provided, fees charged, and costs incurred, as well as competition in their respective marketplaces.
Based on its review of total expenses and fees charged to other Fidelity clients, the Board concluded that the total expenses of each class of the fund were reasonable, although in some cases above the median of the universe presented for comparison, in light of the services that the fund and its shareholders receive and the other factors considered, including the findings of the Committee.
Costs of the Services and Profitability. The Board considered the revenues earned and the expenses incurred by Fidelity in conducting the business of developing, marketing, distributing, managing, administering and servicing the fund and its shareholders. The Board also considered the level of Fidelity's profits in respect of all the Fidelity funds.
Annual Report
On an annual basis, FMR presents to the Board Fidelity's profitability for the fund. Fidelity calculates the profitability for each fund, as well as aggregate profitability for groups of Fidelity funds and all Fidelity funds, using a series of detailed revenue and cost allocation methodologies which originate with the audited books and records of Fidelity. The Audit Committee of the Board reviews any significant changes from the prior year's methodologies.
PricewaterhouseCoopers LLP (PwC), independent registered public accounting firm and auditor to Fidelity and certain Fidelity funds, has been engaged annually by the Board as part of the Board's assessment of Fidelity's profitability analysis. PwC's engagement includes the review and assessment of Fidelity's methodologies used in determining the revenues and expenses attributable to Fidelity's mutual fund business, and completion of agreed-upon procedures surrounding the mathematical accuracy of fund profitability and its conformity to allocation methodologies. After considering PwC's reports issued under the engagement and information provided by Fidelity, the Board believes that while other allocation methods may also be reasonable, Fidelity's profitability methodologies are reasonable in all material respects.
The Board has also reviewed Fidelity's non-fund businesses and fall-out benefits related to the mutual fund business as well as cases where Fidelity's affiliates may benefit from or be related to the fund's business.
The Board considered the costs of the services provided by and the profits realized by Fidelity in connection with the operation of the fund and were satisfied that the profitability was not excessive in the circumstances.
Economies of Scale. The Board considered whether there have been economies of scale in respect of the management of the Fidelity funds, whether the Fidelity funds (including the fund) have appropriately benefited from any such economies of scale, and whether there is potential for realization of any further economies of scale. The Board considered the extent to which the fund will benefit from economies of scale through increased services to the fund, through waivers or reimbursements, or through fee or expense reductions.
In February 2009, the Board and the board of other Fidelity funds created an ad hoc committee (the Economies of Scale Committee) to analyze whether FMR attains economies of scale in respect of the management and servicing of the Fidelity funds, whether the Fidelity funds have appropriately benefited from such economies of scale, and whether there is potential for realization of any further economies of scale.
The Board recognized that the fund's management contract incorporates a "group fee" structure, which provides for lower group fee rates as total fund assets under FMR's management increase, and for higher group fee rates as total fund assets under FMR's management decrease. FMR calculates the group fee rates based on a tiered asset "breakpoint" schedule that varies based on asset class. The Board considered that the group fee is designed to deliver the benefits of economies of scale to fund shareholders when total Fidelity fund assets increase, even if assets of any particular fund are unchanged or have declined, because some portion of Fidelity's costs are attributable to services provided to all Fidelity funds, and all funds benefit if those costs can be allocated among more assets. The Board concluded that, given the group fee structure, fund shareholders will benefit from lower management fees as assets under FMR's management increase at the fund complex level, regardless of whether Fidelity achieves any such economies of scale.
Annual Report
Board Approval of Investment Advisory Contracts and
Management Fees - continued
The Board concluded, considering the findings of the Economies of Scale Committee, that any potential economies of scale are being appropriately shared between fund shareholders and Fidelity.
Additional Information Requested by the Board. In order to develop fully the factual basis for consideration of the Fidelity funds' Advisory Contracts, the Board requested and received additional information on certain topics, including (i) fund performance trends, actions to be taken by FMR to improve certain funds' overall performance, and Fidelity's long-term strategies for certain funds; (ii) portfolio manager changes that have occurred during the past year and length of portfolio manager tenure for different categories of funds over time; (iii) Fidelity's compensation structure for portfolio managers, research analysts, and other key personnel, the rationale for the compensation structure, and how the compensation structure provides appropriate performance incentives; (iv) the amount of the investment that each portfolio manager has made in the Fidelity fund(s) that he or she manages; (v) management and other fees paid by FMR to affiliated sub-advisers on behalf of the Fidelity funds; (vi) Fidelity's fee structures and rationale for recommending different fees among different categories of funds; (vii) Fidelity's rationale for recommending which funds should have a performance adjustment component as part of their management fees; (viii) the rationale for any differences between fund fee structures and fee structures in place for other Fidelity clients; and (ix) explanations regarding the relative total expenses borne by certain funds and classes, total expense competitive trends, and actions that might be taken by FMR to reduce total expenses for certain funds and classes.
Based on its evaluation of all of the conclusions noted above, and after considering all factors it believed relevant, the Board ultimately concluded that the advisory fee structures are fair and reasonable, and that the fund's Advisory Contracts should be renewed.
Annual Report
Managing Your Investments
Fidelity offers several ways to conveniently manage your personal investments via your telephone or PC. You can access your account information, conduct trades and research your investments 24 hours a day.
By Phone
Fidelity Automated Service Telephone provides a single toll-free number to access account balances, positions, quotes and trading. It's easy to navigate the service, and on your first call, the system will help you create a personal identification number (PIN) for security.
(phone_graphic)
Fidelity Automated
Service Telephone (FAST®)
1-800-544-5555
Press
For mutual fund and brokerage trading.
For quotes.*
For account balances and holdings.
To review orders and mutual
fund activity.
To change your PIN.
To speak to a Fidelity representative.
By PC
Fidelity's web site on the Internet provides a wide range of information, including daily financial news, fund performance, interactive planning tools and news about Fidelity products and services.
(computer_graphic)
Fidelity's Web Site
www.fidelity.com
* When you call the quotes line, please remember that a fund's yield and return will vary and, except for money market funds, share price will also vary. This means that you may have a gain or loss when you sell your shares. There is no assurance that money market funds will be able to maintain a stable $1 share price; an investment in a money market fund is not insured or guaranteed by the U.S. government. Total returns are historical and include changes in share price, reinvestment of dividends and capital gains, and the effects of any sales charges.
Annual Report
To Write Fidelity
We'll give your correspondence immediate attention and send you written confirmation upon completion of your request.
(letter_graphic)
Making Changes
To Your Account
(such as changing name, address, bank, etc.)
Fidelity Investments
P.O. Box 770001
Cincinnati, OH 45277-0002
(letter_graphic)
For Non-Retirement
Accounts
Buying shares
Fidelity Investments
P.O. Box 770001
Cincinnati, OH 45277-0003
Overnight Express
Fidelity Investments
Attn: Distribution Services
100 Crosby Parkway - KC1H
Covington, KY 41015
Selling shares
Fidelity Investments
P.O. Box 770001
Cincinnati, OH 45277-0035
Overnight Express
Fidelity Investments
Attn: Distribution Services
100 Crosby Parkway - KC1H
Covington, KY 41015
General Correspondence
Fidelity Investments
P.O. Box 500
Merrimack, NH 03054-0500
(letter_graphic)
For Retirement
Accounts
Buying shares
Fidelity Investments
P.O. Box 770001
Cincinnati, OH 45277-0003
Selling shares
Fidelity Investments
P.O. Box 770001
Cincinnati, OH 45277-0035
Overnight Express
Fidelity Investments
Attn: Distribution Services
100 Crosby Parkway - KC1H
Covington, KY 41015
General Correspondence
Fidelity Investments
P.O. Box 500
Merrimack, NH 03054-0500
Annual Report
Investment Adviser
Fidelity Management & Research Company
Boston, MA
Investment Sub-Advisers
FMR Co., Inc.
Fidelity Research & Analysis Company
Fidelity Management & Research
(U.K.) Inc.
FIL Investments (Japan) Limited
FIL Investment Advisers
FIL Investment Advisers (U.K.) Ltd.
Fidelity Management & Research
(Hong Kong) Limited
Fidelity Management & Research
(Japan) Inc.
General Distributor
Fidelity Distributors Corporation
Boston, MA
Transfer and Service Agents
Fidelity Investments Institutional
Operations Company, Inc.
Boston, MA
Fidelity Service Company, Inc.
Boston, MA
Custodian
The Bank of New York Mellon
New York, NY
The Fidelity Telephone Connection
Mutual Fund 24-Hour Service
Exchanges/Redemptions
and Account Assistance 1-800-544-6666
Product Information 1-800-544-6666
Retirement Accounts 1-800-544-4774
(8 a.m. - 9 p.m.)
TDD Service 1-800-544-0118
for the deaf and hearing impaired
(9 a.m. - 9 p.m. Eastern time)
Fidelity Automated Service
Telephone (FAST®) 1-800-544-5555
Automated line for quickest service
IRE-UANN-0910
1.801327.105
(Fidelity Investment logo)(registered trademark)
Fidelity Advisor
International Real Estate
Fund - Class A, Class T,
Class B, and Class C
Annual Report
July 31, 2010
(2_fidelity_logos) (Registered_Trademark)
Class A, Class T, Class B,
and Class C are classes
of Fidelity® International
Real Estate Fund
Contents
Chairman's Message | <Click Here> | The Chairman's message to shareholders. |
Performance | <Click Here> | How the fund has done over time. |
Management's Discussion of Fund Performance | <Click Here> | The Portfolio Manager's review of fund performance and strategy. |
Shareholder Expense Example | <Click Here> | An example of shareholder expenses. |
Investment Changes | <Click Here> | A summary of major shifts in the fund's investments over the past six months. |
Investments | <Click Here> | A complete list of the fund's investments with their market values. |
Financial Statements | <Click Here> | Statements of assets and liabilities, operations, and changes in net assets,
as well as financial highlights. |
Notes | <Click Here> | Notes to the financial statements. |
Report of Independent Registered Public Accounting Firm | <Click Here> | |
Trustees and Officers | <Click Here> | |
Distributions | <Click Here> | |
Board Approval of Investment Advisory Contracts and Management Fees | <Click Here> | |
To view a fund's proxy voting guidelines and proxy voting record for the 12-month period ended June 30, visit http://www.fidelity.com/proxyvotingresults or visit the Securities and Exchange Commission's (SEC) web site at http://www.sec.gov. You may also call 1-877-208-0098 to request a free copy of the proxy voting guidelines.
Standard & Poor's, S&P and S&P 500 are registered service marks of The McGraw-Hill Companies, Inc. and have been licensed for use by Fidelity Distributors Corporation.
Other third party marks appearing herein are the property of their respective owners.
All other marks appearing herein are registered or unregistered trademarks or service marks of FMR LLC or an affiliated company.
Annual Report
This report and the financial statements contained herein are submitted for the general information of the shareholders of the fund. This report is not authorized for distribution to prospective investors in the fund unless preceded or accompanied by an effective prospectus.
A fund files its complete schedule of portfolio holdings with the SEC for the first and third quarters of each fiscal year on Form N-Q. Forms N-Q are available on the SEC's web site at http://www.sec.gov. A fund's Forms N-Q may be reviewed and copied at the SEC's Public Reference Room in Washington, DC. Information regarding the operation of the SEC's Public Reference Room may be obtained by calling 1-800-SEC-0330. For a complete list of a fund's portfolio holdings, view the most recent holdings listing, semiannual report, or annual report on Fidelity's web site at http://www.fidelity.com or http://www.advisor.fidelity.com, as applicable.
NOT FDIC INSURED • MAY LOSE VALUE • NO BANK GUARANTEE
Neither the fund nor Fidelity Distributors Corporation is a bank.
Annual Report
(photo_of_Edward_C_Johnson_3d)
Dear Shareholder:
A yearlong uptrend in global equity markets reversed course in late April 2010 when investor sentiment turned bearish due in great measure to concern that Europe's debt crisis would expand and slow or derail economic recovery. However, a bounceback in July helped to recover some of the ground that was lost. Financial markets are always unpredictable, of course, but there also are several time-tested investment principles that can help put the odds in your favor.
One of the basic tenets is to invest for the long term. Over time, riding out the markets' inevitable ups and downs has proven much more effective than selling into panic or chasing the hottest trend. Even missing only a few of the markets' best days can significantly diminish investor returns. Patience also affords the benefits of compounding - of earning interest on additional income or reinvested dividends and capital gains. There can be tax advantages and cost benefits to consider as well. While staying the course doesn't eliminate risk, it can considerably lessen the effect of short-term declines.
You can further manage your investing risk through diversification. And today, more than ever, geographic diversification should be taken into account. Studies indicate that asset allocation is the single most important determinant of a portfolio's long-term success. The right mix of stocks, bonds and cash - aligned to your particular risk tolerance and investment objective - is very important. Age-appropriate rebalancing is also an essential aspect of asset allocation. For younger investors, an emphasis on equities - which historically have been the best-performing asset class over time - is encouraged. As investors near their specific goal, such as retirement or sending a child to college, consideration may be given to replacing volatile assets (e.g. common stocks) with more-stable fixed investments (bonds or savings plans).
A third principle - investing regularly - can help lower the average cost of your purchases. Investing a certain amount of money each month or quarter helps ensure you won't pay for all your shares at market highs. This strategy - known as dollar cost averaging - also reduces "emotion" from investing, helping shareholders avoid selling weak performers just prior to an upswing, or chasing a hot performer just before a correction.
We invite you to contact us via the Internet, through our Investor Centers or by phone. It is our privilege to provide you the information you need to make the investments that are right for you.
Sincerely,
(The chairman's signature appears here.)
Edward C. Johnson 3d
Annual Report
Fidelity Advisor International Real Estate Fund - Class A, T, B, and C
Average annual total return reflects the change in the value of an investment, assuming reinvestment of the class' dividend income and capital gains (the profits earned upon the sale of securities that have grown in value, if any) and assuming a constant rate of performance each year. The $10,000 table and the fund's returns do not reflect the deduction of taxes that a shareholder would pay on fund distributions or the redemption of fund shares. During periods of reimbursement by Fidelity, a fund's total return will be greater than it would be had the reimbursement not occurred. How a fund did yesterday is no guarantee of how it will do tomorrow.
Average Annual Total Returns
Periods ended July 31, 2010 | Past 1
year | Past 5
years | Life of Fund A |
Class A (incl. 5.75% sales charge) B | -1.07% | -2.19% | 1.44% |
Class T (incl. 3.50% sales charge) C | 1.01% | -1.90% | 1.69% |
Class B (incl. contingent deferred sales charge) D | -0.80% | -1.82% | 1.89% |
Class C (incl. contingent deferred sales charge)E | 3.10% | -1.55% | 2.00% |
A From September 8, 2004.
B Class A shares bear a 0.25% 12b-1 fee. The initial offering of Class A shares took place on April 4, 2007. Returns prior to April 4, 2007 are those of Fidelity International Real Estate Fund, the original class of the fund, which does not bear a 12b-1 fee. Had Class A shares' 12b-1 fee been reflected, returns prior to April 4, 2007 would have been lower.
C Class T shares bear a 0.50% 12b-1 fee. The initial offering of Class T shares took place on April 4, 2007. Returns prior to April 4, 2007 are those of Fidelity International Real Estate Fund, the original class of the fund, which does not bear a 12b-1 fee. Had Class T shares' 12b-1 fee been reflected, returns prior to April 4, 2007 would have been lower.
D Class B shares bear a 1.00% 12b-1 fee. The initial offering of Class B shares took place on April 4, 2007. Returns prior to April 4, 2007 are those of Fidelity International Real Estate Fund, the original class of the fund, which does not bear a 12b-1 fee. Had Class B shares' 12b-1 fee been reflected, returns prior to April 4, 2007 would have been lower. Class B shares' contingent deferred sales charge included in the past one year, past five years and life of fund total return figures are 5%, 2%, and 1%, respectively.
E Class C shares bear a 1.00% 12b-1 fee. The initial offering of Class C shares took place on April 4, 2007. Returns prior to April 4, 2007 are those of Fidelity International Real Estate Fund, the original class of the fund, which does not bear a 12b-1 fee. Had Class C shares' 12b-1 fee been reflected, returns prior to April 4, 2007 would have been lower. Class C shares' contingent deferred sales charge included in the past one year, past five years and life of fund total return figures are 1%, 0%, and 0%, respectively.
Annual Report
$10,000 Over Life of Fund
Let's say hypothetically that $10,000 was invested in Fidelity Advisor International Real Estate Fund - Class A on September 8, 2004, when the fund started, and the current 5.75% sales charge was paid. The chart shows how the value of your investment would have changed, and also shows how the MSCI® EAFE® Index (Europe, Australasia, Far East) performed over the same period. The initial offering of Class A took place on April 4, 2007. See the previous page for additional information regarding the performance of Class A.
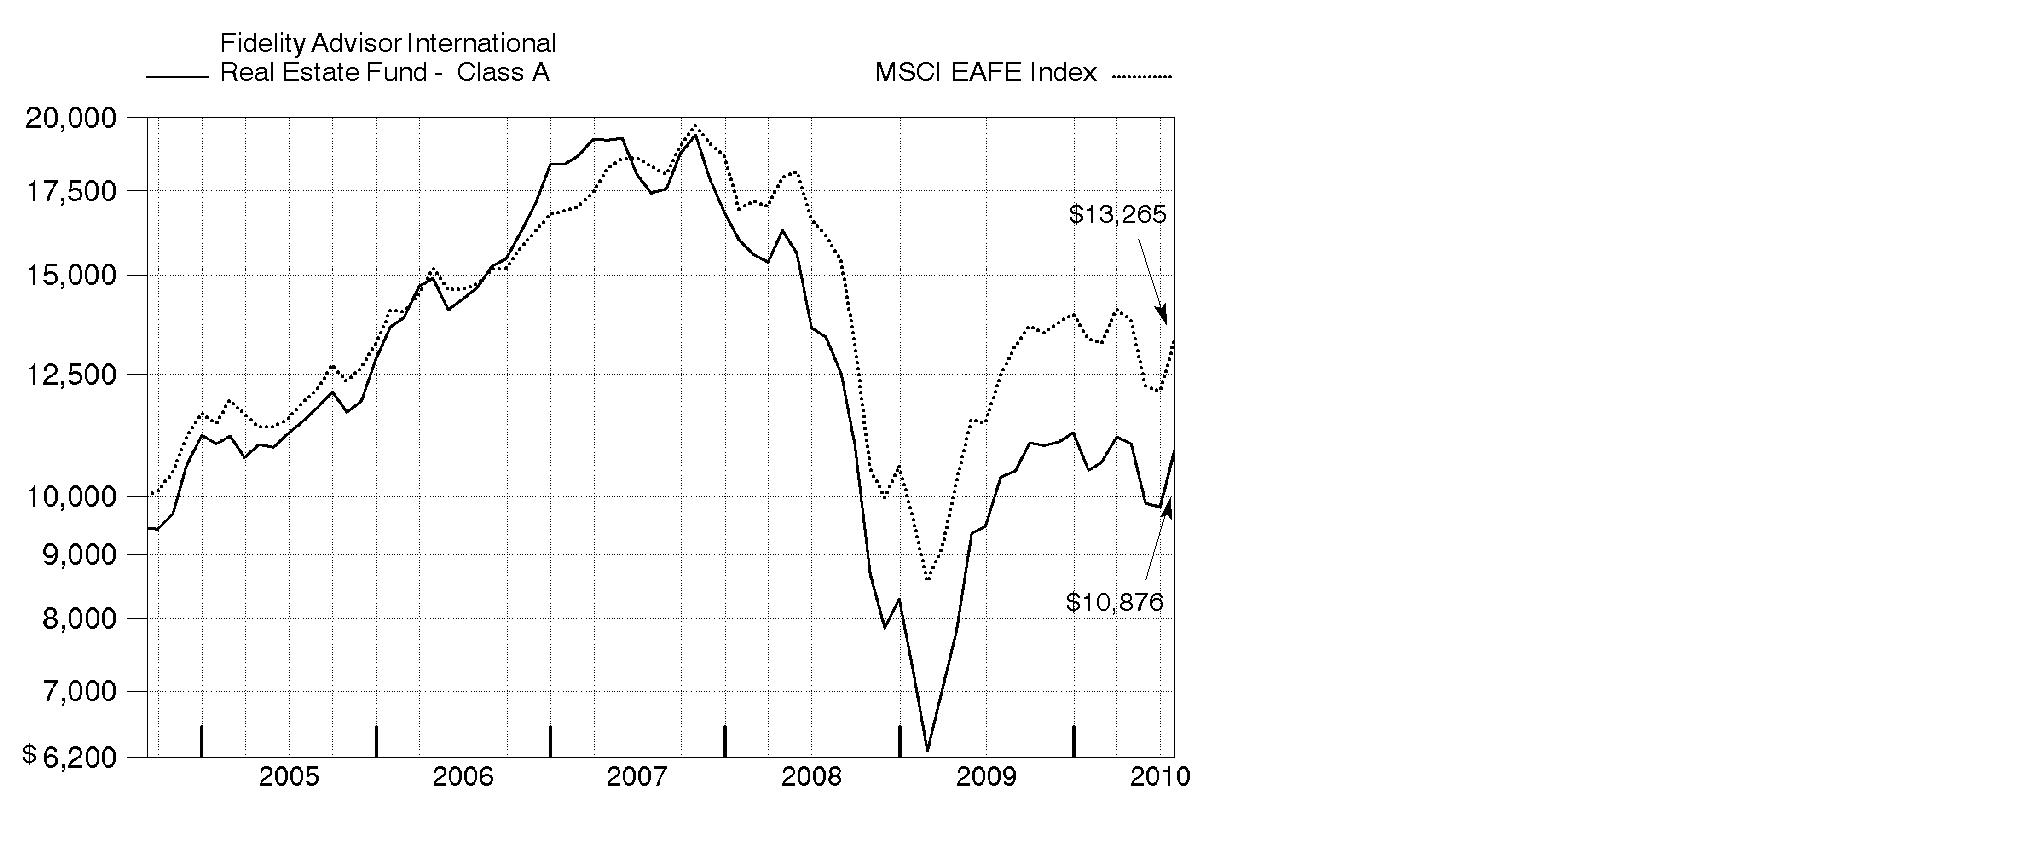
Annual Report
Market Recap: During the year ending July 31, 2010, investors in international real estate securities moved from having an appetite for risk to severe distaste for it. Following investors' exuberance after the global financial crisis, they became less willing to own international real estate securities, based on the sovereign debt crisis in Europe, the slowdown in U.S. employment and China's policies to restrain economic growth. Risk-averse investors strongly favored companies that displayed defensive qualities such as strong balance sheets and rental covenants. As a result, since April, stocks perceived to have less risk did much better than their more "offensive" counterparts. As of the end of July, offensive companies were trading at significant valuation discounts. In this environment, the FTSE EPRA/NAREIT Developed ex North America Index - a measure of international property stocks - returned 8.08%. The U.S. real estate stock market did much better, with the Dow Jones U.S. Select Real Estate Securities IndexSM increasing 55.21%. Meanwhile, the MSCI® EAFE® (Europe, Australasia, Far East Index), a proxy for the broad international stock market, rose 6.36% for the past 12 months.
Comments from Guillermo de las Casas, who became Portfolio Manager of Fidelity Advisor International Real Estate Fund on April 1, 2010: For the year, the fund's Class A, Class T, Class B and Class C shares returned 4.97%, 4.68%, 4.20% and 4.10%, respectively (excluding sales charges), trailing the FTSE EPRA/NAREIT index. Compared with this index during the past 12 months - the last four of which I was managing the fund - an underweighting and disappointing security selection in offices was negative. Stock picking in Japan and Australia were detractors, as was a modest underweighting in Europe. In contrast, the fund benefited from its overweighting in Norway and good stock selection in Brazil - which is not in the index - especially later in the period. Positive security selection among residential property developers more than offset the negative impact of being substantially overweighed in the group. Currency fluctuations modestly boosted performance. The biggest individual detractors were Chinese property company China Overseas Land & Investment; NTT Urban Development, a Japanese office property company that hurt the fund due to untimely ownership; Nomura Real Estate Holdings, a commercial and residential property developer; and Australian property company GPT Group. In contrast, U.K.-based UNITE Group, a manager and developer of student housing, did well, as did property developers Hongkong Land Holdings and Mitsubishi Estate, based in Hong Kong and Japan, respectively. Some of the stocks I've mentioned were not in the portfolio at period end.
The views expressed above reflect those of the portfolio manager(s) only through the end of the period as stated on the cover of this report and do not necessarily represent the views of Fidelity or any other person in the Fidelity organization. Any such views are subject to change at any time based upon market or other conditions and Fidelity disclaims any responsibility to update such views. These views may not be relied on as investment advice and, because investment decisions for a Fidelity fund are based on numerous factors, may not be relied on as an indication of trading intent on behalf of any Fidelity fund.
Annual Report
Shareholder Expense Example
As a shareholder of the Fund, you incur two types of costs: (1) transaction costs, including sales charges (loads) on purchase payments or redemption proceeds, redemption fees, and (2) ongoing costs, including management fees, distribution and/or service (12b-1) fees and other Fund expenses. This Example is intended to help you understand your ongoing costs (in dollars) of investing in the Fund and to compare these costs with the ongoing costs of investing in other mutual funds.
The Example is based on an investment of $1,000 invested at the beginning of the period and held for the entire period (February 1, 2010 to July 31, 2010).
Actual Expenses
The first line of the accompanying table for each class of the Fund provides information about actual account values and actual expenses. You may use the information in this line, together with the amount you invested, to estimate the expenses that you paid over the period. Simply divide your account value by $1,000.00 (for example, an $8,600 account value divided by $1,000.00 = 8.6), then multiply the result by the number in the first line for a class of the Fund under the heading entitled "Expenses Paid During Period" to estimate the expenses you paid on your account during this period. A small balance maintenance fee of $12.00 that is charged once a year may apply for certain accounts with a value of less than $2,000. This fee is not included in the table below. If it was, the estimate of expenses you paid during the period would be higher, and your ending account value lower, by this amount. In addition, the Fund, as a shareholder in the underlying Fidelity Central Funds, will indirectly bear its pro-rata share of the fees and expenses incurred by the underlying Fidelity Central Funds. These fees and expenses are not included in the Fund's annualized expense ratio used to calculate the expense estimate in the table below.
Hypothetical Example for Comparison Purposes
The second line of the accompanying table for each class of the Fund provides information about hypothetical account values and hypothetical expenses based on a Class' actual expense ratio and an assumed rate of return of 5% per year before expenses, which is not the Class' actual return. The hypothetical account values and expenses may not be used to estimate the actual ending account balance or expenses you paid for the period. You may use this information to compare the ongoing costs of investing in the Fund and other funds. To do so, compare this 5% hypothetical example with the 5% hypothetical examples that appear in the shareholder reports of the other funds. A small balance maintenance fee of $12.00 that is charged once a year may apply for certain accounts with a value of less than $2,000. This fee is not included in the table below. If it was, the estimate of expenses you paid during the period would be higher, and your ending account value lower, by this amount. In addition, the Fund, as a shareholder in the underlying Fidelity Central Funds, will indirectly bear its pro-rata share of the fees and expenses incurred by the underlying Fidelity Central Funds. These fees and expenses are not included in the Fund's annualized expense ratio used to calculate the expense estimate in the table below.
Annual Report
Please note that the expenses shown in the table are meant to highlight your ongoing costs only and do not reflect any transaction costs. Therefore, the second line of the table is useful in comparing ongoing costs only, and will not help you determine the relative total costs of owning different funds. In addition, if these transactional costs were included, your costs would have been higher.
| Annualized Expense Ratio | Beginning
Account Value
February 1, 2010 | Ending
Account Value
July 31, 2010 | Expenses Paid
During Period*
February 1, 2010 to July 31, 2010 |
Class A | 1.41% | | | |
Actual | | $ 1,000.00 | $ 1,038.00 | $ 7.12 |
HypotheticalA | | $ 1,000.00 | $ 1,017.80 | $ 7.05 |
Class T | 1.67% | | | |
Actual | | $ 1,000.00 | $ 1,037.00 | $ 8.43 |
HypotheticalA | | $ 1,000.00 | $ 1,016.51 | $ 8.35 |
Class B | 2.16% | | | |
Actual | | $ 1,000.00 | $ 1,033.50 | $ 10.89 |
HypotheticalA | | $ 1,000.00 | $ 1,014.08 | $ 10.79 |
Class C | 2.16% | | | |
Actual | | $ 1,000.00 | $ 1,033.60 | $ 10.89 |
HypotheticalA | | $ 1,000.00 | $ 1,014.08 | $ 10.79 |
International Real Estate | 1.16% | | | |
Actual | | $ 1,000.00 | $ 1,039.00 | $ 5.86 |
HypotheticalA | | $ 1,000.00 | $ 1,019.04 | $ 5.81 |
Institutional Class | 1.16% | | | |
Actual | | $ 1,000.00 | $ 1,039.10 | $ 5.86 |
HypotheticalA | | $ 1,000.00 | $ 1,019.04 | $ 5.81 |
A 5% return per year before expenses
* Expenses are equal to each Class' annualized expense ratio, multiplied by the average account value over the period, multiplied by 181/365 (to reflect the one-half year period).
Annual Report
Investment Changes (Unaudited)
Top Ten Stocks as of July 31, 2010 |
| % of fund's
net assets | % of fund's net assets
6 months ago |
Sun Hung Kai Properties Ltd. | 8.6 | 7.9 |
Westfield Group unit | 7.4 | 7.9 |
Unibail-Rodamco | 6.6 | 6.5 |
Mitsui Fudosan Co. Ltd. | 5.3 | 4.6 |
Wharf Holdings Ltd. | 4.4 | 2.2 |
Sumitomo Realty & Development Co. Ltd. | 3.3 | 2.9 |
CapitaLand Ltd. | 3.2 | 1.6 |
Hang Lung Properties Ltd. | 2.8 | 3.0 |
British Land Co. PLC | 2.6 | 3.4 |
Kerry Properties Ltd. | 2.5 | 0.0 |
| 46.7 | |
Top Five Countries as of July 31, 2010 |
(excluding cash equivalents) | % of fund's
net assets | % of fund's net assets
6 months ago |
Hong Kong | 23.6 | 26.4 |
Japan | 17.7 | 17.7 |
Australia | 14.1 | 16.1 |
Singapore | 10.5 | 5.5 |
United Kingdom | 9.2 | 9.8 |
Percentages are adjusted for the effect of open futures contracts, if applicable. |
Top Five REIT Sectors as of July 31, 2010 |
| % of fund's
net assets | % of fund's net assets
6 months ago |
REITs - Management/Investment | 20.9 | 27.3 |
REITs - Office Buildings | 6.0 | 10.4 |
REITs - Shopping Centers | 4.2 | 4.6 |
REITs - Industrial Buildings | 3.2 | 5.6 |
REITs - Malls | 0.4 | 0.0 |
Asset Allocation (% of fund's net assets) |
As of July 31, 2010* | As of January 31, 2010** |
| Stocks and Investment Companies 99.5% | | | Stocks and Investment Companies 95.9% | |
| Short-Term
Investments and
Net Other Assets 0.5% | | | Short-Term
Investments and
Net Other Assets 4.1% | |
* Foreign investments | 99.5% | | ** Foreign investments | 95.9% | |

Annual Report
Investments July 31, 2010
Showing Percentage of Net Assets
Common Stocks - 99.5% |
| Shares | | Value |
Australia - 14.1% |
Charter Hall Group unit | 6,124,957 | | $ 3,325,300 |
DEXUS Property Group unit | 6,940,140 | | 5,118,025 |
FKP Property Group unit | 3,701,859 | | 2,344,739 |
Goodman Group unit | 9,610,282 | | 5,347,956 |
Macquarie CountryWide Trust | 6,121,441 | | 2,935,663 |
Stockland Corp. Ltd. unit | 954,596 | | 3,273,674 |
Westfield Group unit | 2,242,258 | | 24,772,956 |
TOTAL AUSTRALIA | | 47,118,313 |
Bailiwick of Jersey - 1.0% |
Atrium European Real Estate Ltd. | 416,196 | | 2,142,674 |
LXB Retail Properties PLC | 821,700 | | 1,166,323 |
TOTAL BAILIWICK OF JERSEY | | 3,308,997 |
Brazil - 1.0% |
BR Properties SA | 43,600 | | 345,874 |
Cyrela Brazil Realty SA | 103,400 | | 1,448,247 |
Iguatemi Empresa de Shopping Centers SA | 79,500 | | 1,580,506 |
TOTAL BRAZIL | | 3,374,627 |
Cayman Islands - 4.1% |
Agile Property Holdings Ltd. | 4,135,000 | | 5,387,345 |
Central China Real Estate Ltd. | 3,803,000 | | 979,208 |
IFM Investments Ltd. ADR (a) | 23,300 | | 131,645 |
KWG Property Holding Ltd. | 7,210,500 | | 5,337,673 |
SOHO China Ltd. | 2,668,500 | | 1,645,589 |
TOTAL CAYMAN ISLANDS | | 13,481,460 |
China - 2.1% |
China Resources Land Ltd. | 3,297,000 | | 6,995,116 |
Finland - 0.8% |
Citycon Oyj | 823,403 | | 2,822,469 |
France - 7.2% |
Societe de la Tour Eiffel | 31,000 | | 2,103,020 |
Unibail-Rodamco | 111,077 | | 21,918,512 |
TOTAL FRANCE | | 24,021,532 |
Germany - 1.0% |
alstria office REIT-AG | 129,465 | | 1,498,395 |
DIC Asset AG | 148,900 | | 1,214,871 |
IVG Immobilien AG (a) | 102,600 | | 712,346 |
TOTAL GERMANY | | 3,425,612 |
Common Stocks - continued |
| Shares | | Value |
Greece - 0.1% |
Babis Vovos International Technical SA (a) | 104,074 | | $ 389,301 |
Hong Kong - 23.6% |
Hang Lung Properties Ltd. | 2,241,000 | | 9,347,718 |
Henderson Land Development Co. Ltd. | 884,000 | | 5,502,594 |
Hongkong Land Holdings Ltd. | 994,000 | | 5,327,840 |
Kerry Properties Ltd. | 1,669,500 | | 8,414,667 |
New World Development Co. Ltd. | 3,678,000 | | 6,572,339 |
Sun Hung Kai Properties Ltd. | 1,942,000 | | 28,526,838 |
Wharf Holdings Ltd. | 2,693,000 | | 14,734,792 |
TOTAL HONG KONG | | 78,426,788 |
Italy - 1.9% |
Beni Stabili SpA (d) | 4,602,900 | | 3,806,486 |
Immobiliare Grande Distribuzione SpA | 1,605,876 | | 2,427,901 |
TOTAL ITALY | | 6,234,387 |
Japan - 17.7% |
Aeon Mall Co. Ltd. | 100,800 | | 2,209,027 |
Goldcrest Co. Ltd. | 197,070 | | 4,026,909 |
Japan Retail Fund Investment Corp. | 2,976 | | 3,832,558 |
Kenedix Realty Investment Corp. | 1,394 | | 4,577,578 |
Kenedix, Inc. (a)(d) | 18,256 | | 3,058,685 |
Mitsui Fudosan Co. Ltd. | 1,199,000 | | 17,757,825 |
Nomura Real Estate Holdings, Inc. | 284,100 | | 3,497,627 |
NTT Urban Development Co. | 2,822 | | 2,288,946 |
ORIX JREIT, Inc. | 506 | | 2,479,502 |
Park24 Co. Ltd. | 142,800 | | 1,531,682 |
Sumitomo Realty & Development Co. Ltd. | 617,000 | | 11,108,499 |
Toc Co. Ltd. | 248,300 | | 916,491 |
Tokyo Tatemono Co. Ltd. | 494,000 | | 1,611,895 |
TOTAL JAPAN | | 58,897,224 |
Netherlands - 1.5% |
Corio NV | 86,911 | | 5,099,661 |
Poland - 0.5% |
Globe Trade Centre SA (a) | 225,400 | | 1,767,584 |
Russia - 0.6% |
LSR Group OJSC GDR (Reg. S) (a) | 229,100 | | 2,084,810 |
Singapore - 10.5% |
Allgreen Properties Ltd. | 3,563,000 | | 3,065,453 |
Ascendas Real Estate Investment Trust (A-REIT) | 1,121,000 | | 1,747,570 |
CapitaLand Ltd. | 3,616,900 | | 10,532,336 |
Common Stocks - continued |
| Shares | | Value |
Singapore - continued |
City Developments Ltd. | 889,000 | | $ 7,910,067 |
Parkway Life REIT | 640,000 | | 701,228 |
Wing Tai Holdings Ltd. | 5,369,000 | | 7,106,552 |
Yanlord Land Group Ltd. | 2,785,000 | | 3,809,177 |
TOTAL SINGAPORE | | 34,872,383 |
Spain - 0.2% |
Realia Business SA (a) | 349,294 | | 662,392 |
Sweden - 2.4% |
Castellum AB | 406,200 | | 4,209,443 |
Klovern AB (d) | 395,600 | | 1,463,358 |
Wihlborgs Fastigheter AB | 104,800 | | 2,352,120 |
TOTAL SWEDEN | | 8,024,921 |
United Kingdom - 9.2% |
Big Yellow Group PLC | 796,200 | | 3,871,156 |
British Land Co. PLC | 1,194,723 | | 8,653,225 |
Capital & Counties Properties PLC (a) | 786,300 | | 1,356,556 |
Derwent London PLC | 115,200 | | 2,422,915 |
Great Portland Estates PLC | 705,054 | | 3,331,796 |
Hammerson PLC | 735,499 | | 4,480,414 |
Land Securities Group PLC | 138,373 | | 1,329,273 |
Metric Property Investments PLC (a) | 777,300 | | 1,249,595 |
Quintain Estates & Development PLC (a) | 737,200 | | 453,818 |
Songbird Estates PLC Class B (a) | 17,975 | | 42,288 |
St. Modwen Properties PLC | 1,251,100 | | 3,410,347 |
TOTAL UNITED KINGDOM | | 30,601,383 |
TOTAL COMMON STOCKS (Cost $362,739,810) | 331,608,960 |
Money Market Funds - 1.5% |
| Shares | | Value |
Fidelity Cash Central Fund, 0.24% (b) | 3,490,245 | | $ 3,490,245 |
Fidelity Securities Lending Cash Central Fund, 0.27% (b)(c) | 1,444,564 | | 1,444,564 |
TOTAL MONEY MARKET FUNDS (Cost $4,934,809) | 4,934,809 |
TOTAL INVESTMENT PORTFOLIO - 101.0% (Cost $367,674,619) | | 336,543,769 |
NET OTHER ASSETS (LIABILITIES) - (1.0)% | | (3,496,038) |
NET ASSETS - 100% | $ 333,047,731 |
Legend |
(a) Non-income producing |
(b) Affiliated fund that is available only to investment companies and other accounts managed by Fidelity Investments. The rate quoted is the annualized seven-day yield of the fund at period end. A complete unaudited listing of the fund's holdings as of its most recent quarter end is available upon request. |
(c) Investment made with cash collateral received from securities on loan. |
(d) Security or a portion of the security is on loan at period end. |
Affiliated Central Funds |
Information regarding fiscal year to date income earned by the Fund from investments in Fidelity Central Funds is as follows: |
Fund | Income earned |
Fidelity Cash Central Fund | $ 13,216 |
Fidelity Securities Lending Cash Central Fund | 109,121 |
Total | $ 122,337 |
Other Information |
All investments are categorized as Level 1 under the Fair Value Hierarchy. The inputs or methodology used for valuing securities may not be an indication of the risk associated with investing in those securities. For more information on valuation inputs, please refer to the Security Valuation section in the accompanying Notes to Financial Statements. |
Income Tax Information |
At July 31, 2010, the Fund had a capital loss carryforward of approximately $296,042,629 of which $159,443,097 and $136,599,532 will expire on July 31, 2017 and 2018, respectively. Capital loss carryforwards are only available to offset future capital gains of the Fund to the extent provided by regulations and may be limited. |
The Fund intends to elect to defer to its fiscal year ending July 31, 2011 approximately $17,770,782 of losses recognized during the period November 1, 2009 to July 31, 2010. |
See accompanying notes which are an integral part of the financial statements.
Annual Report
Statement of Assets and Liabilities
| July 31, 2010 |
| | |
Assets | | |
Investment in securities, at value (including securities loaned of $1,365,388) - See accompanying schedule: Unaffiliated issuers (cost $362,739,810) | $ 331,608,960 | |
Fidelity Central Funds (cost $4,934,809) | 4,934,809 | |
Total Investments (cost $367,674,619) | | $ 336,543,769 |
Cash | | 413,491 |
Foreign currency held at value (cost $51,029) | | 51,029 |
Receivable for investments sold | | 3,340,186 |
Receivable for fund shares sold | | 247,448 |
Dividends receivable | | 1,238,333 |
Distributions receivable from Fidelity Central Funds | | 7,202 |
Other receivables | | 90,653 |
Total assets | | 341,932,111 |
| | |
Liabilities | | |
Payable for investments purchased | $ 6,691,428 | |
Payable for fund shares redeemed | 344,790 | |
Accrued management fee | 190,477 | |
Distribution fees payable | 5,552 | |
Other affiliated payables | 91,610 | |
Other payables and accrued expenses | 115,959 | |
Collateral on securities loaned, at value | 1,444,564 | |
Total liabilities | | 8,884,380 |
| | |
Net Assets | | $ 333,047,731 |
Net Assets consist of: | | |
Paid in capital | | $ 673,949,184 |
Undistributed net investment income | | 4,719,742 |
Accumulated undistributed net realized gain (loss) on investments and foreign currency transactions | | (314,475,883) |
Net unrealized appreciation (depreciation) on investments and assets and liabilities in foreign currencies | | (31,145,312) |
Net Assets | | $ 333,047,731 |
See accompanying notes which are an integral part of the financial statements.
Annual Report
Financial Statements - continued
Statement of Assets and Liabilities - continued
| July 31, 2010 |
| | |
Calculation of Maximum Offering Price Class A:
Net Asset Value and redemption price per share ($7,249,830 ÷ 857,301 shares) | | $ 8.46 |
| | |
Maximum offering price per share (100/94.25 of $8.46) | | $ 8.98 |
Class T:
Net Asset Value and redemption price per share ($2,509,693 ÷ 298,568 shares) | | $ 8.41 |
| | |
Maximum offering price per share (100/96.50 of $8.41) | | $ 8.72 |
Class B:
Net Asset Value and offering price per share ($629,375 ÷ 75,682 shares)A | | $ 8.32 |
| | |
Class C:
Net Asset Value and offering price per share ($3,201,487 ÷ 385,566 shares)A | | $ 8.30 |
| | |
International Real Estate:
Net Asset Value, offering price and redemption price per share ($318,032,094 ÷ 37,293,275 shares) | | $ 8.53 |
| | |
Institutional Class:
Net Asset Value, offering price and redemption price per share ($1,425,252 ÷ 167,467 shares) | | $ 8.51 |
A Redemption price per share is equal to net asset value less any applicable contingent deferred sales charge.
See accompanying notes which are an integral part of the financial statements.
Annual Report
Statement of Operations
| Year ended July 31, 2010 |
| | |
Investment Income | | |
Dividends | | $ 12,489,573 |
Interest | | 54 |
Income from Fidelity Central Funds | | 122,337 |
Income before foreign taxes withheld | | 12,611,964 |
Less foreign taxes withheld | | (557,267) |
Total income | | 12,054,697 |
| | |
Expenses | | |
Management fee | $ 2,510,053 | |
Transfer agent fees | 1,144,482 | |
Distribution fees | 65,699 | |
Accounting and security lending fees | 184,993 | |
Custodian fees and expenses | 192,213 | |
Independent trustees' compensation | 2,059 | |
Registration fees | 82,990 | |
Audit | 71,231 | |
Legal | 1,306 | |
Miscellaneous | 6,202 | |
Total expenses before reductions | 4,261,228 | |
Expense reductions | (162,042) | 4,099,186 |
Net investment income (loss) | | 7,955,511 |
Realized and Unrealized Gain (Loss) Net realized gain (loss) on: | | |
Investment securities: | | |
Unaffiliated issuers (net of foreign taxes of $36,571) | 376,370 | |
Foreign currency transactions | (28,299) | |
Total net realized gain (loss) | | 348,071 |
Change in net unrealized appreciation (depreciation) on: Investment securities (net of decrease in deferred foreign taxes of $15,863) | 9,586,175 | |
Assets and liabilities in foreign currencies | (21,167) | |
Total change in net unrealized appreciation (depreciation) | | 9,565,008 |
Net gain (loss) | | 9,913,079 |
Net increase (decrease) in net assets resulting from operations | | $ 17,868,590 |
See accompanying notes which are an integral part of the financial statements.
Annual Report
Financial Statements - continued
Statement of Changes in Net Assets
| Year ended
July 31,
2010 | Year ended
July 31,
2009 |
Increase (Decrease) in Net Assets | | |
Operations | | |
Net investment income (loss) | $ 7,955,511 | $ 9,003,508 |
Net realized gain (loss) | 348,071 | (205,492,245) |
Change in net unrealized appreciation (depreciation) | 9,565,008 | 43,065,853 |
Net increase (decrease) in net assets resulting
from operations | 17,868,590 | (153,422,884) |
Distributions to shareholders from net investment income | (3,235,770) | - |
Distributions to shareholders from net realized gain | (5,017,915) | - |
Total distributions | (8,253,685) | - |
Share transactions - net increase (decrease) | (26,300,777) | (95,264,955) |
Redemption fees | 80,485 | 117,919 |
Total increase (decrease) in net assets | (16,605,387) | (248,569,920) |
| | |
Net Assets | | |
Beginning of period | 349,653,118 | 598,223,038 |
End of period (including undistributed net investment income of $4,719,742 and $0, respectively) | $ 333,047,731 | $ 349,653,118 |
See accompanying notes which are an integral part of the financial statements.
Annual Report
Financial Highlights - Class A
Years ended July 31, | 2010 | 2009 | 2008 | 2007 H |
Selected Per-Share Data | | | | |
Net asset value, beginning of period | $ 8.24 | $ 10.63 | $ 15.71 | $ 17.46 |
Income from Investment Operations | | | | |
Net investment income (loss) E | .17 | .18 | .20 | .11 |
Net realized and unrealized gain (loss) | .24 | (2.57) | (3.48) | (1.87) |
Total from investment operations | .41 | (2.39) | (3.28) | (1.76) |
Distributions from net investment income | (.07) | - | (.31) | - |
Distributions from net realized gain | (.12) | - | (1.50) | - |
Total distributions | (.19) | - | (1.81) | - |
Redemption fees added to paid in capital E | - J | - J | .01 | .01 |
Net asset value, end of period | $ 8.46 | $ 8.24 | $ 10.63 | $ 15.71 |
Total Return B, C, D | 4.97% | (22.48)% | (23.20)% | (10.02)% |
Ratios to Average Net Assets F, I | | | | |
Expenses before reductions | 1.44% | 1.45% | 1.38% | 1.37% A |
Expenses net of fee waivers, if any | 1.44% | 1.45% | 1.38% | 1.37% A |
Expenses net of all reductions | 1.39% | 1.42% | 1.35% | 1.26% A |
Net investment income (loss) | 2.02% | 2.55% | 1.58% | 2.08% A |
Supplemental Data | | | | |
Net assets, end of period (000 omitted) | $ 7,250 | $ 6,745 | $ 9,976 | $ 5,087 |
Portfolio turnover rate G | 95% | 55% | 63% | 144% |
A Annualized
B Total returns for periods of less than one year are not annualized.
C Total returns would have been lower had certain expenses not been reduced during the periods shown.
D Total returns do not include the effect of the sales charges.
E Calculated based on average shares outstanding during the period.
F Fees and expenses of the underlying Fidelity Central Funds are not included in the Fund's expense ratio. The Fund indirectly bears its proportionate share of the expenses of any underlying Fidelity Central Funds.
G Amount does not include the portfolio activity of any underlying Fidelity Central Funds.
H For the period April 4, 2007 (commencement of sale of shares) to July 31, 2007.
I Expense ratios reflect operating expenses of the class. Expenses before reductions do not reflect amounts reimbursed by the investment adviser or reductions from brokerage service arrangements or reductions from other expense offset arrangements and do not represent the amount paid by the class during periods when reimbursements or reductions occur. Expense ratios before reductions for start-up periods may not be representative of longer-term operating periods. Expenses net of fee waivers reflect expenses after reimbursement by the investment adviser but prior to reductions from brokerage service arrangements or other expense offset arrangements. Expenses net of all reductions represent the net expenses paid by the class.
J Amount represents less than $.01 per share.
See accompanying notes which are an integral part of the financial statements.
Annual Report
Financial Highlights - Class T
Years ended July 31, | 2010 | 2009 | 2008 | 2007 H |
Selected Per-Share Data | | | | |
Net asset value, beginning of period | $ 8.21 | $ 10.62 | $ 15.70 | $ 17.46 |
Income from Investment Operations | | | | |
Net investment income (loss) E | .15 | .17 | .17 | .10 |
Net realized and unrealized gain (loss) | .23 | (2.58) | (3.48) | (1.87) |
Total from investment operations | .38 | (2.41) | (3.31) | (1.77) |
Distributions from net investment income | (.06) | - | (.28) | - |
Distributions from net realized gain | (.12) | - | (1.50) | - |
Total distributions | (.18) | - | (1.78) | - |
Redemption fees added to paid in capital E | - J | - J | .01 | .01 |
Net asset value, end of period | $ 8.41 | $ 8.21 | $ 10.62 | $ 15.70 |
Total Return B, C, D | 4.68% | (22.69)% | (23.39)% | (10.08)% |
Ratios to Average Net Assets F, I | | | | |
Expenses before reductions | 1.70% | 1.71% | 1.64% | 1.61% A |
Expenses net of fee waivers, if any | 1.70% | 1.71% | 1.64% | 1.61% A |
Expenses net of all reductions | 1.65% | 1.68% | 1.60% | 1.51% A |
Net investment income (loss) | 1.75% | 2.29% | 1.32% | 1.90% A |
Supplemental Data | | | | |
Net assets, end of period (000 omitted) | $ 2,510 | $ 2,080 | $ 7,566 | $ 2,398 |
Portfolio turnover rate G | 95% | 55% | 63% | 144% |
A Annualized
B Total returns for periods of less than one year are not annualized.
C Total returns would have been lower had certain expenses not been reduced during the periods shown.
D Total returns do not include the effect of the sales charges.
E Calculated based on average shares outstanding during the period.
F Fees and expenses of the underlying Fidelity Central Funds are not included in the Fund's expense ratio. The Fund indirectly bears its proportionate share of the expenses of any underlying Fidelity Central Funds.
G Amount does not include the portfolio activity of any underlying Fidelity Central Funds.
H For the period April 4, 2007 (commencement of sale of shares) to July 31, 2007.
I Expense ratios reflect operating expenses of the class. Expenses before reductions do not reflect amounts reimbursed by the investment adviser or reductions from brokerage service arrangements or reductions from other expense offset arrangements and do not represent the amount paid by the class during periods when reimbursements or reductions occur. Expense ratios before reductions for start-up periods may not be representative of longer-term operating periods. Expenses net of fee waivers reflect expenses after reimbursement by the investment adviser but prior to reductions from brokerage service arrangements or other expense offset arrangements. Expenses net of all reductions represent the net expenses paid by the class.
J Amount represents less than $.01 per share.
See accompanying notes which are an integral part of the financial statements.
Annual Report
Financial Highlights - Class B
Years ended July 31, | 2010 | 2009 | 2008 | 2007 H |
Selected Per-Share Data | | | | |
Net asset value, beginning of period | $ 8.14 | $ 10.58 | $ 15.67 | $ 17.46 |
Income from Investment Operations | | | | |
Net investment income (loss) E | .11 | .13 | .11 | .07 |
Net realized and unrealized gain (loss) | .23 | (2.57) | (3.48) | (1.87) |
Total from investment operations | .34 | (2.44) | (3.37) | (1.80) |
Distributions from net investment income | (.04) | - | (.23) | - |
Distributions from net realized gain | (.12) | - | (1.50) | - |
Total distributions | (.16) | - | (1.73) | - |
Redemption fees added to paid in capital E | - J | - J | .01 | .01 |
Net asset value, end of period | $ 8.32 | $ 8.14 | $ 10.58 | $ 15.67 |
Total Return B, C, D | 4.20% | (23.06)% | (23.80)% | (10.25)% |
Ratios to Average Net Assets F, I | | | | |
Expenses before reductions | 2.19% | 2.19% | 2.14% | 2.11% A |
Expenses net of fee waivers, if any | 2.19% | 2.19% | 2.14% | 2.11% A |
Expenses net of all reductions | 2.14% | 2.17% | 2.11% | 2.01% A |
Net investment income (loss) | 1.26% | 1.81% | .82% | 1.38% A |
Supplemental Data | | | | |
Net assets, end of period (000 omitted) | $ 629 | $ 606 | $ 930 | $ 1,158 |
Portfolio turnover rate G | 95% | 55% | 63% | 144% |
A Annualized
B Total returns for periods of less than one year are not annualized.
C Total returns would have been lower had certain expenses not been reduced during the periods shown.
D Total returns do not include the effect of the contingent deferred sales charge.
E Calculated based on average shares outstanding during the period.
F Fees and expenses of the underlying Fidelity Central Funds are not included in the Fund's expense ratio. The Fund indirectly bears its proportionate share of the expenses of any underlying Fidelity Central Funds.
G Amount does not include the portfolio activity of any underlying Fidelity Central Funds.
H For the period April 4, 2007 (commencement of sale of shares) to July 31, 2007.
I Expense ratios reflect operating expenses of the class. Expenses before reductions do not reflect amounts reimbursed by the investment adviser or reductions from brokerage service arrangements or reductions from other expense offset arrangements and do not represent the amount paid by the class during periods when reimbursements or reductions occur. Expense ratios before reductions for start-up periods may not be representative of longer-term operating periods. Expenses net of fee waivers reflect expenses after reimbursement by the investment adviser but prior to reductions from brokerage service arrangements or other expense offset arrangements. Expenses net of all reductions represent the net expenses paid by the class.
J Amount represents less than $.01 per share.
See accompanying notes which are an integral part of the financial statements.
Annual Report
Financial Highlights - Class C
Years ended July 31, | 2010 | 2009 | 2008 | 2007 H |
Selected Per-Share Data | | | | |
Net asset value, beginning of period | $ 8.13 | $ 10.57 | $ 15.67 | $ 17.46 |
Income from Investment Operations | | | | |
Net investment income (loss) E | .11 | .13 | .11 | .07 |
Net realized and unrealized gain (loss) | .22 | (2.57) | (3.48) | (1.87) |
Total from investment operations | .33 | (2.44) | (3.37) | (1.80) |
Distributions from net investment income | (.04) | - | (.24) | - |
Distributions from net realized gain | (.12) | - | (1.50) | - |
Total distributions | (.16) | - | (1.74) | - |
Redemption fees added to paid in capital E | - J | - J | .01 | .01 |
Net asset value, end of period | $ 8.30 | $ 8.13 | $ 10.57 | $ 15.67 |
Total Return B, C, D | 4.10% | (23.08)% | (23.78)% | (10.25)% |
Ratios to Average Net Assets F, I | | | | |
Expenses before reductions | 2.18% | 2.19% | 2.14% | 2.10% A |
Expenses net of fee waivers, if any | 2.18% | 2.19% | 2.14% | 2.10% A |
Expenses net of all reductions | 2.14% | 2.17% | 2.11% | 2.00% A |
Net investment income (loss) | 1.27% | 1.81% | .82% | 1.35% A |
Supplemental Data | | | | |
Net assets, end of period (000 omitted) | $ 3,201 | $ 2,496 | $ 3,477 | $ 2,629 |
Portfolio turnover rate G | 95% | 55% | 63% | 144% |
A Annualized
B Total returns for periods of less than one year are not annualized.
C Total returns would have been lower had certain expenses not been reduced during the periods shown.
D Total returns do not include the effect of the contingent deferred sales charge.
E Calculated based on average shares outstanding during the period.
F Fees and expenses of the underlying Fidelity Central Funds are not included in the Fund's expense ratio. The Fund indirectly bears its proportionate share of the expenses of any underlying Fidelity Central Funds.
G Amount does not include the portfolio activity of any underlying Fidelity Central Funds.
H For the period April 4, 2007 (commencement of sale of shares) to July 31, 2007.
I Expense ratios reflect operating expenses of the class. Expenses before reductions do not reflect amounts reimbursed by the investment adviser or reductions from brokerage service arrangements or reductions from other expense offset arrangements and do not represent the amount paid by the class during periods when reimbursements or reductions occur. Expense ratios before reductions for start-up periods may not be representative of longer-term operating periods. Expenses net of fee waivers reflect expenses after reimbursement by the investment adviser but prior to reductions from brokerage service arrangements or other expense offset arrangements. Expenses net of all reductions represent the net expenses paid by the class.
J Amount represents less than $.01 per share.
See accompanying notes which are an integral part of the financial statements.
Annual Report
Financial Highlights - International Real Estate
Years ended July 31, | 2010 | 2009 | 2008 | 2007 | 2006 |
Selected Per-Share Data | | | | | |
Net asset value, beginning of period | $ 8.29 | $ 10.68 | $ 15.73 | $ 14.69 | $ 12.09 |
Income from Investment Operations | | | | | |
Net investment income (loss) B | .19 | .20 | .25 | .31 | .30 |
Net realized and unrealized gain (loss) | .25 | (2.59) | (3.50) | 2.35 | 2.93 |
Total from investment operations | .44 | (2.39) | (3.25) | 2.66 | 3.23 |
Distributions from net investment income | (.08) | - | (.31) | (.22) | (.24) |
Distributions from net realized gain | (.12) | - | (1.50) | (1.42) | (.40) |
Total distributions | (.20) | - | (1.81) | (1.64) | (.64) |
Redemption fees added to paid in capital B | - F | - F | .01 | .02 | .01 |
Net asset value, end of period | $ 8.53 | $ 8.29 | $ 10.68 | $ 15.73 | $ 14.69 |
Total Return A | 5.29% | (22.38)% | (22.97)% | 19.01% | 27.85% |
Ratios to Average Net Assets C, E | | | | |
Expenses before reductions | 1.19% | 1.19% | 1.11% | 1.07% | 1.12% |
Expenses net of fee waivers, if any | 1.19% | 1.19% | 1.10% | 1.06% | 1.12% |
Expenses net of all reductions | 1.14% | 1.16% | 1.07% | .96% | .91% |
Net investment income (loss) | 2.27% | 2.81% | 1.86% | 1.86% | 2.23% |
Supplemental Data | | | | | |
Net assets, end of period (000 omitted) | $ 318,032 | $ 336,126 | $ 572,985 | $ 1,032,138 | $ 447,854 |
Portfolio turnover rate D | 95% | 55% | 63% | 144% | 234% |
A Total returns would have been lower had certain expenses not been reduced during the periods shown.
B Calculated based on average shares outstanding during the period.
C Fees and expenses of the underlying Fidelity Central Funds are not included in the Fund's expense ratio. The Fund indirectly bears its proportionate share of the expenses of any underlying Fidelity Central Funds.
D Amount does not include the portfolio activity of any underlying Fidelity Central Funds.
E Expense ratios reflect operating expenses of the class. Expenses before reductions do not reflect amounts reimbursed by the investment adviser or reductions from brokerage service arrangements or reductions from other expense offset arrangements and do not represent the amount paid by the class during periods when reimbursements or reductions occur. Expenses net of fee waivers reflect expenses after reimbursement by the investment adviser but prior to reductions from brokerage service arrangements or other expense offset arrangements. Expenses net of all reductions represent the net expenses paid by the class.
F Amount represents less than $.01 per share.
See accompanying notes which are an integral part of the financial statements.
Annual Report
Financial Highlights - Institutional Class
Years ended July 31, | 2010 | 2009 | 2008 | 2007 G |
Selected Per-Share Data | | | | |
Net asset value, beginning of period | $ 8.28 | $ 10.66 | $ 15.73 | $ 17.46 |
Income from Investment Operations | | | | |
Net investment income (loss) D | .19 | .20 | .24 | .12 |
Net realized and unrealized gain (loss) | .24 | (2.58) | (3.49) | (1.86) |
Total from investment operations | .43 | (2.38) | (3.25) | (1.74) |
Distributions from net investment income | (.08) | - | (.33) | - |
Distributions from net realized gain | (.12) | - | (1.50) | - |
Total distributions | (.20) | - | (1.83) | - |
Redemption fees added to paid in capital D | - I | - I | .01 | .01 |
Net asset value, end of period | $ 8.51 | $ 8.28 | $ 10.66 | $ 15.73 |
Total Return B, C | 5.18% | (22.33)% | (22.98)% | (9.91)% |
Ratios to Average Net Assets E, H | | | | |
Expenses before reductions | 1.18% | 1.19% | 1.13% | 1.08% A |
Expenses net of fee waivers, if any | 1.18% | 1.19% | 1.13% | 1.08% A |
Expenses net of all reductions | 1.14% | 1.17% | 1.10% | .97% A |
Net investment income (loss) | 2.27% | 2.81% | 1.83% | 2.27% A |
Supplemental Data | | | | |
Net assets, end of period (000 omitted) | $ 1,425 | $ 1,600 | $ 3,289 | $ 2,477 |
Portfolio turnover rate F | 95% | 55% | 63% | 144% |
A Annualized
B Total returns for periods of less than one year are not annualized.
C Total returns would have been lower had certain expenses not been reduced during the periods shown.
D Calculated based on average shares outstanding during the period.
E Fees and expenses of the underlying Fidelity Central Funds are not included in the Fund's expense ratio. The Fund indirectly bears its proportionate share of the expenses of any underlying Fidelity Central Funds.
F Amount does not include the portfolio activity of any underlying Fidelity Central Funds.
G For the period April 4, 2007 (commencement of sale of shares) to July 31, 2007.
H Expense ratios reflect operating expenses of the class. Expenses before reductions do not reflect amounts reimbursed by the investment adviser or reductions from brokerage service arrangements or reductions from other expense offset arrangements and do not represent the amount paid by the class during periods when reimbursements or reductions occur. Expense ratios before reductions for start-up periods may not be representative of longer-term operating periods. Expenses net of fee waivers reflect expenses after reimbursement by the investment adviser but prior to reductions from brokerage service arrangements or other expense offset arrangements. Expenses net of all reductions represent the net expenses paid by the class.
I Amount represents less than $.01 per share.
See accompanying notes which are an integral part of the financial statements.
Annual Report
Notes to Financial Statements
For the period ended July 31, 2010
1. Organization.
Fidelity International Real Estate Fund (the Fund) is a non-diversified fund of Fidelity Securities Fund (the Trust) and is authorized to issue an unlimited number of shares. The Trust is registered under the Investment Company Act of 1940, as amended (the 1940 Act), as an open-end management investment company organized as a Massachusetts business trust. The Fund offers Class A, Class T, Class B, Class C, International Real Estate, and Institutional Class shares, each of which has equal rights as to assets and voting privileges. Effective after the close of business on September 1, 2010, Class B shares will be closed to new accounts and additional purchases by existing shareholders. Each class has exclusive voting rights with respect to matters that affect that class. Class B shares will automatically convert to Class A shares after a holding period of seven years from the initial date of purchase. Investment income, realized and unrealized capital gains and losses, the common expenses of the Fund, and certain fund-level expense reductions, if any, are allocated on a pro-rata basis to each class based on the relative net assets of each class to the total net assets of the Fund. Each class differs with respect to transfer agent and distribution and service plan fees incurred. Certain expense reductions also differ by class. The Fund's investments in emerging markets can be subject to social, economic, regulatory, and political uncertainties and can be extremely volatile.
2. Investments in Fidelity Central Funds.
The Fund may invest in Fidelity Central Funds, which are open-end investment companies available only to other investment companies and accounts managed by Fidelity Management & Research Company (FMR) and its affiliates. The Fund's Schedule of Investments lists each of the Fidelity Central Funds held as of period end, if any, as an investment of the Fund, but does not include the underlying holdings of each Fidelity Central Fund. As an Investing Fund, the Fund indirectly bears its proportionate share of the expenses of the underlying Fidelity Central Funds.
The Money Market Central Funds seek preservation of capital and current income and are managed by Fidelity Investments Money Management, Inc. (FIMM), an affiliate of FMR.
A complete unaudited list of holdings for each Fidelity Central Fund is available upon request or at the Securities and Exchange Commission (the SEC) web site at www.sec.gov. In addition, the financial statements of the Fidelity Central Funds which are not covered by the Fund's Report of Independent Registered Public Accounting Firm, are available on the SEC web site or upon request.
Annual Report
Notes to Financial Statements - continued
3. Significant Accounting Policies.
The financial statements have been prepared in conformity with accounting principles generally accepted in the United States of America (GAAP), which require management to make certain estimates and assumptions at the date of the financial statements. Actual results could differ from those estimates. The following summarizes the significant accounting policies of the Fund:
Security Valuation. Investments are valued as of 4:00 p.m. Eastern time on the last calendar day of the period. The Fund uses independent pricing services approved by the Board of Trustees to value its investments. When current market prices or quotations are not readily available or reliable, valuations may be determined in good faith in accordance with procedures adopted by the Board of Trustees. Factors used in determining value may include market or security specific events. The frequency with which these procedures are used cannot be predicted and they may be utilized to a significant extent. The value used for net asset value (NAV) calculation under these procedures may differ from published prices for the same securities.
The Fund categorizes the inputs to valuation techniques used to value its investments into a disclosure hierarchy consisting of three levels as shown below.
Level 1 - quoted prices in active markets for identical investments
Level 2 - other significant observable inputs (including quoted prices for similar investments, interest rates, prepayment speeds, etc.)
Level 3 - unobservable inputs (including the fund's own assumptions based on the best information available)
Changes in valuation techniques may result in transfers in or out of an assigned level within the disclosure hierarchy. Valuation techniques used to value the Fund's investments by major category are as follows.
Equity securities, including restricted securities, for which market quotations are readily available, are valued at the last reported sale price or official closing price as reported by an independent pricing service on the primary market or exchange on which they are traded and are categorized as Level 1 in the hierarchy. In the event there were no sales during the day or closing prices are not available, securities are valued at the last quoted bid price or may be valued using the last available price and are generally categorized as Level 2 in the hierarchy. For foreign equity securities, when significant market or security specific events arise, comparisons to the valuation of American Depositary Receipts (ADRs), futures contracts, Exchange-traded funds (ETFs) and certain indexes as well as quoted prices for similar securities are used and are categorized as Level 2 in the hierarchy in these circumstances. Utilizing these techniques may result in transfers between Level 1 and Level 2. For restricted equity securities and private placements where
Annual Report
3. Significant Accounting Policies - continued
Security Valuation - continued
observable inputs are limited, assumptions about market activity and risk are used and are categorized as Level 3 in the hierarchy.
Investments in open-end mutual funds, including the Fidelity Central Funds, are valued at their closing net asset value each business day and are categorized as Level 1 in the hierarchy. Short-term securities with remaining maturities of sixty days or less for which quotations are not readily available are valued at amortized cost, which approximates fair value and are categorized as Level 2 in the hierarchy.
Foreign Currency. The Fund uses foreign currency contracts to facilitate transactions in foreign-denominated securities. Gains and losses from these transactions may arise from changes in the value of the foreign currency or if the counterparties do not perform under the contracts' terms.
Foreign-denominated assets, including investment securities, and liabilities are translated into U.S. dollars at the exchange rate at period end. Purchases and sales of investment securities, income and dividends received and expenses denominated in foreign currencies are translated into U.S. dollars at the exchange rate in effect on the transaction date.
The effects of exchange rate fluctuations on investments are included with the net realized and unrealized gain (loss) on investment securities. Other foreign currency transactions resulting in realized and unrealized gain (loss) are disclosed separately.
Investment Transactions and Income. For financial reporting purposes, the Fund's investment holdings and NAV include trades executed through the end of the last business day of the period. The NAV per share for processing shareholder transactions is calculated as of the close of business of the New York Stock Exchange (NYSE), normally 4:00 p.m. Eastern time and includes trades executed through the end of the prior business day. Gains and losses on securities sold are determined on the basis of identified cost and may include proceeds received from litigation. Dividend income is recorded on the ex-dividend date, except for certain dividends from foreign securities where the ex-dividend date may have passed, which are recorded as soon as the Fund is informed of the ex-dividend date. Non-cash dividends included in dividend income, if any, are recorded at the fair market value of the securities received. Distributions received on securities that represent a return of capital or capital gain are recorded as a reduction of cost of investments and/or as a realized gain. The Fund estimates the components of distributions received that may be considered return of capital distributions or capital gain distributions. Interest income and distributions from the Fidelity Central Funds are accrued as earned. Interest income includes coupon interest and amortization of
Annual Report
Notes to Financial Statements - continued
3. Significant Accounting Policies - continued
Investment Transactions and Income - continued
premium and accretion of discount on debt securities. Investment income is recorded net of foreign taxes withheld where recovery of such taxes is uncertain.
Expenses. Most expenses of the Trust can be directly attributed to a fund. Expenses which cannot be directly attributed are apportioned amongst each fund in the Trust. Expense estimates are accrued in the period to which they relate and adjustments are made when actual amounts are known.
Income Tax Information and Distributions to Shareholders. Each year the Fund intends to qualify as a regulated investment company, including distributing substantially all of its taxable income and realized gains under Subchapter M of the Internal Revenue Code and filing its U.S. federal tax return. As a result, no provision for income taxes is required. As of July 31, 2010, the Fund did not have any unrecognized tax benefits in the accompanying financial statements. A fund's federal tax return is subject to examination by the Internal Revenue Service (IRS) for a period of three years. Foreign taxes are provided for based on the Fund's understanding of the tax rules and rates that exist in the foreign markets in which it invests.
Distributions are recorded on the ex-dividend date. Income dividends and capital gain distributions are declared separately for each class. Income and capital gain distributions are determined in accordance with income tax regulations, which may differ from GAAP.
Capital accounts within the financial statements are adjusted for permanent book-tax differences. These adjustments have no impact on net assets or the results of operations. Temporary book-tax differences will reverse in a subsequent period.
Book-tax differences are primarily due to the short-term gain distributions from the Fidelity Central Funds, foreign currency transactions, certain foreign taxes, passive foreign investment companies (PFIC), capital loss carryforwards and losses deferred due to wash sales and excise tax regulations.
The federal tax cost of investment securities and unrealized appreciation (depreciation) as of period end were as follows:
Gross unrealized appreciation | $ 15,966,603 |
Gross unrealized depreciation | (53,722,570) |
Net unrealized appreciation (depreciation) | $ (37,755,967) |
| |
Tax Cost | $ 374,299,736 |
Annual Report
3. Significant Accounting Policies - continued
Income Tax Information and Distributions to Shareholders - continued
The tax-based components of distributable earnings as of period end were as follows:
Undistributed ordinary income | $ 10,682,386 |
Capital loss carryforward | $ (296,042,629) |
Net unrealized appreciation (depreciation) | $ (37,770,429) |
The tax character of distributions paid was as follows:
| July 31, 2010 | July 31, 2009 |
Ordinary Income | $ 8,253,685 | $ - |
Short-Term Trading (Redemption) Fees. Shares held in the Fund less than 90 days are subject to a redemption fee equal to 1.50% of the proceeds of the redeemed shares. All redemption fees, including any estimated redemption fees paid by FMR, are retained by the Fund and accounted for as an addition to paid in capital.
4. Purchases and Sales of Investments.
Purchases and sales of securities, other than short-term securities, aggregated $325,000,207 and $341,062,548, respectively.
5. Fees and Other Transactions with Affiliates.
Management Fee. FMR and its affiliates provide the Fund with investment management related services for which the Fund pays a monthly management fee. The management fee is the sum of an individual fund fee rate that is based on an annual rate of .45% of the Fund's average net assets and a group fee rate that averaged .26% during the period. The group fee rate is based upon the average net assets of all the mutual funds advised by FMR. The group fee rate decreases as assets under management increase and increases as assets under management decrease. For the period, the total annual management fee rate was .71% of the Fund's average net assets.
Annual Report
Notes to Financial Statements - continued
5. Fees and Other Transactions with Affiliates - continued
Distribution and Service Plan. In accordance with Rule 12b-1 of the 1940 Act, the Fund has adopted separate Distribution and Service Plans for each class of shares. Certain classes pay Fidelity Distributors Corporation (FDC), an affiliate of FMR, separate Distribution and Service Fees, each of which is based on an annual percentage of each class' average net assets. In addition, FDC may pay financial intermediaries for selling shares of the Fund and providing shareholder support services. For the period, the Distribution and Service Fee rates and the total amounts paid to and retained by FDC were as follows:
| Distribution
Fee | Service
Fee | Paid to
FDC | Retained
by FDC |
Class A | -% | .25% | $ 18,350 | $ 84 |
Class T | .25% | .25% | 12,516 | - |
Class B | .75% | .25% | 6,499 | 4,878 |
Class C | .75% | .25% | 28,334 | 5,047 |
| | | $ 65,699 | $ 10,009 |
Sales Load. FDC receives a front-end sales charge of up to 5.75% for selling Class A shares, and 3.50% for selling Class T shares, some of which is paid to financial intermediaries for selling shares of the Fund. FDC receives the proceeds of contingent deferred sales charges levied on Class A, Class T, Class B, and Class C redemptions. These charges depend on the holding period. The deferred sales charges range from 5% to 1% for Class B, 1% for Class C, 1.00% for certain purchases of Class A (1.00% to .50% prior to July 12, 2010) shares and .25% for certain purchases of Class T shares.
For the period, sales charge amounts retained by FDC were as follows:
| Retained
by FDC |
Class A | $ 5,334 |
Class T | 1,005 |
Class B* | 1,954 |
Class C* | 226 |
| $ 8,519 |
* When Class B and Class C shares are initially sold, FDC pays commissions from its own resources to financial intermediaries through which the sales are made.
Transfer Agent Fees. Fidelity Investments Institutional Operations Company, Inc. (FIIOC), an affiliate of FMR, is the transfer, dividend disbursing and shareholder servicing agent for each class of the Fund. FIIOC receives account fees and asset-based fees that vary according to the account size and type of account of the shareholders of the
Annual Report
5. Fees and Other Transactions with Affiliates - continued
Transfer Agent Fees - continued
respective classes of the Fund. FIIOC pays for typesetting, printing and mailing of shareholder reports, except proxy statements. For the period, the total transfer agent fees paid by each class were as follows:
| Amount | % of
Average
Net Assets |
Class A | $ 23,744 | .32 |
Class T | 8,383 | .34 |
Class B | 2,112 | .32 |
Class C | 9,107 | .32 |
International Real Estate | 1,096,002 | .32 |
Institutional Class | 5,134 | .32 |
| $ 1,144,482 | |
Accounting and Security Lending Fees. Fidelity Service Company, Inc. (FSC), an affiliate of FMR, maintains the Fund's accounting records. The accounting fee is based on the level of average net assets for the month. Under a separate contract, FSC administers the security lending program. The security lending fee is based on the number and duration of lending transactions.
Brokerage Commissions. The Fund placed a portion of its portfolio transactions with brokerage firms which are affiliates of the investment adviser. The commissions paid to these affiliated firms were $27 for the period.
6. Committed Line of Credit.
The Fund participates with other funds managed by FMR in a $3.75 billion credit facility (the "line of credit") to be utilized for temporary or emergency purposes to fund shareholder redemptions or for other short-term liquidity purposes. The Fund has agreed to pay commitment fees on its pro-rata portion of the line of credit, which amounted to $1,415 and is reflected in Miscellaneous expenses on the Statement of Operations. During the period, there were no borrowings on this line of credit.
7. Security Lending.
The Fund lends portfolio securities from time to time in order to earn additional income. On the settlement date of the loan, the Fund receives collateral (in the form of U.S. Treasury obligations, letters of credit and/or cash) against the loaned securities and maintains collateral in an amount not less than 100% of the market value of the loaned securities during the period of the loan. The market value of the loaned securities is
Annual Report
Notes to Financial Statements - continued
7. Security Lending - continued
determined at the close of business of the Fund and any additional required collateral is delivered to the Fund on the next business day. If the borrower defaults on its obligation to return the securities loaned because of insolvency or other reasons, a fund could experience delays and costs in recovering the securities loaned or in gaining access to the collateral. Any cash collateral received is invested in the Fidelity Securities Lending Cash Central Fund. The value of loaned securities and cash collateral at period end are disclosed on the Fund's Statement of Assets and Liabilities. Security lending income represents the income earned on investing cash collateral, less fees and expenses associated with the loan, plus any premium payments that may be received on the loan of certain types of securities. Security lending income is presented in the Statement of Operations as a component of income from Fidelity Central Funds. Net income from lending portfolio securities during the period amounted to $109,121.
8. Expense Reductions.
Many of the brokers with whom FMR places trades on behalf of the Fund provided services to the Fund in addition to trade execution. These services included payments of certain expenses on behalf of the Fund totaling $161,983 for the period. In addition, through arrangements with the Fund's custodian, credits realized as a result of uninvested cash balances were used to reduce the Fund's expenses. During the period, these credits reduced the Fund's custody expenses by $59.
9. Distributions to Shareholders.
Distributions to shareholders of each class were as follows:
Years ended July 31, | 2010 | 2009 |
From net investment income | | |
Class A | $ 58,598 | $ - |
Class T | 19,755 | - |
Class B | 3,225 | - |
Class C | 14,423 | - |
International Real Estate | 3,124,751 | - |
Institutional Class | 15,018 | - |
Total | $ 3,235,770 | $ - |
From net realized gain | | |
Class A | $ 101,910 | $ - |
Class T | 37,040 | - |
Class B | 9,214 | - |
Class C | 39,337 | - |
International Real Estate | 4,807,309 | - |
Institutional Class | 23,105 | - |
Total | $ 5,017,915 | $ - |
Annual Report
10. Share Transactions.
Transactions for each class of shares were as follows:
| Shares | Dollars |
Years ended July 31, | 2010 | 2009 | 2010 | 2009 |
Class A | | | | |
Shares sold | 365,681 | 276,074 | $ 3,120,303 | $ 2,073,370 |
Reinvestment of distributions | 15,947 | - | 134,591 | - |
Shares redeemed | (343,205) | (395,339) | (2,901,988) | (2,671,924) |
Net increase (decrease) | 38,423 | (119,265) | $ 352,906 | $ (598,554) |
Class T | | | | |
Shares sold | 132,643 | 127,919 | $ 1,140,128 | $ 986,052 |
Reinvestment of distributions | 6,259 | - | 52,641 | - |
Shares redeemed | (93,841) | (586,866) | (767,585) | (4,132,628) |
Net increase (decrease) | 45,061 | (458,947) | $ 425,184 | $ (3,146,576) |
Class B | | | | |
Shares sold | 20,099 | 23,179 | $ 169,130 | $ 177,395 |
Reinvestment of distributions | 1,355 | - | 11,297 | - |
Shares redeemed | (20,259) | (36,555) | (169,049) | (251,823) |
Net increase (decrease) | 1,195 | (13,376) | $ 11,378 | $ (74,428) |
Class C | | | | |
Shares sold | 164,953 | 103,043 | $ 1,381,947 | $ 772,724 |
Reinvestment of distributions | 5,842 | - | 48,663 | - |
Shares redeemed | (92,347) | (124,838) | (761,918) | (872,457) |
Net increase (decrease) | 78,448 | (21,795) | $ 668,692 | $ (99,733) |
International Real Estate | | | | |
Shares sold | 9,224,310 | 11,251,723 | $ 79,406,931 | $ 83,151,001 |
Reinvestment of distributions | 875,447 | - | 7,441,303 | - |
Shares redeemed | (13,336,716) | (24,377,998) | (114,385,841) | (173,652,133) |
Net increase (decrease) | (3,236,959) | (13,126,275) | $ (27,537,607) | $ (90,501,132) |
Institutional Class | | | | |
Shares sold | 40,774 | 83,584 | $ 351,025 | $ 621,361 |
Reinvestment of distributions | 4,247 | - | 36,016 | - |
Shares redeemed | (70,819) | (198,948) | (608,371) | (1,465,893) |
Net increase (decrease) | (25,798) | (115,364) | $ (221,330) | $ (844,532) |
11. Other.
The Fund's organizational documents provide former and current trustees and officers with a limited indemnification against liabilities arising in connection with the performance of their duties to the Fund. In the normal course of business, the Fund may also enter into contracts that provide general indemnifications. The Fund's maximum exposure under these arrangements is unknown as this would be dependent on future claims that may be made against the Fund. The risk of material loss from such claims is considered remote.
Annual Report
To the Trustees of Fidelity Securities Fund and the Shareholders of Fidelity International Real Estate Fund:
In our opinion, the accompanying statement of assets and liabilities, including the schedule of investments, and the related statements of operations and of changes in net assets and the financial highlights present fairly, in all material respects, the financial position of Fidelity International Real Estate Fund (a fund of Fidelity Securities Fund) at July 31, 2010, the results of its operations for the year then ended, the changes in its net assets for each of the two years in the period then ended and the financial highlights for the periods indicated, in conformity with accounting principles generally accepted in the United States of America. These financial statements and financial highlights (hereafter referred to as "financial statements") are the responsibility of the Fidelity International Real Estate Fund's management. Our responsibility is to express an opinion on these financial statements based on our audits. We conducted our audits of these financial statements in accordance with the standards of the Public Company Accounting Oversight Board (United States). Those standards require that we plan and perform the audit to obtain reasonable assurance about whether the financial statements are free of material misstatement. An audit includes examining, on a test basis, evidence supporting the amounts and disclosures in the financial statements, assessing the accounting principles used and significant estimates made by management, and evaluating the overall financial statement presentation. We believe that our audits, which included confirmation of securities at July 31, 2010 by correspondence with the custodian and brokers, provide a reasonable basis for our opinion.
/s/ PricewaterhouseCoopers LLP
PricewaterhouseCoopers LLP
Boston, Massachusetts
September 17, 2010
Annual Report
The Trustees, Member of the Advisory Board, and executive officers of the trust and fund, as applicable, are listed below. The Board of Trustees governs the fund and is responsible for protecting the interests of shareholders. The Trustees are experienced executives who meet periodically throughout the year to oversee the fund's activities, review contractual arrangements with companies that provide services to the fund, oversee management of the risks associated with such activities and contractual arrangements, and review the fund's performance. Except for James C. Curvey, each of the Trustees oversees 222 funds advised by FMR or an affiliate. Mr. Curvey oversees 411 funds advised by FMR or an affiliate.
The Trustees hold office without limit in time except that (a) any Trustee may resign; (b) any Trustee may be removed by written instrument, signed by at least two-thirds of the number of Trustees prior to such removal; (c) any Trustee who requests to be retired or who has become incapacitated by illness or injury may be retired by written instrument signed by a majority of the other Trustees; and (d) any Trustee may be removed at any special meeting of shareholders by a two-thirds vote of the outstanding voting securities of the trust. Each Trustee who is not an interested person (as defined in the 1940 Act) (Independent Trustee), shall retire not later than the last day of the calendar year in which his or her 72nd birthday occurs. The Independent Trustees may waive this mandatory retirement age policy with respect to individual Trustees. The executive officers and Advisory Board Member hold office without limit in time, except that any officer and Advisory Board Member may resign or may be removed by a vote of a majority of the Trustees at any regular meeting or any special meeting of the Trustees. Except as indicated, each individual has held the office shown or other offices in the same company for the past five years.
Experience, Skills, Attributes, and Qualifications of the Fund's Trustees. The Governance and Nominating Committee has adopted a statement of policy that describes the experience, qualifications, attributes, and skills that are necessary and desirable for potential Independent Trustee candidates (Statement of Policy). The Board believes that each Trustee satisfied at the time he or she was initially elected or appointed a Trustee, and continues to satisfy, the standards contemplated by the Statement of Policy. The Governance and Nominating Committee also engages professional search firms to help identify potential Independent Trustee candidates who have the experience, qualifications, attributes, and skills consistent with the Statement of Policy. From time to time, additional criteria based on the composition and skills of the current Independent Trustees, as well as experience or skills that may be appropriate in light of future changes to board composition, business conditions, and regulatory or other developments, have also been considered by the professional search firms and the Governance and Nominating Committee. In addition, the Board takes into account the Trustees' commitment and participation in Board and committee meetings, as well as their leadership of standing and ad hoc committees throughout their tenure.
In determining that a particular Trustee was and continues to be qualified to serve as a Trustee, the Board has considered a variety of criteria, none of which, in isolation, was controlling. The Board believes that, collectively, the Trustees have balanced and diverse experience, qualifications, attributes, and skills, which allow the Board to operate effectively in governing the fund and protecting the interests of shareholders. Information about the specific experience, skills, attributes, and qualifications of each Trustee, which in each case led to the Board's conclusion that the Trustee should serve (or continue to serve) as a trustee of the fund, is provided below.
Annual Report
Trustees and Officers - continued
Board Structure and Oversight Function. Edward C. Johnson 3d is an interested person (as defined in the 1940 Act) and currently serves as Chairman. The Trustees have determined that an interested Chairman is appropriate and benefits shareholders because an interested Chairman has a personal and professional stake in the quality and continuity of services provided to the fund. Independent Trustees exercise their informed business judgment to appoint an individual of their choosing to serve as Chairman, regardless of whether the Trustee happens to be independent or a member of management. The Independent Trustees have determined that they can act independently and effectively without having an Independent Trustee serve as Chairman and that a key structural component for assuring that they are in a position to do so is for the Independent Trustees to constitute a substantial majority for the Board. The Independent Trustees also regularly meet in executive session. Ned C. Lautenbach serves as Chairman of the Independent Trustees and as such (i) acts as a liaison between the Independent Trustees and management with respect to matters important to the Independent Trustees and (ii) with management prepares agendas for Board meetings.
Fidelity funds are overseen by different Boards of Trustees. The fund's Board oversees Fidelity's equity and high income funds and another Board oversees Fidelity's investment-grade bond, money market, and asset allocation funds. The asset allocation funds may invest in Fidelity funds overseen by the fund's Board. The use of separate Boards, each with its own committee structure, allows the Trustees of each group of Fidelity funds to focus on the unique issues of the funds they oversee, including common research, investment, and operational issues. On occasion, the separate Boards establish joint committees to address issues of overlapping consequences for the Fidelity funds overseen by each Board.
The Trustees operate using a system of committees to facilitate the timely and efficient consideration of all matters of importance to the Trustees, the fund, and fund shareholders and to facilitate compliance with legal and regulatory requirements and oversight of the fund's activities and associated risks. The Board, acting through its committees, has charged FMR and its affiliates with (i) identifying events or circumstances the occurrence of which could have demonstrably adverse effects on the fund's business and/or reputation; (ii) implementing processes and controls to lessen the possibility that such events or circumstances occur or to mitigate the effects of such events or circumstances if they do occur; and (iii) creating and maintaining a system designed to evaluate continuously business and market conditions in order to facilitate the identification and implementation processes described in (i) and (ii) above. Because the day-to-day operations and activities of the fund are carried out by or through FMR, its affiliates and other service providers, the fund's exposure to risks is mitigated but not eliminated by the processes overseen by the Trustees. While each of the Board's committees has responsibility for overseeing different aspects of the fund's activities, oversight is exercised primarily through the Operations, Audit, and Compliance Committees. Appropriate personnel, including but not limited to the fund's Chief Compliance Officer (CCO), FMR's internal auditor, the independent accountants, the fund's Treasurer and portfolio management personnel, make periodic reports to the Board's committees, as appropriate. The responsibilities of each committee, including their oversight responsibilities, are described further under "Standing Committees of the Fund's Trustees."
Annual Report
The fund's Statement of Additional Information (SAI) includes more information about the Trustees. To request a free copy, call Fidelity at 1-877-208-0098.
Interested Trustees*:
Correspondence intended for each Trustee who is an interested person may be sent to Fidelity Investments, 82 Devonshire Street, Boston, Massachusetts 02109.
Name, Age; Principal Occupations and Other Relevant Experience+ |
Edward C. Johnson 3d (80) |
| Year of Election or Appointment: 1984 Mr. Johnson is Trustee and Chairman of the Board of Trustees of certain Trusts. Mr. Johnson serves as Chief Executive Officer, Chairman, and a Director of FMR LLC; Chairman and a Director of FMR; Chairman and a Director of Fidelity Research & Analysis Company (FRAC); Chairman and a Director of Fidelity Investments Money Management, Inc.; and Chairman and a Director of FMR Co., Inc. In addition, Mr. Johnson serves as Chairman and Director of FIL Limited. Previously, Mr. Johnson served as President of FMR LLC (2006-2007). |
James C. Curvey (75) |
| Year of Election or Appointment: 2007 Mr. Curvey also serves as Trustee (2007-present) of other investment companies advised by FMR. Mr. Curvey is a Director of FMR and FMR Co., Inc. (2007-present). Mr. Curvey is also Vice Chairman (2006-
present) and Director of FMR LLC. In addition, Mr. Curvey serves as an Overseer for the Boston Symphony Orchestra and a member of the Trustees of Villanova University. |
* Trustees have been determined to be "Interested Trustees" by virtue of, among other things, their affiliation with the trust or various entities under common control with FMR.
+ The information above includes each Trustee's principal occupation during the last five years and other information relating to the experience, attributes, and skills relevant to each Trustee's qualifications to serve as a Trustee, which led to the conclusion that each Trustee should serve as a Trustee for the fund.
Annual Report
Trustees and Officers - continued
Independent Trustees:
Correspondence intended for each Independent Trustee (that is, the Trustees other than the Interested Trustees) may be sent to Fidelity Investments, P.O. Box 55235, Boston, Massachusetts 02205-5235.
Name, Age; Principal Occupations and Other Relevant Experience+ |
Dennis J. Dirks (62) |
| Year of Election or Appointment: 2005 Prior to his retirement in May 2003, Mr. Dirks was Chief Operating Officer and a member of the Board of The Depository Trust & Clearing Corporation (DTCC). He also served as President, Chief Operating Officer, and Board member of The Depository Trust Company (DTC) and President and Board member of the National Securities Clearing Corporation (NSCC). In addition, Mr. Dirks served as Chief Executive Officer and Board member of the Government Securities Clearing Corporation, Chief Executive Officer and Board member of the Mortgage-Backed Securities Clearing Corporation, as a Trustee and a member of the Finance Committee of Manhattan College (2005-2008), and as a Trustee and a member of the Finance Committee of AHRC of Nassau County (2006-2008). Currently, Mr. Dirks serves as a member of the Board of Directors for The Brookville Center for Children's Services, Inc. (2009-present). |
Alan J. Lacy (56) |
| Year of Election or Appointment: 2008 Mr. Lacy serves as Senior Adviser (2007-present) of Oak Hill Capital Partners, L.P. (private equity). Mr. Lacy also served as Chief Executive Officer (2000-2005) and Vice Chairman (2005-2006) of Sears Holdings Corporation and Sears, Roebuck and Co. (retail). In addition, Mr. Lacy serves as a member of the Board of Directors of The Western Union Company (global money transfer, 2006-present) and Bristol-Myers Squibb Company (global pharmaceuticals, 2007-present). Mr. Lacy is Chairman (2008-present) and a member (2006-present) of the Board of Trustees of The National Parks Conservation Association. |
Ned C. Lautenbach (66) |
| Year of Election or Appointment: 2000 Mr. Lautenbach is Chairman of the Independent Trustees of the Equity and High Income Funds (2006-present). Mr. Lautenbach is an Advisory Partner of Clayton, Dubilier & Rice, Inc. (private equity investment, 2008-present) and was previously a Partner of Clayton, Dubilier & Rice, Inc. (1998-2008). Previously, Mr. Lautenbach was with the International Business Machines Corporation (IBM) from 1968 until his retirement in 1998. Mr. Lautenbach serves as a Director of Eaton Corporation (diversified industrial) as well as the Philharmonic Center for the Arts in Naples, Florida. Mr. Lautenbach is also a member of the Board of Trustees of Fairfield University (2005-present), as well as a member of the Council on Foreign Relations. Previously, Mr. Lautenbach served as a Director of Sony Corporation (2006-2007). |
Joseph Mauriello (65) |
| Year of Election or Appointment: 2008 Prior to his retirement in January 2006, Mr. Mauriello served in numerous senior management positions including Deputy Chairman and Chief Operating Officer (2004-2005), and Vice Chairman of Financial Services (2002-2004) of KPMG LLP US (professional services, 1965-2005). Mr. Mauriello currently serves as a member of the Board of Directors of XL Capital Ltd. (global insurance and re-insurance, 2006-present) and of Arcadia Resources Inc. (health care services and products, 2007-
present). Previously, Mr. Mauriello served as a Director of the Hamilton Funds of the Bank of New York (2006-2007). |
Cornelia M. Small (66) |
| Year of Election or Appointment: 2005 Ms. Small is a member of the Board of Directors of the Teagle Foundation (2009-present). Ms. Small is also a member of the Investment Committee, and Chair (2008-present) and a member of the Board of Trustees of Smith College. In addition, Ms. Small serves on the Investment Committee of the Berkshire Taconic Community Foundation (2008-present). Previously, Ms. Small served as Chairperson of the Investment Committee (2002-2008) of Smith College. In addition, Ms. Small served as Chief Investment Officer, Director of Global Equity Investments, and a member of the Board of Directors of Scudder, Stevens & Clark and Scudder Kemper Investments. |
William S. Stavropoulos (71) |
| Year of Election or Appointment: 2002 Mr. Stavropoulos is Vice Chairman of the Independent Trustees of the Equity and High Income Funds (2006-present). Mr. Stavropoulos serves as President and Founder of the Michigan Baseball Foundation, the Great Lakes Loons (2007-present). Mr. Stavropoulos is Chairman Emeritus of the Board of Directors of The Dow Chemical Company, where he previously served in numerous senior management positions, including President, CEO (1995-2000; 2002-2004), Chairman of the Executive Committee (2000-2006), and as a member of the Board of Directors (1990-2006). Currently, Mr. Stavropoulos is a Director of Teradata Corporation (data warehousing and technology solutions, 2008-present), Chemical Financial Corporation, Maersk Inc. (industrial conglomerate), Tyco International, Inc. (multinational manufacturing and services, 2007-present), and a member of the Advisory Board for Metalmark Capital (private equity investment, 2005-present). Mr. Stavropoulos is a special advisor to Clayton, Dubilier & Rice, Inc. (private equity investment). In addition, Mr. Stavropoulos is a member of the University of Notre Dame Advisory Council for the College of Science. |
David M. Thomas (61) |
| Year of Election or Appointment: 2008 Previously, Mr. Thomas served as Executive Chairman (2005-2006) and Chairman and Chief Executive Officer (2000-2005) of IMS Health, Inc. (pharmaceutical and healthcare information solutions). In addition, Mr. Thomas serves as a member of the Board of Directors of Fortune Brands, Inc. (consumer products), and Interpublic Group of Companies, Inc. (marketing communication, 2004-present). |
Michael E. Wiley (59) |
| Year of Election or Appointment: 2008 Mr. Wiley also serves as a Director of Asia Pacific Exploration Consolidated (international oil and gas exploration and production, 2008-
present), and as a member of the Board of Trustees of the University of Tulsa (2000-2006; 2007-present). Mr. Wiley serves as a Director of Tesoro Corporation (independent oil refiner and marketer, 2005-present), and a Director of Bill Barrett Corporation (exploration and production, 2005-present). In addition, Mr. Wiley also serves as a Director of Post Oak Bank (privately-held bank, 2004-present). Previously, Mr. Wiley served as a Sr. Energy Advisor of Katzenbach Partners, LLC (consulting, 2006-2007), as an Advisory Director of Riverstone Holdings (private investment), Chairman, President, and CEO of Baker Hughes, Inc. (oilfield services, 2000-2004), and as Director of Spinnaker Exploration Company (exploration and production, 2001-2005). |
Annual Report
+ The information above includes each Trustee's principal occupation during the last five years and other information relating to the experience, attributes, and skills relevant to each Trustee's qualifications to serve as a Trustee, which led to the conclusion that each Trustee should serve as a Trustee for the fund.
Advisory Board Member and Executive Officers:
Correspondence intended for each executive officer and Peter S. Lynch may be sent to Fidelity Investments, 82 Devonshire Street, Boston, Massachusetts 02109.
Name, Age; Principal Occupation |
Peter S. Lynch (66) |
| Year of Election or Appointment: 2003 Member of the Advisory Board of Fidelity's Equity and High Income Funds. Mr. Lynch is Vice Chairman and a Director of FMR and FMR Co., Inc. In addition, Mr. Lynch serves as a Trustee of Boston College and as the Chairman of the Inner-City Scholarship Fund. Previously, Mr. Lynch served on the Special Olympics International Board of Directors (1997-2006). |
Kenneth B. Robins (40) |
| Year of Election or Appointment: 2008 President and Treasurer of Fidelity's Equity and High Income Funds. Mr. Robins also serves as President and Treasurer (2010-present) and Assistant Treasurer (2009-present) of other Fidelity funds and is an employee of Fidelity Investments (2004-present). Previously, Mr. Robins served as Deputy Treasurer of the Fidelity funds (2005-2008) and Treasurer and Chief Financial Officer of The North Carolina Capital Management Trust: Cash and Term Portfolios (2006-2008). |
Brian B. Hogan (45) |
| Year of Election or Appointment: 2009 Vice President of certain Equity Funds and Vice President of Sector Funds. Mr. Hogan also serves as Senior Vice President, Equity Research of FMR (2006-present) and President of FMR's Equity Division (2009-present). Previously, Mr. Hogan served as a portfolio manager. |
Christopher S. Bartel (38) |
| Year of Election or Appointment: 2009 Vice President of Fidelity's Sector and Real Estate Equity Funds. Mr. Bartel also serves as Senior Vice President of Equity Research (2009-present). Previously, Mr. Bartel served as Managing Director of Research (2006-2009) and an analyst and portfolio manager (2000-2006). |
Scott C. Goebel (42) |
| Year of Election or Appointment: 2008 Secretary and Chief Legal Officer (CLO) of the Fidelity funds. Mr. Goebel also serves as General Counsel, Secretary, and Senior Vice President of FMR (2008-present) and FMR Co., Inc. (2008-present); Deputy General Counsel of FMR LLC; Chief Legal Officer of Fidelity Management & Research (Hong Kong) Limited (2008-present) and Assistant Secretary of Fidelity Management & Research (Japan) Inc. (2008-present), Fidelity Investments Money Management, Inc. (2008-present), Fidelity Management & Research (U.K.) Inc. (2008-present), and Fidelity Research and Analysis Company (2008-present). Previously, Mr. Goebel served as Assistant Secretary of the Funds (2007-2008) and as Vice President and Secretary of Fidelity Distributors Corporation (FDC) (2005-2007). |
William C. Coffey (41) |
| Year of Election or Appointment: 2009 Assistant Secretary of Fidelity's Equity and High Income Funds. Mr. Coffey also serves as Senior Vice President and Deputy General Counsel of FMR LLC (2010-present), and is an employee of Fidelity Investments. Previously, Mr. Coffey served as Vice President and Associate General Counsel of FMR LLC (2005-2009). |
Holly C. Laurent (56) |
| Year of Election or Appointment: 2008 Anti-Money Laundering (AML) Officer of the Fidelity funds. Ms. Laurent is an employee of Fidelity Investments. Previously, Ms. Laurent was Senior Vice President and Head of Legal for Fidelity Business Services India Pvt. Ltd. (2006-2008), and Senior Vice President, Deputy General Counsel and Group Head for FMR LLC (2005-2006). |
Christine Reynolds (51) |
| Year of Election or Appointment: 2008 Chief Financial Officer of the Fidelity funds. Ms. Reynolds became President of Fidelity Pricing and Cash Management Services (FPCMS) in August 2008. Ms. Reynolds served as Chief Operating Officer of FPCMS (2007-2008). Previously, Ms. Reynolds served as President, Treasurer, and Anti-Money Laundering officer of the Fidelity funds (2004-2007). |
Kenneth A. Rathgeber (63) |
| Year of Election or Appointment: 2004 Chief Compliance Officer of Fidelity's Equity and High Income Funds. Mr. Rathgeber is Chief Compliance Officer of Fidelity Management & Research (Hong Kong) Limited (2008-present), Fidelity Management & Research (Japan) Inc. (2008-present), FMR (2005-present), FMR Co., Inc. (2005-present), Fidelity Management & Research (U.K.) Inc. (2005-present), Fidelity Research & Analysis Company (2005-present), Fidelity Investments Money Management, Inc. (2005-present), Pyramis Global Advisors, LLC (2005-present), and Strategic Advisers, Inc.(2005-present). |
Jeffrey S. Christian (48) |
| Year of Election or Appointment: 2009 Deputy Treasurer of the Fidelity funds. Mr. Christian is an employee of Fidelity Investments. Previously, Mr. Christian served as Chief Financial Officer (2008-2009) of certain Fidelity funds and Senior Vice President of Fidelity Pricing and Cash Management Services (FPCMS) (2004-2009). |
Bryan A. Mehrmann (49) |
| Year of Election or Appointment: 2005 Deputy Treasurer of the Fidelity funds. Mr. Mehrmann is an employee of Fidelity Investments. |
Adrien E. Deberghes (42) |
| Year of Election or Appointment: 2008 Deputy Treasurer of Fidelity's Equity and High Income Funds. Mr. Deberghes also serves as Assistant Treasurer of other Fidelity funds (2010-present) and is an employee of Fidelity Investments (2008-present). Previously, Mr. Deberghes served as Senior Vice President of Mutual Fund Administration at State Street Corporation (2007-2008), Senior Director of Mutual Fund Administration at Investors Bank & Trust (2005-2007), and Director of Finance for Dunkin' Brands (2000-2005). |
Stephanie J. Dorsey (41) |
| Year of Election or Appointment: 2010 Assistant Treasurer of Fidelity's Equity and High Income Funds. Ms. Dorsey also serves as Deputy Treasurer of other Fidelity funds (2008-present) and is an employee of Fidelity Investments (2008-present). Previously, Ms. Dorsey served as Treasurer (2004-2008) of the JPMorgan Mutual Funds and Vice President (2004-2008) of JPMorgan Chase Bank. |
John R. Hebble (52) |
| Year of Election or Appointment: 2009 Assistant Treasurer of Fidelity's Equity and High Income Funds. Mr. Hebble also serves as Treasurer and Chief Financial Officer of The North Carolina Capital Management Trust: Cash and Term Portfolio (2008-present), President and Treasurer of other Fidelity funds (2008-present) and is an employee of Fidelity Investments. |
Gary W. Ryan (51) |
| Year of Election or Appointment: 2005 Assistant Treasurer of the Fidelity funds. Mr. Ryan is an employee of Fidelity Investments. Previously, Mr. Ryan served as Vice President of Fund Reporting in Fidelity Pricing and Cash Management Services (FPCMS) (1999-2005). |
Annual Report
The Board of Trustees of Fidelity Advisor International Real Estate Fund voted to pay to shareholders of record at the opening of business on record date, the following distributions per share derived from capital gains realized from sales of portfolio securities, and dividends derived from net investment income:
| Pay Date | Record Date | Dividends | Capital Gains |
Class A | 09/09/10 | 09/08/10 | $.112 | $.158 |
Class T | 09/09/10 | 09/08/10 | $.097 | $.158 |
Class B | 09/09/10 | 09/08/10 | $.074 | $.158 |
Class C | 09/09/10 | 09/08/10 | $.083 | $.158 |
Class A designates 9%; Class B designates 11%; Class C designates 10%; and Class T designates 9%; of the dividends distributed in December 2009 during the fiscal year as amounts which may be taken into account as a dividend for purposes of the maximum rate under section 1(h)(11) of the Internal Revenue Code.
The amounts per share which represents income derived from sources within, and taxes paid to, foreign countries or possessions of the United States are as follows:
| Pay Date | Income | Taxes |
Class A | 12/21/09 | $.074 | $.0049 |
Class T | 12/21/09 | $.073 | $.0049 |
Class B | 12/21/09 | $.064 | $.0049 |
Class C | 12/21/09 | $.065 | $.0049 |
The fund will notify shareholders in January 2011 of amounts for use in preparing 2010 income tax returns.
Annual Report
Board Approval of Investment Advisory Contracts and Management Fees
Fidelity International Real Estate Fund
Each year, the Board of Trustees, including the Independent Trustees (together, the Board), votes on the renewal of the management contract and sub-advisory agreements (together, the Advisory Contracts) for the fund. The Board, assisted by the advice of fund counsel and Independent Trustees' counsel, requests and considers a broad range of information relevant to the renewal of the Advisory Contracts throughout the year.
The Board meets regularly and considers at each of its meetings factors that are relevant to its annual consideration of the renewal of the fund's Advisory Contracts, including the services and support provided to the fund and its shareholders. The Board has established various standing committees, each composed of Independent Trustees with varying backgrounds, to which the Board has assigned specific subject matter responsibilities in order to enhance effective decision-making by the Board. The Board, acting directly and through its Committees, requests and receives information concerning the annual consideration of the renewal of the fund's Advisory Contracts. The Board also meets as needed to consider matters specifically related to the Board's annual consideration of the renewal of Advisory Contracts. Members of the Board may also meet with trustees of other Fidelity funds through ad hoc joint committees to discuss certain matters relevant to the Fidelity funds.
At its July 2010 meeting, the Board of Trustees, including the Independent Trustees, unanimously determined to renew the fund's Advisory Contracts. In reaching its determination, the Board considered all factors it believed relevant, including (i) the nature, extent, and quality of the services to be provided to the fund and its shareholders (including the investment performance of the fund); (ii) the competitiveness of the fund's management fee and total expenses; (iii) the total costs of the services to be provided by and the profits to be realized by Fidelity from its relationship with the fund; (iv) the extent to which economies of scale would be realized as the fund grows; and (v) whether fee levels reflect these economies of scale, if any, for the benefit of fund shareholders.
In considering whether to renew the Advisory Contracts for the fund, the Board reached a determination, with the assistance of fund counsel and Independent Trustees' counsel and through the exercise of its business judgment, that the renewal of the Advisory Contracts is in the best interests of fund shareholders and that the compensation to be received by Fidelity under the management contract is fair and reasonable. The Board's decision to renew the Advisory Contracts was not based on any single factor noted above, but rather was based on a comprehensive consideration of all the information provided to the Board at its meetings throughout the year. The Board, in reaching its determination to renew the Advisory Contracts, is aware that shareholders in the fund have a broad range of investment choices available to them, including a wide choice among mutual funds offered by Fidelity's competitors, and that the fund's shareholders, with the opportunity to review and weigh the disclosure provided by the fund in its prospectus and other public disclosures, have chosen to invest in this fund, managed by Fidelity.
Annual Report
Nature, Extent, and Quality of Services Provided. The Board considered the staffing within the investment adviser, FMR, and the sub-advisers (together, the Investment Advisers), including the backgrounds of the fund's investment personnel and the fund's investment objective and discipline. The Independent Trustees also had discussions with senior management of Fidelity's investment operations and investment groups. The Board considered the structure of the portfolio manager compensation program and whether this structure provides appropriate incentives to act in the best interest of the fund.
Resources Dedicated to Investment Management and Support Services. The Board and the equity research subcommittee of the Board's Fund Oversight Committee reviewed the size, education, and experience of the Investment Advisers' investment staff, their use of technology, and the Investment Advisers' approach to recruiting, training, and retaining portfolio managers and other research, advisory, and management personnel. The Board noted that Fidelity's analysts have access to a variety of technological tools and market and securities data that enable them to perform both fundamental and quantitative analysis and to specialize in various disciplines. The Board considered Fidelity's extensive global research capabilities that enable the Investment Advisers to aggregate data from various sources in an effort to produce positive investment results. The Board also considered that Fidelity's portfolio managers and analysts have access to daily portfolio attribution that allows for monitoring of a fund's portfolio, as well as an electronic communication system that provides immediate real-time access to research concerning issuers and credit enhancers. The Board noted FMR's continued focus on strengthening the organization and discipline of equity portfolio management and research.
Shareholder and Administrative Services. The Board considered (i) the nature, extent, quality, and cost of advisory, administrative, and shareholder services performed by the Investment Advisers and their affiliates under the Advisory Contracts and under separate agreements covering transfer agency, pricing and bookkeeping, and securities lending services for the fund; (ii) the nature and extent of the investment adviser's supervision of third party service providers, principally custodians and subcustodians; and (iii) the resources devoted to, and the record of compliance with, the fund's compliance policies and procedures. The Board also reviewed the allocation of fund brokerage, including allocations to brokers affiliated with the Investment Advisers, the use of brokerage commissions to pay fund expenses, and the use of "soft" commission dollars to pay for research services.
The Board noted that the growth of fund assets over time across the complex allows Fidelity to reinvest in the development of services designed to enhance the value or convenience of the Fidelity funds as investment vehicles. These services include 24-hour access to account information and market information through phone representatives and over the Internet, and investor education materials and asset allocation tools.
Annual Report
Board Approval of Investment Advisory Contracts and
Management Fees - continued
Investment in a Large Fund Family. The Board considered the benefits to shareholders of investing in a Fidelity fund, including the benefits of investing in a fund that is part of a large family of funds offering a variety of investment disciplines and providing a large variety of mutual fund investor services. The Board noted that Fidelity had taken, or had made recommendations that resulted in the Fidelity funds taking, a number of actions over the previous year that benefited particular funds, including (i) dedicating additional resources to investment research and restructuring and broadening the focus of the investment research teams; (ii) bolstering the senior management team that oversees asset management; (iii) launching Class F of certain funds as a lower-fee class available to Freedom K and Freedom Index Funds; (iv) lowering the initial investment minimums and ongoing balance requirements for Real Estate High Income Fund; (v) eliminating subsequent purchase minimums for all funds and adding a waiver of the investment minimum requirement for new accounts opened with the proceeds of a systematic withdrawal plan; (vi) eliminating the withdrawal minimum and maximum limits for systematic withdrawals from Advisor funds; (vii) expanding sales load waivers on Class A shares for Destiny Planholders and expanding Institutional Class eligibility for Class O Destiny Planholders; and (viii) changing certain Class A and Class T sales charge structures to further align them with industry practices.
Investment Performance. The Board considered whether the fund has operated in accordance with its investment objective, as well as its record of compliance with its investment restrictions. It also reviewed the fund's absolute investment performance for each class, as well as the fund's relative investment performance for each class measured over multiple periods against a broad-based securities market index. The Board noted that FMR does not believe that a meaningful peer group exists against which to compare the fund's performance. The following charts considered by the Board show, over the one-, three, and five-year periods ended December 31, 2009, as available, the cumulative total returns of Institutional Class (Class I) and the retail class of the fund and the cumulative total returns of a broad-based securities market index ("benchmark").
Annual Report
Fidelity International Real Estate Fund
The Board noted that the investment performance of the fund was lower than its benchmark for all the periods shown. The Board discussed with FMR actions that have been taken by FMR to improve the fund's below-benchmark performance. The Board also reviewed the fund's performance since inception as well as performance in the current year. The Board will continue to closely monitor the performance of the fund in the coming year and discuss with FMR other appropriate actions to address the performance of the fund. The Board considered that the variations in performance among the fund's classes reflect the variations in class expenses, which result in lower performance for higher expense classes.
Based on its review, and giving particular weight to the nature and quality of the resources dedicated by the Investment Advisers to maintain and improve relative performance and factoring in the unprecedented market events in recent years, the Board concluded that the nature, extent, and quality of investment management and support services and of shareholder and administrative services provided to the fund will benefit the fund's shareholders, particularly in light of the Board's view that the fund's shareholders benefit from investing in a fund that is part of a large family of funds offering a variety of investment disciplines and services.
Competitiveness of Management Fee and Total Fund Expenses. The Board considered the fund's management fee and total expenses compared to "mapped groups" of competitive funds and classes. Fidelity creates "mapped groups" by combining similar Lipper investment objective categories that have comparable management fee characteristics. Combining Lipper investment objective categories aids the Board's management fee and total expense comparisons by broadening the competitive group used for comparison and by reducing the number of universes to which various Fidelity funds are compared.
Annual Report
Board Approval of Investment Advisory Contracts and
Management Fees - continued
Management Fee. The Board considered two proprietary management fee comparisons for the 12-month periods shown in the chart below. The group of Lipper funds used by the Board for management fee comparisons is referred to below as the "Total Mapped Group." The Total Mapped Group comparison focuses on a fund's standing relative to the total universe of comparable funds available to investors, in terms of gross management fees before expense reimbursements or caps. "TMG %" represents the percentage of funds in the Total Mapped Group that had management fees that were lower than the fund's. For example, a TMG % of 29% means that 71% of the funds in the Total Mapped Group had higher management fees than the fund. The "Asset-Size Peer Group" (ASPG) comparison focuses on a fund's standing relative to non-Fidelity funds similar in size to the fund within the Total Mapped Group. The ASPG represents at least 15% of the funds in the Total Mapped Group with comparable asset size and management fee characteristics, subject to a minimum of 50 funds (or all funds in the Total Mapped Group if fewer than 50). Additional information, such as the ASPG quartile in which the fund's management fee ranked, is also included in the chart and considered by the Board.
Fidelity International Real Estate Fund
The Board noted that the fund's management fee ranked below the median of its Total Mapped Group and below the median of its ASPG for 2009.
Annual Report
Based on its review, the Board concluded that the fund's management fee is fair and reasonable in light of the services that the fund receives and the other factors considered.
Total Expenses. In its review of each class's total expenses, the Board considered the fund's management fee as well as other fund or class expenses, as applicable, such as transfer agent fees, pricing and bookkeeping fees, fund-paid 12b-1 fees, and custodial, legal, and audit fees. The Board also noted the effects of any waivers and reimbursements on fees and expenses. As part of its review, the Board also considered current and historical total expenses of each class of the fund compared to competitive fund median expenses. Each class of the fund is compared to those funds and classes in the Total Mapped Group (used by the Board for management fee comparisons) that have a similar sales load structure.
The Board noted that the total expenses of each of Class A, Class C, and the retail class ranked below its competitive median for 2009 and the total expenses of each of Class T, Class B, and Institutional Class ranked above its competitive median for 2009. The Board considered that the total expenses for Class T were above the median primarily because its 12b-1 fee is higher than the typical front-end load class. The Board noted that the fund offers multiple classes, each of which has a different sales load and 12b-1 fee structure, and that the multiple structures are intended to offer a range of pricing options for the intermediary market. The Board also noted that the total expenses of the classes vary primarily by the level of their 12b-1 fees, although differences in transfer agent fees may also cause expenses to vary from class to class.
Fees Charged to Other Fidelity Clients. The Board also considered Fidelity fee structures and other information with respect to clients of FMR and its affiliates, such as other mutual funds advised or subadvised by FMR or its affiliates, pension plan clients, and other institutional clients. In March 2010, the Board created an ad hoc joint committee with the board of other Fidelity funds (the Committee) to review and compare Fidelity's institutional investment advisory business with its business of providing services to the Fidelity funds, including the differences in services provided, fees charged, and costs incurred, as well as competition in their respective marketplaces.
Based on its review of total expenses and fees charged to other Fidelity clients, the Board concluded that the total expenses of each class of the fund were reasonable, although in some cases above the median of the universe presented for comparison, in light of the services that the fund and its shareholders receive and the other factors considered, including the findings of the Committee.
Costs of the Services and Profitability. The Board considered the revenues earned and the expenses incurred by Fidelity in conducting the business of developing, marketing, distributing, managing, administering and servicing the fund and its shareholders. The Board also considered the level of Fidelity's profits in respect of all the Fidelity funds.
Annual Report
Board Approval of Investment Advisory Contracts and
Management Fees - continued
On an annual basis, FMR presents to the Board Fidelity's profitability for the fund. Fidelity calculates the profitability for each fund, as well as aggregate profitability for groups of Fidelity funds and all Fidelity funds, using a series of detailed revenue and cost allocation methodologies which originate with the audited books and records of Fidelity. The Audit Committee of the Board reviews any significant changes from the prior year's methodologies.
PricewaterhouseCoopers LLP (PwC), independent registered public accounting firm and auditor to Fidelity and certain Fidelity funds, has been engaged annually by the Board as part of the Board's assessment of Fidelity's profitability analysis. PwC's engagement includes the review and assessment of Fidelity's methodologies used in determining the revenues and expenses attributable to Fidelity's mutual fund business, and completion of agreed-upon procedures surrounding the mathematical accuracy of fund profitability and its conformity to allocation methodologies. After considering PwC's reports issued under the engagement and information provided by Fidelity, the Board believes that while other allocation methods may also be reasonable, Fidelity's profitability methodologies are reasonable in all material respects.
The Board has also reviewed Fidelity's non-fund businesses and fall-out benefits related to the mutual fund business as well as cases where Fidelity's affiliates may benefit from or be related to the fund's business.
The Board considered the costs of the services provided by and the profits realized by Fidelity in connection with the operation of the fund and were satisfied that the profitability was not excessive in the circumstances.
Economies of Scale. The Board considered whether there have been economies of scale in respect of the management of the Fidelity funds, whether the Fidelity funds (including the fund) have appropriately benefited from any such economies of scale, and whether there is potential for realization of any further economies of scale. The Board considered the extent to which the fund will benefit from economies of scale through increased services to the fund, through waivers or reimbursements, or through fee or expense reductions.
In February 2009, the Board and the board of other Fidelity funds created an ad hoc committee (the Economies of Scale Committee) to analyze whether FMR attains economies of scale in respect of the management and servicing of the Fidelity funds, whether the Fidelity funds have appropriately benefited from such economies of scale, and whether there is potential for realization of any further economies of scale.
The Board recognized that the fund's management contract incorporates a "group fee" structure, which provides for lower group fee rates as total fund assets under FMR's management increase, and for higher group fee rates as total fund assets under FMR's management decrease. FMR calculates the group fee rates based on a tiered asset "breakpoint" schedule that varies based on asset class. The Board considered that the group fee is designed to deliver the benefits of economies of scale to fund shareholders when total Fidelity fund assets increase, even if assets of any particular fund are unchanged or have declined, because some portion of Fidelity's costs are attributable to services provided to all Fidelity funds, and all funds benefit if those costs can be allocated among more assets. The Board concluded that, given the group fee structure, fund shareholders will benefit from lower management fees as assets under FMR's management increase at the fund complex level, regardless of whether Fidelity achieves any such economies of scale.
Annual Report
The Board concluded, considering the findings of the Economies of Scale Committee, that any potential economies of scale are being appropriately shared between fund shareholders and Fidelity.
Additional Information Requested by the Board. In order to develop fully the factual basis for consideration of the Fidelity funds' Advisory Contracts, the Board requested and received additional information on certain topics, including (i) fund performance trends, actions to be taken by FMR to improve certain funds' overall performance, and Fidelity's long-term strategies for certain funds; (ii) portfolio manager changes that have occurred during the past year and length of portfolio manager tenure for different categories of funds over time; (iii) Fidelity's compensation structure for portfolio managers, research analysts, and other key personnel, the rationale for the compensation structure, and how the compensation structure provides appropriate performance incentives; (iv) the amount of the investment that each portfolio manager has made in the Fidelity fund(s) that he or she manages; (v) management and other fees paid by FMR to affiliated sub-advisers on behalf of the Fidelity funds; (vi) Fidelity's fee structures and rationale for recommending different fees among different categories of funds; (vii) Fidelity's rationale for recommending which funds should have a performance adjustment component as part of their management fees; (viii) the rationale for any differences between fund fee structures and fee structures in place for other Fidelity clients; and (ix) explanations regarding the relative total expenses borne by certain funds and classes, total expense competitive trends, and actions that might be taken by FMR to reduce total expenses for certain funds and classes.
Based on its evaluation of all of the conclusions noted above, and after considering all factors it believed relevant, the Board ultimately concluded that the advisory fee structures are fair and reasonable, and that the fund's Advisory Contracts should be renewed.
Annual Report
Investment Adviser
Fidelity Management & Research Company
Boston, MA
Investment Sub-Advisers
FMR Co., Inc.
Fidelity Research & Analysis Company
Fidelity Management & Research
(U.K.) Inc.
FIL Investments (Japan) Limited
FIL Investment Advisers
FIL Investment Advisers (U.K.) Ltd.
Fidelity Management & Research
(Hong Kong) Limited
Fidelity Management & Research
(Japan) Inc.
General Distributor
Fidelity Distributors Corporation
Boston, MA
Transfer and Service Agents
Fidelity Investments Institutional
Operations Company, Inc.
Boston, MA
Fidelity Service Company, Inc.
Boston, MA
Custodian
The Bank of New York Mellon
New York, NY
AIRE-UANN-0910
1.843178.103
(Fidelity Investment logo)(registered trademark)
Fidelity Advisor
International Real Estate
Fund - Institutional Class
Annual Report
July 31, 2010
(2_fidelity_logos) (Registered_Trademark)
Institutional Class is a
class of Fidelity®
International Real Estate Fund
Contents
Chairman's Message | <Click Here> | The Chairman's message to shareholders. |
Performance | <Click Here> | How the fund has done over time. |
Management's Discussion of Fund Performance | <Click Here> | The Portfolio Manager's review of fund performance and strategy. |
Shareholder Expense Example | <Click Here> | An example of shareholder expenses. |
Investment Changes | <Click Here> | A summary of major shifts in the fund's investments over the past six months. |
Investments | <Click Here> | A complete list of the fund's investments with their market values. |
Financial Statements | <Click Here> | Statements of assets and liabilities, operations, and changes in net assets,
as well as financial highlights. |
Notes | <Click Here> | Notes to the financial statements. |
Report of Independent Registered Public Accounting Firm | <Click Here> | |
Trustees and Officers | <Click Here> | |
Distributions | <Click Here> | |
Board Approval of Investment Advisory Contracts and Management Fees | <Click Here> | |
To view a fund's proxy voting guidelines and proxy voting record for the 12-month period ended June 30, visit http://www.fidelity.com/proxyvotingresults or visit the Securities and Exchange Commission's (SEC) web site at http://www.sec.gov. You may also call 1-877-208-0098 to request a free copy of the proxy voting guidelines.
Standard & Poor's, S&P and S&P 500 are registered service marks of The McGraw-Hill Companies, Inc. and have been licensed for use by Fidelity Distributors Corporation.
Other third party marks appearing herein are the property of their respective owners.
All other marks appearing herein are registered or unregistered trademarks or service marks of FMR LLC or an affiliated company.
Annual Report
This report and the financial statements contained herein are submitted for the general information of the shareholders of the fund. This report is not authorized for distribution to prospective investors in the fund unless preceded or accompanied by an effective prospectus.
A fund files its complete schedule of portfolio holdings with the SEC for the first and third quarters of each fiscal year on Form N-Q. Forms N-Q are available on the SEC's web site at http://www.sec.gov. A fund's Forms N-Q may be reviewed and copied at the SEC's Public Reference Room in Washington, DC. Information regarding the operation of the SEC's Public Reference Room may be obtained by calling 1-800-SEC-0330. For a complete list of a fund's portfolio holdings, view the most recent holdings listing, semiannual report, or annual report on Fidelity's web site at http://www.fidelity.com or http://www.advisor.fidelity.com, as applicable.
NOT FDIC INSURED • MAY LOSE VALUE • NO BANK GUARANTEE
Neither the fund nor Fidelity Distributors Corporation is a bank.
Annual Report
(photo_of_Edward_C_Johnson_3d)
Dear Shareholder:
A yearlong uptrend in global equity markets reversed course in late April 2010 when investor sentiment turned bearish due in great measure to concern that Europe's debt crisis would expand and slow or derail economic recovery. However, a bounceback in July helped to recover some of the ground that was lost. Financial markets are always unpredictable, of course, but there also are several time-tested investment principles that can help put the odds in your favor.
One of the basic tenets is to invest for the long term. Over time, riding out the markets' inevitable ups and downs has proven much more effective than selling into panic or chasing the hottest trend. Even missing only a few of the markets' best days can significantly diminish investor returns. Patience also affords the benefits of compounding - of earning interest on additional income or reinvested dividends and capital gains. There can be tax advantages and cost benefits to consider as well. While staying the course doesn't eliminate risk, it can considerably lessen the effect of short-term declines.
You can further manage your investing risk through diversification. And today, more than ever, geographic diversification should be taken into account. Studies indicate that asset allocation is the single most important determinant of a portfolio's long-term success. The right mix of stocks, bonds and cash - aligned to your particular risk tolerance and investment objective - is very important. Age-appropriate rebalancing is also an essential aspect of asset allocation. For younger investors, an emphasis on equities - which historically have been the best-performing asset class over time - is encouraged. As investors near their specific goal, such as retirement or sending a child to college, consideration may be given to replacing volatile assets (e.g. common stocks) with more-stable fixed investments (bonds or savings plans).
A third principle - investing regularly - can help lower the average cost of your purchases. Investing a certain amount of money each month or quarter helps ensure you won't pay for all your shares at market highs. This strategy - known as dollar cost averaging - also reduces "emotion" from investing, helping shareholders avoid selling weak performers just prior to an upswing, or chasing a hot performer just before a correction.
We invite you to contact us via the Internet, through our Investor Centers or by phone. It is our privilege to provide you the information you need to make the investments that are right for you.
Sincerely,
(The chairman's signature appears here.)
Edward C. Johnson 3d
Annual Report
Average annual total return reflects the change in the value of an investment, assuming reinvestment of the class' dividend income and capital gains (the profits earned upon the sale of securities that have grown in value, if any) and assuming a constant rate of performance each year. The $10,000 table and the fund's returns do not reflect the deduction of taxes that a shareholder would pay on fund distributions or the redemption of fund shares. During periods of reimbursement by Fidelity, a fund's total return will be greater than it would be had the reimbursement not occurred. How a fund did yesterday is no guarantee of how it will do tomorrow.
Average Annual Total Returns
Periods ended July 31, 2010 | Past 1
year | Past 5
years | Life of
fund A |
Institutional Class B | 5.18% | -0.87% | 2.60% |
A From September 8, 2004.
B The initial offering of Institutional Class shares took place on April 4, 2007. Returns prior to April 4, 2007 are those of Fidelity International Real Estate Fund, the original class of the fund.
$10,000 Over Life of Fund
Let's say hypothetically that $10,000 was invested in Fidelity Advisor International Real Estate Fund - Institutional Class on September 8, 2004, when the fund started. The chart shows how the value of your investment would have changed, and also shows how the MSCI® EAFE® Index (Europe, Australasia, Far East) performed over the same period. The initial offering of Institutional Class took place on April 4, 2007. See above for additional information regarding the performance of Institutional Class.
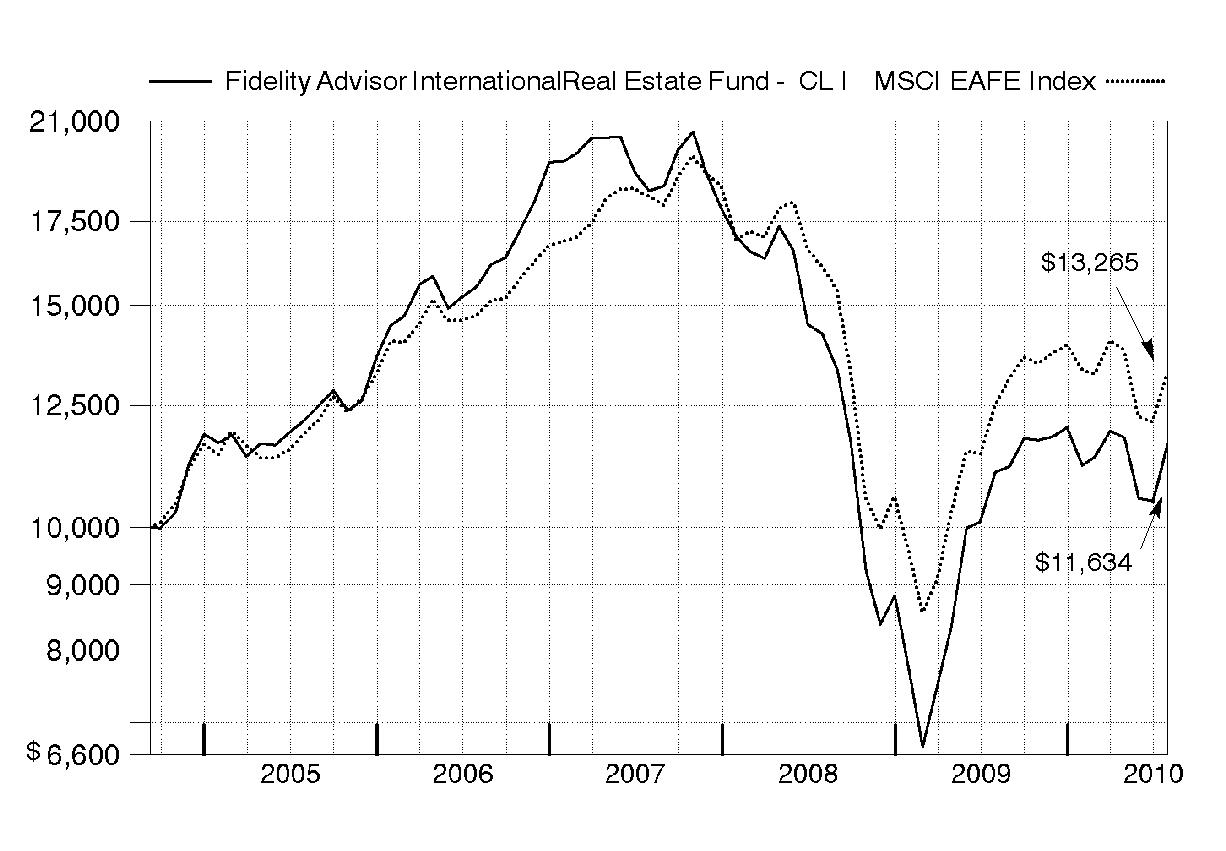
Annual Report
Market Recap: During the year ending July 31, 2010, investors in international real estate securities moved from having an appetite for risk to severe distaste for it. Following investors' exuberance after the global financial crisis, they became less willing to own international real estate securities, based on the sovereign debt crisis in Europe, the slowdown in U.S. employment and China's policies to restrain economic growth. Risk-averse investors strongly favored companies that displayed defensive qualities such as strong balance sheets and rental covenants. As a result, since April, stocks perceived to have less risk did much better than their more "offensive" counterparts. As of the end of July, offensive companies were trading at significant valuation discounts. In this environment, the FTSE EPRA/NAREIT Developed ex North America Index - a measure of international property stocks - returned 8.08%. The U.S. real estate stock market did much better, with the Dow Jones U.S. Select Real Estate Securities IndexSM increasing 55.21%. Meanwhile, the MSCI® EAFE® (Europe, Australasia, Far East Index), a proxy for the broad international stock market, rose 6.36% for the past 12 months.
Comments from Guillermo de las Casas, who became Portfolio Manager of Fidelity Advisor International Real Estate Fund on April 1, 2010: For the year, the fund's Institutional Class shares returned 5.18%, trailing the FTSE EPRA/NAREIT index. Compared with this index during the past 12 months - the last four of which I was managing the fund - an underweighting and disappointing security selection in offices was negative. Stock picking in Japan and Australia were detractors, as was a modest underweighting in Europe. In contrast, the fund benefited from its overweighting in Norway and good stock selection in Brazil - which is not in the index - especially later in the period. Positive security selection among residential property developers more than offset the negative impact of being substantially overweighed in the group. Currency fluctuations modestly boosted performance. The biggest individual detractors were Chinese property company China Overseas Land & Investment; NTT Urban Development, a Japanese office property company that hurt the fund due to untimely ownership; Nomura Real Estate Holdings, a commercial and residential property developer; and Australian property company GPT Group. In contrast, U.K.-based UNITE Group, a manager and developer of student housing, did well, as did property developers Hongkong Land Holdings and Mitsubishi Estate, based in Hong Kong and Japan, respectively. Some of the stocks I've mentioned were not in the portfolio at period end.
The views expressed above reflect those of the portfolio manager(s) only through the end of the period as stated on the cover of this report and do not necessarily represent the views of Fidelity or any other person in the Fidelity organization. Any such views are subject to change at any time based upon market or other conditions and Fidelity disclaims any responsibility to update such views. These views may not be relied on as investment advice and, because investment decisions for a Fidelity fund are based on numerous factors, may not be relied on as an indication of trading intent on behalf of any Fidelity fund.
Annual Report
Shareholder Expense Example
As a shareholder of the Fund, you incur two types of costs: (1) transaction costs, including sales charges (loads) on purchase payments or redemption proceeds, redemption fees, and (2) ongoing costs, including management fees, distribution and/or service (12b-1) fees and other Fund expenses. This Example is intended to help you understand your ongoing costs (in dollars) of investing in the Fund and to compare these costs with the ongoing costs of investing in other mutual funds.
The Example is based on an investment of $1,000 invested at the beginning of the period and held for the entire period (February 1, 2010 to July 31, 2010).
Actual Expenses
The first line of the accompanying table for each class of the Fund provides information about actual account values and actual expenses. You may use the information in this line, together with the amount you invested, to estimate the expenses that you paid over the period. Simply divide your account value by $1,000.00 (for example, an $8,600 account value divided by $1,000.00 = 8.6), then multiply the result by the number in the first line for a class of the Fund under the heading entitled "Expenses Paid During Period" to estimate the expenses you paid on your account during this period. A small balance maintenance fee of $12.00 that is charged once a year may apply for certain accounts with a value of less than $2,000. This fee is not included in the table below. If it was, the estimate of expenses you paid during the period would be higher, and your ending account value lower, by this amount. In addition, the Fund, as a shareholder in the underlying Fidelity Central Funds, will indirectly bear its pro-rata share of the fees and expenses incurred by the underlying Fidelity Central Funds. These fees and expenses are not included in the Fund's annualized expense ratio used to calculate the expense estimate in the table below.
Hypothetical Example for Comparison Purposes
The second line of the accompanying table for each class of the Fund provides information about hypothetical account values and hypothetical expenses based on a Class' actual expense ratio and an assumed rate of return of 5% per year before expenses, which is not the Class' actual return. The hypothetical account values and expenses may not be used to estimate the actual ending account balance or expenses you paid for the period. You may use this information to compare the ongoing costs of investing in the Fund and other funds. To do so, compare this 5% hypothetical example with the 5% hypothetical examples that appear in the shareholder reports of the other funds. A small balance maintenance fee of $12.00 that is charged once a year may apply for certain accounts with a value of less than $2,000. This fee is not included in the table below. If it was, the estimate of expenses you paid during the period would be higher, and your ending account value lower, by this amount. In addition, the Fund, as a shareholder in the underlying Fidelity Central Funds, will indirectly bear its pro-rata share of the fees and expenses incurred by the underlying Fidelity Central Funds. These fees and expenses are not included in the Fund's annualized expense ratio used to calculate the expense estimate in the table below.
Annual Report
Please note that the expenses shown in the table are meant to highlight your ongoing costs only and do not reflect any transaction costs. Therefore, the second line of the table is useful in comparing ongoing costs only, and will not help you determine the relative total costs of owning different funds. In addition, if these transactional costs were included, your costs would have been higher.
| Annualized Expense Ratio | Beginning
Account Value
February 1, 2010 | Ending
Account Value
July 31, 2010 | Expenses Paid
During Period*
February 1, 2010 to July 31, 2010 |
Class A | 1.41% | | | |
Actual | | $ 1,000.00 | $ 1,038.00 | $ 7.12 |
HypotheticalA | | $ 1,000.00 | $ 1,017.80 | $ 7.05 |
Class T | 1.67% | | | |
Actual | | $ 1,000.00 | $ 1,037.00 | $ 8.43 |
HypotheticalA | | $ 1,000.00 | $ 1,016.51 | $ 8.35 |
Class B | 2.16% | | | |
Actual | | $ 1,000.00 | $ 1,033.50 | $ 10.89 |
HypotheticalA | | $ 1,000.00 | $ 1,014.08 | $ 10.79 |
Class C | 2.16% | | | |
Actual | | $ 1,000.00 | $ 1,033.60 | $ 10.89 |
HypotheticalA | | $ 1,000.00 | $ 1,014.08 | $ 10.79 |
International Real Estate | 1.16% | | | |
Actual | | $ 1,000.00 | $ 1,039.00 | $ 5.86 |
HypotheticalA | | $ 1,000.00 | $ 1,019.04 | $ 5.81 |
Institutional Class | 1.16% | | | |
Actual | | $ 1,000.00 | $ 1,039.10 | $ 5.86 |
HypotheticalA | | $ 1,000.00 | $ 1,019.04 | $ 5.81 |
A 5% return per year before expenses
* Expenses are equal to each Class' annualized expense ratio, multiplied by the average account value over the period, multiplied by 181/365 (to reflect the one-half year period).
Annual Report
Investment Changes (Unaudited)
Top Ten Stocks as of July 31, 2010 |
| % of fund's
net assets | % of fund's net assets
6 months ago |
Sun Hung Kai Properties Ltd. | 8.6 | 7.9 |
Westfield Group unit | 7.4 | 7.9 |
Unibail-Rodamco | 6.6 | 6.5 |
Mitsui Fudosan Co. Ltd. | 5.3 | 4.6 |
Wharf Holdings Ltd. | 4.4 | 2.2 |
Sumitomo Realty & Development Co. Ltd. | 3.3 | 2.9 |
CapitaLand Ltd. | 3.2 | 1.6 |
Hang Lung Properties Ltd. | 2.8 | 3.0 |
British Land Co. PLC | 2.6 | 3.4 |
Kerry Properties Ltd. | 2.5 | 0.0 |
| 46.7 | |
Top Five Countries as of July 31, 2010 |
(excluding cash equivalents) | % of fund's
net assets | % of fund's net assets
6 months ago |
Hong Kong | 23.6 | 26.4 |
Japan | 17.7 | 17.7 |
Australia | 14.1 | 16.1 |
Singapore | 10.5 | 5.5 |
United Kingdom | 9.2 | 9.8 |
Percentages are adjusted for the effect of open futures contracts, if applicable. |
Top Five REIT Sectors as of July 31, 2010 |
| % of fund's
net assets | % of fund's net assets
6 months ago |
REITs - Management/Investment | 20.9 | 27.3 |
REITs - Office Buildings | 6.0 | 10.4 |
REITs - Shopping Centers | 4.2 | 4.6 |
REITs - Industrial Buildings | 3.2 | 5.6 |
REITs - Malls | 0.4 | 0.0 |
Asset Allocation (% of fund's net assets) |
As of July 31, 2010* | As of January 31, 2010** |
| Stocks and Investment Companies 99.5% | | | Stocks and Investment Companies 95.9% | |
| Short-Term
Investments and
Net Other Assets 0.5% | | | Short-Term
Investments and
Net Other Assets 4.1% | |
* Foreign investments | 99.5% | | ** Foreign investments | 95.9% | |

Annual Report
Investments July 31, 2010
Showing Percentage of Net Assets
Common Stocks - 99.5% |
| Shares | | Value |
Australia - 14.1% |
Charter Hall Group unit | 6,124,957 | | $ 3,325,300 |
DEXUS Property Group unit | 6,940,140 | | 5,118,025 |
FKP Property Group unit | 3,701,859 | | 2,344,739 |
Goodman Group unit | 9,610,282 | | 5,347,956 |
Macquarie CountryWide Trust | 6,121,441 | | 2,935,663 |
Stockland Corp. Ltd. unit | 954,596 | | 3,273,674 |
Westfield Group unit | 2,242,258 | | 24,772,956 |
TOTAL AUSTRALIA | | 47,118,313 |
Bailiwick of Jersey - 1.0% |
Atrium European Real Estate Ltd. | 416,196 | | 2,142,674 |
LXB Retail Properties PLC | 821,700 | | 1,166,323 |
TOTAL BAILIWICK OF JERSEY | | 3,308,997 |
Brazil - 1.0% |
BR Properties SA | 43,600 | | 345,874 |
Cyrela Brazil Realty SA | 103,400 | | 1,448,247 |
Iguatemi Empresa de Shopping Centers SA | 79,500 | | 1,580,506 |
TOTAL BRAZIL | | 3,374,627 |
Cayman Islands - 4.1% |
Agile Property Holdings Ltd. | 4,135,000 | | 5,387,345 |
Central China Real Estate Ltd. | 3,803,000 | | 979,208 |
IFM Investments Ltd. ADR (a) | 23,300 | | 131,645 |
KWG Property Holding Ltd. | 7,210,500 | | 5,337,673 |
SOHO China Ltd. | 2,668,500 | | 1,645,589 |
TOTAL CAYMAN ISLANDS | | 13,481,460 |
China - 2.1% |
China Resources Land Ltd. | 3,297,000 | | 6,995,116 |
Finland - 0.8% |
Citycon Oyj | 823,403 | | 2,822,469 |
France - 7.2% |
Societe de la Tour Eiffel | 31,000 | | 2,103,020 |
Unibail-Rodamco | 111,077 | | 21,918,512 |
TOTAL FRANCE | | 24,021,532 |
Germany - 1.0% |
alstria office REIT-AG | 129,465 | | 1,498,395 |
DIC Asset AG | 148,900 | | 1,214,871 |
IVG Immobilien AG (a) | 102,600 | | 712,346 |
TOTAL GERMANY | | 3,425,612 |
Common Stocks - continued |
| Shares | | Value |
Greece - 0.1% |
Babis Vovos International Technical SA (a) | 104,074 | | $ 389,301 |
Hong Kong - 23.6% |
Hang Lung Properties Ltd. | 2,241,000 | | 9,347,718 |
Henderson Land Development Co. Ltd. | 884,000 | | 5,502,594 |
Hongkong Land Holdings Ltd. | 994,000 | | 5,327,840 |
Kerry Properties Ltd. | 1,669,500 | | 8,414,667 |
New World Development Co. Ltd. | 3,678,000 | | 6,572,339 |
Sun Hung Kai Properties Ltd. | 1,942,000 | | 28,526,838 |
Wharf Holdings Ltd. | 2,693,000 | | 14,734,792 |
TOTAL HONG KONG | | 78,426,788 |
Italy - 1.9% |
Beni Stabili SpA (d) | 4,602,900 | | 3,806,486 |
Immobiliare Grande Distribuzione SpA | 1,605,876 | | 2,427,901 |
TOTAL ITALY | | 6,234,387 |
Japan - 17.7% |
Aeon Mall Co. Ltd. | 100,800 | | 2,209,027 |
Goldcrest Co. Ltd. | 197,070 | | 4,026,909 |
Japan Retail Fund Investment Corp. | 2,976 | | 3,832,558 |
Kenedix Realty Investment Corp. | 1,394 | | 4,577,578 |
Kenedix, Inc. (a)(d) | 18,256 | | 3,058,685 |
Mitsui Fudosan Co. Ltd. | 1,199,000 | | 17,757,825 |
Nomura Real Estate Holdings, Inc. | 284,100 | | 3,497,627 |
NTT Urban Development Co. | 2,822 | | 2,288,946 |
ORIX JREIT, Inc. | 506 | | 2,479,502 |
Park24 Co. Ltd. | 142,800 | | 1,531,682 |
Sumitomo Realty & Development Co. Ltd. | 617,000 | | 11,108,499 |
Toc Co. Ltd. | 248,300 | | 916,491 |
Tokyo Tatemono Co. Ltd. | 494,000 | | 1,611,895 |
TOTAL JAPAN | | 58,897,224 |
Netherlands - 1.5% |
Corio NV | 86,911 | | 5,099,661 |
Poland - 0.5% |
Globe Trade Centre SA (a) | 225,400 | | 1,767,584 |
Russia - 0.6% |
LSR Group OJSC GDR (Reg. S) (a) | 229,100 | | 2,084,810 |
Singapore - 10.5% |
Allgreen Properties Ltd. | 3,563,000 | | 3,065,453 |
Ascendas Real Estate Investment Trust (A-REIT) | 1,121,000 | | 1,747,570 |
CapitaLand Ltd. | 3,616,900 | | 10,532,336 |
Common Stocks - continued |
| Shares | | Value |
Singapore - continued |
City Developments Ltd. | 889,000 | | $ 7,910,067 |
Parkway Life REIT | 640,000 | | 701,228 |
Wing Tai Holdings Ltd. | 5,369,000 | | 7,106,552 |
Yanlord Land Group Ltd. | 2,785,000 | | 3,809,177 |
TOTAL SINGAPORE | | 34,872,383 |
Spain - 0.2% |
Realia Business SA (a) | 349,294 | | 662,392 |
Sweden - 2.4% |
Castellum AB | 406,200 | | 4,209,443 |
Klovern AB (d) | 395,600 | | 1,463,358 |
Wihlborgs Fastigheter AB | 104,800 | | 2,352,120 |
TOTAL SWEDEN | | 8,024,921 |
United Kingdom - 9.2% |
Big Yellow Group PLC | 796,200 | | 3,871,156 |
British Land Co. PLC | 1,194,723 | | 8,653,225 |
Capital & Counties Properties PLC (a) | 786,300 | | 1,356,556 |
Derwent London PLC | 115,200 | | 2,422,915 |
Great Portland Estates PLC | 705,054 | | 3,331,796 |
Hammerson PLC | 735,499 | | 4,480,414 |
Land Securities Group PLC | 138,373 | | 1,329,273 |
Metric Property Investments PLC (a) | 777,300 | | 1,249,595 |
Quintain Estates & Development PLC (a) | 737,200 | | 453,818 |
Songbird Estates PLC Class B (a) | 17,975 | | 42,288 |
St. Modwen Properties PLC | 1,251,100 | | 3,410,347 |
TOTAL UNITED KINGDOM | | 30,601,383 |
TOTAL COMMON STOCKS (Cost $362,739,810) | 331,608,960 |
Money Market Funds - 1.5% |
| Shares | | Value |
Fidelity Cash Central Fund, 0.24% (b) | 3,490,245 | | $ 3,490,245 |
Fidelity Securities Lending Cash Central Fund, 0.27% (b)(c) | 1,444,564 | | 1,444,564 |
TOTAL MONEY MARKET FUNDS (Cost $4,934,809) | 4,934,809 |
TOTAL INVESTMENT PORTFOLIO - 101.0% (Cost $367,674,619) | | 336,543,769 |
NET OTHER ASSETS (LIABILITIES) - (1.0)% | | (3,496,038) |
NET ASSETS - 100% | $ 333,047,731 |
Legend |
(a) Non-income producing |
(b) Affiliated fund that is available only to investment companies and other accounts managed by Fidelity Investments. The rate quoted is the annualized seven-day yield of the fund at period end. A complete unaudited listing of the fund's holdings as of its most recent quarter end is available upon request. |
(c) Investment made with cash collateral received from securities on loan. |
(d) Security or a portion of the security is on loan at period end. |
Affiliated Central Funds |
Information regarding fiscal year to date income earned by the Fund from investments in Fidelity Central Funds is as follows: |
Fund | Income earned |
Fidelity Cash Central Fund | $ 13,216 |
Fidelity Securities Lending Cash Central Fund | 109,121 |
Total | $ 122,337 |
Other Information |
All investments are categorized as Level 1 under the Fair Value Hierarchy. The inputs or methodology used for valuing securities may not be an indication of the risk associated with investing in those securities. For more information on valuation inputs, please refer to the Security Valuation section in the accompanying Notes to Financial Statements. |
Income Tax Information |
At July 31, 2010, the Fund had a capital loss carryforward of approximately $296,042,629 of which $159,443,097 and $136,599,532 will expire on July 31, 2017 and 2018, respectively. Capital loss carryforwards are only available to offset future capital gains of the Fund to the extent provided by regulations and may be limited. |
The Fund intends to elect to defer to its fiscal year ending July 31, 2011 approximately $17,770,782 of losses recognized during the period November 1, 2009 to July 31, 2010. |
See accompanying notes which are an integral part of the financial statements.
Annual Report
Statement of Assets and Liabilities
| July 31, 2010 |
| | |
Assets | | |
Investment in securities, at value (including securities loaned of $1,365,388) - See accompanying schedule: Unaffiliated issuers (cost $362,739,810) | $ 331,608,960 | |
Fidelity Central Funds (cost $4,934,809) | 4,934,809 | |
Total Investments (cost $367,674,619) | | $ 336,543,769 |
Cash | | 413,491 |
Foreign currency held at value (cost $51,029) | | 51,029 |
Receivable for investments sold | | 3,340,186 |
Receivable for fund shares sold | | 247,448 |
Dividends receivable | | 1,238,333 |
Distributions receivable from Fidelity Central Funds | | 7,202 |
Other receivables | | 90,653 |
Total assets | | 341,932,111 |
| | |
Liabilities | | |
Payable for investments purchased | $ 6,691,428 | |
Payable for fund shares redeemed | 344,790 | |
Accrued management fee | 190,477 | |
Distribution fees payable | 5,552 | |
Other affiliated payables | 91,610 | |
Other payables and accrued expenses | 115,959 | |
Collateral on securities loaned, at value | 1,444,564 | |
Total liabilities | | 8,884,380 |
| | |
Net Assets | | $ 333,047,731 |
Net Assets consist of: | | |
Paid in capital | | $ 673,949,184 |
Undistributed net investment income | | 4,719,742 |
Accumulated undistributed net realized gain (loss) on investments and foreign currency transactions | | (314,475,883) |
Net unrealized appreciation (depreciation) on investments and assets and liabilities in foreign currencies | | (31,145,312) |
Net Assets | | $ 333,047,731 |
See accompanying notes which are an integral part of the financial statements.
Annual Report
Financial Statements - continued
Statement of Assets and Liabilities - continued
| July 31, 2010 |
| | |
Calculation of Maximum Offering Price Class A:
Net Asset Value and redemption price per share ($7,249,830 ÷ 857,301 shares) | | $ 8.46 |
| | |
Maximum offering price per share (100/94.25 of $8.46) | | $ 8.98 |
Class T:
Net Asset Value and redemption price per share ($2,509,693 ÷ 298,568 shares) | | $ 8.41 |
| | |
Maximum offering price per share (100/96.50 of $8.41) | | $ 8.72 |
Class B:
Net Asset Value and offering price per share ($629,375 ÷ 75,682 shares)A | | $ 8.32 |
| | |
Class C:
Net Asset Value and offering price per share ($3,201,487 ÷ 385,566 shares)A | | $ 8.30 |
| | |
International Real Estate:
Net Asset Value, offering price and redemption price per share ($318,032,094 ÷ 37,293,275 shares) | | $ 8.53 |
| | |
Institutional Class:
Net Asset Value, offering price and redemption price per share ($1,425,252 ÷ 167,467 shares) | | $ 8.51 |
A Redemption price per share is equal to net asset value less any applicable contingent deferred sales charge.
See accompanying notes which are an integral part of the financial statements.
Annual Report
Statement of Operations
| Year ended July 31, 2010 |
| | |
Investment Income | | |
Dividends | | $ 12,489,573 |
Interest | | 54 |
Income from Fidelity Central Funds | | 122,337 |
Income before foreign taxes withheld | | 12,611,964 |
Less foreign taxes withheld | | (557,267) |
Total income | | 12,054,697 |
| | |
Expenses | | |
Management fee | $ 2,510,053 | |
Transfer agent fees | 1,144,482 | |
Distribution fees | 65,699 | |
Accounting and security lending fees | 184,993 | |
Custodian fees and expenses | 192,213 | |
Independent trustees' compensation | 2,059 | |
Registration fees | 82,990 | |
Audit | 71,231 | |
Legal | 1,306 | |
Miscellaneous | 6,202 | |
Total expenses before reductions | 4,261,228 | |
Expense reductions | (162,042) | 4,099,186 |
Net investment income (loss) | | 7,955,511 |
Realized and Unrealized Gain (Loss) Net realized gain (loss) on: | | |
Investment securities: | | |
Unaffiliated issuers (net of foreign taxes of $36,571) | 376,370 | |
Foreign currency transactions | (28,299) | |
Total net realized gain (loss) | | 348,071 |
Change in net unrealized appreciation (depreciation) on: Investment securities (net of decrease in deferred foreign taxes of $15,863) | 9,586,175 | |
Assets and liabilities in foreign currencies | (21,167) | |
Total change in net unrealized appreciation (depreciation) | | 9,565,008 |
Net gain (loss) | | 9,913,079 |
Net increase (decrease) in net assets resulting from operations | | $ 17,868,590 |
See accompanying notes which are an integral part of the financial statements.
Annual Report
Financial Statements - continued
Statement of Changes in Net Assets
| Year ended
July 31,
2010 | Year ended
July 31,
2009 |
Increase (Decrease) in Net Assets | | |
Operations | | |
Net investment income (loss) | $ 7,955,511 | $ 9,003,508 |
Net realized gain (loss) | 348,071 | (205,492,245) |
Change in net unrealized appreciation (depreciation) | 9,565,008 | 43,065,853 |
Net increase (decrease) in net assets resulting
from operations | 17,868,590 | (153,422,884) |
Distributions to shareholders from net investment income | (3,235,770) | - |
Distributions to shareholders from net realized gain | (5,017,915) | - |
Total distributions | (8,253,685) | - |
Share transactions - net increase (decrease) | (26,300,777) | (95,264,955) |
Redemption fees | 80,485 | 117,919 |
Total increase (decrease) in net assets | (16,605,387) | (248,569,920) |
| | |
Net Assets | | |
Beginning of period | 349,653,118 | 598,223,038 |
End of period (including undistributed net investment income of $4,719,742 and $0, respectively) | $ 333,047,731 | $ 349,653,118 |
See accompanying notes which are an integral part of the financial statements.
Annual Report
Financial Highlights - Class A
Years ended July 31, | 2010 | 2009 | 2008 | 2007 H |
Selected Per-Share Data | | | | |
Net asset value, beginning of period | $ 8.24 | $ 10.63 | $ 15.71 | $ 17.46 |
Income from Investment Operations | | | | |
Net investment income (loss) E | .17 | .18 | .20 | .11 |
Net realized and unrealized gain (loss) | .24 | (2.57) | (3.48) | (1.87) |
Total from investment operations | .41 | (2.39) | (3.28) | (1.76) |
Distributions from net investment income | (.07) | - | (.31) | - |
Distributions from net realized gain | (.12) | - | (1.50) | - |
Total distributions | (.19) | - | (1.81) | - |
Redemption fees added to paid in capital E | - J | - J | .01 | .01 |
Net asset value, end of period | $ 8.46 | $ 8.24 | $ 10.63 | $ 15.71 |
Total Return B, C, D | 4.97% | (22.48)% | (23.20)% | (10.02)% |
Ratios to Average Net Assets F, I | | | | |
Expenses before reductions | 1.44% | 1.45% | 1.38% | 1.37% A |
Expenses net of fee waivers, if any | 1.44% | 1.45% | 1.38% | 1.37% A |
Expenses net of all reductions | 1.39% | 1.42% | 1.35% | 1.26% A |
Net investment income (loss) | 2.02% | 2.55% | 1.58% | 2.08% A |
Supplemental Data | | | | |
Net assets, end of period (000 omitted) | $ 7,250 | $ 6,745 | $ 9,976 | $ 5,087 |
Portfolio turnover rate G | 95% | 55% | 63% | 144% |
A Annualized
B Total returns for periods of less than one year are not annualized.
C Total returns would have been lower had certain expenses not been reduced during the periods shown.
D Total returns do not include the effect of the sales charges.
E Calculated based on average shares outstanding during the period.
F Fees and expenses of the underlying Fidelity Central Funds are not included in the Fund's expense ratio. The Fund indirectly bears its proportionate share of the expenses of any underlying Fidelity Central Funds.
G Amount does not include the portfolio activity of any underlying Fidelity Central Funds.
H For the period April 4, 2007 (commencement of sale of shares) to July 31, 2007.
I Expense ratios reflect operating expenses of the class. Expenses before reductions do not reflect amounts reimbursed by the investment adviser or reductions from brokerage service arrangements or reductions from other expense offset arrangements and do not represent the amount paid by the class during periods when reimbursements or reductions occur. Expense ratios before reductions for start-up periods may not be representative of longer-term operating periods. Expenses net of fee waivers reflect expenses after reimbursement by the investment adviser but prior to reductions from brokerage service arrangements or other expense offset arrangements. Expenses net of all reductions represent the net expenses paid by the class.
J Amount represents less than $.01 per share.
See accompanying notes which are an integral part of the financial statements.
Annual Report
Financial Highlights - Class T
Years ended July 31, | 2010 | 2009 | 2008 | 2007 H |
Selected Per-Share Data | | | | |
Net asset value, beginning of period | $ 8.21 | $ 10.62 | $ 15.70 | $ 17.46 |
Income from Investment Operations | | | | |
Net investment income (loss) E | .15 | .17 | .17 | .10 |
Net realized and unrealized gain (loss) | .23 | (2.58) | (3.48) | (1.87) |
Total from investment operations | .38 | (2.41) | (3.31) | (1.77) |
Distributions from net investment income | (.06) | - | (.28) | - |
Distributions from net realized gain | (.12) | - | (1.50) | - |
Total distributions | (.18) | - | (1.78) | - |
Redemption fees added to paid in capital E | - J | - J | .01 | .01 |
Net asset value, end of period | $ 8.41 | $ 8.21 | $ 10.62 | $ 15.70 |
Total Return B, C, D | 4.68% | (22.69)% | (23.39)% | (10.08)% |
Ratios to Average Net Assets F, I | | | | |
Expenses before reductions | 1.70% | 1.71% | 1.64% | 1.61% A |
Expenses net of fee waivers, if any | 1.70% | 1.71% | 1.64% | 1.61% A |
Expenses net of all reductions | 1.65% | 1.68% | 1.60% | 1.51% A |
Net investment income (loss) | 1.75% | 2.29% | 1.32% | 1.90% A |
Supplemental Data | | | | |
Net assets, end of period (000 omitted) | $ 2,510 | $ 2,080 | $ 7,566 | $ 2,398 |
Portfolio turnover rate G | 95% | 55% | 63% | 144% |
A Annualized
B Total returns for periods of less than one year are not annualized.
C Total returns would have been lower had certain expenses not been reduced during the periods shown.
D Total returns do not include the effect of the sales charges.
E Calculated based on average shares outstanding during the period.
F Fees and expenses of the underlying Fidelity Central Funds are not included in the Fund's expense ratio. The Fund indirectly bears its proportionate share of the expenses of any underlying Fidelity Central Funds.
G Amount does not include the portfolio activity of any underlying Fidelity Central Funds.
H For the period April 4, 2007 (commencement of sale of shares) to July 31, 2007.
I Expense ratios reflect operating expenses of the class. Expenses before reductions do not reflect amounts reimbursed by the investment adviser or reductions from brokerage service arrangements or reductions from other expense offset arrangements and do not represent the amount paid by the class during periods when reimbursements or reductions occur. Expense ratios before reductions for start-up periods may not be representative of longer-term operating periods. Expenses net of fee waivers reflect expenses after reimbursement by the investment adviser but prior to reductions from brokerage service arrangements or other expense offset arrangements. Expenses net of all reductions represent the net expenses paid by the class.
J Amount represents less than $.01 per share.
See accompanying notes which are an integral part of the financial statements.
Annual Report
Financial Highlights - Class B
Years ended July 31, | 2010 | 2009 | 2008 | 2007 H |
Selected Per-Share Data | | | | |
Net asset value, beginning of period | $ 8.14 | $ 10.58 | $ 15.67 | $ 17.46 |
Income from Investment Operations | | | | |
Net investment income (loss) E | .11 | .13 | .11 | .07 |
Net realized and unrealized gain (loss) | .23 | (2.57) | (3.48) | (1.87) |
Total from investment operations | .34 | (2.44) | (3.37) | (1.80) |
Distributions from net investment income | (.04) | - | (.23) | - |
Distributions from net realized gain | (.12) | - | (1.50) | - |
Total distributions | (.16) | - | (1.73) | - |
Redemption fees added to paid in capital E | - J | - J | .01 | .01 |
Net asset value, end of period | $ 8.32 | $ 8.14 | $ 10.58 | $ 15.67 |
Total Return B, C, D | 4.20% | (23.06)% | (23.80)% | (10.25)% |
Ratios to Average Net Assets F, I | | | | |
Expenses before reductions | 2.19% | 2.19% | 2.14% | 2.11% A |
Expenses net of fee waivers, if any | 2.19% | 2.19% | 2.14% | 2.11% A |
Expenses net of all reductions | 2.14% | 2.17% | 2.11% | 2.01% A |
Net investment income (loss) | 1.26% | 1.81% | .82% | 1.38% A |
Supplemental Data | | | | |
Net assets, end of period (000 omitted) | $ 629 | $ 606 | $ 930 | $ 1,158 |
Portfolio turnover rate G | 95% | 55% | 63% | 144% |
A Annualized
B Total returns for periods of less than one year are not annualized.
C Total returns would have been lower had certain expenses not been reduced during the periods shown.
D Total returns do not include the effect of the contingent deferred sales charge.
E Calculated based on average shares outstanding during the period.
F Fees and expenses of the underlying Fidelity Central Funds are not included in the Fund's expense ratio. The Fund indirectly bears its proportionate share of the expenses of any underlying Fidelity Central Funds.
G Amount does not include the portfolio activity of any underlying Fidelity Central Funds.
H For the period April 4, 2007 (commencement of sale of shares) to July 31, 2007.
I Expense ratios reflect operating expenses of the class. Expenses before reductions do not reflect amounts reimbursed by the investment adviser or reductions from brokerage service arrangements or reductions from other expense offset arrangements and do not represent the amount paid by the class during periods when reimbursements or reductions occur. Expense ratios before reductions for start-up periods may not be representative of longer-term operating periods. Expenses net of fee waivers reflect expenses after reimbursement by the investment adviser but prior to reductions from brokerage service arrangements or other expense offset arrangements. Expenses net of all reductions represent the net expenses paid by the class.
J Amount represents less than $.01 per share.
See accompanying notes which are an integral part of the financial statements.
Annual Report
Financial Highlights - Class C
Years ended July 31, | 2010 | 2009 | 2008 | 2007 H |
Selected Per-Share Data | | | | |
Net asset value, beginning of period | $ 8.13 | $ 10.57 | $ 15.67 | $ 17.46 |
Income from Investment Operations | | | | |
Net investment income (loss) E | .11 | .13 | .11 | .07 |
Net realized and unrealized gain (loss) | .22 | (2.57) | (3.48) | (1.87) |
Total from investment operations | .33 | (2.44) | (3.37) | (1.80) |
Distributions from net investment income | (.04) | - | (.24) | - |
Distributions from net realized gain | (.12) | - | (1.50) | - |
Total distributions | (.16) | - | (1.74) | - |
Redemption fees added to paid in capital E | - J | - J | .01 | .01 |
Net asset value, end of period | $ 8.30 | $ 8.13 | $ 10.57 | $ 15.67 |
Total Return B, C, D | 4.10% | (23.08)% | (23.78)% | (10.25)% |
Ratios to Average Net Assets F, I | | | | |
Expenses before reductions | 2.18% | 2.19% | 2.14% | 2.10% A |
Expenses net of fee waivers, if any | 2.18% | 2.19% | 2.14% | 2.10% A |
Expenses net of all reductions | 2.14% | 2.17% | 2.11% | 2.00% A |
Net investment income (loss) | 1.27% | 1.81% | .82% | 1.35% A |
Supplemental Data | | | | |
Net assets, end of period (000 omitted) | $ 3,201 | $ 2,496 | $ 3,477 | $ 2,629 |
Portfolio turnover rate G | 95% | 55% | 63% | 144% |
A Annualized
B Total returns for periods of less than one year are not annualized.
C Total returns would have been lower had certain expenses not been reduced during the periods shown.
D Total returns do not include the effect of the contingent deferred sales charge.
E Calculated based on average shares outstanding during the period.
F Fees and expenses of the underlying Fidelity Central Funds are not included in the Fund's expense ratio. The Fund indirectly bears its proportionate share of the expenses of any underlying Fidelity Central Funds.
G Amount does not include the portfolio activity of any underlying Fidelity Central Funds.
H For the period April 4, 2007 (commencement of sale of shares) to July 31, 2007.
I Expense ratios reflect operating expenses of the class. Expenses before reductions do not reflect amounts reimbursed by the investment adviser or reductions from brokerage service arrangements or reductions from other expense offset arrangements and do not represent the amount paid by the class during periods when reimbursements or reductions occur. Expense ratios before reductions for start-up periods may not be representative of longer-term operating periods. Expenses net of fee waivers reflect expenses after reimbursement by the investment adviser but prior to reductions from brokerage service arrangements or other expense offset arrangements. Expenses net of all reductions represent the net expenses paid by the class.
J Amount represents less than $.01 per share.
See accompanying notes which are an integral part of the financial statements.
Annual Report
Financial Highlights - International Real Estate
Years ended July 31, | 2010 | 2009 | 2008 | 2007 | 2006 |
Selected Per-Share Data | | | | | |
Net asset value, beginning of period | $ 8.29 | $ 10.68 | $ 15.73 | $ 14.69 | $ 12.09 |
Income from Investment Operations | | | | | |
Net investment income (loss) B | .19 | .20 | .25 | .31 | .30 |
Net realized and unrealized gain (loss) | .25 | (2.59) | (3.50) | 2.35 | 2.93 |
Total from investment operations | .44 | (2.39) | (3.25) | 2.66 | 3.23 |
Distributions from net investment income | (.08) | - | (.31) | (.22) | (.24) |
Distributions from net realized gain | (.12) | - | (1.50) | (1.42) | (.40) |
Total distributions | (.20) | - | (1.81) | (1.64) | (.64) |
Redemption fees added to paid in capital B | - F | - F | .01 | .02 | .01 |
Net asset value, end of period | $ 8.53 | $ 8.29 | $ 10.68 | $ 15.73 | $ 14.69 |
Total Return A | 5.29% | (22.38)% | (22.97)% | 19.01% | 27.85% |
Ratios to Average Net Assets C, E | | | | |
Expenses before reductions | 1.19% | 1.19% | 1.11% | 1.07% | 1.12% |
Expenses net of fee waivers, if any | 1.19% | 1.19% | 1.10% | 1.06% | 1.12% |
Expenses net of all reductions | 1.14% | 1.16% | 1.07% | .96% | .91% |
Net investment income (loss) | 2.27% | 2.81% | 1.86% | 1.86% | 2.23% |
Supplemental Data | | | | | |
Net assets, end of period (000 omitted) | $ 318,032 | $ 336,126 | $ 572,985 | $ 1,032,138 | $ 447,854 |
Portfolio turnover rate D | 95% | 55% | 63% | 144% | 234% |
A Total returns would have been lower had certain expenses not been reduced during the periods shown.
B Calculated based on average shares outstanding during the period.
C Fees and expenses of the underlying Fidelity Central Funds are not included in the Fund's expense ratio. The Fund indirectly bears its proportionate share of the expenses of any underlying Fidelity Central Funds.
D Amount does not include the portfolio activity of any underlying Fidelity Central Funds.
E Expense ratios reflect operating expenses of the class. Expenses before reductions do not reflect amounts reimbursed by the investment adviser or reductions from brokerage service arrangements or reductions from other expense offset arrangements and do not represent the amount paid by the class during periods when reimbursements or reductions occur. Expenses net of fee waivers reflect expenses after reimbursement by the investment adviser but prior to reductions from brokerage service arrangements or other expense offset arrangements. Expenses net of all reductions represent the net expenses paid by the class.
F Amount represents less than $.01 per share.
See accompanying notes which are an integral part of the financial statements.
Annual Report
Financial Highlights - Institutional Class
Years ended July 31, | 2010 | 2009 | 2008 | 2007 G |
Selected Per-Share Data | | | | |
Net asset value, beginning of period | $ 8.28 | $ 10.66 | $ 15.73 | $ 17.46 |
Income from Investment Operations | | | | |
Net investment income (loss) D | .19 | .20 | .24 | .12 |
Net realized and unrealized gain (loss) | .24 | (2.58) | (3.49) | (1.86) |
Total from investment operations | .43 | (2.38) | (3.25) | (1.74) |
Distributions from net investment income | (.08) | - | (.33) | - |
Distributions from net realized gain | (.12) | - | (1.50) | - |
Total distributions | (.20) | - | (1.83) | - |
Redemption fees added to paid in capital D | - I | - I | .01 | .01 |
Net asset value, end of period | $ 8.51 | $ 8.28 | $ 10.66 | $ 15.73 |
Total Return B, C | 5.18% | (22.33)% | (22.98)% | (9.91)% |
Ratios to Average Net Assets E, H | | | | |
Expenses before reductions | 1.18% | 1.19% | 1.13% | 1.08% A |
Expenses net of fee waivers, if any | 1.18% | 1.19% | 1.13% | 1.08% A |
Expenses net of all reductions | 1.14% | 1.17% | 1.10% | .97% A |
Net investment income (loss) | 2.27% | 2.81% | 1.83% | 2.27% A |
Supplemental Data | | | | |
Net assets, end of period (000 omitted) | $ 1,425 | $ 1,600 | $ 3,289 | $ 2,477 |
Portfolio turnover rate F | 95% | 55% | 63% | 144% |
A Annualized
B Total returns for periods of less than one year are not annualized.
C Total returns would have been lower had certain expenses not been reduced during the periods shown.
D Calculated based on average shares outstanding during the period.
E Fees and expenses of the underlying Fidelity Central Funds are not included in the Fund's expense ratio. The Fund indirectly bears its proportionate share of the expenses of any underlying Fidelity Central Funds.
F Amount does not include the portfolio activity of any underlying Fidelity Central Funds.
G For the period April 4, 2007 (commencement of sale of shares) to July 31, 2007.
H Expense ratios reflect operating expenses of the class. Expenses before reductions do not reflect amounts reimbursed by the investment adviser or reductions from brokerage service arrangements or reductions from other expense offset arrangements and do not represent the amount paid by the class during periods when reimbursements or reductions occur. Expense ratios before reductions for start-up periods may not be representative of longer-term operating periods. Expenses net of fee waivers reflect expenses after reimbursement by the investment adviser but prior to reductions from brokerage service arrangements or other expense offset arrangements. Expenses net of all reductions represent the net expenses paid by the class.
I Amount represents less than $.01 per share.
See accompanying notes which are an integral part of the financial statements.
Annual Report
Notes to Financial Statements
For the period ended July 31, 2010
1. Organization.
Fidelity International Real Estate Fund (the Fund) is a non-diversified fund of Fidelity Securities Fund (the Trust) and is authorized to issue an unlimited number of shares. The Trust is registered under the Investment Company Act of 1940, as amended (the 1940 Act), as an open-end management investment company organized as a Massachusetts business trust. The Fund offers Class A, Class T, Class B, Class C, International Real Estate, and Institutional Class shares, each of which has equal rights as to assets and voting privileges. Effective after the close of business on September 1, 2010, Class B shares will be closed to new accounts and additional purchases by existing shareholders. Each class has exclusive voting rights with respect to matters that affect that class. Class B shares will automatically convert to Class A shares after a holding period of seven years from the initial date of purchase. Investment income, realized and unrealized capital gains and losses, the common expenses of the Fund, and certain fund-level expense reductions, if any, are allocated on a pro-rata basis to each class based on the relative net assets of each class to the total net assets of the Fund. Each class differs with respect to transfer agent and distribution and service plan fees incurred. Certain expense reductions also differ by class. The Fund's investments in emerging markets can be subject to social, economic, regulatory, and political uncertainties and can be extremely volatile.
2. Investments in Fidelity Central Funds.
The Fund may invest in Fidelity Central Funds, which are open-end investment companies available only to other investment companies and accounts managed by Fidelity Management & Research Company (FMR) and its affiliates. The Fund's Schedule of Investments lists each of the Fidelity Central Funds held as of period end, if any, as an investment of the Fund, but does not include the underlying holdings of each Fidelity Central Fund. As an Investing Fund, the Fund indirectly bears its proportionate share of the expenses of the underlying Fidelity Central Funds.
The Money Market Central Funds seek preservation of capital and current income and are managed by Fidelity Investments Money Management, Inc. (FIMM), an affiliate of FMR.
A complete unaudited list of holdings for each Fidelity Central Fund is available upon request or at the Securities and Exchange Commission (the SEC) web site at www.sec.gov. In addition, the financial statements of the Fidelity Central Funds which are not covered by the Fund's Report of Independent Registered Public Accounting Firm, are available on the SEC web site or upon request.
Annual Report
Notes to Financial Statements - continued
3. Significant Accounting Policies.
The financial statements have been prepared in conformity with accounting principles generally accepted in the United States of America (GAAP), which require management to make certain estimates and assumptions at the date of the financial statements. Actual results could differ from those estimates. The following summarizes the significant accounting policies of the Fund:
Security Valuation. Investments are valued as of 4:00 p.m. Eastern time on the last calendar day of the period. The Fund uses independent pricing services approved by the Board of Trustees to value its investments. When current market prices or quotations are not readily available or reliable, valuations may be determined in good faith in accordance with procedures adopted by the Board of Trustees. Factors used in determining value may include market or security specific events. The frequency with which these procedures are used cannot be predicted and they may be utilized to a significant extent. The value used for net asset value (NAV) calculation under these procedures may differ from published prices for the same securities.
The Fund categorizes the inputs to valuation techniques used to value its investments into a disclosure hierarchy consisting of three levels as shown below.
Level 1 - quoted prices in active markets for identical investments
Level 2 - other significant observable inputs (including quoted prices for similar investments, interest rates, prepayment speeds, etc.)
Level 3 - unobservable inputs (including the fund's own assumptions based on the best information available)
Changes in valuation techniques may result in transfers in or out of an assigned level within the disclosure hierarchy. Valuation techniques used to value the Fund's investments by major category are as follows.
Equity securities, including restricted securities, for which market quotations are readily available, are valued at the last reported sale price or official closing price as reported by an independent pricing service on the primary market or exchange on which they are traded and are categorized as Level 1 in the hierarchy. In the event there were no sales during the day or closing prices are not available, securities are valued at the last quoted bid price or may be valued using the last available price and are generally categorized as Level 2 in the hierarchy. For foreign equity securities, when significant market or security specific events arise, comparisons to the valuation of American Depositary Receipts (ADRs), futures contracts, Exchange-traded funds (ETFs) and certain indexes as well as quoted prices for similar securities are used and are categorized as Level 2 in the hierarchy in these circumstances. Utilizing these techniques may result in transfers between Level 1 and Level 2. For restricted equity securities and private placements where
Annual Report
3. Significant Accounting Policies - continued
Security Valuation - continued
observable inputs are limited, assumptions about market activity and risk are used and are categorized as Level 3 in the hierarchy.
Investments in open-end mutual funds, including the Fidelity Central Funds, are valued at their closing net asset value each business day and are categorized as Level 1 in the hierarchy. Short-term securities with remaining maturities of sixty days or less for which quotations are not readily available are valued at amortized cost, which approximates fair value and are categorized as Level 2 in the hierarchy.
Foreign Currency. The Fund uses foreign currency contracts to facilitate transactions in foreign-denominated securities. Gains and losses from these transactions may arise from changes in the value of the foreign currency or if the counterparties do not perform under the contracts' terms.
Foreign-denominated assets, including investment securities, and liabilities are translated into U.S. dollars at the exchange rate at period end. Purchases and sales of investment securities, income and dividends received and expenses denominated in foreign currencies are translated into U.S. dollars at the exchange rate in effect on the transaction date.
The effects of exchange rate fluctuations on investments are included with the net realized and unrealized gain (loss) on investment securities. Other foreign currency transactions resulting in realized and unrealized gain (loss) are disclosed separately.
Investment Transactions and Income. For financial reporting purposes, the Fund's investment holdings and NAV include trades executed through the end of the last business day of the period. The NAV per share for processing shareholder transactions is calculated as of the close of business of the New York Stock Exchange (NYSE), normally 4:00 p.m. Eastern time and includes trades executed through the end of the prior business day. Gains and losses on securities sold are determined on the basis of identified cost and may include proceeds received from litigation. Dividend income is recorded on the ex-dividend date, except for certain dividends from foreign securities where the ex-dividend date may have passed, which are recorded as soon as the Fund is informed of the ex-dividend date. Non-cash dividends included in dividend income, if any, are recorded at the fair market value of the securities received. Distributions received on securities that represent a return of capital or capital gain are recorded as a reduction of cost of investments and/or as a realized gain. The Fund estimates the components of distributions received that may be considered return of capital distributions or capital gain distributions. Interest income and distributions from the Fidelity Central Funds are accrued as earned. Interest income includes coupon interest and amortization of
Annual Report
Notes to Financial Statements - continued
3. Significant Accounting Policies - continued
Investment Transactions and Income - continued
premium and accretion of discount on debt securities. Investment income is recorded net of foreign taxes withheld where recovery of such taxes is uncertain.
Expenses. Most expenses of the Trust can be directly attributed to a fund. Expenses which cannot be directly attributed are apportioned amongst each fund in the Trust. Expense estimates are accrued in the period to which they relate and adjustments are made when actual amounts are known.
Income Tax Information and Distributions to Shareholders. Each year the Fund intends to qualify as a regulated investment company, including distributing substantially all of its taxable income and realized gains under Subchapter M of the Internal Revenue Code and filing its U.S. federal tax return. As a result, no provision for income taxes is required. As of July 31, 2010, the Fund did not have any unrecognized tax benefits in the accompanying financial statements. A fund's federal tax return is subject to examination by the Internal Revenue Service (IRS) for a period of three years. Foreign taxes are provided for based on the Fund's understanding of the tax rules and rates that exist in the foreign markets in which it invests.
Distributions are recorded on the ex-dividend date. Income dividends and capital gain distributions are declared separately for each class. Income and capital gain distributions are determined in accordance with income tax regulations, which may differ from GAAP.
Capital accounts within the financial statements are adjusted for permanent book-tax differences. These adjustments have no impact on net assets or the results of operations. Temporary book-tax differences will reverse in a subsequent period.
Book-tax differences are primarily due to the short-term gain distributions from the Fidelity Central Funds, foreign currency transactions, certain foreign taxes, passive foreign investment companies (PFIC), capital loss carryforwards and losses deferred due to wash sales and excise tax regulations.
The federal tax cost of investment securities and unrealized appreciation (depreciation) as of period end were as follows:
Gross unrealized appreciation | $ 15,966,603 |
Gross unrealized depreciation | (53,722,570) |
Net unrealized appreciation (depreciation) | $ (37,755,967) |
| |
Tax Cost | $ 374,299,736 |
Annual Report
3. Significant Accounting Policies - continued
Income Tax Information and Distributions to Shareholders - continued
The tax-based components of distributable earnings as of period end were as follows:
Undistributed ordinary income | $ 10,682,386 |
Capital loss carryforward | $ (296,042,629) |
Net unrealized appreciation (depreciation) | $ (37,770,429) |
The tax character of distributions paid was as follows:
| July 31, 2010 | July 31, 2009 |
Ordinary Income | $ 8,253,685 | $ - |
Short-Term Trading (Redemption) Fees. Shares held in the Fund less than 90 days are subject to a redemption fee equal to 1.50% of the proceeds of the redeemed shares. All redemption fees, including any estimated redemption fees paid by FMR, are retained by the Fund and accounted for as an addition to paid in capital.
4. Purchases and Sales of Investments.
Purchases and sales of securities, other than short-term securities, aggregated $325,000,207 and $341,062,548, respectively.
5. Fees and Other Transactions with Affiliates.
Management Fee. FMR and its affiliates provide the Fund with investment management related services for which the Fund pays a monthly management fee. The management fee is the sum of an individual fund fee rate that is based on an annual rate of .45% of the Fund's average net assets and a group fee rate that averaged .26% during the period. The group fee rate is based upon the average net assets of all the mutual funds advised by FMR. The group fee rate decreases as assets under management increase and increases as assets under management decrease. For the period, the total annual management fee rate was .71% of the Fund's average net assets.
Annual Report
Notes to Financial Statements - continued
5. Fees and Other Transactions with Affiliates - continued
Distribution and Service Plan. In accordance with Rule 12b-1 of the 1940 Act, the Fund has adopted separate Distribution and Service Plans for each class of shares. Certain classes pay Fidelity Distributors Corporation (FDC), an affiliate of FMR, separate Distribution and Service Fees, each of which is based on an annual percentage of each class' average net assets. In addition, FDC may pay financial intermediaries for selling shares of the Fund and providing shareholder support services. For the period, the Distribution and Service Fee rates and the total amounts paid to and retained by FDC were as follows:
| Distribution
Fee | Service
Fee | Paid to
FDC | Retained
by FDC |
Class A | -% | .25% | $ 18,350 | $ 84 |
Class T | .25% | .25% | 12,516 | - |
Class B | .75% | .25% | 6,499 | 4,878 |
Class C | .75% | .25% | 28,334 | 5,047 |
| | | $ 65,699 | $ 10,009 |
Sales Load. FDC receives a front-end sales charge of up to 5.75% for selling Class A shares, and 3.50% for selling Class T shares, some of which is paid to financial intermediaries for selling shares of the Fund. FDC receives the proceeds of contingent deferred sales charges levied on Class A, Class T, Class B, and Class C redemptions. These charges depend on the holding period. The deferred sales charges range from 5% to 1% for Class B, 1% for Class C, 1.00% for certain purchases of Class A (1.00% to .50% prior to July 12, 2010) shares and .25% for certain purchases of Class T shares.
For the period, sales charge amounts retained by FDC were as follows:
| Retained
by FDC |
Class A | $ 5,334 |
Class T | 1,005 |
Class B* | 1,954 |
Class C* | 226 |
| $ 8,519 |
* When Class B and Class C shares are initially sold, FDC pays commissions from its own resources to financial intermediaries through which the sales are made.
Transfer Agent Fees. Fidelity Investments Institutional Operations Company, Inc. (FIIOC), an affiliate of FMR, is the transfer, dividend disbursing and shareholder servicing agent for each class of the Fund. FIIOC receives account fees and asset-based fees that vary according to the account size and type of account of the shareholders of the
Annual Report
5. Fees and Other Transactions with Affiliates - continued
Transfer Agent Fees - continued
respective classes of the Fund. FIIOC pays for typesetting, printing and mailing of shareholder reports, except proxy statements. For the period, the total transfer agent fees paid by each class were as follows:
| Amount | % of
Average
Net Assets |
Class A | $ 23,744 | .32 |
Class T | 8,383 | .34 |
Class B | 2,112 | .32 |
Class C | 9,107 | .32 |
International Real Estate | 1,096,002 | .32 |
Institutional Class | 5,134 | .32 |
| $ 1,144,482 | |
Accounting and Security Lending Fees. Fidelity Service Company, Inc. (FSC), an affiliate of FMR, maintains the Fund's accounting records. The accounting fee is based on the level of average net assets for the month. Under a separate contract, FSC administers the security lending program. The security lending fee is based on the number and duration of lending transactions.
Brokerage Commissions. The Fund placed a portion of its portfolio transactions with brokerage firms which are affiliates of the investment adviser. The commissions paid to these affiliated firms were $27 for the period.
6. Committed Line of Credit.
The Fund participates with other funds managed by FMR in a $3.75 billion credit facility (the "line of credit") to be utilized for temporary or emergency purposes to fund shareholder redemptions or for other short-term liquidity purposes. The Fund has agreed to pay commitment fees on its pro-rata portion of the line of credit, which amounted to $1,415 and is reflected in Miscellaneous expenses on the Statement of Operations. During the period, there were no borrowings on this line of credit.
7. Security Lending.
The Fund lends portfolio securities from time to time in order to earn additional income. On the settlement date of the loan, the Fund receives collateral (in the form of U.S. Treasury obligations, letters of credit and/or cash) against the loaned securities and maintains collateral in an amount not less than 100% of the market value of the loaned securities during the period of the loan. The market value of the loaned securities is
Annual Report
Notes to Financial Statements - continued
7. Security Lending - continued
determined at the close of business of the Fund and any additional required collateral is delivered to the Fund on the next business day. If the borrower defaults on its obligation to return the securities loaned because of insolvency or other reasons, a fund could experience delays and costs in recovering the securities loaned or in gaining access to the collateral. Any cash collateral received is invested in the Fidelity Securities Lending Cash Central Fund. The value of loaned securities and cash collateral at period end are disclosed on the Fund's Statement of Assets and Liabilities. Security lending income represents the income earned on investing cash collateral, less fees and expenses associated with the loan, plus any premium payments that may be received on the loan of certain types of securities. Security lending income is presented in the Statement of Operations as a component of income from Fidelity Central Funds. Net income from lending portfolio securities during the period amounted to $109,121.
8. Expense Reductions.
Many of the brokers with whom FMR places trades on behalf of the Fund provided services to the Fund in addition to trade execution. These services included payments of certain expenses on behalf of the Fund totaling $161,983 for the period. In addition, through arrangements with the Fund's custodian, credits realized as a result of uninvested cash balances were used to reduce the Fund's expenses. During the period, these credits reduced the Fund's custody expenses by $59.
9. Distributions to Shareholders.
Distributions to shareholders of each class were as follows:
Years ended July 31, | 2010 | 2009 |
From net investment income | | |
Class A | $ 58,598 | $ - |
Class T | 19,755 | - |
Class B | 3,225 | - |
Class C | 14,423 | - |
International Real Estate | 3,124,751 | - |
Institutional Class | 15,018 | - |
Total | $ 3,235,770 | $ - |
From net realized gain | | |
Class A | $ 101,910 | $ - |
Class T | 37,040 | - |
Class B | 9,214 | - |
Class C | 39,337 | - |
International Real Estate | 4,807,309 | - |
Institutional Class | 23,105 | - |
Total | $ 5,017,915 | $ - |
Annual Report
10. Share Transactions.
Transactions for each class of shares were as follows:
| Shares | Dollars |
Years ended July 31, | 2010 | 2009 | 2010 | 2009 |
Class A | | | | |
Shares sold | 365,681 | 276,074 | $ 3,120,303 | $ 2,073,370 |
Reinvestment of distributions | 15,947 | - | 134,591 | - |
Shares redeemed | (343,205) | (395,339) | (2,901,988) | (2,671,924) |
Net increase (decrease) | 38,423 | (119,265) | $ 352,906 | $ (598,554) |
Class T | | | | |
Shares sold | 132,643 | 127,919 | $ 1,140,128 | $ 986,052 |
Reinvestment of distributions | 6,259 | - | 52,641 | - |
Shares redeemed | (93,841) | (586,866) | (767,585) | (4,132,628) |
Net increase (decrease) | 45,061 | (458,947) | $ 425,184 | $ (3,146,576) |
Class B | | | | |
Shares sold | 20,099 | 23,179 | $ 169,130 | $ 177,395 |
Reinvestment of distributions | 1,355 | - | 11,297 | - |
Shares redeemed | (20,259) | (36,555) | (169,049) | (251,823) |
Net increase (decrease) | 1,195 | (13,376) | $ 11,378 | $ (74,428) |
Class C | | | | |
Shares sold | 164,953 | 103,043 | $ 1,381,947 | $ 772,724 |
Reinvestment of distributions | 5,842 | - | 48,663 | - |
Shares redeemed | (92,347) | (124,838) | (761,918) | (872,457) |
Net increase (decrease) | 78,448 | (21,795) | $ 668,692 | $ (99,733) |
International Real Estate | | | | |
Shares sold | 9,224,310 | 11,251,723 | $ 79,406,931 | $ 83,151,001 |
Reinvestment of distributions | 875,447 | - | 7,441,303 | - |
Shares redeemed | (13,336,716) | (24,377,998) | (114,385,841) | (173,652,133) |
Net increase (decrease) | (3,236,959) | (13,126,275) | $ (27,537,607) | $ (90,501,132) |
Institutional Class | | | | |
Shares sold | 40,774 | 83,584 | $ 351,025 | $ 621,361 |
Reinvestment of distributions | 4,247 | - | 36,016 | - |
Shares redeemed | (70,819) | (198,948) | (608,371) | (1,465,893) |
Net increase (decrease) | (25,798) | (115,364) | $ (221,330) | $ (844,532) |
11. Other.
The Fund's organizational documents provide former and current trustees and officers with a limited indemnification against liabilities arising in connection with the performance of their duties to the Fund. In the normal course of business, the Fund may also enter into contracts that provide general indemnifications. The Fund's maximum exposure under these arrangements is unknown as this would be dependent on future claims that may be made against the Fund. The risk of material loss from such claims is considered remote.
Annual Report
To the Trustees of Fidelity Securities Fund and the Shareholders of Fidelity International Real Estate Fund:
In our opinion, the accompanying statement of assets and liabilities, including the schedule of investments, and the related statements of operations and of changes in net assets and the financial highlights present fairly, in all material respects, the financial position of Fidelity International Real Estate Fund (a fund of Fidelity Securities Fund) at July 31, 2010, the results of its operations for the year then ended, the changes in its net assets for each of the two years in the period then ended and the financial highlights for the periods indicated, in conformity with accounting principles generally accepted in the United States of America. These financial statements and financial highlights (hereafter referred to as "financial statements") are the responsibility of the Fidelity International Real Estate Fund's management. Our responsibility is to express an opinion on these financial statements based on our audits. We conducted our audits of these financial statements in accordance with the standards of the Public Company Accounting Oversight Board (United States). Those standards require that we plan and perform the audit to obtain reasonable assurance about whether the financial statements are free of material misstatement. An audit includes examining, on a test basis, evidence supporting the amounts and disclosures in the financial statements, assessing the accounting principles used and significant estimates made by management, and evaluating the overall financial statement presentation. We believe that our audits, which included confirmation of securities at July 31, 2010 by correspondence with the custodian and brokers, provide a reasonable basis for our opinion.
/s/ PricewaterhouseCoopers LLP
PricewaterhouseCoopers LLP
Boston, Massachusetts
September 17, 2010
Annual Report
The Trustees, Member of the Advisory Board, and executive officers of the trust and fund, as applicable, are listed below. The Board of Trustees governs the fund and is responsible for protecting the interests of shareholders. The Trustees are experienced executives who meet periodically throughout the year to oversee the fund's activities, review contractual arrangements with companies that provide services to the fund, oversee management of the risks associated with such activities and contractual arrangements, and review the fund's performance. Except for James C. Curvey, each of the Trustees oversees 222 funds advised by FMR or an affiliate. Mr. Curvey oversees 411 funds advised by FMR or an affiliate.
The Trustees hold office without limit in time except that (a) any Trustee may resign; (b) any Trustee may be removed by written instrument, signed by at least two-thirds of the number of Trustees prior to such removal; (c) any Trustee who requests to be retired or who has become incapacitated by illness or injury may be retired by written instrument signed by a majority of the other Trustees; and (d) any Trustee may be removed at any special meeting of shareholders by a two-thirds vote of the outstanding voting securities of the trust. Each Trustee who is not an interested person (as defined in the 1940 Act) (Independent Trustee), shall retire not later than the last day of the calendar year in which his or her 72nd birthday occurs. The Independent Trustees may waive this mandatory retirement age policy with respect to individual Trustees. The executive officers and Advisory Board Member hold office without limit in time, except that any officer and Advisory Board Member may resign or may be removed by a vote of a majority of the Trustees at any regular meeting or any special meeting of the Trustees. Except as indicated, each individual has held the office shown or other offices in the same company for the past five years.
Experience, Skills, Attributes, and Qualifications of the Fund's Trustees. The Governance and Nominating Committee has adopted a statement of policy that describes the experience, qualifications, attributes, and skills that are necessary and desirable for potential Independent Trustee candidates (Statement of Policy). The Board believes that each Trustee satisfied at the time he or she was initially elected or appointed a Trustee, and continues to satisfy, the standards contemplated by the Statement of Policy. The Governance and Nominating Committee also engages professional search firms to help identify potential Independent Trustee candidates who have the experience, qualifications, attributes, and skills consistent with the Statement of Policy. From time to time, additional criteria based on the composition and skills of the current Independent Trustees, as well as experience or skills that may be appropriate in light of future changes to board composition, business conditions, and regulatory or other developments, have also been considered by the professional search firms and the Governance and Nominating Committee. In addition, the Board takes into account the Trustees' commitment and participation in Board and committee meetings, as well as their leadership of standing and ad hoc committees throughout their tenure.
In determining that a particular Trustee was and continues to be qualified to serve as a Trustee, the Board has considered a variety of criteria, none of which, in isolation, was controlling. The Board believes that, collectively, the Trustees have balanced and diverse experience, qualifications, attributes, and skills, which allow the Board to operate effectively in governing the fund and protecting the interests of shareholders. Information about the specific experience, skills, attributes, and qualifications of each Trustee, which in each case led to the Board's conclusion that the Trustee should serve (or continue to serve) as a trustee of the fund, is provided below.
Annual Report
Trustees and Officers - continued
Board Structure and Oversight Function. Edward C. Johnson 3d is an interested person (as defined in the 1940 Act) and currently serves as Chairman. The Trustees have determined that an interested Chairman is appropriate and benefits shareholders because an interested Chairman has a personal and professional stake in the quality and continuity of services provided to the fund. Independent Trustees exercise their informed business judgment to appoint an individual of their choosing to serve as Chairman, regardless of whether the Trustee happens to be independent or a member of management. The Independent Trustees have determined that they can act independently and effectively without having an Independent Trustee serve as Chairman and that a key structural component for assuring that they are in a position to do so is for the Independent Trustees to constitute a substantial majority for the Board. The Independent Trustees also regularly meet in executive session. Ned C. Lautenbach serves as Chairman of the Independent Trustees and as such (i) acts as a liaison between the Independent Trustees and management with respect to matters important to the Independent Trustees and (ii) with management prepares agendas for Board meetings.
Fidelity funds are overseen by different Boards of Trustees. The fund's Board oversees Fidelity's equity and high income funds and another Board oversees Fidelity's investment-grade bond, money market, and asset allocation funds. The asset allocation funds may invest in Fidelity funds overseen by the fund's Board. The use of separate Boards, each with its own committee structure, allows the Trustees of each group of Fidelity funds to focus on the unique issues of the funds they oversee, including common research, investment, and operational issues. On occasion, the separate Boards establish joint committees to address issues of overlapping consequences for the Fidelity funds overseen by each Board.
The Trustees operate using a system of committees to facilitate the timely and efficient consideration of all matters of importance to the Trustees, the fund, and fund shareholders and to facilitate compliance with legal and regulatory requirements and oversight of the fund's activities and associated risks. The Board, acting through its committees, has charged FMR and its affiliates with (i) identifying events or circumstances the occurrence of which could have demonstrably adverse effects on the fund's business and/or reputation; (ii) implementing processes and controls to lessen the possibility that such events or circumstances occur or to mitigate the effects of such events or circumstances if they do occur; and (iii) creating and maintaining a system designed to evaluate continuously business and market conditions in order to facilitate the identification and implementation processes described in (i) and (ii) above. Because the day-to-day operations and activities of the fund are carried out by or through FMR, its affiliates and other service providers, the fund's exposure to risks is mitigated but not eliminated by the processes overseen by the Trustees. While each of the Board's committees has responsibility for overseeing different aspects of the fund's activities, oversight is exercised primarily through the Operations, Audit, and Compliance Committees. Appropriate personnel, including but not limited to the fund's Chief Compliance Officer (CCO), FMR's internal auditor, the independent accountants, the fund's Treasurer and portfolio management personnel, make periodic reports to the Board's committees, as appropriate. The responsibilities of each committee, including their oversight responsibilities, are described further under "Standing Committees of the Fund's Trustees."
Annual Report
The fund's Statement of Additional Information (SAI) includes more information about the Trustees. To request a free copy, call Fidelity at 1-877-208-0098.
Interested Trustees*:
Correspondence intended for each Trustee who is an interested person may be sent to Fidelity Investments, 82 Devonshire Street, Boston, Massachusetts 02109.
Name, Age; Principal Occupations and Other Relevant Experience+ |
Edward C. Johnson 3d (80) |
| Year of Election or Appointment: 1984 Mr. Johnson is Trustee and Chairman of the Board of Trustees of certain Trusts. Mr. Johnson serves as Chief Executive Officer, Chairman, and a Director of FMR LLC; Chairman and a Director of FMR; Chairman and a Director of Fidelity Research & Analysis Company (FRAC); Chairman and a Director of Fidelity Investments Money Management, Inc.; and Chairman and a Director of FMR Co., Inc. In addition, Mr. Johnson serves as Chairman and Director of FIL Limited. Previously, Mr. Johnson served as President of FMR LLC (2006-2007). |
James C. Curvey (75) |
| Year of Election or Appointment: 2007 Mr. Curvey also serves as Trustee (2007-present) of other investment companies advised by FMR. Mr. Curvey is a Director of FMR and FMR Co., Inc. (2007-present). Mr. Curvey is also Vice Chairman (2006-
present) and Director of FMR LLC. In addition, Mr. Curvey serves as an Overseer for the Boston Symphony Orchestra and a member of the Trustees of Villanova University. |
* Trustees have been determined to be "Interested Trustees" by virtue of, among other things, their affiliation with the trust or various entities under common control with FMR.
+ The information above includes each Trustee's principal occupation during the last five years and other information relating to the experience, attributes, and skills relevant to each Trustee's qualifications to serve as a Trustee, which led to the conclusion that each Trustee should serve as a Trustee for the fund.
Annual Report
Trustees and Officers - continued
Independent Trustees:
Correspondence intended for each Independent Trustee (that is, the Trustees other than the Interested Trustees) may be sent to Fidelity Investments, P.O. Box 55235, Boston, Massachusetts 02205-5235.
Name, Age; Principal Occupations and Other Relevant Experience+ |
Dennis J. Dirks (62) |
| Year of Election or Appointment: 2005 Prior to his retirement in May 2003, Mr. Dirks was Chief Operating Officer and a member of the Board of The Depository Trust & Clearing Corporation (DTCC). He also served as President, Chief Operating Officer, and Board member of The Depository Trust Company (DTC) and President and Board member of the National Securities Clearing Corporation (NSCC). In addition, Mr. Dirks served as Chief Executive Officer and Board member of the Government Securities Clearing Corporation, Chief Executive Officer and Board member of the Mortgage-Backed Securities Clearing Corporation, as a Trustee and a member of the Finance Committee of Manhattan College (2005-2008), and as a Trustee and a member of the Finance Committee of AHRC of Nassau County (2006-2008). Currently, Mr. Dirks serves as a member of the Board of Directors for The Brookville Center for Children's Services, Inc. (2009-present). |
Alan J. Lacy (56) |
| Year of Election or Appointment: 2008 Mr. Lacy serves as Senior Adviser (2007-present) of Oak Hill Capital Partners, L.P. (private equity). Mr. Lacy also served as Chief Executive Officer (2000-2005) and Vice Chairman (2005-2006) of Sears Holdings Corporation and Sears, Roebuck and Co. (retail). In addition, Mr. Lacy serves as a member of the Board of Directors of The Western Union Company (global money transfer, 2006-present) and Bristol-Myers Squibb Company (global pharmaceuticals, 2007-present). Mr. Lacy is Chairman (2008-present) and a member (2006-present) of the Board of Trustees of The National Parks Conservation Association. |
Ned C. Lautenbach (66) |
| Year of Election or Appointment: 2000 Mr. Lautenbach is Chairman of the Independent Trustees of the Equity and High Income Funds (2006-present). Mr. Lautenbach is an Advisory Partner of Clayton, Dubilier & Rice, Inc. (private equity investment, 2008-present) and was previously a Partner of Clayton, Dubilier & Rice, Inc. (1998-2008). Previously, Mr. Lautenbach was with the International Business Machines Corporation (IBM) from 1968 until his retirement in 1998. Mr. Lautenbach serves as a Director of Eaton Corporation (diversified industrial) as well as the Philharmonic Center for the Arts in Naples, Florida. Mr. Lautenbach is also a member of the Board of Trustees of Fairfield University (2005-present), as well as a member of the Council on Foreign Relations. Previously, Mr. Lautenbach served as a Director of Sony Corporation (2006-2007). |
Joseph Mauriello (65) |
| Year of Election or Appointment: 2008 Prior to his retirement in January 2006, Mr. Mauriello served in numerous senior management positions including Deputy Chairman and Chief Operating Officer (2004-2005), and Vice Chairman of Financial Services (2002-2004) of KPMG LLP US (professional services, 1965-2005). Mr. Mauriello currently serves as a member of the Board of Directors of XL Capital Ltd. (global insurance and re-insurance, 2006-present) and of Arcadia Resources Inc. (health care services and products, 2007-
present). Previously, Mr. Mauriello served as a Director of the Hamilton Funds of the Bank of New York (2006-2007). |
Cornelia M. Small (66) |
| Year of Election or Appointment: 2005 Ms. Small is a member of the Board of Directors of the Teagle Foundation (2009-present). Ms. Small is also a member of the Investment Committee, and Chair (2008-present) and a member of the Board of Trustees of Smith College. In addition, Ms. Small serves on the Investment Committee of the Berkshire Taconic Community Foundation (2008-present). Previously, Ms. Small served as Chairperson of the Investment Committee (2002-2008) of Smith College. In addition, Ms. Small served as Chief Investment Officer, Director of Global Equity Investments, and a member of the Board of Directors of Scudder, Stevens & Clark and Scudder Kemper Investments. |
William S. Stavropoulos (71) |
| Year of Election or Appointment: 2002 Mr. Stavropoulos is Vice Chairman of the Independent Trustees of the Equity and High Income Funds (2006-present). Mr. Stavropoulos serves as President and Founder of the Michigan Baseball Foundation, the Great Lakes Loons (2007-present). Mr. Stavropoulos is Chairman Emeritus of the Board of Directors of The Dow Chemical Company, where he previously served in numerous senior management positions, including President, CEO (1995-2000; 2002-2004), Chairman of the Executive Committee (2000-2006), and as a member of the Board of Directors (1990-2006). Currently, Mr. Stavropoulos is a Director of Teradata Corporation (data warehousing and technology solutions, 2008-present), Chemical Financial Corporation, Maersk Inc. (industrial conglomerate), Tyco International, Inc. (multinational manufacturing and services, 2007-present), and a member of the Advisory Board for Metalmark Capital (private equity investment, 2005-present). Mr. Stavropoulos is a special advisor to Clayton, Dubilier & Rice, Inc. (private equity investment). In addition, Mr. Stavropoulos is a member of the University of Notre Dame Advisory Council for the College of Science. |
David M. Thomas (61) |
| Year of Election or Appointment: 2008 Previously, Mr. Thomas served as Executive Chairman (2005-2006) and Chairman and Chief Executive Officer (2000-2005) of IMS Health, Inc. (pharmaceutical and healthcare information solutions). In addition, Mr. Thomas serves as a member of the Board of Directors of Fortune Brands, Inc. (consumer products), and Interpublic Group of Companies, Inc. (marketing communication, 2004-present). |
Michael E. Wiley (59) |
| Year of Election or Appointment: 2008 Mr. Wiley also serves as a Director of Asia Pacific Exploration Consolidated (international oil and gas exploration and production, 2008-
present), and as a member of the Board of Trustees of the University of Tulsa (2000-2006; 2007-present). Mr. Wiley serves as a Director of Tesoro Corporation (independent oil refiner and marketer, 2005-present), and a Director of Bill Barrett Corporation (exploration and production, 2005-present). In addition, Mr. Wiley also serves as a Director of Post Oak Bank (privately-held bank, 2004-present). Previously, Mr. Wiley served as a Sr. Energy Advisor of Katzenbach Partners, LLC (consulting, 2006-2007), as an Advisory Director of Riverstone Holdings (private investment), Chairman, President, and CEO of Baker Hughes, Inc. (oilfield services, 2000-2004), and as Director of Spinnaker Exploration Company (exploration and production, 2001-2005). |
Annual Report
+ The information above includes each Trustee's principal occupation during the last five years and other information relating to the experience, attributes, and skills relevant to each Trustee's qualifications to serve as a Trustee, which led to the conclusion that each Trustee should serve as a Trustee for the fund.
Advisory Board Member and Executive Officers:
Correspondence intended for each executive officer and Peter S. Lynch may be sent to Fidelity Investments, 82 Devonshire Street, Boston, Massachusetts 02109.
Name, Age; Principal Occupation |
Peter S. Lynch (66) |
| Year of Election or Appointment: 2003 Member of the Advisory Board of Fidelity's Equity and High Income Funds. Mr. Lynch is Vice Chairman and a Director of FMR and FMR Co., Inc. In addition, Mr. Lynch serves as a Trustee of Boston College and as the Chairman of the Inner-City Scholarship Fund. Previously, Mr. Lynch served on the Special Olympics International Board of Directors (1997-2006). |
Kenneth B. Robins (40) |
| Year of Election or Appointment: 2008 President and Treasurer of Fidelity's Equity and High Income Funds. Mr. Robins also serves as President and Treasurer (2010-present) and Assistant Treasurer (2009-present) of other Fidelity funds and is an employee of Fidelity Investments (2004-present). Previously, Mr. Robins served as Deputy Treasurer of the Fidelity funds (2005-2008) and Treasurer and Chief Financial Officer of The North Carolina Capital Management Trust: Cash and Term Portfolios (2006-2008). |
Brian B. Hogan (45) |
| Year of Election or Appointment: 2009 Vice President of certain Equity Funds and Vice President of Sector Funds. Mr. Hogan also serves as Senior Vice President, Equity Research of FMR (2006-present) and President of FMR's Equity Division (2009-present). Previously, Mr. Hogan served as a portfolio manager. |
Christopher S. Bartel (38) |
| Year of Election or Appointment: 2009 Vice President of Fidelity's Sector and Real Estate Equity Funds. Mr. Bartel also serves as Senior Vice President of Equity Research (2009-present). Previously, Mr. Bartel served as Managing Director of Research (2006-2009) and an analyst and portfolio manager (2000-2006). |
Scott C. Goebel (42) |
| Year of Election or Appointment: 2008 Secretary and Chief Legal Officer (CLO) of the Fidelity funds. Mr. Goebel also serves as General Counsel, Secretary, and Senior Vice President of FMR (2008-present) and FMR Co., Inc. (2008-present); Deputy General Counsel of FMR LLC; Chief Legal Officer of Fidelity Management & Research (Hong Kong) Limited (2008-present) and Assistant Secretary of Fidelity Management & Research (Japan) Inc. (2008-present), Fidelity Investments Money Management, Inc. (2008-present), Fidelity Management & Research (U.K.) Inc. (2008-present), and Fidelity Research and Analysis Company (2008-present). Previously, Mr. Goebel served as Assistant Secretary of the Funds (2007-2008) and as Vice President and Secretary of Fidelity Distributors Corporation (FDC) (2005-2007). |
William C. Coffey (41) |
| Year of Election or Appointment: 2009 Assistant Secretary of Fidelity's Equity and High Income Funds. Mr. Coffey also serves as Senior Vice President and Deputy General Counsel of FMR LLC (2010-present), and is an employee of Fidelity Investments. Previously, Mr. Coffey served as Vice President and Associate General Counsel of FMR LLC (2005-2009). |
Holly C. Laurent (56) |
| Year of Election or Appointment: 2008 Anti-Money Laundering (AML) Officer of the Fidelity funds. Ms. Laurent is an employee of Fidelity Investments. Previously, Ms. Laurent was Senior Vice President and Head of Legal for Fidelity Business Services India Pvt. Ltd. (2006-2008), and Senior Vice President, Deputy General Counsel and Group Head for FMR LLC (2005-2006). |
Christine Reynolds (51) |
| Year of Election or Appointment: 2008 Chief Financial Officer of the Fidelity funds. Ms. Reynolds became President of Fidelity Pricing and Cash Management Services (FPCMS) in August 2008. Ms. Reynolds served as Chief Operating Officer of FPCMS (2007-2008). Previously, Ms. Reynolds served as President, Treasurer, and Anti-Money Laundering officer of the Fidelity funds (2004-2007). |
Kenneth A. Rathgeber (63) |
| Year of Election or Appointment: 2004 Chief Compliance Officer of Fidelity's Equity and High Income Funds. Mr. Rathgeber is Chief Compliance Officer of Fidelity Management & Research (Hong Kong) Limited (2008-present), Fidelity Management & Research (Japan) Inc. (2008-present), FMR (2005-present), FMR Co., Inc. (2005-present), Fidelity Management & Research (U.K.) Inc. (2005-present), Fidelity Research & Analysis Company (2005-present), Fidelity Investments Money Management, Inc. (2005-present), Pyramis Global Advisors, LLC (2005-present), and Strategic Advisers, Inc.(2005-present). |
Jeffrey S. Christian (48) |
| Year of Election or Appointment: 2009 Deputy Treasurer of the Fidelity funds. Mr. Christian is an employee of Fidelity Investments. Previously, Mr. Christian served as Chief Financial Officer (2008-2009) of certain Fidelity funds and Senior Vice President of Fidelity Pricing and Cash Management Services (FPCMS) (2004-2009). |
Bryan A. Mehrmann (49) |
| Year of Election or Appointment: 2005 Deputy Treasurer of the Fidelity funds. Mr. Mehrmann is an employee of Fidelity Investments. |
Adrien E. Deberghes (42) |
| Year of Election or Appointment: 2008 Deputy Treasurer of Fidelity's Equity and High Income Funds. Mr. Deberghes also serves as Assistant Treasurer of other Fidelity funds (2010-present) and is an employee of Fidelity Investments (2008-present). Previously, Mr. Deberghes served as Senior Vice President of Mutual Fund Administration at State Street Corporation (2007-2008), Senior Director of Mutual Fund Administration at Investors Bank & Trust (2005-2007), and Director of Finance for Dunkin' Brands (2000-2005). |
Stephanie J. Dorsey (41) |
| Year of Election or Appointment: 2010 Assistant Treasurer of Fidelity's Equity and High Income Funds. Ms. Dorsey also serves as Deputy Treasurer of other Fidelity funds (2008-present) and is an employee of Fidelity Investments (2008-present). Previously, Ms. Dorsey served as Treasurer (2004-2008) of the JPMorgan Mutual Funds and Vice President (2004-2008) of JPMorgan Chase Bank. |
John R. Hebble (52) |
| Year of Election or Appointment: 2009 Assistant Treasurer of Fidelity's Equity and High Income Funds. Mr. Hebble also serves as Treasurer and Chief Financial Officer of The North Carolina Capital Management Trust: Cash and Term Portfolio (2008-present), President and Treasurer of other Fidelity funds (2008-present) and is an employee of Fidelity Investments. |
Gary W. Ryan (51) |
| Year of Election or Appointment: 2005 Assistant Treasurer of the Fidelity funds. Mr. Ryan is an employee of Fidelity Investments. Previously, Mr. Ryan served as Vice President of Fund Reporting in Fidelity Pricing and Cash Management Services (FPCMS) (1999-2005). |
Annual Report
Distributions (Unaudited)
The Board of Trustees of Fidelity Advisor International Real Estate Fund voted to pay on September 9, 2010, to shareholders of record at the opening of business on September 8, 2010, a distribution of $.158 per share derived from capital gains realized from sales of portfolio securities, and a dividend of $.123 per share from net investment income.
Institutional Class designates 9% of the dividends distributed in December 2009 during the fiscal year as amounts which may be taken into account as a dividend for purposes of the maximum rate under section 1(h)(11) of the Internal Revenue Code.
The amounts per share which represents income derived from sources within, and taxes paid to, foreign countries or possessions of the United States are as follows:
Pay Date | Income | Taxes |
12/21/09 | $.078 | $.0049 |
The fund will notify shareholders in January 2011 of amounts for use in preparing 2010 income tax returns.
Annual Report
Board Approval of Investment Advisory Contracts and Management Fees
Fidelity International Real Estate Fund
Each year, the Board of Trustees, including the Independent Trustees (together, the Board), votes on the renewal of the management contract and sub-advisory agreements (together, the Advisory Contracts) for the fund. The Board, assisted by the advice of fund counsel and Independent Trustees' counsel, requests and considers a broad range of information relevant to the renewal of the Advisory Contracts throughout the year.
The Board meets regularly and considers at each of its meetings factors that are relevant to its annual consideration of the renewal of the fund's Advisory Contracts, including the services and support provided to the fund and its shareholders. The Board has established various standing committees, each composed of Independent Trustees with varying backgrounds, to which the Board has assigned specific subject matter responsibilities in order to enhance effective decision-making by the Board. The Board, acting directly and through its Committees, requests and receives information concerning the annual consideration of the renewal of the fund's Advisory Contracts. The Board also meets as needed to consider matters specifically related to the Board's annual consideration of the renewal of Advisory Contracts. Members of the Board may also meet with trustees of other Fidelity funds through ad hoc joint committees to discuss certain matters relevant to the Fidelity funds.
At its July 2010 meeting, the Board of Trustees, including the Independent Trustees, unanimously determined to renew the fund's Advisory Contracts. In reaching its determination, the Board considered all factors it believed relevant, including (i) the nature, extent, and quality of the services to be provided to the fund and its shareholders (including the investment performance of the fund); (ii) the competitiveness of the fund's management fee and total expenses; (iii) the total costs of the services to be provided by and the profits to be realized by Fidelity from its relationship with the fund; (iv) the extent to which economies of scale would be realized as the fund grows; and (v) whether fee levels reflect these economies of scale, if any, for the benefit of fund shareholders.
In considering whether to renew the Advisory Contracts for the fund, the Board reached a determination, with the assistance of fund counsel and Independent Trustees' counsel and through the exercise of its business judgment, that the renewal of the Advisory Contracts is in the best interests of fund shareholders and that the compensation to be received by Fidelity under the management contract is fair and reasonable. The Board's decision to renew the Advisory Contracts was not based on any single factor noted above, but rather was based on a comprehensive consideration of all the information provided to the Board at its meetings throughout the year. The Board, in reaching its determination to renew the Advisory Contracts, is aware that shareholders in the fund have a broad range of investment choices available to them, including a wide choice among mutual funds offered by Fidelity's competitors, and that the fund's shareholders, with the opportunity to review and weigh the disclosure provided by the fund in its prospectus and other public disclosures, have chosen to invest in this fund, managed by Fidelity.
Annual Report
Nature, Extent, and Quality of Services Provided. The Board considered the staffing within the investment adviser, FMR, and the sub-advisers (together, the Investment Advisers), including the backgrounds of the fund's investment personnel and the fund's investment objective and discipline. The Independent Trustees also had discussions with senior management of Fidelity's investment operations and investment groups. The Board considered the structure of the portfolio manager compensation program and whether this structure provides appropriate incentives to act in the best interest of the fund.
Resources Dedicated to Investment Management and Support Services. The Board and the equity research subcommittee of the Board's Fund Oversight Committee reviewed the size, education, and experience of the Investment Advisers' investment staff, their use of technology, and the Investment Advisers' approach to recruiting, training, and retaining portfolio managers and other research, advisory, and management personnel. The Board noted that Fidelity's analysts have access to a variety of technological tools and market and securities data that enable them to perform both fundamental and quantitative analysis and to specialize in various disciplines. The Board considered Fidelity's extensive global research capabilities that enable the Investment Advisers to aggregate data from various sources in an effort to produce positive investment results. The Board also considered that Fidelity's portfolio managers and analysts have access to daily portfolio attribution that allows for monitoring of a fund's portfolio, as well as an electronic communication system that provides immediate real-time access to research concerning issuers and credit enhancers. The Board noted FMR's continued focus on strengthening the organization and discipline of equity portfolio management and research.
Shareholder and Administrative Services. The Board considered (i) the nature, extent, quality, and cost of advisory, administrative, and shareholder services performed by the Investment Advisers and their affiliates under the Advisory Contracts and under separate agreements covering transfer agency, pricing and bookkeeping, and securities lending services for the fund; (ii) the nature and extent of the investment adviser's supervision of third party service providers, principally custodians and subcustodians; and (iii) the resources devoted to, and the record of compliance with, the fund's compliance policies and procedures. The Board also reviewed the allocation of fund brokerage, including allocations to brokers affiliated with the Investment Advisers, the use of brokerage commissions to pay fund expenses, and the use of "soft" commission dollars to pay for research services.
The Board noted that the growth of fund assets over time across the complex allows Fidelity to reinvest in the development of services designed to enhance the value or convenience of the Fidelity funds as investment vehicles. These services include 24-hour access to account information and market information through phone representatives and over the Internet, and investor education materials and asset allocation tools.
Annual Report
Board Approval of Investment Advisory Contracts and
Management Fees - continued
Investment in a Large Fund Family. The Board considered the benefits to shareholders of investing in a Fidelity fund, including the benefits of investing in a fund that is part of a large family of funds offering a variety of investment disciplines and providing a large variety of mutual fund investor services. The Board noted that Fidelity had taken, or had made recommendations that resulted in the Fidelity funds taking, a number of actions over the previous year that benefited particular funds, including (i) dedicating additional resources to investment research and restructuring and broadening the focus of the investment research teams; (ii) bolstering the senior management team that oversees asset management; (iii) launching Class F of certain funds as a lower-fee class available to Freedom K and Freedom Index Funds; (iv) lowering the initial investment minimums and ongoing balance requirements for Real Estate High Income Fund; (v) eliminating subsequent purchase minimums for all funds and adding a waiver of the investment minimum requirement for new accounts opened with the proceeds of a systematic withdrawal plan; (vi) eliminating the withdrawal minimum and maximum limits for systematic withdrawals from Advisor funds; (vii) expanding sales load waivers on Class A shares for Destiny Planholders and expanding Institutional Class eligibility for Class O Destiny Planholders; and (viii) changing certain Class A and Class T sales charge structures to further align them with industry practices.
Investment Performance. The Board considered whether the fund has operated in accordance with its investment objective, as well as its record of compliance with its investment restrictions. It also reviewed the fund's absolute investment performance for each class, as well as the fund's relative investment performance for each class measured over multiple periods against a broad-based securities market index. The Board noted that FMR does not believe that a meaningful peer group exists against which to compare the fund's performance. The following charts considered by the Board show, over the one-, three, and five-year periods ended December 31, 2009, as available, the cumulative total returns of Institutional Class (Class I) and the retail class of the fund and the cumulative total returns of a broad-based securities market index ("benchmark").
Annual Report
Fidelity International Real Estate Fund
The Board noted that the investment performance of the fund was lower than its benchmark for all the periods shown. The Board discussed with FMR actions that have been taken by FMR to improve the fund's below-benchmark performance. The Board also reviewed the fund's performance since inception as well as performance in the current year. The Board will continue to closely monitor the performance of the fund in the coming year and discuss with FMR other appropriate actions to address the performance of the fund. The Board considered that the variations in performance among the fund's classes reflect the variations in class expenses, which result in lower performance for higher expense classes.
Based on its review, and giving particular weight to the nature and quality of the resources dedicated by the Investment Advisers to maintain and improve relative performance and factoring in the unprecedented market events in recent years, the Board concluded that the nature, extent, and quality of investment management and support services and of shareholder and administrative services provided to the fund will benefit the fund's shareholders, particularly in light of the Board's view that the fund's shareholders benefit from investing in a fund that is part of a large family of funds offering a variety of investment disciplines and services.
Competitiveness of Management Fee and Total Fund Expenses. The Board considered the fund's management fee and total expenses compared to "mapped groups" of competitive funds and classes. Fidelity creates "mapped groups" by combining similar Lipper investment objective categories that have comparable management fee characteristics. Combining Lipper investment objective categories aids the Board's management fee and total expense comparisons by broadening the competitive group used for comparison and by reducing the number of universes to which various Fidelity funds are compared.
Annual Report
Board Approval of Investment Advisory Contracts and
Management Fees - continued
Management Fee. The Board considered two proprietary management fee comparisons for the 12-month periods shown in the chart below. The group of Lipper funds used by the Board for management fee comparisons is referred to below as the "Total Mapped Group." The Total Mapped Group comparison focuses on a fund's standing relative to the total universe of comparable funds available to investors, in terms of gross management fees before expense reimbursements or caps. "TMG %" represents the percentage of funds in the Total Mapped Group that had management fees that were lower than the fund's. For example, a TMG % of 29% means that 71% of the funds in the Total Mapped Group had higher management fees than the fund. The "Asset-Size Peer Group" (ASPG) comparison focuses on a fund's standing relative to non-Fidelity funds similar in size to the fund within the Total Mapped Group. The ASPG represents at least 15% of the funds in the Total Mapped Group with comparable asset size and management fee characteristics, subject to a minimum of 50 funds (or all funds in the Total Mapped Group if fewer than 50). Additional information, such as the ASPG quartile in which the fund's management fee ranked, is also included in the chart and considered by the Board.
Fidelity International Real Estate Fund
The Board noted that the fund's management fee ranked below the median of its Total Mapped Group and below the median of its ASPG for 2009.
Annual Report
Based on its review, the Board concluded that the fund's management fee is fair and reasonable in light of the services that the fund receives and the other factors considered.
Total Expenses. In its review of each class's total expenses, the Board considered the fund's management fee as well as other fund or class expenses, as applicable, such as transfer agent fees, pricing and bookkeeping fees, fund-paid 12b-1 fees, and custodial, legal, and audit fees. The Board also noted the effects of any waivers and reimbursements on fees and expenses. As part of its review, the Board also considered current and historical total expenses of each class of the fund compared to competitive fund median expenses. Each class of the fund is compared to those funds and classes in the Total Mapped Group (used by the Board for management fee comparisons) that have a similar sales load structure.
The Board noted that the total expenses of each of Class A, Class C, and the retail class ranked below its competitive median for 2009 and the total expenses of each of Class T, Class B, and Institutional Class ranked above its competitive median for 2009. The Board considered that the total expenses for Class T were above the median primarily because its 12b-1 fee is higher than the typical front-end load class. The Board noted that the fund offers multiple classes, each of which has a different sales load and 12b-1 fee structure, and that the multiple structures are intended to offer a range of pricing options for the intermediary market. The Board also noted that the total expenses of the classes vary primarily by the level of their 12b-1 fees, although differences in transfer agent fees may also cause expenses to vary from class to class.
Fees Charged to Other Fidelity Clients. The Board also considered Fidelity fee structures and other information with respect to clients of FMR and its affiliates, such as other mutual funds advised or subadvised by FMR or its affiliates, pension plan clients, and other institutional clients. In March 2010, the Board created an ad hoc joint committee with the board of other Fidelity funds (the Committee) to review and compare Fidelity's institutional investment advisory business with its business of providing services to the Fidelity funds, including the differences in services provided, fees charged, and costs incurred, as well as competition in their respective marketplaces.
Based on its review of total expenses and fees charged to other Fidelity clients, the Board concluded that the total expenses of each class of the fund were reasonable, although in some cases above the median of the universe presented for comparison, in light of the services that the fund and its shareholders receive and the other factors considered, including the findings of the Committee.
Costs of the Services and Profitability. The Board considered the revenues earned and the expenses incurred by Fidelity in conducting the business of developing, marketing, distributing, managing, administering and servicing the fund and its shareholders. The Board also considered the level of Fidelity's profits in respect of all the Fidelity funds.
Annual Report
Board Approval of Investment Advisory Contracts and
Management Fees - continued
On an annual basis, FMR presents to the Board Fidelity's profitability for the fund. Fidelity calculates the profitability for each fund, as well as aggregate profitability for groups of Fidelity funds and all Fidelity funds, using a series of detailed revenue and cost allocation methodologies which originate with the audited books and records of Fidelity. The Audit Committee of the Board reviews any significant changes from the prior year's methodologies.
PricewaterhouseCoopers LLP (PwC), independent registered public accounting firm and auditor to Fidelity and certain Fidelity funds, has been engaged annually by the Board as part of the Board's assessment of Fidelity's profitability analysis. PwC's engagement includes the review and assessment of Fidelity's methodologies used in determining the revenues and expenses attributable to Fidelity's mutual fund business, and completion of agreed-upon procedures surrounding the mathematical accuracy of fund profitability and its conformity to allocation methodologies. After considering PwC's reports issued under the engagement and information provided by Fidelity, the Board believes that while other allocation methods may also be reasonable, Fidelity's profitability methodologies are reasonable in all material respects.
The Board has also reviewed Fidelity's non-fund businesses and fall-out benefits related to the mutual fund business as well as cases where Fidelity's affiliates may benefit from or be related to the fund's business.
The Board considered the costs of the services provided by and the profits realized by Fidelity in connection with the operation of the fund and were satisfied that the profitability was not excessive in the circumstances.
Economies of Scale. The Board considered whether there have been economies of scale in respect of the management of the Fidelity funds, whether the Fidelity funds (including the fund) have appropriately benefited from any such economies of scale, and whether there is potential for realization of any further economies of scale. The Board considered the extent to which the fund will benefit from economies of scale through increased services to the fund, through waivers or reimbursements, or through fee or expense reductions.
In February 2009, the Board and the board of other Fidelity funds created an ad hoc committee (the Economies of Scale Committee) to analyze whether FMR attains economies of scale in respect of the management and servicing of the Fidelity funds, whether the Fidelity funds have appropriately benefited from such economies of scale, and whether there is potential for realization of any further economies of scale.
The Board recognized that the fund's management contract incorporates a "group fee" structure, which provides for lower group fee rates as total fund assets under FMR's management increase, and for higher group fee rates as total fund assets under FMR's management decrease. FMR calculates the group fee rates based on a tiered asset "breakpoint" schedule that varies based on asset class. The Board considered that the group fee is designed to deliver the benefits of economies of scale to fund shareholders when total Fidelity fund assets increase, even if assets of any particular fund are unchanged or have declined, because some portion of Fidelity's costs are attributable to services provided to all Fidelity funds, and all funds benefit if those costs can be allocated among more assets. The Board concluded that, given the group fee structure, fund shareholders will benefit from lower management fees as assets under FMR's management increase at the fund complex level, regardless of whether Fidelity achieves any such economies of scale.
Annual Report
The Board concluded, considering the findings of the Economies of Scale Committee, that any potential economies of scale are being appropriately shared between fund shareholders and Fidelity.
Additional Information Requested by the Board. In order to develop fully the factual basis for consideration of the Fidelity funds' Advisory Contracts, the Board requested and received additional information on certain topics, including (i) fund performance trends, actions to be taken by FMR to improve certain funds' overall performance, and Fidelity's long-term strategies for certain funds; (ii) portfolio manager changes that have occurred during the past year and length of portfolio manager tenure for different categories of funds over time; (iii) Fidelity's compensation structure for portfolio managers, research analysts, and other key personnel, the rationale for the compensation structure, and how the compensation structure provides appropriate performance incentives; (iv) the amount of the investment that each portfolio manager has made in the Fidelity fund(s) that he or she manages; (v) management and other fees paid by FMR to affiliated sub-advisers on behalf of the Fidelity funds; (vi) Fidelity's fee structures and rationale for recommending different fees among different categories of funds; (vii) Fidelity's rationale for recommending which funds should have a performance adjustment component as part of their management fees; (viii) the rationale for any differences between fund fee structures and fee structures in place for other Fidelity clients; and (ix) explanations regarding the relative total expenses borne by certain funds and classes, total expense competitive trends, and actions that might be taken by FMR to reduce total expenses for certain funds and classes.
Based on its evaluation of all of the conclusions noted above, and after considering all factors it believed relevant, the Board ultimately concluded that the advisory fee structures are fair and reasonable, and that the fund's Advisory Contracts should be renewed.
Annual Report
Investment Adviser
Fidelity Management & Research Company
Boston, MA
Investment Sub-Advisers
FMR Co., Inc.
Fidelity Research & Analysis Company
Fidelity Management & Research
(U.K.) Inc.
FIL Investments (Japan) Limited
FIL Investment Advisers
FIL Investment Advisers (U.K.) Ltd.
Fidelity Management & Research
(Hong Kong) Limited
Fidelity Management & Research
(Japan) Inc.
General Distributor
Fidelity Distributors Corporation
Boston, MA
Transfer and Service Agents
Fidelity Investments Institutional
Operations Company, Inc.
Boston, MA
Fidelity Service Company, Inc.
Boston, MA
Custodian
The Bank of New York Mellon
New York, NY
AIREI-UANN-0910
1.843171.103
Fidelity®
Leveraged Company Stock
Fund
Annual Report
July 31, 2010
(2_fidelity_logos) (Registered_Trademark)
Contents
Chairman's Message | <Click Here> | The Chairman's message to shareholders. |
Performance | <Click Here> | How the fund has done over time. |
Management's Discussion of Fund Performance | <Click Here> | The Portfolio Manager's review of fund
performance and strategy. |
Shareholder Expense Example | <Click Here> | An example of shareholder expenses. |
Investment Changes | <Click Here> | A summary of major shifts in the fund's investments over the last six months. |
Investments | <Click Here> | A complete list of the fund's investments with their market values. |
Financial Statements | <Click Here> | Statements of assets and liabilities, operations, and changes in net assets,
as well as financial highlights. |
Notes | <Click Here> | Notes to the financial statements. |
Report of Independent Registered Public Accounting Firm | <Click Here> | |
Trustees and Officers | <Click Here> | |
Distributions | <Click Here> | |
Board Approval of Investment Advisory Contracts and Management Fees | <Click Here> | |
To view a fund's proxy voting guidelines and proxy voting record for the 12-month period ended June 30, visit http://www.fidelity.com/proxyvotingresults or visit the Securities and Exchange Commission's (SEC) web site at http://www.sec.gov. You may also call 1-800-544-8544 to request a free copy of the proxy voting guidelines.
Standard & Poor's, S&P and S&P 500 are registered service marks of The McGraw-Hill Companies, Inc. and have been licensed for use by Fidelity Distributors Corporation.
Other third party marks appearing herein are the property of their respective owners.
All other marks appearing herein are registered or unregistered trademarks or service marks of FMR LLC or an affiliated company.
Annual Report
This report and the financial statements contained herein are submitted for the general information of the shareholders of the fund. This report is not authorized for distribution to prospective investors in the fund unless preceded or accompanied by an effective prospectus.
A fund files its complete schedule of portfolio holdings with the SEC for the first and third quarters of each fiscal year on Form N-Q. Forms N-Q are available on the SEC's web site at http://www.sec.gov. A fund's Forms N-Q may be reviewed and copied at the SEC's Public Reference Room in Washington, DC. Information regarding the operation of the SEC's Public Reference Room may be obtained by calling 1-800-SEC-0330. For a complete list of a fund's portfolio holdings, view the most recent holdings listing, semiannual report, or annual report on Fidelity's web site at http://www.fidelity.com or http://www.advisor.fidelity.com, as applicable.
NOT FDIC INSURED • MAY LOSE VALUE • NO BANK GUARANTEE
Neither the fund nor Fidelity Distributors Corporation is a bank.
Annual Report
(photo_of_Edward_C_Johnson_3d)
Dear Shareholder:
A yearlong uptrend in global equity markets reversed course in late April 2010 when investor sentiment turned bearish due in great measure to concern that Europe's debt crisis would expand and slow or derail economic recovery. However, a bounceback in July helped to recover some of the ground that was lost. Financial markets are always unpredictable, of course, but there also are several time-tested investment principles that can help put the odds in your favor.
One of the basic tenets is to invest for the long term. Over time, riding out the markets' inevitable ups and downs has proven much more effective than selling into panic or chasing the hottest trend. Even missing only a few of the markets' best days can significantly diminish investor returns. Patience also affords the benefits of compounding - of earning interest on additional income or reinvested dividends and capital gains. There can be tax advantages and cost benefits to consider as well. While staying the course doesn't eliminate risk, it can considerably lessen the effect of short-term declines.
You can further manage your investing risk through diversification. And today, more than ever, geographic diversification should be taken into account. Studies indicate that asset allocation is the single most important determinant of a portfolio's long-term success. The right mix of stocks, bonds and cash - aligned to your particular risk tolerance and investment objective - is very important. Age-appropriate rebalancing is also an essential aspect of asset allocation. For younger investors, an emphasis on equities - which historically have been the best-performing asset class over time - is encouraged. As investors near their specific goal, such as retirement or sending a child to college, consideration may be given to replacing volatile assets (e.g. common stocks) with more-stable fixed investments (bonds or savings plans).
A third principle - investing regularly - can help lower the average cost of your purchases. Investing a certain amount of money each month or quarter helps ensure you won't pay for all your shares at market highs. This strategy - known as dollar cost averaging - also reduces "emotion" from investing, helping shareholders avoid selling weak performers just prior to an upswing, or chasing a hot performer just before a correction.
We invite you to contact us via the Internet, through our Investor Centers or by phone. It is our privilege to provide you the information you need to make the investments that are right for you.
Sincerely,
(The chairman's signature appears here.)
Edward C. Johnson 3d
Annual Report
Average annual total return reflects the change in the value of an investment, assuming reinvestment of the class' distributions from dividend income and capital gains (the profits earned upon the sale of securities that have grown in value, if any) and assuming a constant rate of performance each year. The $10,000 table and the fund's returns do not reflect the deduction of taxes that a shareholder would pay on fund distributions or the redemption of fund shares. During periods of reimbursement by Fidelity, a fund's total return will be greater than it would be had the reimbursement not occurred. How a fund did yesterday is no guarantee of how it will do tomorrow.
Average Annual Total Returns
Periods ended July 31, 2010 | Past 1
year | Past 5
years | Life of
class A |
Fidelity Leveraged Company Stock Fund | 20.84% | 1.52% | 12.18% |
A From December 19, 2000.
$10,000 Over Life of Fund
Let's say hypothetically that $10,000 was invested in Fidelity Leveraged Company Stock Fund, a class of the fund, on December 19, 2000, when the fund started. The chart shows how the value of your investment would have changed, and also shows how the S&P 500® Index performed over the same period.
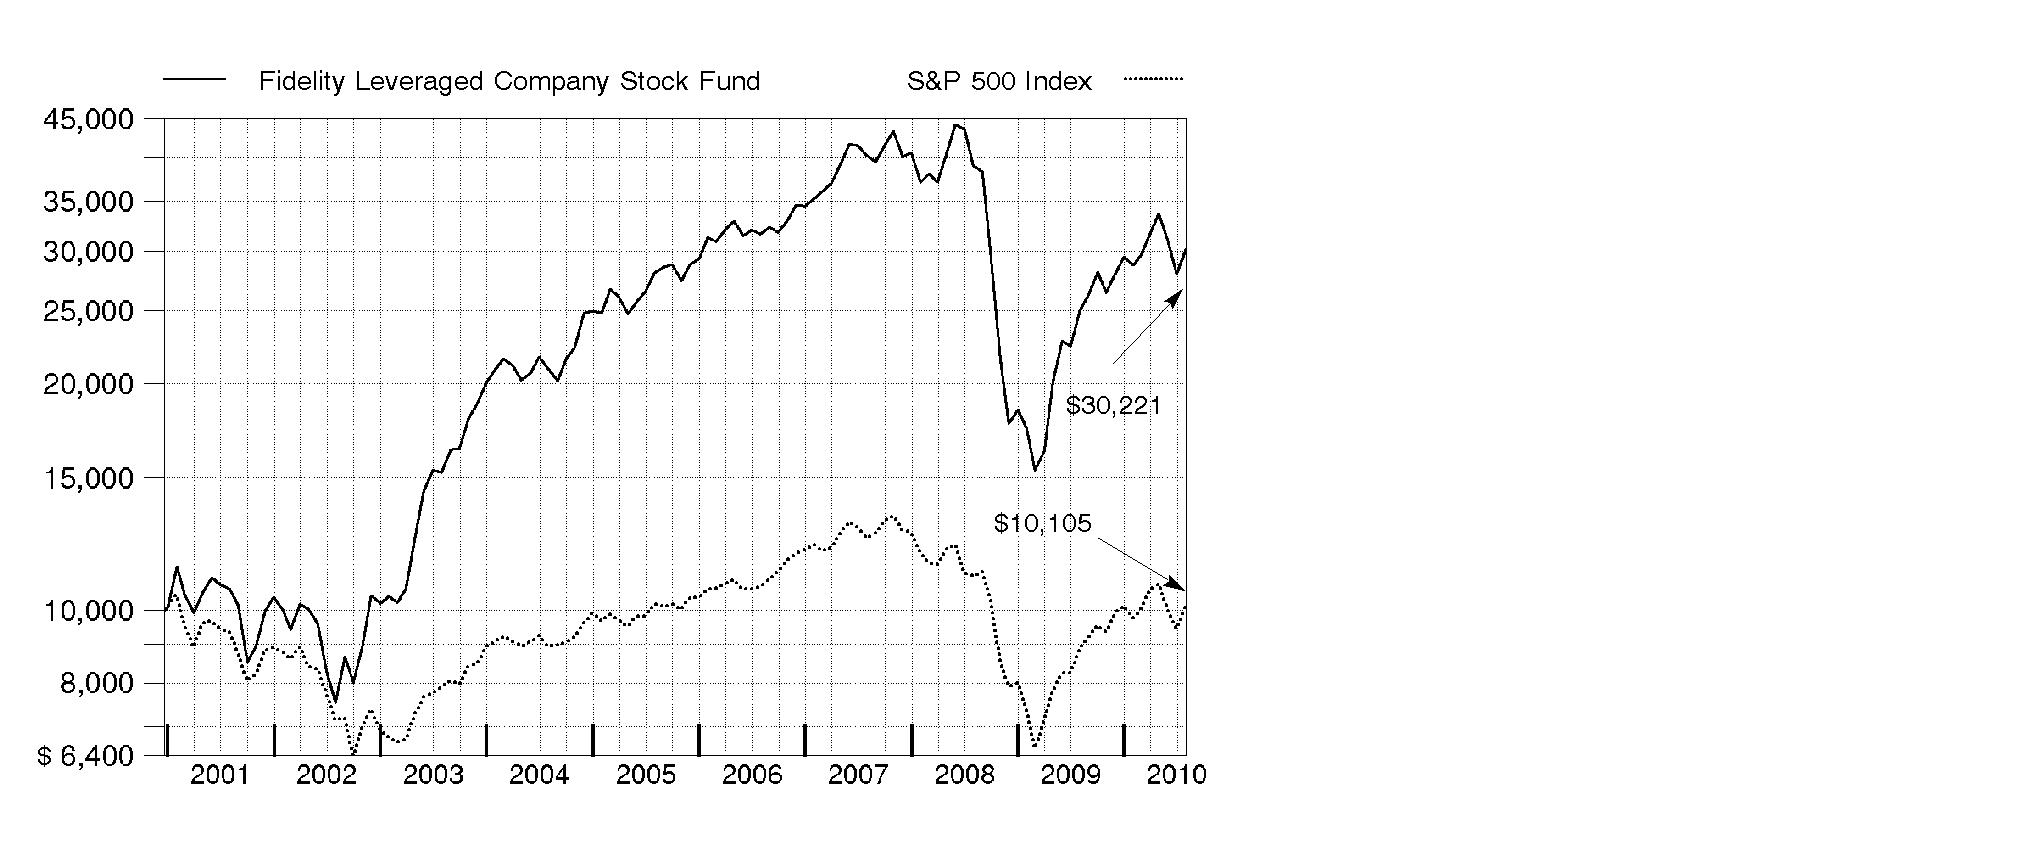
Annual Report
Market Recap: U.S. stock markets saw double-digit gains for the year ending July 31, 2010, despite the return of market volatility and risk aversion during the first half of 2010. An impressive bull run continued through 2009, bolstered by improvement in the economy and credit markets. Early in the new year, however, stocks fell sharply amid concerns about the global economic recovery, fueled by European debt woes and China's efforts to restrain inflation. After this brief dip, markets regained their upward momentum, as government stimulus and significant corporate cost cutting led to encouraging earnings reports, improved credit conditions and rising consumer confidence. Positive news continued through mid-April, when the Dow Jones Industrial AverageSM pushed above the 11,000 mark for the first time in 19 months. That milestone was short-lived, however, as heightened concern about the European debt crisis sparked an abrupt sell-off in May, leading to the first official correction since the rally began in March 2009. Although the market's malaise continued through June, stocks saw solid gains in July. For the year, the Dow rose 17.28%, while the S&P 500® Index was up 13.84%. Elsewhere, the technology-laden Nasdaq Composite® Index returned 14.99%. Small- and mid-cap stocks performed best, as measured by the 18.43% increase of the Russell 2000® Index and the 23.21% gain of the Russell Midcap® Index.
Comments from Thomas Soviero, Portfolio Manager of Fidelity ® Leveraged Company Stock Fund: For the year, the fund's Retail Class shares returned 20.84%, easily outperforming the S&P 500® but trailing the 23.31% gain of the Credit Suisse Leveraged Equity Index. Relative to the S&P®, contributions came from strong stock selection in energy, materials, financials - particularly banks - and telecommunication services. Sector positioning also added value, as did my focus on stronger-performing smaller-cap stocks. In terms of individual positions, the fund benefited from not owning integrated oil firm and sizable index component Exxon Mobil, as well as from investments in building materials manufacturer Owens Corning, regional bank PNC Financial Services, Delta Air Lines, funeral services provider Service Corp International, banking firm KeyCorp, independent oil and gas company Forest Oil, and coal company Peabody Energy. Conversely, we had unfavorable security selection within utilities, technology and consumer staples. Detractors included global power producer AES, ON Semiconductor, drugstore retailer Rite Aid and building products manufacturer Masco. Not owning technology leader and index component Apple also hurt. Some of the stocks mentioned were not part of the S&P 500.
The views expressed above reflect those of the portfolio manager(s) only through the end of the period as stated on the cover of this report and do not necessarily represent the views of Fidelity or any other person in the Fidelity organization. Any such views are subject to change at any time based upon market or other conditions and Fidelity disclaims any responsibility to update such views. These views may not be relied on as investment advice and, because investment decisions for a Fidelity fund are based on numerous factors, may not be relied on as an indication of trading intent on behalf of any Fidelity fund.
Annual Report
Shareholder Expense Example
As a shareholder of the Fund, you incur two types of costs: (1) transaction costs, including redemption fees, and (2) ongoing costs, including management fees and other Fund expenses. This Example is intended to help you understand your ongoing costs (in dollars) of investing in the Fund and to compare these costs with the ongoing costs of investing in other mutual funds.
The Example is based on an investment of $1,000 invested at the beginning of the period and held for the entire period (February 1, 2010 to July 31, 2010).
Actual Expenses
The first line of the accompanying table for each class of the Fund provides information about actual account values and actual expenses. You may use the information in this line, together with the amount you invested, to estimate the expenses that you paid over the period. Simply divide your account value by $1,000.00 (for example, an $8,600 account value divided by $1,000.00 = 8.6), then multiply the result by the number in the first line for a class of the Fund under the heading entitled "Expenses Paid During Period" to estimate the expenses you paid on your account during this period. A small balance maintenance fee of $12.00 that is charged once a year may apply for certain accounts with a value of less than $2,000. This fee is not included in the table below. If it was, the estimate of expenses you paid during the period would be higher, and your ending account value lower, by this amount. In addition, the Fund, as a shareholder in the underlying Fidelity Central Funds, will indirectly bear its pro-rata share of the fees and expenses incurred by the underlying Fidelity Central Funds. These fees and expenses are not included in the Fund's annualized expense ratio used to calculate the expense estimate in the table below.
Hypothetical Example for Comparison Purposes
The second line of the accompanying table for each class of the Fund provides information about hypothetical account values and hypothetical expenses based on a Class' actual expense ratio and an assumed rate of return of 5% per year before expenses, which is not the Class' actual return. The hypothetical account values and expenses may not be used to estimate the actual ending account balance or expenses you paid for the period. You may use this information to compare the ongoing costs of investing in the Fund and other funds. To do so, compare this 5% hypothetical example with the 5% hypothetical examples that appear in the shareholder reports of the other funds. A small balance maintenance fee of $12.00 that is charged once a year may apply for certain accounts with a value of less than $2,000. This fee is not included in the table below. If it was, the estimate of expenses you paid during the period would be higher, and your ending account value lower, by this amount. In addition, the Fund, as a shareholder in the underlying Fidelity Central Funds, will indirectly bear its pro-rata share of the fees and expenses incurred by the underlying Fidelity Central Funds. These fees and expenses are not included in the Fund's annualized expense ratio used to calculate the expense estimate in the table below.
Annual Report
Shareholder Expense Example - continued
Please note that the expenses shown in the table are meant to highlight your ongoing costs only and do not reflect any transaction costs. Therefore, the second line of the table is useful in comparing ongoing costs only, and will not help you determine the relative total costs of owning different funds. In addition, if these transactional costs were included, your costs would have been higher.
| Annualized Expense Ratio | Beginning
Account Value
February 1, 2010 | Ending
Account Value
July 31, 2010 | Expenses Paid
During Period*
February 1, 2010 to July 31, 2010 |
Leveraged Company Stock | .87% | | | |
Actual | | $ 1,000.00 | $ 1,052.90 | $ 4.43 |
HypotheticalA | | $ 1,000.00 | $ 1,020.48 | $ 4.36 |
Class K | .69% | | | |
Actual | | $ 1,000.00 | $ 1,053.80 | $ 3.51 |
HypotheticalA | | $ 1,000.00 | $ 1,021.37 | $ 3.46 |
A 5% return per year before expenses
* Expenses are equal to each Class' annualized expense ratio, multiplied by the average account value over the period, multiplied by 181/365 (to reflect the one-half year period).
Annual Report
Investment Changes (Unaudited)
Top Ten Stocks as of July 31, 2010 |
| % of fund's
net assets | % of fund's net assets
6 months ago |
ON Semiconductor Corp. | 3.5 | 3.8 |
Service Corp. International | 3.4 | 3.2 |
El Paso Corp. | 2.9 | 2.6 |
AES Corp. | 2.6 | 3.1 |
Celanese Corp. Class A | 2.5 | 2.9 |
Tenet Healthcare Corp. | 2.3 | 2.8 |
KeyCorp | 2.3 | 2.0 |
Peabody Energy Corp. | 2.1 | 2.8 |
Owens Corning | 2.0 | 2.2 |
Bank of America Corp. | 1.8 | 2.0 |
| 25.4 | |
Top Five Market Sectors as of July 31, 2010 |
| % of fund's
net assets | % of fund's net assets
6 months ago |
Industrials | 18.8 | 17.4 |
Consumer Discretionary | 16.7 | 13.8 |
Financials | 12.6 | 12.7 |
Energy | 12.5 | 14.5 |
Materials | 11.3 | 10.5 |
Asset Allocation (% of fund's net assets) |
As of July 31, 2010 * | As of January 31, 2010 ** |
 | Stocks 94.4% | | | Stocks 92.9% | |
 | Bonds 2.4% | | | Bonds 2.9% | |
 | Convertible
Securities 0.3% | | | Convertible
Securities 0.3% | |
 | Other Investments 1.4% | | | Other Investments 2.0% | |
 | Short-Term
Investments and
Net Other Assets 1.5% | | | Short-Term
Investments and
Net Other Assets 1.9% | |
* Foreign investments | 7.3% | | ** Foreign investments | 5.9% | |

Annual Report
Investments July 31, 2010
Showing Percentage of Net Assets
Common Stocks - 94.3% |
| Shares | | Value (000s) |
CONSUMER DISCRETIONARY - 15.4% |
Auto Components - 1.1% |
Exide Technologies (a) | 1,643,982 | | $ 9,897 |
Johnson Controls, Inc. | 548,300 | | 15,797 |
Tenneco, Inc. (a) | 97,700 | | 2,697 |
The Goodyear Tire & Rubber Co. (a) | 564,063 | | 6,019 |
TRW Automotive Holdings Corp. (a) | 430,300 | | 15,099 |
| | 49,509 |
Automobiles - 0.4% |
Daimler AG (United States) (a) | 209,400 | | 11,318 |
Toyota Motor Corp. sponsored ADR | 89,500 | | 6,286 |
| | 17,604 |
Diversified Consumer Services - 3.6% |
Carriage Services, Inc. (a) | 266,200 | | 1,246 |
Service Corp. International (f) | 17,656,093 | | 150,430 |
Stewart Enterprises, Inc. Class A | 1,515,242 | | 8,137 |
| | 159,813 |
Hotels, Restaurants & Leisure - 1.0% |
Bally Technologies, Inc. (a) | 198,560 | | 6,413 |
Biglari Holdings, Inc. (a) | 32,970 | | 9,578 |
Burger King Holdings, Inc. | 108,900 | | 1,882 |
Domino's Pizza, Inc. (a) | 726,595 | | 9,293 |
O'Charleys, Inc. (a) | 207,849 | | 1,449 |
Penn National Gaming, Inc. (a) | 537,836 | | 14,731 |
Wendy's/Arby's Group, Inc. | 546,800 | | 2,384 |
| | 45,730 |
Household Durables - 3.1% |
Harman International Industries, Inc. (a) | 1,263,506 | | 38,423 |
Lennar Corp. Class A | 983,400 | | 14,525 |
Newell Rubbermaid, Inc. | 3,304,500 | | 51,220 |
Stanley Black & Decker, Inc. | 531,917 | | 30,862 |
| | 135,030 |
Leisure Equipment & Products - 0.4% |
Callaway Golf Co. | 2,514,010 | | 16,970 |
Media - 2.8% |
Belo Corp. Series A (a) | 163,800 | | 991 |
Cablevision Systems Corp. - NY Group Class A | 541,324 | | 14,838 |
Cinemark Holdings, Inc. | 1,554,497 | | 22,680 |
Comcast Corp. Class A | 3,097,400 | | 60,306 |
Gray Television, Inc. (a)(f) | 2,845,889 | | 7,399 |
LIN TV Corp. Class A (a) | 818,437 | | 4,788 |
Common Stocks - continued |
| Shares | | Value (000s) |
CONSUMER DISCRETIONARY - continued |
Media - continued |
Madison Square Garden, Inc. Class A (a) | 135,331 | | $ 2,604 |
Nexstar Broadcasting Group, Inc. Class A (a)(e) | 1,130,500 | | 6,105 |
The McClatchy Co. Class A (a)(e) | 215,505 | | 754 |
| | 120,465 |
Specialty Retail - 1.2% |
Asbury Automotive Group, Inc. (a) | 385,122 | | 5,184 |
Charming Shoppes, Inc. (a) | 3,932,700 | | 17,618 |
GameStop Corp. Class A (a) | 656,695 | | 13,167 |
Gap, Inc. | 204,000 | | 3,694 |
Sally Beauty Holdings, Inc. (a) | 300,000 | | 2,838 |
The Pep Boys - Manny, Moe & Jack | 980,271 | | 9,411 |
| | 51,912 |
Textiles, Apparel & Luxury Goods - 1.8% |
Coach, Inc. | 314,020 | | 11,609 |
Deckers Outdoor Corp. (a) | 491,745 | | 25,025 |
Hanesbrands, Inc. (a) | 501,700 | | 12,568 |
Phillips-Van Heusen Corp. | 548,718 | | 28,473 |
| | 77,675 |
TOTAL CONSUMER DISCRETIONARY | | 674,708 |
CONSUMER STAPLES - 2.3% |
Food & Staples Retailing - 1.3% |
Rite Aid Corp. (a) | 16,497,982 | | 16,317 |
Safeway, Inc. | 464,300 | | 9,537 |
SUPERVALU, Inc. | 592,800 | | 6,687 |
Whole Foods Market, Inc. (a) | 713,867 | | 27,106 |
| | 59,647 |
Food Products - 0.8% |
Darling International, Inc. (a) | 2,498,930 | | 20,391 |
Dean Foods Co. (a) | 569,900 | | 6,531 |
Smithfield Foods, Inc. (a) | 559,606 | | 7,974 |
| | 34,896 |
Personal Products - 0.2% |
Revlon, Inc. (a) | 553,261 | | 6,938 |
TOTAL CONSUMER STAPLES | | 101,481 |
Common Stocks - continued |
| Shares | | Value (000s) |
ENERGY - 12.2% |
Energy Equipment & Services - 2.5% |
Baker Hughes, Inc. | 218,000 | | $ 10,523 |
Ensco International Ltd. ADR | 110,000 | | 4,599 |
Exterran Holdings, Inc. (a) | 1,302,108 | | 34,727 |
Hercules Offshore, Inc. (a) | 1,493,431 | | 3,793 |
Noble Corp. | 524,700 | | 17,053 |
Oil States International, Inc. (a) | 270,700 | | 12,436 |
Parker Drilling Co. (a) | 1,200,000 | | 5,016 |
Pride International, Inc. (a) | 346,100 | | 8,234 |
Rowan Companies, Inc. (a) | 321,100 | | 8,111 |
Schlumberger Ltd. | 109,400 | | 6,527 |
Seahawk Drilling, Inc. (a)(e) | 23,073 | | 229 |
| | 111,248 |
Oil, Gas & Consumable Fuels - 9.7% |
Alpha Natural Resources, Inc. (a) | 361,838 | | 13,869 |
Arch Coal, Inc. | 688,255 | | 16,305 |
Atlas Pipeline Partners, LP (a) | 163,890 | | 2,957 |
ConocoPhillips | 231,500 | | 12,783 |
CONSOL Energy, Inc. | 327,200 | | 12,263 |
El Paso Corp. | 10,450,276 | | 128,747 |
Forest Oil Corp. (a) | 1,730,645 | | 49,479 |
Frontier Oil Corp. | 1,972,600 | | 24,243 |
International Coal Group, Inc. (a) | 1,365,400 | | 6,144 |
Nexen, Inc. | 188,000 | | 3,905 |
Overseas Shipholding Group, Inc. (e) | 979,192 | | 38,414 |
Paladin Energy Ltd. (a) | 2,042,400 | | 7,115 |
Peabody Energy Corp. | 2,068,114 | | 93,375 |
Plains Exploration & Production Co. (a) | 360,660 | | 8,133 |
SandRidge Energy, Inc. (a) | 1,095,000 | | 6,461 |
| | 424,193 |
TOTAL ENERGY | | 535,441 |
FINANCIALS - 12.3% |
Capital Markets - 0.3% |
Morgan Stanley | 426,900 | | 11,522 |
Commercial Banks - 8.7% |
CIT Group, Inc. (a) | 72,485 | | 2,636 |
Huntington Bancshares, Inc. | 11,032,080 | | 66,854 |
KeyCorp | 11,866,668 | | 100,392 |
PNC Financial Services Group, Inc. | 1,339,226 | | 79,537 |
Common Stocks - continued |
| Shares | | Value (000s) |
FINANCIALS - continued |
Commercial Banks - continued |
Regions Financial Corp. | 2,011,695 | | $ 14,746 |
SunTrust Banks, Inc. | 2,549,800 | | 66,167 |
Wells Fargo & Co. | 1,871,088 | | 51,885 |
| | 382,217 |
Diversified Financial Services - 2.0% |
Bank of America Corp. | 5,742,000 | | 80,618 |
Citigroup, Inc. (a) | 1,638,400 | | 6,717 |
| | 87,335 |
Insurance - 0.6% |
Assured Guaranty Ltd. | 981,795 | | 15,414 |
Lincoln National Corp. | 435,700 | | 11,346 |
| | 26,760 |
Real Estate Investment Trusts - 0.5% |
FelCor Lodging Trust, Inc. (a) | 1,085,852 | | 6,439 |
Host Hotels & Resorts, Inc. | 1,016,122 | | 14,571 |
| | 21,010 |
Thrifts & Mortgage Finance - 0.2% |
First Niagara Financial Group, Inc. | 851,444 | | 11,418 |
TOTAL FINANCIALS | | 540,262 |
HEALTH CARE - 5.9% |
Biotechnology - 0.0% |
Lexicon Pharmaceuticals, Inc. (a) | 392,187 | | 592 |
Health Care Equipment & Supplies - 1.1% |
Alere, Inc. (a) | 518,708 | | 14,591 |
Hospira, Inc. (a) | 631,458 | | 32,899 |
| | 47,490 |
Health Care Providers & Services - 4.2% |
Community Health Systems, Inc. (a) | 611,876 | | 19,843 |
DaVita, Inc. (a) | 503,747 | | 28,875 |
Henry Schein, Inc. (a) | 54,400 | | 2,855 |
Laboratory Corp. of America Holdings (a) | 54,600 | | 3,985 |
RehabCare Group, Inc. (a) | 230,000 | | 4,874 |
Rural/Metro Corp. (a)(e) | 834,200 | | 7,550 |
Sun Healthcare Group, Inc. (a) | 1,642,522 | | 13,600 |
Tenet Healthcare Corp. (a) | 22,373,365 | | 102,917 |
| | 184,499 |
Common Stocks - continued |
| Shares | | Value (000s) |
HEALTH CARE - continued |
Health Care Technology - 0.5% |
Cerner Corp. (a) | 276,209 | | $ 21,392 |
Pharmaceuticals - 0.1% |
Allergan, Inc. | 109,700 | | 6,698 |
TOTAL HEALTH CARE | | 260,671 |
INDUSTRIALS - 18.2% |
Aerospace & Defense - 0.5% |
American Science & Engineering, Inc. | 85,370 | | 6,760 |
Teledyne Technologies, Inc. (a) | 340,694 | | 13,979 |
| | 20,739 |
Air Freight & Logistics - 0.0% |
Park-Ohio Holdings Corp. (a) | 78,022 | | 1,057 |
Airlines - 2.7% |
AirTran Holdings, Inc. (a) | 1,779,700 | | 8,578 |
AMR Corp. (a) | 1,309,130 | | 9,269 |
Delta Air Lines, Inc. (a) | 5,963,193 | | 70,843 |
UAL Corp. (a) | 280,400 | | 6,657 |
US Airways Group, Inc. (a) | 2,034,580 | | 22,075 |
| | 117,422 |
Building Products - 3.7% |
Armstrong World Industries, Inc. (a)(e) | 1,217,530 | | 44,513 |
Masco Corp. | 2,624,679 | | 26,982 |
Owens Corning (a) | 2,828,708 | | 89,048 |
Owens Corning warrants 10/31/13 (a) | 406,600 | | 1,606 |
| | 162,149 |
Commercial Services & Supplies - 3.7% |
ACCO Brands Corp. (a) | 710,554 | | 4,206 |
Cenveo, Inc. (a)(f) | 3,858,300 | | 23,767 |
Deluxe Corp. | 1,749,127 | | 35,997 |
R.R. Donnelley & Sons Co. | 450,900 | | 7,607 |
Republic Services, Inc. | 1,928,875 | | 61,454 |
The Brink's Co. | 464,740 | | 10,178 |
Waste Management, Inc. | 599,400 | | 20,350 |
| | 163,559 |
Construction & Engineering - 0.4% |
Fluor Corp. | 297,100 | | 14,347 |
Great Lakes Dredge & Dock Corp. | 429,400 | | 2,405 |
| | 16,752 |
Common Stocks - continued |
| Shares | | Value (000s) |
INDUSTRIALS - continued |
Electrical Equipment - 1.9% |
Baldor Electric Co. | 404,900 | | $ 15,475 |
Belden, Inc. | 1,270,366 | | 30,349 |
EnerSys (a) | 198,902 | | 4,817 |
General Cable Corp. (a) | 441,500 | | 11,717 |
Harbin Electric, Inc. (a)(e) | 548,369 | | 10,074 |
Polypore International, Inc. (a) | 548,400 | | 13,469 |
| | 85,901 |
Industrial Conglomerates - 0.9% |
Carlisle Companies, Inc. | 109,910 | | 3,702 |
General Electric Co. | 1,103,883 | | 17,795 |
Textron, Inc. | 550,200 | | 11,422 |
Tyco International Ltd. | 187,433 | | 7,175 |
| | 40,094 |
Machinery - 2.6% |
Accuride Corp. (a) | 57,374 | | 68 |
Accuride Corp. warrants 2/26/12 (a) | 778,347 | | 125 |
Badger Meter, Inc. | 228,561 | | 8,950 |
Ingersoll-Rand Co. Ltd. | 1,063,600 | | 39,842 |
Middleby Corp. (a) | 445,361 | | 25,613 |
Mueller Water Products, Inc. Class A | 1,202,599 | | 4,570 |
Navistar International Corp. (a) | 169,800 | | 8,780 |
Terex Corp. (a) | 129,300 | | 2,552 |
Thermadyne Holdings Corp. (a) | 64,900 | | 886 |
Timken Co. | 464,948 | | 15,632 |
WABCO Holdings, Inc. (a) | 211,533 | | 8,182 |
| | 115,200 |
Marine - 0.5% |
Diana Shipping, Inc. (a) | 277,900 | | 3,674 |
Genco Shipping & Trading Ltd. (a)(e) | 380,323 | | 6,351 |
Navios Maritime Holdings, Inc. | 2,162,794 | | 12,133 |
OceanFreight, Inc. (a) | 246,866 | | 299 |
| | 22,457 |
Road & Rail - 1.1% |
Avis Budget Group, Inc. (a) | 830,314 | | 10,246 |
CSX Corp. | 109,400 | | 5,768 |
Hertz Global Holdings, Inc. (a)(e) | 2,598,600 | | 30,508 |
| | 46,522 |
Common Stocks - continued |
| Shares | | Value (000s) |
INDUSTRIALS - continued |
Trading Companies & Distributors - 0.2% |
H&E Equipment Services, Inc. (a) | 12,900 | | $ 112 |
Houston Wire & Cable Co. (e) | 656,176 | | 7,920 |
| | 8,032 |
TOTAL INDUSTRIALS | | 799,884 |
INFORMATION TECHNOLOGY - 9.1% |
Communications Equipment - 0.2% |
CommScope, Inc. (a) | 459,254 | | 9,341 |
Electronic Equipment & Components - 2.4% |
Avnet, Inc. (a) | 328,000 | | 8,249 |
DDi Corp. | 295,899 | | 2,681 |
Flextronics International Ltd. (a) | 12,456,563 | | 77,480 |
TTM Technologies, Inc. (a) | 1,402,619 | | 14,377 |
Viasystems Group, Inc. (a) | 290,108 | | 4,473 |
| | 107,260 |
Internet Software & Services - 0.3% |
NetEase.com, Inc. sponsored ADR (a) | 191,500 | | 7,334 |
VeriSign, Inc. (a) | 194,300 | | 5,470 |
| | 12,804 |
IT Services - 1.0% |
Alliance Data Systems Corp. (a)(e) | 496,639 | | 28,547 |
CACI International, Inc. Class A (a) | 248,000 | | 11,661 |
Cognizant Technology Solutions Corp. Class A (a) | 56,200 | | 3,066 |
| | 43,274 |
Semiconductors & Semiconductor Equipment - 5.2% |
Amkor Technology, Inc. (a)(e) | 5,242,218 | | 30,248 |
Cypress Semiconductor Corp. (a) | 651,200 | | 6,903 |
Fairchild Semiconductor International, Inc. (a) | 548,500 | | 4,980 |
Intel Corp. | 693,100 | | 14,278 |
Micron Technology, Inc. (a) | 1,737,600 | | 12,650 |
ON Semiconductor Corp. (a)(f) | 23,079,802 | | 155,780 |
SunPower Corp. Class B (a) | 178,606 | | 2,061 |
| | 226,900 |
Software - 0.0% |
Nuance Communications, Inc. (a) | 163,600 | | 2,701 |
TOTAL INFORMATION TECHNOLOGY | | 402,280 |
Common Stocks - continued |
| Shares | | Value (000s) |
MATERIALS - 11.3% |
Chemicals - 8.8% |
Albemarle Corp. | 1,163,406 | | $ 50,748 |
Arch Chemicals, Inc. | 344,342 | | 11,801 |
Celanese Corp. Class A | 3,894,835 | | 109,406 |
Dow Chemical Co. | 1,284,894 | | 35,116 |
Ferro Corp. (a) | 722,400 | | 7,708 |
FMC Corp. | 178,600 | | 11,161 |
Georgia Gulf Corp. (a) | 173,861 | | 2,669 |
H.B. Fuller Co. | 1,582,241 | | 32,341 |
LyondellBasell Industries NV: | | | |
Class A (a) | 1,491,164 | | 26,841 |
Class B (a) | 1,319,987 | | 23,760 |
Nalco Holding Co. | 894,300 | | 21,812 |
Phosphate Holdings, Inc. (a) | 307,500 | | 2,537 |
Pliant Corp. (a) | 567 | | 0 |
Solutia, Inc. (a) | 716,300 | | 10,107 |
W.R. Grace & Co. (a) | 1,601,519 | | 41,111 |
| | 387,118 |
Containers & Packaging - 0.7% |
Owens-Illinois, Inc. (a) | 421,000 | | 11,641 |
Rock-Tenn Co. Class A | 355,202 | | 18,904 |
| | 30,545 |
Metals & Mining - 1.3% |
AngloGold Ashanti Ltd. sponsored ADR | 526,100 | | 21,318 |
Compass Minerals International, Inc. | 258,500 | | 18,273 |
Ormet Corp. (a) | 330,000 | | 957 |
Ormet Corp. (a)(i) | 1,075,000 | | 3,118 |
Teck Resources Ltd. Class B (sub. vtg.) | 417,300 | | 14,691 |
| | 58,357 |
Paper & Forest Products - 0.5% |
Domtar Corp. | 203,041 | | 11,878 |
Neenah Paper, Inc. | 518,300 | | 9,298 |
| | 21,176 |
TOTAL MATERIALS | | 497,196 |
TELECOMMUNICATION SERVICES - 3.7% |
Diversified Telecommunication Services - 1.1% |
Level 3 Communications, Inc. (a)(e) | 2,000,000 | | 2,260 |
PAETEC Holding Corp. (a) | 2,980,233 | | 11,712 |
Common Stocks - continued |
| Shares | | Value (000s) |
TELECOMMUNICATION SERVICES - continued |
Diversified Telecommunication Services - continued |
Qwest Communications International, Inc. | 4,637,500 | | $ 26,248 |
tw telecom, inc. (a) | 332,497 | | 6,291 |
| | 46,511 |
Wireless Telecommunication Services - 2.6% |
Crown Castle International Corp. (a) | 981,391 | | 38,775 |
Sprint Nextel Corp. (a) | 5,692,987 | | 26,017 |
Syniverse Holdings, Inc. (a) | 2,244,438 | | 50,118 |
| | 114,910 |
TOTAL TELECOMMUNICATION SERVICES | | 161,421 |
UTILITIES - 3.9% |
Gas Utilities - 0.3% |
ONEOK, Inc. | 317,600 | | 14,778 |
Independent Power Producers & Energy Traders - 3.6% |
AES Corp. (a) | 10,901,923 | | 112,399 |
Calpine Corp. (a) | 2,479,900 | | 33,479 |
NRG Energy, Inc. (a) | 454,528 | | 10,309 |
| | 156,187 |
TOTAL UTILITIES | | 170,965 |
TOTAL COMMON STOCKS (Cost $4,219,527) | 4,144,309 |
Preferred Stocks - 0.4% |
| | | |
Convertible Preferred Stocks - 0.3% |
ENERGY - 0.3% |
Oil, Gas & Consumable Fuels - 0.3% |
El Paso Corp. 4.99% | 11,200 | | 12,067 |
Nonconvertible Preferred Stocks - 0.1% |
CONSUMER STAPLES - 0.1% |
Personal Products - 0.1% |
Revlon, Inc. Series A 12.75% | 639,576 | | 3,614 |
Preferred Stocks - continued |
| Shares | | Value (000s) |
Nonconvertible Preferred Stocks - continued |
FINANCIALS - 0.0% |
Diversified Financial Services - 0.0% |
GMAC, Inc. 7.00% (g) | 944 | | $ 772 |
TOTAL NONCONVERTIBLE PREFERRED STOCKS | | 4,386 |
TOTAL PREFERRED STOCKS (Cost $16,979) | 16,453 |
Nonconvertible Bonds - 2.4% |
| Principal Amount (000s) | | |
CONSUMER DISCRETIONARY - 1.1% |
Automobiles - 0.9% |
General Motors Corp.: | | | | |
6.75% 5/1/28 (d) | | $ 3,075 | | 992 |
7.125% 7/15/13 (d) | | 8,320 | | 2,766 |
7.2% 1/15/11 (d) | | 22,980 | | 7,813 |
8.25% 7/15/23 (d) | | 25,035 | | 8,512 |
8.375% 7/15/33 (d) | | 50,210 | | 17,322 |
8.8% 3/1/21 (d) | | 10,765 | | 3,606 |
| | 41,011 |
Hotels, Restaurants & Leisure - 0.0% |
Station Casinos, Inc.: | | | | |
6% 4/1/12 (d) | | 8,360 | | 167 |
7.75% 8/15/16 (d) | | 9,380 | | 188 |
| | 355 |
Media - 0.2% |
Clear Channel Communications, Inc. 10.75% 8/1/16 | | 10,940 | | 8,369 |
TOTAL CONSUMER DISCRETIONARY | | 49,735 |
FINANCIALS - 0.3% |
Consumer Finance - 0.3% |
GMAC LLC 8% 12/31/18 | | 13,924 | | 13,437 |
Nonconvertible Bonds - continued |
| Principal Amount (000s) | | Value (000s) |
INDUSTRIALS - 0.0% |
Airlines - 0.0% |
Delta Air Lines, Inc. 8% 12/15/07 (a)(g) | | $ 4,145 | | $ 41 |
Northwest Airlines, Inc. 9.875% 3/15/07 (a) | | 7,000 | | 0 |
| | 41 |
INFORMATION TECHNOLOGY - 0.2% |
Semiconductors & Semiconductor Equipment - 0.2% |
NXP BV/NXP Funding LLC: | | | | |
7.875% 10/15/14 | | 4,362 | | 4,395 |
10% 7/15/13 (g) | | 1,655 | | 1,812 |
| | 6,207 |
TELECOMMUNICATION SERVICES - 0.8% |
Diversified Telecommunication Services - 0.8% |
Clearwire Communications LLC/Clearwire Finance, Inc. 12% 12/1/15 (g) | | 10,950 | | 11,456 |
Sprint Capital Corp.: | | | | |
6.875% 11/15/28 | | 14,800 | | 12,876 |
6.9% 5/1/19 | | 10,410 | | 9,929 |
| | 34,261 |
TOTAL NONCONVERTIBLE BONDS (Cost $69,847) | 103,681 |
Floating Rate Loans - 1.4% |
|
CONSUMER DISCRETIONARY - 0.2% |
Media - 0.2% |
Univision Communications, Inc. Tranche 1LN, term loan 2.5972% 9/29/14 (h) | | 10,801 | | 9,424 |
INDUSTRIALS - 0.6% |
Airlines - 0.6% |
Delta Air Lines, Inc. Tranche 2LN, term loan 3.5909% 4/30/14 (h) | | 17,119 | | 15,579 |
US Airways Group, Inc. term loan 2.8288% 3/23/14 (h) | | 10,947 | | 9,059 |
| | 24,638 |
Floating Rate Loans - continued |
| Principal Amount (000s) | | Value (000s) |
INFORMATION TECHNOLOGY - 0.4% |
Semiconductors & Semiconductor Equipment - 0.4% |
Freescale Semiconductor, Inc. term loan 4.5956% 12/1/16 (h) | | $ 18,154 | | $ 16,657 |
TELECOMMUNICATION SERVICES - 0.1% |
Diversified Telecommunication Services - 0.1% |
FairPoint Communications, Inc. Tranche B, term loan 3/31/15 (d) | | 8,250 | | 5,363 |
UTILITIES - 0.1% |
Electric Utilities - 0.1% |
Texas Competitive Electric Holdings Co. LLC/Texas Competitive Electric Holdings Finance, Inc. Tranche B2, term loan 3.975% 10/10/14 (h) | | 5,706 | | 4,422 |
TOTAL FLOATING RATE LOANS (Cost $56,669) | 60,504 |
Other - 0.0% |
| Shares | | |
Other - 0.0% |
Delta Air Lines ALPA Claim (a)
(Cost $519) | 64,750,000 | | 1,295 |
Money Market Funds - 3.4% |
| | | |
Fidelity Cash Central Fund, 0.24% (b) | 60,531,674 | | 60,532 |
Fidelity Securities Lending Cash Central Fund, 0.27% (b)(c) | 88,076,975 | | 88,077 |
TOTAL MONEY MARKET FUNDS (Cost $148,609) | 148,609 |
TOTAL INVESTMENT PORTFOLIO - 101.9% (Cost $4,512,150) | | 4,474,851 |
NET OTHER ASSETS (LIABILITIES) - (1.9)% | | (81,905) |
NET ASSETS - 100% | $ 4,392,946 |
Legend |
(a) Non-income producing |
(b) Affiliated fund that is available only to investment companies and other accounts managed by Fidelity Investments. The rate quoted is the annualized seven-day yield of the fund at period end. A complete unaudited listing of the fund's holdings as of its most recent quarter end is available upon request. |
(c) Investment made with cash collateral received from securities on loan. |
(d) Non-income producing - Issuer is in default. |
(e) Security or a portion of the security is on loan at period end. |
(f) Affiliated company |
(g) Security exempt from registration under Rule 144A of the Securities Act of 1933. These securities may be resold in transactions exempt from registration, normally to qualified institutional buyers. At the end of the period, the value of these securities amounted to $14,081,000 or 0.3% of net assets. |
(h) The coupon rate shown on floating or adjustable rate securities represents the rate at period end. |
(i) Restricted securities - Investment in securities not registered under the Securities Act of 1933 (excluding 144A issues). At the end of the period, the value of restricted securities (excluding 144A issues) amounted to $3,118,000 or 0.1% of net assets. |
Additional information on each holding is as follows: |
Security | Acquisition Date | Acquisition Cost (000s) |
Ormet Corp. | 2/27/07 - 4/4/07 | $ 20,556 |
Affiliated Central Funds |
Information regarding fiscal year to date income earned by the Fund from investments in Fidelity Central Funds is as follows: |
Fund | Income earned
(Amounts in thousands) |
Fidelity Cash Central Fund | $ 401 |
Fidelity Securities Lending Cash Central Fund | 449 |
Total | $ 850 |
Other Affiliated Issuers |
An affiliated company is a company in which the fund has ownership of at least 5% of the voting securities. Fiscal year to date transactions with companies which are or were affiliates are as follows: |
Affiliates
(Amounts in thousands) | Value,
beginning of
period | Purchases | Sales
Proceeds | Dividend
Income | Value,
end of
period |
Cenveo, Inc. | $ 18,636 | $ - | $ - | $ - | $ 23,767 |
Gray Television, Inc. | 978 | 1,991 | - | - | 7,399 |
Merix Corp. | 2,766 | - | - | - | - |
ON Semiconductor Corp. | 168,477 | - | - | - | 155,780 |
Service Corp. International | 110,637 | 3,332 | 2,630 | 2,831 | 150,430 |
Tenet Healthcare Corp. | 103,351 | 2,090 | 24,404 | - | - |
Total | $ 404,845 | $ 7,413 | $ 27,034 | $ 2,831 | $ 337,376 |
Other Information |
The following is a summary of the inputs used, as of July 31, 2010, involving the Fund's assets and liabilities carried at fair value. The inputs or methodology used for valuing securities may not be an indication of the risk associated with investing in those securities. For more information on valuation inputs, and their aggregation into the levels used in the tables below, please refer to the Security Valuation section in the accompanying Notes to Financial Statements. |
Valuation Inputs at Reporting Date: |
Description
(Amounts in thousands) | Total | Level 1 | Level 2 | Level 3 |
Investments in Securities: | | | | |
Equities: | | | | |
Consumer Discretionary | $ 674,708 | $ 674,708 | $ - | $ - |
Consumer Staples | 105,095 | 101,481 | - | 3,614 |
Energy | 547,508 | 535,441 | 12,067 | - |
Financials | 541,034 | 540,262 | 772 | - |
Health Care | 260,671 | 260,671 | - | - |
Industrials | 799,884 | 799,884 | - | - |
Information Technology | 402,280 | 402,280 | - | - |
Materials | 497,196 | 497,196 | - | - |
Telecommunication Services | 161,421 | 161,421 | - | - |
Utilities | 170,965 | 170,965 | - | - |
Corporate Bonds | 103,681 | - | 103,640 | 41 |
Floating Rate Loans | 60,504 | - | 60,504 | - |
Other | 1,295 | - | - | 1,295 |
Money Market Funds | 148,609 | 148,609 | - | - |
Total Investments in Securities: | $ 4,474,851 | $ 4,292,918 | $ 176,983 | $ 4,950 |
The following is a reconciliation of Investments in Securities for which Level 3 inputs were used in determining value: |
Investments in Securities:
(Amounts in thousands) | |
Beginning Balance | $ 2,534 |
Total Realized Gain (Loss) | - |
Total Unrealized Gain (Loss) | 761 |
Cost of Purchases | 3,614 |
Proceeds of Sales | (1,406) |
Amortization/Accretion | - |
Transfers in to Level 3 | - |
Transfers out of Level 3 | (553) |
Ending Balance | $ 4,950 |
The change in unrealized gain (loss) for the period attributable to Level 3 securities held at July 31, 2010 | $ 761 |
The information used in the above reconciliation represents fiscal year to date activity for any Investments in Securities identified as using Level 3 inputs at either the beginning or the end of the current fiscal period. Transfers in or out of Level 3 represent the beginning value of any Security or Instrument where a change in the pricing level occurred from the beginning to the end of the period. The cost of purchases and the proceeds of sales may include securities received or delivered through corporate actions or exchanges. Realized and unrealized gains (losses) disclosed in the reconciliation are included in Net Gain (Loss) on the Fund's Statement of Operations. |
Income Tax Information |
At July 31, 2010, the Fund had a capital loss carryforward of approximately $988,870,000 of which $297,190,000 and $691,680,000 will expire on July 31, 2017 and 2018, respectively. Capital loss carryforwards are only available to offset future capital gains of the Fund to the extent provided by regulations and may be limited. |
See accompanying notes which are an integral part of the financial statements.
Annual Report
Statement of Assets and Liabilities
Amounts in thousands (except per-share amounts) | July 31, 2010 |
| | |
Assets | | |
Investment in securities, at value (including securities loaned of $86,901) - See accompanying schedule: Unaffiliated issuers (cost $4,015,511) | $ 3,988,866 | |
Fidelity Central Funds (cost $148,609) | 148,609 | |
Other affiliated issuers (cost $348,030) | 337,376 | |
Total Investments (cost $4,512,150) | | $ 4,474,851 |
Cash | | 23 |
Receivable for investments sold | | 9,254 |
Receivable for fund shares sold | | 2,316 |
Dividends receivable | | 1,014 |
Interest receivable | | 1,543 |
Distributions receivable from Fidelity Central Funds | | 109 |
Other receivables | | 27 |
Total assets | | 4,489,137 |
| | |
Liabilities | | |
Payable for fund shares redeemed | 4,986 | |
Accrued management fee | 2,184 | |
Other affiliated payables | 890 | |
Other payables and accrued expenses | 54 | |
Collateral on securities loaned, at value | 88,077 | |
Total liabilities | | 96,191 |
| | |
Net Assets | | $ 4,392,946 |
Net Assets consist of: | | |
Paid in capital | | $ 5,426,375 |
Undistributed net investment income | | 10,281 |
Accumulated undistributed net realized gain (loss) on investments and foreign currency transactions | | (1,006,409) |
Net unrealized appreciation (depreciation) on investments and assets and liabilities in foreign currencies | | (37,301) |
Net Assets | | $ 4,392,946 |
See accompanying notes which are an integral part of the financial statements.
Annual Report
Statement of Assets and Liabilities - continued
Amounts in thousands (except per-share amounts) | July 31, 2010 |
| | |
Leveraged Company Stock:
Net Asset Value, offering price and redemption price per share ($3,983,012 ÷ 169,456 shares) | | $ 23.50 |
| | |
Class K:
Net Asset Value, offering price and redemption price per share ($409,934 ÷ 17,427 shares) | | $ 23.52 |
See accompanying notes which are an integral part of the financial statements.
Annual Report
Financial Statements - continued
Statement of Operations
Amounts in thousands | Year ended July 31, 2010 |
| | |
Investment Income | | |
Dividends (including $2,831 earned from other affiliated issuers) | | $ 33,063 |
Interest | | 19,113 |
Income from Fidelity Central Funds | | 850 |
Total income | | 53,026 |
| | |
Expenses | | |
Management fee | $ 27,676 | |
Transfer agent fees | 10,157 | |
Accounting and security lending fees | 1,175 | |
Custodian fees and expenses | 60 | |
Independent trustees' compensation | 26 | |
Registration fees | 106 | |
Audit | 63 | |
Legal | 38 | |
Miscellaneous | 76 | |
Total expenses before reductions | 39,377 | |
Expense reductions | (161) | 39,216 |
Net investment income (loss) | | 13,810 |
Realized and Unrealized Gain (Loss) Net realized gain (loss) on: | | |
Investment securities: | | |
Unaffiliated issuers | 189,278 | |
Other affiliated issuers | 11,822 | |
Foreign currency transactions | (41) | |
Capital gain distributions from Fidelity Central Funds | 6 | |
Total net realized gain (loss) | | 201,065 |
Change in net unrealized appreciation (depreciation) on: Investment securities | 593,664 | |
Assets and liabilities in foreign currencies | (16) | |
Total change in net unrealized appreciation (depreciation) | | 593,648 |
Net gain (loss) | | 794,713 |
Net increase (decrease) in net assets resulting from operations | | $ 808,523 |
See accompanying notes which are an integral part of the financial statements.
Annual Report
Statement of Changes in Net Assets
Amounts in thousands | Year ended
July 31,
2010 | Year ended
July 31,
2009 |
Increase (Decrease) in Net Assets | | |
Operations | | |
Net investment income (loss) | $ 13,810 | $ 46,155 |
Net realized gain (loss) | 201,065 | (1,210,936) |
Change in net unrealized appreciation (depreciation) | 593,648 | (1,921,072) |
Net increase (decrease) in net assets resulting
from operations | 808,523 | (3,085,853) |
Distributions to shareholders from net investment income | (23,690) | (31,749) |
Distributions to shareholders from net realized gain | - | (63,967) |
Total distributions | (23,690) | (95,716) |
Share transactions - net increase (decrease) | (373,729) | (872,099) |
Redemption fees | 970 | 2,433 |
Total increase (decrease) in net assets | 412,074 | (4,051,235) |
| | |
Net Assets | | |
Beginning of period | 3,980,872 | 8,032,107 |
End of period (including undistributed net investment income of $10,281 and undistributed net investment income of $21,357, respectively) | $ 4,392,946 | $ 3,980,872 |
See accompanying notes which are an integral part of the financial statements.
Annual Report
Financial Highlights - Leveraged Company Stock
Years ended July 31, | 2010 | 2009 | 2008 | 2007 | 2006 |
Selected Per-Share Data | | | | | |
Net asset value, beginning of period | $ 19.55 | $ 31.09 | $ 33.78 | $ 28.07 | $ 25.48 |
Income from Investment Operations | | | | | |
Net investment income (loss) B | .07 | .21 | .14 | .44 E | .16 |
Net realized and unrealized gain (loss) | 3.99 | (11.37) | (1.06) | 6.78 | 3.04 |
Total from investment operations | 4.06 | (11.16) | (.92) | 7.22 | 3.20 |
Distributions from net investment income | (.11) | (.14) | (.39) | (.12) | (.21) |
Distributions from net realized gain | - | (.25) | (1.39) | (1.40) | (.41) |
Total distributions | (.11) | (.39) | (1.78) | (1.52) | (.62) |
Redemption fees added to paid in capital B | - G | .01 | .01 | .01 | .01 |
Net asset value, end of period | $ 23.50 | $ 19.55 | $ 31.09 | $ 33.78 | $ 28.07 |
Total Return A | 20.84% | (35.99)% | (2.76)% | 27.08% | 12.80% |
Ratios to Average Net Assets C, F | | | | |
Expenses before reductions | .88% | .92% | .83% | .83% | .86% |
Expenses net of fee waivers, if any | .88% | .92% | .83% | .83% | .86% |
Expenses net of all reductions | .88% | .92% | .83% | .83% | .85% |
Net investment income (loss) | .29% | 1.17% | .44% | 1.43% E | .60% |
Supplemental Data | | | | | |
Net assets, end of period (in millions) | $ 3,983 | $ 3,714 | $ 8,032 | $ 7,830 | $ 4,174 |
Portfolio turnover rate D | 21% | 34% | 30% | 20% | 23% |
A Total returns would have been lower had certain expenses not been reduced during the periods shown.
B Calculated based on average shares outstanding during the period.
C Fees and expenses of the underlying Fidelity Central Funds are not included in the Fund's expense ratio. The Fund indirectly bears its proportionate share of the expenses of any underlying Fidelity Central Funds.
D Amount does not include the portfolio activity of any underlying Fidelity Central Funds.
E Investment income per share reflects a special dividend which amounted to $.26 per share. Excluding the special dividend, the ratio of net investment income (loss) to average net assets would have been .59%.
F Expense ratios reflect operating expenses of the class. Expenses before reductions do not reflect amounts reimbursed by the investment adviser or reductions from brokerage service arrangements or reductions from other expense offset arrangements and do not represent the amount paid by the class during periods when reimbursements or reductions occur. Expenses net of fee waivers reflect expenses after reimbursement by the investment adviser but prior to reductions from brokerage service arrangements or other expense offset arrangements. Expenses net of all reductions represent the net expenses paid by the class.
G Amount represents less than $.01 per share.
See accompanying notes which are an integral part of the financial statements.
Annual Report
Financial Highlights - Class K
Years ended July 31, | 2010 | 2009 | 2008 G |
Selected Per-Share Data | | | |
Net asset value, beginning of period | $ 19.56 | $ 31.11 | $ 34.10 |
Income from Investment Operations | | | |
Net investment income (loss) D | .11 | .21 | .05 |
Net realized and unrealized gain (loss) | 4.00 | (11.35) | (3.04) |
Total from investment operations | 4.11 | (11.14) | (2.99) |
Distributions from net investment income | (.15) | (.17) | - |
Distributions from net realized gain | - | (.25) | - |
Total distributions | (.15) | (.42) | - |
Redemption fees added to paid in capital D | - I | .01 | - I |
Net asset value, end of period | $ 23.52 | $ 19.56 | $ 31.11 |
Total Return B, C | 21.09% | (35.86)% | (8.77)% |
Ratios to Average Net Assets E, H | | | |
Expenses before reductions | .70% | .71% | .70% A |
Expenses net of fee waivers, if any | .70% | .71% | .70% A |
Expenses net of all reductions | .69% | .71% | .70% A |
Net investment income (loss) | .47% | 1.39% | .58% A |
Supplemental Data | | | |
Net assets, end of period (000 omitted) | $ 409,934 | $ 267,351 | $ 91 |
Portfolio turnover rate F | 21% | 34% | 30% |
A Annualized
B Total returns for periods of less than one year are not annualized.
C Total returns would have been lower had certain expenses not been reduced during the periods shown.
D Calculated based on average shares outstanding during the period.
E Fees and expenses of the underlying Fidelity Central Funds are not included in the Fund's expense ratio. The Fund indirectly bears its proportionate share of the expenses of any underlying Fidelity Central Funds.
F Amount does not include the portfolio activity of any underlying Fidelity Central Funds.
G For the period May 9, 2008 (commencement of sale of shares) to July 31, 2008.
H Expense ratios reflect operating expenses of the class. Expenses before reductions do not reflect amounts reimbursed by the investment adviser or reductions from brokerage service arrangements or reductions from other expense offset arrangements and do not represent the amount paid by the class during periods when reimbursements or reductions occur. Expense ratios before reductions for start-up periods may not be representative of longer-term operating periods. Expenses net of fee waivers reflect expenses after reimbursement by the investment adviser but prior to reductions from brokerage service arrangements or other expense offset arrangements. Expenses net of all reductions represent the net expenses paid by the class.
I Amount represents less than $.01 per share.
See accompanying notes which are an integral part of the financial statements.
Annual Report
Notes to Financial Statements
For the period ended July 31, 2010
(Amounts in thousands except ratios)
1. Organization.
Fidelity Leveraged Company Stock Fund (the Fund) is a fund of Fidelity Securities Fund (the Trust) and is authorized to issue an unlimited number of shares. The Trust is registered under the Investment Company Act of 1940, as amended (the 1940 Act), as an open-end management investment company organized as a Massachusetts business trust. The Fund offers Leveraged Company Stock and Class K, each of which has equal rights as to assets and voting privileges. Each class has exclusive voting rights with respect to matters that affect that class. After the commencement of Class K, the Fund began offering conversion privileges between Leveraged Company Stock and Class K to eligible shareholders of Leveraged Company Stock. Investment income, realized and unrealized capital gains and losses, the common expenses of the Fund, and certain fund-level expense reductions, if any, are allocated on a pro-rata basis to each class based on the relative net assets of each class to the total net assets of the Fund. Each class differs with respect to transfer agent fees incurred. Certain expense reductions also differ by class.
2. Investments in Fidelity Central Funds.
The Fund may invest in Fidelity Central Funds, which are open-end investment companies available only to other investment companies and accounts managed by Fidelity Management & Research Company (FMR) and its affiliates. The Fund's Schedule of Investments lists each of the Fidelity Central Funds held as of period end, if any, as an investment of the Fund, but does not include the underlying holdings of each Fidelity Central Fund. As an Investing Fund, the Fund indirectly bears its proportionate share of the expenses of the underlying Fidelity Central Funds.
The Money Market Central Funds seek preservation of capital and current income and are managed by Fidelity Investments Money Management, Inc. (FIMM), an affiliate of FMR.
A complete unaudited list of holdings for each Fidelity Central Fund is available upon request or at the Securities and Exchange Commission (the SEC) web site at www.sec.gov. In addition, the financial statements of the Fidelity Central Funds which are not covered by the Fund's Report of Independent Registered Public Accounting Firm, are available on the SEC web site or upon request.
3. Significant Accounting Policies.
The financial statements have been prepared in conformity with accounting principles generally accepted in the United States of America (GAAP), which require management to make certain estimates and assumptions at the date of the financial statements. Actual results could differ from those estimates. The following summarizes the significant accounting policies of the Fund:
Annual Report
Notes to Financial Statements - continued
(Amounts in thousands except ratios)
3. Significant Accounting Policies - continued
Security Valuation. Investments are valued as of 4:00 p.m. Eastern time on the last calendar day of the period. The Fund uses independent pricing services approved by the Board of Trustees to value its investments. When current market prices or quotations are not readily available or reliable, valuations may be determined in good faith in accordance with procedures adopted by the Board of Trustees. Factors used in determining value may include market or security specific events, changes in interest rates and credit quality. The frequency with which these procedures are used cannot be predicted and they may be utilized to a significant extent. The value used for net asset value (NAV) calculation under these procedures may differ from published prices for the same securities.
The Fund categorizes the inputs to valuation techniques used to value its investments into a disclosure hierarchy consisting of three levels as shown below.
Level 1 - quoted prices in active markets for identical investments
Level 2 - other significant observable inputs (including quoted prices for similar investments, interest rates, prepayment speeds, etc.)
Level 3 - unobservable inputs (including the fund's own assumptions based on the best information available)
Changes in valuation techniques may result in transfers in or out of an assigned level within the disclosure hierarchy. The aggregate value of investments by input level, as of July 31, 2010, as well as a roll forward of Level 3 securities, is included at the end of the Fund's Schedule of Investments. Valuation techniques used to value the Fund's investments by major category are as follows.
Equity securities, including restricted securities, for which market quotations are readily available, are valued at the last reported sale price or official closing price as reported by an independent pricing service on the primary market or exchange on which they are traded and are categorized as Level 1 in the hierarchy. In the event there were no sales during the day or closing prices are not available, securities are valued at the last quoted bid price or may be valued using the last available price and are generally categorized as Level 2 in the hierarchy. For foreign equity securities, when significant market or security specific events arise, comparisons to the valuation of American Depositary Receipts (ADRs), futures contracts, Exchange-traded funds (ETFs) and certain indexes as well as quoted prices for similar securities are used and are categorized as Level 2 in the hierarchy in these circumstances. Utilizing these techniques may result in transfers between Level 1 and Level 2. For restricted equity securities and private placements where observable inputs are limited, assumptions about market activity and risk are used and are categorized as Level 3 in the hierarchy.
Annual Report
3. Significant Accounting Policies - continued
Security Valuation - continued
Debt securities, including restricted securities, are valued based on evaluated prices received from independent pricing services or from dealers who make markets in such securities. For corporate bonds and floating rate loans, pricing services utilize matrix pricing which considers yield or price of bonds of comparable quality, coupon, maturity and type as well as dealer supplied prices and are generally categorized as Level 2 in the hierarchy.
Investments in open-end mutual funds, including the Fidelity Central Funds, are valued at their closing net asset value each business day and are categorized as Level 1 in the hierarchy. Short-term securities with remaining maturities of sixty days or less for which quotations are not readily available are valued at amortized cost, which approximates fair value and are categorized as Level 2 in the hierarchy.
When independent prices are unavailable or unreliable, debt securities may be valued utilizing pricing matrices which consider similar factors that would be used by independent pricing services. These are generally categorized as Level 2 in the hierarchy but may be Level 3 depending on the circumstances.
Foreign Currency. The Fund uses foreign currency contracts to facilitate transactions in foreign-denominated securities. Gains and losses from these transactions may arise from changes in the value of the foreign currency or if the counterparties do not perform under the contracts' terms.
Foreign-denominated assets, including investment securities, and liabilities are translated into U.S. dollars at the exchange rate at period end. Purchases and sales of investment securities, income and dividends received and expenses denominated in foreign currencies are translated into U.S. dollars at the exchange rate in effect on the transaction date.
The effects of exchange rate fluctuations on investments are included with the net realized and unrealized gain (loss) on investment securities. Other foreign currency transactions resulting in realized and unrealized gain (loss) are disclosed separately.
Investment Transactions and Income. For financial reporting purposes, the Fund's investment holdings and NAV include trades executed through the end of the last business day of the period. The NAV per share for processing shareholder transactions is calculated as of the close of business of the New York Stock Exchange (NYSE), normally 4:00 p.m. Eastern time and includes trades executed through the end of the prior business day. Gains and losses on securities sold are determined on the basis of identified cost and may include proceeds received from litigation. Dividend income is recorded on the ex-dividend date, except for certain dividends from foreign securities where the
Annual Report
Notes to Financial Statements - continued
(Amounts in thousands except ratios)
3. Significant Accounting Policies - continued
Investment Transactions and Income - continued
ex-dividend date may have passed, which are recorded as soon as the Fund is informed of the ex-dividend date. Non-cash dividends included in dividend income, if any, are recorded at the fair market value of the securities received. Distributions received on securities that represent a return of capital or capital gain are recorded as a reduction of cost of investments and/or as a realized gain. The Fund estimates the components of distributions received that may be considered return of capital distributions or capital gain distributions. Interest income and distributions from the Fidelity Central Funds are accrued as earned. Interest income includes coupon interest and amortization of premium and accretion of discount on debt securities. Investment income is recorded net of foreign taxes withheld where recovery of such taxes is uncertain. Debt obligations may be placed on non-accrual status and related interest income may be reduced by ceasing current accruals and writing off interest receivables when the collection of all or a portion of interest has become doubtful based on consistently applied procedures. A debt obligation is removed from non-accrual status when the issuer resumes interest payments or when collectability of interest is reasonably assured.
Expenses. Most expenses of the Trust can be directly attributed to a fund. Expenses which cannot be directly attributed are apportioned amongst each fund in the Trust. Expense estimates are accrued in the period to which they relate and adjustments are made when actual amounts are known.
Income Tax Information and Distributions to Shareholders. Each year the Fund intends to qualify as a regulated investment company, including distributing substantially all of its taxable income and realized gains under Subchapter M of the Internal Revenue Code and filing its U.S. federal tax return. As a result, no provision for income taxes is required. As of July 31, 2010, the Fund did not have any unrecognized tax benefits in the accompanying financial statements. A fund's federal tax return is subject to examination by the Internal Revenue Service (IRS) for a period of three years. Foreign taxes are provided for based on the Fund's understanding of the tax rules and rates that exist in the foreign markets in which it invests.
Distributions are recorded on the ex-dividend date. Income dividends and capital gain distributions are declared separately for each class. Income and capital gain distributions are determined in accordance with income tax regulations, which may differ from GAAP.
Capital accounts within the financial statements are adjusted for permanent book-tax differences. These adjustments have no impact on net assets or the results of operations. Temporary book-tax differences will reverse in a subsequent period.
Annual Report
3. Significant Accounting Policies - continued
Income Tax Information and Distributions to Shareholders - continued
Book-tax differences are primarily due to the short-term gain distributions from the Fidelity Central Funds, foreign currency transactions, market discount, capital loss carryforwards and losses deferred due to wash sales and excise tax regulations.
The federal tax cost of investment securities and unrealized appreciation (depreciation) as of period end were as follows:
Gross unrealized appreciation | $ 806,591 |
Gross unrealized depreciation | (857,720) |
Net unrealized appreciation (depreciation) | $ (51,129) |
| |
Tax Cost | $ 4,525,980 |
The tax-based components of distributable earnings as of period end were as follows:
Undistributed ordinary income | $ 6,572 |
Capital loss carryforward | $ (988,870) |
Net unrealized appreciation (depreciation) | $ (51,131) |
The tax character of distributions paid was as follows:
| July 31, 2010 | July 31, 2009 |
Ordinary Income | $ 23,690 | $ 47,101 |
Long-term Capital Gains | - | 48,615 |
Total | $ 23,690 | $ 95,716 |
Short-Term Trading (Redemption) Fees. Shares held in the Fund less than 90 days are subject to a redemption fee equal to 1.50% of the proceeds of the redeemed shares. All redemption fees, including any estimated redemption fees paid by FMR, are retained by the Fund and accounted for as an addition to paid in capital.
4. Operating Policies.
Restricted Securities. The Fund may invest in securities that are subject to legal or contractual restrictions on resale. These securities generally may be resold in transactions exempt from registration or to the public if the securities are registered. Disposal of these securities may involve time-consuming negotiations and expense, and prompt sale at an acceptable price may be difficult. Information regarding restricted securities is included at the end of the Fund's Schedule of Investments.
Annual Report
Notes to Financial Statements - continued
(Amounts in thousands except ratios)
4. Operating Policies - continued
Loans and Other Direct Debt Instruments. The Fund may invest in loans and loan participations, trade claims or other receivables. These investments may include standby financing commitments, including revolving credit facilities, that obligate the Fund to supply additional cash to the borrower on demand. Loan participations involve a risk of insolvency of the lending bank or other financial intermediary. The Fund may be contractually obligated to receive approval from the agent bank and/or borrower prior to the sale of these investments.
5. Purchases and Sales of Investments.
Purchases and sales of securities, other than short-term securities, aggregated $916,790 and $1,229,143, respectively.
6. Fees and Other Transactions with Affiliates.
Management Fee. FMR and its affiliates provide the Fund with investment management related services for which the Fund pays a monthly management fee. The management fee is the sum of an individual fund fee rate that is based on an annual rate of .35% of the Fund's average net assets and a group fee rate that averaged .26% during the period. The group fee rate is based upon the average net assets of all the mutual funds advised by FMR. The group fee rate decreases as assets under management increase and increases as assets under management decrease. For the period, the total annual management fee rate was .61% of the Fund's average net assets.
Transfer Agent Fees. Fidelity Investments Institutional Operations Company, Inc. (FIIOC), an affiliate of FMR, is the transfer, dividend disbursing and shareholder servicing agent for each class of the Fund. FIIOC receives account fees and asset-based fees that vary according to the account size and type of account of the shareholders of Leveraged Company Stock. FIIOC receives an asset-based fee of Class K's average net assets. FIIOC pays for typesetting, printing and mailing of shareholder reports, except proxy statements. For the period, the total transfer agent fees paid by each class were as follows:
| Amount | % of
Average
Net Assets |
Leveraged Company Stock | $ 9,954 | .24 |
Class K | 203 | .05 |
| $ 10,157 | |
Annual Report
6. Fees and Other Transactions with Affiliates - continued
Accounting and Security Lending Fees. Fidelity Service Company, Inc. (FSC), an affiliate of FMR, maintains the Fund's accounting records. The accounting fee is based on the level of average net assets for the month. Under a separate contract, FSC administers the security lending program. The security lending fee is based on the number and duration of lending transactions.
Brokerage Commissions. The Fund placed a portion of its portfolio transactions with brokerage firms which are affiliates of the investment adviser. The commissions paid to these affiliated firms were $72 for the period.
7. Committed Line of Credit.
The Fund participates with other funds managed by FMR in a $3.75 billion credit facility (the "line of credit") to be utilized for temporary or emergency purposes to fund shareholder redemptions or for other short-term liquidity purposes. The Fund has agreed to pay commitment fees on its pro-rata portion of the line of credit, which amounted to $18 and is reflected in Miscellaneous expenses on the Statement of Operations. During the period, there were no borrowings on this line of credit.
8. Security Lending.
The Fund lends portfolio securities from time to time in order to earn additional income. On the settlement date of the loan, the Fund receives collateral (in the form of U.S. Treasury obligations, letters of credit and/or cash) against the loaned securities and maintains collateral in an amount not less than 100% of the market value of the loaned securities during the period of the loan. The market value of the loaned securities is determined at the close of business of the Fund and any additional required collateral is delivered to the Fund on the next business day. If the borrower defaults on its obligation to return the securities loaned because of insolvency or other reasons, a fund could experience delays and costs in recovering the securities loaned or in gaining access to the collateral. Any cash collateral received is invested in the Fidelity Securities Lending Cash Central Fund. The value of loaned securities and cash collateral at period end are disclosed on the Fund's Statement of Assets and Liabilities. Security lending income represents the income earned on investing cash collateral, less fees and expenses associated with the loan, plus any premium payments that may be received on the loan of certain types of securities. Security lending income is presented in the Statement of Operations as a component of income from Fidelity Central Funds. Net income from lending portfolio securities during the period amounted to $449.
Annual Report
Notes to Financial Statements - continued
(Amounts in thousands except ratios)
9. Expense Reductions.
Many of the brokers with whom FMR places trades on behalf of the Fund provided services to the Fund in addition to trade execution. These services included payments of certain expenses on behalf of the Fund totaling $160 for the period. In addition, through arrangements with the Fund's custodian, credits realized as a result of uninvested cash balances were used to reduce the Fund's expenses. During the period, these credits reduced the Fund's custody expenses by $1.
10. Distributions to Shareholders.
Distributions to shareholders of each class were as follows:
Years ended July 31, | 2010 | 2009 |
From net investment income | | |
Leveraged Company Stock | $ 21,247 | $ 30,127 |
Class K | 2,443 | 1,622 |
Total | $ 23,690 | $ 31,749 |
From net realized gain | | |
Leveraged Company Stock | $ - | $ 63,966 |
Class K | - | 1 |
Total | $ - | $ 63,967 |
11. Share Transactions.
Transactions for each class of shares were as follows:
| Shares | Dollars |
Years ended July 31, | 2010 A | 2009 | 2010 A | 2009 |
Leveraged Company Stock | | | | |
Shares sold | 36,532 | 52,607 | $ 843,196 | $ 972,232 |
Conversion to Class K | (2,316) | (12,957) | (48,185) | (289,406) |
Reinvestment of distributions | 940 | 3,995 | 20,361 | 89,681 |
Shares redeemed | (55,646) | (112,023) | (1,272,555) | (1,955,126) |
Net increase (decrease) | (20,490) | (68,378) | $ (457,183) | $ (1,182,619) |
Class K | | | | |
Shares sold | 5,965 | 6,741 | $ 138,844 | $ 105,087 |
Conversion from Leveraged Company Stock | 2,315 | 12,954 | 48,185 | 289,406 |
Reinvestment of distributions | 113 | 118 | 2,443 | 1,623 |
Shares redeemed | (4,631) | (6,151) | (106,018) | (85,596) |
Net increase (decrease) | 3,762 | 13,662 | $ 83,454 | $ 310,520 |
A Conversion transactions for Class K and Leveraged Company Stock are presented for the period August 1, 2009 through August 31, 2009.
Annual Report
12. Other.
The Fund's organizational documents provide former and current trustees and officers with a limited indemnification against liabilities arising in connection with the performance of their duties to the Fund. In the normal course of business, the Fund may also enter into contracts that provide general indemnifications. The Fund's maximum exposure under these arrangements is unknown as this would be dependent on future claims that may be made against the Fund. The risk of material loss from such claims is considered remote.
Annual Report
To the Trustees of Fidelity Securities Fund and the Shareholders of Fidelity Leveraged Company Stock Fund:
In our opinion, the accompanying statement of assets and liabilities, including the schedule of investments, and the related statements of operations and of changes in net assets and the financial highlights present fairly, in all material respects, the financial position of Fidelity Leveraged Company Stock Fund (a fund of Fidelity Securities Fund) at July 31, 2010, the results of its operations for the year then ended, the changes in its net assets for each of the two years in the period then ended and the financial highlights for each of the periods indicated, in conformity with accounting principles generally accepted in the United States of America. These financial statements and financial highlights (hereafter referred to as "financial statements") are the responsibility of the Fidelity Leveraged Company Stock Fund's management. Our responsibility is to express an opinion on these financial statements based on our audits. We conducted our audits of these financial statements in accordance with the standards of the Public Company Accounting Oversight Board (United States). Those standards require that we plan and perform the audit to obtain reasonable assurance about whether the financial statements are free of material misstatement. An audit includes examining, on a test basis, evidence supporting the amounts and disclosures in the financial statements, assessing the accounting principles used and significant estimates made by management, and evaluating the overall financial statement presentation. We believe that our audits, which included confirmation of securities at July 31, 2010 by correspondence with the custodian and brokers, provide a reasonable basis for our opinion.
/s/ PricewaterhouseCoopers LLP
PricewaterhouseCoopers LLP
Boston, Massachusetts
September 22, 2010
Annual Report
The Trustees, Member of the Advisory Board, and executive officers of the trust and fund, as applicable, are listed below. The Board of Trustees governs the fund and is responsible for protecting the interests of shareholders. The Trustees are experienced executives who meet periodically throughout the year to oversee the fund's activities, review contractual arrangements with companies that provide services to the fund, oversee management of the risks associated with such activities and contractual arrangements, and review the fund's performance. Except for James C. Curvey, each of the Trustees oversees 222 funds advised by FMR or an affiliate. Mr. Curvey oversees 411 funds advised by FMR or an affiliate.
The Trustees hold office without limit in time except that (a) any Trustee may resign; (b) any Trustee may be removed by written instrument, signed by at least two-thirds of the number of Trustees prior to such removal; (c) any Trustee who requests to be retired or who has become incapacitated by illness or injury may be retired by written instrument signed by a majority of the other Trustees; and (d) any Trustee may be removed at any special meeting of shareholders by a two-thirds vote of the outstanding voting securities of the trust. Each Trustee who is not an interested person (as defined in the 1940 Act) (Independent Trustee), shall retire not later than the last day of the calendar year in which his or her 72nd birthday occurs. The Independent Trustees may waive this mandatory retirement age policy with respect to individual Trustees. The executive officers and Advisory Board Member hold office without limit in time, except that any officer and Advisory Board Member may resign or may be removed by a vote of a majority of the Trustees at any regular meeting or any special meeting of the Trustees. Except as indicated, each individual has held the office shown or other offices in the same company for the past five years.
Experience, Skills, Attributes, and Qualifications of the Fund's Trustees. The Governance and Nominating Committee has adopted a statement of policy that describes the experience, qualifications, attributes, and skills that are necessary and desirable for potential Independent Trustee candidates (Statement of Policy). The Board believes that each Trustee satisfied at the time he or she was initially elected or appointed a Trustee, and continues to satisfy, the standards contemplated by the Statement of Policy. The Governance and Nominating Committee also engages professional search firms to help identify potential Independent Trustee candidates who have the experience, qualifications, attributes, and skills consistent with the Statement of Policy. From time to time, additional criteria based on the composition and skills of the current Independent Trustees, as well as experience or skills that may be appropriate in light of future changes to board composition, business conditions, and regulatory or other developments, have also been considered by the professional search firms and the Governance and Nominating Committee. In addition, the Board takes into account the Trustees' commitment and participation in Board and committee meetings, as well as their leadership of standing and ad hoc committees throughout their tenure.
In determining that a particular Trustee was and continues to be qualified to serve as a Trustee, the Board has considered a variety of criteria, none of which, in isolation, was controlling. The Board believes that, collectively, the Trustees have balanced and diverse experience, qualifications, attributes, and skills, which allow the Board to operate effectively in governing the fund and protecting the interests of shareholders. Information about the specific experience, skills, attributes, and qualifications of each Trustee, which in each case led to the Board's conclusion that the Trustee should serve (or continue to serve) as a trustee of the fund, is provided below.
Annual Report
Board Structure and Oversight Function. Edward C. Johnson 3d is an interested person (as defined in the 1940 Act) and currently serves as Chairman. The Trustees have determined that an interested Chairman is appropriate and benefits shareholders because an interested Chairman has a personal and professional stake in the quality and continuity of services provided to the fund. Independent Trustees exercise their informed business judgment to appoint an individual of their choosing to serve as Chairman, regardless of whether the Trustee happens to be independent or a member of management. The Independent Trustees have determined that they can act independently and effectively without having an Independent Trustee serve as Chairman and that a key structural component for assuring that they are in a position to do so is for the Independent Trustees to constitute a substantial majority for the Board. The Independent Trustees also regularly meet in executive session. Ned C. Lautenbach serves as Chairman of the Independent Trustees and as such (i) acts as a liaison between the Independent Trustees and management with respect to matters important to the Independent Trustees and (ii) with management prepares agendas for Board meetings.
Fidelity funds are overseen by different Boards of Trustees. The fund's Board oversees Fidelity's equity and high income funds and another Board oversees Fidelity's investment-grade bond, money market, and asset allocation funds. The asset allocation funds may invest in Fidelity funds overseen by the fund's Board. The use of separate Boards, each with its own committee structure, allows the Trustees of each group of Fidelity funds to focus on the unique issues of the funds they oversee, including common research, investment, and operational issues. On occasion, the separate Boards establish joint committees to address issues of overlapping consequences for the Fidelity funds overseen by each Board.
The Trustees operate using a system of committees to facilitate the timely and efficient consideration of all matters of importance to the Trustees, the fund, and fund shareholders and to facilitate compliance with legal and regulatory requirements and oversight of the fund's activities and associated risks. The Board, acting through its committees, has charged FMR and its affiliates with (i) identifying events or circumstances the occurrence of which could have demonstrably adverse effects on the fund's business and/or reputation; (ii) implementing processes and controls to lessen the possibility that such events or circumstances occur or to mitigate the effects of such events or circumstances if they do occur; and (iii) creating and maintaining a system designed to evaluate continuously business and market conditions in order to facilitate the identification and implementation processes described in (i) and (ii) above. Because the day-to-day operations and activities of the fund are carried out by or through FMR, its affiliates and other service providers, the fund's exposure to risks is mitigated but not eliminated by the processes overseen by the Trustees. While each of the Board's committees has responsibility for overseeing different aspects of the fund's activities, oversight is exercised primarily through the Operations, Audit, and Compliance Committees. Appropriate personnel, including but not limited to the fund's Chief Compliance Officer (CCO), FMR's internal auditor, the independent accountants, the fund's Treasurer and portfolio management personnel, make periodic reports to the Board's committees, as appropriate. The responsibilities of each committee, including their oversight responsibilities, are described further under "Standing Committees of the Fund's Trustees."
Annual Report
Trustees and Officers - continued
The fund's Statement of Additional Information (SAI) includes more information about the Trustees. To request a free copy, call Fidelity at 1-800-544-8544.
Interested Trustees*:
Correspondence intended for each Trustee who is an interested person may be sent to Fidelity Investments, 82 Devonshire Street, Boston, Massachusetts 02109.
Name, Age; Principal Occupations and Other Relevant Experience+ |
Edward C. Johnson 3d (80) |
| Year of Election or Appointment: 1984 Mr. Johnson is Trustee and Chairman of the Board of Trustees of certain Trusts. Mr. Johnson serves as Chief Executive Officer, Chairman, and a Director of FMR LLC; Chairman and a Director of FMR; Chairman and a Director of Fidelity Research & Analysis Company (FRAC); Chairman and a Director of Fidelity Investments Money Management, Inc.; and Chairman and a Director of FMR Co., Inc. In addition, Mr. Johnson serves as Chairman and Director of FIL Limited. Previously, Mr. Johnson served as President of FMR LLC (2006-2007). |
James C. Curvey (75) |
| Year of Election or Appointment: 2007 Mr. Curvey also serves as Trustee (2007-present) of other investment companies advised by FMR. Mr. Curvey is a Director of FMR and FMR Co., Inc. (2007-present). Mr. Curvey is also Vice Chairman (2006-present) and Director of FMR LLC. In addition, Mr. Curvey serves as an Overseer for the Boston Symphony Orchestra and a member of the Trustees of Villanova University. |
* Trustees have been determined to be "Interested Trustees" by virtue of, among other things, their affiliation with the trust or various entities under common control with FMR.
+ The information above includes each Trustee's principal occupation during the last five years and other information relating to the experience, attributes, and skills relevant to each Trustee's qualifications to serve as a Trustee, which led to the conclusion that each Trustee should serve as a Trustee for the fund.
Annual Report
Independent Trustees:
Correspondence intended for each Independent Trustee (that is, the Trustees other than the Interested Trustees) may be sent to Fidelity Investments, P.O. Box 55235, Boston, Massachusetts 02205-5235.
Name, Age; Principal Occupations and Other Relevant Experience+ |
Dennis J. Dirks (62) |
| Year of Election or Appointment: 2005 Prior to his retirement in May 2003, Mr. Dirks was Chief Operating Officer and a member of the Board of The Depository Trust & Clearing Corporation (DTCC). He also served as President, Chief Operating Officer, and Board member of The Depository Trust Company (DTC) and President and Board member of the National Securities Clearing Corporation (NSCC). In addition, Mr. Dirks served as Chief Executive Officer and Board member of the Government Securities Clearing Corporation, Chief Executive Officer and Board member of the Mortgage-Backed Securities Clearing Corporation, as a Trustee and a member of the Finance Committee of Manhattan College (2005-2008), and as a Trustee and a member of the Finance Committee of AHRC of Nassau County (2006-2008). Currently, Mr. Dirks serves as a member of the Board of Directors for The Brookville Center for Children's Services, Inc. (2009-present). |
Alan J. Lacy (56) |
| Year of Election or Appointment: 2008 Mr. Lacy serves as Senior Adviser (2007-present) of Oak Hill Capital Partners, L.P. (private equity). Mr. Lacy also served as Chief Executive Officer (2000-2005) and Vice Chairman (2005-2006) of Sears Holdings Corporation and Sears, Roebuck and Co. (retail). In addition, Mr. Lacy serves as a member of the Board of Directors of The Western Union Company (global money transfer, 2006-present) and Bristol-Myers Squibb Company (global pharmaceuticals, 2007-present). Mr. Lacy is Chairman (2008-present) and a member (2006-present) of the Board of Trustees of The National Parks Conservation Association. |
Ned C. Lautenbach (66) |
| Year of Election or Appointment: 2000 Mr. Lautenbach is Chairman of the Independent Trustees of the Equity and High Income Funds (2006-present). Mr. Lautenbach is an Advisory Partner of Clayton, Dubilier & Rice, Inc. (private equity investment, 2008-present) and was previously a Partner of Clayton, Dubilier & Rice, Inc. (1998-2008). Previously, Mr. Lautenbach was with the International Business Machines Corporation (IBM) from 1968 until his retirement in 1998. Mr. Lautenbach serves as a Director of Eaton Corporation (diversified industrial) as well as the Philharmonic Center for the Arts in Naples, Florida. Mr. Lautenbach is also a member of the Board of Trustees of Fairfield University (2005-present), as well as a member of the Council on Foreign Relations. Previously, Mr. Lautenbach served as a Director of Sony Corporation (2006-2007). |
Joseph Mauriello (65) |
| Year of Election or Appointment: 2008 Prior to his retirement in January 2006, Mr. Mauriello served in numerous senior management positions including Deputy Chairman and Chief Operating Officer (2004-2005), and Vice Chairman of Financial Services (2002-2004) of KPMG LLP US (professional services, 1965-2005). Mr. Mauriello currently serves as a member of the Board of Directors of XL Capital Ltd. (global insurance and re-insurance, 2006-present) and of Arcadia Resources Inc. (health care services and products, 2007-present). Previously, Mr. Mauriello served as a Director of the Hamilton Funds of the Bank of New York (2006-2007). |
Cornelia M. Small (66) |
| Year of Election or Appointment: 2005 Ms. Small is a member of the Board of Directors of the Teagle Foundation (2009-present). Ms. Small is also a member of the Investment Committee, and Chair (2008-present) and a member of the Board of Trustees of Smith College. In addition, Ms. Small serves on the Investment Committee of the Berkshire Taconic Community Foundation (2008-
present). Previously, Ms. Small served as Chairperson of the Investment Committee (2002-2008) of Smith College. In addition, Ms. Small served as Chief Investment Officer, Director of Global Equity Investments, and a member of the Board of Directors of Scudder, Stevens & Clark and Scudder Kemper Investments. |
William S. Stavropoulos (71) |
| Year of Election or Appointment: 2002 Mr. Stavropoulos is Vice Chairman of the Independent Trustees of the Equity and High Income Funds (2006-present). Mr. Stavropoulos serves as President and Founder of the Michigan Baseball Foundation, the Great Lakes Loons (2007-present). Mr. Stavropoulos is Chairman Emeritus of the Board of Directors of The Dow Chemical Company, where he previously served in numerous senior management positions, including President, CEO (1995-2000; 2002-2004), Chairman of the Executive Committee (2000-2006), and as a member of the Board of Directors (1990-2006). Currently, Mr. Stavropoulos is a Director of Teradata Corporation (data warehousing and technology solutions, 2008-present), Chemical Financial Corporation, Maersk Inc. (industrial conglomerate), Tyco International, Inc. (multinational manufacturing and services, 2007-present), and a member of the Advisory Board for Metalmark Capital (private equity investment, 2005-present). Mr. Stavropoulos is a special advisor to Clayton, Dubilier & Rice, Inc. (private equity investment). In addition, Mr. Stavropoulos is a member of the University of Notre Dame Advisory Council for the College of Science. |
David M. Thomas (61) |
| Year of Election or Appointment: 2008 Previously, Mr. Thomas served as Executive Chairman (2005-2006) and Chairman and Chief Executive Officer (2000-2005) of IMS Health, Inc. (pharmaceutical and healthcare information solutions). In addition, Mr. Thomas serves as a member of the Board of Directors of Fortune Brands, Inc. (consumer products), and Interpublic Group of Companies, Inc. (marketing communication, 2004-present). |
Michael E. Wiley (59) |
| Year of Election or Appointment: 2008 Mr. Wiley also serves as a Director of Asia Pacific Exploration Consolidated (international oil and gas exploration and production, 2008-present), and as a member of the Board of Trustees of the University of Tulsa (2000-2006; 2007-present). Mr. Wiley serves as a Director of Tesoro Corporation (independent oil refiner and marketer, 2005-present), and a Director of Bill Barrett Corporation (exploration and production, 2005-present). In addition, Mr. Wiley also serves as a Director of Post Oak Bank (privately-held bank, 2004-present). Previously, Mr. Wiley served as a Sr. Energy Advisor of Katzenbach Partners, LLC (consulting, 2006-2007), as an Advisory Director of Riverstone Holdings (private investment), Chairman, President, and CEO of Baker Hughes, Inc. (oilfield services, 2000-2004), and as Director of Spinnaker Exploration Company (exploration and production, 2001-2005). |
Annual Report
Trustees and Officers - continued
+ The information above includes each Trustee's principal occupation during the last five years and other information relating to the experience, attributes, and skills relevant to each Trustee's qualifications to serve as a Trustee, which led to the conclusion that each Trustee should serve as a Trustee for the fund.
Advisory Board Member and Executive Officers:
Correspondence intended for each executive officer and Peter S. Lynch may be sent to Fidelity Investments, 82 Devonshire Street, Boston, Massachusetts 02109.
Name, Age; Principal Occupation |
Peter S. Lynch (66) |
| Year of Election or Appointment: 2003 Member of the Advisory Board of Fidelity's Equity and High Income Funds. Mr. Lynch is Vice Chairman and a Director of FMR and FMR Co., Inc. In addition, Mr. Lynch serves as a Trustee of Boston College and as the Chairman of the Inner-City Scholarship Fund. Previously, Mr. Lynch served on the Special Olympics International Board of Directors (1997-2006). |
Kenneth B. Robins (40) |
| Year of Election or Appointment: 2008 President and Treasurer of Fidelity's Equity and High Income Funds. Mr. Robins also serves as President and Treasurer (2010-present) and Assistant Treasurer (2009-present) of other Fidelity funds and is an employee of Fidelity Investments (2004-present). Previously, Mr. Robins served as Deputy Treasurer of the Fidelity funds (2005-2008) and Treasurer and Chief Financial Officer of The North Carolina Capital Management Trust: Cash and Term Portfolios (2006-2008). |
Bruce T. Herring (44) |
| Year of Election or Appointment: 2006 Vice President of certain Equity Funds. Mr. Herring also serves as Group Chief Investments Officer of FMR. Previously, Mr. Herring served as a portfolio manager for Fidelity U.S. Equity Funds. |
Brian B. Hogan (45) |
| Year of Election or Appointment: 2009 Vice President of certain Equity Funds and Vice President of Sector Funds. Mr. Hogan also serves as Senior Vice President, Equity Research of FMR (2006-present) and President of FMR's Equity Division (2009-present). Previously, Mr. Hogan served as a portfolio manager. |
Scott C. Goebel (42) |
| Year of Election or Appointment: 2008 Secretary and Chief Legal Officer (CLO) of the Fidelity funds. Mr. Goebel also serves as General Counsel, Secretary, and Senior Vice President of FMR (2008-present) and FMR Co., Inc. (2008-present); Deputy General Counsel of FMR LLC; Chief Legal Officer of Fidelity Management & Research (Hong Kong) Limited (2008-present) and Assistant Secretary of Fidelity Management & Research (Japan) Inc. (2008-present), Fidelity Investments Money Management, Inc. (2008-present), Fidelity Management & Research (U.K.) Inc. (2008-present), and Fidelity Research and Analysis Company (2008-present). Previously, Mr. Goebel served as Assistant Secretary of the Funds (2007-2008) and as Vice President and Secretary of Fidelity Distributors Corporation (FDC) (2005-2007). |
William C. Coffey (41) |
| Year of Election or Appointment: 2009 Assistant Secretary of Fidelity's Equity and High Income Funds. Mr. Coffey also serves as Senior Vice President and Deputy General Counsel of FMR LLC (2010-present), and is an employee of Fidelity Investments. Previously, Mr. Coffey served as Vice President and Associate General Counsel of FMR LLC (2005-2009). |
Holly C. Laurent (56) |
| Year of Election or Appointment: 2008 Anti-Money Laundering (AML) Officer of the Fidelity funds. Ms. Laurent is an employee of Fidelity Investments. Previously, Ms. Laurent was Senior Vice President and Head of Legal for Fidelity Business Services India Pvt. Ltd. (2006-2008), and Senior Vice President, Deputy General Counsel and Group Head for FMR LLC (2005-2006). |
Christine Reynolds (51) |
| Year of Election or Appointment: 2008 Chief Financial Officer of the Fidelity funds. Ms. Reynolds became President of Fidelity Pricing and Cash Management Services (FPCMS) in August 2008. Ms. Reynolds served as Chief Operating Officer of FPCMS (2007-2008). Previously, Ms. Reynolds served as President, Treasurer, and Anti-Money Laundering officer of the Fidelity funds (2004-2007). |
Kenneth A. Rathgeber (63) |
| Year of Election or Appointment: 2004 Chief Compliance Officer of Fidelity's Equity and High Income Funds. Mr. Rathgeber is Chief Compliance Officer of Fidelity Management & Research (Hong Kong) Limited (2008-present), Fidelity Management & Research (Japan) Inc. (2008-present), FMR (2005-present), FMR Co., Inc. (2005-present), Fidelity Management & Research (U.K.) Inc. (2005-present), Fidelity Research & Analysis Company (2005-present), Fidelity Investments Money Management, Inc. (2005-present), Pyramis Global Advisors, LLC (2005-present), and Strategic Advisers, Inc. (2005-present). |
Jeffrey S. Christian (48) |
| Year of Election or Appointment: 2009 Deputy Treasurer of the Fidelity funds. Mr. Christian is an employee of Fidelity Investments. Previously, Mr. Christian served as Chief Financial Officer (2008-2009) of certain Fidelity funds and Senior Vice President of Fidelity Pricing and Cash Management Services (FPCMS) (2004-2009). |
Bryan A. Mehrmann (49) |
| Year of Election or Appointment: 2005 Deputy Treasurer of the Fidelity funds. Mr. Mehrmann is an employee of Fidelity Investments. |
Adrien E. Deberghes (42) |
| Year of Election or Appointment: 2008 Deputy Treasurer of Fidelity's Equity and High Income Funds. Mr. Deberghes also serves as Assistant Treasurer of other Fidelity funds (2010-present) and is an employee of Fidelity Investments (2008-
present). Previously, Mr. Deberghes served as Senior Vice President of Mutual Fund Administration at State Street Corporation (2007-2008), Senior Director of Mutual Fund Administration at Investors Bank & Trust (2005-2007), and Director of Finance for Dunkin' Brands (2000-2005). |
Stephanie J. Dorsey (41) |
| Year of Election or Appointment: 2010 Assistant Treasurer of Fidelity's Equity and High Income Funds. Ms. Dorsey also serves as Deputy Treasurer of other Fidelity funds (2008-present) and is an employee of Fidelity Investments (2008-
present). Previously, Ms. Dorsey served as Treasurer (2004-2008) of the JPMorgan Mutual Funds and Vice President (2004-2008) of JPMorgan Chase Bank. |
Name, Age; Principal Occupation |
John R. Hebble (52) |
| Year of Election or Appointment: 2009 Assistant Treasurer of Fidelity's Equity and High Income Funds. Mr. Hebble also serves as Treasurer and Chief Financial Officer of The North Carolina Capital Management Trust: Cash and Term Portfolio (2008-present), President and Treasurer of other Fidelity funds (2008-present) and is an employee of Fidelity Investments. |
Gary W. Ryan (51) |
| Year of Election or Appointment: 2005 Assistant Treasurer of the Fidelity funds. Mr. Ryan is an employee of Fidelity Investments. Previously, Mr. Ryan served as Vice President of Fund Reporting in Fidelity Pricing and Cash Management Services (FPCMS) (1999-2005). |
Annual Report
Leveraged Company Stock designates 92% of the dividends distributed in September, and 100% of the dividends distributed in December during the fiscal year as qualifying for the dividends-received deduction for corporate shareholders.
The fund designates 100% of the dividends distributed during the fiscal year as amounts which may be taken into account as a dividend for the purposes of the maximum rate under section 1(h)(11) of the Internal Revenue Code.
The fund will notify shareholders in January 2011 of amounts for use in preparing 2010 income tax returns.
Annual Report
Board Approval of Investment Advisory Contracts and Management Fees
Fidelity Leveraged Company Stock Fund
Each year, the Board of Trustees, including the Independent Trustees (together, the Board), votes on the renewal of the management contract and sub-advisory agreements (together, the Advisory Contracts) for the fund. The Board, assisted by the advice of fund counsel and Independent Trustees' counsel, requests and considers a broad range of information relevant to the renewal of the Advisory Contracts throughout the year.
The Board meets regularly and considers at each of its meetings factors that are relevant to its annual consideration of the renewal of the fund's Advisory Contracts, including the services and support provided to the fund and its shareholders. The Board has established various standing committees, each composed of Independent Trustees with varying backgrounds, to which the Board has assigned specific subject matter responsibilities in order to enhance effective decision-making by the Board. The Board, acting directly and through its Committees, requests and receives information concerning the annual consideration of the renewal of the fund's Advisory Contracts. The Board also meets as needed to consider matters specifically related to the Board's annual consideration of the renewal of Advisory Contracts. Members of the Board may also meet with trustees of other Fidelity funds through ad hoc joint committees to discuss certain matters relevant to the Fidelity funds.
At its July 2010 meeting, the Board of Trustees, including the Independent Trustees, unanimously determined to renew the fund's Advisory Contracts. In reaching its determination, the Board considered all factors it believed relevant, including (i) the nature, extent, and quality of the services to be provided to the fund and its shareholders (including the investment performance of the fund); (ii) the competitiveness of the fund's management fee and total expenses; (iii) the total costs of the services to be provided by and the profits to be realized by Fidelity from its relationship with the fund; (iv) the extent to which economies of scale would be realized as the fund grows; and (v) whether fee levels reflect these economies of scale, if any, for the benefit of fund shareholders.
In considering whether to renew the Advisory Contracts for the fund, the Board reached a determination, with the assistance of fund counsel and Independent Trustees' counsel and through the exercise of its business judgment, that the renewal of the Advisory Contracts is in the best interests of fund shareholders and that the compensation to be received by Fidelity under the management contract is fair and reasonable. The Board's decision to renew the Advisory Contracts was not based on any single factor noted above, but rather was based on a comprehensive consideration of all the information provided to the Board at its meetings throughout the year. The Board, in reaching its determination to renew the Advisory Contracts, is aware that shareholders in the fund have a broad range of investment choices available to them, including a wide choice among mutual funds offered by Fidelity's competitors, and that the fund's shareholders, with the opportunity to review and weigh the disclosure provided by the fund in its prospectus and other public disclosures, have chosen to invest in this fund, managed by Fidelity.
Annual Report
Board Approval of Investment Advisory Contracts and
Management Fees - continued
Nature, Extent, and Quality of Services Provided. The Board considered the staffing within the investment adviser, FMR, and the sub-advisers (together, the Investment Advisers), including the backgrounds of the fund's investment personnel and the fund's investment objective and discipline. The Independent Trustees also had discussions with senior management of Fidelity's investment operations and investment groups. The Board considered the structure of the portfolio manager compensation program and whether this structure provides appropriate incentives to act in the best interest of the fund.
Resources Dedicated to Investment Management and Support Services. The Board and the equity research subcommittee of the Board's Fund Oversight Committee reviewed the size, education, and experience of the Investment Advisers' investment staff, their use of technology, and the Investment Advisers' approach to recruiting, training, and retaining portfolio managers and other research, advisory, and management personnel. The Board noted that Fidelity's analysts have access to a variety of technological tools and market and securities data that enable them to perform both fundamental and quantitative analysis and to specialize in various disciplines. The Board considered Fidelity's extensive global research capabilities that enable the Investment Advisers to aggregate data from various sources in an effort to produce positive investment results. The Board also considered that Fidelity's portfolio managers and analysts have access to daily portfolio attribution that allows for monitoring of a fund's portfolio, as well as an electronic communication system that provides immediate real-time access to research concerning issuers and credit enhancers. The Board noted FMR's continued focus on strengthening the organization and discipline of equity portfolio management and research.
Shareholder and Administrative Services. The Board considered (i) the nature, extent, quality, and cost of advisory, administrative, and shareholder services performed by the Investment Advisers and their affiliates under the Advisory Contracts and under separate agreements covering transfer agency, pricing and bookkeeping, and securities lending services for the fund; (ii) the nature and extent of the investment adviser's supervision of third party service providers, principally custodians and subcustodians; and (iii) the resources devoted to, and the record of compliance with, the fund's compliance policies and procedures. The Board also reviewed the allocation of fund brokerage, including allocations to brokers affiliated with the Investment Advisers, the use of brokerage commissions to pay fund expenses, and the use of "soft" commission dollars to pay for research services.
The Board noted that the growth of fund assets over time across the complex allows Fidelity to reinvest in the development of services designed to enhance the value or convenience of the Fidelity funds as investment vehicles. These services include 24-hour access to account information and market information through phone representatives and over the Internet, and investor education materials and asset allocation tools.
Annual Report
Investment in a Large Fund Family. The Board considered the benefits to shareholders of investing in a Fidelity fund, including the benefits of investing in a fund that is part of a large family of funds offering a variety of investment disciplines and providing a large variety of mutual fund investor services. The Board noted that Fidelity had taken, or had made recommendations that resulted in the Fidelity funds taking, a number of actions over the previous year that benefited particular funds, including (i) dedicating additional resources to investment research and restructuring and broadening the focus of the investment research teams; (ii) bolstering the senior management team that oversees asset management; (iii) launching Class F of certain funds as a lower-fee class available to Freedom K and Freedom Index Funds; (iv) lowering the initial investment minimums and ongoing balance requirements for Real Estate High Income Fund; (v) eliminating subsequent purchase minimums for all funds and adding a waiver of the investment minimum requirement for new accounts opened with the proceeds of a systematic withdrawal plan; (vi) eliminating the withdrawal minimum and maximum limits for systematic withdrawals from Advisor funds; (vii) expanding sales load waivers on Class A shares for Destiny Planholders and expanding Institutional Class eligibility for Class O Destiny Planholders; and (viii) changing certain Class A and Class T sales charge structures to further align them with industry practices.
Investment Performance. The Board considered whether the fund has operated in accordance with its investment objective, as well as its record of compliance with its investment restrictions. It also reviewed the fund's absolute investment performance for each class, as well as the fund's relative investment performance for each class measured over multiple periods against (i) a broad-based securities market index, and (ii) a custom peer group of mutual funds deemed appropriate by Fidelity and reviewed by the Board. The following charts considered by the Board show, over the one-, three-, and five-year periods ended December 31, 2009, as available, the cumulative total returns of Class K and the retail class of the fund, the cumulative total returns of a broad-based securities market index ("benchmark"), and a range of cumulative total returns of a custom peer group of mutual funds defined by FMR based on categories assigned by Morningstar, Inc. The box within each chart shows the 25th percentile return (bottom of box) and the 75th percentile return (top of box) of the peer group. Returns shown above the box are in the first quartile and returns shown below the box are in the fourth quartile. The percentage beaten numbers noted below each chart correspond to the percentile box and represent the percentage of funds in the peer group whose performance was equal to or lower than that of the class indicated. The fund's custom peer group, defined by FMR, is a peer group that FMR believes provides a more meaningful performance comparison than the peer group assigned by Morningstar, Inc., which assigns mutual funds to categories based on their investment styles as measured by their underlying portfolio holdings.
Annual Report
Board Approval of Investment Advisory Contracts and
Management Fees - continued
Fidelity Leveraged Company Stock Fund

The Board reviewed the fund's relative investment performance against its peer group and noted that the performance of the retail class of the fund (the class with the longer performance record) was in the first quartile for the one- and five-year periods and the third quartile for the three-year period. The Board also noted that the investment performance of the retail class of the fund compared favorably to its benchmark for all the periods shown. The Board considered that the variations in performance between the fund's classes reflect the variations in class expenses, which result in lower performance for the higher expense class. The Board also reviewed the fund's performance since inception as well as performance in the current year.
Based on its review, and giving particular weight to the nature and quality of the resources dedicated by the Investment Advisers to maintain and improve relative performance and factoring in the unprecedented market events in recent years, the Board concluded that the nature, extent, and quality of investment management and support services and of shareholder and administrative services provided to the fund will benefit the fund's shareholders, particularly in light of the Board's view that the fund's shareholders benefit from investing in a fund that is part of a large family of funds offering a variety of investment disciplines and services.
Competitiveness of Management Fee and Total Fund Expenses. The Board considered the fund's management fee and total expenses compared to "mapped groups" of competitive funds and classes. Fidelity creates "mapped groups" by combining similar Lipper investment objective categories that have comparable management fee characteristics. Combining Lipper investment objective categories aids the Board's management fee and total expense comparisons by broadening the competitive group used for comparison and by reducing the number of universes to which various Fidelity funds are compared.
Annual Report
Management Fee. The Board considered two proprietary management fee comparisons for the 12-month periods shown in the chart below. The group of Lipper funds used by the Board for management fee comparisons is referred to below as the "Total Mapped Group." The Total Mapped Group comparison focuses on a fund's standing relative to the total universe of comparable funds available to investors, in terms of gross management fees before expense reimbursements or caps. "TMG %" represents the percentage of funds in the Total Mapped Group that had management fees that were lower than the fund's. For example, a TMG % of 17% means that 83% of the funds in the Total Mapped Group had higher management fees than the fund. The "Asset-Size Peer Group" (ASPG) comparison focuses on a fund's standing relative to non-Fidelity funds similar in size to the fund within the Total Mapped Group. The ASPG represents at least 15% of the funds in the Total Mapped Group with comparable asset size and management fee characteristics, subject to a minimum of 50 funds (or all funds in the Total Mapped Group if fewer than 50). Additional information, such as the ASPG quartile in which the fund's management fee ranked, is also included in the chart and considered by the Board.
Fidelity Leveraged Company Stock Fund

The Board noted that the fund's management fee ranked below the median of its Total Mapped Group and below the median of its ASPG for 2009.
Annual Report
Board Approval of Investment Advisory Contracts and
Management Fees - continued
Based on its review, the Board concluded that the fund's management fee is fair and reasonable in light of the services that the fund receives and the other factors considered.
Total Expenses. In its review of each class's total expenses, the Board considered the fund's management fee as well as other fund or class expenses, as applicable, such as transfer agent fees, pricing and bookkeeping fees, and custodial, legal, and audit fees. The Board also noted the effects of any waivers and reimbursements on fees and expenses. As part of its review, the Board also considered current and historical total expenses of each class of the fund compared to competitive fund median expenses. Each class of the fund is compared to those funds and classes in the Total Mapped Group (used by the Board for management fee comparisons) that have a similar sales load structure.
The Board noted that the total expenses of each class ranked below its competitive median for 2009.
Fees Charged to Other Fidelity Clients. The Board also considered Fidelity fee structures and other information with respect to clients of FMR and its affiliates, such as other mutual funds advised or subadvised by FMR or its affiliates, pension plan clients, and other institutional clients. In March 2010, the Board created an ad hoc joint committee with the board of other Fidelity funds (the Committee) to review and compare Fidelity's institutional investment advisory business with its business of providing services to the Fidelity funds, including the differences in services provided, fees charged, and costs incurred, as well as competition in their respective marketplaces.
Based on its review of total expenses and fees charged to other Fidelity clients, the Board concluded that the total expenses of each class of the fund were reasonable in light of the services that the fund and its shareholders receive and the other factors considered, including the findings of the Committee.
Costs of the Services and Profitability. The Board considered the revenues earned and the expenses incurred by Fidelity in conducting the business of developing, marketing, distributing, managing, administering and servicing the fund and its shareholders. The Board also considered the level of Fidelity's profits in respect of all the Fidelity funds.
On an annual basis, FMR presents to the Board Fidelity's profitability for the fund. Fidelity calculates the profitability for each fund, as well as aggregate profitability for groups of Fidelity funds and all Fidelity funds, using a series of detailed revenue and cost allocation methodologies which originate with the audited books and records of Fidelity. The Audit Committee of the Board reviews any significant changes from the prior year's methodologies.
Annual Report
PricewaterhouseCoopers LLP (PwC), independent registered public accounting firm and auditor to Fidelity and certain Fidelity funds, has been engaged annually by the Board as part of the Board's assessment of Fidelity's profitability analysis. PwC's engagement includes the review and assessment of Fidelity's methodologies used in determining the revenues and expenses attributable to Fidelity's mutual fund business, and completion of agreed-upon procedures surrounding the mathematical accuracy of fund profitability and its conformity to allocation methodologies. After considering PwC's reports issued under the engagement and information provided by Fidelity, the Board believes that while other allocation methods may also be reasonable, Fidelity's profitability methodologies are reasonable in all material respects.
The Board has also reviewed Fidelity's non-fund businesses and fall-out benefits related to the mutual fund business as well as cases where Fidelity's affiliates may benefit from or be related to the fund's business.
The Board considered the costs of the services provided by and the profits realized by Fidelity in connection with the operation of the fund and were satisfied that the profitability was not excessive in the circumstances.
Economies of Scale. The Board considered whether there have been economies of scale in respect of the management of the Fidelity funds, whether the Fidelity funds (including the fund) have appropriately benefited from any such economies of scale, and whether there is potential for realization of any further economies of scale. The Board considered the extent to which the fund will benefit from economies of scale through increased services to the fund, through waivers or reimbursements, or through fee or expense reductions.
In February 2009, the Board and the board of other Fidelity funds created an ad hoc committee (the Economies of Scale Committee) to analyze whether FMR attains economies of scale in respect of the management and servicing of the Fidelity funds, whether the Fidelity funds have appropriately benefited from such economies of scale, and whether there is potential for realization of any further economies of scale.
The Board recognized that the fund's management contract incorporates a "group fee" structure, which provides for lower group fee rates as total fund assets under FMR's management increase, and for higher group fee rates as total fund assets under FMR's management decrease. FMR calculates the group fee rates based on a tiered asset "breakpoint" schedule that varies based on asset class. The Board considered that the group fee is designed to deliver the benefits of economies of scale to fund shareholders when total Fidelity fund assets increase, even if assets of any particular fund are unchanged or have declined, because some portion of Fidelity's costs are attributable to services provided to all Fidelity funds, and all funds benefit if those costs can be allocated among more assets. The Board concluded that, given the group fee structure, fund shareholders will benefit from lower management fees as assets under FMR's management increase at the fund complex level, regardless of whether Fidelity achieves any such economies of scale.
Annual Report
Board Approval of Investment Advisory Contracts and
Management Fees - continued
The Board concluded, considering the findings of the Economies of Scale Committee, that any potential economies of scale are being appropriately shared between fund shareholders and Fidelity.
Additional Information Requested by the Board. In order to develop fully the factual basis for consideration of the Fidelity funds' Advisory Contracts, the Board requested and received additional information on certain topics, including (i) fund performance trends, actions to be taken by FMR to improve certain funds' overall performance, and Fidelity's long-term strategies for certain funds; (ii) portfolio manager changes that have occurred during the past year and length of portfolio manager tenure for different categories of funds over time; (iii) Fidelity's compensation structure for portfolio managers, research analysts, and other key personnel, the rationale for the compensation structure, and how the compensation structure provides appropriate performance incentives; (iv) the amount of the investment that each portfolio manager has made in the Fidelity fund(s) that he or she manages; (v) management and other fees paid by FMR to affiliated sub-advisers on behalf of the Fidelity funds; (vi) Fidelity's fee structures and rationale for recommending different fees among different categories of funds; (vii) Fidelity's rationale for recommending which funds should have a performance adjustment component as part of their management fees; (viii) the rationale for any differences between fund fee structures and fee structures in place for other Fidelity clients; and (ix) explanations regarding the relative total expenses borne by certain funds and classes, total expense competitive trends, and actions that might be taken by FMR to reduce total expenses for certain funds and classes.
Based on its evaluation of all of the conclusions noted above, and after considering all factors it believed relevant, the Board ultimately concluded that the advisory fee structures are fair and reasonable, and that the fund's Advisory Contracts should be renewed.
Annual Report
Managing Your Investments
Fidelity offers several ways to conveniently manage your personal investments via your telephone or PC. You can access your account information, conduct trades and research your investments 24 hours a day.
By Phone
Fidelity Automated Service Telephone provides a single toll-free number to access account balances, positions, quotes and trading. It's easy to navigate the service, and on your first call, the system will help you create a personal identification number (PIN) for security.
(phone_graphic)
Fidelity Automated
Service Telephone (FAST®)
1-800-544-5555
Press
 For mutual fund and brokerage trading.
 For quotes.*
 For account balances and holdings.
 To review orders and mutual
fund activity.
 To change your PIN.

 To speak to a Fidelity representative.
By PC
Fidelity's web site on the Internet provides a wide range of information, including daily financial news, fund performance, interactive planning tools and news about Fidelity products and services.
(computer_graphic)
Fidelity's Web Site
www.fidelity.com
* When you call the quotes line, please remember that a fund's yield and return will vary and, except for money market funds, share price will also vary. This means that you may have a gain or loss when you sell your shares. There is no assurance that money market funds will be able to maintain a stable $1 share price; an investment in a money market fund is not insured or guaranteed by the U.S. government. Total returns are historical and include changes in share price, reinvestment of dividends and capital gains, and the effects of any sales charges.
Annual Report
To Write Fidelity
We'll give your correspondence immediate attention and send you written confirmation upon completion of your request.
(letter_graphic)
Making Changes
To Your Account
(such as changing name, address, bank, etc.)
Fidelity Investments
P.O. Box 770001
Cincinnati, OH 45277-0002
(letter_graphic)
For Non-Retirement
Accounts
Buying shares
Fidelity Investments
P.O. Box 770001
Cincinnati, OH 45277-0003
Overnight Express
Fidelity Investments
Attn: Distribution Services
100 Crosby Parkway - KC1H
Covington, KY 41015
Selling shares
Fidelity Investments
P.O. Box 770001
Cincinnati, OH 45277-0035
Overnight Express
Fidelity Investments
Attn: Distribution Services
100 Crosby Parkway - KC1H
Covington, KY 41015
General Correspondence
Fidelity Investments
P.O. Box 500
Merrimack, NH 03054-0500
(letter_graphic)
For Retirement
Accounts
Buying shares
Fidelity Investments
P.O. Box 770001
Cincinnati, OH 45277-0003
Selling shares
Fidelity Investments
P.O. Box 770001
Cincinnati, OH 45277-0035
Overnight Express
Fidelity Investments
Attn: Distribution Services
100 Crosby Parkway - KC1H
Covington, KY 41015
General Correspondence
Fidelity Investments
P.O. Box 500
Merrimack, NH 03054-0500
Annual Report
To Visit Fidelity
For directions and hours,
please call 1-800-544-9797.
Arizona
7001 West Ray Road
Chandler, AZ
15445 N. Scottsdale Road
Scottsdale, AZ
17550 North 75th Avenue
Glendale, AZ
5330 E. Broadway Blvd
Tucson, AZ
California
815 East Birch Street
Brea, CA
1411 Chapin Avenue
Burlingame, CA
851 East Hamilton Avenue
Campbell, CA
601 Larkspur Landing Circle
Larkspur, CA
2000 Avenue of the Stars
Los Angeles, CA
27101 Puerta Real
Mission Viejo, CA
73575 El Paseo
Palm Desert, CA
251 University Avenue
Palo Alto, CA
123 South Lake Avenue
Pasadena, CA
16656 Bernardo Ctr. Drive
Rancho Bernardo, CA
1220 Roseville Parkway
Roseville, CA
1740 Arden Way
Sacramento, CA
7676 Hazard Center Drive
San Diego, CA
11943 El Camino Real
San Diego, CA
8 Montgomery Street
San Francisco, CA
3793 State Street
Santa Barbara, CA
1200 Wilshire Boulevard
Santa Monica, CA
398 West El Camino Real
Sunnyvale, CA
111 South Westlake Blvd
Thousand Oaks, CA
21701 Hawthorne Boulevard
Torrance, CA
2001 North Main Street
Walnut Creek, CA
6326 Canoga Avenue
Woodland Hills, CA
2211 Michelson Drive
Irvine, CA
Colorado
281 East Flatiron Circle
Broomfield, CO
1625 Broadway
Denver, CO
9185 Westview Road
Lone Tree, CO
Connecticut
48 West Putnam Avenue
Greenwich, CT
265 Church Street
New Haven, CT
300 Atlantic Street
Stamford, CT
29 South Main Street
West Hartford, CT
1261 Post Road
Fairfield, CT
Delaware
400 Delaware Avenue
Wilmington, DE
Florida
175 East Altamonte Drive
Altamonte Springs, FL
1400 Glades Road
Boca Raton, FL
121 Alhambra Plaza
Coral Gables, FL
2948 N. Federal Highway
Ft. Lauderdale, FL
4671 Town Center Parkway
Jacksonville, FL
8880 Tamiami Trail, North
Naples, FL
230 Royal Palm Way
Palm Beach, FL
3501 PGA Boulevard
Palm Beach Gardens, FL
3550 Tamiami Trail, South
Sarasota, FL
1502 N. Westshore Blvd.
Tampa, FL
2465 State Road 7
Wellington, FL
Georgia
3242 Peachtree Road
Atlanta, GA
1000 Abernathy Road
Atlanta, GA
Illinois
One North LaSalle Street
Chicago, IL
401 North Michigan Avenue
Chicago, IL
One Skokie Valley Road
Highland Park, IL
1415 West 22nd Street
Oak Brook, IL
15105 S LaGrange Road
Orland Park, IL
1572 East Golf Road
Schaumburg, IL
1823 Freedom Drive
Naperville, IL
Indiana
8480 Keystone Crossing
Indianapolis, IN
Kansas
5400 College Boulevard
Overland Park, KS
Maine
Three Canal Plaza
Portland, ME
Maryland
7315 Wisconsin Avenue
Bethesda, MD
610 York Road
Towson, MD
Massachusetts
801 Boylston Street
Boston, MA
155 Congress Street
Boston, MA
300 Granite Street
Braintree, MA
44 Mall Road
Burlington, MA
238 Main Street
Cambridge, MA
200 Endicott Street
Danvers, MA
Annual Report
405 Cochituate Road
Framingham, MA
551 Boston Turnpike
Shrewsbury, MA
Michigan
500 E. Eisenhower Pkwy.
Ann Arbor, MI
280 N. Old Woodward Ave.
Birmingham, MI
30200 Northwestern Hwy.
Farmington Hills, MI
43420 Grand River Avenue
Novi, MI
3480 28th Street
Grand Rapids, MI
2425 S. Linden Road STE E
Flint, MI
Minnesota
7740 France Avenue South
Edina, MN
8342 3rd Street North
Oakdale, MN
Missouri
1524 South Lindbergh Blvd.
St. Louis, MO
Nevada
2225 Village Walk Drive
Henderson, NV
New Jersey
501 Route 73 South
Marlton, NJ
150 Essex Street
Millburn, NJ
35 Morris Street
Morristown, NJ
396 Route 17, North
Paramus, NJ
3518 Route 1 North
Princeton, NJ
530 Broad Street
Shrewsbury, NJ
New Mexico
2261 Q Street NE
Albuquerque, NM
New York
1130 Franklin Avenue
Garden City, NY
37 West Jericho Turnpike
Huntington Station, NY
1271 Avenue of the Americas
New York, NY
980 Madison Avenue
New York, NY
61 Broadway
New York, NY
350 Park Avenue
New York, NY
200 Fifth Avenue
New York, NY
733 Third Avenue
New York, NY
2070 Broadway
New York, NY
1075 Northern Blvd.
Roslyn, NY
799 Central Park Avenue
Scarsdale, NY
3349 Monroe Avenue
Rochester, NY
North Carolina
4611 Sharon Road
Charlotte, NC
7011 Fayetteville Road
Durham, NC
Ohio
3805 Edwards Road
Cincinnati, OH
1324 Polaris Parkway
Columbus, OH
1800 Crocker Road
Westlake, OH
28699 Chagrin Boulevard
Woodmere Village, OH
Oregon
7493 SW Bridgeport Road
Tigard, OR
Pennsylvania
600 West DeKalb Pike
King of Prussia, PA
1735 Market Street
Philadelphia, PA
12001 Perry Highway
Wexford, PA
Rhode Island
10 Memorial Boulevard
Providence, RI
Tennessee
3018 Peoples Street
Johnson City, TN
7628 West Farmington Blvd.
Germantown, TN
2035 Mallory Lane
Franklin, TN
Texas
10000 Research Boulevard
Austin, TX
4001 Northwest Parkway
Dallas, TX
12532 Memorial Drive
Houston, TX
2701 Drexel Drive
Houston, TX
6560 Fannin Street
Houston, TX
1701 Lake Robbins Drive
The Woodlands, TX
6500 N. MacArthur Blvd.
Irving, TX
6005 West Park Boulevard
Plano, TX
1576 East Southlake Blvd.
Southlake, TX
15600 Southwest Freeway
Sugar Land, TX
139 N. Loop 1604 East
San Antonio, TX
Utah
279 West South Temple
Salt Lake City, UT
Virginia
1861 International Drive
McLean, VA
11957 Democracy Drive
Reston, VA
Washington
10500 NE 8th Street
Bellevue, WA
1518 6th Avenue
Seattle, WA
304 Strander Blvd
Tukwila, WA
Washington, DC
1900 K Street, N.W.
Washington, DC
Wisconsin
16020 West Bluemound Road
Brookfield, WI
Fidelity Brokerage Services, Inc., 100 Summer St., Boston, MA 02110 Member NYSE/SIPC
Annual Report
Investment Adviser
Fidelity Management & Research Company
Boston, MA
Investment Sub-Adviser
FMR Co., Inc.
Fidelity Research & Analysis Company
Fidelity Management & Research
(U.K.) Inc.
Fidelity Management & Research
(Hong Kong) Limited
Fidelity Management & Research
(Japan) Inc.
General Distributor
Fidelity Distributors Corporation
Boston, MA
Transfer and Service Agents
Fidelity Investments Institutional
Operations Company, Inc.
Boston, MA
Fidelity Service Company, Inc.
Boston, MA
Custodian
JPMorgan Chase Bank
New York, NY
The Fidelity Telephone Connection
Mutual Fund 24-Hour Service
Exchanges/Redemptions
and Account Assistance 1-800-544-6666
Product Information 1-800-544-6666
Retirement Accounts 1-800-544-4774
(8 a.m. - 9 p.m.)
TDD Service 1-800-544-0118
for the deaf and hearing impaired
(9 a.m. - 9 p.m. Eastern time)
Fidelity Automated Service
Telephone (FAST®) 1-800-544-5555
Automated line for quickest service
LSF-UANN-0910
1.789248.107

Fidelity®
Leveraged Company Stock
Fund -
Class K
Annual Report
July 31, 2010
(2_fidelity_logos) (Registered_Trademark)
Contents
Chairman's Message | <Click Here> | The Chairman's message to shareholders. |
Performance | <Click Here> | How the fund has done over time. |
Management's Discussion of Fund Performance | <Click Here> | The Portfolio Manager's review of fund
performance and strategy. |
Shareholder Expense Example | <Click Here> | An example of shareholder expenses. |
Investment Changes | <Click Here> | A summary of major shifts in the fund's investments over the last six months. |
Investments | <Click Here> | A complete list of the fund's investments with their market values. |
Financial Statements | <Click Here> | Statements of assets and liabilities, operations, and changes in net assets,
as well as financial highlights. |
Notes | <Click Here> | Notes to the financial statements. |
Report of Independent Registered Public Accounting Firm | <Click Here> | |
Trustees and Officers | <Click Here> | |
Distributions | <Click Here> | |
Board Approval of Investment Advisory Contracts and Management Fees | <Click Here> | |
To view a fund's proxy voting guidelines and proxy voting record for the 12-month period ended June 30, visit http://www.fidelity.com/proxyvotingresults or visit the Securities and Exchange Commission's (SEC) web site at http://www.sec.gov. You may also call 1-800-835-5092 to request a free copy of the proxy voting guidelines.
Standard & Poor's, S&P and S&P 500 are registered service marks of The McGraw-Hill Companies, Inc. and have been licensed for use by Fidelity Distributors Corporation.
Other third party marks appearing herein are the property of their respective owners.
All other marks appearing herein are registered or unregistered trademarks or service marks of FMR LLC or an affiliated company.
Annual Report
This report and the financial statements contained herein are submitted for the general information of the shareholders of the fund. This report is not authorized for distribution to prospective investors in the fund unless preceded or accompanied by an effective prospectus.
A fund files its complete schedule of portfolio holdings with the SEC for the first and third quarters of each fiscal year on Form N-Q. Forms N-Q are available on the SEC's web site at http://www.sec.gov. A fund's Forms N-Q may be reviewed and copied at the SEC's Public Reference Room in Washington, DC. Information regarding the operation of the SEC's Public Reference Room may be obtained by calling 1-800-SEC-0330. For a complete list of a fund's portfolio holdings, view the most recent holdings listing, semiannual report, or annual report on Fidelity's web site at http://www.fidelity.com or http://www.advisor.fidelity.com, as applicable.
NOT FDIC INSURED • MAY LOSE VALUE • NO BANK GUARANTEE
Neither the fund nor Fidelity Distributors Corporation is a bank.
Annual Report
(photo_of_Edward_C_Johnson_3d)
Dear Shareholder:
A yearlong uptrend in global equity markets reversed course in late April 2010 when investor sentiment turned bearish due in great measure to concern that Europe's debt crisis would expand and slow or derail economic recovery. However, a bounceback in July helped to recover some of the ground that was lost. Financial markets are always unpredictable, of course, but there also are several time-tested investment principles that can help put the odds in your favor.
One of the basic tenets is to invest for the long term. Over time, riding out the markets' inevitable ups and downs has proven much more effective than selling into panic or chasing the hottest trend. Even missing only a few of the markets' best days can significantly diminish investor returns. Patience also affords the benefits of compounding - of earning interest on additional income or reinvested dividends and capital gains. There can be tax advantages and cost benefits to consider as well. While staying the course doesn't eliminate risk, it can considerably lessen the effect of short-term declines.
You can further manage your investing risk through diversification. And today, more than ever, geographic diversification should be taken into account. Studies indicate that asset allocation is the single most important determinant of a portfolio's long-term success. The right mix of stocks, bonds and cash - aligned to your particular risk tolerance and investment objective - is very important. Age-appropriate rebalancing is also an essential aspect of asset allocation. For younger investors, an emphasis on equities - which historically have been the best-performing asset class over time - is encouraged. As investors near their specific goal, such as retirement or sending a child to college, consideration may be given to replacing volatile assets (e.g. common stocks) with more-stable fixed investments (bonds or savings plans).
A third principle - investing regularly - can help lower the average cost of your purchases. Investing a certain amount of money each month or quarter helps ensure you won't pay for all your shares at market highs. This strategy - known as dollar cost averaging - also reduces "emotion" from investing, helping shareholders avoid selling weak performers just prior to an upswing, or chasing a hot performer just before a correction.
We invite you to contact us via the Internet, through our Investor Centers or by phone. It is our privilege to provide you the information you need to make the investments that are right for you.
Sincerely,
(The chairman's signature appears here.)
Edward C. Johnson 3d
Annual Report
Average annual total return reflects the change in the value of an investment, assuming reinvestment of the class' distributions from dividend income and capital gains (the profits earned upon the sale of securities that have grown in value, if any) and assuming a constant rate of performance each year. The $10,000 table and the fund's returns do not reflect the deduction of taxes that a shareholder would pay on fund distributions or the redemption of fund shares. During periods of reimbursement by Fidelity, a fund's total return will be greater than it would be had the reimbursement not occurred. How a fund did yesterday is no guarantee of how it will do tomorrow.
Average Annual Total Returns
Periods ended July 31, 2010 | Past 1
year | Past 5
years | Life of
fundB |
Class K A | 21.09% | 1.61% | 12.24% |
A The initial offering of Class K shares took place on May 9, 2008. Returns prior to May 9, 2008 are those of Fidelity Leveraged Company Stock Fund, the original class of the fund.
B From December 19, 2000.
$10,000 Over Life of Fund
Let's say hypothetically that $10,000 was invested in Fidelity® Leveraged Company Stock Fund - Class K on December 19, 2000, when the fund started. The chart shows how the value of your investment would have changed, and also shows how the S&P 500® Index performed over the same period. The initial offering of Class K took place on May 9, 2008. See above for additional information regarding the performance of Class K.
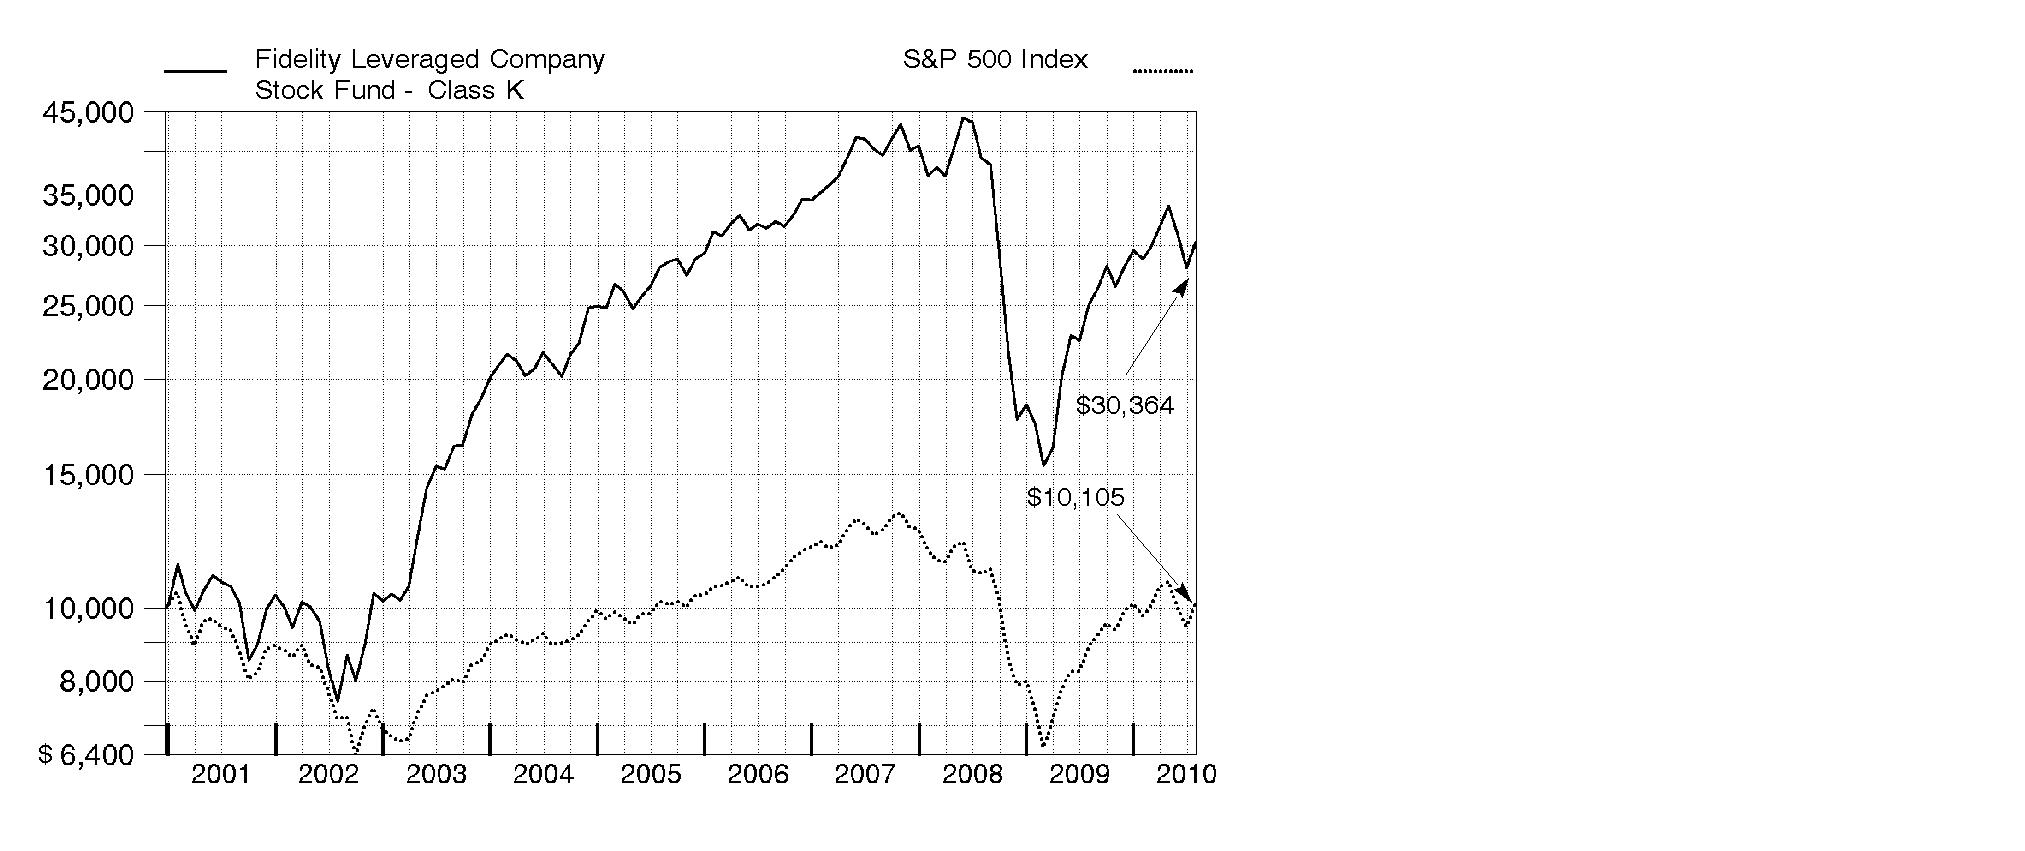
Annual Report
Market Recap: U.S. stock markets saw double-digit gains for the year ending July 31, 2010, despite the return of market volatility and risk aversion during the first half of 2010. An impressive bull run continued through 2009, bolstered by improvement in the economy and credit markets. Early in the new year, however, stocks fell sharply amid concerns about the global economic recovery, fueled by European debt woes and China's efforts to restrain inflation. After this brief dip, markets regained their upward momentum, as government stimulus and significant corporate cost cutting led to encouraging earnings reports, improved credit conditions and rising consumer confidence. Positive news continued through mid-April, when the Dow Jones Industrial AverageSM pushed above the 11,000 mark for the first time in 19 months. That milestone was short-lived, however, as heightened concern about the European debt crisis sparked an abrupt sell-off in May, leading to the first official correction since the rally began in March 2009. Although the market's malaise continued through June, stocks saw solid gains in July. For the year, the Dow rose 17.28%, while the S&P 500® Index was up 13.84%. Elsewhere, the technology-laden Nasdaq Composite® Index returned 14.99%. Small- and mid-cap stocks performed best, as measured by the 18.43% increase of the Russell 2000® Index and the 23.21% gain of the Russell Midcap® Index.
Comments from Thomas Soviero, Portfolio Manager of Fidelity® Leveraged Company Stock Fund: For the year, the fund's Class K shares returned 21.09%, easily outperforming the S&P 500® but trailing the 23.31% gain of the Credit Suisse Leveraged Equity Index. Relative to the S&P®, contributions came from strong stock selection in energy, materials, financials - particularly banks - and telecommunication services. Sector positioning also added value, as did my focus on stronger-performing smaller-cap stocks. In terms of individual positions, the fund benefited from not owning integrated oil firm and sizable index component Exxon Mobil, as well as from investments in building materials manufacturer Owens Corning, regional bank PNC Financial Services, Delta Air Lines, funeral services provider Service Corp International, banking firm KeyCorp, independent oil and gas company Forest Oil, and coal company Peabody Energy. Conversely, we had unfavorable security selection within utilities, technology and consumer staples. Detractors included global power producer AES, ON Semiconductor, drugstore retailer Rite Aid and building products manufacturer Masco. Not owning technology leader and index component Apple also hurt. Some of the stocks mentioned were not part of the S&P 500.
The views expressed above reflect those of the portfolio manager(s) only through the end of the period as stated on the cover of this report and do not necessarily represent the views of Fidelity or any other person in the Fidelity organization. Any such views are subject to change at any time based upon market or other conditions and Fidelity disclaims any responsibility to update such views. These views may not be relied on as investment advice and, because investment decisions for a Fidelity fund are based on numerous factors, may not be relied on as an indication of trading intent on behalf of any Fidelity fund.
Annual Report
Shareholder Expense Example
As a shareholder of the Fund, you incur two types of costs: (1) transaction costs, including redemption fees, and (2) ongoing costs, including management fees and other Fund expenses. This Example is intended to help you understand your ongoing costs (in dollars) of investing in the Fund and to compare these costs with the ongoing costs of investing in other mutual funds.
The Example is based on an investment of $1,000 invested at the beginning of the period and held for the entire period (February 1, 2010 to July 31, 2010).
Actual Expenses
The first line of the accompanying table for each class of the Fund provides information about actual account values and actual expenses. You may use the information in this line, together with the amount you invested, to estimate the expenses that you paid over the period. Simply divide your account value by $1,000.00 (for example, an $8,600 account value divided by $1,000.00 = 8.6), then multiply the result by the number in the first line for a class of the Fund under the heading entitled "Expenses Paid During Period" to estimate the expenses you paid on your account during this period. A small balance maintenance fee of $12.00 that is charged once a year may apply for certain accounts with a value of less than $2,000. This fee is not included in the table below. If it was, the estimate of expenses you paid during the period would be higher, and your ending account value lower, by this amount. In addition, the Fund, as a shareholder in the underlying Fidelity Central Funds, will indirectly bear its pro-rata share of the fees and expenses incurred by the underlying Fidelity Central Funds. These fees and expenses are not included in the Fund's annualized expense ratio used to calculate the expense estimate in the table below.
Hypothetical Example for Comparison Purposes
The second line of the accompanying table for each class of the Fund provides information about hypothetical account values and hypothetical expenses based on a Class' actual expense ratio and an assumed rate of return of 5% per year before expenses, which is not the Class' actual return. The hypothetical account values and expenses may not be used to estimate the actual ending account balance or expenses you paid for the period. You may use this information to compare the ongoing costs of investing in the Fund and other funds. To do so, compare this 5% hypothetical example with the 5% hypothetical examples that appear in the shareholder reports of the other funds. A small balance maintenance fee of $12.00 that is charged once a year may apply for certain accounts with a value of less than $2,000. This fee is not included in the table below. If it was, the estimate of expenses you paid during the period would be higher, and your ending account value lower, by this amount. In addition, the Fund, as a shareholder in the underlying Fidelity Central Funds, will indirectly bear its pro-rata share of the fees and expenses incurred by the underlying Fidelity Central Funds. These fees and expenses are not included in the Fund's annualized expense ratio used to calculate the expense estimate in the table below.
Annual Report
Please note that the expenses shown in the table are meant to highlight your ongoing costs only and do not reflect any transaction costs. Therefore, the second line of the table is useful in comparing ongoing costs only, and will not help you determine the relative total costs of owning different funds. In addition, if these transactional costs were included, your costs would have been higher.
| Annualized Expense Ratio | Beginning
Account Value
February 1, 2010 | Ending
Account Value
July 31, 2010 | Expenses Paid
During Period*
February 1, 2010 to July 31, 2010 |
Leveraged Company Stock | .87% | | | |
Actual | | $ 1,000.00 | $ 1,052.90 | $ 4.43 |
HypotheticalA | | $ 1,000.00 | $ 1,020.48 | $ 4.36 |
Class K | .69% | | | |
Actual | | $ 1,000.00 | $ 1,053.80 | $ 3.51 |
HypotheticalA | | $ 1,000.00 | $ 1,021.37 | $ 3.46 |
A 5% return per year before expenses
* Expenses are equal to each Class' annualized expense ratio, multiplied by the average account value over the period, multiplied by 181/365 (to reflect the one-half year period).
Annual Report
Investment Changes (Unaudited)
Top Ten Stocks as of July 31, 2010 |
| % of fund's
net assets | % of fund's net assets
6 months ago |
ON Semiconductor Corp. | 3.5 | 3.8 |
Service Corp. International | 3.4 | 3.2 |
El Paso Corp. | 2.9 | 2.6 |
AES Corp. | 2.6 | 3.1 |
Celanese Corp. Class A | 2.5 | 2.9 |
Tenet Healthcare Corp. | 2.3 | 2.8 |
KeyCorp | 2.3 | 2.0 |
Peabody Energy Corp. | 2.1 | 2.8 |
Owens Corning | 2.0 | 2.2 |
Bank of America Corp. | 1.8 | 2.0 |
| 25.4 | |
Top Five Market Sectors as of July 31, 2010 |
| % of fund's
net assets | % of fund's net assets
6 months ago |
Industrials | 18.8 | 17.4 |
Consumer Discretionary | 16.7 | 13.8 |
Financials | 12.6 | 12.7 |
Energy | 12.5 | 14.5 |
Materials | 11.3 | 10.5 |
Asset Allocation (% of fund's net assets) |
As of July 31, 2010 * | As of January 31, 2010 ** |
| Stocks 94.4% | | | Stocks 92.9% | |
| Bonds 2.4% | | | Bonds 2.9% | |
| Convertible
Securities 0.3% | | | Convertible
Securities 0.3% | |
| Other Investments 1.4% | | | Other Investments 2.0% | |
| Short-Term
Investments and
Net Other Assets 1.5% | | | Short-Term
Investments and
Net Other Assets 1.9% | |
* Foreign investments | 7.3% | | ** Foreign investments | 5.9% | |

Annual Report
Investments July 31, 2010
Showing Percentage of Net Assets
Common Stocks - 94.3% |
| Shares | | Value (000s) |
CONSUMER DISCRETIONARY - 15.4% |
Auto Components - 1.1% |
Exide Technologies (a) | 1,643,982 | | $ 9,897 |
Johnson Controls, Inc. | 548,300 | | 15,797 |
Tenneco, Inc. (a) | 97,700 | | 2,697 |
The Goodyear Tire & Rubber Co. (a) | 564,063 | | 6,019 |
TRW Automotive Holdings Corp. (a) | 430,300 | | 15,099 |
| | 49,509 |
Automobiles - 0.4% |
Daimler AG (United States) (a) | 209,400 | | 11,318 |
Toyota Motor Corp. sponsored ADR | 89,500 | | 6,286 |
| | 17,604 |
Diversified Consumer Services - 3.6% |
Carriage Services, Inc. (a) | 266,200 | | 1,246 |
Service Corp. International (f) | 17,656,093 | | 150,430 |
Stewart Enterprises, Inc. Class A | 1,515,242 | | 8,137 |
| | 159,813 |
Hotels, Restaurants & Leisure - 1.0% |
Bally Technologies, Inc. (a) | 198,560 | | 6,413 |
Biglari Holdings, Inc. (a) | 32,970 | | 9,578 |
Burger King Holdings, Inc. | 108,900 | | 1,882 |
Domino's Pizza, Inc. (a) | 726,595 | | 9,293 |
O'Charleys, Inc. (a) | 207,849 | | 1,449 |
Penn National Gaming, Inc. (a) | 537,836 | | 14,731 |
Wendy's/Arby's Group, Inc. | 546,800 | | 2,384 |
| | 45,730 |
Household Durables - 3.1% |
Harman International Industries, Inc. (a) | 1,263,506 | | 38,423 |
Lennar Corp. Class A | 983,400 | | 14,525 |
Newell Rubbermaid, Inc. | 3,304,500 | | 51,220 |
Stanley Black & Decker, Inc. | 531,917 | | 30,862 |
| | 135,030 |
Leisure Equipment & Products - 0.4% |
Callaway Golf Co. | 2,514,010 | | 16,970 |
Media - 2.8% |
Belo Corp. Series A (a) | 163,800 | | 991 |
Cablevision Systems Corp. - NY Group Class A | 541,324 | | 14,838 |
Cinemark Holdings, Inc. | 1,554,497 | | 22,680 |
Comcast Corp. Class A | 3,097,400 | | 60,306 |
Gray Television, Inc. (a)(f) | 2,845,889 | | 7,399 |
LIN TV Corp. Class A (a) | 818,437 | | 4,788 |
Common Stocks - continued |
| Shares | | Value (000s) |
CONSUMER DISCRETIONARY - continued |
Media - continued |
Madison Square Garden, Inc. Class A (a) | 135,331 | | $ 2,604 |
Nexstar Broadcasting Group, Inc. Class A (a)(e) | 1,130,500 | | 6,105 |
The McClatchy Co. Class A (a)(e) | 215,505 | | 754 |
| | 120,465 |
Specialty Retail - 1.2% |
Asbury Automotive Group, Inc. (a) | 385,122 | | 5,184 |
Charming Shoppes, Inc. (a) | 3,932,700 | | 17,618 |
GameStop Corp. Class A (a) | 656,695 | | 13,167 |
Gap, Inc. | 204,000 | | 3,694 |
Sally Beauty Holdings, Inc. (a) | 300,000 | | 2,838 |
The Pep Boys - Manny, Moe & Jack | 980,271 | | 9,411 |
| | 51,912 |
Textiles, Apparel & Luxury Goods - 1.8% |
Coach, Inc. | 314,020 | | 11,609 |
Deckers Outdoor Corp. (a) | 491,745 | | 25,025 |
Hanesbrands, Inc. (a) | 501,700 | | 12,568 |
Phillips-Van Heusen Corp. | 548,718 | | 28,473 |
| | 77,675 |
TOTAL CONSUMER DISCRETIONARY | | 674,708 |
CONSUMER STAPLES - 2.3% |
Food & Staples Retailing - 1.3% |
Rite Aid Corp. (a) | 16,497,982 | | 16,317 |
Safeway, Inc. | 464,300 | | 9,537 |
SUPERVALU, Inc. | 592,800 | | 6,687 |
Whole Foods Market, Inc. (a) | 713,867 | | 27,106 |
| | 59,647 |
Food Products - 0.8% |
Darling International, Inc. (a) | 2,498,930 | | 20,391 |
Dean Foods Co. (a) | 569,900 | | 6,531 |
Smithfield Foods, Inc. (a) | 559,606 | | 7,974 |
| | 34,896 |
Personal Products - 0.2% |
Revlon, Inc. (a) | 553,261 | | 6,938 |
TOTAL CONSUMER STAPLES | | 101,481 |
Common Stocks - continued |
| Shares | | Value (000s) |
ENERGY - 12.2% |
Energy Equipment & Services - 2.5% |
Baker Hughes, Inc. | 218,000 | | $ 10,523 |
Ensco International Ltd. ADR | 110,000 | | 4,599 |
Exterran Holdings, Inc. (a) | 1,302,108 | | 34,727 |
Hercules Offshore, Inc. (a) | 1,493,431 | | 3,793 |
Noble Corp. | 524,700 | | 17,053 |
Oil States International, Inc. (a) | 270,700 | | 12,436 |
Parker Drilling Co. (a) | 1,200,000 | | 5,016 |
Pride International, Inc. (a) | 346,100 | | 8,234 |
Rowan Companies, Inc. (a) | 321,100 | | 8,111 |
Schlumberger Ltd. | 109,400 | | 6,527 |
Seahawk Drilling, Inc. (a)(e) | 23,073 | | 229 |
| | 111,248 |
Oil, Gas & Consumable Fuels - 9.7% |
Alpha Natural Resources, Inc. (a) | 361,838 | | 13,869 |
Arch Coal, Inc. | 688,255 | | 16,305 |
Atlas Pipeline Partners, LP (a) | 163,890 | | 2,957 |
ConocoPhillips | 231,500 | | 12,783 |
CONSOL Energy, Inc. | 327,200 | | 12,263 |
El Paso Corp. | 10,450,276 | | 128,747 |
Forest Oil Corp. (a) | 1,730,645 | | 49,479 |
Frontier Oil Corp. | 1,972,600 | | 24,243 |
International Coal Group, Inc. (a) | 1,365,400 | | 6,144 |
Nexen, Inc. | 188,000 | | 3,905 |
Overseas Shipholding Group, Inc. (e) | 979,192 | | 38,414 |
Paladin Energy Ltd. (a) | 2,042,400 | | 7,115 |
Peabody Energy Corp. | 2,068,114 | | 93,375 |
Plains Exploration & Production Co. (a) | 360,660 | | 8,133 |
SandRidge Energy, Inc. (a) | 1,095,000 | | 6,461 |
| | 424,193 |
TOTAL ENERGY | | 535,441 |
FINANCIALS - 12.3% |
Capital Markets - 0.3% |
Morgan Stanley | 426,900 | | 11,522 |
Commercial Banks - 8.7% |
CIT Group, Inc. (a) | 72,485 | | 2,636 |
Huntington Bancshares, Inc. | 11,032,080 | | 66,854 |
KeyCorp | 11,866,668 | | 100,392 |
PNC Financial Services Group, Inc. | 1,339,226 | | 79,537 |
Common Stocks - continued |
| Shares | | Value (000s) |
FINANCIALS - continued |
Commercial Banks - continued |
Regions Financial Corp. | 2,011,695 | | $ 14,746 |
SunTrust Banks, Inc. | 2,549,800 | | 66,167 |
Wells Fargo & Co. | 1,871,088 | | 51,885 |
| | 382,217 |
Diversified Financial Services - 2.0% |
Bank of America Corp. | 5,742,000 | | 80,618 |
Citigroup, Inc. (a) | 1,638,400 | | 6,717 |
| | 87,335 |
Insurance - 0.6% |
Assured Guaranty Ltd. | 981,795 | | 15,414 |
Lincoln National Corp. | 435,700 | | 11,346 |
| | 26,760 |
Real Estate Investment Trusts - 0.5% |
FelCor Lodging Trust, Inc. (a) | 1,085,852 | | 6,439 |
Host Hotels & Resorts, Inc. | 1,016,122 | | 14,571 |
| | 21,010 |
Thrifts & Mortgage Finance - 0.2% |
First Niagara Financial Group, Inc. | 851,444 | | 11,418 |
TOTAL FINANCIALS | | 540,262 |
HEALTH CARE - 5.9% |
Biotechnology - 0.0% |
Lexicon Pharmaceuticals, Inc. (a) | 392,187 | | 592 |
Health Care Equipment & Supplies - 1.1% |
Alere, Inc. (a) | 518,708 | | 14,591 |
Hospira, Inc. (a) | 631,458 | | 32,899 |
| | 47,490 |
Health Care Providers & Services - 4.2% |
Community Health Systems, Inc. (a) | 611,876 | | 19,843 |
DaVita, Inc. (a) | 503,747 | | 28,875 |
Henry Schein, Inc. (a) | 54,400 | | 2,855 |
Laboratory Corp. of America Holdings (a) | 54,600 | | 3,985 |
RehabCare Group, Inc. (a) | 230,000 | | 4,874 |
Rural/Metro Corp. (a)(e) | 834,200 | | 7,550 |
Sun Healthcare Group, Inc. (a) | 1,642,522 | | 13,600 |
Tenet Healthcare Corp. (a) | 22,373,365 | | 102,917 |
| | 184,499 |
Common Stocks - continued |
| Shares | | Value (000s) |
HEALTH CARE - continued |
Health Care Technology - 0.5% |
Cerner Corp. (a) | 276,209 | | $ 21,392 |
Pharmaceuticals - 0.1% |
Allergan, Inc. | 109,700 | | 6,698 |
TOTAL HEALTH CARE | | 260,671 |
INDUSTRIALS - 18.2% |
Aerospace & Defense - 0.5% |
American Science & Engineering, Inc. | 85,370 | | 6,760 |
Teledyne Technologies, Inc. (a) | 340,694 | | 13,979 |
| | 20,739 |
Air Freight & Logistics - 0.0% |
Park-Ohio Holdings Corp. (a) | 78,022 | | 1,057 |
Airlines - 2.7% |
AirTran Holdings, Inc. (a) | 1,779,700 | | 8,578 |
AMR Corp. (a) | 1,309,130 | | 9,269 |
Delta Air Lines, Inc. (a) | 5,963,193 | | 70,843 |
UAL Corp. (a) | 280,400 | | 6,657 |
US Airways Group, Inc. (a) | 2,034,580 | | 22,075 |
| | 117,422 |
Building Products - 3.7% |
Armstrong World Industries, Inc. (a)(e) | 1,217,530 | | 44,513 |
Masco Corp. | 2,624,679 | | 26,982 |
Owens Corning (a) | 2,828,708 | | 89,048 |
Owens Corning warrants 10/31/13 (a) | 406,600 | | 1,606 |
| | 162,149 |
Commercial Services & Supplies - 3.7% |
ACCO Brands Corp. (a) | 710,554 | | 4,206 |
Cenveo, Inc. (a)(f) | 3,858,300 | | 23,767 |
Deluxe Corp. | 1,749,127 | | 35,997 |
R.R. Donnelley & Sons Co. | 450,900 | | 7,607 |
Republic Services, Inc. | 1,928,875 | | 61,454 |
The Brink's Co. | 464,740 | | 10,178 |
Waste Management, Inc. | 599,400 | | 20,350 |
| | 163,559 |
Construction & Engineering - 0.4% |
Fluor Corp. | 297,100 | | 14,347 |
Great Lakes Dredge & Dock Corp. | 429,400 | | 2,405 |
| | 16,752 |
Common Stocks - continued |
| Shares | | Value (000s) |
INDUSTRIALS - continued |
Electrical Equipment - 1.9% |
Baldor Electric Co. | 404,900 | | $ 15,475 |
Belden, Inc. | 1,270,366 | | 30,349 |
EnerSys (a) | 198,902 | | 4,817 |
General Cable Corp. (a) | 441,500 | | 11,717 |
Harbin Electric, Inc. (a)(e) | 548,369 | | 10,074 |
Polypore International, Inc. (a) | 548,400 | | 13,469 |
| | 85,901 |
Industrial Conglomerates - 0.9% |
Carlisle Companies, Inc. | 109,910 | | 3,702 |
General Electric Co. | 1,103,883 | | 17,795 |
Textron, Inc. | 550,200 | | 11,422 |
Tyco International Ltd. | 187,433 | | 7,175 |
| | 40,094 |
Machinery - 2.6% |
Accuride Corp. (a) | 57,374 | | 68 |
Accuride Corp. warrants 2/26/12 (a) | 778,347 | | 125 |
Badger Meter, Inc. | 228,561 | | 8,950 |
Ingersoll-Rand Co. Ltd. | 1,063,600 | | 39,842 |
Middleby Corp. (a) | 445,361 | | 25,613 |
Mueller Water Products, Inc. Class A | 1,202,599 | | 4,570 |
Navistar International Corp. (a) | 169,800 | | 8,780 |
Terex Corp. (a) | 129,300 | | 2,552 |
Thermadyne Holdings Corp. (a) | 64,900 | | 886 |
Timken Co. | 464,948 | | 15,632 |
WABCO Holdings, Inc. (a) | 211,533 | | 8,182 |
| | 115,200 |
Marine - 0.5% |
Diana Shipping, Inc. (a) | 277,900 | | 3,674 |
Genco Shipping & Trading Ltd. (a)(e) | 380,323 | | 6,351 |
Navios Maritime Holdings, Inc. | 2,162,794 | | 12,133 |
OceanFreight, Inc. (a) | 246,866 | | 299 |
| | 22,457 |
Road & Rail - 1.1% |
Avis Budget Group, Inc. (a) | 830,314 | | 10,246 |
CSX Corp. | 109,400 | | 5,768 |
Hertz Global Holdings, Inc. (a)(e) | 2,598,600 | | 30,508 |
| | 46,522 |
Common Stocks - continued |
| Shares | | Value (000s) |
INDUSTRIALS - continued |
Trading Companies & Distributors - 0.2% |
H&E Equipment Services, Inc. (a) | 12,900 | | $ 112 |
Houston Wire & Cable Co. (e) | 656,176 | | 7,920 |
| | 8,032 |
TOTAL INDUSTRIALS | | 799,884 |
INFORMATION TECHNOLOGY - 9.1% |
Communications Equipment - 0.2% |
CommScope, Inc. (a) | 459,254 | | 9,341 |
Electronic Equipment & Components - 2.4% |
Avnet, Inc. (a) | 328,000 | | 8,249 |
DDi Corp. | 295,899 | | 2,681 |
Flextronics International Ltd. (a) | 12,456,563 | | 77,480 |
TTM Technologies, Inc. (a) | 1,402,619 | | 14,377 |
Viasystems Group, Inc. (a) | 290,108 | | 4,473 |
| | 107,260 |
Internet Software & Services - 0.3% |
NetEase.com, Inc. sponsored ADR (a) | 191,500 | | 7,334 |
VeriSign, Inc. (a) | 194,300 | | 5,470 |
| | 12,804 |
IT Services - 1.0% |
Alliance Data Systems Corp. (a)(e) | 496,639 | | 28,547 |
CACI International, Inc. Class A (a) | 248,000 | | 11,661 |
Cognizant Technology Solutions Corp. Class A (a) | 56,200 | | 3,066 |
| | 43,274 |
Semiconductors & Semiconductor Equipment - 5.2% |
Amkor Technology, Inc. (a)(e) | 5,242,218 | | 30,248 |
Cypress Semiconductor Corp. (a) | 651,200 | | 6,903 |
Fairchild Semiconductor International, Inc. (a) | 548,500 | | 4,980 |
Intel Corp. | 693,100 | | 14,278 |
Micron Technology, Inc. (a) | 1,737,600 | | 12,650 |
ON Semiconductor Corp. (a)(f) | 23,079,802 | | 155,780 |
SunPower Corp. Class B (a) | 178,606 | | 2,061 |
| | 226,900 |
Software - 0.0% |
Nuance Communications, Inc. (a) | 163,600 | | 2,701 |
TOTAL INFORMATION TECHNOLOGY | | 402,280 |
Common Stocks - continued |
| Shares | | Value (000s) |
MATERIALS - 11.3% |
Chemicals - 8.8% |
Albemarle Corp. | 1,163,406 | | $ 50,748 |
Arch Chemicals, Inc. | 344,342 | | 11,801 |
Celanese Corp. Class A | 3,894,835 | | 109,406 |
Dow Chemical Co. | 1,284,894 | | 35,116 |
Ferro Corp. (a) | 722,400 | | 7,708 |
FMC Corp. | 178,600 | | 11,161 |
Georgia Gulf Corp. (a) | 173,861 | | 2,669 |
H.B. Fuller Co. | 1,582,241 | | 32,341 |
LyondellBasell Industries NV: | | | |
Class A (a) | 1,491,164 | | 26,841 |
Class B (a) | 1,319,987 | | 23,760 |
Nalco Holding Co. | 894,300 | | 21,812 |
Phosphate Holdings, Inc. (a) | 307,500 | | 2,537 |
Pliant Corp. (a) | 567 | | 0 |
Solutia, Inc. (a) | 716,300 | | 10,107 |
W.R. Grace & Co. (a) | 1,601,519 | | 41,111 |
| | 387,118 |
Containers & Packaging - 0.7% |
Owens-Illinois, Inc. (a) | 421,000 | | 11,641 |
Rock-Tenn Co. Class A | 355,202 | | 18,904 |
| | 30,545 |
Metals & Mining - 1.3% |
AngloGold Ashanti Ltd. sponsored ADR | 526,100 | | 21,318 |
Compass Minerals International, Inc. | 258,500 | | 18,273 |
Ormet Corp. (a) | 330,000 | | 957 |
Ormet Corp. (a)(i) | 1,075,000 | | 3,118 |
Teck Resources Ltd. Class B (sub. vtg.) | 417,300 | | 14,691 |
| | 58,357 |
Paper & Forest Products - 0.5% |
Domtar Corp. | 203,041 | | 11,878 |
Neenah Paper, Inc. | 518,300 | | 9,298 |
| | 21,176 |
TOTAL MATERIALS | | 497,196 |
TELECOMMUNICATION SERVICES - 3.7% |
Diversified Telecommunication Services - 1.1% |
Level 3 Communications, Inc. (a)(e) | 2,000,000 | | 2,260 |
PAETEC Holding Corp. (a) | 2,980,233 | | 11,712 |
Common Stocks - continued |
| Shares | | Value (000s) |
TELECOMMUNICATION SERVICES - continued |
Diversified Telecommunication Services - continued |
Qwest Communications International, Inc. | 4,637,500 | | $ 26,248 |
tw telecom, inc. (a) | 332,497 | | 6,291 |
| | 46,511 |
Wireless Telecommunication Services - 2.6% |
Crown Castle International Corp. (a) | 981,391 | | 38,775 |
Sprint Nextel Corp. (a) | 5,692,987 | | 26,017 |
Syniverse Holdings, Inc. (a) | 2,244,438 | | 50,118 |
| | 114,910 |
TOTAL TELECOMMUNICATION SERVICES | | 161,421 |
UTILITIES - 3.9% |
Gas Utilities - 0.3% |
ONEOK, Inc. | 317,600 | | 14,778 |
Independent Power Producers & Energy Traders - 3.6% |
AES Corp. (a) | 10,901,923 | | 112,399 |
Calpine Corp. (a) | 2,479,900 | | 33,479 |
NRG Energy, Inc. (a) | 454,528 | | 10,309 |
| | 156,187 |
TOTAL UTILITIES | | 170,965 |
TOTAL COMMON STOCKS (Cost $4,219,527) | 4,144,309 |
Preferred Stocks - 0.4% |
| | | |
Convertible Preferred Stocks - 0.3% |
ENERGY - 0.3% |
Oil, Gas & Consumable Fuels - 0.3% |
El Paso Corp. 4.99% | 11,200 | | 12,067 |
Nonconvertible Preferred Stocks - 0.1% |
CONSUMER STAPLES - 0.1% |
Personal Products - 0.1% |
Revlon, Inc. Series A 12.75% | 639,576 | | 3,614 |
Preferred Stocks - continued |
| Shares | | Value (000s) |
Nonconvertible Preferred Stocks - continued |
FINANCIALS - 0.0% |
Diversified Financial Services - 0.0% |
GMAC, Inc. 7.00% (g) | 944 | | $ 772 |
TOTAL NONCONVERTIBLE PREFERRED STOCKS | | 4,386 |
TOTAL PREFERRED STOCKS (Cost $16,979) | 16,453 |
Nonconvertible Bonds - 2.4% |
| Principal Amount (000s) | | |
CONSUMER DISCRETIONARY - 1.1% |
Automobiles - 0.9% |
General Motors Corp.: | | | | |
6.75% 5/1/28 (d) | | $ 3,075 | | 992 |
7.125% 7/15/13 (d) | | 8,320 | | 2,766 |
7.2% 1/15/11 (d) | | 22,980 | | 7,813 |
8.25% 7/15/23 (d) | | 25,035 | | 8,512 |
8.375% 7/15/33 (d) | | 50,210 | | 17,322 |
8.8% 3/1/21 (d) | | 10,765 | | 3,606 |
| | 41,011 |
Hotels, Restaurants & Leisure - 0.0% |
Station Casinos, Inc.: | | | | |
6% 4/1/12 (d) | | 8,360 | | 167 |
7.75% 8/15/16 (d) | | 9,380 | | 188 |
| | 355 |
Media - 0.2% |
Clear Channel Communications, Inc. 10.75% 8/1/16 | | 10,940 | | 8,369 |
TOTAL CONSUMER DISCRETIONARY | | 49,735 |
FINANCIALS - 0.3% |
Consumer Finance - 0.3% |
GMAC LLC 8% 12/31/18 | | 13,924 | | 13,437 |
Nonconvertible Bonds - continued |
| Principal Amount (000s) | | Value (000s) |
INDUSTRIALS - 0.0% |
Airlines - 0.0% |
Delta Air Lines, Inc. 8% 12/15/07 (a)(g) | | $ 4,145 | | $ 41 |
Northwest Airlines, Inc. 9.875% 3/15/07 (a) | | 7,000 | | 0 |
| | 41 |
INFORMATION TECHNOLOGY - 0.2% |
Semiconductors & Semiconductor Equipment - 0.2% |
NXP BV/NXP Funding LLC: | | | | |
7.875% 10/15/14 | | 4,362 | | 4,395 |
10% 7/15/13 (g) | | 1,655 | | 1,812 |
| | 6,207 |
TELECOMMUNICATION SERVICES - 0.8% |
Diversified Telecommunication Services - 0.8% |
Clearwire Communications LLC/Clearwire Finance, Inc. 12% 12/1/15 (g) | | 10,950 | | 11,456 |
Sprint Capital Corp.: | | | | |
6.875% 11/15/28 | | 14,800 | | 12,876 |
6.9% 5/1/19 | | 10,410 | | 9,929 |
| | 34,261 |
TOTAL NONCONVERTIBLE BONDS (Cost $69,847) | 103,681 |
Floating Rate Loans - 1.4% |
|
CONSUMER DISCRETIONARY - 0.2% |
Media - 0.2% |
Univision Communications, Inc. Tranche 1LN, term loan 2.5972% 9/29/14 (h) | | 10,801 | | 9,424 |
INDUSTRIALS - 0.6% |
Airlines - 0.6% |
Delta Air Lines, Inc. Tranche 2LN, term loan 3.5909% 4/30/14 (h) | | 17,119 | | 15,579 |
US Airways Group, Inc. term loan 2.8288% 3/23/14 (h) | | 10,947 | | 9,059 |
| | 24,638 |
Floating Rate Loans - continued |
| Principal Amount (000s) | | Value (000s) |
INFORMATION TECHNOLOGY - 0.4% |
Semiconductors & Semiconductor Equipment - 0.4% |
Freescale Semiconductor, Inc. term loan 4.5956% 12/1/16 (h) | | $ 18,154 | | $ 16,657 |
TELECOMMUNICATION SERVICES - 0.1% |
Diversified Telecommunication Services - 0.1% |
FairPoint Communications, Inc. Tranche B, term loan 3/31/15 (d) | | 8,250 | | 5,363 |
UTILITIES - 0.1% |
Electric Utilities - 0.1% |
Texas Competitive Electric Holdings Co. LLC/Texas Competitive Electric Holdings Finance, Inc. Tranche B2, term loan 3.975% 10/10/14 (h) | | 5,706 | | 4,422 |
TOTAL FLOATING RATE LOANS (Cost $56,669) | 60,504 |
Other - 0.0% |
| Shares | | |
Other - 0.0% |
Delta Air Lines ALPA Claim (a)
(Cost $519) | 64,750,000 | | 1,295 |
Money Market Funds - 3.4% |
| | | |
Fidelity Cash Central Fund, 0.24% (b) | 60,531,674 | | 60,532 |
Fidelity Securities Lending Cash Central Fund, 0.27% (b)(c) | 88,076,975 | | 88,077 |
TOTAL MONEY MARKET FUNDS (Cost $148,609) | 148,609 |
TOTAL INVESTMENT PORTFOLIO - 101.9% (Cost $4,512,150) | | 4,474,851 |
NET OTHER ASSETS (LIABILITIES) - (1.9)% | | (81,905) |
NET ASSETS - 100% | $ 4,392,946 |
Legend |
(a) Non-income producing |
(b) Affiliated fund that is available only to investment companies and other accounts managed by Fidelity Investments. The rate quoted is the annualized seven-day yield of the fund at period end. A complete unaudited listing of the fund's holdings as of its most recent quarter end is available upon request. |
(c) Investment made with cash collateral received from securities on loan. |
(d) Non-income producing - Issuer is in default. |
(e) Security or a portion of the security is on loan at period end. |
(f) Affiliated company |
(g) Security exempt from registration under Rule 144A of the Securities Act of 1933. These securities may be resold in transactions exempt from registration, normally to qualified institutional buyers. At the end of the period, the value of these securities amounted to $14,081,000 or 0.3% of net assets. |
(h) The coupon rate shown on floating or adjustable rate securities represents the rate at period end. |
(i) Restricted securities - Investment in securities not registered under the Securities Act of 1933 (excluding 144A issues). At the end of the period, the value of restricted securities (excluding 144A issues) amounted to $3,118,000 or 0.1% of net assets. |
Additional information on each holding is as follows: |
Security | Acquisition Date | Acquisition Cost (000s) |
Ormet Corp. | 2/27/07 - 4/4/07 | $ 20,556 |
Affiliated Central Funds |
Information regarding fiscal year to date income earned by the Fund from investments in Fidelity Central Funds is as follows: |
Fund | Income earned
(Amounts in thousands) |
Fidelity Cash Central Fund | $ 401 |
Fidelity Securities Lending Cash Central Fund | 449 |
Total | $ 850 |
Other Affiliated Issuers |
An affiliated company is a company in which the fund has ownership of at least 5% of the voting securities. Fiscal year to date transactions with companies which are or were affiliates are as follows: |
Affiliates
(Amounts in thousands) | Value,
beginning of
period | Purchases | Sales
Proceeds | Dividend
Income | Value,
end of
period |
Cenveo, Inc. | $ 18,636 | $ - | $ - | $ - | $ 23,767 |
Gray Television, Inc. | 978 | 1,991 | - | - | 7,399 |
Merix Corp. | 2,766 | - | - | - | - |
ON Semiconductor Corp. | 168,477 | - | - | - | 155,780 |
Service Corp. International | 110,637 | 3,332 | 2,630 | 2,831 | 150,430 |
Tenet Healthcare Corp. | 103,351 | 2,090 | 24,404 | - | - |
Total | $ 404,845 | $ 7,413 | $ 27,034 | $ 2,831 | $ 337,376 |
Other Information |
The following is a summary of the inputs used, as of July 31, 2010, involving the Fund's assets and liabilities carried at fair value. The inputs or methodology used for valuing securities may not be an indication of the risk associated with investing in those securities. For more information on valuation inputs, and their aggregation into the levels used in the tables below, please refer to the Security Valuation section in the accompanying Notes to Financial Statements. |
Valuation Inputs at Reporting Date: |
Description
(Amounts in thousands) | Total | Level 1 | Level 2 | Level 3 |
Investments in Securities: | | | | |
Equities: | | | | |
Consumer Discretionary | $ 674,708 | $ 674,708 | $ - | $ - |
Consumer Staples | 105,095 | 101,481 | - | 3,614 |
Energy | 547,508 | 535,441 | 12,067 | - |
Financials | 541,034 | 540,262 | 772 | - |
Health Care | 260,671 | 260,671 | - | - |
Industrials | 799,884 | 799,884 | - | - |
Information Technology | 402,280 | 402,280 | - | - |
Materials | 497,196 | 497,196 | - | - |
Telecommunication Services | 161,421 | 161,421 | - | - |
Utilities | 170,965 | 170,965 | - | - |
Corporate Bonds | 103,681 | - | 103,640 | 41 |
Floating Rate Loans | 60,504 | - | 60,504 | - |
Other | 1,295 | - | - | 1,295 |
Money Market Funds | 148,609 | 148,609 | - | - |
Total Investments in Securities: | $ 4,474,851 | $ 4,292,918 | $ 176,983 | $ 4,950 |
The following is a reconciliation of Investments in Securities for which Level 3 inputs were used in determining value: |
Investments in Securities:
(Amounts in thousands) | |
Beginning Balance | $ 2,534 |
Total Realized Gain (Loss) | - |
Total Unrealized Gain (Loss) | 761 |
Cost of Purchases | 3,614 |
Proceeds of Sales | (1,406) |
Amortization/Accretion | - |
Transfers in to Level 3 | - |
Transfers out of Level 3 | (553) |
Ending Balance | $ 4,950 |
The change in unrealized gain (loss) for the period attributable to Level 3 securities held at July 31, 2010 | $ 761 |
The information used in the above reconciliation represents fiscal year to date activity for any Investments in Securities identified as using Level 3 inputs at either the beginning or the end of the current fiscal period. Transfers in or out of Level 3 represent the beginning value of any Security or Instrument where a change in the pricing level occurred from the beginning to the end of the period. The cost of purchases and the proceeds of sales may include securities received or delivered through corporate actions or exchanges. Realized and unrealized gains (losses) disclosed in the reconciliation are included in Net Gain (Loss) on the Fund's Statement of Operations. |
Income Tax Information |
At July 31, 2010, the Fund had a capital loss carryforward of approximately $988,870,000 of which $297,190,000 and $691,680,000 will expire on July 31, 2017 and 2018, respectively. Capital loss carryforwards are only available to offset future capital gains of the Fund to the extent provided by regulations and may be limited. |
See accompanying notes which are an integral part of the financial statements.
Annual Report
Statement of Assets and Liabilities
Amounts in thousands (except per-share amounts) | July 31, 2010 |
| | |
Assets | | |
Investment in securities, at value (including securities loaned of $86,901) - See accompanying schedule: Unaffiliated issuers (cost $4,015,511) | $ 3,988,866 | |
Fidelity Central Funds (cost $148,609) | 148,609 | |
Other affiliated issuers (cost $348,030) | 337,376 | |
Total Investments (cost $4,512,150) | | $ 4,474,851 |
Cash | | 23 |
Receivable for investments sold | | 9,254 |
Receivable for fund shares sold | | 2,316 |
Dividends receivable | | 1,014 |
Interest receivable | | 1,543 |
Distributions receivable from Fidelity Central Funds | | 109 |
Other receivables | | 27 |
Total assets | | 4,489,137 |
| | |
Liabilities | | |
Payable for fund shares redeemed | 4,986 | |
Accrued management fee | 2,184 | |
Other affiliated payables | 890 | |
Other payables and accrued expenses | 54 | |
Collateral on securities loaned, at value | 88,077 | |
Total liabilities | | 96,191 |
| | |
Net Assets | | $ 4,392,946 |
Net Assets consist of: | | |
Paid in capital | | $ 5,426,375 |
Undistributed net investment income | | 10,281 |
Accumulated undistributed net realized gain (loss) on investments and foreign currency transactions | | (1,006,409) |
Net unrealized appreciation (depreciation) on investments and assets and liabilities in foreign currencies | | (37,301) |
Net Assets | | $ 4,392,946 |
See accompanying notes which are an integral part of the financial statements.
Annual Report
Financial Statements - continued
Statement of Assets and Liabilities - continued
Amounts in thousands (except per-share amounts) | July 31, 2010 |
| | |
Leveraged Company Stock:
Net Asset Value, offering price and redemption price per share ($3,983,012 ÷ 169,456 shares) | | $ 23.50 |
| | |
Class K:
Net Asset Value, offering price and redemption price per share ($409,934 ÷ 17,427 shares) | | $ 23.52 |
See accompanying notes which are an integral part of the financial statements.
Annual Report
Statement of Operations
Amounts in thousands | Year ended July 31, 2010 |
| | |
Investment Income | | |
Dividends (including $2,831 earned from other affiliated issuers) | | $ 33,063 |
Interest | | 19,113 |
Income from Fidelity Central Funds | | 850 |
Total income | | 53,026 |
| | |
Expenses | | |
Management fee | $ 27,676 | |
Transfer agent fees | 10,157 | |
Accounting and security lending fees | 1,175 | |
Custodian fees and expenses | 60 | |
Independent trustees' compensation | 26 | |
Registration fees | 106 | |
Audit | 63 | |
Legal | 38 | |
Miscellaneous | 76 | |
Total expenses before reductions | 39,377 | |
Expense reductions | (161) | 39,216 |
Net investment income (loss) | | 13,810 |
Realized and Unrealized Gain (Loss) Net realized gain (loss) on: | | |
Investment securities: | | |
Unaffiliated issuers | 189,278 | |
Other affiliated issuers | 11,822 | |
Foreign currency transactions | (41) | |
Capital gain distributions from Fidelity Central Funds | 6 | |
Total net realized gain (loss) | | 201,065 |
Change in net unrealized appreciation (depreciation) on: Investment securities | 593,664 | |
Assets and liabilities in foreign currencies | (16) | |
Total change in net unrealized appreciation (depreciation) | | 593,648 |
Net gain (loss) | | 794,713 |
Net increase (decrease) in net assets resulting from operations | | $ 808,523 |
See accompanying notes which are an integral part of the financial statements.
Annual Report
Financial Statements - continued
Statement of Changes in Net Assets
Amounts in thousands | Year ended
July 31,
2010 | Year ended
July 31,
2009 |
Increase (Decrease) in Net Assets | | |
Operations | | |
Net investment income (loss) | $ 13,810 | $ 46,155 |
Net realized gain (loss) | 201,065 | (1,210,936) |
Change in net unrealized appreciation (depreciation) | 593,648 | (1,921,072) |
Net increase (decrease) in net assets resulting
from operations | 808,523 | (3,085,853) |
Distributions to shareholders from net investment income | (23,690) | (31,749) |
Distributions to shareholders from net realized gain | - | (63,967) |
Total distributions | (23,690) | (95,716) |
Share transactions - net increase (decrease) | (373,729) | (872,099) |
Redemption fees | 970 | 2,433 |
Total increase (decrease) in net assets | 412,074 | (4,051,235) |
| | |
Net Assets | | |
Beginning of period | 3,980,872 | 8,032,107 |
End of period (including undistributed net investment income of $10,281 and undistributed net investment income of $21,357, respectively) | $ 4,392,946 | $ 3,980,872 |
See accompanying notes which are an integral part of the financial statements.
Annual Report
Financial Highlights - Leveraged Company Stock
Years ended July 31, | 2010 | 2009 | 2008 | 2007 | 2006 |
Selected Per-Share Data | | | | | |
Net asset value, beginning of period | $ 19.55 | $ 31.09 | $ 33.78 | $ 28.07 | $ 25.48 |
Income from Investment Operations | | | | | |
Net investment income (loss) B | .07 | .21 | .14 | .44 E | .16 |
Net realized and unrealized gain (loss) | 3.99 | (11.37) | (1.06) | 6.78 | 3.04 |
Total from investment operations | 4.06 | (11.16) | (.92) | 7.22 | 3.20 |
Distributions from net investment income | (.11) | (.14) | (.39) | (.12) | (.21) |
Distributions from net realized gain | - | (.25) | (1.39) | (1.40) | (.41) |
Total distributions | (.11) | (.39) | (1.78) | (1.52) | (.62) |
Redemption fees added to paid in capital B | - G | .01 | .01 | .01 | .01 |
Net asset value, end of period | $ 23.50 | $ 19.55 | $ 31.09 | $ 33.78 | $ 28.07 |
Total Return A | 20.84% | (35.99)% | (2.76)% | 27.08% | 12.80% |
Ratios to Average Net Assets C, F | | | | |
Expenses before reductions | .88% | .92% | .83% | .83% | .86% |
Expenses net of fee waivers, if any | .88% | .92% | .83% | .83% | .86% |
Expenses net of all reductions | .88% | .92% | .83% | .83% | .85% |
Net investment income (loss) | .29% | 1.17% | .44% | 1.43% E | .60% |
Supplemental Data | | | | | |
Net assets, end of period (in millions) | $ 3,983 | $ 3,714 | $ 8,032 | $ 7,830 | $ 4,174 |
Portfolio turnover rate D | 21% | 34% | 30% | 20% | 23% |
A Total returns would have been lower had certain expenses not been reduced during the periods shown.
B Calculated based on average shares outstanding during the period.
C Fees and expenses of the underlying Fidelity Central Funds are not included in the Fund's expense ratio. The Fund indirectly bears its proportionate share of the expenses of any underlying Fidelity Central Funds.
D Amount does not include the portfolio activity of any underlying Fidelity Central Funds.
E Investment income per share reflects a special dividend which amounted to $.26 per share. Excluding the special dividend, the ratio of net investment income (loss) to average net assets would have been .59%.
F Expense ratios reflect operating expenses of the class. Expenses before reductions do not reflect amounts reimbursed by the investment adviser or reductions from brokerage service arrangements or reductions from other expense offset arrangements and do not represent the amount paid by the class during periods when reimbursements or reductions occur. Expenses net of fee waivers reflect expenses after reimbursement by the investment adviser but prior to reductions from brokerage service arrangements or other expense offset arrangements. Expenses net of all reductions represent the net expenses paid by the class.
G Amount represents less than $.01 per share.
See accompanying notes which are an integral part of the financial statements.
Annual Report
Financial Highlights - Class K
Years ended July 31, | 2010 | 2009 | 2008 G |
Selected Per-Share Data | | | |
Net asset value, beginning of period | $ 19.56 | $ 31.11 | $ 34.10 |
Income from Investment Operations | | | |
Net investment income (loss) D | .11 | .21 | .05 |
Net realized and unrealized gain (loss) | 4.00 | (11.35) | (3.04) |
Total from investment operations | 4.11 | (11.14) | (2.99) |
Distributions from net investment income | (.15) | (.17) | - |
Distributions from net realized gain | - | (.25) | - |
Total distributions | (.15) | (.42) | - |
Redemption fees added to paid in capital D | - I | .01 | - I |
Net asset value, end of period | $ 23.52 | $ 19.56 | $ 31.11 |
Total Return B, C | 21.09% | (35.86)% | (8.77)% |
Ratios to Average Net Assets E, H | | | |
Expenses before reductions | .70% | .71% | .70% A |
Expenses net of fee waivers, if any | .70% | .71% | .70% A |
Expenses net of all reductions | .69% | .71% | .70% A |
Net investment income (loss) | .47% | 1.39% | .58% A |
Supplemental Data | | | |
Net assets, end of period (000 omitted) | $ 409,934 | $ 267,351 | $ 91 |
Portfolio turnover rate F | 21% | 34% | 30% |
A Annualized
B Total returns for periods of less than one year are not annualized.
C Total returns would have been lower had certain expenses not been reduced during the periods shown.
D Calculated based on average shares outstanding during the period.
E Fees and expenses of the underlying Fidelity Central Funds are not included in the Fund's expense ratio. The Fund indirectly bears its proportionate share of the expenses of any underlying Fidelity Central Funds.
F Amount does not include the portfolio activity of any underlying Fidelity Central Funds.
G For the period May 9, 2008 (commencement of sale of shares) to July 31, 2008.
H Expense ratios reflect operating expenses of the class. Expenses before reductions do not reflect amounts reimbursed by the investment adviser or reductions from brokerage service arrangements or reductions from other expense offset arrangements and do not represent the amount paid by the class during periods when reimbursements or reductions occur. Expense ratios before reductions for start-up periods may not be representative of longer-term operating periods. Expenses net of fee waivers reflect expenses after reimbursement by the investment adviser but prior to reductions from brokerage service arrangements or other expense offset arrangements. Expenses net of all reductions represent the net expenses paid by the class.
I Amount represents less than $.01 per share.
See accompanying notes which are an integral part of the financial statements.
Annual Report
Notes to Financial Statements
For the period ended July 31, 2010
(Amounts in thousands except ratios)
1. Organization.
Fidelity Leveraged Company Stock Fund (the Fund) is a fund of Fidelity Securities Fund (the Trust) and is authorized to issue an unlimited number of shares. The Trust is registered under the Investment Company Act of 1940, as amended (the 1940 Act), as an open-end management investment company organized as a Massachusetts business trust. The Fund offers Leveraged Company Stock and Class K, each of which has equal rights as to assets and voting privileges. Each class has exclusive voting rights with respect to matters that affect that class. After the commencement of Class K, the Fund began offering conversion privileges between Leveraged Company Stock and Class K to eligible shareholders of Leveraged Company Stock. Investment income, realized and unrealized capital gains and losses, the common expenses of the Fund, and certain fund-level expense reductions, if any, are allocated on a pro-rata basis to each class based on the relative net assets of each class to the total net assets of the Fund. Each class differs with respect to transfer agent fees incurred. Certain expense reductions also differ by class.
2. Investments in Fidelity Central Funds.
The Fund may invest in Fidelity Central Funds, which are open-end investment companies available only to other investment companies and accounts managed by Fidelity Management & Research Company (FMR) and its affiliates. The Fund's Schedule of Investments lists each of the Fidelity Central Funds held as of period end, if any, as an investment of the Fund, but does not include the underlying holdings of each Fidelity Central Fund. As an Investing Fund, the Fund indirectly bears its proportionate share of the expenses of the underlying Fidelity Central Funds.
The Money Market Central Funds seek preservation of capital and current income and are managed by Fidelity Investments Money Management, Inc. (FIMM), an affiliate of FMR.
A complete unaudited list of holdings for each Fidelity Central Fund is available upon request or at the Securities and Exchange Commission (the SEC) web site at www.sec.gov. In addition, the financial statements of the Fidelity Central Funds which are not covered by the Fund's Report of Independent Registered Public Accounting Firm, are available on the SEC web site or upon request.
3. Significant Accounting Policies.
The financial statements have been prepared in conformity with accounting principles generally accepted in the United States of America (GAAP), which require management to make certain estimates and assumptions at the date of the financial statements. Actual results could differ from those estimates. The following summarizes the significant accounting policies of the Fund:
Annual Report
Notes to Financial Statements - continued
(Amounts in thousands except ratios)
3. Significant Accounting Policies - continued
Security Valuation. Investments are valued as of 4:00 p.m. Eastern time on the last calendar day of the period. The Fund uses independent pricing services approved by the Board of Trustees to value its investments. When current market prices or quotations are not readily available or reliable, valuations may be determined in good faith in accordance with procedures adopted by the Board of Trustees. Factors used in determining value may include market or security specific events, changes in interest rates and credit quality. The frequency with which these procedures are used cannot be predicted and they may be utilized to a significant extent. The value used for net asset value (NAV) calculation under these procedures may differ from published prices for the same securities.
The Fund categorizes the inputs to valuation techniques used to value its investments into a disclosure hierarchy consisting of three levels as shown below.
Level 1 - quoted prices in active markets for identical investments
Level 2 - other significant observable inputs (including quoted prices for similar investments, interest rates, prepayment speeds, etc.)
Level 3 - unobservable inputs (including the fund's own assumptions based on the best information available)
Changes in valuation techniques may result in transfers in or out of an assigned level within the disclosure hierarchy. The aggregate value of investments by input level, as of July 31, 2010, as well as a roll forward of Level 3 securities, is included at the end of the Fund's Schedule of Investments. Valuation techniques used to value the Fund's investments by major category are as follows.
Equity securities, including restricted securities, for which market quotations are readily available, are valued at the last reported sale price or official closing price as reported by an independent pricing service on the primary market or exchange on which they are traded and are categorized as Level 1 in the hierarchy. In the event there were no sales during the day or closing prices are not available, securities are valued at the last quoted bid price or may be valued using the last available price and are generally categorized as Level 2 in the hierarchy. For foreign equity securities, when significant market or security specific events arise, comparisons to the valuation of American Depositary Receipts (ADRs), futures contracts, Exchange-traded funds (ETFs) and certain indexes as well as quoted prices for similar securities are used and are categorized as Level 2 in the hierarchy in these circumstances. Utilizing these techniques may result in transfers between Level 1 and Level 2. For restricted equity securities and private placements where observable inputs are limited, assumptions about market activity and risk are used and are categorized as Level 3 in the hierarchy.
Annual Report
3. Significant Accounting Policies - continued
Security Valuation - continued
Debt securities, including restricted securities, are valued based on evaluated prices received from independent pricing services or from dealers who make markets in such securities. For corporate bonds and floating rate loans, pricing services utilize matrix pricing which considers yield or price of bonds of comparable quality, coupon, maturity and type as well as dealer supplied prices and are generally categorized as Level 2 in the hierarchy.
Investments in open-end mutual funds, including the Fidelity Central Funds, are valued at their closing net asset value each business day and are categorized as Level 1 in the hierarchy. Short-term securities with remaining maturities of sixty days or less for which quotations are not readily available are valued at amortized cost, which approximates fair value and are categorized as Level 2 in the hierarchy.
When independent prices are unavailable or unreliable, debt securities may be valued utilizing pricing matrices which consider similar factors that would be used by independent pricing services. These are generally categorized as Level 2 in the hierarchy but may be Level 3 depending on the circumstances.
Foreign Currency. The Fund uses foreign currency contracts to facilitate transactions in foreign-denominated securities. Gains and losses from these transactions may arise from changes in the value of the foreign currency or if the counterparties do not perform under the contracts' terms.
Foreign-denominated assets, including investment securities, and liabilities are translated into U.S. dollars at the exchange rate at period end. Purchases and sales of investment securities, income and dividends received and expenses denominated in foreign currencies are translated into U.S. dollars at the exchange rate in effect on the transaction date.
The effects of exchange rate fluctuations on investments are included with the net realized and unrealized gain (loss) on investment securities. Other foreign currency transactions resulting in realized and unrealized gain (loss) are disclosed separately.
Investment Transactions and Income. For financial reporting purposes, the Fund's investment holdings and NAV include trades executed through the end of the last business day of the period. The NAV per share for processing shareholder transactions is calculated as of the close of business of the New York Stock Exchange (NYSE), normally 4:00 p.m. Eastern time and includes trades executed through the end of the prior business day. Gains and losses on securities sold are determined on the basis of identified cost and may include proceeds received from litigation. Dividend income is recorded on the ex-dividend date, except for certain dividends from foreign securities where the
Annual Report
Notes to Financial Statements - continued
(Amounts in thousands except ratios)
3. Significant Accounting Policies - continued
Investment Transactions and Income - continued
ex-dividend date may have passed, which are recorded as soon as the Fund is informed of the ex-dividend date. Non-cash dividends included in dividend income, if any, are recorded at the fair market value of the securities received. Distributions received on securities that represent a return of capital or capital gain are recorded as a reduction of cost of investments and/or as a realized gain. The Fund estimates the components of distributions received that may be considered return of capital distributions or capital gain distributions. Interest income and distributions from the Fidelity Central Funds are accrued as earned. Interest income includes coupon interest and amortization of premium and accretion of discount on debt securities. Investment income is recorded net of foreign taxes withheld where recovery of such taxes is uncertain. Debt obligations may be placed on non-accrual status and related interest income may be reduced by ceasing current accruals and writing off interest receivables when the collection of all or a portion of interest has become doubtful based on consistently applied procedures. A debt obligation is removed from non-accrual status when the issuer resumes interest payments or when collectability of interest is reasonably assured.
Expenses. Most expenses of the Trust can be directly attributed to a fund. Expenses which cannot be directly attributed are apportioned amongst each fund in the Trust. Expense estimates are accrued in the period to which they relate and adjustments are made when actual amounts are known.
Income Tax Information and Distributions to Shareholders. Each year the Fund intends to qualify as a regulated investment company, including distributing substantially all of its taxable income and realized gains under Subchapter M of the Internal Revenue Code and filing its U.S. federal tax return. As a result, no provision for income taxes is required. As of July 31, 2010, the Fund did not have any unrecognized tax benefits in the accompanying financial statements. A fund's federal tax return is subject to examination by the Internal Revenue Service (IRS) for a period of three years. Foreign taxes are provided for based on the Fund's understanding of the tax rules and rates that exist in the foreign markets in which it invests.
Distributions are recorded on the ex-dividend date. Income dividends and capital gain distributions are declared separately for each class. Income and capital gain distributions are determined in accordance with income tax regulations, which may differ from GAAP.
Capital accounts within the financial statements are adjusted for permanent book-tax differences. These adjustments have no impact on net assets or the results of operations. Temporary book-tax differences will reverse in a subsequent period.
Annual Report
3. Significant Accounting Policies - continued
Income Tax Information and Distributions to Shareholders - continued
Book-tax differences are primarily due to the short-term gain distributions from the Fidelity Central Funds, foreign currency transactions, market discount, capital loss carryforwards and losses deferred due to wash sales and excise tax regulations.
The federal tax cost of investment securities and unrealized appreciation (depreciation) as of period end were as follows:
Gross unrealized appreciation | $ 806,591 |
Gross unrealized depreciation | (857,720) |
Net unrealized appreciation (depreciation) | $ (51,129) |
| |
Tax Cost | $ 4,525,980 |
The tax-based components of distributable earnings as of period end were as follows:
Undistributed ordinary income | $ 6,572 |
Capital loss carryforward | $ (988,870) |
Net unrealized appreciation (depreciation) | $ (51,131) |
The tax character of distributions paid was as follows:
| July 31, 2010 | July 31, 2009 |
Ordinary Income | $ 23,690 | $ 47,101 |
Long-term Capital Gains | - | 48,615 |
Total | $ 23,690 | $ 95,716 |
Short-Term Trading (Redemption) Fees. Shares held in the Fund less than 90 days are subject to a redemption fee equal to 1.50% of the proceeds of the redeemed shares. All redemption fees, including any estimated redemption fees paid by FMR, are retained by the Fund and accounted for as an addition to paid in capital.
4. Operating Policies.
Restricted Securities. The Fund may invest in securities that are subject to legal or contractual restrictions on resale. These securities generally may be resold in transactions exempt from registration or to the public if the securities are registered. Disposal of these securities may involve time-consuming negotiations and expense, and prompt sale at an acceptable price may be difficult. Information regarding restricted securities is included at the end of the Fund's Schedule of Investments.
Annual Report
Notes to Financial Statements - continued
(Amounts in thousands except ratios)
4. Operating Policies - continued
Loans and Other Direct Debt Instruments. The Fund may invest in loans and loan participations, trade claims or other receivables. These investments may include standby financing commitments, including revolving credit facilities, that obligate the Fund to supply additional cash to the borrower on demand. Loan participations involve a risk of insolvency of the lending bank or other financial intermediary. The Fund may be contractually obligated to receive approval from the agent bank and/or borrower prior to the sale of these investments.
5. Purchases and Sales of Investments.
Purchases and sales of securities, other than short-term securities, aggregated $916,790 and $1,229,143, respectively.
6. Fees and Other Transactions with Affiliates.
Management Fee. FMR and its affiliates provide the Fund with investment management related services for which the Fund pays a monthly management fee. The management fee is the sum of an individual fund fee rate that is based on an annual rate of .35% of the Fund's average net assets and a group fee rate that averaged .26% during the period. The group fee rate is based upon the average net assets of all the mutual funds advised by FMR. The group fee rate decreases as assets under management increase and increases as assets under management decrease. For the period, the total annual management fee rate was .61% of the Fund's average net assets.
Transfer Agent Fees. Fidelity Investments Institutional Operations Company, Inc. (FIIOC), an affiliate of FMR, is the transfer, dividend disbursing and shareholder servicing agent for each class of the Fund. FIIOC receives account fees and asset-based fees that vary according to the account size and type of account of the shareholders of Leveraged Company Stock. FIIOC receives an asset-based fee of Class K's average net assets. FIIOC pays for typesetting, printing and mailing of shareholder reports, except proxy statements. For the period, the total transfer agent fees paid by each class were as follows:
| Amount | % of
Average
Net Assets |
Leveraged Company Stock | $ 9,954 | .24 |
Class K | 203 | .05 |
| $ 10,157 | |
Annual Report
6. Fees and Other Transactions with Affiliates - continued
Accounting and Security Lending Fees. Fidelity Service Company, Inc. (FSC), an affiliate of FMR, maintains the Fund's accounting records. The accounting fee is based on the level of average net assets for the month. Under a separate contract, FSC administers the security lending program. The security lending fee is based on the number and duration of lending transactions.
Brokerage Commissions. The Fund placed a portion of its portfolio transactions with brokerage firms which are affiliates of the investment adviser. The commissions paid to these affiliated firms were $72 for the period.
7. Committed Line of Credit.
The Fund participates with other funds managed by FMR in a $3.75 billion credit facility (the "line of credit") to be utilized for temporary or emergency purposes to fund shareholder redemptions or for other short-term liquidity purposes. The Fund has agreed to pay commitment fees on its pro-rata portion of the line of credit, which amounted to $18 and is reflected in Miscellaneous expenses on the Statement of Operations. During the period, there were no borrowings on this line of credit.
8. Security Lending.
The Fund lends portfolio securities from time to time in order to earn additional income. On the settlement date of the loan, the Fund receives collateral (in the form of U.S. Treasury obligations, letters of credit and/or cash) against the loaned securities and maintains collateral in an amount not less than 100% of the market value of the loaned securities during the period of the loan. The market value of the loaned securities is determined at the close of business of the Fund and any additional required collateral is delivered to the Fund on the next business day. If the borrower defaults on its obligation to return the securities loaned because of insolvency or other reasons, a fund could experience delays and costs in recovering the securities loaned or in gaining access to the collateral. Any cash collateral received is invested in the Fidelity Securities Lending Cash Central Fund. The value of loaned securities and cash collateral at period end are disclosed on the Fund's Statement of Assets and Liabilities. Security lending income represents the income earned on investing cash collateral, less fees and expenses associated with the loan, plus any premium payments that may be received on the loan of certain types of securities. Security lending income is presented in the Statement of Operations as a component of income from Fidelity Central Funds. Net income from lending portfolio securities during the period amounted to $449.
Annual Report
Notes to Financial Statements - continued
(Amounts in thousands except ratios)
9. Expense Reductions.
Many of the brokers with whom FMR places trades on behalf of the Fund provided services to the Fund in addition to trade execution. These services included payments of certain expenses on behalf of the Fund totaling $160 for the period. In addition, through arrangements with the Fund's custodian, credits realized as a result of uninvested cash balances were used to reduce the Fund's expenses. During the period, these credits reduced the Fund's custody expenses by $1.
10. Distributions to Shareholders.
Distributions to shareholders of each class were as follows:
Years ended July 31, | 2010 | 2009 |
From net investment income | | |
Leveraged Company Stock | $ 21,247 | $ 30,127 |
Class K | 2,443 | 1,622 |
Total | $ 23,690 | $ 31,749 |
From net realized gain | | |
Leveraged Company Stock | $ - | $ 63,966 |
Class K | - | 1 |
Total | $ - | $ 63,967 |
11. Share Transactions.
Transactions for each class of shares were as follows:
| Shares | Dollars |
Years ended July 31, | 2010 A | 2009 | 2010 A | 2009 |
Leveraged Company Stock | | | | |
Shares sold | 36,532 | 52,607 | $ 843,196 | $ 972,232 |
Conversion to Class K | (2,316) | (12,957) | (48,185) | (289,406) |
Reinvestment of distributions | 940 | 3,995 | 20,361 | 89,681 |
Shares redeemed | (55,646) | (112,023) | (1,272,555) | (1,955,126) |
Net increase (decrease) | (20,490) | (68,378) | $ (457,183) | $ (1,182,619) |
Class K | | | | |
Shares sold | 5,965 | 6,741 | $ 138,844 | $ 105,087 |
Conversion from Leveraged Company Stock | 2,315 | 12,954 | 48,185 | 289,406 |
Reinvestment of distributions | 113 | 118 | 2,443 | 1,623 |
Shares redeemed | (4,631) | (6,151) | (106,018) | (85,596) |
Net increase (decrease) | 3,762 | 13,662 | $ 83,454 | $ 310,520 |
A Conversion transactions for Class K and Leveraged Company Stock are presented for the period August 1, 2009 through August 31, 2009.
Annual Report
12. Other.
The Fund's organizational documents provide former and current trustees and officers with a limited indemnification against liabilities arising in connection with the performance of their duties to the Fund. In the normal course of business, the Fund may also enter into contracts that provide general indemnifications. The Fund's maximum exposure under these arrangements is unknown as this would be dependent on future claims that may be made against the Fund. The risk of material loss from such claims is considered remote.
Annual Report
To the Trustees of Fidelity Securities Fund and the Shareholders of Fidelity Leveraged Company Stock Fund:
In our opinion, the accompanying statement of assets and liabilities, including the schedule of investments, and the related statements of operations and of changes in net assets and the financial highlights present fairly, in all material respects, the financial position of Fidelity Leveraged Company Stock Fund (a fund of Fidelity Securities Fund) at July 31, 2010, the results of its operations for the year then ended, the changes in its net assets for each of the two years in the period then ended and the financial highlights for each of the periods indicated, in conformity with accounting principles generally accepted in the United States of America. These financial statements and financial highlights (hereafter referred to as "financial statements") are the responsibility of the Fidelity Leveraged Company Stock Fund's management. Our responsibility is to express an opinion on these financial statements based on our audits. We conducted our audits of these financial statements in accordance with the standards of the Public Company Accounting Oversight Board (United States). Those standards require that we plan and perform the audit to obtain reasonable assurance about whether the financial statements are free of material misstatement. An audit includes examining, on a test basis, evidence supporting the amounts and disclosures in the financial statements, assessing the accounting principles used and significant estimates made by management, and evaluating the overall financial statement presentation. We believe that our audits, which included confirmation of securities at July 31, 2010 by correspondence with the custodian and brokers, provide a reasonable basis for our opinion.
/s/ PricewaterhouseCoopers LLP
PricewaterhouseCoopers LLP
Boston, Massachusetts
September 22, 2010
Annual Report
The Trustees, Member of the Advisory Board, and executive officers of the trust and fund, as applicable, are listed below. The Board of Trustees governs the fund and is responsible for protecting the interests of shareholders. The Trustees are experienced executives who meet periodically throughout the year to oversee the fund's activities, review contractual arrangements with companies that provide services to the fund, oversee management of the risks associated with such activities and contractual arrangements, and review the fund's performance. Except for James C. Curvey, each of the Trustees oversees 222 funds advised by FMR or an affiliate. Mr. Curvey oversees 411 funds advised by FMR or an affiliate.
The Trustees hold office without limit in time except that (a) any Trustee may resign; (b) any Trustee may be removed by written instrument, signed by at least two-thirds of the number of Trustees prior to such removal; (c) any Trustee who requests to be retired or who has become incapacitated by illness or injury may be retired by written instrument signed by a majority of the other Trustees; and (d) any Trustee may be removed at any special meeting of shareholders by a two-thirds vote of the outstanding voting securities of the trust. Each Trustee who is not an interested person (as defined in the 1940 Act) (Independent Trustee), shall retire not later than the last day of the calendar year in which his or her 72nd birthday occurs. The Independent Trustees may waive this mandatory retirement age policy with respect to individual Trustees. The executive officers and Advisory Board Member hold office without limit in time, except that any officer and Advisory Board Member may resign or may be removed by a vote of a majority of the Trustees at any regular meeting or any special meeting of the Trustees. Except as indicated, each individual has held the office shown or other offices in the same company for the past five years.
Experience, Skills, Attributes, and Qualifications of the Fund's Trustees. The Governance and Nominating Committee has adopted a statement of policy that describes the experience, qualifications, attributes, and skills that are necessary and desirable for potential Independent Trustee candidates (Statement of Policy). The Board believes that each Trustee satisfied at the time he or she was initially elected or appointed a Trustee, and continues to satisfy, the standards contemplated by the Statement of Policy. The Governance and Nominating Committee also engages professional search firms to help identify potential Independent Trustee candidates who have the experience, qualifications, attributes, and skills consistent with the Statement of Policy. From time to time, additional criteria based on the composition and skills of the current Independent Trustees, as well as experience or skills that may be appropriate in light of future changes to board composition, business conditions, and regulatory or other developments, have also been considered by the professional search firms and the Governance and Nominating Committee. In addition, the Board takes into account the Trustees' commitment and participation in Board and committee meetings, as well as their leadership of standing and ad hoc committees throughout their tenure.
In determining that a particular Trustee was and continues to be qualified to serve as a Trustee, the Board has considered a variety of criteria, none of which, in isolation, was controlling. The Board believes that, collectively, the Trustees have balanced and diverse experience, qualifications, attributes, and skills, which allow the Board to operate effectively in governing the fund and protecting the interests of shareholders. Information about the specific experience, skills, attributes, and qualifications of each Trustee, which in each case led to the Board's conclusion that the Trustee should serve (or continue to serve) as a trustee of the fund, is provided below.
Annual Report
Board Structure and Oversight Function. Edward C. Johnson 3d is an interested person (as defined in the 1940 Act) and currently serves as Chairman. The Trustees have determined that an interested Chairman is appropriate and benefits shareholders because an interested Chairman has a personal and professional stake in the quality and continuity of services provided to the fund. Independent Trustees exercise their informed business judgment to appoint an individual of their choosing to serve as Chairman, regardless of whether the Trustee happens to be independent or a member of management. The Independent Trustees have determined that they can act independently and effectively without having an Independent Trustee serve as Chairman and that a key structural component for assuring that they are in a position to do so is for the Independent Trustees to constitute a substantial majority for the Board. The Independent Trustees also regularly meet in executive session. Ned C. Lautenbach serves as Chairman of the Independent Trustees and as such (i) acts as a liaison between the Independent Trustees and management with respect to matters important to the Independent Trustees and (ii) with management prepares agendas for Board meetings.
Fidelity funds are overseen by different Boards of Trustees. The fund's Board oversees Fidelity's equity and high income funds and another Board oversees Fidelity's investment-grade bond, money market, and asset allocation funds. The asset allocation funds may invest in Fidelity funds overseen by the fund's Board. The use of separate Boards, each with its own committee structure, allows the Trustees of each group of Fidelity funds to focus on the unique issues of the funds they oversee, including common research, investment, and operational issues. On occasion, the separate Boards establish joint committees to address issues of overlapping consequences for the Fidelity funds overseen by each Board.
The Trustees operate using a system of committees to facilitate the timely and efficient consideration of all matters of importance to the Trustees, the fund, and fund shareholders and to facilitate compliance with legal and regulatory requirements and oversight of the fund's activities and associated risks. The Board, acting through its committees, has charged FMR and its affiliates with (i) identifying events or circumstances the occurrence of which could have demonstrably adverse effects on the fund's business and/or reputation; (ii) implementing processes and controls to lessen the possibility that such events or circumstances occur or to mitigate the effects of such events or circumstances if they do occur; and (iii) creating and maintaining a system designed to evaluate continuously business and market conditions in order to facilitate the identification and implementation processes described in (i) and (ii) above. Because the day-to-day operations and activities of the fund are carried out by or through FMR, its affiliates and other service providers, the fund's exposure to risks is mitigated but not eliminated by the processes overseen by the Trustees. While each of the Board's committees has responsibility for overseeing different aspects of the fund's activities, oversight is exercised primarily through the Operations, Audit, and Compliance Committees. Appropriate personnel, including but not limited to the fund's Chief Compliance Officer (CCO), FMR's internal auditor, the independent accountants, the fund's Treasurer and portfolio management personnel, make periodic reports to the Board's committees, as appropriate. The responsibilities of each committee, including their oversight responsibilities, are described further under "Standing Committees of the Fund's Trustees."
Annual Report
Trustees and Officers - continued
The fund's Statement of Additional Information (SAI) includes more information about the Trustees. To request a free copy, call Fidelity at 1-800-835-5092.
Interested Trustees*:
Correspondence intended for each Trustee who is an interested person may be sent to Fidelity Investments, 82 Devonshire Street, Boston, Massachusetts 02109.
Name, Age; Principal Occupations and Other Relevant Experience+ |
Edward C. Johnson 3d (80) |
| Year of Election or Appointment: 1984 Mr. Johnson is Trustee and Chairman of the Board of Trustees of certain Trusts. Mr. Johnson serves as Chief Executive Officer, Chairman, and a Director of FMR LLC; Chairman and a Director of FMR; Chairman and a Director of Fidelity Research & Analysis Company (FRAC); Chairman and a Director of Fidelity Investments Money Management, Inc.; and Chairman and a Director of FMR Co., Inc. In addition, Mr. Johnson serves as Chairman and Director of FIL Limited. Previously, Mr. Johnson served as President of FMR LLC (2006-2007). |
James C. Curvey (75) |
| Year of Election or Appointment: 2007 Mr. Curvey also serves as Trustee (2007-present) of other investment companies advised by FMR. Mr. Curvey is a Director of FMR and FMR Co., Inc. (2007-present). Mr. Curvey is also Vice Chairman (2006-present) and Director of FMR LLC. In addition, Mr. Curvey serves as an Overseer for the Boston Symphony Orchestra and a member of the Trustees of Villanova University. |
* Trustees have been determined to be "Interested Trustees" by virtue of, among other things, their affiliation with the trust or various entities under common control with FMR.
+ The information above includes each Trustee's principal occupation during the last five years and other information relating to the experience, attributes, and skills relevant to each Trustee's qualifications to serve as a Trustee, which led to the conclusion that each Trustee should serve as a Trustee for the fund.
Annual Report
Independent Trustees:
Correspondence intended for each Independent Trustee (that is, the Trustees other than the Interested Trustees) may be sent to Fidelity Investments, P.O. Box 55235, Boston, Massachusetts 02205-5235.
Name, Age; Principal Occupations and Other Relevant Experience+ |
Dennis J. Dirks (62) |
| Year of Election or Appointment: 2005 Prior to his retirement in May 2003, Mr. Dirks was Chief Operating Officer and a member of the Board of The Depository Trust & Clearing Corporation (DTCC). He also served as President, Chief Operating Officer, and Board member of The Depository Trust Company (DTC) and President and Board member of the National Securities Clearing Corporation (NSCC). In addition, Mr. Dirks served as Chief Executive Officer and Board member of the Government Securities Clearing Corporation, Chief Executive Officer and Board member of the Mortgage-Backed Securities Clearing Corporation, as a Trustee and a member of the Finance Committee of Manhattan College (2005-2008), and as a Trustee and a member of the Finance Committee of AHRC of Nassau County (2006-2008). Currently, Mr. Dirks serves as a member of the Board of Directors for The Brookville Center for Children's Services, Inc. (2009-present). |
Alan J. Lacy (56) |
| Year of Election or Appointment: 2008 Mr. Lacy serves as Senior Adviser (2007-present) of Oak Hill Capital Partners, L.P. (private equity). Mr. Lacy also served as Chief Executive Officer (2000-2005) and Vice Chairman (2005-2006) of Sears Holdings Corporation and Sears, Roebuck and Co. (retail). In addition, Mr. Lacy serves as a member of the Board of Directors of The Western Union Company (global money transfer, 2006-present) and Bristol-Myers Squibb Company (global pharmaceuticals, 2007-present). Mr. Lacy is Chairman (2008-present) and a member (2006-present) of the Board of Trustees of The National Parks Conservation Association. |
Ned C. Lautenbach (66) |
| Year of Election or Appointment: 2000 Mr. Lautenbach is Chairman of the Independent Trustees of the Equity and High Income Funds (2006-present). Mr. Lautenbach is an Advisory Partner of Clayton, Dubilier & Rice, Inc. (private equity investment, 2008-present) and was previously a Partner of Clayton, Dubilier & Rice, Inc. (1998-2008). Previously, Mr. Lautenbach was with the International Business Machines Corporation (IBM) from 1968 until his retirement in 1998. Mr. Lautenbach serves as a Director of Eaton Corporation (diversified industrial) as well as the Philharmonic Center for the Arts in Naples, Florida. Mr. Lautenbach is also a member of the Board of Trustees of Fairfield University (2005-present), as well as a member of the Council on Foreign Relations. Previously, Mr. Lautenbach served as a Director of Sony Corporation (2006-2007). |
Joseph Mauriello (65) |
| Year of Election or Appointment: 2008 Prior to his retirement in January 2006, Mr. Mauriello served in numerous senior management positions including Deputy Chairman and Chief Operating Officer (2004-2005), and Vice Chairman of Financial Services (2002-2004) of KPMG LLP US (professional services, 1965-2005). Mr. Mauriello currently serves as a member of the Board of Directors of XL Capital Ltd. (global insurance and re-insurance, 2006-present) and of Arcadia Resources Inc. (health care services and products, 2007-
present). Previously, Mr. Mauriello served as a Director of the Hamilton Funds of the Bank of New York (2006-2007). |
Cornelia M. Small (66) |
| Year of Election or Appointment: 2005 Ms. Small is a member of the Board of Directors of the Teagle Foundation (2009-present). Ms. Small is also a member of the Investment Committee, and Chair (2008-present) and a member of the Board of Trustees of Smith College. In addition, Ms. Small serves on the Investment Committee of the Berkshire Taconic Community Foundation (2008-
present). Previously, Ms. Small served as Chairperson of the Investment Committee (2002-2008) of Smith College. In addition, Ms. Small served as Chief Investment Officer, Director of Global Equity Investments, and a member of the Board of Directors of Scudder, Stevens & Clark and Scudder Kemper Investments. |
William S. Stavropoulos (71) |
| Year of Election or Appointment: 2002 Mr. Stavropoulos is Vice Chairman of the Independent Trustees of the Equity and High Income Funds (2006-present). Mr. Stavropoulos serves as President and Founder of the Michigan Baseball Foundation, the Great Lakes Loons (2007-present). Mr. Stavropoulos is Chairman Emeritus of the Board of Directors of The Dow Chemical Company, where he previously served in numerous senior management positions, including President, CEO (1995-2000; 2002-2004), Chairman of the Executive Committee (2000-2006), and as a member of the Board of Directors (1990-2006). Currently, Mr. Stavropoulos is a Director of Teradata Corporation (data warehousing and technology solutions, 2008-present), Chemical Financial Corporation, Maersk Inc. (industrial conglomerate), Tyco International, Inc. (multinational manufacturing and services, 2007-present), and a member of the Advisory Board for Metalmark Capital (private equity investment, 2005-present). Mr. Stavropoulos is a special advisor to Clayton, Dubilier & Rice, Inc. (private equity investment). In addition, Mr. Stavropoulos is a member of the University of Notre Dame Advisory Council for the College of Science. |
David M. Thomas (61) |
| Year of Election or Appointment: 2008 Previously, Mr. Thomas served as Executive Chairman (2005-2006) and Chairman and Chief Executive Officer (2000-2005) of IMS Health, Inc. (pharmaceutical and healthcare information solutions). In addition, Mr. Thomas serves as a member of the Board of Directors of Fortune Brands, Inc. (consumer products), and Interpublic Group of Companies, Inc. (marketing communication, 2004-present). |
Michael E. Wiley (59) |
| Year of Election or Appointment: 2008 Mr. Wiley also serves as a Director of Asia Pacific Exploration Consolidated (international oil and gas exploration and production, 2008-
present), and as a member of the Board of Trustees of the University of Tulsa (2000-2006; 2007-present). Mr. Wiley serves as a Director of Tesoro Corporation (independent oil refiner and marketer, 2005-present), and a Director of Bill Barrett Corporation (exploration and production, 2005-
present). In addition, Mr. Wiley also serves as a Director of Post Oak Bank (privately-held bank, 2004-present). Previously, Mr. Wiley served as a Sr. Energy Advisor of Katzenbach Partners, LLC (consulting, 2006-
2007), as an Advisory Director of Riverstone Holdings (private investment), Chairman, President, and CEO of Baker Hughes, Inc. (oilfield services, 2000-2004), and as Director of Spinnaker Exploration Company (exploration and production, 2001-2005). |
Annual Report
Trustees and Officers - continued
+ The information above includes each Trustee's principal occupation during the last five years and other information relating to the experience, attributes, and skills relevant to each Trustee's qualifications to serve as a Trustee, which led to the conclusion that each Trustee should serve as a Trustee for the fund.
Advisory Board Member and Executive Officers:
Correspondence intended for each executive officer and Peter S. Lynch may be sent to Fidelity Investments, 82 Devonshire Street, Boston, Massachusetts 02109.
Name, Age; Principal Occupation |
Peter S. Lynch (66) |
| Year of Election or Appointment: 2003 Member of the Advisory Board of Fidelity's Equity and High Income Funds. Mr. Lynch is Vice Chairman and a Director of FMR and FMR Co., Inc. In addition, Mr. Lynch serves as a Trustee of Boston College and as the Chairman of the Inner-City Scholarship Fund. Previously, Mr. Lynch served on the Special Olympics International Board of Directors (1997-2006). |
Kenneth B. Robins (40) |
| Year of Election or Appointment: 2008 President and Treasurer of Fidelity's Equity and High Income Funds. Mr. Robins also serves as President and Treasurer (2010-present) and Assistant Treasurer (2009-present) of other Fidelity funds and is an employee of Fidelity Investments (2004-present). Previously, Mr. Robins served as Deputy Treasurer of the Fidelity funds (2005-2008) and Treasurer and Chief Financial Officer of The North Carolina Capital Management Trust: Cash and Term Portfolios (2006-2008). |
Bruce T. Herring (44) |
| Year of Election or Appointment: 2006 Vice President of certain Equity Funds. Mr. Herring also serves as Group Chief Investments Officer of FMR. Previously, Mr. Herring served as a portfolio manager for Fidelity U.S. Equity Funds. |
Brian B. Hogan (45) |
| Year of Election or Appointment: 2009 Vice President of certain Equity Funds and Vice President of Sector Funds. Mr. Hogan also serves as Senior Vice President, Equity Research of FMR (2006-present) and President of FMR's Equity Division (2009-present). Previously, Mr. Hogan served as a portfolio manager. |
Scott C. Goebel (42) |
| Year of Election or Appointment: 2008 Secretary and Chief Legal Officer (CLO) of the Fidelity funds. Mr. Goebel also serves as General Counsel, Secretary, and Senior Vice President of FMR (2008-present) and FMR Co., Inc. (2008-present); Deputy General Counsel of FMR LLC; Chief Legal Officer of Fidelity Management & Research (Hong Kong) Limited (2008-present) and Assistant Secretary of Fidelity Management & Research (Japan) Inc. (2008-present), Fidelity Investments Money Management, Inc. (2008-present), Fidelity Management & Research (U.K.) Inc. (2008-present), and Fidelity Research and Analysis Company (2008-present). Previously, Mr. Goebel served as Assistant Secretary of the Funds (2007-2008) and as Vice President and Secretary of Fidelity Distributors Corporation (FDC) (2005-2007). |
William C. Coffey (41) |
| Year of Election or Appointment: 2009 Assistant Secretary of Fidelity's Equity and High Income Funds. Mr. Coffey also serves as Senior Vice President and Deputy General Counsel of FMR LLC (2010-present), and is an employee of Fidelity Investments. Previously, Mr. Coffey served as Vice President and Associate General Counsel of FMR LLC (2005-2009). |
Holly C. Laurent (56) |
| Year of Election or Appointment: 2008 Anti-Money Laundering (AML) Officer of the Fidelity funds. Ms. Laurent is an employee of Fidelity Investments. Previously, Ms. Laurent was Senior Vice President and Head of Legal for Fidelity Business Services India Pvt. Ltd. (2006-2008), and Senior Vice President, Deputy General Counsel and Group Head for FMR LLC (2005-2006). |
Christine Reynolds (51) |
| Year of Election or Appointment: 2008 Chief Financial Officer of the Fidelity funds. Ms. Reynolds became President of Fidelity Pricing and Cash Management Services (FPCMS) in August 2008. Ms. Reynolds served as Chief Operating Officer of FPCMS (2007-2008). Previously, Ms. Reynolds served as President, Treasurer, and Anti-Money Laundering officer of the Fidelity funds (2004-2007). |
Kenneth A. Rathgeber (63) |
| Year of Election or Appointment: 2004 Chief Compliance Officer of Fidelity's Equity and High Income Funds. Mr. Rathgeber is Chief Compliance Officer of Fidelity Management & Research (Hong Kong) Limited (2008-present), Fidelity Management & Research (Japan) Inc. (2008-present), FMR (2005-present), FMR Co., Inc. (2005-present), Fidelity Management & Research (U.K.) Inc. (2005-present), Fidelity Research & Analysis Company (2005-present), Fidelity Investments Money Management, Inc. (2005-present), Pyramis Global Advisors, LLC (2005-present), and Strategic Advisers, Inc. (2005-present). |
Jeffrey S. Christian (48) |
| Year of Election or Appointment: 2009 Deputy Treasurer of the Fidelity funds. Mr. Christian is an employee of Fidelity Investments. Previously, Mr. Christian served as Chief Financial Officer (2008-2009) of certain Fidelity funds and Senior Vice President of Fidelity Pricing and Cash Management Services (FPCMS) (2004-2009). |
Bryan A. Mehrmann (49) |
| Year of Election or Appointment: 2005 Deputy Treasurer of the Fidelity funds. Mr. Mehrmann is an employee of Fidelity Investments. |
Adrien E. Deberghes (42) |
| Year of Election or Appointment: 2008 Deputy Treasurer of Fidelity's Equity and High Income Funds. Mr. Deberghes also serves as Assistant Treasurer of other Fidelity funds (2010-present) and is an employee of Fidelity Investments (2008-present). Previously, Mr. Deberghes served as Senior Vice President of Mutual Fund Administration at State Street Corporation (2007-2008), Senior Director of Mutual Fund Administration at Investors Bank & Trust (2005-2007), and Director of Finance for Dunkin' Brands (2000-2005). |
Stephanie J. Dorsey (41) |
| Year of Election or Appointment: 2010 Assistant Treasurer of Fidelity's Equity and High Income Funds. Ms. Dorsey also serves as Deputy Treasurer of other Fidelity funds (2008-present) and is an employee of Fidelity Investments (2008-present). Previously, Ms. Dorsey served as Treasurer (2004-2008) of the JPMorgan Mutual Funds and Vice President (2004-2008) of JPMorgan Chase Bank. |
John R. Hebble (52) |
| Year of Election or Appointment: 2009 Assistant Treasurer of Fidelity's Equity and High Income Funds. Mr. Hebble also serves as Treasurer and Chief Financial Officer of The North Carolina Capital Management Trust: Cash and Term Portfolio (2008-present), President and Treasurer of other Fidelity funds (2008-present) and is an employee of Fidelity Investments. |
Gary W. Ryan (51) |
| Year of Election or Appointment: 2005 Assistant Treasurer of the Fidelity funds. Mr. Ryan is an employee of Fidelity Investments. Previously, Mr. Ryan served as Vice President of Fund Reporting in Fidelity Pricing and Cash Management Services (FPCMS) (1999-2005). |
Annual Report
Class K designates 73% of the dividends distributed in September, and 100% of the dividends distributed in December during the fiscal year as qualifying for the dividends-received deduction for corporate shareholders.
The fund designates 100% of the dividends distributed during the fiscal year as amounts which may be taken into account as a dividend for the purposes of the maximum rate under section 1(h)(11) of the Internal Revenue Code.
The fund will notify shareholders in January 2011 of amounts for use in preparing 2010 income tax returns.
Annual Report
Board Approval of Investment Advisory Contracts and Management Fees
Fidelity Leveraged Company Stock Fund
Each year, the Board of Trustees, including the Independent Trustees (together, the Board), votes on the renewal of the management contract and sub-advisory agreements (together, the Advisory Contracts) for the fund. The Board, assisted by the advice of fund counsel and Independent Trustees' counsel, requests and considers a broad range of information relevant to the renewal of the Advisory Contracts throughout the year.
The Board meets regularly and considers at each of its meetings factors that are relevant to its annual consideration of the renewal of the fund's Advisory Contracts, including the services and support provided to the fund and its shareholders. The Board has established various standing committees, each composed of Independent Trustees with varying backgrounds, to which the Board has assigned specific subject matter responsibilities in order to enhance effective decision-making by the Board. The Board, acting directly and through its Committees, requests and receives information concerning the annual consideration of the renewal of the fund's Advisory Contracts. The Board also meets as needed to consider matters specifically related to the Board's annual consideration of the renewal of Advisory Contracts. Members of the Board may also meet with trustees of other Fidelity funds through ad hoc joint committees to discuss certain matters relevant to the Fidelity funds.
At its July 2010 meeting, the Board of Trustees, including the Independent Trustees, unanimously determined to renew the fund's Advisory Contracts. In reaching its determination, the Board considered all factors it believed relevant, including (i) the nature, extent, and quality of the services to be provided to the fund and its shareholders (including the investment performance of the fund); (ii) the competitiveness of the fund's management fee and total expenses; (iii) the total costs of the services to be provided by and the profits to be realized by Fidelity from its relationship with the fund; (iv) the extent to which economies of scale would be realized as the fund grows; and (v) whether fee levels reflect these economies of scale, if any, for the benefit of fund shareholders.
In considering whether to renew the Advisory Contracts for the fund, the Board reached a determination, with the assistance of fund counsel and Independent Trustees' counsel and through the exercise of its business judgment, that the renewal of the Advisory Contracts is in the best interests of fund shareholders and that the compensation to be received by Fidelity under the management contract is fair and reasonable. The Board's decision to renew the Advisory Contracts was not based on any single factor noted above, but rather was based on a comprehensive consideration of all the information provided to the Board at its meetings throughout the year. The Board, in reaching its determination to renew the Advisory Contracts, is aware that shareholders in the fund have a broad range of investment choices available to them, including a wide choice among mutual funds offered by Fidelity's competitors, and that the fund's shareholders, with the opportunity to review and weigh the disclosure provided by the fund in its prospectus and other public disclosures, have chosen to invest in this fund, managed by Fidelity.
Annual Report
Board Approval of Investment Advisory Contracts and
Management Fees - continued
Nature, Extent, and Quality of Services Provided. The Board considered the staffing within the investment adviser, FMR, and the sub-advisers (together, the Investment Advisers), including the backgrounds of the fund's investment personnel and the fund's investment objective and discipline. The Independent Trustees also had discussions with senior management of Fidelity's investment operations and investment groups. The Board considered the structure of the portfolio manager compensation program and whether this structure provides appropriate incentives to act in the best interest of the fund.
Resources Dedicated to Investment Management and Support Services. The Board and the equity research subcommittee of the Board's Fund Oversight Committee reviewed the size, education, and experience of the Investment Advisers' investment staff, their use of technology, and the Investment Advisers' approach to recruiting, training, and retaining portfolio managers and other research, advisory, and management personnel. The Board noted that Fidelity's analysts have access to a variety of technological tools and market and securities data that enable them to perform both fundamental and quantitative analysis and to specialize in various disciplines. The Board considered Fidelity's extensive global research capabilities that enable the Investment Advisers to aggregate data from various sources in an effort to produce positive investment results. The Board also considered that Fidelity's portfolio managers and analysts have access to daily portfolio attribution that allows for monitoring of a fund's portfolio, as well as an electronic communication system that provides immediate real-time access to research concerning issuers and credit enhancers. The Board noted FMR's continued focus on strengthening the organization and discipline of equity portfolio management and research.
Shareholder and Administrative Services. The Board considered (i) the nature, extent, quality, and cost of advisory, administrative, and shareholder services performed by the Investment Advisers and their affiliates under the Advisory Contracts and under separate agreements covering transfer agency, pricing and bookkeeping, and securities lending services for the fund; (ii) the nature and extent of the investment adviser's supervision of third party service providers, principally custodians and subcustodians; and (iii) the resources devoted to, and the record of compliance with, the fund's compliance policies and procedures. The Board also reviewed the allocation of fund brokerage, including allocations to brokers affiliated with the Investment Advisers, the use of brokerage commissions to pay fund expenses, and the use of "soft" commission dollars to pay for research services.
The Board noted that the growth of fund assets over time across the complex allows Fidelity to reinvest in the development of services designed to enhance the value or convenience of the Fidelity funds as investment vehicles. These services include 24-hour access to account information and market information through phone representatives and over the Internet, and investor education materials and asset allocation tools.
Annual Report
Investment in a Large Fund Family. The Board considered the benefits to shareholders of investing in a Fidelity fund, including the benefits of investing in a fund that is part of a large family of funds offering a variety of investment disciplines and providing a large variety of mutual fund investor services. The Board noted that Fidelity had taken, or had made recommendations that resulted in the Fidelity funds taking, a number of actions over the previous year that benefited particular funds, including (i) dedicating additional resources to investment research and restructuring and broadening the focus of the investment research teams; (ii) bolstering the senior management team that oversees asset management; (iii) launching Class F of certain funds as a lower-fee class available to Freedom K and Freedom Index Funds; (iv) lowering the initial investment minimums and ongoing balance requirements for Real Estate High Income Fund; (v) eliminating subsequent purchase minimums for all funds and adding a waiver of the investment minimum requirement for new accounts opened with the proceeds of a systematic withdrawal plan; (vi) eliminating the withdrawal minimum and maximum limits for systematic withdrawals from Advisor funds; (vii) expanding sales load waivers on Class A shares for Destiny Planholders and expanding Institutional Class eligibility for Class O Destiny Planholders; and (viii) changing certain Class A and Class T sales charge structures to further align them with industry practices.
Investment Performance. The Board considered whether the fund has operated in accordance with its investment objective, as well as its record of compliance with its investment restrictions. It also reviewed the fund's absolute investment performance for each class, as well as the fund's relative investment performance for each class measured over multiple periods against (i) a broad-based securities market index, and (ii) a custom peer group of mutual funds deemed appropriate by Fidelity and reviewed by the Board. The following charts considered by the Board show, over the one-, three-, and five-year periods ended December 31, 2009, as available, the cumulative total returns of Class K and the retail class of the fund, the cumulative total returns of a broad-based securities market index ("benchmark"), and a range of cumulative total returns of a custom peer group of mutual funds defined by FMR based on categories assigned by Morningstar, Inc. The box within each chart shows the 25th percentile return (bottom of box) and the 75th percentile return (top of box) of the peer group. Returns shown above the box are in the first quartile and returns shown below the box are in the fourth quartile. The percentage beaten numbers noted below each chart correspond to the percentile box and represent the percentage of funds in the peer group whose performance was equal to or lower than that of the class indicated. The fund's custom peer group, defined by FMR, is a peer group that FMR believes provides a more meaningful performance comparison than the peer group assigned by Morningstar, Inc., which assigns mutual funds to categories based on their investment styles as measured by their underlying portfolio holdings.
Annual Report
Board Approval of Investment Advisory Contracts and
Management Fees - continued
Fidelity Leveraged Company Stock Fund

The Board reviewed the fund's relative investment performance against its peer group and noted that the performance of the retail class of the fund (the class with the longer performance record) was in the first quartile for the one- and five-year periods and the third quartile for the three-year period. The Board also noted that the investment performance of the retail class of the fund compared favorably to its benchmark for all the periods shown. The Board considered that the variations in performance between the fund's classes reflect the variations in class expenses, which result in lower performance for the higher expense class. The Board also reviewed the fund's performance since inception as well as performance in the current year.
Based on its review, and giving particular weight to the nature and quality of the resources dedicated by the Investment Advisers to maintain and improve relative performance and factoring in the unprecedented market events in recent years, the Board concluded that the nature, extent, and quality of investment management and support services and of shareholder and administrative services provided to the fund will benefit the fund's shareholders, particularly in light of the Board's view that the fund's shareholders benefit from investing in a fund that is part of a large family of funds offering a variety of investment disciplines and services.
Competitiveness of Management Fee and Total Fund Expenses. The Board considered the fund's management fee and total expenses compared to "mapped groups" of competitive funds and classes. Fidelity creates "mapped groups" by combining similar Lipper investment objective categories that have comparable management fee characteristics. Combining Lipper investment objective categories aids the Board's management fee and total expense comparisons by broadening the competitive group used for comparison and by reducing the number of universes to which various Fidelity funds are compared.
Annual Report
Management Fee. The Board considered two proprietary management fee comparisons for the 12-month periods shown in the chart below. The group of Lipper funds used by the Board for management fee comparisons is referred to below as the "Total Mapped Group." The Total Mapped Group comparison focuses on a fund's standing relative to the total universe of comparable funds available to investors, in terms of gross management fees before expense reimbursements or caps. "TMG %" represents the percentage of funds in the Total Mapped Group that had management fees that were lower than the fund's. For example, a TMG % of 17% means that 83% of the funds in the Total Mapped Group had higher management fees than the fund. The "Asset-Size Peer Group" (ASPG) comparison focuses on a fund's standing relative to non-Fidelity funds similar in size to the fund within the Total Mapped Group. The ASPG represents at least 15% of the funds in the Total Mapped Group with comparable asset size and management fee characteristics, subject to a minimum of 50 funds (or all funds in the Total Mapped Group if fewer than 50). Additional information, such as the ASPG quartile in which the fund's management fee ranked, is also included in the chart and considered by the Board.
Fidelity Leveraged Company Stock Fund

The Board noted that the fund's management fee ranked below the median of its Total Mapped Group and below the median of its ASPG for 2009.
Annual Report
Board Approval of Investment Advisory Contracts and
Management Fees - continued
Based on its review, the Board concluded that the fund's management fee is fair and reasonable in light of the services that the fund receives and the other factors considered.
Total Expenses. In its review of each class's total expenses, the Board considered the fund's management fee as well as other fund or class expenses, as applicable, such as transfer agent fees, pricing and bookkeeping fees, and custodial, legal, and audit fees. The Board also noted the effects of any waivers and reimbursements on fees and expenses. As part of its review, the Board also considered current and historical total expenses of each class of the fund compared to competitive fund median expenses. Each class of the fund is compared to those funds and classes in the Total Mapped Group (used by the Board for management fee comparisons) that have a similar sales load structure.
The Board noted that the total expenses of each class ranked below its competitive median for 2009.
Fees Charged to Other Fidelity Clients. The Board also considered Fidelity fee structures and other information with respect to clients of FMR and its affiliates, such as other mutual funds advised or subadvised by FMR or its affiliates, pension plan clients, and other institutional clients. In March 2010, the Board created an ad hoc joint committee with the board of other Fidelity funds (the Committee) to review and compare Fidelity's institutional investment advisory business with its business of providing services to the Fidelity funds, including the differences in services provided, fees charged, and costs incurred, as well as competition in their respective marketplaces.
Based on its review of total expenses and fees charged to other Fidelity clients, the Board concluded that the total expenses of each class of the fund were reasonable in light of the services that the fund and its shareholders receive and the other factors considered, including the findings of the Committee.
Costs of the Services and Profitability. The Board considered the revenues earned and the expenses incurred by Fidelity in conducting the business of developing, marketing, distributing, managing, administering and servicing the fund and its shareholders. The Board also considered the level of Fidelity's profits in respect of all the Fidelity funds.
On an annual basis, FMR presents to the Board Fidelity's profitability for the fund. Fidelity calculates the profitability for each fund, as well as aggregate profitability for groups of Fidelity funds and all Fidelity funds, using a series of detailed revenue and cost allocation methodologies which originate with the audited books and records of Fidelity. The Audit Committee of the Board reviews any significant changes from the prior year's methodologies.
Annual Report
PricewaterhouseCoopers LLP (PwC), independent registered public accounting firm and auditor to Fidelity and certain Fidelity funds, has been engaged annually by the Board as part of the Board's assessment of Fidelity's profitability analysis. PwC's engagement includes the review and assessment of Fidelity's methodologies used in determining the revenues and expenses attributable to Fidelity's mutual fund business, and completion of agreed-upon procedures surrounding the mathematical accuracy of fund profitability and its conformity to allocation methodologies. After considering PwC's reports issued under the engagement and information provided by Fidelity, the Board believes that while other allocation methods may also be reasonable, Fidelity's profitability methodologies are reasonable in all material respects.
The Board has also reviewed Fidelity's non-fund businesses and fall-out benefits related to the mutual fund business as well as cases where Fidelity's affiliates may benefit from or be related to the fund's business.
The Board considered the costs of the services provided by and the profits realized by Fidelity in connection with the operation of the fund and were satisfied that the profitability was not excessive in the circumstances.
Economies of Scale. The Board considered whether there have been economies of scale in respect of the management of the Fidelity funds, whether the Fidelity funds (including the fund) have appropriately benefited from any such economies of scale, and whether there is potential for realization of any further economies of scale. The Board considered the extent to which the fund will benefit from economies of scale through increased services to the fund, through waivers or reimbursements, or through fee or expense reductions.
In February 2009, the Board and the board of other Fidelity funds created an ad hoc committee (the Economies of Scale Committee) to analyze whether FMR attains economies of scale in respect of the management and servicing of the Fidelity funds, whether the Fidelity funds have appropriately benefited from such economies of scale, and whether there is potential for realization of any further economies of scale.
The Board recognized that the fund's management contract incorporates a "group fee" structure, which provides for lower group fee rates as total fund assets under FMR's management increase, and for higher group fee rates as total fund assets under FMR's management decrease. FMR calculates the group fee rates based on a tiered asset "breakpoint" schedule that varies based on asset class. The Board considered that the group fee is designed to deliver the benefits of economies of scale to fund shareholders when total Fidelity fund assets increase, even if assets of any particular fund are unchanged or have declined, because some portion of Fidelity's costs are attributable to services provided to all Fidelity funds, and all funds benefit if those costs can be allocated among more assets. The Board concluded that, given the group fee structure, fund shareholders will benefit from lower management fees as assets under FMR's management increase at the fund complex level, regardless of whether Fidelity achieves any such economies of scale.
Annual Report
Board Approval of Investment Advisory Contracts and
Management Fees - continued
The Board concluded, considering the findings of the Economies of Scale Committee, that any potential economies of scale are being appropriately shared between fund shareholders and Fidelity.
Additional Information Requested by the Board. In order to develop fully the factual basis for consideration of the Fidelity funds' Advisory Contracts, the Board requested and received additional information on certain topics, including (i) fund performance trends, actions to be taken by FMR to improve certain funds' overall performance, and Fidelity's long-term strategies for certain funds; (ii) portfolio manager changes that have occurred during the past year and length of portfolio manager tenure for different categories of funds over time; (iii) Fidelity's compensation structure for portfolio managers, research analysts, and other key personnel, the rationale for the compensation structure, and how the compensation structure provides appropriate performance incentives; (iv) the amount of the investment that each portfolio manager has made in the Fidelity fund(s) that he or she manages; (v) management and other fees paid by FMR to affiliated sub-advisers on behalf of the Fidelity funds; (vi) Fidelity's fee structures and rationale for recommending different fees among different categories of funds; (vii) Fidelity's rationale for recommending which funds should have a performance adjustment component as part of their management fees; (viii) the rationale for any differences between fund fee structures and fee structures in place for other Fidelity clients; and (ix) explanations regarding the relative total expenses borne by certain funds and classes, total expense competitive trends, and actions that might be taken by FMR to reduce total expenses for certain funds and classes.
Based on its evaluation of all of the conclusions noted above, and after considering all factors it believed relevant, the Board ultimately concluded that the advisory fee structures are fair and reasonable, and that the fund's Advisory Contracts should be renewed.
Annual Report
Managing Your Investments
Fidelity offers several ways to conveniently manage your workplace benefits (including your workplace savings plan, investments, and additional services) via your telephone or PC. You can access your plan and account information and research your investments 24 hours a day.
By Phone
Fidelity provides a single toll-free number to access plan information, account balances, positions, and quotes*. It's easy to navigate the service, and on your first call, the system will help you create a personal identification number (PIN) for security.
(phone_graphic)
Fidelity Workplace
Investing
1-800-835-5092
By PC
Fidelity's web site on the Internet provides a wide range of information, including plan information, daily financial news, fund performance, interactive planning tools, and news about Fidelity products and services.
(computer_graphic)
Fidelity's Web Site
www.401k.com
* When you call the quotes line, please remember that a fund's yield and return will vary and, except for money market funds, share price will also vary. This means that you may have a gain or loss when you sell your shares. There is no assurance that money market funds will be able to maintain a stable $1 share price; an investment in a money market fund is not insured or guaranteed by the U.S. government. Total returns are historical and include changes in share price, reinvestment of dividends and capital gains, and the effects of any sales charges.
Annual Report
To Write Fidelity
We'll give your correspondence immediate attention and send you written confirmation upon completion of your request.
(letter_graphic)
For Non-Retirement
Accounts
Buying shares
Fidelity Investments
P.O. Box 770001
Cincinnati, OH 45277-0003
Overnight Express
Fidelity Investments
Attn: Distribution Services
100 Crosby Parkway - KC1H
Covington, KY 41015
Selling shares
Fidelity Investments
P.O. Box 770001
Cincinnati, OH 45277-0035
Overnight Express
Fidelity Investments
Attn: Distribution Services
100 Crosby Parkway - KC1H
Covington, KY 41015
General Correspondence
Fidelity Investments
P.O. Box 500
Merrimack, NH 03054-0500
(letter_graphic)
For Retirement
Accounts
Buying shares
Fidelity Investments
P.O. Box 770001
Cincinnati, OH 45277-0003
Selling shares
Fidelity Investments
P.O. Box 770001
Cincinnati, OH 45277-0035
Overnight Express
Fidelity Investments
Attn: Distribution Services
100 Crosby Parkway - KC1H
Covington, KY 41015
General Correspondence
Fidelity Investments
P.O. Box 500
Merrimack, NH 03054-0500
Annual Report
Investment Adviser
Fidelity Management & Research Company
Boston, MA
Investment Sub-Adviser
FMR Co., Inc.
Fidelity Research & Analysis Company
Fidelity Management & Research
(U.K.) Inc.
Fidelity Management & Research
(Hong Kong) Limited
Fidelity Management & Research
(Japan) Inc.
General Distributor
Fidelity Distributors Corporation
Boston, MA
Transfer and Service Agents
Fidelity Investments Institutional
Operations Company, Inc.
Boston, MA
Fidelity Service Company, Inc.
Boston, MA
Custodian
JPMorgan Chase Bank
New York, NY
LSF-K-UANN-0910
1.863381.101
Fidelity®
OTC
Portfolio
Annual Report
July 31, 2010
(2_fidelity_logos) (Registered_Trademark)
Contents
Chairman's Message | <Click Here> | The Chairman's message to shareholders. |
Performance | <Click Here> | How the fund has done over time. |
Management's Discussion of Fund Performance | <Click Here> | The Portfolio Manager's review of fund
performance and strategy. |
Shareholder Expense Example | <Click Here> | An example of shareholder expenses. |
Investment Changes | <Click Here> | A summary of major shifts in the fund's investments over the past six months. |
Investments | <Click Here> | A complete list of the fund's investments with their market values. |
Financial Statements | <Click Here> | Statements of assets and liabilities, operations, and changes in net assets, as well as financial highlights. |
Notes | <Click Here> | Notes to the financial statements. |
Report of Independent Registered Public Accounting Firm | <Click Here> | |
Trustees and Officers | <Click Here> | |
Board Approval of Investment Advisory Contracts and Management Fees | <Click Here> | |
To view a fund's proxy voting guidelines and proxy voting record for the 12-month period ended June 30, visit http://www.fidelity.com/proxyvotingresults or visit the Securities and Exchange Commission's (SEC) web site at http://www.sec.gov. You may also call 1-800-544-8544 to request a free copy of the proxy voting guidelines.
Standard & Poor's, S&P and S&P 500 are registered service marks of The McGraw-Hill Companies, Inc. and have been licensed for use by Fidelity Distributors Corporation.
Other third party marks appearing herein are the property of their respective owners.
All other marks appearing herein are registered or unregistered trademarks or service marks of FMR LLC or an affiliated company.
Annual Report
This report and the financial statements contained herein are submitted for the general information of the shareholders of the fund. This report is not authorized for distribution to prospective investors in the fund unless preceded or accompanied by an effective prospectus.
A fund files its complete schedule of portfolio holdings with the SEC for the first and third quarters of each fiscal year on Form N-Q. Forms N-Q are available on the SEC's web site at http://www.sec.gov. A fund's Forms N-Q may be reviewed and copied at the SEC's Public Reference Room in Washington, DC. Information regarding the operation of the SEC's Public Reference Room may be obtained by calling 1-800-SEC-0330. For a complete list of a fund's portfolio holdings, view the most recent holdings listing, semiannual report, or annual report on Fidelity's web site at http://www.fidelity.com or http://www.advisor.fidelity.com, as applicable.
NOT FDIC INSURED • MAY LOSE VALUE • NO BANK GUARANTEE
Neither the fund nor Fidelity Distributors Corporation is a bank.
Annual Report
(photo_of_Edward_C_Johnson_3d)
Dear Shareholder:
A yearlong uptrend in global equity markets reversed course in late April 2010 when investor sentiment turned bearish due in great measure to concern that Europe's debt crisis would expand and slow or derail economic recovery. However, a bounceback in July helped to recover some of the ground that was lost. Financial markets are always unpredictable, of course, but there also are several time-tested investment principles that can help put the odds in your favor.
One of the basic tenets is to invest for the long term. Over time, riding out the markets' inevitable ups and downs has proven much more effective than selling into panic or chasing the hottest trend. Even missing only a few of the markets' best days can significantly diminish investor returns. Patience also affords the benefits of compounding - of earning interest on additional income or reinvested dividends and capital gains. There can be tax advantages and cost benefits to consider as well. While staying the course doesn't eliminate risk, it can considerably lessen the effect of short-term declines.
You can further manage your investing risk through diversification. And today, more than ever, geographic diversification should be taken into account. Studies indicate that asset allocation is the single most important determinant of a portfolio's long-term success. The right mix of stocks, bonds and cash - aligned to your particular risk tolerance and investment objective - is very important. Age-appropriate rebalancing is also an essential aspect of asset allocation. For younger investors, an emphasis on equities - which historically have been the best-performing asset class over time - is encouraged. As investors near their specific goal, such as retirement or sending a child to college, consideration may be given to replacing volatile assets (e.g. common stocks) with more-stable fixed investments (bonds or savings plans).
A third principle - investing regularly - can help lower the average cost of your purchases. Investing a certain amount of money each month or quarter helps ensure you won't pay for all your shares at market highs. This strategy - known as dollar cost averaging - also reduces "emotion" from investing, helping shareholders avoid selling weak performers just prior to an upswing, or chasing a hot performer just before a correction.
We invite you to contact us via the Internet, through our Investor Centers or by phone. It is our privilege to provide you the information you need to make the investments that are right for you.
Sincerely,
(The chairman's signature appears here.)
Edward C. Johnson 3d
Annual Report
Average annual total return reflects the change in the value of an investment, assuming reinvestment of the class' distributions from dividend income and capital gains (the profits earned upon the sale of securities that have grown in value, if any) and assuming a constant rate of performance each year. The $10,000 table and the fund's returns do not reflect the deduction of taxes that a shareholder would pay on fund distributions or the redemption of fund shares. During periods of reimbursement by Fidelity, a fund's total return will be greater than it would be had the reimbursement not occurred. How a fund did yesterday is no guarantee of how it will do tomorrow.
Average Annual Total Returns
Periods ended July 31, 2010 | Past 1
year | Past 5
years | Past 10
years |
Fidelity® OTC Portfolio | 16.19% | 4.57% | -2.32% |
$10,000 Over 10 Years
Let's say hypothetically that $10,000 was invested in Fidelity® OTC Portfolio, a class of the fund, on July 31, 2000. The chart shows how the value of your investment would have changed, and also shows how the Nasdaq Composite® Index performed over the same period.
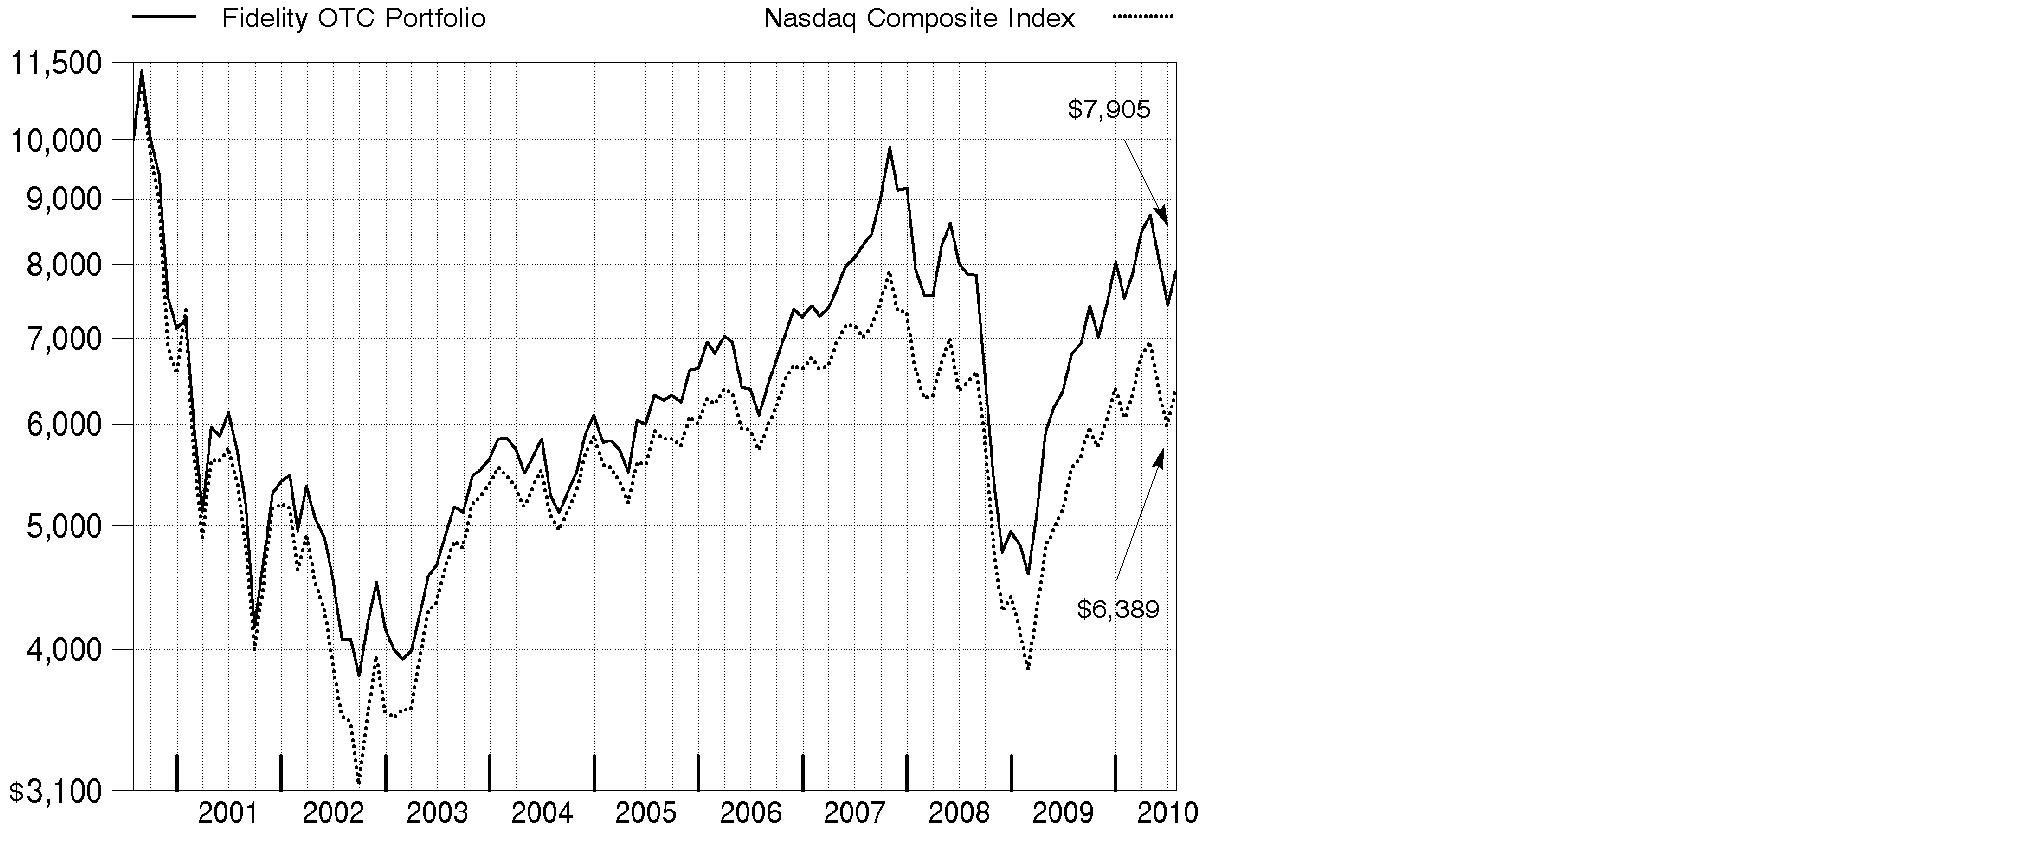
Annual Report
Market Recap: U.S. stock markets saw double-digit gains for the year ending July 31, 2010, despite the return of market volatility and risk aversion during the first half of 2010. An impressive bull run continued through 2009, bolstered by improvement in the economy and credit markets. Early in the new year, however, stocks fell sharply amid concerns about the global economic recovery, fueled by European debt woes and China's efforts to restrain inflation. After this brief dip, markets regained their upward momentum, as government stimulus and significant corporate cost cutting led to encouraging earnings reports, improved credit conditions and rising consumer confidence. Positive news continued through mid-April, when the Dow Jones Industrial AverageSM pushed above the 11,000 mark for the first time in 19 months. That milestone was short-lived, however, as heightened concern about the European debt crisis sparked an abrupt sell-off in May, leading to the first official correction since the rally began in March 2009. Although the market's malaise continued through June, stocks saw solid gains in July. For the year, the Dow rose 17.28%, while the S&P 500® Index was up 13.84%. Elsewhere, the technology-laden Nasdaq Composite® Index returned 15.05%. Small- and mid-cap stocks performed best, as measured by the 18.43% increase of the Russell 2000® Index and the 23.21% gain of the Russell Midcap® Index.
Comments from Gavin Baker, Portfolio Manager of Fidelity® OTC Portfolio: During the past year, the fund's Retail Class shares returned 16.19%, topping the Nasdaq Composite Index. Versus the index, stock picking in the transportation segment of industrials helped, as did security selection in consumer discretionary, financials and health care. At the stock level, UAL, parent company of United Airlines, was the fund's top relative contributor, with our holdings in the stock more than tripling in price. Other contributors included wireless carrier Sprint Nextel - a large out-of-index position - Starent Networks, a provider of equipment to manage mobile data, which was acquired in December; yoga-inspired women's apparel retailer lululemon athletica; and computer/consumer electronics maker Apple, by far the fund's largest holding at period end. Underweighting biotech company Gilead Sciences also bolstered results. Conversely, my picks in information technology and energy hurt. The largest relative detractor was smart phone manufacturer Palm, which had good products but suffered from operational miscues and undercapitalization, and was acquired in July. Graphics chip producer NVIDIA, China-based online game provider Perfect World and solar power components makers First Solar and MEMC Electronic Materials - the latter of which I sold - also detracted.
The views expressed above reflect those of the portfolio manager(s) only through the end of the period as stated on the cover of this report and do not necessarily represent the views of Fidelity or any other person in the Fidelity organization. Any such views are subject to change at any time based upon market or other conditions and Fidelity disclaims any responsibility to update such views. These views may not be relied on as investment advice and, because investment decisions for a Fidelity fund are based on numerous factors, may not be relied on as an indication of trading intent on behalf of any Fidelity fund.
Annual Report
Shareholder Expense Example
As a shareholder of the Fund, you incur two types of costs: (1) transaction costs, and (2) ongoing costs, including management fees and other Fund expenses. This Example is intended to help you understand your ongoing costs (in dollars) of investing in the Fund and to compare these costs with the ongoing costs of investing in other mutual funds.
The Example is based on an investment of $1,000 invested at the beginning of the period and held for the entire period (February 1, 2010 to July 31, 2010).
Actual Expenses
The first line of the accompanying table for each class of the Fund provides information about actual account values and actual expenses. You may use the information in this line, together with the amount you invested, to estimate the expenses that you paid over the period. Simply divide your account value by $1,000.00 (for example, an $8,600 account value divided by $1,000.00 = 8.6), then multiply the result by the number in the first line for a class of the Fund under the heading entitled "Expenses Paid During Period" to estimate the expenses you paid on your account during this period. A small balance maintenance fee of $12.00 that is charged once a year may apply for certain accounts with a value of less than $2,000. This fee is not included in the table below. If it was, the estimate of expenses you paid during the period would be higher, and your ending account value lower, by this amount. In addition, the Fund, as a shareholder in the underlying Fidelity Central Funds, will indirectly bear its pro-rata share of the fees and expenses incurred by the underlying Fidelity Central Funds. These fees and expenses are not included in the Fund's annualized expense ratio used to calculate the expense estimate in the table below.
Hypothetical Example for Comparison Purposes
The second line of the accompanying table for each class of the Fund provides information about hypothetical account values and hypothetical expenses based on a Class' actual expense ratio and an assumed rate of return of 5% per year before expenses, which is not the Class' actual return. The hypothetical account values and expenses may not be used to estimate the actual ending account balance or expenses you paid for the period. You may use this information to compare the ongoing costs of investing in the Fund and other funds. To do so, compare this 5% hypothetical example with the 5% hypothetical examples that appear in the shareholder reports of the other funds. A small balance maintenance fee of $12.00 that is charged once a year may apply for certain accounts with a value of less than $2,000. This fee is not included in the table below. If it was, the estimate of expenses you paid during the period would be higher, and your ending account value lower, by this amount. In addition, the Fund, as a shareholder in the underlying Fidelity Central Funds, will indirectly bear its pro-rata share of the fees and expenses incurred by the underlying Fidelity Central Funds. These fees and expenses are not included in the Fund's annualized expense ratio used to calculate the expense estimate in the table below.
Please note that the expenses shown in the table are meant to highlight your ongoing costs only and do not reflect any transaction costs. Therefore, the second line of the table is useful in comparing ongoing costs only, and will not help you determine the relative total costs of owning different funds.
Annual Report
Shareholder Expense Example - continued
| Annualized Expense Ratio | Beginning
Account Value
February 1, 2010 | Ending
Account Value
July 31, 2010 | Expenses Paid
During Period*
February 1, 2010
to July 31, 2010 |
OTC | 1.02% | | | |
Actual | | $ 1,000.00 | $ 1,050.70 | $ 5.19 |
HypotheticalA | | $ 1,000.00 | $ 1,019.74 | $ 5.11 |
Class K | .88% | | | |
Actual | | $ 1,000.00 | $ 1,051.40 | $ 4.48 |
HypotheticalA | | $ 1,000.00 | $ 1,020.43 | $ 4.41 |
A 5% return per year before expenses
* Expenses are equal to each Class' annualized expense ratio, multiplied by the average account value over the period, multiplied by 181/365 (to reflect the one-half year period).
Annual Report
Investment Changes (Unaudited)
Top Ten Stocks as of July 31, 2010 |
| % of fund's
net assets | % of fund's net assets
6 months ago |
Apple, Inc. | 8.4 | 6.3 |
Microsoft Corp. | 4.8 | 8.1 |
Google, Inc. Class A | 4.6 | 4.7 |
Cisco Systems, Inc. | 3.7 | 1.3 |
Sprint Nextel Corp. | 3.3 | 2.5 |
Oracle Corp. | 3.2 | 3.4 |
QUALCOMM, Inc. | 2.4 | 2.5 |
Rackspace Hosting, Inc. | 2.4 | 0.2 |
Amazon.com, Inc. | 1.9 | 1.8 |
NVIDIA Corp. | 1.9 | 2.3 |
| 36.6 | |
Top Five Market Sectors as of July 31, 2010 |
| % of fund's
net assets | % of fund's net assets
6 months ago |
Information Technology | 53.6 | 50.1 |
Health Care | 13.5 | 17.0 |
Consumer Discretionary | 11.2 | 11.1 |
Financials | 7.8 | 8.5 |
Industrials | 5.6 | 5.6 |
Asset Allocation (% of fund's net assets) |
As of July 31, 2010 * | As of January 31, 2010 ** |
| Stocks 100.3% | | | Stocks 99.7% | |
 | Short-Term
Investments and
Net Other Assets † (0.3)% | | | Short-Term
Investments and
Net Other Assets 0.3% | |
* Foreign investments | 10.6% | | ** Foreign investments | 10.4% | |

† Short-Term Investments and Net Other Assets are not included in the pie chart. |
Annual Report
Investments July 31, 2010
Showing Percentage of Net Assets
Common Stocks - 100.3% |
| Shares | | Value (000s) |
CONSUMER DISCRETIONARY - 11.2% |
Automobiles - 0.2% |
Bayerische Motoren Werke AG (BMW) ADR | 518,800 | | $ 9,302 |
Diversified Consumer Services - 0.8% |
Coinstar, Inc. (a) | 264,600 | | 12,039 |
Strayer Education, Inc. (d) | 156,203 | | 37,395 |
| | 49,434 |
Hotels, Restaurants & Leisure - 1.4% |
BJ's Restaurants, Inc. (a) | 569,500 | | 14,522 |
Ctrip.com International Ltd. sponsored ADR (a) | 175,000 | | 7,046 |
Starbucks Corp. | 1,680,000 | | 41,748 |
Wyndham Worldwide Corp. | 335,400 | | 8,563 |
Wynn Resorts Ltd. | 148,400 | | 13,012 |
| | 84,891 |
Household Durables - 0.9% |
iRobot Corp. (a)(d)(e) | 1,688,286 | | 34,374 |
Lennar Corp. Class A | 231,900 | | 3,425 |
Pulte Group, Inc. (a) | 598,300 | | 5,253 |
Techtronic Industries Co. Ltd. | 14,996,500 | | 12,376 |
| | 55,428 |
Internet & Catalog Retail - 2.6% |
Amazon.com, Inc. (a) | 978,600 | | 115,367 |
Expedia, Inc. | 598,200 | | 13,567 |
Netflix, Inc. (a) | 250,500 | | 25,689 |
| | 154,623 |
Media - 1.9% |
Comcast Corp. Class A | 2,109,900 | | 41,080 |
DIRECTV (a) | 936,700 | | 34,808 |
Discovery Communications, Inc. (a) | 208,000 | | 8,031 |
Lamar Advertising Co. Class A (a) | 829,600 | | 22,690 |
Liberty Global, Inc. Class A (a)(d) | 351,800 | | 10,290 |
| | 116,899 |
Specialty Retail - 1.9% |
Bed Bath & Beyond, Inc. (a) | 1,174,300 | | 44,482 |
Citi Trends, Inc. (a) | 564,437 | | 17,718 |
Coldwater Creek, Inc. (a)(d) | 1,949,900 | | 7,644 |
O'Reilly Automotive, Inc. (a) | 408,700 | | 20,141 |
Staples, Inc. | 454,700 | | 9,244 |
Common Stocks - continued |
| Shares | | Value (000s) |
CONSUMER DISCRETIONARY - continued |
Specialty Retail - continued |
Ulta Salon, Cosmetics & Fragrance, Inc. (a) | 224,900 | | $ 5,681 |
Urban Outfitters, Inc. (a) | 369,900 | | 11,896 |
| | 116,806 |
Textiles, Apparel & Luxury Goods - 1.5% |
Deckers Outdoor Corp. (a) | 769,300 | | 39,150 |
lululemon athletica, Inc. (a)(d) | 826,473 | | 34,282 |
Polo Ralph Lauren Corp. Class A | 186,600 | | 14,743 |
| | 88,175 |
TOTAL CONSUMER DISCRETIONARY | | 675,558 |
CONSUMER STAPLES - 0.5% |
Beverages - 0.1% |
Hansen Natural Corp. (a) | 139,400 | | 5,839 |
Food & Staples Retailing - 0.4% |
Whole Foods Market, Inc. (a) | 629,400 | | 23,898 |
TOTAL CONSUMER STAPLES | | 29,737 |
ENERGY - 1.8% |
Energy Equipment & Services - 1.4% |
Baker Hughes, Inc. | 170,300 | | 8,220 |
ION Geophysical Corp. (a) | 3,241,700 | | 14,231 |
Oceaneering International, Inc. (a) | 128,900 | | 6,378 |
Schlumberger Ltd. | 395,400 | | 23,590 |
T-3 Energy Services, Inc. (a) | 639,200 | | 16,210 |
Weatherford International Ltd. (a) | 978,900 | | 15,858 |
| | 84,487 |
Oil, Gas & Consumable Fuels - 0.4% |
Carrizo Oil & Gas, Inc. (a) | 678,600 | | 13,307 |
Massey Energy Co. | 233,000 | | 7,125 |
Rosetta Resources, Inc. (a) | 144,600 | | 3,191 |
| | 23,623 |
TOTAL ENERGY | | 108,110 |
FINANCIALS - 7.8% |
Commercial Banks - 5.0% |
Associated Banc-Corp. | 2,125,900 | | 28,891 |
Banco Santander SA sponsored ADR | 843,300 | | 10,769 |
Common Stocks - continued |
| Shares | | Value (000s) |
FINANCIALS - continued |
Commercial Banks - continued |
CVB Financial Corp. (d) | 628,500 | | $ 6,398 |
FirstMerit Corp. | 1,075,500 | | 21,198 |
Fulton Financial Corp. | 121,300 | | 1,105 |
Huntington Bancshares, Inc. | 7,826,500 | | 47,429 |
National Penn Bancshares, Inc. | 1,094,600 | | 7,290 |
Popular, Inc. (a) | 3,821,800 | | 10,969 |
Regions Financial Corp. | 1,587,600 | | 11,637 |
Susquehanna Bancshares, Inc., Pennsylvania | 144,100 | | 1,246 |
SVB Financial Group (a) | 376,700 | | 16,270 |
Wells Fargo & Co. | 3,461,200 | | 95,979 |
Zions Bancorporation | 1,792,900 | | 39,784 |
| | 298,965 |
Diversified Financial Services - 1.7% |
Citigroup, Inc. (a) | 16,050,700 | | 65,808 |
CME Group, Inc. | 88,500 | | 24,674 |
JPMorgan Chase & Co. | 269,300 | | 10,847 |
NBH Holdings Corp. Class A (a)(f) | 110,800 | | 2,161 |
| | 103,490 |
Insurance - 0.5% |
CNinsure, Inc. ADR (d) | 507,200 | | 11,960 |
Genworth Financial, Inc. Class A (a) | 1,000,000 | | 13,580 |
Protective Life Corp. | 284,700 | | 6,403 |
| | 31,943 |
Thrifts & Mortgage Finance - 0.6% |
First Niagara Financial Group, Inc. | 1,280,500 | | 17,172 |
The PMI Group, Inc. (a) | 749,300 | | 2,345 |
Washington Federal, Inc. | 965,870 | | 16,806 |
| | 36,323 |
TOTAL FINANCIALS | | 470,721 |
HEALTH CARE - 13.5% |
Biotechnology - 8.2% |
Alexion Pharmaceuticals, Inc. (a) | 817,860 | | 44,459 |
Allos Therapeutics, Inc. (a)(d) | 1,542,800 | | 7,436 |
Alnylam Pharmaceuticals, Inc. (a) | 574,300 | | 8,816 |
Amgen, Inc. (a) | 1,269,300 | | 69,215 |
Amylin Pharmaceuticals, Inc. (a) | 1,544,809 | | 29,228 |
ARIAD Pharmaceuticals, Inc. (a) | 2,536,300 | | 8,116 |
Common Stocks - continued |
| Shares | | Value (000s) |
HEALTH CARE - continued |
Biotechnology - continued |
BioMarin Pharmaceutical, Inc. (a) | 728,600 | | $ 15,920 |
Cephalon, Inc. (a) | 129,900 | | 7,372 |
Cepheid, Inc. (a) | 678,900 | | 11,236 |
Dendreon Corp. (a) | 1,283,600 | | 42,243 |
Genzyme Corp. (a) | 709,100 | | 49,325 |
Gilead Sciences, Inc. (a) | 1,164,600 | | 38,804 |
Human Genome Sciences, Inc. (a) | 2,523,612 | | 65,462 |
ImmunoGen, Inc. (a) | 297,309 | | 2,804 |
Inhibitex, Inc. (a)(d) | 2,000,000 | | 3,780 |
InterMune, Inc. (a) | 528,037 | | 5,154 |
Isis Pharmaceuticals, Inc. (a) | 1,523,949 | | 15,072 |
NPS Pharmaceuticals, Inc. (a) | 1,127,600 | | 7,803 |
OREXIGEN Therapeutics, Inc. (a)(d) | 1,970,400 | | 10,246 |
Pharmasset, Inc. (a) | 179,000 | | 4,835 |
Seattle Genetics, Inc. (a) | 1,465,403 | | 17,849 |
Targacept, Inc. (a) | 226,549 | | 4,900 |
Vertex Pharmaceuticals, Inc. (a) | 713,988 | | 24,033 |
| | 494,108 |
Health Care Equipment & Supplies - 2.7% |
Abiomed, Inc. (a)(d) | 1,512,372 | | 16,772 |
AGA Medical Holdings, Inc. | 318,300 | | 4,612 |
Alphatec Holdings, Inc. (a)(e) | 5,168,467 | | 21,863 |
Mako Surgical Corp. (a)(d) | 1,184,063 | | 12,989 |
Masimo Corp. | 557,600 | | 12,869 |
NuVasive, Inc. (a) | 591,000 | | 19,367 |
Thoratec Corp. (a) | 1,926,815 | | 70,868 |
| | 159,340 |
Health Care Providers & Services - 0.0% |
Accretive Health, Inc. | 77,300 | | 919 |
Health Care Technology - 0.4% |
athenahealth, Inc. (a)(d) | 373,800 | | 10,380 |
SXC Health Solutions Corp. (a) | 224,200 | | 15,363 |
| | 25,743 |
Life Sciences Tools & Services - 1.5% |
Illumina, Inc. (a) | 1,177,192 | | 52,774 |
Illumina, Inc.: | | | |
warrants 11/20/10 (a)(g) | 709,552 | | 8,290 |
Common Stocks - continued |
| Shares | | Value (000s) |
HEALTH CARE - continued |
Life Sciences Tools & Services - continued |
Illumina, Inc.: - continued | | | |
warrants 1/19/11 (a)(g) | 905,834 | | $ 10,586 |
QIAGEN NV (a) | 833,400 | | 15,601 |
| | 87,251 |
Pharmaceuticals - 0.7% |
Elan Corp. PLC sponsored ADR (a) | 1,562,051 | | 7,451 |
Teva Pharmaceutical Industries Ltd. sponsored ADR | 732,373 | | 35,776 |
| | 43,227 |
TOTAL HEALTH CARE | | 810,588 |
INDUSTRIALS - 5.6% |
Aerospace & Defense - 0.5% |
AeroVironment, Inc. (a)(d) | 570,051 | | 13,630 |
BE Aerospace, Inc. (a) | 299,300 | | 8,799 |
Precision Castparts Corp. | 81,300 | | 9,934 |
| | 32,363 |
Air Freight & Logistics - 0.4% |
C.H. Robinson Worldwide, Inc. | 355,200 | | 23,159 |
Airlines - 2.2% |
Continental Airlines, Inc. Class B (a) | 1,012,684 | | 25,337 |
Delta Air Lines, Inc. (a) | 2,276,600 | | 27,046 |
UAL Corp. (a)(d) | 3,355,200 | | 79,652 |
| | 132,035 |
Construction & Engineering - 0.8% |
Fluor Corp. | 201,400 | | 9,726 |
Foster Wheeler AG (a) | 1,081,900 | | 24,905 |
Jacobs Engineering Group, Inc. (a) | 392,800 | | 14,365 |
| | 48,996 |
Electrical Equipment - 0.1% |
Fushi Copperweld, Inc. (a) | 742,900 | | 6,285 |
Machinery - 1.2% |
Altra Holdings, Inc. (a) | 387,800 | | 5,623 |
Bucyrus International, Inc. Class A | 455,500 | | 28,341 |
PACCAR, Inc. | 829,999 | | 38,031 |
| | 71,995 |
Road & Rail - 0.1% |
Saia, Inc. (a) | 300,000 | | 4,530 |
Common Stocks - continued |
| Shares | | Value (000s) |
INDUSTRIALS - continued |
Trading Companies & Distributors - 0.3% |
DXP Enterprises, Inc. (a) | 312,715 | | $ 6,420 |
Interline Brands, Inc. (a) | 409,400 | | 7,406 |
Rush Enterprises, Inc. Class A (a) | 258,100 | | 3,856 |
| | 17,682 |
TOTAL INDUSTRIALS | | 337,045 |
INFORMATION TECHNOLOGY - 53.6% |
Communications Equipment - 8.0% |
Acme Packet, Inc. (a) | 279,300 | | 7,893 |
Cisco Systems, Inc. (a) | 9,624,500 | | 222,037 |
QUALCOMM, Inc. | 3,824,500 | | 145,637 |
Research In Motion Ltd. (a) | 1,057,000 | | 60,809 |
Riverbed Technology, Inc. (a) | 972,750 | | 36,079 |
ViaSat, Inc. (a) | 239,200 | | 8,645 |
| | 481,100 |
Computers & Peripherals - 10.8% |
Apple, Inc. (a) | 1,967,900 | | 506,240 |
Hewlett-Packard Co. | 317,300 | | 14,608 |
HTC Corp. | 1,177,850 | | 21,651 |
Isilon Systems, Inc. (a) | 1,275,983 | | 22,381 |
NetApp, Inc. (a) | 1,487,900 | | 62,938 |
SanDisk Corp. (a) | 465,950 | | 20,362 |
Seagate Technology (a) | 202,500 | | 2,541 |
| | 650,721 |
Electronic Equipment & Components - 0.5% |
FLIR Systems, Inc. (a) | 925,100 | | 27,531 |
Prime View International Co. Ltd. sponsored GDR (a)(f) | 44,300 | | 643 |
| | 28,174 |
Internet Software & Services - 8.6% |
eBay, Inc. (a) | 3,217,600 | | 67,280 |
Google, Inc. Class A (a) | 565,681 | | 274,270 |
LogMeIn, Inc. | 806,653 | | 22,990 |
Monster Worldwide, Inc. (a) | 231,100 | | 3,171 |
OpenTable, Inc. (a) | 135,800 | | 6,070 |
Rackspace Hosting, Inc. (a)(d)(e) | 7,614,300 | | 142,387 |
| | 516,168 |
IT Services - 2.2% |
Cognizant Technology Solutions Corp. Class A (a) | 1,498,845 | | 81,777 |
Common Stocks - continued |
| Shares | | Value (000s) |
INFORMATION TECHNOLOGY - continued |
IT Services - continued |
Echo Global Logistics, Inc. (d) | 242,900 | | $ 2,905 |
hiSoft Technology International Ltd. ADR (a) | 416,300 | | 4,996 |
iGate Corp. | 883,762 | | 15,687 |
MasterCard, Inc. Class A | 68,800 | | 14,451 |
Visa, Inc. Class A | 166,600 | | 12,220 |
| | 132,036 |
Semiconductors & Semiconductor Equipment - 8.5% |
Advanced Micro Devices, Inc. (a)(d) | 6,634,400 | | 49,692 |
Amkor Technology, Inc. (a)(d) | 1,614,027 | | 9,313 |
ASML Holding NV | 1,087,100 | | 34,994 |
Cree, Inc. (a) | 173,900 | | 12,319 |
Cypress Semiconductor Corp. (a) | 803,050 | | 8,512 |
First Solar, Inc. (a)(d) | 158,036 | | 19,826 |
Intel Corp. | 3,006,900 | | 61,942 |
Lam Research Corp. (a) | 1,180,500 | | 49,805 |
Marvell Technology Group Ltd. (a) | 2,755,300 | | 41,109 |
Mellanox Technologies Ltd. (a) | 1,234,551 | | 20,568 |
Micron Technology, Inc. (a) | 3,758,400 | | 27,361 |
Monolithic Power Systems, Inc. (a) | 761,400 | | 13,416 |
NVIDIA Corp. (a) | 12,415,981 | | 114,103 |
Standard Microsystems Corp. (a) | 400,400 | | 8,817 |
Varian Semiconductor Equipment Associates, Inc. (a) | 454,449 | | 12,843 |
Volterra Semiconductor Corp. (a) | 1,261,000 | | 28,398 |
| | 513,018 |
Software - 15.0% |
Adobe Systems, Inc. (a) | 1,061,500 | | 30,486 |
ArcSight, Inc. (a) | 497,712 | | 12,448 |
Ariba, Inc. (a) | 1,350,596 | | 21,569 |
Autonomy Corp. PLC (a) | 846,800 | | 21,678 |
Blackboard, Inc. (a)(d) | 322,300 | | 12,238 |
BMC Software, Inc. (a) | 150,200 | | 5,344 |
Check Point Software Technologies Ltd. (a) | 1,371,800 | | 46,669 |
Concur Technologies, Inc. (a) | 468,100 | | 21,664 |
DemandTec, Inc. (a)(d) | 1,093,333 | | 7,358 |
Fortinet, Inc. (d) | 928,200 | | 16,717 |
Gameloft (a)(e) | 7,439,224 | | 36,748 |
Informatica Corp. (a) | 316,000 | | 9,521 |
Microsoft Corp. | 11,204,700 | | 289,193 |
NCsoft Corp. | 12,542 | | 1,994 |
Oracle Corp. | 8,187,200 | | 193,545 |
Common Stocks - continued |
| Shares | | Value (000s) |
INFORMATION TECHNOLOGY - continued |
Software - continued |
Pegasystems, Inc. (d) | 422,800 | | $ 13,005 |
Perfect World Co. Ltd. sponsored ADR Class B (a)(d) | 4,389,629 | | 102,542 |
QLIK Technologies, Inc. | 21,500 | | 309 |
SuccessFactors, Inc. (a) | 743,907 | | 15,109 |
Taleo Corp. Class A (a) | 1,416,922 | | 34,856 |
TiVo, Inc. (a) | 1,455,675 | | 12,490 |
| | 905,483 |
TOTAL INFORMATION TECHNOLOGY | | 3,226,700 |
MATERIALS - 1.9% |
Chemicals - 1.9% |
Celanese Corp. Class A | 179,000 | | 5,028 |
CF Industries Holdings, Inc. | 158,600 | | 12,877 |
Dow Chemical Co. | 1,724,100 | | 47,120 |
LyondellBasell Industries NV Class A (a) | 1,066,000 | | 19,188 |
Monsanto Co. | 400,400 | | 23,159 |
Solutia, Inc. (a) | 335,589 | | 4,735 |
| | 112,107 |
TELECOMMUNICATION SERVICES - 4.4% |
Diversified Telecommunication Services - 0.6% |
Cbeyond, Inc. (a) | 468,590 | | 7,137 |
Global Crossing Ltd. (a) | 2,495,900 | | 28,878 |
| | 36,015 |
Wireless Telecommunication Services - 3.8% |
Clearwire Corp. Class A (a)(d) | 4,597,125 | | 32,088 |
Sprint Nextel Corp. (a) | 43,291,456 | | 197,842 |
| | 229,930 |
TOTAL TELECOMMUNICATION SERVICES | | 265,945 |
TOTAL COMMON STOCKS (Cost $6,011,434) | 6,036,511 |
Money Market Funds - 3.8% |
| | | |
Fidelity Securities Lending Cash Central Fund, 0.27% (b)(c)
(Cost $228,193) | 228,192,564 | | 228,193 |
Cash Equivalents - 0.2% |
| Maturity Amount (000s) | | Value (000s) |
Investments in repurchase agreements in a joint trading account at 0.21%, dated 7/30/10 due 8/2/10 (Collateralized by U.S. Government Obligations) #
(Cost $11,095) | $ 11,095 | | $ 11,095 |
TOTAL INVESTMENT PORTFOLIO - 104.3% (Cost $6,250,722) | | 6,275,799 |
NET OTHER ASSETS (LIABILITIES) - (4.3)% | | (259,403) |
NET ASSETS - 100% | $ 6,016,396 |
Legend |
(a) Non-income producing |
(b) Affiliated fund that is available only to investment companies and other accounts managed by Fidelity Investments. The rate quoted is the annualized seven-day yield of the fund at period end. A complete unaudited listing of the fund's holdings as of its most recent quarter end is available upon request. |
(c) Investment made with cash collateral received from securities on loan. |
(d) Security or a portion of the security is on loan at period end. |
(e) Affiliated company |
(f) Security exempt from registration under Rule 144A of the Securities Act of 1933. These securities may be resold in transactions exempt from registration, normally to qualified institutional buyers. At the end of the period, the value of these securities amounted to $2,804,000 or 0.0% of net assets. |
(g) Restricted securities - Investment in securities not registered under the Securities Act of 1933 (excluding 144A issues). At the end of the period, the value of restricted securities (excluding 144A issues) amounted to $18,876,000 or 0.3% of net assets. |
Additional information on each holding is as follows: |
Security | Acquisition Date | Acquisition Cost (000s) |
Illumina, Inc. warrants 11/20/10 | 11/21/05 | $ - |
Illumina, Inc. warrants 1/19/11 | 1/18/06 | $ - |
# Additional information on each counterparty to the repurchase agreement is as follows: |
Repurchase Agreement / Counterparty | Value
(000s) |
$11,095,000 due 8/02/10 at 0.21% |
BNP Paribas Securities Corp. | $ 4,433 |
Banc of America Securities LLC | 1,677 |
Barclays Capital, Inc. | 4,985 |
| $ 11,095 |
Affiliated Central Funds |
Information regarding fiscal year to date income earned by the Fund from investments in Fidelity Central Funds is as follows: |
Fund | Income earned
(Amounts in thousands) |
Fidelity Cash Central Fund | $ 36 |
Fidelity Securities Lending Cash Central Fund | 1,676 |
Total | $ 1,712 |
Other Affiliated Issuers |
An affiliated company is a company in which the fund has ownership of at least 5% of the voting securities. Fiscal year to date transactions with companies which are or were affiliates are as follows: |
Affiliate
(Amounts in thousands) | Value, beginning of period | Purchases | Sales Proceeds | Dividend Income | Value,
end of
period |
Abiomed, Inc. | $ 7,555 | $ 15,198 | $ 9,435 | $ - | $ - |
AeroVironment, Inc. | - | 53,295 | 30,372 | - | - |
Alphatec Holdings, Inc. | - | 28,809 | 108 | - | 21,863 |
Citi Trends, Inc. | 18,823 | 15,921 | 18,783 | - | - |
Gameloft | 23,134 | 9,008 | 1,102 | - | 36,748 |
iRobot Corp. | - | 22,455 | 1,013 | - | 34,374 |
Rackspace Hosting, Inc. | - | 146,593 | 13,066 | - | 142,387 |
Volterra Semiconductor Corp. | 20,371 | 1,413 | 1,428 | - | - |
Total | $ 69,883 | $ 292,692 | $ 75,307 | $ - | $ 235,372 |
Other Information |
The following is a summary of the inputs used, as of July 31, 2010, involving the Fund's assets and liabilities carried at fair value. The inputs or methodology used for valuing securities may not be an indication of the risk associated with investing in those securities. For more information on valuation inputs, and their aggregation into the levels used in the tables below, please refer to the Security Valuation section in the accompanying Notes to Financial Statements. |
Valuation Inputs at Reporting Date: |
Description
(Amounts in thousands) | Total | Level 1 | Level 2 | Level 3 |
Investments in Securities: | | | | |
Equities: | | | | |
Consumer Discretionary | $ 675,558 | $ 675,558 | $ - | $ - |
Consumer Staples | 29,737 | 29,737 | - | - |
Energy | 108,110 | 108,110 | - | - |
Financials | 470,721 | 468,560 | - | 2,161 |
Health Care | 810,588 | 791,712 | 18,876 | - |
Industrials | 337,045 | 337,045 | - | - |
Information Technology | 3,226,700 | 3,226,700 | - | - |
Materials | 112,107 | 112,107 | - | - |
Telecommunication Services | 265,945 | 265,945 | - | - |
Money Market Funds | 228,193 | 228,193 | - | - |
Cash Equivalents | 11,095 | - | 11,095 | - |
Total Investments in Securities: | $ 6,275,799 | $ 6,243,667 | $ 29,971 | $ 2,161 |
The following is a reconciliation of Investments in Securities for which Level 3 inputs were used in determining value: |
(Amounts in thousands) | |
Investments in Securities: | |
Beginning Balance | $ - |
Total Realized Gain (Loss) | (24) |
Total Unrealized Gain (Loss) | (55) |
Cost of Purchases | 2,834 |
Proceeds of Sales | (594) |
Amortization/Accretion | - |
Transfers in to Level 3 | - |
Transfers out of Level 3 | - |
Ending Balance | $ 2,161 |
The change in unrealized gain (loss) for the period attributable to Level 3 securities held at July 31, 2010 | $ (55) |
The information used in the above reconciliation represents fiscal year to date activity for any Investments in Securities identified as using Level 3 inputs at either the beginning or the end of the current fiscal period. Transfers in or out of Level 3 represent the beginning value of any Security or Instrument where a change in the pricing level occurred from the beginning to the end of the period. The cost of purchases and the proceeds of sales may include securities received or delivered through corporate actions or exchanges. Realized and unrealized gains (losses) disclosed in the reconciliation are included in Net Gain (Loss) on the Fund's Statement of Operations. |
Distribution of investments by country of issue, as a percentage of total net assets, is as follows: (Unaudited) |
United States of America | 89.4% |
Cayman Islands | 2.1% |
Israel | 1.7% |
Canada | 1.2% |
Bermuda | 1.2% |
Netherlands | 1.2% |
Others (Individually Less Than 1%) | 3.2% |
| 100.0% |
Income Tax Information |
At July 31, 2010, the Fund had a capital loss carryforward of approximately $1,651,048,000 of which $1,249,895,000 and $401,153,000 will expire on July 31, 2011 and 2017, respectively. Capital loss carryforwards are only available to offset future capital gains of the Fund to the extent provided by regulations and may be limited. |
See accompanying notes which are an integral part of the financial statements.
Annual Report
Statement of Assets and Liabilities
Amounts in thousands (except per-share amounts) | July 31, 2010 |
| | |
Assets | | |
Investment in securities, at value (including securities loaned of $223,384 and repurchase agreements of $11,095) - See accompanying schedule: Unaffiliated issuers (cost $5,807,296) | $ 5,812,234 | |
Fidelity Central Funds (cost $228,193) | 228,193 | |
Other affiliated issuers (cost $215,233) | 235,372 | |
Total Investments (cost $6,250,722) | | $ 6,275,799 |
Foreign currency held at value (cost $90) | | 90 |
Receivable for investments sold | | 41,068 |
Receivable for fund shares sold | | 4,621 |
Dividends receivable | | 1,468 |
Distributions receivable from Fidelity Central Funds | | 108 |
Other receivables | | 964 |
Total assets | | 6,324,118 |
| | |
Liabilities | | |
Payable for investments purchased | $ 64,818 | |
Payable for fund shares redeemed | 9,950 | |
Accrued management fee | 3,516 | |
Other affiliated payables | 1,042 | |
Other payables and accrued expenses | 203 | |
Collateral on securities loaned, at value | 228,193 | |
Total liabilities | | 307,722 |
| | |
Net Assets | | $ 6,016,396 |
Net Assets consist of: | | |
Paid in capital | | $ 7,719,105 |
Accumulated net investment loss | | (112) |
Accumulated undistributed net realized gain (loss) on investments and foreign currency transactions | | (1,727,624) |
Net unrealized appreciation (depreciation) on investments and assets and liabilities in foreign currencies | | 25,027 |
Net Assets | | $ 6,016,396 |
| | |
OTC:
Net Asset Value, offering price and redemption price per share ($5,080,140 ÷ 112,882 shares) | | $ 45.00 |
| | |
Class K:
Net Asset Value, offering price and redemption price per share ($936,256 ÷ 20,717 shares) | | $ 45.19 |
See accompanying notes which are an integral part of the financial statements.
Annual Report
Financial Statements - continued
Statement of Operations
Amounts in thousands | Year ended July 31, 2010 |
| | |
Investment Income | | |
Dividends | | $ 29,847 |
Interest | | 1 |
Income from Fidelity Central Funds (including $1,676 from security lending) | | 1,712 |
Total income | | 31,560 |
| | |
Expenses | | |
Management fee
Basic fee | $ 36,461 | |
Performance adjustment | 12,387 | |
Transfer agent fees | 11,777 | |
Accounting and security lending fees | 1,257 | |
Custodian fees and expenses | 203 | |
Independent trustees' compensation | 36 | |
Registration fees | 153 | |
Audit | 77 | |
Legal | 30 | |
Interest | 16 | |
Miscellaneous | 91 | |
Total expenses before reductions | 62,488 | |
Expense reductions | (1,271) | 61,217 |
Net investment income (loss) | | (29,657) |
Realized and Unrealized Gain (Loss) Net realized gain (loss) on: | | |
Investment securities: | | |
Unaffiliated issuers | 1,044,884 | |
Other affiliated issuers | 9,014 | |
Foreign currency transactions | 79 | |
Capital gain distributions from Fidelity Central Funds | 12 | |
Total net realized gain (loss) | | 1,053,989 |
Change in net unrealized appreciation (depreciation) on: Investment securities | (204,417) | |
Assets and liabilities in foreign currencies | 19 | |
Total change in net unrealized appreciation (depreciation) | | (204,398) |
Net gain (loss) | | 849,591 |
Net increase (decrease) in net assets resulting from operations | | $ 819,934 |
See accompanying notes which are an integral part of the financial statements.
Annual Report
Statement of Changes in Net Assets
Amounts in thousands | Year ended
July 31,
2010 | Year ended
July 31,
2009 |
Increase (Decrease) in Net Assets | | |
Operations | | |
Net investment income (loss) | $ (29,657) | $ (15,605) |
Net realized gain (loss) | 1,053,989 | (679,506) |
Change in net unrealized appreciation (depreciation) | (204,398) | (298,374) |
Net increase (decrease) in net assets resulting
from operations | 819,934 | (993,485) |
Share transactions - net increase (decrease) | 30,686 | (711,460) |
Total increase (decrease) in net assets | 850,620 | (1,704,945) |
| | |
Net Assets | | |
Beginning of period | 5,165,776 | 6,870,721 |
End of period (including accumulated net investment loss of $112 and accumulated net investment loss of $108, respectively) | $ 6,016,396 | $ 5,165,776 |
See accompanying notes which are an integral part of the financial statements.
Annual Report
Financial Highlights - OTC
Years ended July 31, | 2010 | 2009 | 2008 | 2007 | 2006 |
Selected Per-Share Data | | | | | |
Net asset value, beginning of period | $ 38.73 | $ 44.66 | $ 47.09 | $ 34.70 | $ 35.99 |
Income from Investment Operations | | | | | |
Net investment income (loss) B | (.23) | (.12) | (.20) | (.19) | (.10) E |
Net realized and unrealized gain (loss) | 6.50 | (5.81) | (2.23) | 12.58 | (1.19) |
Total from investment operations | 6.27 | (5.93) | (2.43) | 12.39 | (1.29) |
Net asset value, end of period | $ 45.00 | $ 38.73 | $ 44.66 | $ 47.09 | $ 34.70 |
Total Return A | 16.19% | (13.28)% | (5.16)% | 35.71% | (3.58)% |
Ratios to Average Net Assets C, F | | | | | |
Expenses before reductions | 1.06% | 1.13% | 1.06% | .96% | .80% |
Expenses net of fee waivers,
if any | 1.06% | 1.13% | 1.06% | .96% | .80% |
Expenses net of all reductions | 1.04% | 1.13% | 1.05% | .95% | .75% |
Net investment income (loss) | (.51)% | (.37)% | (.42)% | (.45)% | (.26)% E |
Supplemental Data | | | | | |
Net assets, end of period
(in millions) | $ 5,080 | $ 4,677 | $ 6,871 | $ 8,778 | $ 7,370 |
Portfolio turnover rate D | 163% | 151% | 145% | 121% | 149% |
A Total returns would have been lower had certain expenses not been reduced during the periods shown.
B Calculated based on average shares outstanding during the period.
C Fees and expenses of the underlying Fidelity Central Funds are not included in the Fund's expense ratio. The Fund indirectly bears its proportionate share of the expenses of any underlying Fidelity Central Funds.
D Amount does not include the portfolio activity of any underlying Fidelity Central Funds.
E Investment income per share reflects a special dividend which amounted to $.03 per share. Excluding the special dividend, the ratio of net investment income (loss) to average net assets would have been (.34%).
F Expense ratios reflect operating expenses of the class. Expenses before reductions do not reflect amounts reimbursed by the investment adviser or reductions from brokerage service arrangements or reductions from other expense offset arrangements and do not represent the amount paid by the class during periods when reimbursements or reductions occur. Expenses net of fee waivers reflect expenses after reimbursement by the investment adviser but prior to reductions from brokerage service arrangements or other expense offset arrangements. Expenses net of all reductions represent the net expenses paid by the class.
See accompanying notes which are an integral part of the financial statements.
Annual Report
Financial Highlights - Class K
Years ended July 31, | 2010 | 2009 | 2008 G |
Selected Per-Share Data | | | |
Net asset value, beginning of period | $ 38.83 | $ 44.68 | $ 47.79 |
Income from Investment Operations | | | |
Net investment income (loss) D | (.16) | (.05) | (.05) |
Net realized and unrealized gain (loss) | 6.52 | (5.80) | (3.06) |
Total from investment operations | 6.36 | (5.85) | (3.11) |
Net asset value, end of period | $ 45.19 | $ 38.83 | $ 44.68 |
Total Return B, C | 16.38% | (13.09)% | (6.51)% |
Ratios to Average Net Assets E, H | | | |
Expenses before reductions | .90% | .92% | .91% A |
Expenses net of fee waivers, if any | .90% | .92% | .91% A |
Expenses net of all reductions | .88% | .92% | .91% A |
Net investment income (loss) | (.35)% | (.17)% | (.47)% A |
Supplemental Data | | | |
Net assets, end of period (000 omitted) | $ 936,256 | $ 488,683 | $ 93 |
Portfolio turnover rate F | 163% | 151% | 145% |
A Annualized
B Total returns for periods of less than one year are not annualized.
C Total returns would have been lower had certain expenses not been reduced during the periods shown.
D Calculated based on average shares outstanding during the period.
E Fees and expenses of the underlying Fidelity Central Funds are not included in the Fund's expense ratio. The Fund indirectly bears its proportionate share of the expenses of any underlying Fidelity Central Funds.
F Amount does not include the portfolio activity of any underlying Fidelity Central Funds.
G For the period May 9, 2008 (commencement of sale of shares) to July 31, 2008.
H Expense ratios reflect operating expenses of the class. Expenses before reductions do not reflect amounts reimbursed by the investment adviser or reductions from brokerage service arrangements or reductions from other expense offset arrangements and do not represent the amount paid by the class during periods when reimbursements or reductions occur. Expense ratios before reductions for start-up periods may not be representative of longer-term operating periods. Expenses net of fee waivers reflect expenses after reimbursement by the investment adviser but prior to reductions from brokerage service arrangements or other expense offset arrangements. Expenses net of all reductions represent the net expenses paid by the class.
See accompanying notes which are an integral part of the financial statements.
Annual Report
Notes to Financial Statements
For the period ended July 31, 2010
(Amounts in thousands except ratios)
1. Organization.
Fidelity OTC Portfolio (the Fund) is a non-diversified fund of Fidelity Securities Fund (the Trust) and is authorized to issue an unlimited number of shares. The Trust is registered under the Investment Company Act of 1940, as amended (the 1940 Act), as an open-end management investment company organized as a Massachusetts business trust. The Fund offers OTC and Class K shares, each of which has equal rights as to assets and voting privileges. Each class has exclusive voting rights with respect to matters that affect that class. After the commencement of Class K, the Fund began offering conversion privileges between OTC and Class K to eligible shareholders of OTC. Investment income, realized and unrealized capital gains and losses, the common expenses of the Fund, and certain fund-level expense reductions, if any, are allocated on a pro-rata basis to each class based on the relative net assets of each class to the total net assets of the Fund. Each class differs with respect to transfer agent fees incurred. Certain expense reductions also differ by class.
2. Investments in Fidelity Central Funds.
The Fund may invest in Fidelity Central Funds, which are open-end investment companies available only to other investment companies and accounts managed by Fidelity Management & Research Company (FMR) and its affiliates. The Fund's Schedule of Investments lists each of the Fidelity Central Funds held as of period end, if any, as an investment of the Fund, but does not include the underlying holdings of each Fidelity Central Fund. As an Investing Fund, the Fund indirectly bears its proportionate share of the expenses of the underlying Fidelity Central Funds.
The Money Market Central Funds seek preservation of capital and current income and are managed by Fidelity Investments Money Management, Inc. (FIMM), an affiliate of FMR.
A complete unaudited list of holdings for each Fidelity Central Fund is available upon request or at the Securities and Exchange Commission (the SEC) web site at www.sec.gov. In addition, the financial statements of the Fidelity Central Funds which are not covered by the Fund's Report of Independent Registered Public Accounting Firm, are available on the SEC web site or upon request.
3. Significant Accounting Policies.
The financial statements have been prepared in conformity with accounting principles generally accepted in the United States of America (GAAP), which require management to make certain estimates and assumptions at the date of the financial statements. Actual results could differ from those estimates. The following summarizes the significant accounting policies of the Fund:
Annual Report
Notes to Financial Statements - continued
(Amounts in thousands except ratios)
3. Significant Accounting Policies - continued
Security Valuation. Investments are valued as of 4:00 p.m. Eastern time on the last calendar day of the period. The Fund uses independent pricing services approved by the Board of Trustees to value its investments. When current market prices or quotations are not readily available or reliable, valuations may be determined in good faith in accordance with procedures adopted by the Board of Trustees. Factors used in determining value may include market or security specific events. The frequency with which these procedures are used cannot be predicted and they may be utilized to a significant extent. The value used for net asset value (NAV) calculation under these procedures may differ from published prices for the same securities.
The Fund categorizes the inputs to valuation techniques used to value its investments into a disclosure hierarchy consisting of three levels as shown below.
Level 1 - quoted prices in active markets for identical investments
Level 2 - other significant observable inputs (including quoted prices for similar investments, interest rates, prepayment speeds, etc.)
Level 3 - unobservable inputs (including the fund's own assumptions based on the best information available)
Changes in valuation techniques may result in transfers in or out of an assigned level within the disclosure hierarchy. The aggregate value of investments by input level, as of July 31, 2010, as well as a roll forward of Level 3 securities, is included at the end of the Fund's Schedule of Investments. Valuation techniques used to value the Fund's investments by major category are as follows.
Equity securities, including restricted securities, for which market quotations are readily available, are valued at the last reported sale price or official closing price as reported by an independent pricing service on the primary market or exchange on which they are traded and are categorized as Level 1 in the hierarchy. In the event there were no sales during the day or closing prices are not available, securities are valued at the last quoted bid price or may be valued using the last available price and are generally categorized as Level 2 in the hierarchy. For foreign equity securities, when significant market or security specific events arise, comparisons to the valuation of American Depository Receipts (ADRs), futures contracts, Exchange-traded funds (ETFs) and certain indexes as well as quoted prices for similar securities are used and are categorized as Level 2 in the hierarchy in these circumstances. Utilizing these techniques may result in transfers between Level 1 and Level 2. For restricted equity securities and private placements where observable inputs are limited, assumptions about market activity and risk are used and are categorized as Level 3 in the hierarchy.
Annual Report
3. Significant Accounting Policies - continued
Security Valuation - continued
Investments in open-end mutual funds, including the Fidelity Central Funds, are valued at their closing net asset value each business day and are categorized as Level 1 in the hierarchy. Short-term securities with remaining maturities of sixty days or less for which quotations are not readily available are valued at amortized cost, which approximates fair value and are categorized as Level 2 in the hierarchy.
Foreign Currency. The Fund uses foreign currency contracts to facilitate transactions in foreign-denominated securities. Gains and losses from these transactions may arise from changes in the value of the foreign currency or if the counterparties do not perform under the contracts' terms.
Foreign-denominated assets, including investment securities, and liabilities are translated into U.S. dollars at the exchange rate at period end. Purchases and sales of investment securities, income and dividends received and expenses denominated in foreign currencies are translated into U.S. dollars at the exchange rate in effect on the transaction date.
The effects of exchange rate fluctuations on investments are included with the net realized and unrealized gain (loss) on investment securities. Other foreign currency transactions resulting in realized and unrealized gain (loss) are disclosed separately.
Investment Transactions and Income. For financial reporting purposes, the Fund's investment holdings and NAV include trades executed through the end of the last business day of the period. The NAV per share for processing shareholder transactions is calculated as of the close of business of the New York Stock Exchange (NYSE), normally 4:00 p.m. Eastern time and includes trades executed through the end of the prior business day. Gains and losses on securities sold are determined on the basis of identified cost and may include proceeds received from litigation. Dividend income is recorded on the ex-dividend date, except for certain dividends from foreign securities where the ex-dividend date may have passed, which are recorded as soon as the Fund is informed of the ex-dividend date. Non-cash dividends included in dividend income, if any, are recorded at the fair market value of the securities received. Distributions received on securities that represent a return of capital or capital gain are recorded as a reduction of cost of investments and/or as a realized gain. The Fund estimates the components of distributions received that may be considered return of capital distributions or capital gain distributions. Interest income and distributions from the Fidelity Central Funds are accrued as earned. Interest income includes coupon interest and amortization of premium and accretion of discount on debt securities. Investment income is recorded net of foreign taxes withheld where recovery of such taxes is uncertain.
Annual Report
Notes to Financial Statements - continued
(Amounts in thousands except ratios)
3. Significant Accounting Policies - continued
Expenses. Most expenses of the Trust can be directly attributed to a fund. Expenses which cannot be directly attributed are apportioned amongst each fund in the Trust. Expense estimates are accrued in the period to which they relate and adjustments are made when actual amounts are known.
Deferred Trustee Compensation. Under a Deferred Compensation Plan (the Plan), independent Trustees may elect to defer receipt of a portion of their annual compensation. Deferred amounts are invested in a cross-section of Fidelity funds, are marked-to-market and remain in the Fund until distributed in accordance with the Plan. The investment of deferred amounts and the offsetting payable to the Trustees are included in the accompanying Statement of Assets and Liabilities.
Income Tax Information and Distributions to Shareholders. Each year the Fund intends to qualify as a regulated investment company, including distributing substantially all of its taxable income and realized gains under Subchapter M of the Internal Revenue Code and filing its U.S. federal tax return. As a result, no provision for income taxes is required. As of July 31, 2010, the Fund did not have any unrecognized tax benefits in the accompanying financial statements. A fund's federal tax return is subject to examination by the Internal Revenue Service (IRS) for a period of three years. Foreign taxes are provided for based on the Fund's understanding of the tax rules and rates that exist in the foreign markets in which it invests.
Distributions are recorded on the ex-dividend date. Income dividends and capital gain distributions are declared separately for each class. Income and capital gain distributions are determined in accordance with income tax regulations, which may differ from GAAP.
Capital accounts within the financial statements are adjusted for permanent book-tax differences. These adjustments have no impact on net assets or the results of operations. Temporary book-tax differences will reverse in a subsequent period.
Book-tax differences are primarily due to the short-term gain distributions from the Fidelity Central Funds, foreign currency transactions, passive foreign investment companies (PFIC), partnerships, deferred trustees compensation, net operating losses, capital loss carryforwards, expiring capital loss carryforwards, losses deferred due to wash sales and excise tax regulations
The federal tax cost of investment securities and unrealized appreciation (depreciation) as of period end were as follows:
Gross unrealized appreciation | $ 634,723 |
Gross unrealized depreciation | (686,222) |
Net unrealized appreciation (depreciation) | $ (51,499) |
| |
Tax Cost | $ 6,327,298 |
Annual Report
3. Significant Accounting Policies - continued
Income Tax Information and Distributions to Shareholders - continued
The tax-based components of distributable earnings as of period end were as follows:
Capital loss carryforward | $ (1,651,048) |
Net unrealized appreciation (depreciation) | $ (51,548) |
4. Operating Policies.
Repurchase Agreements. FMR has received an Exemptive Order from the SEC which permits the Fund and other affiliated entities of FMR to transfer uninvested cash balances into joint trading accounts which are then invested in repurchase agreements. The Fund may also invest directly with institutions in repurchase agreements. Repurchase agreements are collateralized by government or non-government securities. Upon settlement date, collateral is held in segregated accounts with custodian banks and may be obtained in the event of a default of the counterparty. The Fund monitors, on a daily basis, the value of the collateral to ensure it is at least equal to the principal amount of the repurchase agreement (including accrued interest). In the event of a default by the counterparty, realization of the collateral proceeds could be delayed, during which time the value of the collateral may decline.
Restricted Securities. The Fund may invest in securities that are subject to legal or contractual restrictions on resale. These securities generally may be resold in transactions exempt from registration or to the public if the securities are registered. Disposal of these securities may involve time-consuming negotiations and expense, and prompt sale at an acceptable price may be difficult. Information regarding restricted securities is included at the end of the Fund's Schedule of Investments.
5. Purchases and Sales of Investments.
Purchases and sales of securities, other than short-term securities, aggregated $9,619,611 and $9,543,935, respectively.
6. Fees and Other Transactions with Affiliates.
Management Fee. FMR and its affiliates provide the Fund with investment management related services for which the Fund pays a monthly management fee. The management fee is the sum of an individual fund fee rate that is based on an annual rate of .35% of the Fund's average net assets and a group fee rate that averaged .26% during the period. The group fee rate is based upon the average net assets of all the mutual funds advised by FMR. The group fee rate decreases as assets under management increase and increases as assets under management decrease. In addition, the management fee is
Annual Report
Notes to Financial Statements - continued
(Amounts in thousands except ratios)
6. Fees and Other Transactions with Affiliates - continued
Management Fee - continued
subject to a performance adjustment (up to a maximum of ± .20% of the Fund's average net assets over a 36 month performance period). The upward or downward adjustment to the management fee is based on the relative investment performance of the retail class of the Fund, OTC as compared to an appropriate benchmark index. For the period, the total annual management fee rate, including the performance adjustment, was ..82% of the Fund's average net assets.
Transfer Agent Fees. Fidelity Investments Institutional Operations Company, Inc. (FIIOC), an affiliate of FMR, is the transfer, dividend disbursing and shareholder servicing agent for each class of the Fund. FIIOC receives account fees and asset-based fees that vary according to the account size and type of account of the shareholders of OTC. FIIOC receives an asset-based fee of Class K's average net assets. FIIOC pays for typesetting, printing and mailing of shareholder reports, except proxy statements. For the period, the total transfer agent fees paid by each class were as follows:
| Amount | % of
Average
Net Assets |
OTC | $ 11,397 | .22 |
Class K | 380 | .05 |
| $ 11,777 | |
Accounting and Security Lending Fees. Fidelity Service Company, Inc. (FSC), an affiliate of FMR, maintains the Fund's accounting records. The accounting fee is based on the level of average net assets for the month. Under a separate contract, FSC administers the security lending program. The security lending fee is based on the number and duration of lending transactions.
Brokerage Commissions. The Fund placed a portion of its portfolio transactions with brokerage firms which are affiliates of the investment adviser. The commissions paid to these affiliated firms were $231 for the period.
Interfund Lending Program. Pursuant to an Exemptive Order issued by the SEC, the Fund, along with other registered investment companies having management contracts with FMR, may participate in an interfund lending program. This program provides an alternative credit facility allowing the funds to borrow from, or lend money to, other participating affiliated funds. At period end, there were no interfund loans outstanding.
Annual Report
6. Fees and Other Transactions with Affiliates - continued
Interfund Lending Program - continued
The Fund's activity in this program during the period for which loans were outstanding was as follows:
Borrower or Lender | Average Daily
Loan Balance | Weighted Average Interest Rate | Interest
Expense |
Borrower | $ 14,593 | .42% | $ 16 |
7. Committed Line of Credit.
The Fund participates with other funds managed by FMR in a $3.75 billion credit facility (the "line of credit") to be utilized for temporary or emergency purposes to fund shareholder redemptions or for other short-term liquidity purposes. The Fund has agreed to pay commitment fees on its pro-rata portion of the line of credit, which amounted to $23 and is reflected in Miscellaneous expenses on the Statement of Operations. During the period, there were no borrowings on this line of credit.
8. Security Lending.
The Fund lends portfolio securities from time to time in order to earn additional income. On the settlement date of the loan, the Fund receives collateral (in the form of U.S. Treasury obligations, letters of credit and/or cash) against the loaned securities and maintains collateral in an amount not less than 100% of the market value of the loaned securities during the period of the loan. The market value of the loaned securities is determined at the close of business of the Fund and any additional required collateral is delivered to the Fund on the next business day. If the borrower defaults on its obligation to return the securities loaned because of insolvency or other reasons, a fund could experience delays and costs in recovering the securities loaned or in gaining access to the collateral. Any cash collateral received is invested in the Fidelity Securities Lending Cash Central Fund. The value of loaned securities and cash collateral at period end are disclosed on the Fund's Statement of Assets and Liabilities. Security lending income represents the income earned on investing cash collateral, less fees and expenses associated with the loan, plus any premium payments that may be received on the loan of certain types of securities. Security lending income is presented in the Statement of Operations as a component of income from Fidelity Central Funds.
Annual Report
Notes to Financial Statements - continued
(Amounts in thousands except ratios)
9. Bank Borrowings.
The Fund is permitted to have bank borrowings for temporary or emergency purposes to fund shareholder redemptions. The Fund has established borrowing arrangements with certain banks. The interest rate on the borrowings is the bank's base rate, as revised from time to time. The average daily loan balance during the period for which loans were outstanding amounted to $6,750. The weighted average interest rate was .62%. The interest expense amounted to two hundred thirty-three dollars under the bank borrowing program. At period end, there were no bank borrowings outstanding.
10. Expense Reductions.
Many of the brokers with whom FMR places trades on behalf of the Fund provided services to the Fund in addition to trade execution. These services included payments of certain expenses on behalf of the Fund totaling $1,271 for the period.
11. Share Transactions.
Transactions for each class of shares were as follows:
| Shares | Dollars |
Years ended July 31, | 2010 A | 2009 | 2010 A | 2009 |
OTC | | | | |
Shares sold | 27,879 | 30,393 | $ 1,242,349 | $ 1,008,444 |
Conversion to Class K | (520) | (11,534) | (20,492) | (344,688) |
Shares redeemed | (35,233) | (51,952) | (1,562,257) | (1,755,471) |
Net increase (decrease) | (7,874) | (33,093) | $ (340,400) | $ (1,091,715) |
Class K | | | | |
Shares sold | 11,838 | 2,992 | $ 538,757 | $ 95,604 |
Conversion from OTC | 518 | 11,521 | 20,492 | 344,688 |
Shares redeemed | (4,224) | (1,930) | (188,163) | (60,037) |
Net increase (decrease) | 8,132 | 12,583 | $ 371,086 | $ 380,255 |
A Conversion transactions for Class K and OTC are presented for the period August 1, 2009 through August 31, 2009
12. Other.
The Fund's organizational documents provide former and current trustees and officers with a limited indemnification against liabilities arising in connection with the performance of their duties to the Fund. In the normal course of business, the Fund may also enter into contracts that provide general indemnifications. The Fund's maximum exposure under these arrangements is unknown as this would be dependent on future claims that may be made against the Fund. The risk of material loss from such claims is considered remote.
Annual Report
To the Trustees of Fidelity Securities Fund and Shareholders of Fidelity OTC Portfolio:
We have audited the accompanying statement of assets and liabilities of Fidelity OTC Portfolio (the Fund), a fund of Fidelity Securities Fund, including the schedule of investments, as of July 31, 2010, and the related statement of operations for the year then ended, the statement of changes in net assets for each of the two years in the period then ended, and the financial highlights for each of the five years in the periods then ended. These financial statements and financial highlights are the responsibility of the Fund's management. Our responsibility is to express an opinion on these financial statements and financial highlights based on our audits.
We conducted our audits in accordance with standards of the Public Company Accounting Oversight Board (United States). Those standards require that we plan and perform the audit to obtain reasonable assurance about whether the financial statements and financial highlights are free of material misstatement. The Fund is not required to have, nor were we engaged to perform, an audit of its internal control over financial reporting. Our audits included consideration of internal control over financial reporting as a basis for designing audit procedures that are appropriate in the circumstances, but not for the purpose of expressing an opinion on the effectiveness of the Fund's internal control over financial reporting. Accordingly, we express no such opinion. An audit also includes examining, on a test basis, evidence supporting the amounts and disclosures in the financial statements, assessing the accounting principles used and significant estimates made by management, as well as evaluating the overall financial statement presentation. Our procedures included confirmation of securities owned as of July 31, 2010, by correspondence with the custodians and brokers; where replies were not received from brokers, we performed other auditing procedures. We believe that our audits provide a reasonable basis for our opinion.
In our opinion, the financial statements and financial highlights referred to above present fairly, in all material respects, the financial position of Fidelity OTC Portfolio as of July 31, 2010, the results of its operations for the year then ended, the changes in its net assets for each of the two years in the period then ended, and the financial highlights for each of the five years in the periods then ended, in conformity with accounting principles generally accepted in the United States of America.
/s/ Deloitte & Touche LLP
DELOITTE & TOUCHE LLP
Boston, Massachusetts
September 22, 2010
Annual Report
The Trustees, Member of the Advisory Board, and executive officers of the trust and fund, as applicable, are listed below. The Board of Trustees governs the fund and is responsible for protecting the interests of shareholders. The Trustees are experienced executives who meet periodically throughout the year to oversee the fund's activities, review contractual arrangements with companies that provide services to the fund, oversee management of the risks associated with such activities and contractual arrangements, and review the fund's performance. Except for James C. Curvey, each of the Trustees oversees 222 funds advised by FMR or an affiliate. Mr. Curvey oversees 411 funds advised by FMR or an affiliate.
The Trustees hold office without limit in time except that (a) any Trustee may resign; (b) any Trustee may be removed by written instrument, signed by at least two-thirds of the number of Trustees prior to such removal; (c) any Trustee who requests to be retired or who has become incapacitated by illness or injury may be retired by written instrument signed by a majority of the other Trustees; and (d) any Trustee may be removed at any special meeting of shareholders by a two-thirds vote of the outstanding voting securities of the trust. Each Trustee who is not an interested person (as defined in the 1940 Act) (Independent Trustee), shall retire not later than the last day of the calendar year in which his or her 72nd birthday occurs. The Independent Trustees may waive this mandatory retirement age policy with respect to individual Trustees. The executive officers and Advisory Board Member hold office without limit in time, except that any officer and Advisory Board Member may resign or may be removed by a vote of a majority of the Trustees at any regular meeting or any special meeting of the Trustees. Except as indicated, each individual has held the office shown or other offices in the same company for the past five years.
Experience, Skills, Attributes, and Qualifications of the Fund's Trustees. The Governance and Nominating Committee has adopted a statement of policy that describes the experience, qualifications, attributes, and skills that are necessary and desirable for potential Independent Trustee candidates (Statement of Policy). The Board believes that each Trustee satisfied at the time he or she was initially elected or appointed a Trustee, and continues to satisfy, the standards contemplated by the Statement of Policy. The Governance and Nominating Committee also engages professional search firms to help identify potential Independent Trustee candidates who have the experience, qualifications, attributes, and skills consistent with the Statement of Policy. From time to time, additional criteria based on the composition and skills of the current Independent Trustees, as well as experience or skills that may be appropriate in light of future changes to board composition, business conditions, and regulatory or other developments, have also been considered by the professional search firms and the Governance and Nominating Committee. In addition, the Board takes into account the Trustees' commitment and participation in Board and committee meetings, as well as their leadership of standing and ad hoc committees throughout their tenure.
In determining that a particular Trustee was and continues to be qualified to serve as a Trustee, the Board has considered a variety of criteria, none of which, in isolation, was controlling. The Board believes that, collectively, the Trustees have balanced and diverse experience, qualifications, attributes, and skills, which allow the Board to operate effectively in governing the fund and protecting the interests of shareholders. Information about the specific experience, skills, attributes, and qualifications of each Trustee, which in each case led to the Board's conclusion that the Trustee should serve (or continue to serve) as a trustee of the fund, is provided below.
Annual Report
Board Structure and Oversight Function. Edward C. Johnson 3d is an interested person (as defined in the 1940 Act) and currently serves as Chairman. The Trustees have determined that an interested Chairman is appropriate and benefits shareholders because an interested Chairman has a personal and professional stake in the quality and continuity of services provided to the fund. Independent Trustees exercise their informed business judgment to appoint an individual of their choosing to serve as Chairman, regardless of whether the Trustee happens to be independent or a member of management. The Independent Trustees have determined that they can act independently and effectively without having an Independent Trustee serve as Chairman and that a key structural component for assuring that they are in a position to do so is for the Independent Trustees to constitute a substantial majority for the Board. The Independent Trustees also regularly meet in executive session. Ned C. Lautenbach serves as Chairman of the Independent Trustees and as such (i) acts as a liaison between the Independent Trustees and management with respect to matters important to the Independent Trustees and (ii) with management prepares agendas for Board meetings.
Fidelity funds are overseen by different Boards of Trustees. The fund's Board oversees Fidelity's equity and high income funds and another Board oversees Fidelity's investment-grade bond, money market, and asset allocation funds. The asset allocation funds may invest in Fidelity funds overseen by the fund's Board. The use of separate Boards, each with its own committee structure, allows the Trustees of each group of Fidelity funds to focus on the unique issues of the funds they oversee, including common research, investment, and operational issues. On occasion, the separate Boards establish joint committees to address issues of overlapping consequences for the Fidelity funds overseen by each Board.
The Trustees operate using a system of committees to facilitate the timely and efficient consideration of all matters of importance to the Trustees, the fund, and fund shareholders and to facilitate compliance with legal and regulatory requirements and oversight of the fund's activities and associated risks. The Board, acting through its committees, has charged FMR and its affiliates with (i) identifying events or circumstances the occurrence of which could have demonstrably adverse effects on the fund's business and/or reputation; (ii) implementing processes and controls to lessen the possibility that such events or circumstances occur or to mitigate the effects of such events or circumstances if they do occur; and (iii) creating and maintaining a system designed to evaluate continuously business and market conditions in order to facilitate the identification and implementation processes described in (i) and (ii) above. Because the day-to-day operations and activities of the fund are carried out by or through FMR, its affiliates and other service providers, the fund's exposure to risks is mitigated but not eliminated by the processes overseen by the Trustees. While each of the Board's committees has responsibility for overseeing different aspects of the fund's activities, oversight is exercised primarily through the Operations, Audit, and Compliance Committees. Appropriate personnel, including but not limited to the fund's Chief Compliance Officer (CCO), FMR's internal auditor, the independent accountants, the fund's Treasurer and portfolio management personnel, make periodic reports to the Board's committees, as appropriate. The responsibilities of each committee, including their oversight responsibilities, are described further under "Standing Committees of the Fund's Trustees."
Annual Report
Trustees and Officers - continued
The fund's Statement of Additional Information (SAI) includes more information about the Trustees. To request a free copy, call Fidelity at 1-800-544-8544.
Interested Trustees*:
Correspondence intended for each Trustee who is an interested person may be sent to Fidelity Investments, 82 Devonshire Street, Boston, Massachusetts 02109.
Name, Age; Principal Occupations and Other Relevant Experience+ |
Edward C. Johnson 3d (80) |
| Year of Election or Appointment: 1984 Mr. Johnson is Trustee and Chairman of the Board of Trustees of certain Trusts. Mr. Johnson serves as Chief Executive Officer, Chairman, and a Director of FMR LLC; Chairman and a Director of FMR; Chairman and a Director of Fidelity Research & Analysis Company (FRAC); Chairman and a Director of Fidelity Investments Money Management, Inc.; and Chairman and a Director of FMR Co., Inc. In addition, Mr. Johnson serves as Chairman and Director of FIL Limited. Previously, Mr. Johnson served as President of FMR LLC (2006-2007). |
James C. Curvey (75) |
| Year of Election or Appointment: 2007 Mr. Curvey also serves as Trustee (2007-present) of other investment companies advised by FMR. Mr. Curvey is a Director of FMR and FMR Co., Inc. (2007-present). Mr. Curvey is also Vice Chairman (2006-present) and Director of FMR LLC. In addition, Mr. Curvey serves as an Overseer for the Boston Symphony Orchestra and a member of the Trustees of Villanova University. |
* Trustees have been determined to be "Interested Trustees" by virtue of, among other things, their affiliation with the trust or various entities under common control with FMR.
+ The information above includes each Trustee's principal occupation during the last five years and other information relating to the experience, attributes, and skills relevant to each Trustee's qualifications to serve as a Trustee, which led to the conclusion that each Trustee should serve as a Trustee for the fund.
Annual Report
Independent Trustees:
Correspondence intended for each Independent Trustee (that is, the Trustees other than the Interested Trustees) may be sent to Fidelity Investments, P.O. Box 55235, Boston, Massachusetts 02205-5235.
Name, Age; Principal Occupations and Other Relevant Experience+ |
Dennis J. Dirks (62) |
| Year of Election or Appointment: 2005 Prior to his retirement in May 2003, Mr. Dirks was Chief Operating Officer and a member of the Board of The Depository Trust & Clearing Corporation (DTCC). He also served as President, Chief Operating Officer, and Board member of The Depository Trust Company (DTC) and President and Board member of the National Securities Clearing Corporation (NSCC). In addition, Mr. Dirks served as Chief Executive Officer and Board member of the Government Securities Clearing Corporation, Chief Executive Officer and Board member of the Mortgage-Backed Securities Clearing Corporation, as a Trustee and a member of the Finance Committee of Manhattan College (2005-2008), and as a Trustee and a member of the Finance Committee of AHRC of Nassau County (2006-2008). Currently, Mr. Dirks serves as a member of the Board of Directors for The Brookville Center for Children's Services, Inc. (2009-present). |
Alan J. Lacy (56) |
| Year of Election or Appointment: 2008 Mr. Lacy serves as Senior Adviser (2007-present) of Oak Hill Capital Partners, L.P. (private equity). Mr. Lacy also served as Chief Executive Officer (2000-2005) and Vice Chairman (2005-2006) of Sears Holdings Corporation and Sears, Roebuck and Co. (retail). In addition, Mr. Lacy serves as a member of the Board of Directors of The Western Union Company (global money transfer, 2006-present) and Bristol-Myers Squibb Company (global pharmaceuticals, 2007-present). Mr. Lacy is Chairman (2008-present) and a member (2006-present) of the Board of Trustees of The National Parks Conservation Association. |
Ned C. Lautenbach (66) |
| Year of Election or Appointment: 2000 Mr. Lautenbach is Chairman of the Independent Trustees of the Equity and High Income Funds (2006-present). Mr. Lautenbach is an Advisory Partner of Clayton, Dubilier & Rice, Inc. (private equity investment, 2008-present) and was previously a Partner of Clayton, Dubilier & Rice, Inc. (1998-2008). Previously, Mr. Lautenbach was with the International Business Machines Corporation (IBM) from 1968 until his retirement in 1998. Mr. Lautenbach serves as a Director of Eaton Corporation (diversified industrial) as well as the Philharmonic Center for the Arts in Naples, Florida. Mr. Lautenbach is also a member of the Board of Trustees of Fairfield University (2005-present), as well as a member of the Council on Foreign Relations. Previously, Mr. Lautenbach served as a Director of Sony Corporation (2006-2007). |
Joseph Mauriello (65) |
| Year of Election or Appointment: 2008 Prior to his retirement in January 2006, Mr. Mauriello served in numerous senior management positions including Deputy Chairman and Chief Operating Officer (2004-2005), and Vice Chairman of Financial Services (2002-2004) of KPMG LLP US (professional services, 1965-2005). Mr. Mauriello currently serves as a member of the Board of Directors of XL Capital Ltd. (global insurance and re-insurance, 2006-present) and of Arcadia Resources Inc. (health care services and products, 2007- present). Previously, Mr. Mauriello served as a Director of the Hamilton Funds of the Bank of New York (2006-2007). |
Cornelia M. Small (66) |
| Year of Election or Appointment: 2005 Ms. Small is a member of the Board of Directors of the Teagle Foundation (2009-present). Ms. Small is also a member of the Investment Committee, and Chair (2008-present) and a member of the Board of Trustees of Smith College. In addition, Ms. Small serves on the Investment Committee of the Berkshire Taconic Community Foundation (2008-present). Previously, Ms. Small served as Chairperson of the Investment Committee (2002- 2008) of Smith College. In addition, Ms. Small served as Chief Investment Officer, Director of Global Equity Investments, and a member of the Board of Directors of Scudder, Stevens & Clark and Scudder Kemper Investments. |
William S. Stavropoulos (71) |
| Year of Election or Appointment: 2002 Mr. Stavropoulos is Vice Chairman of the Independent Trustees of the Equity and High Income Funds (2006-present). Mr. Stavropoulos serves as President and Founder of the Michigan Baseball Foundation, the Great Lakes Loons (2007-present). Mr. Stavropoulos is Chairman Emeritus of the Board of Directors of The Dow Chemical Company, where he previously served in numerous senior management positions, including President, CEO (1995-2000; 2002-2004), Chairman of the Executive Committee (2000-2006), and as a member of the Board of Directors (1990-2006). Currently, Mr. Stavropoulos is a Director of Teradata Corporation (data warehousing and technology solutions, 2008-present), Chemical Financial Corporation, Maersk Inc. (industrial conglomerate), Tyco International, Inc. (multinational manufacturing and services, 2007-present), and a member of the Advisory Board for Metalmark Capital (private equity investment, 2005-present). Mr. Stavropoulos is a special advisor to Clayton, Dubilier & Rice, Inc. (private equity investment). In addition, Mr. Stavropoulos is a member of the University of Notre Dame Advisory Council for the College of Science. |
David M. Thomas (61) |
| Year of Election or Appointment: 2008 Previously, Mr. Thomas served as Executive Chairman (2005-2006) and Chairman and Chief Executive Officer (2000-2005) of IMS Health, Inc. (pharmaceutical and healthcare information solutions). In addition, Mr. Thomas serves as a member of the Board of Directors of Fortune Brands, Inc. (consumer products), and Interpublic Group of Companies, Inc. (marketing communication, 2004-present). |
Michael E. Wiley (59) |
| Year of Election or Appointment: 2008 Mr. Wiley also serves as a Director of Asia Pacific Exploration Consolidated (international oil and gas exploration and production, 2008-
present), and as a member of the Board of Trustees of the University of Tulsa (2000-2006; 2007-present). Mr. Wiley serves as a Director of Tesoro Corporation (independent oil refiner and marketer, 2005-present), and a Director of Bill Barrett Corporation (exploration and production, 2005- present). In addition, Mr. Wiley also serves as a Director of Post Oak Bank (privately-held bank, 2004-present). Previously, Mr. Wiley served as a Sr. Energy Advisor of Katzenbach Partners, LLC (consulting, 2006- 2007), as an Advisory Director of Riverstone Holdings (private investment), Chairman, President, and CEO of Baker Hughes, Inc. (oilfield services, 2000-2004), and as Director of Spinnaker Exploration Company (exploration and production, 2001-2005). |
Annual Report
Trustees and Officers - continued
+ The information above includes each Trustee's principal occupation during the last five years and other information relating to the experience, attributes, and skills relevant to each Trustee's qualifications to serve as a Trustee, which led to the conclusion that each Trustee should serve as a Trustee for the fund.
Advisory Board Member and Executive Officers:
Correspondence intended for each executive officer and Peter S. Lynch may be sent to Fidelity Investments, 82 Devonshire Street, Boston, Massachusetts 02109.
Name, Age; Principal Occupation |
Peter S. Lynch (66) |
| Year of Election or Appointment: 2003 Member of the Advisory Board of Fidelity's Equity and High Income Funds. Mr. Lynch is Vice Chairman and a Director of FMR and FMR Co., Inc. In addition, Mr. Lynch serves as a Trustee of Boston College and as the Chairman of the Inner-City Scholarship Fund. Previously, Mr. Lynch served on the Special Olympics International Board of Directors (1997-2006). |
Kenneth B. Robins (40) |
| Year of Election or Appointment: 2008 President and Treasurer of Fidelity's Equity and High Income Funds. Mr. Robins also serves as President and Treasurer (2010-present) and Assistant Treasurer (2009-present) of other Fidelity funds and is an employee of Fidelity Investments (2004-present). Previously, Mr. Robins served as Deputy Treasurer of the Fidelity funds (2005-2008) and Treasurer and Chief Financial Officer of The North Carolina Capital Management Trust: Cash and Term Portfolios (2006-2008). |
Bruce T. Herring (44) |
| Year of Election or Appointment: 2006 Vice President of certain Equity Funds. Mr. Herring also serves as Group Chief Investments Officer of FMR. Previously, Mr. Herring served as a portfolio manager for Fidelity U.S. Equity Funds. |
Brian B. Hogan (45) |
| Year of Election or Appointment: 2009 Vice President of certain Equity Funds and Vice President of Sector Funds. Mr. Hogan also serves as Senior Vice President, Equity Research of FMR (2006-present) and President of FMR's Equity Division (2009-present). Previously, Mr. Hogan served as a portfolio manager. |
Scott C. Goebel (42) |
| Year of Election or Appointment: 2008 Secretary and Chief Legal Officer (CLO) of the Fidelity funds. Mr. Goebel also serves as General Counsel, Secretary, and Senior Vice President of FMR (2008-present) and FMR Co., Inc. (2008-present); Deputy General Counsel of FMR LLC; Chief Legal Officer of Fidelity Management & Research (Hong Kong) Limited (2008-present) and Assistant Secretary of Fidelity Management & Research (Japan) Inc. (2008-present), Fidelity Investments Money Management, Inc. (2008-present), Fidelity Management & Research (U.K.) Inc. (2008-present), and Fidelity Research and Analysis Company (2008-present). Previously, Mr. Goebel served as Assistant Secretary of the Funds (2007-2008) and as Vice President and Secretary of Fidelity Distributors Corporation (FDC) (2005-2007). |
William C. Coffey (41) |
| Year of Election or Appointment: 2009 Assistant Secretary of Fidelity's Equity and High Income Funds. Mr. Coffey also serves as Senior Vice President and Deputy General Counsel of FMR LLC (2010-present), and is an employee of Fidelity Investments. Previously, Mr. Coffey served as Vice President and Associate General Counsel of FMR LLC (2005-2009). |
Holly C. Laurent (56) |
| Year of Election or Appointment: 2008 Anti-Money Laundering (AML) Officer of the Fidelity funds. Ms. Laurent is an employee of Fidelity Investments. Previously, Ms. Laurent was Senior Vice President and Head of Legal for Fidelity Business Services India Pvt. Ltd. (2006-2008), and Senior Vice President, Deputy General Counsel and Group Head for FMR LLC (2005-2006). |
Christine Reynolds (51) |
| Year of Election or Appointment: 2008 Chief Financial Officer of the Fidelity funds. Ms. Reynolds became President of Fidelity Pricing and Cash Management Services (FPCMS) in August 2008. Ms. Reynolds served as Chief Operating Officer of FPCMS (2007-2008). Previously, Ms. Reynolds served as President, Treasurer, and Anti-Money Laundering officer of the Fidelity funds (2004-2007). |
Kenneth A. Rathgeber (63) |
| Year of Election or Appointment: 2004 Chief Compliance Officer of Fidelity's Equity and High Income Funds. Mr. Rathgeber is Chief Compliance Officer of Fidelity Management & Research (Hong Kong) Limited (2008-present), Fidelity Management & Research (Japan) Inc. (2008-present), FMR (2005-present), FMR Co., Inc. (2005-present), Fidelity Management & Research (U.K.) Inc. (2005-present), Fidelity Research & Analysis Company (2005-present), Fidelity Investments Money Management, Inc. (2005-present), Pyramis Global Advisors, LLC (2005-present), and Strategic Advisers, Inc. (2005-present). |
Jeffrey S. Christian (48) |
| Year of Election or Appointment: 2009 Deputy Treasurer of the Fidelity funds. Mr. Christian is an employee of Fidelity Investments. Previously, Mr. Christian served as Chief Financial Officer (2008-2009) of certain Fidelity funds and Senior Vice President of Fidelity Pricing and Cash Management Services (FPCMS) (2004-2009). |
Bryan A. Mehrmann (49) |
| Year of Election or Appointment: 2005 Deputy Treasurer of the Fidelity funds. Mr. Mehrmann is an employee of Fidelity Investments. |
Adrien E. Deberghes (42) |
| Year of Election or Appointment: 2008 Deputy Treasurer of Fidelity's Equity and High Income Funds. Mr. Deberghes also serves as Assistant Treasurer of other Fidelity funds (2010-present) and is an employee of Fidelity Investments (2008-
present). Previously, Mr. Deberghes served as Senior Vice President of Mutual Fund Administration at State Street Corporation (2007-2008), Senior Director of Mutual Fund Administration at Investors Bank & Trust (2005-2007), and Director of Finance for Dunkin' Brands (2000-2005). |
Stephanie J. Dorsey (41) |
| Year of Election or Appointment: 2010 Assistant Treasurer of Fidelity's Equity and High Income Funds. Ms. Dorsey also serves as Deputy Treasurer of other Fidelity funds (2008- present) and is an employee of Fidelity Investments (2008-present). Previously, Ms. Dorsey served as Treasurer (2004-2008) of the JPMorgan Mutual Funds and Vice President (2004-2008) of JPMorgan Chase Bank. |
John R. Hebble (52) |
| Year of Election or Appointment: 2009 Assistant Treasurer of Fidelity's Equity and High Income Funds. Mr. Hebble also serves as Treasurer and Chief Financial Officer of The North Carolina Capital Management Trust: Cash and Term Portfolio (2008-present), President and Treasurer of other Fidelity funds (2008-present) and is an employee of Fidelity Investments. |
Gary W. Ryan (51) |
| Year of Election or Appointment: 2005 Assistant Treasurer of the Fidelity funds. Mr. Ryan is an employee of Fidelity Investments. Previously, Mr. Ryan served as Vice President of Fund Reporting in Fidelity Pricing and Cash Management Services (FPCMS) (1999-2005). |
Annual Report
Board Approval of Investment Advisory Contracts and Management Fees
Fidelity OTC Portfolio
Each year, the Board of Trustees, including the Independent Trustees (together, the Board), votes on the renewal of the management contract and sub-advisory agreements (together, the Advisory Contracts) for the fund. The Board, assisted by the advice of fund counsel and Independent Trustees' counsel, requests and considers a broad range of information relevant to the renewal of the Advisory Contracts throughout the year.
The Board meets regularly and considers at each of its meetings factors that are relevant to its annual consideration of the renewal of the fund's Advisory Contracts, including the services and support provided to the fund and its shareholders. The Board has established various standing committees, each composed of Independent Trustees with varying backgrounds, to which the Board has assigned specific subject matter responsibilities in order to enhance effective decision-making by the Board. The Board, acting directly and through its Committees, requests and receives information concerning the annual consideration of the renewal of the fund's Advisory Contracts. The Board also meets as needed to consider matters specifically related to the Board's annual consideration of the renewal of Advisory Contracts. Members of the Board may also meet with trustees of other Fidelity funds through ad hoc joint committees to discuss certain matters relevant to the Fidelity funds.
At its July 2010 meeting, the Board of Trustees, including the Independent Trustees, unanimously determined to renew the fund's Advisory Contracts. In reaching its determination, the Board considered all factors it believed relevant, including (i) the nature, extent, and quality of the services to be provided to the fund and its shareholders (including the investment performance of the fund); (ii) the competitiveness of the fund's management fee and total expenses; (iii) the total costs of the services to be provided by and the profits to be realized by Fidelity from its relationship with the fund; (iv) the extent to which economies of scale would be realized as the fund grows; and (v) whether fee levels reflect these economies of scale, if any, for the benefit of fund shareholders.
In considering whether to renew the Advisory Contracts for the fund, the Board reached a determination, with the assistance of fund counsel and Independent Trustees' counsel and through the exercise of its business judgment, that the renewal of the Advisory Contracts is in the best interests of fund shareholders and that the compensation to be received by Fidelity under the management contract is fair and reasonable. The Board's decision to renew the Advisory Contracts was not based on any single factor noted above, but rather was based on a comprehensive consideration of all the information provided to the Board at its meetings throughout the year. The Board, in reaching its determination to renew the Advisory Contracts, is aware that shareholders in the fund have a broad range of investment choices available to them, including a wide choice among mutual funds offered by Fidelity's competitors, and that the fund's shareholders, with the opportunity to review and weigh the disclosure provided by the fund in its prospectus and other public disclosures, have chosen to invest in this fund, managed by Fidelity.
Annual Report
Nature, Extent, and Quality of Services Provided. The Board considered the staffing within the investment adviser, FMR, and the sub-advisers (together, the Investment Advisers), including the backgrounds of the fund's investment personnel and the fund's investment objective and discipline. The Independent Trustees also had discussions with senior management of Fidelity's investment operations and investment groups. The Board considered the structure of the portfolio manager compensation program and whether this structure provides appropriate incentives to act in the best interest of the fund.
Resources Dedicated to Investment Management and Support Services. The Board and the equity research subcommittee of the Board's Fund Oversight Committee reviewed the size, education, and experience of the Investment Advisers' investment staff, their use of technology, and the Investment Advisers' approach to recruiting, training, and retaining portfolio managers and other research, advisory, and management personnel. The Board noted that Fidelity's analysts have access to a variety of technological tools and market and securities data that enable them to perform both fundamental and quantitative analysis and to specialize in various disciplines. The Board considered Fidelity's extensive global research capabilities that enable the Investment Advisers to aggregate data from various sources in an effort to produce positive investment results. The Board also considered that Fidelity's portfolio managers and analysts have access to daily portfolio attribution that allows for monitoring of a fund's portfolio, as well as an electronic communication system that provides immediate real-time access to research concerning issuers and credit enhancers. The Board noted FMR's continued focus on strengthening the organization and discipline of equity portfolio management and research.
Shareholder and Administrative Services. The Board considered (i) the nature, extent, quality, and cost of advisory, administrative, and shareholder services performed by the Investment Advisers and their affiliates under the Advisory Contracts and under separate agreements covering transfer agency, pricing and bookkeeping, and securities lending services for the fund; (ii) the nature and extent of the investment adviser's supervision of third party service providers, principally custodians and subcustodians; and (iii) the resources devoted to, and the record of compliance with, the fund's compliance policies and procedures. The Board also reviewed the allocation of fund brokerage, including allocations to brokers affiliated with the Investment Advisers, the use of brokerage commissions to pay fund expenses, and the use of "soft" commission dollars to pay for research services.
The Board noted that the growth of fund assets over time across the complex allows Fidelity to reinvest in the development of services designed to enhance the value or convenience of the Fidelity funds as investment vehicles. These services include 24-hour access to account information and market information through phone representatives and over the Internet, and investor education materials and asset allocation tools.
Annual Report
Board Approval of Investment Advisory Contracts and
Management Fees - continued
Investment in a Large Fund Family. The Board considered the benefits to shareholders of investing in a Fidelity fund, including the benefits of investing in a fund that is part of a large family of funds offering a variety of investment disciplines and providing a large variety of mutual fund investor services. The Board noted that Fidelity had taken, or had made recommendations that resulted in the Fidelity funds taking, a number of actions over the previous year that benefited particular funds, including (i) dedicating additional resources to investment research and restructuring and broadening the focus of the investment research teams; (ii) bolstering the senior management team that oversees asset management; (iii) launching Class F of certain funds as a lower-fee class available to Freedom K and Freedom Index Funds; (iv) lowering the initial investment minimums and ongoing balance requirements for Real Estate High Income Fund; (v) eliminating subsequent purchase minimums for all funds and adding a waiver of the investment minimum requirement for new accounts opened with the proceeds of a systematic withdrawal plan; (vi) eliminating the withdrawal minimum and maximum limits for systematic withdrawals from Advisor funds; (vii) expanding sales load waivers on Class A shares for Destiny Planholders and expanding Institutional Class eligibility for Class O Destiny Planholders; and (viii) changing certain Class A and Class T sales charge structures to further align them with industry practices.
Investment Performance. The Board considered whether the fund has operated in accordance with its investment objective, as well as its record of compliance with its investment restrictions. It also reviewed the fund's absolute investment performance for each class, as well as the fund's relative investment performance for each class measured over multiple periods against a broad-based securities market index. The Board noted that FMR does not believe that a meaningful peer group exists against which to compare the fund's performance. The following charts considered by the Board show, over the one-, three-, and five-year periods ended December 31, 2009, as available, the cumulative total returns of Class K and the retail class of the fund and the cumulative total returns of a broad-based securities market index ("benchmark").
Annual Report
Fidelity OTC Portfolio
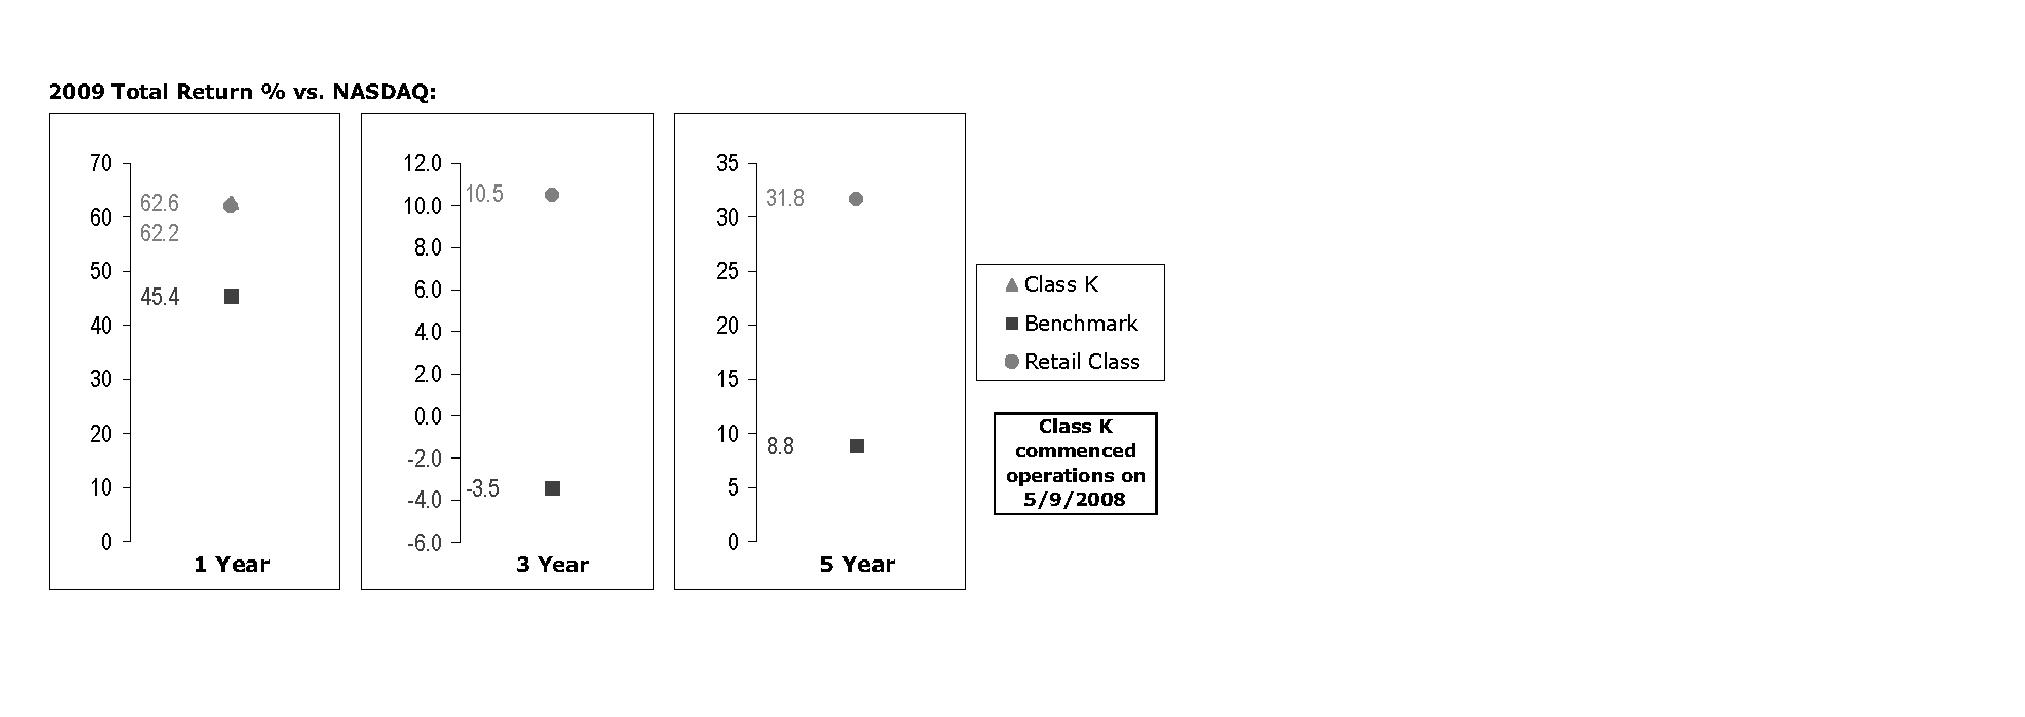
The Board noted that the investment performance of the retail class of the fund (the class with the longer performance record) compared favorably to its benchmark for all the periods shown. The Board also reviewed the fund's performance since inception as well as performance in the current year.
The Board also considered that the fund's management fee is subject to upward or downward adjustment depending upon whether, and to what extent, the fund's investment performance for the performance period exceeds, or is exceeded by, the record (over the same period) of a Board-approved performance adjustment index. The Board realizes that the performance adjustment provides FMR with a strong economic incentive to seek to achieve superior performance for the fund's shareholders and helps to more closely align the interests of FMR and the fund's shareholders.
Based on its review, and giving particular weight to the nature and quality of the resources dedicated by the Investment Advisers to maintain and improve relative performance and factoring in the unprecedented market events in recent years, the Board concluded that the nature, extent, and quality of investment management and support services and of shareholder and administrative services provided to the fund will benefit the fund's shareholders, particularly in light of the Board's view that the fund's shareholders benefit from investing in a fund that is part of a large family of funds offering a variety of investment disciplines and services.
Competitiveness of Management Fee and Total Fund Expenses. The Board considered the fund's management fee and total expenses compared to "mapped groups" of competitive funds and classes. Fidelity creates "mapped groups" by combining similar Lipper investment objective categories that have comparable management fee characteristics. Combining Lipper investment objective categories aids the Board's management fee and total expense comparisons by broadening the competitive group used for comparison and by reducing the number of universes to which various Fidelity funds are compared.
Annual Report
Board Approval of Investment Advisory Contracts and
Management Fees - continued
Management Fee. The Board considered two proprietary management fee comparisons for the 12-month periods shown in the chart below. The group of Lipper funds used by the Board for management fee comparisons is referred to below as the "Total Mapped Group." The Total Mapped Group comparison focuses on a fund's standing relative to the total universe of comparable funds available to investors, in terms of gross management fees before expense reimbursements or caps, and without giving effect to the fund's performance adjustment. "TMG %" represents the percentage of funds in the Total Mapped Group that had management fees that were lower than the fund's. For example, a TMG % of 17% means that 83% of the funds in the Total Mapped Group had higher management fees than the fund. The "Asset-Size Peer Group" (ASPG) comparison focuses on a fund's standing relative to non-Fidelity funds similar in size to the fund within the Total Mapped Group. The ASPG represents at least 15% of the funds in the Total Mapped Group with comparable asset size and management fee characteristics, subject to a minimum of 50 funds (or all funds in the Total Mapped Group if fewer than 50). Additional information, such as the ASPG quartile in which the fund's management fee ranked and the impact of the fund's performance adjustment, is also included in the chart and considered by the Board.
Fidelity OTC Portfolio
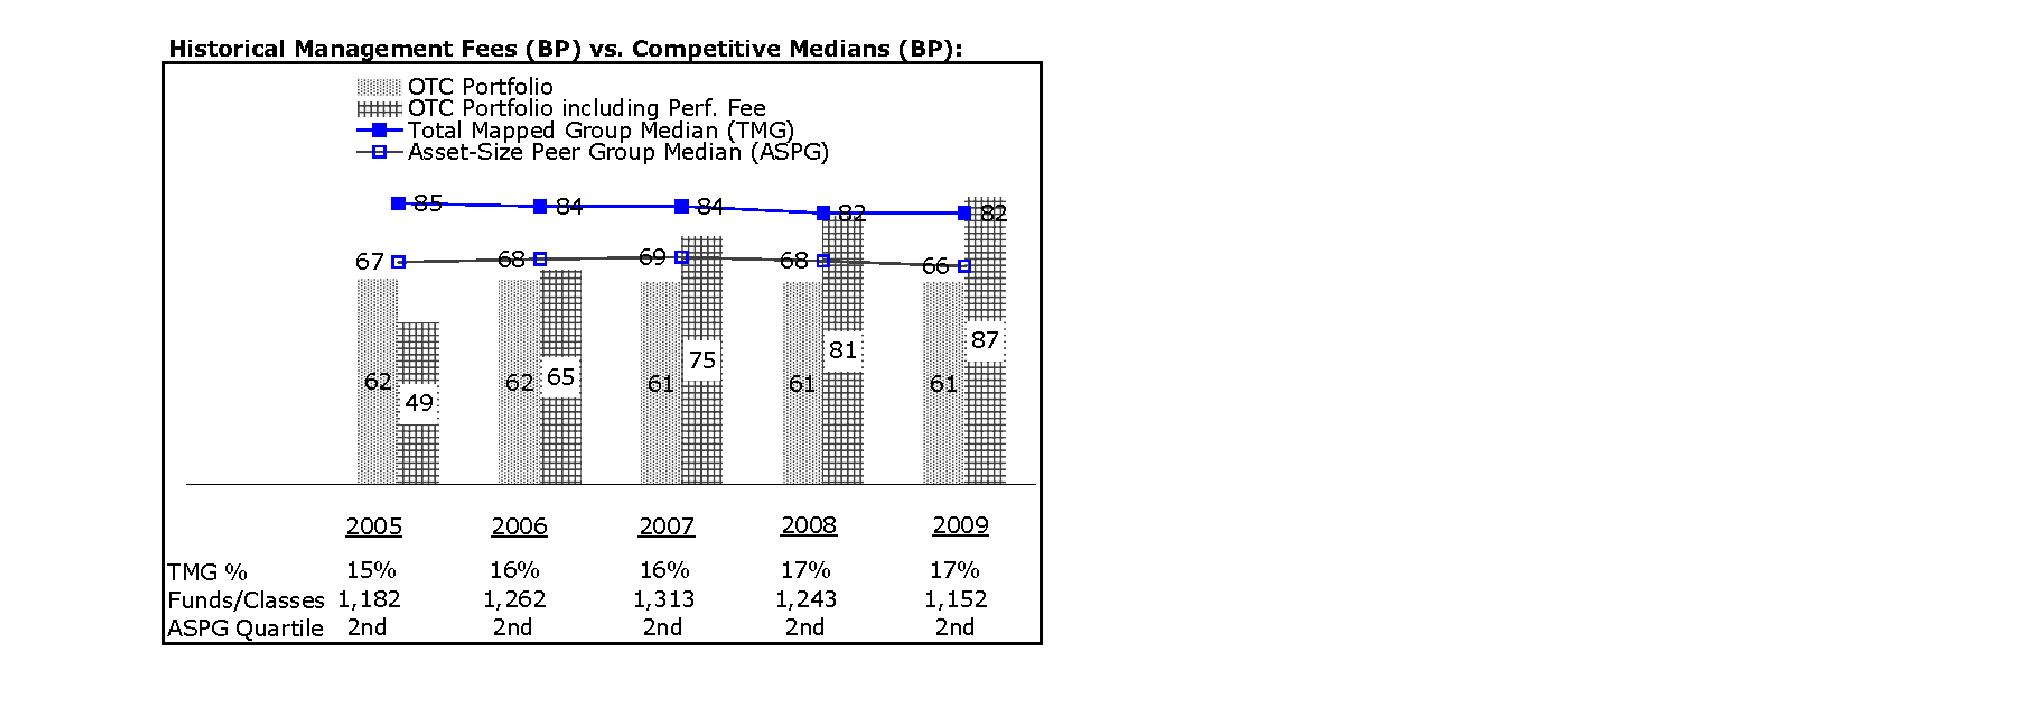
Annual Report
The Board noted that the fund's management fee ranked below the median of its Total Mapped Group and below the median of its ASPG for 2009. The Board also noted the effect of the fund's positive performance adjustment on the fund's management fee ranking. The Board noted that the performance adjustment for each year represents calculations for performance periods that differ from the periods shown in the performance charts above.
Based on its review, the Board concluded that the fund's management fee is fair and reasonable in light of the services that the fund receives and the other factors considered.
Total Expenses. In its review of each class's total expenses, the Board considered the fund's management fee as well as other fund or class expenses, as applicable, such as transfer agent fees, pricing and bookkeeping fees, and custodial, legal, and audit fees. The Board also noted the effects of any waivers and reimbursements on fees and expenses, as well as the impact of the fund's performance adjustment. As part of its review, the Board also considered current and historical total expenses of each class of the fund compared to competitive fund median expenses. Each class of the fund is compared to those funds and classes in the Total Mapped Group (used by the Board for management fee comparisons) that have a similar sales load structure.
The Board noted that the total expenses of each class ranked below its competitive median for 2009.
Fees Charged to Other Fidelity Clients. The Board also considered Fidelity fee structures and other information with respect to clients of FMR and its affiliates, such as other mutual funds advised or subadvised by FMR or its affiliates, pension plan clients, and other institutional clients. In March 2010, the Board created an ad hoc joint committee with the board of other Fidelity funds (the Committee) to review and compare Fidelity's institutional investment advisory business with its business of providing services to the Fidelity funds, including the differences in services provided, fees charged, and costs incurred, as well as competition in their respective marketplaces.
Based on its review of total expenses and fees charged to other Fidelity clients, the Board concluded that the total expenses of each class of the fund were reasonable in light of the services that the fund and its shareholders receive and the other factors considered, including the findings of the Committee.
Costs of the Services and Profitability. The Board considered the revenues earned and the expenses incurred by Fidelity in conducting the business of developing, marketing, distributing, managing, administering and servicing the fund and its shareholders. The Board also considered the level of Fidelity's profits in respect of all the Fidelity funds.
Annual Report
Board Approval of Investment Advisory Contracts and
Management Fees - continued
On an annual basis, FMR presents to the Board Fidelity's profitability for the fund. Fidelity calculates the profitability for each fund, as well as aggregate profitability for groups of Fidelity funds and all Fidelity funds, using a series of detailed revenue and cost allocation methodologies which originate with the audited books and records of Fidelity. The Audit Committee of the Board reviews any significant changes from the prior year's methodologies.
PricewaterhouseCoopers LLP (PwC), independent registered public accounting firm and auditor to Fidelity and certain Fidelity funds, has been engaged annually by the Board as part of the Board's assessment of Fidelity's profitability analysis. PwC's engagement includes the review and assessment of Fidelity's methodologies used in determining the revenues and expenses attributable to Fidelity's mutual fund business, and completion of agreed-upon procedures surrounding the mathematical accuracy of fund profitability and its conformity to allocation methodologies. After considering PwC's reports issued under the engagement and information provided by Fidelity, the Board believes that while other allocation methods may also be reasonable, Fidelity's profitability methodologies are reasonable in all material respects.
The Board has also reviewed Fidelity's non-fund businesses and fall-out benefits related to the mutual fund business as well as cases where Fidelity's affiliates may benefit from or be related to the fund's business.
The Board considered the costs of the services provided by and the profits realized by Fidelity in connection with the operation of the fund and were satisfied that the profitability was not excessive in the circumstances.
Economies of Scale. The Board considered whether there have been economies of scale in respect of the management of the Fidelity funds, whether the Fidelity funds (including the fund) have appropriately benefited from any such economies of scale, and whether there is potential for realization of any further economies of scale. The Board considered the extent to which the fund will benefit from economies of scale through increased services to the fund, through waivers or reimbursements, or through fee or expense reductions.
In February 2009, the Board and the board of other Fidelity funds created an ad hoc committee (the Economies of Scale Committee) to analyze whether FMR attains economies of scale in respect of the management and servicing of the Fidelity funds, whether the Fidelity funds have appropriately benefited from such economies of scale, and whether there is potential for realization of any further economies of scale.
The Board recognized that the fund's management contract incorporates a "group fee" structure, which provides for lower group fee rates as total fund assets under FMR's management increase, and for higher group fee rates as total fund assets under FMR's management decrease. FMR calculates the group fee rates based on a tiered asset "breakpoint" schedule that varies based on asset class. The Board considered that the group fee is designed to deliver the benefits of economies of scale to fund shareholders when total Fidelity fund assets increase, even if assets of any particular fund are unchanged or have declined, because some portion of Fidelity's costs are attributable to services provided to all Fidelity funds, and all funds benefit if those costs can be allocated among more assets. The Board concluded that, given the group fee structure, fund shareholders will benefit from lower management fees as assets under FMR's management increase at the fund complex level, regardless of whether Fidelity achieves any such economies of scale.
Annual Report
The Board concluded, considering the findings of the Economies of Scale Committee, that any potential economies of scale are being appropriately shared between fund shareholders and Fidelity.
Additional Information Requested by the Board. In order to develop fully the factual basis for consideration of the Fidelity funds' Advisory Contracts, the Board requested and received additional information on certain topics, including (i) fund performance trends, actions to be taken by FMR to improve certain funds' overall performance, and Fidelity's long-term strategies for certain funds; (ii) portfolio manager changes that have occurred during the past year and length of portfolio manager tenure for different categories of funds over time; (iii) Fidelity's compensation structure for portfolio managers, research analysts, and other key personnel, the rationale for the compensation structure, and how the compensation structure provides appropriate performance incentives; (iv) the amount of the investment that each portfolio manager has made in the Fidelity fund(s) that he or she manages; (v) management and other fees paid by FMR to affiliated sub-advisers on behalf of the Fidelity funds; (vi) Fidelity's fee structures and rationale for recommending different fees among different categories of funds; (vii) Fidelity's rationale for recommending which funds should have a performance adjustment component as part of their management fees; (viii) the rationale for any differences between fund fee structures and fee structures in place for other Fidelity clients; and (ix) explanations regarding the relative total expenses borne by certain funds and classes, total expense competitive trends, and actions that might be taken by FMR to reduce total expenses for certain funds and classes.
Based on its evaluation of all of the conclusions noted above, and after considering all factors it believed relevant, the Board ultimately concluded that the advisory fee structures are fair and reasonable, and that the fund's Advisory Contracts should be renewed.
Annual Report
Managing Your Investments
Fidelity offers several ways to conveniently manage your personal investments via your telephone or PC. You can access your account information, conduct trades and research your investments 24 hours a day.
By Phone
Fidelity Automated Service Telephone provides a single toll-free number to access account balances, positions, quotes and trading. It's easy to navigate the service, and on your first call, the system will help you create a personal identification number (PIN) for security.
(phone_graphic)
Fidelity Automated
Service Telephone (FAST®)
1-800-544-5555
Press
For mutual fund and brokerage trading.
For quotes.*
For account balances and holdings.
To review orders and mutual
fund activity.
To change your PIN.
To speak to a Fidelity representative.
By PC
Fidelity's web site on the Internet provides a wide range of information, including daily financial news, fund performance, interactive planning tools and news about Fidelity products and services.
(computer_graphic)
Fidelity's Web Site
www.fidelity.com
* When you call the quotes line, please remember that a fund's yield and return will vary and, except for money market funds, share price will also vary. This means that you may have a gain or loss when you sell your shares. There is no assurance that money market funds will be able to maintain a stable $1 share price; an investment in a money market fund is not insured or guaranteed by the U.S. government. Total returns are historical and include changes in share price, reinvestment of dividends and capital gains, and the effects of any sales charges.
Annual Report
To Write Fidelity
We'll give your correspondence immediate attention and send you written confirmation upon completion of your request.
(letter_graphic)
Making Changes
To Your Account
(such as changing name, address, bank, etc.)
Fidelity Investments
P.O. Box 770001
Cincinnati, OH 45277-0002
(letter_graphic)
For Non-Retirement
Accounts
Buying shares
Fidelity Investments
P.O. Box 770001
Cincinnati, OH 45277-0003
Overnight Express
Fidelity Investments
Attn: Distribution Services
100 Crosby Parkway - KC1H
Covington, KY 41015
Selling shares
Fidelity Investments
P.O. Box 770001
Cincinnati, OH 45277-0035
Overnight Express
Fidelity Investments
Attn: Distribution Services
100 Crosby Parkway - KC1H
Covington, KY 41015
General Correspondence
Fidelity Investments
P.O. Box 500
Merrimack, NH 03054-0500
(letter_graphic)
For Retirement
Accounts
Buying shares
Fidelity Investments
P.O. Box 770001
Cincinnati, OH 45277-0003
Selling shares
Fidelity Investments
P.O. Box 770001
Cincinnati, OH 45277-0035
Overnight Express
Fidelity Investments
Attn: Distribution Services
100 Crosby Parkway - KC1H
Covington, KY 41015
General Correspondence
Fidelity Investments
P.O. Box 500
Merrimack, NH 03054-0500
Annual Report
Investment Adviser
Fidelity Management & Research Company
Boston, MA
Investment Sub-Advisers
FMR Co., Inc.
Fidelity Research & Analysis Company
Fidelity Management & Research
(U.K.) Inc.
Fidelity Management & Research
(Hong Kong) Limited
Fidelity Management & Research
(Japan) Inc.
General Distributor
Fidelity Distributors Corporation
Boston, MA
Transfer and Service Agents
Fidelity Investments Institutional
Operations Company, Inc.
Boston, MA
Fidelity Service Company, Inc.
Boston, MA
Custodian
The Northern Trust Company
Chicago, IL
The Fidelity Telephone Connection
Mutual Fund 24-Hour Service
Exchanges/Redemptions
and Account Assistance 1-800-544-6666
Product Information 1-800-544-6666
Retirement Accounts 1-800-544-4774
(8 a.m. - 9 p.m.)
TDD Service 1-800-544-0118
for the deaf and hearing impaired
(9 a.m. - 9 p.m. Eastern time)
Fidelity Automated Service
Telephone (FAST®) 1-800-544-5555
Automated line for quickest service
OTC-UANN-0910
1.789250.107
Fidelity®
OTC
Portfolio -
Class K
Annual Report
July 31, 2010
(2_fidelity_logos) (Registered_Trademark)
Contents
Chairman's Message | <Click Here> | The Chairman's message to shareholders. |
Performance | <Click Here> | How the fund has done over time. |
Management's Discussion of Fund Performance | <Click Here> | The Portfolio Manager's review of fund
performance and strategy. |
Shareholder Expense Example | <Click Here> | An example of shareholder expenses. |
Investment Changes | <Click Here> | A summary of major shifts in the fund's investments over the past six months. |
Investments | <Click Here> | A complete list of the fund's investments with their market values. |
Financial Statements | <Click Here> | Statements of assets and liabilities, operations, and changes in net assets, as well as financial highlights. |
Notes | <Click Here> | Notes to the financial statements. |
Report of Independent Registered Public Accounting Firm | <Click Here> | |
Trustees and Officers | <Click Here> | |
Board Approval of Investment Advisory Contracts and Management Fees | <Click Here> | |
To view a fund's proxy voting guidelines and proxy voting record for the 12-month period ended June 30, visit http://www.fidelity.com/proxyvotingresults or visit the Securities and Exchange Commission's (SEC) web site at http://www.sec.gov. You may also call 1-800-835-5092 to request a free copy of the proxy voting guidelines.
Standard & Poor's, S&P and S&P 500 are registered service marks of The McGraw-Hill Companies, Inc. and have been licensed for use by Fidelity Distributors Corporation.
Other third party marks appearing herein are the property of their respective owners.
All other marks appearing herein are registered or unregistered trademarks or service marks of FMR LLC or an affiliated company.
Annual Report
This report and the financial statements contained herein are submitted for the general information of the shareholders of the fund. This report is not authorized for distribution to prospective investors in the fund unless preceded or accompanied by an effective prospectus.
A fund files its complete schedule of portfolio holdings with the SEC for the first and third quarters of each fiscal year on Form N-Q. Forms N-Q are available on the SEC's web site at http://www.sec.gov. A fund's Forms N-Q may be reviewed and copied at the SEC's Public Reference Room in Washington, DC. Information regarding the operation of the SEC's Public Reference Room may be obtained by calling 1-800-SEC-0330. For a complete list of a fund's portfolio holdings, view the most recent holdings listing, semiannual report, or annual report on Fidelity's web site at http://www.fidelity.com or http://www.advisor.fidelity.com, as applicable.
NOT FDIC INSURED • MAY LOSE VALUE • NO BANK GUARANTEE
Neither the fund nor Fidelity Distributors Corporation is a bank.
Annual Report
(photo_of_Edward_C_Johnson_3d)
Dear Shareholder:
A yearlong uptrend in global equity markets reversed course in late April 2010 when investor sentiment turned bearish due in great measure to concern that Europe's debt crisis would expand and slow or derail economic recovery. However, a bounceback in July helped to recover some of the ground that was lost. Financial markets are always unpredictable, of course, but there also are several time-tested investment principles that can help put the odds in your favor.
One of the basic tenets is to invest for the long term. Over time, riding out the markets' inevitable ups and downs has proven much more effective than selling into panic or chasing the hottest trend. Even missing only a few of the markets' best days can significantly diminish investor returns. Patience also affords the benefits of compounding - of earning interest on additional income or reinvested dividends and capital gains. There can be tax advantages and cost benefits to consider as well. While staying the course doesn't eliminate risk, it can considerably lessen the effect of short-term declines.
You can further manage your investing risk through diversification. And today, more than ever, geographic diversification should be taken into account. Studies indicate that asset allocation is the single most important determinant of a portfolio's long-term success. The right mix of stocks, bonds and cash - aligned to your particular risk tolerance and investment objective - is very important. Age-appropriate rebalancing is also an essential aspect of asset allocation. For younger investors, an emphasis on equities - which historically have been the best-performing asset class over time - is encouraged. As investors near their specific goal, such as retirement or sending a child to college, consideration may be given to replacing volatile assets (e.g. common stocks) with more-stable fixed investments (bonds or savings plans).
A third principle - investing regularly - can help lower the average cost of your purchases. Investing a certain amount of money each month or quarter helps ensure you won't pay for all your shares at market highs. This strategy - known as dollar cost averaging - also reduces "emotion" from investing, helping shareholders avoid selling weak performers just prior to an upswing, or chasing a hot performer just before a correction.
We invite you to contact us via the Internet, through our Investor Centers or by phone. It is our privilege to provide you the information you need to make the investments that are right for you.
Sincerely,
(The chairman's signature appears here.)
Edward C. Johnson 3d
Annual Report
Average annual total return reflects the change in the value of an investment, assuming reinvestment of the class' distributions from dividend income and capital gains (the profits earned upon the sale of securities that have grown in value, if any) and assuming a constant rate of performance each year. The $10,000 table and the fund's returns do not reflect the deduction of taxes that a shareholder would pay on fund distributions or the redemption of fund shares. During periods of reimbursement by Fidelity, a fund's total return will be greater than it would be had the reimbursement not occurred. How a fund did yesterday is no guarantee of how it will do tomorrow.
Average Annual Total Returns
Periods ended July 31, 2010 | Past 1
year | Past 5
years | Past 10
years |
Class KA | 16.38% | 4.66% | -2.28% |
A The initial offering of Class K shares took place on May 9, 2008. Returns prior to May 9, 2008 are those of Fidelity® OTC Portfolio, the original class of the fund.
$10,000 Over 10 Years
Let's say hypothetically that $10,000 was invested in Fidelity® OTC Portfolio - Class K on July 31, 2000. The chart shows how the value of your investment would have changed, and also shows how the Nasdaq Composite® Index performed over the same period. The initial offering of Class K took place on May 9, 2008. See above for additional information regarding the performance of Class K.
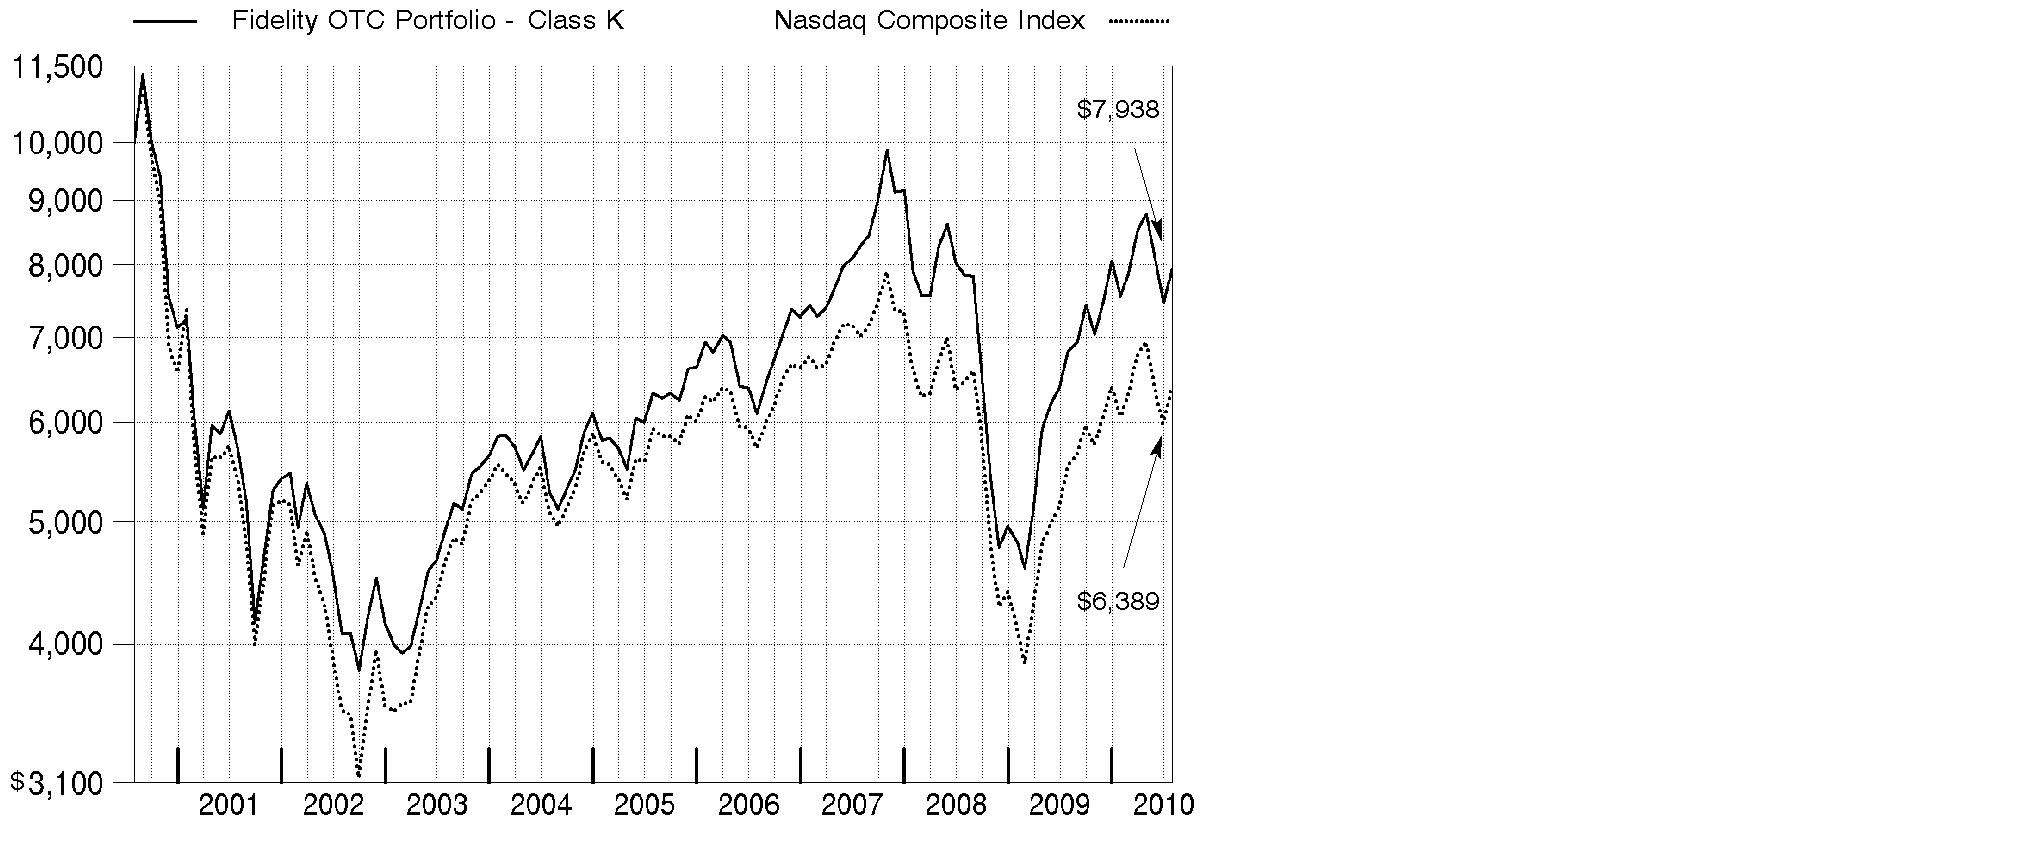
Annual Report
Market Recap: U.S. stock markets saw double-digit gains for the year ending July 31, 2010, despite the return of market volatility and risk aversion during the first half of 2010. An impressive bull run continued through 2009, bolstered by improvement in the economy and credit markets. Early in the new year, however, stocks fell sharply amid concerns about the global economic recovery, fueled by European debt woes and China's efforts to restrain inflation. After this brief dip, markets regained their upward momentum, as government stimulus and significant corporate cost cutting led to encouraging earnings reports, improved credit conditions and rising consumer confidence. Positive news continued through mid-April, when the Dow Jones Industrial AverageSM pushed above the 11,000 mark for the first time in 19 months. That milestone was short-lived, however, as heightened concern about the European debt crisis sparked an abrupt sell-off in May, leading to the first official correction since the rally began in March 2009. Although the market's malaise continued through June, stocks saw solid gains in July. For the year, the Dow rose 17.28%, while the S&P 500® Index was up 13.84%. Elsewhere, the technology-laden Nasdaq Composite® Index returned 15.05%. Small- and mid-cap stocks performed best, as measured by the 18.43% increase of the Russell 2000® Index and the 23.21% gain of the Russell Midcap® Index.
Comments from Gavin Baker, Portfolio Manager of Fidelity® OTC Portfolio: During the past year, the fund's Class K shares returned 16.38%, topping the Nasdaq Composite Index. Versus the index, stock picking in the transportation segment of industrials helped, as did security selection in consumer discretionary, financials and health care. At the stock level, UAL, parent company of United Airlines, was the fund's top relative contributor, with our holdings in the stock more than tripling in price. Other contributors included wireless carrier Sprint Nextel - a large out-of-index position - Starent Networks, a provider of equipment to manage mobile data, which was acquired in December; yoga-inspired women's apparel retailer lululemon athletica; and computer/consumer electronics maker Apple, by far the fund's largest holding at period end. Underweighting biotech company Gilead Sciences also bolstered results. Conversely, my picks in information technology and energy hurt. The largest relative detractor was smart phone manufacturer Palm, which had good products but suffered from operational miscues and undercapitalization, and was acquired in July. Graphics chip producer NVIDIA, China-based online game provider Perfect World and solar power components makers First Solar and MEMC Electronic Materials - the latter of which I sold - also detracted.
The views expressed above reflect those of the portfolio manager(s) only through the end of the period as stated on the cover of this report and do not necessarily represent the views of Fidelity or any other person in the Fidelity organization. Any such views are subject to change at any time based upon market or other conditions and Fidelity disclaims any responsibility to update such views. These views may not be relied on as investment advice and, because investment decisions for a Fidelity fund are based on numerous factors, may not be relied on as an indication of trading intent on behalf of any Fidelity fund.
Annual Report
Shareholder Expense Example
As a shareholder of the Fund, you incur two types of costs: (1) transaction costs, and (2) ongoing costs, including management fees and other Fund expenses. This Example is intended to help you understand your ongoing costs (in dollars) of investing in the Fund and to compare these costs with the ongoing costs of investing in other mutual funds.
The Example is based on an investment of $1,000 invested at the beginning of the period and held for the entire period (February 1, 2010 to July 31, 2010).
Actual Expenses
The first line of the accompanying table for each class of the Fund provides information about actual account values and actual expenses. You may use the information in this line, together with the amount you invested, to estimate the expenses that you paid over the period. Simply divide your account value by $1,000.00 (for example, an $8,600 account value divided by $1,000.00 = 8.6), then multiply the result by the number in the first line for a class of the Fund under the heading entitled "Expenses Paid During Period" to estimate the expenses you paid on your account during this period. A small balance maintenance fee of $12.00 that is charged once a year may apply for certain accounts with a value of less than $2,000. This fee is not included in the table below. If it was, the estimate of expenses you paid during the period would be higher, and your ending account value lower, by this amount. In addition, the Fund, as a shareholder in the underlying Fidelity Central Funds, will indirectly bear its pro-rata share of the fees and expenses incurred by the underlying Fidelity Central Funds. These fees and expenses are not included in the Fund's annualized expense ratio used to calculate the expense estimate in the table below.
Hypothetical Example for Comparison Purposes
The second line of the accompanying table for each class of the Fund provides information about hypothetical account values and hypothetical expenses based on a Class' actual expense ratio and an assumed rate of return of 5% per year before expenses, which is not the Class' actual return. The hypothetical account values and expenses may not be used to estimate the actual ending account balance or expenses you paid for the period. You may use this information to compare the ongoing costs of investing in the Fund and other funds. To do so, compare this 5% hypothetical example with the 5% hypothetical examples that appear in the shareholder reports of the other funds. A small balance maintenance fee of $12.00 that is charged once a year may apply for certain accounts with a value of less than $2,000. This fee is not included in the table below. If it was, the estimate of expenses you paid during the period would be higher, and your ending account value lower, by this amount. In addition, the Fund, as a shareholder in the underlying Fidelity Central Funds, will indirectly bear its pro-rata share of the fees and expenses incurred by the underlying Fidelity Central Funds. These fees and expenses are not included in the Fund's annualized expense ratio used to calculate the expense estimate in the table below.
Please note that the expenses shown in the table are meant to highlight your ongoing costs only and do not reflect any transaction costs. Therefore, the second line of the table is useful in comparing ongoing costs only, and will not help you determine the relative total costs of owning different funds.
Annual Report
| Annualized Expense Ratio | Beginning
Account Value
February 1, 2010 | Ending
Account Value
July 31, 2010 | Expenses Paid
During Period*
February 1, 2010
to July 31, 2010 |
OTC | 1.02% | | | |
Actual | | $ 1,000.00 | $ 1,050.70 | $ 5.19 |
HypotheticalA | | $ 1,000.00 | $ 1,019.74 | $ 5.11 |
Class K | .88% | | | |
Actual | | $ 1,000.00 | $ 1,051.40 | $ 4.48 |
HypotheticalA | | $ 1,000.00 | $ 1,020.43 | $ 4.41 |
A 5% return per year before expenses
* Expenses are equal to each Class' annualized expense ratio, multiplied by the average account value over the period, multiplied by 181/365 (to reflect the one-half year period).
Annual Report
Investment Changes (Unaudited)
Top Ten Stocks as of July 31, 2010 |
| % of fund's
net assets | % of fund's net assets
6 months ago |
Apple, Inc. | 8.4 | 6.3 |
Microsoft Corp. | 4.8 | 8.1 |
Google, Inc. Class A | 4.6 | 4.7 |
Cisco Systems, Inc. | 3.7 | 1.3 |
Sprint Nextel Corp. | 3.3 | 2.5 |
Oracle Corp. | 3.2 | 3.4 |
QUALCOMM, Inc. | 2.4 | 2.5 |
Rackspace Hosting, Inc. | 2.4 | 0.2 |
Amazon.com, Inc. | 1.9 | 1.8 |
NVIDIA Corp. | 1.9 | 2.3 |
| 36.6 | |
Top Five Market Sectors as of July 31, 2010 |
| % of fund's
net assets | % of fund's net assets
6 months ago |
Information Technology | 53.6 | 50.1 |
Health Care | 13.5 | 17.0 |
Consumer Discretionary | 11.2 | 11.1 |
Financials | 7.8 | 8.5 |
Industrials | 5.6 | 5.6 |
Asset Allocation (% of fund's net assets) |
As of July 31, 2010 * | As of January 31, 2010 ** |
| Stocks 100.3% | | | Stocks 99.7% | |
| Short-Term
Investments and
Net Other Assets † (0.3)% | | | Short-Term
Investments and
Net Other Assets 0.3% | |
* Foreign investments | 10.6% | | ** Foreign investments | 10.4% | |

† Short-Term Investments and Net Other Assets are not included in the pie chart. |
Annual Report
Investments July 31, 2010
Showing Percentage of Net Assets
Common Stocks - 100.3% |
| Shares | | Value (000s) |
CONSUMER DISCRETIONARY - 11.2% |
Automobiles - 0.2% |
Bayerische Motoren Werke AG (BMW) ADR | 518,800 | | $ 9,302 |
Diversified Consumer Services - 0.8% |
Coinstar, Inc. (a) | 264,600 | | 12,039 |
Strayer Education, Inc. (d) | 156,203 | | 37,395 |
| | 49,434 |
Hotels, Restaurants & Leisure - 1.4% |
BJ's Restaurants, Inc. (a) | 569,500 | | 14,522 |
Ctrip.com International Ltd. sponsored ADR (a) | 175,000 | | 7,046 |
Starbucks Corp. | 1,680,000 | | 41,748 |
Wyndham Worldwide Corp. | 335,400 | | 8,563 |
Wynn Resorts Ltd. | 148,400 | | 13,012 |
| | 84,891 |
Household Durables - 0.9% |
iRobot Corp. (a)(d)(e) | 1,688,286 | | 34,374 |
Lennar Corp. Class A | 231,900 | | 3,425 |
Pulte Group, Inc. (a) | 598,300 | | 5,253 |
Techtronic Industries Co. Ltd. | 14,996,500 | | 12,376 |
| | 55,428 |
Internet & Catalog Retail - 2.6% |
Amazon.com, Inc. (a) | 978,600 | | 115,367 |
Expedia, Inc. | 598,200 | | 13,567 |
Netflix, Inc. (a) | 250,500 | | 25,689 |
| | 154,623 |
Media - 1.9% |
Comcast Corp. Class A | 2,109,900 | | 41,080 |
DIRECTV (a) | 936,700 | | 34,808 |
Discovery Communications, Inc. (a) | 208,000 | | 8,031 |
Lamar Advertising Co. Class A (a) | 829,600 | | 22,690 |
Liberty Global, Inc. Class A (a)(d) | 351,800 | | 10,290 |
| | 116,899 |
Specialty Retail - 1.9% |
Bed Bath & Beyond, Inc. (a) | 1,174,300 | | 44,482 |
Citi Trends, Inc. (a) | 564,437 | | 17,718 |
Coldwater Creek, Inc. (a)(d) | 1,949,900 | | 7,644 |
O'Reilly Automotive, Inc. (a) | 408,700 | | 20,141 |
Staples, Inc. | 454,700 | | 9,244 |
Common Stocks - continued |
| Shares | | Value (000s) |
CONSUMER DISCRETIONARY - continued |
Specialty Retail - continued |
Ulta Salon, Cosmetics & Fragrance, Inc. (a) | 224,900 | | $ 5,681 |
Urban Outfitters, Inc. (a) | 369,900 | | 11,896 |
| | 116,806 |
Textiles, Apparel & Luxury Goods - 1.5% |
Deckers Outdoor Corp. (a) | 769,300 | | 39,150 |
lululemon athletica, Inc. (a)(d) | 826,473 | | 34,282 |
Polo Ralph Lauren Corp. Class A | 186,600 | | 14,743 |
| | 88,175 |
TOTAL CONSUMER DISCRETIONARY | | 675,558 |
CONSUMER STAPLES - 0.5% |
Beverages - 0.1% |
Hansen Natural Corp. (a) | 139,400 | | 5,839 |
Food & Staples Retailing - 0.4% |
Whole Foods Market, Inc. (a) | 629,400 | | 23,898 |
TOTAL CONSUMER STAPLES | | 29,737 |
ENERGY - 1.8% |
Energy Equipment & Services - 1.4% |
Baker Hughes, Inc. | 170,300 | | 8,220 |
ION Geophysical Corp. (a) | 3,241,700 | | 14,231 |
Oceaneering International, Inc. (a) | 128,900 | | 6,378 |
Schlumberger Ltd. | 395,400 | | 23,590 |
T-3 Energy Services, Inc. (a) | 639,200 | | 16,210 |
Weatherford International Ltd. (a) | 978,900 | | 15,858 |
| | 84,487 |
Oil, Gas & Consumable Fuels - 0.4% |
Carrizo Oil & Gas, Inc. (a) | 678,600 | | 13,307 |
Massey Energy Co. | 233,000 | | 7,125 |
Rosetta Resources, Inc. (a) | 144,600 | | 3,191 |
| | 23,623 |
TOTAL ENERGY | | 108,110 |
FINANCIALS - 7.8% |
Commercial Banks - 5.0% |
Associated Banc-Corp. | 2,125,900 | | 28,891 |
Banco Santander SA sponsored ADR | 843,300 | | 10,769 |
Common Stocks - continued |
| Shares | | Value (000s) |
FINANCIALS - continued |
Commercial Banks - continued |
CVB Financial Corp. (d) | 628,500 | | $ 6,398 |
FirstMerit Corp. | 1,075,500 | | 21,198 |
Fulton Financial Corp. | 121,300 | | 1,105 |
Huntington Bancshares, Inc. | 7,826,500 | | 47,429 |
National Penn Bancshares, Inc. | 1,094,600 | | 7,290 |
Popular, Inc. (a) | 3,821,800 | | 10,969 |
Regions Financial Corp. | 1,587,600 | | 11,637 |
Susquehanna Bancshares, Inc., Pennsylvania | 144,100 | | 1,246 |
SVB Financial Group (a) | 376,700 | | 16,270 |
Wells Fargo & Co. | 3,461,200 | | 95,979 |
Zions Bancorporation | 1,792,900 | | 39,784 |
| | 298,965 |
Diversified Financial Services - 1.7% |
Citigroup, Inc. (a) | 16,050,700 | | 65,808 |
CME Group, Inc. | 88,500 | | 24,674 |
JPMorgan Chase & Co. | 269,300 | | 10,847 |
NBH Holdings Corp. Class A (a)(f) | 110,800 | | 2,161 |
| | 103,490 |
Insurance - 0.5% |
CNinsure, Inc. ADR (d) | 507,200 | | 11,960 |
Genworth Financial, Inc. Class A (a) | 1,000,000 | | 13,580 |
Protective Life Corp. | 284,700 | | 6,403 |
| | 31,943 |
Thrifts & Mortgage Finance - 0.6% |
First Niagara Financial Group, Inc. | 1,280,500 | | 17,172 |
The PMI Group, Inc. (a) | 749,300 | | 2,345 |
Washington Federal, Inc. | 965,870 | | 16,806 |
| | 36,323 |
TOTAL FINANCIALS | | 470,721 |
HEALTH CARE - 13.5% |
Biotechnology - 8.2% |
Alexion Pharmaceuticals, Inc. (a) | 817,860 | | 44,459 |
Allos Therapeutics, Inc. (a)(d) | 1,542,800 | | 7,436 |
Alnylam Pharmaceuticals, Inc. (a) | 574,300 | | 8,816 |
Amgen, Inc. (a) | 1,269,300 | | 69,215 |
Amylin Pharmaceuticals, Inc. (a) | 1,544,809 | | 29,228 |
ARIAD Pharmaceuticals, Inc. (a) | 2,536,300 | | 8,116 |
Common Stocks - continued |
| Shares | | Value (000s) |
HEALTH CARE - continued |
Biotechnology - continued |
BioMarin Pharmaceutical, Inc. (a) | 728,600 | | $ 15,920 |
Cephalon, Inc. (a) | 129,900 | | 7,372 |
Cepheid, Inc. (a) | 678,900 | | 11,236 |
Dendreon Corp. (a) | 1,283,600 | | 42,243 |
Genzyme Corp. (a) | 709,100 | | 49,325 |
Gilead Sciences, Inc. (a) | 1,164,600 | | 38,804 |
Human Genome Sciences, Inc. (a) | 2,523,612 | | 65,462 |
ImmunoGen, Inc. (a) | 297,309 | | 2,804 |
Inhibitex, Inc. (a)(d) | 2,000,000 | | 3,780 |
InterMune, Inc. (a) | 528,037 | | 5,154 |
Isis Pharmaceuticals, Inc. (a) | 1,523,949 | | 15,072 |
NPS Pharmaceuticals, Inc. (a) | 1,127,600 | | 7,803 |
OREXIGEN Therapeutics, Inc. (a)(d) | 1,970,400 | | 10,246 |
Pharmasset, Inc. (a) | 179,000 | | 4,835 |
Seattle Genetics, Inc. (a) | 1,465,403 | | 17,849 |
Targacept, Inc. (a) | 226,549 | | 4,900 |
Vertex Pharmaceuticals, Inc. (a) | 713,988 | | 24,033 |
| | 494,108 |
Health Care Equipment & Supplies - 2.7% |
Abiomed, Inc. (a)(d) | 1,512,372 | | 16,772 |
AGA Medical Holdings, Inc. | 318,300 | | 4,612 |
Alphatec Holdings, Inc. (a)(e) | 5,168,467 | | 21,863 |
Mako Surgical Corp. (a)(d) | 1,184,063 | | 12,989 |
Masimo Corp. | 557,600 | | 12,869 |
NuVasive, Inc. (a) | 591,000 | | 19,367 |
Thoratec Corp. (a) | 1,926,815 | | 70,868 |
| | 159,340 |
Health Care Providers & Services - 0.0% |
Accretive Health, Inc. | 77,300 | | 919 |
Health Care Technology - 0.4% |
athenahealth, Inc. (a)(d) | 373,800 | | 10,380 |
SXC Health Solutions Corp. (a) | 224,200 | | 15,363 |
| | 25,743 |
Life Sciences Tools & Services - 1.5% |
Illumina, Inc. (a) | 1,177,192 | | 52,774 |
Illumina, Inc.: | | | |
warrants 11/20/10 (a)(g) | 709,552 | | 8,290 |
Common Stocks - continued |
| Shares | | Value (000s) |
HEALTH CARE - continued |
Life Sciences Tools & Services - continued |
Illumina, Inc.: - continued | | | |
warrants 1/19/11 (a)(g) | 905,834 | | $ 10,586 |
QIAGEN NV (a) | 833,400 | | 15,601 |
| | 87,251 |
Pharmaceuticals - 0.7% |
Elan Corp. PLC sponsored ADR (a) | 1,562,051 | | 7,451 |
Teva Pharmaceutical Industries Ltd. sponsored ADR | 732,373 | | 35,776 |
| | 43,227 |
TOTAL HEALTH CARE | | 810,588 |
INDUSTRIALS - 5.6% |
Aerospace & Defense - 0.5% |
AeroVironment, Inc. (a)(d) | 570,051 | | 13,630 |
BE Aerospace, Inc. (a) | 299,300 | | 8,799 |
Precision Castparts Corp. | 81,300 | | 9,934 |
| | 32,363 |
Air Freight & Logistics - 0.4% |
C.H. Robinson Worldwide, Inc. | 355,200 | | 23,159 |
Airlines - 2.2% |
Continental Airlines, Inc. Class B (a) | 1,012,684 | | 25,337 |
Delta Air Lines, Inc. (a) | 2,276,600 | | 27,046 |
UAL Corp. (a)(d) | 3,355,200 | | 79,652 |
| | 132,035 |
Construction & Engineering - 0.8% |
Fluor Corp. | 201,400 | | 9,726 |
Foster Wheeler AG (a) | 1,081,900 | | 24,905 |
Jacobs Engineering Group, Inc. (a) | 392,800 | | 14,365 |
| | 48,996 |
Electrical Equipment - 0.1% |
Fushi Copperweld, Inc. (a) | 742,900 | | 6,285 |
Machinery - 1.2% |
Altra Holdings, Inc. (a) | 387,800 | | 5,623 |
Bucyrus International, Inc. Class A | 455,500 | | 28,341 |
PACCAR, Inc. | 829,999 | | 38,031 |
| | 71,995 |
Road & Rail - 0.1% |
Saia, Inc. (a) | 300,000 | | 4,530 |
Common Stocks - continued |
| Shares | | Value (000s) |
INDUSTRIALS - continued |
Trading Companies & Distributors - 0.3% |
DXP Enterprises, Inc. (a) | 312,715 | | $ 6,420 |
Interline Brands, Inc. (a) | 409,400 | | 7,406 |
Rush Enterprises, Inc. Class A (a) | 258,100 | | 3,856 |
| | 17,682 |
TOTAL INDUSTRIALS | | 337,045 |
INFORMATION TECHNOLOGY - 53.6% |
Communications Equipment - 8.0% |
Acme Packet, Inc. (a) | 279,300 | | 7,893 |
Cisco Systems, Inc. (a) | 9,624,500 | | 222,037 |
QUALCOMM, Inc. | 3,824,500 | | 145,637 |
Research In Motion Ltd. (a) | 1,057,000 | | 60,809 |
Riverbed Technology, Inc. (a) | 972,750 | | 36,079 |
ViaSat, Inc. (a) | 239,200 | | 8,645 |
| | 481,100 |
Computers & Peripherals - 10.8% |
Apple, Inc. (a) | 1,967,900 | | 506,240 |
Hewlett-Packard Co. | 317,300 | | 14,608 |
HTC Corp. | 1,177,850 | | 21,651 |
Isilon Systems, Inc. (a) | 1,275,983 | | 22,381 |
NetApp, Inc. (a) | 1,487,900 | | 62,938 |
SanDisk Corp. (a) | 465,950 | | 20,362 |
Seagate Technology (a) | 202,500 | | 2,541 |
| | 650,721 |
Electronic Equipment & Components - 0.5% |
FLIR Systems, Inc. (a) | 925,100 | | 27,531 |
Prime View International Co. Ltd. sponsored GDR (a)(f) | 44,300 | | 643 |
| | 28,174 |
Internet Software & Services - 8.6% |
eBay, Inc. (a) | 3,217,600 | | 67,280 |
Google, Inc. Class A (a) | 565,681 | | 274,270 |
LogMeIn, Inc. | 806,653 | | 22,990 |
Monster Worldwide, Inc. (a) | 231,100 | | 3,171 |
OpenTable, Inc. (a) | 135,800 | | 6,070 |
Rackspace Hosting, Inc. (a)(d)(e) | 7,614,300 | | 142,387 |
| | 516,168 |
IT Services - 2.2% |
Cognizant Technology Solutions Corp. Class A (a) | 1,498,845 | | 81,777 |
Common Stocks - continued |
| Shares | | Value (000s) |
INFORMATION TECHNOLOGY - continued |
IT Services - continued |
Echo Global Logistics, Inc. (d) | 242,900 | | $ 2,905 |
hiSoft Technology International Ltd. ADR (a) | 416,300 | | 4,996 |
iGate Corp. | 883,762 | | 15,687 |
MasterCard, Inc. Class A | 68,800 | | 14,451 |
Visa, Inc. Class A | 166,600 | | 12,220 |
| | 132,036 |
Semiconductors & Semiconductor Equipment - 8.5% |
Advanced Micro Devices, Inc. (a)(d) | 6,634,400 | | 49,692 |
Amkor Technology, Inc. (a)(d) | 1,614,027 | | 9,313 |
ASML Holding NV | 1,087,100 | | 34,994 |
Cree, Inc. (a) | 173,900 | | 12,319 |
Cypress Semiconductor Corp. (a) | 803,050 | | 8,512 |
First Solar, Inc. (a)(d) | 158,036 | | 19,826 |
Intel Corp. | 3,006,900 | | 61,942 |
Lam Research Corp. (a) | 1,180,500 | | 49,805 |
Marvell Technology Group Ltd. (a) | 2,755,300 | | 41,109 |
Mellanox Technologies Ltd. (a) | 1,234,551 | | 20,568 |
Micron Technology, Inc. (a) | 3,758,400 | | 27,361 |
Monolithic Power Systems, Inc. (a) | 761,400 | | 13,416 |
NVIDIA Corp. (a) | 12,415,981 | | 114,103 |
Standard Microsystems Corp. (a) | 400,400 | | 8,817 |
Varian Semiconductor Equipment Associates, Inc. (a) | 454,449 | | 12,843 |
Volterra Semiconductor Corp. (a) | 1,261,000 | | 28,398 |
| | 513,018 |
Software - 15.0% |
Adobe Systems, Inc. (a) | 1,061,500 | | 30,486 |
ArcSight, Inc. (a) | 497,712 | | 12,448 |
Ariba, Inc. (a) | 1,350,596 | | 21,569 |
Autonomy Corp. PLC (a) | 846,800 | | 21,678 |
Blackboard, Inc. (a)(d) | 322,300 | | 12,238 |
BMC Software, Inc. (a) | 150,200 | | 5,344 |
Check Point Software Technologies Ltd. (a) | 1,371,800 | | 46,669 |
Concur Technologies, Inc. (a) | 468,100 | | 21,664 |
DemandTec, Inc. (a)(d) | 1,093,333 | | 7,358 |
Fortinet, Inc. (d) | 928,200 | | 16,717 |
Gameloft (a)(e) | 7,439,224 | | 36,748 |
Informatica Corp. (a) | 316,000 | | 9,521 |
Microsoft Corp. | 11,204,700 | | 289,193 |
NCsoft Corp. | 12,542 | | 1,994 |
Oracle Corp. | 8,187,200 | | 193,545 |
Common Stocks - continued |
| Shares | | Value (000s) |
INFORMATION TECHNOLOGY - continued |
Software - continued |
Pegasystems, Inc. (d) | 422,800 | | $ 13,005 |
Perfect World Co. Ltd. sponsored ADR Class B (a)(d) | 4,389,629 | | 102,542 |
QLIK Technologies, Inc. | 21,500 | | 309 |
SuccessFactors, Inc. (a) | 743,907 | | 15,109 |
Taleo Corp. Class A (a) | 1,416,922 | | 34,856 |
TiVo, Inc. (a) | 1,455,675 | | 12,490 |
| | 905,483 |
TOTAL INFORMATION TECHNOLOGY | | 3,226,700 |
MATERIALS - 1.9% |
Chemicals - 1.9% |
Celanese Corp. Class A | 179,000 | | 5,028 |
CF Industries Holdings, Inc. | 158,600 | | 12,877 |
Dow Chemical Co. | 1,724,100 | | 47,120 |
LyondellBasell Industries NV Class A (a) | 1,066,000 | | 19,188 |
Monsanto Co. | 400,400 | | 23,159 |
Solutia, Inc. (a) | 335,589 | | 4,735 |
| | 112,107 |
TELECOMMUNICATION SERVICES - 4.4% |
Diversified Telecommunication Services - 0.6% |
Cbeyond, Inc. (a) | 468,590 | | 7,137 |
Global Crossing Ltd. (a) | 2,495,900 | | 28,878 |
| | 36,015 |
Wireless Telecommunication Services - 3.8% |
Clearwire Corp. Class A (a)(d) | 4,597,125 | | 32,088 |
Sprint Nextel Corp. (a) | 43,291,456 | | 197,842 |
| | 229,930 |
TOTAL TELECOMMUNICATION SERVICES | | 265,945 |
TOTAL COMMON STOCKS (Cost $6,011,434) | 6,036,511 |
Money Market Funds - 3.8% |
| | | |
Fidelity Securities Lending Cash Central Fund, 0.27% (b)(c)
(Cost $228,193) | 228,192,564 | | 228,193 |
Cash Equivalents - 0.2% |
| Maturity Amount (000s) | | Value (000s) |
Investments in repurchase agreements in a joint trading account at 0.21%, dated 7/30/10 due 8/2/10 (Collateralized by U.S. Government Obligations) #
(Cost $11,095) | $ 11,095 | | $ 11,095 |
TOTAL INVESTMENT PORTFOLIO - 104.3% (Cost $6,250,722) | | 6,275,799 |
NET OTHER ASSETS (LIABILITIES) - (4.3)% | | (259,403) |
NET ASSETS - 100% | $ 6,016,396 |
Legend |
(a) Non-income producing |
(b) Affiliated fund that is available only to investment companies and other accounts managed by Fidelity Investments. The rate quoted is the annualized seven-day yield of the fund at period end. A complete unaudited listing of the fund's holdings as of its most recent quarter end is available upon request. |
(c) Investment made with cash collateral received from securities on loan. |
(d) Security or a portion of the security is on loan at period end. |
(e) Affiliated company |
(f) Security exempt from registration under Rule 144A of the Securities Act of 1933. These securities may be resold in transactions exempt from registration, normally to qualified institutional buyers. At the end of the period, the value of these securities amounted to $2,804,000 or 0.0% of net assets. |
(g) Restricted securities - Investment in securities not registered under the Securities Act of 1933 (excluding 144A issues). At the end of the period, the value of restricted securities (excluding 144A issues) amounted to $18,876,000 or 0.3% of net assets. |
Additional information on each holding is as follows: |
Security | Acquisition Date | Acquisition Cost (000s) |
Illumina, Inc. warrants 11/20/10 | 11/21/05 | $ - |
Illumina, Inc. warrants 1/19/11 | 1/18/06 | $ - |
# Additional information on each counterparty to the repurchase agreement is as follows: |
Repurchase Agreement / Counterparty | Value
(000s) |
$11,095,000 due 8/02/10 at 0.21% |
BNP Paribas Securities Corp. | $ 4,433 |
Banc of America Securities LLC | 1,677 |
Barclays Capital, Inc. | 4,985 |
| $ 11,095 |
Affiliated Central Funds |
Information regarding fiscal year to date income earned by the Fund from investments in Fidelity Central Funds is as follows: |
Fund | Income earned
(Amounts in thousands) |
Fidelity Cash Central Fund | $ 36 |
Fidelity Securities Lending Cash Central Fund | 1,676 |
Total | $ 1,712 |
Other Affiliated Issuers |
An affiliated company is a company in which the fund has ownership of at least 5% of the voting securities. Fiscal year to date transactions with companies which are or were affiliates are as follows: |
Affiliate
(Amounts in thousands) | Value, beginning of period | Purchases | Sales Proceeds | Dividend Income | Value,
end of
period |
Abiomed, Inc. | $ 7,555 | $ 15,198 | $ 9,435 | $ - | $ - |
AeroVironment, Inc. | - | 53,295 | 30,372 | - | - |
Alphatec Holdings, Inc. | - | 28,809 | 108 | - | 21,863 |
Citi Trends, Inc. | 18,823 | 15,921 | 18,783 | - | - |
Gameloft | 23,134 | 9,008 | 1,102 | - | 36,748 |
iRobot Corp. | - | 22,455 | 1,013 | - | 34,374 |
Rackspace Hosting, Inc. | - | 146,593 | 13,066 | - | 142,387 |
Volterra Semiconductor Corp. | 20,371 | 1,413 | 1,428 | - | - |
Total | $ 69,883 | $ 292,692 | $ 75,307 | $ - | $ 235,372 |
Other Information |
The following is a summary of the inputs used, as of July 31, 2010, involving the Fund's assets and liabilities carried at fair value. The inputs or methodology used for valuing securities may not be an indication of the risk associated with investing in those securities. For more information on valuation inputs, and their aggregation into the levels used in the tables below, please refer to the Security Valuation section in the accompanying Notes to Financial Statements. |
Valuation Inputs at Reporting Date: |
Description
(Amounts in thousands) | Total | Level 1 | Level 2 | Level 3 |
Investments in Securities: | | | | |
Equities: | | | | |
Consumer Discretionary | $ 675,558 | $ 675,558 | $ - | $ - |
Consumer Staples | 29,737 | 29,737 | - | - |
Energy | 108,110 | 108,110 | - | - |
Financials | 470,721 | 468,560 | - | 2,161 |
Health Care | 810,588 | 791,712 | 18,876 | - |
Industrials | 337,045 | 337,045 | - | - |
Information Technology | 3,226,700 | 3,226,700 | - | - |
Materials | 112,107 | 112,107 | - | - |
Telecommunication Services | 265,945 | 265,945 | - | - |
Money Market Funds | 228,193 | 228,193 | - | - |
Cash Equivalents | 11,095 | - | 11,095 | - |
Total Investments in Securities: | $ 6,275,799 | $ 6,243,667 | $ 29,971 | $ 2,161 |
The following is a reconciliation of Investments in Securities for which Level 3 inputs were used in determining value: |
(Amounts in thousands) | |
Investments in Securities: | |
Beginning Balance | $ - |
Total Realized Gain (Loss) | (24) |
Total Unrealized Gain (Loss) | (55) |
Cost of Purchases | 2,834 |
Proceeds of Sales | (594) |
Amortization/Accretion | - |
Transfers in to Level 3 | - |
Transfers out of Level 3 | - |
Ending Balance | $ 2,161 |
The change in unrealized gain (loss) for the period attributable to Level 3 securities held at July 31, 2010 | $ (55) |
The information used in the above reconciliation represents fiscal year to date activity for any Investments in Securities identified as using Level 3 inputs at either the beginning or the end of the current fiscal period. Transfers in or out of Level 3 represent the beginning value of any Security or Instrument where a change in the pricing level occurred from the beginning to the end of the period. The cost of purchases and the proceeds of sales may include securities received or delivered through corporate actions or exchanges. Realized and unrealized gains (losses) disclosed in the reconciliation are included in Net Gain (Loss) on the Fund's Statement of Operations. |
Distribution of investments by country of issue, as a percentage of total net assets, is as follows: (Unaudited) |
United States of America | 89.4% |
Cayman Islands | 2.1% |
Israel | 1.7% |
Canada | 1.2% |
Bermuda | 1.2% |
Netherlands | 1.2% |
Others (Individually Less Than 1%) | 3.2% |
| 100.0% |
Income Tax Information |
At July 31, 2010, the Fund had a capital loss carryforward of approximately $1,651,048,000 of which $1,249,895,000 and $401,153,000 will expire on July 31, 2011 and 2017, respectively. Capital loss carryforwards are only available to offset future capital gains of the Fund to the extent provided by regulations and may be limited. |
See accompanying notes which are an integral part of the financial statements.
Annual Report
Statement of Assets and Liabilities
Amounts in thousands (except per-share amounts) | July 31, 2010 |
| | |
Assets | | |
Investment in securities, at value (including securities loaned of $223,384 and repurchase agreements of $11,095) - See accompanying schedule: Unaffiliated issuers (cost $5,807,296) | $ 5,812,234 | |
Fidelity Central Funds (cost $228,193) | 228,193 | |
Other affiliated issuers (cost $215,233) | 235,372 | |
Total Investments (cost $6,250,722) | | $ 6,275,799 |
Foreign currency held at value (cost $90) | | 90 |
Receivable for investments sold | | 41,068 |
Receivable for fund shares sold | | 4,621 |
Dividends receivable | | 1,468 |
Distributions receivable from Fidelity Central Funds | | 108 |
Other receivables | | 964 |
Total assets | | 6,324,118 |
| | |
Liabilities | | |
Payable for investments purchased | $ 64,818 | |
Payable for fund shares redeemed | 9,950 | |
Accrued management fee | 3,516 | |
Other affiliated payables | 1,042 | |
Other payables and accrued expenses | 203 | |
Collateral on securities loaned, at value | 228,193 | |
Total liabilities | | 307,722 |
| | |
Net Assets | | $ 6,016,396 |
Net Assets consist of: | | |
Paid in capital | | $ 7,719,105 |
Accumulated net investment loss | | (112) |
Accumulated undistributed net realized gain (loss) on investments and foreign currency transactions | | (1,727,624) |
Net unrealized appreciation (depreciation) on investments and assets and liabilities in foreign currencies | | 25,027 |
Net Assets | | $ 6,016,396 |
| | |
OTC:
Net Asset Value, offering price and redemption price per share ($5,080,140 ÷ 112,882 shares) | | $ 45.00 |
| | |
Class K:
Net Asset Value, offering price and redemption price per share ($936,256 ÷ 20,717 shares) | | $ 45.19 |
See accompanying notes which are an integral part of the financial statements.
Annual Report
Statement of Operations
Amounts in thousands | Year ended July 31, 2010 |
| | |
Investment Income | | |
Dividends | | $ 29,847 |
Interest | | 1 |
Income from Fidelity Central Funds (including $1,676 from security lending) | | 1,712 |
Total income | | 31,560 |
| | |
Expenses | | |
Management fee
Basic fee | $ 36,461 | |
Performance adjustment | 12,387 | |
Transfer agent fees | 11,777 | |
Accounting and security lending fees | 1,257 | |
Custodian fees and expenses | 203 | |
Independent trustees' compensation | 36 | |
Registration fees | 153 | |
Audit | 77 | |
Legal | 30 | |
Interest | 16 | |
Miscellaneous | 91 | |
Total expenses before reductions | 62,488 | |
Expense reductions | (1,271) | 61,217 |
Net investment income (loss) | | (29,657) |
Realized and Unrealized Gain (Loss) Net realized gain (loss) on: | | |
Investment securities: | | |
Unaffiliated issuers | 1,044,884 | |
Other affiliated issuers | 9,014 | |
Foreign currency transactions | 79 | |
Capital gain distributions from Fidelity Central Funds | 12 | |
Total net realized gain (loss) | | 1,053,989 |
Change in net unrealized appreciation (depreciation) on: Investment securities | (204,417) | |
Assets and liabilities in foreign currencies | 19 | |
Total change in net unrealized appreciation (depreciation) | | (204,398) |
Net gain (loss) | | 849,591 |
Net increase (decrease) in net assets resulting from operations | | $ 819,934 |
See accompanying notes which are an integral part of the financial statements.
Annual Report
Financial Statements - continued
Statement of Changes in Net Assets
Amounts in thousands | Year ended
July 31,
2010 | Year ended
July 31,
2009 |
Increase (Decrease) in Net Assets | | |
Operations | | |
Net investment income (loss) | $ (29,657) | $ (15,605) |
Net realized gain (loss) | 1,053,989 | (679,506) |
Change in net unrealized appreciation (depreciation) | (204,398) | (298,374) |
Net increase (decrease) in net assets resulting
from operations | 819,934 | (993,485) |
Share transactions - net increase (decrease) | 30,686 | (711,460) |
Total increase (decrease) in net assets | 850,620 | (1,704,945) |
| | |
Net Assets | | |
Beginning of period | 5,165,776 | 6,870,721 |
End of period (including accumulated net investment loss of $112 and accumulated net investment loss of $108, respectively) | $ 6,016,396 | $ 5,165,776 |
See accompanying notes which are an integral part of the financial statements.
Annual Report
Financial Highlights - OTC
Years ended July 31, | 2010 | 2009 | 2008 | 2007 | 2006 |
Selected Per-Share Data | | | | | |
Net asset value, beginning of period | $ 38.73 | $ 44.66 | $ 47.09 | $ 34.70 | $ 35.99 |
Income from Investment Operations | | | | | |
Net investment income (loss) B | (.23) | (.12) | (.20) | (.19) | (.10) E |
Net realized and unrealized gain (loss) | 6.50 | (5.81) | (2.23) | 12.58 | (1.19) |
Total from investment operations | 6.27 | (5.93) | (2.43) | 12.39 | (1.29) |
Net asset value, end of period | $ 45.00 | $ 38.73 | $ 44.66 | $ 47.09 | $ 34.70 |
Total Return A | 16.19% | (13.28)% | (5.16)% | 35.71% | (3.58)% |
Ratios to Average Net Assets C, F | | | | | |
Expenses before reductions | 1.06% | 1.13% | 1.06% | .96% | .80% |
Expenses net of fee waivers,
if any | 1.06% | 1.13% | 1.06% | .96% | .80% |
Expenses net of all reductions | 1.04% | 1.13% | 1.05% | .95% | .75% |
Net investment income (loss) | (.51)% | (.37)% | (.42)% | (.45)% | (.26)% E |
Supplemental Data | | | | | |
Net assets, end of period
(in millions) | $ 5,080 | $ 4,677 | $ 6,871 | $ 8,778 | $ 7,370 |
Portfolio turnover rate D | 163% | 151% | 145% | 121% | 149% |
A Total returns would have been lower had certain expenses not been reduced during the periods shown.
B Calculated based on average shares outstanding during the period.
C Fees and expenses of the underlying Fidelity Central Funds are not included in the Fund's expense ratio. The Fund indirectly bears its proportionate share of the expenses of any underlying Fidelity Central Funds.
D Amount does not include the portfolio activity of any underlying Fidelity Central Funds.
E Investment income per share reflects a special dividend which amounted to $.03 per share. Excluding the special dividend, the ratio of net investment income (loss) to average net assets would have been (.34%).
F Expense ratios reflect operating expenses of the class. Expenses before reductions do not reflect amounts reimbursed by the investment adviser or reductions from brokerage service arrangements or reductions from other expense offset arrangements and do not represent the amount paid by the class during periods when reimbursements or reductions occur. Expenses net of fee waivers reflect expenses after reimbursement by the investment adviser but prior to reductions from brokerage service arrangements or other expense offset arrangements. Expenses net of all reductions represent the net expenses paid by the class.
See accompanying notes which are an integral part of the financial statements.
Annual Report
Financial Highlights - Class K
Years ended July 31, | 2010 | 2009 | 2008 G |
Selected Per-Share Data | | | |
Net asset value, beginning of period | $ 38.83 | $ 44.68 | $ 47.79 |
Income from Investment Operations | | | |
Net investment income (loss) D | (.16) | (.05) | (.05) |
Net realized and unrealized gain (loss) | 6.52 | (5.80) | (3.06) |
Total from investment operations | 6.36 | (5.85) | (3.11) |
Net asset value, end of period | $ 45.19 | $ 38.83 | $ 44.68 |
Total Return B, C | 16.38% | (13.09)% | (6.51)% |
Ratios to Average Net Assets E, H | | | |
Expenses before reductions | .90% | .92% | .91% A |
Expenses net of fee waivers, if any | .90% | .92% | .91% A |
Expenses net of all reductions | .88% | .92% | .91% A |
Net investment income (loss) | (.35)% | (.17)% | (.47)% A |
Supplemental Data | | | |
Net assets, end of period (000 omitted) | $ 936,256 | $ 488,683 | $ 93 |
Portfolio turnover rate F | 163% | 151% | 145% |
A Annualized
B Total returns for periods of less than one year are not annualized.
C Total returns would have been lower had certain expenses not been reduced during the periods shown.
D Calculated based on average shares outstanding during the period.
E Fees and expenses of the underlying Fidelity Central Funds are not included in the Fund's expense ratio. The Fund indirectly bears its proportionate share of the expenses of any underlying Fidelity Central Funds.
F Amount does not include the portfolio activity of any underlying Fidelity Central Funds.
G For the period May 9, 2008 (commencement of sale of shares) to July 31, 2008.
H Expense ratios reflect operating expenses of the class. Expenses before reductions do not reflect amounts reimbursed by the investment adviser or reductions from brokerage service arrangements or reductions from other expense offset arrangements and do not represent the amount paid by the class during periods when reimbursements or reductions occur. Expense ratios before reductions for start-up periods may not be representative of longer-term operating periods. Expenses net of fee waivers reflect expenses after reimbursement by the investment adviser but prior to reductions from brokerage service arrangements or other expense offset arrangements. Expenses net of all reductions represent the net expenses paid by the class.
See accompanying notes which are an integral part of the financial statements.
Annual Report
Notes to Financial Statements
For the period ended July 31, 2010
(Amounts in thousands except ratios)
1. Organization.
Fidelity OTC Portfolio (the Fund) is a non-diversified fund of Fidelity Securities Fund (the Trust) and is authorized to issue an unlimited number of shares. The Trust is registered under the Investment Company Act of 1940, as amended (the 1940 Act), as an open-end management investment company organized as a Massachusetts business trust. The Fund offers OTC and Class K shares, each of which has equal rights as to assets and voting privileges. Each class has exclusive voting rights with respect to matters that affect that class. After the commencement of Class K, the Fund began offering conversion privileges between OTC and Class K to eligible shareholders of OTC. Investment income, realized and unrealized capital gains and losses, the common expenses of the Fund, and certain fund-level expense reductions, if any, are allocated on a pro-rata basis to each class based on the relative net assets of each class to the total net assets of the Fund. Each class differs with respect to transfer agent fees incurred. Certain expense reductions also differ by class.
2. Investments in Fidelity Central Funds.
The Fund may invest in Fidelity Central Funds, which are open-end investment companies available only to other investment companies and accounts managed by Fidelity Management & Research Company (FMR) and its affiliates. The Fund's Schedule of Investments lists each of the Fidelity Central Funds held as of period end, if any, as an investment of the Fund, but does not include the underlying holdings of each Fidelity Central Fund. As an Investing Fund, the Fund indirectly bears its proportionate share of the expenses of the underlying Fidelity Central Funds.
The Money Market Central Funds seek preservation of capital and current income and are managed by Fidelity Investments Money Management, Inc. (FIMM), an affiliate of FMR.
A complete unaudited list of holdings for each Fidelity Central Fund is available upon request or at the Securities and Exchange Commission (the SEC) web site at www.sec.gov. In addition, the financial statements of the Fidelity Central Funds which are not covered by the Fund's Report of Independent Registered Public Accounting Firm, are available on the SEC web site or upon request.
3. Significant Accounting Policies.
The financial statements have been prepared in conformity with accounting principles generally accepted in the United States of America (GAAP), which require management to make certain estimates and assumptions at the date of the financial statements. Actual results could differ from those estimates. The following summarizes the significant accounting policies of the Fund:
Annual Report
3. Significant Accounting Policies - continued
Security Valuation. Investments are valued as of 4:00 p.m. Eastern time on the last calendar day of the period. The Fund uses independent pricing services approved by the Board of Trustees to value its investments. When current market prices or quotations are not readily available or reliable, valuations may be determined in good faith in accordance with procedures adopted by the Board of Trustees. Factors used in determining value may include market or security specific events. The frequency with which these procedures are used cannot be predicted and they may be utilized to a significant extent. The value used for net asset value (NAV) calculation under these procedures may differ from published prices for the same securities.
The Fund categorizes the inputs to valuation techniques used to value its investments into a disclosure hierarchy consisting of three levels as shown below.
Level 1 - quoted prices in active markets for identical investments
Level 2 - other significant observable inputs (including quoted prices for similar investments, interest rates, prepayment speeds, etc.)
Level 3 - unobservable inputs (including the fund's own assumptions based on the best information available)
Changes in valuation techniques may result in transfers in or out of an assigned level within the disclosure hierarchy. The aggregate value of investments by input level, as of July 31, 2010, as well as a roll forward of Level 3 securities, is included at the end of the Fund's Schedule of Investments. Valuation techniques used to value the Fund's investments by major category are as follows.
Equity securities, including restricted securities, for which market quotations are readily available, are valued at the last reported sale price or official closing price as reported by an independent pricing service on the primary market or exchange on which they are traded and are categorized as Level 1 in the hierarchy. In the event there were no sales during the day or closing prices are not available, securities are valued at the last quoted bid price or may be valued using the last available price and are generally categorized as Level 2 in the hierarchy. For foreign equity securities, when significant market or security specific events arise, comparisons to the valuation of American Depository Receipts (ADRs), futures contracts, Exchange-traded funds (ETFs) and certain indexes as well as quoted prices for similar securities are used and are categorized as Level 2 in the hierarchy in these circumstances. Utilizing these techniques may result in transfers between Level 1 and Level 2. For restricted equity securities and private placements where observable inputs are limited, assumptions about market activity and risk are used and are categorized as Level 3 in the hierarchy.
Annual Report
Notes to Financial Statements - continued
(Amounts in thousands except ratios)
3. Significant Accounting Policies - continued
Security Valuation - continued
Investments in open-end mutual funds, including the Fidelity Central Funds, are valued at their closing net asset value each business day and are categorized as Level 1 in the hierarchy. Short-term securities with remaining maturities of sixty days or less for which quotations are not readily available are valued at amortized cost, which approximates fair value and are categorized as Level 2 in the hierarchy.
Foreign Currency. The Fund uses foreign currency contracts to facilitate transactions in foreign-denominated securities. Gains and losses from these transactions may arise from changes in the value of the foreign currency or if the counterparties do not perform under the contracts' terms.
Foreign-denominated assets, including investment securities, and liabilities are translated into U.S. dollars at the exchange rate at period end. Purchases and sales of investment securities, income and dividends received and expenses denominated in foreign currencies are translated into U.S. dollars at the exchange rate in effect on the transaction date.
The effects of exchange rate fluctuations on investments are included with the net realized and unrealized gain (loss) on investment securities. Other foreign currency transactions resulting in realized and unrealized gain (loss) are disclosed separately.
Investment Transactions and Income. For financial reporting purposes, the Fund's investment holdings and NAV include trades executed through the end of the last business day of the period. The NAV per share for processing shareholder transactions is calculated as of the close of business of the New York Stock Exchange (NYSE), normally 4:00 p.m. Eastern time and includes trades executed through the end of the prior business day. Gains and losses on securities sold are determined on the basis of identified cost and may include proceeds received from litigation. Dividend income is recorded on the ex-dividend date, except for certain dividends from foreign securities where the ex-dividend date may have passed, which are recorded as soon as the Fund is informed of the ex-dividend date. Non-cash dividends included in dividend income, if any, are recorded at the fair market value of the securities received. Distributions received on securities that represent a return of capital or capital gain are recorded as a reduction of cost of investments and/or as a realized gain. The Fund estimates the components of distributions received that may be considered return of capital distributions or capital gain distributions. Interest income and distributions from the Fidelity Central Funds are accrued as earned. Interest income includes coupon interest and amortization of premium and accretion of discount on debt securities. Investment income is recorded net of foreign taxes withheld where recovery of such taxes is uncertain.
Annual Report
3. Significant Accounting Policies - continued
Expenses. Most expenses of the Trust can be directly attributed to a fund. Expenses which cannot be directly attributed are apportioned amongst each fund in the Trust. Expense estimates are accrued in the period to which they relate and adjustments are made when actual amounts are known.
Deferred Trustee Compensation. Under a Deferred Compensation Plan (the Plan), independent Trustees may elect to defer receipt of a portion of their annual compensation. Deferred amounts are invested in a cross-section of Fidelity funds, are marked-to-market and remain in the Fund until distributed in accordance with the Plan. The investment of deferred amounts and the offsetting payable to the Trustees are included in the accompanying Statement of Assets and Liabilities.
Income Tax Information and Distributions to Shareholders. Each year the Fund intends to qualify as a regulated investment company, including distributing substantially all of its taxable income and realized gains under Subchapter M of the Internal Revenue Code and filing its U.S. federal tax return. As a result, no provision for income taxes is required. As of July 31, 2010, the Fund did not have any unrecognized tax benefits in the accompanying financial statements. A fund's federal tax return is subject to examination by the Internal Revenue Service (IRS) for a period of three years. Foreign taxes are provided for based on the Fund's understanding of the tax rules and rates that exist in the foreign markets in which it invests.
Distributions are recorded on the ex-dividend date. Income dividends and capital gain distributions are declared separately for each class. Income and capital gain distributions are determined in accordance with income tax regulations, which may differ from GAAP.
Capital accounts within the financial statements are adjusted for permanent book-tax differences. These adjustments have no impact on net assets or the results of operations. Temporary book-tax differences will reverse in a subsequent period.
Book-tax differences are primarily due to the short-term gain distributions from the Fidelity Central Funds, foreign currency transactions, passive foreign investment companies (PFIC), partnerships, deferred trustees compensation, net operating losses, capital loss carryforwards, expiring capital loss carryforwards, losses deferred due to wash sales and excise tax regulations
The federal tax cost of investment securities and unrealized appreciation (depreciation) as of period end were as follows:
Gross unrealized appreciation | $ 634,723 |
Gross unrealized depreciation | (686,222) |
Net unrealized appreciation (depreciation) | $ (51,499) |
| |
Tax Cost | $ 6,327,298 |
Annual Report
Notes to Financial Statements - continued
(Amounts in thousands except ratios)
3. Significant Accounting Policies - continued
Income Tax Information and Distributions to Shareholders - continued
The tax-based components of distributable earnings as of period end were as follows:
Capital loss carryforward | $ (1,651,048) |
Net unrealized appreciation (depreciation) | $ (51,548) |
4. Operating Policies.
Repurchase Agreements. FMR has received an Exemptive Order from the SEC which permits the Fund and other affiliated entities of FMR to transfer uninvested cash balances into joint trading accounts which are then invested in repurchase agreements. The Fund may also invest directly with institutions in repurchase agreements. Repurchase agreements are collateralized by government or non-government securities. Upon settlement date, collateral is held in segregated accounts with custodian banks and may be obtained in the event of a default of the counterparty. The Fund monitors, on a daily basis, the value of the collateral to ensure it is at least equal to the principal amount of the repurchase agreement (including accrued interest). In the event of a default by the counterparty, realization of the collateral proceeds could be delayed, during which time the value of the collateral may decline.
Restricted Securities. The Fund may invest in securities that are subject to legal or contractual restrictions on resale. These securities generally may be resold in transactions exempt from registration or to the public if the securities are registered. Disposal of these securities may involve time-consuming negotiations and expense, and prompt sale at an acceptable price may be difficult. Information regarding restricted securities is included at the end of the Fund's Schedule of Investments.
5. Purchases and Sales of Investments.
Purchases and sales of securities, other than short-term securities, aggregated $9,619,611 and $9,543,935, respectively.
6. Fees and Other Transactions with Affiliates.
Management Fee. FMR and its affiliates provide the Fund with investment management related services for which the Fund pays a monthly management fee. The management fee is the sum of an individual fund fee rate that is based on an annual rate of .35% of the Fund's average net assets and a group fee rate that averaged .26% during the period. The group fee rate is based upon the average net assets of all the mutual funds advised by FMR. The group fee rate decreases as assets under management increase and increases as assets under management decrease. In addition, the management fee is
Annual Report
6. Fees and Other Transactions with Affiliates - continued
Management Fee - continued
subject to a performance adjustment (up to a maximum of ± .20% of the Fund's average net assets over a 36 month performance period). The upward or downward adjustment to the management fee is based on the relative investment performance of the retail class of the Fund, OTC as compared to an appropriate benchmark index. For the period, the total annual management fee rate, including the performance adjustment, was ..82% of the Fund's average net assets.
Transfer Agent Fees. Fidelity Investments Institutional Operations Company, Inc. (FIIOC), an affiliate of FMR, is the transfer, dividend disbursing and shareholder servicing agent for each class of the Fund. FIIOC receives account fees and asset-based fees that vary according to the account size and type of account of the shareholders of OTC. FIIOC receives an asset-based fee of Class K's average net assets. FIIOC pays for typesetting, printing and mailing of shareholder reports, except proxy statements. For the period, the total transfer agent fees paid by each class were as follows:
| Amount | % of
Average
Net Assets |
OTC | $ 11,397 | .22 |
Class K | 380 | .05 |
| $ 11,777 | |
Accounting and Security Lending Fees. Fidelity Service Company, Inc. (FSC), an affiliate of FMR, maintains the Fund's accounting records. The accounting fee is based on the level of average net assets for the month. Under a separate contract, FSC administers the security lending program. The security lending fee is based on the number and duration of lending transactions.
Brokerage Commissions. The Fund placed a portion of its portfolio transactions with brokerage firms which are affiliates of the investment adviser. The commissions paid to these affiliated firms were $231 for the period.
Interfund Lending Program. Pursuant to an Exemptive Order issued by the SEC, the Fund, along with other registered investment companies having management contracts with FMR, may participate in an interfund lending program. This program provides an alternative credit facility allowing the funds to borrow from, or lend money to, other participating affiliated funds. At period end, there were no interfund loans outstanding.
Annual Report
Notes to Financial Statements - continued
(Amounts in thousands except ratios)
6. Fees and Other Transactions with Affiliates - continued
Interfund Lending Program - continued
The Fund's activity in this program during the period for which loans were outstanding was as follows:
Borrower or Lender | Average Daily
Loan Balance | Weighted Average Interest Rate | Interest
Expense |
Borrower | $ 14,593 | .42% | $ 16 |
7. Committed Line of Credit.
The Fund participates with other funds managed by FMR in a $3.75 billion credit facility (the "line of credit") to be utilized for temporary or emergency purposes to fund shareholder redemptions or for other short-term liquidity purposes. The Fund has agreed to pay commitment fees on its pro-rata portion of the line of credit, which amounted to $23 and is reflected in Miscellaneous expenses on the Statement of Operations. During the period, there were no borrowings on this line of credit.
8. Security Lending.
The Fund lends portfolio securities from time to time in order to earn additional income. On the settlement date of the loan, the Fund receives collateral (in the form of U.S. Treasury obligations, letters of credit and/or cash) against the loaned securities and maintains collateral in an amount not less than 100% of the market value of the loaned securities during the period of the loan. The market value of the loaned securities is determined at the close of business of the Fund and any additional required collateral is delivered to the Fund on the next business day. If the borrower defaults on its obligation to return the securities loaned because of insolvency or other reasons, a fund could experience delays and costs in recovering the securities loaned or in gaining access to the collateral. Any cash collateral received is invested in the Fidelity Securities Lending Cash Central Fund. The value of loaned securities and cash collateral at period end are disclosed on the Fund's Statement of Assets and Liabilities. Security lending income represents the income earned on investing cash collateral, less fees and expenses associated with the loan, plus any premium payments that may be received on the loan of certain types of securities. Security lending income is presented in the Statement of Operations as a component of income from Fidelity Central Funds.
Annual Report
9. Bank Borrowings.
The Fund is permitted to have bank borrowings for temporary or emergency purposes to fund shareholder redemptions. The Fund has established borrowing arrangements with certain banks. The interest rate on the borrowings is the bank's base rate, as revised from time to time. The average daily loan balance during the period for which loans were outstanding amounted to $6,750. The weighted average interest rate was .62%. The interest expense amounted to two hundred thirty-three dollars under the bank borrowing program. At period end, there were no bank borrowings outstanding.
10. Expense Reductions.
Many of the brokers with whom FMR places trades on behalf of the Fund provided services to the Fund in addition to trade execution. These services included payments of certain expenses on behalf of the Fund totaling $1,271 for the period.
11. Share Transactions.
Transactions for each class of shares were as follows:
| Shares | Dollars |
Years ended July 31, | 2010 A | 2009 | 2010 A | 2009 |
OTC | | | | |
Shares sold | 27,879 | 30,393 | $ 1,242,349 | $ 1,008,444 |
Conversion to Class K | (520) | (11,534) | (20,492) | (344,688) |
Shares redeemed | (35,233) | (51,952) | (1,562,257) | (1,755,471) |
Net increase (decrease) | (7,874) | (33,093) | $ (340,400) | $ (1,091,715) |
Class K | | | | |
Shares sold | 11,838 | 2,992 | $ 538,757 | $ 95,604 |
Conversion from OTC | 518 | 11,521 | 20,492 | 344,688 |
Shares redeemed | (4,224) | (1,930) | (188,163) | (60,037) |
Net increase (decrease) | 8,132 | 12,583 | $ 371,086 | $ 380,255 |
A Conversion transactions for Class K and OTC are presented for the period August 1, 2009 through August 31, 2009
12. Other.
The Fund's organizational documents provide former and current trustees and officers with a limited indemnification against liabilities arising in connection with the performance of their duties to the Fund. In the normal course of business, the Fund may also enter into contracts that provide general indemnifications. The Fund's maximum exposure under these arrangements is unknown as this would be dependent on future claims that may be made against the Fund. The risk of material loss from such claims is considered remote.
Annual Report
To the Trustees of Fidelity Securities Fund and Shareholders of Fidelity OTC Portfolio:
We have audited the accompanying statement of assets and liabilities of Fidelity OTC Portfolio (the Fund), a fund of Fidelity Securities Fund, including the schedule of investments, as of July 31, 2010, and the related statement of operations for the year then ended, the statement of changes in net assets for each of the two years in the period then ended, and the financial highlights for each of the five years in the periods then ended. These financial statements and financial highlights are the responsibility of the Fund's management. Our responsibility is to express an opinion on these financial statements and financial highlights based on our audits.
We conducted our audits in accordance with standards of the Public Company Accounting Oversight Board (United States). Those standards require that we plan and perform the audit to obtain reasonable assurance about whether the financial statements and financial highlights are free of material misstatement. The Fund is not required to have, nor were we engaged to perform, an audit of its internal control over financial reporting. Our audits included consideration of internal control over financial reporting as a basis for designing audit procedures that are appropriate in the circumstances, but not for the purpose of expressing an opinion on the effectiveness of the Fund's internal control over financial reporting. Accordingly, we express no such opinion. An audit also includes examining, on a test basis, evidence supporting the amounts and disclosures in the financial statements, assessing the accounting principles used and significant estimates made by management, as well as evaluating the overall financial statement presentation. Our procedures included confirmation of securities owned as of July 31, 2010, by correspondence with the custodians and brokers; where replies were not received from brokers, we performed other auditing procedures. We believe that our audits provide a reasonable basis for our opinion.
In our opinion, the financial statements and financial highlights referred to above present fairly, in all material respects, the financial position of Fidelity OTC Portfolio as of July 31, 2010, the results of its operations for the year then ended, the changes in its net assets for each of the two years in the period then ended, and the financial highlights for each of the five years in the periods then ended, in conformity with accounting principles generally accepted in the United States of America.
/s/ Deloitte & Touche LLP
DELOITTE & TOUCHE LLP
Boston, Massachusetts
September 22, 2010
Annual Report
The Trustees, Member of the Advisory Board, and executive officers of the trust and fund, as applicable, are listed below. The Board of Trustees governs the fund and is responsible for protecting the interests of shareholders. The Trustees are experienced executives who meet periodically throughout the year to oversee the fund's activities, review contractual arrangements with companies that provide services to the fund, oversee management of the risks associated with such activities and contractual arrangements, and review the fund's performance. Except for James C. Curvey, each of the Trustees oversees 222 funds advised by FMR or an affiliate. Mr. Curvey oversees 411 funds advised by FMR or an affiliate.
The Trustees hold office without limit in time except that (a) any Trustee may resign; (b) any Trustee may be removed by written instrument, signed by at least two-thirds of the number of Trustees prior to such removal; (c) any Trustee who requests to be retired or who has become incapacitated by illness or injury may be retired by written instrument signed by a majority of the other Trustees; and (d) any Trustee may be removed at any special meeting of shareholders by a two-thirds vote of the outstanding voting securities of the trust. Each Trustee who is not an interested person (as defined in the 1940 Act) (Independent Trustee), shall retire not later than the last day of the calendar year in which his or her 72nd birthday occurs. The Independent Trustees may waive this mandatory retirement age policy with respect to individual Trustees. The executive officers and Advisory Board Member hold office without limit in time, except that any officer and Advisory Board Member may resign or may be removed by a vote of a majority of the Trustees at any regular meeting or any special meeting of the Trustees. Except as indicated, each individual has held the office shown or other offices in the same company for the past five years.
Experience, Skills, Attributes, and Qualifications of the Fund's Trustees. The Governance and Nominating Committee has adopted a statement of policy that describes the experience, qualifications, attributes, and skills that are necessary and desirable for potential Independent Trustee candidates (Statement of Policy). The Board believes that each Trustee satisfied at the time he or she was initially elected or appointed a Trustee, and continues to satisfy, the standards contemplated by the Statement of Policy. The Governance and Nominating Committee also engages professional search firms to help identify potential Independent Trustee candidates who have the experience, qualifications, attributes, and skills consistent with the Statement of Policy. From time to time, additional criteria based on the composition and skills of the current Independent Trustees, as well as experience or skills that may be appropriate in light of future changes to board composition, business conditions, and regulatory or other developments, have also been considered by the professional search firms and the Governance and Nominating Committee. In addition, the Board takes into account the Trustees' commitment and participation in Board and committee meetings, as well as their leadership of standing and ad hoc committees throughout their tenure.
In determining that a particular Trustee was and continues to be qualified to serve as a Trustee, the Board has considered a variety of criteria, none of which, in isolation, was controlling. The Board believes that, collectively, the Trustees have balanced and diverse experience, qualifications, attributes, and skills, which allow the Board to operate effectively in governing the fund and protecting the interests of shareholders. Information about the specific experience, skills, attributes, and qualifications of each Trustee, which in each case led to the Board's conclusion that the Trustee should serve (or continue to serve) as a trustee of the fund, is provided below.
Annual Report
Board Structure and Oversight Function. Edward C. Johnson 3d is an interested person (as defined in the 1940 Act) and currently serves as Chairman. The Trustees have determined that an interested Chairman is appropriate and benefits shareholders because an interested Chairman has a personal and professional stake in the quality and continuity of services provided to the fund. Independent Trustees exercise their informed business judgment to appoint an individual of their choosing to serve as Chairman, regardless of whether the Trustee happens to be independent or a member of management. The Independent Trustees have determined that they can act independently and effectively without having an Independent Trustee serve as Chairman and that a key structural component for assuring that they are in a position to do so is for the Independent Trustees to constitute a substantial majority for the Board. The Independent Trustees also regularly meet in executive session. Ned C. Lautenbach serves as Chairman of the Independent Trustees and as such (i) acts as a liaison between the Independent Trustees and management with respect to matters important to the Independent Trustees and (ii) with management prepares agendas for Board meetings.
Fidelity funds are overseen by different Boards of Trustees. The fund's Board oversees Fidelity's equity and high income funds and another Board oversees Fidelity's investment-grade bond, money market, and asset allocation funds. The asset allocation funds may invest in Fidelity funds overseen by the fund's Board. The use of separate Boards, each with its own committee structure, allows the Trustees of each group of Fidelity funds to focus on the unique issues of the funds they oversee, including common research, investment, and operational issues. On occasion, the separate Boards establish joint committees to address issues of overlapping consequences for the Fidelity funds overseen by each Board.
The Trustees operate using a system of committees to facilitate the timely and efficient consideration of all matters of importance to the Trustees, the fund, and fund shareholders and to facilitate compliance with legal and regulatory requirements and oversight of the fund's activities and associated risks. The Board, acting through its committees, has charged FMR and its affiliates with (i) identifying events or circumstances the occurrence of which could have demonstrably adverse effects on the fund's business and/or reputation; (ii) implementing processes and controls to lessen the possibility that such events or circumstances occur or to mitigate the effects of such events or circumstances if they do occur; and (iii) creating and maintaining a system designed to evaluate continuously business and market conditions in order to facilitate the identification and implementation processes described in (i) and (ii) above. Because the day-to-day operations and activities of the fund are carried out by or through FMR, its affiliates and other service providers, the fund's exposure to risks is mitigated but not eliminated by the processes overseen by the Trustees. While each of the Board's committees has responsibility for overseeing different aspects of the fund's activities, oversight is exercised primarily through the Operations, Audit, and Compliance Committees. Appropriate personnel, including but not limited to the fund's Chief Compliance Officer (CCO), FMR's internal auditor, the independent accountants, the fund's Treasurer and portfolio management personnel, make periodic reports to the Board's committees, as appropriate. The responsibilities of each committee, including their oversight responsibilities, are described further under "Standing Committees of the Fund's Trustees."
Annual Report
Trustees and Officers - continued
The fund's Statement of Additional Information (SAI) includes more information about the Trustees. To request a free copy, call Fidelity at 1-800-835-5092.
Interested Trustees*:
Correspondence intended for each Trustee who is an interested person may be sent to Fidelity Investments, 82 Devonshire Street, Boston, Massachusetts 02109.
Name, Age; Principal Occupations and Other Relevant Experience+ |
Edward C. Johnson 3d (80) |
| Year of Election or Appointment: 1984 Mr. Johnson is Trustee and Chairman of the Board of Trustees of certain Trusts. Mr. Johnson serves as Chief Executive Officer, Chairman, and a Director of FMR LLC; Chairman and a Director of FMR; Chairman and a Director of Fidelity Research & Analysis Company (FRAC); Chairman and a Director of Fidelity Investments Money Management, Inc.; and Chairman and a Director of FMR Co., Inc. In addition, Mr. Johnson serves as Chairman and Director of FIL Limited. Previously, Mr. Johnson served as President of FMR LLC (2006-2007). |
James C. Curvey (75) |
| Year of Election or Appointment: 2007 Mr. Curvey also serves as Trustee (2007-present) of other investment companies advised by FMR. Mr. Curvey is a Director of FMR and FMR Co., Inc. (2007-present). Mr. Curvey is also Vice Chairman (2006-present) and Director of FMR LLC. In addition, Mr. Curvey serves as an Overseer for the Boston Symphony Orchestra and a member of the Trustees of Villanova University. |
* Trustees have been determined to be "Interested Trustees" by virtue of, among other things, their affiliation with the trust or various entities under common control with FMR.
+ The information above includes each Trustee's principal occupation during the last five years and other information relating to the experience, attributes, and skills relevant to each Trustee's qualifications to serve as a Trustee, which led to the conclusion that each Trustee should serve as a Trustee for the fund.
Annual Report
Independent Trustees:
Correspondence intended for each Independent Trustee (that is, the Trustees other than the Interested Trustees) may be sent to Fidelity Investments, P.O. Box 55235, Boston, Massachusetts 02205-5235.
Name, Age; Principal Occupations and Other Relevant Experience+ |
Dennis J. Dirks (62) |
| Year of Election or Appointment: 2005 Prior to his retirement in May 2003, Mr. Dirks was Chief Operating Officer and a member of the Board of The Depository Trust & Clearing Corporation (DTCC). He also served as President, Chief Operating Officer, and Board member of The Depository Trust Company (DTC) and President and Board member of the National Securities Clearing Corporation (NSCC). In addition, Mr. Dirks served as Chief Executive Officer and Board member of the Government Securities Clearing Corporation, Chief Executive Officer and Board member of the Mortgage-Backed Securities Clearing Corporation, as a Trustee and a member of the Finance Committee of Manhattan College (2005-2008), and as a Trustee and a member of the Finance Committee of AHRC of Nassau County (2006-2008). Currently, Mr. Dirks serves as a member of the Board of Directors for The Brookville Center for Children's Services, Inc. (2009-present). |
Alan J. Lacy (56) |
| Year of Election or Appointment: 2008 Mr. Lacy serves as Senior Adviser (2007-present) of Oak Hill Capital Partners, L.P. (private equity). Mr. Lacy also served as Chief Executive Officer (2000-2005) and Vice Chairman (2005-2006) of Sears Holdings Corporation and Sears, Roebuck and Co. (retail). In addition, Mr. Lacy serves as a member of the Board of Directors of The Western Union Company (global money transfer, 2006-present) and Bristol-Myers Squibb Company (global pharmaceuticals, 2007-present). Mr. Lacy is Chairman (2008-present) and a member (2006-present) of the Board of Trustees of The National Parks Conservation Association. |
Ned C. Lautenbach (66) |
| Year of Election or Appointment: 2000 Mr. Lautenbach is Chairman of the Independent Trustees of the Equity and High Income Funds (2006-present). Mr. Lautenbach is an Advisory Partner of Clayton, Dubilier & Rice, Inc. (private equity investment, 2008-present) and was previously a Partner of Clayton, Dubilier & Rice, Inc. (1998-2008). Previously, Mr. Lautenbach was with the International Business Machines Corporation (IBM) from 1968 until his retirement in 1998. Mr. Lautenbach serves as a Director of Eaton Corporation (diversified industrial) as well as the Philharmonic Center for the Arts in Naples, Florida. Mr. Lautenbach is also a member of the Board of Trustees of Fairfield University (2005-present), as well as a member of the Council on Foreign Relations. Previously, Mr. Lautenbach served as a Director of Sony Corporation (2006-2007). |
Joseph Mauriello (65) |
| Year of Election or Appointment: 2008 Prior to his retirement in January 2006, Mr. Mauriello served in numerous senior management positions including Deputy Chairman and Chief Operating Officer (2004-2005), and Vice Chairman of Financial Services (2002-2004) of KPMG LLP US (professional services, 1965-2005). Mr. Mauriello currently serves as a member of the Board of Directors of XL Capital Ltd. (global insurance and re-insurance, 2006-present) and of Arcadia Resources Inc. (health care services and products, 2007- present). Previously, Mr. Mauriello served as a Director of the Hamilton Funds of the Bank of New York (2006-2007). |
Cornelia M. Small (66) |
| Year of Election or Appointment: 2005 Ms. Small is a member of the Board of Directors of the Teagle Foundation (2009-present). Ms. Small is also a member of the Investment Committee, and Chair (2008-present) and a member of the Board of Trustees of Smith College. In addition, Ms. Small serves on the Investment Committee of the Berkshire Taconic Community Foundation (2008-present). Previously, Ms. Small served as Chairperson of the Investment Committee (2002- 2008) of Smith College. In addition, Ms. Small served as Chief Investment Officer, Director of Global Equity Investments, and a member of the Board of Directors of Scudder, Stevens & Clark and Scudder Kemper Investments. |
William S. Stavropoulos (71) |
| Year of Election or Appointment: 2002 Mr. Stavropoulos is Vice Chairman of the Independent Trustees of the Equity and High Income Funds (2006-present). Mr. Stavropoulos serves as President and Founder of the Michigan Baseball Foundation, the Great Lakes Loons (2007-present). Mr. Stavropoulos is Chairman Emeritus of the Board of Directors of The Dow Chemical Company, where he previously served in numerous senior management positions, including President, CEO (1995-2000; 2002-2004), Chairman of the Executive Committee (2000-2006), and as a member of the Board of Directors (1990-2006). Currently, Mr. Stavropoulos is a Director of Teradata Corporation (data warehousing and technology solutions, 2008-present), Chemical Financial Corporation, Maersk Inc. (industrial conglomerate), Tyco International, Inc. (multinational manufacturing and services, 2007-present), and a member of the Advisory Board for Metalmark Capital (private equity investment, 2005-present). Mr. Stavropoulos is a special advisor to Clayton, Dubilier & Rice, Inc. (private equity investment). In addition, Mr. Stavropoulos is a member of the University of Notre Dame Advisory Council for the College of Science. |
David M. Thomas (61) |
| Year of Election or Appointment: 2008 Previously, Mr. Thomas served as Executive Chairman (2005-2006) and Chairman and Chief Executive Officer (2000-2005) of IMS Health, Inc. (pharmaceutical and healthcare information solutions). In addition, Mr. Thomas serves as a member of the Board of Directors of Fortune Brands, Inc. (consumer products), and Interpublic Group of Companies, Inc. (marketing communication, 2004-present). |
Michael E. Wiley (59) |
| Year of Election or Appointment: 2008 Mr. Wiley also serves as a Director of Asia Pacific Exploration Consolidated (international oil and gas exploration and production, 2008- present), and as a member of the Board of Trustees of the University of Tulsa (2000-2006; 2007-present). Mr. Wiley serves as a Director of Tesoro Corporation (independent oil refiner and marketer, 2005-
present), and a Director of Bill Barrett Corporation (exploration and production, 2005-present). In addition, Mr. Wiley also serves as a Director of Post Oak Bank (privately-held bank, 2004-present). Previously, Mr. Wiley served as a Sr. Energy Advisor of Katzenbach Partners, LLC (consulting, 2006-2007), as an Advisory Director of Riverstone Holdings (private investment), Chairman, President, and CEO of Baker Hughes, Inc. (oilfield services, 2000-2004), and as Director of Spinnaker Exploration Company (exploration and production, 2001-2005). |
Annual Report
Trustees and Officers - continued
+ The information above includes each Trustee's principal occupation during the last five years and other information relating to the experience, attributes, and skills relevant to each Trustee's qualifications to serve as a Trustee, which led to the conclusion that each Trustee should serve as a Trustee for the fund.
Advisory Board Member and Executive Officers:
Correspondence intended for each executive officer and Peter S. Lynch may be sent to Fidelity Investments, 82 Devonshire Street, Boston, Massachusetts 02109.
Name, Age; Principal Occupation |
Peter S. Lynch (66) |
| Year of Election or Appointment: 2003 Member of the Advisory Board of Fidelity's Equity and High Income Funds. Mr. Lynch is Vice Chairman and a Director of FMR and FMR Co., Inc. In addition, Mr. Lynch serves as a Trustee of Boston College and as the Chairman of the Inner-City Scholarship Fund. Previously, Mr. Lynch served on the Special Olympics International Board of Directors (1997-2006). |
Kenneth B. Robins (40) |
| Year of Election or Appointment: 2008 President and Treasurer of Fidelity's Equity and High Income Funds. Mr. Robins also serves as President and Treasurer (2010-present) and Assistant Treasurer (2009-present) of other Fidelity funds and is an employee of Fidelity Investments (2004-present). Previously, Mr. Robins served as Deputy Treasurer of the Fidelity funds (2005-2008) and Treasurer and Chief Financial Officer of The North Carolina Capital Management Trust: Cash and Term Portfolios (2006-2008). |
Bruce T. Herring (44) |
| Year of Election or Appointment: 2006 Vice President of certain Equity Funds. Mr. Herring also serves as Group Chief Investments Officer of FMR. Previously, Mr. Herring served as a portfolio manager for Fidelity U.S. Equity Funds. |
Brian B. Hogan (45) |
| Year of Election or Appointment: 2009 Vice President of certain Equity Funds and Vice President of Sector Funds. Mr. Hogan also serves as Senior Vice President, Equity Research of FMR (2006-present) and President of FMR's Equity Division (2009- present). Previously, Mr. Hogan served as a portfolio manager. |
Scott C. Goebel (42) |
| Year of Election or Appointment: 2008 Secretary and Chief Legal Officer (CLO) of the Fidelity funds. Mr. Goebel also serves as General Counsel, Secretary, and Senior Vice President of FMR (2008-present) and FMR Co., Inc. (2008-present); Deputy General Counsel of FMR LLC; Chief Legal Officer of Fidelity Management & Research (Hong Kong) Limited (2008-present) and Assistant Secretary of Fidelity Management & Research (Japan) Inc. (2008-present), Fidelity Investments Money Management, Inc. (2008-present), Fidelity Management & Research (U.K.) Inc. (2008-present), and Fidelity Research and Analysis Company (2008-present). Previously, Mr. Goebel served as Assistant Secretary of the Funds (2007-2008) and as Vice President and Secretary of Fidelity Distributors Corporation (FDC) (2005-2007). |
William C. Coffey (41) |
| Year of Election or Appointment: 2009 Assistant Secretary of Fidelity's Equity and High Income Funds. Mr. Coffey also serves as Senior Vice President and Deputy General Counsel of FMR LLC (2010-present), and is an employee of Fidelity Investments. Previously, Mr. Coffey served as Vice President and Associate General Counsel of FMR LLC (2005-2009). |
Holly C. Laurent (56) |
| Year of Election or Appointment: 2008 Anti-Money Laundering (AML) Officer of the Fidelity funds. Ms. Laurent is an employee of Fidelity Investments. Previously, Ms. Laurent was Senior Vice President and Head of Legal for Fidelity Business Services India Pvt. Ltd. (2006-2008), and Senior Vice President, Deputy General Counsel and Group Head for FMR LLC (2005-2006). |
Christine Reynolds (51) |
| Year of Election or Appointment: 2008 Chief Financial Officer of the Fidelity funds. Ms. Reynolds became President of Fidelity Pricing and Cash Management Services (FPCMS) in August 2008. Ms. Reynolds served as Chief Operating Officer of FPCMS (2007-2008). Previously, Ms. Reynolds served as President, Treasurer, and Anti-Money Laundering officer of the Fidelity funds (2004-2007). |
Kenneth A. Rathgeber (63) |
| Year of Election or Appointment: 2004 Chief Compliance Officer of Fidelity's Equity and High Income Funds. Mr. Rathgeber is Chief Compliance Officer of Fidelity Management & Research (Hong Kong) Limited (2008-present), Fidelity Management & Research (Japan) Inc. (2008-present), FMR (2005-present), FMR Co., Inc. (2005-present), Fidelity Management & Research (U.K.) Inc. (2005-present), Fidelity Research & Analysis Company (2005-present), Fidelity Investments Money Management, Inc. (2005-present), Pyramis Global Advisors, LLC (2005-present), and Strategic Advisers, Inc. (2005-present). |
Jeffrey S. Christian (48) |
| Year of Election or Appointment: 2009 Deputy Treasurer of the Fidelity funds. Mr. Christian is an employee of Fidelity Investments. Previously, Mr. Christian served as Chief Financial Officer (2008-2009) of certain Fidelity funds and Senior Vice President of Fidelity Pricing and Cash Management Services (FPCMS) (2004-2009). |
Bryan A. Mehrmann (49) |
| Year of Election or Appointment: 2005 Deputy Treasurer of the Fidelity funds. Mr. Mehrmann is an employee of Fidelity Investments. |
Adrien E. Deberghes (42) |
| Year of Election or Appointment: 2008 Deputy Treasurer of Fidelity's Equity and High Income Funds. Mr. Deberghes also serves as Assistant Treasurer of other Fidelity funds (2010-present) and is an employee of Fidelity Investments (2008-present). Previously, Mr. Deberghes served as Senior Vice President of Mutual Fund Administration at State Street Corporation (2007-2008), Senior Director of Mutual Fund Administration at Investors Bank & Trust (2005-2007), and Director of Finance for Dunkin' Brands (2000-2005). |
Stephanie J. Dorsey (41) |
| Year of Election or Appointment: 2010 Assistant Treasurer of Fidelity's Equity and High Income Funds. Ms. Dorsey also serves as Deputy Treasurer of other Fidelity funds (2008- present) and is an employee of Fidelity Investments (2008-present). Previously, Ms. Dorsey served as Treasurer (2004-2008) of the JPMorgan Mutual Funds and Vice President (2004-2008) of JPMorgan Chase Bank. |
John R. Hebble (52) |
| Year of Election or Appointment: 2009 Assistant Treasurer of Fidelity's Equity and High Income Funds. Mr. Hebble also serves as Treasurer and Chief Financial Officer of The North Carolina Capital Management Trust: Cash and Term Portfolio (2008-present), President and Treasurer of other Fidelity funds (2008-present) and is an employee of Fidelity Investments. |
Gary W. Ryan (51) |
| Year of Election or Appointment: 2005 Assistant Treasurer of the Fidelity funds. Mr. Ryan is an employee of Fidelity Investments. Previously, Mr. Ryan served as Vice President of Fund Reporting in Fidelity Pricing and Cash Management Services (FPCMS) (1999-2005). |
Annual Report
Board Approval of Investment Advisory Contracts and Management Fees
Fidelity OTC Portfolio
Each year, the Board of Trustees, including the Independent Trustees (together, the Board), votes on the renewal of the management contract and sub-advisory agreements (together, the Advisory Contracts) for the fund. The Board, assisted by the advice of fund counsel and Independent Trustees' counsel, requests and considers a broad range of information relevant to the renewal of the Advisory Contracts throughout the year.
The Board meets regularly and considers at each of its meetings factors that are relevant to its annual consideration of the renewal of the fund's Advisory Contracts, including the services and support provided to the fund and its shareholders. The Board has established various standing committees, each composed of Independent Trustees with varying backgrounds, to which the Board has assigned specific subject matter responsibilities in order to enhance effective decision-making by the Board. The Board, acting directly and through its Committees, requests and receives information concerning the annual consideration of the renewal of the fund's Advisory Contracts. The Board also meets as needed to consider matters specifically related to the Board's annual consideration of the renewal of Advisory Contracts. Members of the Board may also meet with trustees of other Fidelity funds through ad hoc joint committees to discuss certain matters relevant to the Fidelity funds.
At its July 2010 meeting, the Board of Trustees, including the Independent Trustees, unanimously determined to renew the fund's Advisory Contracts. In reaching its determination, the Board considered all factors it believed relevant, including (i) the nature, extent, and quality of the services to be provided to the fund and its shareholders (including the investment performance of the fund); (ii) the competitiveness of the fund's management fee and total expenses; (iii) the total costs of the services to be provided by and the profits to be realized by Fidelity from its relationship with the fund; (iv) the extent to which economies of scale would be realized as the fund grows; and (v) whether fee levels reflect these economies of scale, if any, for the benefit of fund shareholders.
In considering whether to renew the Advisory Contracts for the fund, the Board reached a determination, with the assistance of fund counsel and Independent Trustees' counsel and through the exercise of its business judgment, that the renewal of the Advisory Contracts is in the best interests of fund shareholders and that the compensation to be received by Fidelity under the management contract is fair and reasonable. The Board's decision to renew the Advisory Contracts was not based on any single factor noted above, but rather was based on a comprehensive consideration of all the information provided to the Board at its meetings throughout the year. The Board, in reaching its determination to renew the Advisory Contracts, is aware that shareholders in the fund have a broad range of investment choices available to them, including a wide choice among mutual funds offered by Fidelity's competitors, and that the fund's shareholders, with the opportunity to review and weigh the disclosure provided by the fund in its prospectus and other public disclosures, have chosen to invest in this fund, managed by Fidelity.
Annual Report
Nature, Extent, and Quality of Services Provided. The Board considered the staffing within the investment adviser, FMR, and the sub-advisers (together, the Investment Advisers), including the backgrounds of the fund's investment personnel and the fund's investment objective and discipline. The Independent Trustees also had discussions with senior management of Fidelity's investment operations and investment groups. The Board considered the structure of the portfolio manager compensation program and whether this structure provides appropriate incentives to act in the best interest of the fund.
Resources Dedicated to Investment Management and Support Services. The Board and the equity research subcommittee of the Board's Fund Oversight Committee reviewed the size, education, and experience of the Investment Advisers' investment staff, their use of technology, and the Investment Advisers' approach to recruiting, training, and retaining portfolio managers and other research, advisory, and management personnel. The Board noted that Fidelity's analysts have access to a variety of technological tools and market and securities data that enable them to perform both fundamental and quantitative analysis and to specialize in various disciplines. The Board considered Fidelity's extensive global research capabilities that enable the Investment Advisers to aggregate data from various sources in an effort to produce positive investment results. The Board also considered that Fidelity's portfolio managers and analysts have access to daily portfolio attribution that allows for monitoring of a fund's portfolio, as well as an electronic communication system that provides immediate real-time access to research concerning issuers and credit enhancers. The Board noted FMR's continued focus on strengthening the organization and discipline of equity portfolio management and research.
Shareholder and Administrative Services. The Board considered (i) the nature, extent, quality, and cost of advisory, administrative, and shareholder services performed by the Investment Advisers and their affiliates under the Advisory Contracts and under separate agreements covering transfer agency, pricing and bookkeeping, and securities lending services for the fund; (ii) the nature and extent of the investment adviser's supervision of third party service providers, principally custodians and subcustodians; and (iii) the resources devoted to, and the record of compliance with, the fund's compliance policies and procedures. The Board also reviewed the allocation of fund brokerage, including allocations to brokers affiliated with the Investment Advisers, the use of brokerage commissions to pay fund expenses, and the use of "soft" commission dollars to pay for research services.
The Board noted that the growth of fund assets over time across the complex allows Fidelity to reinvest in the development of services designed to enhance the value or convenience of the Fidelity funds as investment vehicles. These services include 24-hour access to account information and market information through phone representatives and over the Internet, and investor education materials and asset allocation tools.
Annual Report
Board Approval of Investment Advisory Contracts and
Management Fees - continued
Investment in a Large Fund Family. The Board considered the benefits to shareholders of investing in a Fidelity fund, including the benefits of investing in a fund that is part of a large family of funds offering a variety of investment disciplines and providing a large variety of mutual fund investor services. The Board noted that Fidelity had taken, or had made recommendations that resulted in the Fidelity funds taking, a number of actions over the previous year that benefited particular funds, including (i) dedicating additional resources to investment research and restructuring and broadening the focus of the investment research teams; (ii) bolstering the senior management team that oversees asset management; (iii) launching Class F of certain funds as a lower-fee class available to Freedom K and Freedom Index Funds; (iv) lowering the initial investment minimums and ongoing balance requirements for Real Estate High Income Fund; (v) eliminating subsequent purchase minimums for all funds and adding a waiver of the investment minimum requirement for new accounts opened with the proceeds of a systematic withdrawal plan; (vi) eliminating the withdrawal minimum and maximum limits for systematic withdrawals from Advisor funds; (vii) expanding sales load waivers on Class A shares for Destiny Planholders and expanding Institutional Class eligibility for Class O Destiny Planholders; and (viii) changing certain Class A and Class T sales charge structures to further align them with industry practices.
Investment Performance. The Board considered whether the fund has operated in accordance with its investment objective, as well as its record of compliance with its investment restrictions. It also reviewed the fund's absolute investment performance for each class, as well as the fund's relative investment performance for each class measured over multiple periods against a broad-based securities market index. The Board noted that FMR does not believe that a meaningful peer group exists against which to compare the fund's performance. The following charts considered by the Board show, over the one-, three-, and five-year periods ended December 31, 2009, as available, the cumulative total returns of Class K and the retail class of the fund and the cumulative total returns of a broad-based securities market index ("benchmark").
Annual Report
Fidelity OTC Portfolio
The Board noted that the investment performance of the retail class of the fund (the class with the longer performance record) compared favorably to its benchmark for all the periods shown. The Board also reviewed the fund's performance since inception as well as performance in the current year.
The Board also considered that the fund's management fee is subject to upward or downward adjustment depending upon whether, and to what extent, the fund's investment performance for the performance period exceeds, or is exceeded by, the record (over the same period) of a Board-approved performance adjustment index. The Board realizes that the performance adjustment provides FMR with a strong economic incentive to seek to achieve superior performance for the fund's shareholders and helps to more closely align the interests of FMR and the fund's shareholders.
Based on its review, and giving particular weight to the nature and quality of the resources dedicated by the Investment Advisers to maintain and improve relative performance and factoring in the unprecedented market events in recent years, the Board concluded that the nature, extent, and quality of investment management and support services and of shareholder and administrative services provided to the fund will benefit the fund's shareholders, particularly in light of the Board's view that the fund's shareholders benefit from investing in a fund that is part of a large family of funds offering a variety of investment disciplines and services.
Competitiveness of Management Fee and Total Fund Expenses. The Board considered the fund's management fee and total expenses compared to "mapped groups" of competitive funds and classes. Fidelity creates "mapped groups" by combining similar Lipper investment objective categories that have comparable management fee characteristics. Combining Lipper investment objective categories aids the Board's management fee and total expense comparisons by broadening the competitive group used for comparison and by reducing the number of universes to which various Fidelity funds are compared.
Annual Report
Board Approval of Investment Advisory Contracts and
Management Fees - continued
Management Fee. The Board considered two proprietary management fee comparisons for the 12-month periods shown in the chart below. The group of Lipper funds used by the Board for management fee comparisons is referred to below as the "Total Mapped Group." The Total Mapped Group comparison focuses on a fund's standing relative to the total universe of comparable funds available to investors, in terms of gross management fees before expense reimbursements or caps, and without giving effect to the fund's performance adjustment. "TMG %" represents the percentage of funds in the Total Mapped Group that had management fees that were lower than the fund's. For example, a TMG % of 17% means that 83% of the funds in the Total Mapped Group had higher management fees than the fund. The "Asset-Size Peer Group" (ASPG) comparison focuses on a fund's standing relative to non-Fidelity funds similar in size to the fund within the Total Mapped Group. The ASPG represents at least 15% of the funds in the Total Mapped Group with comparable asset size and management fee characteristics, subject to a minimum of 50 funds (or all funds in the Total Mapped Group if fewer than 50). Additional information, such as the ASPG quartile in which the fund's management fee ranked and the impact of the fund's performance adjustment, is also included in the chart and considered by the Board.
Fidelity OTC Portfolio
Annual Report
The Board noted that the fund's management fee ranked below the median of its Total Mapped Group and below the median of its ASPG for 2009. The Board also noted the effect of the fund's positive performance adjustment on the fund's management fee ranking. The Board noted that the performance adjustment for each year represents calculations for performance periods that differ from the periods shown in the performance charts above.
Based on its review, the Board concluded that the fund's management fee is fair and reasonable in light of the services that the fund receives and the other factors considered.
Total Expenses. In its review of each class's total expenses, the Board considered the fund's management fee as well as other fund or class expenses, as applicable, such as transfer agent fees, pricing and bookkeeping fees, and custodial, legal, and audit fees. The Board also noted the effects of any waivers and reimbursements on fees and expenses, as well as the impact of the fund's performance adjustment. As part of its review, the Board also considered current and historical total expenses of each class of the fund compared to competitive fund median expenses. Each class of the fund is compared to those funds and classes in the Total Mapped Group (used by the Board for management fee comparisons) that have a similar sales load structure.
The Board noted that the total expenses of each class ranked below its competitive median for 2009.
Fees Charged to Other Fidelity Clients. The Board also considered Fidelity fee structures and other information with respect to clients of FMR and its affiliates, such as other mutual funds advised or subadvised by FMR or its affiliates, pension plan clients, and other institutional clients. In March 2010, the Board created an ad hoc joint committee with the board of other Fidelity funds (the Committee) to review and compare Fidelity's institutional investment advisory business with its business of providing services to the Fidelity funds, including the differences in services provided, fees charged, and costs incurred, as well as competition in their respective marketplaces.
Based on its review of total expenses and fees charged to other Fidelity clients, the Board concluded that the total expenses of each class of the fund were reasonable in light of the services that the fund and its shareholders receive and the other factors considered, including the findings of the Committee.
Costs of the Services and Profitability. The Board considered the revenues earned and the expenses incurred by Fidelity in conducting the business of developing, marketing, distributing, managing, administering and servicing the fund and its shareholders. The Board also considered the level of Fidelity's profits in respect of all the Fidelity funds.
Annual Report
Board Approval of Investment Advisory Contracts and
Management Fees - continued
On an annual basis, FMR presents to the Board Fidelity's profitability for the fund. Fidelity calculates the profitability for each fund, as well as aggregate profitability for groups of Fidelity funds and all Fidelity funds, using a series of detailed revenue and cost allocation methodologies which originate with the audited books and records of Fidelity. The Audit Committee of the Board reviews any significant changes from the prior year's methodologies.
PricewaterhouseCoopers LLP (PwC), independent registered public accounting firm and auditor to Fidelity and certain Fidelity funds, has been engaged annually by the Board as part of the Board's assessment of Fidelity's profitability analysis. PwC's engagement includes the review and assessment of Fidelity's methodologies used in determining the revenues and expenses attributable to Fidelity's mutual fund business, and completion of agreed-upon procedures surrounding the mathematical accuracy of fund profitability and its conformity to allocation methodologies. After considering PwC's reports issued under the engagement and information provided by Fidelity, the Board believes that while other allocation methods may also be reasonable, Fidelity's profitability methodologies are reasonable in all material respects.
The Board has also reviewed Fidelity's non-fund businesses and fall-out benefits related to the mutual fund business as well as cases where Fidelity's affiliates may benefit from or be related to the fund's business.
The Board considered the costs of the services provided by and the profits realized by Fidelity in connection with the operation of the fund and were satisfied that the profitability was not excessive in the circumstances.
Economies of Scale. The Board considered whether there have been economies of scale in respect of the management of the Fidelity funds, whether the Fidelity funds (including the fund) have appropriately benefited from any such economies of scale, and whether there is potential for realization of any further economies of scale. The Board considered the extent to which the fund will benefit from economies of scale through increased services to the fund, through waivers or reimbursements, or through fee or expense reductions.
In February 2009, the Board and the board of other Fidelity funds created an ad hoc committee (the Economies of Scale Committee) to analyze whether FMR attains economies of scale in respect of the management and servicing of the Fidelity funds, whether the Fidelity funds have appropriately benefited from such economies of scale, and whether there is potential for realization of any further economies of scale.
The Board recognized that the fund's management contract incorporates a "group fee" structure, which provides for lower group fee rates as total fund assets under FMR's management increase, and for higher group fee rates as total fund assets under FMR's management decrease. FMR calculates the group fee rates based on a tiered asset "breakpoint" schedule that varies based on asset class. The Board considered that the group fee is designed to deliver the benefits of economies of scale to fund shareholders when total Fidelity fund assets increase, even if assets of any particular fund are unchanged or have declined, because some portion of Fidelity's costs are attributable to services provided to all Fidelity funds, and all funds benefit if those costs can be allocated among more assets. The Board concluded that, given the group fee structure, fund shareholders will benefit from lower management fees as assets under FMR's management increase at the fund complex level, regardless of whether Fidelity achieves any such economies of scale.
Annual Report
The Board concluded, considering the findings of the Economies of Scale Committee, that any potential economies of scale are being appropriately shared between fund shareholders and Fidelity.
Additional Information Requested by the Board. In order to develop fully the factual basis for consideration of the Fidelity funds' Advisory Contracts, the Board requested and received additional information on certain topics, including (i) fund performance trends, actions to be taken by FMR to improve certain funds' overall performance, and Fidelity's long-term strategies for certain funds; (ii) portfolio manager changes that have occurred during the past year and length of portfolio manager tenure for different categories of funds over time; (iii) Fidelity's compensation structure for portfolio managers, research analysts, and other key personnel, the rationale for the compensation structure, and how the compensation structure provides appropriate performance incentives; (iv) the amount of the investment that each portfolio manager has made in the Fidelity fund(s) that he or she manages; (v) management and other fees paid by FMR to affiliated sub-advisers on behalf of the Fidelity funds; (vi) Fidelity's fee structures and rationale for recommending different fees among different categories of funds; (vii) Fidelity's rationale for recommending which funds should have a performance adjustment component as part of their management fees; (viii) the rationale for any differences between fund fee structures and fee structures in place for other Fidelity clients; and (ix) explanations regarding the relative total expenses borne by certain funds and classes, total expense competitive trends, and actions that might be taken by FMR to reduce total expenses for certain funds and classes.
Based on its evaluation of all of the conclusions noted above, and after considering all factors it believed relevant, the Board ultimately concluded that the advisory fee structures are fair and reasonable, and that the fund's Advisory Contracts should be renewed.
Annual Report
Managing Your Investments
Fidelity offers several ways to conveniently manage your workplace benefits (including your workplace savings plan, investments, and additional services) via your telephone or PC. You can access your plan and account information and research your investments 24 hours a day.
By Phone
Fidelity provides a single toll-free number to access plan information, account balances, positions, and quotes*. It's easy to navigate the service, and on your first call, the system will help you create a personal identification number (PIN) for security.
(phone_graphic)
Fidelity Workplace
Investing
1-800-835-5092
By PC
Fidelity's web site on the Internet provides a wide range of information, including plan information, daily financial news, fund performance, interactive planning tools, and news about Fidelity products and services.
(computer_graphic)
Fidelity's Web Site
www.401k.com
* When you call the quotes line, please remember that a fund's yield and return will vary and, except for money market funds, share price will also vary. This means that you may have a gain or loss when you sell your shares. There is no assurance that money market funds will be able to maintain a stable $1 share price; an investment in a money market fund is not insured or guaranteed by the U.S. government. Total returns are historical and include changes in share price, reinvestment of dividends and capital gains, and the effects of any sales charges.
Annual Report
To Write Fidelity
We'll give your correspondence immediate attention and send you written confirmation upon completion of your request.
(letter_graphic)
For Non-Retirement
Accounts
Buying shares
Fidelity Investments
P.O. Box 770001
Cincinnati, OH 45277-0003
Overnight Express
Fidelity Investments
Attn: Distribution Services
100 Crosby Parkway - KC1H
Covington, KY 41015
Selling shares
Fidelity Investments
P.O. Box 770001
Cincinnati, OH 45277-0035
Overnight Express
Fidelity Investments
Attn: Distribution Services
100 Crosby Parkway - KC1H
Covington, KY 41015
General Correspondence
Fidelity Investments
P.O. Box 500
Merrimack, NH 03054-0500
(letter_graphic)
For Retirement
Accounts
Buying shares
Fidelity Investments
P.O. Box 770001
Cincinnati, OH 45277-0003
Selling shares
Fidelity Investments
P.O. Box 770001
Cincinnati, OH 45277-0035
Overnight Express
Fidelity Investments
Attn: Distribution Services
100 Crosby Parkway - KC1H
Covington, KY 41015
General Correspondence
Fidelity Investments
P.O. Box 500
Merrimack, NH 03054-0500
Annual Report
Investment Adviser
Fidelity Management & Research Company
Boston, MA
Investment Sub-Advisers
FMR Co., Inc.
Fidelity Research & Analysis Company
Fidelity Management & Research
(U.K.) Inc.
Fidelity Management & Research
(Hong Kong) Limited
Fidelity Management & Research
(Japan) Inc.
General Distributor
Fidelity Distributors Corporation
Boston, MA
Transfer and Service Agents
Fidelity Investments Institutional
Operations Company, Inc.
Boston, MA
Fidelity Service Company, Inc.
Boston, MA
Custodian
The Northern Trust Company
Chicago, IL
OTC-K-UANN-0910
1.863303.101
Fidelity®
Real Estate Income
Fund
Annual Report
July 31, 2010
(2_fidelity_logos) (Registered_Trademark)
Contents
Chairman's Message | <Click Here> | The Chairman's message to shareholders. |
Performance | <Click Here> | How the fund has done over time. |
Management's Discussion of Fund Performance | <Click Here> | The Portfolio Manager's review of fund performance and strategy. |
Shareholder Expense Example | <Click Here> | An example of shareholder expenses. |
Investment Changes | <Click Here> | A summary of major shifts in the fund's investments over the past year. |
Investments | <Click Here> | A complete list of the fund's investments with their market values. |
Financial Statements | <Click Here> | Statements of assets and liabilities, operations, and changes in net assets,
as well as financial highlights. |
Notes | <Click Here> | Notes to the financial statements. |
Report of Independent Registered Public Accounting Firm | <Click Here> | |
Trustees and Officers | <Click Here> | |
Distributions | <Click Here> | |
Board Approval of Investment Advisory Contracts and Management Fees | <Click Here> | |
To view a fund's proxy voting guidelines and proxy voting record for the 12-month period ended June 30, visit http://www.fidelity.com/proxyvotingresults or visit the Securities and Exchange Commission's (SEC) web site at http://www.sec.gov. You may also call 1-800-544-8544 to request a free copy of the proxy voting guidelines.
Standard & Poor's, S&P and S&P 500 are registered service marks of The McGraw-Hill Companies, Inc. and have been licensed for use by Fidelity Distributors Corporation.
Other third party marks appearing herein are the property of their respective owners.
All other marks appearing herein are registered or unregistered trademarks or service marks of FMR LLC or an affiliated company.
Annual Report
This report and the financial statements contained herein are submitted for the general information of the shareholders of the fund. This report is not authorized for distribution to prospective investors in the fund unless preceded or accompanied by an effective prospectus.
A fund files its complete schedule of portfolio holdings with the SEC for the first and third quarters of each fiscal year on Form N-Q. Forms N-Q are available on the SEC's web site at http://www.sec.gov. A fund's Forms N-Q may be reviewed and copied at the SEC's Public Reference Room in Washington, DC. Information regarding the operation of the SEC's Public Reference Room may be obtained by calling 1-800-SEC-0330. For a complete list of a fund's portfolio holdings, view the most recent holdings listing, semiannual report, or annual report on Fidelity's web site at http://www.fidelity.com or http://www.advisor.fidelity.com, as applicable.
NOT FDIC INSURED • MAY LOSE VALUE • NO BANK GUARANTEE
Neither the fund nor Fidelity Distributors Corporation is a bank.
Annual Report
(photo_of_Edward_C_Johnson_3d)
Dear Shareholder:
A yearlong uptrend in global equity markets reversed course in late April 2010 when investor sentiment turned bearish due in great measure to concern that Europe's debt crisis would expand and slow or derail economic recovery. However, a bounceback in July helped to recover some of the ground that was lost. Financial markets are always unpredictable, of course, but there also are several time-tested investment principles that can help put the odds in your favor.
One of the basic tenets is to invest for the long term. Over time, riding out the markets' inevitable ups and downs has proven much more effective than selling into panic or chasing the hottest trend. Even missing only a few of the markets' best days can significantly diminish investor returns. Patience also affords the benefits of compounding - of earning interest on additional income or reinvested dividends and capital gains. There can be tax advantages and cost benefits to consider as well. While staying the course doesn't eliminate risk, it can considerably lessen the effect of short-term declines.
You can further manage your investing risk through diversification. And today, more than ever, geographic diversification should be taken into account. Studies indicate that asset allocation is the single most important determinant of a portfolio's long-term success. The right mix of stocks, bonds and cash - aligned to your particular risk tolerance and investment objective - is very important. Age-appropriate rebalancing is also an essential aspect of asset allocation. For younger investors, an emphasis on equities - which historically have been the best-performing asset class over time - is encouraged. As investors near their specific goal, such as retirement or sending a child to college, consideration may be given to replacing volatile assets (e.g. common stocks) with more-stable fixed investments (bonds or savings plans).
A third principle - investing regularly - can help lower the average cost of your purchases. Investing a certain amount of money each month or quarter helps ensure you won't pay for all your shares at market highs. This strategy - known as dollar cost averaging - also reduces "emotion" from investing, helping shareholders avoid selling weak performers just prior to an upswing, or chasing a hot performer just before a correction.
We invite you to contact us via the Internet, through our Investor Centers or by phone. It is our privilege to provide you the information you need to make the investments that are right for you.
Sincerely,
(The chairman's signature appears here.)
Edward C. Johnson 3d
Annual Report
Average annual total return reflects the change in the value of an investment, assuming reinvestment of the class' distribution from dividend income and capital gains (the profits earned upon the sale of securities that have grown in value, if any) and assuming a constant rate of performance each year. The $10,000 table and the fund's returns do not reflect the deduction of taxes that a shareholder would pay on fund distributions or the redemption of fund shares. During periods of reimbursement by Fidelity, a fund's total return will be greater than it would be had the reimbursement not occurred. How a fund did yesterday is no guarantee of how it will do tomorrow.
Average Annual Total Returns
Periods ended July 31, 2010 | Past 1
year | Past 5
years | Life of
fund A |
Fidelity® Real Estate Income Fund | 28.29% | 3.17% | 6.60% |
A From February 4, 2003.
$10,000 Over Life of Fund
Let's say hypothetically that $10,000 was invested in Fidelity® Real Estate Income Fund, a class of the fund, on February 4, 2003, when the fund started. The chart shows how the value of your investment would have changed, and also shows how the S&P 500® Index performed over the same period.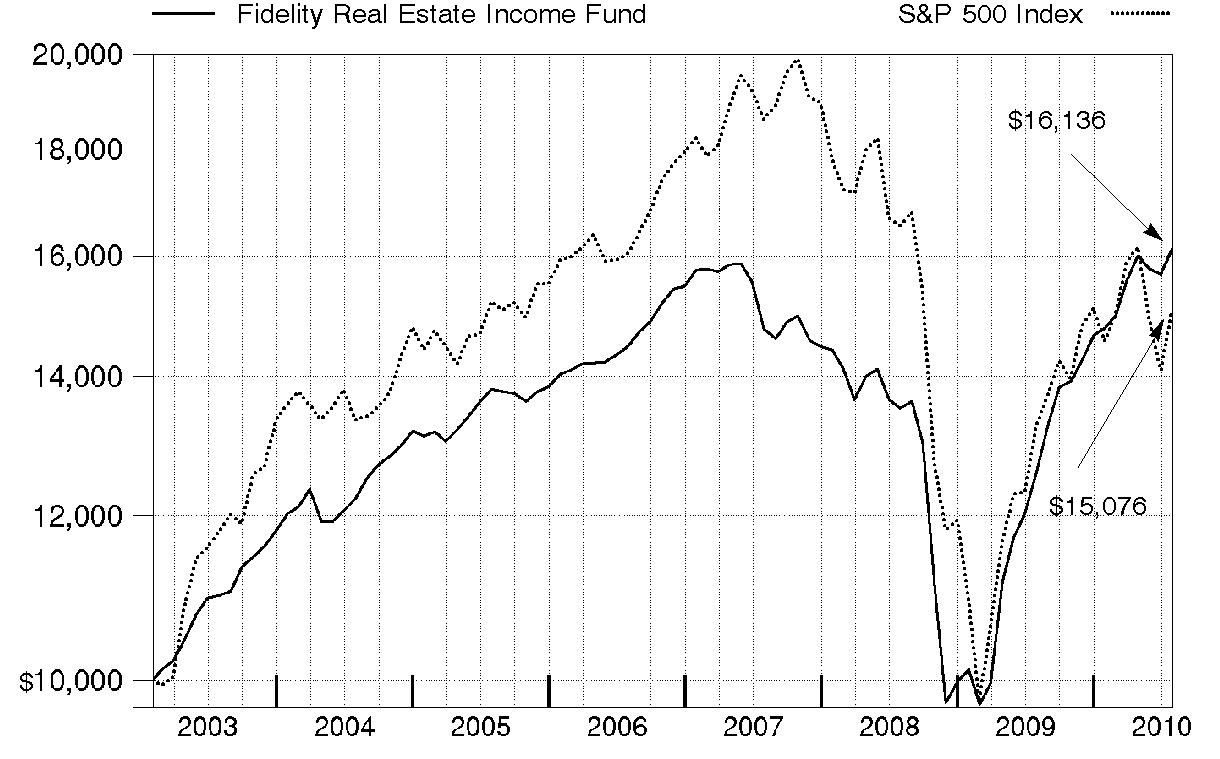
Annual Report
Market Recap: The 12 months ending July 31, 2010, reflected a gradual return to historical norms for investors in real estate stocks and bonds. Commercial property values, which significantly declined in 2008 and early 2009, stabilized and even began to increase modestly, benefiting from very low interest rates and better economic conditions. In addition, the income that commercial properties generated looked reasonable compared with U.S. Treasuries and other bond alternatives. Overall, property-related securities benefited from strengthening fundamentals. For example, in recent months, rents and occupancy rates in apartments and hotels started to improve, while rental rates for office properties stopped going down. For the year, The BofA Merrill Lynch U.S. Real Estate IndexSM - a market-capitalization-weighted measure of the performance of investment-grade public debt of corporate issuers in the domestic real estate sector - rose 22.94%. Real estate investment trusts (REITs) did the best, increasing 48.68%, as measured by the FTSE NAREIT All REIT Index. Both real estate bonds and stocks performed considerably better than the S&P 500® Index, a proxy for the broad U.S. equity market, which returned 13.84%.
Comments from Mark Snyderman, Portfolio Manager of Fidelity® Real Estate Income Fund: For the year, the fund's Retail Class shares returned 28.29%, while the Fidelity Real Estate Income Composite Index - a 40/40/20 blend of the MSCI® REIT Preferred Index, The BofA Merrill Lynch U.S. Real Estate Index and the FTSE NAREIT index, respectively - returned 33.67%. Overall, however, I'm pleased to have helped shareholders make a very good return in the past year. The fund's much smaller allocation to preferred stocks was the main reason for its underperformance of the Composite index. The fund's common and preferred stocks, real estate bonds and commercial mortgage-backed securities (CMBS) all turned in a healthy double-digit gain. Common stocks did the best, rising nearly 50%, slightly ahead of the FTSE NAREIT index. The portfolio's preferred stocks modestly outpaced the MSCI index's roughly 36% return. My real estate bond investments returned close to 20% overall, slightly lagging the BofA Merrill Lynch index because I tend to favor lower-duration securities - meaning those with less interest-rate sensitivity. The fund's CMBS allocation added nicely to returns. My holdings in this group - about 21% of the portfolio, on average - rose more than 35%.
The views expressed above reflect those of the portfolio manager(s) only through the end of the period as stated on the cover of this report and do not necessarily represent the views of Fidelity or any other person in the Fidelity organization. Any such views are subject to change at any time based upon market or other conditions and Fidelity disclaims any responsibility to update such views. These views may not be relied on as investment advice and, because investment decisions for a Fidelity fund are based on numerous factors, may not be relied on as an indication of trading intent on behalf of any Fidelity fund.
Annual Report
Shareholder Expense Example
As a shareholder of the Fund, you incur two types of costs: (1) transaction costs, including sales charges (loads) on purchase payments or redemption proceeds, redemption fees, and (2) ongoing costs, including management fees, distribution and/or service (12b-1) fees and other Fund expenses. This Example is intended to help you understand your ongoing costs (in dollars) of investing in the Fund and to compare these costs with the ongoing costs of investing in other mutual funds.
The actual expense Example is based on an investment of $1,000 invested at the beginning of the period and held for the entire period (February 1, 2010 to July 31, 2010) for Real Estate Income and for the entire period (April 14, 2010 to July 31, 2010) for Class A, Class T, Class C and Institutional Class. The hypothetical expense Example is based on an investment of $1,000 invested for the one-half year period (February 1, 2010 to July 31, 2010).
Actual Expenses
The first line of the accompanying table for each class of the Fund provides information about actual account values and actual expenses. You may use the information in this line, together with the amount you invested, to estimate the expenses that you paid over the period. Simply divide your account value by $1,000.00 (for example, an $8,600 account value divided by $1,000.00 = 8.6), then multiply the result by the number in the first line for a class of the Fund under the heading entitled "Expenses Paid During Period" to estimate the expenses you paid on your account during this period. A small balance maintenance fee of $12.00 that is charged once a year may apply for certain accounts with a value of less than $2,000. This fee is not included in the table below. If it was, the estimate of expenses you paid during the period would be higher, and your ending account value lower, by this amount. In addition, the Fund, as a shareholder in the underlying Fidelity Central Funds, will indirectly bear its pro-rata share of the fees and expenses incurred by the underlying Fidelity Central Funds. These fees and expenses are not included in the Fund's annualized expense ratio used to calculate the expense estimate in the table below.
Hypothetical Example for Comparison Purposes
The second line of the accompanying table for each class of the Fund provides information about hypothetical account values and hypothetical expenses based on a Class' actual expense ratio and an assumed rate of return of 5% per year before expenses, which is not the Class' actual return. The hypothetical account values and expenses may not be used to estimate the actual ending account balance or expenses you paid for the period. You may use this information to compare the ongoing costs of investing in the Fund and other funds. To do so, compare this 5% hypothetical example with the 5% hypothetical examples that appear in the shareholder reports of the other funds. A small balance maintenance fee of $12.00 that is charged once a year may apply for certain accounts with a value of less than $2,000. This fee is not included in the table below. If it was, the estimate of expenses you paid during the period would be higher, and your ending account value lower, by this amount. In addition, the Fund, as a shareholder in the underlying Fidelity Central Funds, will indirectly bear its pro-rata share of the fees and expenses incurred by the underlying Fidelity Central Funds. These fees and expenses are not included in the Fund's annualized expense ratio used to calculate the expense estimate in the table below.
Annual Report
Shareholder Expense Example - continued
Please note that the expenses shown in the table are meant to highlight your ongoing costs only and do not reflect any transaction costs. Therefore, the second line of the table is useful in comparing ongoing costs only, and will not help you determine the relative total costs of owning different funds. In addition, if these transactional costs were included, your costs would have been higher.
| Annualized Expense Ratio | Beginning
Account Value | Ending
Account Value
July 31, 2010 | Expenses Paid
During Period |
Class A | 1.09% | | | |
Actual | | $ 1,000.00 | $ 1,014.60 | $ 3.28 B |
HypotheticalA | | $ 1,000.00 | $ 1,019.39 | $ 5.46 C |
Class T | 1.17% | | | |
Actual | | $ 1,000.00 | $ 1,014.50 | $ 3.52 B |
HypotheticalA | | $ 1,000.00 | $ 1,018.99 | $ 5.86 C |
Class C | 1.86% | | | |
Actual | | $ 1,000.00 | $ 1,012.90 | $ 5.59 B |
HypotheticalA | | $ 1,000.00 | $ 1,015.57 | $ 9.30 C |
Real Estate Income | .93% | | | |
Actual | | $ 1,000.00 | $ 1,093.40 | $ 4.83 B |
HypotheticalA | | $ 1,000.00 | $ 1,020.18 | $ 4.66 C |
Institutional Class | .85% | | | |
Actual | | $ 1,000.00 | $ 1,015.80 | $ 2.56 B |
HypotheticalA | | $ 1,000.00 | $ 1,020.58 | $ 4.26 C |
A 5% return per year before expenses
B Actual expenses are equal to each Class' annualized expense ratio, multiplied by the average account value over the period, multiplied by 181/365 (to reflect the one-half year period) for Real Estate Income and multiplied by 108/365 (to reflect the period April 14, 2010 to July 31, 2010) for Class A, Class T, Class C and Institutional Class.
C Hypothetical expenses are equal to each Class' annualized expense ratio, multiplied by average account value over the period, multiplied by 181/365 (to reflect one-half year period.)
Annual Report
Investment Changes (Unaudited)
Top Five Stocks as of July 31, 2010 |
| % of fund's
net assets | % of fund's net assets
6 months ago |
MFA Financial, Inc. | 1.8 | 1.9 |
Acadia Realty Trust (SBI) | 1.5 | 1.2 |
Equity Lifestyle Properties, Inc. | 1.4 | 1.3 |
Cypress Sharpridge Investments, Inc. | 1.3 | 0.7 |
Ventas, Inc. | 1.3 | 1.4 |
| 7.3 | |
Top 5 Bonds as of July 31, 2010 |
| % of fund's
net assets | % of fund's net assets
6 months ago |
Lexington Master Ltd. Partnership 5.45% 1/15/27 | 1.4 | 2.0 |
Ventas Realty LP 6.5% 6/1/16 | 1.1 | 1.5 |
Acadia Realty Trust 3.75% 12/15/26 | 1.1 | 1.5 |
Inland Real Estate Corp. 4.625% 11/15/26 | 1.0 | 1.0 |
Omega Healthcare Investors, Inc. 7% 4/1/14 | 1.0 | 1.3 |
| 5.6 | |
Top Five REIT Sectors as of July 31, 2010 |
| % of fund's
net assets | % of fund's net assets
6 months ago |
REITs - Shopping Centers | 8.9 | 10.4 |
REITs - Mortgage | 8.7 | 7.3 |
REITs - Health Care Facilities | 8.3 | 11.1 |
REITs - Management/Investment | 6.6 | 7.1 |
REITs - Apartments | 5.0 | 7.0 |
Asset Allocation (% of fund's net assets) |
As of July 31, 2010* | As of January 31, 2010** |
| Common Stocks 23.4% | | | Common Stocks 20.9% | |
 | Preferred Stocks 8.1% | | | Preferred Stocks 9.4% | |
| Bonds 45.1% | | | Bonds 45.7% | |
| Convertible
Securities 11.8% | | | Convertible
Securities 16.4% | |
| Other Investments 1.5% | | | Other Investments 1.0% | |
| Short-Term
Investments and
Net Other Assets 10.1% | | | Short-Term
Investments and
Net Other Assets 6.6% | |
* Foreign investments | 2.3% | | ** Foreign investments | 2.9% | |

Annual Report
Investments July 31, 2010
Showing Percentage of Net Assets
Common Stocks - 23.4% |
| Shares | | Value |
CONSUMER DISCRETIONARY - 0.7% |
Hotels, Restaurants & Leisure - 0.3% |
Starwood Hotels & Resorts Worldwide, Inc. | 74,100 | | $ 3,590,145 |
Household Durables - 0.4% |
Stanley Martin Communities LLC Class B (a) | 4,620 | | 3,696,000 |
TOTAL CONSUMER DISCRETIONARY | | 7,286,145 |
FINANCIALS - 21.4% |
Capital Markets - 0.2% |
HFF, Inc. (a) | 271,664 | | 2,379,777 |
Real Estate Investment Trusts - 21.0% |
Acadia Realty Trust (SBI) | 853,449 | | 15,822,944 |
Alexandria Real Estate Equities, Inc. | 28,800 | | 2,031,840 |
AMB Property Corp. (SBI) | 248,200 | | 6,195,072 |
American Campus Communities, Inc. | 175,500 | | 5,080,725 |
Annaly Capital Management, Inc. | 523,250 | | 9,104,550 |
Anworth Mortgage Asset Corp. | 1,129,510 | | 7,872,685 |
Apartment Investment & Management Co. Class A | 141,241 | | 3,032,444 |
Associated Estates Realty Corp. | 432,500 | | 5,985,800 |
AvalonBay Communities, Inc. | 48,225 | | 5,067,965 |
Brandywine Realty Trust (SBI) | 191,100 | | 2,170,896 |
CapLease, Inc. | 124,200 | | 608,580 |
CBL & Associates Properties, Inc. | 296,173 | | 4,167,154 |
Cedar Shopping Centers, Inc. | 267,400 | | 1,657,880 |
Chimera Investment Corp. | 255,200 | | 987,624 |
Cypress Sharpridge Investments, Inc. | 1,018,863 | | 13,448,992 |
Cypress Sharpridge Investments, Inc. (g) | 146,458 | | 1,933,246 |
DCT Industrial Trust, Inc. | 413,600 | | 1,939,784 |
Developers Diversified Realty Corp. | 115,000 | | 1,305,250 |
DiamondRock Hospitality Co. | 264,700 | | 2,456,416 |
Duke Realty LP | 362,983 | | 4,341,277 |
Dynex Capital, Inc. | 350,000 | | 3,395,000 |
Equity Lifestyle Properties, Inc. | 266,930 | | 14,128,605 |
Equity Residential (SBI) | 52,200 | | 2,393,370 |
Excel Trust, Inc. (a) | 276,100 | | 3,158,584 |
Federal Realty Investment Trust (SBI) | 22,400 | | 1,751,456 |
Franklin Street Properties Corp. | 90,317 | | 1,102,771 |
Glimcher Realty Trust | 64,600 | | 429,590 |
Government Properties Income Trust | 73,500 | | 2,042,565 |
Health Care REIT, Inc. | 26,200 | | 1,187,122 |
Highwoods Properties, Inc. (SBI) | 106,400 | | 3,331,384 |
Kimco Realty Corp. | 87,800 | | 1,323,146 |
Common Stocks - continued |
| Shares | | Value |
FINANCIALS - continued |
Real Estate Investment Trusts - continued |
Lexington Corporate Properties Trust | 30,900 | | $ 198,687 |
MFA Financial, Inc. | 2,521,581 | | 18,508,390 |
Monmouth Real Estate Investment Corp. Class A | 427,000 | | 3,360,490 |
National Retail Properties, Inc. | 147,900 | | 3,419,448 |
Nationwide Health Properties, Inc. | 138,580 | | 5,185,664 |
Pebblebrook Hotel Trust (a) | 186,300 | | 3,407,427 |
Piedmont Office Realty Trust, Inc. Class A (f) | 158,700 | | 2,856,600 |
ProLogis Trust | 194,366 | | 2,110,815 |
Public Storage | 23,800 | | 2,335,256 |
Redwood Trust, Inc. | 278,000 | | 4,350,700 |
Regency Centers Corp. | 97,400 | | 3,675,876 |
Simon Property Group, Inc. | 96,001 | | 8,565,209 |
Sun Communities, Inc. | 35,000 | | 1,018,500 |
Sunstone Hotel Investors, Inc. (a) | 479,900 | | 4,952,568 |
The Macerich Co. | 93,074 | | 3,857,917 |
Two Harbors Investment Corp. | 346,800 | | 2,923,524 |
UDR, Inc. | 64,101 | | 1,353,172 |
Ventas, Inc. | 260,480 | | 13,211,546 |
Vornado Realty Trust | 43,790 | | 3,624,936 |
| | 218,371,442 |
Real Estate Management & Development - 0.2% |
CB Richard Ellis Group, Inc. Class A (a) | 122,500 | | 2,082,500 |
Thrifts & Mortgage Finance - 0.0% |
Wrightwood Capital LLC warrants 7/31/14 (a)(g) | 60,681 | | 607 |
TOTAL FINANCIALS | | 222,834,326 |
HEALTH CARE - 1.2% |
Health Care Providers & Services - 1.2% |
Brookdale Senior Living, Inc. (a) | 364,900 | | 5,174,282 |
Capital Senior Living Corp. (a) | 412,050 | | 2,225,070 |
Emeritus Corp. (a)(f) | 280,141 | | 4,821,227 |
| | 12,220,579 |
MATERIALS - 0.1% |
Paper & Forest Products - 0.1% |
Weyerhaeuser Co. | 61,500 | | 997,530 |
TOTAL COMMON STOCKS (Cost $210,556,928) | 243,338,580 |
Preferred Stocks - 9.5% |
| Shares | | Value |
Convertible Preferred Stocks - 1.4% |
FINANCIALS - 1.4% |
Real Estate Investment Trusts - 1.1% |
Alexandria Real Estate Equities, Inc. Series D 7.00% | 20,000 | | $ 457,500 |
CommonWealth REIT 6.50% | 80,000 | | 1,612,800 |
Lexington Corporate Properties Trust Series C 6.50% | 254,009 | | 9,303,080 |
| | 11,373,380 |
Real Estate Management & Development - 0.3% |
Forest City Enterprises, Inc. Series A 7.00% | 10,000 | | 508,000 |
Grubb & Ellis Co.: | | | |
12.00% (g) | 22,500 | | 1,833,750 |
12.00% (g) | 5,000 | | 407,500 |
| | 2,749,250 |
TOTAL FINANCIALS | | 14,122,630 |
Nonconvertible Preferred Stocks - 8.1% |
CONSUMER DISCRETIONARY - 0.0% |
Household Durables - 0.0% |
M/I Homes, Inc. Series A, 9.75% (a) | 18,200 | | 323,050 |
FINANCIALS - 8.1% |
Diversified Financial Services - 0.4% |
DRA CRT Acquisition Corp. Series A, 8.50% | 25,000 | | 306,250 |
Red Lion Hotels Capital Trust 9.50% | 163,125 | | 4,081,388 |
W2007 Grace Acquisition I, Inc. Series B, 8.75% (a) | 35,300 | | 4,236 |
| | 4,391,874 |
Real Estate Investment Trusts - 7.7% |
Alexandria Real Estate Equities, Inc. Series C, 8.375% | 67,000 | | 1,737,310 |
American Home Mortgage Investment Corp.: | | | |
Series A, 9.375% (a) | 120,300 | | 12 |
Series B, 9.25% (a) | 124,100 | | 124 |
Annaly Capital Management, Inc. Series A, 7.875% | 164,900 | | 4,224,738 |
Anworth Mortgage Asset Corp. Series A, 8.625% | 247,727 | | 6,188,220 |
Apartment Investment & Management Co.: | | | |
Series G, 9.375% | 136,198 | | 3,508,460 |
Series T, 8.00% | 57,500 | | 1,432,900 |
CapLease, Inc. Series A, 8.125% | 43,400 | | 1,031,184 |
CBL & Associates Properties, Inc.: | | | |
(depositary shares) Series C, 7.75% | 34,500 | | 803,850 |
7.375% | 43,688 | | 977,301 |
Preferred Stocks - continued |
| Shares | | Value |
Nonconvertible Preferred Stocks - continued |
FINANCIALS - continued |
Real Estate Investment Trusts - continued |
Cedar Shopping Centers, Inc. 8.875% | 117,801 | | $ 3,002,747 |
CenterPoint Properties Trust Series D, 5.377% | 3,575 | | 1,644,500 |
Colonial Properties Trust (depositary shares) Series D, 8.125% | 42,200 | | 1,048,670 |
CommonWealth REIT 8.75% | 43,019 | | 1,086,230 |
Corporate Office Properties Trust Series H, 7.50% | 5,000 | | 123,100 |
Cousins Properties, Inc. Series A, 7.75% | 93,230 | | 2,214,213 |
Developers Diversified Realty Corp. (depositary shares)
Series G, 8.00% | 49,000 | | 1,169,630 |
Digital Realty Trust, Inc. Series A, 8.50% | 75,000 | | 1,897,500 |
Duke Realty LP: | | | |
8.375% | 128,517 | | 3,383,853 |
Series L, 6.60% | 10,666 | | 232,412 |
Eagle Hospitality Properties Trust, Inc. 8.25% (a) | 24,000 | | 21,600 |
Glimcher Realty Trust Series G, 8.125% | 73,400 | | 1,702,880 |
HomeBanc Mortgage Corp. Series A, 10.00% (a) | 104,685 | | 1 |
Hospitality Properties Trust: | | | |
Series B, 8.875% | 88,600 | | 2,263,730 |
Series C, 7.00% | 58,500 | | 1,373,580 |
Innkeepers USA Trust Series C, 8.00% (a) | 62,400 | | 33,696 |
iStar Financial, Inc. Series E, 7.875% | 54,000 | | 799,740 |
Kimco Realty Corp. Series G, 7.75% | 77,300 | | 2,021,395 |
LaSalle Hotel Properties: | | | |
Series B, 8.375% | 26,800 | | 675,360 |
Series E, 8.00% | 42,750 | | 1,034,550 |
Series G, 7.25% | 114,485 | | 2,661,776 |
LBA Realty Fund II: | | | |
Series A, 8.75% (a) | 69,000 | | 2,277,000 |
Series B, 7.625% (a) | 31,240 | | 562,320 |
Lexington Corporate Properties Trust Series B, 8.05% | 29,000 | | 680,920 |
Lexington Realty Trust 7.55% | 23,800 | | 527,646 |
LTC Properties, Inc. Series F, 8.00% | 101,900 | | 2,565,842 |
MFA Financial, Inc. Series A, 8.50% | 335,099 | | 8,471,303 |
Mid-America Apartment Communities, Inc. Series H, 8.30% | 15,400 | | 389,620 |
Omega Healthcare Investors, Inc. Series D, 8.375% | 59,600 | | 1,537,680 |
Parkway Properties, Inc. Series D, 8.00% | 25,000 | | 612,250 |
ProLogis Trust Series C, 8.54% | 84,446 | | 4,106,187 |
PS Business Parks, Inc.: | | | |
(depositary shares) Series H, 7.00% | 6,700 | | 164,418 |
(depositary shares) Series L, 7.60% | 49,890 | | 1,238,769 |
Preferred Stocks - continued |
| Shares | | Value |
Nonconvertible Preferred Stocks - continued |
FINANCIALS - continued |
Real Estate Investment Trusts - continued |
PS Business Parks, Inc.: - continued | | | |
7.20% | 35,900 | | $ 872,729 |
Series P, 6.70% | 35,000 | | 811,650 |
Public Storage: | | | |
Series I, 7.25% | 10,828 | | 273,407 |
Series K, 7.25% | 21,418 | | 548,301 |
Series N, 7.00% | 4,200 | | 106,764 |
Regency Centers Corp.: | | | |
7.25% | 10,500 | | 259,875 |
Series C 7.45% | 18,000 | | 447,300 |
Saul Centers, Inc. 8.00% | 93,700 | | 2,384,665 |
Sunstone Hotel Investors, Inc. Series A, 8.00% | 62,200 | | 1,533,230 |
Weingarten Realty Investors (SBI) Series F, 6.50% | 56,230 | | 1,290,479 |
| | 79,957,617 |
TOTAL FINANCIALS | | 84,349,491 |
TOTAL NONCONVERTIBLE PREFERRED STOCKS | | 84,672,541 |
TOTAL PREFERRED STOCKS (Cost $110,568,273) | 98,795,171 |
Corporate Bonds - 29.7% |
| Principal Amount (e) | | |
Convertible Bonds - 10.4% |
CONSUMER DISCRETIONARY - 0.1% |
Hotels, Restaurants & Leisure - 0.1% |
Morgans Hotel Group Co. 2.375% 10/15/14 | | $ 1,340,000 | | 988,250 |
FINANCIALS - 10.3% |
Real Estate Investment Trusts - 6.7% |
Acadia Realty Trust 3.75% 12/15/26 | | 11,505,000 | | 11,325,234 |
Alexandria Real Estate Equities, Inc. 3.7% 1/15/27 (g) | | 6,895,000 | | 6,771,580 |
Annaly Capital Management, Inc. 4% 2/15/15 | | 1,000,000 | | 1,043,125 |
BRE Properties, Inc. 4.125% 8/15/26 | | 6,800,000 | | 6,829,750 |
CapLease, Inc. 7.5% 10/1/27 (g) | | 5,180,000 | | 5,128,200 |
Hospitality Properties Trust 3.8% 3/15/27 | | 5,100,000 | | 5,087,250 |
Corporate Bonds - continued |
| Principal Amount (e) | | Value |
Convertible Bonds - continued |
FINANCIALS - continued |
Real Estate Investment Trusts - continued |
Inland Real Estate Corp. 4.625% 11/15/26 | | $ 10,870,000 | | $ 10,652,600 |
Lexington Corporate Properties Trust 6% 1/15/30 (g) | | 5,000,000 | | 5,181,250 |
ProLogis Trust: | | | | |
1.875% 11/15/37 | | 2,450,000 | | 2,247,875 |
2.625% 5/15/38 | | 1,500,000 | | 1,389,375 |
The Macerich Co. 3.25% 3/15/12 (g) | | 4,800,000 | | 4,698,000 |
United Dominion Realty Trust, Inc. 3.625% 9/15/11 | | 5,500,000 | | 5,500,000 |
Washington (REIT): | | | | |
3.875% 9/15/26 | | 1,600,000 | | 1,592,000 |
3.875% 9/15/26 | | 2,450,000 | | 2,437,750 |
| | 69,883,989 |
Real Estate Management & Development - 3.6% |
BioMed Realty LP 4.5% 10/1/26 (g) | | 2,500,000 | | 2,500,000 |
Brandywine Operating Partnership LP 3.875% 10/15/26 | | 1,000,000 | | 992,500 |
Corporate Office Properties LP: | | | | |
3.5% 9/15/26 (g) | | 3,280,000 | | 3,222,600 |
4.25% 4/15/30 (g) | | 2,000,000 | | 1,993,000 |
Duke Realty LP 3.75% 12/1/11 (g) | | 2,650,000 | | 2,643,375 |
First Potomac Realty Investment LP 4% 12/15/11 (g) | | 2,600,000 | | 2,538,250 |
Grubb & Ellis Co. 7.95% 5/1/15 (g) | | 3,500,000 | | 2,944,375 |
Home Properties, Inc. 4.125% 11/1/26 (g) | | 2,100,000 | | 2,092,125 |
Kilroy Realty LP 3.25% 4/15/12 (g) | | 2,185,000 | | 2,113,988 |
Lexington Master Ltd. Partnership 5.45% 1/15/27 (g) | | 14,950,000 | | 14,800,500 |
MPT Operating Partnership LP 9.25% 4/1/13 (g) | | 1,000,000 | | 1,075,000 |
SL Green Realty Corp. 3% 3/30/27 (g) | | 500,000 | | 485,000 |
| | 37,400,713 |
TOTAL FINANCIALS | | 107,284,702 |
TOTAL CONVERTIBLE BONDS | | 108,272,952 |
Nonconvertible Bonds - 19.3% |
CONSUMER DISCRETIONARY - 3.3% |
Hotels, Restaurants & Leisure - 0.4% |
Times Square Hotel Trust 8.528% 8/1/26 (g) | | 3,968,871 | | 4,038,326 |
Corporate Bonds - continued |
| Principal Amount (e) | | Value |
Nonconvertible Bonds - continued |
CONSUMER DISCRETIONARY - continued |
Household Durables - 2.6% |
KB Home: | | | | |
5.75% 2/1/14 | | $ 510,000 | | $ 479,400 |
5.875% 1/15/15 | | 2,000,000 | | 1,860,000 |
6.25% 6/15/15 | | 7,500,000 | | 6,900,000 |
9.1% 9/15/17 | | 1,000,000 | | 1,013,750 |
Lennar Corp.: | | | | |
5.5% 9/1/14 | | 1,000,000 | | 928,750 |
5.6% 5/31/15 | | 1,000,000 | | 905,000 |
6.95% 6/1/18 (g) | | 3,000,000 | | 2,662,500 |
M/I Homes, Inc. 6.875% 4/1/12 | | 2,150,000 | | 2,090,875 |
Meritage Homes Corp.: | | | | |
6.25% 3/15/15 | | 2,500,000 | | 2,381,250 |
7.15% 4/15/20 | | 1,500,000 | | 1,346,250 |
Ryland Group, Inc. 8.4% 5/15/17 | | 745,000 | | 791,563 |
Standard Pacific Corp.: | | | | |
6.25% 4/1/14 | | 2,700,000 | | 2,544,750 |
8.375% 5/15/18 | | 2,245,000 | | 2,188,875 |
10.75% 9/15/16 | | 1,000,000 | | 1,070,000 |
| | 27,162,963 |
Specialty Retail - 0.3% |
Toys 'R' US Property Co. I LLC 10.75% 7/15/17 | | 2,490,000 | | 2,801,250 |
TOTAL CONSUMER DISCRETIONARY | | 34,002,539 |
CONSUMER STAPLES - 0.3% |
Food & Staples Retailing - 0.3% |
Ahold Lease Series 2001 A1 pass thru trust certificates 7.82% 1/2/20 | | 1,281,883 | | 1,435,709 |
C&S Group Enterprises LLC 8.375% 5/1/17 (g) | | 1,630,000 | | 1,556,650 |
| | 2,992,359 |
FINANCIALS - 15.4% |
Commercial Banks - 0.2% |
CapitalSource, Inc. 12.75% 7/15/14 (g) | | 1,500,000 | | 1,736,250 |
Diversified Financial Services - 0.4% |
Icahn Enterprises LP/Icahn Enterprises Finance Corp. 7.75% 1/15/16 | | 4,000,000 | | 3,990,000 |
Corporate Bonds - continued |
| Principal Amount (e) | | Value |
Nonconvertible Bonds - continued |
FINANCIALS - continued |
Real Estate Investment Trusts - 8.9% |
AvalonBay Communities, Inc.: | | | | |
5.5% 1/15/12 | | $ 527,000 | | $ 551,419 |
6.625% 9/15/11 | | 393,000 | | 411,965 |
Camden Property Trust 5% 6/15/15 | | 1,100,000 | | 1,160,740 |
Commercial Net Lease Realty, Inc.: | | | | |
6.15% 12/15/15 | | 800,000 | | 856,399 |
6.25% 6/15/14 | | 3,005,000 | | 3,261,597 |
Developers Diversified Realty Corp.: | | | | |
4.625% 8/1/10 | | 900,000 | | 900,000 |
5.375% 10/15/12 | | 500,000 | | 499,045 |
5.5% 5/1/15 | | 2,000,000 | | 1,911,018 |
7.5% 4/1/17 | | 2,500,000 | | 2,475,273 |
7.5% 7/15/18 | | 5,271,000 | | 5,125,336 |
9.625% 3/15/16 | | 3,836,000 | | 4,201,648 |
Entertainment Properties Trust 7.75% 7/15/20 (g) | | 2,000,000 | | 1,957,500 |
Equity One, Inc.: | | | | |
5.375% 10/15/15 | | 1,500,000 | | 1,521,897 |
6.25% 12/15/14 | | 3,000,000 | | 3,190,734 |
Federal Realty Investment Trust 5.65% 6/1/16 | | 725,000 | | 783,005 |
Health Care Property Investors, Inc.: | | | | |
5.65% 12/15/13 | | 1,025,000 | | 1,090,835 |
6% 3/1/15 | | 1,000,000 | | 1,068,453 |
6.3% 9/15/16 | | 5,250,000 | | 5,589,602 |
7.072% 6/8/15 | | 1,500,000 | | 1,668,411 |
Health Care REIT, Inc.: | | | | |
6% 11/15/13 | | 1,000,000 | | 1,093,641 |
6.2% 6/1/16 | | 750,000 | | 824,795 |
Healthcare Realty Trust, Inc. 6.5% 1/17/17 | | 1,875,000 | | 1,981,980 |
HMB Capital Trust V 4.1371% 12/15/36 (d)(g)(h) | | 2,530,000 | | 0 |
Hospitality Properties Trust: | | | | |
5.625% 3/15/17 | | 915,000 | | 898,796 |
6.75% 2/15/13 | | 610,000 | | 648,782 |
7.875% 8/15/14 | | 1,000,000 | | 1,108,650 |
HRPT Properties Trust: | | | | |
6.25% 8/15/16 | | 1,500,000 | | 1,565,039 |
6.5% 1/15/13 | | 200,000 | | 211,067 |
iStar Financial, Inc. 5.95% 10/15/13 | | 5,330,000 | | 3,970,850 |
Kimco Realty Corp. 5.783% 3/15/16 | | 450,000 | | 490,279 |
Corporate Bonds - continued |
| Principal Amount (e) | | Value |
Nonconvertible Bonds - continued |
FINANCIALS - continued |
Real Estate Investment Trusts - continued |
Nationwide Health Properties, Inc.: | | | | |
6% 5/20/15 | | $ 3,122,000 | | $ 3,442,108 |
6.25% 2/1/13 | | 1,000,000 | | 1,075,846 |
8.25% 7/1/12 | | 1,300,000 | | 1,421,732 |
Omega Healthcare Investors, Inc.: | | | | |
7% 4/1/14 | | 9,720,000 | | 9,853,650 |
7% 1/15/16 | | 1,295,000 | | 1,314,425 |
7.5% 2/15/20 (g) | | 1,000,000 | | 1,045,000 |
Pan Pacific Retail Properties, Inc. 5.95% 6/1/14 | | 1,750,000 | | 1,910,384 |
Potlatch Corp. 7.5% 11/1/19 | | 1,000,000 | | 1,010,000 |
ProLogis Trust: | | | | |
6.25% 3/15/17 | | 2,000,000 | | 1,935,774 |
6.625% 5/15/18 | | 2,000,000 | | 1,950,180 |
6.875% 3/15/20 | | 1,500,000 | | 1,437,281 |
Reckson Operating Partnership LP 7.75% 3/15/20 (g) | | 2,000,000 | | 2,000,000 |
Senior Housing Properties Trust: | | | | |
6.75% 4/15/20 | | 2,000,000 | | 2,040,000 |
8.625% 1/15/12 | | 5,900,000 | | 6,187,625 |
UDR, Inc. 5.5% 4/1/14 | | 500,000 | | 529,707 |
United Dominion Realty Trust, Inc.: | | | | |
5.13% 1/15/14 | | 500,000 | | 517,405 |
5.25% 1/15/15 | | 1,000,000 | | 1,042,302 |
Weingarten Realty Investors 4.857% 1/15/14 | | 2,500,000 | | 2,576,130 |
| | 92,308,305 |
Real Estate Management & Development - 5.8% |
AMB Property LP: | | | | |
5.9% 8/15/13 | | 400,000 | | 425,077 |
6.125% 12/1/16 | | 1,000,000 | | 1,078,402 |
Brandywine Operating Partnership LP: | | | | |
5.4% 11/1/14 | | 1,750,000 | | 1,802,542 |
5.75% 4/1/12 | | 1,000,000 | | 1,033,235 |
7.5% 5/15/15 | | 1,000,000 | | 1,104,883 |
CB Richard Ellis Services, Inc. 11.625% 6/15/17 | | 1,500,000 | | 1,698,750 |
Colonial Properties Trust: | | | | |
6.15% 4/15/13 | | 1,500,000 | | 1,543,574 |
6.25% 6/15/14 | | 1,594,000 | | 1,628,897 |
6.875% 8/15/12 | | 1,000,000 | | 1,035,000 |
Colonial Realty LP 6.05% 9/1/16 | | 2,500,000 | | 2,424,405 |
Corporate Bonds - continued |
| Principal Amount (e) | | Value |
Nonconvertible Bonds - continued |
FINANCIALS - continued |
Real Estate Management & Development - continued |
Duke Realty LP: | | | | |
6.25% 5/15/13 | | $ 750,000 | | $ 804,506 |
7.375% 2/15/15 | | 1,500,000 | | 1,685,130 |
DuPont Fabros Technology LP 8.5% 12/15/17 | | 845,000 | | 897,813 |
Forest City Enterprises, Inc.: | | | | |
6.5% 2/1/17 | | 3,310,000 | | 2,780,400 |
7.625% 6/1/15 | | 1,435,000 | | 1,305,850 |
Highwoods/Forsyth LP 5.85% 3/15/17 | | 2,800,000 | | 2,816,708 |
Host Hotels & Resorts LP: | | | | |
6.875% 11/1/14 | | 500,000 | | 507,500 |
9% 5/15/17 | | 750,000 | | 810,000 |
Liberty Property LP: | | | | |
5.125% 3/2/15 | | 2,200,000 | | 2,289,516 |
6.375% 8/15/12 | | 2,679,000 | | 2,868,295 |
Post Apartment Homes LP: | | | | |
5.45% 6/1/12 | | 713,000 | | 742,970 |
6.3% 6/1/13 | | 2,000,000 | | 2,157,816 |
Regency Centers LP: | | | | |
5.25% 8/1/15 | | 4,509,000 | | 4,773,687 |
5.875% 6/15/17 | | 400,000 | | 425,412 |
Toys 'R' Us Property Co. II LLC 8.5% 12/1/17 (g) | | 1,000,000 | | 1,050,000 |
Ventas Realty LP: | | | | |
6.5% 6/1/16 | | 2,340,000 | | 2,392,650 |
6.5% 6/1/16 | | 11,370,000 | | 11,625,825 |
6.625% 10/15/14 | | 6,160,000 | | 6,283,200 |
| | 59,992,043 |
Thrifts & Mortgage Finance - 0.1% |
Wrightwood Capital LLC 9% 6/1/14 (d)(g) | | 4,000,000 | | 1,370,000 |
TOTAL FINANCIALS | | 159,396,598 |
Corporate Bonds - continued |
| Principal Amount (e) | | Value |
Nonconvertible Bonds - continued |
HEALTH CARE - 0.3% |
Health Care Providers & Services - 0.3% |
Skilled Healthcare Group, Inc. 11% 1/15/14 | | $ 1,580,000 | | $ 1,406,200 |
Sun Healthcare Group, Inc. 9.125% 4/15/15 | | 2,050,000 | | 2,137,125 |
| | 3,543,325 |
TOTAL NONCONVERTIBLE BONDS | | 199,934,821 |
TOTAL CORPORATE BONDS (Cost $288,182,095) | 308,207,773 |
Asset-Backed Securities - 5.2% |
|
Anthracite CDO I Ltd. Series 2002-CIBA Class B, 6.633% 5/24/37 (g) | | 1,384,000 | | 1,218,353 |
Anthracite CDO II Ltd. Series 2002-2A Class F, 7.6% 12/24/37 (g) | | 2,260,000 | | 971,800 |
Anthracite CDO III Ltd./Anthracite CDO III Corp. Series 2004-1A Class A, 0.6906% 3/23/19 (g)(h) | | 395,791 | | 296,843 |
Brascan Real Estate CDO Ltd./Brascan Real Estate CDO Corp. Series 2004-1A Class A, 0.8713% 1/20/40 (g)(h) | | 2,309,895 | | 2,211,724 |
Capital Trust RE CDO Ltd. Series 2005-1A Class D, 1.8381% 3/20/50 (g)(h) | | 2,250,000 | | 225,000 |
Capital Trust RE CDO Ltd./Capital Trust RE CDO Corp. Series 2005-3A Class A2, 5.16% 6/25/35 (g) | | 5,375,000 | | 5,213,750 |
CapitalSource Real Estate Loan Trust Series 2006-1A Class A2A, 0.7713% 1/20/37 (g)(h) | | 1,186,654 | | 771,325 |
CapLease CDO Ltd. Series 2005-1A Class A, 4.926% 1/29/40 (g) | | 2,430,816 | | 1,823,112 |
Conseco Finance Securitizations Corp. Series 2002-2 Class M2, 9.163% 3/1/33 | | 500,000 | | 237,030 |
Crest Clarendon Street Ltd./Crest Clarendon Corp. Series 2002-1A: | | | | |
Class B1, 6.065% 12/28/35 (g) | | 1,570,000 | | 1,130,400 |
Class B2, 1.8872% 12/28/35 (g)(h) | | 1,575,000 | | 937,125 |
Class D, 9% 12/28/35 (g) | | 500,000 | | 158,650 |
Crest Dartmouth Street Ltd./Crest Dartmouth Street Corp. Series 2003-1A Class D, 9% 6/28/38 (g) | | 997,000 | | 279,160 |
Crest Ltd. Series 2002-IGA: | | | | |
Class A, 0.9375% 7/28/17 (g)(h) | | 1,145,821 | | 1,077,072 |
Class B, 1.8375% 7/28/35 (g)(h) | | 1,500,000 | | 1,329,450 |
Asset-Backed Securities - continued |
| Principal Amount (e) | | Value |
Deutsche Financial Capital Securitization LLC Series 1997-I Class M, 7.275% 9/15/27 | | $ 6,500,000 | | $ 5,652,853 |
Fairfield Street Solar Corp. Series 2004-1A Class E1, 3.9028% 11/28/39 (g)(h) | | 550,000 | | 38,500 |
Green Tree Financial Corp.: | | | | |
Series 1996-4 Class M1, 7.75% 6/15/27 | | 1,788,179 | | 1,660,953 |
Series 1997-3 Class M1, 7.53% 3/15/28 | | 8,167,187 | | 5,706,925 |
GSR Mortgage Loan Trust Series 2005-HE3 Class B3, 2.8288% 6/25/35 (h)(j) | | 1,259,000 | | 72,722 |
Guggenheim Structured Real Estate Funding Ltd./Guggenheim Structured Real Estate Funding LLC Series 2005-2A: | | | | |
Class D, 1.8788% 8/26/30 (g)(h) | | 749,836 | | 74,984 |
Class E, 2.3288% 8/26/30 (g)(h) | | 1,455,839 | | 72,792 |
Leafs CMBS I Ltd./Leafs CMBS I Corp. Series 2002-1A Class A2, 0.8881% 11/20/17 (g)(h) | | 1,926,008 | | 1,829,708 |
Lehman ABS Manufactured Housing Contract Trust Series 2001-B Class M2, 7.17% 3/15/28 | | 1,447,670 | | 500,753 |
Merit Securities Corp. Series 13 Class M1, 7.9882% 12/28/33 | | 1,923,000 | | 1,744,067 |
N-Star Real Estate CDO Ltd. Series 1A Class C1B, 7.696% 8/28/38 (g) | | 883,000 | | 535,098 |
Prima Capital CDO Ltd./Prima Capital CDO Corp. Series 2005-1A Class A2, 4.646% 7/24/39 (g) | | 2,460,088 | | 2,312,483 |
Taberna Preferred Funding III Ltd. Series 2005-3A Class D, 2.9966% 2/5/36 (g)(h) | | 3,370,124 | | 337 |
TIAA Real Estate CDO Ltd./TIAA Real Estate CDO Corp. Series 2002-1A Class IIFX, 6.77% 5/22/37 (g) | | 3,165,000 | | 3,006,750 |
Wachovia Ltd./Wachovia LLC: | | | | |
Series 2006-1 Class 1ML, 5.7835% 9/25/26 (g)(h) | | 2,000,000 | | 540,000 |
Series 2006-1A: | | | | |
Class A1A, 0.7983% 9/25/26 (g)(h) | | 2,439,000 | | 1,975,590 |
Class A1B, 0.8683% 9/25/26 (g)(h) | | 4,285,000 | | 3,235,175 |
Class A2A, 0.7583% 9/25/26 (g)(h) | | 9,140,000 | | 7,540,500 |
Wrightwood Capital Real Estate CDO Ltd. Series 2005-1A Class F, 2.4275% 11/21/40 (g)(h) | | 250,000 | | 15,000 |
TOTAL ASSET-BACKED SECURITIES (Cost $63,473,583) | 54,395,984 |
Collateralized Mortgage Obligations - 2.8% |
| Principal Amount (e) | | Value |
Private Sponsor - 2.8% |
Banc of America Large Loan, Inc. Series 2005-MIB1 Class A2, 0.5509% 3/15/22 (g)(h) | | $ 8,050,108 | | $ 7,783,777 |
COMM pass-thru certificates Series 2007-FL14 Class AJ, 0.5209% 6/15/22 (g)(h) | | 3,250,000 | | 2,772,973 |
Countrywide Home Loans, Inc.: | | | | |
Series 2002-38 Class B3, 5% 2/25/18 (g) | | 122,616 | | 15,339 |
Series 2002-R2 Class 2B3, 4.7244% 7/25/33 (g)(h) | | 236,928 | | 83,988 |
Series 2003-40 Class B3, 4.5% 10/25/18 (g) | | 165,728 | | 18,280 |
Series 2003-R2 Class B3, 5.5% 5/25/43 (g) | | 359,616 | | 18,896 |
Series 2003-R3: | | | | |
Class B2, 5.5% 11/25/33 (g) | | 1,593,299 | | 469,657 |
Class B3, 5.5% 11/25/33 (g) | | 477,085 | | 43,133 |
Series 2004-R1 Class 1B3, 5.5% 11/25/34 (g)(h) | | 343,868 | | 17,633 |
Freddie Mac Series 2010 K7 Class B, 5.4341% 4/25/20 (g)(h) | | 1,500,000 | | 1,325,700 |
FREMF Mortgage Trust Series 2010-K6 Class B, 5.3574% 12/26/46 (g)(h) | | 4,500,000 | | 3,925,502 |
Merrill Lynch Floating Trust floater Series 2006-1 Class TM, 0.841% 6/15/22 (g)(h) | | 5,198,066 | | 4,496,327 |
Merrill Lynch Mortgage Investors Trust Series 1998-C3 Class F, 6% 12/15/30 (g) | | 4,240,000 | | 4,126,368 |
Merrill Lynch Mortgage Trust Series 2002-MW1 Class E, 6.219% 7/12/34 (g) | | 1,600,000 | | 1,627,974 |
RESI Finance LP/RESI Finance DE Corp. floater: | | | | |
Series 2003-B Class B9, 12.2925% 7/10/35 (g)(h) | | 577,830 | | 327,803 |
Series 2004-C Class B5, 1.6925% 9/10/36 (g)(h) | | 323,453 | | 150,600 |
Series 2005-A Class B6, 2.3425% 3/10/37 (g)(h) | | 1,775,940 | | 311,500 |
Series 2005-B Class B6, 1.9425% 6/10/37 (g)(h) | | 897,707 | | 62,750 |
Series 2005-D Class B6, 2.5909% 12/15/37 (g)(h) | | 452,911 | | 18,162 |
Series 2006-B Class B6, 2.0409% 7/15/38 (g)(h) | | 921,308 | | 14,188 |
Residential Funding Mortgage Securities I, Inc. Series 2002-S20 Class M3, 5.25% 12/25/17 | | 46,470 | | 30,125 |
Residential Funding Securities Corp. Series 2002-RM1 Class BI1, 5.5% 12/25/17 (g) | | 95,444 | | 32,093 |
RESIX Finance Ltd. floater: | | | | |
Series 2003-D Class B8, 6.8425% 12/10/35 (g)(h) | | 508,287 | | 180,137 |
Series 2004-A Class B7, 4.5925% 2/10/36 (g)(h) | | 520,533 | | 216,073 |
Series 2004-B Class B7, 4.3425% 2/10/36 (g)(h) | | 630,046 | | 174,208 |
Series 2005-C Class B7, 3.4425% 9/10/37 (g)(h) | | 1,847,925 | | 145,801 |
Collateralized Mortgage Obligations - continued |
| Principal Amount (e) | | Value |
Private Sponsor - continued |
RESIX Finance Ltd. floater: - continued | | | | |
Series 2006-B Class B7, 4.1909% 7/15/38 (g)(h) | | $ 841,219 | | $ 11,020 |
Series 2007-A Class BB, 3.6909% 2/15/39 (g)(h) | | 575,971 | | 1,901 |
TOTAL PRIVATE SPONSOR | | 28,401,908 |
U.S. Government Agency - 0.0% |
Fannie Mae REMIC Trust: | | | | |
Series 2001-W3 subordinate REMIC pass thru certificates, Class B3, 7% 9/25/41 (j) | | 202,034 | | 109,976 |
Series 2002-W1 subordinate REMIC pass thru certificates, Class 3B3, 4.4529% 2/25/42 (g)(h) | | 126,091 | | 54,561 |
Series 2003-W1 subordinate REMIC pass thru certificates, Class B3, 5.75% 12/25/42 (j) | | 276,868 | | 91,121 |
Series 2003-W10 subordinate REMIC pass thru certificates, Class 2B3, 4.5583% 6/25/43 (g)(h) | | 170,779 | | 61,218 |
Series 2003-W4 subordinate REMIC pass thru certificates, Class 2B3, 4.6215% 10/25/42 (g)(h) | | 74,156 | | 26,092 |
TOTAL U.S. GOVERNMENT AGENCY | | 342,968 |
TOTAL COLLATERALIZED MORTGAGE OBLIGATIONS (Cost $37,253,558) | 28,744,876 |
Commercial Mortgage Securities - 17.8% |
|
Asset Securitization Corp. Series 1997-D4: | | | | |
Class B1, 7.525% 4/14/29 | | 1,565,000 | | 1,641,920 |
Class B2, 7.525% 4/14/29 | | 560,000 | | 579,712 |
Banc of America Commercial Mortgage, Inc.: | | | | |
sequential payer Series 2002-2 Class F, 5.487% 7/11/43 | | 4,185,000 | | 4,012,407 |
Series 2005-1 Class CJ, 5.3362% 11/10/42 (h) | | 3,580,000 | | 3,325,119 |
Series 2005-6 Class AJ, 5.35% 9/10/47 (h) | | 5,000,000 | | 4,589,640 |
Banc of America Large Loan, Inc. floater Series 2005-MIB1 Class K, 2.3409% 3/15/22 (g)(h) | | 820,000 | | 352,600 |
Bear Stearns Commercial Mortgage Securities, Inc. Series 2006-PW11 Class AJ, 5.6236% 3/11/39 (h) | | 5,700,000 | | 4,924,612 |
Bear Stearns Commercial Mortgage Securities Trust: | | | | |
floater Series 2006-BBA7: | | | | |
Class D, 0.6009% 3/15/19 (g)(h) | | 2,480,000 | | 2,072,139 |
Class E, 0.6609% 3/15/19 (g)(h) | | 1,995,000 | | 1,611,038 |
Class F, 0.6809% 3/15/19 (g)(h) | | 1,650,000 | | 1,274,110 |
Commercial Mortgage Securities - continued |
| Principal Amount (e) | | Value |
Bear Stearns Commercial Mortgage Securities Trust: - continued | | | | |
floater Series 2006-BBA7: | | | | |
Class G, 0.7809% 3/15/19 (g)(h) | | $ 2,760,000 | | $ 1,968,965 |
Series 2006-T22 Class B, 5.6284% 4/12/38 (g)(h) | | 2,520,000 | | 2,093,906 |
Citigroup Commercial Mortgage Trust floater Series 2007-FL3A Classs MLA2, 1.3909% 4/15/22 (g)(h) | | 800,000 | | 652,005 |
COMM pass-thru certificates Series 2001-J1A Class F, 6.958% 2/16/34 (g) | | 2,600,000 | | 2,627,255 |
Credit Suisse First Boston Mortgage Securities Corp. Series 2004-TF2A Class AX, 0.0136% 11/15/19 (g)(h)(i) | | 4,560,701 | | 228 |
Credit Suisse/Morgan Stanley Commercial Mortgage Trust: | | | | |
floater Series 2006-HC1A: | | | | |
Class A2, 0.6009% 5/15/23 (g)(h) | | 5,800,000 | | 5,474,633 |
Class D, 0.8109% 5/15/23 (g)(h) | | 1,250,000 | | 1,144,969 |
Class F, 0.9409% 5/15/23 (g)(h) | | 1,825,000 | | 1,640,680 |
Series 2006-HC1A Class A1, 0.5309% 5/15/23 (g)(h) | | 2,445,102 | | 2,330,284 |
Crest Ltd. Series 2001-1A Class C, 9% 2/25/34 (g) | | 1,000,000 | | 440,000 |
Deutsche Mortgage & Asset Receiving Corp. Series 1998-C1 Class J, 6.22% 6/15/31 | | 1,200,000 | | 980,774 |
DLJ Commercial Mortgage Corp.: | | | | |
Series 1998-CG1 Class B4, 7.4574% 6/10/31 (g)(h) | | 2,500,000 | | 2,735,966 |
Series 2000-CKP1 Class B3, 8.5482% 11/10/33 (h) | | 2,970,000 | | 2,966,191 |
First Union National Bank Commercial Mortgage Trust Series 2001-C4: | | | | |
Class H, 7.036% 12/12/33 (g) | | 2,000,000 | | 2,020,947 |
Class K, 6% 12/12/33 (g) | | 2,000,000 | | 1,948,235 |
G-Force LLC sequential payer Series 2005-RRA Class A2, 4.83% 8/22/36 (g) | | 7,545,000 | | 7,054,575 |
GE Capital Commercial Mortgage Corp.: | | | | |
Series 2001-3 Class C, 6.51% 6/10/38 | | 820,000 | | 835,259 |
Series 2002-1A Class H, 7.4003% 12/10/35 (g)(h) | | 991,000 | | 957,525 |
Global Towers Partners Acquisition Partners I LLC Series 2007-1A Class G, 7.8737% 5/15/37 (g) | | 1,000,000 | | 1,040,000 |
GMAC Commercial Mortgage Securities, Inc.: | | | | |
Series 1997-C2: | | | | |
Class F, 6.75% 4/15/29 (h) | | 2,702,284 | | 2,825,545 |
Class G, 6.75% 4/15/29 (h) | | 1,250,000 | | 1,238,451 |
Series 1999-C3: | | | | |
Class G, 6.974% 8/15/36 (g) | | 1,551,289 | | 1,557,774 |
Class J, 6.974% 8/15/36 (g) | | 1,500,000 | | 1,526,450 |
Commercial Mortgage Securities - continued |
| Principal Amount (e) | | Value |
GMAC Commercial Mortgage Securities, Inc.: - continued | | | | |
Series 2000-C1: | | | | |
Class H, 7% 3/15/33 (g) | | $ 568,791 | | $ 562,048 |
Class K, 7% 3/15/33 | | 1,100,000 | | 861,158 |
Series 2002-C3 Class D, 5.27% 7/10/39 | | 3,000,000 | | 3,037,131 |
Greenwich Capital Commercial Funding Corp.: | | | | |
sequential payer Series 2003-C1 Class D, 4.29% 7/5/35 (g) | | 2,000,000 | | 1,984,305 |
Series 2002-C1 Class H, 5.903% 1/11/35 (g) | | 880,000 | | 836,054 |
GS Mortgage Securities Corp. II floater Series 2007-EOP Class L, 1.6475% 3/1/20 (g)(h) | | 1,400,000 | | 1,148,000 |
JPMorgan Chase Commercial Mortgage Securities Corp.: | | | | |
Series 2001-A: | | | | |
Class G, 6% 10/15/32 (g)(h) | | 2,895,000 | | 14,475 |
Class X, 1.0879% 10/15/32 (g)(h)(i) | | 7,823,066 | | 217 |
Series 2009-IWST Class D, 7.6935% 12/5/27 (g)(h) | | 3,250,000 | | 3,281,771 |
JPMorgan Chase Commercial Mortgage Securities Trust floater Series 2005-FL1A Class A2, 0.5209% 2/15/19 (g)(h) | | 2,505,338 | | 2,356,715 |
JPMorgan Commercial Mortgage Finance Corp.: | | | | |
Series 1997-C5 Class F, 7.5605% 9/15/29 | | 2,719,847 | | 2,872,371 |
Series 1999-C8: | | | | |
Class G, 6% 7/15/31 (g) | | 1,385,000 | | 1,246,338 |
Class H, 6% 7/15/31 (g) | | 2,638,000 | | 131,900 |
LB Commercial Conduit Mortgage Trust Series 1998-C4 Class G, 5.6% 10/15/35 (g) | | 2,820,000 | | 2,876,682 |
LB-UBS Commercial Mortgage Trust: | | | | |
sequential payer: | | | | |
Series 2004-C2 Class E, 4.487% 3/15/36 | | 2,060,000 | | 1,928,886 |
Series 2005-C7 Class AJ, 5.323% 11/15/40 | | 6,000,000 | | 5,354,522 |
Series 2006-C7 Class AM, 5.378% 11/15/38 | | 2,040,000 | | 1,755,114 |
Series 2005-C2 Class AJ, 5.205% 4/15/30 (h) | | 8,910,000 | | 7,984,874 |
Series 2006-C4: | | | | |
Class AJ, 5.9022% 6/15/38 (h) | | 6,005,000 | | 5,038,615 |
Class AM, 5.9022% 6/15/38 (h) | | 6,700,000 | | 6,041,858 |
Leafs CMBS I Ltd./Leafs CMBS I Corp. Series 2002-1A Class B, 4.13% 11/20/37 (g) | | 1,850,000 | | 1,757,500 |
Merrill Lynch Financial Asset, Inc. Series 2005-CA16: | | | | |
Class F, 4.384% 7/12/37 | CAD | 710,000 | | 326,364 |
Class G, 4.384% 7/12/37 | CAD | 355,000 | | 157,241 |
Class H, 4.384% 7/12/37 | CAD | 236,000 | | 100,756 |
Class J, 4.384% 7/12/37 | CAD | 355,000 | | 146,146 |
Commercial Mortgage Securities - continued |
| Principal Amount (e) | | Value |
Merrill Lynch Financial Asset, Inc. Series 2005-CA16: - continued | | | | |
Class K, 4.384% 7/12/37 | CAD | 355,000 | | $ 140,967 |
Class L, 4.384% 7/12/37 | CAD | 236,000 | | 90,419 |
Class M, 4.384% 7/12/37 | CAD | 995,000 | | 281,590 |
Merrill Lynch Mortgage Investors Trust: | | | | |
Series 1999-C1 Class G, 6.71% 11/15/31 (g) | | 2,833,490 | | 283 |
Series 2001-HRPA: | | | | |
Class G, 6.778% 2/3/16 (g) | | 840,000 | | 831,600 |
Class H, 6.778% 2/3/16 (g) | | 2,130,000 | | 2,108,700 |
Merrill Lynch Mortgage Trust Series 2006-C1 Class AM, 5.8383% 5/12/39 (h) | | 1,200,000 | | 1,099,538 |
Mezz Capital Commercial Mortgage Trust Series 2004-C1: | | | | |
Class D, 6.988% 1/15/37 | | 750,000 | | 0 |
Class E, 7.983% 1/15/37 | | 1,453,000 | | 0 |
Class IO, 8.4873% 1/15/37 (h)(i) | | 5,527,084 | | 525,073 |
Morgan Stanley Capital I Trust: | | | | |
sequential payer: | | | | |
Series 2004-RR2 Class A2, 5.45% 10/28/33 (g) | | 2,260,570 | | 2,266,221 |
Series 2006-HQ10 Class AM, 5.36% 11/12/41 | | 8,200,000 | | 7,366,776 |
Series 1997-RR Class F, 7.4307% 4/30/39 (g)(h) | | 3,249,026 | | 2,989,104 |
Series 1998-CF1 Class G, 7.35% 7/15/32 (g) | | 2,830,092 | | 1,415,046 |
Series 2005-HQ7 Class E, 5.3761% 11/14/42 (h) | | 850,000 | | 433,500 |
Series 2006-IQ12 Class AMFX, 5.37% 12/15/43 | | 7,500,000 | | 6,337,500 |
Morgan Stanley Dean Witter Capital I Trust Series 2001-IQA Class F, 6.79% 12/18/32 (g) | | 1,486,185 | | 1,509,189 |
Multi Security Asset Trust sequential payer Series 2005-RR4A Class A2, 4.83% 11/28/35 (g) | | 3,152,092 | | 2,935,386 |
Providence Place Group Ltd. Partnership Series 2000-C1 Class A2, 7.75% 7/20/28 (g) | | 3,128,112 | | 3,128,112 |
RBSCF Trust Series 2010-MB1 Class D, 4.8194% 4/15/24 (g)(h) | | 5,820,000 | | 5,298,928 |
Structured Asset Securities Corp.: | | | | |
Series 1996-CFL Class I, 7.75% 2/25/28 (g) | | 3,827,943 | | 3,923,641 |
Series 1997-LLI Class F, 7.3% 10/12/34 (g) | | 2,170,000 | | 2,200,209 |
TIAA Seasoned Commercial Mortgage Trust sequential payer Series 2007-C4 Class AJ, 6.0712% 8/15/39 (h) | | 2,080,000 | | 2,009,231 |
TimberStar Trust I Series 2006-1 Class F, 7.5296% 10/15/36 (g) | | 6,460,000 | | 6,395,400 |
UBS Commercial Mortgage Trust Series 2007-FL1 Class F, 0.9159% 7/15/24 (g)(h) | | 1,200,000 | | 289,236 |
Commercial Mortgage Securities - continued |
| Principal Amount (e) | | Value |
Wachovia Bank Commercial Mortgage Trust: | | | | |
floater Series 2007-WHL8 Class MH1, 1.1409% 6/15/20 (g)(h) | | $ 1,800,000 | | $ 1,490,968 |
Series 2004-C10 Class E, 4.931% 2/15/41 | | 2,000,000 | | 1,843,444 |
Series 2004-C12 Class D, 5.4836% 7/15/41 (h) | | 2,750,000 | | 2,444,518 |
Series 2004-C14 Class B, 5.17% 8/15/41 | | 3,180,000 | | 3,080,420 |
TOTAL COMMERCIAL MORTGAGE SECURITIES (Cost $188,261,532) | 184,679,954 |
Floating Rate Loans - 1.5% |
|
CONSUMER DISCRETIONARY - 0.0% |
Specialty Retail - 0.0% |
The Pep Boys - Manny, Moe & Jack term loan 2.54% 10/27/13 (h) | | 28,155 | | 26,888 |
FINANCIALS - 1.2% |
Diversified Financial Services - 0.1% |
TowerCo Finance LLC term loan 6% 11/24/14 (h) | | 568,147 | | 569,568 |
Real Estate Investment Trusts - 0.2% |
Medical Properties Trust, Inc. Tranche B, term loan 5% 5/17/16 (h) | | 2,000,000 | | 1,970,000 |
Real Estate Management & Development - 0.9% |
CB Richard Ellis Services, Inc. Tranche B1-A, term loan 6.5% 12/20/15 (h) | | 2,298,941 | | 2,284,573 |
Realogy Corp.: | | | | |
Credit-Linked Deposit 3.35% 10/10/13 (h) | | 1,186,117 | | 1,034,887 |
Tranche 2LN, term loan 13.5% 10/15/17 | | 2,500,000 | | 2,625,000 |
Tranche B, term loan 3.3472% 10/10/13 (h) | | 4,405,577 | | 3,843,866 |
| | 9,788,326 |
TOTAL FINANCIALS | | 12,327,894 |
HEALTH CARE - 0.3% |
Health Care Providers & Services - 0.3% |
Skilled Healthcare Group, Inc. term loan: | | | | |
5.25% 4/9/16 (h) | | 1,628,362 | | 1,514,377 |
Floating Rate Loans - continued |
| Principal Amount (e) | | Value |
HEALTH CARE - continued |
Health Care Providers & Services - continued |
Skilled Healthcare Group, Inc. term loan: - continued | | | | |
5.25% 4/9/16 (h) | | $ 148,438 | | $ 138,047 |
Universal Health Services, Inc. term loan 7/28/16 (h) | | 2,000,000 | | 1,982,400 |
| | 3,634,824 |
TOTAL FLOATING RATE LOANS (Cost $16,036,884) | 15,989,606 |
Preferred Securities - 0.0% |
| | | |
FINANCIALS - 0.0% |
Diversified Financial Services - 0.0% |
Cairn High Grade ABS CDO PLC Series 2006-2A Class SUB, 1/13/47 (g) | 1,000,000 | | 0 |
Crest Clarendon Street 2002-1 Ltd. Series 2002-1A Class PS, 12/28/35 (g) | 500,000 | | 85,000 |
Crest Dartmouth Street 2003 1 Ltd. Series 2003-1A Class PS, 6/28/38 (g) | 1,220,000 | | 280,600 |
Harp High Grade CDO I Ltd. Series 2006-1, 7/8/46 (g) | 810,000 | | 8 |
Ipswich Street CDO Series 2006-1, 6/27/46 (d)(g) | 1,350,000 | | 0 |
Kent Funding III Ltd. 11/5/47 (g) | 1,650,000 | | 0 |
| | 365,608 |
TOTAL PREFERRED SECURITIES (Cost $5,781,511) | 365,608 |
Money Market Funds - 10.1% |
| Shares | | |
Fidelity Cash Central Fund, 0.24% (b) | 101,267,689 | | 101,267,689 |
Fidelity Securities Lending Cash Central Fund, 0.27% (b)(c) | 3,560,975 | | 3,560,975 |
TOTAL MONEY MARKET FUNDS (Cost $104,828,664) | 104,828,664 |
Cash Equivalents - 0.3% |
| Maturity Amount | | Value |
Investments in repurchase agreements in a joint trading account at 0.21%, dated 7/30/10 due 8/2/10 (Collateralized by U.S. Government Obligations) #
(Cost $2,682,000) | $ 2,682,047 | | $ 2,682,000 |
TOTAL INVESTMENT PORTFOLIO - 100.3% (Cost $1,027,625,028) | | 1,042,028,216 |
NET OTHER ASSETS (LIABILITIES) - (0.3)% | | (3,177,633) |
NET ASSETS - 100% | $ 1,038,850,583 |
Currency Abbreviations |
CAD | - | Canadian dollar |
Legend |
(a) Non-income producing |
(b) Affiliated fund that is available only to investment companies and other accounts managed by Fidelity Investments. The rate quoted is the annualized seven-day yield of the fund at period end. A complete unaudited listing of the fund's holdings as of its most recent quarter end is available upon request. |
(c) Investment made with cash collateral received from securities on loan. |
(d) Non-income producing - Issuer is in default. |
(e) Principal amount is stated in United States dollars unless otherwise noted. |
(f) Security or a portion of the security is on loan at period end. |
(g) Security exempt from registration under Rule 144A of the Securities Act of 1933. These securities may be resold in transactions exempt from registration, normally to qualified institutional buyers. At the end of the period, the value of these securities amounted to $242,980,827 or 23.4% of net assets. |
(h) The coupon rate shown on floating or adjustable rate securities represents the rate at period end. |
(i) Security represents right to receive monthly interest payments on an underlying pool of mortgages or assets. Principal shown is the outstanding par amount of the pool held as of the end of the period. |
(j) Restricted securities - Investment in securities not registered under the Securities Act of 1933 (excluding 144A issues). At the end of the period, the value of restricted securities (excluding 144A issues) amounted to $273,819 or 0.0% of net assets. |
Additional information on each holding is as follows: |
Security | Acquisition Date | Acquisition Cost |
Fannie Mae REMIC Trust: Series 2001-W3 subordinate REMIC pass thru certificates, Class B3, 7% 9/25/41 | 5/21/03 | $ 175,074 |
Series 2003-W1 subordinate REMIC pass thru certificates, Class B3, 5.75% 12/25/42 | 3/25/03 | $ 208,646 |
GSR Mortgage Loan Trust Series 2005-HE3 Class B3, 2.8288% 6/25/35 | 6/3/05 | $ 1,110,697 |
# Additional information on each counterparty to the repurchase agreement is as follows: |
Repurchase Agreement / Counterparty | Value |
$2,682,000 due 8/02/10 at 0.21% |
BNP Paribas Securities Corp. | $ 1,071,608 |
Banc of America Securities LLC | 405,435 |
Barclays Capital, Inc. | 1,204,957 |
| $ 2,682,000 |
Affiliated Central Funds |
Information regarding fiscal year to date income earned by the Fund from investments in Fidelity Central Funds is as follows: |
Fund | Income earned |
Fidelity Cash Central Fund | $ 122,644 |
Fidelity Securities Lending Cash Central Fund | 6,300 |
Total | $ 128,944 |
Other Information |
The following is a summary of the inputs used, as of July 31, 2010, involving the Fund's assets and liabilities carried at fair value. The inputs or methodology used for valuing securities may not be an indication of the risk associated with investing in those securities. For more information on valuation inputs, and their aggregation into the levels used in the tables below, please refer to the Security Valuation section in the accompanying Notes to Financial Statements. |
Valuation Inputs at Reporting Date: |
Description | Total | Level 1 | Level 2 | Level 3 |
Investments in Securities: | | | | |
Equities: | | | | |
Consumer Discretionary | $ 7,609,195 | $ 3,913,195 | $ - | $ 3,696,000 |
Financials | 321,306,447 | 300,180,030 | 17,204,173 | 3,922,244 |
Health Care | 12,220,579 | 12,220,579 | - | - |
Materials | 997,530 | 997,530 | - | - |
Corporate Bonds | 308,207,773 | - | 306,837,773 | 1,370,000 |
Asset-Backed Securities | 54,395,984 | - | 37,509,028 | 16,886,956 |
Collateralized Mortgage Obligations | 28,744,876 | - | 27,750,321 | 994,555 |
Commercial Mortgage Securities | 184,679,954 | - | 172,427,208 | 12,252,746 |
Floating Rate Loans | 15,989,606 | - | 15,989,606 | - |
Preferred Securities | 365,608 | - | - | 365,608 |
Money Market Funds | 104,828,664 | 104,828,664 | - | - |
Cash Equivalents | 2,682,000 | - | 2,682,000 | - |
Total Investments in Securities: | $ 1,042,028,216 | $ 422,139,998 | $ 580,400,109 | $ 39,488,109 |
The following is a reconciliation of Investments in Securities for which Level 3 inputs were used in determining value: |
Investments in Securities: | |
Equities - Consumer Discretionary | |
Beginning Balance | $ - |
Total Realized Gain (Loss) | - |
Total Unrealized Gain (Loss) | 2,304,225 |
Cost of Purchases | 1,391,775 |
Proceeds of Sales | - |
Amortization/Accretion | - |
Transfers in to Level 3 | - |
Transfers out of Level 3 | - |
Ending Balance | $ 3,696,000 |
The change in unrealized gain (loss) for the period attributable to Level 3 securities held at July 31, 2010 | $ 2,304,225 |
Equities - Financials | |
Beginning Balance | $ 3,099,870 |
Total Realized Gain (Loss) | (2,073,397) |
Total Unrealized Gain (Loss) | 3,167,065 |
Cost of Purchases | 607 |
Proceeds of Sales | (271,913) |
Amortization/Accretion | - |
Transfers in to Level 3 | 12 |
Transfers out of Level 3 | - |
Ending Balance | $ 3,922,244 |
The change in unrealized gain (loss) for the period attributable to Level 3 securities held at July 31, 2010 | $ 932,126 |
Corporate Bonds | |
Beginning Balance | $ 2,343,856 |
Total Realized Gain (Loss) | - |
Total Unrealized Gain (Loss) | (230,253) |
Cost of Purchases | - |
Proceeds of Sales | - |
Amortization/Accretion | - |
Transfers in to Level 3 | - |
Transfers out of Level 3 | (743,603) |
Ending Balance | $ 1,370,000 |
The change in unrealized gain (loss) for the period attributable to Level 3 securities held at July 31, 2010 | $ (230,253) |
Asset-Backed Securities | |
Beginning Balance | $ 11,832,848 |
Total Realized Gain (Loss) | 164,843 |
Total Unrealized Gain (Loss) | 2,972,785 |
Cost of Purchases | 7,476,085 |
Proceeds of Sales | (1,606,631) |
Amortization/Accretion | (329,128) |
Transfers in to Level 3 | 1,375,000 |
Transfers out of Level 3 | (4,998,846) |
Ending Balance | $ 16,886,956 |
The change in unrealized gain (loss) for the period attributable to Level 3 securities held at July 31, 2010 | $ 2,907,249 |
Collateralized Mortgage Obligations | |
Beginning Balance | $ 2,036,201 |
Total Realized Gain (Loss) | 296,490 |
Total Unrealized Gain (Loss) | 3,450,561 |
Cost of Purchases | - |
Proceeds of Sales | (3,529,343) |
Amortization/Accretion | (534,455) |
Transfers in to Level 3 | 26,799 |
Transfers out of Level 3 | (751,698) |
Ending Balance | $ 994,555 |
The change in unrealized gain (loss) for the period attributable to Level 3 securities held at July 31, 2010 | $ 547,954 |
Commercial Mortgage Securities | |
Beginning Balance | $ 6,157,272 |
Total Realized Gain (Loss) | - |
Total Unrealized Gain (Loss) | 1,065,436 |
Cost of Purchases | 8,051,715 |
Proceeds of Sales | (85,393) |
Amortization/Accretion | (168,765) |
Transfers in to Level 3 | 527,055 |
Transfers out of Level 3 | (3,294,574) |
Ending Balance | $ 12,252,746 |
The change in unrealized gain (loss) for the period attributable to Level 3 securities held at July 31, 2010 | $ 706,900 |
Preferred Securities | |
Beginning Balance | $ 159,115 |
Total Realized Gain (Loss) | - |
Total Unrealized Gain (Loss) | 83,968 |
Cost of Purchases | 113,400 |
Proceeds of Sales | - |
Amortization/Accretion | 9,125 |
Transfers in to Level 3 | - |
Transfers out of Level 3 | - |
Ending Balance | $ 365,608 |
The change in unrealized gain (loss) for the period attributable to Level 3 securities held at July 31, 2010 | $ 83,968 |
The information used in the above reconciliation represents fiscal year to date activity for any Investments in Securities identified as using Level 3 inputs at either the beginning or the end of the current fiscal period. Transfers in or out of Level 3 represent the beginning value of any Security or Instrument where a change in the pricing level occurred from the beginning to the end of the period. The cost of purchases and the proceeds of sales may include securities received or delivered through corporate actions or exchanges. Realized and unrealized gains (losses) disclosed in the reconciliation are included in Net Gain (Loss) on the Fund's Statement of Operations. |
The composition of credit quality ratings as a percentage of net assets is as follows (ratings are unaudited): |
U.S. Government and U.S. Government Agency Obligations | 0.0%* |
AAA,AA,A | 15.7% |
BBB | 16.6% |
BB | 5.2% |
B | 5.3% |
CCC,CC,C | 2.8% |
D | 0.0%* |
Not Rated | 11.4% |
Equities | 32.9% |
Short-Term Investments and Net Other Assets | 10.1% |
| 100.0% |
* Amount represents less than 0.1% |
We have used ratings from Moody's Investors Service, Inc. Where Moody's ratings are not available, we have used S&P ratings. All ratings are as of the report date and do not reflect subsequent downgrades. |
Income Tax Information |
At July 31, 2010, the Fund had a capital loss carryforward of approximately $13,906,408 of which $302,434 and $13,603,974 will expire on July 31, 2016 and 2017, respectively. Capital loss carryforwards are only available to offset future capital gains of the Fund to the extent provided by regulations and may be limited. |
See accompanying notes which are an integral part of the financial statements.
Annual Report
Statement of Assets and Liabilities
| July 31, 2010 |
| | |
Assets | | |
Investment in securities, at value (including securities loaned of $3,465,460 and repurchase agreements of $2,682,000) - See accompanying schedule: Unaffiliated issuers (cost $922,796,364) | $ 937,199,552 | |
Fidelity Central Funds (cost $104,828,664) | 104,828,664 | |
Total Investments (cost $1,027,625,028) | | $ 1,042,028,216 |
Cash | | 12,910 |
Receivable for investments sold | | 59,082 |
Receivable for fund shares sold | | 3,904,419 |
Dividends receivable | | 2,212,230 |
Interest receivable | | 5,665,975 |
Distributions receivable from Fidelity Central Funds | | 16,214 |
Other receivables | | 6,136 |
Total assets | | 1,053,905,182 |
| | |
Liabilities | | |
Payable for investments purchased | $ 9,453,671 | |
Payable for fund shares redeemed | 1,242,558 | |
Accrued management fee | 450,916 | |
Distribution fees payable | 1,158 | |
Other affiliated payables | 265,254 | |
Other payables and accrued expenses | 80,067 | |
Collateral on securities loaned, at value | 3,560,975 | |
Total liabilities | | 15,054,599 |
| | |
Net Assets | | $ 1,038,850,583 |
Net Assets consist of: | | |
Paid in capital | | $ 1,029,732,177 |
Undistributed net investment income | | 11,035,447 |
Accumulated undistributed net realized gain (loss) on investments and foreign currency transactions | | (16,345,917) |
Net unrealized appreciation (depreciation) on investments and assets and liabilities in foreign currencies | | 14,428,876 |
Net Assets | | $ 1,038,850,583 |
See accompanying notes which are an integral part of the financial statements.
Annual Report
Financial Statements - continued
Statement of Assets and Liabilities - continued
| July 31, 2010 |
| | |
Calculation of Maximum Offering Price
Class A:
Net Asset Value and redemption price per share
($3,830,229 ÷ 385,150 shares) | | $ 9.94 |
| | |
Maximum offering price per share (100/96.00 of $9.94) | | $ 10.35 |
Class T:
Net Asset Value and redemption price per share ($861,570 ÷ 86,640 shares) | | $ 9.94 |
| | |
Maximum offering price per share (100/96.00 of $9.94) | | $ 10.35 |
Class C:
Net Asset Value and offering price per share
($835,566 ÷ 84,150 shares)A | | $ 9.93 |
| | |
Real Estate Income:
Net Asset Value, offering price and redemption price per share ($1,030,393,032 ÷ 103,518,377 shares) | | $ 9.95 |
| | |
Institutional Class:
Net Asset Value, offering price and redemption price per share ($2,930,186 ÷ 294,473 shares) | | $ 9.95 |
A Redemption price per share is equal to net asset value less any applicable contingent deferred sales charge.
See accompanying notes which are an integral part of the financial statements.
Annual Report
Statement of Operations
| Year ended July 31, 2010 |
| | |
Investment Income | | |
Dividends | | $ 14,605,009 |
Interest | | 33,888,914 |
Income from Fidelity Central Funds | | 128,944 |
Total income | | 48,622,867 |
| | |
Expenses | | |
Management fee | $ 4,142,289 | |
Transfer agent fees | 2,353,943 | |
Distribution fees | 2,342 | |
Accounting and security lending fees | 331,606 | |
Custodian fees and expenses | 25,321 | |
Independent trustees' compensation | 3,983 | |
Registration fees | 139,993 | |
Audit | 158,498 | |
Legal | 9,943 | |
Miscellaneous | 9,004 | |
Total expenses before reductions | 7,176,922 | |
Expense reductions | (70,219) | 7,106,703 |
Net investment income (loss) | | 41,516,164 |
Realized and Unrealized Gain (Loss) Net realized gain (loss) on: | | |
Investment securities: | | |
Unaffiliated issuers | 20,622,501 | |
Foreign currency transactions | 2,968 | |
Total net realized gain (loss) | | 20,625,469 |
Change in net unrealized appreciation (depreciation) on: Investment securities | 102,834,422 | |
Assets and liabilities in foreign currencies | 21,305 | |
Total change in net unrealized appreciation (depreciation) | | 102,855,727 |
Net gain (loss) | | 123,481,196 |
Net increase (decrease) in net assets resulting from operations | | $ 164,997,360 |
See accompanying notes which are an integral part of the financial statements.
Annual Report
Financial Statements - continued
Statement of Changes in Net Assets
| Year ended
July 31,
2010 | Year ended
July 31,
2009 |
Increase (Decrease) in Net Assets | | |
Operations | | |
Net investment income (loss) | $ 41,516,164 | $ 24,141,669 |
Net realized gain (loss) | 20,625,469 | (25,453,488) |
Change in net unrealized appreciation (depreciation) | 102,855,727 | (12,255,306) |
Net increase (decrease) in net assets resulting
from operations | 164,997,360 | (13,567,125) |
Distributions to shareholders from net investment income | (40,150,798) | (21,152,317) |
Share transactions - net increase (decrease) | 450,504,667 | 104,590,330 |
Redemption fees | 230,512 | 250,779 |
Total increase (decrease) in net assets | 575,581,741 | 70,121,667 |
| | |
Net Assets | | |
Beginning of period | 463,268,842 | 393,147,175 |
End of period (including undistributed net investment income of $11,035,447 and undistributed net investment income of $8,560,696, respectively) | $ 1,038,850,583 | $ 463,268,842 |
See accompanying notes which are an integral part of the financial statements.
Annual Report
Financial Highlights - Class A
Period ended July 31, | 2010 H |
Selected Per-Share Data | |
Net asset value, beginning of period | $ 9.95 |
Income from Investment Operations | |
Net investment income (loss) E | .18 |
Net realized and unrealized gain (loss) | (.04) |
Total from investment operations | .14 |
Distributions from net investment income | (.15) |
Redemption fees added to paid in capital E | -J |
Net asset value, end of period | $ 9.94 |
Total Return B, C, D | 1.46% |
Ratios to Average Net Assets F, I | |
Expenses before reductions | 1.09% A |
Expenses net of fee waivers, if any | 1.09% A |
Expenses net of all reductions | 1.09% A |
Net investment income (loss) | 6.23% A |
Supplemental Data | |
Net assets, end of period (000 omitted) | $ 3,830 |
Portfolio turnover rate G | 28% |
A Annualized
B Total returns for periods of less than one year are not annualized.
C Total returns would have been lower had certain expenses not been reduced during the periods shown.
D Total returns do not include the effect of the sales charges.
E Calculated based on average shares outstanding during the period.
F Fees and expenses of the underlying Fidelity Central Funds are not included in the Fund's expense ratio. The Fund indirectly bears its proportionate share of the expenses of any underlying Fidelity Central Funds.
G Amount does not include the portfolio activity of any underlying Fidelity Central Funds.
H For the period April 14, 2010 (commencement of sale of shares) to July 31, 2010.
I Expense ratios reflect operating expenses of the class. Expenses before reductions do not reflect amounts reimbursed by the investment adviser or reductions from brokerage service arrangements or reductions from other expense offset arrangements and do not represent the amount paid by the class during periods when reimbursements or reductions occur. Expense ratios before reductions for start-up periods may not be representative of longer-term operating periods. Expenses net of fee waivers reflect expenses after reimbursement by the investment adviser but prior to reductions from brokerage service arrangements or other expense offset arrangements. Expenses net of all reductions represent the net expenses paid by the class.
J Amount represents less than $.01 per share.
See accompanying notes which are an integral part of the financial statements.
Annual Report
Financial Highlights - Class T
Period ended July 31, | 2010 H |
Selected Per-Share Data | |
Net asset value, beginning of period | $ 9.95 |
Income from Investment Operations | |
Net investment income (loss) E | .17 |
Net realized and unrealized gain (loss) | (.03) |
Total from investment operations | .14 |
Distributions from net investment income | (.15) |
Redemption fees added to paid in capital E | -J |
Net asset value, end of period | $ 9.94 |
Total Return B, C, D | 1.45% |
Ratios to Average Net Assets F, I | |
Expenses before reductions | 1.17% A |
Expenses net of fee waivers, if any | 1.17% A |
Expenses net of all reductions | 1.17% A |
Net investment income (loss) | 5.92% A |
Supplemental Data | |
Net assets, end of period (000 omitted) | $ 862 |
Portfolio turnover rate G | 28% |
A Annualized
B Total returns for periods of less than one year are not annualized.
C Total returns would have been lower had certain expenses not been reduced during the periods shown.
D Total returns do not include the effect of the sales charges.
E Calculated based on average shares outstanding during the period.
F Fees and expenses of the underlying Fidelity Central Funds are not included in the Fund's expense ratio. The Fund indirectly bears its proportionate share of the expenses of any underlying Fidelity Central Funds.
G Amount does not include the portfolio activity of any underlying Fidelity Central Funds.
H For the period April 14, 2010 (commencement of sale of shares) to July 31, 2010.
I Expense ratios reflect operating expenses of the class. Expenses before reductions do not reflect amounts reimbursed by the investment adviser or reductions from brokerage service arrangements or reductions from other expense offset arrangements and do not represent the amount paid by the class during periods when reimbursements or reductions occur. Expense ratios before reductions for start-up periods may not be representative of longer-term operating periods. Expenses net of fee waivers reflect expenses after reimbursement by the investment adviser but prior to reductions from brokerage service arrangements or other expense offset arrangements. Expenses net of all reductions represent the net expenses paid by the class.
J Amount represents less than $.01 per share.
See accompanying notes which are an integral part of the financial statements.
Annual Report
Financial Highlights - Class C
Period ended July 31, | 2010 H |
Selected Per-Share Data | |
Net asset value, beginning of period | $ 9.95 |
Income from Investment Operations | |
Net investment income (loss) E | .15 |
Net realized and unrealized gain (loss) | (.03) |
Total from investment operations | .12 |
Distributions from net investment income | (.14) |
Redemption fees added to paid in capital E | -J |
Net asset value, end of period | $ 9.93 |
Total Return B, C, D | 1.29% |
Ratios to Average Net Assets F, I | |
Expenses before reductions | 1.86% A |
Expenses net of fee waivers, if any | 1.86% A |
Expenses net of all reductions | 1.86% A |
Net investment income (loss) | 5.21% A |
Supplemental Data | |
Net assets, end of period (000 omitted) | $ 836 |
Portfolio turnover rate G | 28% |
A Annualized
B Total returns for periods of less than one year are not annualized.
C Total returns would have been lower had certain expenses not been reduced during the periods shown.
D Total returns do not include the effect of the contingent deferred sales charge.
E Calculated based on average shares outstanding during the period.
F Fees and expenses of the underlying Fidelity Central Funds are not included in the Fund's expense ratio. The Fund indirectly bears its proportionate share of the expenses of any underlying Fidelity Central Funds.
G Amount does not include the portfolio activity of any underlying Fidelity Central Funds.
H For the period April 14, 2010 (commencement of sale of shares) to July 31, 2010.
I Expense ratios reflect operating expenses of the class. Expenses before reductions do not reflect amounts reimbursed by the investment adviser or reductions from brokerage service arrangements or reductions from other expense offset arrangements and do not represent the amount paid by the class during periods when reimbursements or reductions occur. Expense ratios before reductions for start-up periods may not be representative of longer-term operating periods. Expenses net of fee waivers reflect expenses after reimbursement by the investment adviser but prior to reductions from brokerage service arrangements or other expense offset arrangements. Expenses net of all reductions represent the net expenses paid by the class.
J Amount represents less than $.01 per share.
See accompanying notes which are an integral part of the financial statements.
Annual Report
Financial Highlights - Real Estate Income
Years ended July 31, | 2010 | 2009 | 2008 | 2007 | 2006 |
Selected Per-Share Data | | | | | |
Net asset value, beginning of period | $ 8.21 | $ 9.43 | $ 11.22 | $ 11.78 | $ 12.17 |
Income from Investment Operations | | | | | |
Net investment income
(loss) B | .53 | .54 | .59 | .63 | .66 |
Net realized and unrealized gain (loss) | 1.73 | (1.27) | (1.48) | (.37) | (.11) |
Total from investment operations | 2.26 | (.73) | (.89) | .26 | .55 |
Distributions from net investment income | (.52) | (.50) | (.66) | (.58) | (.67) |
Distributions from net realized gain | - | - | (.24) | (.24) | (.27) |
Total distributions | (.52) | (.50) | (.90) | (.82) | (.94) |
Redemption fees added to paid in capital B | - F | .01 | - F | - F | - F |
Net asset value, end of period | $ 9.95 | $ 8.21 | $ 9.43 | $ 11.22 | $ 11.78 |
Total Return A | 28.29% | (6.92)% | (8.43)% | 2.00% | 4.82% |
Ratios to Average Net Assets C, E | | | | | |
Expenses before reductions | .97% | 1.00% | .94% | .88% | .85% |
Expenses net of fee waivers,
if any | .96% | 1.00% | .94% | .88% | .85% |
Expenses net of all reductions | .96% | 1.00% | .94% | .88% | .85% |
Net investment income (loss) | 5.60% | 7.15% | 5.77% | 5.30% | 5.61% |
Supplemental Data | | | | | |
Net assets, end of period
(000 omitted) | $ 1,030,393 | $ 463,269 | $ 393,147 | $ 516,268 | $ 521,265 |
Portfolio turnover rate D | 28% | 47% | 32% | 45% | 27% |
A Total returns would have been lower had certain expenses not been reduced during the periods shown.
B Calculated based on average shares outstanding during the period.
C Fees and expenses of the underlying Fidelity Central Funds are not included in the Fund's expense ratio. The Fund indirectly bears its proportionate share of the expenses of any underlying Fidelity Central Funds.
D Amount does not include the portfolio activity of any underlying Fidelity Central Funds.
E Expense ratios reflect operating expenses of the class. Expenses before reductions do not reflect amounts reimbursed by the investment adviser or reductions from brokerage service arrangements or reductions from other expense offset arrangements and do not represent the amount paid by the class during periods when reimbursements or reductions occur. Expenses net of fee waivers reflect expenses after reimbursement by the investment adviser but prior to reductions from brokerage service arrangements or other expense offset arrangements. Expenses net of all reductions represent the net expenses paid by the class.
F Amount represents less than $.01 per share.
See accompanying notes which are an integral part of the financial statements.
Annual Report
Financial Highlights - Institutional Class
Period ended July 31, | 2010 G |
Selected Per-Share Data | |
Net asset value, beginning of period | $ 9.95 |
Income from Investment Operations | |
Net investment income (loss) D | .19 |
Net realized and unrealized gain (loss) | (.04) |
Total from investment operations | .15 |
Distributions from net investment income | (.15) |
Redemption fees added to paid in capital D | -I |
Net asset value, end of period | $ 9.95 |
Total Return B, C | 1.58% |
Ratios to Average Net Assets E,H | |
Expenses before reductions | .85% A |
Expenses net of fee waivers, if any | .85% A |
Expenses net of all reductions | .85% A |
Net investment income (loss) | 6.70% A |
Supplemental Data | |
Net assets, end of period (000 omitted) | $ 2,930 |
Portfolio turnover rate F | 28% |
A Annualized
B Total returns for periods of less than one year are not annualized.
C Total returns would have been lower had certain expenses not been reduced during the periods shown.
D Calculated based on average shares outstanding during the period.
E Fees and expenses of the underlying Fidelity Central Funds are not included in the Fund's expense ratio. The Fund indirectly bears its proportionate share of the expenses of any underlying Fidelity Central Funds.
F Amount does not include the portfolio activity of any underlying Fidelity Central Funds.
G For the period April 14, 2010 (commencement of sale of shares) to July 31, 2010.
H Expense ratios reflect operating expenses of the class. Expenses before reductions do not reflect amounts reimbursed by the investment adviser or reductions from brokerage service arrangements or reductions from other expense offset arrangements and do not represent the amount paid by the class during periods when reimbursements or reductions occur. Expense ratios before reductions for start-up periods may not be representative of longer-term operating periods. Expenses net of fee waivers reflect expenses after reimbursement by the investment adviser but prior to reductions from brokerage service arrangements or other expense offset arrangements. Expenses net of all reductions represent the net expenses paid by the class.
I Amount represents less than $.01 per share.
See accompanying notes which are an integral part of the financial statements.
Annual Report
Notes to Financial Statements
For the period ended July 31, 2010
1. Organization.
Fidelity Real Estate Income Fund (the Fund) is a fund of Fidelity Securities Fund (the Trust) and is authorized to issue an unlimited number of shares. The Trust is registered under the Investment Company Act of 1940, as amended (the 1940 Act), as an open-end management investment company organized as a Massachusetts business trust. The Fund commenced sale of Class A, Class T, Class C, and Institutional Class shares and the existing class was designated Real Estate Income on April 14, 2010. The Fund offers Class A, Class T, Class C, Real Estate Income and Institutional Class shares, each of which has equal rights as to assets and voting privileges. Each class has exclusive voting rights with respect to matters that affect that class. Investment income, realized and unrealized capital gains and losses, the common expenses of the Fund, and certain fund-level expense reductions, if any, are allocated on a pro-rata basis to each class based on the relative net assets of each class to the total net assets of the Fund. Each class differs with respect to transfer agent and distribution and service plan fees incurred. Certain expense reductions also differ by class.
2. Investments in Fidelity Central Funds.
The Fund may invest in Fidelity Central Funds, which are open-end investment companies available only to other investment companies and accounts managed by Fidelity Management & Research Company (FMR) and its affiliates. The Fund's Schedule of Investments lists each of the Fidelity Central Funds held as of period end, if any, as an investment of the Fund, but does not include the underlying holdings of each Fidelity Central Fund. As an Investing Fund, the Fund indirectly bears its proportionate share of the expenses of the underlying Fidelity Central Funds.
The Money Market Central Funds seek preservation of capital and current income and are managed by Fidelity Investments Money Management, Inc. (FIMM), an affiliate of FMR.
A complete unaudited list of holdings for each Fidelity Central Fund is available upon request or at the Securities and Exchange Commission (the SEC) web site at www.sec.gov. In addition, the financial statements of the Fidelity Central Funds which are not covered by the Fund's Report of Independent Registered Public Accounting Firm, are available on the SEC web site or upon request.
3. Significant Accounting Policies.
The financial statements have been prepared in conformity with accounting principles generally accepted in the United States of America (GAAP), which require management to make certain estimates and assumptions at the date of the financial statements. Actual results could differ from those estimates. The following summarizes the significant accounting policies of the Fund:
Annual Report
Notes to Financial Statements - continued
3. Significant Accounting Policies - continued
Security Valuation. Investments are valued as of 4:00 p.m. Eastern time on the last calendar day of the period. The Fund uses independent pricing services approved by the Board of Trustees to value its investments. When current market prices or quotations are not readily available or reliable, valuations may be determined in good faith in accordance with procedures adopted by the Board of Trustees. Factors used in determining value may include market or security specific events, changes in interest rates and credit quality. The frequency with which these procedures are used cannot be predicted and they may be utilized to a significant extent. The value used for net asset value (NAV) calculation under these procedures may differ from published prices for the same securities.
The Fund categorizes the inputs to valuation techniques used to value its investments into a disclosure hierarchy consisting of three levels as shown below.
Level 1 - quoted prices in active markets for identical investments
Level 2 - other significant observable inputs (including quoted prices for similar investments, interest rates, prepayment speeds, etc.)
Level 3 - unobservable inputs (including the fund's own assumptions based on the best information available)
Changes in valuation techniques may result in transfers in or out of an assigned level within the disclosure hierarchy. The aggregate value of investments by input level, as of July 31, 2010, as well as a rollforward of level 3 securities, is included at the end of the Fund's Schedule of Investments. Valuation techniques used to value the Fund's investments by major category are as follows.
Equity securities, including restricted securities, for which market quotations are readily available, are valued at the last reported sale price or official closing price as reported by an independent pricing service on the primary market or exchange on which they are traded and are categorized as Level 1 in the hierarchy. In the event there were no sales during the day or closing prices are not available, securities are valued at the last quoted bid price or may be valued using the last available price and are generally categorized as Level 2 in the hierarchy. For foreign equity securities, when significant market or security specific events arise, comparisons to the valuation of American Depositary Receipts (ADRs), futures contracts, Exchange-traded funds (ETFs) and certain indexes as well as quoted prices for similar securities are used and are categorized as Level 2 in the hierarchy in these circumstances. Utilizing these techniques may result in transfers between Level 1 and Level 2. For restricted equity securities and private placements where observable inputs are limited, assumptions about market activity and risk are used and are categorized as Level 3 in the hierarchy.
Annual Report
3. Significant Accounting Policies - continued
Security Valuation - continued
Debt securities, including restricted securities, are valued based on evaluated prices received from independent pricing services or from dealers who make markets in such securities. For corporate bonds, floating rate loans and preferred securities, pricing services utilize matrix pricing which considers yield or price of bonds of comparable quality, coupon, maturity and type as well as dealer supplied prices and are generally categorized as Level 2 in the hierarchy. For asset backed securities, collateralized mortgage obligations and commercial mortgage securities, pricing services utilize matrix pricing which considers prepayment speed assumptions, attributes of the collateral, yield or price of bonds of comparable quality, coupon, maturity and type as well as dealer supplied prices and, accordingly, such securities are generally categorized as Level 2 in the hierarchy.
Investments in open-end mutual funds, including the Fidelity Central Funds, are valued at their closing net asset value each business day and are categorized as Level 1 in the hierarchy. Short-term securities with remaining maturities of sixty days or less for which quotations are not readily available are valued at amortized cost, which approximates fair value and are categorized as Level 2 in the hierarchy.
When independent prices are unavailable or unreliable, debt securities may be valued utilizing pricing matrices which consider similar factors that would be used by independent pricing services. These are generally categorized as Level 2 in the hierarchy but may be Level 3 depending on the circumstances. Certain of the Fund's securities may be valued by a single source or dealer.
Foreign Currency. The Fund uses foreign currency contracts to facilitate transactions in foreign-denominated securities. Gains and losses from these transactions may arise from changes in the value of the foreign currency or if the counterparties do not perform under the contracts' terms.
Foreign-denominated assets, including investment securities, and liabilities are translated into U.S. dollars at the exchange rate at period end. Purchases and sales of investment securities, income and dividends received and expenses denominated in foreign currencies are translated into U.S. dollars at the exchange rate in effect on the transaction date.
The effects of exchange rate fluctuations on investments are included with the net realized and unrealized gain (loss) on investment securities. Other foreign currency transactions resulting in realized and unrealized gain (loss) are disclosed separately.
Annual Report
Notes to Financial Statements - continued
3. Significant Accounting Policies - continued
Investment Transactions and Income. For financial reporting purposes, the Fund's investment holdings and NAV include trades executed through the end of the last business day of the period. The NAV per share for processing shareholder transactions is calculated as of the close of business of the New York Stock Exchange (NYSE), normally 4:00 p.m. Eastern time and includes trades executed through the end of the prior business day. Gains and losses on securities sold are determined on the basis of identified cost. Dividend income is recorded on the ex-dividend date, except for certain dividends from foreign securities where the ex-dividend date may have passed, which are recorded as soon as the Fund is informed of the ex-dividend date. Non-cash dividends included in dividend income, if any, are recorded at the fair market value of the securities received. Distributions received on securities that represent a return of capital or capital gain are recorded as a reduction of cost of investment and/or as a realized gain. The Funds estimate the components of distributions received that may be considered return of capital distributions or capital gain distributions. Interest income and distributions from the Fidelity Central Funds are accrued as earned. Interest income includes coupon interest and amortization of premium and accretion of discount on debt securities. For certain lower credit quality securitized assets that have contractual cash flows (for example, asset backed securities, collateralized mortgage obligations and commercial mortgage-backed securities), changes in estimated cash flows are periodically evaluated and the estimated yield is adjusted on a prospective basis over the remaining life of the security, resulting in increases or decreases to Interest Income in the accompanying Statement of Operations. Investment income is recorded net of foreign taxes withheld where recovery of such taxes is uncertain. Debt obligations may be placed on non-accrual status and related interest income may be reduced by ceasing current accruals and writing off interest receivables when the collection of all or a portion of interest has become doubtful based on consistently applied procedures. A debt obligation is removed from non-accrual status when the issuer resumes interest payments or when collectability of interest is reasonably assured.
Expenses. Most expenses of the Trust can be directly attributed to a fund. Expenses which cannot be directly attributed are apportioned amongst each fund in the Trust. Expense estimates are accrued in the period to which they relate and adjustments are made when actual amounts are known.
Income Tax Information and Distributions to Shareholders. Each year the Fund intends to qualify as a regulated investment company, including distributing substantially all of its taxable income and realized gains under Subchapter M of the Internal Revenue Code and filing its U.S. federal tax return. As a result, no provision for income taxes is required. As of July 31, 2010, the Fund did not have any unrecognized tax benefits in the accompanying financial statements. A fund's federal tax return is subject to examination by the Internal Revenue Service (IRS) for a period of three years. Foreign taxes are provided for based on the Fund's understanding of the tax rules and rates that exist in the foreign markets in which it invests.
Annual Report
3. Significant Accounting Policies - continued
Income Tax Information and Distributions to Shareholders - continued
Distributions are recorded on the ex-dividend date. Income dividends and capital gain distributions are declared separately for each class. Income and capital gain distributions are determined in accordance with income tax regulations, which may differ from GAAP. In addition, the Fund claimed a portion of the payment made to redeeming shareholders as a distribution for income tax purposes.
Capital accounts within the financial statements are adjusted for permanent book-tax differences. These adjustments have no impact on net assets or the results of operations. Temporary book-tax differences will reverse in a subsequent period.
Book-tax differences are primarily due to the short-term gain distributions from the Fidelity Central Funds, foreign currency transactions, passive foreign investment companies (PFIC), defaulted bonds, market discount, partnerships, capital loss carryforwards, losses deferred due to wash sales and excise tax regulations.
The federal tax cost of investment securities and unrealized appreciation (depreciation) as of period end were as follows:
Gross unrealized appreciation | $ 88,269,388 |
Gross unrealized depreciation | (75,775,542) |
Net unrealized appreciation (depreciation) | $ 12,493,846 |
| |
Tax Cost | $ 1,029,534,370 |
The tax-based components of distributable earnings as of period end were as follows:
Undistributed ordinary income | $ 10,505,281 |
Capital loss carryforward | $ (13,906,408) |
Net unrealized appreciation (depreciation) | $ 12,519,534 |
The tax character of distributions paid was as follows:
| July 31, 2010 | July 31, 2009 |
Ordinary Income | $ 40,150,798 | $ 21,152,317 |
Annual Report
Notes to Financial Statements - continued
3. Significant Accounting Policies - continued
Short-Term Trading (Redemption) Fees. Shares held in the Fund less than 90 days are subject to a redemption fee equal to .75% of the proceeds of the redeemed shares. All redemption fees, including any estimated redemption fees paid by FMR, are retained by the Fund and accounted for as an addition to paid in capital.
4. Operating Policies.
Repurchase Agreements. FMR has received an Exemptive Order from the SEC which permits the Fund and other affiliated entities of FMR to transfer uninvested cash balances into joint trading accounts which are then invested in repurchase agreements. The Fund may also invest directly with institutions in repurchase agreements. Repurchase agreements are collateralized by government or non-government securities. Upon settlement date, collateral is held in segregated accounts with custodian banks and may be obtained in the event of a default of the counterparty. The Fund monitors, on a daily basis, the value of the collateral to ensure it is at least equal to the principal amount of the repurchase agreement (including accrued interest). In the event of a default by the counterparty, realization of the collateral proceeds could be delayed, during which time the value of the collateral may decline.
Restricted Securities. The Fund may invest in securities that are subject to legal or contractual restrictions on resale. These securities generally may be resold in transactions exempt from registration or to the public if the securities are registered. Disposal of these securities may involve time-consuming negotiations and expense, and prompt sale at an acceptable price may be difficult. Information regarding restricted securities is included at the end of the Fund's Schedule of Investments.
Loans and Other Direct Debt Instruments The Fund may invest in loans and loan participations, trade claims or other receivables. These investments may include standby financing commitments, including revolving credit facilities, that obligate the Fund to supply additional cash to the borrower on demand. Loan participations involve a risk of insolvency of the lending bank or other financial intermediary. The Fund may be contractually obligated to receive approval from the agent bank and/or borrower prior to the sale of these investments.
5. Purchases and Sales of Investments.
Purchases and sales of securities, other than short-term securities and U.S. government securities, aggregated $569,505,702 and $189,844,016, respectively.
Annual Report
6. Fees and Other Transactions with Affiliates.
Management Fee. FMR and its affiliates provide the Fund with investment management related services for which the Fund pays a monthly management fee. The management fee is the sum of an individual fund fee rate that is based on an annual rate of .30% of the Fund's average net assets and a group fee rate that averaged .26% during the period. The group fee rate is based upon the average net assets of all the mutual funds advised by FMR. The group fee rate decreases as assets under management increase and increases as assets under management decrease. For the period, the total annual management fee rate was .56% of the Fund's average net assets.
Distribution and Service Plan. In accordance with Rule 12b-1 of the 1940 Act, the Fund has adopted separate Distribution and Service Plans for each class of shares. Certain classes pay Fidelity Distributors Corporation (FDC), an affiliate of FMR, separate Distribution and Service Fees, each of which is based on an annual percentage of each class' average net assets. In addition, FDC may pay financial intermediaries for selling shares of the Fund and providing shareholder support services. For the period, the Distribution and Service Fee rates and the total amounts paid to and retained by FDC were as follows:
| Distribution
Fee | Service
Fee | Paid to
FDC | Retained
by FDC |
Class A | -% | .25% | $ 1,146 | $ 382 |
Class T | -% | .25% | 324 | 68 |
Class C | .75% | .25% | 872 | 585 |
| | | $ 2,342 | $ 1,035 |
Sales Load. FDC receives a front-end sales charge of up to 4.00% for selling Class A shares and Class T shares, some of which is paid to financial intermediaries for selling shares of the Fund. FDC receives the proceeds of contingent deferred sales charges levied on Class A, Class T, and Class C redemptions. These charges depend on the holding period. The deferred sales charges range from 1% for Class C, .75% for certain purchases of Class A shares (1.00% to .50% prior to July 12, 2010) and .25% for certain purchases of Class T shares.
For the period, sales charge amounts retained by FDC were as follows:
| Retained
by FDC |
Class A | $ 369 |
Class T | 283 |
| $ 652 |
Annual Report
Notes to Financial Statements - continued
6. Fees and Other Transactions with Affiliates - continued
Transfer Agent Fees. Fidelity Investments Institutional Operations Company, Inc. (FIIOC), an affiliate of FMR, is the transfer, dividend disbursing and shareholder servicing agent for each class of the Fund. FIIOC receives account fees and asset-based fees that vary according to the account size and type of account of the shareholders of the respective classes of the Fund. FIIOC pays for typesetting, printing and mailing of shareholder reports, except proxy statements. For the period, the total transfer agent fees paid by each applicable class were as follows:
| Amount | % of
Average
Net Assets |
Class A | $ 905 | .19* |
Class T | 351 | .27* |
Class C | 196 | .22* |
Real Estate Income | 2,351,958 | .32 |
Institutional Class | 533 | .20* |
| $ 2,353,943 | |
* Annualized
Accounting and Security Lending Fees. Fidelity Service Company, Inc. (FSC), an affiliate of FMR, maintains the Fund's accounting records. The accounting fee is based on the level of average net assets for the month. Under a separate contract, FSC administers the security lending program. The security lending fee is based on the number and duration of lending transactions.
Brokerage Commissions. The Fund placed a portion of its portfolio transactions with brokerage firms which are affiliates of the investment adviser. The commissions paid to these affiliated firms were $8,333 for the period.
7. Committed Line of Credit.
The Fund participates with other funds managed by FMR in a $3.75 billion credit facility (the "line of credit") to be utilized for temporary or emergency purposes to fund shareholder redemptions or for other short-term liquidity purposes. The Fund has agreed to pay commitment fees on its pro-rata portion of the line of credit, which amounted to $2,742 and is reflected in Miscellaneous expenses on the Statement of Operations. During the period, there were no borrowings on this line of credit.
Annual Report
8. Security Lending.
The Fund lends portfolio securities from time to time in order to earn additional income. On the settlement date of the loan, the Fund receives collateral (in the form of U.S. Treasury obligations, letters of credit and/or cash) against the loaned securities and maintains collateral in an amount not less than 100% of the market value of the loaned securities during the period of the loan. The market value of the loaned securities is determined at the close of business of the Fund and any additional required collateral is delivered to the Fund on the next business day. If the borrower defaults on its obligation to return the securities loaned because of insolvency or other reasons, a fund could experience delays and costs in recovering the securities loaned or in gaining access to the collateral. Any cash collateral received is invested in the Fidelity Securities Lending Cash Central Fund. The value of loaned securities and cash collateral at period end are disclosed on the Fund's Statement of Assets and Liabilities. Security lending income represents the income earned on investing cash collateral, less fees and expenses associated with the loan, plus any premium payments that may be received on the loan of certain types of securities. Security lending income is presented in the Statement of Operations as a component of income from Fidelity Central Funds. Net income from lending portfolio securities during the period amounted to $6,300.
9. Expense Reductions.
FMR voluntarily agreed to reimburse a portion of the Fund's operating expenses. During the period, this reimbursement reduced expenses of the Real Estate Income Class by $62,921.
Many of the brokers with whom FMR places trades on behalf of the Fund provided services in addition to trade execution. These services included payments of certain expenses on behalf of the Fund totaling $6,610 for the period. In addition, through arrangements with the Fund's custodian, credits realized as a result of uninvested cash balances were used to reduce the Fund's expenses. During the period, these credits reduced the Fund's custody expenses by $688.
Annual Report
Notes to Financial Statements - continued
10. Distributions to Shareholders.
Distributions to shareholders of each class were as follows:
Years ended July 31, | 2010 A | 2009 |
From net investment income | | |
Class A | $ 23,172 | $ - |
Class T | 6,447 | - |
Class C | 3,705 | - |
Real Estate Income | 40,107,971 | 21,152,317 |
Institutional Class | 9,503 | - |
Total | $ 40,150,798 | $ 21,152,317 |
A Distributions for Class A, Class T, Class C and Institutional Class are for the period April 14, 2010 (commencement of sale of shares) to July 31, 2010.
11. Share Transactions.
Transactions for each class of shares were as follows:
| Shares | Dollars |
Years ended July 31, | 2010 A | 2009 | 2010 A | 2009 |
Class A | | | | |
Shares sold | 402,260 | - | $ 3,960,293 | $ - |
Reinvestment of distributions | 1,072 | - | 10,302 | - |
Shares redeemed | (18,182) | - | (177,559) | - |
Net increase (decrease) | 385,150 | - | $ 3,793,036 | $ - |
Class T | | | | |
Shares sold | 85,986 | - | $ 847,305 | $ - |
Reinvestment of distributions | 671 | - | 6,447 | - |
Shares redeemed | (17) | - | (166) | - |
Net increase (decrease) | 86,640 | - | $ 853,586 | $ - |
Class C | | | | |
Shares sold | 84,053 | - | $ 827,207 | $ - |
Reinvestment of distributions | 378 | - | 3,628 | - |
Shares redeemed | (281) | - | (2,700) | - |
Net increase (decrease) | 84,150 | - | $ 828,135 | $ - |
Real Estate Income | | | | |
Shares sold | 69,175,263 | 36,427,202 | $ 650,744,676 | $ 268,384,038 |
Reinvestment of distributions | 4,018,182 | 2,602,609 | 36,922,410 | 19,305,679 |
Shares redeemed | (26,105,432) | (24,280,916) | (245,525,556) | (183,099,387) |
Net increase (decrease) | 47,088,013 | 14,748,895 | $ 442,141,530 | $ 104,590,330 |
Institutional Class | | | | |
Shares sold | 294,304 | - | $ 2,886,826 | $ - |
Reinvestment of distributions | 902 | - | 8,663 | - |
Shares redeemed | (733) | - | (7,109) | - |
Net increase (decrease) | 294,473 | - | $ 2,888,380 | $ - |
A Share transactions for Class A, Class T, Class C and Institutional Class are for the period April 14, 2010 (commencement of sale of shares) to
July 31, 2010.
Annual Report
12. Other.
The Fund's organizational documents provide former and current trustees and officers with a limited indemnification against liabilities arising in connection with the performance of their duties to the Fund. In the normal course of business, the Fund may also enter into contracts that provide general indemnifications. The Fund's maximum exposure under these arrangements is unknown as this would be dependent on future claims that may be made against the Fund. The risk of material loss from such claims is considered remote.
Annual Report
To the Trustees of Fidelity Securities Fund and Shareholders of Fidelity Real Estate Income Fund:
We have audited the accompanying statement of assets and liabilities of Fidelity Real Estate Income Fund (the Fund), a fund of Fidelity Securities Fund, including the schedule of investments, as of July 31, 2010, and the related statement of operations for the year then ended, the statement of changes in net assets for each of the two years in the period then ended, and the financial highlights for each of the five years in the period then ended. These financial statements and financial highlights are the responsibility of the Fund's management. Our responsibility is to express an opinion on these financial statements and financial highlights based on our audits.
We conducted our audits in accordance with standards of the Public Company Accounting Oversight Board (United States). Those standards require that we plan and perform the audit to obtain reasonable assurance about whether the financial statements and financial highlights are free of material misstatement. The Fund is not required to have, nor were we engaged to perform, an audit of its internal control over financial reporting. Our audits included consideration of internal control over financial reporting as a basis for designing audit procedures that are appropriate in the circumstances, but not for the purpose of expressing an opinion on the effectiveness of the Fund's internal control over financial reporting. Accordingly, we express no such opinion. An audit also includes examining, on a test basis, evidence supporting the amounts and disclosures in the financial statements, assessing the accounting principles used and significant estimates made by management, as well as evaluating the overall financial statement presentation. Our procedures included confirmation of securities owned as of July 31, 2010, by correspondence with the custodians, agent banks and brokers; where replies were not received from brokers, we performed other auditing procedures. We believe that our audits provide a reasonable basis for our opinion.
In our opinion, the financial statements and financial highlights referred to above present fairly, in all material respects, the financial position of Fidelity Real Estate Income Fund as of July 31, 2010, the results of its operations for the year then ended, the changes in its net assets for each of the two years in the period then ended, and the financial highlights for each of the five years in the period then ended, in conformity with accounting principles generally accepted in the United States of America.
/s/ Deloitte & Touche LLP
DELOITTE & TOUCHE LLP
Boston, Massachusetts
September 24, 2010
Annual Report
The Trustees, Member of the Advisory Board, and executive officers of the trust and fund, as applicable, are listed below. The Board of Trustees governs the fund and is responsible for protecting the interests of shareholders. The Trustees are experienced executives who meet periodically throughout the year to oversee the fund's activities, review contractual arrangements with companies that provide services to the fund, oversee management of the risks associated with such activities and contractual arrangements, and review the fund's performance. Except for James C. Curvey, each of the Trustees oversees 222 funds advised by FMR or an affiliate. Mr. Curvey oversees 411 funds advised by FMR or an affiliate.
The Trustees hold office without limit in time except that (a) any Trustee may resign; (b) any Trustee may be removed by written instrument, signed by at least two-thirds of the number of Trustees prior to such removal; (c) any Trustee who requests to be retired or who has become incapacitated by illness or injury may be retired by written instrument signed by a majority of the other Trustees; and (d) any Trustee may be removed at any special meeting of shareholders by a two-thirds vote of the outstanding voting securities of the trust. Each Trustee who is not an interested person (as defined in the 1940 Act) (Independent Trustee), shall retire not later than the last day of the calendar year in which his or her 72nd birthday occurs. The Independent Trustees may waive this mandatory retirement age policy with respect to individual Trustees. The executive officers and Advisory Board Member hold office without limit in time, except that any officer and Advisory Board Member may resign or may be removed by a vote of a majority of the Trustees at any regular meeting or any special meeting of the Trustees. Except as indicated, each individual has held the office shown or other offices in the same company for the past five years.
Experience, Skills, Attributes, and Qualifications of the Fund's Trustees. The Governance and Nominating Committee has adopted a statement of policy that describes the experience, qualifications, attributes, and skills that are necessary and desirable for potential Independent Trustee candidates (Statement of Policy). The Board believes that each Trustee satisfied at the time he or she was initially elected or appointed a Trustee, and continues to satisfy, the standards contemplated by the Statement of Policy. The Governance and Nominating Committee also engages professional search firms to help identify potential Independent Trustee candidates who have the experience, qualifications, attributes, and skills consistent with the Statement of Policy. From time to time, additional criteria based on the composition and skills of the current Independent Trustees, as well as experience or skills that may be appropriate in light of future changes to board composition, business conditions, and regulatory or other developments, have also been considered by the professional search firms and the Governance and Nominating Committee. In addition, the Board takes into account the Trustees' commitment and participation in Board and committee meetings, as well as their leadership of standing and ad hoc committees throughout their tenure.
In determining that a particular Trustee was and continues to be qualified to serve as a Trustee, the Board has considered a variety of criteria, none of which, in isolation, was controlling. The Board believes that, collectively, the Trustees have balanced and diverse experience, qualifications, attributes, and skills, which allow the Board to operate effectively in governing the fund and protecting the interests of shareholders. Information about the specific experience, skills, attributes, and qualifications of each Trustee, which in each case led to the Board's conclusion that the Trustee should serve (or continue to serve) as a trustee of the fund, is provided below.
Annual Report
Board Structure and Oversight Function. Edward C. Johnson 3d is an interested person (as defined in the 1940 Act) and currently serves as Chairman. The Trustees have determined that an interested Chairman is appropriate and benefits shareholders because an interested Chairman has a personal and professional stake in the quality and continuity of services provided to the fund. Independent Trustees exercise their informed business judgment to appoint an individual of their choosing to serve as Chairman, regardless of whether the Trustee happens to be independent or a member of management. The Independent Trustees have determined that they can act independently and effectively without having an Independent Trustee serve as Chairman and that a key structural component for assuring that they are in a position to do so is for the Independent Trustees to constitute a substantial majority for the Board. The Independent Trustees also regularly meet in executive session. Ned C. Lautenbach serves as Chairman of the Independent Trustees and as such (i) acts as a liaison between the Independent Trustees and management with respect to matters important to the Independent Trustees and (ii) with management prepares agendas for Board meetings.
Fidelity funds are overseen by different Boards of Trustees. The fund's Board oversees Fidelity's equity and high income funds and another Board oversees Fidelity's investment-grade bond, money market, and asset allocation funds. The asset allocation funds may invest in Fidelity funds overseen by the fund's Board. The use of separate Boards, each with its own committee structure, allows the Trustees of each group of Fidelity funds to focus on the unique issues of the funds they oversee, including common research, investment, and operational issues. On occasion, the separate Boards establish joint committees to address issues of overlapping consequences for the Fidelity funds overseen by each Board.
The Trustees operate using a system of committees to facilitate the timely and efficient consideration of all matters of importance to the Trustees, the fund, and fund shareholders and to facilitate compliance with legal and regulatory requirements and oversight of the fund's activities and associated risks. The Board, acting through its committees, has charged FMR and its affiliates with (i) identifying events or circumstances the occurrence of which could have demonstrably adverse effects on the fund's business and/or reputation; (ii) implementing processes and controls to lessen the possibility that such events or circumstances occur or to mitigate the effects of such events or circumstances if they do occur; and (iii) creating and maintaining a system designed to evaluate continuously business and market conditions in order to facilitate the identification and implementation processes described in (i) and (ii) above. Because the day-to-day operations and activities of the fund are carried out by or through FMR, its affiliates and other service providers, the fund's exposure to risks is mitigated but not eliminated by the processes overseen by the Trustees. While each of the Board's committees has responsibility for overseeing different aspects of the fund's activities, oversight is exercised primarily through the Operations, Audit, and Compliance Committees. Appropriate personnel, including but not limited to the fund's Chief Compliance Officer (CCO), FMR's internal auditor, the independent accountants, the fund's Treasurer and portfolio management personnel, make periodic reports to the Board's committees, as appropriate. The responsibilities of each committee, including their oversight responsibilities, are described further under "Standing Committees of the Fund's Trustees."
Annual Report
Trustees and Officers - continued
The fund's Statement of Additional Information (SAI) includes more information about the Trustees. To request a free copy, call Fidelity at 1-800-544-8544.
Interested Trustees*:
Correspondence intended for each Trustee who is an interested person may be sent to Fidelity Investments, 82 Devonshire Street, Boston, Massachusetts 02109.
Name, Age; Principal Occupations and Other Relevant Experience+ |
Edward C. Johnson 3d (80) |
| Year of Election or Appointment: 1984 Mr. Johnson is Trustee and Chairman of the Board of Trustees of certain Trusts. Mr. Johnson serves as Chief Executive Officer, Chairman, and a Director of FMR LLC; Chairman and a Director of FMR; Chairman and a Director of Fidelity Research & Analysis Company (FRAC); Chairman and a Director of Fidelity Investments Money Management, Inc.; and Chairman and a Director of FMR Co., Inc. In addition, Mr. Johnson serves as Chairman and Director of FIL Limited. Previously, Mr. Johnson served as President of FMR LLC (2006-2007). |
James C. Curvey (75) |
| Year of Election or Appointment: 2007 Mr. Curvey also serves as Trustee (2007-present) of other investment companies advised by FMR. Mr. Curvey is a Director of FMR and FMR Co., Inc. (2007-present). Mr. Curvey is also Vice Chairman (2006-present) and Director of FMR LLC. In addition, Mr. Curvey serves as an Overseer for the Boston Symphony Orchestra and a member of the Trustees of Villanova University. |
* Trustees have been determined to be "Interested Trustees" by virtue of, among other things, their affiliation with the trust or various entities under common control with FMR.
+ The information above includes each Trustee's principal occupation during the last five years and other information relating to the experience, attributes, and skills relevant to each Trustee's qualifications to serve as a Trustee, which led to the conclusion that each Trustee should serve as a Trustee for the fund.
Annual Report
Independent Trustees:
Correspondence intended for each Independent Trustee (that is, the Trustees other than the Interested Trustees) may be sent to Fidelity Investments, P.O. Box 55235, Boston, Massachusetts 02205-5235.
Name, Age; Principal Occupations and Other Relevant Experience+ |
Dennis J. Dirks (62) |
| Year of Election or Appointment: 2005 Prior to his retirement in May 2003, Mr. Dirks was Chief Operating Officer and a member of the Board of The Depository Trust & Clearing Corporation (DTCC). He also served as President, Chief Operating Officer, and Board member of The Depository Trust Company (DTC) and President and Board member of the National Securities Clearing Corporation (NSCC). In addition, Mr. Dirks served as Chief Executive Officer and Board member of the Government Securities Clearing Corporation, Chief Executive Officer and Board member of the Mortgage-Backed Securities Clearing Corporation, as a Trustee and a member of the Finance Committee of Manhattan College (2005-2008), and as a Trustee and a member of the Finance Committee of AHRC of Nassau County (2006-2008). Currently, Mr. Dirks serves as a member of the Board of Directors for The Brookville Center for Children's Services, Inc. (2009-present). |
Alan J. Lacy (56) |
| Year of Election or Appointment: 2008 Mr. Lacy serves as Senior Adviser (2007-present) of Oak Hill Capital Partners, L.P. (private equity). Mr. Lacy also served as Chief Executive Officer (2000-2005) and Vice Chairman (2005-2006) of Sears Holdings Corporation and Sears, Roebuck and Co. (retail). In addition, Mr. Lacy serves as a member of the Board of Directors of The Western Union Company (global money transfer, 2006-present) and Bristol-Myers Squibb Company (global pharmaceuticals, 2007-present). Mr. Lacy is Chairman (2008-present) and a member (2006-present) of the Board of Trustees of The National Parks Conservation Association. |
Ned C. Lautenbach (66) |
| Year of Election or Appointment: 2000 Mr. Lautenbach is Chairman of the Independent Trustees of the Equity and High Income Funds (2006-present). Mr. Lautenbach is an Advisory Partner of Clayton, Dubilier & Rice, Inc. (private equity investment, 2008-present) and was previously a Partner of Clayton, Dubilier & Rice, Inc. (1998-2008). Previously, Mr. Lautenbach was with the International Business Machines Corporation (IBM) from 1968 until his retirement in 1998. Mr. Lautenbach serves as a Director of Eaton Corporation (diversified industrial) as well as the Philharmonic Center for the Arts in Naples, Florida. Mr. Lautenbach is also a member of the Board of Trustees of Fairfield University (2005-present), as well as a member of the Council on Foreign Relations. Previously, Mr. Lautenbach served as a Director of Sony Corporation (2006-2007). |
Joseph Mauriello (65) |
| Year of Election or Appointment: 2008 Prior to his retirement in January 2006, Mr. Mauriello served in numerous senior management positions including Deputy Chairman and Chief Operating Officer (2004-2005), and Vice Chairman of Financial Services (2002-2004) of KPMG LLP US (professional services, 1965-2005). Mr. Mauriello currently serves as a member of the Board of Directors of XL Capital Ltd. (global insurance and re-insurance, 2006-present) and of Arcadia Resources Inc. (health care services and products, 2007-present). Previously, Mr. Mauriello served as a Director of the Hamilton Funds of the Bank of New York (2006-2007). |
Cornelia M. Small (66) |
| Year of Election or Appointment: 2005 Ms. Small is a member of the Board of Directors of the Teagle Foundation (2009-present). Ms. Small is also a member of the Investment Committee, and Chair (2008-present) and a member of the Board of Trustees of Smith College. In addition, Ms. Small serves on the Investment Committee of the Berkshire Taconic Community Foundation (2008-present). Previously, Ms. Small served as Chairperson of the Investment Committee (2002-2008) of Smith College. In addition, Ms. Small served as Chief Investment Officer, Director of Global Equity Investments, and a member of the Board of Directors of Scudder, Stevens & Clark and Scudder Kemper Investments. |
William S. Stavropoulos (71) |
| Year of Election or Appointment: 2002 Mr. Stavropoulos is Vice Chairman of the Independent Trustees of the Equity and High Income Funds (2006-present). Mr. Stavropoulos serves as President and Founder of the Michigan Baseball Foundation, the Great Lakes Loons (2007-present). Mr. Stavropoulos is Chairman Emeritus of the Board of Directors of The Dow Chemical Company, where he previously served in numerous senior management positions, including President, CEO (1995-2000; 2002-2004), Chairman of the Executive Committee (2000-2006), and as a member of the Board of Directors (1990-2006). Currently, Mr. Stavropoulos is a Director of Teradata Corporation (data warehousing and technology solutions, 2008-present), Chemical Financial Corporation, Maersk Inc. (industrial conglomerate), Tyco International, Inc. (multinational manufacturing and services, 2007-present), and a member of the Advisory Board for Metalmark Capital (private equity investment, 2005-present). Mr. Stavropoulos is a special advisor to Clayton, Dubilier & Rice, Inc. (private equity investment). In addition, Mr. Stavropoulos is a member of the University of Notre Dame Advisory Council for the College of Science. |
David M. Thomas (61) |
| Year of Election or Appointment: 2008 Previously, Mr. Thomas served as Executive Chairman (2005-2006) and Chairman and Chief Executive Officer (2000-2005) of IMS Health, Inc. (pharmaceutical and healthcare information solutions). In addition, Mr. Thomas serves as a member of the Board of Directors of Fortune Brands, Inc. (consumer products), and Interpublic Group of Companies, Inc. (marketing communication, 2004-present). |
Michael E. Wiley (59) |
| Year of Election or Appointment: 2008 Mr. Wiley also serves as a Director of Asia Pacific Exploration Consolidated (international oil and gas exploration and production, 2008-present), and as a member of the Board of Trustees of the University of Tulsa (2000-2006; 2007-present). Mr. Wiley serves as a Director of Tesoro Corporation (independent oil refiner and marketer, 2005-present), and a Director of Bill Barrett Corporation (exploration and production, 2005-present). In addition, Mr. Wiley also serves as a Director of Post Oak Bank (privately-held bank, 2004-present). Previously, Mr. Wiley served as a Sr. Energy Advisor of Katzenbach Partners, LLC (consulting, 2006-2007), as an Advisory Director of Riverstone Holdings (private investment), Chairman, President, and CEO of Baker Hughes, Inc. (oilfield services, 2000-2004), and as Director of Spinnaker Exploration Company (exploration and production, 2001-2005). |
Annual Report
Trustees and Officers - continued
+ The information above includes each Trustee's principal occupation during the last five years and other information relating to the experience, attributes, and skills relevant to each Trustee's qualifications to serve as a Trustee, which led to the conclusion that each Trustee should serve as a Trustee for the fund.
Advisory Board Member and Executive Officers:
Correspondence intended for each executive officer and Peter S. Lynch may be sent to Fidelity Investments, 82 Devonshire Street, Boston, Massachusetts 02109.
Name, Age; Principal Occupation |
Peter S. Lynch (66) |
| Year of Election or Appointment: 2003 Member of the Advisory Board of Fidelity's Equity and High Income Funds. Mr. Lynch is Vice Chairman and a Director of FMR and FMR Co., Inc. In addition, Mr. Lynch serves as a Trustee of Boston College and as the Chairman of the Inner-City Scholarship Fund. Previously, Mr. Lynch served on the Special Olympics International Board of Directors (1997-2006). |
Kenneth B. Robins (40) |
| Year of Election or Appointment: 2008 President and Treasurer of Fidelity's Equity and High Income Funds. Mr. Robins also serves as President and Treasurer (2010-present) and Assistant Treasurer (2009-present) of other Fidelity funds and is an employee of Fidelity Investments (2004-present). Previously, Mr. Robins served as Deputy Treasurer of the Fidelity funds (2005-2008) and Treasurer and Chief Financial Officer of The North Carolina Capital Management Trust: Cash and Term Portfolios (2006-2008). |
Brian B. Hogan (45) |
| Year of Election or Appointment: 2009 Vice President of certain Equity Funds and Vice President of Sector Funds. Mr. Hogan also serves as Senior Vice President, Equity Research of FMR (2006-present) and President of FMR's Equity Division (2009-present). Previously, Mr. Hogan served as a portfolio manager. |
Christopher S. Bartel (38) |
| Year of Election or Appointment: 2009 Vice President of Fidelity's Sector and Real Estate Equity Funds. Mr. Bartel also serves as Senior Vice President of Equity Research (2009-present). Previously, Mr. Bartel served as Managing Director of Research (2006-2009) and an analyst and portfolio manager (2000-2006). |
Scott C. Goebel (42) |
| Year of Election or Appointment: 2008 Secretary and Chief Legal Officer (CLO) of the Fidelity funds. Mr. Goebel also serves as General Counsel, Secretary, and Senior Vice President of FMR (2008-present) and FMR Co., Inc. (2008-present); Deputy General Counsel of FMR LLC; Chief Legal Officer of Fidelity Management & Research (Hong Kong) Limited (2008-present) and Assistant Secretary of Fidelity Management & Research (Japan) Inc. (2008-present), Fidelity Investments Money Management, Inc. (2008-present), Fidelity Management & Research (U.K.) Inc. (2008-present), and Fidelity Research and Analysis Company (2008-present). Previously, Mr. Goebel served as Assistant Secretary of the Funds (2007-2008) and as Vice President and Secretary of Fidelity Distributors Corporation (FDC) (2005-2007). |
William C. Coffey (41) |
| Year of Election or Appointment: 2009 Assistant Secretary of Fidelity's Equity and High Income Funds. Mr. Coffey also serves as Senior Vice President and Deputy General Counsel of FMR LLC (2010-present), and is an employee of Fidelity Investments. Previously, Mr. Coffey served as Vice President and Associate General Counsel of FMR LLC (2005-2009). |
Holly C. Laurent (56) |
| Year of Election or Appointment: 2008 Anti-Money Laundering (AML) Officer of the Fidelity funds. Ms. Laurent is an employee of Fidelity Investments. Previously, Ms. Laurent was Senior Vice President and Head of Legal for Fidelity Business Services India Pvt. Ltd. (2006-2008), and Senior Vice President, Deputy General Counsel and Group Head for FMR LLC (2005-2006). |
Christine Reynolds (51) |
| Year of Election or Appointment: 2008 Chief Financial Officer of the Fidelity funds. Ms. Reynolds became President of Fidelity Pricing and Cash Management Services (FPCMS) in August 2008. Ms. Reynolds served as Chief Operating Officer of FPCMS (2007-2008). Previously, Ms. Reynolds served as President, Treasurer, and Anti-Money Laundering officer of the Fidelity funds (2004-2007). |
Kenneth A. Rathgeber (63) |
| Year of Election or Appointment: 2004 Chief Compliance Officer of Fidelity's Equity and High Income Funds. Mr. Rathgeber is Chief Compliance Officer of Fidelity Management & Research (Hong Kong) Limited (2008-present), Fidelity Management & Research (Japan) Inc. (2008-present), FMR (2005-present), FMR Co., Inc. (2005-present), Fidelity Management & Research (U.K.) Inc. (2005-present), Fidelity Research & Analysis Company (2005-present), Fidelity Investments Money Management, Inc. (2005-present), Pyramis Global Advisors, LLC (2005-present), and Strategic Advisers, Inc. (2005-present). |
Jeffrey S. Christian (48) |
| Year of Election or Appointment: 2009 Deputy Treasurer of the Fidelity funds. Mr. Christian is an employee of Fidelity Investments. Previously, Mr. Christian served as Chief Financial Officer (2008-2009) of certain Fidelity funds and Senior Vice President of Fidelity Pricing and Cash Management Services (FPCMS) (2004-2009). |
Bryan A. Mehrmann (49) |
| Year of Election or Appointment: 2005 Deputy Treasurer of the Fidelity funds. Mr. Mehrmann is an employee of Fidelity Investments. |
Adrien E. Deberghes (42) |
| Year of Election or Appointment: 2008 Deputy Treasurer of Fidelity's Equity and High Income Funds. Mr. Deberghes also serves as Assistant Treasurer of other Fidelity funds (2010-present) and is an employee of Fidelity Investments (2008-present). Previously, Mr. Deberghes served as Senior Vice President of Mutual Fund Administration at State Street Corporation (2007-2008), Senior Director of Mutual Fund Administration at Investors Bank & Trust (2005-2007), and Director of Finance for Dunkin' Brands (2000-2005). |
Stephanie J. Dorsey (41) |
| Year of Election or Appointment: 2010 Assistant Treasurer of Fidelity's Equity and High Income Funds. Ms. Dorsey also serves as Deputy Treasurer of other Fidelity funds (2008-present) and is an employee of Fidelity Investments (2008-present). Previously, Ms. Dorsey served as Treasurer (2004-2008) of the JPMorgan Mutual Funds and Vice President (2004-2008) of JPMorgan Chase Bank. |
John R. Hebble (52) |
| Year of Election or Appointment: 2009 Assistant Treasurer of Fidelity's Equity and High Income Funds. Mr. Hebble also serves as Treasurer and Chief Financial Officer of The North Carolina Capital Management Trust: Cash and Term Portfolio (2008-present), President and Treasurer of other Fidelity funds (2008-present) and is an employee of Fidelity Investments. |
Gary W. Ryan (51) |
| Year of Election or Appointment: 2005 Assistant Treasurer of the Fidelity funds. Mr. Ryan is an employee of Fidelity Investments. Previously, Mr. Ryan served as Vice President of Fund Reporting in Fidelity Pricing and Cash Management Services (FPCMS) (1999-2005). |
Annual Report
A total of 0.13% of the dividends distributed during the fiscal year was derived from interest on U.S. Government securities which is generally exempt from state income tax.
The Retail Class designates 8% of the dividends distributed in March and June, during the fiscal year as qualifying for the dividends-received deduction for corporate shareholders.
The Retail Class designates 10% of dividends distributed in March and June, during the fiscal year as amounts which may be taken into account as a dividend for purposes of the maximum rate under section 1(h)(11) of the Internal Revenue Code.
The fund will notify shareholders in January 2011 of amounts for use in preparing 2010 income tax returns.
Annual Report
Board Approval of Investment Advisory Contracts and Management Fees
Fidelity Real Estate Income Fund
Each year, the Board of Trustees, including the Independent Trustees (together, the Board), votes on the renewal of the management contract and sub-advisory agreements (together, the Advisory Contracts) for the fund. The Board, assisted by the advice of fund counsel and Independent Trustees' counsel, requests and considers a broad range of information relevant to the renewal of the Advisory Contracts throughout the year.
The Board meets regularly and considers at each of its meetings factors that are relevant to its annual consideration of the renewal of the fund's Advisory Contracts, including the services and support provided to the fund and its shareholders. The Board has established various standing committees, each composed of Independent Trustees with varying backgrounds, to which the Board has assigned specific subject matter responsibilities in order to enhance effective decision-making by the Board. The Board, acting directly and through its Committees, requests and receives information concerning the annual consideration of the renewal of the fund's Advisory Contracts. The Board also meets as needed to consider matters specifically related to the Board's annual consideration of the renewal of Advisory Contracts. Members of the Board may also meet with trustees of other Fidelity funds through ad hoc joint committees to discuss certain matters relevant to the Fidelity funds.
At its July 2010 meeting, the Board of Trustees, including the Independent Trustees, unanimously determined to renew the fund's Advisory Contracts. In reaching its determination, the Board considered all factors it believed relevant, including (i) the nature, extent, and quality of the services to be provided to the fund and its shareholders (including the investment performance of the fund); (ii) the competitiveness of the fund's management fee and total expenses; (iii) the total costs of the services to be provided by and the profits to be realized by Fidelity from its relationship with the fund; (iv) the extent to which economies of scale would be realized as the fund grows; and (v) whether fee levels reflect these economies of scale, if any, for the benefit of fund shareholders.
In considering whether to renew the Advisory Contracts for the fund, the Board reached a determination, with the assistance of fund counsel and Independent Trustees' counsel and through the exercise of its business judgment, that the renewal of the Advisory Contracts is in the best interests of fund shareholders and that the compensation to be received by Fidelity under the management contract is fair and reasonable. The Board's decision to renew the Advisory Contracts was not based on any single factor noted above, but rather was based on a comprehensive consideration of all the information provided to the Board at its meetings throughout the year. The Board, in reaching its determination to renew the Advisory Contracts, is aware that shareholders in the fund have a broad range of investment choices available to them, including a wide choice among mutual funds offered by Fidelity's competitors, and that the fund's shareholders, with the opportunity to review and weigh the disclosure provided by the fund in its prospectus and other public disclosures, have chosen to invest in this fund, managed by Fidelity.
Annual Report
Nature, Extent, and Quality of Services Provided. The Board considered the staffing within the investment adviser, FMR, and the sub-advisers (together, the Investment Advisers), including the backgrounds of the fund's investment personnel and the fund's investment objective and discipline. The Independent Trustees also had discussions with senior management of Fidelity's investment operations and investment groups. The Board considered the structure of the portfolio manager compensation program and whether this structure provides appropriate incentives to act in the best interest of the fund.
Resources Dedicated to Investment Management and Support Services. The Board and the equity research subcommittee of the Board's Fund Oversight Committee reviewed the size, education, and experience of the Investment Advisers' investment staff, their use of technology, and the Investment Advisers' approach to recruiting, training, and retaining portfolio managers and other research, advisory, and management personnel. The Board noted that Fidelity's analysts have access to a variety of technological tools and market and securities data that enable them to perform both fundamental and quantitative analysis and to specialize in various disciplines. The Board considered Fidelity's extensive global research capabilities that enable the Investment Advisers to aggregate data from various sources in an effort to produce positive investment results. The Board also considered that Fidelity's portfolio managers and analysts have access to daily portfolio attribution that allows for monitoring of a fund's portfolio, as well as an electronic communication system that provides immediate real-time access to research concerning issuers and credit enhancers. The Board noted FMR's continued focus on strengthening the organization and discipline of equity portfolio management and research.
Shareholder and Administrative Services. The Board considered (i) the nature, extent, quality, and cost of advisory, administrative, and shareholder services performed by the Investment Advisers and their affiliates under the Advisory Contracts and under separate agreements covering transfer agency, pricing and bookkeeping, and securities lending services for the fund; (ii) the nature and extent of the investment adviser's supervision of third party service providers, principally custodians and subcustodians; and (iii) the resources devoted to, and the record of compliance with, the fund's compliance policies and procedures. The Board also reviewed the allocation of fund brokerage, including allocations to brokers affiliated with the Investment Advisers, the use of brokerage commissions to pay fund expenses, and the use of "soft" commission dollars to pay for research services.
The Board noted that the growth of fund assets over time across the complex allows Fidelity to reinvest in the development of services designed to enhance the value or convenience of the Fidelity funds as investment vehicles. These services include 24-hour access to account information and market information through phone representatives and over the Internet, and investor education materials and asset allocation tools.
Annual Report
Board Approval of Investment Advisory Contracts and
Management Fees - continued
Investment in a Large Fund Family. The Board considered the benefits to shareholders of investing in a Fidelity fund, including the benefits of investing in a fund that is part of a large family of funds offering a variety of investment disciplines and providing a large variety of mutual fund investor services. The Board noted that Fidelity had taken, or had made recommendations that resulted in the Fidelity funds taking, a number of actions over the previous year that benefited particular funds, including (i) dedicating additional resources to investment research and restructuring and broadening the focus of the investment research teams; (ii) bolstering the senior management team that oversees asset management; (iii) launching Class F of certain funds as a lower-fee class available to Freedom K and Freedom Index Funds; (iv) lowering the initial investment minimums and ongoing balance requirements for Real Estate High Income Fund; (v) eliminating subsequent purchase minimums for all funds and adding a waiver of the investment minimum requirement for new accounts opened with the proceeds of a systematic withdrawal plan; (vi) eliminating the withdrawal minimum and maximum limits for systematic withdrawals from Advisor funds; (vii) expanding sales load waivers on Class A shares for Destiny Planholders and expanding Institutional Class eligibility for Class O Destiny Planholders; and (viii) changing certain Class A and Class T sales charge structures to further align them with industry practices.
Investment Performance. The Board considered whether the fund has operated in accordance with its investment objective, as well as its record of compliance with its investment restrictions. It also reviewed the fund's absolute investment performance, as well as the fund's relative investment performance measured over multiple periods against (i) a proprietary custom index, and (ii) a peer group of mutual funds and reviewed by the Board. The following charts considered by the Board show, over the one-, three-, and five-year periods ended December 31, 2009, the fund's cumulative total returns, the cumulative total returns of a proprietary custom index ("benchmark"), and a range of cumulative total returns of a peer group of mutual funds identified by Lipper Inc. as having an investment objective similar to that of the fund. (The fund did not offer Advisor classes as of December 31, 2009). The box within each chart shows the 25th percentile return (bottom of box) and the 75th percentile return (top of box) of the peer group. Returns shown above the box are in the first quartile and returns shown below the box are in the fourth quartile. The percentage beaten number noted below each chart corresponds to the percentile box and represents the percentage of funds in the peer group whose performance was equal to or lower than that of the fund. The fund's proprietary custom index is an index developed by FMR that represents the performance of the fund's unmanaged indexes.
Annual Report
Fidelity Real Estate Income Fund
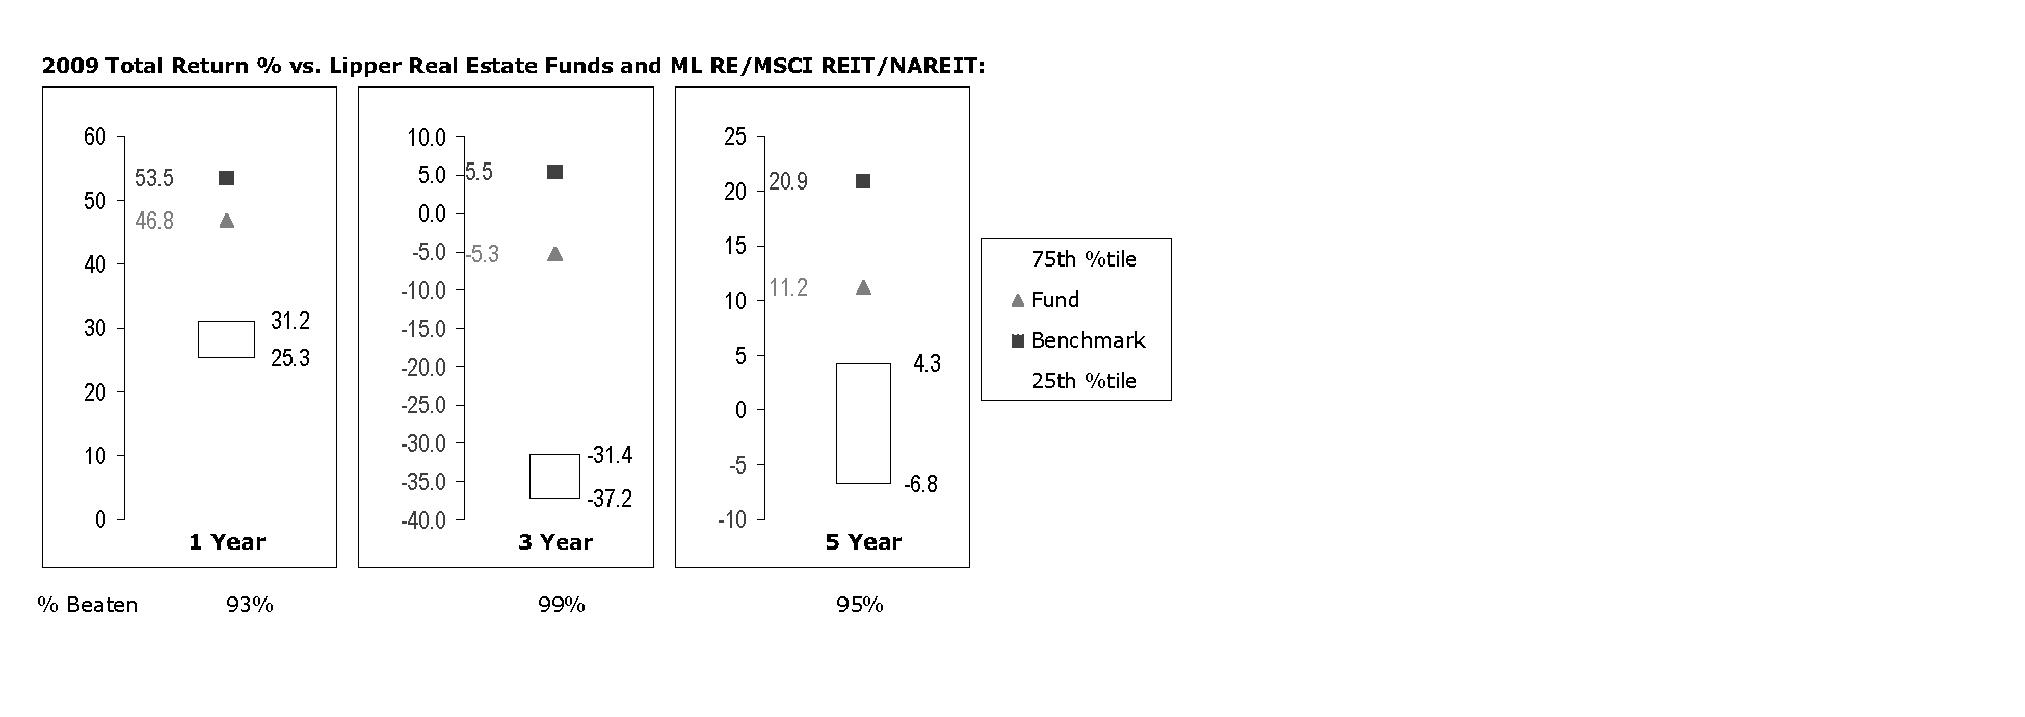
The Board reviewed the fund's relative investment performance against its peer group and noted that the performance of the fund was in the first quartile for all the periods shown. The Board noted that FMR does not consider that peer group to be a particularly meaningful comparison for the fund, however, because unlike many of its peers, which invest primarily in common stocks of real estate companies, the fund invests primarily in common, preferred and debt securities of real estate entities. The Board also noted that the investment performance of the fund was lower than its benchmark for all the periods shown. The Board also reviewed the fund's performance since inception as well as performance in the current year.
Based on its review, and giving particular weight to the nature and quality of the resources dedicated by the Investment Advisers to maintain and improve relative performance and factoring in the unprecedented market events in recent years, the Board concluded that the nature, extent, and quality of investment management and support services and of shareholder and administrative services provided to the fund will benefit the fund's shareholders, particularly in light of the Board's view that the fund's shareholders benefit from investing in a fund that is part of a large family of funds offering a variety of investment disciplines and services.
Competitiveness of Management Fee and Total Fund Expenses. The Board considered the fund's management fee and total expenses compared to "mapped groups" of competitive funds and classes. Fidelity creates "mapped groups" by combining similar Lipper investment objective categories that have comparable management fee characteristics. Combining Lipper investment objective categories aids the Board's management fee and total expense comparisons by broadening the competitive group used for comparison and by reducing the number of universes to which various Fidelity funds are compared.
Annual Report
Board Approval of Investment Advisory Contracts and
Management Fees - continued
Management Fee. The Board considered two proprietary management fee comparisons for the 12-month periods shown in the chart below. The group of Lipper funds used by the Board for management fee comparisons is referred to below as the "Total Mapped Group." The Total Mapped Group is broader than the Lipper peer group used by the Board for performance comparisons because the Total Mapped Group combines several Lipper investment objective categories while the Lipper peer group does not. The Total Mapped Group comparison focuses on a fund's standing relative to the total universe of comparable funds available to investors, in terms of gross management fees before expense reimbursements or caps. "TMG %" represents the percentage of funds in the Total Mapped Group that had management fees that were lower than the fund's. For example, a TMG % of 8% means that 92% of the funds in the Total Mapped Group had higher management fees than the fund. The "Asset-Size Peer Group" (ASPG) comparison focuses on a fund's standing relative to non-Fidelity funds similar in size to the fund within the Total Mapped Group. The ASPG represents at least 15% of the funds in the Total Mapped Group with comparable asset size and management fee characteristics, subject to a minimum of 50 funds (or all funds in the Total Mapped Group if fewer than 50). Additional information, such as the ASPG quartile in which the fund's management fee ranked, is also included in the chart and considered by the Board.
Fidelity Real Estate Income Fund

Annual Report
The Board noted that the fund's management fee ranked below the median of its Total Mapped Group and below the median of its ASPG for 2009.
Based on its review, the Board concluded that the fund's management fee is fair and reasonable in light of the services that the fund receives and the other factors considered.
Total Expenses. In its review of the fund's total expenses, the Board considered the fund's management fee as well as other fund expenses, such as transfer agent fees, pricing and bookkeeping fees, and custodial, legal, and audit fees. The Board also noted the effects of any waivers and reimbursements on fees and expenses. As part of its review, the Board also considered current and historical total expenses of the fund compared to competitive fund median expenses. The fund is compared to those funds and classes in the Total Mapped Group (used by the Board for management fee comparisons) that have a similar sales load structure.
The Board noted that the fund's total expenses ranked below its competitive median for 2009.
Fees Charged to Other Fidelity Clients. The Board also considered Fidelity fee structures and other information with respect to clients of FMR and its affiliates, such as other mutual funds advised or subadvised by FMR or its affiliates, pension plan clients, and other institutional clients. In March 2010, the Board created an ad hoc joint committee with the board of other Fidelity funds (the Committee) to review and compare Fidelity's institutional investment advisory business with its business of providing services to the Fidelity funds, including the differences in services provided, fees charged, and costs incurred, as well as competition in their respective marketplaces.
Based on its review of total expenses and fees charged to other Fidelity clients, the Board concluded that the fund's total expenses were reasonable in light of the services that the fund and its shareholders receive and the other factors considered, including the findings of the Committee.
Costs of the Services and Profitability. The Board considered the revenues earned and the expenses incurred by Fidelity in conducting the business of developing, marketing, distributing, managing, administering and servicing the fund and its shareholders. The Board also considered the level of Fidelity's profits in respect of all the Fidelity funds.
On an annual basis, FMR presents to the Board Fidelity's profitability for the fund. Fidelity calculates the profitability for each fund, as well as aggregate profitability for groups of Fidelity funds and all Fidelity funds, using a series of detailed revenue and cost allocation methodologies which originate with the audited books and records of Fidelity. The Audit Committee of the Board reviews any significant changes from the prior year's methodologies.
Annual Report
Board Approval of Investment Advisory Contracts and
Management Fees - continued
PricewaterhouseCoopers LLP (PwC), independent registered public accounting firm and auditor to Fidelity and certain Fidelity funds, has been engaged annually by the Board as part of the Board's assessment of Fidelity's profitability analysis. PwC's engagement includes the review and assessment of Fidelity's methodologies used in determining the revenues and expenses attributable to Fidelity's mutual fund business, and completion of agreed-upon procedures surrounding the mathematical accuracy of fund profitability and its conformity to allocation methodologies. After considering PwC's reports issued under the engagement and information provided by Fidelity, the Board believes that while other allocation methods may also be reasonable, Fidelity's profitability methodologies are reasonable in all material respects.
The Board has also reviewed Fidelity's non-fund businesses and fall-out benefits related to the mutual fund business as well as cases where Fidelity's affiliates may benefit from or be related to the fund's business.
The Board considered the costs of the services provided by and the profits realized by Fidelity in connection with the operation of the fund and were satisfied that the profitability was not excessive in the circumstances.
Economies of Scale. The Board considered whether there have been economies of scale in respect of the management of the Fidelity funds, whether the Fidelity funds (including the fund) have appropriately benefited from any such economies of scale, and whether there is potential for realization of any further economies of scale. The Board considered the extent to which the fund will benefit from economies of scale through increased services to the fund, through waivers or reimbursements, or through fee or expense reductions.
In February 2009, the Board and the board of other Fidelity funds created an ad hoc committee (the Economies of Scale Committee) to analyze whether FMR attains economies of scale in respect of the management and servicing of the Fidelity funds, whether the Fidelity funds have appropriately benefited from such economies of scale, and whether there is potential for realization of any further economies of scale.
The Board recognized that the fund's management contract incorporates a "group fee" structure, which provides for lower group fee rates as total fund assets under FMR's management increase, and for higher group fee rates as total fund assets under FMR's management decrease. FMR calculates the group fee rates based on a tiered asset "breakpoint" schedule that varies based on asset class. The Board considered that the group fee is designed to deliver the benefits of economies of scale to fund shareholders when total Fidelity fund assets increase, even if assets of any particular fund are unchanged or have declined, because some portion of Fidelity's costs are attributable to services provided to all Fidelity funds, and all funds benefit if those costs can be allocated among more assets. The Board concluded that, given the group fee structure, fund shareholders will benefit from lower management fees as assets under FMR's management increase at the fund complex level, regardless of whether Fidelity achieves any such economies of scale.
Annual Report
The Board concluded, considering the findings of the Economies of Scale Committee, that any potential economies of scale are being appropriately shared between fund shareholders and Fidelity.
Additional Information Requested by the Board. In order to develop fully the factual basis for consideration of the Fidelity funds' Advisory Contracts, the Board requested and received additional information on certain topics, including (i) fund performance trends, actions to be taken by FMR to improve certain funds' overall performance, and Fidelity's long-term strategies for certain funds; (ii) portfolio manager changes that have occurred during the past year and length of portfolio manager tenure for different categories of funds over time; (iii) Fidelity's compensation structure for portfolio managers, research analysts, and other key personnel, the rationale for the compensation structure, and how the compensation structure provides appropriate performance incentives; (iv) the amount of the investment that each portfolio manager has made in the Fidelity fund(s) that he or she manages; (v) management and other fees paid by FMR to affiliated sub-advisers on behalf of the Fidelity funds; (vi) Fidelity's fee structures and rationale for recommending different fees among different categories of funds; (vii) Fidelity's rationale for recommending which funds should have a performance adjustment component as part of their management fees; (viii) the rationale for any differences between fund fee structures and fee structures in place for other Fidelity clients; and (ix) explanations regarding the relative total expenses borne by certain funds and classes, total expense competitive trends, and actions that might be taken by FMR to reduce total expenses for certain funds and classes.
Based on its evaluation of all of the conclusions noted above, and after considering all factors it believed relevant, the Board ultimately concluded that the advisory fee structures are fair and reasonable, and that the fund's Advisory Contracts should be renewed.
Annual Report
Managing Your Investments
Fidelity offers several ways to conveniently manage your personal investments via your telephone or PC. You can access your account information, conduct trades and research your investments 24 hours a day.
By Phone
Fidelity Automated Service Telephone provides a single toll-free number to access account balances, positions, quotes and trading. It's easy to navigate the service, and on your first call, the system will help you create a personal identification number (PIN) for security.
(phone_graphic)
Fidelity Automated
Service Telephone (FAST®)
1-800-544-5555
Press
For mutual fund and brokerage trading.
For quotes.*
For account balances and holdings.
To review orders and mutual
fund activity.
To change your PIN.
To speak to a Fidelity representative.
By PC
Fidelity's web site on the Internet provides a wide range of information, including daily financial news, fund performance, interactive planning tools and news about Fidelity products and services.
(computer_graphic)
Fidelity's Web Site
www.fidelity.com
* When you call the quotes line, please remember that a fund's yield and return will vary and, except for money market funds, share price will also vary. This means that you may have a gain or loss when you sell your shares. There is no assurance that money market funds will be able to maintain a stable $1 share price; an investment in a money market fund is not insured or guaranteed by the U.S. government. Total returns are historical and include changes in share price, reinvestment of dividends and capital gains, and the effects of any sales charges.
Annual Report
To Visit Fidelity
For directions and hours,
please call 1-800-544-9797.
Arizona
7001 West Ray Road
Chandler, AZ
15445 N. Scottsdale Road
Scottsdale, AZ
17550 North 75th Avenue
Glendale, AZ
5330 E. Broadway Blvd
Tucson, AZ
California
815 East Birch Street
Brea, CA
1411 Chapin Avenue
Burlingame, CA
851 East Hamilton Avenue
Campbell, CA
601 Larkspur Landing Circle
Larkspur, CA
2000 Avenue of the Stars
Los Angeles, CA
27101 Puerta Real
Mission Viejo, CA
73575 El Paseo
Palm Desert, CA
251 University Avenue
Palo Alto, CA
123 South Lake Avenue
Pasadena, CA
16656 Bernardo Ctr. Drive
Rancho Bernardo, CA
1220 Roseville Parkway
Roseville, CA
1740 Arden Way
Sacramento, CA
7676 Hazard Center Drive
San Diego, CA
11943 El Camino Real
San Diego, CA
8 Montgomery Street
San Francisco, CA
3793 State Street
Santa Barbara, CA
1200 Wilshire Boulevard
Santa Monica, CA
398 West El Camino Real
Sunnyvale, CA
111 South Westlake Blvd
Thousand Oaks, CA
21701 Hawthorne Boulevard
Torrance, CA
2001 North Main Street
Walnut Creek, CA
6326 Canoga Avenue
Woodland Hills, CA
2211 Michelson Drive
Irvine, CA
Colorado
281 East Flatiron Circle
Broomfield, CO
1625 Broadway
Denver, CO
9185 Westview Road
Lone Tree, CO
Connecticut
48 West Putnam Avenue
Greenwich, CT
265 Church Street
New Haven, CT
300 Atlantic Street
Stamford, CT
29 South Main Street
West Hartford, CT
1261 Post Road
Fairfield, CT
Delaware
400 Delaware Avenue
Wilmington, DE
Florida
175 East Altamonte Drive
Altamonte Springs, FL
1400 Glades Road
Boca Raton, FL
121 Alhambra Plaza
Coral Gables, FL
2948 N. Federal Highway
Ft. Lauderdale, FL
4671 Town Center Parkway
Jacksonville, FL
8880 Tamiami Trail, North
Naples, FL
230 Royal Palm Way
Palm Beach, FL
3501 PGA Boulevard
Palm Beach Gardens, FL
3550 Tamiami Trail, South
Sarasota, FL
1502 N. Westshore Blvd.
Tampa, FL
2465 State Road 7
Wellington, FL
Georgia
3242 Peachtree Road
Atlanta, GA
1000 Abernathy Road
Atlanta, GA
Illinois
One North LaSalle Street
Chicago, IL
401 North Michigan Avenue
Chicago, IL
One Skokie Valley Road
Highland Park, IL
1415 West 22nd Street
Oak Brook, IL
15105 S LaGrange Road
Orland Park, IL
1572 East Golf Road
Schaumburg, IL
1823 Freedom Drive
Naperville, IL
Indiana
8480 Keystone Crossing
Indianapolis, IN
Kansas
5400 College Boulevard
Overland Park, KS
Maine
Three Canal Plaza
Portland, ME
Maryland
7315 Wisconsin Avenue
Bethesda, MD
610 York Road
Towson, MD
Massachusetts
801 Boylston Street
Boston, MA
155 Congress Street
Boston, MA
300 Granite Street
Braintree, MA
44 Mall Road
Burlington, MA
238 Main Street
Cambridge, MA
200 Endicott Street
Danvers, MA
Fidelity Brokerage Services, Inc., 100 Summer St., Boston, MA 02110 Member NYSE/SIPC
Annual Report
405 Cochituate Road
Framingham, MA
551 Boston Turnpike
Shrewsbury, MA
Michigan
500 E. Eisenhower Pkwy.
Ann Arbor, MI
280 N. Old Woodward Ave.
Birmingham, MI
30200 Northwestern Hwy.
Farmington Hills, MI
43420 Grand River Avenue
Novi, MI
3480 28th Street
Grand Rapids, MI
2425 S. Linden Road STE E
Flint, MI
Minnesota
7740 France Avenue South
Edina, MN
8342 3rd Street North
Oakdale, MN
Missouri
1524 South Lindbergh Blvd.
St. Louis, MO
Nevada
2225 Village Walk Drive
Henderson, NV
New Jersey
501 Route 73 South
Marlton, NJ
150 Essex Street
Millburn, NJ
35 Morris Street
Morristown, NJ
396 Route 17, North
Paramus, NJ
3518 Route 1 North
Princeton, NJ
530 Broad Street
Shrewsbury, NJ
New Mexico
2261 Q Street NE
Albuquerque, NM
New York
1130 Franklin Avenue
Garden City, NY
37 West Jericho Turnpike
Huntington Station, NY
1271 Avenue of the Americas
New York, NY
980 Madison Avenue
New York, NY
61 Broadway
New York, NY
350 Park Avenue
New York, NY
200 Fifth Avenue
New York, NY
733 Third Avenue
New York, NY
2070 Broadway
New York, NY
1075 Northern Blvd.
Roslyn, NY
799 Central Park Avenue
Scarsdale, NY
3349 Monroe Avenue
Rochester, NY
North Carolina
4611 Sharon Road
Charlotte, NC
7011 Fayetteville Road
Durham, NC
Ohio
3805 Edwards Road
Cincinnati, OH
1324 Polaris Parkway
Columbus, OH
1800 Crocker Road
Westlake, OH
28699 Chagrin Boulevard
Woodmere Village, OH
Oregon
7493 SW Bridgeport Road
Tigard, OR
Pennsylvania
600 West DeKalb Pike
King of Prussia, PA
1735 Market Street
Philadelphia, PA
12001 Perry Highway
Wexford, PA
Rhode Island
10 Memorial Boulevard
Providence, RI
Tennessee
3018 Peoples Street
Johnson City, TN
7628 West Farmington Blvd.
Germantown, TN
2035 Mallory Lane
Franklin, TN
Texas
10000 Research Boulevard
Austin, TX
4001 Northwest Parkway
Dallas, TX
12532 Memorial Drive
Houston, TX
2701 Drexel Drive
Houston, TX
6560 Fannin Street
Houston, TX
1701 Lake Robbins Drive
The Woodlands, TX
6500 N. MacArthur Blvd.
Irving, TX
6005 West Park Boulevard
Plano, TX
1576 East Southlake Blvd.
Southlake, TX
15600 Southwest Freeway
Sugar Land, TX
139 N. Loop 1604 East
San Antonio, TX
Utah
279 West South Temple
Salt Lake City, UT
Virginia
1861 International Drive
McLean, VA
11957 Democracy Drive
Reston, VA
Washington
10500 NE 8th Street
Bellevue, WA
1518 6th Avenue
Seattle, WA
304 Strander Blvd
Tukwila, WA
Washington, DC
1900 K Street, N.W.
Washington, DC
Wisconsin
16020 West Bluemound Road
Brookfield, WI
Annual Report
To Write Fidelity
We'll give your correspondence immediate attention and send you written confirmation upon completion of your request.
(letter_graphic)
Making Changes
To Your Account
(such as changing name, address, bank, etc.)
Fidelity Investments
P.O. Box 770001
Cincinnati, OH 45277-0002
(letter_graphic)
For Non-Retirement
Accounts
Buying shares
Fidelity Investments
P.O. Box 770001
Cincinnati, OH 45277-0003
Overnight Express
Fidelity Investments
Attn: Distribution Services
100 Crosby Parkway - KC1H
Covington, KY 41015
Selling shares
Fidelity Investments
P.O. Box 770001
Cincinnati, OH 45277-0035
Overnight Express
Fidelity Investments
Attn: Distribution Services
100 Crosby Parkway - KC1H
Covington, KY 41015
General Correspondence
Fidelity Investments
P.O. Box 500
Merrimack, NH 03054-0500
(letter_graphic)
For Retirement
Accounts
Buying shares
Fidelity Investments
P.O. Box 770001
Cincinnati, OH 45277-0003
Selling shares
Fidelity Investments
P.O. Box 770001
Cincinnati, OH 45277-0035
Overnight Express
Fidelity Investments
Attn: Distribution Services
100 Crosby Parkway - KC1H
Covington, KY 41015
General Correspondence
Fidelity Investments
P.O. Box 500
Merrimack, NH 03054-0500
Annual Report
Investment Adviser
Fidelity Management & Research Company
Boston, MA
Investment Sub-Advisers
FMR Co., Inc.
Fidelity Research & Analysis Company
Fidelity Management & Research
(U.K.) Inc.
Fidelity Management & Research
(Hong Kong) Limited
Fidelity Management & Research
(Japan) Inc.
General Distributor
Fidelity Distributors Corporation
Boston, MA
Transfer and Service Agents
Fidelity Investments Institutional
Operations Company, Inc.
Boston, MA
Fidelity Service Company, Inc.
Boston, MA
Custodian
Citibank, N.A.
New York, NY
The Fidelity Telephone Connection
Mutual Fund 24-Hour Service
Exchanges/Redemptions
and Account Assistance 1-800-544-6666
Product Information 1-800-544-6666
Retirement Accounts 1-800-544-4774
(8 a.m. - 9 p.m.)
TDD Service 1-800-544-0118
for the deaf and hearing impaired
(9 a.m. - 9 p.m. Eastern time)
Fidelity Automated Service
Telephone (FAST®) 1-800-544-5555
Automated line for quickest service
REI-UANN-0910
1.789710.107
(Fidelity Investment logo)(registered trademark)
Fidelity Advisor
Real Estate Income
Fund - Class A, Class T, and Class C
Annual Report
July 31, 2010
(2_fidelity_logos) (Registered_Trademark)
Class A , Class T, and
Class C are classes of Fidelity® Real Estate Income Fund
Contents
Chairman's Message | <Click Here> | The Chairman's message to shareholders. |
Performance | <Click Here> | How the fund has done over time. |
Management's Discussion of Fund Performance | <Click Here> | The Portfolio Manager's review of fund
performance and strategy. |
Shareholder Expense Example | <Click Here> | An example of shareholder expenses. |
Investment Summary | <Click Here> | A summary of the fund's holdings. |
Investments | <Click Here> | A complete list of the fund's investments with their market values. |
Financial Statements | <Click Here> | Statements of assets and liabilities, operations, and changes in net assets,
as well as financial highlights. |
Notes | <Click Here> | Notes to the financial statements. |
Report of Independent Registered Public Accounting Firm | <Click Here> | |
Trustees and Officers | <Click Here> | |
Distributions | <Click Here> | |
Board Approval of Investment Advisory Contracts and Management Fees | <Click Here> | |
To view a fund's proxy voting guidelines and proxy voting record for the 12-month period ended June 30, visit http://www.fidelity.com/proxyvotingresults or visit the Securities and Exchange Commission's (SEC) web site at http://www.sec.gov. You may also call 1-877-208-0098 to request a free copy of the proxy voting guidelines.
Standard & Poor's, S&P and S&P 500 are registered service marks of The McGraw-Hill Companies, Inc. and have been licensed for use by Fidelity Distributors Corporation.
Other third party marks appearing herein are the property of their respective owners.
All other marks appearing herein are registered or unregistered trademarks or service marks of FMR LLC or an affiliated company.
Annual Report
This report and the financial statements contained herein are submitted for the general information of the shareholders of the fund. This report is not authorized for distribution to prospective investors in the fund unless preceded or accompanied by an effective prospectus.
A fund files its complete schedule of portfolio holdings with the SEC for the first and third quarters of each fiscal year on Form N-Q. Forms N-Q are available on the SEC's web site at http://www.sec.gov. A fund's Forms N-Q may be reviewed and copied at the SEC's Public Reference Room in Washington, DC. Information regarding the operation of the SEC's Public Reference Room may be obtained by calling 1-800-SEC-0330. For a complete list of a fund's portfolio holdings, view the most recent holdings listing, semiannual report, or annual report on Fidelity's web site at http://www.fidelity.com or http://www.advisor.fidelity.com, as applicable.
NOT FDIC INSURED • MAY LOSE VALUE • NO BANK GUARANTEE
Neither the fund nor Fidelity Distributors Corporation is a bank.
Annual Report
(photo_of_Edward_C_Johnson_3d)
Dear Shareholder:
A yearlong uptrend in global equity markets reversed course in late April 2010 when investor sentiment turned bearish due in great measure to concern that Europe's debt crisis would expand and slow or derail economic recovery. However, a bounceback in July helped to recover some of the ground that was lost. Financial markets are always unpredictable, of course, but there also are several time-tested investment principles that can help put the odds in your favor.
One of the basic tenets is to invest for the long term. Over time, riding out the markets' inevitable ups and downs has proven much more effective than selling into panic or chasing the hottest trend. Even missing only a few of the markets' best days can significantly diminish investor returns. Patience also affords the benefits of compounding - of earning interest on additional income or reinvested dividends and capital gains. There can be tax advantages and cost benefits to consider as well. While staying the course doesn't eliminate risk, it can considerably lessen the effect of short-term declines.
You can further manage your investing risk through diversification. And today, more than ever, geographic diversification should be taken into account. Studies indicate that asset allocation is the single most important determinant of a portfolio's long-term success. The right mix of stocks, bonds and cash - aligned to your particular risk tolerance and investment objective - is very important. Age-appropriate rebalancing is also an essential aspect of asset allocation. For younger investors, an emphasis on equities - which historically have been the best-performing asset class over time - is encouraged. As investors near their specific goal, such as retirement or sending a child to college, consideration may be given to replacing volatile assets (e.g. common stocks) with more-stable fixed investments (bonds or savings plans).
A third principle - investing regularly - can help lower the average cost of your purchases. Investing a certain amount of money each month or quarter helps ensure you won't pay for all your shares at market highs. This strategy - known as dollar cost averaging - also reduces "emotion" from investing, helping shareholders avoid selling weak performers just prior to an upswing, or chasing a hot performer just before a correction.
We invite you to contact us via the Internet, through our Investor Centers or by phone. It is our privilege to provide you the information you need to make the investments that are right for you.
Sincerely,
(The chairman's signature appears here.)
Edward C. Johnson 3d
Annual Report
Average annual total return reflects the change in the value of an investment, assuming reinvestment of the class' distributions from dividend income and capital gains (the profits earned upon the sale of securities that have grown in value, if any) and assuming a constant rate of performance each year. The $10,000 table and the fund's returns do not reflect the deduction of taxes that a shareholder would pay on fund distributions or the redemption of fund shares. During periods of reimbursement by Fidelity, a fund's total return will be greater than it would be had the reimbursement not occurred. How a fund did yesterday is no guarantee of how it will do tomorrow.
Average Annual Total Returns
Periods ended July 31, 2010 | Past 1
year | Past 5
years | Life of
fundA |
Class A (incl. 4.00% sales charge) B | 23.05% | 2.32% | 6.00% |
Class T (incl. 4.00% sales charge) C | 23.03% | 2.32% | 6.00% |
Class C (incl. contingent deferred sales charge)D | 26.96% | 3.12% | 6.56% |
A From February 4, 2003.
B The initial offering of Class A shares took place on April 14, 2010. Returns prior to April 14, 2010 are those of Fidelity® Real Estate Income Fund, the original class of the fund, which has no 12b-1 fee. Had Class A's 12b-1 fee been reflected, returns prior to April 14, 2010 would have been lower.
C The initial offering of Class T shares took place on April 14, 2010. Returns prior to April 14, 2010 are those of Fidelity Real Estate Income Fund, the original class of the fund, which has no 12b-1 fee. Had Class T's 12b-1 fee been reflected, returns prior to April 14, 2010 would have been lower.
D The initial offering of Class C shares took place on April 14, 2010. Returns prior to April 14, 2010 are those of Fidelity Real Estate Income Fund, the original class of the fund, which has no 12b-1 fee. Had Class C's 12b-1 fee been reflected, returns prior to April 14, 2010 would have been lower. Class C shares' contingent deferred sales charges included in the past one year, past five years, and life of fund total return figures are 1%, 0%, and 0%, respectively.
Annual Report
$10,000 Over Life of Fund
Let's say hypothetically that $10,000 was invested in Fidelity® Advisor Real Estate Income Fund - Class A on February 4, 2003, when the fund started, and the current 4.00% sales charge was paid. The chart shows how the value of your investment would have changed, and also shows how the S&P 500® Index performed over the same period. The initial offering of Class A took place on April 14, 2010. See the previous page for additional information regarding the performance of Class A.
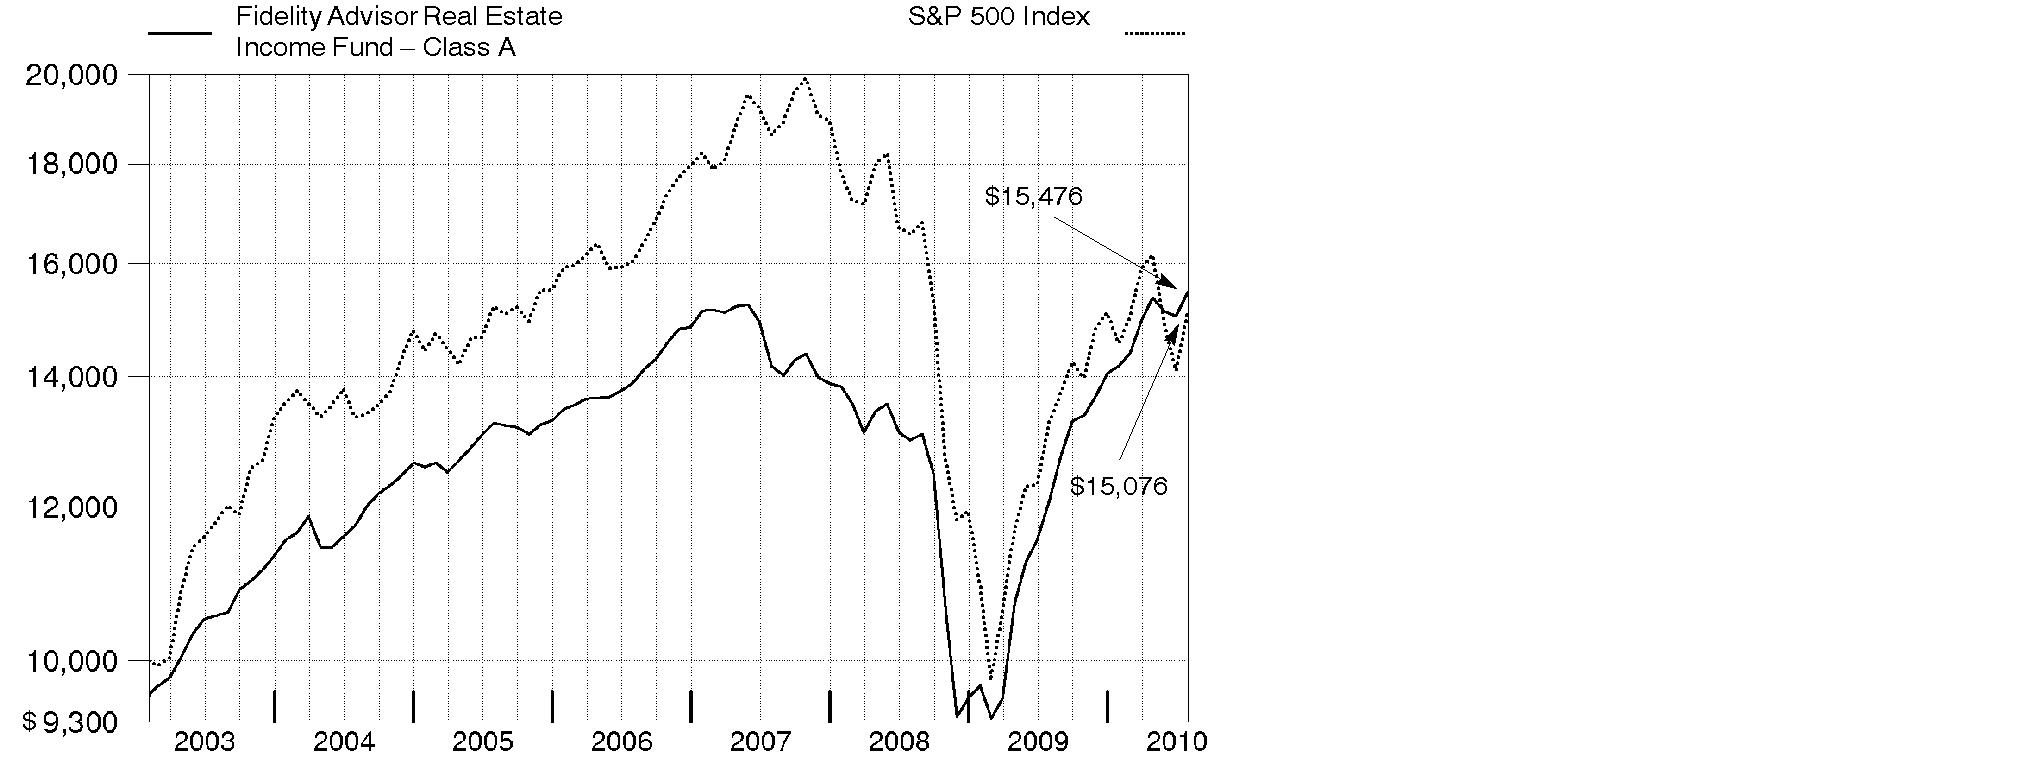
Annual Report
Market Recap: The 12 months ending July 31, 2010, reflected a gradual return to historical norms for investors in real estate stocks and bonds. Commercial property values, which significantly declined in 2008 and early 2009, stabilized and even began to increase modestly, benefiting from very low interest rates and better economic conditions. In addition, the income that commercial properties generated looked reasonable compared with U.S. Treasuries and other bond alternatives. Overall, property-related securities benefited from strengthening fundamentals. For example, in recent months, rents and occupancy rates in apartments and hotels started to improve, while rental rates for office properties stopped going down. For the year, The BofA Merrill Lynch U.S. Real Estate IndexSM - a market-capitalization-weighted measure of the performance of investment-grade public debt of corporate issuers in the domestic real estate sector - rose 22.94%. Real estate investment trusts (REITs) did the best, increasing 48.68%, as measured by the FTSE NAREIT All REIT Index. Both real estate bonds and stocks performed considerably better than the S&P 500® Index, a proxy for the broad U.S. equity market, which returned 13.84%.
Comments from Mark Snyderman, Portfolio Manager of Fidelity Advisor Real Estate Income Fund: For the year, the fund's Class A, Class T and Class C shares (excluding sales charges) trailed the Fidelity Real Estate Income Composite Index - a 40/40/20 blend of the MSCI® REIT Preferred Index, The BofA Merrill Lynch U.S. Real Estate Index and the FTSE NAREIT index, respectively - which returned 33.67%. Overall, however, I'm pleased to have helped shareholders make a very good return in the past year. (For specific class-level results, please see the performance section of this report.) The fund's much smaller allocation to preferred stocks was the main reason for its underperformance of the Composite index. The fund's common and preferred stocks, real estate bonds and commercial mortgage-backed securities (CMBS) all turned in a healthy double-digit gain. Common stocks did the best, rising nearly 50%, slightly ahead of the FTSE NAREIT index. The portfolio's preferred stocks modestly outpaced the MSCI index's roughly 36% return. My real estate bond investments returned close to 20% overall, slightly lagging the BofA Merrill Lynch index because I tend to favor lower-duration securities - meaning those with less interest-rate sensitivity. The fund's CMBS allocation added nicely to returns. My holdings in this group - about 21% of the portfolio, on average - rose more than 35%.
The views expressed above reflect those of the portfolio manager(s) only through the end of the period as stated on the cover of this report and do not necessarily represent the views of Fidelity or any other person in the Fidelity organization. Any such views are subject to change at any time based upon market or other conditions and Fidelity disclaims any responsibility to update such views. These views may not be relied on as investment advice and, because investment decisions for a Fidelity fund are based on numerous factors, may not be relied on as an indication of trading intent on behalf of any Fidelity fund.
Annual Report
Shareholder Expense Example
As a shareholder of the Fund, you incur two types of costs: (1) transaction costs, including sales charges (loads) on purchase payments or redemption proceeds, redemption fees, and (2) ongoing costs, including management fees, distribution and/or service (12b-1) fees and other Fund expenses. This Example is intended to help you understand your ongoing costs (in dollars) of investing in the Fund and to compare these costs with the ongoing costs of investing in other mutual funds.
The actual expense Example is based on an investment of $1,000 invested at the beginning of the period and held for the entire period (February 1, 2010 to July 31, 2010) for Real Estate Income and for the entire period (April 14, 2010 to July 31, 2010) for Class A, Class T, Class C and Institutional Class. The hypothetical expense Example is based on an investment of $1,000 invested for the one-half year period (February 1, 2010 to July 31, 2010).
Actual Expenses
The first line of the accompanying table for each class of the Fund provides information about actual account values and actual expenses. You may use the information in this line, together with the amount you invested, to estimate the expenses that you paid over the period. Simply divide your account value by $1,000.00 (for example, an $8,600 account value divided by $1,000.00 = 8.6), then multiply the result by the number in the first line for a class of the Fund under the heading entitled "Expenses Paid During Period" to estimate the expenses you paid on your account during this period. A small balance maintenance fee of $12.00 that is charged once a year may apply for certain accounts with a value of less than $2,000. This fee is not included in the table below. If it was, the estimate of expenses you paid during the period would be higher, and your ending account value lower, by this amount. In addition, the Fund, as a shareholder in the underlying Fidelity Central Funds, will indirectly bear its pro-rata share of the fees and expenses incurred by the underlying Fidelity Central Funds. These fees and expenses are not included in the Fund's annualized expense ratio used to calculate the expense estimate in the table below.
Hypothetical Example for Comparison Purposes
The second line of the accompanying table for each class of the Fund provides information about hypothetical account values and hypothetical expenses based on a Class' actual expense ratio and an assumed rate of return of 5% per year before expenses, which is not the Class' actual return. The hypothetical account values and expenses may not be used to estimate the actual ending account balance or expenses you paid for the period. You may use this information to compare the ongoing costs of investing in the Fund and other funds. To do so, compare this 5% hypothetical example with the 5% hypothetical examples that appear in the shareholder reports of the other funds. A small balance maintenance fee of $12.00 that is charged once a year may apply for certain accounts with a value of less than $2,000. This fee is not included in the table below. If it was, the estimate of expenses you paid during the period would be higher, and your ending account value lower, by this amount. In addition, the Fund, as a shareholder in the underlying Fidelity Central Funds, will indirectly bear its pro-rata share of the fees and expenses incurred by the underlying Fidelity Central Funds. These fees and expenses are not included in the Fund's annualized expense ratio used to calculate the expense estimate in the table below.
Annual Report
Please note that the expenses shown in the table are meant to highlight your ongoing costs only and do not reflect any transaction costs. Therefore, the second line of the table is useful in comparing ongoing costs only, and will not help you determine the relative total costs of owning different funds. In addition, if these transactional costs were included, your costs would have been higher.
| Annualized Expense Ratio | Beginning
Account Value | Ending
Account Value
July 31, 2010 | Expenses Paid
During Period |
Class A | 1.09% | | | |
Actual | | $ 1,000.00 | $ 1,014.60 | $ 3.28 B |
HypotheticalA | | $ 1,000.00 | $ 1,019.39 | $ 5.46 C |
Class T | 1.17% | | | |
Actual | | $ 1,000.00 | $ 1,014.50 | $ 3.52 B |
HypotheticalA | | $ 1,000.00 | $ 1,018.99 | $ 5.86 C |
Class C | 1.86% | | | |
Actual | | $ 1,000.00 | $ 1,012.90 | $ 5.59 B |
HypotheticalA | | $ 1,000.00 | $ 1,015.57 | $ 9.30 C |
Real Estate Income | .93% | | | |
Actual | | $ 1,000.00 | $ 1,093.40 | $ 4.83 B |
HypotheticalA | | $ 1,000.00 | $ 1,020.18 | $ 4.66 C |
Institutional Class | .85% | | | |
Actual | | $ 1,000.00 | $ 1,015.80 | $ 2.56 B |
HypotheticalA | | $ 1,000.00 | $ 1,020.58 | $ 4.26 C |
A 5% return per year before expenses
B Actual expenses are equal to each Class' annualized expense ratio, multiplied by the average account value over the period, multiplied by 181/365 (to reflect the one-half year period) for Real Estate Income and multiplied by 108/365 (to reflect the period April 14, 2010 to July 31, 2010) for Class A, Class T, Class C and Institutional Class.
C Hypothetical expenses are equal to each Class' annualized expense ratio, multiplied by average account value over the period, multiplied by 181/365 (to reflect one-half year period.)
Annual Report
Investment Changes (Unaudited)
Top Five Stocks as of July 31, 2010 |
| % of fund's
net assets | % of fund's net assets
6 months ago |
MFA Financial, Inc. | 1.8 | 1.9 |
Acadia Realty Trust (SBI) | 1.5 | 1.2 |
Equity Lifestyle Properties, Inc. | 1.4 | 1.3 |
Cypress Sharpridge Investments, Inc. | 1.3 | 0.7 |
Ventas, Inc. | 1.3 | 1.4 |
| 7.3 | |
Top 5 Bonds as of July 31, 2010 |
| % of fund's
net assets | % of fund's net assets
6 months ago |
Lexington Master Ltd. Partnership 5.45% 1/15/27 | 1.4 | 2.0 |
Ventas Realty LP 6.5% 6/1/16 | 1.1 | 1.5 |
Acadia Realty Trust 3.75% 12/15/26 | 1.1 | 1.5 |
Inland Real Estate Corp. 4.625% 11/15/26 | 1.0 | 1.0 |
Omega Healthcare Investors, Inc. 7% 4/1/14 | 1.0 | 1.3 |
| 5.6 | |
Top Five REIT Sectors as of July 31, 2010 |
| % of fund's
net assets | % of fund's net assets
6 months ago |
REITs - Shopping Centers | 8.9 | 10.4 |
REITs - Mortgage | 8.7 | 7.3 |
REITs - Health Care Facilities | 8.3 | 11.1 |
REITs - Management/Investment | 6.6 | 7.1 |
REITs - Apartments | 5.0 | 7.0 |
Asset Allocation (% of fund's net assets) |
As of July 31, 2010* | As of January 31, 2010** |
| Common Stocks 23.4% | | | Common Stocks 20.9% | |
| Preferred Stocks 8.1% | | | Preferred Stocks 9.4% | |
| Bonds 45.1% | | | Bonds 45.7% | |
| Convertible
Securities 11.8% | | | Convertible
Securities 16.4% | |
| Other Investments 1.5% | | | Other Investments 1.0% | |
| Short-Term
Investments and
Net Other Assets 10.1% | | | Short-Term
Investments and
Net Other Assets 6.6% | |
* Foreign investments | 2.3% | | ** Foreign investments | 2.9% | |

Annual Report
Investments July 31, 2010
Showing Percentage of Net Assets
Common Stocks - 23.4% |
| Shares | | Value |
CONSUMER DISCRETIONARY - 0.7% |
Hotels, Restaurants & Leisure - 0.3% |
Starwood Hotels & Resorts Worldwide, Inc. | 74,100 | | $ 3,590,145 |
Household Durables - 0.4% |
Stanley Martin Communities LLC Class B (a) | 4,620 | | 3,696,000 |
TOTAL CONSUMER DISCRETIONARY | | 7,286,145 |
FINANCIALS - 21.4% |
Capital Markets - 0.2% |
HFF, Inc. (a) | 271,664 | | 2,379,777 |
Real Estate Investment Trusts - 21.0% |
Acadia Realty Trust (SBI) | 853,449 | | 15,822,944 |
Alexandria Real Estate Equities, Inc. | 28,800 | | 2,031,840 |
AMB Property Corp. (SBI) | 248,200 | | 6,195,072 |
American Campus Communities, Inc. | 175,500 | | 5,080,725 |
Annaly Capital Management, Inc. | 523,250 | | 9,104,550 |
Anworth Mortgage Asset Corp. | 1,129,510 | | 7,872,685 |
Apartment Investment & Management Co. Class A | 141,241 | | 3,032,444 |
Associated Estates Realty Corp. | 432,500 | | 5,985,800 |
AvalonBay Communities, Inc. | 48,225 | | 5,067,965 |
Brandywine Realty Trust (SBI) | 191,100 | | 2,170,896 |
CapLease, Inc. | 124,200 | | 608,580 |
CBL & Associates Properties, Inc. | 296,173 | | 4,167,154 |
Cedar Shopping Centers, Inc. | 267,400 | | 1,657,880 |
Chimera Investment Corp. | 255,200 | | 987,624 |
Cypress Sharpridge Investments, Inc. | 1,018,863 | | 13,448,992 |
Cypress Sharpridge Investments, Inc. (g) | 146,458 | | 1,933,246 |
DCT Industrial Trust, Inc. | 413,600 | | 1,939,784 |
Developers Diversified Realty Corp. | 115,000 | | 1,305,250 |
DiamondRock Hospitality Co. | 264,700 | | 2,456,416 |
Duke Realty LP | 362,983 | | 4,341,277 |
Dynex Capital, Inc. | 350,000 | | 3,395,000 |
Equity Lifestyle Properties, Inc. | 266,930 | | 14,128,605 |
Equity Residential (SBI) | 52,200 | | 2,393,370 |
Excel Trust, Inc. (a) | 276,100 | | 3,158,584 |
Federal Realty Investment Trust (SBI) | 22,400 | | 1,751,456 |
Franklin Street Properties Corp. | 90,317 | | 1,102,771 |
Glimcher Realty Trust | 64,600 | | 429,590 |
Government Properties Income Trust | 73,500 | | 2,042,565 |
Health Care REIT, Inc. | 26,200 | | 1,187,122 |
Highwoods Properties, Inc. (SBI) | 106,400 | | 3,331,384 |
Kimco Realty Corp. | 87,800 | | 1,323,146 |
Common Stocks - continued |
| Shares | | Value |
FINANCIALS - continued |
Real Estate Investment Trusts - continued |
Lexington Corporate Properties Trust | 30,900 | | $ 198,687 |
MFA Financial, Inc. | 2,521,581 | | 18,508,390 |
Monmouth Real Estate Investment Corp. Class A | 427,000 | | 3,360,490 |
National Retail Properties, Inc. | 147,900 | | 3,419,448 |
Nationwide Health Properties, Inc. | 138,580 | | 5,185,664 |
Pebblebrook Hotel Trust (a) | 186,300 | | 3,407,427 |
Piedmont Office Realty Trust, Inc. Class A (f) | 158,700 | | 2,856,600 |
ProLogis Trust | 194,366 | | 2,110,815 |
Public Storage | 23,800 | | 2,335,256 |
Redwood Trust, Inc. | 278,000 | | 4,350,700 |
Regency Centers Corp. | 97,400 | | 3,675,876 |
Simon Property Group, Inc. | 96,001 | | 8,565,209 |
Sun Communities, Inc. | 35,000 | | 1,018,500 |
Sunstone Hotel Investors, Inc. (a) | 479,900 | | 4,952,568 |
The Macerich Co. | 93,074 | | 3,857,917 |
Two Harbors Investment Corp. | 346,800 | | 2,923,524 |
UDR, Inc. | 64,101 | | 1,353,172 |
Ventas, Inc. | 260,480 | | 13,211,546 |
Vornado Realty Trust | 43,790 | | 3,624,936 |
| | 218,371,442 |
Real Estate Management & Development - 0.2% |
CB Richard Ellis Group, Inc. Class A (a) | 122,500 | | 2,082,500 |
Thrifts & Mortgage Finance - 0.0% |
Wrightwood Capital LLC warrants 7/31/14 (a)(g) | 60,681 | | 607 |
TOTAL FINANCIALS | | 222,834,326 |
HEALTH CARE - 1.2% |
Health Care Providers & Services - 1.2% |
Brookdale Senior Living, Inc. (a) | 364,900 | | 5,174,282 |
Capital Senior Living Corp. (a) | 412,050 | | 2,225,070 |
Emeritus Corp. (a)(f) | 280,141 | | 4,821,227 |
| | 12,220,579 |
MATERIALS - 0.1% |
Paper & Forest Products - 0.1% |
Weyerhaeuser Co. | 61,500 | | 997,530 |
TOTAL COMMON STOCKS (Cost $210,556,928) | 243,338,580 |
Preferred Stocks - 9.5% |
| Shares | | Value |
Convertible Preferred Stocks - 1.4% |
FINANCIALS - 1.4% |
Real Estate Investment Trusts - 1.1% |
Alexandria Real Estate Equities, Inc. Series D 7.00% | 20,000 | | $ 457,500 |
CommonWealth REIT 6.50% | 80,000 | | 1,612,800 |
Lexington Corporate Properties Trust Series C 6.50% | 254,009 | | 9,303,080 |
| | 11,373,380 |
Real Estate Management & Development - 0.3% |
Forest City Enterprises, Inc. Series A 7.00% | 10,000 | | 508,000 |
Grubb & Ellis Co.: | | | |
12.00% (g) | 22,500 | | 1,833,750 |
12.00% (g) | 5,000 | | 407,500 |
| | 2,749,250 |
TOTAL FINANCIALS | | 14,122,630 |
Nonconvertible Preferred Stocks - 8.1% |
CONSUMER DISCRETIONARY - 0.0% |
Household Durables - 0.0% |
M/I Homes, Inc. Series A, 9.75% (a) | 18,200 | | 323,050 |
FINANCIALS - 8.1% |
Diversified Financial Services - 0.4% |
DRA CRT Acquisition Corp. Series A, 8.50% | 25,000 | | 306,250 |
Red Lion Hotels Capital Trust 9.50% | 163,125 | | 4,081,388 |
W2007 Grace Acquisition I, Inc. Series B, 8.75% (a) | 35,300 | | 4,236 |
| | 4,391,874 |
Real Estate Investment Trusts - 7.7% |
Alexandria Real Estate Equities, Inc. Series C, 8.375% | 67,000 | | 1,737,310 |
American Home Mortgage Investment Corp.: | | | |
Series A, 9.375% (a) | 120,300 | | 12 |
Series B, 9.25% (a) | 124,100 | | 124 |
Annaly Capital Management, Inc. Series A, 7.875% | 164,900 | | 4,224,738 |
Anworth Mortgage Asset Corp. Series A, 8.625% | 247,727 | | 6,188,220 |
Apartment Investment & Management Co.: | | | |
Series G, 9.375% | 136,198 | | 3,508,460 |
Series T, 8.00% | 57,500 | | 1,432,900 |
CapLease, Inc. Series A, 8.125% | 43,400 | | 1,031,184 |
CBL & Associates Properties, Inc.: | | | |
(depositary shares) Series C, 7.75% | 34,500 | | 803,850 |
7.375% | 43,688 | | 977,301 |
Preferred Stocks - continued |
| Shares | | Value |
Nonconvertible Preferred Stocks - continued |
FINANCIALS - continued |
Real Estate Investment Trusts - continued |
Cedar Shopping Centers, Inc. 8.875% | 117,801 | | $ 3,002,747 |
CenterPoint Properties Trust Series D, 5.377% | 3,575 | | 1,644,500 |
Colonial Properties Trust (depositary shares) Series D, 8.125% | 42,200 | | 1,048,670 |
CommonWealth REIT 8.75% | 43,019 | | 1,086,230 |
Corporate Office Properties Trust Series H, 7.50% | 5,000 | | 123,100 |
Cousins Properties, Inc. Series A, 7.75% | 93,230 | | 2,214,213 |
Developers Diversified Realty Corp. (depositary shares)
Series G, 8.00% | 49,000 | | 1,169,630 |
Digital Realty Trust, Inc. Series A, 8.50% | 75,000 | | 1,897,500 |
Duke Realty LP: | | | |
8.375% | 128,517 | | 3,383,853 |
Series L, 6.60% | 10,666 | | 232,412 |
Eagle Hospitality Properties Trust, Inc. 8.25% (a) | 24,000 | | 21,600 |
Glimcher Realty Trust Series G, 8.125% | 73,400 | | 1,702,880 |
HomeBanc Mortgage Corp. Series A, 10.00% (a) | 104,685 | | 1 |
Hospitality Properties Trust: | | | |
Series B, 8.875% | 88,600 | | 2,263,730 |
Series C, 7.00% | 58,500 | | 1,373,580 |
Innkeepers USA Trust Series C, 8.00% (a) | 62,400 | | 33,696 |
iStar Financial, Inc. Series E, 7.875% | 54,000 | | 799,740 |
Kimco Realty Corp. Series G, 7.75% | 77,300 | | 2,021,395 |
LaSalle Hotel Properties: | | | |
Series B, 8.375% | 26,800 | | 675,360 |
Series E, 8.00% | 42,750 | | 1,034,550 |
Series G, 7.25% | 114,485 | | 2,661,776 |
LBA Realty Fund II: | | | |
Series A, 8.75% (a) | 69,000 | | 2,277,000 |
Series B, 7.625% (a) | 31,240 | | 562,320 |
Lexington Corporate Properties Trust Series B, 8.05% | 29,000 | | 680,920 |
Lexington Realty Trust 7.55% | 23,800 | | 527,646 |
LTC Properties, Inc. Series F, 8.00% | 101,900 | | 2,565,842 |
MFA Financial, Inc. Series A, 8.50% | 335,099 | | 8,471,303 |
Mid-America Apartment Communities, Inc. Series H, 8.30% | 15,400 | | 389,620 |
Omega Healthcare Investors, Inc. Series D, 8.375% | 59,600 | | 1,537,680 |
Parkway Properties, Inc. Series D, 8.00% | 25,000 | | 612,250 |
ProLogis Trust Series C, 8.54% | 84,446 | | 4,106,187 |
PS Business Parks, Inc.: | | | |
(depositary shares) Series H, 7.00% | 6,700 | | 164,418 |
(depositary shares) Series L, 7.60% | 49,890 | | 1,238,769 |
Preferred Stocks - continued |
| Shares | | Value |
Nonconvertible Preferred Stocks - continued |
FINANCIALS - continued |
Real Estate Investment Trusts - continued |
PS Business Parks, Inc.: - continued | | | |
7.20% | 35,900 | | $ 872,729 |
Series P, 6.70% | 35,000 | | 811,650 |
Public Storage: | | | |
Series I, 7.25% | 10,828 | | 273,407 |
Series K, 7.25% | 21,418 | | 548,301 |
Series N, 7.00% | 4,200 | | 106,764 |
Regency Centers Corp.: | | | |
7.25% | 10,500 | | 259,875 |
Series C 7.45% | 18,000 | | 447,300 |
Saul Centers, Inc. 8.00% | 93,700 | | 2,384,665 |
Sunstone Hotel Investors, Inc. Series A, 8.00% | 62,200 | | 1,533,230 |
Weingarten Realty Investors (SBI) Series F, 6.50% | 56,230 | | 1,290,479 |
| | 79,957,617 |
TOTAL FINANCIALS | | 84,349,491 |
TOTAL NONCONVERTIBLE PREFERRED STOCKS | | 84,672,541 |
TOTAL PREFERRED STOCKS (Cost $110,568,273) | 98,795,171 |
Corporate Bonds - 29.7% |
| Principal Amount (e) | | |
Convertible Bonds - 10.4% |
CONSUMER DISCRETIONARY - 0.1% |
Hotels, Restaurants & Leisure - 0.1% |
Morgans Hotel Group Co. 2.375% 10/15/14 | | $ 1,340,000 | | 988,250 |
FINANCIALS - 10.3% |
Real Estate Investment Trusts - 6.7% |
Acadia Realty Trust 3.75% 12/15/26 | | 11,505,000 | | 11,325,234 |
Alexandria Real Estate Equities, Inc. 3.7% 1/15/27 (g) | | 6,895,000 | | 6,771,580 |
Annaly Capital Management, Inc. 4% 2/15/15 | | 1,000,000 | | 1,043,125 |
BRE Properties, Inc. 4.125% 8/15/26 | | 6,800,000 | | 6,829,750 |
CapLease, Inc. 7.5% 10/1/27 (g) | | 5,180,000 | | 5,128,200 |
Hospitality Properties Trust 3.8% 3/15/27 | | 5,100,000 | | 5,087,250 |
Corporate Bonds - continued |
| Principal Amount (e) | | Value |
Convertible Bonds - continued |
FINANCIALS - continued |
Real Estate Investment Trusts - continued |
Inland Real Estate Corp. 4.625% 11/15/26 | | $ 10,870,000 | | $ 10,652,600 |
Lexington Corporate Properties Trust 6% 1/15/30 (g) | | 5,000,000 | | 5,181,250 |
ProLogis Trust: | | | | |
1.875% 11/15/37 | | 2,450,000 | | 2,247,875 |
2.625% 5/15/38 | | 1,500,000 | | 1,389,375 |
The Macerich Co. 3.25% 3/15/12 (g) | | 4,800,000 | | 4,698,000 |
United Dominion Realty Trust, Inc. 3.625% 9/15/11 | | 5,500,000 | | 5,500,000 |
Washington (REIT): | | | | |
3.875% 9/15/26 | | 1,600,000 | | 1,592,000 |
3.875% 9/15/26 | | 2,450,000 | | 2,437,750 |
| | 69,883,989 |
Real Estate Management & Development - 3.6% |
BioMed Realty LP 4.5% 10/1/26 (g) | | 2,500,000 | | 2,500,000 |
Brandywine Operating Partnership LP 3.875% 10/15/26 | | 1,000,000 | | 992,500 |
Corporate Office Properties LP: | | | | |
3.5% 9/15/26 (g) | | 3,280,000 | | 3,222,600 |
4.25% 4/15/30 (g) | | 2,000,000 | | 1,993,000 |
Duke Realty LP 3.75% 12/1/11 (g) | | 2,650,000 | | 2,643,375 |
First Potomac Realty Investment LP 4% 12/15/11 (g) | | 2,600,000 | | 2,538,250 |
Grubb & Ellis Co. 7.95% 5/1/15 (g) | | 3,500,000 | | 2,944,375 |
Home Properties, Inc. 4.125% 11/1/26 (g) | | 2,100,000 | | 2,092,125 |
Kilroy Realty LP 3.25% 4/15/12 (g) | | 2,185,000 | | 2,113,988 |
Lexington Master Ltd. Partnership 5.45% 1/15/27 (g) | | 14,950,000 | | 14,800,500 |
MPT Operating Partnership LP 9.25% 4/1/13 (g) | | 1,000,000 | | 1,075,000 |
SL Green Realty Corp. 3% 3/30/27 (g) | | 500,000 | | 485,000 |
| | 37,400,713 |
TOTAL FINANCIALS | | 107,284,702 |
TOTAL CONVERTIBLE BONDS | | 108,272,952 |
Nonconvertible Bonds - 19.3% |
CONSUMER DISCRETIONARY - 3.3% |
Hotels, Restaurants & Leisure - 0.4% |
Times Square Hotel Trust 8.528% 8/1/26 (g) | | 3,968,871 | | 4,038,326 |
Corporate Bonds - continued |
| Principal Amount (e) | | Value |
Nonconvertible Bonds - continued |
CONSUMER DISCRETIONARY - continued |
Household Durables - 2.6% |
KB Home: | | | | |
5.75% 2/1/14 | | $ 510,000 | | $ 479,400 |
5.875% 1/15/15 | | 2,000,000 | | 1,860,000 |
6.25% 6/15/15 | | 7,500,000 | | 6,900,000 |
9.1% 9/15/17 | | 1,000,000 | | 1,013,750 |
Lennar Corp.: | | | | |
5.5% 9/1/14 | | 1,000,000 | | 928,750 |
5.6% 5/31/15 | | 1,000,000 | | 905,000 |
6.95% 6/1/18 (g) | | 3,000,000 | | 2,662,500 |
M/I Homes, Inc. 6.875% 4/1/12 | | 2,150,000 | | 2,090,875 |
Meritage Homes Corp.: | | | | |
6.25% 3/15/15 | | 2,500,000 | | 2,381,250 |
7.15% 4/15/20 | | 1,500,000 | | 1,346,250 |
Ryland Group, Inc. 8.4% 5/15/17 | | 745,000 | | 791,563 |
Standard Pacific Corp.: | | | | |
6.25% 4/1/14 | | 2,700,000 | | 2,544,750 |
8.375% 5/15/18 | | 2,245,000 | | 2,188,875 |
10.75% 9/15/16 | | 1,000,000 | | 1,070,000 |
| | 27,162,963 |
Specialty Retail - 0.3% |
Toys 'R' US Property Co. I LLC 10.75% 7/15/17 | | 2,490,000 | | 2,801,250 |
TOTAL CONSUMER DISCRETIONARY | | 34,002,539 |
CONSUMER STAPLES - 0.3% |
Food & Staples Retailing - 0.3% |
Ahold Lease Series 2001 A1 pass thru trust certificates 7.82% 1/2/20 | | 1,281,883 | | 1,435,709 |
C&S Group Enterprises LLC 8.375% 5/1/17 (g) | | 1,630,000 | | 1,556,650 |
| | 2,992,359 |
FINANCIALS - 15.4% |
Commercial Banks - 0.2% |
CapitalSource, Inc. 12.75% 7/15/14 (g) | | 1,500,000 | | 1,736,250 |
Diversified Financial Services - 0.4% |
Icahn Enterprises LP/Icahn Enterprises Finance Corp. 7.75% 1/15/16 | | 4,000,000 | | 3,990,000 |
Corporate Bonds - continued |
| Principal Amount (e) | | Value |
Nonconvertible Bonds - continued |
FINANCIALS - continued |
Real Estate Investment Trusts - 8.9% |
AvalonBay Communities, Inc.: | | | | |
5.5% 1/15/12 | | $ 527,000 | | $ 551,419 |
6.625% 9/15/11 | | 393,000 | | 411,965 |
Camden Property Trust 5% 6/15/15 | | 1,100,000 | | 1,160,740 |
Commercial Net Lease Realty, Inc.: | | | | |
6.15% 12/15/15 | | 800,000 | | 856,399 |
6.25% 6/15/14 | | 3,005,000 | | 3,261,597 |
Developers Diversified Realty Corp.: | | | | |
4.625% 8/1/10 | | 900,000 | | 900,000 |
5.375% 10/15/12 | | 500,000 | | 499,045 |
5.5% 5/1/15 | | 2,000,000 | | 1,911,018 |
7.5% 4/1/17 | | 2,500,000 | | 2,475,273 |
7.5% 7/15/18 | | 5,271,000 | | 5,125,336 |
9.625% 3/15/16 | | 3,836,000 | | 4,201,648 |
Entertainment Properties Trust 7.75% 7/15/20 (g) | | 2,000,000 | | 1,957,500 |
Equity One, Inc.: | | | | |
5.375% 10/15/15 | | 1,500,000 | | 1,521,897 |
6.25% 12/15/14 | | 3,000,000 | | 3,190,734 |
Federal Realty Investment Trust 5.65% 6/1/16 | | 725,000 | | 783,005 |
Health Care Property Investors, Inc.: | | | | |
5.65% 12/15/13 | | 1,025,000 | | 1,090,835 |
6% 3/1/15 | | 1,000,000 | | 1,068,453 |
6.3% 9/15/16 | | 5,250,000 | | 5,589,602 |
7.072% 6/8/15 | | 1,500,000 | | 1,668,411 |
Health Care REIT, Inc.: | | | | |
6% 11/15/13 | | 1,000,000 | | 1,093,641 |
6.2% 6/1/16 | | 750,000 | | 824,795 |
Healthcare Realty Trust, Inc. 6.5% 1/17/17 | | 1,875,000 | | 1,981,980 |
HMB Capital Trust V 4.1371% 12/15/36 (d)(g)(h) | | 2,530,000 | | 0 |
Hospitality Properties Trust: | | | | |
5.625% 3/15/17 | | 915,000 | | 898,796 |
6.75% 2/15/13 | | 610,000 | | 648,782 |
7.875% 8/15/14 | | 1,000,000 | | 1,108,650 |
HRPT Properties Trust: | | | | |
6.25% 8/15/16 | | 1,500,000 | | 1,565,039 |
6.5% 1/15/13 | | 200,000 | | 211,067 |
iStar Financial, Inc. 5.95% 10/15/13 | | 5,330,000 | | 3,970,850 |
Kimco Realty Corp. 5.783% 3/15/16 | | 450,000 | | 490,279 |
Corporate Bonds - continued |
| Principal Amount (e) | | Value |
Nonconvertible Bonds - continued |
FINANCIALS - continued |
Real Estate Investment Trusts - continued |
Nationwide Health Properties, Inc.: | | | | |
6% 5/20/15 | | $ 3,122,000 | | $ 3,442,108 |
6.25% 2/1/13 | | 1,000,000 | | 1,075,846 |
8.25% 7/1/12 | | 1,300,000 | | 1,421,732 |
Omega Healthcare Investors, Inc.: | | | | |
7% 4/1/14 | | 9,720,000 | | 9,853,650 |
7% 1/15/16 | | 1,295,000 | | 1,314,425 |
7.5% 2/15/20 (g) | | 1,000,000 | | 1,045,000 |
Pan Pacific Retail Properties, Inc. 5.95% 6/1/14 | | 1,750,000 | | 1,910,384 |
Potlatch Corp. 7.5% 11/1/19 | | 1,000,000 | | 1,010,000 |
ProLogis Trust: | | | | |
6.25% 3/15/17 | | 2,000,000 | | 1,935,774 |
6.625% 5/15/18 | | 2,000,000 | | 1,950,180 |
6.875% 3/15/20 | | 1,500,000 | | 1,437,281 |
Reckson Operating Partnership LP 7.75% 3/15/20 (g) | | 2,000,000 | | 2,000,000 |
Senior Housing Properties Trust: | | | | |
6.75% 4/15/20 | | 2,000,000 | | 2,040,000 |
8.625% 1/15/12 | | 5,900,000 | | 6,187,625 |
UDR, Inc. 5.5% 4/1/14 | | 500,000 | | 529,707 |
United Dominion Realty Trust, Inc.: | | | | |
5.13% 1/15/14 | | 500,000 | | 517,405 |
5.25% 1/15/15 | | 1,000,000 | | 1,042,302 |
Weingarten Realty Investors 4.857% 1/15/14 | | 2,500,000 | | 2,576,130 |
| | 92,308,305 |
Real Estate Management & Development - 5.8% |
AMB Property LP: | | | | |
5.9% 8/15/13 | | 400,000 | | 425,077 |
6.125% 12/1/16 | | 1,000,000 | | 1,078,402 |
Brandywine Operating Partnership LP: | | | | |
5.4% 11/1/14 | | 1,750,000 | | 1,802,542 |
5.75% 4/1/12 | | 1,000,000 | | 1,033,235 |
7.5% 5/15/15 | | 1,000,000 | | 1,104,883 |
CB Richard Ellis Services, Inc. 11.625% 6/15/17 | | 1,500,000 | | 1,698,750 |
Colonial Properties Trust: | | | | |
6.15% 4/15/13 | | 1,500,000 | | 1,543,574 |
6.25% 6/15/14 | | 1,594,000 | | 1,628,897 |
6.875% 8/15/12 | | 1,000,000 | | 1,035,000 |
Colonial Realty LP 6.05% 9/1/16 | | 2,500,000 | | 2,424,405 |
Corporate Bonds - continued |
| Principal Amount (e) | | Value |
Nonconvertible Bonds - continued |
FINANCIALS - continued |
Real Estate Management & Development - continued |
Duke Realty LP: | | | | |
6.25% 5/15/13 | | $ 750,000 | | $ 804,506 |
7.375% 2/15/15 | | 1,500,000 | | 1,685,130 |
DuPont Fabros Technology LP 8.5% 12/15/17 | | 845,000 | | 897,813 |
Forest City Enterprises, Inc.: | | | | |
6.5% 2/1/17 | | 3,310,000 | | 2,780,400 |
7.625% 6/1/15 | | 1,435,000 | | 1,305,850 |
Highwoods/Forsyth LP 5.85% 3/15/17 | | 2,800,000 | | 2,816,708 |
Host Hotels & Resorts LP: | | | | |
6.875% 11/1/14 | | 500,000 | | 507,500 |
9% 5/15/17 | | 750,000 | | 810,000 |
Liberty Property LP: | | | | |
5.125% 3/2/15 | | 2,200,000 | | 2,289,516 |
6.375% 8/15/12 | | 2,679,000 | | 2,868,295 |
Post Apartment Homes LP: | | | | |
5.45% 6/1/12 | | 713,000 | | 742,970 |
6.3% 6/1/13 | | 2,000,000 | | 2,157,816 |
Regency Centers LP: | | | | |
5.25% 8/1/15 | | 4,509,000 | | 4,773,687 |
5.875% 6/15/17 | | 400,000 | | 425,412 |
Toys 'R' Us Property Co. II LLC 8.5% 12/1/17 (g) | | 1,000,000 | | 1,050,000 |
Ventas Realty LP: | | | | |
6.5% 6/1/16 | | 2,340,000 | | 2,392,650 |
6.5% 6/1/16 | | 11,370,000 | | 11,625,825 |
6.625% 10/15/14 | | 6,160,000 | | 6,283,200 |
| | 59,992,043 |
Thrifts & Mortgage Finance - 0.1% |
Wrightwood Capital LLC 9% 6/1/14 (d)(g) | | 4,000,000 | | 1,370,000 |
TOTAL FINANCIALS | | 159,396,598 |
Corporate Bonds - continued |
| Principal Amount (e) | | Value |
Nonconvertible Bonds - continued |
HEALTH CARE - 0.3% |
Health Care Providers & Services - 0.3% |
Skilled Healthcare Group, Inc. 11% 1/15/14 | | $ 1,580,000 | | $ 1,406,200 |
Sun Healthcare Group, Inc. 9.125% 4/15/15 | | 2,050,000 | | 2,137,125 |
| | 3,543,325 |
TOTAL NONCONVERTIBLE BONDS | | 199,934,821 |
TOTAL CORPORATE BONDS (Cost $288,182,095) | 308,207,773 |
Asset-Backed Securities - 5.2% |
|
Anthracite CDO I Ltd. Series 2002-CIBA Class B, 6.633% 5/24/37 (g) | | 1,384,000 | | 1,218,353 |
Anthracite CDO II Ltd. Series 2002-2A Class F, 7.6% 12/24/37 (g) | | 2,260,000 | | 971,800 |
Anthracite CDO III Ltd./Anthracite CDO III Corp. Series 2004-1A Class A, 0.6906% 3/23/19 (g)(h) | | 395,791 | | 296,843 |
Brascan Real Estate CDO Ltd./Brascan Real Estate CDO Corp. Series 2004-1A Class A, 0.8713% 1/20/40 (g)(h) | | 2,309,895 | | 2,211,724 |
Capital Trust RE CDO Ltd. Series 2005-1A Class D, 1.8381% 3/20/50 (g)(h) | | 2,250,000 | | 225,000 |
Capital Trust RE CDO Ltd./Capital Trust RE CDO Corp. Series 2005-3A Class A2, 5.16% 6/25/35 (g) | | 5,375,000 | | 5,213,750 |
CapitalSource Real Estate Loan Trust Series 2006-1A Class A2A, 0.7713% 1/20/37 (g)(h) | | 1,186,654 | | 771,325 |
CapLease CDO Ltd. Series 2005-1A Class A, 4.926% 1/29/40 (g) | | 2,430,816 | | 1,823,112 |
Conseco Finance Securitizations Corp. Series 2002-2 Class M2, 9.163% 3/1/33 | | 500,000 | | 237,030 |
Crest Clarendon Street Ltd./Crest Clarendon Corp. Series 2002-1A: | | | | |
Class B1, 6.065% 12/28/35 (g) | | 1,570,000 | | 1,130,400 |
Class B2, 1.8872% 12/28/35 (g)(h) | | 1,575,000 | | 937,125 |
Class D, 9% 12/28/35 (g) | | 500,000 | | 158,650 |
Crest Dartmouth Street Ltd./Crest Dartmouth Street Corp. Series 2003-1A Class D, 9% 6/28/38 (g) | | 997,000 | | 279,160 |
Crest Ltd. Series 2002-IGA: | | | | |
Class A, 0.9375% 7/28/17 (g)(h) | | 1,145,821 | | 1,077,072 |
Class B, 1.8375% 7/28/35 (g)(h) | | 1,500,000 | | 1,329,450 |
Asset-Backed Securities - continued |
| Principal Amount (e) | | Value |
Deutsche Financial Capital Securitization LLC Series 1997-I Class M, 7.275% 9/15/27 | | $ 6,500,000 | | $ 5,652,853 |
Fairfield Street Solar Corp. Series 2004-1A Class E1, 3.9028% 11/28/39 (g)(h) | | 550,000 | | 38,500 |
Green Tree Financial Corp.: | | | | |
Series 1996-4 Class M1, 7.75% 6/15/27 | | 1,788,179 | | 1,660,953 |
Series 1997-3 Class M1, 7.53% 3/15/28 | | 8,167,187 | | 5,706,925 |
GSR Mortgage Loan Trust Series 2005-HE3 Class B3, 2.8288% 6/25/35 (h)(j) | | 1,259,000 | | 72,722 |
Guggenheim Structured Real Estate Funding Ltd./Guggenheim Structured Real Estate Funding LLC Series 2005-2A: | | | | |
Class D, 1.8788% 8/26/30 (g)(h) | | 749,836 | | 74,984 |
Class E, 2.3288% 8/26/30 (g)(h) | | 1,455,839 | | 72,792 |
Leafs CMBS I Ltd./Leafs CMBS I Corp. Series 2002-1A Class A2, 0.8881% 11/20/17 (g)(h) | | 1,926,008 | | 1,829,708 |
Lehman ABS Manufactured Housing Contract Trust Series 2001-B Class M2, 7.17% 3/15/28 | | 1,447,670 | | 500,753 |
Merit Securities Corp. Series 13 Class M1, 7.9882% 12/28/33 | | 1,923,000 | | 1,744,067 |
N-Star Real Estate CDO Ltd. Series 1A Class C1B, 7.696% 8/28/38 (g) | | 883,000 | | 535,098 |
Prima Capital CDO Ltd./Prima Capital CDO Corp. Series 2005-1A Class A2, 4.646% 7/24/39 (g) | | 2,460,088 | | 2,312,483 |
Taberna Preferred Funding III Ltd. Series 2005-3A Class D, 2.9966% 2/5/36 (g)(h) | | 3,370,124 | | 337 |
TIAA Real Estate CDO Ltd./TIAA Real Estate CDO Corp. Series 2002-1A Class IIFX, 6.77% 5/22/37 (g) | | 3,165,000 | | 3,006,750 |
Wachovia Ltd./Wachovia LLC: | | | | |
Series 2006-1 Class 1ML, 5.7835% 9/25/26 (g)(h) | | 2,000,000 | | 540,000 |
Series 2006-1A: | | | | |
Class A1A, 0.7983% 9/25/26 (g)(h) | | 2,439,000 | | 1,975,590 |
Class A1B, 0.8683% 9/25/26 (g)(h) | | 4,285,000 | | 3,235,175 |
Class A2A, 0.7583% 9/25/26 (g)(h) | | 9,140,000 | | 7,540,500 |
Wrightwood Capital Real Estate CDO Ltd. Series 2005-1A Class F, 2.4275% 11/21/40 (g)(h) | | 250,000 | | 15,000 |
TOTAL ASSET-BACKED SECURITIES (Cost $63,473,583) | 54,395,984 |
Collateralized Mortgage Obligations - 2.8% |
| Principal Amount (e) | | Value |
Private Sponsor - 2.8% |
Banc of America Large Loan, Inc. Series 2005-MIB1 Class A2, 0.5509% 3/15/22 (g)(h) | | $ 8,050,108 | | $ 7,783,777 |
COMM pass-thru certificates Series 2007-FL14 Class AJ, 0.5209% 6/15/22 (g)(h) | | 3,250,000 | | 2,772,973 |
Countrywide Home Loans, Inc.: | | | | |
Series 2002-38 Class B3, 5% 2/25/18 (g) | | 122,616 | | 15,339 |
Series 2002-R2 Class 2B3, 4.7244% 7/25/33 (g)(h) | | 236,928 | | 83,988 |
Series 2003-40 Class B3, 4.5% 10/25/18 (g) | | 165,728 | | 18,280 |
Series 2003-R2 Class B3, 5.5% 5/25/43 (g) | | 359,616 | | 18,896 |
Series 2003-R3: | | | | |
Class B2, 5.5% 11/25/33 (g) | | 1,593,299 | | 469,657 |
Class B3, 5.5% 11/25/33 (g) | | 477,085 | | 43,133 |
Series 2004-R1 Class 1B3, 5.5% 11/25/34 (g)(h) | | 343,868 | | 17,633 |
Freddie Mac Series 2010 K7 Class B, 5.4341% 4/25/20 (g)(h) | | 1,500,000 | | 1,325,700 |
FREMF Mortgage Trust Series 2010-K6 Class B, 5.3574% 12/26/46 (g)(h) | | 4,500,000 | | 3,925,502 |
Merrill Lynch Floating Trust floater Series 2006-1 Class TM, 0.841% 6/15/22 (g)(h) | | 5,198,066 | | 4,496,327 |
Merrill Lynch Mortgage Investors Trust Series 1998-C3 Class F, 6% 12/15/30 (g) | | 4,240,000 | | 4,126,368 |
Merrill Lynch Mortgage Trust Series 2002-MW1 Class E, 6.219% 7/12/34 (g) | | 1,600,000 | | 1,627,974 |
RESI Finance LP/RESI Finance DE Corp. floater: | | | | |
Series 2003-B Class B9, 12.2925% 7/10/35 (g)(h) | | 577,830 | | 327,803 |
Series 2004-C Class B5, 1.6925% 9/10/36 (g)(h) | | 323,453 | | 150,600 |
Series 2005-A Class B6, 2.3425% 3/10/37 (g)(h) | | 1,775,940 | | 311,500 |
Series 2005-B Class B6, 1.9425% 6/10/37 (g)(h) | | 897,707 | | 62,750 |
Series 2005-D Class B6, 2.5909% 12/15/37 (g)(h) | | 452,911 | | 18,162 |
Series 2006-B Class B6, 2.0409% 7/15/38 (g)(h) | | 921,308 | | 14,188 |
Residential Funding Mortgage Securities I, Inc. Series 2002-S20 Class M3, 5.25% 12/25/17 | | 46,470 | | 30,125 |
Residential Funding Securities Corp. Series 2002-RM1 Class BI1, 5.5% 12/25/17 (g) | | 95,444 | | 32,093 |
RESIX Finance Ltd. floater: | | | | |
Series 2003-D Class B8, 6.8425% 12/10/35 (g)(h) | | 508,287 | | 180,137 |
Series 2004-A Class B7, 4.5925% 2/10/36 (g)(h) | | 520,533 | | 216,073 |
Series 2004-B Class B7, 4.3425% 2/10/36 (g)(h) | | 630,046 | | 174,208 |
Series 2005-C Class B7, 3.4425% 9/10/37 (g)(h) | | 1,847,925 | | 145,801 |
Collateralized Mortgage Obligations - continued |
| Principal Amount (e) | | Value |
Private Sponsor - continued |
RESIX Finance Ltd. floater: - continued | | | | |
Series 2006-B Class B7, 4.1909% 7/15/38 (g)(h) | | $ 841,219 | | $ 11,020 |
Series 2007-A Class BB, 3.6909% 2/15/39 (g)(h) | | 575,971 | | 1,901 |
TOTAL PRIVATE SPONSOR | | 28,401,908 |
U.S. Government Agency - 0.0% |
Fannie Mae REMIC Trust: | | | | |
Series 2001-W3 subordinate REMIC pass thru certificates, Class B3, 7% 9/25/41 (j) | | 202,034 | | 109,976 |
Series 2002-W1 subordinate REMIC pass thru certificates, Class 3B3, 4.4529% 2/25/42 (g)(h) | | 126,091 | | 54,561 |
Series 2003-W1 subordinate REMIC pass thru certificates, Class B3, 5.75% 12/25/42 (j) | | 276,868 | | 91,121 |
Series 2003-W10 subordinate REMIC pass thru certificates, Class 2B3, 4.5583% 6/25/43 (g)(h) | | 170,779 | | 61,218 |
Series 2003-W4 subordinate REMIC pass thru certificates, Class 2B3, 4.6215% 10/25/42 (g)(h) | | 74,156 | | 26,092 |
TOTAL U.S. GOVERNMENT AGENCY | | 342,968 |
TOTAL COLLATERALIZED MORTGAGE OBLIGATIONS (Cost $37,253,558) | 28,744,876 |
Commercial Mortgage Securities - 17.8% |
|
Asset Securitization Corp. Series 1997-D4: | | | | |
Class B1, 7.525% 4/14/29 | | 1,565,000 | | 1,641,920 |
Class B2, 7.525% 4/14/29 | | 560,000 | | 579,712 |
Banc of America Commercial Mortgage, Inc.: | | | | |
sequential payer Series 2002-2 Class F, 5.487% 7/11/43 | | 4,185,000 | | 4,012,407 |
Series 2005-1 Class CJ, 5.3362% 11/10/42 (h) | | 3,580,000 | | 3,325,119 |
Series 2005-6 Class AJ, 5.35% 9/10/47 (h) | | 5,000,000 | | 4,589,640 |
Banc of America Large Loan, Inc. floater Series 2005-MIB1 Class K, 2.3409% 3/15/22 (g)(h) | | 820,000 | | 352,600 |
Bear Stearns Commercial Mortgage Securities, Inc. Series 2006-PW11 Class AJ, 5.6236% 3/11/39 (h) | | 5,700,000 | | 4,924,612 |
Bear Stearns Commercial Mortgage Securities Trust: | | | | |
floater Series 2006-BBA7: | | | | |
Class D, 0.6009% 3/15/19 (g)(h) | | 2,480,000 | | 2,072,139 |
Class E, 0.6609% 3/15/19 (g)(h) | | 1,995,000 | | 1,611,038 |
Class F, 0.6809% 3/15/19 (g)(h) | | 1,650,000 | | 1,274,110 |
Commercial Mortgage Securities - continued |
| Principal Amount (e) | | Value |
Bear Stearns Commercial Mortgage Securities Trust: - continued | | | | |
floater Series 2006-BBA7: | | | | |
Class G, 0.7809% 3/15/19 (g)(h) | | $ 2,760,000 | | $ 1,968,965 |
Series 2006-T22 Class B, 5.6284% 4/12/38 (g)(h) | | 2,520,000 | | 2,093,906 |
Citigroup Commercial Mortgage Trust floater Series 2007-FL3A Classs MLA2, 1.3909% 4/15/22 (g)(h) | | 800,000 | | 652,005 |
COMM pass-thru certificates Series 2001-J1A Class F, 6.958% 2/16/34 (g) | | 2,600,000 | | 2,627,255 |
Credit Suisse First Boston Mortgage Securities Corp. Series 2004-TF2A Class AX, 0.0136% 11/15/19 (g)(h)(i) | | 4,560,701 | | 228 |
Credit Suisse/Morgan Stanley Commercial Mortgage Trust: | | | | |
floater Series 2006-HC1A: | | | | |
Class A2, 0.6009% 5/15/23 (g)(h) | | 5,800,000 | | 5,474,633 |
Class D, 0.8109% 5/15/23 (g)(h) | | 1,250,000 | | 1,144,969 |
Class F, 0.9409% 5/15/23 (g)(h) | | 1,825,000 | | 1,640,680 |
Series 2006-HC1A Class A1, 0.5309% 5/15/23 (g)(h) | | 2,445,102 | | 2,330,284 |
Crest Ltd. Series 2001-1A Class C, 9% 2/25/34 (g) | | 1,000,000 | | 440,000 |
Deutsche Mortgage & Asset Receiving Corp. Series 1998-C1 Class J, 6.22% 6/15/31 | | 1,200,000 | | 980,774 |
DLJ Commercial Mortgage Corp.: | | | | |
Series 1998-CG1 Class B4, 7.4574% 6/10/31 (g)(h) | | 2,500,000 | | 2,735,966 |
Series 2000-CKP1 Class B3, 8.5482% 11/10/33 (h) | | 2,970,000 | | 2,966,191 |
First Union National Bank Commercial Mortgage Trust Series 2001-C4: | | | | |
Class H, 7.036% 12/12/33 (g) | | 2,000,000 | | 2,020,947 |
Class K, 6% 12/12/33 (g) | | 2,000,000 | | 1,948,235 |
G-Force LLC sequential payer Series 2005-RRA Class A2, 4.83% 8/22/36 (g) | | 7,545,000 | | 7,054,575 |
GE Capital Commercial Mortgage Corp.: | | | | |
Series 2001-3 Class C, 6.51% 6/10/38 | | 820,000 | | 835,259 |
Series 2002-1A Class H, 7.4003% 12/10/35 (g)(h) | | 991,000 | | 957,525 |
Global Towers Partners Acquisition Partners I LLC Series 2007-1A Class G, 7.8737% 5/15/37 (g) | | 1,000,000 | | 1,040,000 |
GMAC Commercial Mortgage Securities, Inc.: | | | | |
Series 1997-C2: | | | | |
Class F, 6.75% 4/15/29 (h) | | 2,702,284 | | 2,825,545 |
Class G, 6.75% 4/15/29 (h) | | 1,250,000 | | 1,238,451 |
Series 1999-C3: | | | | |
Class G, 6.974% 8/15/36 (g) | | 1,551,289 | | 1,557,774 |
Class J, 6.974% 8/15/36 (g) | | 1,500,000 | | 1,526,450 |
Commercial Mortgage Securities - continued |
| Principal Amount (e) | | Value |
GMAC Commercial Mortgage Securities, Inc.: - continued | | | | |
Series 2000-C1: | | | | |
Class H, 7% 3/15/33 (g) | | $ 568,791 | | $ 562,048 |
Class K, 7% 3/15/33 | | 1,100,000 | | 861,158 |
Series 2002-C3 Class D, 5.27% 7/10/39 | | 3,000,000 | | 3,037,131 |
Greenwich Capital Commercial Funding Corp.: | | | | |
sequential payer Series 2003-C1 Class D, 4.29% 7/5/35 (g) | | 2,000,000 | | 1,984,305 |
Series 2002-C1 Class H, 5.903% 1/11/35 (g) | | 880,000 | | 836,054 |
GS Mortgage Securities Corp. II floater Series 2007-EOP Class L, 1.6475% 3/1/20 (g)(h) | | 1,400,000 | | 1,148,000 |
JPMorgan Chase Commercial Mortgage Securities Corp.: | | | | |
Series 2001-A: | | | | |
Class G, 6% 10/15/32 (g)(h) | | 2,895,000 | | 14,475 |
Class X, 1.0879% 10/15/32 (g)(h)(i) | | 7,823,066 | | 217 |
Series 2009-IWST Class D, 7.6935% 12/5/27 (g)(h) | | 3,250,000 | | 3,281,771 |
JPMorgan Chase Commercial Mortgage Securities Trust floater Series 2005-FL1A Class A2, 0.5209% 2/15/19 (g)(h) | | 2,505,338 | | 2,356,715 |
JPMorgan Commercial Mortgage Finance Corp.: | | | | |
Series 1997-C5 Class F, 7.5605% 9/15/29 | | 2,719,847 | | 2,872,371 |
Series 1999-C8: | | | | |
Class G, 6% 7/15/31 (g) | | 1,385,000 | | 1,246,338 |
Class H, 6% 7/15/31 (g) | | 2,638,000 | | 131,900 |
LB Commercial Conduit Mortgage Trust Series 1998-C4 Class G, 5.6% 10/15/35 (g) | | 2,820,000 | | 2,876,682 |
LB-UBS Commercial Mortgage Trust: | | | | |
sequential payer: | | | | |
Series 2004-C2 Class E, 4.487% 3/15/36 | | 2,060,000 | | 1,928,886 |
Series 2005-C7 Class AJ, 5.323% 11/15/40 | | 6,000,000 | | 5,354,522 |
Series 2006-C7 Class AM, 5.378% 11/15/38 | | 2,040,000 | | 1,755,114 |
Series 2005-C2 Class AJ, 5.205% 4/15/30 (h) | | 8,910,000 | | 7,984,874 |
Series 2006-C4: | | | | |
Class AJ, 5.9022% 6/15/38 (h) | | 6,005,000 | | 5,038,615 |
Class AM, 5.9022% 6/15/38 (h) | | 6,700,000 | | 6,041,858 |
Leafs CMBS I Ltd./Leafs CMBS I Corp. Series 2002-1A Class B, 4.13% 11/20/37 (g) | | 1,850,000 | | 1,757,500 |
Merrill Lynch Financial Asset, Inc. Series 2005-CA16: | | | | |
Class F, 4.384% 7/12/37 | CAD | 710,000 | | 326,364 |
Class G, 4.384% 7/12/37 | CAD | 355,000 | | 157,241 |
Class H, 4.384% 7/12/37 | CAD | 236,000 | | 100,756 |
Class J, 4.384% 7/12/37 | CAD | 355,000 | | 146,146 |
Commercial Mortgage Securities - continued |
| Principal Amount (e) | | Value |
Merrill Lynch Financial Asset, Inc. Series 2005-CA16: - continued | | | | |
Class K, 4.384% 7/12/37 | CAD | 355,000 | | $ 140,967 |
Class L, 4.384% 7/12/37 | CAD | 236,000 | | 90,419 |
Class M, 4.384% 7/12/37 | CAD | 995,000 | | 281,590 |
Merrill Lynch Mortgage Investors Trust: | | | | |
Series 1999-C1 Class G, 6.71% 11/15/31 (g) | | 2,833,490 | | 283 |
Series 2001-HRPA: | | | | |
Class G, 6.778% 2/3/16 (g) | | 840,000 | | 831,600 |
Class H, 6.778% 2/3/16 (g) | | 2,130,000 | | 2,108,700 |
Merrill Lynch Mortgage Trust Series 2006-C1 Class AM, 5.8383% 5/12/39 (h) | | 1,200,000 | | 1,099,538 |
Mezz Capital Commercial Mortgage Trust Series 2004-C1: | | | | |
Class D, 6.988% 1/15/37 | | 750,000 | | 0 |
Class E, 7.983% 1/15/37 | | 1,453,000 | | 0 |
Class IO, 8.4873% 1/15/37 (h)(i) | | 5,527,084 | | 525,073 |
Morgan Stanley Capital I Trust: | | | | |
sequential payer: | | | | |
Series 2004-RR2 Class A2, 5.45% 10/28/33 (g) | | 2,260,570 | | 2,266,221 |
Series 2006-HQ10 Class AM, 5.36% 11/12/41 | | 8,200,000 | | 7,366,776 |
Series 1997-RR Class F, 7.4307% 4/30/39 (g)(h) | | 3,249,026 | | 2,989,104 |
Series 1998-CF1 Class G, 7.35% 7/15/32 (g) | | 2,830,092 | | 1,415,046 |
Series 2005-HQ7 Class E, 5.3761% 11/14/42 (h) | | 850,000 | | 433,500 |
Series 2006-IQ12 Class AMFX, 5.37% 12/15/43 | | 7,500,000 | | 6,337,500 |
Morgan Stanley Dean Witter Capital I Trust Series 2001-IQA Class F, 6.79% 12/18/32 (g) | | 1,486,185 | | 1,509,189 |
Multi Security Asset Trust sequential payer Series 2005-RR4A Class A2, 4.83% 11/28/35 (g) | | 3,152,092 | | 2,935,386 |
Providence Place Group Ltd. Partnership Series 2000-C1 Class A2, 7.75% 7/20/28 (g) | | 3,128,112 | | 3,128,112 |
RBSCF Trust Series 2010-MB1 Class D, 4.8194% 4/15/24 (g)(h) | | 5,820,000 | | 5,298,928 |
Structured Asset Securities Corp.: | | | | |
Series 1996-CFL Class I, 7.75% 2/25/28 (g) | | 3,827,943 | | 3,923,641 |
Series 1997-LLI Class F, 7.3% 10/12/34 (g) | | 2,170,000 | | 2,200,209 |
TIAA Seasoned Commercial Mortgage Trust sequential payer Series 2007-C4 Class AJ, 6.0712% 8/15/39 (h) | | 2,080,000 | | 2,009,231 |
TimberStar Trust I Series 2006-1 Class F, 7.5296% 10/15/36 (g) | | 6,460,000 | | 6,395,400 |
UBS Commercial Mortgage Trust Series 2007-FL1 Class F, 0.9159% 7/15/24 (g)(h) | | 1,200,000 | | 289,236 |
Commercial Mortgage Securities - continued |
| Principal Amount (e) | | Value |
Wachovia Bank Commercial Mortgage Trust: | | | | |
floater Series 2007-WHL8 Class MH1, 1.1409% 6/15/20 (g)(h) | | $ 1,800,000 | | $ 1,490,968 |
Series 2004-C10 Class E, 4.931% 2/15/41 | | 2,000,000 | | 1,843,444 |
Series 2004-C12 Class D, 5.4836% 7/15/41 (h) | | 2,750,000 | | 2,444,518 |
Series 2004-C14 Class B, 5.17% 8/15/41 | | 3,180,000 | | 3,080,420 |
TOTAL COMMERCIAL MORTGAGE SECURITIES (Cost $188,261,532) | 184,679,954 |
Floating Rate Loans - 1.5% |
|
CONSUMER DISCRETIONARY - 0.0% |
Specialty Retail - 0.0% |
The Pep Boys - Manny, Moe & Jack term loan 2.54% 10/27/13 (h) | | 28,155 | | 26,888 |
FINANCIALS - 1.2% |
Diversified Financial Services - 0.1% |
TowerCo Finance LLC term loan 6% 11/24/14 (h) | | 568,147 | | 569,568 |
Real Estate Investment Trusts - 0.2% |
Medical Properties Trust, Inc. Tranche B, term loan 5% 5/17/16 (h) | | 2,000,000 | | 1,970,000 |
Real Estate Management & Development - 0.9% |
CB Richard Ellis Services, Inc. Tranche B1-A, term loan 6.5% 12/20/15 (h) | | 2,298,941 | | 2,284,573 |
Realogy Corp.: | | | | |
Credit-Linked Deposit 3.35% 10/10/13 (h) | | 1,186,117 | | 1,034,887 |
Tranche 2LN, term loan 13.5% 10/15/17 | | 2,500,000 | | 2,625,000 |
Tranche B, term loan 3.3472% 10/10/13 (h) | | 4,405,577 | | 3,843,866 |
| | 9,788,326 |
TOTAL FINANCIALS | | 12,327,894 |
HEALTH CARE - 0.3% |
Health Care Providers & Services - 0.3% |
Skilled Healthcare Group, Inc. term loan: | | | | |
5.25% 4/9/16 (h) | | 1,628,362 | | 1,514,377 |
Floating Rate Loans - continued |
| Principal Amount (e) | | Value |
HEALTH CARE - continued |
Health Care Providers & Services - continued |
Skilled Healthcare Group, Inc. term loan: - continued | | | | |
5.25% 4/9/16 (h) | | $ 148,438 | | $ 138,047 |
Universal Health Services, Inc. term loan 7/28/16 (h) | | 2,000,000 | | 1,982,400 |
| | 3,634,824 |
TOTAL FLOATING RATE LOANS (Cost $16,036,884) | 15,989,606 |
Preferred Securities - 0.0% |
| | | |
FINANCIALS - 0.0% |
Diversified Financial Services - 0.0% |
Cairn High Grade ABS CDO PLC Series 2006-2A Class SUB, 1/13/47 (g) | 1,000,000 | | 0 |
Crest Clarendon Street 2002-1 Ltd. Series 2002-1A Class PS, 12/28/35 (g) | 500,000 | | 85,000 |
Crest Dartmouth Street 2003 1 Ltd. Series 2003-1A Class PS, 6/28/38 (g) | 1,220,000 | | 280,600 |
Harp High Grade CDO I Ltd. Series 2006-1, 7/8/46 (g) | 810,000 | | 8 |
Ipswich Street CDO Series 2006-1, 6/27/46 (d)(g) | 1,350,000 | | 0 |
Kent Funding III Ltd. 11/5/47 (g) | 1,650,000 | | 0 |
| | 365,608 |
TOTAL PREFERRED SECURITIES (Cost $5,781,511) | 365,608 |
Money Market Funds - 10.1% |
| Shares | | |
Fidelity Cash Central Fund, 0.24% (b) | 101,267,689 | | 101,267,689 |
Fidelity Securities Lending Cash Central Fund, 0.27% (b)(c) | 3,560,975 | | 3,560,975 |
TOTAL MONEY MARKET FUNDS (Cost $104,828,664) | 104,828,664 |
Cash Equivalents - 0.3% |
| Maturity Amount | | Value |
Investments in repurchase agreements in a joint trading account at 0.21%, dated 7/30/10 due 8/2/10 (Collateralized by U.S. Government Obligations) #
(Cost $2,682,000) | $ 2,682,047 | | $ 2,682,000 |
TOTAL INVESTMENT PORTFOLIO - 100.3% (Cost $1,027,625,028) | | 1,042,028,216 |
NET OTHER ASSETS (LIABILITIES) - (0.3)% | | (3,177,633) |
NET ASSETS - 100% | $ 1,038,850,583 |
Currency Abbreviations |
CAD | - | Canadian dollar |
Legend |
(a) Non-income producing |
(b) Affiliated fund that is available only to investment companies and other accounts managed by Fidelity Investments. The rate quoted is the annualized seven-day yield of the fund at period end. A complete unaudited listing of the fund's holdings as of its most recent quarter end is available upon request. |
(c) Investment made with cash collateral received from securities on loan. |
(d) Non-income producing - Issuer is in default. |
(e) Principal amount is stated in United States dollars unless otherwise noted. |
(f) Security or a portion of the security is on loan at period end. |
(g) Security exempt from registration under Rule 144A of the Securities Act of 1933. These securities may be resold in transactions exempt from registration, normally to qualified institutional buyers. At the end of the period, the value of these securities amounted to $242,980,827 or 23.4% of net assets. |
(h) The coupon rate shown on floating or adjustable rate securities represents the rate at period end. |
(i) Security represents right to receive monthly interest payments on an underlying pool of mortgages or assets. Principal shown is the outstanding par amount of the pool held as of the end of the period. |
(j) Restricted securities - Investment in securities not registered under the Securities Act of 1933 (excluding 144A issues). At the end of the period, the value of restricted securities (excluding 144A issues) amounted to $273,819 or 0.0% of net assets. |
Additional information on each holding is as follows: |
Security | Acquisition Date | Acquisition Cost |
Fannie Mae REMIC Trust: Series 2001-W3 subordinate REMIC pass thru certificates, Class B3, 7% 9/25/41 | 5/21/03 | $ 175,074 |
Series 2003-W1 subordinate REMIC pass thru certificates, Class B3, 5.75% 12/25/42 | 3/25/03 | $ 208,646 |
GSR Mortgage Loan Trust Series 2005-HE3 Class B3, 2.8288% 6/25/35 | 6/3/05 | $ 1,110,697 |
# Additional information on each counterparty to the repurchase agreement is as follows: |
Repurchase Agreement / Counterparty | Value |
$2,682,000 due 8/02/10 at 0.21% |
BNP Paribas Securities Corp. | $ 1,071,608 |
Banc of America Securities LLC | 405,435 |
Barclays Capital, Inc. | 1,204,957 |
| $ 2,682,000 |
Affiliated Central Funds |
Information regarding fiscal year to date income earned by the Fund from investments in Fidelity Central Funds is as follows: |
Fund | Income earned |
Fidelity Cash Central Fund | $ 122,644 |
Fidelity Securities Lending Cash Central Fund | 6,300 |
Total | $ 128,944 |
Other Information |
The following is a summary of the inputs used, as of July 31, 2010, involving the Fund's assets and liabilities carried at fair value. The inputs or methodology used for valuing securities may not be an indication of the risk associated with investing in those securities. For more information on valuation inputs, and their aggregation into the levels used in the tables below, please refer to the Security Valuation section in the accompanying Notes to Financial Statements. |
Valuation Inputs at Reporting Date: |
Description | Total | Level 1 | Level 2 | Level 3 |
Investments in Securities: | | | | |
Equities: | | | | |
Consumer Discretionary | $ 7,609,195 | $ 3,913,195 | $ - | $ 3,696,000 |
Financials | 321,306,447 | 300,180,030 | 17,204,173 | 3,922,244 |
Health Care | 12,220,579 | 12,220,579 | - | - |
Materials | 997,530 | 997,530 | - | - |
Corporate Bonds | 308,207,773 | - | 306,837,773 | 1,370,000 |
Asset-Backed Securities | 54,395,984 | - | 37,509,028 | 16,886,956 |
Collateralized Mortgage Obligations | 28,744,876 | - | 27,750,321 | 994,555 |
Commercial Mortgage Securities | 184,679,954 | - | 172,427,208 | 12,252,746 |
Floating Rate Loans | 15,989,606 | - | 15,989,606 | - |
Preferred Securities | 365,608 | - | - | 365,608 |
Money Market Funds | 104,828,664 | 104,828,664 | - | - |
Cash Equivalents | 2,682,000 | - | 2,682,000 | - |
Total Investments in Securities: | $ 1,042,028,216 | $ 422,139,998 | $ 580,400,109 | $ 39,488,109 |
The following is a reconciliation of Investments in Securities for which Level 3 inputs were used in determining value: |
Investments in Securities: | |
Equities - Consumer Discretionary | |
Beginning Balance | $ - |
Total Realized Gain (Loss) | - |
Total Unrealized Gain (Loss) | 2,304,225 |
Cost of Purchases | 1,391,775 |
Proceeds of Sales | - |
Amortization/Accretion | - |
Transfers in to Level 3 | - |
Transfers out of Level 3 | - |
Ending Balance | $ 3,696,000 |
The change in unrealized gain (loss) for the period attributable to Level 3 securities held at July 31, 2010 | $ 2,304,225 |
Equities - Financials | |
Beginning Balance | $ 3,099,870 |
Total Realized Gain (Loss) | (2,073,397) |
Total Unrealized Gain (Loss) | 3,167,065 |
Cost of Purchases | 607 |
Proceeds of Sales | (271,913) |
Amortization/Accretion | - |
Transfers in to Level 3 | 12 |
Transfers out of Level 3 | - |
Ending Balance | $ 3,922,244 |
The change in unrealized gain (loss) for the period attributable to Level 3 securities held at July 31, 2010 | $ 932,126 |
Corporate Bonds | |
Beginning Balance | $ 2,343,856 |
Total Realized Gain (Loss) | - |
Total Unrealized Gain (Loss) | (230,253) |
Cost of Purchases | - |
Proceeds of Sales | - |
Amortization/Accretion | - |
Transfers in to Level 3 | - |
Transfers out of Level 3 | (743,603) |
Ending Balance | $ 1,370,000 |
The change in unrealized gain (loss) for the period attributable to Level 3 securities held at July 31, 2010 | $ (230,253) |
Asset-Backed Securities | |
Beginning Balance | $ 11,832,848 |
Total Realized Gain (Loss) | 164,843 |
Total Unrealized Gain (Loss) | 2,972,785 |
Cost of Purchases | 7,476,085 |
Proceeds of Sales | (1,606,631) |
Amortization/Accretion | (329,128) |
Transfers in to Level 3 | 1,375,000 |
Transfers out of Level 3 | (4,998,846) |
Ending Balance | $ 16,886,956 |
The change in unrealized gain (loss) for the period attributable to Level 3 securities held at July 31, 2010 | $ 2,907,249 |
Collateralized Mortgage Obligations | |
Beginning Balance | $ 2,036,201 |
Total Realized Gain (Loss) | 296,490 |
Total Unrealized Gain (Loss) | 3,450,561 |
Cost of Purchases | - |
Proceeds of Sales | (3,529,343) |
Amortization/Accretion | (534,455) |
Transfers in to Level 3 | 26,799 |
Transfers out of Level 3 | (751,698) |
Ending Balance | $ 994,555 |
The change in unrealized gain (loss) for the period attributable to Level 3 securities held at July 31, 2010 | $ 547,954 |
Commercial Mortgage Securities | |
Beginning Balance | $ 6,157,272 |
Total Realized Gain (Loss) | - |
Total Unrealized Gain (Loss) | 1,065,436 |
Cost of Purchases | 8,051,715 |
Proceeds of Sales | (85,393) |
Amortization/Accretion | (168,765) |
Transfers in to Level 3 | 527,055 |
Transfers out of Level 3 | (3,294,574) |
Ending Balance | $ 12,252,746 |
The change in unrealized gain (loss) for the period attributable to Level 3 securities held at July 31, 2010 | $ 706,900 |
Preferred Securities | |
Beginning Balance | $ 159,115 |
Total Realized Gain (Loss) | - |
Total Unrealized Gain (Loss) | 83,968 |
Cost of Purchases | 113,400 |
Proceeds of Sales | - |
Amortization/Accretion | 9,125 |
Transfers in to Level 3 | - |
Transfers out of Level 3 | - |
Ending Balance | $ 365,608 |
The change in unrealized gain (loss) for the period attributable to Level 3 securities held at July 31, 2010 | $ 83,968 |
The information used in the above reconciliation represents fiscal year to date activity for any Investments in Securities identified as using Level 3 inputs at either the beginning or the end of the current fiscal period. Transfers in or out of Level 3 represent the beginning value of any Security or Instrument where a change in the pricing level occurred from the beginning to the end of the period. The cost of purchases and the proceeds of sales may include securities received or delivered through corporate actions or exchanges. Realized and unrealized gains (losses) disclosed in the reconciliation are included in Net Gain (Loss) on the Fund's Statement of Operations. |
The composition of credit quality ratings as a percentage of net assets is as follows (ratings are unaudited): |
U.S. Government and U.S. Government Agency Obligations | 0.0%* |
AAA,AA,A | 15.7% |
BBB | 16.6% |
BB | 5.2% |
B | 5.3% |
CCC,CC,C | 2.8% |
D | 0.0%* |
Not Rated | 11.4% |
Equities | 32.9% |
Short-Term Investments and Net Other Assets | 10.1% |
| 100.0% |
* Amount represents less than 0.1% |
We have used ratings from Moody's Investors Service, Inc. Where Moody's ratings are not available, we have used S&P ratings. All ratings are as of the report date and do not reflect subsequent downgrades. |
Income Tax Information |
At July 31, 2010, the Fund had a capital loss carryforward of approximately $13,906,408 of which $302,434 and $13,603,974 will expire on July 31, 2016 and 2017, respectively. Capital loss carryforwards are only available to offset future capital gains of the Fund to the extent provided by regulations and may be limited. |
See accompanying notes which are an integral part of the financial statements.
Annual Report
Statement of Assets and Liabilities
| July 31, 2010 |
| | |
Assets | | |
Investment in securities, at value (including securities loaned of $3,465,460 and repurchase agreements of $2,682,000) - See accompanying schedule: Unaffiliated issuers (cost $922,796,364) | $ 937,199,552 | |
Fidelity Central Funds (cost $104,828,664) | 104,828,664 | |
Total Investments (cost $1,027,625,028) | | $ 1,042,028,216 |
Cash | | 12,910 |
Receivable for investments sold | | 59,082 |
Receivable for fund shares sold | | 3,904,419 |
Dividends receivable | | 2,212,230 |
Interest receivable | | 5,665,975 |
Distributions receivable from Fidelity Central Funds | | 16,214 |
Other receivables | | 6,136 |
Total assets | | 1,053,905,182 |
| | |
Liabilities | | |
Payable for investments purchased | $ 9,453,671 | |
Payable for fund shares redeemed | 1,242,558 | |
Accrued management fee | 450,916 | |
Distribution fees payable | 1,158 | |
Other affiliated payables | 265,254 | |
Other payables and accrued expenses | 80,067 | |
Collateral on securities loaned, at value | 3,560,975 | |
Total liabilities | | 15,054,599 |
| | |
Net Assets | | $ 1,038,850,583 |
Net Assets consist of: | | |
Paid in capital | | $ 1,029,732,177 |
Undistributed net investment income | | 11,035,447 |
Accumulated undistributed net realized gain (loss) on investments and foreign currency transactions | | (16,345,917) |
Net unrealized appreciation (depreciation) on investments and assets and liabilities in foreign currencies | | 14,428,876 |
Net Assets | | $ 1,038,850,583 |
See accompanying notes which are an integral part of the financial statements.
Annual Report
Statement of Assets and Liabilities - continued
| July 31, 2010 |
| | |
Calculation of Maximum Offering Price
Class A:
Net Asset Value and redemption price per share
($3,830,229 ÷ 385,150 shares) | | $ 9.94 |
| | |
Maximum offering price per share (100/96.00 of $9.94) | | $ 10.35 |
Class T:
Net Asset Value and redemption price per share ($861,570 ÷ 86,640 shares) | | $ 9.94 |
| | |
Maximum offering price per share (100/96.00 of $9.94) | | $ 10.35 |
Class C:
Net Asset Value and offering price per share
($835,566 ÷ 84,150 shares)A | | $ 9.93 |
| | |
Real Estate Income:
Net Asset Value, offering price and redemption price per share ($1,030,393,032 ÷ 103,518,377 shares) | | $ 9.95 |
| | |
Institutional Class:
Net Asset Value, offering price and redemption price per share ($2,930,186 ÷ 294,473 shares) | | $ 9.95 |
A Redemption price per share is equal to net asset value less any applicable contingent deferred sales charge.
See accompanying notes which are an integral part of the financial statements.
Annual Report
Financial Statements - continued
Statement of Operations
| Year ended July 31, 2010 |
| | |
Investment Income | | |
Dividends | | $ 14,605,009 |
Interest | | 33,888,914 |
Income from Fidelity Central Funds | | 128,944 |
Total income | | 48,622,867 |
| | |
Expenses | | |
Management fee | $ 4,142,289 | |
Transfer agent fees | 2,353,943 | |
Distribution fees | 2,342 | |
Accounting and security lending fees | 331,606 | |
Custodian fees and expenses | 25,321 | |
Independent trustees' compensation | 3,983 | |
Registration fees | 139,993 | |
Audit | 158,498 | |
Legal | 9,943 | |
Miscellaneous | 9,004 | |
Total expenses before reductions | 7,176,922 | |
Expense reductions | (70,219) | 7,106,703 |
Net investment income (loss) | | 41,516,164 |
Realized and Unrealized Gain (Loss) Net realized gain (loss) on: | | |
Investment securities: | | |
Unaffiliated issuers | 20,622,501 | |
Foreign currency transactions | 2,968 | |
Total net realized gain (loss) | | 20,625,469 |
Change in net unrealized appreciation (depreciation) on: Investment securities | 102,834,422 | |
Assets and liabilities in foreign currencies | 21,305 | |
Total change in net unrealized appreciation (depreciation) | | 102,855,727 |
Net gain (loss) | | 123,481,196 |
Net increase (decrease) in net assets resulting from operations | | $ 164,997,360 |
See accompanying notes which are an integral part of the financial statements.
Annual Report
Statement of Changes in Net Assets
| Year ended
July 31,
2010 | Year ended
July 31,
2009 |
Increase (Decrease) in Net Assets | | |
Operations | | |
Net investment income (loss) | $ 41,516,164 | $ 24,141,669 |
Net realized gain (loss) | 20,625,469 | (25,453,488) |
Change in net unrealized appreciation (depreciation) | 102,855,727 | (12,255,306) |
Net increase (decrease) in net assets resulting
from operations | 164,997,360 | (13,567,125) |
Distributions to shareholders from net investment income | (40,150,798) | (21,152,317) |
Share transactions - net increase (decrease) | 450,504,667 | 104,590,330 |
Redemption fees | 230,512 | 250,779 |
Total increase (decrease) in net assets | 575,581,741 | 70,121,667 |
| | |
Net Assets | | |
Beginning of period | 463,268,842 | 393,147,175 |
End of period (including undistributed net investment income of $11,035,447 and undistributed net investment income of $8,560,696, respectively) | $ 1,038,850,583 | $ 463,268,842 |
See accompanying notes which are an integral part of the financial statements.
Annual Report
Financial Highlights - Class A
Period ended July 31, | 2010 H |
Selected Per-Share Data | |
Net asset value, beginning of period | $ 9.95 |
Income from Investment Operations | |
Net investment income (loss) E | .18 |
Net realized and unrealized gain (loss) | (.04) |
Total from investment operations | .14 |
Distributions from net investment income | (.15) |
Redemption fees added to paid in capital E | -J |
Net asset value, end of period | $ 9.94 |
Total Return B, C, D | 1.46% |
Ratios to Average Net Assets F, I | |
Expenses before reductions | 1.09% A |
Expenses net of fee waivers, if any | 1.09% A |
Expenses net of all reductions | 1.09% A |
Net investment income (loss) | 6.23% A |
Supplemental Data | |
Net assets, end of period (000 omitted) | $ 3,830 |
Portfolio turnover rate G | 28% |
A Annualized
B Total returns for periods of less than one year are not annualized.
C Total returns would have been lower had certain expenses not been reduced during the periods shown.
D Total returns do not include the effect of the sales charges.
E Calculated based on average shares outstanding during the period.
F Fees and expenses of the underlying Fidelity Central Funds are not included in the Fund's expense ratio. The Fund indirectly bears its proportionate share of the expenses of any underlying Fidelity Central Funds.
G Amount does not include the portfolio activity of any underlying Fidelity Central Funds.
H For the period April 14, 2010 (commencement of sale of shares) to July 31, 2010.
I Expense ratios reflect operating expenses of the class. Expenses before reductions do not reflect amounts reimbursed by the investment adviser or reductions from brokerage service arrangements or reductions from other expense offset arrangements and do not represent the amount paid by the class during periods when reimbursements or reductions occur. Expense ratios before reductions for start-up periods may not be representative of longer-term operating periods. Expenses net of fee waivers reflect expenses after reimbursement by the investment adviser but prior to reductions from brokerage service arrangements or other expense offset arrangements. Expenses net of all reductions represent the net expenses paid by the class.
J Amount represents less than $.01 per share.
See accompanying notes which are an integral part of the financial statements.
Annual Report
Financial Highlights - Class T
Period ended July 31, | 2010 H |
Selected Per-Share Data | |
Net asset value, beginning of period | $ 9.95 |
Income from Investment Operations | |
Net investment income (loss) E | .17 |
Net realized and unrealized gain (loss) | (.03) |
Total from investment operations | .14 |
Distributions from net investment income | (.15) |
Redemption fees added to paid in capital E | -J |
Net asset value, end of period | $ 9.94 |
Total Return B, C, D | 1.45% |
Ratios to Average Net Assets F, I | |
Expenses before reductions | 1.17% A |
Expenses net of fee waivers, if any | 1.17% A |
Expenses net of all reductions | 1.17% A |
Net investment income (loss) | 5.92% A |
Supplemental Data | |
Net assets, end of period (000 omitted) | $ 862 |
Portfolio turnover rate G | 28% |
A Annualized
B Total returns for periods of less than one year are not annualized.
C Total returns would have been lower had certain expenses not been reduced during the periods shown.
D Total returns do not include the effect of the sales charges.
E Calculated based on average shares outstanding during the period.
F Fees and expenses of the underlying Fidelity Central Funds are not included in the Fund's expense ratio. The Fund indirectly bears its proportionate share of the expenses of any underlying Fidelity Central Funds.
G Amount does not include the portfolio activity of any underlying Fidelity Central Funds.
H For the period April 14, 2010 (commencement of sale of shares) to July 31, 2010.
I Expense ratios reflect operating expenses of the class. Expenses before reductions do not reflect amounts reimbursed by the investment adviser or reductions from brokerage service arrangements or reductions from other expense offset arrangements and do not represent the amount paid by the class during periods when reimbursements or reductions occur. Expense ratios before reductions for start-up periods may not be representative of longer-term operating periods. Expenses net of fee waivers reflect expenses after reimbursement by the investment adviser but prior to reductions from brokerage service arrangements or other expense offset arrangements. Expenses net of all reductions represent the net expenses paid by the class.
J Amount represents less than $.01 per share.
See accompanying notes which are an integral part of the financial statements.
Annual Report
Financial Highlights - Class C
Period ended July 31, | 2010 H |
Selected Per-Share Data | |
Net asset value, beginning of period | $ 9.95 |
Income from Investment Operations | |
Net investment income (loss) E | .15 |
Net realized and unrealized gain (loss) | (.03) |
Total from investment operations | .12 |
Distributions from net investment income | (.14) |
Redemption fees added to paid in capital E | -J |
Net asset value, end of period | $ 9.93 |
Total Return B, C, D | 1.29% |
Ratios to Average Net Assets F, I | |
Expenses before reductions | 1.86% A |
Expenses net of fee waivers, if any | 1.86% A |
Expenses net of all reductions | 1.86% A |
Net investment income (loss) | 5.21% A |
Supplemental Data | |
Net assets, end of period (000 omitted) | $ 836 |
Portfolio turnover rate G | 28% |
A Annualized
B Total returns for periods of less than one year are not annualized.
C Total returns would have been lower had certain expenses not been reduced during the periods shown.
D Total returns do not include the effect of the contingent deferred sales charge.
E Calculated based on average shares outstanding during the period.
F Fees and expenses of the underlying Fidelity Central Funds are not included in the Fund's expense ratio. The Fund indirectly bears its proportionate share of the expenses of any underlying Fidelity Central Funds.
G Amount does not include the portfolio activity of any underlying Fidelity Central Funds.
H For the period April 14, 2010 (commencement of sale of shares) to July 31, 2010.
I Expense ratios reflect operating expenses of the class. Expenses before reductions do not reflect amounts reimbursed by the investment adviser or reductions from brokerage service arrangements or reductions from other expense offset arrangements and do not represent the amount paid by the class during periods when reimbursements or reductions occur. Expense ratios before reductions for start-up periods may not be representative of longer-term operating periods. Expenses net of fee waivers reflect expenses after reimbursement by the investment adviser but prior to reductions from brokerage service arrangements or other expense offset arrangements. Expenses net of all reductions represent the net expenses paid by the class.
J Amount represents less than $.01 per share.
See accompanying notes which are an integral part of the financial statements.
Annual Report
Financial Highlights - Real Estate Income
Years ended July 31, | 2010 | 2009 | 2008 | 2007 | 2006 |
Selected Per-Share Data | | | | | |
Net asset value, beginning of period | $ 8.21 | $ 9.43 | $ 11.22 | $ 11.78 | $ 12.17 |
Income from Investment Operations | | | | | |
Net investment income
(loss) B | .53 | .54 | .59 | .63 | .66 |
Net realized and unrealized gain (loss) | 1.73 | (1.27) | (1.48) | (.37) | (.11) |
Total from investment operations | 2.26 | (.73) | (.89) | .26 | .55 |
Distributions from net investment income | (.52) | (.50) | (.66) | (.58) | (.67) |
Distributions from net realized gain | - | - | (.24) | (.24) | (.27) |
Total distributions | (.52) | (.50) | (.90) | (.82) | (.94) |
Redemption fees added to paid in capital B | - F | .01 | - F | - F | - F |
Net asset value, end of period | $ 9.95 | $ 8.21 | $ 9.43 | $ 11.22 | $ 11.78 |
Total Return A | 28.29% | (6.92)% | (8.43)% | 2.00% | 4.82% |
Ratios to Average Net Assets C, E | | | | | |
Expenses before reductions | .97% | 1.00% | .94% | .88% | .85% |
Expenses net of fee waivers,
if any | .96% | 1.00% | .94% | .88% | .85% |
Expenses net of all reductions | .96% | 1.00% | .94% | .88% | .85% |
Net investment income (loss) | 5.60% | 7.15% | 5.77% | 5.30% | 5.61% |
Supplemental Data | | | | | |
Net assets, end of period
(000 omitted) | $ 1,030,393 | $ 463,269 | $ 393,147 | $ 516,268 | $ 521,265 |
Portfolio turnover rate D | 28% | 47% | 32% | 45% | 27% |
A Total returns would have been lower had certain expenses not been reduced during the periods shown.
B Calculated based on average shares outstanding during the period.
C Fees and expenses of the underlying Fidelity Central Funds are not included in the Fund's expense ratio. The Fund indirectly bears its proportionate share of the expenses of any underlying Fidelity Central Funds.
D Amount does not include the portfolio activity of any underlying Fidelity Central Funds.
E Expense ratios reflect operating expenses of the class. Expenses before reductions do not reflect amounts reimbursed by the investment adviser or reductions from brokerage service arrangements or reductions from other expense offset arrangements and do not represent the amount paid by the class during periods when reimbursements or reductions occur. Expenses net of fee waivers reflect expenses after reimbursement by the investment adviser but prior to reductions from brokerage service arrangements or other expense offset arrangements. Expenses net of all reductions represent the net expenses paid by the class.
F Amount represents less than $.01 per share.
See accompanying notes which are an integral part of the financial statements.
Annual Report
Financial Highlights - Institutional Class
Period ended July 31, | 2010 G |
Selected Per-Share Data | |
Net asset value, beginning of period | $ 9.95 |
Income from Investment Operations | |
Net investment income (loss) D | .19 |
Net realized and unrealized gain (loss) | (.04) |
Total from investment operations | .15 |
Distributions from net investment income | (.15) |
Redemption fees added to paid in capital D | -I |
Net asset value, end of period | $ 9.95 |
Total Return B, C | 1.58% |
Ratios to Average Net Assets E,H | |
Expenses before reductions | .85% A |
Expenses net of fee waivers, if any | .85% A |
Expenses net of all reductions | .85% A |
Net investment income (loss) | 6.70% A |
Supplemental Data | |
Net assets, end of period (000 omitted) | $ 2,930 |
Portfolio turnover rate F | 28% |
A Annualized
B Total returns for periods of less than one year are not annualized.
C Total returns would have been lower had certain expenses not been reduced during the periods shown.
D Calculated based on average shares outstanding during the period.
E Fees and expenses of the underlying Fidelity Central Funds are not included in the Fund's expense ratio. The Fund indirectly bears its proportionate share of the expenses of any underlying Fidelity Central Funds.
F Amount does not include the portfolio activity of any underlying Fidelity Central Funds.
G For the period April 14, 2010 (commencement of sale of shares) to July 31, 2010.
H Expense ratios reflect operating expenses of the class. Expenses before reductions do not reflect amounts reimbursed by the investment adviser or reductions from brokerage service arrangements or reductions from other expense offset arrangements and do not represent the amount paid by the class during periods when reimbursements or reductions occur. Expense ratios before reductions for start-up periods may not be representative of longer-term operating periods. Expenses net of fee waivers reflect expenses after reimbursement by the investment adviser but prior to reductions from brokerage service arrangements or other expense offset arrangements. Expenses net of all reductions represent the net expenses paid by the class.
I Amount represents less than $.01 per share.
See accompanying notes which are an integral part of the financial statements.
Annual Report
Notes to Financial Statements
For the period ended July 31, 2010
1. Organization.
Fidelity Real Estate Income Fund (the Fund) is a fund of Fidelity Securities Fund (the Trust) and is authorized to issue an unlimited number of shares. The Trust is registered under the Investment Company Act of 1940, as amended (the 1940 Act), as an open-end management investment company organized as a Massachusetts business trust. The Fund commenced sale of Class A, Class T, Class C, and Institutional Class shares and the existing class was designated Real Estate Income on April 14, 2010. The Fund offers Class A, Class T, Class C, Real Estate Income and Institutional Class shares, each of which has equal rights as to assets and voting privileges. Each class has exclusive voting rights with respect to matters that affect that class. Investment income, realized and unrealized capital gains and losses, the common expenses of the Fund, and certain fund-level expense reductions, if any, are allocated on a pro-rata basis to each class based on the relative net assets of each class to the total net assets of the Fund. Each class differs with respect to transfer agent and distribution and service plan fees incurred. Certain expense reductions also differ by class.
2. Investments in Fidelity Central Funds.
The Fund may invest in Fidelity Central Funds, which are open-end investment companies available only to other investment companies and accounts managed by Fidelity Management & Research Company (FMR) and its affiliates. The Fund's Schedule of Investments lists each of the Fidelity Central Funds held as of period end, if any, as an investment of the Fund, but does not include the underlying holdings of each Fidelity Central Fund. As an Investing Fund, the Fund indirectly bears its proportionate share of the expenses of the underlying Fidelity Central Funds.
The Money Market Central Funds seek preservation of capital and current income and are managed by Fidelity Investments Money Management, Inc. (FIMM), an affiliate of FMR.
A complete unaudited list of holdings for each Fidelity Central Fund is available upon request or at the Securities and Exchange Commission (the SEC) web site at www.sec.gov. In addition, the financial statements of the Fidelity Central Funds which are not covered by the Fund's Report of Independent Registered Public Accounting Firm, are available on the SEC web site or upon request.
3. Significant Accounting Policies.
The financial statements have been prepared in conformity with accounting principles generally accepted in the United States of America (GAAP), which require management to make certain estimates and assumptions at the date of the financial statements. Actual results could differ from those estimates. The following summarizes the significant accounting policies of the Fund:
Annual Report
3. Significant Accounting Policies - continued
Security Valuation. Investments are valued as of 4:00 p.m. Eastern time on the last calendar day of the period. The Fund uses independent pricing services approved by the Board of Trustees to value its investments. When current market prices or quotations are not readily available or reliable, valuations may be determined in good faith in accordance with procedures adopted by the Board of Trustees. Factors used in determining value may include market or security specific events, changes in interest rates and credit quality. The frequency with which these procedures are used cannot be predicted and they may be utilized to a significant extent. The value used for net asset value (NAV) calculation under these procedures may differ from published prices for the same securities.
The Fund categorizes the inputs to valuation techniques used to value its investments into a disclosure hierarchy consisting of three levels as shown below.
Level 1 - quoted prices in active markets for identical investments
Level 2 - other significant observable inputs (including quoted prices for similar investments, interest rates, prepayment speeds, etc.)
Level 3 - unobservable inputs (including the fund's own assumptions based on the best information available)
Changes in valuation techniques may result in transfers in or out of an assigned level within the disclosure hierarchy. The aggregate value of investments by input level, as of July 31, 2010, as well as a rollforward of level 3 securities, is included at the end of the Fund's Schedule of Investments. Valuation techniques used to value the Fund's investments by major category are as follows.
Equity securities, including restricted securities, for which market quotations are readily available, are valued at the last reported sale price or official closing price as reported by an independent pricing service on the primary market or exchange on which they are traded and are categorized as Level 1 in the hierarchy. In the event there were no sales during the day or closing prices are not available, securities are valued at the last quoted bid price or may be valued using the last available price and are generally categorized as Level 2 in the hierarchy. For foreign equity securities, when significant market or security specific events arise, comparisons to the valuation of American Depositary Receipts (ADRs), futures contracts, Exchange-traded funds (ETFs) and certain indexes as well as quoted prices for similar securities are used and are categorized as Level 2 in the hierarchy in these circumstances. Utilizing these techniques may result in transfers between Level 1 and Level 2. For restricted equity securities and private placements where observable inputs are limited, assumptions about market activity and risk are used and are categorized as Level 3 in the hierarchy.
Annual Report
Notes to Financial Statements - continued
3. Significant Accounting Policies - continued
Security Valuation - continued
Debt securities, including restricted securities, are valued based on evaluated prices received from independent pricing services or from dealers who make markets in such securities. For corporate bonds, floating rate loans and preferred securities, pricing services utilize matrix pricing which considers yield or price of bonds of comparable quality, coupon, maturity and type as well as dealer supplied prices and are generally categorized as Level 2 in the hierarchy. For asset backed securities, collateralized mortgage obligations and commercial mortgage securities, pricing services utilize matrix pricing which considers prepayment speed assumptions, attributes of the collateral, yield or price of bonds of comparable quality, coupon, maturity and type as well as dealer supplied prices and, accordingly, such securities are generally categorized as Level 2 in the hierarchy.
Investments in open-end mutual funds, including the Fidelity Central Funds, are valued at their closing net asset value each business day and are categorized as Level 1 in the hierarchy. Short-term securities with remaining maturities of sixty days or less for which quotations are not readily available are valued at amortized cost, which approximates fair value and are categorized as Level 2 in the hierarchy.
When independent prices are unavailable or unreliable, debt securities may be valued utilizing pricing matrices which consider similar factors that would be used by independent pricing services. These are generally categorized as Level 2 in the hierarchy but may be Level 3 depending on the circumstances. Certain of the Fund's securities may be valued by a single source or dealer.
Foreign Currency. The Fund uses foreign currency contracts to facilitate transactions in foreign-denominated securities. Gains and losses from these transactions may arise from changes in the value of the foreign currency or if the counterparties do not perform under the contracts' terms.
Foreign-denominated assets, including investment securities, and liabilities are translated into U.S. dollars at the exchange rate at period end. Purchases and sales of investment securities, income and dividends received and expenses denominated in foreign currencies are translated into U.S. dollars at the exchange rate in effect on the transaction date.
The effects of exchange rate fluctuations on investments are included with the net realized and unrealized gain (loss) on investment securities. Other foreign currency transactions resulting in realized and unrealized gain (loss) are disclosed separately.
Annual Report
3. Significant Accounting Policies - continued
Investment Transactions and Income. For financial reporting purposes, the Fund's investment holdings and NAV include trades executed through the end of the last business day of the period. The NAV per share for processing shareholder transactions is calculated as of the close of business of the New York Stock Exchange (NYSE), normally 4:00 p.m. Eastern time and includes trades executed through the end of the prior business day. Gains and losses on securities sold are determined on the basis of identified cost. Dividend income is recorded on the ex-dividend date, except for certain dividends from foreign securities where the ex-dividend date may have passed, which are recorded as soon as the Fund is informed of the ex-dividend date. Non-cash dividends included in dividend income, if any, are recorded at the fair market value of the securities received. Distributions received on securities that represent a return of capital or capital gain are recorded as a reduction of cost of investment and/or as a realized gain. The Funds estimate the components of distributions received that may be considered return of capital distributions or capital gain distributions. Interest income and distributions from the Fidelity Central Funds are accrued as earned. Interest income includes coupon interest and amortization of premium and accretion of discount on debt securities. For certain lower credit quality securitized assets that have contractual cash flows (for example, asset backed securities, collateralized mortgage obligations and commercial mortgage-backed securities), changes in estimated cash flows are periodically evaluated and the estimated yield is adjusted on a prospective basis over the remaining life of the security, resulting in increases or decreases to Interest Income in the accompanying Statement of Operations. Investment income is recorded net of foreign taxes withheld where recovery of such taxes is uncertain. Debt obligations may be placed on non-accrual status and related interest income may be reduced by ceasing current accruals and writing off interest receivables when the collection of all or a portion of interest has become doubtful based on consistently applied procedures. A debt obligation is removed from non-accrual status when the issuer resumes interest payments or when collectability of interest is reasonably assured.
Expenses. Most expenses of the Trust can be directly attributed to a fund. Expenses which cannot be directly attributed are apportioned amongst each fund in the Trust. Expense estimates are accrued in the period to which they relate and adjustments are made when actual amounts are known.
Income Tax Information and Distributions to Shareholders. Each year the Fund intends to qualify as a regulated investment company, including distributing substantially all of its taxable income and realized gains under Subchapter M of the Internal Revenue Code and filing its U.S. federal tax return. As a result, no provision for income taxes is required. As of July 31, 2010, the Fund did not have any unrecognized tax benefits in the accompanying financial statements. A fund's federal tax return is subject to examination by the Internal Revenue Service (IRS) for a period of three years. Foreign taxes are provided for based on the Fund's understanding of the tax rules and rates that exist in the foreign markets in which it invests.
Annual Report
Notes to Financial Statements - continued
3. Significant Accounting Policies - continued
Income Tax Information and Distributions to Shareholders - continued
Distributions are recorded on the ex-dividend date. Income dividends and capital gain distributions are declared separately for each class. Income and capital gain distributions are determined in accordance with income tax regulations, which may differ from GAAP. In addition, the Fund claimed a portion of the payment made to redeeming shareholders as a distribution for income tax purposes.
Capital accounts within the financial statements are adjusted for permanent book-tax differences. These adjustments have no impact on net assets or the results of operations. Temporary book-tax differences will reverse in a subsequent period.
Book-tax differences are primarily due to the short-term gain distributions from the Fidelity Central Funds, foreign currency transactions, passive foreign investment companies (PFIC), defaulted bonds, market discount, partnerships, capital loss carryforwards, losses deferred due to wash sales and excise tax regulations.
The federal tax cost of investment securities and unrealized appreciation (depreciation) as of period end were as follows:
Gross unrealized appreciation | $ 88,269,388 |
Gross unrealized depreciation | (75,775,542) |
Net unrealized appreciation (depreciation) | $ 12,493,846 |
| |
Tax Cost | $ 1,029,534,370 |
The tax-based components of distributable earnings as of period end were as follows:
Undistributed ordinary income | $ 10,505,281 |
Capital loss carryforward | $ (13,906,408) |
Net unrealized appreciation (depreciation) | $ 12,519,534 |
The tax character of distributions paid was as follows:
| July 31, 2010 | July 31, 2009 |
Ordinary Income | $ 40,150,798 | $ 21,152,317 |
Annual Report
3. Significant Accounting Policies - continued
Short-Term Trading (Redemption) Fees. Shares held in the Fund less than 90 days are subject to a redemption fee equal to .75% of the proceeds of the redeemed shares. All redemption fees, including any estimated redemption fees paid by FMR, are retained by the Fund and accounted for as an addition to paid in capital.
4. Operating Policies.
Repurchase Agreements. FMR has received an Exemptive Order from the SEC which permits the Fund and other affiliated entities of FMR to transfer uninvested cash balances into joint trading accounts which are then invested in repurchase agreements. The Fund may also invest directly with institutions in repurchase agreements. Repurchase agreements are collateralized by government or non-government securities. Upon settlement date, collateral is held in segregated accounts with custodian banks and may be obtained in the event of a default of the counterparty. The Fund monitors, on a daily basis, the value of the collateral to ensure it is at least equal to the principal amount of the repurchase agreement (including accrued interest). In the event of a default by the counterparty, realization of the collateral proceeds could be delayed, during which time the value of the collateral may decline.
Restricted Securities. The Fund may invest in securities that are subject to legal or contractual restrictions on resale. These securities generally may be resold in transactions exempt from registration or to the public if the securities are registered. Disposal of these securities may involve time-consuming negotiations and expense, and prompt sale at an acceptable price may be difficult. Information regarding restricted securities is included at the end of the Fund's Schedule of Investments.
Loans and Other Direct Debt Instruments The Fund may invest in loans and loan participations, trade claims or other receivables. These investments may include standby financing commitments, including revolving credit facilities, that obligate the Fund to supply additional cash to the borrower on demand. Loan participations involve a risk of insolvency of the lending bank or other financial intermediary. The Fund may be contractually obligated to receive approval from the agent bank and/or borrower prior to the sale of these investments.
5. Purchases and Sales of Investments.
Purchases and sales of securities, other than short-term securities and U.S. government securities, aggregated $569,505,702 and $189,844,016, respectively.
Annual Report
Notes to Financial Statements - continued
6. Fees and Other Transactions with Affiliates.
Management Fee. FMR and its affiliates provide the Fund with investment management related services for which the Fund pays a monthly management fee. The management fee is the sum of an individual fund fee rate that is based on an annual rate of .30% of the Fund's average net assets and a group fee rate that averaged .26% during the period. The group fee rate is based upon the average net assets of all the mutual funds advised by FMR. The group fee rate decreases as assets under management increase and increases as assets under management decrease. For the period, the total annual management fee rate was .56% of the Fund's average net assets.
Distribution and Service Plan. In accordance with Rule 12b-1 of the 1940 Act, the Fund has adopted separate Distribution and Service Plans for each class of shares. Certain classes pay Fidelity Distributors Corporation (FDC), an affiliate of FMR, separate Distribution and Service Fees, each of which is based on an annual percentage of each class' average net assets. In addition, FDC may pay financial intermediaries for selling shares of the Fund and providing shareholder support services. For the period, the Distribution and Service Fee rates and the total amounts paid to and retained by FDC were as follows:
| Distribution
Fee | Service
Fee | Paid to
FDC | Retained
by FDC |
Class A | -% | .25% | $ 1,146 | $ 382 |
Class T | -% | .25% | 324 | 68 |
Class C | .75% | .25% | 872 | 585 |
| | | $ 2,342 | $ 1,035 |
Sales Load. FDC receives a front-end sales charge of up to 4.00% for selling Class A shares and Class T shares, some of which is paid to financial intermediaries for selling shares of the Fund. FDC receives the proceeds of contingent deferred sales charges levied on Class A, Class T, and Class C redemptions. These charges depend on the holding period. The deferred sales charges range from 1% for Class C, .75% for certain purchases of Class A shares (1.00% to .50% prior to July 12, 2010) and .25% for certain purchases of Class T shares.
For the period, sales charge amounts retained by FDC were as follows:
| Retained
by FDC |
Class A | $ 369 |
Class T | 283 |
| $ 652 |
Annual Report
6. Fees and Other Transactions with Affiliates - continued
Transfer Agent Fees. Fidelity Investments Institutional Operations Company, Inc. (FIIOC), an affiliate of FMR, is the transfer, dividend disbursing and shareholder servicing agent for each class of the Fund. FIIOC receives account fees and asset-based fees that vary according to the account size and type of account of the shareholders of the respective classes of the Fund. FIIOC pays for typesetting, printing and mailing of shareholder reports, except proxy statements. For the period, the total transfer agent fees paid by each applicable class were as follows:
| Amount | % of
Average
Net Assets |
Class A | $ 905 | .19* |
Class T | 351 | .27* |
Class C | 196 | .22* |
Real Estate Income | 2,351,958 | .32 |
Institutional Class | 533 | .20* |
| $ 2,353,943 | |
* Annualized
Accounting and Security Lending Fees. Fidelity Service Company, Inc. (FSC), an affiliate of FMR, maintains the Fund's accounting records. The accounting fee is based on the level of average net assets for the month. Under a separate contract, FSC administers the security lending program. The security lending fee is based on the number and duration of lending transactions.
Brokerage Commissions. The Fund placed a portion of its portfolio transactions with brokerage firms which are affiliates of the investment adviser. The commissions paid to these affiliated firms were $8,333 for the period.
7. Committed Line of Credit.
The Fund participates with other funds managed by FMR in a $3.75 billion credit facility (the "line of credit") to be utilized for temporary or emergency purposes to fund shareholder redemptions or for other short-term liquidity purposes. The Fund has agreed to pay commitment fees on its pro-rata portion of the line of credit, which amounted to $2,742 and is reflected in Miscellaneous expenses on the Statement of Operations. During the period, there were no borrowings on this line of credit.
Annual Report
Notes to Financial Statements - continued
8. Security Lending.
The Fund lends portfolio securities from time to time in order to earn additional income. On the settlement date of the loan, the Fund receives collateral (in the form of U.S. Treasury obligations, letters of credit and/or cash) against the loaned securities and maintains collateral in an amount not less than 100% of the market value of the loaned securities during the period of the loan. The market value of the loaned securities is determined at the close of business of the Fund and any additional required collateral is delivered to the Fund on the next business day. If the borrower defaults on its obligation to return the securities loaned because of insolvency or other reasons, a fund could experience delays and costs in recovering the securities loaned or in gaining access to the collateral. Any cash collateral received is invested in the Fidelity Securities Lending Cash Central Fund. The value of loaned securities and cash collateral at period end are disclosed on the Fund's Statement of Assets and Liabilities. Security lending income represents the income earned on investing cash collateral, less fees and expenses associated with the loan, plus any premium payments that may be received on the loan of certain types of securities. Security lending income is presented in the Statement of Operations as a component of income from Fidelity Central Funds. Net income from lending portfolio securities during the period amounted to $6,300.
9. Expense Reductions.
FMR voluntarily agreed to reimburse a portion of the Fund's operating expenses. During the period, this reimbursement reduced expenses of the Real Estate Income Class by $62,921.
Many of the brokers with whom FMR places trades on behalf of the Fund provided services in addition to trade execution. These services included payments of certain expenses on behalf of the Fund totaling $6,610 for the period. In addition, through arrangements with the Fund's custodian, credits realized as a result of uninvested cash balances were used to reduce the Fund's expenses. During the period, these credits reduced the Fund's custody expenses by $688.
Annual Report
10. Distributions to Shareholders.
Distributions to shareholders of each class were as follows:
Years ended July 31, | 2010 A | 2009 |
From net investment income | | |
Class A | $ 23,172 | $ - |
Class T | 6,447 | - |
Class C | 3,705 | - |
Real Estate Income | 40,107,971 | 21,152,317 |
Institutional Class | 9,503 | - |
Total | $ 40,150,798 | $ 21,152,317 |
A Distributions for Class A, Class T, Class C and Institutional Class are for the period April 14, 2010 (commencement of sale of shares) to July 31, 2010.
11. Share Transactions.
Transactions for each class of shares were as follows:
| Shares | Dollars |
Years ended July 31, | 2010 A | 2009 | 2010 A | 2009 |
Class A | | | | |
Shares sold | 402,260 | - | $ 3,960,293 | $ - |
Reinvestment of distributions | 1,072 | - | 10,302 | - |
Shares redeemed | (18,182) | - | (177,559) | - |
Net increase (decrease) | 385,150 | - | $ 3,793,036 | $ - |
Class T | | | | |
Shares sold | 85,986 | - | $ 847,305 | $ - |
Reinvestment of distributions | 671 | - | 6,447 | - |
Shares redeemed | (17) | - | (166) | - |
Net increase (decrease) | 86,640 | - | $ 853,586 | $ - |
Class C | | | | |
Shares sold | 84,053 | - | $ 827,207 | $ - |
Reinvestment of distributions | 378 | - | 3,628 | - |
Shares redeemed | (281) | - | (2,700) | - |
Net increase (decrease) | 84,150 | - | $ 828,135 | $ - |
Real Estate Income | | | | |
Shares sold | 69,175,263 | 36,427,202 | $ 650,744,676 | $ 268,384,038 |
Reinvestment of distributions | 4,018,182 | 2,602,609 | 36,922,410 | 19,305,679 |
Shares redeemed | (26,105,432) | (24,280,916) | (245,525,556) | (183,099,387) |
Net increase (decrease) | 47,088,013 | 14,748,895 | $ 442,141,530 | $ 104,590,330 |
Institutional Class | | | | |
Shares sold | 294,304 | - | $ 2,886,826 | $ - |
Reinvestment of distributions | 902 | - | 8,663 | - |
Shares redeemed | (733) | - | (7,109) | - |
Net increase (decrease) | 294,473 | - | $ 2,888,380 | $ - |
A Share transactions for Class A, Class T, Class C and Institutional Class are for the period April 14, 2010 (commencement of sale of shares) to
July 31, 2010.
Annual Report
Notes to Financial Statements - continued
12. Other.
The Fund's organizational documents provide former and current trustees and officers with a limited indemnification against liabilities arising in connection with the performance of their duties to the Fund. In the normal course of business, the Fund may also enter into contracts that provide general indemnifications. The Fund's maximum exposure under these arrangements is unknown as this would be dependent on future claims that may be made against the Fund. The risk of material loss from such claims is considered remote.
Annual Report
To the Trustees of Fidelity Securities Fund and Shareholders of Fidelity Real Estate Income Fund:
We have audited the accompanying statement of assets and liabilities of Fidelity Real Estate Income Fund (the Fund), a fund of Fidelity Securities Fund, including the schedule of investments, as of July 31, 2010, and the related statement of operations for the year then ended, the statement of changes in net assets for each of the two years in the period then ended, and the financial highlights for each of the five years in the period then ended. These financial statements and financial highlights are the responsibility of the Fund's management. Our responsibility is to express an opinion on these financial statements and financial highlights based on our audits.
We conducted our audits in accordance with standards of the Public Company Accounting Oversight Board (United States). Those standards require that we plan and perform the audit to obtain reasonable assurance about whether the financial statements and financial highlights are free of material misstatement. The Fund is not required to have, nor were we engaged to perform, an audit of its internal control over financial reporting. Our audits included consideration of internal control over financial reporting as a basis for designing audit procedures that are appropriate in the circumstances, but not for the purpose of expressing an opinion on the effectiveness of the Fund's internal control over financial reporting. Accordingly, we express no such opinion. An audit also includes examining, on a test basis, evidence supporting the amounts and disclosures in the financial statements, assessing the accounting principles used and significant estimates made by management, as well as evaluating the overall financial statement presentation. Our procedures included confirmation of securities owned as of July 31, 2010, by correspondence with the custodians, agent banks and brokers; where replies were not received from brokers, we performed other auditing procedures. We believe that our audits provide a reasonable basis for our opinion.
In our opinion, the financial statements and financial highlights referred to above present fairly, in all material respects, the financial position of Fidelity Real Estate Income Fund as of July 31, 2010, the results of its operations for the year then ended, the changes in its net assets for each of the two years in the period then ended, and the financial highlights for each of the five years in the period then ended, in conformity with accounting principles generally accepted in the United States of America.
/s/ Deloitte & Touche LLP
DELOITTE & TOUCHE LLP
Boston, Massachusetts
September 24, 2010
Annual Report
The Trustees, Member of the Advisory Board, and executive officers of the trust and fund, as applicable, are listed below. The Board of Trustees governs the fund and is responsible for protecting the interests of shareholders. The Trustees are experienced executives who meet periodically throughout the year to oversee the fund's activities, review contractual arrangements with companies that provide services to the fund, oversee management of the risks associated with such activities and contractual arrangements, and review the fund's performance. Except for James C. Curvey, each of the Trustees oversees 222 funds advised by FMR or an affiliate. Mr. Curvey oversees 411 funds advised by FMR or an affiliate.
The Trustees hold office without limit in time except that (a) any Trustee may resign; (b) any Trustee may be removed by written instrument, signed by at least two-thirds of the number of Trustees prior to such removal; (c) any Trustee who requests to be retired or who has become incapacitated by illness or injury may be retired by written instrument signed by a majority of the other Trustees; and (d) any Trustee may be removed at any special meeting of shareholders by a two-thirds vote of the outstanding voting securities of the trust. Each Trustee who is not an interested person (as defined in the 1940 Act) (Independent Trustee), shall retire not later than the last day of the calendar year in which his or her 72nd birthday occurs. The Independent Trustees may waive this mandatory retirement age policy with respect to individual Trustees. The executive officers and Advisory Board Member hold office without limit in time, except that any officer and Advisory Board Member may resign or may be removed by a vote of a majority of the Trustees at any regular meeting or any special meeting of the Trustees. Except as indicated, each individual has held the office shown or other offices in the same company for the past five years.
Experience, Skills, Attributes, and Qualifications of the Fund's Trustees. The Governance and Nominating Committee has adopted a statement of policy that describes the experience, qualifications, attributes, and skills that are necessary and desirable for potential Independent Trustee candidates (Statement of Policy). The Board believes that each Trustee satisfied at the time he or she was initially elected or appointed a Trustee, and continues to satisfy, the standards contemplated by the Statement of Policy. The Governance and Nominating Committee also engages professional search firms to help identify potential Independent Trustee candidates who have the experience, qualifications, attributes, and skills consistent with the Statement of Policy. From time to time, additional criteria based on the composition and skills of the current Independent Trustees, as well as experience or skills that may be appropriate in light of future changes to board composition, business conditions, and regulatory or other developments, have also been considered by the professional search firms and the Governance and Nominating Committee. In addition, the Board takes into account the Trustees' commitment and participation in Board and committee meetings, as well as their leadership of standing and ad hoc committees throughout their tenure.
In determining that a particular Trustee was and continues to be qualified to serve as a Trustee, the Board has considered a variety of criteria, none of which, in isolation, was controlling. The Board believes that, collectively, the Trustees have balanced and diverse experience, qualifications, attributes, and skills, which allow the Board to operate effectively in governing the fund and protecting the interests of shareholders. Information about the specific experience, skills, attributes, and qualifications of each Trustee, which in each case led to the Board's conclusion that the Trustee should serve (or continue to serve) as a trustee of the fund, is provided below.
Annual Report
Board Structure and Oversight Function. Edward C. Johnson 3d is an interested person (as defined in the 1940 Act) and currently serves as Chairman. The Trustees have determined that an interested Chairman is appropriate and benefits shareholders because an interested Chairman has a personal and professional stake in the quality and continuity of services provided to the fund. Independent Trustees exercise their informed business judgment to appoint an individual of their choosing to serve as Chairman, regardless of whether the Trustee happens to be independent or a member of management. The Independent Trustees have determined that they can act independently and effectively without having an Independent Trustee serve as Chairman and that a key structural component for assuring that they are in a position to do so is for the Independent Trustees to constitute a substantial majority for the Board. The Independent Trustees also regularly meet in executive session. Ned C. Lautenbach serves as Chairman of the Independent Trustees and as such (i) acts as a liaison between the Independent Trustees and management with respect to matters important to the Independent Trustees and (ii) with management prepares agendas for Board meetings.
Fidelity funds are overseen by different Boards of Trustees. The fund's Board oversees Fidelity's equity and high income funds and another Board oversees Fidelity's investment-grade bond, money market, and asset allocation funds. The asset allocation funds may invest in Fidelity funds overseen by the fund's Board. The use of separate Boards, each with its own committee structure, allows the Trustees of each group of Fidelity funds to focus on the unique issues of the funds they oversee, including common research, investment, and operational issues. On occasion, the separate Boards establish joint committees to address issues of overlapping consequences for the Fidelity funds overseen by each Board.
The Trustees operate using a system of committees to facilitate the timely and efficient consideration of all matters of importance to the Trustees, the fund, and fund shareholders and to facilitate compliance with legal and regulatory requirements and oversight of the fund's activities and associated risks. The Board, acting through its committees, has charged FMR and its affiliates with (i) identifying events or circumstances the occurrence of which could have demonstrably adverse effects on the fund's business and/or reputation; (ii) implementing processes and controls to lessen the possibility that such events or circumstances occur or to mitigate the effects of such events or circumstances if they do occur; and (iii) creating and maintaining a system designed to evaluate continuously business and market conditions in order to facilitate the identification and implementation processes described in (i) and (ii) above. Because the day-to-day operations and activities of the fund are carried out by or through FMR, its affiliates and other service providers, the fund's exposure to risks is mitigated but not eliminated by the processes overseen by the Trustees. While each of the Board's committees has responsibility for overseeing different aspects of the fund's activities, oversight is exercised primarily through the Operations, Audit, and Compliance Committees. Appropriate personnel, including but not limited to the fund's Chief Compliance Officer (CCO), FMR's internal auditor, the independent accountants, the fund's Treasurer and portfolio management personnel, make periodic reports to the Board's committees, as appropriate. The responsibilities of each committee, including their oversight responsibilities, are described further under "Standing Committees of the Fund's Trustees."
Annual Report
Trustees and Officers - continued
The fund's Statement of Additional Information (SAI) includes more information about the Trustees. To request a free copy, call Fidelity at 1-877-208-0098.
Interested Trustees*:
Correspondence intended for each Trustee who is an interested person may be sent to Fidelity Investments, 82 Devonshire Street, Boston, Massachusetts 02109.
Name, Age; Principal Occupations and Other Relevant Experience+ |
Edward C. Johnson 3d (80) |
| Year of Election or Appointment: 1984 Mr. Johnson is Trustee and Chairman of the Board of Trustees of certain Trusts. Mr. Johnson serves as Chief Executive Officer, Chairman, and a Director of FMR LLC; Chairman and a Director of FMR; Chairman and a Director of Fidelity Research & Analysis Company (FRAC); Chairman and a Director of Fidelity Investments Money Management, Inc.; and Chairman and a Director of FMR Co., Inc. In addition, Mr. Johnson serves as Chairman and Director of FIL Limited. Previously, Mr. Johnson served as President of FMR LLC (2006-2007). |
James C. Curvey (75) |
| Year of Election or Appointment: 2007 Mr. Curvey also serves as Trustee (2007-present) of other investment companies advised by FMR. Mr. Curvey is a Director of FMR and FMR Co., Inc. (2007-present). Mr. Curvey is also Vice Chairman (2006-present) and Director of FMR LLC. In addition, Mr. Curvey serves as an Overseer for the Boston Symphony Orchestra and a member of the Trustees of Villanova University. |
* Trustees have been determined to be "Interested Trustees" by virtue of, among other things, their affiliation with the trust or various entities under common control with FMR.
+ The information above includes each Trustee's principal occupation during the last five years and other information relating to the experience, attributes, and skills relevant to each Trustee's qualifications to serve as a Trustee, which led to the conclusion that each Trustee should serve as a Trustee for the fund.
Annual Report
Independent Trustees:
Correspondence intended for each Independent Trustee (that is, the Trustees other than the Interested Trustees) may be sent to Fidelity Investments, P.O. Box 55235, Boston, Massachusetts 02205-5235.
Name, Age; Principal Occupations and Other Relevant Experience+ |
Dennis J. Dirks (62) |
| Year of Election or Appointment: 2005 Prior to his retirement in May 2003, Mr. Dirks was Chief Operating Officer and a member of the Board of The Depository Trust & Clearing Corporation (DTCC). He also served as President, Chief Operating Officer, and Board member of The Depository Trust Company (DTC) and President and Board member of the National Securities Clearing Corporation (NSCC). In addition, Mr. Dirks served as Chief Executive Officer and Board member of the Government Securities Clearing Corporation, Chief Executive Officer and Board member of the Mortgage-Backed Securities Clearing Corporation, as a Trustee and a member of the Finance Committee of Manhattan College (2005-2008), and as a Trustee and a member of the Finance Committee of AHRC of Nassau County (2006-2008). Currently, Mr. Dirks serves as a member of the Board of Directors for The Brookville Center for Children's Services, Inc. (2009-present). |
Alan J. Lacy (56) |
| Year of Election or Appointment: 2008 Mr. Lacy serves as Senior Adviser (2007-present) of Oak Hill Capital Partners, L.P. (private equity). Mr. Lacy also served as Chief Executive Officer (2000-2005) and Vice Chairman (2005-2006) of Sears Holdings Corporation and Sears, Roebuck and Co. (retail). In addition, Mr. Lacy serves as a member of the Board of Directors of The Western Union Company (global money transfer, 2006-present) and Bristol-Myers Squibb Company (global pharmaceuticals, 2007-present). Mr. Lacy is Chairman (2008-present) and a member (2006-present) of the Board of Trustees of The National Parks Conservation Association. |
Ned C. Lautenbach (66) |
| Year of Election or Appointment: 2000 Mr. Lautenbach is Chairman of the Independent Trustees of the Equity and High Income Funds (2006-present). Mr. Lautenbach is an Advisory Partner of Clayton, Dubilier & Rice, Inc. (private equity investment, 2008-present) and was previously a Partner of Clayton, Dubilier & Rice, Inc. (1998-2008). Previously, Mr. Lautenbach was with the International Business Machines Corporation (IBM) from 1968 until his retirement in 1998. Mr. Lautenbach serves as a Director of Eaton Corporation (diversified industrial) as well as the Philharmonic Center for the Arts in Naples, Florida. Mr. Lautenbach is also a member of the Board of Trustees of Fairfield University (2005-present), as well as a member of the Council on Foreign Relations. Previously, Mr. Lautenbach served as a Director of Sony Corporation (2006-2007). |
Joseph Mauriello (65) |
| Year of Election or Appointment: 2008 Prior to his retirement in January 2006, Mr. Mauriello served in numerous senior management positions including Deputy Chairman and Chief Operating Officer (2004-2005), and Vice Chairman of Financial Services (2002-2004) of KPMG LLP US (professional services, 1965-2005). Mr. Mauriello currently serves as a member of the Board of Directors of XL Capital Ltd. (global insurance and re-insurance, 2006-present) and of Arcadia Resources Inc. (health care services and products, 2007-present). Previously, Mr. Mauriello served as a Director of the Hamilton Funds of the Bank of New York (2006-2007). |
Cornelia M. Small (66) |
| Year of Election or Appointment: 2005 Ms. Small is a member of the Board of Directors of the Teagle Foundation (2009-present). Ms. Small is also a member of the Investment Committee, and Chair (2008-present) and a member of the Board of Trustees of Smith College. In addition, Ms. Small serves on the Investment Committee of the Berkshire Taconic Community Foundation (2008-present). Previously, Ms. Small served as Chairperson of the Investment Committee (2002-2008) of Smith College. In addition, Ms. Small served as Chief Investment Officer, Director of Global Equity Investments, and a member of the Board of Directors of Scudder, Stevens & Clark and Scudder Kemper Investments. |
William S. Stavropoulos (71) |
| Year of Election or Appointment: 2002 Mr. Stavropoulos is Vice Chairman of the Independent Trustees of the Equity and High Income Funds (2006-present). Mr. Stavropoulos serves as President and Founder of the Michigan Baseball Foundation, the Great Lakes Loons (2007-present). Mr. Stavropoulos is Chairman Emeritus of the Board of Directors of The Dow Chemical Company, where he previously served in numerous senior management positions, including President, CEO (1995-2000; 2002-2004), Chairman of the Executive Committee (2000-2006), and as a member of the Board of Directors (1990-2006). Currently, Mr. Stavropoulos is a Director of Teradata Corporation (data warehousing and technology solutions, 2008-present), Chemical Financial Corporation, Maersk Inc. (industrial conglomerate), Tyco International, Inc. (multinational manufacturing and services, 2007-present), and a member of the Advisory Board for Metalmark Capital (private equity investment, 2005-present). Mr. Stavropoulos is a special advisor to Clayton, Dubilier & Rice, Inc. (private equity investment). In addition, Mr. Stavropoulos is a member of the University of Notre Dame Advisory Council for the College of Science. |
David M. Thomas (61) |
| Year of Election or Appointment: 2008 Previously, Mr. Thomas served as Executive Chairman (2005-2006) and Chairman and Chief Executive Officer (2000-2005) of IMS Health, Inc. (pharmaceutical and healthcare information solutions). In addition, Mr. Thomas serves as a member of the Board of Directors of Fortune Brands, Inc. (consumer products), and Interpublic Group of Companies, Inc. (marketing communication, 2004-present). |
Michael E. Wiley (59) |
| Year of Election or Appointment: 2008 Mr. Wiley also serves as a Director of Asia Pacific Exploration Consolidated (international oil and gas exploration and production, 2008-present), and as a member of the Board of Trustees of the University of Tulsa (2000-2006; 2007-present). Mr. Wiley serves as a Director of Tesoro Corporation (independent oil refiner and marketer, 2005-present), and a Director of Bill Barrett Corporation (exploration and production, 2005-present). In addition, Mr. Wiley also serves as a Director of Post Oak Bank (privately-held bank, 2004-present). Previously, Mr. Wiley served as a Sr. Energy Advisor of Katzenbach Partners, LLC (consulting, 2006-2007), as an Advisory Director of Riverstone Holdings (private investment), Chairman, President, and CEO of Baker Hughes, Inc. (oilfield services, 2000-2004), and as Director of Spinnaker Exploration Company (exploration and production, 2001-2005). |
Annual Report
Trustees and Officers - continued
+ The information above includes each Trustee's principal occupation during the last five years and other information relating to the experience, attributes, and skills relevant to each Trustee's qualifications to serve as a Trustee, which led to the conclusion that each Trustee should serve as a Trustee for the fund.
Advisory Board Member and Executive Officers:
Correspondence intended for each executive officer and Peter S. Lynch may be sent to Fidelity Investments, 82 Devonshire Street, Boston, Massachusetts 02109.
Name, Age; Principal Occupation |
Peter S. Lynch (66) |
| Year of Election or Appointment: 2003 Member of the Advisory Board of Fidelity's Equity and High Income Funds. Mr. Lynch is Vice Chairman and a Director of FMR and FMR Co., Inc. In addition, Mr. Lynch serves as a Trustee of Boston College and as the Chairman of the Inner-City Scholarship Fund. Previously, Mr. Lynch served on the Special Olympics International Board of Directors (1997-2006). |
Kenneth B. Robins (40) |
| Year of Election or Appointment: 2008 President and Treasurer of Fidelity's Equity and High Income Funds. Mr. Robins also serves as President and Treasurer (2010-present) and Assistant Treasurer (2009-present) of other Fidelity funds and is an employee of Fidelity Investments (2004-present). Previously, Mr. Robins served as Deputy Treasurer of the Fidelity funds (2005-2008) and Treasurer and Chief Financial Officer of The North Carolina Capital Management Trust: Cash and Term Portfolios (2006-2008). |
Brian B. Hogan (45) |
| Year of Election or Appointment: 2009 Vice President of certain Equity Funds and Vice President of Sector Funds. Mr. Hogan also serves as Senior Vice President, Equity Research of FMR (2006-present) and President of FMR's Equity Division (2009-present). Previously, Mr. Hogan served as a portfolio manager. |
Christopher S. Bartel (38) |
| Year of Election or Appointment: 2009 Vice President of Fidelity's Sector and Real Estate Equity Funds. Mr. Bartel also serves as Senior Vice President of Equity Research (2009-present). Previously, Mr. Bartel served as Managing Director of Research (2006-2009) and an analyst and portfolio manager (2000-2006). |
Scott C. Goebel (42) |
| Year of Election or Appointment: 2008 Secretary and Chief Legal Officer (CLO) of the Fidelity funds. Mr. Goebel also serves as General Counsel, Secretary, and Senior Vice President of FMR (2008-present) and FMR Co., Inc. (2008-present); Deputy General Counsel of FMR LLC; Chief Legal Officer of Fidelity Management & Research (Hong Kong) Limited (2008-present) and Assistant Secretary of Fidelity Management & Research (Japan) Inc. (2008-present), Fidelity Investments Money Management, Inc. (2008-present), Fidelity Management & Research (U.K.) Inc. (2008-present), and Fidelity Research and Analysis Company (2008-present). Previously, Mr. Goebel served as Assistant Secretary of the Funds (2007-2008) and as Vice President and Secretary of Fidelity Distributors Corporation (FDC) (2005-2007). |
William C. Coffey (41) |
| Year of Election or Appointment: 2009 Assistant Secretary of Fidelity's Equity and High Income Funds. Mr. Coffey also serves as Senior Vice President and Deputy General Counsel of FMR LLC (2010-present), and is an employee of Fidelity Investments. Previously, Mr. Coffey served as Vice President and Associate General Counsel of FMR LLC (2005-2009). |
Holly C. Laurent (56) |
| Year of Election or Appointment: 2008 Anti-Money Laundering (AML) Officer of the Fidelity funds. Ms. Laurent is an employee of Fidelity Investments. Previously, Ms. Laurent was Senior Vice President and Head of Legal for Fidelity Business Services India Pvt. Ltd. (2006-2008), and Senior Vice President, Deputy General Counsel and Group Head for FMR LLC (2005-2006). |
Christine Reynolds (51) |
| Year of Election or Appointment: 2008 Chief Financial Officer of the Fidelity funds. Ms. Reynolds became President of Fidelity Pricing and Cash Management Services (FPCMS) in August 2008. Ms. Reynolds served as Chief Operating Officer of FPCMS (2007-2008). Previously, Ms. Reynolds served as President, Treasurer, and Anti-Money Laundering officer of the Fidelity funds (2004-2007). |
Kenneth A. Rathgeber (63) |
| Year of Election or Appointment: 2004 Chief Compliance Officer of Fidelity's Equity and High Income Funds. Mr. Rathgeber is Chief Compliance Officer of Fidelity Management & Research (Hong Kong) Limited (2008-present), Fidelity Management & Research (Japan) Inc. (2008-present), FMR (2005-present), FMR Co., Inc. (2005-present), Fidelity Management & Research (U.K.) Inc. (2005-present), Fidelity Research & Analysis Company (2005-present), Fidelity Investments Money Management, Inc. (2005-present), Pyramis Global Advisors, LLC (2005-present), and Strategic Advisers, Inc. (2005-present). |
Jeffrey S. Christian (48) |
| Year of Election or Appointment: 2009 Deputy Treasurer of the Fidelity funds. Mr. Christian is an employee of Fidelity Investments. Previously, Mr. Christian served as Chief Financial Officer (2008-2009) of certain Fidelity funds and Senior Vice President of Fidelity Pricing and Cash Management Services (FPCMS) (2004-2009). |
Bryan A. Mehrmann (49) |
| Year of Election or Appointment: 2005 Deputy Treasurer of the Fidelity funds. Mr. Mehrmann is an employee of Fidelity Investments. |
Adrien E. Deberghes (42) |
| Year of Election or Appointment: 2008 Deputy Treasurer of Fidelity's Equity and High Income Funds. Mr. Deberghes also serves as Assistant Treasurer of other Fidelity funds (2010-present) and is an employee of Fidelity Investments (2008-present). Previously, Mr. Deberghes served as Senior Vice President of Mutual Fund Administration at State Street Corporation (2007-2008), Senior Director of Mutual Fund Administration at Investors Bank & Trust (2005-2007), and Director of Finance for Dunkin' Brands (2000-2005). |
Stephanie J. Dorsey (41) |
| Year of Election or Appointment: 2010 Assistant Treasurer of Fidelity's Equity and High Income Funds. Ms. Dorsey also serves as Deputy Treasurer of other Fidelity funds (2008-present) and is an employee of Fidelity Investments (2008-present). Previously, Ms. Dorsey served as Treasurer (2004-2008) of the JPMorgan Mutual Funds and Vice President (2004-2008) of JPMorgan Chase Bank. |
John R. Hebble (52) |
| Year of Election or Appointment: 2009 Assistant Treasurer of Fidelity's Equity and High Income Funds. Mr. Hebble also serves as Treasurer and Chief Financial Officer of The North Carolina Capital Management Trust: Cash and Term Portfolio (2008-present), President and Treasurer of other Fidelity funds (2008-present) and is an employee of Fidelity Investments. |
Gary W. Ryan (51) |
| Year of Election or Appointment: 2005 Assistant Treasurer of the Fidelity funds. Mr. Ryan is an employee of Fidelity Investments. Previously, Mr. Ryan served as Vice President of Fund Reporting in Fidelity Pricing and Cash Management Services (FPCMS) (1999-2005). |
Annual Report
A total of 0.13% of the dividends distributed during the fiscal year was derived from interest on U.S. Government securities which is generally exempt from state income tax.
Class A, Class T, and Class C designates 8% of the dividends distributed in June, during the fiscal year as qualifying for the dividends-received deduction for corporate shareholders.
Class A designates 10%; Class T designates 10%; and Class C designates 11%; of dividends distributed in June, during the fiscal year as amounts which may be taken into account as a dividend for purposes of the maximum rate under section 1(h)(11) of the Internal Revenue Code.
The fund will notify shareholders in January 2011 of amounts for use in preparing 2010 income tax returns.
Annual Report
Board Approval of Investment Advisory Contracts and Management Fees
Fidelity Real Estate Income Fund
Each year, the Board of Trustees, including the Independent Trustees (together, the Board), votes on the renewal of the management contract and sub-advisory agreements (together, the Advisory Contracts) for the fund. The Board, assisted by the advice of fund counsel and Independent Trustees' counsel, requests and considers a broad range of information relevant to the renewal of the Advisory Contracts throughout the year.
The Board meets regularly and considers at each of its meetings factors that are relevant to its annual consideration of the renewal of the fund's Advisory Contracts, including the services and support provided to the fund and its shareholders. The Board has established various standing committees, each composed of Independent Trustees with varying backgrounds, to which the Board has assigned specific subject matter responsibilities in order to enhance effective decision-making by the Board. The Board, acting directly and through its Committees, requests and receives information concerning the annual consideration of the renewal of the fund's Advisory Contracts. The Board also meets as needed to consider matters specifically related to the Board's annual consideration of the renewal of Advisory Contracts. Members of the Board may also meet with trustees of other Fidelity funds through ad hoc joint committees to discuss certain matters relevant to the Fidelity funds.
At its July 2010 meeting, the Board of Trustees, including the Independent Trustees, unanimously determined to renew the fund's Advisory Contracts. In reaching its determination, the Board considered all factors it believed relevant, including (i) the nature, extent, and quality of the services to be provided to the fund and its shareholders (including the investment performance of the fund); (ii) the competitiveness of the fund's management fee and total expenses; (iii) the total costs of the services to be provided by and the profits to be realized by Fidelity from its relationship with the fund; (iv) the extent to which economies of scale would be realized as the fund grows; and (v) whether fee levels reflect these economies of scale, if any, for the benefit of fund shareholders.
In considering whether to renew the Advisory Contracts for the fund, the Board reached a determination, with the assistance of fund counsel and Independent Trustees' counsel and through the exercise of its business judgment, that the renewal of the Advisory Contracts is in the best interests of fund shareholders and that the compensation to be received by Fidelity under the management contract is fair and reasonable. The Board's decision to renew the Advisory Contracts was not based on any single factor noted above, but rather was based on a comprehensive consideration of all the information provided to the Board at its meetings throughout the year. The Board, in reaching its determination to renew the Advisory Contracts, is aware that shareholders in the fund have a broad range of investment choices available to them, including a wide choice among mutual funds offered by Fidelity's competitors, and that the fund's shareholders, with the opportunity to review and weigh the disclosure provided by the fund in its prospectus and other public disclosures, have chosen to invest in this fund, managed by Fidelity.
Annual Report
Board Approval of Investment Advisory Contracts and
Management Fees - continued
Nature, Extent, and Quality of Services Provided. The Board considered the staffing within the investment adviser, FMR, and the sub-advisers (together, the Investment Advisers), including the backgrounds of the fund's investment personnel and the fund's investment objective and discipline. The Independent Trustees also had discussions with senior management of Fidelity's investment operations and investment groups. The Board considered the structure of the portfolio manager compensation program and whether this structure provides appropriate incentives to act in the best interest of the fund.
Resources Dedicated to Investment Management and Support Services. The Board and the equity research subcommittee of the Board's Fund Oversight Committee reviewed the size, education, and experience of the Investment Advisers' investment staff, their use of technology, and the Investment Advisers' approach to recruiting, training, and retaining portfolio managers and other research, advisory, and management personnel. The Board noted that Fidelity's analysts have access to a variety of technological tools and market and securities data that enable them to perform both fundamental and quantitative analysis and to specialize in various disciplines. The Board considered Fidelity's extensive global research capabilities that enable the Investment Advisers to aggregate data from various sources in an effort to produce positive investment results. The Board also considered that Fidelity's portfolio managers and analysts have access to daily portfolio attribution that allows for monitoring of a fund's portfolio, as well as an electronic communication system that provides immediate real-time access to research concerning issuers and credit enhancers. The Board noted FMR's continued focus on strengthening the organization and discipline of equity portfolio management and research.
Shareholder and Administrative Services. The Board considered (i) the nature, extent, quality, and cost of advisory, administrative, and shareholder services performed by the Investment Advisers and their affiliates under the Advisory Contracts and under separate agreements covering transfer agency, pricing and bookkeeping, and securities lending services for the fund; (ii) the nature and extent of the investment adviser's supervision of third party service providers, principally custodians and subcustodians; and (iii) the resources devoted to, and the record of compliance with, the fund's compliance policies and procedures. The Board also reviewed the allocation of fund brokerage, including allocations to brokers affiliated with the Investment Advisers, the use of brokerage commissions to pay fund expenses, and the use of "soft" commission dollars to pay for research services.
The Board noted that the growth of fund assets over time across the complex allows Fidelity to reinvest in the development of services designed to enhance the value or convenience of the Fidelity funds as investment vehicles. These services include 24-hour access to account information and market information through phone representatives and over the Internet, and investor education materials and asset allocation tools.
Annual Report
Investment in a Large Fund Family. The Board considered the benefits to shareholders of investing in a Fidelity fund, including the benefits of investing in a fund that is part of a large family of funds offering a variety of investment disciplines and providing a large variety of mutual fund investor services. The Board noted that Fidelity had taken, or had made recommendations that resulted in the Fidelity funds taking, a number of actions over the previous year that benefited particular funds, including (i) dedicating additional resources to investment research and restructuring and broadening the focus of the investment research teams; (ii) bolstering the senior management team that oversees asset management; (iii) launching Class F of certain funds as a lower-fee class available to Freedom K and Freedom Index Funds; (iv) lowering the initial investment minimums and ongoing balance requirements for Real Estate High Income Fund; (v) eliminating subsequent purchase minimums for all funds and adding a waiver of the investment minimum requirement for new accounts opened with the proceeds of a systematic withdrawal plan; (vi) eliminating the withdrawal minimum and maximum limits for systematic withdrawals from Advisor funds; (vii) expanding sales load waivers on Class A shares for Destiny Planholders and expanding Institutional Class eligibility for Class O Destiny Planholders; and (viii) changing certain Class A and Class T sales charge structures to further align them with industry practices.
Investment Performance. The Board considered whether the fund has operated in accordance with its investment objective, as well as its record of compliance with its investment restrictions. It also reviewed the fund's absolute investment performance, as well as the fund's relative investment performance measured over multiple periods against (i) a proprietary custom index, and (ii) a peer group of mutual funds and reviewed by the Board. The following charts considered by the Board show, over the one-, three-, and five-year periods ended December 31, 2009, the fund's cumulative total returns, the cumulative total returns of a proprietary custom index ("benchmark"), and a range of cumulative total returns of a peer group of mutual funds identified by Lipper Inc. as having an investment objective similar to that of the fund. (The fund did not offer Advisor classes as of December 31, 2009). The box within each chart shows the 25th percentile return (bottom of box) and the 75th percentile return (top of box) of the peer group. Returns shown above the box are in the first quartile and returns shown below the box are in the fourth quartile. The percentage beaten number noted below each chart corresponds to the percentile box and represents the percentage of funds in the peer group whose performance was equal to or lower than that of the fund. The fund's proprietary custom index is an index developed by FMR that represents the performance of the fund's unmanaged indexes.
Annual Report
Board Approval of Investment Advisory Contracts and
Management Fees - continued
Fidelity Real Estate Income Fund

The Board reviewed the fund's relative investment performance against its peer group and noted that the performance of the fund was in the first quartile for all the periods shown. The Board noted that FMR does not consider that peer group to be a particularly meaningful comparison for the fund, however, because unlike many of its peers, which invest primarily in common stocks of real estate companies, the fund invests primarily in common, preferred and debt securities of real estate entities. The Board also noted that the investment performance of the fund was lower than its benchmark for all the periods shown. The Board also reviewed the fund's performance since inception as well as performance in the current year.
Based on its review, and giving particular weight to the nature and quality of the resources dedicated by the Investment Advisers to maintain and improve relative performance and factoring in the unprecedented market events in recent years, the Board concluded that the nature, extent, and quality of investment management and support services and of shareholder and administrative services provided to the fund will benefit the fund's shareholders, particularly in light of the Board's view that the fund's shareholders benefit from investing in a fund that is part of a large family of funds offering a variety of investment disciplines and services.
Competitiveness of Management Fee and Total Fund Expenses. The Board considered the fund's management fee and total expenses compared to "mapped groups" of competitive funds and classes. Fidelity creates "mapped groups" by combining similar Lipper investment objective categories that have comparable management fee characteristics. Combining Lipper investment objective categories aids the Board's management fee and total expense comparisons by broadening the competitive group used for comparison and by reducing the number of universes to which various Fidelity funds are compared.
Annual Report
Management Fee. The Board considered two proprietary management fee comparisons for the 12-month periods shown in the chart below. The group of Lipper funds used by the Board for management fee comparisons is referred to below as the "Total Mapped Group." The Total Mapped Group is broader than the Lipper peer group used by the Board for performance comparisons because the Total Mapped Group combines several Lipper investment objective categories while the Lipper peer group does not. The Total Mapped Group comparison focuses on a fund's standing relative to the total universe of comparable funds available to investors, in terms of gross management fees before expense reimbursements or caps. "TMG %" represents the percentage of funds in the Total Mapped Group that had management fees that were lower than the fund's. For example, a TMG % of 8% means that 92% of the funds in the Total Mapped Group had higher management fees than the fund. The "Asset-Size Peer Group" (ASPG) comparison focuses on a fund's standing relative to non-Fidelity funds similar in size to the fund within the Total Mapped Group. The ASPG represents at least 15% of the funds in the Total Mapped Group with comparable asset size and management fee characteristics, subject to a minimum of 50 funds (or all funds in the Total Mapped Group if fewer than 50). Additional information, such as the ASPG quartile in which the fund's management fee ranked, is also included in the chart and considered by the Board.
Fidelity Real Estate Income Fund
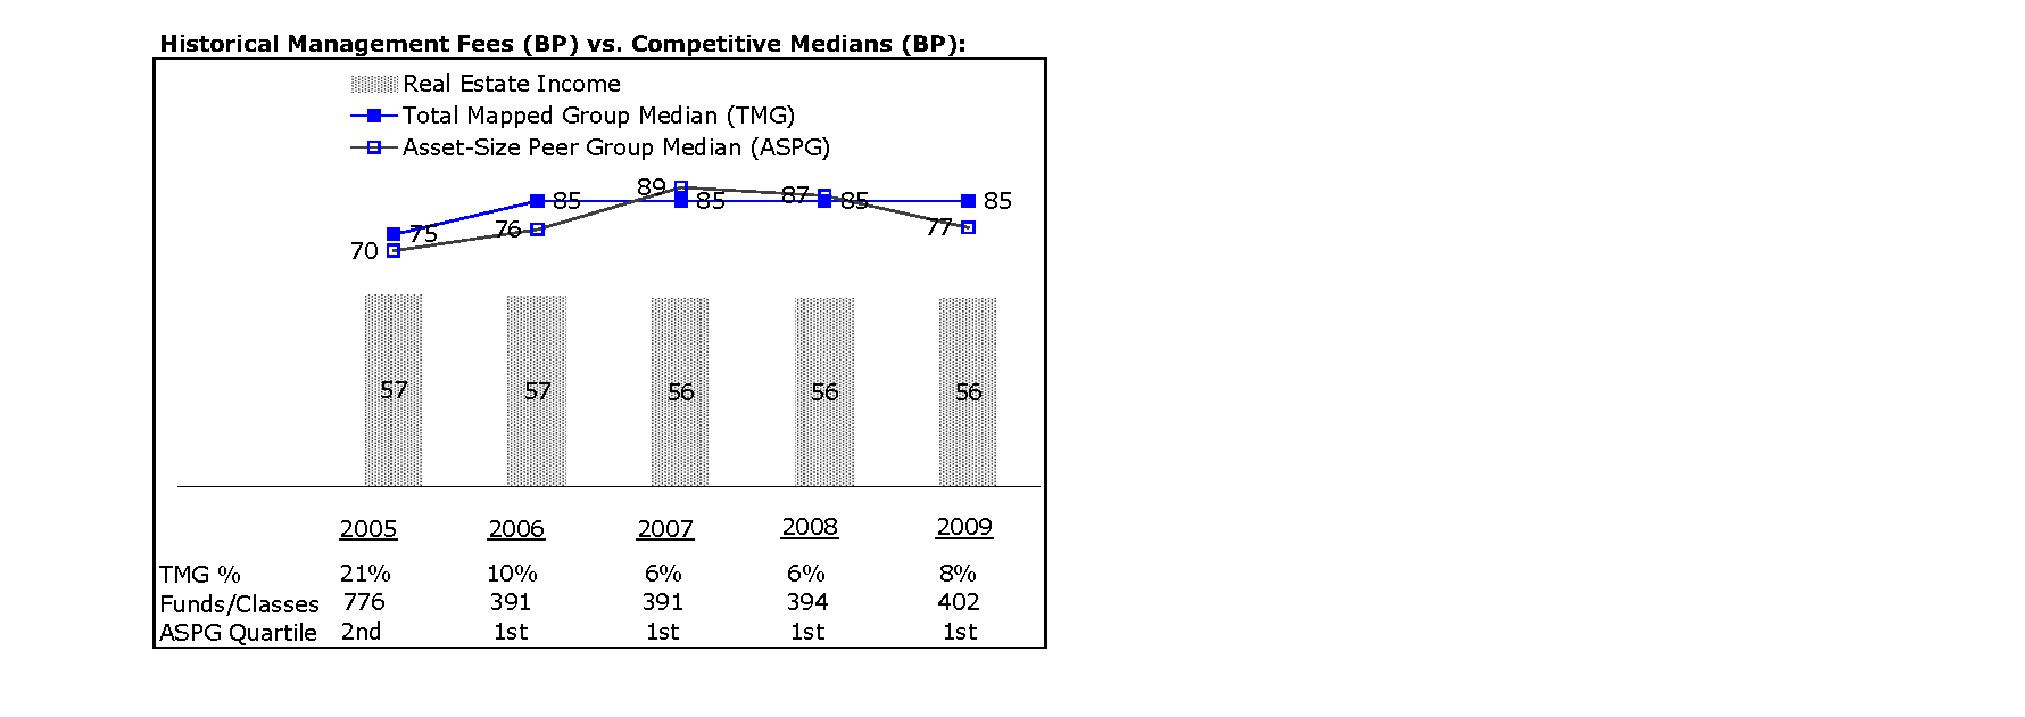
Annual Report
Board Approval of Investment Advisory Contracts and
Management Fees - continued
The Board noted that the fund's management fee ranked below the median of its Total Mapped Group and below the median of its ASPG for 2009.
Based on its review, the Board concluded that the fund's management fee is fair and reasonable in light of the services that the fund receives and the other factors considered.
Total Expenses. In its review of the fund's total expenses, the Board considered the fund's management fee as well as other fund expenses, such as transfer agent fees, pricing and bookkeeping fees, and custodial, legal, and audit fees. The Board also noted the effects of any waivers and reimbursements on fees and expenses. As part of its review, the Board also considered current and historical total expenses of the fund compared to competitive fund median expenses. The fund is compared to those funds and classes in the Total Mapped Group (used by the Board for management fee comparisons) that have a similar sales load structure.
The Board noted that the fund's total expenses ranked below its competitive median for 2009.
Fees Charged to Other Fidelity Clients. The Board also considered Fidelity fee structures and other information with respect to clients of FMR and its affiliates, such as other mutual funds advised or subadvised by FMR or its affiliates, pension plan clients, and other institutional clients. In March 2010, the Board created an ad hoc joint committee with the board of other Fidelity funds (the Committee) to review and compare Fidelity's institutional investment advisory business with its business of providing services to the Fidelity funds, including the differences in services provided, fees charged, and costs incurred, as well as competition in their respective marketplaces.
Based on its review of total expenses and fees charged to other Fidelity clients, the Board concluded that the fund's total expenses were reasonable in light of the services that the fund and its shareholders receive and the other factors considered, including the findings of the Committee.
Costs of the Services and Profitability. The Board considered the revenues earned and the expenses incurred by Fidelity in conducting the business of developing, marketing, distributing, managing, administering and servicing the fund and its shareholders. The Board also considered the level of Fidelity's profits in respect of all the Fidelity funds.
On an annual basis, FMR presents to the Board Fidelity's profitability for the fund. Fidelity calculates the profitability for each fund, as well as aggregate profitability for groups of Fidelity funds and all Fidelity funds, using a series of detailed revenue and cost allocation methodologies which originate with the audited books and records of Fidelity. The Audit Committee of the Board reviews any significant changes from the prior year's methodologies.
Annual Report
PricewaterhouseCoopers LLP (PwC), independent registered public accounting firm and auditor to Fidelity and certain Fidelity funds, has been engaged annually by the Board as part of the Board's assessment of Fidelity's profitability analysis. PwC's engagement includes the review and assessment of Fidelity's methodologies used in determining the revenues and expenses attributable to Fidelity's mutual fund business, and completion of agreed-upon procedures surrounding the mathematical accuracy of fund profitability and its conformity to allocation methodologies. After considering PwC's reports issued under the engagement and information provided by Fidelity, the Board believes that while other allocation methods may also be reasonable, Fidelity's profitability methodologies are reasonable in all material respects.
The Board has also reviewed Fidelity's non-fund businesses and fall-out benefits related to the mutual fund business as well as cases where Fidelity's affiliates may benefit from or be related to the fund's business.
The Board considered the costs of the services provided by and the profits realized by Fidelity in connection with the operation of the fund and were satisfied that the profitability was not excessive in the circumstances.
Economies of Scale. The Board considered whether there have been economies of scale in respect of the management of the Fidelity funds, whether the Fidelity funds (including the fund) have appropriately benefited from any such economies of scale, and whether there is potential for realization of any further economies of scale. The Board considered the extent to which the fund will benefit from economies of scale through increased services to the fund, through waivers or reimbursements, or through fee or expense reductions.
In February 2009, the Board and the board of other Fidelity funds created an ad hoc committee (the Economies of Scale Committee) to analyze whether FMR attains economies of scale in respect of the management and servicing of the Fidelity funds, whether the Fidelity funds have appropriately benefited from such economies of scale, and whether there is potential for realization of any further economies of scale.
The Board recognized that the fund's management contract incorporates a "group fee" structure, which provides for lower group fee rates as total fund assets under FMR's management increase, and for higher group fee rates as total fund assets under FMR's management decrease. FMR calculates the group fee rates based on a tiered asset "breakpoint" schedule that varies based on asset class. The Board considered that the group fee is designed to deliver the benefits of economies of scale to fund shareholders when total Fidelity fund assets increase, even if assets of any particular fund are unchanged or have declined, because some portion of Fidelity's costs are attributable to services provided to all Fidelity funds, and all funds benefit if those costs can be allocated among more assets. The Board concluded that, given the group fee structure, fund shareholders will benefit from lower management fees as assets under FMR's management increase at the fund complex level, regardless of whether Fidelity achieves any such economies of scale.
Annual Report
Board Approval of Investment Advisory Contracts and
Management Fees - continued
The Board concluded, considering the findings of the Economies of Scale Committee, that any potential economies of scale are being appropriately shared between fund shareholders and Fidelity.
Additional Information Requested by the Board. In order to develop fully the factual basis for consideration of the Fidelity funds' Advisory Contracts, the Board requested and received additional information on certain topics, including (i) fund performance trends, actions to be taken by FMR to improve certain funds' overall performance, and Fidelity's long-term strategies for certain funds; (ii) portfolio manager changes that have occurred during the past year and length of portfolio manager tenure for different categories of funds over time; (iii) Fidelity's compensation structure for portfolio managers, research analysts, and other key personnel, the rationale for the compensation structure, and how the compensation structure provides appropriate performance incentives; (iv) the amount of the investment that each portfolio manager has made in the Fidelity fund(s) that he or she manages; (v) management and other fees paid by FMR to affiliated sub-advisers on behalf of the Fidelity funds; (vi) Fidelity's fee structures and rationale for recommending different fees among different categories of funds; (vii) Fidelity's rationale for recommending which funds should have a performance adjustment component as part of their management fees; (viii) the rationale for any differences between fund fee structures and fee structures in place for other Fidelity clients; and (ix) explanations regarding the relative total expenses borne by certain funds and classes, total expense competitive trends, and actions that might be taken by FMR to reduce total expenses for certain funds and classes.
Based on its evaluation of all of the conclusions noted above, and after considering all factors it believed relevant, the Board ultimately concluded that the advisory fee structures are fair and reasonable, and that the fund's Advisory Contracts should be renewed.
Annual Report
Investment Adviser
Fidelity Management & Research Company
Boston, MA
Investment Sub-Advisers
FMR Co., Inc.
Fidelity Management & Research
(Hong Kong) Limited
Fidelity Management & Research
(Japan) Inc.
Fidelity Management & Research
(U.K.) Inc.
Fidelity Research & Analysis Company
General Distributor
Fidelity Distributors Corporation
Boston, MA
Transfer and Service Agents
Fidelity Investments Institutional Operations Company, Inc.
Boston, MA
Fidelity Service Company, Inc.
Boston, MA
Custodian
Citibank, N.A.
New York, NY
REIA-UANN-0910
1.907548.100

(Fidelity Investment logo)(registered trademark)
Fidelity Advisor
Real Estate Income
Fund - Institutional Class
Annual Report
July 31, 2010
(2_fidelity_logos) (Registered_Trademark)
Institutional Class
is a class of Fidelity®
Real Estate Income Fund
Contents
Chairman's Message | <Click Here> | The Chairman's message to shareholders. |
Performance | <Click Here> | How the fund has done over time. |
Management's Discussion of Fund Performance | <Click Here> | The Portfolio Manager's review of fund
performance and strategy. |
Shareholder Expense Example | <Click Here> | An example of shareholder expenses. |
Investment Summary | <Click Here> | A summary of the fund's holdings. |
Investments | <Click Here> | A complete list of the fund's investments with their market values. |
Financial Statements | <Click Here> | Statements of assets and liabilities, operations, and changes in net assets,
as well as financial highlights. |
Notes | <Click Here> | Notes to the financial statements. |
Report of Independent Registered Public Accounting Firm | <Click Here> | |
Trustees and Officers | <Click Here> | |
Distributions | <Click Here> | |
Board Approval of Investment Advisory Contracts and Management Fees | <Click Here> | |
To view a fund's proxy voting guidelines and proxy voting record for the 12-month period ended June 30, visit http://www.fidelity.com/proxyvotingresults or visit the Securities and Exchange Commission's (SEC) web site at http://www.sec.gov. You may also call 1-877-208-0098 to request a free copy of the proxy voting guidelines.
Standard & Poor's, S&P and S&P 500 are registered service marks of The McGraw-Hill Companies, Inc. and have been licensed for use by Fidelity Distributors Corporation.
Other third party marks appearing herein are the property of their respective owners.
All other marks appearing herein are registered or unregistered trademarks or service marks of FMR LLC or an affiliated company.
Annual Report
This report and the financial statements contained herein are submitted for the general information of the shareholders of the fund. This report is not authorized for distribution to prospective investors in the fund unless preceded or accompanied by an effective prospectus.
A fund files its complete schedule of portfolio holdings with the SEC for the first and third quarters of each fiscal year on Form N-Q. Forms N-Q are available on the SEC's web site at http://www.sec.gov. A fund's Forms N-Q may be reviewed and copied at the SEC's Public Reference Room in Washington, DC. Information regarding the operation of the SEC's Public Reference Room may be obtained by calling 1-800-SEC-0330. For a complete list of a fund's portfolio holdings, view the most recent holdings listing, semiannual report, or annual report on Fidelity's web site at http://www.fidelity.com or http://www.advisor.fidelity.com, as applicable.
NOT FDIC INSURED • MAY LOSE VALUE • NO BANK GUARANTEE
Neither the fund nor Fidelity Distributors Corporation is a bank.
Annual Report
(photo_of_Edward_C_Johnson_3d)
Dear Shareholder:
A yearlong uptrend in global equity markets reversed course in late April 2010 when investor sentiment turned bearish due in great measure to concern that Europe's debt crisis would expand and slow or derail economic recovery. However, a bounceback in July helped to recover some of the ground that was lost. Financial markets are always unpredictable, of course, but there also are several time-tested investment principles that can help put the odds in your favor.
One of the basic tenets is to invest for the long term. Over time, riding out the markets' inevitable ups and downs has proven much more effective than selling into panic or chasing the hottest trend. Even missing only a few of the markets' best days can significantly diminish investor returns. Patience also affords the benefits of compounding - of earning interest on additional income or reinvested dividends and capital gains. There can be tax advantages and cost benefits to consider as well. While staying the course doesn't eliminate risk, it can considerably lessen the effect of short-term declines.
You can further manage your investing risk through diversification. And today, more than ever, geographic diversification should be taken into account. Studies indicate that asset allocation is the single most important determinant of a portfolio's long-term success. The right mix of stocks, bonds and cash - aligned to your particular risk tolerance and investment objective - is very important. Age-appropriate rebalancing is also an essential aspect of asset allocation. For younger investors, an emphasis on equities - which historically have been the best-performing asset class over time - is encouraged. As investors near their specific goal, such as retirement or sending a child to college, consideration may be given to replacing volatile assets (e.g. common stocks) with more-stable fixed investments (bonds or savings plans).
A third principle - investing regularly - can help lower the average cost of your purchases. Investing a certain amount of money each month or quarter helps ensure you won't pay for all your shares at market highs. This strategy - known as dollar cost averaging - also reduces "emotion" from investing, helping shareholders avoid selling weak performers just prior to an upswing, or chasing a hot performer just before a correction.
We invite you to contact us via the Internet, through our Investor Centers or by phone. It is our privilege to provide you the information you need to make the investments that are right for you.
Sincerely,
(The chairman's signature appears here.)
Edward C. Johnson 3d
Annual Report
Average annual total return reflects the change in the value of an investment, assuming reinvestment of the class' distributions from dividend income and capital gains (the profits earned upon the sale of securities that have grown in value, if any) and assuming a constant rate of performance each year. The $10,000 table and the fund's returns do not reflect the deduction of taxes that a shareholder would pay on fund distributions or the redemption of fund shares. During periods of reimbursement by Fidelity, a fund's total return will be greater than it would be had the reimbursement not occurred. How a fund did yesterday is no guarantee of how it will do tomorrow.
Average Annual Total Returns
Periods ended July 31, 2010 | Past 1
year | Past 5
years | Life of
fund A |
Institutional ClassB | 28.33% | 3.18% | 6.60% |
A From February 4, 2003 .
B The initial offering of Institutional Class shares took place on April 14, 2010. Returns prior to April 14, 2010 are those of Fidelity® Real Estate Income Fund, the original class of the fund.
$10,000 Over Life of Fund
Let's say hypothetically that $10,000 was invested in Fidelity® Advisor Real Estate Income Fund - Institutional Class on February 4, 2003, when the fund started. The chart shows how the value of your investment would have changed, and also shows how the S&P 500® Index performed over the same period. The initial offering of Institutional Class took place on April 14, 2010. See above for additional information regarding the performance of Institutional Class.
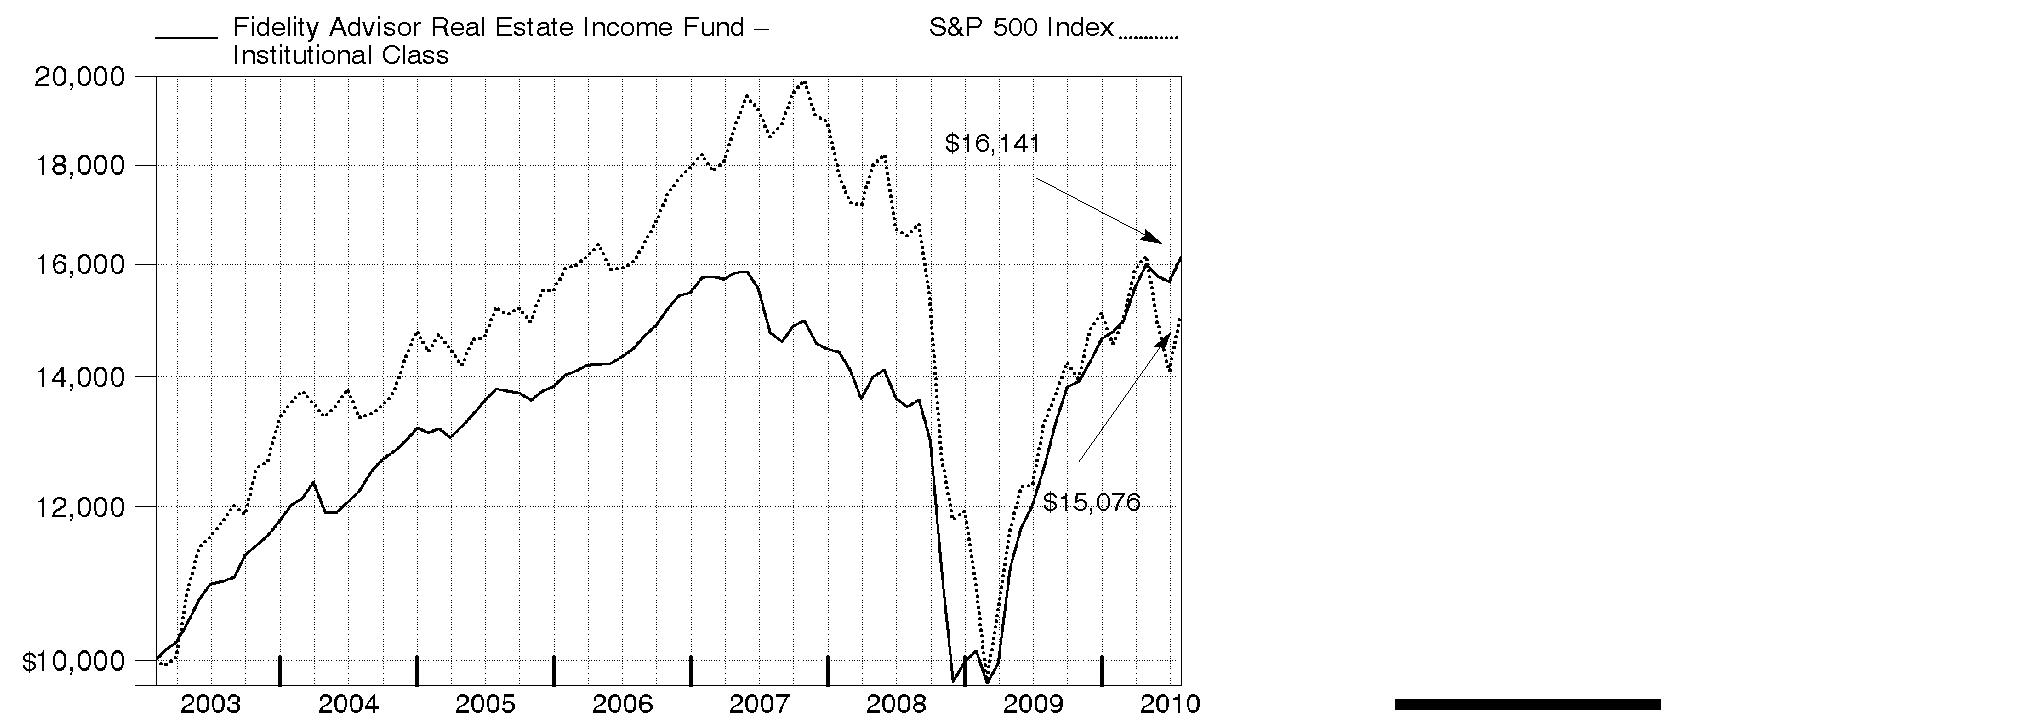
Annual Report
Market Recap: The 12 months ending July 31, 2010, reflected a gradual return to historical norms for investors in real estate stocks and bonds. Commercial property values, which significantly declined in 2008 and early 2009, stabilized and even began to increase modestly, benefiting from very low interest rates and better economic conditions. In addition, the income that commercial properties generated looked reasonable compared with U.S. Treasuries and other bond alternatives. Overall, property-related securities benefited from strengthening fundamentals. For example, in recent months, rents and occupancy rates in apartments and hotels started to improve, while rental rates for office properties stopped going down. For the year, The BofA Merrill Lynch U.S. Real Estate IndexSM - a market-capitalization-weighted measure of the performance of investment-grade public debt of corporate issuers in the domestic real estate sector - rose 22.94%. Real estate investment trusts (REITs) did the best, increasing 48.68%, as measured by the FTSE NAREIT All REIT Index. Both real estate bonds and stocks performed considerably better than the S&P 500® Index, a proxy for the broad U.S. equity market, which returned 13.84%.
Comments from Mark Snyderman, Portfolio Manager of Fidelity Advisor Real Estate Income Fund: For the year, the fund's Institutional Class shares trailed the Fidelity Real Estate Income Composite Index - a 40/40/20 blend of the MSCI® REIT Preferred Index, The BofA Merrill Lynch U.S. Real Estate Index and the FTSE NAREIT index, respectively - which returned 33.67%. Overall, however, I'm pleased to have helped shareholders make a very good return in the past year. (For specific class-level results, please see the performance section of this report.) The fund's much smaller allocation to preferred stocks was the main reason for its underperformance of the Composite index. The fund's common and preferred stocks, real estate bonds and commercial mortgage-backed securities (CMBS) all turned in a healthy double-digit gain. Common stocks did the best, rising nearly 50%, slightly ahead of the FTSE NAREIT index. The portfolio's preferred stocks modestly outpaced the MSCI index's roughly 36% return. My real estate bond investments returned close to 20% overall, slightly lagging the BofA Merrill Lynch index because I tend to favor lower-duration securities - meaning those with less interest-rate sensitivity. The fund's CMBS allocation added nicely to returns. My holdings in this group - about 21% of the portfolio, on average - rose more than 35%.
The views expressed above reflect those of the portfolio manager(s) only through the end of the period as stated on the cover of this report and do not necessarily represent the views of Fidelity or any other person in the Fidelity organization. Any such views are subject to change at any time based upon market or other conditions and Fidelity disclaims any responsibility to update such views. These views may not be relied on as investment advice and, because investment decisions for a Fidelity fund are based on numerous factors, may not be relied on as an indication of trading intent on behalf of any Fidelity fund.
Annual Report
Shareholder Expense Example
As a shareholder of the Fund, you incur two types of costs: (1) transaction costs, including sales charges (loads) on purchase payments or redemption proceeds, redemption fees, and (2) ongoing costs, including management fees, distribution and/or service (12b-1) fees and other Fund expenses. This Example is intended to help you understand your ongoing costs (in dollars) of investing in the Fund and to compare these costs with the ongoing costs of investing in other mutual funds.
The actual expense Example is based on an investment of $1,000 invested at the beginning of the period and held for the entire period (February 1, 2010 to July 31, 2010) for Real Estate Income and for the entire period (April 14, 2010 to July 31, 2010) for Class A, Class T, Class C and Institutional Class. The hypothetical expense Example is based on an investment of $1,000 invested for the one-half year period (February 1, 2010 to July 31, 2010).
Actual Expenses
The first line of the accompanying table for each class of the Fund provides information about actual account values and actual expenses. You may use the information in this line, together with the amount you invested, to estimate the expenses that you paid over the period. Simply divide your account value by $1,000.00 (for example, an $8,600 account value divided by $1,000.00 = 8.6), then multiply the result by the number in the first line for a class of the Fund under the heading entitled "Expenses Paid During Period" to estimate the expenses you paid on your account during this period. A small balance maintenance fee of $12.00 that is charged once a year may apply for certain accounts with a value of less than $2,000. This fee is not included in the table below. If it was, the estimate of expenses you paid during the period would be higher, and your ending account value lower, by this amount. In addition, the Fund, as a shareholder in the underlying Fidelity Central Funds, will indirectly bear its pro-rata share of the fees and expenses incurred by the underlying Fidelity Central Funds. These fees and expenses are not included in the Fund's annualized expense ratio used to calculate the expense estimate in the table below.
Hypothetical Example for Comparison Purposes
The second line of the accompanying table for each class of the Fund provides information about hypothetical account values and hypothetical expenses based on a Class' actual expense ratio and an assumed rate of return of 5% per year before expenses, which is not the Class' actual return. The hypothetical account values and expenses may not be used to estimate the actual ending account balance or expenses you paid for the period. You may use this information to compare the ongoing costs of investing in the Fund and other funds. To do so, compare this 5% hypothetical example with the 5% hypothetical examples that appear in the shareholder reports of the other funds. A small balance maintenance fee of $12.00 that is charged once a year may apply for certain accounts with a value of less than $2,000. This fee is not included in the table below. If it was, the estimate of expenses you paid during the period would be higher, and your ending account value lower, by this amount. In addition, the Fund, as a shareholder in the underlying Fidelity Central Funds, will indirectly bear its pro-rata share of the fees and expenses incurred by the underlying Fidelity Central Funds. These fees and expenses are not included in the Fund's annualized expense ratio used to calculate the expense estimate in the table below.
Annual Report
Please note that the expenses shown in the table are meant to highlight your ongoing costs only and do not reflect any transaction costs. Therefore, the second line of the table is useful in comparing ongoing costs only, and will not help you determine the relative total costs of owning different funds. In addition, if these transactional costs were included, your costs would have been higher.
| Annualized Expense Ratio | Beginning
Account Value | Ending
Account Value
July 31, 2010 | Expenses Paid
During Period |
Class A | 1.09% | | | |
Actual | | $ 1,000.00 | $ 1,014.60 | $ 3.28 B |
HypotheticalA | | $ 1,000.00 | $ 1,019.39 | $ 5.46 C |
Class T | 1.17% | | | |
Actual | | $ 1,000.00 | $ 1,014.50 | $ 3.52 B |
HypotheticalA | | $ 1,000.00 | $ 1,018.99 | $ 5.86 C |
Class C | 1.86% | | | |
Actual | | $ 1,000.00 | $ 1,012.90 | $ 5.59 B |
HypotheticalA | | $ 1,000.00 | $ 1,015.57 | $ 9.30 C |
Real Estate Income | .93% | | | |
Actual | | $ 1,000.00 | $ 1,093.40 | $ 4.83 B |
HypotheticalA | | $ 1,000.00 | $ 1,020.18 | $ 4.66 C |
Institutional Class | .85% | | | |
Actual | | $ 1,000.00 | $ 1,015.80 | $ 2.56 B |
HypotheticalA | | $ 1,000.00 | $ 1,020.58 | $ 4.26 C |
A 5% return per year before expenses
B Actual expenses are equal to each Class' annualized expense ratio, multiplied by the average account value over the period, multiplied by 181/365 (to reflect the one-half year period) for Real Estate Income and multiplied by 108/365 (to reflect the period April 14, 2010 to July 31, 2010) for Class A, Class T, Class C and Institutional Class.
C Hypothetical expenses are equal to each Class' annualized expense ratio, multiplied by average account value over the period, multiplied by 181/365 (to reflect one-half year period.)
Annual Report
Investment Changes (Unaudited)
Top Five Stocks as of July 31, 2010 |
| % of fund's
net assets | % of fund's net assets
6 months ago |
MFA Financial, Inc. | 1.8 | 1.9 |
Acadia Realty Trust (SBI) | 1.5 | 1.2 |
Equity Lifestyle Properties, Inc. | 1.4 | 1.3 |
Cypress Sharpridge Investments, Inc. | 1.3 | 0.7 |
Ventas, Inc. | 1.3 | 1.4 |
| 7.3 | |
Top 5 Bonds as of July 31, 2010 |
| % of fund's
net assets | % of fund's net assets
6 months ago |
Lexington Master Ltd. Partnership 5.45% 1/15/27 | 1.4 | 2.0 |
Ventas Realty LP 6.5% 6/1/16 | 1.1 | 1.5 |
Acadia Realty Trust 3.75% 12/15/26 | 1.1 | 1.5 |
Inland Real Estate Corp. 4.625% 11/15/26 | 1.0 | 1.0 |
Omega Healthcare Investors, Inc. 7% 4/1/14 | 1.0 | 1.3 |
| 5.6 | |
Top Five REIT Sectors as of July 31, 2010 |
| % of fund's
net assets | % of fund's net assets
6 months ago |
REITs - Shopping Centers | 8.9 | 10.4 |
REITs - Mortgage | 8.7 | 7.3 |
REITs - Health Care Facilities | 8.3 | 11.1 |
REITs - Management/Investment | 6.6 | 7.1 |
REITs - Apartments | 5.0 | 7.0 |
Asset Allocation (% of fund's net assets) |
As of July 31, 2010* | As of January 31, 2010** |
| Common Stocks 23.4% | | | Common Stocks 20.9% | |
| Preferred Stocks 8.1% | | | Preferred Stocks 9.4% | |
| Bonds 45.1% | | | Bonds 45.7% | |
| Convertible
Securities 11.8% | | | Convertible
Securities 16.4% | |
| Other Investments 1.5% | | | Other Investments 1.0% | |
| Short-Term
Investments and
Net Other Assets 10.1% | | | Short-Term
Investments and
Net Other Assets 6.6% | |
* Foreign investments | 2.3% | | ** Foreign investments | 2.9% | |

Annual Report
Investments July 31, 2010
Showing Percentage of Net Assets
Common Stocks - 23.4% |
| Shares | | Value |
CONSUMER DISCRETIONARY - 0.7% |
Hotels, Restaurants & Leisure - 0.3% |
Starwood Hotels & Resorts Worldwide, Inc. | 74,100 | | $ 3,590,145 |
Household Durables - 0.4% |
Stanley Martin Communities LLC Class B (a) | 4,620 | | 3,696,000 |
TOTAL CONSUMER DISCRETIONARY | | 7,286,145 |
FINANCIALS - 21.4% |
Capital Markets - 0.2% |
HFF, Inc. (a) | 271,664 | | 2,379,777 |
Real Estate Investment Trusts - 21.0% |
Acadia Realty Trust (SBI) | 853,449 | | 15,822,944 |
Alexandria Real Estate Equities, Inc. | 28,800 | | 2,031,840 |
AMB Property Corp. (SBI) | 248,200 | | 6,195,072 |
American Campus Communities, Inc. | 175,500 | | 5,080,725 |
Annaly Capital Management, Inc. | 523,250 | | 9,104,550 |
Anworth Mortgage Asset Corp. | 1,129,510 | | 7,872,685 |
Apartment Investment & Management Co. Class A | 141,241 | | 3,032,444 |
Associated Estates Realty Corp. | 432,500 | | 5,985,800 |
AvalonBay Communities, Inc. | 48,225 | | 5,067,965 |
Brandywine Realty Trust (SBI) | 191,100 | | 2,170,896 |
CapLease, Inc. | 124,200 | | 608,580 |
CBL & Associates Properties, Inc. | 296,173 | | 4,167,154 |
Cedar Shopping Centers, Inc. | 267,400 | | 1,657,880 |
Chimera Investment Corp. | 255,200 | | 987,624 |
Cypress Sharpridge Investments, Inc. | 1,018,863 | | 13,448,992 |
Cypress Sharpridge Investments, Inc. (g) | 146,458 | | 1,933,246 |
DCT Industrial Trust, Inc. | 413,600 | | 1,939,784 |
Developers Diversified Realty Corp. | 115,000 | | 1,305,250 |
DiamondRock Hospitality Co. | 264,700 | | 2,456,416 |
Duke Realty LP | 362,983 | | 4,341,277 |
Dynex Capital, Inc. | 350,000 | | 3,395,000 |
Equity Lifestyle Properties, Inc. | 266,930 | | 14,128,605 |
Equity Residential (SBI) | 52,200 | | 2,393,370 |
Excel Trust, Inc. (a) | 276,100 | | 3,158,584 |
Federal Realty Investment Trust (SBI) | 22,400 | | 1,751,456 |
Franklin Street Properties Corp. | 90,317 | | 1,102,771 |
Glimcher Realty Trust | 64,600 | | 429,590 |
Government Properties Income Trust | 73,500 | | 2,042,565 |
Health Care REIT, Inc. | 26,200 | | 1,187,122 |
Highwoods Properties, Inc. (SBI) | 106,400 | | 3,331,384 |
Kimco Realty Corp. | 87,800 | | 1,323,146 |
Common Stocks - continued |
| Shares | | Value |
FINANCIALS - continued |
Real Estate Investment Trusts - continued |
Lexington Corporate Properties Trust | 30,900 | | $ 198,687 |
MFA Financial, Inc. | 2,521,581 | | 18,508,390 |
Monmouth Real Estate Investment Corp. Class A | 427,000 | | 3,360,490 |
National Retail Properties, Inc. | 147,900 | | 3,419,448 |
Nationwide Health Properties, Inc. | 138,580 | | 5,185,664 |
Pebblebrook Hotel Trust (a) | 186,300 | | 3,407,427 |
Piedmont Office Realty Trust, Inc. Class A (f) | 158,700 | | 2,856,600 |
ProLogis Trust | 194,366 | | 2,110,815 |
Public Storage | 23,800 | | 2,335,256 |
Redwood Trust, Inc. | 278,000 | | 4,350,700 |
Regency Centers Corp. | 97,400 | | 3,675,876 |
Simon Property Group, Inc. | 96,001 | | 8,565,209 |
Sun Communities, Inc. | 35,000 | | 1,018,500 |
Sunstone Hotel Investors, Inc. (a) | 479,900 | | 4,952,568 |
The Macerich Co. | 93,074 | | 3,857,917 |
Two Harbors Investment Corp. | 346,800 | | 2,923,524 |
UDR, Inc. | 64,101 | | 1,353,172 |
Ventas, Inc. | 260,480 | | 13,211,546 |
Vornado Realty Trust | 43,790 | | 3,624,936 |
| | 218,371,442 |
Real Estate Management & Development - 0.2% |
CB Richard Ellis Group, Inc. Class A (a) | 122,500 | | 2,082,500 |
Thrifts & Mortgage Finance - 0.0% |
Wrightwood Capital LLC warrants 7/31/14 (a)(g) | 60,681 | | 607 |
TOTAL FINANCIALS | | 222,834,326 |
HEALTH CARE - 1.2% |
Health Care Providers & Services - 1.2% |
Brookdale Senior Living, Inc. (a) | 364,900 | | 5,174,282 |
Capital Senior Living Corp. (a) | 412,050 | | 2,225,070 |
Emeritus Corp. (a)(f) | 280,141 | | 4,821,227 |
| | 12,220,579 |
MATERIALS - 0.1% |
Paper & Forest Products - 0.1% |
Weyerhaeuser Co. | 61,500 | | 997,530 |
TOTAL COMMON STOCKS (Cost $210,556,928) | 243,338,580 |
Preferred Stocks - 9.5% |
| Shares | | Value |
Convertible Preferred Stocks - 1.4% |
FINANCIALS - 1.4% |
Real Estate Investment Trusts - 1.1% |
Alexandria Real Estate Equities, Inc. Series D 7.00% | 20,000 | | $ 457,500 |
CommonWealth REIT 6.50% | 80,000 | | 1,612,800 |
Lexington Corporate Properties Trust Series C 6.50% | 254,009 | | 9,303,080 |
| | 11,373,380 |
Real Estate Management & Development - 0.3% |
Forest City Enterprises, Inc. Series A 7.00% | 10,000 | | 508,000 |
Grubb & Ellis Co.: | | | |
12.00% (g) | 22,500 | | 1,833,750 |
12.00% (g) | 5,000 | | 407,500 |
| | 2,749,250 |
TOTAL FINANCIALS | | 14,122,630 |
Nonconvertible Preferred Stocks - 8.1% |
CONSUMER DISCRETIONARY - 0.0% |
Household Durables - 0.0% |
M/I Homes, Inc. Series A, 9.75% (a) | 18,200 | | 323,050 |
FINANCIALS - 8.1% |
Diversified Financial Services - 0.4% |
DRA CRT Acquisition Corp. Series A, 8.50% | 25,000 | | 306,250 |
Red Lion Hotels Capital Trust 9.50% | 163,125 | | 4,081,388 |
W2007 Grace Acquisition I, Inc. Series B, 8.75% (a) | 35,300 | | 4,236 |
| | 4,391,874 |
Real Estate Investment Trusts - 7.7% |
Alexandria Real Estate Equities, Inc. Series C, 8.375% | 67,000 | | 1,737,310 |
American Home Mortgage Investment Corp.: | | | |
Series A, 9.375% (a) | 120,300 | | 12 |
Series B, 9.25% (a) | 124,100 | | 124 |
Annaly Capital Management, Inc. Series A, 7.875% | 164,900 | | 4,224,738 |
Anworth Mortgage Asset Corp. Series A, 8.625% | 247,727 | | 6,188,220 |
Apartment Investment & Management Co.: | | | |
Series G, 9.375% | 136,198 | | 3,508,460 |
Series T, 8.00% | 57,500 | | 1,432,900 |
CapLease, Inc. Series A, 8.125% | 43,400 | | 1,031,184 |
CBL & Associates Properties, Inc.: | | | |
(depositary shares) Series C, 7.75% | 34,500 | | 803,850 |
7.375% | 43,688 | | 977,301 |
Preferred Stocks - continued |
| Shares | | Value |
Nonconvertible Preferred Stocks - continued |
FINANCIALS - continued |
Real Estate Investment Trusts - continued |
Cedar Shopping Centers, Inc. 8.875% | 117,801 | | $ 3,002,747 |
CenterPoint Properties Trust Series D, 5.377% | 3,575 | | 1,644,500 |
Colonial Properties Trust (depositary shares) Series D, 8.125% | 42,200 | | 1,048,670 |
CommonWealth REIT 8.75% | 43,019 | | 1,086,230 |
Corporate Office Properties Trust Series H, 7.50% | 5,000 | | 123,100 |
Cousins Properties, Inc. Series A, 7.75% | 93,230 | | 2,214,213 |
Developers Diversified Realty Corp. (depositary shares)
Series G, 8.00% | 49,000 | | 1,169,630 |
Digital Realty Trust, Inc. Series A, 8.50% | 75,000 | | 1,897,500 |
Duke Realty LP: | | | |
8.375% | 128,517 | | 3,383,853 |
Series L, 6.60% | 10,666 | | 232,412 |
Eagle Hospitality Properties Trust, Inc. 8.25% (a) | 24,000 | | 21,600 |
Glimcher Realty Trust Series G, 8.125% | 73,400 | | 1,702,880 |
HomeBanc Mortgage Corp. Series A, 10.00% (a) | 104,685 | | 1 |
Hospitality Properties Trust: | | | |
Series B, 8.875% | 88,600 | | 2,263,730 |
Series C, 7.00% | 58,500 | | 1,373,580 |
Innkeepers USA Trust Series C, 8.00% (a) | 62,400 | | 33,696 |
iStar Financial, Inc. Series E, 7.875% | 54,000 | | 799,740 |
Kimco Realty Corp. Series G, 7.75% | 77,300 | | 2,021,395 |
LaSalle Hotel Properties: | | | |
Series B, 8.375% | 26,800 | | 675,360 |
Series E, 8.00% | 42,750 | | 1,034,550 |
Series G, 7.25% | 114,485 | | 2,661,776 |
LBA Realty Fund II: | | | |
Series A, 8.75% (a) | 69,000 | | 2,277,000 |
Series B, 7.625% (a) | 31,240 | | 562,320 |
Lexington Corporate Properties Trust Series B, 8.05% | 29,000 | | 680,920 |
Lexington Realty Trust 7.55% | 23,800 | | 527,646 |
LTC Properties, Inc. Series F, 8.00% | 101,900 | | 2,565,842 |
MFA Financial, Inc. Series A, 8.50% | 335,099 | | 8,471,303 |
Mid-America Apartment Communities, Inc. Series H, 8.30% | 15,400 | | 389,620 |
Omega Healthcare Investors, Inc. Series D, 8.375% | 59,600 | | 1,537,680 |
Parkway Properties, Inc. Series D, 8.00% | 25,000 | | 612,250 |
ProLogis Trust Series C, 8.54% | 84,446 | | 4,106,187 |
PS Business Parks, Inc.: | | | |
(depositary shares) Series H, 7.00% | 6,700 | | 164,418 |
(depositary shares) Series L, 7.60% | 49,890 | | 1,238,769 |
Preferred Stocks - continued |
| Shares | | Value |
Nonconvertible Preferred Stocks - continued |
FINANCIALS - continued |
Real Estate Investment Trusts - continued |
PS Business Parks, Inc.: - continued | | | |
7.20% | 35,900 | | $ 872,729 |
Series P, 6.70% | 35,000 | | 811,650 |
Public Storage: | | | |
Series I, 7.25% | 10,828 | | 273,407 |
Series K, 7.25% | 21,418 | | 548,301 |
Series N, 7.00% | 4,200 | | 106,764 |
Regency Centers Corp.: | | | |
7.25% | 10,500 | | 259,875 |
Series C 7.45% | 18,000 | | 447,300 |
Saul Centers, Inc. 8.00% | 93,700 | | 2,384,665 |
Sunstone Hotel Investors, Inc. Series A, 8.00% | 62,200 | | 1,533,230 |
Weingarten Realty Investors (SBI) Series F, 6.50% | 56,230 | | 1,290,479 |
| | 79,957,617 |
TOTAL FINANCIALS | | 84,349,491 |
TOTAL NONCONVERTIBLE PREFERRED STOCKS | | 84,672,541 |
TOTAL PREFERRED STOCKS (Cost $110,568,273) | 98,795,171 |
Corporate Bonds - 29.7% |
| Principal Amount (e) | | |
Convertible Bonds - 10.4% |
CONSUMER DISCRETIONARY - 0.1% |
Hotels, Restaurants & Leisure - 0.1% |
Morgans Hotel Group Co. 2.375% 10/15/14 | | $ 1,340,000 | | 988,250 |
FINANCIALS - 10.3% |
Real Estate Investment Trusts - 6.7% |
Acadia Realty Trust 3.75% 12/15/26 | | 11,505,000 | | 11,325,234 |
Alexandria Real Estate Equities, Inc. 3.7% 1/15/27 (g) | | 6,895,000 | | 6,771,580 |
Annaly Capital Management, Inc. 4% 2/15/15 | | 1,000,000 | | 1,043,125 |
BRE Properties, Inc. 4.125% 8/15/26 | | 6,800,000 | | 6,829,750 |
CapLease, Inc. 7.5% 10/1/27 (g) | | 5,180,000 | | 5,128,200 |
Hospitality Properties Trust 3.8% 3/15/27 | | 5,100,000 | | 5,087,250 |
Corporate Bonds - continued |
| Principal Amount (e) | | Value |
Convertible Bonds - continued |
FINANCIALS - continued |
Real Estate Investment Trusts - continued |
Inland Real Estate Corp. 4.625% 11/15/26 | | $ 10,870,000 | | $ 10,652,600 |
Lexington Corporate Properties Trust 6% 1/15/30 (g) | | 5,000,000 | | 5,181,250 |
ProLogis Trust: | | | | |
1.875% 11/15/37 | | 2,450,000 | | 2,247,875 |
2.625% 5/15/38 | | 1,500,000 | | 1,389,375 |
The Macerich Co. 3.25% 3/15/12 (g) | | 4,800,000 | | 4,698,000 |
United Dominion Realty Trust, Inc. 3.625% 9/15/11 | | 5,500,000 | | 5,500,000 |
Washington (REIT): | | | | |
3.875% 9/15/26 | | 1,600,000 | | 1,592,000 |
3.875% 9/15/26 | | 2,450,000 | | 2,437,750 |
| | 69,883,989 |
Real Estate Management & Development - 3.6% |
BioMed Realty LP 4.5% 10/1/26 (g) | | 2,500,000 | | 2,500,000 |
Brandywine Operating Partnership LP 3.875% 10/15/26 | | 1,000,000 | | 992,500 |
Corporate Office Properties LP: | | | | |
3.5% 9/15/26 (g) | | 3,280,000 | | 3,222,600 |
4.25% 4/15/30 (g) | | 2,000,000 | | 1,993,000 |
Duke Realty LP 3.75% 12/1/11 (g) | | 2,650,000 | | 2,643,375 |
First Potomac Realty Investment LP 4% 12/15/11 (g) | | 2,600,000 | | 2,538,250 |
Grubb & Ellis Co. 7.95% 5/1/15 (g) | | 3,500,000 | | 2,944,375 |
Home Properties, Inc. 4.125% 11/1/26 (g) | | 2,100,000 | | 2,092,125 |
Kilroy Realty LP 3.25% 4/15/12 (g) | | 2,185,000 | | 2,113,988 |
Lexington Master Ltd. Partnership 5.45% 1/15/27 (g) | | 14,950,000 | | 14,800,500 |
MPT Operating Partnership LP 9.25% 4/1/13 (g) | | 1,000,000 | | 1,075,000 |
SL Green Realty Corp. 3% 3/30/27 (g) | | 500,000 | | 485,000 |
| | 37,400,713 |
TOTAL FINANCIALS | | 107,284,702 |
TOTAL CONVERTIBLE BONDS | | 108,272,952 |
Nonconvertible Bonds - 19.3% |
CONSUMER DISCRETIONARY - 3.3% |
Hotels, Restaurants & Leisure - 0.4% |
Times Square Hotel Trust 8.528% 8/1/26 (g) | | 3,968,871 | | 4,038,326 |
Corporate Bonds - continued |
| Principal Amount (e) | | Value |
Nonconvertible Bonds - continued |
CONSUMER DISCRETIONARY - continued |
Household Durables - 2.6% |
KB Home: | | | | |
5.75% 2/1/14 | | $ 510,000 | | $ 479,400 |
5.875% 1/15/15 | | 2,000,000 | | 1,860,000 |
6.25% 6/15/15 | | 7,500,000 | | 6,900,000 |
9.1% 9/15/17 | | 1,000,000 | | 1,013,750 |
Lennar Corp.: | | | | |
5.5% 9/1/14 | | 1,000,000 | | 928,750 |
5.6% 5/31/15 | | 1,000,000 | | 905,000 |
6.95% 6/1/18 (g) | | 3,000,000 | | 2,662,500 |
M/I Homes, Inc. 6.875% 4/1/12 | | 2,150,000 | | 2,090,875 |
Meritage Homes Corp.: | | | | |
6.25% 3/15/15 | | 2,500,000 | | 2,381,250 |
7.15% 4/15/20 | | 1,500,000 | | 1,346,250 |
Ryland Group, Inc. 8.4% 5/15/17 | | 745,000 | | 791,563 |
Standard Pacific Corp.: | | | | |
6.25% 4/1/14 | | 2,700,000 | | 2,544,750 |
8.375% 5/15/18 | | 2,245,000 | | 2,188,875 |
10.75% 9/15/16 | | 1,000,000 | | 1,070,000 |
| | 27,162,963 |
Specialty Retail - 0.3% |
Toys 'R' US Property Co. I LLC 10.75% 7/15/17 | | 2,490,000 | | 2,801,250 |
TOTAL CONSUMER DISCRETIONARY | | 34,002,539 |
CONSUMER STAPLES - 0.3% |
Food & Staples Retailing - 0.3% |
Ahold Lease Series 2001 A1 pass thru trust certificates 7.82% 1/2/20 | | 1,281,883 | | 1,435,709 |
C&S Group Enterprises LLC 8.375% 5/1/17 (g) | | 1,630,000 | | 1,556,650 |
| | 2,992,359 |
FINANCIALS - 15.4% |
Commercial Banks - 0.2% |
CapitalSource, Inc. 12.75% 7/15/14 (g) | | 1,500,000 | | 1,736,250 |
Diversified Financial Services - 0.4% |
Icahn Enterprises LP/Icahn Enterprises Finance Corp. 7.75% 1/15/16 | | 4,000,000 | | 3,990,000 |
Corporate Bonds - continued |
| Principal Amount (e) | | Value |
Nonconvertible Bonds - continued |
FINANCIALS - continued |
Real Estate Investment Trusts - 8.9% |
AvalonBay Communities, Inc.: | | | | |
5.5% 1/15/12 | | $ 527,000 | | $ 551,419 |
6.625% 9/15/11 | | 393,000 | | 411,965 |
Camden Property Trust 5% 6/15/15 | | 1,100,000 | | 1,160,740 |
Commercial Net Lease Realty, Inc.: | | | | |
6.15% 12/15/15 | | 800,000 | | 856,399 |
6.25% 6/15/14 | | 3,005,000 | | 3,261,597 |
Developers Diversified Realty Corp.: | | | | |
4.625% 8/1/10 | | 900,000 | | 900,000 |
5.375% 10/15/12 | | 500,000 | | 499,045 |
5.5% 5/1/15 | | 2,000,000 | | 1,911,018 |
7.5% 4/1/17 | | 2,500,000 | | 2,475,273 |
7.5% 7/15/18 | | 5,271,000 | | 5,125,336 |
9.625% 3/15/16 | | 3,836,000 | | 4,201,648 |
Entertainment Properties Trust 7.75% 7/15/20 (g) | | 2,000,000 | | 1,957,500 |
Equity One, Inc.: | | | | |
5.375% 10/15/15 | | 1,500,000 | | 1,521,897 |
6.25% 12/15/14 | | 3,000,000 | | 3,190,734 |
Federal Realty Investment Trust 5.65% 6/1/16 | | 725,000 | | 783,005 |
Health Care Property Investors, Inc.: | | | | |
5.65% 12/15/13 | | 1,025,000 | | 1,090,835 |
6% 3/1/15 | | 1,000,000 | | 1,068,453 |
6.3% 9/15/16 | | 5,250,000 | | 5,589,602 |
7.072% 6/8/15 | | 1,500,000 | | 1,668,411 |
Health Care REIT, Inc.: | | | | |
6% 11/15/13 | | 1,000,000 | | 1,093,641 |
6.2% 6/1/16 | | 750,000 | | 824,795 |
Healthcare Realty Trust, Inc. 6.5% 1/17/17 | | 1,875,000 | | 1,981,980 |
HMB Capital Trust V 4.1371% 12/15/36 (d)(g)(h) | | 2,530,000 | | 0 |
Hospitality Properties Trust: | | | | |
5.625% 3/15/17 | | 915,000 | | 898,796 |
6.75% 2/15/13 | | 610,000 | | 648,782 |
7.875% 8/15/14 | | 1,000,000 | | 1,108,650 |
HRPT Properties Trust: | | | | |
6.25% 8/15/16 | | 1,500,000 | | 1,565,039 |
6.5% 1/15/13 | | 200,000 | | 211,067 |
iStar Financial, Inc. 5.95% 10/15/13 | | 5,330,000 | | 3,970,850 |
Kimco Realty Corp. 5.783% 3/15/16 | | 450,000 | | 490,279 |
Corporate Bonds - continued |
| Principal Amount (e) | | Value |
Nonconvertible Bonds - continued |
FINANCIALS - continued |
Real Estate Investment Trusts - continued |
Nationwide Health Properties, Inc.: | | | | |
6% 5/20/15 | | $ 3,122,000 | | $ 3,442,108 |
6.25% 2/1/13 | | 1,000,000 | | 1,075,846 |
8.25% 7/1/12 | | 1,300,000 | | 1,421,732 |
Omega Healthcare Investors, Inc.: | | | | |
7% 4/1/14 | | 9,720,000 | | 9,853,650 |
7% 1/15/16 | | 1,295,000 | | 1,314,425 |
7.5% 2/15/20 (g) | | 1,000,000 | | 1,045,000 |
Pan Pacific Retail Properties, Inc. 5.95% 6/1/14 | | 1,750,000 | | 1,910,384 |
Potlatch Corp. 7.5% 11/1/19 | | 1,000,000 | | 1,010,000 |
ProLogis Trust: | | | | |
6.25% 3/15/17 | | 2,000,000 | | 1,935,774 |
6.625% 5/15/18 | | 2,000,000 | | 1,950,180 |
6.875% 3/15/20 | | 1,500,000 | | 1,437,281 |
Reckson Operating Partnership LP 7.75% 3/15/20 (g) | | 2,000,000 | | 2,000,000 |
Senior Housing Properties Trust: | | | | |
6.75% 4/15/20 | | 2,000,000 | | 2,040,000 |
8.625% 1/15/12 | | 5,900,000 | | 6,187,625 |
UDR, Inc. 5.5% 4/1/14 | | 500,000 | | 529,707 |
United Dominion Realty Trust, Inc.: | | | | |
5.13% 1/15/14 | | 500,000 | | 517,405 |
5.25% 1/15/15 | | 1,000,000 | | 1,042,302 |
Weingarten Realty Investors 4.857% 1/15/14 | | 2,500,000 | | 2,576,130 |
| | 92,308,305 |
Real Estate Management & Development - 5.8% |
AMB Property LP: | | | | |
5.9% 8/15/13 | | 400,000 | | 425,077 |
6.125% 12/1/16 | | 1,000,000 | | 1,078,402 |
Brandywine Operating Partnership LP: | | | | |
5.4% 11/1/14 | | 1,750,000 | | 1,802,542 |
5.75% 4/1/12 | | 1,000,000 | | 1,033,235 |
7.5% 5/15/15 | | 1,000,000 | | 1,104,883 |
CB Richard Ellis Services, Inc. 11.625% 6/15/17 | | 1,500,000 | | 1,698,750 |
Colonial Properties Trust: | | | | |
6.15% 4/15/13 | | 1,500,000 | | 1,543,574 |
6.25% 6/15/14 | | 1,594,000 | | 1,628,897 |
6.875% 8/15/12 | | 1,000,000 | | 1,035,000 |
Colonial Realty LP 6.05% 9/1/16 | | 2,500,000 | | 2,424,405 |
Corporate Bonds - continued |
| Principal Amount (e) | | Value |
Nonconvertible Bonds - continued |
FINANCIALS - continued |
Real Estate Management & Development - continued |
Duke Realty LP: | | | | |
6.25% 5/15/13 | | $ 750,000 | | $ 804,506 |
7.375% 2/15/15 | | 1,500,000 | | 1,685,130 |
DuPont Fabros Technology LP 8.5% 12/15/17 | | 845,000 | | 897,813 |
Forest City Enterprises, Inc.: | | | | |
6.5% 2/1/17 | | 3,310,000 | | 2,780,400 |
7.625% 6/1/15 | | 1,435,000 | | 1,305,850 |
Highwoods/Forsyth LP 5.85% 3/15/17 | | 2,800,000 | | 2,816,708 |
Host Hotels & Resorts LP: | | | | |
6.875% 11/1/14 | | 500,000 | | 507,500 |
9% 5/15/17 | | 750,000 | | 810,000 |
Liberty Property LP: | | | | |
5.125% 3/2/15 | | 2,200,000 | | 2,289,516 |
6.375% 8/15/12 | | 2,679,000 | | 2,868,295 |
Post Apartment Homes LP: | | | | |
5.45% 6/1/12 | | 713,000 | | 742,970 |
6.3% 6/1/13 | | 2,000,000 | | 2,157,816 |
Regency Centers LP: | | | | |
5.25% 8/1/15 | | 4,509,000 | | 4,773,687 |
5.875% 6/15/17 | | 400,000 | | 425,412 |
Toys 'R' Us Property Co. II LLC 8.5% 12/1/17 (g) | | 1,000,000 | | 1,050,000 |
Ventas Realty LP: | | | | |
6.5% 6/1/16 | | 2,340,000 | | 2,392,650 |
6.5% 6/1/16 | | 11,370,000 | | 11,625,825 |
6.625% 10/15/14 | | 6,160,000 | | 6,283,200 |
| | 59,992,043 |
Thrifts & Mortgage Finance - 0.1% |
Wrightwood Capital LLC 9% 6/1/14 (d)(g) | | 4,000,000 | | 1,370,000 |
TOTAL FINANCIALS | | 159,396,598 |
Corporate Bonds - continued |
| Principal Amount (e) | | Value |
Nonconvertible Bonds - continued |
HEALTH CARE - 0.3% |
Health Care Providers & Services - 0.3% |
Skilled Healthcare Group, Inc. 11% 1/15/14 | | $ 1,580,000 | | $ 1,406,200 |
Sun Healthcare Group, Inc. 9.125% 4/15/15 | | 2,050,000 | | 2,137,125 |
| | 3,543,325 |
TOTAL NONCONVERTIBLE BONDS | | 199,934,821 |
TOTAL CORPORATE BONDS (Cost $288,182,095) | 308,207,773 |
Asset-Backed Securities - 5.2% |
|
Anthracite CDO I Ltd. Series 2002-CIBA Class B, 6.633% 5/24/37 (g) | | 1,384,000 | | 1,218,353 |
Anthracite CDO II Ltd. Series 2002-2A Class F, 7.6% 12/24/37 (g) | | 2,260,000 | | 971,800 |
Anthracite CDO III Ltd./Anthracite CDO III Corp. Series 2004-1A Class A, 0.6906% 3/23/19 (g)(h) | | 395,791 | | 296,843 |
Brascan Real Estate CDO Ltd./Brascan Real Estate CDO Corp. Series 2004-1A Class A, 0.8713% 1/20/40 (g)(h) | | 2,309,895 | | 2,211,724 |
Capital Trust RE CDO Ltd. Series 2005-1A Class D, 1.8381% 3/20/50 (g)(h) | | 2,250,000 | | 225,000 |
Capital Trust RE CDO Ltd./Capital Trust RE CDO Corp. Series 2005-3A Class A2, 5.16% 6/25/35 (g) | | 5,375,000 | | 5,213,750 |
CapitalSource Real Estate Loan Trust Series 2006-1A Class A2A, 0.7713% 1/20/37 (g)(h) | | 1,186,654 | | 771,325 |
CapLease CDO Ltd. Series 2005-1A Class A, 4.926% 1/29/40 (g) | | 2,430,816 | | 1,823,112 |
Conseco Finance Securitizations Corp. Series 2002-2 Class M2, 9.163% 3/1/33 | | 500,000 | | 237,030 |
Crest Clarendon Street Ltd./Crest Clarendon Corp. Series 2002-1A: | | | | |
Class B1, 6.065% 12/28/35 (g) | | 1,570,000 | | 1,130,400 |
Class B2, 1.8872% 12/28/35 (g)(h) | | 1,575,000 | | 937,125 |
Class D, 9% 12/28/35 (g) | | 500,000 | | 158,650 |
Crest Dartmouth Street Ltd./Crest Dartmouth Street Corp. Series 2003-1A Class D, 9% 6/28/38 (g) | | 997,000 | | 279,160 |
Crest Ltd. Series 2002-IGA: | | | | |
Class A, 0.9375% 7/28/17 (g)(h) | | 1,145,821 | | 1,077,072 |
Class B, 1.8375% 7/28/35 (g)(h) | | 1,500,000 | | 1,329,450 |
Asset-Backed Securities - continued |
| Principal Amount (e) | | Value |
Deutsche Financial Capital Securitization LLC Series 1997-I Class M, 7.275% 9/15/27 | | $ 6,500,000 | | $ 5,652,853 |
Fairfield Street Solar Corp. Series 2004-1A Class E1, 3.9028% 11/28/39 (g)(h) | | 550,000 | | 38,500 |
Green Tree Financial Corp.: | | | | |
Series 1996-4 Class M1, 7.75% 6/15/27 | | 1,788,179 | | 1,660,953 |
Series 1997-3 Class M1, 7.53% 3/15/28 | | 8,167,187 | | 5,706,925 |
GSR Mortgage Loan Trust Series 2005-HE3 Class B3, 2.8288% 6/25/35 (h)(j) | | 1,259,000 | | 72,722 |
Guggenheim Structured Real Estate Funding Ltd./Guggenheim Structured Real Estate Funding LLC Series 2005-2A: | | | | |
Class D, 1.8788% 8/26/30 (g)(h) | | 749,836 | | 74,984 |
Class E, 2.3288% 8/26/30 (g)(h) | | 1,455,839 | | 72,792 |
Leafs CMBS I Ltd./Leafs CMBS I Corp. Series 2002-1A Class A2, 0.8881% 11/20/17 (g)(h) | | 1,926,008 | | 1,829,708 |
Lehman ABS Manufactured Housing Contract Trust Series 2001-B Class M2, 7.17% 3/15/28 | | 1,447,670 | | 500,753 |
Merit Securities Corp. Series 13 Class M1, 7.9882% 12/28/33 | | 1,923,000 | | 1,744,067 |
N-Star Real Estate CDO Ltd. Series 1A Class C1B, 7.696% 8/28/38 (g) | | 883,000 | | 535,098 |
Prima Capital CDO Ltd./Prima Capital CDO Corp. Series 2005-1A Class A2, 4.646% 7/24/39 (g) | | 2,460,088 | | 2,312,483 |
Taberna Preferred Funding III Ltd. Series 2005-3A Class D, 2.9966% 2/5/36 (g)(h) | | 3,370,124 | | 337 |
TIAA Real Estate CDO Ltd./TIAA Real Estate CDO Corp. Series 2002-1A Class IIFX, 6.77% 5/22/37 (g) | | 3,165,000 | | 3,006,750 |
Wachovia Ltd./Wachovia LLC: | | | | |
Series 2006-1 Class 1ML, 5.7835% 9/25/26 (g)(h) | | 2,000,000 | | 540,000 |
Series 2006-1A: | | | | |
Class A1A, 0.7983% 9/25/26 (g)(h) | | 2,439,000 | | 1,975,590 |
Class A1B, 0.8683% 9/25/26 (g)(h) | | 4,285,000 | | 3,235,175 |
Class A2A, 0.7583% 9/25/26 (g)(h) | | 9,140,000 | | 7,540,500 |
Wrightwood Capital Real Estate CDO Ltd. Series 2005-1A Class F, 2.4275% 11/21/40 (g)(h) | | 250,000 | | 15,000 |
TOTAL ASSET-BACKED SECURITIES (Cost $63,473,583) | 54,395,984 |
Collateralized Mortgage Obligations - 2.8% |
| Principal Amount (e) | | Value |
Private Sponsor - 2.8% |
Banc of America Large Loan, Inc. Series 2005-MIB1 Class A2, 0.5509% 3/15/22 (g)(h) | | $ 8,050,108 | | $ 7,783,777 |
COMM pass-thru certificates Series 2007-FL14 Class AJ, 0.5209% 6/15/22 (g)(h) | | 3,250,000 | | 2,772,973 |
Countrywide Home Loans, Inc.: | | | | |
Series 2002-38 Class B3, 5% 2/25/18 (g) | | 122,616 | | 15,339 |
Series 2002-R2 Class 2B3, 4.7244% 7/25/33 (g)(h) | | 236,928 | | 83,988 |
Series 2003-40 Class B3, 4.5% 10/25/18 (g) | | 165,728 | | 18,280 |
Series 2003-R2 Class B3, 5.5% 5/25/43 (g) | | 359,616 | | 18,896 |
Series 2003-R3: | | | | |
Class B2, 5.5% 11/25/33 (g) | | 1,593,299 | | 469,657 |
Class B3, 5.5% 11/25/33 (g) | | 477,085 | | 43,133 |
Series 2004-R1 Class 1B3, 5.5% 11/25/34 (g)(h) | | 343,868 | | 17,633 |
Freddie Mac Series 2010 K7 Class B, 5.4341% 4/25/20 (g)(h) | | 1,500,000 | | 1,325,700 |
FREMF Mortgage Trust Series 2010-K6 Class B, 5.3574% 12/26/46 (g)(h) | | 4,500,000 | | 3,925,502 |
Merrill Lynch Floating Trust floater Series 2006-1 Class TM, 0.841% 6/15/22 (g)(h) | | 5,198,066 | | 4,496,327 |
Merrill Lynch Mortgage Investors Trust Series 1998-C3 Class F, 6% 12/15/30 (g) | | 4,240,000 | | 4,126,368 |
Merrill Lynch Mortgage Trust Series 2002-MW1 Class E, 6.219% 7/12/34 (g) | | 1,600,000 | | 1,627,974 |
RESI Finance LP/RESI Finance DE Corp. floater: | | | | |
Series 2003-B Class B9, 12.2925% 7/10/35 (g)(h) | | 577,830 | | 327,803 |
Series 2004-C Class B5, 1.6925% 9/10/36 (g)(h) | | 323,453 | | 150,600 |
Series 2005-A Class B6, 2.3425% 3/10/37 (g)(h) | | 1,775,940 | | 311,500 |
Series 2005-B Class B6, 1.9425% 6/10/37 (g)(h) | | 897,707 | | 62,750 |
Series 2005-D Class B6, 2.5909% 12/15/37 (g)(h) | | 452,911 | | 18,162 |
Series 2006-B Class B6, 2.0409% 7/15/38 (g)(h) | | 921,308 | | 14,188 |
Residential Funding Mortgage Securities I, Inc. Series 2002-S20 Class M3, 5.25% 12/25/17 | | 46,470 | | 30,125 |
Residential Funding Securities Corp. Series 2002-RM1 Class BI1, 5.5% 12/25/17 (g) | | 95,444 | | 32,093 |
RESIX Finance Ltd. floater: | | | | |
Series 2003-D Class B8, 6.8425% 12/10/35 (g)(h) | | 508,287 | | 180,137 |
Series 2004-A Class B7, 4.5925% 2/10/36 (g)(h) | | 520,533 | | 216,073 |
Series 2004-B Class B7, 4.3425% 2/10/36 (g)(h) | | 630,046 | | 174,208 |
Series 2005-C Class B7, 3.4425% 9/10/37 (g)(h) | | 1,847,925 | | 145,801 |
Collateralized Mortgage Obligations - continued |
| Principal Amount (e) | | Value |
Private Sponsor - continued |
RESIX Finance Ltd. floater: - continued | | | | |
Series 2006-B Class B7, 4.1909% 7/15/38 (g)(h) | | $ 841,219 | | $ 11,020 |
Series 2007-A Class BB, 3.6909% 2/15/39 (g)(h) | | 575,971 | | 1,901 |
TOTAL PRIVATE SPONSOR | | 28,401,908 |
U.S. Government Agency - 0.0% |
Fannie Mae REMIC Trust: | | | | |
Series 2001-W3 subordinate REMIC pass thru certificates, Class B3, 7% 9/25/41 (j) | | 202,034 | | 109,976 |
Series 2002-W1 subordinate REMIC pass thru certificates, Class 3B3, 4.4529% 2/25/42 (g)(h) | | 126,091 | | 54,561 |
Series 2003-W1 subordinate REMIC pass thru certificates, Class B3, 5.75% 12/25/42 (j) | | 276,868 | | 91,121 |
Series 2003-W10 subordinate REMIC pass thru certificates, Class 2B3, 4.5583% 6/25/43 (g)(h) | | 170,779 | | 61,218 |
Series 2003-W4 subordinate REMIC pass thru certificates, Class 2B3, 4.6215% 10/25/42 (g)(h) | | 74,156 | | 26,092 |
TOTAL U.S. GOVERNMENT AGENCY | | 342,968 |
TOTAL COLLATERALIZED MORTGAGE OBLIGATIONS (Cost $37,253,558) | 28,744,876 |
Commercial Mortgage Securities - 17.8% |
|
Asset Securitization Corp. Series 1997-D4: | | | | |
Class B1, 7.525% 4/14/29 | | 1,565,000 | | 1,641,920 |
Class B2, 7.525% 4/14/29 | | 560,000 | | 579,712 |
Banc of America Commercial Mortgage, Inc.: | | | | |
sequential payer Series 2002-2 Class F, 5.487% 7/11/43 | | 4,185,000 | | 4,012,407 |
Series 2005-1 Class CJ, 5.3362% 11/10/42 (h) | | 3,580,000 | | 3,325,119 |
Series 2005-6 Class AJ, 5.35% 9/10/47 (h) | | 5,000,000 | | 4,589,640 |
Banc of America Large Loan, Inc. floater Series 2005-MIB1 Class K, 2.3409% 3/15/22 (g)(h) | | 820,000 | | 352,600 |
Bear Stearns Commercial Mortgage Securities, Inc. Series 2006-PW11 Class AJ, 5.6236% 3/11/39 (h) | | 5,700,000 | | 4,924,612 |
Bear Stearns Commercial Mortgage Securities Trust: | | | | |
floater Series 2006-BBA7: | | | | |
Class D, 0.6009% 3/15/19 (g)(h) | | 2,480,000 | | 2,072,139 |
Class E, 0.6609% 3/15/19 (g)(h) | | 1,995,000 | | 1,611,038 |
Class F, 0.6809% 3/15/19 (g)(h) | | 1,650,000 | | 1,274,110 |
Commercial Mortgage Securities - continued |
| Principal Amount (e) | | Value |
Bear Stearns Commercial Mortgage Securities Trust: - continued | | | | |
floater Series 2006-BBA7: | | | | |
Class G, 0.7809% 3/15/19 (g)(h) | | $ 2,760,000 | | $ 1,968,965 |
Series 2006-T22 Class B, 5.6284% 4/12/38 (g)(h) | | 2,520,000 | | 2,093,906 |
Citigroup Commercial Mortgage Trust floater Series 2007-FL3A Classs MLA2, 1.3909% 4/15/22 (g)(h) | | 800,000 | | 652,005 |
COMM pass-thru certificates Series 2001-J1A Class F, 6.958% 2/16/34 (g) | | 2,600,000 | | 2,627,255 |
Credit Suisse First Boston Mortgage Securities Corp. Series 2004-TF2A Class AX, 0.0136% 11/15/19 (g)(h)(i) | | 4,560,701 | | 228 |
Credit Suisse/Morgan Stanley Commercial Mortgage Trust: | | | | |
floater Series 2006-HC1A: | | | | |
Class A2, 0.6009% 5/15/23 (g)(h) | | 5,800,000 | | 5,474,633 |
Class D, 0.8109% 5/15/23 (g)(h) | | 1,250,000 | | 1,144,969 |
Class F, 0.9409% 5/15/23 (g)(h) | | 1,825,000 | | 1,640,680 |
Series 2006-HC1A Class A1, 0.5309% 5/15/23 (g)(h) | | 2,445,102 | | 2,330,284 |
Crest Ltd. Series 2001-1A Class C, 9% 2/25/34 (g) | | 1,000,000 | | 440,000 |
Deutsche Mortgage & Asset Receiving Corp. Series 1998-C1 Class J, 6.22% 6/15/31 | | 1,200,000 | | 980,774 |
DLJ Commercial Mortgage Corp.: | | | | |
Series 1998-CG1 Class B4, 7.4574% 6/10/31 (g)(h) | | 2,500,000 | | 2,735,966 |
Series 2000-CKP1 Class B3, 8.5482% 11/10/33 (h) | | 2,970,000 | | 2,966,191 |
First Union National Bank Commercial Mortgage Trust Series 2001-C4: | | | | |
Class H, 7.036% 12/12/33 (g) | | 2,000,000 | | 2,020,947 |
Class K, 6% 12/12/33 (g) | | 2,000,000 | | 1,948,235 |
G-Force LLC sequential payer Series 2005-RRA Class A2, 4.83% 8/22/36 (g) | | 7,545,000 | | 7,054,575 |
GE Capital Commercial Mortgage Corp.: | | | | |
Series 2001-3 Class C, 6.51% 6/10/38 | | 820,000 | | 835,259 |
Series 2002-1A Class H, 7.4003% 12/10/35 (g)(h) | | 991,000 | | 957,525 |
Global Towers Partners Acquisition Partners I LLC Series 2007-1A Class G, 7.8737% 5/15/37 (g) | | 1,000,000 | | 1,040,000 |
GMAC Commercial Mortgage Securities, Inc.: | | | | |
Series 1997-C2: | | | | |
Class F, 6.75% 4/15/29 (h) | | 2,702,284 | | 2,825,545 |
Class G, 6.75% 4/15/29 (h) | | 1,250,000 | | 1,238,451 |
Series 1999-C3: | | | | |
Class G, 6.974% 8/15/36 (g) | | 1,551,289 | | 1,557,774 |
Class J, 6.974% 8/15/36 (g) | | 1,500,000 | | 1,526,450 |
Commercial Mortgage Securities - continued |
| Principal Amount (e) | | Value |
GMAC Commercial Mortgage Securities, Inc.: - continued | | | | |
Series 2000-C1: | | | | |
Class H, 7% 3/15/33 (g) | | $ 568,791 | | $ 562,048 |
Class K, 7% 3/15/33 | | 1,100,000 | | 861,158 |
Series 2002-C3 Class D, 5.27% 7/10/39 | | 3,000,000 | | 3,037,131 |
Greenwich Capital Commercial Funding Corp.: | | | | |
sequential payer Series 2003-C1 Class D, 4.29% 7/5/35 (g) | | 2,000,000 | | 1,984,305 |
Series 2002-C1 Class H, 5.903% 1/11/35 (g) | | 880,000 | | 836,054 |
GS Mortgage Securities Corp. II floater Series 2007-EOP Class L, 1.6475% 3/1/20 (g)(h) | | 1,400,000 | | 1,148,000 |
JPMorgan Chase Commercial Mortgage Securities Corp.: | | | | |
Series 2001-A: | | | | |
Class G, 6% 10/15/32 (g)(h) | | 2,895,000 | | 14,475 |
Class X, 1.0879% 10/15/32 (g)(h)(i) | | 7,823,066 | | 217 |
Series 2009-IWST Class D, 7.6935% 12/5/27 (g)(h) | | 3,250,000 | | 3,281,771 |
JPMorgan Chase Commercial Mortgage Securities Trust floater Series 2005-FL1A Class A2, 0.5209% 2/15/19 (g)(h) | | 2,505,338 | | 2,356,715 |
JPMorgan Commercial Mortgage Finance Corp.: | | | | |
Series 1997-C5 Class F, 7.5605% 9/15/29 | | 2,719,847 | | 2,872,371 |
Series 1999-C8: | | | | |
Class G, 6% 7/15/31 (g) | | 1,385,000 | | 1,246,338 |
Class H, 6% 7/15/31 (g) | | 2,638,000 | | 131,900 |
LB Commercial Conduit Mortgage Trust Series 1998-C4 Class G, 5.6% 10/15/35 (g) | | 2,820,000 | | 2,876,682 |
LB-UBS Commercial Mortgage Trust: | | | | |
sequential payer: | | | | |
Series 2004-C2 Class E, 4.487% 3/15/36 | | 2,060,000 | | 1,928,886 |
Series 2005-C7 Class AJ, 5.323% 11/15/40 | | 6,000,000 | | 5,354,522 |
Series 2006-C7 Class AM, 5.378% 11/15/38 | | 2,040,000 | | 1,755,114 |
Series 2005-C2 Class AJ, 5.205% 4/15/30 (h) | | 8,910,000 | | 7,984,874 |
Series 2006-C4: | | | | |
Class AJ, 5.9022% 6/15/38 (h) | | 6,005,000 | | 5,038,615 |
Class AM, 5.9022% 6/15/38 (h) | | 6,700,000 | | 6,041,858 |
Leafs CMBS I Ltd./Leafs CMBS I Corp. Series 2002-1A Class B, 4.13% 11/20/37 (g) | | 1,850,000 | | 1,757,500 |
Merrill Lynch Financial Asset, Inc. Series 2005-CA16: | | | | |
Class F, 4.384% 7/12/37 | CAD | 710,000 | | 326,364 |
Class G, 4.384% 7/12/37 | CAD | 355,000 | | 157,241 |
Class H, 4.384% 7/12/37 | CAD | 236,000 | | 100,756 |
Class J, 4.384% 7/12/37 | CAD | 355,000 | | 146,146 |
Commercial Mortgage Securities - continued |
| Principal Amount (e) | | Value |
Merrill Lynch Financial Asset, Inc. Series 2005-CA16: - continued | | | | |
Class K, 4.384% 7/12/37 | CAD | 355,000 | | $ 140,967 |
Class L, 4.384% 7/12/37 | CAD | 236,000 | | 90,419 |
Class M, 4.384% 7/12/37 | CAD | 995,000 | | 281,590 |
Merrill Lynch Mortgage Investors Trust: | | | | |
Series 1999-C1 Class G, 6.71% 11/15/31 (g) | | 2,833,490 | | 283 |
Series 2001-HRPA: | | | | |
Class G, 6.778% 2/3/16 (g) | | 840,000 | | 831,600 |
Class H, 6.778% 2/3/16 (g) | | 2,130,000 | | 2,108,700 |
Merrill Lynch Mortgage Trust Series 2006-C1 Class AM, 5.8383% 5/12/39 (h) | | 1,200,000 | | 1,099,538 |
Mezz Capital Commercial Mortgage Trust Series 2004-C1: | | | | |
Class D, 6.988% 1/15/37 | | 750,000 | | 0 |
Class E, 7.983% 1/15/37 | | 1,453,000 | | 0 |
Class IO, 8.4873% 1/15/37 (h)(i) | | 5,527,084 | | 525,073 |
Morgan Stanley Capital I Trust: | | | | |
sequential payer: | | | | |
Series 2004-RR2 Class A2, 5.45% 10/28/33 (g) | | 2,260,570 | | 2,266,221 |
Series 2006-HQ10 Class AM, 5.36% 11/12/41 | | 8,200,000 | | 7,366,776 |
Series 1997-RR Class F, 7.4307% 4/30/39 (g)(h) | | 3,249,026 | | 2,989,104 |
Series 1998-CF1 Class G, 7.35% 7/15/32 (g) | | 2,830,092 | | 1,415,046 |
Series 2005-HQ7 Class E, 5.3761% 11/14/42 (h) | | 850,000 | | 433,500 |
Series 2006-IQ12 Class AMFX, 5.37% 12/15/43 | | 7,500,000 | | 6,337,500 |
Morgan Stanley Dean Witter Capital I Trust Series 2001-IQA Class F, 6.79% 12/18/32 (g) | | 1,486,185 | | 1,509,189 |
Multi Security Asset Trust sequential payer Series 2005-RR4A Class A2, 4.83% 11/28/35 (g) | | 3,152,092 | | 2,935,386 |
Providence Place Group Ltd. Partnership Series 2000-C1 Class A2, 7.75% 7/20/28 (g) | | 3,128,112 | | 3,128,112 |
RBSCF Trust Series 2010-MB1 Class D, 4.8194% 4/15/24 (g)(h) | | 5,820,000 | | 5,298,928 |
Structured Asset Securities Corp.: | | | | |
Series 1996-CFL Class I, 7.75% 2/25/28 (g) | | 3,827,943 | | 3,923,641 |
Series 1997-LLI Class F, 7.3% 10/12/34 (g) | | 2,170,000 | | 2,200,209 |
TIAA Seasoned Commercial Mortgage Trust sequential payer Series 2007-C4 Class AJ, 6.0712% 8/15/39 (h) | | 2,080,000 | | 2,009,231 |
TimberStar Trust I Series 2006-1 Class F, 7.5296% 10/15/36 (g) | | 6,460,000 | | 6,395,400 |
UBS Commercial Mortgage Trust Series 2007-FL1 Class F, 0.9159% 7/15/24 (g)(h) | | 1,200,000 | | 289,236 |
Commercial Mortgage Securities - continued |
| Principal Amount (e) | | Value |
Wachovia Bank Commercial Mortgage Trust: | | | | |
floater Series 2007-WHL8 Class MH1, 1.1409% 6/15/20 (g)(h) | | $ 1,800,000 | | $ 1,490,968 |
Series 2004-C10 Class E, 4.931% 2/15/41 | | 2,000,000 | | 1,843,444 |
Series 2004-C12 Class D, 5.4836% 7/15/41 (h) | | 2,750,000 | | 2,444,518 |
Series 2004-C14 Class B, 5.17% 8/15/41 | | 3,180,000 | | 3,080,420 |
TOTAL COMMERCIAL MORTGAGE SECURITIES (Cost $188,261,532) | 184,679,954 |
Floating Rate Loans - 1.5% |
|
CONSUMER DISCRETIONARY - 0.0% |
Specialty Retail - 0.0% |
The Pep Boys - Manny, Moe & Jack term loan 2.54% 10/27/13 (h) | | 28,155 | | 26,888 |
FINANCIALS - 1.2% |
Diversified Financial Services - 0.1% |
TowerCo Finance LLC term loan 6% 11/24/14 (h) | | 568,147 | | 569,568 |
Real Estate Investment Trusts - 0.2% |
Medical Properties Trust, Inc. Tranche B, term loan 5% 5/17/16 (h) | | 2,000,000 | | 1,970,000 |
Real Estate Management & Development - 0.9% |
CB Richard Ellis Services, Inc. Tranche B1-A, term loan 6.5% 12/20/15 (h) | | 2,298,941 | | 2,284,573 |
Realogy Corp.: | | | | |
Credit-Linked Deposit 3.35% 10/10/13 (h) | | 1,186,117 | | 1,034,887 |
Tranche 2LN, term loan 13.5% 10/15/17 | | 2,500,000 | | 2,625,000 |
Tranche B, term loan 3.3472% 10/10/13 (h) | | 4,405,577 | | 3,843,866 |
| | 9,788,326 |
TOTAL FINANCIALS | | 12,327,894 |
HEALTH CARE - 0.3% |
Health Care Providers & Services - 0.3% |
Skilled Healthcare Group, Inc. term loan: | | | | |
5.25% 4/9/16 (h) | | 1,628,362 | | 1,514,377 |
Floating Rate Loans - continued |
| Principal Amount (e) | | Value |
HEALTH CARE - continued |
Health Care Providers & Services - continued |
Skilled Healthcare Group, Inc. term loan: - continued | | | | |
5.25% 4/9/16 (h) | | $ 148,438 | | $ 138,047 |
Universal Health Services, Inc. term loan 7/28/16 (h) | | 2,000,000 | | 1,982,400 |
| | 3,634,824 |
TOTAL FLOATING RATE LOANS (Cost $16,036,884) | 15,989,606 |
Preferred Securities - 0.0% |
| | | |
FINANCIALS - 0.0% |
Diversified Financial Services - 0.0% |
Cairn High Grade ABS CDO PLC Series 2006-2A Class SUB, 1/13/47 (g) | 1,000,000 | | 0 |
Crest Clarendon Street 2002-1 Ltd. Series 2002-1A Class PS, 12/28/35 (g) | 500,000 | | 85,000 |
Crest Dartmouth Street 2003 1 Ltd. Series 2003-1A Class PS, 6/28/38 (g) | 1,220,000 | | 280,600 |
Harp High Grade CDO I Ltd. Series 2006-1, 7/8/46 (g) | 810,000 | | 8 |
Ipswich Street CDO Series 2006-1, 6/27/46 (d)(g) | 1,350,000 | | 0 |
Kent Funding III Ltd. 11/5/47 (g) | 1,650,000 | | 0 |
| | 365,608 |
TOTAL PREFERRED SECURITIES (Cost $5,781,511) | 365,608 |
Money Market Funds - 10.1% |
| Shares | | |
Fidelity Cash Central Fund, 0.24% (b) | 101,267,689 | | 101,267,689 |
Fidelity Securities Lending Cash Central Fund, 0.27% (b)(c) | 3,560,975 | | 3,560,975 |
TOTAL MONEY MARKET FUNDS (Cost $104,828,664) | 104,828,664 |
Cash Equivalents - 0.3% |
| Maturity Amount | | Value |
Investments in repurchase agreements in a joint trading account at 0.21%, dated 7/30/10 due 8/2/10 (Collateralized by U.S. Government Obligations) #
(Cost $2,682,000) | $ 2,682,047 | | $ 2,682,000 |
TOTAL INVESTMENT PORTFOLIO - 100.3% (Cost $1,027,625,028) | | 1,042,028,216 |
NET OTHER ASSETS (LIABILITIES) - (0.3)% | | (3,177,633) |
NET ASSETS - 100% | $ 1,038,850,583 |
Currency Abbreviations |
CAD | - | Canadian dollar |
Legend |
(a) Non-income producing |
(b) Affiliated fund that is available only to investment companies and other accounts managed by Fidelity Investments. The rate quoted is the annualized seven-day yield of the fund at period end. A complete unaudited listing of the fund's holdings as of its most recent quarter end is available upon request. |
(c) Investment made with cash collateral received from securities on loan. |
(d) Non-income producing - Issuer is in default. |
(e) Principal amount is stated in United States dollars unless otherwise noted. |
(f) Security or a portion of the security is on loan at period end. |
(g) Security exempt from registration under Rule 144A of the Securities Act of 1933. These securities may be resold in transactions exempt from registration, normally to qualified institutional buyers. At the end of the period, the value of these securities amounted to $242,980,827 or 23.4% of net assets. |
(h) The coupon rate shown on floating or adjustable rate securities represents the rate at period end. |
(i) Security represents right to receive monthly interest payments on an underlying pool of mortgages or assets. Principal shown is the outstanding par amount of the pool held as of the end of the period. |
(j) Restricted securities - Investment in securities not registered under the Securities Act of 1933 (excluding 144A issues). At the end of the period, the value of restricted securities (excluding 144A issues) amounted to $273,819 or 0.0% of net assets. |
Additional information on each holding is as follows: |
Security | Acquisition Date | Acquisition Cost |
Fannie Mae REMIC Trust: Series 2001-W3 subordinate REMIC pass thru certificates, Class B3, 7% 9/25/41 | 5/21/03 | $ 175,074 |
Series 2003-W1 subordinate REMIC pass thru certificates, Class B3, 5.75% 12/25/42 | 3/25/03 | $ 208,646 |
GSR Mortgage Loan Trust Series 2005-HE3 Class B3, 2.8288% 6/25/35 | 6/3/05 | $ 1,110,697 |
# Additional information on each counterparty to the repurchase agreement is as follows: |
Repurchase Agreement / Counterparty | Value |
$2,682,000 due 8/02/10 at 0.21% |
BNP Paribas Securities Corp. | $ 1,071,608 |
Banc of America Securities LLC | 405,435 |
Barclays Capital, Inc. | 1,204,957 |
| $ 2,682,000 |
Affiliated Central Funds |
Information regarding fiscal year to date income earned by the Fund from investments in Fidelity Central Funds is as follows: |
Fund | Income earned |
Fidelity Cash Central Fund | $ 122,644 |
Fidelity Securities Lending Cash Central Fund | 6,300 |
Total | $ 128,944 |
Other Information |
The following is a summary of the inputs used, as of July 31, 2010, involving the Fund's assets and liabilities carried at fair value. The inputs or methodology used for valuing securities may not be an indication of the risk associated with investing in those securities. For more information on valuation inputs, and their aggregation into the levels used in the tables below, please refer to the Security Valuation section in the accompanying Notes to Financial Statements. |
Valuation Inputs at Reporting Date: |
Description | Total | Level 1 | Level 2 | Level 3 |
Investments in Securities: | | | | |
Equities: | | | | |
Consumer Discretionary | $ 7,609,195 | $ 3,913,195 | $ - | $ 3,696,000 |
Financials | 321,306,447 | 300,180,030 | 17,204,173 | 3,922,244 |
Health Care | 12,220,579 | 12,220,579 | - | - |
Materials | 997,530 | 997,530 | - | - |
Corporate Bonds | 308,207,773 | - | 306,837,773 | 1,370,000 |
Asset-Backed Securities | 54,395,984 | - | 37,509,028 | 16,886,956 |
Collateralized Mortgage Obligations | 28,744,876 | - | 27,750,321 | 994,555 |
Commercial Mortgage Securities | 184,679,954 | - | 172,427,208 | 12,252,746 |
Floating Rate Loans | 15,989,606 | - | 15,989,606 | - |
Preferred Securities | 365,608 | - | - | 365,608 |
Money Market Funds | 104,828,664 | 104,828,664 | - | - |
Cash Equivalents | 2,682,000 | - | 2,682,000 | - |
Total Investments in Securities: | $ 1,042,028,216 | $ 422,139,998 | $ 580,400,109 | $ 39,488,109 |
The following is a reconciliation of Investments in Securities for which Level 3 inputs were used in determining value: |
Investments in Securities: | |
Equities - Consumer Discretionary | |
Beginning Balance | $ - |
Total Realized Gain (Loss) | - |
Total Unrealized Gain (Loss) | 2,304,225 |
Cost of Purchases | 1,391,775 |
Proceeds of Sales | - |
Amortization/Accretion | - |
Transfers in to Level 3 | - |
Transfers out of Level 3 | - |
Ending Balance | $ 3,696,000 |
The change in unrealized gain (loss) for the period attributable to Level 3 securities held at July 31, 2010 | $ 2,304,225 |
Equities - Financials | |
Beginning Balance | $ 3,099,870 |
Total Realized Gain (Loss) | (2,073,397) |
Total Unrealized Gain (Loss) | 3,167,065 |
Cost of Purchases | 607 |
Proceeds of Sales | (271,913) |
Amortization/Accretion | - |
Transfers in to Level 3 | 12 |
Transfers out of Level 3 | - |
Ending Balance | $ 3,922,244 |
The change in unrealized gain (loss) for the period attributable to Level 3 securities held at July 31, 2010 | $ 932,126 |
Corporate Bonds | |
Beginning Balance | $ 2,343,856 |
Total Realized Gain (Loss) | - |
Total Unrealized Gain (Loss) | (230,253) |
Cost of Purchases | - |
Proceeds of Sales | - |
Amortization/Accretion | - |
Transfers in to Level 3 | - |
Transfers out of Level 3 | (743,603) |
Ending Balance | $ 1,370,000 |
The change in unrealized gain (loss) for the period attributable to Level 3 securities held at July 31, 2010 | $ (230,253) |
Asset-Backed Securities | |
Beginning Balance | $ 11,832,848 |
Total Realized Gain (Loss) | 164,843 |
Total Unrealized Gain (Loss) | 2,972,785 |
Cost of Purchases | 7,476,085 |
Proceeds of Sales | (1,606,631) |
Amortization/Accretion | (329,128) |
Transfers in to Level 3 | 1,375,000 |
Transfers out of Level 3 | (4,998,846) |
Ending Balance | $ 16,886,956 |
The change in unrealized gain (loss) for the period attributable to Level 3 securities held at July 31, 2010 | $ 2,907,249 |
Collateralized Mortgage Obligations | |
Beginning Balance | $ 2,036,201 |
Total Realized Gain (Loss) | 296,490 |
Total Unrealized Gain (Loss) | 3,450,561 |
Cost of Purchases | - |
Proceeds of Sales | (3,529,343) |
Amortization/Accretion | (534,455) |
Transfers in to Level 3 | 26,799 |
Transfers out of Level 3 | (751,698) |
Ending Balance | $ 994,555 |
The change in unrealized gain (loss) for the period attributable to Level 3 securities held at July 31, 2010 | $ 547,954 |
Commercial Mortgage Securities | |
Beginning Balance | $ 6,157,272 |
Total Realized Gain (Loss) | - |
Total Unrealized Gain (Loss) | 1,065,436 |
Cost of Purchases | 8,051,715 |
Proceeds of Sales | (85,393) |
Amortization/Accretion | (168,765) |
Transfers in to Level 3 | 527,055 |
Transfers out of Level 3 | (3,294,574) |
Ending Balance | $ 12,252,746 |
The change in unrealized gain (loss) for the period attributable to Level 3 securities held at July 31, 2010 | $ 706,900 |
Preferred Securities | |
Beginning Balance | $ 159,115 |
Total Realized Gain (Loss) | - |
Total Unrealized Gain (Loss) | 83,968 |
Cost of Purchases | 113,400 |
Proceeds of Sales | - |
Amortization/Accretion | 9,125 |
Transfers in to Level 3 | - |
Transfers out of Level 3 | - |
Ending Balance | $ 365,608 |
The change in unrealized gain (loss) for the period attributable to Level 3 securities held at July 31, 2010 | $ 83,968 |
The information used in the above reconciliation represents fiscal year to date activity for any Investments in Securities identified as using Level 3 inputs at either the beginning or the end of the current fiscal period. Transfers in or out of Level 3 represent the beginning value of any Security or Instrument where a change in the pricing level occurred from the beginning to the end of the period. The cost of purchases and the proceeds of sales may include securities received or delivered through corporate actions or exchanges. Realized and unrealized gains (losses) disclosed in the reconciliation are included in Net Gain (Loss) on the Fund's Statement of Operations. |
The composition of credit quality ratings as a percentage of net assets is as follows (ratings are unaudited): |
U.S. Government and U.S. Government Agency Obligations | 0.0%* |
AAA,AA,A | 15.7% |
BBB | 16.6% |
BB | 5.2% |
B | 5.3% |
CCC,CC,C | 2.8% |
D | 0.0%* |
Not Rated | 11.4% |
Equities | 32.9% |
Short-Term Investments and Net Other Assets | 10.1% |
| 100.0% |
* Amount represents less than 0.1% |
We have used ratings from Moody's Investors Service, Inc. Where Moody's ratings are not available, we have used S&P ratings. All ratings are as of the report date and do not reflect subsequent downgrades. |
Income Tax Information |
At July 31, 2010, the Fund had a capital loss carryforward of approximately $13,906,408 of which $302,434 and $13,603,974 will expire on July 31, 2016 and 2017, respectively. Capital loss carryforwards are only available to offset future capital gains of the Fund to the extent provided by regulations and may be limited. |
See accompanying notes which are an integral part of the financial statements.
Annual Report
Statement of Assets and Liabilities
| July 31, 2010 |
| | |
Assets | | |
Investment in securities, at value (including securities loaned of $3,465,460 and repurchase agreements of $2,682,000) - See accompanying schedule: Unaffiliated issuers (cost $922,796,364) | $ 937,199,552 | |
Fidelity Central Funds (cost $104,828,664) | 104,828,664 | |
Total Investments (cost $1,027,625,028) | | $ 1,042,028,216 |
Cash | | 12,910 |
Receivable for investments sold | | 59,082 |
Receivable for fund shares sold | | 3,904,419 |
Dividends receivable | | 2,212,230 |
Interest receivable | | 5,665,975 |
Distributions receivable from Fidelity Central Funds | | 16,214 |
Other receivables | | 6,136 |
Total assets | | 1,053,905,182 |
| | |
Liabilities | | |
Payable for investments purchased | $ 9,453,671 | |
Payable for fund shares redeemed | 1,242,558 | |
Accrued management fee | 450,916 | |
Distribution fees payable | 1,158 | |
Other affiliated payables | 265,254 | |
Other payables and accrued expenses | 80,067 | |
Collateral on securities loaned, at value | 3,560,975 | |
Total liabilities | | 15,054,599 |
| | |
Net Assets | | $ 1,038,850,583 |
Net Assets consist of: | | |
Paid in capital | | $ 1,029,732,177 |
Undistributed net investment income | | 11,035,447 |
Accumulated undistributed net realized gain (loss) on investments and foreign currency transactions | | (16,345,917) |
Net unrealized appreciation (depreciation) on investments and assets and liabilities in foreign currencies | | 14,428,876 |
Net Assets | | $ 1,038,850,583 |
See accompanying notes which are an integral part of the financial statements.
Annual Report
Statement of Assets and Liabilities - continued
| July 31, 2010 |
| | |
Calculation of Maximum Offering Price
Class A:
Net Asset Value and redemption price per share
($3,830,229 ÷ 385,150 shares) | | $ 9.94 |
| | |
Maximum offering price per share (100/96.00 of $9.94) | | $ 10.35 |
Class T:
Net Asset Value and redemption price per share ($861,570 ÷ 86,640 shares) | | $ 9.94 |
| | |
Maximum offering price per share (100/96.00 of $9.94) | | $ 10.35 |
Class C:
Net Asset Value and offering price per share
($835,566 ÷ 84,150 shares)A | | $ 9.93 |
| | |
Real Estate Income:
Net Asset Value, offering price and redemption price per share ($1,030,393,032 ÷ 103,518,377 shares) | | $ 9.95 |
| | |
Institutional Class:
Net Asset Value, offering price and redemption price per share ($2,930,186 ÷ 294,473 shares) | | $ 9.95 |
A Redemption price per share is equal to net asset value less any applicable contingent deferred sales charge.
See accompanying notes which are an integral part of the financial statements.
Annual Report
Financial Statements - continued
Statement of Operations
| Year ended July 31, 2010 |
| | |
Investment Income | | |
Dividends | | $ 14,605,009 |
Interest | | 33,888,914 |
Income from Fidelity Central Funds | | 128,944 |
Total income | | 48,622,867 |
| | |
Expenses | | |
Management fee | $ 4,142,289 | |
Transfer agent fees | 2,353,943 | |
Distribution fees | 2,342 | |
Accounting and security lending fees | 331,606 | |
Custodian fees and expenses | 25,321 | |
Independent trustees' compensation | 3,983 | |
Registration fees | 139,993 | |
Audit | 158,498 | |
Legal | 9,943 | |
Miscellaneous | 9,004 | |
Total expenses before reductions | 7,176,922 | |
Expense reductions | (70,219) | 7,106,703 |
Net investment income (loss) | | 41,516,164 |
Realized and Unrealized Gain (Loss) Net realized gain (loss) on: | | |
Investment securities: | | |
Unaffiliated issuers | 20,622,501 | |
Foreign currency transactions | 2,968 | |
Total net realized gain (loss) | | 20,625,469 |
Change in net unrealized appreciation (depreciation) on: Investment securities | 102,834,422 | |
Assets and liabilities in foreign currencies | 21,305 | |
Total change in net unrealized appreciation (depreciation) | | 102,855,727 |
Net gain (loss) | | 123,481,196 |
Net increase (decrease) in net assets resulting from operations | | $ 164,997,360 |
See accompanying notes which are an integral part of the financial statements.
Annual Report
Statement of Changes in Net Assets
| Year ended
July 31,
2010 | Year ended
July 31,
2009 |
Increase (Decrease) in Net Assets | | |
Operations | | |
Net investment income (loss) | $ 41,516,164 | $ 24,141,669 |
Net realized gain (loss) | 20,625,469 | (25,453,488) |
Change in net unrealized appreciation (depreciation) | 102,855,727 | (12,255,306) |
Net increase (decrease) in net assets resulting
from operations | 164,997,360 | (13,567,125) |
Distributions to shareholders from net investment income | (40,150,798) | (21,152,317) |
Share transactions - net increase (decrease) | 450,504,667 | 104,590,330 |
Redemption fees | 230,512 | 250,779 |
Total increase (decrease) in net assets | 575,581,741 | 70,121,667 |
| | |
Net Assets | | |
Beginning of period | 463,268,842 | 393,147,175 |
End of period (including undistributed net investment income of $11,035,447 and undistributed net investment income of $8,560,696, respectively) | $ 1,038,850,583 | $ 463,268,842 |
See accompanying notes which are an integral part of the financial statements.
Annual Report
Financial Highlights - Class A
Period ended July 31, | 2010 H |
Selected Per-Share Data | |
Net asset value, beginning of period | $ 9.95 |
Income from Investment Operations | |
Net investment income (loss) E | .18 |
Net realized and unrealized gain (loss) | (.04) |
Total from investment operations | .14 |
Distributions from net investment income | (.15) |
Redemption fees added to paid in capital E | -J |
Net asset value, end of period | $ 9.94 |
Total Return B, C, D | 1.46% |
Ratios to Average Net Assets F, I | |
Expenses before reductions | 1.09% A |
Expenses net of fee waivers, if any | 1.09% A |
Expenses net of all reductions | 1.09% A |
Net investment income (loss) | 6.23% A |
Supplemental Data | |
Net assets, end of period (000 omitted) | $ 3,830 |
Portfolio turnover rate G | 28% |
A Annualized
B Total returns for periods of less than one year are not annualized.
C Total returns would have been lower had certain expenses not been reduced during the periods shown.
D Total returns do not include the effect of the sales charges.
E Calculated based on average shares outstanding during the period.
F Fees and expenses of the underlying Fidelity Central Funds are not included in the Fund's expense ratio. The Fund indirectly bears its proportionate share of the expenses of any underlying Fidelity Central Funds.
G Amount does not include the portfolio activity of any underlying Fidelity Central Funds.
H For the period April 14, 2010 (commencement of sale of shares) to July 31, 2010.
I Expense ratios reflect operating expenses of the class. Expenses before reductions do not reflect amounts reimbursed by the investment adviser or reductions from brokerage service arrangements or reductions from other expense offset arrangements and do not represent the amount paid by the class during periods when reimbursements or reductions occur. Expense ratios before reductions for start-up periods may not be representative of longer-term operating periods. Expenses net of fee waivers reflect expenses after reimbursement by the investment adviser but prior to reductions from brokerage service arrangements or other expense offset arrangements. Expenses net of all reductions represent the net expenses paid by the class.
J Amount represents less than $.01 per share.
See accompanying notes which are an integral part of the financial statements.
Annual Report
Financial Highlights - Class T
Period ended July 31, | 2010 H |
Selected Per-Share Data | |
Net asset value, beginning of period | $ 9.95 |
Income from Investment Operations | |
Net investment income (loss) E | .17 |
Net realized and unrealized gain (loss) | (.03) |
Total from investment operations | .14 |
Distributions from net investment income | (.15) |
Redemption fees added to paid in capital E | -J |
Net asset value, end of period | $ 9.94 |
Total Return B, C, D | 1.45% |
Ratios to Average Net Assets F, I | |
Expenses before reductions | 1.17% A |
Expenses net of fee waivers, if any | 1.17% A |
Expenses net of all reductions | 1.17% A |
Net investment income (loss) | 5.92% A |
Supplemental Data | |
Net assets, end of period (000 omitted) | $ 862 |
Portfolio turnover rate G | 28% |
A Annualized
B Total returns for periods of less than one year are not annualized.
C Total returns would have been lower had certain expenses not been reduced during the periods shown.
D Total returns do not include the effect of the sales charges.
E Calculated based on average shares outstanding during the period.
F Fees and expenses of the underlying Fidelity Central Funds are not included in the Fund's expense ratio. The Fund indirectly bears its proportionate share of the expenses of any underlying Fidelity Central Funds.
G Amount does not include the portfolio activity of any underlying Fidelity Central Funds.
H For the period April 14, 2010 (commencement of sale of shares) to July 31, 2010.
I Expense ratios reflect operating expenses of the class. Expenses before reductions do not reflect amounts reimbursed by the investment adviser or reductions from brokerage service arrangements or reductions from other expense offset arrangements and do not represent the amount paid by the class during periods when reimbursements or reductions occur. Expense ratios before reductions for start-up periods may not be representative of longer-term operating periods. Expenses net of fee waivers reflect expenses after reimbursement by the investment adviser but prior to reductions from brokerage service arrangements or other expense offset arrangements. Expenses net of all reductions represent the net expenses paid by the class.
J Amount represents less than $.01 per share.
See accompanying notes which are an integral part of the financial statements.
Annual Report
Financial Highlights - Class C
Period ended July 31, | 2010 H |
Selected Per-Share Data | |
Net asset value, beginning of period | $ 9.95 |
Income from Investment Operations | |
Net investment income (loss) E | .15 |
Net realized and unrealized gain (loss) | (.03) |
Total from investment operations | .12 |
Distributions from net investment income | (.14) |
Redemption fees added to paid in capital E | -J |
Net asset value, end of period | $ 9.93 |
Total Return B, C, D | 1.29% |
Ratios to Average Net Assets F, I | |
Expenses before reductions | 1.86% A |
Expenses net of fee waivers, if any | 1.86% A |
Expenses net of all reductions | 1.86% A |
Net investment income (loss) | 5.21% A |
Supplemental Data | |
Net assets, end of period (000 omitted) | $ 836 |
Portfolio turnover rate G | 28% |
A Annualized
B Total returns for periods of less than one year are not annualized.
C Total returns would have been lower had certain expenses not been reduced during the periods shown.
D Total returns do not include the effect of the contingent deferred sales charge.
E Calculated based on average shares outstanding during the period.
F Fees and expenses of the underlying Fidelity Central Funds are not included in the Fund's expense ratio. The Fund indirectly bears its proportionate share of the expenses of any underlying Fidelity Central Funds.
G Amount does not include the portfolio activity of any underlying Fidelity Central Funds.
H For the period April 14, 2010 (commencement of sale of shares) to July 31, 2010.
I Expense ratios reflect operating expenses of the class. Expenses before reductions do not reflect amounts reimbursed by the investment adviser or reductions from brokerage service arrangements or reductions from other expense offset arrangements and do not represent the amount paid by the class during periods when reimbursements or reductions occur. Expense ratios before reductions for start-up periods may not be representative of longer-term operating periods. Expenses net of fee waivers reflect expenses after reimbursement by the investment adviser but prior to reductions from brokerage service arrangements or other expense offset arrangements. Expenses net of all reductions represent the net expenses paid by the class.
J Amount represents less than $.01 per share.
See accompanying notes which are an integral part of the financial statements.
Annual Report
Financial Highlights - Real Estate Income
Years ended July 31, | 2010 | 2009 | 2008 | 2007 | 2006 |
Selected Per-Share Data | | | | | |
Net asset value, beginning of period | $ 8.21 | $ 9.43 | $ 11.22 | $ 11.78 | $ 12.17 |
Income from Investment Operations | | | | | |
Net investment income
(loss) B | .53 | .54 | .59 | .63 | .66 |
Net realized and unrealized gain (loss) | 1.73 | (1.27) | (1.48) | (.37) | (.11) |
Total from investment operations | 2.26 | (.73) | (.89) | .26 | .55 |
Distributions from net investment income | (.52) | (.50) | (.66) | (.58) | (.67) |
Distributions from net realized gain | - | - | (.24) | (.24) | (.27) |
Total distributions | (.52) | (.50) | (.90) | (.82) | (.94) |
Redemption fees added to paid in capital B | - F | .01 | - F | - F | - F |
Net asset value, end of period | $ 9.95 | $ 8.21 | $ 9.43 | $ 11.22 | $ 11.78 |
Total Return A | 28.29% | (6.92)% | (8.43)% | 2.00% | 4.82% |
Ratios to Average Net Assets C, E | | | | | |
Expenses before reductions | .97% | 1.00% | .94% | .88% | .85% |
Expenses net of fee waivers,
if any | .96% | 1.00% | .94% | .88% | .85% |
Expenses net of all reductions | .96% | 1.00% | .94% | .88% | .85% |
Net investment income (loss) | 5.60% | 7.15% | 5.77% | 5.30% | 5.61% |
Supplemental Data | | | | | |
Net assets, end of period
(000 omitted) | $ 1,030,393 | $ 463,269 | $ 393,147 | $ 516,268 | $ 521,265 |
Portfolio turnover rate D | 28% | 47% | 32% | 45% | 27% |
A Total returns would have been lower had certain expenses not been reduced during the periods shown.
B Calculated based on average shares outstanding during the period.
C Fees and expenses of the underlying Fidelity Central Funds are not included in the Fund's expense ratio. The Fund indirectly bears its proportionate share of the expenses of any underlying Fidelity Central Funds.
D Amount does not include the portfolio activity of any underlying Fidelity Central Funds.
E Expense ratios reflect operating expenses of the class. Expenses before reductions do not reflect amounts reimbursed by the investment adviser or reductions from brokerage service arrangements or reductions from other expense offset arrangements and do not represent the amount paid by the class during periods when reimbursements or reductions occur. Expenses net of fee waivers reflect expenses after reimbursement by the investment adviser but prior to reductions from brokerage service arrangements or other expense offset arrangements. Expenses net of all reductions represent the net expenses paid by the class.
F Amount represents less than $.01 per share.
See accompanying notes which are an integral part of the financial statements.
Annual Report
Financial Highlights - Institutional Class
Period ended July 31, | 2010 G |
Selected Per-Share Data | |
Net asset value, beginning of period | $ 9.95 |
Income from Investment Operations | |
Net investment income (loss) D | .19 |
Net realized and unrealized gain (loss) | (.04) |
Total from investment operations | .15 |
Distributions from net investment income | (.15) |
Redemption fees added to paid in capital D | -I |
Net asset value, end of period | $ 9.95 |
Total Return B, C | 1.58% |
Ratios to Average Net Assets E,H | |
Expenses before reductions | .85% A |
Expenses net of fee waivers, if any | .85% A |
Expenses net of all reductions | .85% A |
Net investment income (loss) | 6.70% A |
Supplemental Data | |
Net assets, end of period (000 omitted) | $ 2,930 |
Portfolio turnover rate F | 28% |
A Annualized
B Total returns for periods of less than one year are not annualized.
C Total returns would have been lower had certain expenses not been reduced during the periods shown.
D Calculated based on average shares outstanding during the period.
E Fees and expenses of the underlying Fidelity Central Funds are not included in the Fund's expense ratio. The Fund indirectly bears its proportionate share of the expenses of any underlying Fidelity Central Funds.
F Amount does not include the portfolio activity of any underlying Fidelity Central Funds.
G For the period April 14, 2010 (commencement of sale of shares) to July 31, 2010.
H Expense ratios reflect operating expenses of the class. Expenses before reductions do not reflect amounts reimbursed by the investment adviser or reductions from brokerage service arrangements or reductions from other expense offset arrangements and do not represent the amount paid by the class during periods when reimbursements or reductions occur. Expense ratios before reductions for start-up periods may not be representative of longer-term operating periods. Expenses net of fee waivers reflect expenses after reimbursement by the investment adviser but prior to reductions from brokerage service arrangements or other expense offset arrangements. Expenses net of all reductions represent the net expenses paid by the class.
I Amount represents less than $.01 per share.
See accompanying notes which are an integral part of the financial statements.
Annual Report
Notes to Financial Statements
For the period ended July 31, 2010
1. Organization.
Fidelity Real Estate Income Fund (the Fund) is a fund of Fidelity Securities Fund (the Trust) and is authorized to issue an unlimited number of shares. The Trust is registered under the Investment Company Act of 1940, as amended (the 1940 Act), as an open-end management investment company organized as a Massachusetts business trust. The Fund commenced sale of Class A, Class T, Class C, and Institutional Class shares and the existing class was designated Real Estate Income on April 14, 2010. The Fund offers Class A, Class T, Class C, Real Estate Income and Institutional Class shares, each of which has equal rights as to assets and voting privileges. Each class has exclusive voting rights with respect to matters that affect that class. Investment income, realized and unrealized capital gains and losses, the common expenses of the Fund, and certain fund-level expense reductions, if any, are allocated on a pro-rata basis to each class based on the relative net assets of each class to the total net assets of the Fund. Each class differs with respect to transfer agent and distribution and service plan fees incurred. Certain expense reductions also differ by class.
2. Investments in Fidelity Central Funds.
The Fund may invest in Fidelity Central Funds, which are open-end investment companies available only to other investment companies and accounts managed by Fidelity Management & Research Company (FMR) and its affiliates. The Fund's Schedule of Investments lists each of the Fidelity Central Funds held as of period end, if any, as an investment of the Fund, but does not include the underlying holdings of each Fidelity Central Fund. As an Investing Fund, the Fund indirectly bears its proportionate share of the expenses of the underlying Fidelity Central Funds.
The Money Market Central Funds seek preservation of capital and current income and are managed by Fidelity Investments Money Management, Inc. (FIMM), an affiliate of FMR.
A complete unaudited list of holdings for each Fidelity Central Fund is available upon request or at the Securities and Exchange Commission (the SEC) web site at www.sec.gov. In addition, the financial statements of the Fidelity Central Funds which are not covered by the Fund's Report of Independent Registered Public Accounting Firm, are available on the SEC web site or upon request.
3. Significant Accounting Policies.
The financial statements have been prepared in conformity with accounting principles generally accepted in the United States of America (GAAP), which require management to make certain estimates and assumptions at the date of the financial statements. Actual results could differ from those estimates. The following summarizes the significant accounting policies of the Fund:
Annual Report
3. Significant Accounting Policies - continued
Security Valuation. Investments are valued as of 4:00 p.m. Eastern time on the last calendar day of the period. The Fund uses independent pricing services approved by the Board of Trustees to value its investments. When current market prices or quotations are not readily available or reliable, valuations may be determined in good faith in accordance with procedures adopted by the Board of Trustees. Factors used in determining value may include market or security specific events, changes in interest rates and credit quality. The frequency with which these procedures are used cannot be predicted and they may be utilized to a significant extent. The value used for net asset value (NAV) calculation under these procedures may differ from published prices for the same securities.
The Fund categorizes the inputs to valuation techniques used to value its investments into a disclosure hierarchy consisting of three levels as shown below.
Level 1 - quoted prices in active markets for identical investments
Level 2 - other significant observable inputs (including quoted prices for similar investments, interest rates, prepayment speeds, etc.)
Level 3 - unobservable inputs (including the fund's own assumptions based on the best information available)
Changes in valuation techniques may result in transfers in or out of an assigned level within the disclosure hierarchy. The aggregate value of investments by input level, as of July 31, 2010, as well as a rollforward of level 3 securities, is included at the end of the Fund's Schedule of Investments. Valuation techniques used to value the Fund's investments by major category are as follows.
Equity securities, including restricted securities, for which market quotations are readily available, are valued at the last reported sale price or official closing price as reported by an independent pricing service on the primary market or exchange on which they are traded and are categorized as Level 1 in the hierarchy. In the event there were no sales during the day or closing prices are not available, securities are valued at the last quoted bid price or may be valued using the last available price and are generally categorized as Level 2 in the hierarchy. For foreign equity securities, when significant market or security specific events arise, comparisons to the valuation of American Depositary Receipts (ADRs), futures contracts, Exchange-traded funds (ETFs) and certain indexes as well as quoted prices for similar securities are used and are categorized as Level 2 in the hierarchy in these circumstances. Utilizing these techniques may result in transfers between Level 1 and Level 2. For restricted equity securities and private placements where observable inputs are limited, assumptions about market activity and risk are used and are categorized as Level 3 in the hierarchy.
Annual Report
Notes to Financial Statements - continued
3. Significant Accounting Policies - continued
Security Valuation - continued
Debt securities, including restricted securities, are valued based on evaluated prices received from independent pricing services or from dealers who make markets in such securities. For corporate bonds, floating rate loans and preferred securities, pricing services utilize matrix pricing which considers yield or price of bonds of comparable quality, coupon, maturity and type as well as dealer supplied prices and are generally categorized as Level 2 in the hierarchy. For asset backed securities, collateralized mortgage obligations and commercial mortgage securities, pricing services utilize matrix pricing which considers prepayment speed assumptions, attributes of the collateral, yield or price of bonds of comparable quality, coupon, maturity and type as well as dealer supplied prices and, accordingly, such securities are generally categorized as Level 2 in the hierarchy.
Investments in open-end mutual funds, including the Fidelity Central Funds, are valued at their closing net asset value each business day and are categorized as Level 1 in the hierarchy. Short-term securities with remaining maturities of sixty days or less for which quotations are not readily available are valued at amortized cost, which approximates fair value and are categorized as Level 2 in the hierarchy.
When independent prices are unavailable or unreliable, debt securities may be valued utilizing pricing matrices which consider similar factors that would be used by independent pricing services. These are generally categorized as Level 2 in the hierarchy but may be Level 3 depending on the circumstances. Certain of the Fund's securities may be valued by a single source or dealer.
Foreign Currency. The Fund uses foreign currency contracts to facilitate transactions in foreign-denominated securities. Gains and losses from these transactions may arise from changes in the value of the foreign currency or if the counterparties do not perform under the contracts' terms.
Foreign-denominated assets, including investment securities, and liabilities are translated into U.S. dollars at the exchange rate at period end. Purchases and sales of investment securities, income and dividends received and expenses denominated in foreign currencies are translated into U.S. dollars at the exchange rate in effect on the transaction date.
The effects of exchange rate fluctuations on investments are included with the net realized and unrealized gain (loss) on investment securities. Other foreign currency transactions resulting in realized and unrealized gain (loss) are disclosed separately.
Annual Report
3. Significant Accounting Policies - continued
Investment Transactions and Income. For financial reporting purposes, the Fund's investment holdings and NAV include trades executed through the end of the last business day of the period. The NAV per share for processing shareholder transactions is calculated as of the close of business of the New York Stock Exchange (NYSE), normally 4:00 p.m. Eastern time and includes trades executed through the end of the prior business day. Gains and losses on securities sold are determined on the basis of identified cost. Dividend income is recorded on the ex-dividend date, except for certain dividends from foreign securities where the ex-dividend date may have passed, which are recorded as soon as the Fund is informed of the ex-dividend date. Non-cash dividends included in dividend income, if any, are recorded at the fair market value of the securities received. Distributions received on securities that represent a return of capital or capital gain are recorded as a reduction of cost of investment and/or as a realized gain. The Funds estimate the components of distributions received that may be considered return of capital distributions or capital gain distributions. Interest income and distributions from the Fidelity Central Funds are accrued as earned. Interest income includes coupon interest and amortization of premium and accretion of discount on debt securities. For certain lower credit quality securitized assets that have contractual cash flows (for example, asset backed securities, collateralized mortgage obligations and commercial mortgage-backed securities), changes in estimated cash flows are periodically evaluated and the estimated yield is adjusted on a prospective basis over the remaining life of the security, resulting in increases or decreases to Interest Income in the accompanying Statement of Operations. Investment income is recorded net of foreign taxes withheld where recovery of such taxes is uncertain. Debt obligations may be placed on non-accrual status and related interest income may be reduced by ceasing current accruals and writing off interest receivables when the collection of all or a portion of interest has become doubtful based on consistently applied procedures. A debt obligation is removed from non-accrual status when the issuer resumes interest payments or when collectability of interest is reasonably assured.
Expenses. Most expenses of the Trust can be directly attributed to a fund. Expenses which cannot be directly attributed are apportioned amongst each fund in the Trust. Expense estimates are accrued in the period to which they relate and adjustments are made when actual amounts are known.
Income Tax Information and Distributions to Shareholders. Each year the Fund intends to qualify as a regulated investment company, including distributing substantially all of its taxable income and realized gains under Subchapter M of the Internal Revenue Code and filing its U.S. federal tax return. As a result, no provision for income taxes is required. As of July 31, 2010, the Fund did not have any unrecognized tax benefits in the accompanying financial statements. A fund's federal tax return is subject to examination by the Internal Revenue Service (IRS) for a period of three years. Foreign taxes are provided for based on the Fund's understanding of the tax rules and rates that exist in the foreign markets in which it invests.
Annual Report
Notes to Financial Statements - continued
3. Significant Accounting Policies - continued
Income Tax Information and Distributions to Shareholders - continued
Distributions are recorded on the ex-dividend date. Income dividends and capital gain distributions are declared separately for each class. Income and capital gain distributions are determined in accordance with income tax regulations, which may differ from GAAP. In addition, the Fund claimed a portion of the payment made to redeeming shareholders as a distribution for income tax purposes.
Capital accounts within the financial statements are adjusted for permanent book-tax differences. These adjustments have no impact on net assets or the results of operations. Temporary book-tax differences will reverse in a subsequent period.
Book-tax differences are primarily due to the short-term gain distributions from the Fidelity Central Funds, foreign currency transactions, passive foreign investment companies (PFIC), defaulted bonds, market discount, partnerships, capital loss carryforwards, losses deferred due to wash sales and excise tax regulations.
The federal tax cost of investment securities and unrealized appreciation (depreciation) as of period end were as follows:
Gross unrealized appreciation | $ 88,269,388 |
Gross unrealized depreciation | (75,775,542) |
Net unrealized appreciation (depreciation) | $ 12,493,846 |
| |
Tax Cost | $ 1,029,534,370 |
The tax-based components of distributable earnings as of period end were as follows:
Undistributed ordinary income | $ 10,505,281 |
Capital loss carryforward | $ (13,906,408) |
Net unrealized appreciation (depreciation) | $ 12,519,534 |
The tax character of distributions paid was as follows:
| July 31, 2010 | July 31, 2009 |
Ordinary Income | $ 40,150,798 | $ 21,152,317 |
Annual Report
3. Significant Accounting Policies - continued
Short-Term Trading (Redemption) Fees. Shares held in the Fund less than 90 days are subject to a redemption fee equal to .75% of the proceeds of the redeemed shares. All redemption fees, including any estimated redemption fees paid by FMR, are retained by the Fund and accounted for as an addition to paid in capital.
4. Operating Policies.
Repurchase Agreements. FMR has received an Exemptive Order from the SEC which permits the Fund and other affiliated entities of FMR to transfer uninvested cash balances into joint trading accounts which are then invested in repurchase agreements. The Fund may also invest directly with institutions in repurchase agreements. Repurchase agreements are collateralized by government or non-government securities. Upon settlement date, collateral is held in segregated accounts with custodian banks and may be obtained in the event of a default of the counterparty. The Fund monitors, on a daily basis, the value of the collateral to ensure it is at least equal to the principal amount of the repurchase agreement (including accrued interest). In the event of a default by the counterparty, realization of the collateral proceeds could be delayed, during which time the value of the collateral may decline.
Restricted Securities. The Fund may invest in securities that are subject to legal or contractual restrictions on resale. These securities generally may be resold in transactions exempt from registration or to the public if the securities are registered. Disposal of these securities may involve time-consuming negotiations and expense, and prompt sale at an acceptable price may be difficult. Information regarding restricted securities is included at the end of the Fund's Schedule of Investments.
Loans and Other Direct Debt Instruments The Fund may invest in loans and loan participations, trade claims or other receivables. These investments may include standby financing commitments, including revolving credit facilities, that obligate the Fund to supply additional cash to the borrower on demand. Loan participations involve a risk of insolvency of the lending bank or other financial intermediary. The Fund may be contractually obligated to receive approval from the agent bank and/or borrower prior to the sale of these investments.
5. Purchases and Sales of Investments.
Purchases and sales of securities, other than short-term securities and U.S. government securities, aggregated $569,505,702 and $189,844,016, respectively.
Annual Report
Notes to Financial Statements - continued
6. Fees and Other Transactions with Affiliates.
Management Fee. FMR and its affiliates provide the Fund with investment management related services for which the Fund pays a monthly management fee. The management fee is the sum of an individual fund fee rate that is based on an annual rate of .30% of the Fund's average net assets and a group fee rate that averaged .26% during the period. The group fee rate is based upon the average net assets of all the mutual funds advised by FMR. The group fee rate decreases as assets under management increase and increases as assets under management decrease. For the period, the total annual management fee rate was .56% of the Fund's average net assets.
Distribution and Service Plan. In accordance with Rule 12b-1 of the 1940 Act, the Fund has adopted separate Distribution and Service Plans for each class of shares. Certain classes pay Fidelity Distributors Corporation (FDC), an affiliate of FMR, separate Distribution and Service Fees, each of which is based on an annual percentage of each class' average net assets. In addition, FDC may pay financial intermediaries for selling shares of the Fund and providing shareholder support services. For the period, the Distribution and Service Fee rates and the total amounts paid to and retained by FDC were as follows:
| Distribution
Fee | Service
Fee | Paid to
FDC | Retained
by FDC |
Class A | -% | .25% | $ 1,146 | $ 382 |
Class T | -% | .25% | 324 | 68 |
Class C | .75% | .25% | 872 | 585 |
| | | $ 2,342 | $ 1,035 |
Sales Load. FDC receives a front-end sales charge of up to 4.00% for selling Class A shares and Class T shares, some of which is paid to financial intermediaries for selling shares of the Fund. FDC receives the proceeds of contingent deferred sales charges levied on Class A, Class T, and Class C redemptions. These charges depend on the holding period. The deferred sales charges range from 1% for Class C, .75% for certain purchases of Class A shares (1.00% to .50% prior to July 12, 2010) and .25% for certain purchases of Class T shares.
For the period, sales charge amounts retained by FDC were as follows:
| Retained
by FDC |
Class A | $ 369 |
Class T | 283 |
| $ 652 |
Annual Report
6. Fees and Other Transactions with Affiliates - continued
Transfer Agent Fees. Fidelity Investments Institutional Operations Company, Inc. (FIIOC), an affiliate of FMR, is the transfer, dividend disbursing and shareholder servicing agent for each class of the Fund. FIIOC receives account fees and asset-based fees that vary according to the account size and type of account of the shareholders of the respective classes of the Fund. FIIOC pays for typesetting, printing and mailing of shareholder reports, except proxy statements. For the period, the total transfer agent fees paid by each applicable class were as follows:
| Amount | % of
Average
Net Assets |
Class A | $ 905 | .19* |
Class T | 351 | .27* |
Class C | 196 | .22* |
Real Estate Income | 2,351,958 | .32 |
Institutional Class | 533 | .20* |
| $ 2,353,943 | |
* Annualized
Accounting and Security Lending Fees. Fidelity Service Company, Inc. (FSC), an affiliate of FMR, maintains the Fund's accounting records. The accounting fee is based on the level of average net assets for the month. Under a separate contract, FSC administers the security lending program. The security lending fee is based on the number and duration of lending transactions.
Brokerage Commissions. The Fund placed a portion of its portfolio transactions with brokerage firms which are affiliates of the investment adviser. The commissions paid to these affiliated firms were $8,333 for the period.
7. Committed Line of Credit.
The Fund participates with other funds managed by FMR in a $3.75 billion credit facility (the "line of credit") to be utilized for temporary or emergency purposes to fund shareholder redemptions or for other short-term liquidity purposes. The Fund has agreed to pay commitment fees on its pro-rata portion of the line of credit, which amounted to $2,742 and is reflected in Miscellaneous expenses on the Statement of Operations. During the period, there were no borrowings on this line of credit.
Annual Report
Notes to Financial Statements - continued
8. Security Lending.
The Fund lends portfolio securities from time to time in order to earn additional income. On the settlement date of the loan, the Fund receives collateral (in the form of U.S. Treasury obligations, letters of credit and/or cash) against the loaned securities and maintains collateral in an amount not less than 100% of the market value of the loaned securities during the period of the loan. The market value of the loaned securities is determined at the close of business of the Fund and any additional required collateral is delivered to the Fund on the next business day. If the borrower defaults on its obligation to return the securities loaned because of insolvency or other reasons, a fund could experience delays and costs in recovering the securities loaned or in gaining access to the collateral. Any cash collateral received is invested in the Fidelity Securities Lending Cash Central Fund. The value of loaned securities and cash collateral at period end are disclosed on the Fund's Statement of Assets and Liabilities. Security lending income represents the income earned on investing cash collateral, less fees and expenses associated with the loan, plus any premium payments that may be received on the loan of certain types of securities. Security lending income is presented in the Statement of Operations as a component of income from Fidelity Central Funds. Net income from lending portfolio securities during the period amounted to $6,300.
9. Expense Reductions.
FMR voluntarily agreed to reimburse a portion of the Fund's operating expenses. During the period, this reimbursement reduced expenses of the Real Estate Income Class by $62,921.
Many of the brokers with whom FMR places trades on behalf of the Fund provided services in addition to trade execution. These services included payments of certain expenses on behalf of the Fund totaling $6,610 for the period. In addition, through arrangements with the Fund's custodian, credits realized as a result of uninvested cash balances were used to reduce the Fund's expenses. During the period, these credits reduced the Fund's custody expenses by $688.
Annual Report
10. Distributions to Shareholders.
Distributions to shareholders of each class were as follows:
Years ended July 31, | 2010 A | 2009 |
From net investment income | | |
Class A | $ 23,172 | $ - |
Class T | 6,447 | - |
Class C | 3,705 | - |
Real Estate Income | 40,107,971 | 21,152,317 |
Institutional Class | 9,503 | - |
Total | $ 40,150,798 | $ 21,152,317 |
A Distributions for Class A, Class T, Class C and Institutional Class are for the period April 14, 2010 (commencement of sale of shares) to July 31, 2010.
11. Share Transactions.
Transactions for each class of shares were as follows:
| Shares | Dollars |
Years ended July 31, | 2010 A | 2009 | 2010 A | 2009 |
Class A | | | | |
Shares sold | 402,260 | - | $ 3,960,293 | $ - |
Reinvestment of distributions | 1,072 | - | 10,302 | - |
Shares redeemed | (18,182) | - | (177,559) | - |
Net increase (decrease) | 385,150 | - | $ 3,793,036 | $ - |
Class T | | | | |
Shares sold | 85,986 | - | $ 847,305 | $ - |
Reinvestment of distributions | 671 | - | 6,447 | - |
Shares redeemed | (17) | - | (166) | - |
Net increase (decrease) | 86,640 | - | $ 853,586 | $ - |
Class C | | | | |
Shares sold | 84,053 | - | $ 827,207 | $ - |
Reinvestment of distributions | 378 | - | 3,628 | - |
Shares redeemed | (281) | - | (2,700) | - |
Net increase (decrease) | 84,150 | - | $ 828,135 | $ - |
Real Estate Income | | | | |
Shares sold | 69,175,263 | 36,427,202 | $ 650,744,676 | $ 268,384,038 |
Reinvestment of distributions | 4,018,182 | 2,602,609 | 36,922,410 | 19,305,679 |
Shares redeemed | (26,105,432) | (24,280,916) | (245,525,556) | (183,099,387) |
Net increase (decrease) | 47,088,013 | 14,748,895 | $ 442,141,530 | $ 104,590,330 |
Institutional Class | | | | |
Shares sold | 294,304 | - | $ 2,886,826 | $ - |
Reinvestment of distributions | 902 | - | 8,663 | - |
Shares redeemed | (733) | - | (7,109) | - |
Net increase (decrease) | 294,473 | - | $ 2,888,380 | $ - |
A Share transactions for Class A, Class T, Class C and Institutional Class are for the period April 14, 2010 (commencement of sale of shares) to
July 31, 2010.
Annual Report
Notes to Financial Statements - continued
12. Other.
The Fund's organizational documents provide former and current trustees and officers with a limited indemnification against liabilities arising in connection with the performance of their duties to the Fund. In the normal course of business, the Fund may also enter into contracts that provide general indemnifications. The Fund's maximum exposure under these arrangements is unknown as this would be dependent on future claims that may be made against the Fund. The risk of material loss from such claims is considered remote.
Annual Report
To the Trustees of Fidelity Securities Fund and Shareholders of Fidelity Real Estate Income Fund:
We have audited the accompanying statement of assets and liabilities of Fidelity Real Estate Income Fund (the Fund), a fund of Fidelity Securities Fund, including the schedule of investments, as of July 31, 2010, and the related statement of operations for the year then ended, the statement of changes in net assets for each of the two years in the period then ended, and the financial highlights for each of the five years in the period then ended. These financial statements and financial highlights are the responsibility of the Fund's management. Our responsibility is to express an opinion on these financial statements and financial highlights based on our audits.
We conducted our audits in accordance with standards of the Public Company Accounting Oversight Board (United States). Those standards require that we plan and perform the audit to obtain reasonable assurance about whether the financial statements and financial highlights are free of material misstatement. The Fund is not required to have, nor were we engaged to perform, an audit of its internal control over financial reporting. Our audits included consideration of internal control over financial reporting as a basis for designing audit procedures that are appropriate in the circumstances, but not for the purpose of expressing an opinion on the effectiveness of the Fund's internal control over financial reporting. Accordingly, we express no such opinion. An audit also includes examining, on a test basis, evidence supporting the amounts and disclosures in the financial statements, assessing the accounting principles used and significant estimates made by management, as well as evaluating the overall financial statement presentation. Our procedures included confirmation of securities owned as of July 31, 2010, by correspondence with the custodians, agent banks and brokers; where replies were not received from brokers, we performed other auditing procedures. We believe that our audits provide a reasonable basis for our opinion.
In our opinion, the financial statements and financial highlights referred to above present fairly, in all material respects, the financial position of Fidelity Real Estate Income Fund as of July 31, 2010, the results of its operations for the year then ended, the changes in its net assets for each of the two years in the period then ended, and the financial highlights for each of the five years in the period then ended, in conformity with accounting principles generally accepted in the United States of America.
/s/ Deloitte & Touche LLP
DELOITTE & TOUCHE LLP
Boston, Massachusetts
September 24, 2010
Annual Report
The Trustees, Member of the Advisory Board, and executive officers of the trust and fund, as applicable, are listed below. The Board of Trustees governs the fund and is responsible for protecting the interests of shareholders. The Trustees are experienced executives who meet periodically throughout the year to oversee the fund's activities, review contractual arrangements with companies that provide services to the fund, oversee management of the risks associated with such activities and contractual arrangements, and review the fund's performance. Except for James C. Curvey, each of the Trustees oversees 222 funds advised by FMR or an affiliate. Mr. Curvey oversees 411 funds advised by FMR or an affiliate.
The Trustees hold office without limit in time except that (a) any Trustee may resign; (b) any Trustee may be removed by written instrument, signed by at least two-thirds of the number of Trustees prior to such removal; (c) any Trustee who requests to be retired or who has become incapacitated by illness or injury may be retired by written instrument signed by a majority of the other Trustees; and (d) any Trustee may be removed at any special meeting of shareholders by a two-thirds vote of the outstanding voting securities of the trust. Each Trustee who is not an interested person (as defined in the 1940 Act) (Independent Trustee), shall retire not later than the last day of the calendar year in which his or her 72nd birthday occurs. The Independent Trustees may waive this mandatory retirement age policy with respect to individual Trustees. The executive officers and Advisory Board Member hold office without limit in time, except that any officer and Advisory Board Member may resign or may be removed by a vote of a majority of the Trustees at any regular meeting or any special meeting of the Trustees. Except as indicated, each individual has held the office shown or other offices in the same company for the past five years.
Experience, Skills, Attributes, and Qualifications of the Fund's Trustees. The Governance and Nominating Committee has adopted a statement of policy that describes the experience, qualifications, attributes, and skills that are necessary and desirable for potential Independent Trustee candidates (Statement of Policy). The Board believes that each Trustee satisfied at the time he or she was initially elected or appointed a Trustee, and continues to satisfy, the standards contemplated by the Statement of Policy. The Governance and Nominating Committee also engages professional search firms to help identify potential Independent Trustee candidates who have the experience, qualifications, attributes, and skills consistent with the Statement of Policy. From time to time, additional criteria based on the composition and skills of the current Independent Trustees, as well as experience or skills that may be appropriate in light of future changes to board composition, business conditions, and regulatory or other developments, have also been considered by the professional search firms and the Governance and Nominating Committee. In addition, the Board takes into account the Trustees' commitment and participation in Board and committee meetings, as well as their leadership of standing and ad hoc committees throughout their tenure.
In determining that a particular Trustee was and continues to be qualified to serve as a Trustee, the Board has considered a variety of criteria, none of which, in isolation, was controlling. The Board believes that, collectively, the Trustees have balanced and diverse experience, qualifications, attributes, and skills, which allow the Board to operate effectively in governing the fund and protecting the interests of shareholders. Information about the specific experience, skills, attributes, and qualifications of each Trustee, which in each case led to the Board's conclusion that the Trustee should serve (or continue to serve) as a trustee of the fund, is provided below.
Annual Report
Board Structure and Oversight Function. Edward C. Johnson 3d is an interested person (as defined in the 1940 Act) and currently serves as Chairman. The Trustees have determined that an interested Chairman is appropriate and benefits shareholders because an interested Chairman has a personal and professional stake in the quality and continuity of services provided to the fund. Independent Trustees exercise their informed business judgment to appoint an individual of their choosing to serve as Chairman, regardless of whether the Trustee happens to be independent or a member of management. The Independent Trustees have determined that they can act independently and effectively without having an Independent Trustee serve as Chairman and that a key structural component for assuring that they are in a position to do so is for the Independent Trustees to constitute a substantial majority for the Board. The Independent Trustees also regularly meet in executive session. Ned C. Lautenbach serves as Chairman of the Independent Trustees and as such (i) acts as a liaison between the Independent Trustees and management with respect to matters important to the Independent Trustees and (ii) with management prepares agendas for Board meetings.
Fidelity funds are overseen by different Boards of Trustees. The fund's Board oversees Fidelity's equity and high income funds and another Board oversees Fidelity's investment-grade bond, money market, and asset allocation funds. The asset allocation funds may invest in Fidelity funds overseen by the fund's Board. The use of separate Boards, each with its own committee structure, allows the Trustees of each group of Fidelity funds to focus on the unique issues of the funds they oversee, including common research, investment, and operational issues. On occasion, the separate Boards establish joint committees to address issues of overlapping consequences for the Fidelity funds overseen by each Board.
The Trustees operate using a system of committees to facilitate the timely and efficient consideration of all matters of importance to the Trustees, the fund, and fund shareholders and to facilitate compliance with legal and regulatory requirements and oversight of the fund's activities and associated risks. The Board, acting through its committees, has charged FMR and its affiliates with (i) identifying events or circumstances the occurrence of which could have demonstrably adverse effects on the fund's business and/or reputation; (ii) implementing processes and controls to lessen the possibility that such events or circumstances occur or to mitigate the effects of such events or circumstances if they do occur; and (iii) creating and maintaining a system designed to evaluate continuously business and market conditions in order to facilitate the identification and implementation processes described in (i) and (ii) above. Because the day-to-day operations and activities of the fund are carried out by or through FMR, its affiliates and other service providers, the fund's exposure to risks is mitigated but not eliminated by the processes overseen by the Trustees. While each of the Board's committees has responsibility for overseeing different aspects of the fund's activities, oversight is exercised primarily through the Operations, Audit, and Compliance Committees. Appropriate personnel, including but not limited to the fund's Chief Compliance Officer (CCO), FMR's internal auditor, the independent accountants, the fund's Treasurer and portfolio management personnel, make periodic reports to the Board's committees, as appropriate. The responsibilities of each committee, including their oversight responsibilities, are described further under "Standing Committees of the Fund's Trustees."
Annual Report
Trustees and Officers - continued
The fund's Statement of Additional Information (SAI) includes more information about the Trustees. To request a free copy, call Fidelity at 1-877-208-0098.
Interested Trustees*:
Correspondence intended for each Trustee who is an interested person may be sent to Fidelity Investments, 82 Devonshire Street, Boston, Massachusetts 02109.
Name, Age; Principal Occupations and Other Relevant Experience+ |
Edward C. Johnson 3d (80) |
| Year of Election or Appointment: 1984 Mr. Johnson is Trustee and Chairman of the Board of Trustees of certain Trusts. Mr. Johnson serves as Chief Executive Officer, Chairman, and a Director of FMR LLC; Chairman and a Director of FMR; Chairman and a Director of Fidelity Research & Analysis Company (FRAC); Chairman and a Director of Fidelity Investments Money Management, Inc.; and Chairman and a Director of FMR Co., Inc. In addition, Mr. Johnson serves as Chairman and Director of FIL Limited. Previously, Mr. Johnson served as President of FMR LLC (2006-2007). |
James C. Curvey (75) |
| Year of Election or Appointment: 2007 Mr. Curvey also serves as Trustee (2007-present) of other investment companies advised by FMR. Mr. Curvey is a Director of FMR and FMR Co., Inc. (2007-present). Mr. Curvey is also Vice Chairman (2006-present) and Director of FMR LLC. In addition, Mr. Curvey serves as an Overseer for the Boston Symphony Orchestra and a member of the Trustees of Villanova University. |
* Trustees have been determined to be "Interested Trustees" by virtue of, among other things, their affiliation with the trust or various entities under common control with FMR.
+ The information above includes each Trustee's principal occupation during the last five years and other information relating to the experience, attributes, and skills relevant to each Trustee's qualifications to serve as a Trustee, which led to the conclusion that each Trustee should serve as a Trustee for the fund.
Annual Report
Independent Trustees:
Correspondence intended for each Independent Trustee (that is, the Trustees other than the Interested Trustees) may be sent to Fidelity Investments, P.O. Box 55235, Boston, Massachusetts 02205-5235.
Name, Age; Principal Occupations and Other Relevant Experience+ |
Dennis J. Dirks (62) |
| Year of Election or Appointment: 2005 Prior to his retirement in May 2003, Mr. Dirks was Chief Operating Officer and a member of the Board of The Depository Trust & Clearing Corporation (DTCC). He also served as President, Chief Operating Officer, and Board member of The Depository Trust Company (DTC) and President and Board member of the National Securities Clearing Corporation (NSCC). In addition, Mr. Dirks served as Chief Executive Officer and Board member of the Government Securities Clearing Corporation, Chief Executive Officer and Board member of the Mortgage-Backed Securities Clearing Corporation, as a Trustee and a member of the Finance Committee of Manhattan College (2005-2008), and as a Trustee and a member of the Finance Committee of AHRC of Nassau County (2006-2008). Currently, Mr. Dirks serves as a member of the Board of Directors for The Brookville Center for Children's Services, Inc. (2009-present). |
Alan J. Lacy (56) |
| Year of Election or Appointment: 2008 Mr. Lacy serves as Senior Adviser (2007-present) of Oak Hill Capital Partners, L.P. (private equity). Mr. Lacy also served as Chief Executive Officer (2000-2005) and Vice Chairman (2005-2006) of Sears Holdings Corporation and Sears, Roebuck and Co. (retail). In addition, Mr. Lacy serves as a member of the Board of Directors of The Western Union Company (global money transfer, 2006-present) and Bristol-Myers Squibb Company (global pharmaceuticals, 2007-present). Mr. Lacy is Chairman (2008-present) and a member (2006-present) of the Board of Trustees of The National Parks Conservation Association. |
Ned C. Lautenbach (66) |
| Year of Election or Appointment: 2000 Mr. Lautenbach is Chairman of the Independent Trustees of the Equity and High Income Funds (2006-present). Mr. Lautenbach is an Advisory Partner of Clayton, Dubilier & Rice, Inc. (private equity investment, 2008-present) and was previously a Partner of Clayton, Dubilier & Rice, Inc. (1998-2008). Previously, Mr. Lautenbach was with the International Business Machines Corporation (IBM) from 1968 until his retirement in 1998. Mr. Lautenbach serves as a Director of Eaton Corporation (diversified industrial) as well as the Philharmonic Center for the Arts in Naples, Florida. Mr. Lautenbach is also a member of the Board of Trustees of Fairfield University (2005-present), as well as a member of the Council on Foreign Relations. Previously, Mr. Lautenbach served as a Director of Sony Corporation (2006-2007). |
Joseph Mauriello (65) |
| Year of Election or Appointment: 2008 Prior to his retirement in January 2006, Mr. Mauriello served in numerous senior management positions including Deputy Chairman and Chief Operating Officer (2004-2005), and Vice Chairman of Financial Services (2002-2004) of KPMG LLP US (professional services, 1965-2005). Mr. Mauriello currently serves as a member of the Board of Directors of XL Capital Ltd. (global insurance and re-insurance, 2006-present) and of Arcadia Resources Inc. (health care services and products, 2007-present). Previously, Mr. Mauriello served as a Director of the Hamilton Funds of the Bank of New York (2006-2007). |
Cornelia M. Small (66) |
| Year of Election or Appointment: 2005 Ms. Small is a member of the Board of Directors of the Teagle Foundation (2009-present). Ms. Small is also a member of the Investment Committee, and Chair (2008-present) and a member of the Board of Trustees of Smith College. In addition, Ms. Small serves on the Investment Committee of the Berkshire Taconic Community Foundation (2008-present). Previously, Ms. Small served as Chairperson of the Investment Committee (2002-2008) of Smith College. In addition, Ms. Small served as Chief Investment Officer, Director of Global Equity Investments, and a member of the Board of Directors of Scudder, Stevens & Clark and Scudder Kemper Investments. |
William S. Stavropoulos (71) |
| Year of Election or Appointment: 2002 Mr. Stavropoulos is Vice Chairman of the Independent Trustees of the Equity and High Income Funds (2006-present). Mr. Stavropoulos serves as President and Founder of the Michigan Baseball Foundation, the Great Lakes Loons (2007-present). Mr. Stavropoulos is Chairman Emeritus of the Board of Directors of The Dow Chemical Company, where he previously served in numerous senior management positions, including President, CEO (1995-2000; 2002-2004), Chairman of the Executive Committee (2000-2006), and as a member of the Board of Directors (1990-2006). Currently, Mr. Stavropoulos is a Director of Teradata Corporation (data warehousing and technology solutions, 2008-present), Chemical Financial Corporation, Maersk Inc. (industrial conglomerate), Tyco International, Inc. (multinational manufacturing and services, 2007-present), and a member of the Advisory Board for Metalmark Capital (private equity investment, 2005-present). Mr. Stavropoulos is a special advisor to Clayton, Dubilier & Rice, Inc. (private equity investment). In addition, Mr. Stavropoulos is a member of the University of Notre Dame Advisory Council for the College of Science. |
David M. Thomas (61) |
| Year of Election or Appointment: 2008 Previously, Mr. Thomas served as Executive Chairman (2005-2006) and Chairman and Chief Executive Officer (2000-2005) of IMS Health, Inc. (pharmaceutical and healthcare information solutions). In addition, Mr. Thomas serves as a member of the Board of Directors of Fortune Brands, Inc. (consumer products), and Interpublic Group of Companies, Inc. (marketing communication, 2004-present). |
Michael E. Wiley (59) |
| Year of Election or Appointment: 2008 Mr. Wiley also serves as a Director of Asia Pacific Exploration Consolidated (international oil and gas exploration and production, 2008-present), and as a member of the Board of Trustees of the University of Tulsa (2000-2006; 2007-present). Mr. Wiley serves as a Director of Tesoro Corporation (independent oil refiner and marketer, 2005-present), and a Director of Bill Barrett Corporation (exploration and production, 2005-present). In addition, Mr. Wiley also serves as a Director of Post Oak Bank (privately-held bank, 2004-present). Previously, Mr. Wiley served as a Sr. Energy Advisor of Katzenbach Partners, LLC (consulting, 2006-2007), as an Advisory Director of Riverstone Holdings (private investment), Chairman, President, and CEO of Baker Hughes, Inc. (oilfield services, 2000-2004), and as Director of Spinnaker Exploration Company (exploration and production, 2001-2005). |
Annual Report
Trustees and Officers - continued
+ The information above includes each Trustee's principal occupation during the last five years and other information relating to the experience, attributes, and skills relevant to each Trustee's qualifications to serve as a Trustee, which led to the conclusion that each Trustee should serve as a Trustee for the fund.
Advisory Board Member and Executive Officers:
Correspondence intended for each executive officer and Peter S. Lynch may be sent to Fidelity Investments, 82 Devonshire Street, Boston, Massachusetts 02109.
Name, Age; Principal Occupation |
Peter S. Lynch (66) |
| Year of Election or Appointment: 2003 Member of the Advisory Board of Fidelity's Equity and High Income Funds. Mr. Lynch is Vice Chairman and a Director of FMR and FMR Co., Inc. In addition, Mr. Lynch serves as a Trustee of Boston College and as the Chairman of the Inner-City Scholarship Fund. Previously, Mr. Lynch served on the Special Olympics International Board of Directors (1997-2006). |
Kenneth B. Robins (40) |
| Year of Election or Appointment: 2008 President and Treasurer of Fidelity's Equity and High Income Funds. Mr. Robins also serves as President and Treasurer (2010-present) and Assistant Treasurer (2009-present) of other Fidelity funds and is an employee of Fidelity Investments (2004-present). Previously, Mr. Robins served as Deputy Treasurer of the Fidelity funds (2005-2008) and Treasurer and Chief Financial Officer of The North Carolina Capital Management Trust: Cash and Term Portfolios (2006-2008). |
Brian B. Hogan (45) |
| Year of Election or Appointment: 2009 Vice President of certain Equity Funds and Vice President of Sector Funds. Mr. Hogan also serves as Senior Vice President, Equity Research of FMR (2006-present) and President of FMR's Equity Division (2009-present). Previously, Mr. Hogan served as a portfolio manager. |
Christopher S. Bartel (38) |
| Year of Election or Appointment: 2009 Vice President of Fidelity's Sector and Real Estate Equity Funds. Mr. Bartel also serves as Senior Vice President of Equity Research (2009-present). Previously, Mr. Bartel served as Managing Director of Research (2006-2009) and an analyst and portfolio manager (2000-2006). |
Scott C. Goebel (42) |
| Year of Election or Appointment: 2008 Secretary and Chief Legal Officer (CLO) of the Fidelity funds. Mr. Goebel also serves as General Counsel, Secretary, and Senior Vice President of FMR (2008-present) and FMR Co., Inc. (2008-present); Deputy General Counsel of FMR LLC; Chief Legal Officer of Fidelity Management & Research (Hong Kong) Limited (2008-present) and Assistant Secretary of Fidelity Management & Research (Japan) Inc. (2008-present), Fidelity Investments Money Management, Inc. (2008-present), Fidelity Management & Research (U.K.) Inc. (2008-present), and Fidelity Research and Analysis Company (2008-present). Previously, Mr. Goebel served as Assistant Secretary of the Funds (2007-2008) and as Vice President and Secretary of Fidelity Distributors Corporation (FDC) (2005-2007). |
William C. Coffey (41) |
| Year of Election or Appointment: 2009 Assistant Secretary of Fidelity's Equity and High Income Funds. Mr. Coffey also serves as Senior Vice President and Deputy General Counsel of FMR LLC (2010-present), and is an employee of Fidelity Investments. Previously, Mr. Coffey served as Vice President and Associate General Counsel of FMR LLC (2005-2009). |
Holly C. Laurent (56) |
| Year of Election or Appointment: 2008 Anti-Money Laundering (AML) Officer of the Fidelity funds. Ms. Laurent is an employee of Fidelity Investments. Previously, Ms. Laurent was Senior Vice President and Head of Legal for Fidelity Business Services India Pvt. Ltd. (2006-2008), and Senior Vice President, Deputy General Counsel and Group Head for FMR LLC (2005-2006). |
Christine Reynolds (51) |
| Year of Election or Appointment: 2008 Chief Financial Officer of the Fidelity funds. Ms. Reynolds became President of Fidelity Pricing and Cash Management Services (FPCMS) in August 2008. Ms. Reynolds served as Chief Operating Officer of FPCMS (2007-2008). Previously, Ms. Reynolds served as President, Treasurer, and Anti-Money Laundering officer of the Fidelity funds (2004-2007). |
Kenneth A. Rathgeber (63) |
| Year of Election or Appointment: 2004 Chief Compliance Officer of Fidelity's Equity and High Income Funds. Mr. Rathgeber is Chief Compliance Officer of Fidelity Management & Research (Hong Kong) Limited (2008-present), Fidelity Management & Research (Japan) Inc. (2008-present), FMR (2005-present), FMR Co., Inc. (2005-present), Fidelity Management & Research (U.K.) Inc. (2005-present), Fidelity Research & Analysis Company (2005-present), Fidelity Investments Money Management, Inc. (2005-present), Pyramis Global Advisors, LLC (2005-present), and Strategic Advisers, Inc. (2005-present). |
Jeffrey S. Christian (48) |
| Year of Election or Appointment: 2009 Deputy Treasurer of the Fidelity funds. Mr. Christian is an employee of Fidelity Investments. Previously, Mr. Christian served as Chief Financial Officer (2008-2009) of certain Fidelity funds and Senior Vice President of Fidelity Pricing and Cash Management Services (FPCMS) (2004-2009). |
Bryan A. Mehrmann (49) |
| Year of Election or Appointment: 2005 Deputy Treasurer of the Fidelity funds. Mr. Mehrmann is an employee of Fidelity Investments. |
Adrien E. Deberghes (42) |
| Year of Election or Appointment: 2008 Deputy Treasurer of Fidelity's Equity and High Income Funds. Mr. Deberghes also serves as Assistant Treasurer of other Fidelity funds (2010-present) and is an employee of Fidelity Investments (2008-present). Previously, Mr. Deberghes served as Senior Vice President of Mutual Fund Administration at State Street Corporation (2007-2008), Senior Director of Mutual Fund Administration at Investors Bank & Trust (2005-2007), and Director of Finance for Dunkin' Brands (2000-2005). |
Stephanie J. Dorsey (41) |
| Year of Election or Appointment: 2010 Assistant Treasurer of Fidelity's Equity and High Income Funds. Ms. Dorsey also serves as Deputy Treasurer of other Fidelity funds (2008-present) and is an employee of Fidelity Investments (2008-present). Previously, Ms. Dorsey served as Treasurer (2004-2008) of the JPMorgan Mutual Funds and Vice President (2004-2008) of JPMorgan Chase Bank. |
John R. Hebble (52) |
| Year of Election or Appointment: 2009 Assistant Treasurer of Fidelity's Equity and High Income Funds. Mr. Hebble also serves as Treasurer and Chief Financial Officer of The North Carolina Capital Management Trust: Cash and Term Portfolio (2008-present), President and Treasurer of other Fidelity funds (2008-present) and is an employee of Fidelity Investments. |
Gary W. Ryan (51) |
| Year of Election or Appointment: 2005 Assistant Treasurer of the Fidelity funds. Mr. Ryan is an employee of Fidelity Investments. Previously, Mr. Ryan served as Vice President of Fund Reporting in Fidelity Pricing and Cash Management Services (FPCMS) (1999-2005). |
Annual Report
A total of 0.13% of the dividends distributed during the fiscal year was derived from interest on U.S. Government securities which is generally exempt from state income tax.
The Institutional Class designates 8% of the dividend distributed in June, during the fiscal year as qualifying for the dividends-received deduction for corporate shareholders.
The Institutional Class designates 10% of the dividend distributed in June, during the fiscal year as amounts which may be taken into account as a dividend for purposes of the maximum rate under section 1(h)(11) of the Internal Revenue Code.
The fund will notify shareholders in January 2011 of amounts for use in preparing 2010 income tax returns.
Annual Report
Board Approval of Investment Advisory Contracts and Management Fees
Fidelity Real Estate Income Fund
Each year, the Board of Trustees, including the Independent Trustees (together, the Board), votes on the renewal of the management contract and sub-advisory agreements (together, the Advisory Contracts) for the fund. The Board, assisted by the advice of fund counsel and Independent Trustees' counsel, requests and considers a broad range of information relevant to the renewal of the Advisory Contracts throughout the year.
The Board meets regularly and considers at each of its meetings factors that are relevant to its annual consideration of the renewal of the fund's Advisory Contracts, including the services and support provided to the fund and its shareholders. The Board has established various standing committees, each composed of Independent Trustees with varying backgrounds, to which the Board has assigned specific subject matter responsibilities in order to enhance effective decision-making by the Board. The Board, acting directly and through its Committees, requests and receives information concerning the annual consideration of the renewal of the fund's Advisory Contracts. The Board also meets as needed to consider matters specifically related to the Board's annual consideration of the renewal of Advisory Contracts. Members of the Board may also meet with trustees of other Fidelity funds through ad hoc joint committees to discuss certain matters relevant to the Fidelity funds.
At its July 2010 meeting, the Board of Trustees, including the Independent Trustees, unanimously determined to renew the fund's Advisory Contracts. In reaching its determination, the Board considered all factors it believed relevant, including (i) the nature, extent, and quality of the services to be provided to the fund and its shareholders (including the investment performance of the fund); (ii) the competitiveness of the fund's management fee and total expenses; (iii) the total costs of the services to be provided by and the profits to be realized by Fidelity from its relationship with the fund; (iv) the extent to which economies of scale would be realized as the fund grows; and (v) whether fee levels reflect these economies of scale, if any, for the benefit of fund shareholders.
In considering whether to renew the Advisory Contracts for the fund, the Board reached a determination, with the assistance of fund counsel and Independent Trustees' counsel and through the exercise of its business judgment, that the renewal of the Advisory Contracts is in the best interests of fund shareholders and that the compensation to be received by Fidelity under the management contract is fair and reasonable. The Board's decision to renew the Advisory Contracts was not based on any single factor noted above, but rather was based on a comprehensive consideration of all the information provided to the Board at its meetings throughout the year. The Board, in reaching its determination to renew the Advisory Contracts, is aware that shareholders in the fund have a broad range of investment choices available to them, including a wide choice among mutual funds offered by Fidelity's competitors, and that the fund's shareholders, with the opportunity to review and weigh the disclosure provided by the fund in its prospectus and other public disclosures, have chosen to invest in this fund, managed by Fidelity.
Annual Report
Board Approval of Investment Advisory Contracts and
Management Fees - continued
Nature, Extent, and Quality of Services Provided. The Board considered the staffing within the investment adviser, FMR, and the sub-advisers (together, the Investment Advisers), including the backgrounds of the fund's investment personnel and the fund's investment objective and discipline. The Independent Trustees also had discussions with senior management of Fidelity's investment operations and investment groups. The Board considered the structure of the portfolio manager compensation program and whether this structure provides appropriate incentives to act in the best interest of the fund.
Resources Dedicated to Investment Management and Support Services. The Board and the equity research subcommittee of the Board's Fund Oversight Committee reviewed the size, education, and experience of the Investment Advisers' investment staff, their use of technology, and the Investment Advisers' approach to recruiting, training, and retaining portfolio managers and other research, advisory, and management personnel. The Board noted that Fidelity's analysts have access to a variety of technological tools and market and securities data that enable them to perform both fundamental and quantitative analysis and to specialize in various disciplines. The Board considered Fidelity's extensive global research capabilities that enable the Investment Advisers to aggregate data from various sources in an effort to produce positive investment results. The Board also considered that Fidelity's portfolio managers and analysts have access to daily portfolio attribution that allows for monitoring of a fund's portfolio, as well as an electronic communication system that provides immediate real-time access to research concerning issuers and credit enhancers. The Board noted FMR's continued focus on strengthening the organization and discipline of equity portfolio management and research.
Shareholder and Administrative Services. The Board considered (i) the nature, extent, quality, and cost of advisory, administrative, and shareholder services performed by the Investment Advisers and their affiliates under the Advisory Contracts and under separate agreements covering transfer agency, pricing and bookkeeping, and securities lending services for the fund; (ii) the nature and extent of the investment adviser's supervision of third party service providers, principally custodians and subcustodians; and (iii) the resources devoted to, and the record of compliance with, the fund's compliance policies and procedures. The Board also reviewed the allocation of fund brokerage, including allocations to brokers affiliated with the Investment Advisers, the use of brokerage commissions to pay fund expenses, and the use of "soft" commission dollars to pay for research services.
The Board noted that the growth of fund assets over time across the complex allows Fidelity to reinvest in the development of services designed to enhance the value or convenience of the Fidelity funds as investment vehicles. These services include 24-hour access to account information and market information through phone representatives and over the Internet, and investor education materials and asset allocation tools.
Annual Report
Investment in a Large Fund Family. The Board considered the benefits to shareholders of investing in a Fidelity fund, including the benefits of investing in a fund that is part of a large family of funds offering a variety of investment disciplines and providing a large variety of mutual fund investor services. The Board noted that Fidelity had taken, or had made recommendations that resulted in the Fidelity funds taking, a number of actions over the previous year that benefited particular funds, including (i) dedicating additional resources to investment research and restructuring and broadening the focus of the investment research teams; (ii) bolstering the senior management team that oversees asset management; (iii) launching Class F of certain funds as a lower-fee class available to Freedom K and Freedom Index Funds; (iv) lowering the initial investment minimums and ongoing balance requirements for Real Estate High Income Fund; (v) eliminating subsequent purchase minimums for all funds and adding a waiver of the investment minimum requirement for new accounts opened with the proceeds of a systematic withdrawal plan; (vi) eliminating the withdrawal minimum and maximum limits for systematic withdrawals from Advisor funds; (vii) expanding sales load waivers on Class A shares for Destiny Planholders and expanding Institutional Class eligibility for Class O Destiny Planholders; and (viii) changing certain Class A and Class T sales charge structures to further align them with industry practices.
Investment Performance. The Board considered whether the fund has operated in accordance with its investment objective, as well as its record of compliance with its investment restrictions. It also reviewed the fund's absolute investment performance, as well as the fund's relative investment performance measured over multiple periods against (i) a proprietary custom index, and (ii) a peer group of mutual funds and reviewed by the Board. The following charts considered by the Board show, over the one-, three-, and five-year periods ended December 31, 2009, the fund's cumulative total returns, the cumulative total returns of a proprietary custom index ("benchmark"), and a range of cumulative total returns of a peer group of mutual funds identified by Lipper Inc. as having an investment objective similar to that of the fund. (The fund did not offer Advisor classes as of December 31, 2009). The box within each chart shows the 25th percentile return (bottom of box) and the 75th percentile return (top of box) of the peer group. Returns shown above the box are in the first quartile and returns shown below the box are in the fourth quartile. The percentage beaten number noted below each chart corresponds to the percentile box and represents the percentage of funds in the peer group whose performance was equal to or lower than that of the fund. The fund's proprietary custom index is an index developed by FMR that represents the performance of the fund's unmanaged indexes.
Annual Report
Board Approval of Investment Advisory Contracts and
Management Fees - continued
Fidelity Real Estate Income Fund

The Board reviewed the fund's relative investment performance against its peer group and noted that the performance of the fund was in the first quartile for all the periods shown. The Board noted that FMR does not consider that peer group to be a particularly meaningful comparison for the fund, however, because unlike many of its peers, which invest primarily in common stocks of real estate companies, the fund invests primarily in common, preferred and debt securities of real estate entities. The Board also noted that the investment performance of the fund was lower than its benchmark for all the periods shown. The Board also reviewed the fund's performance since inception as well as performance in the current year.
Based on its review, and giving particular weight to the nature and quality of the resources dedicated by the Investment Advisers to maintain and improve relative performance and factoring in the unprecedented market events in recent years, the Board concluded that the nature, extent, and quality of investment management and support services and of shareholder and administrative services provided to the fund will benefit the fund's shareholders, particularly in light of the Board's view that the fund's shareholders benefit from investing in a fund that is part of a large family of funds offering a variety of investment disciplines and services.
Competitiveness of Management Fee and Total Fund Expenses. The Board considered the fund's management fee and total expenses compared to "mapped groups" of competitive funds and classes. Fidelity creates "mapped groups" by combining similar Lipper investment objective categories that have comparable management fee characteristics. Combining Lipper investment objective categories aids the Board's management fee and total expense comparisons by broadening the competitive group used for comparison and by reducing the number of universes to which various Fidelity funds are compared.
Annual Report
Management Fee. The Board considered two proprietary management fee comparisons for the 12-month periods shown in the chart below. The group of Lipper funds used by the Board for management fee comparisons is referred to below as the "Total Mapped Group." The Total Mapped Group is broader than the Lipper peer group used by the Board for performance comparisons because the Total Mapped Group combines several Lipper investment objective categories while the Lipper peer group does not. The Total Mapped Group comparison focuses on a fund's standing relative to the total universe of comparable funds available to investors, in terms of gross management fees before expense reimbursements or caps. "TMG %" represents the percentage of funds in the Total Mapped Group that had management fees that were lower than the fund's. For example, a TMG % of 8% means that 92% of the funds in the Total Mapped Group had higher management fees than the fund. The "Asset-Size Peer Group" (ASPG) comparison focuses on a fund's standing relative to non-Fidelity funds similar in size to the fund within the Total Mapped Group. The ASPG represents at least 15% of the funds in the Total Mapped Group with comparable asset size and management fee characteristics, subject to a minimum of 50 funds (or all funds in the Total Mapped Group if fewer than 50). Additional information, such as the ASPG quartile in which the fund's management fee ranked, is also included in the chart and considered by the Board.
Fidelity Real Estate Income Fund

Annual Report
Board Approval of Investment Advisory Contracts and
Management Fees - continued
The Board noted that the fund's management fee ranked below the median of its Total Mapped Group and below the median of its ASPG for 2009.
Based on its review, the Board concluded that the fund's management fee is fair and reasonable in light of the services that the fund receives and the other factors considered.
Total Expenses. In its review of the fund's total expenses, the Board considered the fund's management fee as well as other fund expenses, such as transfer agent fees, pricing and bookkeeping fees, and custodial, legal, and audit fees. The Board also noted the effects of any waivers and reimbursements on fees and expenses. As part of its review, the Board also considered current and historical total expenses of the fund compared to competitive fund median expenses. The fund is compared to those funds and classes in the Total Mapped Group (used by the Board for management fee comparisons) that have a similar sales load structure.
The Board noted that the fund's total expenses ranked below its competitive median for 2009.
Fees Charged to Other Fidelity Clients. The Board also considered Fidelity fee structures and other information with respect to clients of FMR and its affiliates, such as other mutual funds advised or subadvised by FMR or its affiliates, pension plan clients, and other institutional clients. In March 2010, the Board created an ad hoc joint committee with the board of other Fidelity funds (the Committee) to review and compare Fidelity's institutional investment advisory business with its business of providing services to the Fidelity funds, including the differences in services provided, fees charged, and costs incurred, as well as competition in their respective marketplaces.
Based on its review of total expenses and fees charged to other Fidelity clients, the Board concluded that the fund's total expenses were reasonable in light of the services that the fund and its shareholders receive and the other factors considered, including the findings of the Committee.
Costs of the Services and Profitability. The Board considered the revenues earned and the expenses incurred by Fidelity in conducting the business of developing, marketing, distributing, managing, administering and servicing the fund and its shareholders. The Board also considered the level of Fidelity's profits in respect of all the Fidelity funds.
On an annual basis, FMR presents to the Board Fidelity's profitability for the fund. Fidelity calculates the profitability for each fund, as well as aggregate profitability for groups of Fidelity funds and all Fidelity funds, using a series of detailed revenue and cost allocation methodologies which originate with the audited books and records of Fidelity. The Audit Committee of the Board reviews any significant changes from the prior year's methodologies.
Annual Report
PricewaterhouseCoopers LLP (PwC), independent registered public accounting firm and auditor to Fidelity and certain Fidelity funds, has been engaged annually by the Board as part of the Board's assessment of Fidelity's profitability analysis. PwC's engagement includes the review and assessment of Fidelity's methodologies used in determining the revenues and expenses attributable to Fidelity's mutual fund business, and completion of agreed-upon procedures surrounding the mathematical accuracy of fund profitability and its conformity to allocation methodologies. After considering PwC's reports issued under the engagement and information provided by Fidelity, the Board believes that while other allocation methods may also be reasonable, Fidelity's profitability methodologies are reasonable in all material respects.
The Board has also reviewed Fidelity's non-fund businesses and fall-out benefits related to the mutual fund business as well as cases where Fidelity's affiliates may benefit from or be related to the fund's business.
The Board considered the costs of the services provided by and the profits realized by Fidelity in connection with the operation of the fund and were satisfied that the profitability was not excessive in the circumstances.
Economies of Scale. The Board considered whether there have been economies of scale in respect of the management of the Fidelity funds, whether the Fidelity funds (including the fund) have appropriately benefited from any such economies of scale, and whether there is potential for realization of any further economies of scale. The Board considered the extent to which the fund will benefit from economies of scale through increased services to the fund, through waivers or reimbursements, or through fee or expense reductions.
In February 2009, the Board and the board of other Fidelity funds created an ad hoc committee (the Economies of Scale Committee) to analyze whether FMR attains economies of scale in respect of the management and servicing of the Fidelity funds, whether the Fidelity funds have appropriately benefited from such economies of scale, and whether there is potential for realization of any further economies of scale.
The Board recognized that the fund's management contract incorporates a "group fee" structure, which provides for lower group fee rates as total fund assets under FMR's management increase, and for higher group fee rates as total fund assets under FMR's management decrease. FMR calculates the group fee rates based on a tiered asset "breakpoint" schedule that varies based on asset class. The Board considered that the group fee is designed to deliver the benefits of economies of scale to fund shareholders when total Fidelity fund assets increase, even if assets of any particular fund are unchanged or have declined, because some portion of Fidelity's costs are attributable to services provided to all Fidelity funds, and all funds benefit if those costs can be allocated among more assets. The Board concluded that, given the group fee structure, fund shareholders will benefit from lower management fees as assets under FMR's management increase at the fund complex level, regardless of whether Fidelity achieves any such economies of scale.
Annual Report
Board Approval of Investment Advisory Contracts and
Management Fees - continued
The Board concluded, considering the findings of the Economies of Scale Committee, that any potential economies of scale are being appropriately shared between fund shareholders and Fidelity.
Additional Information Requested by the Board. In order to develop fully the factual basis for consideration of the Fidelity funds' Advisory Contracts, the Board requested and received additional information on certain topics, including (i) fund performance trends, actions to be taken by FMR to improve certain funds' overall performance, and Fidelity's long-term strategies for certain funds; (ii) portfolio manager changes that have occurred during the past year and length of portfolio manager tenure for different categories of funds over time; (iii) Fidelity's compensation structure for portfolio managers, research analysts, and other key personnel, the rationale for the compensation structure, and how the compensation structure provides appropriate performance incentives; (iv) the amount of the investment that each portfolio manager has made in the Fidelity fund(s) that he or she manages; (v) management and other fees paid by FMR to affiliated sub-advisers on behalf of the Fidelity funds; (vi) Fidelity's fee structures and rationale for recommending different fees among different categories of funds; (vii) Fidelity's rationale for recommending which funds should have a performance adjustment component as part of their management fees; (viii) the rationale for any differences between fund fee structures and fee structures in place for other Fidelity clients; and (ix) explanations regarding the relative total expenses borne by certain funds and classes, total expense competitive trends, and actions that might be taken by FMR to reduce total expenses for certain funds and classes.
Based on its evaluation of all of the conclusions noted above, and after considering all factors it believed relevant, the Board ultimately concluded that the advisory fee structures are fair and reasonable, and that the fund's Advisory Contracts should be renewed.
Annual Report
Investment Adviser
Fidelity Management & Research Company
Boston, MA
Investment Sub-Advisers
FMR Co., Inc.
Fidelity Management & Research
(Hong Kong) Limited
Fidelity Management & Research
(Japan) Inc.
Fidelity Management & Research
(U.K.) Inc.
Fidelity Research & Analysis Company
General Distributor
Fidelity Distributors Corporation
Boston, MA
Transfer and Service Agents
Fidelity Investments Institutional
Operations Company, Inc.
Boston, MA
Fidelity Service Company, Inc.
Boston, MA
Custodian
Citibank, N.A.
New York, NY
REII-UANN-0910
1.907540.100
Fidelity®
Series Small Cap Opportunities
Fund
Fidelity Series Small Cap Opportunities Fund
Class F
Annual Report
July 31, 2010
(2_fidelity_logos) (Registered_Trademark)
Contents
Performance | <Click Here> | How the fund has done over time. |
Management's Discussion of Fund Performance | <Click Here> | The Portfolio Manager's review of fund performance and strategy. |
Shareholder Expense Example | <Click Here> | An example of shareholder expenses. |
Investment Changes | <Click Here> | A summary of major shifts in the fund's investments over the past six months. |
Investments | <Click Here> | A complete list of the fund's investments with their market values. |
Financial Statements | <Click Here> | Statements of assets and liabilities, operations, and changes in net assets,
as well as financial highlights. |
Notes | <Click Here> | Notes to the financial statements. |
Report of Independent Registered Public Accounting Firm | <Click Here> | |
Trustees and Officers | <Click Here> | |
Board Approval of Investment Advisory Contracts and Management Fees | <Click Here> | |
To view a fund's proxy voting guidelines and proxy voting record for the 12-month period ended June 30, visit http://www.fidelity.com/proxyvotingresults or visit the Securities and Exchange Commission's (SEC) web site at http://www.sec.gov. You may also call 1-800-544-8544 for Fidelity Series Small Cap Opportunities Fund or 1-800-835-5092 for Class F to request a free copy of the proxy voting guidelines.
Standard & Poor's, S&P and S&P 500 are registered service marks of The McGraw-Hill Companies, Inc. and have been licensed for use by Fidelity Distributors Corporation.
Other third party marks appearing herein are the property of their respective owners.
All other marks appearing herein are registered or unregistered trademarks or service marks of FMR LLC or an affiliated company.
Annual Report
This report and the financial statements contained herein are submitted for the general information of the shareholders of the fund. This report is not authorized for distribution to prospective investors in the fund unless preceded or accompanied by an effective prospectus.
A fund files its complete schedule of portfolio holdings with the SEC for the first and third quarters of each fiscal year on Form N-Q. Forms N-Q are available on the SEC's web site at http://www.sec.gov. A fund's Forms N-Q may be reviewed and copied at the SEC's Public Reference Room in Washington, DC. Information regarding the operation of the SEC's Public Reference Room may be obtained by calling 1-800-SEC-0330. For a complete list of a fund's portfolio holdings, view the most recent holdings listing, semiannual report, or annual report on Fidelity's web site at http://www.fidelity.com or http://www.advisor.fidelity.com, as applicable.
NOT FDIC INSURED • MAY LOSE VALUE • NO BANK GUARANTEE
Neither the fund nor Fidelity Distributors Corporation is a bank.
Annual Report
Average annual total return reflects the change in the value of an investment, assuming reinvestment of the class' distributions from dividend income and capital gains (the profits earned upon the sale of securities that have grown in value, if any) and assuming a constant rate of performance each year. The $10,000 table and the fund's returns do not reflect the deduction of taxes that a shareholder would pay on fund distributions or the redemption of fund shares. During periods of reimbursement by Fidelity, a fund's total return will be greater than it would be had the reimbursement not occurred. How a fund did yesterday is no guarantee of how it will do tomorrow.
Average Annual Total Returns
Periods ended July 31, 2010 | Past 1
year | Life of
fund A |
Fidelity ® Series Small Cap Opportunities Fund | 26.22% | -3.56% |
Class F B | 26.66% | -3.47% |
A From March 22, 2007.
B The initial offering of Class F shares took place on June 26, 2009. Returns prior to June 26, 2009 are those of Fidelity Small Cap Opportunities Fund, the original class of the fund.
$10,000 Over Life of Fund
Let's say hypothetically that $10,000 was invested in Fidelity ® Series Small Cap Opportunities Fund, a class of the fund, on March 22, 2007, when the fund started. The chart shows how the value of your investment would have changed, and also shows how the Russell 2000® Index performed over the same period.
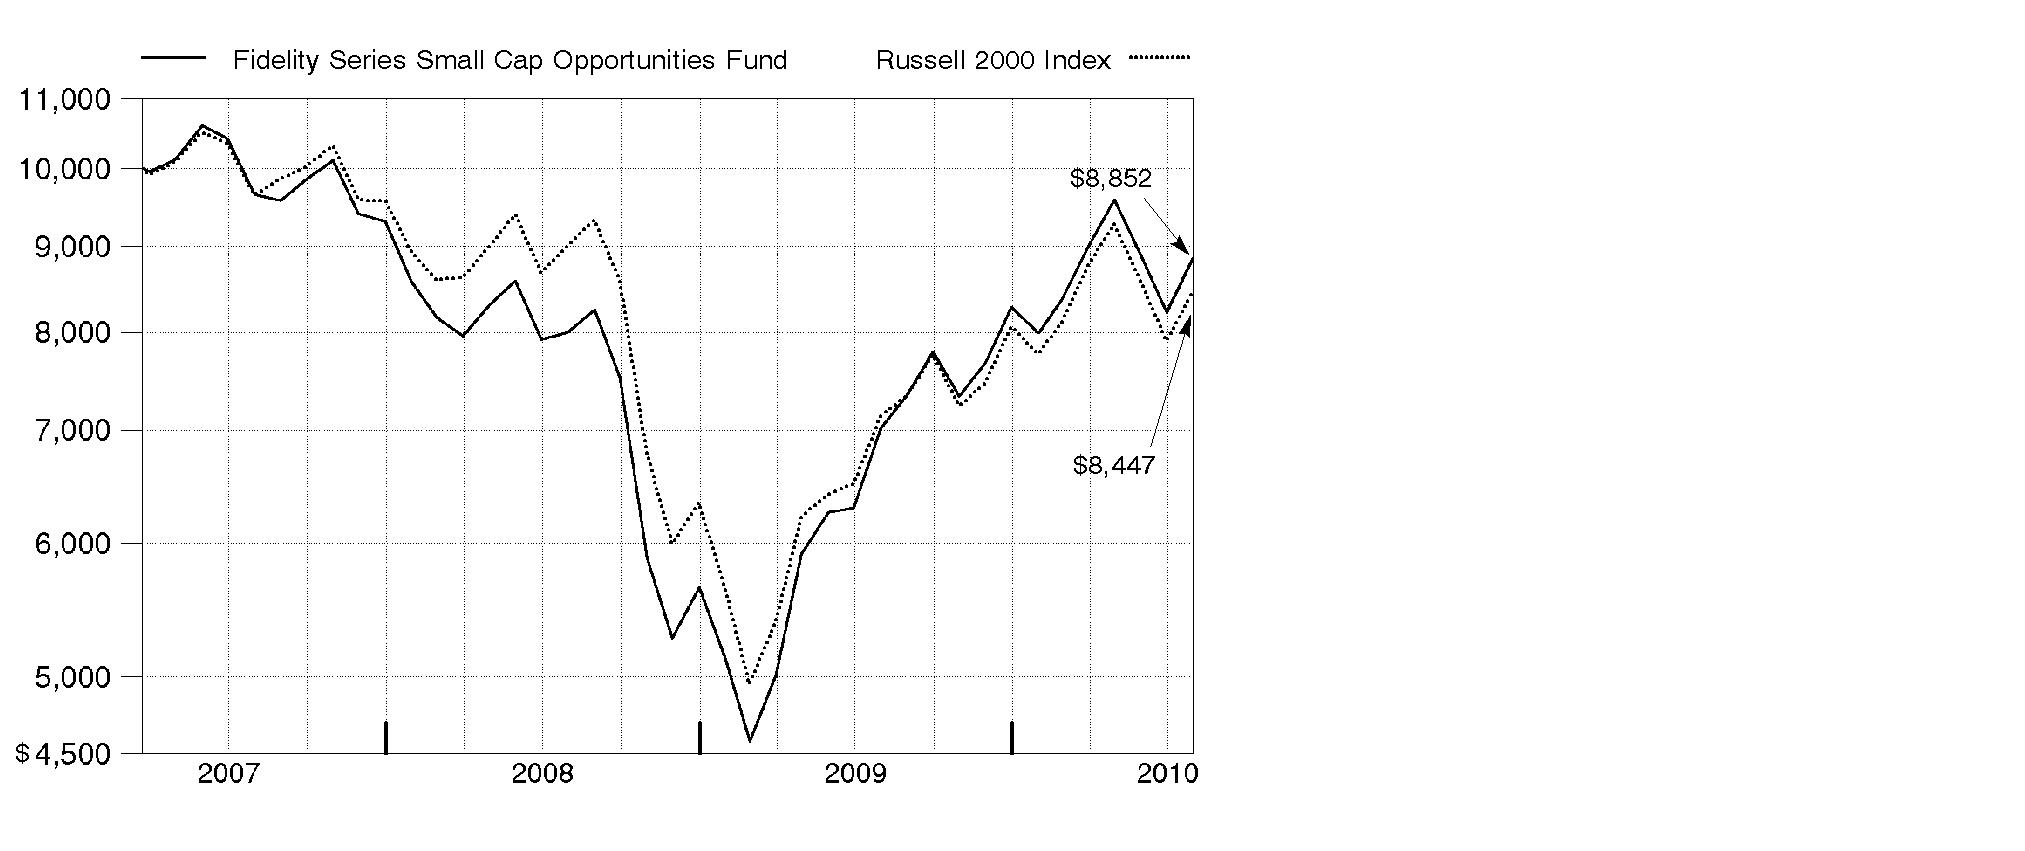
Annual Report
Market Recap: U.S. stock markets saw double-digit gains for the year ending July 31, 2010, despite the return of market volatility and risk aversion during the first half of 2010. An impressive bull run continued through 2009, bolstered by improvement in the economy and credit markets. Early in the new year, however, stocks fell sharply amid concerns about the global economic recovery, fueled by European debt woes and China's efforts to restrain inflation. After this brief dip, markets regained their upward momentum, as government stimulus and significant corporate cost cutting led to encouraging earnings reports, improved credit conditions and rising consumer confidence. Positive news continued through mid-April, when the Dow Jones Industrial AverageSM pushed above the 11,000 mark for the first time in 19 months. That milestone was short-lived, however, as heightened concern about the European debt crisis sparked an abrupt sell-off in May, leading to the first official correction since the rally began in March 2009. Although the market's malaise continued through June, stocks saw solid gains in July. For the year, the Dow rose 17.28%, while the S&P 500® Index was up 13.84%. Elsewhere, the technology-laden Nasdaq Composite® Index returned 14.99%. Small- and mid-cap stocks performed best, as measured by the 18.43% increase of the Russell 2000® Index and the 23.21% gain of the Russell Midcap® Index.
Comments from Rayna Lesser Hannaway, Charles Myers, Shadman Riaz, Richard Thompson and Patrick Venanzi, who became Co-Portfolio Managers of Fidelity® Series Small Cap Opportunities Fund on October 1, 2009: For the year, the fund's Series Small Cap Opportunities and Class F shares returned 26.22% and 26.66%, respectively, beating the Russell 2000 by a wide margin. Security selection was very strong overall, with the biggest gains versus the index coming from financials, industrials, materials, energy and health care. Conversely, stock picking in a few industries - health care equipment/services, media and diversified financials - was modestly negative. On an individual security basis, the top contributors were Red Back Mining, a Canadian gold producer; real estate services company Jones Lang LaSalle; Alexandria Real Estate Equities, a real estate investment trust (REIT); Bucyrus International, a maker of mining equipment; and footwear company Deckers Outdoor, the only index component mentioned in this discussion. On the negative side were Fourlis Holdings, which owns the franchise rights to the IKEA furniture chain in Greece; wireless networking systems company DragonWave; and financial planning and asset management company Waddell & Reed Financial. At period end, we did not own Bucyrus and Fourlis.
The views expressed above reflect those of the portfolio manager(s) only through the end of the period as stated on the cover of this report and do not necessarily represent the views of Fidelity or any other person in the Fidelity organization. Any such views are subject to change at any time based upon market or other conditions and Fidelity disclaims any responsibility to update such views. These views may not be relied on as investment advice and, because investment decisions for a Fidelity fund are based on numerous factors, may not be relied on as an indication of trading intent on behalf of any Fidelity fund.
Annual Report
Shareholder Expense Example
As a shareholder of the Fund, you incur two types of costs: (1) transaction costs, and (2) ongoing costs, including management fees and other Fund expenses. This Example is intended to help you understand your ongoing costs (in dollars) of investing in the Fund and to compare these costs with the ongoing costs of investing in other mutual funds.
The Example is based on an investment of $1,000 invested at the beginning of the period and held for the entire period (February 1, 2010 to July 31, 2010).
Actual Expenses
The first line of the accompanying table for each class of the Fund provides information about actual account values and actual expenses. You may use the information in this line, together with the amount you invested, to estimate the expenses that you paid over the period. Simply divide your account value by $1,000.00 (for example, an $8,600 account value divided by $1,000.00 = 8.6), then multiply the result by the number in the first line for a class of the Fund under the heading entitled "Expenses Paid During Period" to estimate the expenses you paid on your account during this period. In addition, the Fund, as a shareholder in the underlying Fidelity Central Funds, will indirectly bear its pro-rata share of the fees and expenses incurred by the underlying Fidelity Central Funds. These fees and expenses are not included in the Fund's annualized expense ratio used to calculate the expense estimate in the table below.
Hypothetical Example for Comparison Purposes
The second line of the accompanying table for each class of the Fund provides information about hypothetical account values and hypothetical expenses based on a Class' actual expense ratio and an assumed rate of return of 5% per year before expenses, which is not the Class' actual return. The hypothetical account values and expenses may not be used to estimate the actual ending account balance or expenses you paid for the period. You may use this information to compare the ongoing costs of investing in the Fund and other funds. To do so, compare this 5% hypothetical example with the 5% hypothetical examples that appear in the shareholder reports of the other funds. In addition, the Fund, as a shareholder in the underlying Fidelity Central Funds, will indirectly bear its pro-rata share of the fees and expenses incurred by the underlying Fidelity Central Funds. These fees and expenses are not included in the Fund's annualized expense ratio used to calculate the expense estimate in the table below.
Please note that the expenses shown in the table are meant to highlight your ongoing costs only and do not reflect any transaction costs. Therefore, the second line of the table is useful in comparing ongoing costs only, and will not help you determine the relative total costs of owning different funds. In addition, if these transactional costs were included, your costs would have been higher.
Annual Report
| Annualized
Expense Ratio | Beginning
Account Value
February 1, 2010 | Ending
Account Value
July 31, 2010 | Expenses Paid
During Period*
February 1, 2010
to July 31, 2010 |
Series Small Cap Opportunities | 1.02% | | | |
Actual | | $ 1,000.00 | $ 1,108.90 | $ 5.33 |
Hypothetical A | | $ 1,000.00 | $ 1,019.74 | $ 5.11 |
Class F | .79% | | | |
Actual | | $ 1,000.00 | $ 1,111.30 | $ 4.14 |
Hypothetical A | | $ 1,000.00 | $ 1,020.88 | $ 3.96 |
A 5% return per year before expenses
* Expenses are equal to each Class' annualized expense ratio, multiplied by the average account value over the period, multiplied by 181/365 (to reflect the one-half year period).
Annual Report
Investment Changes (Unaudited)
Top Ten Stocks as of July 31, 2010 |
| % of fund's
net assets | % of fund's net assets
6 months ago |
Wright Express Corp. | 1.3 | 1.3 |
Alexandria Real Estate Equities, Inc. | 1.3 | 1.1 |
TCF Financial Corp. | 1.2 | 1.1 |
City National Corp. | 1.2 | 1.0 |
Jones Lang LaSalle, Inc. | 1.1 | 0.9 |
Platinum Underwriters Holdings Ltd. | 1.1 | 1.1 |
Forestar Group, Inc. | 1.1 | 1.2 |
National Penn Bancshares, Inc. | 1.1 | 1.1 |
Adtran, Inc. | 1.1 | 0.8 |
CapitalSource, Inc. | 1.0 | 1.0 |
| 11.5 | |
Top Five Market Sectors as of July 31, 2010 |
| % of fund's
net assets | % of fund's net assets
6 months ago |
Financials | 20.9 | 20.8 |
Information Technology | 19.6 | 19.4 |
Consumer Discretionary | 14.1 | 14.1 |
Industrials | 13.5 | 12.8 |
Health Care | 12.4 | 14.0 |
Asset Allocation (% of fund's net assets) |
As of July 31, 2010* | As of January 31, 2010** |
| Stocks and
Equity Futures 98.9% | | | Stocks and
Equity Futures 99.3% | |
| Short-Term
Investments and
Net Other Assets 1.1% | | | Short-Term
Investments and
Net Other Assets 0.7% | |
* Foreign investments | 7.7% | | ** Foreign investments | 8.6% | |

Annual Report
Investments July 31, 2010
Showing Percentage of Net Assets
Common Stocks - 98.5% |
| Shares | | Value |
CONSUMER DISCRETIONARY - 14.1% |
Auto Components - 1.6% |
BorgWarner, Inc. (a) | 232,800 | | $ 10,210,608 |
Tenneco, Inc. (a) | 537,400 | | 14,832,240 |
| | 25,042,848 |
Diversified Consumer Services - 0.5% |
Bridgepoint Education, Inc. (a) | 425,814 | | 7,898,850 |
Hotels, Restaurants & Leisure - 2.0% |
Red Robin Gourmet Burgers, Inc. (a) | 210,660 | | 4,495,484 |
Vail Resorts, Inc. (a)(d) | 241,600 | | 9,151,808 |
WMS Industries, Inc. (a) | 181,000 | | 6,970,310 |
Wyndham Worldwide Corp. | 366,700 | | 9,361,851 |
| | 29,979,453 |
Household Durables - 2.3% |
iRobot Corp. (a)(d) | 305,983 | | 6,229,814 |
Meritage Homes Corp. (a) | 464,600 | | 8,167,668 |
Mohawk Industries, Inc. (a) | 169,200 | | 8,278,956 |
Tempur-Pedic International, Inc. (a) | 391,354 | | 12,002,827 |
| | 34,679,265 |
Media - 0.5% |
Lamar Advertising Co. Class A (a) | 294,700 | | 8,060,045 |
Multiline Retail - 0.5% |
Dollarama, Inc. | 283,366 | | 7,073,468 |
Specialty Retail - 4.5% |
Cabela's, Inc. Class A (a)(d) | 611,338 | | 9,530,759 |
Fourlis Holdings SA | 598,800 | | 6,227,959 |
Gymboree Corp. (a) | 195,400 | | 8,460,820 |
RadioShack Corp. | 462,900 | | 9,970,866 |
Shoe Carnival, Inc. (a) | 544,614 | | 11,464,125 |
Signet Jewelers Ltd. (a) | 282,500 | | 8,410,025 |
Vitamin Shoppe, Inc. | 461,300 | | 12,602,716 |
West Marine, Inc. (a)(d) | 315,000 | | 3,269,700 |
| | 69,936,970 |
Textiles, Apparel & Luxury Goods - 2.2% |
Deckers Outdoor Corp. (a) | 213,300 | | 10,854,837 |
G-III Apparel Group Ltd. (a) | 524,800 | | 13,539,840 |
Phillips-Van Heusen Corp. | 173,400 | | 8,997,726 |
| | 33,392,403 |
TOTAL CONSUMER DISCRETIONARY | | 216,063,302 |
Common Stocks - continued |
| Shares | | Value |
CONSUMER STAPLES - 3.3% |
Beverages - 0.4% |
Hansen Natural Corp. (a) | 146,400 | | $ 6,132,696 |
Food & Staples Retailing - 0.6% |
BJ's Wholesale Club, Inc. (a) | 182,600 | | 8,317,430 |
Food Products - 1.6% |
Chiquita Brands International, Inc. (a) | 437,830 | | 6,427,344 |
Green Mountain Coffee Roasters, Inc. (a)(d) | 279,400 | | 8,602,726 |
J&J Snack Foods Corp. | 97,945 | | 4,085,286 |
Lance, Inc. | 274,200 | | 5,793,846 |
| | 24,909,202 |
Personal Products - 0.7% |
Elizabeth Arden, Inc. (a) | 506,245 | | 7,861,985 |
Nutraceutical International Corp. (a) | 185,888 | | 2,927,736 |
| | 10,789,721 |
TOTAL CONSUMER STAPLES | | 50,149,049 |
ENERGY - 5.5% |
Energy Equipment & Services - 1.6% |
Complete Production Services, Inc. (a) | 371,071 | | 7,143,117 |
Newpark Resources, Inc. (a) | 824,700 | | 6,589,353 |
Superior Energy Services, Inc. (a) | 307,200 | | 7,001,088 |
Willbros Group, Inc. (a) | 506,800 | | 4,637,220 |
| | 25,370,778 |
Oil, Gas & Consumable Fuels - 3.9% |
Atlas Pipeline Partners, LP (a) | 732,073 | | 13,206,597 |
Berry Petroleum Co. Class A | 308,500 | | 9,199,470 |
Cloud Peak Energy, Inc. | 583,000 | | 8,949,050 |
EXCO Resources, Inc. | 476,748 | | 6,917,613 |
SM Energy Co. | 287,332 | | 11,901,291 |
Whiting Petroleum Corp. (a) | 108,935 | | 9,587,369 |
| | 59,761,390 |
TOTAL ENERGY | | 85,132,168 |
FINANCIALS - 20.9% |
Capital Markets - 2.7% |
Affiliated Managers Group, Inc. (a) | 193,800 | | 13,726,854 |
Common Stocks - continued |
| Shares | | Value |
FINANCIALS - continued |
Capital Markets - continued |
optionsXpress Holdings, Inc. (a) | 923,302 | | $ 14,403,511 |
Waddell & Reed Financial, Inc. Class A | 552,500 | | 13,166,075 |
| | 41,296,440 |
Commercial Banks - 6.8% |
Associated Banc-Corp. | 1,103,328 | | 14,994,228 |
CapitalSource, Inc. | 2,945,000 | | 15,844,100 |
City National Corp. | 312,300 | | 17,698,041 |
National Penn Bancshares, Inc. | 2,527,700 | | 16,834,482 |
PacWest Bancorp | 681,500 | | 14,263,795 |
TCF Financial Corp. (d) | 1,160,531 | | 18,382,811 |
Western Liberty Bancorp (a)(e) | 1,000,000 | | 6,240,000 |
| | 104,257,457 |
Insurance - 3.7% |
Alterra Capital Holdings Ltd. | 611,211 | | 11,826,933 |
Amerisafe, Inc. (a) | 767,000 | | 13,775,320 |
Endurance Specialty Holdings Ltd. | 372,400 | | 14,370,916 |
Platinum Underwriters Holdings Ltd. | 440,499 | | 17,214,701 |
| | 57,187,870 |
Real Estate Investment Trusts - 3.7% |
Alexandria Real Estate Equities, Inc. (d) | 276,900 | | 19,535,295 |
Franklin Street Properties Corp. | 685,200 | | 8,366,292 |
Highwoods Properties, Inc. (SBI) | 285,000 | | 8,923,350 |
Home Properties, Inc. | 212,000 | | 10,530,040 |
National Retail Properties, Inc. | 441,800 | | 10,214,416 |
| | 57,569,393 |
Real Estate Management & Development - 2.2% |
Forestar Group, Inc. (a) | 1,059,000 | | 17,060,490 |
Jones Lang LaSalle, Inc. | 224,700 | | 17,405,262 |
| | 34,465,752 |
Thrifts & Mortgage Finance - 1.8% |
Astoria Financial Corp. | 862,200 | | 11,415,528 |
Washington Federal, Inc. | 898,900 | | 15,640,860 |
| | 27,056,388 |
TOTAL FINANCIALS | | 321,833,300 |
HEALTH CARE - 12.4% |
Biotechnology - 3.1% |
Allos Therapeutics, Inc. (a)(d) | 937,810 | | 4,520,244 |
Common Stocks - continued |
| Shares | | Value |
HEALTH CARE - continued |
Biotechnology - continued |
Anadys Pharmaceuticals, Inc. (a) | 1,013,500 | | $ 2,037,135 |
ARIAD Pharmaceuticals, Inc. (a) | 1,219,782 | | 3,903,302 |
BioMarin Pharmaceutical, Inc. (a) | 150,900 | | 3,297,165 |
Dynavax Technologies Corp. (a) | 2,007,034 | | 4,435,545 |
Idenix Pharmaceuticals, Inc. (a) | 44,058 | | 225,136 |
Incyte Corp. (a) | 352,980 | | 4,595,800 |
Inhibitex, Inc. (a)(d) | 582,163 | | 1,100,288 |
Keryx Biopharmaceuticals, Inc. (a)(d) | 756,143 | | 2,843,098 |
Lexicon Pharmaceuticals, Inc. (a)(d) | 2,189,060 | | 3,305,481 |
Metabolix, Inc. (a)(d) | 311,256 | | 4,394,935 |
Neurocrine Biosciences, Inc. (a) | 714,621 | | 4,059,047 |
Pharmacyclics, Inc. (a) | 262,600 | | 1,830,322 |
Pharmasset, Inc. (a) | 45,600 | | 1,231,656 |
Targacept, Inc. (a) | 131,941 | | 2,853,884 |
ZIOPHARM Oncology, Inc. (a) | 751,550 | | 2,810,797 |
| | 47,443,835 |
Health Care Equipment & Supplies - 2.9% |
AGA Medical Holdings, Inc. (d) | 685,758 | | 9,936,633 |
American Medical Systems Holdings, Inc. (a) | 505,907 | | 11,312,081 |
DexCom, Inc. (a) | 960,900 | | 10,723,644 |
Hill-Rom Holdings, Inc. | 82,900 | | 2,739,016 |
NxStage Medical, Inc. (a) | 146,650 | | 2,315,604 |
Volcano Corp. (a) | 318,963 | | 7,039,513 |
| | 44,066,491 |
Health Care Providers & Services - 3.4% |
Alliance Healthcare Services, Inc. (a) | 1,762,722 | | 7,403,432 |
BioScrip, Inc. (a) | 667,998 | | 2,838,992 |
Catalyst Health Solutions, Inc. (a) | 202,337 | | 6,996,813 |
Centene Corp. (a) | 403,663 | | 8,602,059 |
Emergency Medical Services Corp. Class A (a) | 92,829 | | 4,153,169 |
Hanger Orthopedic Group, Inc. (a) | 410,008 | | 7,031,637 |
HMS Holdings Corp. (a) | 189,586 | | 10,677,484 |
MWI Veterinary Supply, Inc. (a) | 97,384 | | 5,128,241 |
| | 52,831,827 |
Health Care Technology - 0.4% |
MedAssets, Inc. (a) | 41,400 | | 969,174 |
SXC Health Solutions Corp. (a) | 84,617 | | 5,798,357 |
| | 6,767,531 |
Common Stocks - continued |
| Shares | | Value |
HEALTH CARE - continued |
Life Sciences Tools & Services - 1.5% |
Dionex Corp. (a) | 86,607 | | $ 6,538,829 |
eResearchTechnology, Inc. (a) | 1,067,139 | | 8,643,826 |
Illumina, Inc. (a) | 177,600 | | 7,961,808 |
| | 23,144,463 |
Pharmaceuticals - 1.1% |
Amarin Corp. PLC ADR (a)(d) | 801,547 | | 1,947,759 |
Ardea Biosciences, Inc. (a) | 194,301 | | 3,876,305 |
Cardiome Pharma Corp. (a) | 430,200 | | 3,523,794 |
Perrigo Co. | 26,700 | | 1,495,467 |
Questcor Pharmaceuticals, Inc. (a) | 553,205 | | 6,223,556 |
| | 17,066,881 |
TOTAL HEALTH CARE | | 191,321,028 |
INDUSTRIALS - 13.5% |
Aerospace & Defense - 1.0% |
Teledyne Technologies, Inc. (a) | 197,600 | | 8,107,528 |
Triumph Group, Inc. | 103,180 | | 7,831,362 |
| | 15,938,890 |
Air Freight & Logistics - 0.5% |
UTI Worldwide, Inc. | 524,400 | | 7,661,484 |
Airlines - 0.6% |
Alaska Air Group, Inc. (a) | 172,500 | | 8,899,275 |
Building Products - 1.9% |
A.O. Smith Corp. | 207,174 | | 11,328,274 |
AAON, Inc. | 327,200 | | 8,134,192 |
Armstrong World Industries, Inc. (a) | 254,674 | | 9,310,881 |
| | 28,773,347 |
Commercial Services & Supplies - 0.7% |
United Stationers, Inc. (a) | 199,400 | | 10,797,510 |
Construction & Engineering - 1.0% |
Chicago Bridge & Iron Co. NV unit (a) | 357,700 | | 8,051,827 |
Granite Construction, Inc. | 323,800 | | 7,528,350 |
| | 15,580,177 |
Electrical Equipment - 1.3% |
General Cable Corp. (a)(d) | 378,385 | | 10,042,338 |
Regal-Beloit Corp. | 161,500 | | 9,824,045 |
| | 19,866,383 |
Common Stocks - continued |
| Shares | | Value |
INDUSTRIALS - continued |
Industrial Conglomerates - 0.7% |
Carlisle Companies, Inc. | 224,600 | | $ 7,564,528 |
Otter Tail Corp. | 114,928 | | 2,361,770 |
| | 9,926,298 |
Machinery - 3.6% |
Accuride Corp. (a) | 3,748,860 | | 4,461,143 |
CLARCOR, Inc. | 271,586 | | 10,189,907 |
Gardner Denver, Inc. | 171,300 | | 8,696,901 |
John Bean Technologies Corp. | 495,700 | | 7,787,447 |
Manitowoc Co., Inc. | 771,500 | | 7,992,740 |
Timken Co. | 304,726 | | 10,244,888 |
Wabtec Corp. | 147,154 | | 6,564,540 |
| | 55,937,566 |
Professional Services - 0.5% |
Advisory Board Co. (a) | 187,984 | | 8,244,978 |
Road & Rail - 0.5% |
Kansas City Southern (a) | 221,800 | | 8,140,060 |
Trading Companies & Distributors - 1.2% |
Interline Brands, Inc. (a) | 511,800 | | 9,258,462 |
WESCO International, Inc. (a) | 230,800 | | 8,292,644 |
| | 17,551,106 |
TOTAL INDUSTRIALS | | 207,317,074 |
INFORMATION TECHNOLOGY - 19.6% |
Communications Equipment - 3.6% |
Adtran, Inc. | 515,990 | | 16,294,964 |
CommScope, Inc. (a) | 381,194 | | 7,753,486 |
DragonWave, Inc. (a)(d) | 774,500 | | 4,716,543 |
Emulex Corp. (a) | 809,900 | | 7,046,130 |
Ixia (a) | 638,700 | | 7,012,926 |
NETGEAR, Inc. (a) | 491,000 | | 11,784,000 |
| | 54,608,049 |
Computers & Peripherals - 2.3% |
NCR Corp. (a) | 520,500 | | 7,130,850 |
SanDisk Corp. (a) | 167,064 | | 7,300,697 |
Super Micro Computer, Inc. (a) | 783,289 | | 11,310,693 |
Synaptics, Inc. (a)(d) | 287,857 | | 9,009,924 |
| | 34,752,164 |
Common Stocks - continued |
| Shares | | Value |
INFORMATION TECHNOLOGY - continued |
Electronic Equipment & Components - 1.4% |
Anixter International, Inc. (a) | 208,200 | | $ 10,060,224 |
Avnet, Inc. (a) | 424,470 | | 10,675,421 |
| | 20,735,645 |
Internet Software & Services - 2.6% |
Art Technology Group, Inc. (a) | 2,543,300 | | 9,155,880 |
j2 Global Communications, Inc. (a) | 345,430 | | 8,127,968 |
Rackspace Hosting, Inc. (a)(d) | 623,700 | | 11,663,190 |
Terremark Worldwide, Inc. (a) | 1,264,744 | | 11,357,401 |
| | 40,304,439 |
IT Services - 2.5% |
Acxiom Corp. (a) | 194,234 | | 2,979,550 |
Alliance Data Systems Corp. (a)(d) | 132,800 | | 7,633,344 |
Sapient Corp. | 732,620 | | 8,058,820 |
Wright Express Corp. (a) | 586,400 | | 20,518,138 |
| | 39,189,852 |
Semiconductors & Semiconductor Equipment - 2.8% |
Amkor Technology, Inc. (a)(d) | 1,243,800 | | 7,176,726 |
Brooks Automation, Inc. (a) | 682,756 | | 5,209,428 |
Micron Technology, Inc. (a) | 402,300 | | 2,928,744 |
Omnivision Technologies, Inc. (a) | 455,900 | | 10,171,129 |
Standard Microsystems Corp. (a) | 283,507 | | 6,242,824 |
Teradyne, Inc. (a) | 586,091 | | 6,306,339 |
Varian Semiconductor Equipment Associates, Inc. (a) | 190,600 | | 5,386,356 |
| | 43,421,546 |
Software - 4.4% |
Ariba, Inc. (a) | 382,602 | | 6,110,154 |
JDA Software Group, Inc. (a) | 444,800 | | 10,452,800 |
Mentor Graphics Corp. (a) | 1,507,200 | | 14,499,264 |
Nuance Communications, Inc. (a) | 702,000 | | 11,590,020 |
Parametric Technology Corp. (a) | 881,400 | | 15,812,316 |
Radiant Systems, Inc. (a) | 692,026 | | 9,833,689 |
| | 68,298,243 |
TOTAL INFORMATION TECHNOLOGY | | 301,309,938 |
MATERIALS - 5.0% |
Chemicals - 2.6% |
Cabot Corp. | 329,200 | | 9,711,400 |
Common Stocks - continued |
| Shares | | Value |
MATERIALS - continued |
Chemicals - continued |
LyondellBasell Industries NV: | | | |
Class A (a) | 256,514 | | $ 4,617,252 |
Class B (a) | 251,597 | | 4,528,746 |
Rockwood Holdings, Inc. (a) | 398,700 | | 11,646,027 |
Solutia, Inc. (a) | 632,610 | | 8,926,127 |
| | 39,429,552 |
Construction Materials - 0.3% |
Texas Industries, Inc. (d) | 146,200 | | 4,853,840 |
Metals & Mining - 2.1% |
Carpenter Technology Corp. | 321,500 | | 11,236,425 |
Compass Minerals International, Inc. | 148,700 | | 10,511,603 |
Red Back Mining, Inc. (a) | 418,600 | | 10,595,819 |
| | 32,343,847 |
TOTAL MATERIALS | | 76,627,239 |
TELECOMMUNICATION SERVICES - 1.1% |
Diversified Telecommunication Services - 0.6% |
AboveNet, Inc. (a) | 74,914 | | 3,985,425 |
Global Crossing Ltd. (a) | 213,492 | | 2,470,102 |
PAETEC Holding Corp. (a) | 763,521 | | 3,000,638 |
| | 9,456,165 |
Wireless Telecommunication Services - 0.5% |
NII Holdings, Inc. (a) | 44,000 | | 1,648,240 |
Syniverse Holdings, Inc. (a) | 275,897 | | 6,160,780 |
| | 7,809,020 |
TOTAL TELECOMMUNICATION SERVICES | | 17,265,185 |
UTILITIES - 3.1% |
Electric Utilities - 1.6% |
Cleco Corp. | 264,000 | | 7,537,200 |
Great Plains Energy, Inc. | 361,700 | | 6,488,898 |
Portland General Electric Co. | 232,400 | | 4,438,840 |
Westar Energy, Inc. | 283,100 | | 6,760,428 |
| | 25,225,366 |
Common Stocks - continued |
| Shares | | Value |
UTILITIES - continued |
Gas Utilities - 1.0% |
Northwest Natural Gas Co. | 151,700 | | $ 7,192,097 |
Southwest Gas Corp. | 265,800 | | 8,550,786 |
| | 15,742,883 |
Multi-Utilities - 0.5% |
NorthWestern Energy Corp. | 255,000 | | 7,191,000 |
TOTAL UTILITIES | | 48,159,249 |
TOTAL COMMON STOCKS (Cost $1,311,330,973) | 1,515,177,532 |
U.S. Treasury Obligations - 0.1% |
| Principal Amount | | |
U.S. Treasury Bills, yield at date of purchase 0.09% to 0.16% 8/12/10 to 9/16/10 (f)
(Cost $1,999,819) | | $ 2,000,000 | | 1,999,853 |
Money Market Funds - 4.3% |
| Shares | | |
Fidelity Cash Central Fund, 0.24% (b) | 20,250,260 | | 20,250,260 |
Fidelity Securities Lending Cash Central Fund, 0.27% (b)(c) | 45,511,652 | | 45,511,652 |
TOTAL MONEY MARKET FUNDS (Cost $65,761,912) | 65,761,912 |
Cash Equivalents - 0.0% |
| Maturity Amount | | |
Investments in repurchase agreements in a joint trading account at 0.21%, dated 7/30/10 due 8/2/10 (Collateralized by U.S. Treasury Obligations) #
(Cost $25,000) | $ 25,000 | | 25,000 |
TOTAL INVESTMENT PORTFOLIO - 102.9% (Cost $1,379,117,704) | | 1,582,964,297 |
NET OTHER ASSETS (LIABILITIES) - (2.9)% | | (44,534,679) |
NET ASSETS - 100% | $ 1,538,429,618 |
Futures Contracts |
| Expiration Date | | Underlying Face Amount at Value | | Unrealized Appreciation/
(Depreciation) |
Purchased |
Equity Index Contracts |
87 NYFE Russell 2000 Mini Index Contracts | Sept. 2010 | | $ 5,651,520 | | $ (53,768) |
The face value of futures purchased as a percentage of net assets is 0.4% |
Legend |
(a) Non-income producing |
(b) Affiliated fund that is available only to investment companies and other accounts managed by Fidelity Investments. The rate quoted is the annualized seven-day yield of the fund at period end. A complete unaudited listing of the fund's holdings as of its most recent quarter end is available upon request. |
(c) Investment made with cash collateral received from securities on loan. |
(d) Security or a portion of the security is on loan at period end. |
(e) Affiliated company |
(f) Security or a portion of the security was pledged to cover margin requirements for futures contracts. At the period end, the value of securities pledged amounted to $549,896. |
# Additional information on each counterparty to the repurchase agreement is as follows: |
Repurchase Agreement / Counterparty | Value |
$25,000 due 8/02/10 at 0.21% |
BNP Paribas Securities Corp. | $ 5,535 |
Bank of America NA | 3,493 |
Barclays Capital, Inc. | 5,648 |
Credit Agricole Securities (USA) Inc. | 1,164 |
Credit Suisse Securities (USA) LLC | 1,497 |
Deutsche Bank Securities, Inc. | 582 |
ING Financial Markets LLC | 582 |
Mizuho Securities USA,
Inc. | 1,164 |
Morgan Stanley & Co., Inc. | 1,164 |
RBC Capital Markets Corp. | 1,145 |
RBS Securities, Inc. | 1,164 |
Societe Generale, New York Branch | 1,746 |
Wells Fargo Securities LLC | 116 |
| $ 25,000 |
Affiliated Central Funds |
Information regarding fiscal year to date income earned by the Fund from investments in Fidelity Central Funds is as follows: |
Fund | Income earned |
Fidelity Cash Central Fund | $ 69,474 |
Fidelity Securities Lending Cash Central Fund | 1,151,105 |
Total | $ 1,220,579 |
Other Affiliated Issuers |
An affiliated company is a company in which the fund has ownership of at least 5% of the voting securities. Fiscal year to date transactions with companies which are or were affiliates are as follows: |
Affiliate | Value, beginning of period | Purchases | Sales Proceeds | Dividend Income | Value,
end of
period |
International Assets Holding Corp (formerly known as FCStone Group, Inc.) | $ 7,828,236 | $ - | $ 7,305,943 | $ - | $ - |
Western Liberty Bancorp | - | 9,660,486 | - | - | 6,240,000 |
Total | $ 7,828,236 | $ 9,660,486 | $ 7,305,943 | $ - | $ 6,240,000 |
Other Information |
The following is a summary of the inputs used, as of July 31, 2010, involving the Fund's assets and liabilities carried at fair value. The inputs or methodology used for valuing securities may not be an indication of the risk associated with investing in those securities. For more information on valuation inputs, and their aggregation into the levels used in the table below, please refer to the Security Valuation section in the accompanying Notes to Financial Statements. |
Valuation Inputs at Reporting Date: |
Description | Total | Level 1 | Level 2 | Level 3 |
Investments in Securities: | | | | |
Equities: | | | | |
Consumer Discretionary | $ 216,063,302 | $ 216,063,302 | $ - | $ - |
Consumer Staples | 50,149,049 | 50,149,049 | - | - |
Energy | 85,132,168 | 85,132,168 | - | - |
Financials | 321,833,300 | 315,593,300 | 6,240,000 | - |
Health Care | 191,321,028 | 191,321,028 | - | - |
Industrials | 207,317,074 | 207,317,074 | - | - |
Information Technology | 301,309,938 | 301,309,938 | - | - |
Materials | 76,627,239 | 76,627,239 | - | - |
Telecommunication Services | 17,265,185 | 17,265,185 | - | - |
Utilities | 48,159,249 | 48,159,249 | - | - |
U.S. Government and Government Agency Obligations | 1,999,853 | - | 1,999,853 | - |
Money Market Funds | 65,761,912 | 65,761,912 | - | - |
Cash Equivalents | 25,000 | - | 25,000 | - |
Total Investments in Securities: | $ 1,582,964,297 | $ 1,574,699,444 | $ 8,264,853 | $ - |
Derivative Instruments: | | | | |
Liabilities | | | | |
Futures Contracts | $ (53,768) | $ (53,768) | $ - | $ - |
Value of Derivative Instruments |
The following table is a summary of the Fund's value of derivative instruments by risk exposure as of July 31, 2010. For additional information on derivative instruments, please refer to the Derivative Instruments section in the accompanying Notes to Financial Statements. |
Risk Exposure /
Derivative Type | Value |
| Asset | Liability |
Equity Risk | | |
Futures Contracts (a) | $ - | $ (53,768) |
Total Value of Derivatives | $ - | $ (53,768) |
(a) Reflects cumulative appreciation/(depreciation) on futures contracts as disclosed on the Schedule of Investments. Only the period end variation margin is separately disclosed on the Statement of Assets and Liabilities. |
Income Tax Information |
At July 31, 2010, the Fund had a capital loss carryforward of approximately $299,856,941 which will expire on July 31, 2017. Capital loss carryforwards are only available to offset future capital gains of the Fund to the extent provided by regulations and may be limited. |
See accompanying notes which are an integral part of the financial statements.
Annual Report
Statement of Assets and Liabilities
| July 31, 2010 |
| | |
Assets | | |
Investment in securities, at value (including securities loaned of $43,976,139 and repurchase agreements of $25,000) - See accompanying schedule: Unaffiliated issuers (cost $1,303,695,306) | $ 1,510,962,385 | |
Fidelity Central Funds (cost $65,761,912) | 65,761,912 | |
Other affiliated issuers (cost $9,660,486) | 6,240,000 | |
Total Investments (cost $1,379,117,704) | | $ 1,582,964,297 |
Receivable for investments sold | | 12,756,081 |
Receivable for fund shares sold | | 1,786,198 |
Dividends receivable | | 725,054 |
Distributions receivable from Fidelity Central Funds | | 49,815 |
Receivable for daily variation on futures contracts | | 16,501 |
Other receivables | | 87,192 |
Total assets | | 1,598,385,138 |
| | |
Liabilities | | |
Payable to custodian bank | $ 2,182,896 | |
Payable for investments purchased | 10,791,611 | |
Payable for fund shares redeemed | 145,405 | |
Accrued management fee | 959,665 | |
Other affiliated payables | 296,729 | |
Other payables and accrued expenses | 67,562 | |
Collateral on securities loaned, at value | 45,511,652 | |
Total liabilities | | 59,955,520 |
| | |
Net Assets | | $ 1,538,429,618 |
Net Assets consist of: | | |
Paid in capital | | $ 1,638,054,522 |
Accumulated net investment loss | | (47,686) |
Accumulated undistributed net realized gain (loss) on investments and foreign currency transactions | | (303,378,360) |
Net unrealized appreciation (depreciation) on investments and assets and liabilities in foreign currencies | | 203,801,142 |
Net Assets | | $ 1,538,429,618 |
| | |
Series Small Cap Opportunities:
Net Asset Value, offering price and redemption price per share ($1,363,646,463 ÷ 155,647,422 shares) | | $ 8.76 |
| | |
Class F:
Net Asset Value, offering price and redemption price per share ($174,783,155 ÷ 19,892,926 shares) | | $ 8.79 |
See accompanying notes which are an integral part of the financial statements.
Annual Report
Statement of Operations
| Year ended July 31, 2010 |
| | |
Investment Income | | |
Dividends | | $ 12,787,810 |
Interest | | 83,593 |
Income from Fidelity Central Funds (including $1,151,105 from security lending) | | 1,220,579 |
Total income | | 14,091,982 |
| | |
Expenses | | |
Management fee
Basic fee | $ 10,604,945 | |
Performance adjustment | 431,105 | |
Transfer agent fees | 3,350,923 | |
Accounting and security lending fees | 511,326 | |
Custodian fees and expenses | 82,739 | |
Independent trustees' compensation | 8,504 | |
Audit | 64,098 | |
Legal | 6,189 | |
Miscellaneous | 21,955 | |
Total expenses before reductions | 15,081,784 | |
Expense reductions | (160,955) | 14,920,829 |
Net investment income (loss) | | (828,847) |
Realized and Unrealized Gain (Loss) Net realized gain (loss) on: | | |
Investment securities: | | |
Unaffiliated issuers | 283,169,729 | |
Other affiliated issuers | 2,732,496 | |
Foreign currency transactions | (46,014) | |
Futures contracts | 3,349,312 | |
Capital gain distributions from Fidelity Central Funds | 2,413 | |
Total net realized gain (loss) | | 289,207,936 |
Change in net unrealized appreciation (depreciation) on: Investment securities | 51,066,076 | |
Assets and liabilities in foreign currencies | 3,336 | |
Futures contracts | (791,525) | |
Total change in net unrealized appreciation (depreciation) | | 50,277,887 |
Net gain (loss) | | 339,485,823 |
Net increase (decrease) in net assets resulting from operations | | $ 338,656,976 |
See accompanying notes which are an integral part of the financial statements.
Annual Report
Financial Statements - continued
Statement of Changes in Net Assets
| Year ended
July 31,
2010 | Year ended
July 31,
2009 |
Increase (Decrease) in Net Assets | | |
Operations | | |
Net investment income (loss) | $ (828,847) | $ 5,093,481 |
Net realized gain (loss) | 289,207,936 | (336,177,072) |
Change in net unrealized appreciation (depreciation) | 50,277,887 | 196,145,576 |
Net increase (decrease) in net assets resulting
from operations | 338,656,976 | (134,938,015) |
Distributions to shareholders from net investment income | - | (5,991,213) |
Share transactions - net increase (decrease) | (84,503,551) | 76,947,174 |
Total increase (decrease) in net assets | 254,153,425 | (63,982,054) |
| | |
Net Assets | | |
Beginning of period | 1,284,276,193 | 1,348,258,247 |
End of period (including accumulated net investment loss of $47,686 and undistributed net investment income of $0, respectively) | $ 1,538,429,618 | $ 1,284,276,193 |
See accompanying notes which are an integral part of the financial statements.
Annual Report
Financial Highlights - Series Small Cap Opportunities
Years ended July 31, | 2010 | 2009 | 2008 | 2007 G |
Selected Per-Share Data | | | | |
Net asset value, beginning of period | $ 6.94 | $ 7.97 | $ 9.65 | $ 10.00 |
Income from Investment Operations | | | | |
Net investment income (loss) D | (.01) | .03 | .02 | .01 |
Net realized and unrealized gain (loss) | 1.83 | (1.02) | (1.66) | (.36) |
Total from investment operations | 1.82 | (.99) | (1.64) | (.35) |
Distributions from net investment income | - | (.04) | (.02) | - |
Distributions from net realized gain | - | - | (.02) | - |
Total distributions | - | (.04) | (.04) | - |
Redemption fees added to paid in capital I | - | - | - D, J | - D, J |
Net asset value, end of period | $ 8.76 | $ 6.94 | $ 7.97 | $ 9.65 |
Total Return B, C | 26.22% | (12.34)% | (17.10)% | (3.50)% |
Ratios to Average Net Assets E, H | | | | |
Expenses before reductions | 1.02% | .93% | .93% | 1.00% A |
Expenses net of fee waivers, if any | 1.02% | .93% | .93% | 1.00% A |
Expenses net of all reductions | 1.01% | .93% | .92% | .98% A |
Net investment income (loss) | (.07)% | .49% | .20% | .20% A |
Supplemental Data | | | | |
Net assets, end of period (000 omitted) | $ 1,363,646 | $ 1,284,079 | $ 1,348,258 | $ 984,470 |
Portfolio turnover rate F | 104% | 167% | 179% | 176% A |
A Annualized
B Total returns for periods of less than one year are not annualized.
C Total returns would have been lower had certain expenses not been reduced during the periods shown.
D Calculated based on average shares outstanding during the period.
E Fees and expenses of the underlying Fidelity Central Funds are not included in the Fund's expense ratio. The Fund indirectly bears its proportionate share of the expenses of any underlying Fidelity Central Funds.
F Amount does not include the portfolio activity of any underlying Fidelity Central Funds.
G For the period March 22, 2007 (commencement of sale of shares) to July 31, 2007.
H Expense ratios reflect operating expenses of the class. Expenses before reductions do not reflect amounts reimbursed by the investment adviser or reductions from brokerage service arrangements or reductions from other expense offset arrangements and do not represent the amount paid by the class during periods when reimbursements or reductions occur. Expense ratio before reductions for start-up periods may not be representative of longer term operating periods. Expenses net of fee waivers reflect expenses after reimbursement by the investment adviser but prior to reductions from brokerage service arrangements or other expense offset arrangements. Expenses net of all reductions represent the net expenses paid by the class.
I The redemption fee was eliminated during the year ended July 31, 2009.
J Amount represents less than $.01 per share.
See accompanying notes which are an integral part of the financial statements.
Annual Report
Financial Highlights - Class F
Years ended July 31, | 2010 | 2009 G |
Selected Per-Share Data | | |
Net asset value, beginning of period | $ 6.94 | $ 6.24 |
Income from Investment Operations | | |
Net investment income (loss) D | .01 | - I |
Net realized and unrealized gain (loss) | 1.84 | .70 |
Total from investment operations | 1.85 | .70 |
Net asset value, end of period | $ 8.79 | $ 6.94 |
Total Return B, C | 26.66% | 11.22% |
Ratios to Average Net Assets E, H | | |
Expenses before reductions | .78% | .68% A |
Expenses net of fee waivers, if any | .78% | .68% A |
Expenses net of all reductions | .77% | .68% A |
Net investment income (loss) | .17% | .11% A |
Supplemental Data | | |
Net assets, end of period (000 omitted) | $ 174,783 | $ 197 |
Portfolio turnover rate F | 104% | 167% |
A Annualized
B Total returns for periods of less than one year are not annualized.
C Total returns would have been lower had certain expenses not been reduced during the periods shown.
D Calculated based on average shares outstanding during the period.
E Fees and expenses of the underlying Fidelity Central Funds are not included in the Fund's expense ratio. The Fund indirectly bears its proportionate share of the expenses of any underlying Fidelity Central Funds.
F Amount does not include the portfolio activity of any underlying Fidelity Central Funds.
G For the period June 26, 2009 (commencement of sale of shares) to July 31, 2009.
H Expense ratios reflect operating expenses of the class. Expenses before reductions do not reflect amounts reimbursed by the investment adviser or reductions from brokerage service arrangements or reductions from other expense offset arrangements and do not represent the amount paid by the class during periods when reimbursements or reductions occur. Expense ratios before reductions for start-up periods may not be representative of longer-term operating periods. Expenses net of fee waivers reflect expenses after reimbursement by the investment adviser but prior to reductions from brokerage service arrangements or other expense offset arrangements. Expenses net of all reductions represent the net expenses paid by the class.
I Amount represents less than $.01 per share.
See accompanying notes which are an integral part of the financial statements.
Annual Report
Notes to Financial Statements
For the period ended July 31, 2010
1. Organization.
Fidelity Series Small Cap Opportunities Fund (the Fund) is a fund of Fidelity Securities Fund (the Trust) and is authorized to issue an unlimited number of shares. Shares of the Fund are only available for purchase by mutual funds for which Fidelity Management & Research Company (FMR) or an affiliate serves as an investment manager and, for shares of Series Small Cap Opportunities, FMR investment professionals. The Trust is registered under the Investment Company Act of 1940, as amended (the 1940 Act), as an open-end management investment company organized as a Massachusetts business trust. The Fund offers Series Small Cap Opportunities and Class F shares, each of which has equal rights as to assets and voting privileges. Each class has exclusive voting rights with respect to matters that affect that class. Investment income, realized and unrealized capital gains and losses, the common expenses of the Fund, and certain fund-level expense reductions, if any, are allocated on a pro-rata basis to each class based on the relative net assets of each class to the total net assets of the Fund. Each class differs with respect to transfer agent fees incurred. Certain expense reductions also differ by class.
2. Investments in Fidelity Central Funds.
The Fund may invest in Fidelity Central Funds, which are open-end investment companies available only to other investment companies and accounts managed by FMR and its affiliates. The Fund's Schedule of Investments lists each of the Fidelity Central Funds held as of period end, if any, as an investment of the Fund, but does not include the underlying holdings of each Fidelity Central Fund. As an Investing Fund, the Fund indirectly bears its proportionate share of the expenses of the underlying Fidelity Central Funds.
The Money Market Central Funds seek preservation of capital and current income and are managed by Fidelity Investments Money Management, Inc. (FIMM), an affiliate of FMR.
A complete unaudited list of holdings for each Fidelity Central Fund is available upon request or at the Securities and Exchange Commission (the SEC) web site at www.sec.gov. In addition, the financial statements of the Fidelity Central Funds which are not covered by the Fund's Report of Independent Registered Public Accounting Firm, are available on the SEC web site or upon request.
3. Significant Accounting Policies.
The financial statements have been prepared in conformity with accounting principles generally accepted in the United States of America (GAAP), which require management to make certain estimates and assumptions at the date of the financial statements. Actual results could differ from those estimates. The following summarizes the significant accounting policies of the Fund:
Annual Report
3. Significant Accounting Policies- continued
Security Valuation. Investments are valued as of 4:00 p.m. Eastern time on the last calendar day of the period. The Fund uses independent pricing services approved by the Board of Trustees to value its investments. When current market prices or quotations are not readily available or reliable, valuations may be determined in good faith in accordance with procedures adopted by the Board of Trustees. Factors used in determining value may include market or security specific events. The frequency with which these procedures are used cannot be predicted and they may be utilized to a significant extent. The value used for net asset value (NAV) calculation under these procedures may differ from published prices for the same securities.
The Fund categorizes the inputs to valuation techniques used to value its investments into a disclosure hierarchy consisting of three levels as shown below.
Level 1 - quoted prices in active markets for identical investments
Level 2 - other significant observable inputs (including quoted prices for similar investments, interest rates, prepayment speeds, etc.)
Level 3 - unobservable inputs (including the fund's own assumptions based on the best information available)
Changes in valuation techniques may result in transfers in or out of an assigned level within the disclosure hierarchy. The aggregate value of investments by input level, as of July 31, 2010 is included at the end of the Fund's Schedule of Investments. Valuation techniques used to value the Fund's investments by major category are as follows.
Equity securities, including restricted securities, for which market quotations are readily available, are valued at the last reported sale price or official closing price as reported by an independent pricing service on the primary market or exchange on which they are traded and are categorized as Level 1 in the hierarchy. In the event there were no sales during the day or closing prices are not available, securities are valued at the last quoted bid price or may be valued using the last available price and are generally categorized as Level 2 in the hierarchy. For foreign equity securities, when significant market or security specific events arise, comparisons to the valuation of American Depositary Receipts (ADRs), futures contracts, Exchange-traded funds (ETFs) and certain indexes as well as quoted prices for similar securities are used and are categorized as Level 2 in the hierarchy in these circumstances. Utilizing these techniques may result in transfers between Level 1 and Level 2. For restricted equity securities and private placements where observable inputs are limited, assumptions about market activity and risk are used and are categorized as Level 3 in the hierarchy.
Annual Report
Notes to Financial Statements - continued
3. Significant Accounting Policies- continued
Security Valuation - continued
Futures contracts are valued at the settlement price established each day by the board of trade or exchange on which they are traded and are categorized as Level 1 in the hierarchy. Investments in open-end mutual funds, including the Fidelity Central Funds, are valued at their closing net asset value each business day and are categorized as Level 1 in the hierarchy. Short-term securities with remaining maturities of sixty days or less for which quotations are not readily available are valued at amortized cost, which approximates fair value and are categorized as Level 2 in the hierarchy.
Foreign Currency. The Fund uses foreign currency contracts to facilitate transactions in foreign-denominated securities. Gains and losses from these transactions may arise from changes in the value of the foreign currency or if the counterparties do not perform under the contracts' terms.
Foreign-denominated assets, including investment securities, and liabilities are translated into U.S. dollars at the exchange rate at period end. Purchases and sales of investment securities, income and dividends received and expenses denominated in foreign currencies are translated into U.S. dollars at the exchange rate in effect on the transaction date.
The effects of exchange rate fluctuations on investments are included with the net realized and unrealized gain (loss) on investment securities. Other foreign currency transactions resulting in realized and unrealized gain (loss) are disclosed separately.
Investment Transactions and Income. For financial reporting purposes, the Fund's investment holdings and NAV include trades executed through the end of the last business day of the period. The NAV per share for processing shareholder transactions is calculated as of the close of business of the New York Stock Exchange (NYSE), normally 4:00 p.m. Eastern time and includes trades executed through the end of the prior business day. Gains and losses on securities sold are determined on the basis of identified cost. Dividend income is recorded on the ex-dividend date, except for certain dividends from foreign securities where the ex-dividend date may have passed, which are recorded as soon as the Fund is informed of the ex-dividend date. Non-cash dividends included in dividend income, if any, are recorded at the fair market value of the securities received. Distributions received on securities that represent a return of capital or capital gain are recorded as a reduction of cost of investments and/or as a realized gain. The Fund estimates the components of distributions received that may be considered return of capital distributions or capital gain distributions. Interest income and distributions from the Fidelity Central Funds are accrued as earned. Interest income includes coupon interest and amortization of premium and accretion of discount on debt securities. Investment income is recorded net of foreign taxes withheld where recovery of such taxes is uncertain.
Annual Report
3. Significant Accounting Policies- continued
Expenses. Most expenses of the Trust can be directly attributed to a fund. Expenses which cannot be directly attributed are apportioned amongst each fund in the Trust. Expense estimates are accrued in the period to which they relate and adjustments are made when actual amounts are known.
Income Tax Information and Distributions to Shareholders. Each year the Fund intends to qualify as a regulated investment company, including distributing substantially all of its taxable income and realized gains under Subchapter M of the Internal Revenue Code and filing its U.S. federal tax return. As a result, no provision for income taxes is required. As of July 31, 2010, the Fund did not have any unrecognized tax benefits in the accompanying financial statements. A fund's federal tax return is subject to examination by the Internal Revenue Service (IRS) for a period of three years. Foreign taxes are provided for based on the Fund's understanding of the tax rules and rates that exist in the foreign markets in which it invests.
Distributions are recorded on the ex-dividend date. Income dividends and capital gain distributions are declared separately for each class. Income and capital gain distributions are determined in accordance with income tax regulations, which may differ from GAAP.
Capital accounts within the financial statements are adjusted for permanent book-tax differences. These adjustments have no impact on net assets or the results of operations. Temporary book-tax differences will reverse in a subsequent period.
Book-tax differences are primarily due to short term gain distributions from the underlying funds, futures transactions, foreign currency transactions, market discount, partnerships, net operating losses, capital loss carryforwards, and losses deferred due to wash sales and excise tax regulations.
The federal tax cost of investment securities and unrealized appreciation (depreciation) as of period end were as follows:
Gross unrealized appreciation | $ 273,986,350 |
Gross unrealized depreciation | (73,715,564) |
Net unrealized appreciation (depreciation) | $ 200,270,786 |
| |
Tax Cost | $ 1,382,693,511 |
The tax-based components of distributable earnings as of period end were as follows:
Capital loss carryforward | $ (299,856,941) |
Net unrealized appreciation (depreciation) | $ 200,279,723 |
Annual Report
Notes to Financial Statements - continued
3. Significant Accounting Policies- continued
Income Tax Information and Distributions to Shareholders - continued
The tax character of distributions paid was as follows:
| July 31, 2010 | July 31, 2009 |
Ordinary Income | $ - | $ 5,991,213 |
4. Operating Policies.
Repurchase Agreements. FMR has received an Exemptive Order from the SEC which permits the Fund and other affiliated entities of FMR to transfer uninvested cash balances into joint trading accounts which are then invested in repurchase agreements. The Fund may also invest directly with institutions in repurchase agreements. Repurchase agreements are collateralized by government or non-government securities. Upon settlement date, collateral is held in segregated accounts with custodian banks and may be obtained in the event of a default of the counterparty. The Fund monitors, on a daily basis, the value of the collateral to ensure it is at least equal to the principal amount of the repurchase agreement (including accrued interest). In the event of a default by the counterparty, realization of the collateral proceeds could be delayed, during which time the value of the collateral may decline.
5. Derivative Instruments.
Risk Exposures and the Use of Derivative Instruments. The Fund uses derivative instruments (derivatives), including futures contracts, in order to meet its investment objectives. The strategy is to use derivatives to increase returns and to manage exposure to certain risks as defined below. The success of any strategy involving derivatives depends on analysis of numerous economic factors, and if the strategies for investment do not work as intended, the Fund may not achieve its objectives.
The Fund's use of derivatives may increase or decrease its exposure to the following risks:
Equity Risk | Equity risk relates to the fluctuations in the value of financial instruments as a result of changes in market prices (other than those arising from interest rate risk or foreign exchange risk), whether caused by factors specific to an individual investment, its issuer, or all factors affecting all instruments traded in a market or market segment. |
The Fund is also exposed to additional risks from investing in derivatives, such as liquidity risk and counterparty credit risk. Liquidity risk is the risk that the Fund will be unable to sell the derivative in the open market in a timely manner. Counterparty credit risk is the risk that the counterparty will not be able to fulfill its obligation to the Fund.
Annual Report
5. Derivative Instruments - continued
Risk Exposures and the Use of Derivative Instruments - continued
The Fund's maximum risk of loss from counterparty credit risk is generally the aggregate unrealized appreciation and unpaid counterparty fees in excess of any collateral pledged by the counterparty to the Fund. Counterparty risk related to exchange-traded futures contracts is minimal because of the protection provided by the exchange on which they trade. Risk of loss may exceed the amounts recognized in the Statement of Assets and Liabilities.
Futures Contracts. A futures contract is an agreement between two parties to buy or sell a specified underlying instrument for a fixed price at a specified future date. The Fund uses futures contracts to manage its exposure to the stock markets.
Upon entering into a futures contract, a fund is required to deposit either cash or securities (initial margin) with a clearing broker in an amount equal to a certain percentage of the face value of the contract. Futures contracts are marked-to-market daily and subsequent payments (variation margin) are made or received by a fund depending on the daily fluctuations in the value of the futures contracts and are recorded as unrealized appreciation or (depreciation). Realized gain or (loss) is recorded upon the expiration or closing of a futures contract.
The underlying face amount at value of open futures contracts at period end, if any, is shown in the Schedule of Investments under the caption "Futures Contracts." This amount reflects each contract's exposure to the underlying instrument at period end and is representative of activity for the period. Securities deposited to meet initial margin requirements are identified in the Schedule of Investments. The receivable and/or payable for the variation margin are reflected in the Statement of Assets and Liabilities.
Certain risks may arise upon entering into futures contracts, including the risk that an illiquid market may limit the ability to close out a futures contract prior to settlement date.
During the period the Fund recognized net realized gain (loss) of $3,349,312 and a change in net unrealized appreciation (depreciation) of $(791,525) related to its investment in futures contracts. These amounts are included in the Statement of Operations.
6. Purchases and Sales of Investments.
Purchases and sales of securities, other than short-term securities, aggregated $1,495,737,397 and $1,572,042,780, respectively.
Annual Report
Notes to Financial Statements - continued
7. Fees and Other Transactions with Affiliates.
Management Fee. FMR and its affiliates provide the Fund with investment management related services for which the Fund pays a monthly management fee. The management fee is the sum of an individual fund fee rate that is based on an annual rate of .45% of the Fund's average net assets and a group fee rate that averaged .26% during the period. The group fee rate is based upon the average net assets of all the mutual funds advised by FMR. The group fee rate decreases as assets under management increase and increases as assets under management decrease. In addition, the management fee is subject to a performance adjustment (up to a maximum of ± .20% of the Fund's average net assets over a 36 month performance period). The upward or downward adjustment to the management fee is based on the relative investment performance of the retail class of the Fund, Series Small Cap Opportunities, as compared to an appropriate benchmark index. For the period, the total annual management fee rate, including the performance adjustment, was .74% of the Fund's average net assets.
Transfer Agent Fees. Fidelity Investments Institutional Operations Company, Inc. (FIIOC), an affiliate of FMR, is the transfer, dividend disbursing and shareholder servicing agent for each class of the Fund. FIIOC receives account fees and asset-based fees that vary according to the account size and type of account of the shareholders of Series Small Cap Opportunities. FIIOC receives no fees for providing transfer agency services to Class F. FIIOC pays for typesetting, printing and mailing of shareholder reports, except proxy statements. For the period, the total transfer agent fees paid by each applicable class were as follows:
| Amount | % of
Average
Net Assets |
Series Small Cap Opportunities | $ 3,350,923 | .24 |
Accounting and Security Lending Fees. Fidelity Service Company, Inc. (FSC), an affiliate of FMR, maintains the Fund's accounting records. The accounting fee is based on the level of average net assets for the month. Under a separate contract, FSC administers the security lending program. The security lending fee is based on the number and duration of lending transactions.
Brokerage Commissions. The Fund placed a portion of its portfolio transactions with brokerage firms which are affiliates of the investment adviser. The commissions paid to these affiliated firms were $38,672 for the period.
Annual Report
8. Committed Line of Credit.
The Fund participates with other funds managed by FMR in a $3.75 billion credit facility (the "line of credit") to be utilized for temporary or emergency purposes to fund shareholder redemptions or for other short-term liquidity purposes. The Fund has agreed to pay commitment fees on its pro-rata portion of the line of credit, which amounted to $5,842 and is reflected in Miscellaneous expenses on the Statement of Operations. During the period, there were no borrowings on this line of credit.
9. Security Lending.
The Fund lends portfolio securities from time to time in order to earn additional income. On the settlement date of the loan, the Fund receives collateral (in the form of U.S. Treasury obligations, letters of credit and/or cash) against the loaned securities and maintains collateral in an amount not less than 100% of the market value of the loaned securities during the period of the loan. The market value of the loaned securities is determined at the close of business of the Fund and any additional required collateral is delivered to the Fund on the next business day. If the borrower defaults on its obligation to return the securities loaned because of insolvency or other reasons, a fund could experience delays and costs in recovering the securities loaned or in gaining access to the collateral. Any cash collateral received is invested in the Fidelity Securities Lending Cash Central Fund. The value of loaned securities and cash collateral at period end are disclosed on the Fund's Statement of Assets and Liabilities. Security lending income represents the income earned on investing cash collateral, less fees and expenses associated with the loan, plus any premium payments that may be received on the loan of certain types of securities. Security lending income is presented in the Statement of Operations as a component of income from Fidelity Central Funds.
10. Expense Reductions.
Many of the brokers with whom FMR places trades on behalf of the Fund provided services to the Fund in addition to trade execution. These services included payments of certain expenses on behalf of the Fund totaling $160,955 for the period.
11. Distributions to Shareholders.
Distributions to shareholders of each class were as follows:
Years ended July 31, | 2010 | 2009 |
From net investment income | | |
Series Small Cap Opportunities | $ - | $ 5,991,213 |
Annual Report
Notes to Financial Statements - continued
12. Share Transactions.
Transactions for each class of shares were as follows:
| Shares | Dollars |
Years ended July 31, | 2010 | 2009 A | 2010 | 2009 A |
Series Small Cap Opportunities | | | | |
Shares sold | 23,783,608 | 29,784,876 | $ 194,753,795 | $ 160,099,974 |
Reinvestment of distributions | - | 1,140,271 | - | 5,991,213 |
Shares redeemed | (53,284,371) | (15,013,563) | (444,895,516) | (89,319,366) |
Net increase (decrease) | (29,500,763) | 15,911,584 | $ (250,141,721) | $ 76,771,821 |
Class F | | | | |
Shares sold | 21,585,308 | 28,431 | $ 180,598,380 | $ 175,553 |
Shares redeemed | (1,720,780) | (33) | (14,960,210) | (200) |
Net increase (decrease) | 19,864,528 | 28,398 | $ 165,638,170 | $ 175,353 |
A Share transactions for Class F are for the period June 26, 2009 (commencement of sale of shares) to July 31, 2009.
13. Other.
The Fund's organizational documents provide former and current trustees and officers with a limited indemnification against liabilities arising in connection with the performance of their duties to the Fund. In the normal course of business, the Fund may also enter into contracts that provide general indemnifications. The Fund's maximum exposure under these arrangements is unknown as this would be dependent on future claims that may be made against the Fund. The risk of material loss from such claims is considered remote.
At period end, mutual funds managed by FMR or an affiliate were owners of record of substantially all of the outstanding shares of the Fund.
Annual Report
To the Trustees of Fidelity Securities Fund and Shareholders of Fidelity Series Small Cap Opportunities Fund:
We have audited the accompanying statement of assets and liabilities of Fidelity Series Small Cap Opportunities Fund (the Fund), a fund of Fidelity Securities Fund, including the schedule of investments, as of July 31, 2010, and the related statement of operations for the year then ended, the statement of changes in net assets for each of the two years in the period then ended, and the financial highlights for each of the three years in the period then ended and for the period March 22, 2007 (commencement of investment operations) to July 31, 2007. These financial statements and financial highlights are the responsibility of the Fund's management. Our responsibility is to express an opinion on these financial statements and financial highlights based on our audits.
We conducted our audits in accordance with standards of the Public Company Accounting Oversight Board (United States). Those standards require that we plan and perform the audit to obtain reasonable assurance about whether the financial statements and financial highlights are free of material misstatement. The Fund is not required to have, nor were we engaged to perform, an audit of its internal control over financial reporting. Our audits included consideration of internal control over financial reporting as a basis for designing audit procedures that are appropriate in the circumstances, but not for the purpose of expressing an opinion on the effectiveness of the Fund's internal control over financial reporting. Accordingly, we express no such opinion. An audit also includes examining, on a test basis, evidence supporting the amounts and disclosures in the financial statements, assessing the accounting principles used and significant estimates made by management, as well as evaluating the overall financial statement presentation. Our procedures included confirmation of securities owned as of July 31, 2010, by correspondence with the custodians and brokers; where replies were not received from brokers, we performed other auditing procedures. We believe that our audits provide a reasonable basis for our opinion.
In our opinion, the financial statements and financial highlights referred to above present fairly, in all material respects, the financial position of Fidelity Series Small Cap Opportunities Fund as of July 31, 2010, the results of its operations for the year then ended, the changes in its net assets for each of the two years in the period then ended, and the financial highlights for each of the three years in the period then ended and for the period March 22, 2007 (commencement of investment operations) to July 31, 2007, in conformity with accounting principles generally accepted in the United States of America.
/s/ Deloitte & Touche LLP
DELOITTE & TOUCHE LLP
Boston, Massachusetts
September 20, 2010
Annual Report
The Trustees, Member of the Advisory Board, and executive officers of the trust and fund, as applicable, are listed below. The Board of Trustees governs the fund and is responsible for protecting the interests of shareholders. The Trustees are experienced executives who meet periodically throughout the year to oversee the fund's activities, review contractual arrangements with companies that provide services to the fund, oversee management of the risks associated with such activities and contractual arrangements, and review the fund's performance. Except for James C. Curvey, each of the Trustees oversees 222 funds advised by FMR or an affiliate. Mr. Curvey oversees 411 funds advised by FMR or an affiliate.
The Trustees hold office without limit in time except that (a) any Trustee may resign; (b) any Trustee may be removed by written instrument, signed by at least two-thirds of the number of Trustees prior to such removal; (c) any Trustee who requests to be retired or who has become incapacitated by illness or injury may be retired by written instrument signed by a majority of the other Trustees; and (d) any Trustee may be removed at any special meeting of shareholders by a two-thirds vote of the outstanding voting securities of the trust. Each Trustee who is not an interested person (as defined in the 1940 Act) (Independent Trustee), shall retire not later than the last day of the calendar year in which his or her 72nd birthday occurs. The Independent Trustees may waive this mandatory retirement age policy with respect to individual Trustees. The executive officers and Advisory Board Member hold office without limit in time, except that any officer and Advisory Board Member may resign or may be removed by a vote of a majority of the Trustees at any regular meeting or any special meeting of the Trustees. Except as indicated, each individual has held the office shown or other offices in the same company for the past five years.
Experience, Skills, Attributes, and Qualifications of the Fund's Trustees. The Governance and Nominating Committee has adopted a statement of policy that describes the experience, qualifications, attributes, and skills that are necessary and desirable for potential Independent Trustee candidates (Statement of Policy). The Board believes that each Trustee satisfied at the time he or she was initially elected or appointed a Trustee, and continues to satisfy, the standards contemplated by the Statement of Policy. The Governance and Nominating Committee also engages professional search firms to help identify potential Independent Trustee candidates who have the experience, qualifications, attributes, and skills consistent with the Statement of Policy. From time to time, additional criteria based on the composition and skills of the current Independent Trustees, as well as experience or skills that may be appropriate in light of future changes to board composition, business conditions, and regulatory or other developments, have also been considered by the professional search firms and the Governance and Nominating Committee. In addition, the Board takes into account the Trustees' commitment and participation in Board and committee meetings, as well as their leadership of standing and ad hoc committees throughout their tenure.
In determining that a particular Trustee was and continues to be qualified to serve as a Trustee, the Board has considered a variety of criteria, none of which, in isolation, was controlling. The Board believes that, collectively, the Trustees have balanced and diverse experience, qualifications, attributes, and skills, which allow the Board to operate effectively in governing the fund and protecting the interests of shareholders. Information about the specific experience, skills, attributes, and qualifications of each Trustee, which in each case led to the Board's conclusion that the Trustee should serve (or continue to serve) as a trustee of the fund, is provided below.
Annual Report
Trustees and Officers - continued
Board Structure and Oversight Function. Edward C. Johnson 3d is an interested person (as defined in the 1940 Act) and currently serves as Chairman. The Trustees have determined that an interested Chairman is appropriate and benefits shareholders because an interested Chairman has a personal and professional stake in the quality and continuity of services provided to the fund. Independent Trustees exercise their informed business judgment to appoint an individual of their choosing to serve as Chairman, regardless of whether the Trustee happens to be independent or a member of management. The Independent Trustees have determined that they can act independently and effectively without having an Independent Trustee serve as Chairman and that a key structural component for assuring that they are in a position to do so is for the Independent Trustees to constitute a substantial majority for the Board. The Independent Trustees also regularly meet in executive session. Ned C. Lautenbach serves as Chairman of the Independent Trustees and as such (i) acts as a liaison between the Independent Trustees and management with respect to matters important to the Independent Trustees and (ii) with management prepares agendas for Board meetings.
Fidelity funds are overseen by different Boards of Trustees. The fund's Board oversees Fidelity's equity and high income funds and another Board oversees Fidelity's investment-grade bond, money market, and asset allocation funds. The asset allocation funds may invest in Fidelity funds overseen by the fund's Board. The use of separate Boards, each with its own committee structure, allows the Trustees of each group of Fidelity funds to focus on the unique issues of the funds they oversee, including common research, investment, and operational issues. On occasion, the separate Boards establish joint committees to address issues of overlapping consequences for the Fidelity funds overseen by each Board.
The Trustees operate using a system of committees to facilitate the timely and efficient consideration of all matters of importance to the Trustees, the fund, and fund shareholders and to facilitate compliance with legal and regulatory requirements and oversight of the fund's activities and associated risks. The Board, acting through its committees, has charged FMR and its affiliates with (i) identifying events or circumstances the occurrence of which could have demonstrably adverse effects on the fund's business and/or reputation; (ii) implementing processes and controls to lessen the possibility that such events or circumstances occur or to mitigate the effects of such events or circumstances if they do occur; and (iii) creating and maintaining a system designed to evaluate continuously business and market conditions in order to facilitate the identification and implementation processes described in (i) and (ii) above. Because the day-to-day operations and activities of the fund are carried out by or through FMR, its affiliates and other service providers, the fund's exposure to risks is mitigated but not eliminated by the processes overseen by the Trustees. While each of the Board's committees has responsibility for overseeing different aspects of the fund's activities, oversight is exercised primarily through the Operations, Audit, and Compliance Committees. Appropriate personnel, including but not limited to the fund's Chief Compliance Officer (CCO), FMR's internal auditor, the independent accountants, the fund's Treasurer and portfolio management personnel, make periodic reports to the Board's committees, as appropriate. The responsibilities of each committee, including their oversight responsibilities, are described further under "Standing Committees of the Fund's Trustees."
Annual Report
The fund's Statement of Additional Information (SAI) includes more information about the Trustees. To request a free copy, call Fidelity at 1-800-544-8544 for Series Small Cap Opportunities Fund or 1-800-835-5092 for Class F.
Interested Trustees*:
Correspondence intended for each Trustee who is an interested person may be sent to Fidelity Investments, 82 Devonshire Street, Boston, Massachusetts 02109.
Name, Age; Principal Occupations and Other Relevant Experience+ |
Edward C. Johnson 3d (80) |
| Year of Election or Appointment: 1984 Mr. Johnson is Trustee and Chairman of the Board of Trustees of certain Trusts. Mr. Johnson serves as Chief Executive Officer, Chairman, and a Director of FMR LLC; Chairman and a Director of FMR; Chairman and a Director of Fidelity Research & Analysis Company (FRAC); Chairman and a Director of Fidelity Investments Money Management, Inc.; and Chairman and a Director of FMR Co., Inc. In addition, Mr. Johnson serves as Chairman and Director of FIL Limited. Previously, Mr. Johnson served as President of FMR LLC (2006-2007). |
James C. Curvey (75) |
| Year of Election or Appointment: 2007 Mr. Curvey also serves as Trustee (2007-present) of other investment companies advised by FMR. Mr. Curvey is a Director of FMR and FMR Co., Inc. (2007-present). Mr. Curvey is also Vice Chairman (2006-present) and Director of FMR LLC. In addition, Mr. Curvey serves as an Overseer for the Boston Symphony Orchestra and a member of the Trustees of Villanova University. |
* Trustees have been determined to be "Interested Trustees" by virtue of, among other things, their affiliation with the trust or various entities under common control with FMR.
+ The information above includes each Trustee's principal occupation during the last five years and other information relating to the experience, attributes, and skills relevant to each Trustee's qualifications to serve as a Trustee, which led to the conclusion that each Trustee should serve as a Trustee for the fund.
Annual Report
Trustees and Officers - continued
Independent Trustees:
Correspondence intended for each Independent Trustee (that is, the Trustees other than the Interested Trustees) may be sent to Fidelity Investments, P.O. Box 55235, Boston, Massachusetts 02205-5235.
Name, Age; Principal Occupations and Other Relevant Experience+ |
Dennis J. Dirks (62) |
| Year of Election or Appointment: 2005 Prior to his retirement in May 2003, Mr. Dirks was Chief Operating Officer and a member of the Board of The Depository Trust & Clearing Corporation (DTCC). He also served as President, Chief Operating Officer, and Board member of The Depository Trust Company (DTC) and President and Board member of the National Securities Clearing Corporation (NSCC). In addition, Mr. Dirks served as Chief Executive Officer and Board member of the Government Securities Clearing Corporation, Chief Executive Officer and Board member of the Mortgage-Backed Securities Clearing Corporation, as a Trustee and a member of the Finance Committee of Manhattan College (2005-2008), and as a Trustee and a member of the Finance Committee of AHRC of Nassau County (2006-2008). Currently, Mr. Dirks serves as a member of the Board of Directors for The Brookville Center for Children's Services, Inc. (2009-present). |
Alan J. Lacy (56) |
| Year of Election or Appointment: 2008 Mr. Lacy serves as Senior Adviser (2007-present) of Oak Hill Capital Partners, L.P. (private equity). Mr. Lacy also served as Chief Executive Officer (2000-2005) and Vice Chairman (2005-2006) of Sears Holdings Corporation and Sears, Roebuck and Co. (retail). In addition, Mr. Lacy serves as a member of the Board of Directors of The Western Union Company (global money transfer, 2006-present) and Bristol-Myers Squibb Company (global pharmaceuticals, 2007-present). Mr. Lacy is Chairman (2008-present) and a member (2006-present) of the Board of Trustees of The National Parks Conservation Association. |
Ned C. Lautenbach (66) |
| Year of Election or Appointment: 2000 Mr. Lautenbach is Chairman of the Independent Trustees of the Equity and High Income Funds (2006-present). Mr. Lautenbach is an Advisory Partner of Clayton, Dubilier & Rice, Inc. (private equity investment, 2008-present) and was previously a Partner of Clayton, Dubilier & Rice, Inc. (1998-2008). Previously, Mr. Lautenbach was with the International Business Machines Corporation (IBM) from 1968 until his retirement in 1998. Mr. Lautenbach serves as a Director of Eaton Corporation (diversified industrial) as well as the Philharmonic Center for the Arts in Naples, Florida. Mr. Lautenbach is also a member of the Board of Trustees of Fairfield University (2005-present), as well as a member of the Council on Foreign Relations. Previously, Mr. Lautenbach served as a Director of Sony Corporation (2006-2007). |
Joseph Mauriello (65) |
| Year of Election or Appointment: 2008 Prior to his retirement in January 2006, Mr. Mauriello served in numerous senior management positions including Deputy Chairman and Chief Operating Officer (2004-2005), and Vice Chairman of Financial Services (2002-2004) of KPMG LLP US (professional services, 1965-2005). Mr. Mauriello currently serves as a member of the Board of Directors of XL Capital Ltd. (global insurance and re-insurance, 2006-present) and of Arcadia Resources Inc. (health care services and products, 2007-present). Previously, Mr. Mauriello served as a Director of the Hamilton Funds of the Bank of New York (2006-2007). |
Cornelia M. Small (66) |
| Year of Election or Appointment: 2005 Ms. Small is a member of the Board of Directors of the Teagle Foundation (2009-present). Ms. Small is also a member of the Investment Committee, and Chair (2008-present) and a member of the Board of Trustees of Smith College. In addition, Ms. Small serves on the Investment Committee of the Berkshire Taconic Community Foundation (2008-present). Previously, Ms. Small served as Chairperson of the Investment Committee (2002-2008) of Smith College. In addition, Ms. Small served as Chief Investment Officer, Director of Global Equity Investments, and a member of the Board of Directors of Scudder, Stevens & Clark and Scudder Kemper Investments. |
William S. Stavropoulos (71) |
| Year of Election or Appointment: 2002 Mr. Stavropoulos is Vice Chairman of the Independent Trustees of the Equity and High Income Funds (2006-present). Mr. Stavropoulos serves as President and Founder of the Michigan Baseball Foundation, the Great Lakes Loons (2007-present). Mr. Stavropoulos is Chairman Emeritus of the Board of Directors of The Dow Chemical Company, where he previously served in numerous senior management positions, including President, CEO (1995-2000; 2002-2004), Chairman of the Executive Committee (2000-2006), and as a member of the Board of Directors (1990-2006). Currently, Mr. Stavropoulos is a Director of Teradata Corporation (data warehousing and technology solutions, 2008-present), Chemical Financial Corporation, Maersk Inc. (industrial conglomerate), Tyco International, Inc. (multinational manufacturing and services, 2007-present), and a member of the Advisory Board for Metalmark Capital (private equity investment, 2005-present). Mr. Stavropoulos is a special advisor to Clayton, Dubilier & Rice, Inc. (private equity investment). In addition, Mr. Stavropoulos is a member of the University of Notre Dame Advisory Council for the College of Science. |
David M. Thomas (61) |
| Year of Election or Appointment: 2008 Previously, Mr. Thomas served as Executive Chairman (2005-2006) and Chairman and Chief Executive Officer (2000-2005) of IMS Health, Inc. (pharmaceutical and healthcare information solutions). In addition, Mr. Thomas serves as a member of the Board of Directors of Fortune Brands, Inc. (consumer products), and Interpublic Group of Companies, Inc. (marketing communication, 2004-present). |
Michael E. Wiley (59) |
| Year of Election or Appointment: 2008 Mr. Wiley also serves as a Director of Asia Pacific Exploration Consolidated (international oil and gas exploration and production, 2008-present), and as a member of the Board of Trustees of the University of Tulsa (2000-2006; 2007-present). Mr. Wiley serves as a Director of Tesoro Corporation (independent oil refiner and marketer, 2005-present), and a Director of Bill Barrett Corporation (exploration and production, 2005-present). In addition, Mr. Wiley also serves as a Director of Post Oak Bank (privately-held bank, 2004-present). Previously, Mr. Wiley served as a Sr. Energy Advisor of Katzenbach Partners, LLC (consulting, 2006-2007), as an Advisory Director of Riverstone Holdings (private investment), Chairman, President, and CEO of Baker Hughes, Inc. (oilfield services, 2000-2004), and as Director of Spinnaker Exploration Company (exploration and production, 2001-2005). |
Annual Report
+ The information above includes each Trustee's principal occupation during the last five years and other information relating to the experience, attributes, and skills relevant to each Trustee's qualifications to serve as a Trustee, which led to the conclusion that each Trustee should serve as a Trustee for the fund.
Advisory Board Member and Executive Officers:
Correspondence intended for each executive officer and Peter S. Lynch may be sent to Fidelity Investments, 82 Devonshire Street, Boston, Massachusetts 02109.
Name, Age; Principal Occupation |
Peter S. Lynch (66) |
| Year of Election or Appointment: 2003 Member of the Advisory Board of Fidelity's Equity and High Income Funds. Mr. Lynch is Vice Chairman and a Director of FMR and FMR Co., Inc. In addition, Mr. Lynch serves as a Trustee of Boston College and as the Chairman of the Inner-City Scholarship Fund. Previously, Mr. Lynch served on the Special Olympics International Board of Directors (1997-2006). |
Kenneth B. Robins (40) |
| Year of Election or Appointment: 2008 President and Treasurer of Fidelity's Equity and High Income Funds. Mr. Robins also serves as President and Treasurer (2010-present) and Assistant Treasurer (2009-present) of other Fidelity funds and is an employee of Fidelity Investments (2004-present). Previously, Mr. Robins served as Deputy Treasurer of the Fidelity funds (2005-2008) and Treasurer and Chief Financial Officer of The North Carolina Capital Management Trust: Cash and Term Portfolios (2006-2008). |
Brian B. Hogan (45) |
| Year of Election or Appointment: 2009 Vice President of certain Equity Funds and Vice President of Sector Funds. Mr. Hogan also serves as Senior Vice President, Equity Research of FMR (2006-present) and President of FMR's Equity Division (2009-present). Previously, Mr. Hogan served as a portfolio manager. |
Thomas C. Hense (46) |
| Year of Election or Appointment: 2008 or 2010 Vice President of Fidelity's High Income (2008), Small Cap (2008), and Value (2010) Funds. Previously, Mr. Hense served as a portfolio manager for Fidelity's Institutional Money Management Group (Pyramis) (2003-2008). |
Scott C. Goebel (42) |
| Year of Election or Appointment: 2008 Secretary and Chief Legal Officer (CLO) of the Fidelity funds. Mr. Goebel also serves as General Counsel, Secretary, and Senior Vice President of FMR (2008-present) and FMR Co., Inc. (2008-present); Deputy General Counsel of FMR LLC; Chief Legal Officer of Fidelity Management & Research (Hong Kong) Limited (2008-present) and Assistant Secretary of Fidelity Management & Research (Japan) Inc. (2008-present), Fidelity Investments Money Management, Inc. (2008-present), Fidelity Management & Research (U.K.) Inc. (2008-present), and Fidelity Research and Analysis Company (2008-present). Previously, Mr. Goebel served as Assistant Secretary of the Funds (2007-2008) and as Vice President and Secretary of Fidelity Distributors Corporation (FDC) (2005-2007). |
William C. Coffey (41) |
| Year of Election or Appointment: 2009 Assistant Secretary of Fidelity's Equity and High Income Funds. Mr. Coffey also serves as Senior Vice President and Deputy General Counsel of FMR LLC (2010-present), and is an employee of Fidelity Investments. Previously, Mr. Coffey served as Vice President and Associate General Counsel of FMR LLC (2005-2009). |
Holly C. Laurent (56) |
| Year of Election or Appointment: 2008 Anti-Money Laundering (AML) Officer of the Fidelity funds. Ms. Laurent is an employee of Fidelity Investments. Previously, Ms. Laurent was Senior Vice President and Head of Legal for Fidelity Business Services India Pvt. Ltd. (2006-2008), and Senior Vice President, Deputy General Counsel and Group Head for FMR LLC (2005-2006). |
Christine Reynolds (51) |
| Year of Election or Appointment: 2008 Chief Financial Officer of the Fidelity funds. Ms. Reynolds became President of Fidelity Pricing and Cash Management Services (FPCMS) in August 2008. Ms. Reynolds served as Chief Operating Officer of FPCMS (2007-2008). Previously, Ms. Reynolds served as President, Treasurer, and Anti-Money Laundering officer of the Fidelity funds (2004-2007). |
Kenneth A. Rathgeber (63) |
| Year of Election or Appointment: 2004 Chief Compliance Officer of Fidelity's Equity and High Income Funds. Mr. Rathgeber is Chief Compliance Officer of Fidelity Management & Research (Hong Kong) Limited (2008-present), Fidelity Management & Research (Japan) Inc. (2008-present), FMR (2005-present), FMR Co., Inc. (2005-present), Fidelity Management & Research (U.K.) Inc. (2005-present), Fidelity Research & Analysis Company (2005-present), Fidelity Investments Money Management, Inc. (2005-present), Pyramis Global Advisors, LLC (2005-present), and Strategic Advisers, Inc. (2005-present). |
Jeffrey S. Christian (48) |
| Year of Election or Appointment: 2009 Deputy Treasurer of the Fidelity funds. Mr. Christian is an employee of Fidelity Investments. Previously, Mr. Christian served as Chief Financial Officer (2008-2009) of certain Fidelity funds and Senior Vice President of Fidelity Pricing and Cash Management Services (FPCMS) (2004-2009). |
Bryan A. Mehrmann (49) |
| Year of Election or Appointment: 2005 Deputy Treasurer of the Fidelity funds. Mr. Mehrmann is an employee of Fidelity Investments. |
Adrien E. Deberghes (42) |
| Year of Election or Appointment: 2008 Deputy Treasurer of Fidelity's Equity and High Income Funds. Mr. Deberghes also serves as Assistant Treasurer of other Fidelity funds (2010-present) and is an employee of Fidelity Investments (2008-present). Previously, Mr. Deberghes served as Senior Vice President of Mutual Fund Administration at State Street Corporation (2007-2008), Senior Director of Mutual Fund Administration at Investors Bank & Trust (2005-2007), and Director of Finance for Dunkin' Brands (2000-2005). |
Stephanie J. Dorsey (41) |
| Year of Election or Appointment: 2010 Assistant Treasurer of Fidelity's Equity and High Income Funds. Ms. Dorsey also serves as Deputy Treasurer of other Fidelity funds (2008-present) and is an employee of Fidelity Investments (2008-present). Previously, Ms. Dorsey served as Treasurer (2004-2008) of the JPMorgan Mutual Funds and Vice President (2004-2008) of JPMorgan Chase Bank. |
Name, Age; Principal Occupation |
John R. Hebble (52) |
| Year of Election or Appointment: 2009 Assistant Treasurer of Fidelity's Equity and High Income Funds. Mr. Hebble also serves as Treasurer and Chief Financial Officer of The North Carolina Capital Management Trust: Cash and Term Portfolio (2008-present), President and Treasurer of other Fidelity funds (2008-present) and is an employee of Fidelity Investments. |
Gary W. Ryan (51) |
| Year of Election or Appointment: 2005 Assistant Treasurer of the Fidelity funds. Mr. Ryan is an employee of Fidelity Investments. Previously, Mr. Ryan served as Vice President of Fund Reporting in Fidelity Pricing and Cash Management Services (FPCMS) (1999-2005). |
Annual Report
Board Approval of Investment Advisory Contracts and Management Fees
Fidelity Series Small Cap Opportunities Fund
Each year, the Board of Trustees, including the Independent Trustees (together, the Board), votes on the renewal of the management contract and sub-advisory agreements (together, the Advisory Contracts) for the fund. The Board, assisted by the advice of fund counsel and Independent Trustees' counsel, requests and considers a broad range of information relevant to the renewal of the Advisory Contracts throughout the year.
The Board meets regularly and considers at each of its meetings factors that are relevant to its annual consideration of the renewal of the fund's Advisory Contracts, including the services and support provided to the fund and its shareholders. The Board has established various standing committees, each composed of Independent Trustees with varying backgrounds, to which the Board has assigned specific subject matter responsibilities in order to enhance effective decision-making by the Board. The Board, acting directly and through its Committees, requests and receives information concerning the annual consideration of the renewal of the fund's Advisory Contracts. The Board also meets as needed to consider matters specifically related to the Board's annual consideration of the renewal of Advisory Contracts. Members of the Board may also meet with trustees of other Fidelity funds through ad hoc joint committees to discuss certain matters relevant to the Fidelity funds.
At its July 2010 meeting, the Board of Trustees, including the Independent Trustees, unanimously determined to renew the fund's Advisory Contracts. In reaching its determination, the Board considered all factors it believed relevant, including (i) the nature, extent, and quality of the services to be provided to the fund and its shareholders (including the investment performance of the fund); (ii) the competitiveness of the fund's management fee and total expenses; (iii) the total costs of the services to be provided by and the profits to be realized by Fidelity from its relationship with the fund; (iv) the extent to which economies of scale would be realized as the fund grows; and (v) whether fee levels reflect these economies of scale, if any, for the benefit of fund shareholders.
In considering whether to renew the Advisory Contracts for the fund, the Board reached a determination, with the assistance of fund counsel and Independent Trustees' counsel and through the exercise of its business judgment, that the renewal of the Advisory Contracts is in the best interests of fund shareholders and that the compensation to be received by Fidelity under the management contract is fair and reasonable. The Board's decision to renew the Advisory Contracts was not based on any single factor noted above, but rather was based on a comprehensive consideration of all the information provided to the Board at its meetings throughout the year. The Board, in reaching its determination to renew the Advisory Contracts, is aware that shareholders in the fund have a broad range of investment choices available to them, including a wide choice among mutual funds offered by Fidelity's competitors, and that the fund's shareholders, with the opportunity to review and weigh the disclosure provided by the fund in its prospectus and other public disclosures, have chosen to invest in this fund, managed by Fidelity.
Annual Report
Board Approval of Investment Advisory Contracts and
Management Fees - continued
Nature, Extent, and Quality of Services Provided. The Board considered the staffing within the investment adviser, FMR, and the sub-advisers (together, the Investment Advisers), including the backgrounds of the fund's investment personnel and the fund's investment objective and discipline. The Independent Trustees also had discussions with senior management of Fidelity's investment operations and investment groups. The Board considered the structure of the portfolio manager compensation program and whether this structure provides appropriate incentives to act in the best interest of the fund.
Resources Dedicated to Investment Management and Support Services. The Board and the equity research subcommittee of the Board's Fund Oversight Committee reviewed the size, education, and experience of the Investment Advisers' investment staff, their use of technology, and the Investment Advisers' approach to recruiting, training, and retaining portfolio managers and other research, advisory, and management personnel. The Board noted that Fidelity's analysts have access to a variety of technological tools and market and securities data that enable them to perform both fundamental and quantitative analysis and to specialize in various disciplines. The Board considered Fidelity's extensive global research capabilities that enable the Investment Advisers to aggregate data from various sources in an effort to produce positive investment results. The Board also considered that Fidelity's portfolio managers and analysts have access to daily portfolio attribution that allows for monitoring of a fund's portfolio, as well as an electronic communication system that provides immediate real-time access to research concerning issuers and credit enhancers. The Board noted FMR's continued focus on strengthening the organization and discipline of equity portfolio management and research.
Shareholder and Administrative Services. The Board considered (i) the nature, extent, quality, and cost of advisory, administrative, and shareholder services performed by the Investment Advisers and their affiliates under the Advisory Contracts and under separate agreements covering transfer agency, pricing and bookkeeping, and securities lending services for the fund; (ii) the nature and extent of the investment adviser's supervision of third party service providers, principally custodians and subcustodians; and (iii) the resources devoted to, and the record of compliance with, the fund's compliance policies and procedures. The Board also reviewed the allocation of fund brokerage, including allocations to brokers affiliated with the Investment Advisers, the use of brokerage commissions to pay fund expenses, and the use of "soft" commission dollars to pay for research services.
The Board noted that the growth of fund assets over time across the complex allows Fidelity to reinvest in the development of services designed to enhance the value or convenience of the Fidelity funds as investment vehicles. These services include 24-hour access to account information and market information through phone representatives and over the Internet, and investor education materials and asset allocation tools.
Annual Report
Investment in a Large Fund Family. The Board considered the benefits to shareholders of investing in a Fidelity fund, including the benefits of investing in a fund that is part of a large family of funds offering a variety of investment disciplines and providing a large variety of mutual fund investor services. The Board noted that Fidelity had taken, or had made recommendations that resulted in the Fidelity funds taking, a number of actions over the previous year that benefited particular funds, including (i) dedicating additional resources to investment research and restructuring and broadening the focus of the investment research teams; (ii) bolstering the senior management team that oversees asset management; (iii) launching Class F of certain funds as a lower-fee class available to Freedom K and Freedom Index Funds; (iv) lowering the initial investment minimums and ongoing balance requirements for Real Estate High Income Fund; (v) eliminating subsequent purchase minimums for all funds and adding a waiver of the investment minimum requirement for new accounts opened with the proceeds of a systematic withdrawal plan; (vi) eliminating the withdrawal minimum and maximum limits for systematic withdrawals from Advisor funds; (vii) expanding sales load waivers on Class A shares for Destiny Planholders and expanding Institutional Class eligibility for Class O Destiny Planholders; and (viii) changing certain Class A and Class T sales charge structures to further align them with industry practices.
Investment Performance. The Board considered whether the fund has operated in accordance with its investment objective, as well as its record of compliance with its investment restrictions. It also reviewed the fund's absolute investment performance for the retail class, as well as the fund's relative investment performance for the retail class measured against (i) a broad-based securities market index, and (ii) a peer group of mutual funds deemed appropriate by Fidelity and reviewed by the Board. Because the fund had been in existence less than three calendar years, the following chart considered by the Board shows, for the one-year period ended December 31, 2009, the total return of the retail class of the fund, the total return of a broad-based securities market index ("benchmark"), and a range of total returns of a peer group of mutual funds identified by Morningstar, Inc. as having an investment style similar to that of the fund based on underlying portfolio holdings. (Class F of the fund had less than one year of performance as of December 31, 2009.) The box within the chart shows the 25th percentile return (bottom of box) and the 75th percentile return (top of box) of the peer group. Returns shown above the box are in the first quartile and returns shown below the box are in the fourth quartile. The percentage beaten number noted below the chart corresponds to the percentile box and represents the percentage of funds in the peer group whose performance was equal to or lower than that of the retail class of the fund.
Annual Report
Board Approval of Investment Advisory Contracts and
Management Fees - continued
Fidelity Series Small Cap Opportunities Fund
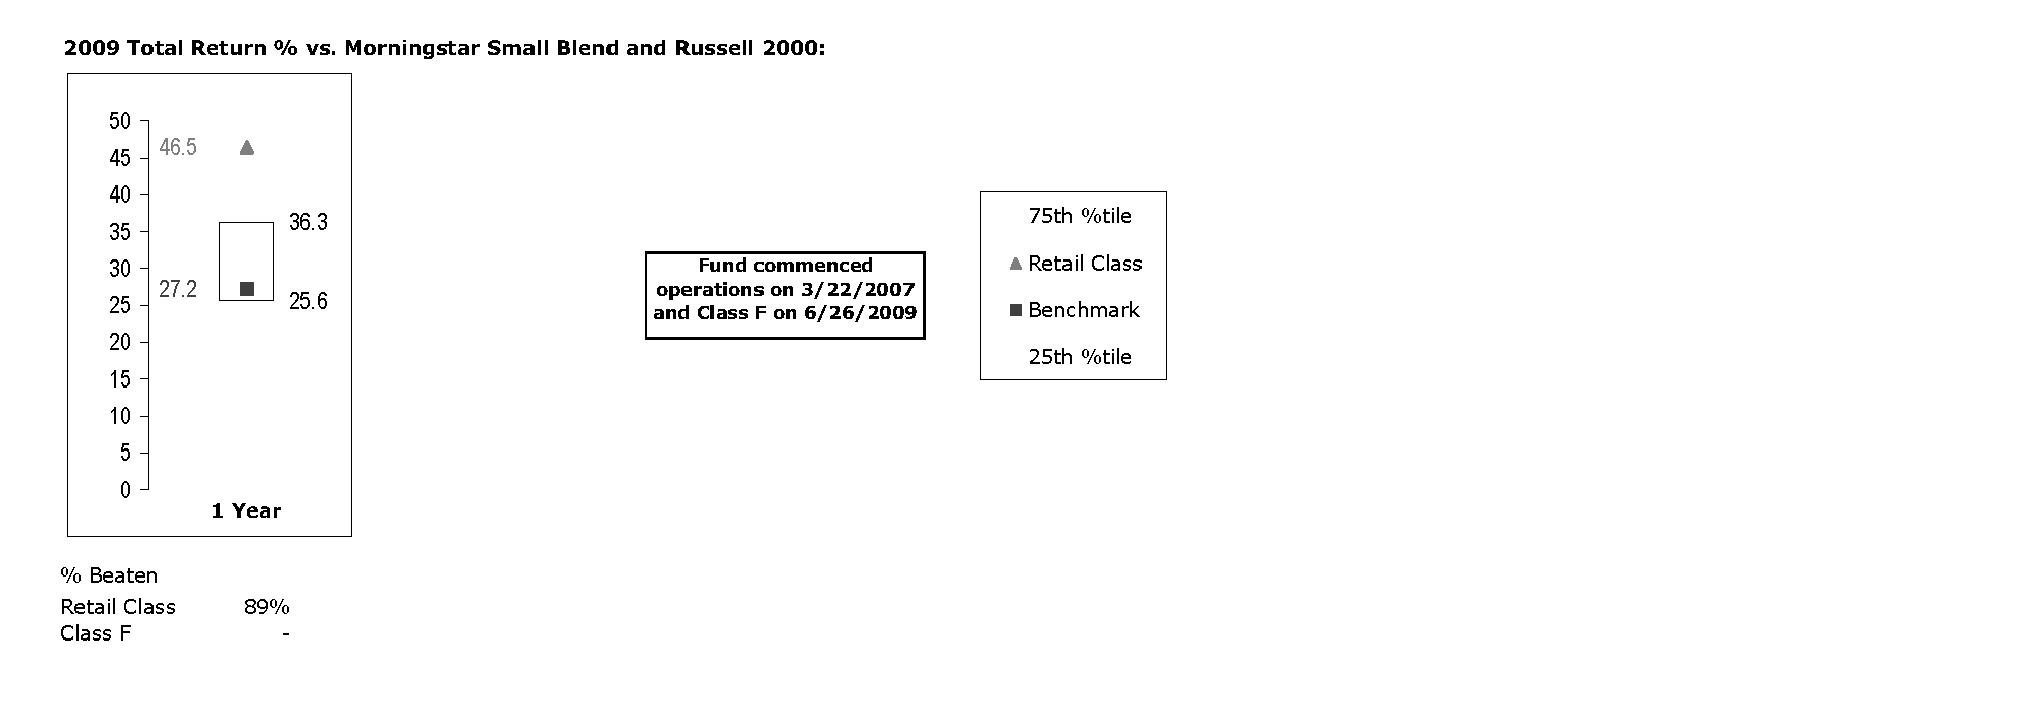
The Board reviewed the fund's relative investment performance against its peer group and noted that the performance of the retail class of the fund was in the first quartile for the period shown. The Board also noted that the investment performance of the retail class of the fund compared favorably to its benchmark for the period shown. The Board also reviewed the fund's performance since inception as well as performance in the current year. The Board noted that it is difficult to evaluate in any comprehensive fashion the performance of the fund, in light of its relatively recent commencement of operations.
The Board also considered that the fund's management fee is subject to upward or downward adjustment depending upon whether, and to what extent, the fund's investment performance for the performance period exceeds, or is exceeded by, the record (over the same period) of a Board-approved performance adjustment index. The Board realizes that the performance adjustment provides FMR with a strong economic incentive to seek to achieve superior performance for the fund's shareholders and helps to more closely align the interests of FMR and the fund's shareholders.
Based on its review, and giving particular weight to the nature and quality of the resources dedicated by the Investment Advisers to maintain and improve relative performance and factoring in the unprecedented market events in recent years, the Board concluded that the nature, extent, and quality of investment management and support services and of shareholder and administrative services provided to the fund will benefit the fund's shareholders, particularly in light of the Board's view that the fund's shareholders benefit from investing in a fund that is part of a large family of funds offering a variety of investment disciplines and services.
Annual Report
Competitiveness of Management Fee and Total Fund Expenses. The Board considered the fund's management fee and total expenses compared to "mapped groups" of competitive funds and classes. Fidelity creates "mapped groups" by combining similar Lipper investment objective categories that have comparable management fee characteristics. Combining Lipper investment objective categories aids the Board's management fee and total expense comparisons by broadening the competitive group used for comparison and by reducing the number of universes to which various Fidelity funds are compared.
Management Fee. The Board considered two proprietary management fee comparisons for the 12-month (or shorter) periods shown in the chart below. The group of Lipper funds used by the Board for management fee comparisons is referred to below as the "Total Mapped Group." The Total Mapped Group comparison focuses on a fund's standing relative to the total universe of comparable funds available to investors, in terms of gross management fees before expense reimbursements or caps, and without giving effect to the fund's performance adjustment. "TMG %" represents the percentage of funds in the Total Mapped Group that had management fees that were lower than the fund's. For example, a TMG % of 13% means that 87% of the funds in the Total Mapped Group had higher management fees than the fund. The "Asset-Size Peer Group" (ASPG) comparison focuses on a fund's standing relative to non-Fidelity funds similar in size to the fund within the Total Mapped Group. The ASPG represents at least 15% of the funds in the Total Mapped Group with comparable asset size and management fee characteristics, subject to a minimum of 50 funds (or all funds in the Total Mapped Group if fewer than 50). Additional information, such as the ASPG quartile in which the fund's management fee ranked and the impact of the fund's performance adjustment, is also included in the chart and considered by the Board.
Annual Report
Board Approval of Investment Advisory Contracts and
Management Fees - continued
Fidelity Series Small Cap Opportunities Fund
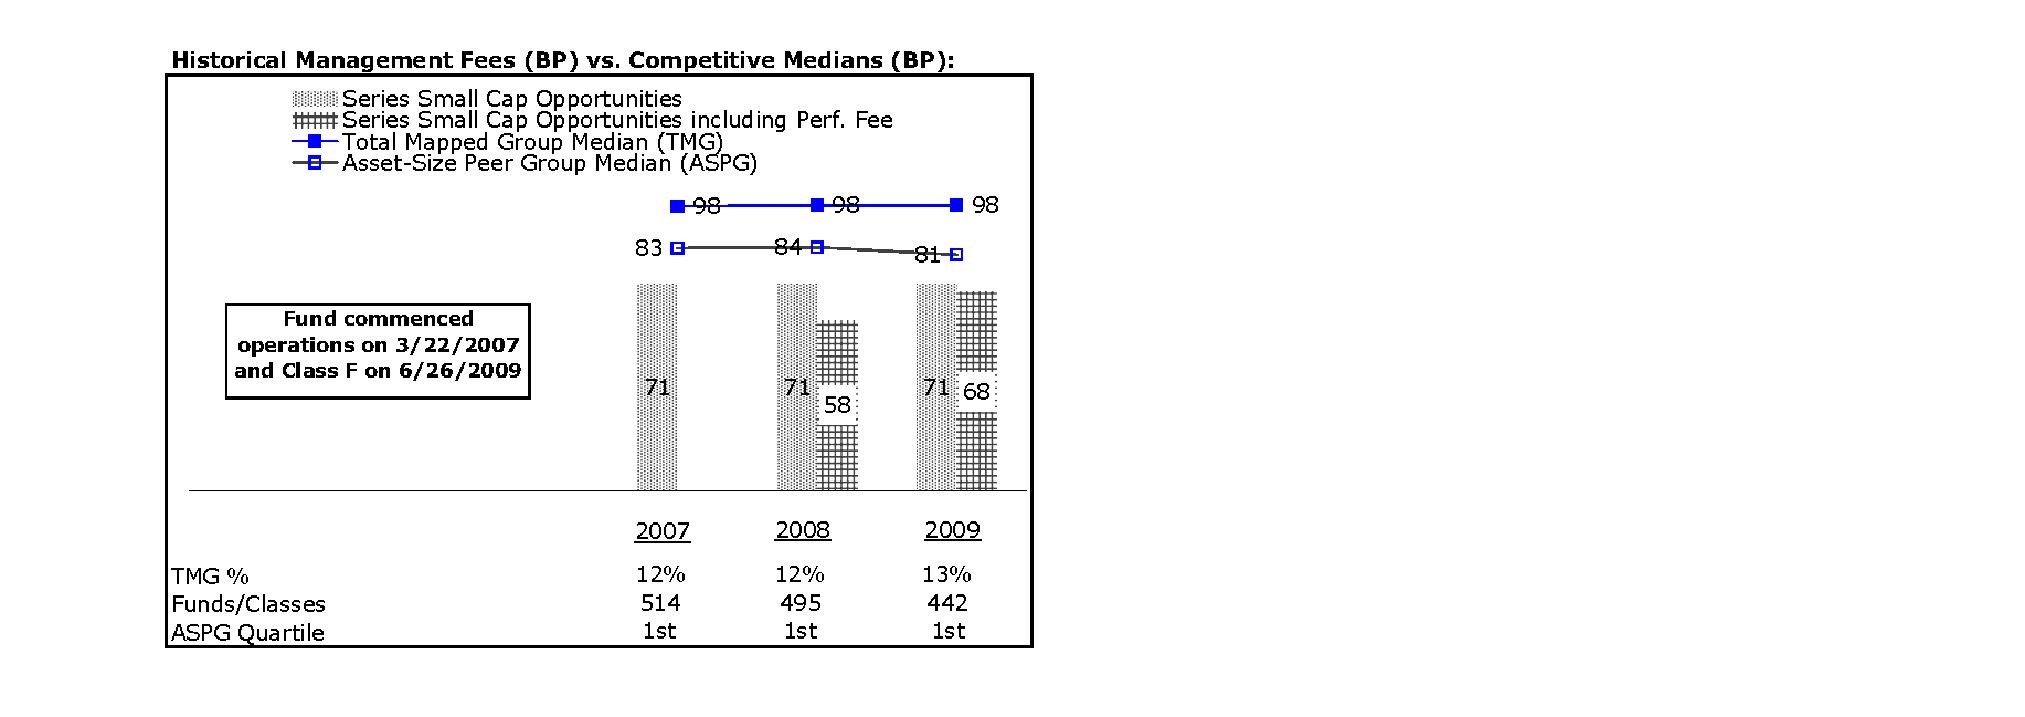
The Board noted that the fund's management fee ranked below the median of its Total Mapped Group and below the median of its ASPG for 2009. The Board also noted the effect of the fund's negative performance adjustment on the fund's management fee ranking. The Board noted that the performance adjustment for each year represents calculations for performance periods that differ from the period shown in the performance chart above.
Based on its review, the Board concluded that the fund's management fee is fair and reasonable in light of the services that the fund receives and the other factors considered.
Total Expenses. In its review of each class's total expenses, the Board considered the fund's management fee as well as other fund or class expenses, as applicable, such as transfer agent fees, pricing and bookkeeping fees, and custodial, legal, and audit fees. The Board also noted the effects of any waivers and reimbursements on fees and expenses, as well as the impact of the fund's performance adjustment. As part of its review, the Board also considered current and historical total expenses of each class of the fund compared to competitive fund median expenses. Each class of the fund is compared to those funds and classes in the Total Mapped Group (used by the Board for management fee comparisons) that have a similar sales load structure.
The Board noted that the total expenses of each class ranked below its competitive median for the period.
Annual Report
Fees Charged to Other Fidelity Clients. The Board also considered Fidelity fee structures and other information with respect to clients of FMR and its affiliates, such as other mutual funds advised or subadvised by FMR or its affiliates, pension plan clients, and other institutional clients. In March 2010, the Board created an ad hoc joint committee with the board of other Fidelity funds (the Committee) to review and compare Fidelity's institutional investment advisory business with its business of providing services to the Fidelity funds, including the differences in services provided, fees charged, and costs incurred, as well as competition in their respective marketplaces.
Based on its review of total expenses and fees charged to other Fidelity clients, the Board concluded that the total expenses of each class of the fund were reasonable in light of the services that the fund and its shareholders receive and the other factors considered, including the findings of the Committee.
Costs of the Services and Profitability. The Board considered the revenues earned and the expenses incurred by Fidelity in conducting the business of developing, marketing, distributing, managing, administering and servicing the fund and its shareholders. The Board also considered the level of Fidelity's profits in respect of all the Fidelity funds.
On an annual basis, FMR presents to the Board Fidelity's profitability for the fund. Fidelity calculates the profitability for each fund, as well as aggregate profitability for groups of Fidelity funds and all Fidelity funds, using a series of detailed revenue and cost allocation methodologies which originate with the audited books and records of Fidelity. The Audit Committee of the Board reviews any significant changes from the prior year's methodologies.
PricewaterhouseCoopers LLP (PwC), independent registered public accounting firm and auditor to Fidelity and certain Fidelity funds, has been engaged annually by the Board as part of the Board's assessment of Fidelity's profitability analysis. PwC's engagement includes the review and assessment of Fidelity's methodologies used in determining the revenues and expenses attributable to Fidelity's mutual fund business, and completion of agreed-upon procedures surrounding the mathematical accuracy of fund profitability and its conformity to allocation methodologies. After considering PwC's reports issued under the engagement and information provided by Fidelity, the Board believes that while other allocation methods may also be reasonable, Fidelity's profitability methodologies are reasonable in all material respects.
The Board has also reviewed Fidelity's non-fund businesses and fall-out benefits related to the mutual fund business as well as cases where Fidelity's affiliates may benefit from or be related to the fund's business.
The Board considered the costs of the services provided by and the profits realized by Fidelity in connection with the operation of the fund and were satisfied that the profitability was not excessive in the circumstances.
Annual Report
Board Approval of Investment Advisory Contracts and
Management Fees - continued
Economies of Scale. The Board considered whether there have been economies of scale in respect of the management of the Fidelity funds, whether the Fidelity funds (including the fund) have appropriately benefited from any such economies of scale, and whether there is potential for realization of any further economies of scale. The Board considered the extent to which the fund will benefit from economies of scale through increased services to the fund, through waivers or reimbursements, or through fee or expense reductions.
In February 2009, the Board and the board of other Fidelity funds created an ad hoc committee (the Economies of Scale Committee) to analyze whether FMR attains economies of scale in respect of the management and servicing of the Fidelity funds, whether the Fidelity funds have appropriately benefited from such economies of scale, and whether there is potential for realization of any further economies of scale.
The Board recognized that the fund's management contract incorporates a "group fee" structure, which provides for lower group fee rates as total fund assets under FMR's management increase, and for higher group fee rates as total fund assets under FMR's management decrease. FMR calculates the group fee rates based on a tiered asset "breakpoint" schedule that varies based on asset class. The Board considered that the group fee is designed to deliver the benefits of economies of scale to fund shareholders when total Fidelity fund assets increase, even if assets of any particular fund are unchanged or have declined, because some portion of Fidelity's costs are attributable to services provided to all Fidelity funds, and all funds benefit if those costs can be allocated among more assets. The Board also considered that although the fund is offered only to other funds advised by FMR or an affiliate, it continues to incur management expenses. The Board further noted that the fund may continue to realize benefits from the group fee structure, even though assets may not be expected to grow significantly at the fund level. The Board concluded that, given the group fee structure, fund shareholders will benefit from lower management fees as assets under FMR's management increase at the fund complex level, regardless of whether Fidelity achieves any such economies of scale.
The Board concluded, considering the findings of the Economies of Scale Committee, that any potential economies of scale are being appropriately shared between fund shareholders and Fidelity.
Additional Information Requested by the Board. In order to develop fully the factual basis for consideration of the Fidelity funds' Advisory Contracts, the Board requested and received additional information on certain topics, including (i) fund performance trends, actions to be taken by FMR to improve certain funds' overall performance, and Fidelity's long-term strategies for certain funds; (ii) portfolio manager changes that have occurred during the past year and length of portfolio manager tenure for different categories of funds over time; (iii) Fidelity's compensation structure for portfolio managers, research analysts, and other key personnel, the rationale for the compensation structure, and how the compensation structure provides appropriate performance incentives; (iv) the amount of the investment that each portfolio manager has made in the Fidelity fund(s) that he or she manages; (v) management and other fees paid by FMR to affiliated sub-advisers on behalf of the Fidelity funds; (vi) Fidelity's fee structures and rationale for recommending different fees among different categories of funds; (vii) Fidelity's rationale for recommending which funds should have a performance adjustment component as part of their management fees; (viii) the rationale for any differences between fund fee structures and fee structures in place for other Fidelity clients; and (ix) explanations regarding the relative total expenses borne by certain funds and classes, total expense competitive trends, and actions that might be taken by FMR to reduce total expenses for certain funds and classes.
Annual Report
Based on its evaluation of all of the conclusions noted above, and after considering all factors it believed relevant, the Board ultimately concluded that the advisory fee structures are fair and reasonable, and that the fund's Advisory Contracts should be renewed.
Annual Report
Investment Adviser
Fidelity Management & Research Company
Boston, MA
Investment Sub-Advisers
FMR Co., Inc.
Fidelity Management & Research (U.K.) Inc.
Fidelity Research & Analysis Company
FIL Investments (Japan) Limited
FIL Investment Advisors
FIL Investment Advisors (U.K.) Ltd.
Fidelity Management & Research
(Hong Kong) Limited
Fidelity Management & Research
(Japan) Inc.
General Distributor
Fidelity Distributors Corporation
Boston, MA
Transfer and Service Agents
Fidelity Investments Institutional Operations Company, Inc.
Boston, MA
Fidelity Service Company, Inc.
Boston, MA
Custodian
Citibank, N.A.
New York, NY
SMO-ANN-0910
1.839807.103

Fidelity®
Small Cap Growth
Fund
Annual Report
July 31, 2010
(2_fidelity_logos) (Registered_Trademark)
Contents
Chairman's Message | <Click Here> | The Chairman's message to shareholders. |
Performance | <Click Here> | How the fund has done over time. |
Management's Discussion of Fund Performance | <Click Here> | The Portfolio Manager's review of fund performance and strategy. |
Shareholder Expense Example | <Click Here> | An example of shareholder expenses. |
Investment Changes | <Click Here> | A summary of major shifts in the fund's investments over the past six months. |
Investments | <Click Here> | A complete list of the fund's investments with their market values. |
Financial Statements | <Click Here> | Statements of assets and liabilities, operations, and changes in net assets,
as well as financial highlights. |
Notes | <Click Here> | Notes to the financial statements. |
Report of Independent Registered Public Accounting Firm | <Click Here> | |
Trustees and Officers | <Click Here> | |
Board Approval of Investment Advisory Contracts and Management Fees | <Click Here> | |
To view a fund's proxy voting guidelines and proxy voting record for the 12-month period ended June 30, visit http://www.fidelity.com/proxyvotingresults or visit the Securities and Exchange Commission's (SEC) web site at http://www.sec.gov. You may also call 1-800-544-8544 to request a free copy of the proxy voting guidelines.
Standard & Poor's, S&P and S&P 500 are registered service marks of The McGraw-Hill Companies, Inc. and have been licensed for use by Fidelity Distributors Corporation.
Other third party marks appearing herein are the property of their respective owners.
All other marks appearing herein are registered or unregistered trademarks or service marks of FMR LLC or an affiliated company.
Annual Report
This report and the financial statements contained herein are submitted for the general information of the shareholders of the fund. This report is not authorized for distribution to prospective investors in the fund unless preceded or accompanied by an effective prospectus.
A fund files its complete schedule of portfolio holdings with the SEC for the first and third quarters of each fiscal year on Form N-Q. Forms N-Q are available on the SEC's web site at http://www.sec.gov. A fund's Forms N-Q may be reviewed and copied at the SEC's Public Reference Room in Washington, DC. Information regarding the operation of the SEC's Public Reference Room may be obtained by calling 1-800-SEC-0330. For a complete list of a fund's portfolio holdings, view the fund's most recent holdings listing, semiannual report, or annual report on Fidelity's web site at http://www.fidelity.com or http://www.advisor.fidelity.com, as applicable.
NOT FDIC INSURED • MAY LOSE VALUE • NO BANK GUARANTEE
Neither the fund nor Fidelity Distributors Corporation is a bank.
Annual Report
(photo_of_Edward_C_Johnson_3d)
Dear Shareholder:
A yearlong uptrend in global equity markets reversed course in late April 2010 when investor sentiment turned bearish due in great measure to concern that Europe's debt crisis would expand and slow or derail economic recovery. However, a bounceback in July helped to recover some of the ground that was lost. Financial markets are always unpredictable, of course, but there also are several time-tested investment principles that can help put the odds in your favor.
One of the basic tenets is to invest for the long term. Over time, riding out the markets' inevitable ups and downs has proven much more effective than selling into panic or chasing the hottest trend. Even missing only a few of the markets' best days can significantly diminish investor returns. Patience also affords the benefits of compounding - of earning interest on additional income or reinvested dividends and capital gains. There can be tax advantages and cost benefits to consider as well. While staying the course doesn't eliminate risk, it can considerably lessen the effect of short-term declines.
You can further manage your investing risk through diversification. And today, more than ever, geographic diversification should be taken into account. Studies indicate that asset allocation is the single most important determinant of a portfolio's long-term success. The right mix of stocks, bonds and cash - aligned to your particular risk tolerance and investment objective - is very important. Age-appropriate rebalancing is also an essential aspect of asset allocation. For younger investors, an emphasis on equities - which historically have been the best-performing asset class over time - is encouraged. As investors near their specific goal, such as retirement or sending a child to college, consideration may be given to replacing volatile assets (e.g. common stocks) with more-stable fixed investments (bonds or savings plans).
A third principle - investing regularly - can help lower the average cost of your purchases. Investing a certain amount of money each month or quarter helps ensure you won't pay for all your shares at market highs. This strategy - known as dollar cost averaging - also reduces "emotion" from investing, helping shareholders avoid selling weak performers just prior to an upswing, or chasing a hot performer just before a correction.
We invite you to contact us via the Internet, through our Investor Centers or by phone. It is our privilege to provide you the information you need to make the investments that are right for you.
Sincerely,
(The chairman's signature appears here.)
Edward C. Johnson 3d
Annual Report
Average annual total return reflects the change in the value of an investment, assuming reinvestment of the class' distributions from dividend income and capital gains (the profits earned upon the sale of securities that have grown in value, if any) and assuming a constant rate of performance each year. The $10,000 table and the fund's returns do not reflect the deduction of taxes that a shareholder would pay on fund distributions or the redemption of fund shares. During periods of reimbursement by Fidelity, a fund's total return will be greater than it would be had the reimbursement not occurred. How a fund did yesterday is no guarantee of how it will do tomorrow.
Average Annual Total Returns
Periods ended July 31, 2010 | Past 1
year | Past 5
years | Life of
fund A |
Fidelity Small Cap Growth Fund | 17.63% | 1.52% | 6.03% |
A From November 3, 2004.
$10,000 Over Life of Fund
Let's say hypothetically that $10,000 was invested in Fidelity Small Cap Growth Fund, a class of the fund, on November 3, 2004, when the fund started. The chart shows how the value of your investment would have changed, and also shows how the Russell 2000® Growth Index performed over the same period.
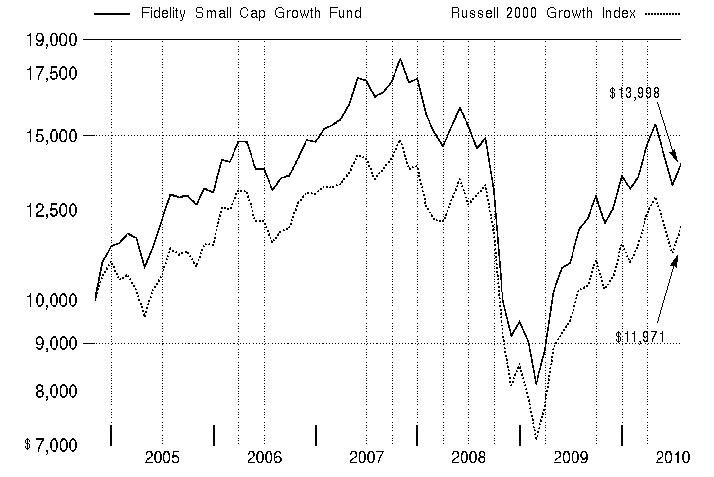
Annual Report
Market Recap: U.S. stock markets saw double-digit gains for the year ending July 31, 2010, despite the return of market volatility and risk aversion during the first half of 2010. An impressive bull run continued through 2009, bolstered by improvement in the economy and credit markets. Early in the new year, however, stocks fell sharply amid concerns about the global economic recovery, fueled by European debt woes and China's efforts to restrain inflation. After this brief dip, markets regained their upward momentum, as government stimulus and significant corporate cost cutting led to encouraging earnings reports, improved credit conditions and rising consumer confidence. Positive news continued through mid-April, when the Dow Jones Industrial AverageSM pushed above the 11,000 mark for the first time in 19 months. That milestone was short-lived, however, as heightened concern about the European debt crisis sparked an abrupt sell-off in May, leading to the first official correction since the rally began in March 2009. Although the market's malaise continued through June, stocks saw solid gains in July. For the year, the Dow rose 17.28%, while the S&P 500® Index was up 13.84%. Elsewhere, the technology-laden Nasdaq Composite® Index returned 14.99%. Small- and mid-cap stocks performed best, as measured by the 18.43% increase of the Russell 2000® Index and the 23.21% gain of the Russell Midcap® Index.
Comments from Lionel Harris, Portfolio Manager of Fidelity® Small Cap Growth Fund: For the 12 months ending July 31, 2010, the fund's Retail Class shares rose 17.63%, outpacing the 16.71% return of the Russell 2000 Growth Index. Stock selection was a big plus overall, especially in the industrials and consumer discretionary sectors. Within information technology, the fund saw success from its hardware/equipment positions, though several software/services names lagged - most notably, network communications systems company TeleCommunications Systems and Internet banking and billing services provider Online Resources. Favorable sector allocation helped, especially overweighting industrials and underweighting the weak-performing pharmaceuticals industry. Having a smaller relative weighting in the consumer discretionary sector, however, took away some of this positive impact. A stronger dollar overall hampered the performance of the fund's foreign stocks. The fund's top individual contributor was Commercial Vehicle Group, which makes parts for the cabs of large trucks. As optimism about the economy and, with it, the trucking industry grew, Commercial Vehicle's share price rose off an extremely low level. Brookdale Senior Living, an operator of assisted-living and retirement communities, also did well, as did hotel and timeshare property owner Wyndham Worldwide.
The views expressed above reflect those of the portfolio manager(s) only through the end of the period as stated on the cover of this report and do not necessarily represent the views of Fidelity or any other person in the Fidelity organization. Any such views are subject to change at any time based upon market or other conditions and Fidelity disclaims any responsibility to update such views. These views may not be relied on as investment advice and, because investment decisions for a Fidelity fund are based on numerous factors, may not be relied on as an indication of trading intent on behalf of any Fidelity fund.
Annual Report
Shareholder Expense Example
As a shareholder of the Fund, you incur two types of costs: (1) transaction costs, including sales charges (loads) on purchase payments or redemption proceeds, redemption fees, and (2) ongoing costs, including management fees, distribution and/or service (12b-1) fees and other Fund expenses. This Example is intended to help you understand your ongoing costs (in dollars) of investing in the Fund and to compare these costs with the ongoing costs of investing in other mutual funds.
The Example is based on an investment of $1,000 invested at the beginning of the period and held for the entire period (February 1, 2010 to July 31, 2010).
Actual Expenses
The first line of the accompanying table for each class of the Fund provides information about actual account values and actual expenses. You may use the information in this line, together with the amount you invested, to estimate the expenses that you paid over the period. Simply divide your account value by $1,000.00 (for example, an $8,600 account value divided by $1,000.00 = 8.6), then multiply the result by the number in the first line for a class of the Fund under the heading entitled "Expenses Paid During Period" to estimate the expenses you paid on your account during this period. A small balance maintenance fee of $12.00 that is charged once a year may apply for certain accounts with a value of less than $2,000. This fee is not included in the table below. If it was, the estimate of expenses you paid during the period would be higher, and your ending account value lower, by this amount. In addition, the Fund, as a shareholder in the underlying Fidelity Central Funds, will indirectly bear its pro-rata share of the fees and expenses incurred by the underlying Fidelity Central Funds. These fees and expenses are not included in the Fund's annualized expense ratio used to calculate the expense estimate in the table below.
Hypothetical Example for Comparison Purposes
The second line of the accompanying table for each class of the Fund provides information about hypothetical account values and hypothetical expenses based on a Class' actual expense ratio and an assumed rate of return of 5% per year before expenses, which is not the Class' actual return. The hypothetical account values and expenses may not be used to estimate the actual ending account balance or expenses you paid for the period. You may use this information to compare the ongoing costs of investing in the Fund and other funds. To do so, compare this 5% hypothetical example with the 5% hypothetical examples that appear in the shareholder reports of the other funds. A small balance maintenance fee of $12.00 that is charged once a year may apply for certain accounts with a value of less than $2,000. This fee is not included in the table below. If it was, the estimate of expenses you paid during the period would be higher, and your ending account value lower, by this amount. In addition, the Fund, as a shareholder in the underlying Fidelity Central Funds, will indirectly bear its pro-rata share of the fees and expenses incurred by the underlying Fidelity Central Funds. These fees and expenses are not included in the Fund's annualized expense ratio used to calculate the expense estimate in the table below.
Please note that the expenses shown in the table are meant to highlight your ongoing costs only and do not reflect any transaction costs. Therefore, the second line of the table is useful in comparing ongoing costs only, and will not help you determine the relative total costs of owning different funds. In addition, if these transactional costs were included, your costs would have been higher.
Annual Report
| Annualized Expense Ratio | Beginning
Account Value
February 1, 2010 | Ending
Account Value
July 31, 2010 | Expenses Paid
During Period*
February 1, 2010
to July 31, 2010 |
Class A | 1.31% | | | |
Actual | | $ 1,000.00 | $ 1,062.10 | $ 6.70 |
HypotheticalA | | $ 1,000.00 | $ 1,018.30 | $ 6.56 |
Class T | 1.57% | | | |
Actual | | $ 1,000.00 | $ 1,060.80 | $ 8.02 |
HypotheticalA | | $ 1,000.00 | $ 1,017.01 | $ 7.85 |
Class B | 2.07% | | | |
Actual | | $ 1,000.00 | $ 1,057.60 | $ 10.56 |
HypotheticalA | | $ 1,000.00 | $ 1,014.53 | $ 10.34 |
Class C | 2.07% | | | |
Actual | | $ 1,000.00 | $ 1,057.70 | $ 10.56 |
HypotheticalA | | $ 1,000.00 | $ 1,014.53 | $ 10.34 |
Small Cap Growth | 1.03% | | | |
Actual | | $ 1,000.00 | $ 1,064.00 | $ 5.27 |
HypotheticalA | | $ 1,000.00 | $ 1,019.69 | $ 5.16 |
Class F | .78% | | | |
Actual | | $ 1,000.00 | $ 1,064.60 | $ 3.99 |
HypotheticalA | | $ 1,000.00 | $ 1,020.93 | $ 3.91 |
Institutional Class | .99% | | | |
Actual | | $ 1,000.00 | $ 1,063.80 | $ 5.07 |
HypotheticalA | | $ 1,000.00 | $ 1,019.89 | $ 4.96 |
A 5% return per year before expenses
* Expenses are equal to each Class' annualized expense ratio, multiplied by the average account value over the period, multiplied by 181/365 (to reflect the one-half year period).
Annual Report
Investment Changes (Unaudited)
Top Ten Stocks as of July 31, 2010 |
| % of fund's
net assets | % of fund's net assets
6 months ago |
NETGEAR, Inc. | 1.1 | 0.0 |
Zumtobel AG | 1.1 | 0.0 |
Adtran, Inc. | 1.1 | 0.8 |
Wyndham Worldwide Corp. | 1.1 | 0.7 |
Plantronics, Inc. | 1.1 | 1.2 |
Riverbed Technology, Inc. | 1.1 | 1.4 |
Triumph Group, Inc. | 1.1 | 0.0 |
Polycom, Inc. | 1.1 | 0.6 |
Super Micro Computer, Inc. | 1.1 | 1.0 |
Armstrong World Industries, Inc. | 1.0 | 0.7 |
| 10.9 | |
Top Five Market Sectors as of July 31, 2010 |
| % of fund's
net assets | % of fund's net assets
6 months ago |
Information Technology | 27.1 | 23.0 |
Health Care | 20.6 | 23.3 |
Industrials | 18.5 | 18.7 |
Consumer Discretionary | 17.8 | 14.9 |
Financials | 4.0 | 3.5 |
Asset Allocation (% of fund's net assets) |
As of July 31, 2010* | As of January 31, 2010** |
| Stocks 95.2% | | | Stocks 93.5% | |
| Short-Term
Investments and
Net Other Assets 4.8% | | | Short-Term
Investments and
Net Other Assets 6.5% | |
* Foreign investments | 16.2% | | ** Foreign investments | 15.1% | |

Annual Report
Investments July 31, 2010
Showing Percentage of Net Assets
Common Stocks - 95.2% |
| Shares | | Value |
CONSUMER DISCRETIONARY - 17.8% |
Auto Components - 1.4% |
ElringKlinger AG | 285,000 | | $ 7,661,254 |
Modine Manufacturing Co. (a) | 1,254,000 | | 12,728,100 |
| | 20,389,354 |
Distributors - 0.7% |
Delticom AG | 181,910 | | 9,280,982 |
Diversified Consumer Services - 0.7% |
Steiner Leisure Ltd. (a) | 248,000 | | 10,542,480 |
Hotels, Restaurants & Leisure - 3.7% |
Aristocrat Leisure Ltd. | 2,735,000 | | 8,389,453 |
BJ's Restaurants, Inc. (a) | 320,000 | | 8,160,000 |
Life Time Fitness, Inc. (a)(d) | 203,000 | | 7,381,080 |
Toridoll Corp. (d) | 3,250 | | 5,949,089 |
WMS Industries, Inc. (a) | 194,750 | | 7,499,823 |
Wyndham Worldwide Corp. | 622,000 | | 15,879,660 |
| | 53,259,105 |
Household Durables - 2.8% |
Dorel Industries, Inc. Class B (sub. vtg.) | 321,550 | | 10,876,301 |
Harman International Industries, Inc. (a) | 350,000 | | 10,643,500 |
Hooker Furniture Corp. | 510,101 | | 6,029,394 |
Tempur-Pedic International, Inc. (a) | 399,000 | | 12,237,330 |
| | 39,786,525 |
Multiline Retail - 0.7% |
Dollarama, Inc. | 415,000 | | 10,359,356 |
Specialty Retail - 4.9% |
Casual Male Retail Group, Inc. (a) | 1,749,978 | | 6,054,924 |
Citi Trends, Inc. (a) | 300,000 | | 9,417,000 |
DSW, Inc. Class A (a)(d) | 425,000 | | 11,309,250 |
hhgregg, Inc. (a)(d) | 490,000 | | 9,942,100 |
Jos. A. Bank Clothiers, Inc. (a)(d) | 125,000 | | 7,335,000 |
Sally Beauty Holdings, Inc. (a) | 901,000 | | 8,523,460 |
Shoe Carnival, Inc. (a) | 458,881 | | 9,659,445 |
Signet Jewelers Ltd. (a) | 288,400 | | 8,585,668 |
| | 70,826,847 |
Textiles, Apparel & Luxury Goods - 2.9% |
Fossil, Inc. (a) | 350,000 | | 13,860,000 |
G-III Apparel Group Ltd. (a) | 390,300 | | 10,069,740 |
Common Stocks - continued |
| Shares | | Value |
CONSUMER DISCRETIONARY - continued |
Textiles, Apparel & Luxury Goods - continued |
Phillips-Van Heusen Corp. | 182,000 | | $ 9,443,980 |
Ted Baker PLC | 907,621 | | 7,594,441 |
| | 40,968,161 |
TOTAL CONSUMER DISCRETIONARY | | 255,412,810 |
CONSUMER STAPLES - 3.0% |
Food & Staples Retailing - 0.4% |
Susser Holdings Corp. (a) | 548,452 | | 6,586,909 |
Food Products - 1.7% |
Calavo Growers, Inc. (d) | 599,046 | | 12,651,852 |
Smithfield Foods, Inc. (a) | 790,000 | | 11,257,500 |
| | 23,909,352 |
Personal Products - 0.9% |
Inter Parfums, Inc. | 737,000 | | 12,860,650 |
TOTAL CONSUMER STAPLES | | 43,356,911 |
ENERGY - 2.4% |
Energy Equipment & Services - 1.6% |
Newpark Resources, Inc. (a) | 1,525,000 | | 12,184,750 |
T-3 Energy Services, Inc. (a) | 445,000 | | 11,285,200 |
| | 23,469,950 |
Oil, Gas & Consumable Fuels - 0.8% |
EXCO Resources, Inc. | 771,400 | | 11,193,014 |
TOTAL ENERGY | | 34,662,964 |
FINANCIALS - 4.0% |
Capital Markets - 0.9% |
Fifth Street Finance Corp. (d) | 465,000 | | 5,049,900 |
optionsXpress Holdings, Inc. (a) | 469,200 | | 7,319,520 |
| | 12,369,420 |
Commercial Banks - 1.7% |
CapitalSource, Inc. | 1,295,000 | | 6,967,100 |
FirstMerit Corp. | 463,000 | | 9,125,730 |
Huntington Bancshares, Inc. | 1,496,100 | | 9,066,366 |
| | 25,159,196 |
Common Stocks - continued |
| Shares | | Value |
FINANCIALS - continued |
Real Estate Investment Trusts - 0.7% |
CBL & Associates Properties, Inc. | 680,200 | | $ 9,570,414 |
Thrifts & Mortgage Finance - 0.7% |
First Niagara Financial Group, Inc. | 765,000 | | 10,258,650 |
TOTAL FINANCIALS | | 57,357,680 |
HEALTH CARE - 20.6% |
Biotechnology - 1.8% |
Allos Therapeutics, Inc. (a) | 875,000 | | 4,217,500 |
PDL BioPharma, Inc. | 1,860,000 | | 11,569,200 |
Theravance, Inc. (a)(d) | 409,000 | | 6,057,290 |
ZIOPHARM Oncology, Inc. (a)(d) | 860,000 | | 3,216,400 |
| | 25,060,390 |
Health Care Equipment & Supplies - 4.1% |
AGA Medical Holdings, Inc. | 310,583 | | 4,500,348 |
American Medical Systems Holdings, Inc. (a) | 500,000 | | 11,180,000 |
Integra LifeSciences Holdings Corp. (a) | 337,400 | | 12,190,262 |
Natus Medical, Inc. (a) | 548,000 | | 8,044,640 |
Orthofix International NV (a) | 200,000 | | 6,056,000 |
STRATEC Biomedical Systems AG | 175,000 | | 6,548,356 |
Wright Medical Group, Inc. (a) | 670,000 | | 10,458,700 |
| | 58,978,306 |
Health Care Providers & Services - 8.0% |
Amedisys, Inc. (a)(d) | 247,400 | | 6,499,198 |
Catalyst Health Solutions, Inc. (a) | 370,000 | | 12,794,600 |
Centene Corp. (a) | 395,000 | | 8,417,450 |
Emergency Medical Services Corp. Class A (a) | 273,000 | | 12,214,020 |
Hanger Orthopedic Group, Inc. (a) | 651,900 | | 11,180,085 |
HealthSouth Corp. (a) | 570,000 | | 10,550,700 |
LHC Group, Inc. (a) | 342,400 | | 7,871,776 |
Providence Service Corp. (a) | 393,800 | | 5,670,720 |
PSS World Medical, Inc. (a)(d) | 664,499 | | 12,505,871 |
RehabCare Group, Inc. (a) | 483,000 | | 10,234,770 |
Synergy Health PLC | 780,411 | | 8,170,177 |
Team Health Holdings, Inc. | 699,000 | | 9,163,890 |
| | 115,273,257 |
Common Stocks - continued |
| Shares | | Value |
HEALTH CARE - continued |
Health Care Technology - 1.7% |
Computer Programs & Systems, Inc. (d) | 305,800 | | $ 13,751,826 |
MedAssets, Inc. (a) | 423,000 | | 9,902,430 |
| | 23,654,256 |
Life Sciences Tools & Services - 3.5% |
Bruker BioSciences Corp. (a) | 965,000 | | 12,709,050 |
ICON PLC sponsored ADR (a) | 560,000 | | 13,216,000 |
PerkinElmer, Inc. | 745,000 | | 14,497,700 |
QIAGEN NV (a) | 551,000 | | 10,314,720 |
| | 50,737,470 |
Pharmaceuticals - 1.5% |
Ardea Biosciences, Inc. (a)(d) | 209,263 | | 4,174,797 |
Auxilium Pharmaceuticals, Inc. (a)(d) | 148,935 | | 3,359,974 |
Cadence Pharmaceuticals, Inc. (a)(d) | 645,000 | | 4,940,700 |
Hikma Pharmaceuticals PLC | 785,000 | | 8,815,349 |
| | 21,290,820 |
TOTAL HEALTH CARE | | 294,994,499 |
INDUSTRIALS - 18.5% |
Aerospace & Defense - 3.5% |
Esterline Technologies Corp. (a) | 220,000 | | 11,292,600 |
Spirit AeroSystems Holdings, Inc. Class A (a) | 651,400 | | 13,255,990 |
Teledyne Technologies, Inc. (a) | 257,000 | | 10,544,710 |
Triumph Group, Inc. | 199,000 | | 15,104,100 |
| | 50,197,400 |
Building Products - 1.0% |
Armstrong World Industries, Inc. (a)(d) | 406,000 | | 14,843,360 |
Commercial Services & Supplies - 3.4% |
Prosegur Compania de Seguridad SA (Reg.) | 273,000 | | 13,424,883 |
Schawk, Inc. Class A | 600,000 | | 8,898,000 |
The Geo Group, Inc. (a) | 653,000 | | 14,091,740 |
Waste Connections, Inc. (a) | 310,000 | | 11,832,700 |
| | 48,247,323 |
Construction & Engineering - 2.6% |
Foster Wheeler AG (a) | 490,000 | | 11,279,800 |
Granite Construction, Inc. | 392,000 | | 9,114,000 |
KBR, Inc. | 450,000 | | 10,071,000 |
Orion Marine Group, Inc. (a) | 570,000 | | 7,079,400 |
| | 37,544,200 |
Common Stocks - continued |
| Shares | | Value |
INDUSTRIALS - continued |
Electrical Equipment - 2.8% |
Acuity Brands, Inc. | 257,100 | | $ 10,831,623 |
Regal-Beloit Corp. | 208,000 | | 12,652,640 |
Zumtobel AG | 852,783 | | 16,155,285 |
| | 39,639,548 |
Machinery - 1.8% |
Blount International, Inc. (a) | 640,000 | | 6,816,000 |
Commercial Vehicle Group, Inc. (a) | 1,064,273 | | 11,973,071 |
OSG Corp. | 600,000 | | 6,630,026 |
| | 25,419,097 |
Professional Services - 0.5% |
Diamond Management & Technology Consultants, Inc. | 725,000 | | 7,866,250 |
Road & Rail - 0.6% |
Contrans Group, Inc. Class A | 985,000 | | 8,576,049 |
Trading Companies & Distributors - 2.3% |
Beacon Roofing Supply, Inc. (a) | 569,000 | | 9,707,140 |
Interline Brands, Inc. (a) | 550,000 | | 9,949,500 |
Rush Enterprises, Inc. Class A (a) | 948,254 | | 14,166,915 |
| | 33,823,555 |
TOTAL INDUSTRIALS | | 266,156,782 |
INFORMATION TECHNOLOGY - 27.1% |
Communications Equipment - 5.9% |
Adtran, Inc. | 510,200 | | 16,112,116 |
CommScope, Inc. (a) | 287,200 | | 5,841,648 |
NETGEAR, Inc. (a) | 681,392 | | 16,353,406 |
Plantronics, Inc. | 520,000 | | 15,584,400 |
Polycom, Inc. (a) | 505,000 | | 14,988,400 |
Riverbed Technology, Inc. (a) | 415,000 | | 15,392,350 |
| | 84,272,320 |
Computers & Peripherals - 2.7% |
Super Micro Computer, Inc. (a) | 1,030,000 | | 14,873,200 |
Synaptics, Inc. (a)(d) | 370,000 | | 11,581,000 |
Wincor Nixdorf AG | 212,400 | | 11,988,190 |
| | 38,442,390 |
Electronic Equipment & Components - 2.6% |
Avnet, Inc. (a) | 494,000 | | 12,424,100 |
Common Stocks - continued |
| Shares | | Value |
INFORMATION TECHNOLOGY - continued |
Electronic Equipment & Components - continued |
Insight Enterprises, Inc. (a) | 815,000 | | $ 11,874,550 |
SYNNEX Corp. (a) | 472,800 | | 12,477,192 |
| | 36,775,842 |
Internet Software & Services - 5.1% |
Art Technology Group, Inc. (a) | 1,785,652 | | 6,428,347 |
j2 Global Communications, Inc. (a) | 607,500 | | 14,294,475 |
Monster Worldwide, Inc. (a)(d) | 675,880 | | 9,273,074 |
Perficient, Inc. (a)(e) | 1,548,502 | | 13,394,542 |
Rackspace Hosting, Inc. (a)(d) | 633,000 | | 11,837,100 |
Sohu.com, Inc. (a)(d) | 174,000 | | 8,181,480 |
TelecityGroup PLC (a) | 1,416,600 | | 9,620,374 |
| | 73,029,392 |
IT Services - 3.3% |
Datacash Group PLC | 2,736,200 | | 10,514,067 |
Heartland Payment Systems, Inc. | 634,000 | | 10,004,520 |
Online Resources Corp. (a)(e) | 1,897,060 | | 7,777,946 |
WNS Holdings Ltd. sponsored ADR (a) | 574,657 | | 5,148,927 |
Wright Express Corp. (a) | 382,000 | | 13,366,180 |
| | 46,811,640 |
Semiconductors & Semiconductor Equipment - 2.9% |
Hittite Microwave Corp. (a) | 148,821 | | 6,839,813 |
Microsemi Corp. (a) | 847,000 | | 13,518,120 |
Roth & Rau AG (a) | 357,200 | | 11,825,138 |
Standard Microsystems Corp. (a) | 458,000 | | 10,085,160 |
| | 42,268,231 |
Software - 4.6% |
Blackbaud, Inc. | 446,059 | | 10,567,138 |
Informatica Corp. (a) | 381,000 | | 11,479,530 |
Radiant Systems, Inc. (a) | 895,000 | | 12,717,950 |
Solera Holdings, Inc. | 342,000 | | 12,989,160 |
Taleo Corp. Class A (a) | 481,039 | | 11,833,559 |
TeleCommunication Systems, Inc. Class A (a) | 2,000,000 | | 7,180,000 |
| | 66,767,337 |
TOTAL INFORMATION TECHNOLOGY | | 388,367,152 |
MATERIALS - 1.3% |
Chemicals - 0.6% |
Solutia, Inc. (a) | 647,000 | | 9,129,170 |
Common Stocks - continued |
| Shares | | Value |
MATERIALS - continued |
Metals & Mining - 0.7% |
Commercial Metals Co. | 635,100 | | $ 9,139,089 |
TOTAL MATERIALS | | 18,268,259 |
TELECOMMUNICATION SERVICES - 0.5% |
Diversified Telecommunication Services - 0.5% |
Premiere Global Services, Inc. (a) | 1,172,000 | | 7,336,720 |
TOTAL COMMON STOCKS (Cost $1,290,877,469) | 1,365,913,777 |
Money Market Funds - 9.5% |
| | | |
Fidelity Cash Central Fund, 0.24% (b) | 69,466,459 | | 69,466,459 |
Fidelity Securities Lending Cash Central Fund, 0.27% (b)(c) | 67,877,077 | | 67,877,077 |
TOTAL MONEY MARKET FUNDS (Cost $137,343,536) | 137,343,536 |
TOTAL INVESTMENT PORTFOLIO - 104.7% (Cost $1,428,221,005) | | 1,503,257,313 |
NET OTHER ASSETS (LIABILITIES) - (4.7)% | | (68,064,626) |
NET ASSETS - 100% | $ 1,435,192,687 |
Legend |
(a) Non-income producing |
(b) Affiliated fund that is available only to investment companies and other accounts managed by Fidelity Investments. The rate quoted is the annualized seven-day yield of the fund at period end. A complete unaudited listing of the fund's holdings as of its most recent quarter end is available upon request. |
(c) Investment made with cash collateral received from securities on loan. |
(d) Security or a portion of the security is on loan at period end. |
(e) Affiliated company |
Affiliated Central Funds |
Information regarding fiscal year to date income earned by the Fund from investments in Fidelity Central Funds is as follows: |
Fund | Income earned |
Fidelity Cash Central Fund | $ 149,674 |
Fidelity Securities Lending Cash Central Fund | 1,296,145 |
Total | $ 1,445,819 |
Other Affiliated Issuers |
An affiliated company is a company in which the fund has ownership of at least 5% of the voting securities. Fiscal year to date transactions with companies which are or were affiliates are as follows: |
Affiliate | Value, beginning of period | Purchases | Sales Proceeds | Dividend Income | Value, end of period |
Commercial Vehicle Group, Inc. | $ - | $ 9,035,246 | $ 6,160,191 | $ - | $ - |
Online Resources Corp. | 7,502,350 | 4,608,401 | 537,693 | - | 7,777,946 |
Perficient, Inc. | - | 15,347,170 | - | - | 13,394,542 |
Town Sports International Holdings, Inc. | 4,060,850 | 759,596 | 3,236,327 | - | - |
Total | $ 11,563,200 | $ 29,750,413 | $ 9,934,211 | $ - | $ 21,172,488 |
Other Information |
All investments are categorized as Level 1 under the Fair Value Hierarchy. The inputs or methodology used for valuing securities may not be an indication of the risk associated with investing in those securities. For more information on valuation inputs, please refer to the Security Valuation section in the accompanying Notes to Financial Statements. |
Distribution of investments by country of issue, as a percentage of total net assets, is as follows: (Unaudited) |
United States of America | 83.8% |
Germany | 3.3% |
United Kingdom | 3.1% |
Canada | 2.1% |
Austria | 1.1% |
Spain | 1.0% |
Others (Individually Less Than 1%) | 5.6% |
| 100.0% |
Income Tax Information |
At July 31, 2010, the Fund had a capital loss carryforward of approximately $193,259,144 all of which will expire on July 31, 2017. Capital loss carryforwards are only available to offset future capital gains of the Fund to the extent provided by regulations and may be limited. |
See accompanying notes which are an integral part of the financial statements.
Annual Report
Statement of Assets and Liabilities
| July 31, 2010 |
| | |
Assets | | |
Investment in securities, at value (including securities loaned of $66,419,896) - See accompanying schedule: Unaffiliated issuers (cost $1,264,897,501) | $ 1,344,741,289 | |
Fidelity Central Funds (cost $137,343,536) | 137,343,536 | |
Other affiliated issuers (cost $25,979,968) | 21,172,488 | |
Total Investments (cost $1,428,221,005) | | $ 1,503,257,313 |
Cash | | 315,767 |
Receivable for investments sold | | 13,654,738 |
Receivable for fund shares sold | | 2,171,959 |
Dividends receivable | | 292,550 |
Distributions receivable from Fidelity Central Funds | | 132,533 |
Other receivables | | 33,561 |
Total assets | | 1,519,858,421 |
| | |
Liabilities | | |
Payable to custodian bank | $ 29,626 | |
Payable for investments purchased | 14,818,248 | |
Payable for fund shares redeemed | 742,277 | |
Accrued management fee | 742,220 | |
Distribution fees payable | 38,799 | |
Other affiliated payables | 356,239 | |
Other payables and accrued expenses | 61,248 | |
Collateral on securities loaned, at value | 67,877,077 | |
Total liabilities | | 84,665,734 |
| | |
Net Assets | | $ 1,435,192,687 |
Net Assets consist of: | | |
Paid in capital | | $ 1,560,322,935 |
Accumulated undistributed net realized gain (loss) on investments and foreign currency transactions | | (200,164,970) |
Net unrealized appreciation (depreciation) on investments and assets and liabilities in foreign currencies | | 75,034,722 |
Net Assets | | $ 1,435,192,687 |
See accompanying notes which are an integral part of the financial statements.
Annual Report
Statement of Assets and Liabilities - continued
| July 31, 2010 |
| | |
Calculation of Maximum Offering Price
Class A:
Net Asset Value and redemption price per share
($50,620,117 ÷ 3,999,164 shares) | | $ 12.66 |
| | |
Maximum offering price per share (100/94.25 of $12.66) | | $ 13.43 |
Class T:
Net Asset Value and redemption price per share ($23,930,175 ÷ 1,904,460 shares) | | $ 12.57 |
| | |
Maximum offering price per share (100/96.50 of $12.57) | | $ 13.03 |
Class B:
Net Asset Value and offering price per share ($5,141,694 ÷ 417,875 shares)A | | $ 12.30 |
| | |
Class C:
Net Asset Value and offering price per share ($18,091,241 ÷ 1,472,976 shares)A | | $ 12.28 |
| | |
Small Cap Growth:
Net Asset Value, offering price and redemption price per share ($1,204,817,925 ÷ 94,067,973 shares) | | $ 12.81 |
| | |
Class F:
Net Asset Value, offering price and redemption price per share ($106,941,045 ÷ 8,320,712 shares) | | $ 12.85 |
| | |
Institutional Class:
Net Asset Value, offering price and redemption price per share ($25,650,490 ÷ 1,999,058 shares) | | $ 12.83 |
A Redemption price per share is equal to net asset value less any applicable contingent deferred sales charge.
See accompanying notes which are an integral part of the financial statements.
Annual Report
Financial Statements - continued
Statement of Operations
| Year ended July 31, 2010 |
| | |
Investment Income | | |
Dividends | | $ 7,668,648 |
Special dividends | | 1,409,998 |
Interest | | 77 |
Income from Fidelity Central Funds (including $1,296,145 from security lending) | | 1,445,819 |
Total income | | 10,524,542 |
| | |
Expenses | | |
Management fee
Basic fee | $ 9,613,711 | |
Performance adjustment | 303,437 | |
Transfer agent fees | 3,875,107 | |
Distribution fees | 458,801 | |
Accounting and security lending fees | 472,799 | |
Custodian fees and expenses | 60,299 | |
Independent trustees' compensation | 7,713 | |
Registration fees | 89,950 | |
Audit | 55,399 | |
Legal | 5,688 | |
Miscellaneous | 20,225 | |
Total expenses before reductions | 14,963,129 | |
Expense reductions | (169,459) | 14,793,670 |
Net investment income (loss) | | (4,269,128) |
Realized and Unrealized Gain (Loss) Net realized gain (loss) on: | | |
Investment securities: | | |
Unaffiliated issuers | 241,077,337 | |
Other affiliated issuers | 987,981 | |
Foreign currency transactions | (28,960) | |
Capital gain distributions from Fidelity Central Funds | 2,501 | |
Total net realized gain (loss) | | 242,038,859 |
Change in net unrealized appreciation (depreciation) on: Investment securities | (34,114,564) | |
Assets and liabilities in foreign currencies | (2,138) | |
Total change in net unrealized appreciation (depreciation) | | (34,116,702) |
Net gain (loss) | | 207,922,157 |
Net increase (decrease) in net assets resulting from operations | | $ 203,653,029 |
See accompanying notes which are an integral part of the financial statements.
Annual Report
Statement of Changes in Net Assets
| Year ended
July 31,
2010 | Year ended
July 31,
2009 |
Increase (Decrease) in Net Assets | | |
Operations | | |
Net investment income (loss) | $ (4,269,128) | $ (4,212,561) |
Net realized gain (loss) | 242,038,859 | (335,295,985) |
Change in net unrealized appreciation (depreciation) | (34,116,702) | 109,380,680 |
Net increase (decrease) in net assets resulting
from operations | 203,653,029 | (230,127,866) |
Share transactions - net increase (decrease) | 46,578,163 | 89,233,558 |
Redemption fees | 232,258 | 255,734 |
Total increase (decrease) in net assets | 250,463,450 | (140,638,574) |
| | |
Net Assets | | |
Beginning of period | 1,184,729,237 | 1,325,367,811 |
End of period | $ 1,435,192,687 | $ 1,184,729,237 |
See accompanying notes which are an integral part of the financial statements.
Annual Report
Financial Highlights - Class A
Years ended July 31, | 2010 | 2009 | 2008 | 2007 | 2006 |
Selected Per-Share Data | | | | | |
Net asset value, beginning of period | $ 10.79 | $ 13.20 | $ 16.06 | $ 12.88 | $ 12.95 |
Income from Investment Operations | | | | | |
Net investment income (loss) C | (.07) F | (.06) | (.11) | (.12) G | (.10) H |
Net realized and unrealized gain (loss) | 1.94 | (2.35) | (1.73) | 3.39 | .18 |
Total from investment operations | 1.87 | (2.41) | (1.84) | 3.27 | .08 |
Distributions from net realized gain | - | - | (1.02) | (.09) | (.16) |
Redemption fees added to paid in capital C | - J | - J | - J | - J | .01 |
Net asset value, end of period | $ 12.66 | $ 10.79 | $ 13.20 | $ 16.06 | $ 12.88 |
Total Return A, B | 17.33% | (18.26)% | (12.26)% | 25.52% | .70% |
Ratios to Average Net Assets D, I | | | | | |
Expenses before reductions | 1.35% | 1.33% | 1.40% | 1.44% | 1.53% |
Expenses net of fee waivers,
if any | 1.35% | 1.33% | 1.40% | 1.40% | 1.40% |
Expenses net of all reductions | 1.34% | 1.33% | 1.39% | 1.39% | 1.35% |
Net investment income (loss) | (.56)% F | (.64)% | (.74)% | (.80)% G | (.79)% H |
Supplemental Data | | | | | |
Net assets, end of period
(000 omitted) | $ 50,620 | $ 40,211 | $ 42,187 | $ 33,588 | $ 18,104 |
Portfolio turnover rate E | 105% | 150% | 113% | 91% | 129% |
A Total returns would have been lower had certain expenses not been reduced during the periods shown.
B Total returns do not include the effect of the sales charges.
C Calculated based on average shares outstanding during the period.
D Fees and expenses of the underlying Fidelity Central Funds are not included in the Fund's expense ratio. The Fund indirectly bears its proportionate share of the expenses of any underlying Fidelity Central Funds.
E Amount does not include the portfolio activity of any underlying Fidelity Central Funds.
F Investment income per share reflects a special dividend which amounted to $.01 per share. Excluding the special dividend, the ratio of net investment income (loss) to average net assets would have been (.67)%.
G Investment income per share reflects a special dividend which amounted to $.01 per share. Excluding the special dividend, the ratio of net investment income (loss) to average net assets would have been (.84)%.
H Investment income per share reflects a special dividend which amounted to $.01 per share. Excluding the special dividend, the ratio of net investment income (loss) to average net assets would have been (.85)%.
I Expense ratios reflect operating expenses of the class. Expenses before reductions do not reflect amounts reimbursed by the investment adviser or reductions from brokerage service arrangements or reductions from other expense offset arrangements and do not represent the amount paid by the class during periods when reimbursements or reductions occur. Expenses net of fee waivers reflect expenses after reimbursement by the investment adviser but prior to reductions from brokerage service arrangements or other expense offset arrangements. Expenses net of all reductions represent the net expenses paid by the class.
J Amount represents less than $.01 per share.
See accompanying notes which are an integral part of the financial statements.
Annual Report
Financial Highlights - Class T
Years ended July 31, | 2010 | 2009 | 2008 | 2007 | 2006 |
Selected Per-Share Data | | | | | |
Net asset value, beginning of period | $ 10.74 | $ 13.17 | $ 16.01 | $ 12.86 | $ 12.93 |
Income from Investment Operations | | | | | |
Net investment income (loss) C | (.10) F | (.09) | (.15) | (.16) G | (.14) H |
Net realized and unrealized gain (loss) | 1.93 | (2.34) | (1.73) | 3.38 | .19 |
Total from investment operations | 1.83 | (2.43) | (1.88) | 3.22 | .05 |
Distributions from net realized gain | - | - | (.96) | (.07) | (.13) |
Redemption fees added to paid in capital C | - J | - J | - J | - J | .01 |
Net asset value, end of period | $ 12.57 | $ 10.74 | $ 13.17 | $ 16.01 | $ 12.86 |
Total Return A, B | 17.04% | (18.45)% | (12.50)% | 25.18% | .48% |
Ratios to Average Net Assets D, I | | | | | |
Expenses before reductions | 1.61% | 1.60% | 1.65% | 1.67% | 1.73% |
Expenses net of fee waivers,
if any | 1.61% | 1.60% | 1.65% | 1.65% | 1.65% |
Expenses net of all reductions | 1.60% | 1.59% | 1.65% | 1.65% | 1.60% |
Net investment income (loss) | (.82)% F | (.91)% | (.99)% | (1.05)% G | (1.04)% H |
Supplemental Data | | | | | |
Net assets, end of period
(000 omitted) | $ 23,930 | $ 21,533 | $ 21,754 | $ 26,419 | $ 19,205 |
Portfolio turnover rate E | 105% | 150% | 113% | 91% | 129% |
A Total returns would have been lower had certain expenses not been reduced during the periods shown.
B Total returns do not include the effect of the sales charges.
C Calculated based on average shares outstanding during the period.
D Fees and expenses of the underlying Fidelity Central Funds are not included in the Fund's expense ratio. The Fund indirectly bears its proportionate share of the expenses of any underlying Fidelity Central Funds.
E Amount does not include the portfolio activity of any underlying Fidelity Central Funds.
F Investment income per share reflects a special dividend which amounted to $.01 per share. Excluding the special dividend, the ratio of net investment income (loss) to average net assets would have been (.93)%.
G Investment income per share reflects a special dividend which amounted to $.01 per share. Excluding the special dividend, the ratio of net investment income (loss) to average net assets would have been (1.09)%.
H Investment income per share reflects a special dividend which amounted to $.01 per share. Excluding the special dividend, the ratio of net investment income (loss) to average net assets would have been (1.10)%.
I Expense ratios reflect operating expenses of the class. Expenses before reductions do not reflect amounts reimbursed by the investment adviser or reductions from brokerage service arrangements or reductions from other expense offset arrangements and do not represent the amount paid by the class during periods when reimbursements or reductions occur. Expenses net of fee waivers reflect expenses after reimbursement by the investment adviser but prior to reductions from brokerage service arrangements or other expense offset arrangements. Expenses net of all reductions represent the net expenses paid by the class.
J Amount represents less than $.01 per share.
See accompanying notes which are an integral part of the financial statements.
Annual Report
Financial Highlights - Class B
Years ended July 31, | 2010 | 2009 | 2008 | 2007 | 2006 |
Selected Per-Share Data | | | | | |
Net asset value, beginning of period | $ 10.57 | $ 13.03 | $ 15.85 | $ 12.78 | $ 12.87 |
Income from Investment Operations | | | | | |
Net investment income (loss) C | (.16) F | (.13) | (.22) | (.23) G | (.20) H |
Net realized and unrealized gain (loss) | 1.89 | (2.33) | (1.71) | 3.36 | .19 |
Total from investment operations | 1.73 | (2.46) | (1.93) | 3.13 | (.01) |
Distributions from net realized gain | - | - | (.89) | (.06) | (.09) |
Redemption fees added to paid in capital C | - J | - J | - J | - J | .01 |
Net asset value, end of period | $ 12.30 | $ 10.57 | $ 13.03 | $ 15.85 | $ 12.78 |
Total Return A, B | 16.37% | (18.88)% | (12.92)% | 24.57% | (.03)% |
Ratios to Average Net Assets D, I | | | | | |
Expenses before reductions | 2.11% | 2.08% | 2.15% | 2.20% | 2.28% |
Expenses net of fee waivers,
if any | 2.11% | 2.08% | 2.15% | 2.15% | 2.15% |
Expenses net of all reductions | 2.09% | 2.08% | 2.15% | 2.15% | 2.10% |
Net investment income (loss) | (1.32)% F | (1.39)% | (1.49)% | (1.55)% G | (1.54)% H |
Supplemental Data | | | | | |
Net assets, end of period
(000 omitted) | $ 5,142 | $ 4,171 | $ 5,517 | $ 6,242 | $ 5,191 |
Portfolio turnover rate E | 105% | 150% | 113% | 91% | 129% |
A Total returns would have been lower had certain expenses not been reduced during the periods shown.
B Total returns do not include the effect of the contingent deferred sales charge.
C Calculated based on average shares outstanding during the period.
D Fees and expenses of the underlying Fidelity Central Funds are not included in the Fund's expense ratio. The Fund indirectly bears its proportionate share of the expenses of any underlying Fidelity Central Funds.
E Amount does not include the portfolio activity of any underlying Fidelity Central Funds.
F Investment income per share reflects a special dividend which amounted to $.01 per share. Excluding the special dividend, the ratio of net investment income (loss) to average net assets would have been (1.42)%.
G Investment income per share reflects a special dividend which amounted to $.01 per share. Excluding the special dividend, the ratio of net investment income (loss) to average net assets would have been (1.59)%.
H Investment income per share reflects a special dividend which amounted to $.01 per share. Excluding the special dividend, the ratio of net investment income (loss) to average net assets would have been (1.60)%.
I Expense ratios reflect operating expenses of the class. Expenses before reductions do not reflect amounts reimbursed by the investment adviser or reductions from brokerage service arrangements or reductions from other expense offset arrangements and do not represent the amount paid by the class during periods when reimbursements or reductions occur. Expenses net of fee waivers reflect expenses after reimbursement by the investment adviser but prior to reductions from brokerage service arrangements or other expense offset arrangements. Expenses net of all reductions represent the net expenses paid by the class.
J Amount represents less than $.01 per share.
See accompanying notes which are an integral part of the financial statements.
Annual Report
Financial Highlights - Class C
Years ended July 31, | 2010 | 2009 | 2008 | 2007 | 2006 |
Selected Per-Share Data | | | | | |
Net asset value, beginning of period | $ 10.55 | $ 13.00 | $ 15.84 | $ 12.77 | $ 12.88 |
Income from Investment Operations | | | | | |
Net investment income (loss) C | (.16) F | (.13) | (.22) | (.23) G | (.20) H |
Net realized and unrealized gain (loss) | 1.89 | (2.32) | (1.71) | 3.36 | .18 |
Total from investment operations | 1.73 | (2.45) | (1.93) | 3.13 | (.02) |
Distributions from net realized gain | - | - | (.91) | (.06) | (.10) |
Redemption fees added to paid in capital C | - J | - J | - J | - J | .01 |
Net asset value, end of period | $ 12.28 | $ 10.55 | $ 13.00 | $ 15.84 | $ 12.77 |
Total Return A, B | 16.40% | (18.85)% | (12.94)% | 24.59% | (.08)% |
Ratios to Average Net Assets D, I | | | | | |
Expenses before reductions | 2.11% | 2.08% | 2.15% | 2.20% | 2.25% |
Expenses net of fee waivers,
if any | 2.11% | 2.08% | 2.15% | 2.15% | 2.15% |
Expenses net of all reductions | 2.09% | 2.07% | 2.14% | 2.14% | 2.10% |
Net investment income (loss) | (1.32)% F | (1.39)% | (1.49)% | (1.55)% G | (1.54)% H |
Supplemental Data | | | | | |
Net assets, end of period
(000 omitted) | $ 18,091 | $ 14,267 | $ 15,946 | $ 22,348 | $ 14,682 |
Portfolio turnover rateE | 105% | 150% | 113% | 91% | 129% |
A Total returns would have been lower had certain expenses not been reduced during the periods shown.
B Total returns do not include the effect of the contingent deferred sales charge.
C Calculated based on average shares outstanding during the period.
D Fees and expenses of the underlying Fidelity Central Funds are not included in the Fund's expense ratio. The Fund indirectly bears its proportionate share of the expenses of any underlying Fidelity Central Funds.
E Amount does not include the portfolio activity of any underlying Fidelity Central Funds.
F Investment income per share reflects a special dividend which amounted to $.01 per share. Excluding the special dividend, the ratio of net investment income (loss) to average net assets would have been (1.42)%.
G Investment income per share reflects a special dividend which amounted to $.01 per share. Excluding the special dividend, the ratio of net investment income (loss) to average net assets would have been (1.59)%.
H Investment income per share reflects a special dividend which amounted to $.01 per share. Excluding the special dividend, the ratio of net investment income (loss) to average net assets would have been (1.60)%.
I Expense ratios reflect operating expenses of the class. Expenses before reductions do not reflect amounts reimbursed by the investment adviser or reductions from brokerage service arrangements or reductions from other expense offset arrangements and do not represent the amount paid by the class during periods when reimbursements or reductions occur. Expenses net of fee waivers reflect expenses after reimbursement by the investment adviser but prior to reductions from brokerage service arrangements or other expense offset arrangements. Expenses net of all reductions represent the net expenses paid by the class.
J Amount represents less than $.01 per share.
See accompanying notes which are an integral part of the financial statements.
Annual Report
Financial Highlights - Small Cap Growth
Years ended July 31, | 2010 | 2009 | 2008 | 2007 | 2006 |
Selected Per-Share Data | | | | | |
Net asset value, beginning of period | $ 10.89 | $ 13.29 | $ 16.15 | $ 12.93 | $ 12.98 |
Income from Investment Operations | | | | | |
Net investment income (loss) B | (.04) E | (.04) | (.07) | (.08) F | (.07) G |
Net realized and unrealized gain (loss) | 1.96 | (2.36) | (1.74) | 3.40 | .19 |
Total from investment operations | 1.92 | (2.40) | (1.81) | 3.32 | .12 |
Distributions from net realized gain | - | - | (1.05) | (.10) | (.18) |
Redemption fees added to paid in capital B | - I | - I | - I | - I | .01 |
Net asset value, end of period | $ 12.81 | $ 10.89 | $ 13.29 | $ 16.15 | $ 12.93 |
Total Return A | 17.63% | (18.06)% | (11.98)% | 25.84% | 1.01% |
Ratios to Average Net Assets C, H | | | | |
Expenses before reductions | 1.08% | 1.08% | 1.11% | 1.10% | 1.13% |
Expenses net of fee waivers,
if any | 1.08% | 1.08% | 1.11% | 1.10% | 1.13% |
Expenses net of all reductions | 1.07% | 1.08% | 1.10% | 1.09% | 1.08% |
Net investment income (loss) | (.29)% E | (.39)% | (.45)% | (.50)% F | (.52)% G |
Supplemental Data | | | | | |
Net assets, end of period (000 omitted) | $ 1,204,818 | $ 1,085,184 | $ 1,217,520 | $ 1,149,809 | $ 402,353 |
Portfolio turnover rate D | 105% | 150% | 113% | 91% | 129% |
A Total returns would have been lower had certain expenses not been reduced during the periods shown.
B Calculated based on average shares outstanding during the period.
C Fees and expenses of the underlying Fidelity Central Funds are not included in the Fund's expense ratio. The Fund indirectly bears its proportionate share of the expenses of any underlying Fidelity Central Funds.
D Amount does not include the portfolio activity of any underlying Fidelity Central Funds.
E Investment income per share reflects a special dividend which amounted to $.01 per share. Excluding the special dividend, the ratio of net investment income (loss) to average net assets would have been (.39)%.
F Investment income per share reflects a special dividend which amounted to $.01 per share. Excluding the special dividend, the ratio of net investment income (loss) to average net assets would have been (.54)%.
G Investment income per share reflects a special dividend which amounted to $.01 per share. Excluding the special dividend, the ratio of net investment income (loss) to average net assets would have been (.58)%.
H Expense ratios reflect operating expenses of the class. Expenses before reductions do not reflect amounts reimbursed by the investment adviser or reductions from brokerage service arrangements or reductions from other expense offset arrangements and do not represent the amount paid by the class during periods when reimbursements or reductions occur. Expenses net of fee waivers reflect expenses after reimbursement by the investment adviser but prior to reductions from brokerage service arrangements or other expense offset arrangements. Expenses net of all reductions represent the net expenses paid by the class.
I Amount represents less than $.01 per share.
See accompanying notes which are an integral part of the financial statements.
Annual Report
Financial Highlights - Class F
Years ended July 31, | 2010 | 2009 I |
Selected Per-Share Data | | |
Net asset value, beginning of period | $ 10.90 | $ 10.03 |
Income from Investment Operations | | |
Net investment income (loss) D | - G, K | (.01) |
Net realized and unrealized gain (loss) | 1.95 | .88 H |
Total from investment operations | 1.95 | .87 |
Redemption fees added to paid in capital D, K | - | - |
Net asset value, end of period | $ 12.85 | $ 10.90 |
Total Return B, C | 17.89% | 8.67% |
Ratios to Average Net Assets E, J | | |
Expenses before reductions | .78% | .74% A |
Expenses net of fee waivers, if any | .78% | .74% A |
Expenses net of all reductions | .77% | .73% A |
Net investment income (loss) | -% G, L | (.54)% A |
Supplemental Data | | |
Net assets, end of period (000 omitted) | $ 106,941 | $ 159 |
Portfolio turnover rate F | 105% | 150% |
A Annualized
B Total returns for periods of less than one year are not annualized.
C Total returns would have been lower had certain expenses not been reduced during the periods shown.
D Calculated based on average shares outstanding during the period.
E Fees and expenses of the underlying Fidelity Central Funds are not included in the Fund's expense ratio. The Fund indirectly bears its proportionate share of the expenses of any underlying Fidelity Central Funds.
F Amount does not include the portfolio activity of any underlying Fidelity Central Funds.
G Investment income per share reflects a special dividend which amounted to $.01 per share. Excluding the special dividend, the ratio of net investment income (loss) to average net assets would have been (.10)%.
H The amount shown for a share outstanding does not correspond with the aggregate net gain (loss) on investments for the period due to the timing of sales and repurchases of shares in relation to fluctuating market values of the investments of the Fund.
I For the period June 26, 2009 (commencement of sale of shares) to July 31, 2009.
J Expense ratios reflect operating expenses of the class. Expenses before reductions do not reflect amounts reimbursed by the investment adviser or reductions from brokerage service arrangements or reductions from other expense offset arrangements and do not represent the amount paid by the class during periods when reimbursements or reductions occur. Expense ratios before reductions for start-up periods may not be representative of longer-term operating periods. Expenses net of fee waivers reflect expenses after reimbursement by the investment adviser but prior to reductions from brokerage service arrangements or other expense offset arrangements. Expenses net of all reductions represent the net expenses paid by the class.
K Amount represents less than $.01 per share.
L Amount represents less than .01%.
See accompanying notes which are an integral part of the financial statements.
Annual Report
Financial Highlights - Institutional Class
Years ended July 31, | 2010 | 2009 | 2008 | 2007 | 2006 |
Selected Per-Share Data | | | | | |
Net asset value, beginning of period | $ 10.91 | $ 13.30 | $ 16.15 | $ 12.92 | $ 12.97 |
Income from Investment Operations | | | | | |
Net investment income (loss) B | (.03) E | (.03) | (.06) | (.07) F | (.07) G |
Net realized and unrealized gain (loss) | 1.95 | (2.36) | (1.74) | 3.41 | .19 |
Total from investment operations | 1.92 | (2.39) | (1.80) | 3.34 | .12 |
Distributions from net realized gain | - | - | (1.05) | (.11) | (.18) |
Redemption fees added to paid in capital B | - I | - I | - I | - I | .01 |
Net asset value, end of period | $ 12.83 | $ 10.91 | $ 13.30 | $ 16.15 | $ 12.92 |
Total Return A | 17.60% | (17.97)% | (11.93)% | 25.99% | .97% |
Ratios to Average Net Assets C, H | | | | | |
Expenses before reductions | 1.03% | 1.05% | 1.04% | 1.05% | 1.10% |
Expenses net of fee waivers,
if any | 1.03% | 1.05% | 1.04% | 1.05% | 1.10% |
Expenses net of all reductions | 1.02% | 1.04% | 1.03% | 1.05% | 1.05% |
Net investment income (loss) | (.24)% E | (.36)% | (.38)% | (.46)% F | (.49)% G |
Supplemental Data | | | | | |
Net assets, end of period
(000 omitted) | $ 25,650 | $ 19,204 | $ 22,444 | $ 18,671 | $ 14,233 |
Portfolio turnover rate D | 105% | 150% | 113% | 91% | 129% |
A Total returns would have been lower had certain expenses not been reduced during the periods shown.
B Calculated based on average shares outstanding during the period.
C Fees and expenses of the underlying Fidelity Central Funds are not included in the Fund's expense ratio. The Fund indirectly bears its proportionate share of the expenses of any underlying Fidelity Central Funds.
D Amount does not include the portfolio activity of any underlying Fidelity Central Funds.
E Investment income per share reflects a special dividend which amounted to $.01 per share. Excluding the special dividend, the ratio of net investment income (loss) to average net assets would have been (.34)%.
F Investment income per share reflects a special dividend which amounted to $.01 per share. Excluding the special dividend, the ratio of net investment income (loss) to average net assets would have been (.50)%.
G Investment income per share reflects a special dividend which amounted to $.01 per share. Excluding the special dividend, the ratio of net investment income (loss) to average net assets would have been (.55)%.
H Expense ratios reflect operating expenses of the class. Expenses before reductions do not reflect amounts reimbursed by the investment adviser or reductions from brokerage service arrangements or reductions from other expense offset arrangements and do not represent the amount paid by the class during periods when reimbursements or reductions occur. Expenses net of fee waivers reflect expenses after reimbursement by the investment adviser but prior to reductions from brokerage service arrangements or other expense offset arrangements. Expenses net of all reductions represent the net expenses paid by the class.
I Amount represents less than $.01 per share.
See accompanying notes which are an integral part of the financial statements.
Annual Report
Notes to Financial Statements
For the period ended July 31, 2010
1. Organization.
Fidelity Small Cap Growth Fund (the Fund) is a fund of Fidelity Securities Fund (the Trust) and is authorized to issue an unlimited number of shares. The Trust is registered under the Investment Company Act of 1940, as amended (the 1940 Act), as an open-end management investment company organized as a Massachusetts business trust. The Fund offers Class A, Class T, Class B, Class C, Small Cap Growth, Class F and Institutional Class shares, each of which has equal rights as to assets and voting privileges. Effective after the close of business on September 1, 2010, Class B shares will be closed to new accounts and additional purchases by existing shareholders. Each class has exclusive voting rights with respect to matters that affect that class. Class F shares of the Fund are only available for purchase by mutual funds for which Fidelity Management & Research Company (FMR) or an affiliate serves as investment manager. Class B shares will automatically convert to Class A shares after a holding period of seven years from the initial date of purchase. Investment income, realized and unrealized capital gains and losses, the common expenses of the Fund, and certain fund-level expense reductions, if any, are allocated on a pro-rata basis to each class based on the relative net assets of each class to the total net assets of the Fund. Each class differs with respect to transfer agent and distribution and service plan fees incurred. Certain expense reductions also differ by class.
2. Investments in Fidelity Central Funds.
The Fund may invest in Fidelity Central Funds, which are open-end investment companies available only to other investment companies and accounts managed by FMR and its affiliates. The Fund's Schedule of Investments lists each of the Fidelity Central Funds held as of period end, if any, as an investment of the Fund, but does not include the underlying holdings of each Fidelity Central Fund. As an Investing Fund, the Fund indirectly bears its proportionate share of the expenses of the underlying Fidelity Central Funds.
The Money Market Central Funds seek preservation of capital and current income and are managed by Fidelity Investments Money Management, Inc. (FIMM), an affiliate of FMR.
A complete unaudited list of holdings for each Fidelity Central Fund is available upon request or at the Securities and Exchange Commission (the SEC) web site at www.sec.gov. In addition, the financial statements of the Fidelity Central Funds which are not covered by the Fund's Report of Independent Registered Public Accounting Firm, are available on the SEC web site or upon request.
Annual Report
3. Significant Accounting Policies.
The financial statements have been prepared in conformity with accounting principles generally accepted in the United States of America (GAAP), which require management to make certain estimates and assumptions at the date of the financial statements. Actual results could differ from those estimates. The following summarizes the significant accounting policies of the Fund:
Security Valuation. Investments are valued as of 4:00 p.m. Eastern time on the last calendar day of the period. The Fund uses independent pricing services approved by the Board of Trustees to value its investments. When current market prices or quotations are not readily available or reliable, valuations may be determined in good faith in accordance with procedures adopted by the Board of Trustees. Factors used in determining value may include market or security specific events. The frequency with which these procedures are used cannot be predicted and they may be utilized to a significant extent. The value used for net asset value (NAV) calculation under these procedures may differ from published prices for the same securities.
The Fund categorizes the inputs to valuation techniques used to value its investments into a disclosure hierarchy consisting of three levels as shown below.
Level 1 - quoted prices in active markets for identical investments
Level 2 - other significant observable inputs (including quoted prices for similar investments, interest rates, prepayment speeds, etc.)
Level 3 - unobservable inputs (including the fund's own assumptions based on the best information available)
Changes in valuation techniques may result in transfers in or out of an assigned level within the disclosure hierarchy. The aggregate value of investments by input level, as of July 31, 2010 is included at the end of the Fund's Schedule of Investments. Valuation techniques used to value the Fund's investments by major category are as follows.
Equity securities, including restricted securities, for which market quotations are readily available, are valued at the last reported sale price or official closing price as reported by an independent pricing service on the primary market or exchange on which they are traded and are categorized as Level 1 in the hierarchy. In the event there were no sales during the day or closing prices are not available, securities are valued at the last quoted bid price or may be valued using the last available price and are generally categorized as Level 2 in the hierarchy. For foreign equity securities, when significant market or security specific events arise, comparisons to the valuation of American Depositary Receipts (ADRs) futures contracts, Exchange-traded funds (ETFs) and certain indexes as well as quoted prices for similar securities are used and are categorized as Level 2 in the hierarchy
Annual Report
Notes to Financial Statements - continued
3. Significant Accounting Policies - continued
Security Valuation - continued
in these circumstances. Utilizing these techniques may result in transfers between Level 1 and Level 2. For restricted equity securities and private placements where observable inputs are limited, assumptions about market activity and risk are used and are categorized as Level 3 in the hierarchy.
Investments in open-end mutual funds, including the Fidelity Central Funds, are valued at their closing net asset value each business day and are categorized as Level 1 in the hierarchy. Short-term securities with remaining maturities of sixty days or less for which quotations are not readily available are valued at amortized cost, which approximates fair value and are categorized as Level 2 in the hierarchy.
Foreign Currency. The Fund uses foreign currency contracts to facilitate transactions in foreign-denominated securities. Gains and losses from these transactions may arise from changes in the value of the foreign currency or if the counterparties do not perform under the contracts' terms.
Foreign-denominated assets, including investment securities, and liabilities are translated into U.S. dollars at the exchange rate at period end. Purchases and sales of investment securities, income and dividends received and expenses denominated in foreign currencies are translated into U.S. dollars at the exchange rate in effect on the transaction date.
The effects of exchange rate fluctuations on investments are included with the net realized and unrealized gain (loss) on investment securities. Other foreign currency transactions resulting in realized and unrealized gain (loss) are disclosed separately.
Investment Transactions and Income. For financial reporting purposes, the Fund's investment holdings and NAV include trades executed through the end of the last business day of the period. The NAV per share for processing shareholder transactions is calculated as of the close of business of the New York Stock Exchange (NYSE), normally 4:00 p.m. Eastern time and includes trades executed through the end of the prior business day. Gains and losses on securities sold are determined on the basis of identified cost and may include proceeds received from litigation. Dividend income is recorded on the ex-dividend date, except for certain dividends from foreign securities where the ex-dividend date may have passed, which are recorded as soon as the Fund is informed of the ex-dividend date. Non-cash dividends included in dividend income, if any, are recorded at the fair market value of the securities received. Distributions received on securities that represent a return of capital or capital gain are recorded as a reduction of cost of investments and/or as a realized gain. The Fund estimates the components of distributions received that may be considered return of capital distributions or capital
Annual Report
3. Significant Accounting Policies - continued
Investment Transactions and Income - continued
gain distributions. Large, non-recurring dividends recognized by the Fund are presented separately on the Statement of Operations as "Special Dividends" and the impact of these dividends is presented in the Financial Highlights. Interest income and distributions from the Fidelity Central Funds are accrued as earned. Interest income includes coupon interest and amortization of premium and accretion of discount on debt securities. Investment income is recorded net of foreign taxes withheld where recovery of such taxes is uncertain.
Expenses. Most expenses of the Trust can be directly attributed to a fund. Expenses which cannot be directly attributed are apportioned amongst each fund in the Trust. Expense estimates are accrued in the period to which they relate and adjustments are made when actual amounts are known.
Income Tax Information and Distributions to Shareholders. Each year the Fund intends to qualify as a regulated investment company, including distributing substantially all of its taxable income and realized gains under Subchapter M of the Internal Revenue Code and filing its U.S. federal tax return. As a result, no provision for income taxes is required. As of July 31, 2010, the Fund did not have any unrecognized tax benefits in the accompanying financial statements. A fund's federal tax return is subject to examination by the Internal Revenue Service (IRS) for a period of three years. Foreign taxes are provided for based on the Fund's understanding of the tax rules and rates that exist in the foreign markets in which it invests.
Distributions are recorded on the ex-dividend date. Income dividends and capital gain distributions are declared separately for each class. Income and capital gain distributions are determined in accordance with income tax regulations, which may differ from GAAP.
Capital accounts within the financial statements are adjusted for permanent book-tax differences. These adjustments have no impact on net assets or the results of operations. Temporary book-tax differences will reverse in a subsequent period.
Book-tax differences are primarily due to the short-term gain distributions from the Fidelity Central Funds, foreign currency transactions, net operating losses, capital loss carryforwards, losses deferred due to wash sales and excise tax regulations.
The federal tax cost of investment securities and unrealized appreciation (depreciation) as of period end were as follows:
Gross unrealized appreciation | $ 169,655,477 |
Gross unrealized depreciation | (101,524,996) |
Net unrealized appreciation (depreciation) | $ 68,130,481 |
| |
Tax Cost | $ 1,435,126,832 |
Annual Report
Notes to Financial Statements - continued
3. Significant Accounting Policies - continued
Income Tax Information and Distributions to Shareholders - continued
The tax-based components of distributable earnings as of period end were as follows:
Capital loss carryforward | $ (193,259,144) |
Net unrealized appreciation (depreciation) | $ 68,128,895 |
Short-Term Trading (Redemption) Fees. Shares held in the Fund less than 90 days are subject to a redemption fee equal to 1.50% of the proceeds of the redeemed shares. All redemption fees, including any estimated redemption fees paid by FMR, are retained by the Fund and accounted for as an addition to paid in capital.
4. Purchases and Sales of Investments.
Purchases and sales of securities, other than short-term securities, aggregated $1,359,919,734 and $1,335,378,288, respectively.
5. Fees and Other Transactions with Affiliates.
Management Fee. FMR and its affiliates provide the Fund with investment management related services for which the Fund pays a monthly management fee. The management fee is the sum of an individual fund fee rate that is based on an annual rate of .45% of the Fund's average net assets and a group fee rate that averaged .26% during the period. The group fee rate is based upon the average net assets of all the mutual funds advised by FMR. The group fee rate decreases as assets under management increase and increases as assets under management decrease. In addition, the management fee is subject to a performance adjustment (up to a maximum of ± .20% of the Fund's average net assets over a 36 month performance period). The upward or downward adjustment to the management fee is based on the relative investment performance of the retail class of the Fund, Small Cap Growth, as compared to an appropriate benchmark index. For the period, the total annual management fee rate, including the performance adjustment, was .73% of the Fund's average net assets.
Distribution and Service Plan. In accordance with Rule 12b-1 of the 1940 Act, the Fund has adopted separate Distribution and Service Plans for each class of shares. Certain classes pay Fidelity Distributors Corporation (FDC), an affiliate of FMR, separate Distribution and Service Fees, each of which is based on an annual percentage of each class' average net assets. In addition, FDC may pay financial intermediaries for
Annual Report
5. Fees and Other Transactions with Affiliates - continued
Distribution and Service Plan - continued
selling shares of the Fund and providing shareholder support services. For the period, the Distribution and Service Fee rates and the total amounts paid to and retained by FDC were as follows:
| Distribution
Fee | Service
Fee | Paid to
FDC | Retained
by FDC |
Class A | -% | .25% | $ 117,878 | $ 2,297 |
Class T | .25% | .25% | 118,478 | - |
Class B | .75% | .25% | 49,164 | 36,913 |
Class C | .75% | .25% | 173,281 | 40,211 |
| | | $ 458,801 | $ 79,421 |
Sales Load. FDC receives a front-end sales charge of up to 5.75% for selling Class A shares, and 3.50% for selling Class T shares, some of which is paid to financial intermediaries for selling shares of the Fund. FDC receives the proceeds of contingent deferred sales charges levied on Class A, Class T, Class B, and Class C redemptions. These charges depend on the holding period. The deferred sales charges range from 5% to 1% for Class B, 1% for Class C, 1.00% for certain purchases of Class A shares (1.00% to .50% prior to July 12, 2010) and .25% for certain purchases of Class T shares.
For the period, sales charge amounts retained by FDC were as follows:
| Retained
by FDC |
Class A | $ 27,622 |
Class T | 6,101 |
Class B* | 8,154 |
Class C* | 2,438 |
| $ 44,315 |
* When Class B and Class C shares are initially sold, FDC pays commissions from its own resources to financial intermediaries through which the
sales are made.
Transfer Agent Fees. Fidelity Investments Institutional Operations Company, Inc. (FIIOC), an affiliate of FMR, is the transfer, dividend disbursing and shareholder servicing agent for each class of the Fund. FIIOC receives account fees and asset-based fees that vary according to the account size and type of account of the shareholders of the Fund, except for Class F. FIIOC receives no fees for providing transfer agency services to Class F.
Annual Report
Notes to Financial Statements - continued
5. Fees and Other Transactions with Affiliates - continued
Transfer Agent Fees - continued
FIIOC pays for typesetting, printing and mailing of shareholder reports, except proxy statements. For the period, the total transfer agent fees paid by each class were as follows:
| Amount | % of
Average
Net Assets |
Class A | $ 150,515 | .32 |
Class T | 77,623 | .33 |
Class B | 15,920 | .32 |
Class C | 56,034 | .32 |
Small Cap Growth | 3,522,221 | .29 |
Institutional Class | 52,794 | .24 |
| $ 3,875,107 | |
Accounting and Security Lending Fees. Fidelity Service Company, Inc. (FSC), an affiliate of FMR, maintains the Fund's accounting records. The accounting fee is based on the level of average net assets for the month. Under a separate contract, FSC administers the security lending program. The security lending fee is based on the number and duration of lending transactions.
Brokerage Commissions. The Fund placed a portion of its portfolio transactions with brokerage firms which are affiliates of the investment adviser. The commissions paid to these affiliated firms were $26,958 for the period.
6. Committed Line of Credit.
The Fund participates with other funds managed by FMR in a $3.75 billion credit facility (the "line of credit") to be utilized for temporary or emergency purposes to fund shareholder redemptions or for other short-term liquidity purposes. The Fund has agreed to pay commitment fees on its pro-rata portion of the line of credit, which amounted to $5,294 and is reflected in Miscellaneous expenses on the Statement of Operations. During the period, there were no borrowings on this line of credit.
7. Security Lending.
The Fund lends portfolio securities from time to time in order to earn additional income. On the settlement date of the loan, the Fund receives collateral (in the form of U.S. Treasury obligations, letters of credit and/or cash) against the loaned securities and maintains collateral in an amount not less than 100% of the market value of the loaned securities during the period of the loan. The market value of the loaned securities is
Annual Report
7. Security Lending - continued
determined at the close of business of the Fund and any additional required collateral is delivered to the Fund on the next business day. If the borrower defaults on its obligation to return the securities loaned because of insolvency or other reasons, a fund could experience delays and costs in recovering the securities loaned or in gaining access to the collateral. Any cash collateral received is invested in the Fidelity Securities Lending Cash Central Fund. The value of loaned securities and cash collateral at period end are disclosed on the Fund's Statement of Assets and Liabilities. Security lending income represents the income earned on investing cash collateral, less fees and expenses associated with the loan, plus any premium payments that may be received on the loan of certain types of securities. Security lending income is presented in the Statement of Operations as a component of income from Fidelity Central Funds.
8. Expense Reductions.
Many of the brokers with whom FMR places trades on behalf of the Fund provided services to the Fund in addition to trade execution. These services included payments of certain expenses on behalf of the Fund totaling $169,391 for the period. In addition, through arrangements with the Fund's custodian, credits realized as a result of uninvested cash balances were used to reduce the Fund's expenses. During the period, these credits reduced the Fund's custody expenses by $68.
9. Share Transactions.
Transactions for each class of shares were as follows:
| Shares | Dollars |
Years ended July 31, | 2010 | 2009 A | 2010 | 2009 A |
Class A | | | | |
Shares sold | 1,755,238 | 1,768,538 | $ 21,749,463 | $ 16,919,128 |
Shares redeemed | (1,481,231) | (1,239,291) | (17,861,442) | (11,138,983) |
Net increase (decrease) | 274,007 | 529,247 | $ 3,888,021 | $ 5,780,145 |
Class T | | | | |
Shares sold | 492,575 | 1,485,602 | $ 6,056,365 | $ 12,842,623 |
Shares redeemed | (592,408) | (1,132,759) | (7,232,100) | (9,596,209) |
Net increase (decrease) | (99,833) | 352,843 | $ (1,175,735) | $ 3,246,414 |
Class B | | | | |
Shares sold | 117,304 | 116,072 | $ 1,414,923 | $ 1,042,949 |
Shares redeemed | (93,928) | (145,097) | (1,126,513) | (1,355,668) |
Net increase (decrease) | 23,376 | (29,025) | $ 288,410 | $ (312,719) |
A Share transactions for Class F are for the period July 26, 2009 (commencement of sale of shares) to July 31, 2009.
Annual Report
Notes to Financial Statements - continued
9. Share Transactions - continued
| Shares | Dollars |
Years ended July 31, | 2010 | 2009 A | 2010 | 2009 A |
Class C | | | | |
Shares sold | 479,633 | 604,934 | $ 5,791,649 | $ 5,793,290 |
Shares redeemed | (358,550) | (479,386) | (4,319,904) | (4,290,700) |
Net increase (decrease) | 121,083 | 125,548 | $ 1,471,745 | $ 1,502,590 |
Small Cap Growth | | | | |
Shares sold | 22,893,960 | 30,718,046 | $ 285,679,819 | $ 287,281,815 |
Shares redeemed | (28,450,958) | (22,726,319) | (351,525,118) | (209,407,815) |
Net increase (decrease) | (5,556,998) | 7,991,727 | $ (65,845,299) | $ 77,874,000 |
Class F | | | | |
Shares sold | 8,663,528 | 14,590 | $ 109,176,128 | $ 145,457 |
Shares redeemed | (357,394) | (12) | (4,690,130) | (113) |
Net increase (decrease) | 8,306,134 | 14,578 | $ 104,485,998 | $ 145,344 |
Institutional Class | | | | |
Shares sold | 1,109,901 | 802,152 | $ 14,013,757 | $ 7,245,594 |
Shares redeemed | (871,545) | (728,847) | (10,548,734) | (6,247,810) |
Net increase (decrease) | 238,356 | 73,305 | $ 3,465,023 | $ 997,784 |
A Share transactions for Class F are for the period July 26, 2009 (commencement of sale of shares) to July 31, 2009.
10. Other.
The Fund's organizational documents provide former and current trustees and officers with a limited indemnification against liabilities arising in connection with the performance of their duties to the Fund. In the normal course of business, the Fund may also enter into contracts that provide general indemnifications. The Fund's maximum exposure under these arrangements is unknown as this would be dependent on future claims that may be made against the Fund. The risk of material loss from such claims is considered remote.
At the end of the period, Fidelity Freedom 2020 Fund was the owner of record of approximately 10% of the total outstanding shares of the Fund. The Fidelity Freedom Funds and Fidelity Freedom K Funds were the owners of record, in the aggregate, of approximately 54% of the total outstanding shares of the Fund.
Annual Report
To the Trustees of Fidelity Securities Fund and the Shareholders of Fidelity Small Cap Growth Fund:
In our opinion, the accompanying statement of assets and liabilities, including the schedule of investments, and the related statements of operations and of changes in net assets and the financial highlights present fairly, in all material respects, the financial position of Fidelity Small Cap Growth Fund (a fund of Fidelity Securities Fund) at July 31, 2010, the results of its operations for the year then ended, the changes in its net assets for each of the two years in the period then ended and the financial highlights for each of the periods indicated, in conformity with accounting principles generally accepted in the United States of America. These financial statements and financial highlights (hereafter referred to as "financial statements") are the responsibility of the Fidelity Small Cap Growth Fund's management. Our responsibility is to express an opinion on these financial statements based on our audits. We conducted our audits of these financial statements in accordance with the standards of the Public Company Accounting Oversight Board (United States). Those standards require that we plan and perform the audit to obtain reasonable assurance about whether the financial statements are free of material misstatement. An audit includes examining, on a test basis, evidence supporting the amounts and disclosures in the financial statements, assessing the accounting principles used and significant estimates made by management, and evaluating the overall financial statement presentation. We believe that our audits, which included confirmation of securities at July 31, 2010 by correspondence with the custodian and brokers, provide a reasonable basis for our opinion.
/s/ PricewaterhouseCoopers LLP
PricewaterhouseCoopers LLP
Boston, Massachusetts
September 14, 2010
Annual Report
The Trustees, Member of the Advisory Board, and executive officers of the trust and fund, as applicable, are listed below. The Board of Trustees governs the fund and is responsible for protecting the interests of shareholders. The Trustees are experienced executives who meet periodically throughout the year to oversee the fund's activities, review contractual arrangements with companies that provide services to the fund, oversee management of the risks associated with such activities and contractual arrangements, and review the fund's performance. Except for James C. Curvey, each of the Trustees oversees 222 funds advised by FMR or an affiliate. Mr. Curvey oversees 411 funds advised by FMR or an affiliate.
The Trustees hold office without limit in time except that (a) any Trustee may resign; (b) any Trustee may be removed by written instrument, signed by at least two-thirds of the number of Trustees prior to such removal; (c) any Trustee who requests to be retired or who has become incapacitated by illness or injury may be retired by written instrument signed by a majority of the other Trustees; and (d) any Trustee may be removed at any special meeting of shareholders by a two-thirds vote of the outstanding voting securities of the trust. Each Trustee who is not an interested person (as defined in the 1940 Act) (Independent Trustee), shall retire not later than the last day of the calendar year in which his or her 72nd birthday occurs. The Independent Trustees may waive this mandatory retirement age policy with respect to individual Trustees. The executive officers and Advisory Board Member hold office without limit in time, except that any officer and Advisory Board Member may resign or may be removed by a vote of a majority of the Trustees at any regular meeting or any special meeting of the Trustees. Except as indicated, each individual has held the office shown or other offices in the same company for the past five years.
Experience, Skills, Attributes, and Qualifications of the Fund's Trustees. The Governance and Nominating Committee has adopted a statement of policy that describes the experience, qualifications, attributes, and skills that are necessary and desirable for potential Independent Trustee candidates (Statement of Policy). The Board believes that each Trustee satisfied at the time he or she was initially elected or appointed a Trustee, and continues to satisfy, the standards contemplated by the Statement of Policy. The Governance and Nominating Committee also engages professional search firms to help identify potential Independent Trustee candidates who have the experience, qualifications, attributes, and skills consistent with the Statement of Policy. From time to time, additional criteria based on the composition and skills of the current Independent Trustees, as well as experience or skills that may be appropriate in light of future changes to board composition, business conditions, and regulatory or other developments, have also been considered by the professional search firms and the Governance and Nominating Committee. In addition, the Board takes into account the Trustees' commitment and participation in Board and committee meetings, as well as their leadership of standing and ad hoc committees throughout their tenure.
In determining that a particular Trustee was and continues to be qualified to serve as a Trustee, the Board has considered a variety of criteria, none of which, in isolation, was controlling. The Board believes that, collectively, the Trustees have balanced and diverse experience, qualifications, attributes, and skills, which allow the Board to operate effectively in governing the fund and protecting the interests of shareholders. Information about the specific experience, skills, attributes, and qualifications of each Trustee, which in each case led to the Board's conclusion that the Trustee should serve (or continue to serve) as a trustee of the fund, is provided below.
Annual Report
Trustees and Officers - continued
Board Structure and Oversight Function. Edward C. Johnson 3d is an interested person (as defined in the 1940 Act) and currently serves as Chairman. The Trustees have determined that an interested Chairman is appropriate and benefits shareholders because an interested Chairman has a personal and professional stake in the quality and continuity of services provided to the fund. Independent Trustees exercise their informed business judgment to appoint an individual of their choosing to serve as Chairman, regardless of whether the Trustee happens to be independent or a member of management. The Independent Trustees have determined that they can act independently and effectively without having an Independent Trustee serve as Chairman and that a key structural component for assuring that they are in a position to do so is for the Independent Trustees to constitute a substantial majority for the Board. The Independent Trustees also regularly meet in executive session. Ned C. Lautenbach serves as Chairman of the Independent Trustees and as such (i) acts as a liaison between the Independent Trustees and management with respect to matters important to the Independent Trustees and (ii) with management prepares agendas for Board meetings.
Fidelity funds are overseen by different Boards of Trustees. The fund Board oversees Fidelity's equity and high income funds and another Board oversees Fidelity's investment-grade bond, money market, and asset allocation funds. The asset allocation funds may invest in Fidelity funds overseen by the fund's Board. The use of separate Boards, each with its own committee structure, allows the Trustees of each group of Fidelity funds to focus on the unique issues of the funds they oversee, including common research, investment, and operational issues. On occasion, the separate Boards establish joint committees to address issues of overlapping consequences for the Fidelity funds overseen by each Board.
The Trustees operate using a system of committees to facilitate the timely and efficient consideration of all matters of importance to the Trustees, the fund, and fund shareholders and to facilitate compliance with legal and regulatory requirements and oversight of the fund's activities and associated risks. The Board, acting through its committees, has charged FMR and its affiliates with (i) identifying events or circumstances the occurrence of which could have demonstrably adverse effects on the fund's business and/or reputation; (ii) implementing processes and controls to lessen the possibility that such events or circumstances occur or to mitigate the effects of such events or circumstances if they do occur; and (iii) creating and maintaining a system designed to evaluate continuously business and market conditions in order to facilitate the identification and implementation processes described in (i) and (ii) above. Because the day-to-day operations and activities of the fund's are carried out by or through FMR, its affiliates and other service providers, the fund's exposure to risks is mitigated but not eliminated by the processes overseen by the Trustees. While each of the Board's committees has responsibility for overseeing different aspects of the fund's activities, oversight is exercised primarily through the Operations, Audit, and Compliance Committees. Appropriate personnel, including but not limited to the fund's Chief Compliance Officer (CCO), FMR's internal auditor, the independent accountants, the fund's Treasurer and portfolio management personnel, make periodic reports to the Board's committees, as appropriate. The responsibilities of each committee, including their oversight responsibilities, are described further under "Standing Committees of the Fund's Trustees."
Annual Report
The fund's Statement of Additional Information (SAI) includes more information about the Trustees. To request a free copy, call Fidelity at 1-800-544-8544.
Interested Trustees*:
Correspondence intended for each Trustee who is an interested person may be sent to Fidelity Investments, 82 Devonshire Street, Boston, Massachusetts 02109.
Name, Age; Principal Occupations and Other Relevant Experience+ |
Edward C. Johnson 3d (80) |
| Year of Election or Appointment: 1984 Mr. Johnson is Trustee and Chairman of the Board of Trustees of certain Trusts. Mr. Johnson serves as Chief Executive Officer, Chairman, and a Director of FMR LLC; Chairman and a Director of FMR; Chairman and a Director of Fidelity Research & Analysis Company (FRAC); Chairman and a Director of Fidelity Investments Money Management, Inc.; and Chairman and a Director of FMR Co., Inc. In addition, Mr. Johnson serves as Chairman and Director of FIL Limited. Previously, Mr. Johnson served as President of FMR LLC (2006-2007). |
James C. Curvey (75) |
| Year of Election or Appointment: 2007 Mr. Curvey also serves as Trustee (2007-present) of other investment companies advised by FMR. Mr. Curvey is a Director of FMR and FMR Co., Inc. (2007-present). Mr. Curvey is also Vice Chairman (2006-present) and Director of FMR LLC. In addition, Mr. Curvey serves as an Overseer for the Boston Symphony Orchestra and a member of the Trustees of Villanova University. |
* Trustees have been determined to be "Interested Trustees" by virtue of, among other things, their affiliation with the trust or various entities under common control with FMR.
+ The information above includes each Trustee's principal occupation during the last five years and other information relating to the experience, attributes, and skills relevant to each Trustee's qualifications to serve as a Trustee, which led to the conclusion that each Trustee should serve as a Trustee for the fund.
Annual Report
Trustees and Officers - continued
Independent Trustees:
Correspondence intended for each Independent Trustee (that is, the Trustees other than the Interested Trustees) may be sent to Fidelity Investments, P.O. Box 55235, Boston, Massachusetts 02205-5235.
Name, Age; Principal Occupations and Other Relevant Experience+ |
Dennis J. Dirks (62) |
| Year of Election or Appointment: 2005 Prior to his retirement in May 2003, Mr. Dirks was Chief Operating Officer and a member of the Board of The Depository Trust & Clearing Corporation (DTCC). He also served as President, Chief Operating Officer, and Board member of The Depository Trust Company (DTC) and President and Board member of the National Securities Clearing Corporation (NSCC). In addition, Mr. Dirks served as Chief Executive Officer and Board member of the Government Securities Clearing Corporation, Chief Executive Officer and Board member of the Mortgage-Backed Securities Clearing Corporation, as a Trustee and a member of the Finance Committee of Manhattan College (2005-2008), and as a Trustee and a member of the Finance Committee of AHRC of Nassau County (2006-2008). Currently, Mr. Dirks serves as a member of the Board of Directors for The Brookville Center for Children's Services, Inc. (2009-present). |
Alan J. Lacy (56) |
| Year of Election or Appointment: 2008 Mr. Lacy serves as Senior Adviser (2007-present) of Oak Hill Capital Partners, L.P. (private equity). Mr. Lacy also served as Chief Executive Officer (2000-2005) and Vice Chairman (2005-2006) of Sears Holdings Corporation and Sears, Roebuck and Co. (retail). In addition, Mr. Lacy serves as a member of the Board of Directors of The Western Union Company (global money transfer, 2006-present) and Bristol-Myers Squibb Company (global pharmaceuticals, 2007-present). Mr. Lacy is Chairman (2008-present) and a member (2006-present) of the Board of Trustees of The National Parks Conservation Association. |
Ned C. Lautenbach (66) |
| Year of Election or Appointment: 2000 Mr. Lautenbach is Chairman of the Independent Trustees of the Equity and High Income Funds (2006-present). Mr. Lautenbach is an Advisory Partner of Clayton, Dubilier & Rice, Inc. (private equity investment, 2008-present) and was previously a Partner of Clayton, Dubilier & Rice, Inc. (1998-2008). Previously, Mr. Lautenbach was with the International Business Machines Corporation (IBM) from 1968 until his retirement in 1998. Mr. Lautenbach serves as a Director of Eaton Corporation (diversified industrial) as well as the Philharmonic Center for the Arts in Naples, Florida. Mr. Lautenbach is also a member of the Board of Trustees of Fairfield University (2005-present), as well as a member of the Council on Foreign Relations. Previously, Mr. Lautenbach served as a Director of Sony Corporation (2006-2007). |
Joseph Mauriello (65) |
| Year of Election or Appointment: 2008 Prior to his retirement in January 2006, Mr. Mauriello served in numerous senior management positions including Deputy Chairman and Chief Operating Officer (2004-2005), and Vice Chairman of Financial Services (2002-2004) of KPMG LLP US (professional services, 1965-2005). Mr. Mauriello currently serves as a member of the Board of Directors of XL Capital Ltd. (global insurance and re-insurance, 2006-present) and of Arcadia Resources Inc. (health care services and products, 2007-present). Previously, Mr. Mauriello served as a Director of the Hamilton Funds of the Bank of New York (2006-2007). |
Cornelia M. Small (66) |
| Year of Election or Appointment: 2005 Ms. Small is a member of the Board of Directors of the Teagle Foundation (2009-present). Ms. Small is also a member of the Investment Committee, and Chair (2008-present) and a member of the Board of Trustees of Smith College. In addition, Ms. Small serves on the Investment Committee of the Berkshire Taconic Community Foundation (2008-present). Previously, Ms. Small served as Chairperson of the Investment Committee (2002-2008) of Smith College. In addition, Ms. Small served as Chief Investment Officer, Director of Global Equity Investments, and a member of the Board of Directors of Scudder, Stevens & Clark and Scudder Kemper Investments. |
William S. Stavropoulos (71) |
| Year of Election or Appointment: 2002 Mr. Stavropoulos is Vice Chairman of the Independent Trustees of the Equity and High Income Funds (2006-present). Mr. Stavropoulos serves as President and Founder of the Michigan Baseball Foundation, the Great Lakes Loons (2007-present). Mr. Stavropoulos is Chairman Emeritus of the Board of Directors of The Dow Chemical Company, where he previously served in numerous senior management positions, including President, CEO (1995-2000; 2002-2004), Chairman of the Executive Committee (2000-2006), and as a member of the Board of Directors (1990-2006). Currently, Mr. Stavropoulos is a Director of Teradata Corporation (data warehousing and technology solutions, 2008-present), Chemical Financial Corporation, Maersk Inc. (industrial conglomerate), Tyco International, Inc. (multinational manufacturing and services, 2007-present), and a member of the Advisory Board for Metalmark Capital (private equity investment, 2005-present). Mr. Stavropoulos is a special advisor to Clayton, Dubilier & Rice, Inc. (private equity investment). In addition, Mr. Stavropoulos is a member of the University of Notre Dame Advisory Council for the College of Science. |
David M. Thomas (61) |
| Year of Election or Appointment: 2008 Previously, Mr. Thomas served as Executive Chairman (2005-2006) and Chairman and Chief Executive Officer (2000-2005) of IMS Health, Inc. (pharmaceutical and healthcare information solutions). In addition, Mr. Thomas serves as a member of the Board of Directors of Fortune Brands, Inc. (consumer products), and Interpublic Group of Companies, Inc. (marketing communication, 2004-present). |
Michael E. Wiley (59) |
| Year of Election or Appointment: 2008 Mr. Wiley also serves as a Director of Asia Pacific Exploration Consolidated (international oil and gas exploration and production, 2008-present), and as a member of the Board of Trustees of the University of Tulsa (2000-2006; 2007-present). Mr. Wiley serves as a Director of Tesoro Corporation (independent oil refiner and marketer, 2005-present), and a Director of Bill Barrett Corporation (exploration and production, 2005-present). In addition, Mr. Wiley also serves as a Director of Post Oak Bank (privately-held bank, 2004-present). Previously, Mr. Wiley served as a Sr. Energy Advisor of Katzenbach Partners, LLC (consulting, 2006-2007), as an Advisory Director of Riverstone Holdings (private investment), Chairman, President, and CEO of Baker Hughes, Inc. (oilfield services, 2000-2004), and as Director of Spinnaker Exploration Company (exploration and production, 2001-2005). |
Annual Report
+ The information above includes each Trustee's principal occupation during the last five years and other information relating to the experience, attributes, and skills relevant to each Trustee's qualifications to serve as a Trustee, which led to the conclusion that each Trustee should serve as a Trustee for the fund.
Advisory Board Member and Executive Officers:
Correspondence intended for each executive officer and Peter S. Lynch may be sent to Fidelity Investments, 82 Devonshire Street, Boston, Massachusetts 02109.
Name, Age; Principal Occupation |
Peter S. Lynch (66) |
| Year of Election or Appointment: 2003 Member of the Advisory Board of Fidelity's Equity and High Income Funds. Mr. Lynch is Vice Chairman and a Director of FMR and FMR Co., Inc. In addition, Mr. Lynch serves as a Trustee of Boston College and as the Chairman of the Inner-City Scholarship Fund. Previously, Mr. Lynch served on the Special Olympics International Board of Directors (1997-2006). |
Kenneth B. Robins (40) |
| Year of Election or Appointment: 2008 President and Treasurer of Fidelity's Equity and High Income Funds. Mr. Robins also serves as President and Treasurer (2010-present) and Assistant Treasurer (2009-present) of other Fidelity funds and is an employee of Fidelity Investments (2004-present). Previously, Mr. Robins served as Deputy Treasurer of the Fidelity funds (2005-2008) and Treasurer and Chief Financial Officer of The North Carolina Capital Management Trust: Cash and Term Portfolios (2006-2008). |
Brian B. Hogan (45) |
| Year of Election or Appointment: 2009 Vice President of certain Equity Funds and Vice President of Sector Funds. Mr. Hogan also serves as Senior Vice President, Equity Research of FMR (2006-present) and President of FMR's Equity Division (2009-present). Previously, Mr. Hogan served as a portfolio manager. |
Thomas C. Hense (46) |
| Year of Election or Appointment: 2008 or 2010 Vice President of Fidelity's High Income (2008), Small Cap (2008), and Value (2010) Funds. Previously, Mr. Hense served as a portfolio manager for Fidelity's Institutional Money Management Group (Pyramis) (2003-2008). |
Scott C. Goebel (42) |
| Year of Election or Appointment: 2008 Secretary and Chief Legal Officer (CLO) of the Fidelity funds. Mr. Goebel also serves as General Counsel, Secretary, and Senior Vice President of FMR (2008-present) and FMR Co., Inc. (2008-present); Deputy General Counsel of FMR LLC; Chief Legal Officer of Fidelity Management & Research (Hong Kong) Limited (2008-present) and Assistant Secretary of Fidelity Management & Research (Japan) Inc. (2008-present), Fidelity Investments Money Management, Inc. (2008-present), Fidelity Management & Research (U.K.) Inc. (2008-present), and Fidelity Research and Analysis Company (2008-present). Previously, Mr. Goebel served as Assistant Secretary of the Funds (2007-2008) and as Vice President and Secretary of Fidelity Distributors Corporation (FDC) (2005-2007). |
William C. Coffey (41) |
| Year of Election or Appointment: 2009 Assistant Secretary of Fidelity's Equity and High Income Funds. Mr. Coffey also serves as Senior Vice President and Deputy General Counsel of FMR LLC (2010-present), and is an employee of Fidelity Investments. Previously, Mr. Coffey served as Vice President and Associate General Counsel of FMR LLC (2005-2009). |
Holly C. Laurent (56) |
| Year of Election or Appointment: 2008 Anti-Money Laundering (AML) Officer of the Fidelity funds. Ms. Laurent is an employee of Fidelity Investments. Previously, Ms. Laurent was Senior Vice President and Head of Legal for Fidelity Business Services India Pvt. Ltd. (2006-2008), and Senior Vice President, Deputy General Counsel and Group Head for FMR LLC (2005-2006). |
Christine Reynolds (51) |
| Year of Election or Appointment: 2008 Chief Financial Officer of the Fidelity funds. Ms. Reynolds became President of Fidelity Pricing and Cash Management Services (FPCMS) in August 2008. Ms. Reynolds served as Chief Operating Officer of FPCMS (2007-2008). Previously, Ms. Reynolds served as President, Treasurer, and Anti-Money Laundering officer of the Fidelity funds (2004-2007). |
Kenneth A. Rathgeber (63) |
| Year of Election or Appointment: 2004 Chief Compliance Officer of Fidelity's Equity and High Income Funds. Mr. Rathgeber is Chief Compliance Officer of Fidelity Management & Research (Hong Kong) Limited (2008-present), Fidelity Management & Research (Japan) Inc. (2008-present), FMR (2005-present), FMR Co., Inc. (2005-present), Fidelity Management & Research (U.K.) Inc. (2005-present), Fidelity Research & Analysis Company (2005-present), Fidelity Investments Money Management, Inc. (2005-present), Pyramis Global Advisors, LLC (2005-present), and Strategic Advisers, Inc. (2005-present). |
Jeffrey S. Christian (48) |
| Year of Election or Appointment: 2009 Deputy Treasurer of the Fidelity funds. Mr. Christian is an employee of Fidelity Investments. Previously, Mr. Christian served as Chief Financial Officer (2008-2009) of certain Fidelity funds and Senior Vice President of Fidelity Pricing and Cash Management Services (FPCMS) (2004-2009). |
Bryan A. Mehrmann (49) |
| Year of Election or Appointment: 2005 Deputy Treasurer of the Fidelity funds. Mr. Mehrmann is an employee of Fidelity Investments. |
Adrien E. Deberghes (42) |
| Year of Election or Appointment: 2008 Deputy Treasurer of Fidelity's Equity and High Income Funds. Mr. Deberghes also serves as Assistant Treasurer of other Fidelity funds (2010-present) and is an employee of Fidelity Investments (2008-present). Previously, Mr. Deberghes served as Senior Vice President of Mutual Fund Administration at State Street Corporation (2007-2008), Senior Director of Mutual Fund Administration at Investors Bank & Trust (2005-2007), and Director of Finance for Dunkin' Brands (2000-2005). |
Stephanie J. Dorsey (41) |
| Year of Election or Appointment: 2010 Assistant Treasurer of Fidelity's Equity and High Income Funds. Ms. Dorsey also serves as Deputy Treasurer of other Fidelity funds (2008-present) and is an employee of Fidelity Investments (2008-present). Previously, Ms. Dorsey served as Treasurer (2004-2008) of the JPMorgan Mutual Funds and Vice President (2004-2008) of JPMorgan Chase Bank. |
John R. Hebble (52) |
| Year of Election or Appointment: 2009 Assistant Treasurer of Fidelity's Equity and High Income Funds. Mr. Hebble also serves as Treasurer and Chief Financial Officer of The North Carolina Capital Management Trust: Cash and Term Portfolio (2008-present), President and Treasurer of other Fidelity funds (2008-present) and is an employee of Fidelity Investments. |
Gary W. Ryan (51) |
| Year of Election or Appointment: 2005 Assistant Treasurer of the Fidelity funds. Mr. Ryan is an employee of Fidelity Investments. Previously, Mr. Ryan served as Vice President of Fund Reporting in Fidelity Pricing and Cash Management Services (FPCMS) (1999-2005). |
Annual Report
Board Approval of Investment Advisory Contracts and Management Fees
Fidelity Small Cap Growth Fund
Each year, the Board of Trustees, including the Independent Trustees (together, the Board), votes on the renewal of the management contract and sub-advisory agreements (together, the Advisory Contracts) for the fund. The Board, assisted by the advice of fund counsel and Independent Trustees' counsel, requests and considers a broad range of information relevant to the renewal of the Advisory Contracts throughout the year.
The Board meets regularly and considers at each of its meetings factors that are relevant to its annual consideration of the renewal of the fund's Advisory Contracts, including the services and support provided to the fund and its shareholders. The Board has established various standing committees, each composed of Independent Trustees with varying backgrounds, to which the Board has assigned specific subject matter responsibilities in order to enhance effective decision-making by the Board. The Board, acting directly and through its Committees, requests and receives information concerning the annual consideration of the renewal of the fund's Advisory Contracts. The Board also meets as needed to consider matters specifically related to the Board's annual consideration of the renewal of Advisory Contracts. Members of the Board may also meet with trustees of other Fidelity funds through ad hoc joint committees to discuss certain matters relevant to the Fidelity funds.
At its July 2010 meeting, the Board of Trustees, including the Independent Trustees, unanimously determined to renew the fund's Advisory Contracts. In reaching its determination, the Board considered all factors it believed relevant, including (i) the nature, extent, and quality of the services to be provided to the fund and its shareholders (including the investment performance of the fund); (ii) the competitiveness of the fund's management fee and total expenses; (iii) the total costs of the services to be provided by and the profits to be realized by Fidelity from its relationship with the fund; (iv) the extent to which economies of scale would be realized as the fund grows; and (v) whether fee levels reflect these economies of scale, if any, for the benefit of fund shareholders.
In considering whether to renew the Advisory Contracts for the fund, the Board reached a determination, with the assistance of fund counsel and Independent Trustees' counsel and through the exercise of its business judgment, that the renewal of the Advisory Contracts is in the best interests of fund shareholders and that the compensation to be received by Fidelity under the management contract is fair and reasonable. The Board's decision to renew the Advisory Contracts was not based on any single factor noted above, but rather was based on a comprehensive consideration of all the information provided to the Board at its meetings throughout the year. The Board, in reaching its determination to renew the Advisory Contracts, is aware that shareholders in the fund have a broad range of investment choices available to them, including a wide choice among mutual funds offered by Fidelity's competitors, and that the fund's shareholders, with the opportunity to review and weigh the disclosure provided by the fund in its prospectus and other public disclosures, have chosen to invest in this fund, managed by Fidelity.
Annual Report
Board Approval of Investment Advisory Contracts and
Management Fees - continued
Nature, Extent, and Quality of Services Provided. The Board considered the staffing within the investment adviser, FMR, and the sub-advisers (together, the Investment Advisers), including the backgrounds of the fund's investment personnel and the fund's investment objective and discipline. The Independent Trustees also had discussions with senior management of Fidelity's investment operations and investment groups. The Board considered the structure of the portfolio manager compensation program and whether this structure provides appropriate incentives to act in the best interest of the fund.
Resources Dedicated to Investment Management and Support Services. The Board and the equity research subcommittee of the Board's Fund Oversight Committee reviewed the size, education, and experience of the Investment Advisers' investment staff, their use of technology, and the Investment Advisers' approach to recruiting, training, and retaining portfolio managers and other research, advisory, and management personnel. The Board noted that Fidelity's analysts have access to a variety of technological tools and market and securities data that enable them to perform both fundamental and quantitative analysis and to specialize in various disciplines. The Board considered Fidelity's extensive global research capabilities that enable the Investment Advisers to aggregate data from various sources in an effort to produce positive investment results. The Board also considered that Fidelity's portfolio managers and analysts have access to daily portfolio attribution that allows for monitoring of a fund's portfolio, as well as an electronic communication system that provides immediate real-time access to research concerning issuers and credit enhancers. The Board noted FMR's continued focus on strengthening the organization and discipline of equity portfolio management and research.
Shareholder and Administrative Services. The Board considered (i) the nature, extent, quality, and cost of advisory, administrative, and shareholder services performed by the Investment Advisers and their affiliates under the Advisory Contracts and under separate agreements covering transfer agency, pricing and bookkeeping, and securities lending services for the fund; (ii) the nature and extent of the investment adviser's supervision of third party service providers, principally custodians and subcustodians; and (iii) the resources devoted to, and the record of compliance with, the fund's compliance policies and procedures. The Board also reviewed the allocation of fund brokerage, including allocations to brokers affiliated with the Investment Advisers, the use of brokerage commissions to pay fund expenses, and the use of "soft" commission dollars to pay for research services.
Annual Report
The Board noted that the growth of fund assets over time across the complex allows Fidelity to reinvest in the development of services designed to enhance the value or convenience of the Fidelity funds as investment vehicles. These services include 24-hour access to account information and market information through phone representatives and over the Internet, and investor education materials and asset allocation tools.
Investment in a Large Fund Family. The Board considered the benefits to shareholders of investing in a Fidelity fund, including the benefits of investing in a fund that is part of a large family of funds offering a variety of investment disciplines and providing a large variety of mutual fund investor services. The Board noted that Fidelity had taken, or had made recommendations that resulted in the Fidelity funds taking, a number of actions over the previous year that benefited particular funds, including (i) dedicating additional resources to investment research and restructuring and broadening the focus of the investment research teams; (ii) bolstering the senior management team that oversees asset management; (iii) launching Class F of certain funds as a lower-fee class available to Freedom K and Freedom Index Funds; (iv) lowering the initial investment minimums and ongoing balance requirements for Real Estate High Income Fund; (v) eliminating subsequent purchase minimums for all funds and adding a waiver of the investment minimum requirement for new accounts opened with the proceeds of a systematic withdrawal plan; (vi) eliminating the withdrawal minimum and maximum limits for systematic withdrawals from Advisor funds; (vii) expanding sales load waivers on Class A shares for Destiny Planholders and expanding Institutional Class eligibility for Class O Destiny Planholders; and (viii) changing certain Class A and Class T sales charge structures to further align them with industry practices.
Investment Performance. The Board considered whether the fund has operated in accordance with its investment objective, as well as its record of compliance with its investment restrictions. It also reviewed the fund's absolute investment performance for each class (except Class F), as well as the fund's relative investment performance for each class (except Class F) measured over multiple periods against (i) a broad-based securities market index, and (ii) a peer group of mutual funds deemed appropriate by Fidelity and reviewed by the Board. The following charts considered by the Board show, over the one-, three-, and five-year periods ended December 31, 2009, the cumulative total returns of Institutional Class (Class I) and Class B of the fund, the cumulative total returns of a broad-based securities market index ("benchmark"), and a range of cumulative total returns of a peer group of mutual funds identified by Morningstar, Inc. as having an investment style similar to that of the fund based on underlying portfolio holdings. The returns of Institutional Class (Class I) and Class B show the performance of the highest and lowest performing classes, respectively (based on five-year performance). (Class F had less than one year of performance as of December 31, 2009.) The box within each chart shows the 25th percentile return (bottom of box) and the 75th percentile return (top of box) of the peer group. Returns shown above the box are in the first quartile and returns shown below the box are in the fourth quartile. The percentage beaten numbers noted below each chart correspond to the percentile box and represent the percentage of funds in the peer group whose performance was equal to or lower than that of the class indicated.
Annual Report
Board Approval of Investment Advisory Contracts and
Management Fees - continued
Fidelity Small Cap Growth Fund
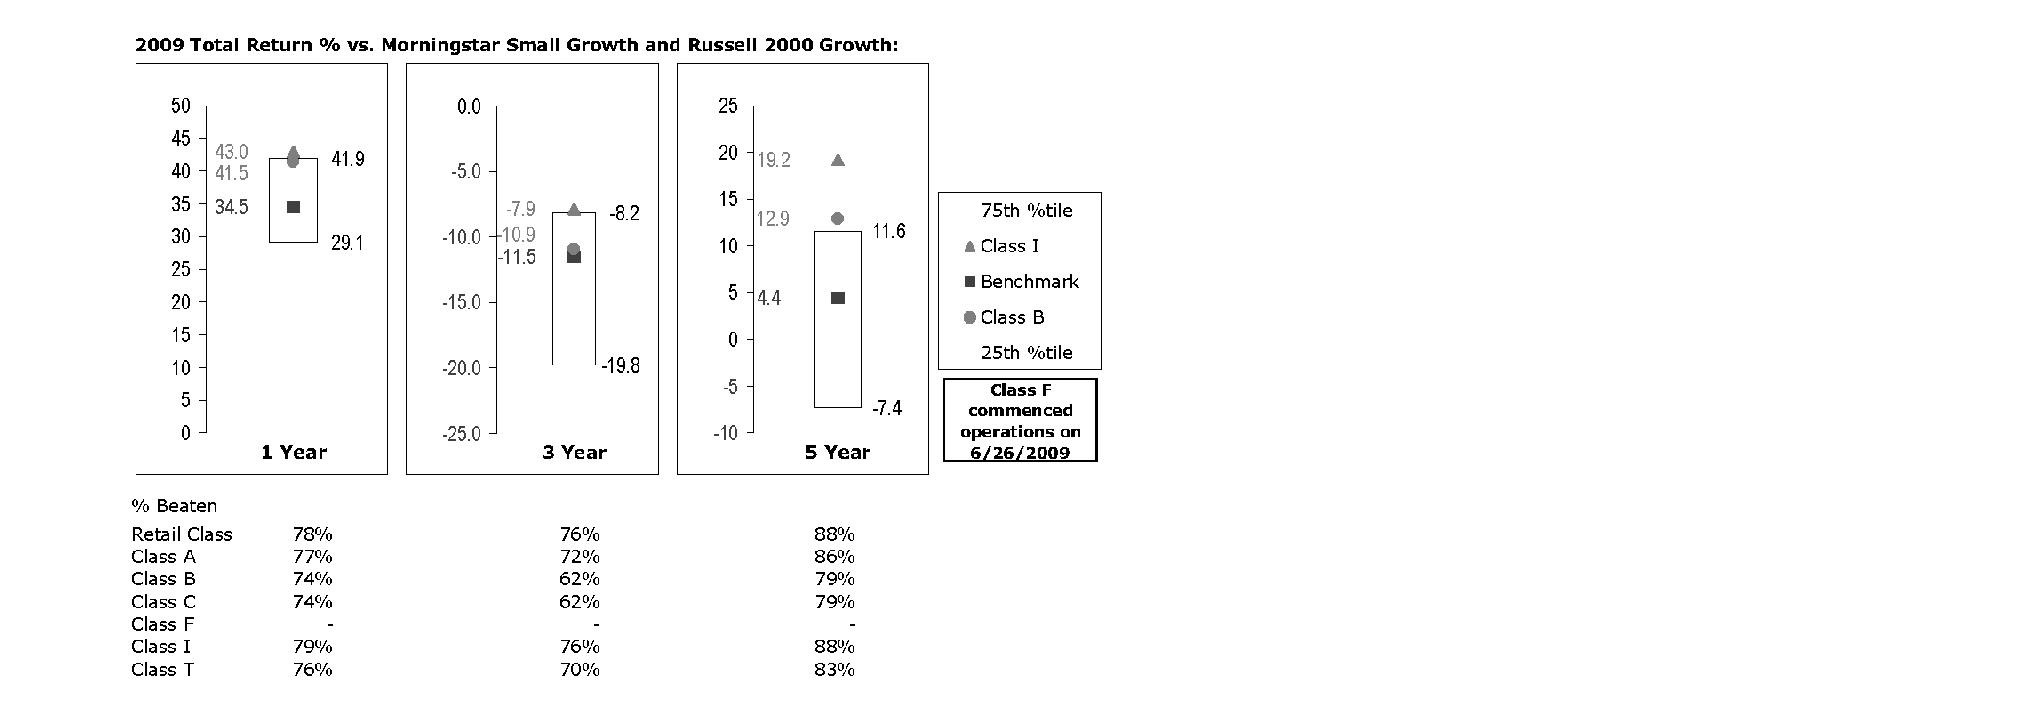
The Board reviewed the fund's relative investment performance against its peer group and noted that the performance of Institutional Class (Class I) of the fund was in the first quartile for all the periods shown. The Board also noted that the investment performance of Institutional Class (Class I) of the fund compared favorably to its benchmark for all the periods shown. The Board considered that the variations in performance among the fund's classes reflect the variations in class expenses, which result in lower performance for higher expense classes. The Board also reviewed the fund's performance since inception as well as performance in the current year.
The Board also considered that the fund's management fee is subject to upward or downward adjustment depending upon whether, and to what extent, the fund's investment performance for the performance period exceeds, or is exceeded by, the record (over the same period) of a Board-approved performance adjustment index. The Board realizes that the performance adjustment provides FMR with a strong economic incentive to seek to achieve superior performance for the fund's shareholders and helps to more closely align the interests of FMR and the fund's shareholders.
Based on its review, and giving particular weight to the nature and quality of the resources dedicated by the Investment Advisers to maintain and improve relative performance and factoring in the unprecedented market events in recent years, the Board concluded that the nature, extent, and quality of investment management and support services and of shareholder and administrative services provided to the fund will benefit the fund's shareholders, particularly in light of the Board's view that the fund's shareholders benefit from investing in a fund that is part of a large family of funds offering a variety of investment disciplines and services.
Annual Report
Competitiveness of Management Fee and Total Fund Expenses. The Board considered the fund's management fee and total expenses compared to "mapped groups" of competitive funds and classes. Fidelity creates "mapped groups" by combining similar Lipper investment objective categories that have comparable management fee characteristics. Combining Lipper investment objective categories aids the Board's management fee and total expense comparisons by broadening the competitive group used for comparison and by reducing the number of universes to which various Fidelity funds are compared.
Management Fee. The Board considered two proprietary management fee comparisons for the 12-month periods shown in the chart below. The group of Lipper funds used by the Board for management fee comparisons is referred to below as the "Total Mapped Group." The Total Mapped Group comparison focuses on a fund's standing relative to the total universe of comparable funds available to investors, in terms of gross management fees before expense reimbursements or caps, and without giving effect to the fund's performance adjustment. "TMG %" represents the percentage of funds in the Total Mapped Group that had management fees that were lower than the fund's. For example, a TMG % of 13% means that 87% of the funds in the Total Mapped Group had higher management fees than the fund. The "Asset-Size Peer Group" (ASPG) comparison focuses on a fund's standing relative to non-Fidelity funds similar in size to the fund within the Total Mapped Group. The ASPG represents at least 15% of the funds in the Total Mapped Group with comparable asset size and management fee characteristics, subject to a minimum of 50 funds (or all funds in the Total Mapped Group if fewer than 50). Additional information, such as the ASPG quartile in which the fund's management fee ranked and the impact of the fund's performance adjustment, is also included in the chart and considered by the Board.
Annual Report
Board Approval of Investment Advisory Contracts and
Management Fees - continued
Fidelity Small Cap Growth Fund
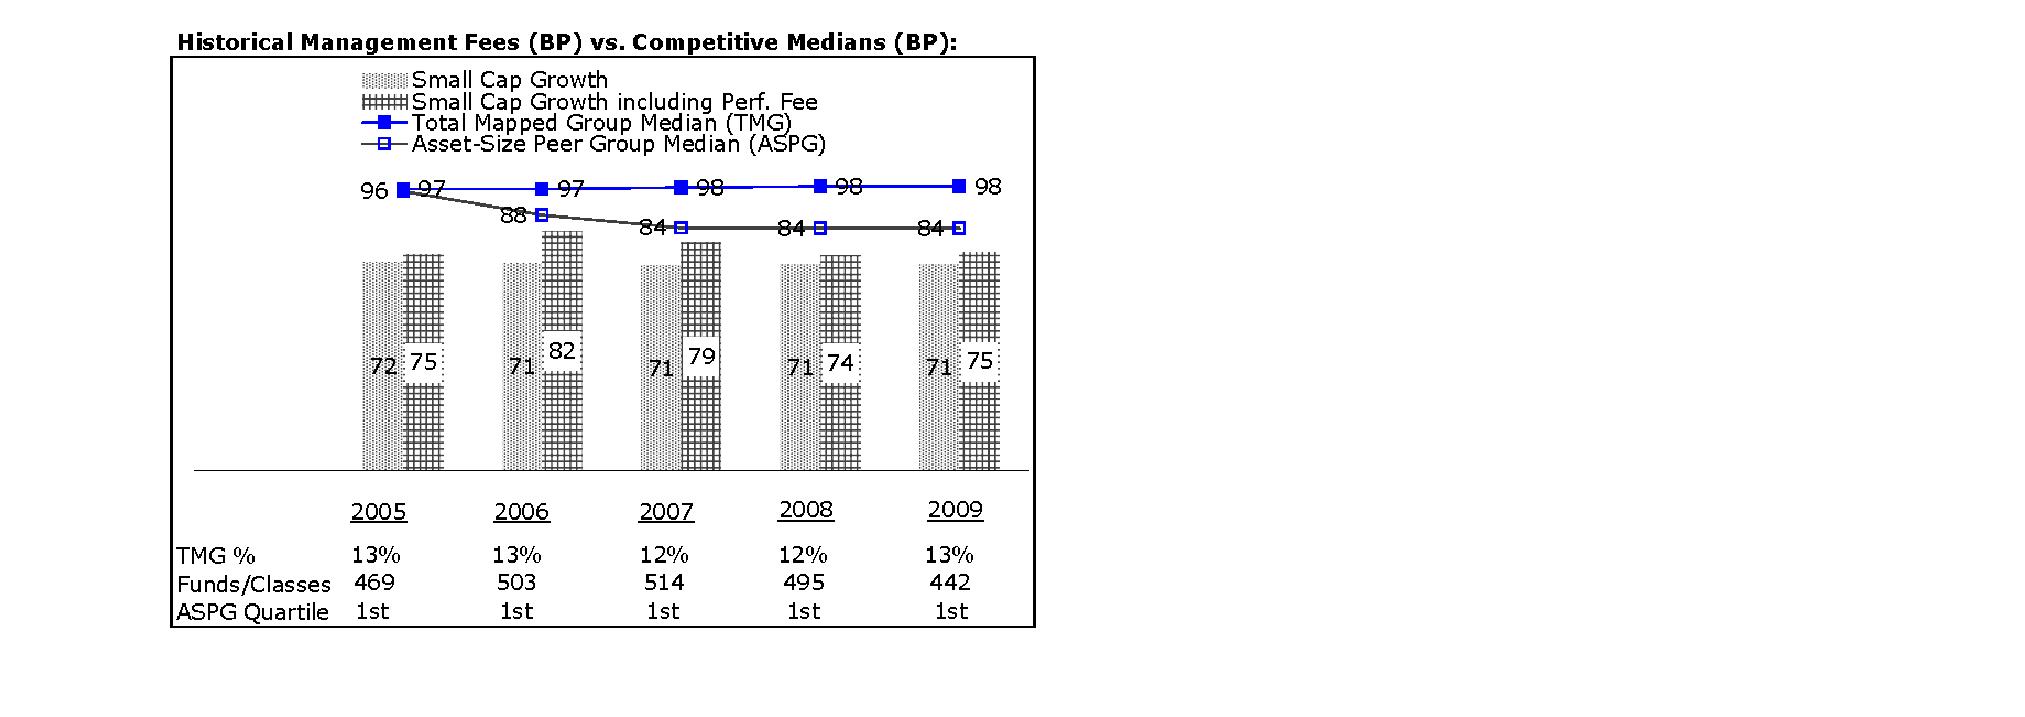
The Board noted that the fund's management fee ranked below the median of its Total Mapped Group and below the median of its ASPG for 2009. The Board also noted the effect of the fund's positive performance adjustment on the fund's management fee ranking. The Board noted that the performance adjustment for each year represents calculations for performance periods that differ from the periods shown in the performance charts above.
Based on its review, the Board concluded that the fund's management fee is fair and reasonable in light of the services that the fund receives and the other factors considered.
Total Expenses. In its review of each class's total expenses, the Board considered the fund's management fee as well as other fund or class expenses, as applicable, such as transfer agent fees, pricing and bookkeeping fees, fund-paid 12b-1 fees, and custodial, legal, and audit fees. The Board also noted the effects of any waivers and reimbursements on fees and expenses, as well as the impact of the fund's performance adjustment. As part of its review, the Board also considered current and historical total expenses of each class of the fund compared to competitive fund median expenses. Each class of the fund is compared to those funds and classes in the Total Mapped Group (used by the Board for management fee comparisons) that have a similar sales load structure.
The Board noted that the total expenses of each of Class A, Class B, Institutional Class, the retail class, and Class F ranked below its competitive median for the period, the total expenses of Class C ranked equal to its competitive median for the period, and the total expenses of Class T ranked above its competitive median for the period. The Board considered that the total expenses for Class T were above the median primarily because its 12b-1 fee is higher than the typical front-end load class. The Board noted that the fund offers multiple classes, each of which has a different sales load and 12b-1 fee structure, and that the multiple structures are intended to offer a range of pricing options for the intermediary market. The Board also noted that the total expenses of the classes vary primarily by the level of their 12b-1 fees, although differences in transfer agent fees may also cause expenses to vary from class to class.
Annual Report
Fees Charged to Other Fidelity Clients. The Board also considered Fidelity fee structures and other information with respect to clients of FMR and its affiliates, such as other mutual funds advised or subadvised by FMR or its affiliates, pension plan clients, and other institutional clients. In March 2010, the Board created an ad hoc joint committee with the board of other Fidelity funds (the Committee) to review and compare Fidelity's institutional investment advisory business with its business of providing services to the Fidelity funds, including the differences in services provided, fees charged, and costs incurred, as well as competition in their respective marketplaces.
Based on its review of total expenses and fees charged to other Fidelity clients, the Board concluded that the total expenses of each class of the fund were reasonable, although in one case above the median of the universe presented for comparison, in light of the services that the fund and its shareholders receive and the other factors considered, including the findings of the Committee.
Costs of the Services and Profitability. The Board considered the revenues earned and the expenses incurred by Fidelity in conducting the business of developing, marketing, distributing, managing, administering and servicing the fund and its shareholders. The Board also considered the level of Fidelity's profits in respect of all the Fidelity funds.
On an annual basis, FMR presents to the Board Fidelity's profitability for the fund. Fidelity calculates the profitability for each fund, as well as aggregate profitability for groups of Fidelity funds and all Fidelity funds, using a series of detailed revenue and cost allocation methodologies which originate with the audited books and records of Fidelity. The Audit Committee of the Board reviews any significant changes from the prior year's methodologies.
PricewaterhouseCoopers LLP (PwC), independent registered public accounting firm and auditor to Fidelity and certain Fidelity funds, has been engaged annually by the Board as part of the Board's assessment of Fidelity's profitability analysis. PwC's engagement includes the review and assessment of Fidelity's methodologies used in determining the revenues and expenses attributable to Fidelity's mutual fund business, and completion of agreed-upon procedures surrounding the mathematical accuracy of fund profitability and its conformity to allocation methodologies. After considering PwC's reports issued under the engagement and information provided by Fidelity, the Board believes that while other allocation methods may also be reasonable, Fidelity's profitability methodologies are reasonable in all material respects.
Annual Report
Board Approval of Investment Advisory Contracts and
Management Fees - continued
The Board has also reviewed Fidelity's non-fund businesses and fall-out benefits related to the mutual fund business as well as cases where Fidelity's affiliates may benefit from or be related to the fund's business.
The Board considered the costs of the services provided by and the profits realized by Fidelity in connection with the operation of the fund and were satisfied that the profitability was not excessive in the circumstances.
Economies of Scale. The Board considered whether there have been economies of scale in respect of the management of the Fidelity funds, whether the Fidelity funds (including the fund) have appropriately benefited from any such economies of scale, and whether there is potential for realization of any further economies of scale. The Board considered the extent to which the fund will benefit from economies of scale through increased services to the fund, through waivers or reimbursements, or through fee or expense reductions.
In February 2009, the Board and the board of other Fidelity funds created an ad hoc committee (the Economies of Scale Committee) to analyze whether FMR attains economies of scale in respect of the management and servicing of the Fidelity funds, whether the Fidelity funds have appropriately benefited from such economies of scale, and whether there is potential for realization of any further economies of scale.
The Board recognized that the fund's management contract incorporates a "group fee" structure, which provides for lower group fee rates as total fund assets under FMR's management increase, and for higher group fee rates as total fund assets under FMR's management decrease. FMR calculates the group fee rates based on a tiered asset "breakpoint" schedule that varies based on asset class. The Board considered that the group fee is designed to deliver the benefits of economies of scale to fund shareholders when total Fidelity fund assets increase, even if assets of any particular fund are unchanged or have declined, because some portion of Fidelity's costs are attributable to services provided to all Fidelity funds, and all funds benefit if those costs can be allocated among more assets. The Board concluded that, given the group fee structure, fund shareholders will benefit from lower management fees as assets under FMR's management increase at the fund complex level, regardless of whether Fidelity achieves any such economies of scale.
The Board concluded, considering the findings of the Economies of Scale Committee, that any potential economies of scale are being appropriately shared between fund shareholders and Fidelity.
Annual Report
Additional Information Requested by the Board. In order to develop fully the factual basis for consideration of the Fidelity funds' Advisory Contracts, the Board requested and received additional information on certain topics, including (i) fund performance trends, actions to be taken by FMR to improve certain funds' overall performance, and Fidelity's long-term strategies for certain funds; (ii) portfolio manager changes that have occurred during the past year and length of portfolio manager tenure for different categories of funds over time; (iii) Fidelity's compensation structure for portfolio managers, research analysts, and other key personnel, the rationale for the compensation structure, and how the compensation structure provides appropriate performance incentives; (iv) the amount of the investment that each portfolio manager has made in the Fidelity fund(s) that he or she manages; (v) management and other fees paid by FMR to affiliated sub-advisers on behalf of the Fidelity funds; (vi) Fidelity's fee structures and rationale for recommending different fees among different categories of funds; (vii) Fidelity's rationale for recommending which funds should have a performance adjustment component as part of their management fees; (viii) the rationale for any differences between fund fee structures and fee structures in place for other Fidelity clients; and (ix) explanations regarding the relative total expenses borne by certain funds and classes, total expense competitive trends, and actions that might be taken by FMR to reduce total expenses for certain funds and classes.
Based on its evaluation of all of the conclusions noted above, and after considering all factors it believed relevant, the Board ultimately concluded that the advisory fee structures are fair and reasonable, and that the fund's Advisory Contracts should be renewed.
Annual Report
Managing Your Investments
Fidelity offers several ways to conveniently manage your personal investments via your telephone or PC. You can access your account information, conduct trades and research your investments 24 hours a day.
By Phone
Fidelity Automated Service Telephone provides a single toll-free number to access account balances, positions, quotes and trading. It's easy to navigate the service, and on your first call, the system will help you create a personal identification number (PIN) for security.
(phone_graphic)
Fidelity Automated
Service Telephone (FAST®)
1-800-544-5555
Press
For mutual fund and brokerage trading.
For quotes.*
For account balances and holdings.
To review orders and mutual
fund activity.
To change your PIN.
To speak to a Fidelity representative.
By PC
Fidelity's web site on the Internet provides a wide range of information, including daily financial news, fund performance, interactive planning tools and news about Fidelity products and services.
(computer_graphic)
Fidelity's Web Site
www.fidelity.com
* When you call the quotes line, please remember that a fund's yield and return will vary and, except for money market funds, share price will also vary. This means that you may have a gain or loss when you sell your shares. There is no assurance that money market funds will be able to maintain a stable $1 share price; an investment in a money market fund is not insured or guaranteed by the U.S. government. Total returns are historical and include changes in share price, reinvestment of dividends and capital gains, and the effects of any sales charges.
Annual Report
To Write Fidelity
We'll give your correspondence immediate attention and send you written confirmation upon completion of your request.
(letter_graphic)
Making Changes
To Your Account
(such as changing name, address, bank, etc.)
Fidelity Investments
P.O. Box 770001
Cincinnati, OH 45277-0002
(letter_graphic)
For Non-Retirement
Accounts
Buying shares
Fidelity Investments
P.O. Box 770001
Cincinnati, OH 45277-0003
Overnight Express
Fidelity Investments
Attn: Distribution Services
100 Crosby Parkway - KC1H
Covington, KY 41015
Selling shares
Fidelity Investments
P.O. Box 770001
Cincinnati, OH 45277-0035
Overnight Express
Fidelity Investments
Attn: Distribution Services
100 Crosby Parkway - KC1H
Covington, KY 41015
General Correspondence
Fidelity Investments
P.O. Box 500
Merrimack, NH 03054-0500
(letter_graphic)
For Retirement
Accounts
Buying shares
Fidelity Investments
P.O. Box 770001
Cincinnati, OH 45277-0003
Selling shares
Fidelity Investments
P.O. Box 770001
Cincinnati, OH 45277-0035
Overnight Express
Fidelity Investments
Attn: Distribution Services
100 Crosby Parkway - KC1H
Covington, KY 41015
General Correspondence
Fidelity Investments
P.O. Box 500
Merrimack, NH 03054-0500
Annual Report
To Visit Fidelity
For directions and hours,
please call 1-800-544-9797.
Arizona
7001 West Ray Road
Chandler, AZ
15445 N. Scottsdale Road
Scottsdale, AZ
17550 North 75th Avenue
Glendale, AZ
5330 E. Broadway Blvd
Tucson, AZ
California
815 East Birch Street
Brea, CA
1411 Chapin Avenue
Burlingame, CA
851 East Hamilton Avenue
Campbell, CA
601 Larkspur Landing Circle
Larkspur, CA
2000 Avenue of the Stars
Los Angeles, CA
27101 Puerta Real
Mission Viejo, CA
73575 El Paseo
Palm Desert, CA
251 University Avenue
Palo Alto, CA
123 South Lake Avenue
Pasadena, CA
16656 Bernardo Ctr. Drive
Rancho Bernardo, CA
1220 Roseville Parkway
Roseville, CA
1740 Arden Way
Sacramento, CA
7676 Hazard Center Drive
San Diego, CA
11943 El Camino Real
San Diego, CA
8 Montgomery Street
San Francisco, CA
3793 State Street
Santa Barbara, CA
1200 Wilshire Boulevard
Santa Monica, CA
398 West El Camino Real
Sunnyvale, CA
111 South Westlake Blvd
Thousand Oaks, CA
21701 Hawthorne Boulevard
Torrance, CA
2001 North Main Street
Walnut Creek, CA
6326 Canoga Avenue
Woodland Hills, CA
2211 Michelson Drive
Irvine, CA
Colorado
281 East Flatiron Circle
Broomfield, CO
1625 Broadway
Denver, CO
9185 Westview Road
Lone Tree, CO
Connecticut
48 West Putnam Avenue
Greenwich, CT
265 Church Street
New Haven, CT
300 Atlantic Street
Stamford, CT
29 South Main Street
West Hartford, CT
1261 Post Road
Fairfield, CT
Delaware
400 Delaware Avenue
Wilmington, DE
Florida
175 East Altamonte Drive
Altamonte Springs, FL
1400 Glades Road
Boca Raton, FL
121 Alhambra Plaza
Coral Gables, FL
2948 N. Federal Highway
Ft. Lauderdale, FL
4671 Town Center Parkway
Jacksonville, FL
8880 Tamiami Trail, North
Naples, FL
230 Royal Palm Way
Palm Beach, FL
3501 PGA Boulevard
Palm Beach Gardens, FL
3550 Tamiami Trail, South
Sarasota, FL
1502 N. Westshore Blvd.
Tampa, FL
2465 State Road 7
Wellington, FL
Georgia
3242 Peachtree Road
Atlanta, GA
1000 Abernathy Road
Atlanta, GA
Illinois
One North LaSalle Street
Chicago, IL
401 North Michigan Avenue
Chicago, IL
One Skokie Valley Road
Highland Park, IL
1415 West 22nd Street
Oak Brook, IL
15105 S LaGrange Road
Orland Park, IL
1572 East Golf Road
Schaumburg, IL
1823 Freedom Drive
Naperville, IL
Indiana
8480 Keystone Crossing
Indianapolis, IN
Kansas
5400 College Boulevard
Overland Park, KS
Maine
Three Canal Plaza
Portland, ME
Maryland
7315 Wisconsin Avenue
Bethesda, MD
610 York Road
Towson, MD
Massachusetts
801 Boylston Street
Boston, MA
155 Congress Street
Boston, MA
300 Granite Street
Braintree, MA
44 Mall Road
Burlington, MA
238 Main Street
Cambridge, MA
200 Endicott Street
Danvers, MA
Fidelity Brokerage Services, Inc., 100 Summer St., Boston, MA 02110 Member NYSE/SIPC
Annual Report
405 Cochituate Road
Framingham, MA
551 Boston Turnpike
Shrewsbury, MA
Michigan
500 E. Eisenhower Pkwy.
Ann Arbor, MI
280 N. Old Woodward Ave.
Birmingham, MI
30200 Northwestern Hwy.
Farmington Hills, MI
43420 Grand River Avenue
Novi, MI
3480 28th Street
Grand Rapids, MI
2425 S. Linden Road STE E
Flint, MI
Minnesota
7740 France Avenue South
Edina, MN
8342 3rd Street North
Oakdale, MN
Missouri
1524 South Lindbergh Blvd.
St. Louis, MO
Nevada
2225 Village Walk Drive
Henderson, NV
New Jersey
501 Route 73 South
Marlton, NJ
150 Essex Street
Millburn, NJ
35 Morris Street
Morristown, NJ
396 Route 17, North
Paramus, NJ
3518 Route 1 North
Princeton, NJ
530 Broad Street
Shrewsbury, NJ
New Mexico
2261 Q Street NE
Albuquerque, NM
New York
1130 Franklin Avenue
Garden City, NY
37 West Jericho Turnpike
Huntington Station, NY
1271 Avenue of the Americas
New York, NY
980 Madison Avenue
New York, NY
61 Broadway
New York, NY
350 Park Avenue
New York, NY
200 Fifth Avenue
New York, NY
733 Third Avenue
New York, NY
2070 Broadway
New York, NY
1075 Northern Blvd.
Roslyn, NY
799 Central Park Avenue
Scarsdale, NY
3349 Monroe Avenue
Rochester, NY
North Carolina
4611 Sharon Road
Charlotte, NC
7011 Fayetteville Road
Durham, NC
Ohio
3805 Edwards Road
Cincinnati, OH
1324 Polaris Parkway
Columbus, OH
1800 Crocker Road
Westlake, OH
28699 Chagrin Boulevard
Woodmere Village, OH
Oregon
7493 SW Bridgeport Road
Tigard, OR
Pennsylvania
600 West DeKalb Pike
King of Prussia, PA
1735 Market Street
Philadelphia, PA
12001 Perry Highway
Wexford, PA
Rhode Island
10 Memorial Boulevard
Providence, RI
Tennessee
3018 Peoples Street
Johnson City, TN
7628 West Farmington Blvd.
Germantown, TN
2035 Mallory Lane
Franklin, TN
Texas
10000 Research Boulevard
Austin, TX
4001 Northwest Parkway
Dallas, TX
12532 Memorial Drive
Houston, TX
2701 Drexel Drive
Houston, TX
6560 Fannin Street
Houston, TX
1701 Lake Robbins Drive
The Woodlands, TX
6500 N. MacArthur Blvd.
Irving, TX
6005 West Park Boulevard
Plano, TX
1576 East Southlake Blvd.
Southlake, TX
15600 Southwest Freeway
Sugar Land, TX
139 N. Loop 1604 East
San Antonio, TX
Utah
279 West South Temple
Salt Lake City, UT
Virginia
1861 International Drive
McLean, VA
11957 Democracy Drive
Reston, VA
Washington
10500 NE 8th Street
Bellevue, WA
1518 6th Avenue
Seattle, WA
304 Strander Blvd
Tukwila, WA
Washington, DC
1900 K Street, N.W.
Washington, DC
Wisconsin
16020 West Bluemound Road
Brookfield, WI
Annual Report
Investment Adviser
Fidelity Management & Research Company
Boston, MA
Investment Sub-Advisers
FMR Co., Inc.
Fidelity Research & Analysis Company
Fidelity Management & Research
(U.K.) Inc.
Fidelity Management & Research
(Hong Kong) Limited
Fidelity Management & Research
(Japan) Inc.
General Distributor
Fidelity Distributors Corporation
Boston, MA
Transfer and Service Agents
Fidelity Investments Institutional
Operating Company, Inc.
Boston, MA
Fidelity Service Company, Inc.
Boston, MA
Custodian
Citibank, N.A.
New York, NY
The Fidelity Telephone Connection
Mutual Fund 24-Hour Service
Exchanges/Redemptions
and Account Assistance 1-800-544-6666
Product Information 1-800-544-6666
Retirement Accounts 1-800-544-4774
(8 a.m. - 9 p.m.)
TDD Service 1-800-544-0118
for the deaf and hearing impaired
(9 a.m. - 9 p.m. Eastern time)
Fidelity Automated Service
Telephone (FAST®) 1-800-544-5555
Automated line for quickest service
SCP-UANN-0910
1.803694.105
Fidelity®
Small Cap Growth
Fund
Class F
Annual Report
July 31, 2010
(2_fidelity_logos) (Registered_Trademark)
Contents
Chairman's Message | <Click Here> | The Chairman's message to shareholders. |
Performance | <Click Here> | How the fund has done over time. |
Management's Discussion of Fund Performance | <Click Here> | The Portfolio Manager's review of fund performance and strategy. |
Shareholder Expense Example | <Click Here> | An example of shareholder expenses. |
Investment Changes | <Click Here> | A summary of major shifts in the fund's investments over the past six months. |
Investments | <Click Here> | A complete list of the fund's investments with their market values. |
Financial Statements | <Click Here> | Statements of assets and liabilities, operations, and changes in net assets,
as well as financial highlights. |
Notes | <Click Here> | Notes to the financial statements. |
Report of Independent Registered Public Accounting Firm | <Click Here> | |
Trustees and Officers | <Click Here> | |
Board Approval of Investment Advisory Contracts and Management Fees | <Click Here> | |
To view a fund's proxy voting guidelines and proxy voting record for the 12-month period ended June 30, visit http://www.fidelity.com/proxyvotingresults or visit the Securities and Exchange Commission's (SEC) web site at http://www.sec.gov. You may also call 1-800-835-5092 to request a free copy of the proxy voting guidelines.
Standard & Poor's, S&P and S&P 500 are registered service marks of The McGraw-Hill Companies, Inc. and have been licensed for use by Fidelity Distributors Corporation.
Other third party marks appearing herein are the property of their respective owners.
All other marks appearing herein are registered or unregistered trademarks or service marks of FMR LLC or an affiliated company.
Annual Report
p20
This report and the financial statements contained herein are submitted for the general information of the shareholders of the fund. This report is not authorized for distribution to prospective investors in the fund unless preceded or accompanied by an effective prospectus.
A fund files its complete schedule of portfolio holdings with the SEC for the first and third quarters of each fiscal year on Form N-Q. Forms N-Q are available on the SEC's web site at http://www.sec.gov. A fund's Forms N-Q may be reviewed and copied at the SEC's Public Reference Room in Washington, DC. Information regarding the operation of the SEC's Public Reference Room may be obtained by calling 1-800-SEC-0330. For a complete list of a fund's portfolio holdings, view the fund's most recent holdings listing, semiannual report, or annual report on Fidelity's web site at http://www.fidelity.com or http://www.advisor.fidelity.com, as applicable.
NOT FDIC INSURED • MAY LOSE VALUE • NO BANK GUARANTEE
Neither the fund nor Fidelity Distributors Corporation is a bank.
Annual Report
(photo_of_Edward_C_Johnson_3d)
Dear Shareholder:
A yearlong uptrend in global equity markets reversed course in late April 2010 when investor sentiment turned bearish due in great measure to concern that Europe's debt crisis would expand and slow or derail economic recovery. However, a bounceback in July helped to recover some of the ground that was lost. Financial markets are always unpredictable, of course, but there also are several time-tested investment principles that can help put the odds in your favor.
One of the basic tenets is to invest for the long term. Over time, riding out the markets' inevitable ups and downs has proven much more effective than selling into panic or chasing the hottest trend. Even missing only a few of the markets' best days can significantly diminish investor returns. Patience also affords the benefits of compounding - of earning interest on additional income or reinvested dividends and capital gains. There can be tax advantages and cost benefits to consider as well. While staying the course doesn't eliminate risk, it can considerably lessen the effect of short-term declines.
You can further manage your investing risk through diversification. And today, more than ever, geographic diversification should be taken into account. Studies indicate that asset allocation is the single most important determinant of a portfolio's long-term success. The right mix of stocks, bonds and cash - aligned to your particular risk tolerance and investment objective - is very important. Age-appropriate rebalancing is also an essential aspect of asset allocation. For younger investors, an emphasis on equities - which historically have been the best-performing asset class over time - is encouraged. As investors near their specific goal, such as retirement or sending a child to college, consideration may be given to replacing volatile assets (e.g. common stocks) with more-stable fixed investments (bonds or savings plans).
A third principle - investing regularly - can help lower the average cost of your purchases. Investing a certain amount of money each month or quarter helps ensure you won't pay for all your shares at market highs. This strategy - known as dollar cost averaging - also reduces "emotion" from investing, helping shareholders avoid selling weak performers just prior to an upswing, or chasing a hot performer just before a correction.
We invite you to contact us via the Internet, through our Investor Centers or by phone. It is our privilege to provide you the information you need to make the investments that are right for you.
Sincerely,
(The chairman's signature appears here.)
Edward C. Johnson 3d
Annual Report
Average annual total return reflects the change in the value of an investment, assuming reinvestment of the class' distributions from dividend income and capital gains (the profits earned upon the sale of securities that have grown in value, if any) and assuming a constant rate of performance each year. The $10,000 table and the fund's returns do not reflect the deduction of taxes that a shareholder would pay on fund distributions or the redemption of fund shares. During periods of reimbursement by Fidelity, a fund's total return will be greater than it would be had the reimbursement not occurred. How a fund did yesterday is no guarantee of how it will do tomorrow.
Average Annual Total Returns
Periods ended July 31, 2010 | | Past 1
year | Past 5
years | Life of
fund A |
Class F B | | 17.89% | 1.58% | 6.09% |
A From November 3, 2004.
B The initial offering of Class F shares took place on June 26, 2009. Returns prior to June 26, 2009 are those of Fidelity Small Cap Growth Fund, the original class of the fund.
$10,000 Over Life of Fund
Let's say hypothetically that $10,000 was invested in Fidelity Small Cap Growth Fund - Class F on November 3, 2004, when the fund started. The chart shows how the value of your investment would have changed, and also shows how the Russell 2000® Growth Index performed over the same period. The initial offering of Class F took place on June 26, 2009. See above for additional information regarding the performance of Class F.
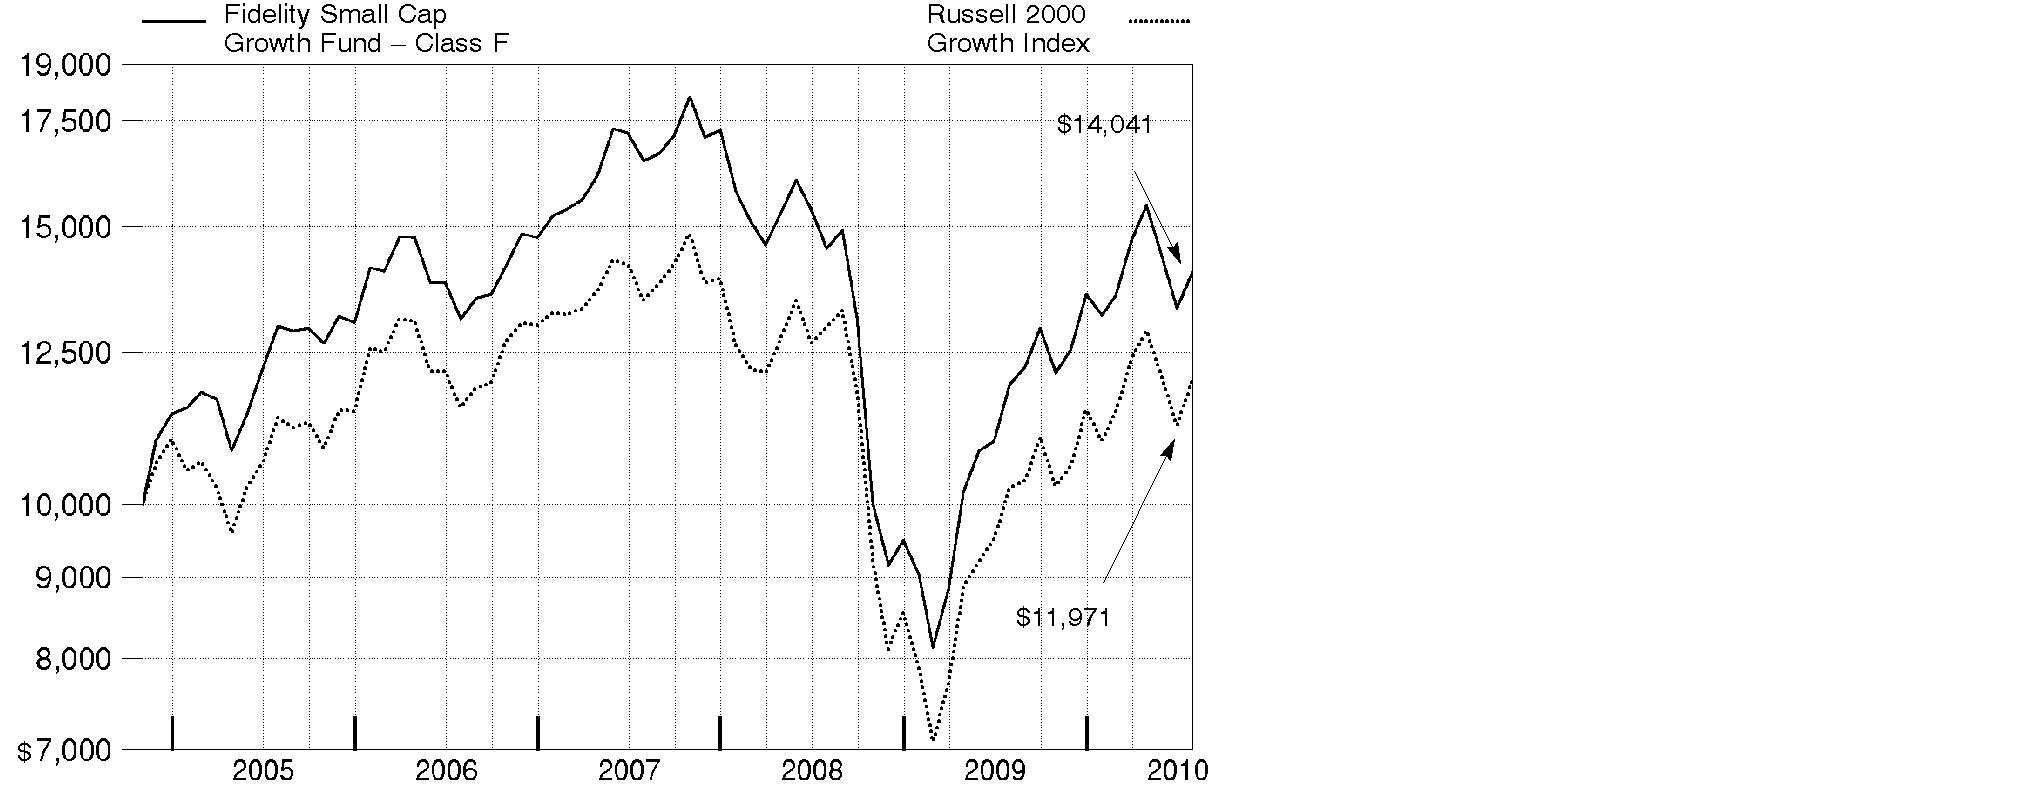
Annual Report
Market Recap: U.S. stock markets saw double-digit gains for the year ending July 31, 2010, despite the return of market volatility and risk aversion during the first half of 2010. An impressive bull run continued through 2009, bolstered by improvement in the economy and credit markets. Early in the new year, however, stocks fell sharply amid concerns about the global economic recovery, fueled by European debt woes and China's efforts to restrain inflation. After this brief dip, markets regained their upward momentum, as government stimulus and significant corporate cost cutting led to encouraging earnings reports, improved credit conditions and rising consumer confidence. Positive news continued through mid-April, when the Dow Jones Industrial AverageSM pushed above the 11,000 mark for the first time in 19 months. That milestone was short-lived, however, as heightened concern about the European debt crisis sparked an abrupt sell-off in May, leading to the first official correction since the rally began in March 2009. Although the market's malaise continued through June, stocks saw solid gains in July. For the year, the Dow rose 17.28%, while the S&P 500® Index was up 13.84%. Elsewhere, the technology-laden Nasdaq Composite® Index returned 14.99%. Small- and mid-cap stocks performed best, as measured by the 18.43% increase of the Russell 2000® Index and the 23.21% gain of the Russell Midcap® Index.
Comments from Lionel Harris, Portfolio Manager of Fidelity® Small Cap Growth Fund: For the 12 months ending July 31, 2010, the fund's Class F shares outperformed the 16.71% return of the Russell 2000 Growth Index. (For specific class-level results, please see the performance section of this report.) Stock selection was a big plus overall, especially in the industrials and consumer discretionary sectors. Within information technology, the fund saw success from its hardware/equipment positions, though several software/services names lagged - most notably, network communications systems company TeleCommunication Systems and Internet banking and billing services provider Online Resources. Favorable sector allocation helped, especially overweighting industrials and underweighting the weak-performing pharmaceuticals industry. Having a smaller relative weighting in the consumer discretionary sector, however, took away some of this positive impact. A stronger dollar overall hampered the performance of the fund's foreign stocks. The fund's top individual contributor was Commercial Vehicle Group, which makes parts for the cabs of large trucks. As optimism about the economy and, with it, the trucking industry grew, Commercial Vehicle's share price rose off an extremely low level. Brookdale Senior Living, an operator of assisted-living and retirement communities, also did well, as did hotel and timeshare property owner Wyndham Worldwide.
The views expressed above reflect those of the portfolio manager(s) only through the end of the period as stated on the cover of this report and do not necessarily represent the views of Fidelity or any other person in the Fidelity organization. Any such views are subject to change at any time based upon market or other conditions and Fidelity disclaims any responsibility to update such views. These views may not be relied on as investment advice and, because investment decisions for a Fidelity fund are based on numerous factors, may not be relied on as an indication of trading intent on behalf of any Fidelity fund.
Annual Report
Shareholder Expense Example
As a shareholder of the Fund, you incur two types of costs: (1) transaction costs, including sales charges (loads) on purchase payments or redemption proceeds, redemption fees, and (2) ongoing costs, including management fees, distribution and/or service (12b-1) fees and other Fund expenses. This Example is intended to help you understand your ongoing costs (in dollars) of investing in the Fund and to compare these costs with the ongoing costs of investing in other mutual funds.
The Example is based on an investment of $1,000 invested at the beginning of the period and held for the entire period (February 1, 2010 to July 31, 2010).
Actual Expenses
The first line of the accompanying table for each class of the Fund provides information about actual account values and actual expenses. You may use the information in this line, together with the amount you invested, to estimate the expenses that you paid over the period. Simply divide your account value by $1,000.00 (for example, an $8,600 account value divided by $1,000.00 = 8.6), then multiply the result by the number in the first line for a class of the Fund under the heading entitled "Expenses Paid During Period" to estimate the expenses you paid on your account during this period. A small balance maintenance fee of $12.00 that is charged once a year may apply for certain accounts with a value of less than $2,000. This fee is not included in the table below. If it was, the estimate of expenses you paid during the period would be higher, and your ending account value lower, by this amount. In addition, the Fund, as a shareholder in the underlying Fidelity Central Funds, will indirectly bear its pro-rata share of the fees and expenses incurred by the underlying Fidelity Central Funds. These fees and expenses are not included in the Fund's annualized expense ratio used to calculate the expense estimate in the table below.
Hypothetical Example for Comparison Purposes
The second line of the accompanying table for each class of the Fund provides information about hypothetical account values and hypothetical expenses based on a Class' actual expense ratio and an assumed rate of return of 5% per year before expenses, which is not the Class' actual return. The hypothetical account values and expenses may not be used to estimate the actual ending account balance or expenses you paid for the period. You may use this information to compare the ongoing costs of investing in the Fund and other funds. To do so, compare this 5% hypothetical example with the 5% hypothetical examples that appear in the shareholder reports of the other funds. A small balance maintenance fee of $12.00 that is charged once a year may apply for certain accounts with a value of less than $2,000. This fee is not included in the table below. If it was, the estimate of expenses you paid during the period would be higher, and your ending account value lower, by this amount. In addition, the Fund, as a shareholder in the underlying Fidelity Central Funds, will indirectly bear its pro-rata share of the fees and expenses incurred by the underlying Fidelity Central Funds. These fees and expenses are not included in the Fund's annualized expense ratio used to calculate the expense estimate in the table below.
Please note that the expenses shown in the table are meant to highlight your ongoing costs only and do not reflect any transaction costs. Therefore, the second line of the table is useful in comparing ongoing costs only, and will not help you determine the relative total costs of owning different funds. In addition, if these transactional costs were included, your costs would have been higher.
Annual Report
| Annualized Expense Ratio | Beginning
Account Value
February 1, 2010 | Ending
Account Value
July 31, 2010 | Expenses Paid
During Period*
February 1, 2010
to July 31, 2010 |
Class A | 1.31% | | | |
Actual | | $ 1,000.00 | $ 1,062.10 | $ 6.70 |
HypotheticalA | | $ 1,000.00 | $ 1,018.30 | $ 6.56 |
Class T | 1.57% | | | |
Actual | | $ 1,000.00 | $ 1,060.80 | $ 8.02 |
HypotheticalA | | $ 1,000.00 | $ 1,017.01 | $ 7.85 |
Class B | 2.07% | | | |
Actual | | $ 1,000.00 | $ 1,057.60 | $ 10.56 |
HypotheticalA | | $ 1,000.00 | $ 1,014.53 | $ 10.34 |
Class C | 2.07% | | | |
Actual | | $ 1,000.00 | $ 1,057.70 | $ 10.56 |
HypotheticalA | | $ 1,000.00 | $ 1,014.53 | $ 10.34 |
Small Cap Growth | 1.03% | | | |
Actual | | $ 1,000.00 | $ 1,064.00 | $ 5.27 |
HypotheticalA | | $ 1,000.00 | $ 1,019.69 | $ 5.16 |
Class F | .78% | | | |
Actual | | $ 1,000.00 | $ 1,064.60 | $ 3.99 |
HypotheticalA | | $ 1,000.00 | $ 1,020.93 | $ 3.91 |
Institutional Class | .99% | | | |
Actual | | $ 1,000.00 | $ 1,063.80 | $ 5.07 |
HypotheticalA | | $ 1,000.00 | $ 1,019.89 | $ 4.96 |
A 5% return per year before expenses
* Expenses are equal to each Class' annualized expense ratio, multiplied by the average account value over the period, multiplied by 181/365 (to reflect the one-half year period).
Annual Report
Investment Changes (Unaudited)
Top Ten Stocks as of July 31, 2010 |
| % of fund's
net assets | % of fund's net assets
6 months ago |
NETGEAR, Inc. | 1.1 | 0.0 |
Zumtobel AG | 1.1 | 0.0 |
Adtran, Inc. | 1.1 | 0.8 |
Wyndham Worldwide Corp. | 1.1 | 0.7 |
Plantronics, Inc. | 1.1 | 1.2 |
Riverbed Technology, Inc. | 1.1 | 1.4 |
Triumph Group, Inc. | 1.1 | 0.0 |
Polycom, Inc. | 1.1 | 0.6 |
Super Micro Computer, Inc. | 1.1 | 1.0 |
Armstrong World Industries, Inc. | 1.0 | 0.7 |
| 10.9 | |
Top Five Market Sectors as of July 31, 2010 |
| % of fund's
net assets | % of fund's net assets
6 months ago |
Information Technology | 27.1 | 23.0 |
Health Care | 20.6 | 23.3 |
Industrials | 18.5 | 18.7 |
Consumer Discretionary | 17.8 | 14.9 |
Financials | 4.0 | 3.5 |
Asset Allocation (% of fund's net assets) |
As of July 31, 2010* | As of January 31, 2010** |
| Stocks 95.2% | | | Stocks 93.5% | |
| Short-Term
Investments and
Net Other Assets 4.8% | | | Short-Term
Investments and
Net Other Assets 6.5% | |
* Foreign investments | 16.2% | | ** Foreign investments | 15.1% | |

Annual Report
Investments July 31, 2010
Showing Percentage of Net Assets
Common Stocks - 95.2% |
| Shares | | Value |
CONSUMER DISCRETIONARY - 17.8% |
Auto Components - 1.4% |
ElringKlinger AG | 285,000 | | $ 7,661,254 |
Modine Manufacturing Co. (a) | 1,254,000 | | 12,728,100 |
| | 20,389,354 |
Distributors - 0.7% |
Delticom AG | 181,910 | | 9,280,982 |
Diversified Consumer Services - 0.7% |
Steiner Leisure Ltd. (a) | 248,000 | | 10,542,480 |
Hotels, Restaurants & Leisure - 3.7% |
Aristocrat Leisure Ltd. | 2,735,000 | | 8,389,453 |
BJ's Restaurants, Inc. (a) | 320,000 | | 8,160,000 |
Life Time Fitness, Inc. (a)(d) | 203,000 | | 7,381,080 |
Toridoll Corp. (d) | 3,250 | | 5,949,089 |
WMS Industries, Inc. (a) | 194,750 | | 7,499,823 |
Wyndham Worldwide Corp. | 622,000 | | 15,879,660 |
| | 53,259,105 |
Household Durables - 2.8% |
Dorel Industries, Inc. Class B (sub. vtg.) | 321,550 | | 10,876,301 |
Harman International Industries, Inc. (a) | 350,000 | | 10,643,500 |
Hooker Furniture Corp. | 510,101 | | 6,029,394 |
Tempur-Pedic International, Inc. (a) | 399,000 | | 12,237,330 |
| | 39,786,525 |
Multiline Retail - 0.7% |
Dollarama, Inc. | 415,000 | | 10,359,356 |
Specialty Retail - 4.9% |
Casual Male Retail Group, Inc. (a) | 1,749,978 | | 6,054,924 |
Citi Trends, Inc. (a) | 300,000 | | 9,417,000 |
DSW, Inc. Class A (a)(d) | 425,000 | | 11,309,250 |
hhgregg, Inc. (a)(d) | 490,000 | | 9,942,100 |
Jos. A. Bank Clothiers, Inc. (a)(d) | 125,000 | | 7,335,000 |
Sally Beauty Holdings, Inc. (a) | 901,000 | | 8,523,460 |
Shoe Carnival, Inc. (a) | 458,881 | | 9,659,445 |
Signet Jewelers Ltd. (a) | 288,400 | | 8,585,668 |
| | 70,826,847 |
Textiles, Apparel & Luxury Goods - 2.9% |
Fossil, Inc. (a) | 350,000 | | 13,860,000 |
G-III Apparel Group Ltd. (a) | 390,300 | | 10,069,740 |
Common Stocks - continued |
| Shares | | Value |
CONSUMER DISCRETIONARY - continued |
Textiles, Apparel & Luxury Goods - continued |
Phillips-Van Heusen Corp. | 182,000 | | $ 9,443,980 |
Ted Baker PLC | 907,621 | | 7,594,441 |
| | 40,968,161 |
TOTAL CONSUMER DISCRETIONARY | | 255,412,810 |
CONSUMER STAPLES - 3.0% |
Food & Staples Retailing - 0.4% |
Susser Holdings Corp. (a) | 548,452 | | 6,586,909 |
Food Products - 1.7% |
Calavo Growers, Inc. (d) | 599,046 | | 12,651,852 |
Smithfield Foods, Inc. (a) | 790,000 | | 11,257,500 |
| | 23,909,352 |
Personal Products - 0.9% |
Inter Parfums, Inc. | 737,000 | | 12,860,650 |
TOTAL CONSUMER STAPLES | | 43,356,911 |
ENERGY - 2.4% |
Energy Equipment & Services - 1.6% |
Newpark Resources, Inc. (a) | 1,525,000 | | 12,184,750 |
T-3 Energy Services, Inc. (a) | 445,000 | | 11,285,200 |
| | 23,469,950 |
Oil, Gas & Consumable Fuels - 0.8% |
EXCO Resources, Inc. | 771,400 | | 11,193,014 |
TOTAL ENERGY | | 34,662,964 |
FINANCIALS - 4.0% |
Capital Markets - 0.9% |
Fifth Street Finance Corp. (d) | 465,000 | | 5,049,900 |
optionsXpress Holdings, Inc. (a) | 469,200 | | 7,319,520 |
| | 12,369,420 |
Commercial Banks - 1.7% |
CapitalSource, Inc. | 1,295,000 | | 6,967,100 |
FirstMerit Corp. | 463,000 | | 9,125,730 |
Huntington Bancshares, Inc. | 1,496,100 | | 9,066,366 |
| | 25,159,196 |
Common Stocks - continued |
| Shares | | Value |
FINANCIALS - continued |
Real Estate Investment Trusts - 0.7% |
CBL & Associates Properties, Inc. | 680,200 | | $ 9,570,414 |
Thrifts & Mortgage Finance - 0.7% |
First Niagara Financial Group, Inc. | 765,000 | | 10,258,650 |
TOTAL FINANCIALS | | 57,357,680 |
HEALTH CARE - 20.6% |
Biotechnology - 1.8% |
Allos Therapeutics, Inc. (a) | 875,000 | | 4,217,500 |
PDL BioPharma, Inc. | 1,860,000 | | 11,569,200 |
Theravance, Inc. (a)(d) | 409,000 | | 6,057,290 |
ZIOPHARM Oncology, Inc. (a)(d) | 860,000 | | 3,216,400 |
| | 25,060,390 |
Health Care Equipment & Supplies - 4.1% |
AGA Medical Holdings, Inc. | 310,583 | | 4,500,348 |
American Medical Systems Holdings, Inc. (a) | 500,000 | | 11,180,000 |
Integra LifeSciences Holdings Corp. (a) | 337,400 | | 12,190,262 |
Natus Medical, Inc. (a) | 548,000 | | 8,044,640 |
Orthofix International NV (a) | 200,000 | | 6,056,000 |
STRATEC Biomedical Systems AG | 175,000 | | 6,548,356 |
Wright Medical Group, Inc. (a) | 670,000 | | 10,458,700 |
| | 58,978,306 |
Health Care Providers & Services - 8.0% |
Amedisys, Inc. (a)(d) | 247,400 | | 6,499,198 |
Catalyst Health Solutions, Inc. (a) | 370,000 | | 12,794,600 |
Centene Corp. (a) | 395,000 | | 8,417,450 |
Emergency Medical Services Corp. Class A (a) | 273,000 | | 12,214,020 |
Hanger Orthopedic Group, Inc. (a) | 651,900 | | 11,180,085 |
HealthSouth Corp. (a) | 570,000 | | 10,550,700 |
LHC Group, Inc. (a) | 342,400 | | 7,871,776 |
Providence Service Corp. (a) | 393,800 | | 5,670,720 |
PSS World Medical, Inc. (a)(d) | 664,499 | | 12,505,871 |
RehabCare Group, Inc. (a) | 483,000 | | 10,234,770 |
Synergy Health PLC | 780,411 | | 8,170,177 |
Team Health Holdings, Inc. | 699,000 | | 9,163,890 |
| | 115,273,257 |
Common Stocks - continued |
| Shares | | Value |
HEALTH CARE - continued |
Health Care Technology - 1.7% |
Computer Programs & Systems, Inc. (d) | 305,800 | | $ 13,751,826 |
MedAssets, Inc. (a) | 423,000 | | 9,902,430 |
| | 23,654,256 |
Life Sciences Tools & Services - 3.5% |
Bruker BioSciences Corp. (a) | 965,000 | | 12,709,050 |
ICON PLC sponsored ADR (a) | 560,000 | | 13,216,000 |
PerkinElmer, Inc. | 745,000 | | 14,497,700 |
QIAGEN NV (a) | 551,000 | | 10,314,720 |
| | 50,737,470 |
Pharmaceuticals - 1.5% |
Ardea Biosciences, Inc. (a)(d) | 209,263 | | 4,174,797 |
Auxilium Pharmaceuticals, Inc. (a)(d) | 148,935 | | 3,359,974 |
Cadence Pharmaceuticals, Inc. (a)(d) | 645,000 | | 4,940,700 |
Hikma Pharmaceuticals PLC | 785,000 | | 8,815,349 |
| | 21,290,820 |
TOTAL HEALTH CARE | | 294,994,499 |
INDUSTRIALS - 18.5% |
Aerospace & Defense - 3.5% |
Esterline Technologies Corp. (a) | 220,000 | | 11,292,600 |
Spirit AeroSystems Holdings, Inc. Class A (a) | 651,400 | | 13,255,990 |
Teledyne Technologies, Inc. (a) | 257,000 | | 10,544,710 |
Triumph Group, Inc. | 199,000 | | 15,104,100 |
| | 50,197,400 |
Building Products - 1.0% |
Armstrong World Industries, Inc. (a)(d) | 406,000 | | 14,843,360 |
Commercial Services & Supplies - 3.4% |
Prosegur Compania de Seguridad SA (Reg.) | 273,000 | | 13,424,883 |
Schawk, Inc. Class A | 600,000 | | 8,898,000 |
The Geo Group, Inc. (a) | 653,000 | | 14,091,740 |
Waste Connections, Inc. (a) | 310,000 | | 11,832,700 |
| | 48,247,323 |
Construction & Engineering - 2.6% |
Foster Wheeler AG (a) | 490,000 | | 11,279,800 |
Granite Construction, Inc. | 392,000 | | 9,114,000 |
KBR, Inc. | 450,000 | | 10,071,000 |
Orion Marine Group, Inc. (a) | 570,000 | | 7,079,400 |
| | 37,544,200 |
Common Stocks - continued |
| Shares | | Value |
INDUSTRIALS - continued |
Electrical Equipment - 2.8% |
Acuity Brands, Inc. | 257,100 | | $ 10,831,623 |
Regal-Beloit Corp. | 208,000 | | 12,652,640 |
Zumtobel AG | 852,783 | | 16,155,285 |
| | 39,639,548 |
Machinery - 1.8% |
Blount International, Inc. (a) | 640,000 | | 6,816,000 |
Commercial Vehicle Group, Inc. (a) | 1,064,273 | | 11,973,071 |
OSG Corp. | 600,000 | | 6,630,026 |
| | 25,419,097 |
Professional Services - 0.5% |
Diamond Management & Technology Consultants, Inc. | 725,000 | | 7,866,250 |
Road & Rail - 0.6% |
Contrans Group, Inc. Class A | 985,000 | | 8,576,049 |
Trading Companies & Distributors - 2.3% |
Beacon Roofing Supply, Inc. (a) | 569,000 | | 9,707,140 |
Interline Brands, Inc. (a) | 550,000 | | 9,949,500 |
Rush Enterprises, Inc. Class A (a) | 948,254 | | 14,166,915 |
| | 33,823,555 |
TOTAL INDUSTRIALS | | 266,156,782 |
INFORMATION TECHNOLOGY - 27.1% |
Communications Equipment - 5.9% |
Adtran, Inc. | 510,200 | | 16,112,116 |
CommScope, Inc. (a) | 287,200 | | 5,841,648 |
NETGEAR, Inc. (a) | 681,392 | | 16,353,406 |
Plantronics, Inc. | 520,000 | | 15,584,400 |
Polycom, Inc. (a) | 505,000 | | 14,988,400 |
Riverbed Technology, Inc. (a) | 415,000 | | 15,392,350 |
| | 84,272,320 |
Computers & Peripherals - 2.7% |
Super Micro Computer, Inc. (a) | 1,030,000 | | 14,873,200 |
Synaptics, Inc. (a)(d) | 370,000 | | 11,581,000 |
Wincor Nixdorf AG | 212,400 | | 11,988,190 |
| | 38,442,390 |
Electronic Equipment & Components - 2.6% |
Avnet, Inc. (a) | 494,000 | | 12,424,100 |
Common Stocks - continued |
| Shares | | Value |
INFORMATION TECHNOLOGY - continued |
Electronic Equipment & Components - continued |
Insight Enterprises, Inc. (a) | 815,000 | | $ 11,874,550 |
SYNNEX Corp. (a) | 472,800 | | 12,477,192 |
| | 36,775,842 |
Internet Software & Services - 5.1% |
Art Technology Group, Inc. (a) | 1,785,652 | | 6,428,347 |
j2 Global Communications, Inc. (a) | 607,500 | | 14,294,475 |
Monster Worldwide, Inc. (a)(d) | 675,880 | | 9,273,074 |
Perficient, Inc. (a)(e) | 1,548,502 | | 13,394,542 |
Rackspace Hosting, Inc. (a)(d) | 633,000 | | 11,837,100 |
Sohu.com, Inc. (a)(d) | 174,000 | | 8,181,480 |
TelecityGroup PLC (a) | 1,416,600 | | 9,620,374 |
| | 73,029,392 |
IT Services - 3.3% |
Datacash Group PLC | 2,736,200 | | 10,514,067 |
Heartland Payment Systems, Inc. | 634,000 | | 10,004,520 |
Online Resources Corp. (a)(e) | 1,897,060 | | 7,777,946 |
WNS Holdings Ltd. sponsored ADR (a) | 574,657 | | 5,148,927 |
Wright Express Corp. (a) | 382,000 | | 13,366,180 |
| | 46,811,640 |
Semiconductors & Semiconductor Equipment - 2.9% |
Hittite Microwave Corp. (a) | 148,821 | | 6,839,813 |
Microsemi Corp. (a) | 847,000 | | 13,518,120 |
Roth & Rau AG (a) | 357,200 | | 11,825,138 |
Standard Microsystems Corp. (a) | 458,000 | | 10,085,160 |
| | 42,268,231 |
Software - 4.6% |
Blackbaud, Inc. | 446,059 | | 10,567,138 |
Informatica Corp. (a) | 381,000 | | 11,479,530 |
Radiant Systems, Inc. (a) | 895,000 | | 12,717,950 |
Solera Holdings, Inc. | 342,000 | | 12,989,160 |
Taleo Corp. Class A (a) | 481,039 | | 11,833,559 |
TeleCommunication Systems, Inc. Class A (a) | 2,000,000 | | 7,180,000 |
| | 66,767,337 |
TOTAL INFORMATION TECHNOLOGY | | 388,367,152 |
MATERIALS - 1.3% |
Chemicals - 0.6% |
Solutia, Inc. (a) | 647,000 | | 9,129,170 |
Common Stocks - continued |
| Shares | | Value |
MATERIALS - continued |
Metals & Mining - 0.7% |
Commercial Metals Co. | 635,100 | | $ 9,139,089 |
TOTAL MATERIALS | | 18,268,259 |
TELECOMMUNICATION SERVICES - 0.5% |
Diversified Telecommunication Services - 0.5% |
Premiere Global Services, Inc. (a) | 1,172,000 | | 7,336,720 |
TOTAL COMMON STOCKS (Cost $1,290,877,469) | 1,365,913,777 |
Money Market Funds - 9.5% |
| | | |
Fidelity Cash Central Fund, 0.24% (b) | 69,466,459 | | 69,466,459 |
Fidelity Securities Lending Cash Central Fund, 0.27% (b)(c) | 67,877,077 | | 67,877,077 |
TOTAL MONEY MARKET FUNDS (Cost $137,343,536) | 137,343,536 |
TOTAL INVESTMENT PORTFOLIO - 104.7% (Cost $1,428,221,005) | | 1,503,257,313 |
NET OTHER ASSETS (LIABILITIES) - (4.7)% | | (68,064,626) |
NET ASSETS - 100% | $ 1,435,192,687 |
Legend |
(a) Non-income producing |
(b) Affiliated fund that is available only to investment companies and other accounts managed by Fidelity Investments. The rate quoted is the annualized seven-day yield of the fund at period end. A complete unaudited listing of the fund's holdings as of its most recent quarter end is available upon request. |
(c) Investment made with cash collateral received from securities on loan. |
(d) Security or a portion of the security is on loan at period end. |
(e) Affiliated company |
Affiliated Central Funds |
Information regarding fiscal year to date income earned by the Fund from investments in Fidelity Central Funds is as follows: |
Fund | Income earned |
Fidelity Cash Central Fund | $ 149,674 |
Fidelity Securities Lending Cash Central Fund | 1,296,145 |
Total | $ 1,445,819 |
Other Affiliated Issuers |
An affiliated company is a company in which the fund has ownership of at least 5% of the voting securities. Fiscal year to date transactions with companies which are or were affiliates are as follows: |
Affiliate | Value, beginning of period | Purchases | Sales Proceeds | Dividend Income | Value, end of period |
Commercial Vehicle Group, Inc. | $ - | $ 9,035,246 | $ 6,160,191 | $ - | $ - |
Online Resources Corp. | 7,502,350 | 4,608,401 | 537,693 | - | 7,777,946 |
Perficient, Inc. | - | 15,347,170 | - | - | 13,394,542 |
Town Sports International Holdings, Inc. | 4,060,850 | 759,596 | 3,236,327 | - | - |
Total | $ 11,563,200 | $ 29,750,413 | $ 9,934,211 | $ - | $ 21,172,488 |
Other Information |
All investments are categorized as Level 1 under the Fair Value Hierarchy. The inputs or methodology used for valuing securities may not be an indication of the risk associated with investing in those securities. For more information on valuation inputs, please refer to the Security Valuation section in the accompanying Notes to Financial Statements. |
Distribution of investments by country of issue, as a percentage of total net assets, is as follows: (Unaudited) |
United States of America | 83.8% |
Germany | 3.3% |
United Kingdom | 3.1% |
Canada | 2.1% |
Austria | 1.1% |
Spain | 1.0% |
Others (Individually Less Than 1%) | 5.6% |
| 100.0% |
Income Tax Information |
At July 31, 2010, the Fund had a capital loss carryforward of approximately $193,259,144 all of which will expire on July 31, 2017. Capital loss carryforwards are only available to offset future capital gains of the Fund to the extent provided by regulations and may be limited. |
See accompanying notes which are an integral part of the financial statements.
Annual Report
Statement of Assets and Liabilities
| July 31, 2010 |
| | |
Assets | | |
Investment in securities, at value (including securities loaned of $66,419,896) - See accompanying schedule: Unaffiliated issuers (cost $1,264,897,501) | $ 1,344,741,289 | |
Fidelity Central Funds (cost $137,343,536) | 137,343,536 | |
Other affiliated issuers (cost $25,979,968) | 21,172,488 | |
Total Investments (cost $1,428,221,005) | | $ 1,503,257,313 |
Cash | | 315,767 |
Receivable for investments sold | | 13,654,738 |
Receivable for fund shares sold | | 2,171,959 |
Dividends receivable | | 292,550 |
Distributions receivable from Fidelity Central Funds | | 132,533 |
Other receivables | | 33,561 |
Total assets | | 1,519,858,421 |
| | |
Liabilities | | |
Payable to custodian bank | $ 29,626 | |
Payable for investments purchased | 14,818,248 | |
Payable for fund shares redeemed | 742,277 | |
Accrued management fee | 742,220 | |
Distribution fees payable | 38,799 | |
Other affiliated payables | 356,239 | |
Other payables and accrued expenses | 61,248 | |
Collateral on securities loaned, at value | 67,877,077 | |
Total liabilities | | 84,665,734 |
| | |
Net Assets | | $ 1,435,192,687 |
Net Assets consist of: | | |
Paid in capital | | $ 1,560,322,935 |
Accumulated undistributed net realized gain (loss) on investments and foreign currency transactions | | (200,164,970) |
Net unrealized appreciation (depreciation) on investments and assets and liabilities in foreign currencies | | 75,034,722 |
Net Assets | | $ 1,435,192,687 |
See accompanying notes which are an integral part of the financial statements.
Annual Report
Statement of Assets and Liabilities - continued
| July 31, 2010 |
| | |
Calculation of Maximum Offering Price
Class A:
Net Asset Value and redemption price per share
($50,620,117 ÷ 3,999,164 shares) | | $ 12.66 |
| | |
Maximum offering price per share (100/94.25 of $12.66) | | $ 13.43 |
Class T:
Net Asset Value and redemption price per share ($23,930,175 ÷ 1,904,460 shares) | | $ 12.57 |
| | |
Maximum offering price per share (100/96.50 of $12.57) | | $ 13.03 |
Class B:
Net Asset Value and offering price per share ($5,141,694 ÷ 417,875 shares)A | | $ 12.30 |
| | |
Class C:
Net Asset Value and offering price per share ($18,091,241 ÷ 1,472,976 shares)A | | $ 12.28 |
| | |
Small Cap Growth:
Net Asset Value, offering price and redemption price per share ($1,204,817,925 ÷ 94,067,973 shares) | | $ 12.81 |
| | |
Class F:
Net Asset Value, offering price and redemption price per share ($106,941,045 ÷ 8,320,712 shares) | | $ 12.85 |
| | |
Institutional Class:
Net Asset Value, offering price and redemption price per share ($25,650,490 ÷ 1,999,058 shares) | | $ 12.83 |
A Redemption price per share is equal to net asset value less any applicable contingent deferred sales charge.
See accompanying notes which are an integral part of the financial statements.
Annual Report
Financial Statements - continued
Statement of Operations
| Year ended July 31, 2010 |
| | |
Investment Income | | |
Dividends | | $ 7,668,648 |
Special dividends | | 1,409,998 |
Interest | | 77 |
Income from Fidelity Central Funds (including $1,296,145 from security lending) | | 1,445,819 |
Total income | | 10,524,542 |
| | |
Expenses | | |
Management fee
Basic fee | $ 9,613,711 | |
Performance adjustment | 303,437 | |
Transfer agent fees | 3,875,107 | |
Distribution fees | 458,801 | |
Accounting and security lending fees | 472,799 | |
Custodian fees and expenses | 60,299 | |
Independent trustees' compensation | 7,713 | |
Registration fees | 89,950 | |
Audit | 55,399 | |
Legal | 5,688 | |
Miscellaneous | 20,225 | |
Total expenses before reductions | 14,963,129 | |
Expense reductions | (169,459) | 14,793,670 |
Net investment income (loss) | | (4,269,128) |
Realized and Unrealized Gain (Loss) Net realized gain (loss) on: | | |
Investment securities: | | |
Unaffiliated issuers | 241,077,337 | |
Other affiliated issuers | 987,981 | |
Foreign currency transactions | (28,960) | |
Capital gain distributions from Fidelity Central Funds | 2,501 | |
Total net realized gain (loss) | | 242,038,859 |
Change in net unrealized appreciation (depreciation) on: Investment securities | (34,114,564) | |
Assets and liabilities in foreign currencies | (2,138) | |
Total change in net unrealized appreciation (depreciation) | | (34,116,702) |
Net gain (loss) | | 207,922,157 |
Net increase (decrease) in net assets resulting from operations | | $ 203,653,029 |
See accompanying notes which are an integral part of the financial statements.
Annual Report
Statement of Changes in Net Assets
| Year ended
July 31,
2010 | Year ended
July 31,
2009 |
Increase (Decrease) in Net Assets | | |
Operations | | |
Net investment income (loss) | $ (4,269,128) | $ (4,212,561) |
Net realized gain (loss) | 242,038,859 | (335,295,985) |
Change in net unrealized appreciation (depreciation) | (34,116,702) | 109,380,680 |
Net increase (decrease) in net assets resulting
from operations | 203,653,029 | (230,127,866) |
Share transactions - net increase (decrease) | 46,578,163 | 89,233,558 |
Redemption fees | 232,258 | 255,734 |
Total increase (decrease) in net assets | 250,463,450 | (140,638,574) |
| | |
Net Assets | | |
Beginning of period | 1,184,729,237 | 1,325,367,811 |
End of period | $ 1,435,192,687 | $ 1,184,729,237 |
See accompanying notes which are an integral part of the financial statements.
Annual Report
Financial Highlights - Class A
Years ended July 31, | 2010 | 2009 | 2008 | 2007 | 2006 |
Selected Per-Share Data | | | | | |
Net asset value, beginning of period | $ 10.79 | $ 13.20 | $ 16.06 | $ 12.88 | $ 12.95 |
Income from Investment Operations | | | | | |
Net investment income (loss) C | (.07) F | (.06) | (.11) | (.12) G | (.10) H |
Net realized and unrealized gain (loss) | 1.94 | (2.35) | (1.73) | 3.39 | .18 |
Total from investment operations | 1.87 | (2.41) | (1.84) | 3.27 | .08 |
Distributions from net realized gain | - | - | (1.02) | (.09) | (.16) |
Redemption fees added to paid in capital C | - J | - J | - J | - J | .01 |
Net asset value, end of period | $ 12.66 | $ 10.79 | $ 13.20 | $ 16.06 | $ 12.88 |
Total Return A, B | 17.33% | (18.26)% | (12.26)% | 25.52% | .70% |
Ratios to Average Net Assets D, I | | | | | |
Expenses before reductions | 1.35% | 1.33% | 1.40% | 1.44% | 1.53% |
Expenses net of fee waivers,
if any | 1.35% | 1.33% | 1.40% | 1.40% | 1.40% |
Expenses net of all reductions | 1.34% | 1.33% | 1.39% | 1.39% | 1.35% |
Net investment income (loss) | (.56)% F | (.64)% | (.74)% | (.80)% G | (.79)% H |
Supplemental Data | | | | | |
Net assets, end of period
(000 omitted) | $ 50,620 | $ 40,211 | $ 42,187 | $ 33,588 | $ 18,104 |
Portfolio turnover rate E | 105% | 150% | 113% | 91% | 129% |
A Total returns would have been lower had certain expenses not been reduced during the periods shown.
B Total returns do not include the effect of the sales charges.
C Calculated based on average shares outstanding during the period.
D Fees and expenses of the underlying Fidelity Central Funds are not included in the Fund's expense ratio. The Fund indirectly bears its proportionate share of the expenses of any underlying Fidelity Central Funds.
E Amount does not include the portfolio activity of any underlying Fidelity Central Funds.
F Investment income per share reflects a special dividend which amounted to $.01 per share. Excluding the special dividend, the ratio of net investment income (loss) to average net assets would have been (.67)%.
G Investment income per share reflects a special dividend which amounted to $.01 per share. Excluding the special dividend, the ratio of net investment income (loss) to average net assets would have been (.84)%.
H Investment income per share reflects a special dividend which amounted to $.01 per share. Excluding the special dividend, the ratio of net investment income (loss) to average net assets would have been (.85)%.
I Expense ratios reflect operating expenses of the class. Expenses before reductions do not reflect amounts reimbursed by the investment adviser or reductions from brokerage service arrangements or reductions from other expense offset arrangements and do not represent the amount paid by the class during periods when reimbursements or reductions occur. Expenses net of fee waivers reflect expenses after reimbursement by the investment adviser but prior to reductions from brokerage service arrangements or other expense offset arrangements. Expenses net of all reductions represent the net expenses paid by the class.
J Amount represents less than $.01 per share.
See accompanying notes which are an integral part of the financial statements.
Annual Report
Financial Highlights - Class T
Years ended July 31, | 2010 | 2009 | 2008 | 2007 | 2006 |
Selected Per-Share Data | | | | | |
Net asset value, beginning of period | $ 10.74 | $ 13.17 | $ 16.01 | $ 12.86 | $ 12.93 |
Income from Investment Operations | | | | | |
Net investment income (loss) C | (.10) F | (.09) | (.15) | (.16) G | (.14) H |
Net realized and unrealized gain (loss) | 1.93 | (2.34) | (1.73) | 3.38 | .19 |
Total from investment operations | 1.83 | (2.43) | (1.88) | 3.22 | .05 |
Distributions from net realized gain | - | - | (.96) | (.07) | (.13) |
Redemption fees added to paid in capital C | - J | - J | - J | - J | .01 |
Net asset value, end of period | $ 12.57 | $ 10.74 | $ 13.17 | $ 16.01 | $ 12.86 |
Total Return A, B | 17.04% | (18.45)% | (12.50)% | 25.18% | .48% |
Ratios to Average Net Assets D, I | | | | | |
Expenses before reductions | 1.61% | 1.60% | 1.65% | 1.67% | 1.73% |
Expenses net of fee waivers,
if any | 1.61% | 1.60% | 1.65% | 1.65% | 1.65% |
Expenses net of all reductions | 1.60% | 1.59% | 1.65% | 1.65% | 1.60% |
Net investment income (loss) | (.82)% F | (.91)% | (.99)% | (1.05)% G | (1.04)% H |
Supplemental Data | | | | | |
Net assets, end of period
(000 omitted) | $ 23,930 | $ 21,533 | $ 21,754 | $ 26,419 | $ 19,205 |
Portfolio turnover rate E | 105% | 150% | 113% | 91% | 129% |
A Total returns would have been lower had certain expenses not been reduced during the periods shown.
B Total returns do not include the effect of the sales charges.
C Calculated based on average shares outstanding during the period.
D Fees and expenses of the underlying Fidelity Central Funds are not included in the Fund's expense ratio. The Fund indirectly bears its proportionate share of the expenses of any underlying Fidelity Central Funds.
E Amount does not include the portfolio activity of any underlying Fidelity Central Funds.
F Investment income per share reflects a special dividend which amounted to $.01 per share. Excluding the special dividend, the ratio of net investment income (loss) to average net assets would have been (.93)%.
G Investment income per share reflects a special dividend which amounted to $.01 per share. Excluding the special dividend, the ratio of net investment income (loss) to average net assets would have been (1.09)%.
H Investment income per share reflects a special dividend which amounted to $.01 per share. Excluding the special dividend, the ratio of net investment income (loss) to average net assets would have been (1.10)%.
I Expense ratios reflect operating expenses of the class. Expenses before reductions do not reflect amounts reimbursed by the investment adviser or reductions from brokerage service arrangements or reductions from other expense offset arrangements and do not represent the amount paid by the class during periods when reimbursements or reductions occur. Expenses net of fee waivers reflect expenses after reimbursement by the investment adviser but prior to reductions from brokerage service arrangements or other expense offset arrangements. Expenses net of all reductions represent the net expenses paid by the class.
J Amount represents less than $.01 per share.
See accompanying notes which are an integral part of the financial statements.
Annual Report
Financial Highlights - Class B
Years ended July 31, | 2010 | 2009 | 2008 | 2007 | 2006 |
Selected Per-Share Data | | | | | |
Net asset value, beginning of period | $ 10.57 | $ 13.03 | $ 15.85 | $ 12.78 | $ 12.87 |
Income from Investment Operations | | | | | |
Net investment income (loss) C | (.16) F | (.13) | (.22) | (.23) G | (.20) H |
Net realized and unrealized gain (loss) | 1.89 | (2.33) | (1.71) | 3.36 | .19 |
Total from investment operations | 1.73 | (2.46) | (1.93) | 3.13 | (.01) |
Distributions from net realized gain | - | - | (.89) | (.06) | (.09) |
Redemption fees added to paid in capital C | - J | - J | - J | - J | .01 |
Net asset value, end of period | $ 12.30 | $ 10.57 | $ 13.03 | $ 15.85 | $ 12.78 |
Total Return A, B | 16.37% | (18.88)% | (12.92)% | 24.57% | (.03)% |
Ratios to Average Net Assets D, I | | | | | |
Expenses before reductions | 2.11% | 2.08% | 2.15% | 2.20% | 2.28% |
Expenses net of fee waivers,
if any | 2.11% | 2.08% | 2.15% | 2.15% | 2.15% |
Expenses net of all reductions | 2.09% | 2.08% | 2.15% | 2.15% | 2.10% |
Net investment income (loss) | (1.32)% F | (1.39)% | (1.49)% | (1.55)% G | (1.54)% H |
Supplemental Data | | | | | |
Net assets, end of period
(000 omitted) | $ 5,142 | $ 4,171 | $ 5,517 | $ 6,242 | $ 5,191 |
Portfolio turnover rate E | 105% | 150% | 113% | 91% | 129% |
A Total returns would have been lower had certain expenses not been reduced during the periods shown.
B Total returns do not include the effect of the contingent deferred sales charge.
C Calculated based on average shares outstanding during the period.
D Fees and expenses of the underlying Fidelity Central Funds are not included in the Fund's expense ratio. The Fund indirectly bears its proportionate share of the expenses of any underlying Fidelity Central Funds.
E Amount does not include the portfolio activity of any underlying Fidelity Central Funds.
F Investment income per share reflects a special dividend which amounted to $.01 per share. Excluding the special dividend, the ratio of net investment income (loss) to average net assets would have been (1.42)%.
G Investment income per share reflects a special dividend which amounted to $.01 per share. Excluding the special dividend, the ratio of net investment income (loss) to average net assets would have been (1.59)%.
H Investment income per share reflects a special dividend which amounted to $.01 per share. Excluding the special dividend, the ratio of net investment income (loss) to average net assets would have been (1.60)%.
I Expense ratios reflect operating expenses of the class. Expenses before reductions do not reflect amounts reimbursed by the investment adviser or reductions from brokerage service arrangements or reductions from other expense offset arrangements and do not represent the amount paid by the class during periods when reimbursements or reductions occur. Expenses net of fee waivers reflect expenses after reimbursement by the investment adviser but prior to reductions from brokerage service arrangements or other expense offset arrangements. Expenses net of all reductions represent the net expenses paid by the class.
J Amount represents less than $.01 per share.
See accompanying notes which are an integral part of the financial statements.
Annual Report
Financial Highlights - Class C
Years ended July 31, | 2010 | 2009 | 2008 | 2007 | 2006 |
Selected Per-Share Data | | | | | |
Net asset value, beginning of period | $ 10.55 | $ 13.00 | $ 15.84 | $ 12.77 | $ 12.88 |
Income from Investment Operations | | | | | |
Net investment income (loss) C | (.16) F | (.13) | (.22) | (.23) G | (.20) H |
Net realized and unrealized gain (loss) | 1.89 | (2.32) | (1.71) | 3.36 | .18 |
Total from investment operations | 1.73 | (2.45) | (1.93) | 3.13 | (.02) |
Distributions from net realized gain | - | - | (.91) | (.06) | (.10) |
Redemption fees added to paid in capital C | - J | - J | - J | - J | .01 |
Net asset value, end of period | $ 12.28 | $ 10.55 | $ 13.00 | $ 15.84 | $ 12.77 |
Total Return A, B | 16.40% | (18.85)% | (12.94)% | 24.59% | (.08)% |
Ratios to Average Net Assets D, I | | | | | |
Expenses before reductions | 2.11% | 2.08% | 2.15% | 2.20% | 2.25% |
Expenses net of fee waivers,
if any | 2.11% | 2.08% | 2.15% | 2.15% | 2.15% |
Expenses net of all reductions | 2.09% | 2.07% | 2.14% | 2.14% | 2.10% |
Net investment income (loss) | (1.32)% F | (1.39)% | (1.49)% | (1.55)% G | (1.54)% H |
Supplemental Data | | | | | |
Net assets, end of period
(000 omitted) | $ 18,091 | $ 14,267 | $ 15,946 | $ 22,348 | $ 14,682 |
Portfolio turnover rateE | 105% | 150% | 113% | 91% | 129% |
A Total returns would have been lower had certain expenses not been reduced during the periods shown.
B Total returns do not include the effect of the contingent deferred sales charge.
C Calculated based on average shares outstanding during the period.
D Fees and expenses of the underlying Fidelity Central Funds are not included in the Fund's expense ratio. The Fund indirectly bears its proportionate share of the expenses of any underlying Fidelity Central Funds.
E Amount does not include the portfolio activity of any underlying Fidelity Central Funds.
F Investment income per share reflects a special dividend which amounted to $.01 per share. Excluding the special dividend, the ratio of net investment income (loss) to average net assets would have been (1.42)%.
G Investment income per share reflects a special dividend which amounted to $.01 per share. Excluding the special dividend, the ratio of net investment income (loss) to average net assets would have been (1.59)%.
H Investment income per share reflects a special dividend which amounted to $.01 per share. Excluding the special dividend, the ratio of net investment income (loss) to average net assets would have been (1.60)%.
I Expense ratios reflect operating expenses of the class. Expenses before reductions do not reflect amounts reimbursed by the investment adviser or reductions from brokerage service arrangements or reductions from other expense offset arrangements and do not represent the amount paid by the class during periods when reimbursements or reductions occur. Expenses net of fee waivers reflect expenses after reimbursement by the investment adviser but prior to reductions from brokerage service arrangements or other expense offset arrangements. Expenses net of all reductions represent the net expenses paid by the class.
J Amount represents less than $.01 per share.
See accompanying notes which are an integral part of the financial statements.
Annual Report
Financial Highlights - Small Cap Growth
Years ended July 31, | 2010 | 2009 | 2008 | 2007 | 2006 |
Selected Per-Share Data | | | | | |
Net asset value, beginning of period | $ 10.89 | $ 13.29 | $ 16.15 | $ 12.93 | $ 12.98 |
Income from Investment Operations | | | | | |
Net investment income (loss) B | (.04) E | (.04) | (.07) | (.08) F | (.07) G |
Net realized and unrealized gain (loss) | 1.96 | (2.36) | (1.74) | 3.40 | .19 |
Total from investment operations | 1.92 | (2.40) | (1.81) | 3.32 | .12 |
Distributions from net realized gain | - | - | (1.05) | (.10) | (.18) |
Redemption fees added to paid in capital B | - I | - I | - I | - I | .01 |
Net asset value, end of period | $ 12.81 | $ 10.89 | $ 13.29 | $ 16.15 | $ 12.93 |
Total Return A | 17.63% | (18.06)% | (11.98)% | 25.84% | 1.01% |
Ratios to Average Net Assets C, H | | | | |
Expenses before reductions | 1.08% | 1.08% | 1.11% | 1.10% | 1.13% |
Expenses net of fee waivers,
if any | 1.08% | 1.08% | 1.11% | 1.10% | 1.13% |
Expenses net of all reductions | 1.07% | 1.08% | 1.10% | 1.09% | 1.08% |
Net investment income (loss) | (.29)% E | (.39)% | (.45)% | (.50)% F | (.52)% G |
Supplemental Data | | | | | |
Net assets, end of period (000 omitted) | $ 1,204,818 | $ 1,085,184 | $ 1,217,520 | $ 1,149,809 | $ 402,353 |
Portfolio turnover rate D | 105% | 150% | 113% | 91% | 129% |
A Total returns would have been lower had certain expenses not been reduced during the periods shown.
B Calculated based on average shares outstanding during the period.
C Fees and expenses of the underlying Fidelity Central Funds are not included in the Fund's expense ratio. The Fund indirectly bears its proportionate share of the expenses of any underlying Fidelity Central Funds.
D Amount does not include the portfolio activity of any underlying Fidelity Central Funds.
E Investment income per share reflects a special dividend which amounted to $.01 per share. Excluding the special dividend, the ratio of net investment income (loss) to average net assets would have been (.39)%.
F Investment income per share reflects a special dividend which amounted to $.01 per share. Excluding the special dividend, the ratio of net investment income (loss) to average net assets would have been (.54)%.
G Investment income per share reflects a special dividend which amounted to $.01 per share. Excluding the special dividend, the ratio of net investment income (loss) to average net assets would have been (.58)%.
H Expense ratios reflect operating expenses of the class. Expenses before reductions do not reflect amounts reimbursed by the investment adviser or reductions from brokerage service arrangements or reductions from other expense offset arrangements and do not represent the amount paid by the class during periods when reimbursements or reductions occur. Expenses net of fee waivers reflect expenses after reimbursement by the investment adviser but prior to reductions from brokerage service arrangements or other expense offset arrangements. Expenses net of all reductions represent the net expenses paid by the class.
I Amount represents less than $.01 per share.
See accompanying notes which are an integral part of the financial statements.
Annual Report
Financial Highlights - Class F
Years ended July 31, | 2010 | 2009 I |
Selected Per-Share Data | | |
Net asset value, beginning of period | $ 10.90 | $ 10.03 |
Income from Investment Operations | | |
Net investment income (loss) D | - G, K | (.01) |
Net realized and unrealized gain (loss) | 1.95 | .88 H |
Total from investment operations | 1.95 | .87 |
Redemption fees added to paid in capital D, K | - | - |
Net asset value, end of period | $ 12.85 | $ 10.90 |
Total Return B, C | 17.89% | 8.67% |
Ratios to Average Net Assets E, J | | |
Expenses before reductions | .78% | .74% A |
Expenses net of fee waivers, if any | .78% | .74% A |
Expenses net of all reductions | .77% | .73% A |
Net investment income (loss) | -% G, L | (.54)% A |
Supplemental Data | | |
Net assets, end of period (000 omitted) | $ 106,941 | $ 159 |
Portfolio turnover rate F | 105% | 150% |
A Annualized
B Total returns for periods of less than one year are not annualized.
C Total returns would have been lower had certain expenses not been reduced during the periods shown.
D Calculated based on average shares outstanding during the period.
E Fees and expenses of the underlying Fidelity Central Funds are not included in the Fund's expense ratio. The Fund indirectly bears its proportionate share of the expenses of any underlying Fidelity Central Funds.
F Amount does not include the portfolio activity of any underlying Fidelity Central Funds.
G Investment income per share reflects a special dividend which amounted to $.01 per share. Excluding the special dividend, the ratio of net investment income (loss) to average net assets would have been (.10)%.
H The amount shown for a share outstanding does not correspond with the aggregate net gain (loss) on investments for the period due to the timing of sales and repurchases of shares in relation to fluctuating market values of the investments of the Fund.
I For the period June 26, 2009 (commencement of sale of shares) to July 31, 2009.
J Expense ratios reflect operating expenses of the class. Expenses before reductions do not reflect amounts reimbursed by the investment adviser or reductions from brokerage service arrangements or reductions from other expense offset arrangements and do not represent the amount paid by the class during periods when reimbursements or reductions occur. Expense ratios before reductions for start-up periods may not be representative of longer-term operating periods. Expenses net of fee waivers reflect expenses after reimbursement by the investment adviser but prior to reductions from brokerage service arrangements or other expense offset arrangements. Expenses net of all reductions represent the net expenses paid by the class.
K Amount represents less than $.01 per share.
L Amount represents less than .01%.
See accompanying notes which are an integral part of the financial statements.
Annual Report
Financial Highlights - Institutional Class
Years ended July 31, | 2010 | 2009 | 2008 | 2007 | 2006 |
Selected Per-Share Data | | | | | |
Net asset value, beginning of period | $ 10.91 | $ 13.30 | $ 16.15 | $ 12.92 | $ 12.97 |
Income from Investment Operations | | | | | |
Net investment income (loss) B | (.03) E | (.03) | (.06) | (.07) F | (.07) G |
Net realized and unrealized gain (loss) | 1.95 | (2.36) | (1.74) | 3.41 | .19 |
Total from investment operations | 1.92 | (2.39) | (1.80) | 3.34 | .12 |
Distributions from net realized gain | - | - | (1.05) | (.11) | (.18) |
Redemption fees added to paid in capital B | - I | - I | - I | - I | .01 |
Net asset value, end of period | $ 12.83 | $ 10.91 | $ 13.30 | $ 16.15 | $ 12.92 |
Total Return A | 17.60% | (17.97)% | (11.93)% | 25.99% | .97% |
Ratios to Average Net Assets C, H | | | | | |
Expenses before reductions | 1.03% | 1.05% | 1.04% | 1.05% | 1.10% |
Expenses net of fee waivers,
if any | 1.03% | 1.05% | 1.04% | 1.05% | 1.10% |
Expenses net of all reductions | 1.02% | 1.04% | 1.03% | 1.05% | 1.05% |
Net investment income (loss) | (.24)% E | (.36)% | (.38)% | (.46)% F | (.49)% G |
Supplemental Data | | | | | |
Net assets, end of period
(000 omitted) | $ 25,650 | $ 19,204 | $ 22,444 | $ 18,671 | $ 14,233 |
Portfolio turnover rate D | 105% | 150% | 113% | 91% | 129% |
A Total returns would have been lower had certain expenses not been reduced during the periods shown.
B Calculated based on average shares outstanding during the period.
C Fees and expenses of the underlying Fidelity Central Funds are not included in the Fund's expense ratio. The Fund indirectly bears its proportionate share of the expenses of any underlying Fidelity Central Funds.
D Amount does not include the portfolio activity of any underlying Fidelity Central Funds.
E Investment income per share reflects a special dividend which amounted to $.01 per share. Excluding the special dividend, the ratio of net investment income (loss) to average net assets would have been (.34)%.
F Investment income per share reflects a special dividend which amounted to $.01 per share. Excluding the special dividend, the ratio of net investment income (loss) to average net assets would have been (.50)%.
G Investment income per share reflects a special dividend which amounted to $.01 per share. Excluding the special dividend, the ratio of net investment income (loss) to average net assets would have been (.55)%.
H Expense ratios reflect operating expenses of the class. Expenses before reductions do not reflect amounts reimbursed by the investment adviser or reductions from brokerage service arrangements or reductions from other expense offset arrangements and do not represent the amount paid by the class during periods when reimbursements or reductions occur. Expenses net of fee waivers reflect expenses after reimbursement by the investment adviser but prior to reductions from brokerage service arrangements or other expense offset arrangements. Expenses net of all reductions represent the net expenses paid by the class.
I Amount represents less than $.01 per share.
See accompanying notes which are an integral part of the financial statements.
Annual Report
Notes to Financial Statements
For the period ended July 31, 2010
1. Organization.
Fidelity Small Cap Growth Fund (the Fund) is a fund of Fidelity Securities Fund (the Trust) and is authorized to issue an unlimited number of shares. The Trust is registered under the Investment Company Act of 1940, as amended (the 1940 Act), as an open-end management investment company organized as a Massachusetts business trust. The Fund offers Class A, Class T, Class B, Class C, Small Cap Growth, Class F and Institutional Class shares, each of which has equal rights as to assets and voting privileges. Effective after the close of business on September 1, 2010, Class B shares will be closed to new accounts and additional purchases by existing shareholders. Each class has exclusive voting rights with respect to matters that affect that class. Class F shares of the Fund are only available for purchase by mutual funds for which Fidelity Management & Research Company (FMR) or an affiliate serves as investment manager. Class B shares will automatically convert to Class A shares after a holding period of seven years from the initial date of purchase. Investment income, realized and unrealized capital gains and losses, the common expenses of the Fund, and certain fund-level expense reductions, if any, are allocated on a pro-rata basis to each class based on the relative net assets of each class to the total net assets of the Fund. Each class differs with respect to transfer agent and distribution and service plan fees incurred. Certain expense reductions also differ by class.
2. Investments in Fidelity Central Funds.
The Fund may invest in Fidelity Central Funds, which are open-end investment companies available only to other investment companies and accounts managed by FMR and its affiliates. The Fund's Schedule of Investments lists each of the Fidelity Central Funds held as of period end, if any, as an investment of the Fund, but does not include the underlying holdings of each Fidelity Central Fund. As an Investing Fund, the Fund indirectly bears its proportionate share of the expenses of the underlying Fidelity Central Funds.
The Money Market Central Funds seek preservation of capital and current income and are managed by Fidelity Investments Money Management, Inc. (FIMM), an affiliate of FMR.
A complete unaudited list of holdings for each Fidelity Central Fund is available upon request or at the Securities and Exchange Commission (the SEC) web site at www.sec.gov. In addition, the financial statements of the Fidelity Central Funds which are not covered by the Fund's Report of Independent Registered Public Accounting Firm, are available on the SEC web site or upon request.
Annual Report
3. Significant Accounting Policies.
The financial statements have been prepared in conformity with accounting principles generally accepted in the United States of America (GAAP), which require management to make certain estimates and assumptions at the date of the financial statements. Actual results could differ from those estimates. The following summarizes the significant accounting policies of the Fund:
Security Valuation. Investments are valued as of 4:00 p.m. Eastern time on the last calendar day of the period. The Fund uses independent pricing services approved by the Board of Trustees to value its investments. When current market prices or quotations are not readily available or reliable, valuations may be determined in good faith in accordance with procedures adopted by the Board of Trustees. Factors used in determining value may include market or security specific events. The frequency with which these procedures are used cannot be predicted and they may be utilized to a significant extent. The value used for net asset value (NAV) calculation under these procedures may differ from published prices for the same securities.
The Fund categorizes the inputs to valuation techniques used to value its investments into a disclosure hierarchy consisting of three levels as shown below.
Level 1 - quoted prices in active markets for identical investments
Level 2 - other significant observable inputs (including quoted prices for similar investments, interest rates, prepayment speeds, etc.)
Level 3 - unobservable inputs (including the fund's own assumptions based on the best information available)
Changes in valuation techniques may result in transfers in or out of an assigned level within the disclosure hierarchy. The aggregate value of investments by input level, as of July 31, 2010 is included at the end of the Fund's Schedule of Investments. Valuation techniques used to value the Fund's investments by major category are as follows.
Equity securities, including restricted securities, for which market quotations are readily available, are valued at the last reported sale price or official closing price as reported by an independent pricing service on the primary market or exchange on which they are traded and are categorized as Level 1 in the hierarchy. In the event there were no sales during the day or closing prices are not available, securities are valued at the last quoted bid price or may be valued using the last available price and are generally categorized as Level 2 in the hierarchy. For foreign equity securities, when significant market or security specific events arise, comparisons to the valuation of American Depositary Receipts (ADRs) futures contracts, Exchange-traded funds (ETFs) and certain indexes as well as quoted prices for similar securities are used and are categorized as Level 2 in the hierarchy
Annual Report
Notes to Financial Statements - continued
3. Significant Accounting Policies - continued
Security Valuation - continued
in these circumstances. Utilizing these techniques may result in transfers between Level 1 and Level 2. For restricted equity securities and private placements where observable inputs are limited, assumptions about market activity and risk are used and are categorized as Level 3 in the hierarchy.
Investments in open-end mutual funds, including the Fidelity Central Funds, are valued at their closing net asset value each business day and are categorized as Level 1 in the hierarchy. Short-term securities with remaining maturities of sixty days or less for which quotations are not readily available are valued at amortized cost, which approximates fair value and are categorized as Level 2 in the hierarchy.
Foreign Currency. The Fund uses foreign currency contracts to facilitate transactions in foreign-denominated securities. Gains and losses from these transactions may arise from changes in the value of the foreign currency or if the counterparties do not perform under the contracts' terms.
Foreign-denominated assets, including investment securities, and liabilities are translated into U.S. dollars at the exchange rate at period end. Purchases and sales of investment securities, income and dividends received and expenses denominated in foreign currencies are translated into U.S. dollars at the exchange rate in effect on the transaction date.
The effects of exchange rate fluctuations on investments are included with the net realized and unrealized gain (loss) on investment securities. Other foreign currency transactions resulting in realized and unrealized gain (loss) are disclosed separately.
Investment Transactions and Income. For financial reporting purposes, the Fund's investment holdings and NAV include trades executed through the end of the last business day of the period. The NAV per share for processing shareholder transactions is calculated as of the close of business of the New York Stock Exchange (NYSE), normally 4:00 p.m. Eastern time and includes trades executed through the end of the prior business day. Gains and losses on securities sold are determined on the basis of identified cost and may include proceeds received from litigation. Dividend income is recorded on the ex-dividend date, except for certain dividends from foreign securities where the ex-dividend date may have passed, which are recorded as soon as the Fund is informed of the ex-dividend date. Non-cash dividends included in dividend income, if any, are recorded at the fair market value of the securities received. Distributions received on securities that represent a return of capital or capital gain are recorded as a reduction of cost of investments and/or as a realized gain. The Fund estimates the components of distributions received that may be considered return of capital distributions or capital
Annual Report
3. Significant Accounting Policies - continued
Investment Transactions and Income - continued
gain distributions. Large, non-recurring dividends recognized by the Fund are presented separately on the Statement of Operations as "Special Dividends" and the impact of these dividends is presented in the Financial Highlights. Interest income and distributions from the Fidelity Central Funds are accrued as earned. Interest income includes coupon interest and amortization of premium and accretion of discount on debt securities. Investment income is recorded net of foreign taxes withheld where recovery of such taxes is uncertain.
Expenses. Most expenses of the Trust can be directly attributed to a fund. Expenses which cannot be directly attributed are apportioned amongst each fund in the Trust. Expense estimates are accrued in the period to which they relate and adjustments are made when actual amounts are known.
Income Tax Information and Distributions to Shareholders. Each year the Fund intends to qualify as a regulated investment company, including distributing substantially all of its taxable income and realized gains under Subchapter M of the Internal Revenue Code and filing its U.S. federal tax return. As a result, no provision for income taxes is required. As of July 31, 2010, the Fund did not have any unrecognized tax benefits in the accompanying financial statements. A fund's federal tax return is subject to examination by the Internal Revenue Service (IRS) for a period of three years. Foreign taxes are provided for based on the Fund's understanding of the tax rules and rates that exist in the foreign markets in which it invests.
Distributions are recorded on the ex-dividend date. Income dividends and capital gain distributions are declared separately for each class. Income and capital gain distributions are determined in accordance with income tax regulations, which may differ from GAAP.
Capital accounts within the financial statements are adjusted for permanent book-tax differences. These adjustments have no impact on net assets or the results of operations. Temporary book-tax differences will reverse in a subsequent period.
Book-tax differences are primarily due to the short-term gain distributions from the Fidelity Central Funds, foreign currency transactions, net operating losses, capital loss carryforwards, losses deferred due to wash sales and excise tax regulations.
The federal tax cost of investment securities and unrealized appreciation (depreciation) as of period end were as follows:
Gross unrealized appreciation | $ 169,655,477 |
Gross unrealized depreciation | (101,524,996) |
Net unrealized appreciation (depreciation) | $ 68,130,481 |
| |
Tax Cost | $ 1,435,126,832 |
Annual Report
Notes to Financial Statements - continued
3. Significant Accounting Policies - continued
Income Tax Information and Distributions to Shareholders - continued
The tax-based components of distributable earnings as of period end were as follows:
Capital loss carryforward | $ (193,259,144) |
Net unrealized appreciation (depreciation) | $ 68,128,895 |
Short-Term Trading (Redemption) Fees. Shares held in the Fund less than 90 days are subject to a redemption fee equal to 1.50% of the proceeds of the redeemed shares. All redemption fees, including any estimated redemption fees paid by FMR, are retained by the Fund and accounted for as an addition to paid in capital.
4. Purchases and Sales of Investments.
Purchases and sales of securities, other than short-term securities, aggregated $1,359,919,734 and $1,335,378,288, respectively.
5. Fees and Other Transactions with Affiliates.
Management Fee. FMR and its affiliates provide the Fund with investment management related services for which the Fund pays a monthly management fee. The management fee is the sum of an individual fund fee rate that is based on an annual rate of .45% of the Fund's average net assets and a group fee rate that averaged .26% during the period. The group fee rate is based upon the average net assets of all the mutual funds advised by FMR. The group fee rate decreases as assets under management increase and increases as assets under management decrease. In addition, the management fee is subject to a performance adjustment (up to a maximum of ± .20% of the Fund's average net assets over a 36 month performance period). The upward or downward adjustment to the management fee is based on the relative investment performance of the retail class of the Fund, Small Cap Growth, as compared to an appropriate benchmark index. For the period, the total annual management fee rate, including the performance adjustment, was .73% of the Fund's average net assets.
Distribution and Service Plan. In accordance with Rule 12b-1 of the 1940 Act, the Fund has adopted separate Distribution and Service Plans for each class of shares. Certain classes pay Fidelity Distributors Corporation (FDC), an affiliate of FMR, separate Distribution and Service Fees, each of which is based on an annual percentage of each class' average net assets. In addition, FDC may pay financial intermediaries for
Annual Report
5. Fees and Other Transactions with Affiliates - continued
Distribution and Service Plan - continued
selling shares of the Fund and providing shareholder support services. For the period, the Distribution and Service Fee rates and the total amounts paid to and retained by FDC were as follows:
| Distribution
Fee | Service
Fee | Paid to
FDC | Retained
by FDC |
Class A | -% | .25% | $ 117,878 | $ 2,297 |
Class T | .25% | .25% | 118,478 | - |
Class B | .75% | .25% | 49,164 | 36,913 |
Class C | .75% | .25% | 173,281 | 40,211 |
| | | $ 458,801 | $ 79,421 |
Sales Load. FDC receives a front-end sales charge of up to 5.75% for selling Class A shares, and 3.50% for selling Class T shares, some of which is paid to financial intermediaries for selling shares of the Fund. FDC receives the proceeds of contingent deferred sales charges levied on Class A, Class T, Class B, and Class C redemptions. These charges depend on the holding period. The deferred sales charges range from 5% to 1% for Class B, 1% for Class C, 1.00% for certain purchases of Class A shares (1.00% to .50% prior to July 12, 2010) and .25% for certain purchases of Class T shares.
For the period, sales charge amounts retained by FDC were as follows:
| Retained
by FDC |
Class A | $ 27,622 |
Class T | 6,101 |
Class B* | 8,154 |
Class C* | 2,438 |
| $ 44,315 |
* When Class B and Class C shares are initially sold, FDC pays commissions from its own resources to financial intermediaries through which the
sales are made.
Transfer Agent Fees. Fidelity Investments Institutional Operations Company, Inc. (FIIOC), an affiliate of FMR, is the transfer, dividend disbursing and shareholder servicing agent for each class of the Fund. FIIOC receives account fees and asset-based fees that vary according to the account size and type of account of the shareholders of the Fund, except for Class F. FIIOC receives no fees for providing transfer agency services to Class F.
Annual Report
Notes to Financial Statements - continued
5. Fees and Other Transactions with Affiliates - continued
Transfer Agent Fees - continued
FIIOC pays for typesetting, printing and mailing of shareholder reports, except proxy statements. For the period, the total transfer agent fees paid by each class were as follows:
| Amount | % of
Average
Net Assets |
Class A | $ 150,515 | .32 |
Class T | 77,623 | .33 |
Class B | 15,920 | .32 |
Class C | 56,034 | .32 |
Small Cap Growth | 3,522,221 | .29 |
Institutional Class | 52,794 | .24 |
| $ 3,875,107 | |
Accounting and Security Lending Fees. Fidelity Service Company, Inc. (FSC), an affiliate of FMR, maintains the Fund's accounting records. The accounting fee is based on the level of average net assets for the month. Under a separate contract, FSC administers the security lending program. The security lending fee is based on the number and duration of lending transactions.
Brokerage Commissions. The Fund placed a portion of its portfolio transactions with brokerage firms which are affiliates of the investment adviser. The commissions paid to these affiliated firms were $26,958 for the period.
6. Committed Line of Credit.
The Fund participates with other funds managed by FMR in a $3.75 billion credit facility (the "line of credit") to be utilized for temporary or emergency purposes to fund shareholder redemptions or for other short-term liquidity purposes. The Fund has agreed to pay commitment fees on its pro-rata portion of the line of credit, which amounted to $5,294 and is reflected in Miscellaneous expenses on the Statement of Operations. During the period, there were no borrowings on this line of credit.
7. Security Lending.
The Fund lends portfolio securities from time to time in order to earn additional income. On the settlement date of the loan, the Fund receives collateral (in the form of U.S. Treasury obligations, letters of credit and/or cash) against the loaned securities and maintains collateral in an amount not less than 100% of the market value of the loaned securities during the period of the loan. The market value of the loaned securities is
Annual Report
7. Security Lending - continued
determined at the close of business of the Fund and any additional required collateral is delivered to the Fund on the next business day. If the borrower defaults on its obligation to return the securities loaned because of insolvency or other reasons, a fund could experience delays and costs in recovering the securities loaned or in gaining access to the collateral. Any cash collateral received is invested in the Fidelity Securities Lending Cash Central Fund. The value of loaned securities and cash collateral at period end are disclosed on the Fund's Statement of Assets and Liabilities. Security lending income represents the income earned on investing cash collateral, less fees and expenses associated with the loan, plus any premium payments that may be received on the loan of certain types of securities. Security lending income is presented in the Statement of Operations as a component of income from Fidelity Central Funds.
8. Expense Reductions.
Many of the brokers with whom FMR places trades on behalf of the Fund provided services to the Fund in addition to trade execution. These services included payments of certain expenses on behalf of the Fund totaling $169,391 for the period. In addition, through arrangements with the Fund's custodian, credits realized as a result of uninvested cash balances were used to reduce the Fund's expenses. During the period, these credits reduced the Fund's custody expenses by $68.
9. Share Transactions.
Transactions for each class of shares were as follows:
| Shares | Dollars |
Years ended July 31, | 2010 | 2009 A | 2010 | 2009 A |
Class A | | | | |
Shares sold | 1,755,238 | 1,768,538 | $ 21,749,463 | $ 16,919,128 |
Shares redeemed | (1,481,231) | (1,239,291) | (17,861,442) | (11,138,983) |
Net increase (decrease) | 274,007 | 529,247 | $ 3,888,021 | $ 5,780,145 |
Class T | | | | |
Shares sold | 492,575 | 1,485,602 | $ 6,056,365 | $ 12,842,623 |
Shares redeemed | (592,408) | (1,132,759) | (7,232,100) | (9,596,209) |
Net increase (decrease) | (99,833) | 352,843 | $ (1,175,735) | $ 3,246,414 |
Class B | | | | |
Shares sold | 117,304 | 116,072 | $ 1,414,923 | $ 1,042,949 |
Shares redeemed | (93,928) | (145,097) | (1,126,513) | (1,355,668) |
Net increase (decrease) | 23,376 | (29,025) | $ 288,410 | $ (312,719) |
A Share transactions for Class F are for the period July 26, 2009 (commencement of sale of shares) to July 31, 2009.
Annual Report
Notes to Financial Statements - continued
9. Share Transactions - continued
| Shares | Dollars |
Years ended July 31, | 2010 | 2009 A | 2010 | 2009 A |
Class C | | | | |
Shares sold | 479,633 | 604,934 | $ 5,791,649 | $ 5,793,290 |
Shares redeemed | (358,550) | (479,386) | (4,319,904) | (4,290,700) |
Net increase (decrease) | 121,083 | 125,548 | $ 1,471,745 | $ 1,502,590 |
Small Cap Growth | | | | |
Shares sold | 22,893,960 | 30,718,046 | $ 285,679,819 | $ 287,281,815 |
Shares redeemed | (28,450,958) | (22,726,319) | (351,525,118) | (209,407,815) |
Net increase (decrease) | (5,556,998) | 7,991,727 | $ (65,845,299) | $ 77,874,000 |
Class F | | | | |
Shares sold | 8,663,528 | 14,590 | $ 109,176,128 | $ 145,457 |
Shares redeemed | (357,394) | (12) | (4,690,130) | (113) |
Net increase (decrease) | 8,306,134 | 14,578 | $ 104,485,998 | $ 145,344 |
Institutional Class | | | | |
Shares sold | 1,109,901 | 802,152 | $ 14,013,757 | $ 7,245,594 |
Shares redeemed | (871,545) | (728,847) | (10,548,734) | (6,247,810) |
Net increase (decrease) | 238,356 | 73,305 | $ 3,465,023 | $ 997,784 |
A Share transactions for Class F are for the period July 26, 2009 (commencement of sale of shares) to July 31, 2009.
10. Other.
The Fund's organizational documents provide former and current trustees and officers with a limited indemnification against liabilities arising in connection with the performance of their duties to the Fund. In the normal course of business, the Fund may also enter into contracts that provide general indemnifications. The Fund's maximum exposure under these arrangements is unknown as this would be dependent on future claims that may be made against the Fund. The risk of material loss from such claims is considered remote.
At the end of the period, Fidelity Freedom 2020 Fund was the owner of record of approximately 10% of the total outstanding shares of the Fund. The Fidelity Freedom Funds and Fidelity Freedom K Funds were the owners of record, in the aggregate, of approximately 54% of the total outstanding shares of the Fund.
Annual Report
To the Trustees of Fidelity Securities Fund and the Shareholders of Fidelity Small Cap Growth Fund:
In our opinion, the accompanying statement of assets and liabilities, including the schedule of investments, and the related statements of operations and of changes in net assets and the financial highlights present fairly, in all material respects, the financial position of Fidelity Small Cap Growth Fund (a fund of Fidelity Securities Fund) at July 31, 2010, the results of its operations for the year then ended, the changes in its net assets for each of the two years in the period then ended and the financial highlights for each of the periods indicated, in conformity with accounting principles generally accepted in the United States of America. These financial statements and financial highlights (hereafter referred to as "financial statements") are the responsibility of the Fidelity Small Cap Growth Fund's management. Our responsibility is to express an opinion on these financial statements based on our audits. We conducted our audits of these financial statements in accordance with the standards of the Public Company Accounting Oversight Board (United States). Those standards require that we plan and perform the audit to obtain reasonable assurance about whether the financial statements are free of material misstatement. An audit includes examining, on a test basis, evidence supporting the amounts and disclosures in the financial statements, assessing the accounting principles used and significant estimates made by management, and evaluating the overall financial statement presentation. We believe that our audits, which included confirmation of securities at July 31, 2010 by correspondence with the custodian and brokers, provide a reasonable basis for our opinion.
/s/ PricewaterhouseCoopers LLP
PricewaterhouseCoopers LLP
Boston, Massachusetts
September 14, 2010
Annual Report
The Trustees, Member of the Advisory Board, and executive officers of the trust and fund, as applicable, are listed below. The Board of Trustees governs the fund and is responsible for protecting the interests of shareholders. The Trustees are experienced executives who meet periodically throughout the year to oversee the fund's activities, review contractual arrangements with companies that provide services to the fund, oversee management of the risks associated with such activities and contractual arrangements, and review the fund's performance. Except for James C. Curvey, each of the Trustees oversees 222 funds advised by FMR or an affiliate. Mr. Curvey oversees 411 funds advised by FMR or an affiliate.
The Trustees hold office without limit in time except that (a) any Trustee may resign; (b) any Trustee may be removed by written instrument, signed by at least two-thirds of the number of Trustees prior to such removal; (c) any Trustee who requests to be retired or who has become incapacitated by illness or injury may be retired by written instrument signed by a majority of the other Trustees; and (d) any Trustee may be removed at any special meeting of shareholders by a two-thirds vote of the outstanding voting securities of the trust. Each Trustee who is not an interested person (as defined in the 1940 Act) (Independent Trustee), shall retire not later than the last day of the calendar year in which his or her 72nd birthday occurs. The Independent Trustees may waive this mandatory retirement age policy with respect to individual Trustees. The executive officers and Advisory Board Member hold office without limit in time, except that any officer and Advisory Board Member may resign or may be removed by a vote of a majority of the Trustees at any regular meeting or any special meeting of the Trustees. Except as indicated, each individual has held the office shown or other offices in the same company for the past five years.
Experience, Skills, Attributes, and Qualifications of the Fund's Trustees. The Governance and Nominating Committee has adopted a statement of policy that describes the experience, qualifications, attributes, and skills that are necessary and desirable for potential Independent Trustee candidates (Statement of Policy). The Board believes that each Trustee satisfied at the time he or she was initially elected or appointed a Trustee, and continues to satisfy, the standards contemplated by the Statement of Policy. The Governance and Nominating Committee also engages professional search firms to help identify potential Independent Trustee candidates who have the experience, qualifications, attributes, and skills consistent with the Statement of Policy. From time to time, additional criteria based on the composition and skills of the current Independent Trustees, as well as experience or skills that may be appropriate in light of future changes to board composition, business conditions, and regulatory or other developments, have also been considered by the professional search firms and the Governance and Nominating Committee. In addition, the Board takes into account the Trustees' commitment and participation in Board and committee meetings, as well as their leadership of standing and ad hoc committees throughout their tenure.
In determining that a particular Trustee was and continues to be qualified to serve as a Trustee, the Board has considered a variety of criteria, none of which, in isolation, was controlling. The Board believes that, collectively, the Trustees have balanced and diverse experience, qualifications, attributes, and skills, which allow the Board to operate effectively in governing the fund and protecting the interests of shareholders. Information about the specific experience, skills, attributes, and qualifications of each Trustee, which in each case led to the Board's conclusion that the Trustee should serve (or continue to serve) as a trustee of the fund, is provided below.
Annual Report
Trustees and Officers - continued
Board Structure and Oversight Function. Edward C. Johnson 3d is an interested person (as defined in the 1940 Act) and currently serves as Chairman. The Trustees have determined that an interested Chairman is appropriate and benefits shareholders because an interested Chairman has a personal and professional stake in the quality and continuity of services provided to the fund. Independent Trustees exercise their informed business judgment to appoint an individual of their choosing to serve as Chairman, regardless of whether the Trustee happens to be independent or a member of management. The Independent Trustees have determined that they can act independently and effectively without having an Independent Trustee serve as Chairman and that a key structural component for assuring that they are in a position to do so is for the Independent Trustees to constitute a substantial majority for the Board. The Independent Trustees also regularly meet in executive session. Ned C. Lautenbach serves as Chairman of the Independent Trustees and as such (i) acts as a liaison between the Independent Trustees and management with respect to matters important to the Independent Trustees and (ii) with management prepares agendas for Board meetings.
Fidelity funds are overseen by different Boards of Trustees. The fund Board oversees Fidelity's equity and high income funds and another Board oversees Fidelity's investment-grade bond, money market, and asset allocation funds. The asset allocation funds may invest in Fidelity funds overseen by the fund's Board. The use of separate Boards, each with its own committee structure, allows the Trustees of each group of Fidelity funds to focus on the unique issues of the funds they oversee, including common research, investment, and operational issues. On occasion, the separate Boards establish joint committees to address issues of overlapping consequences for the Fidelity funds overseen by each Board.
The Trustees operate using a system of committees to facilitate the timely and efficient consideration of all matters of importance to the Trustees, the fund, and fund shareholders and to facilitate compliance with legal and regulatory requirements and oversight of the fund's activities and associated risks. The Board, acting through its committees, has charged FMR and its affiliates with (i) identifying events or circumstances the occurrence of which could have demonstrably adverse effects on the fund's business and/or reputation; (ii) implementing processes and controls to lessen the possibility that such events or circumstances occur or to mitigate the effects of such events or circumstances if they do occur; and (iii) creating and maintaining a system designed to evaluate continuously business and market conditions in order to facilitate the identification and implementation processes described in (i) and (ii) above. Because the day-to-day operations and activities of the fund's are carried out by or through FMR, its affiliates and other service providers, the fund's exposure to risks is mitigated but not eliminated by the processes overseen by the Trustees. While each of the Board's committees has responsibility for overseeing different aspects of the fund's activities, oversight is exercised primarily through the Operations, Audit, and Compliance Committees. Appropriate personnel, including but not limited to the fund's Chief Compliance Officer (CCO), FMR's internal auditor, the independent accountants, the fund's Treasurer and portfolio management personnel, make periodic reports to the Board's committees, as appropriate. The responsibilities of each committee, including their oversight responsibilities, are described further under "Standing Committees of the Fund's Trustees."
Annual Report
The fund's Statement of Additional Information (SAI) includes more information about the Trustees. To request a free copy, call Fidelity at 1-800-835-5092.
Interested Trustees*:
Correspondence intended for each Trustee who is an interested person may be sent to Fidelity Investments, 82 Devonshire Street, Boston, Massachusetts 02109.
Name, Age; Principal Occupations and Other Relevant Experience+ |
Edward C. Johnson 3d (80) |
| Year of Election or Appointment: 1984 Mr. Johnson is Trustee and Chairman of the Board of Trustees of certain Trusts. Mr. Johnson serves as Chief Executive Officer, Chairman, and a Director of FMR LLC; Chairman and a Director of FMR; Chairman and a Director of Fidelity Research & Analysis Company (FRAC); Chairman and a Director of Fidelity Investments Money Management, Inc.; and Chairman and a Director of FMR Co., Inc. In addition, Mr. Johnson serves as Chairman and Director of FIL Limited. Previously, Mr. Johnson served as President of FMR LLC (2006-2007). |
James C. Curvey (75) |
| Year of Election or Appointment: 2007 Mr. Curvey also serves as Trustee (2007-present) of other investment companies advised by FMR. Mr. Curvey is a Director of FMR and FMR Co., Inc. (2007-present). Mr. Curvey is also Vice Chairman (2006-present) and Director of FMR LLC. In addition, Mr. Curvey serves as an Overseer for the Boston Symphony Orchestra and a member of the Trustees of Villanova University. |
* Trustees have been determined to be "Interested Trustees" by virtue of, among other things, their affiliation with the trust or various entities under common control with FMR.
+ The information above includes each Trustee's principal occupation during the last five years and other information relating to the experience, attributes, and skills relevant to each Trustee's qualifications to serve as a Trustee, which led to the conclusion that each Trustee should serve as a Trustee for the fund.
Annual Report
Trustees and Officers - continued
Independent Trustees:
Correspondence intended for each Independent Trustee (that is, the Trustees other than the Interested Trustees) may be sent to Fidelity Investments, P.O. Box 55235, Boston, Massachusetts 02205-5235.
Name, Age; Principal Occupations and Other Relevant Experience+ |
Dennis J. Dirks (62) |
| Year of Election or Appointment: 2005 Prior to his retirement in May 2003, Mr. Dirks was Chief Operating Officer and a member of the Board of The Depository Trust & Clearing Corporation (DTCC). He also served as President, Chief Operating Officer, and Board member of The Depository Trust Company (DTC) and President and Board member of the National Securities Clearing Corporation (NSCC). In addition, Mr. Dirks served as Chief Executive Officer and Board member of the Government Securities Clearing Corporation, Chief Executive Officer and Board member of the Mortgage-Backed Securities Clearing Corporation, as a Trustee and a member of the Finance Committee of Manhattan College (2005-2008), and as a Trustee and a member of the Finance Committee of AHRC of Nassau County (2006-2008). Currently, Mr. Dirks serves as a member of the Board of Directors for The Brookville Center for Children's Services, Inc. (2009-present). |
Alan J. Lacy (56) |
| Year of Election or Appointment: 2008 Mr. Lacy serves as Senior Adviser (2007-present) of Oak Hill Capital Partners, L.P. (private equity). Mr. Lacy also served as Chief Executive Officer (2000-2005) and Vice Chairman (2005-2006) of Sears Holdings Corporation and Sears, Roebuck and Co. (retail). In addition, Mr. Lacy serves as a member of the Board of Directors of The Western Union Company (global money transfer, 2006-present) and Bristol-Myers Squibb Company (global pharmaceuticals, 2007-present). Mr. Lacy is Chairman (2008-present) and a member (2006-present) of the Board of Trustees of The National Parks Conservation Association. |
Ned C. Lautenbach (66) |
| Year of Election or Appointment: 2000 Mr. Lautenbach is Chairman of the Independent Trustees of the Equity and High Income Funds (2006-present). Mr. Lautenbach is an Advisory Partner of Clayton, Dubilier & Rice, Inc. (private equity investment, 2008-present) and was previously a Partner of Clayton, Dubilier & Rice, Inc. (1998-2008). Previously, Mr. Lautenbach was with the International Business Machines Corporation (IBM) from 1968 until his retirement in 1998. Mr. Lautenbach serves as a Director of Eaton Corporation (diversified industrial) as well as the Philharmonic Center for the Arts in Naples, Florida. Mr. Lautenbach is also a member of the Board of Trustees of Fairfield University (2005-present), as well as a member of the Council on Foreign Relations. Previously, Mr. Lautenbach served as a Director of Sony Corporation (2006-2007). |
Joseph Mauriello (65) |
| Year of Election or Appointment: 2008 Prior to his retirement in January 2006, Mr. Mauriello served in numerous senior management positions including Deputy Chairman and Chief Operating Officer (2004-2005), and Vice Chairman of Financial Services (2002-2004) of KPMG LLP US (professional services, 1965-2005). Mr. Mauriello currently serves as a member of the Board of Directors of XL Capital Ltd. (global insurance and re-insurance, 2006-present) and of Arcadia Resources Inc. (health care services and products, 2007-present). Previously, Mr. Mauriello served as a Director of the Hamilton Funds of the Bank of New York (2006-2007). |
Cornelia M. Small (66) |
| Year of Election or Appointment: 2005 Ms. Small is a member of the Board of Directors of the Teagle Foundation (2009-present). Ms. Small is also a member of the Investment Committee, and Chair (2008-present) and a member of the Board of Trustees of Smith College. In addition, Ms. Small serves on the Investment Committee of the Berkshire Taconic Community Foundation (2008-present). Previously, Ms. Small served as Chairperson of the Investment Committee (2002-2008) of Smith College. In addition, Ms. Small served as Chief Investment Officer, Director of Global Equity Investments, and a member of the Board of Directors of Scudder, Stevens & Clark and Scudder Kemper Investments. |
William S. Stavropoulos (71) |
| Year of Election or Appointment: 2002 Mr. Stavropoulos is Vice Chairman of the Independent Trustees of the Equity and High Income Funds (2006-present). Mr. Stavropoulos serves as President and Founder of the Michigan Baseball Foundation, the Great Lakes Loons (2007-present). Mr. Stavropoulos is Chairman Emeritus of the Board of Directors of The Dow Chemical Company, where he previously served in numerous senior management positions, including President, CEO (1995-2000; 2002-2004), Chairman of the Executive Committee (2000-2006), and as a member of the Board of Directors (1990-2006). Currently, Mr. Stavropoulos is a Director of Teradata Corporation (data warehousing and technology solutions, 2008-present), Chemical Financial Corporation, Maersk Inc. (industrial conglomerate), Tyco International, Inc. (multinational manufacturing and services, 2007-present), and a member of the Advisory Board for Metalmark Capital (private equity investment, 2005-present). Mr. Stavropoulos is a special advisor to Clayton, Dubilier & Rice, Inc. (private equity investment). In addition, Mr. Stavropoulos is a member of the University of Notre Dame Advisory Council for the College of Science. |
David M. Thomas (61) |
| Year of Election or Appointment: 2008 Previously, Mr. Thomas served as Executive Chairman (2005-2006) and Chairman and Chief Executive Officer (2000-2005) of IMS Health, Inc. (pharmaceutical and healthcare information solutions). In addition, Mr. Thomas serves as a member of the Board of Directors of Fortune Brands, Inc. (consumer products), and Interpublic Group of Companies, Inc. (marketing communication, 2004-present). |
Michael E. Wiley (59) |
| Year of Election or Appointment: 2008 Mr. Wiley also serves as a Director of Asia Pacific Exploration Consolidated (international oil and gas exploration and production, 2008-present), and as a member of the Board of Trustees of the University of Tulsa (2000-2006; 2007-present). Mr. Wiley serves as a Director of Tesoro Corporation (independent oil refiner and marketer, 2005-present), and a Director of Bill Barrett Corporation (exploration and production, 2005-present). In addition, Mr. Wiley also serves as a Director of Post Oak Bank (privately-held bank, 2004-present). Previously, Mr. Wiley served as a Sr. Energy Advisor of Katzenbach Partners, LLC (consulting, 2006-2007), as an Advisory Director of Riverstone Holdings (private investment), Chairman, President, and CEO of Baker Hughes, Inc. (oilfield services, 2000-2004), and as Director of Spinnaker Exploration Company (exploration and production, 2001-2005). |
Annual Report
+ The information above includes each Trustee's principal occupation during the last five years and other information relating to the experience, attributes, and skills relevant to each Trustee's qualifications to serve as a Trustee, which led to the conclusion that each Trustee should serve as a Trustee for the fund.
Advisory Board Member and Executive Officers:
Correspondence intended for each executive officer and Peter S. Lynch may be sent to Fidelity Investments, 82 Devonshire Street, Boston, Massachusetts 02109.
Name, Age; Principal Occupation |
Peter S. Lynch (66) |
| Year of Election or Appointment: 2003 Member of the Advisory Board of Fidelity's Equity and High Income Funds. Mr. Lynch is Vice Chairman and a Director of FMR and FMR Co., Inc. In addition, Mr. Lynch serves as a Trustee of Boston College and as the Chairman of the Inner-City Scholarship Fund. Previously, Mr. Lynch served on the Special Olympics International Board of Directors (1997-2006). |
Kenneth B. Robins (40) |
| Year of Election or Appointment: 2008 President and Treasurer of Fidelity's Equity and High Income Funds. Mr. Robins also serves as President and Treasurer (2010-present) and Assistant Treasurer (2009-present) of other Fidelity funds and is an employee of Fidelity Investments (2004-present). Previously, Mr. Robins served as Deputy Treasurer of the Fidelity funds (2005-2008) and Treasurer and Chief Financial Officer of The North Carolina Capital Management Trust: Cash and Term Portfolios (2006-2008). |
Brian B. Hogan (45) |
| Year of Election or Appointment: 2009 Vice President of certain Equity Funds and Vice President of Sector Funds. Mr. Hogan also serves as Senior Vice President, Equity Research of FMR (2006-present) and President of FMR's Equity Division (2009-present). Previously, Mr. Hogan served as a portfolio manager. |
Thomas C. Hense (46) |
| Year of Election or Appointment: 2008 or 2010 Vice President of Fidelity's High Income (2008), Small Cap (2008), and Value (2010) Funds. Previously, Mr. Hense served as a portfolio manager for Fidelity's Institutional Money Management Group (Pyramis) (2003-2008). |
Scott C. Goebel (42) |
| Year of Election or Appointment: 2008 Secretary and Chief Legal Officer (CLO) of the Fidelity funds. Mr. Goebel also serves as General Counsel, Secretary, and Senior Vice President of FMR (2008-present) and FMR Co., Inc. (2008-present); Deputy General Counsel of FMR LLC; Chief Legal Officer of Fidelity Management & Research (Hong Kong) Limited (2008-present) and Assistant Secretary of Fidelity Management & Research (Japan) Inc. (2008-present), Fidelity Investments Money Management, Inc. (2008-present), Fidelity Management & Research (U.K.) Inc. (2008-present), and Fidelity Research and Analysis Company (2008-present). Previously, Mr. Goebel served as Assistant Secretary of the Funds (2007-2008) and as Vice President and Secretary of Fidelity Distributors Corporation (FDC) (2005-2007). |
William C. Coffey (41) |
| Year of Election or Appointment: 2009 Assistant Secretary of Fidelity's Equity and High Income Funds. Mr. Coffey also serves as Senior Vice President and Deputy General Counsel of FMR LLC (2010-present), and is an employee of Fidelity Investments. Previously, Mr. Coffey served as Vice President and Associate General Counsel of FMR LLC (2005-2009). |
Holly C. Laurent (56) |
| Year of Election or Appointment: 2008 Anti-Money Laundering (AML) Officer of the Fidelity funds. Ms. Laurent is an employee of Fidelity Investments. Previously, Ms. Laurent was Senior Vice President and Head of Legal for Fidelity Business Services India Pvt. Ltd. (2006-2008), and Senior Vice President, Deputy General Counsel and Group Head for FMR LLC (2005-2006). |
Christine Reynolds (51) |
| Year of Election or Appointment: 2008 Chief Financial Officer of the Fidelity funds. Ms. Reynolds became President of Fidelity Pricing and Cash Management Services (FPCMS) in August 2008. Ms. Reynolds served as Chief Operating Officer of FPCMS (2007-2008). Previously, Ms. Reynolds served as President, Treasurer, and Anti-Money Laundering officer of the Fidelity funds (2004-2007). |
Kenneth A. Rathgeber (63) |
| Year of Election or Appointment: 2004 Chief Compliance Officer of Fidelity's Equity and High Income Funds. Mr. Rathgeber is Chief Compliance Officer of Fidelity Management & Research (Hong Kong) Limited (2008-present), Fidelity Management & Research (Japan) Inc. (2008-present), FMR (2005-present), FMR Co., Inc. (2005-present), Fidelity Management & Research (U.K.) Inc. (2005-present), Fidelity Research & Analysis Company (2005-present), Fidelity Investments Money Management, Inc. (2005-present), Pyramis Global Advisors, LLC (2005-present), and Strategic Advisers, Inc. (2005-present). |
Jeffrey S. Christian (48) |
| Year of Election or Appointment: 2009 Deputy Treasurer of the Fidelity funds. Mr. Christian is an employee of Fidelity Investments. Previously, Mr. Christian served as Chief Financial Officer (2008-2009) of certain Fidelity funds and Senior Vice President of Fidelity Pricing and Cash Management Services (FPCMS) (2004-2009). |
Bryan A. Mehrmann (49) |
| Year of Election or Appointment: 2005 Deputy Treasurer of the Fidelity funds. Mr. Mehrmann is an employee of Fidelity Investments. |
Adrien E. Deberghes (42) |
| Year of Election or Appointment: 2008 Deputy Treasurer of Fidelity's Equity and High Income Funds. Mr. Deberghes also serves as Assistant Treasurer of other Fidelity funds (2010-present) and is an employee of Fidelity Investments (2008-present). Previously, Mr. Deberghes served as Senior Vice President of Mutual Fund Administration at State Street Corporation (2007-2008), Senior Director of Mutual Fund Administration at Investors Bank & Trust (2005-2007), and Director of Finance for Dunkin' Brands (2000-2005). |
Stephanie J. Dorsey (41) |
| Year of Election or Appointment: 2010 Assistant Treasurer of Fidelity's Equity and High Income Funds. Ms. Dorsey also serves as Deputy Treasurer of other Fidelity funds (2008-present) and is an employee of Fidelity Investments (2008-present). Previously, Ms. Dorsey served as Treasurer (2004-2008) of the JPMorgan Mutual Funds and Vice President (2004-2008) of JPMorgan Chase Bank. |
Name, Age; Principal Occupation |
John R. Hebble (52) |
| Year of Election or Appointment: 2009 Assistant Treasurer of Fidelity's Equity and High Income Funds. Mr. Hebble also serves as Treasurer and Chief Financial Officer of The North Carolina Capital Management Trust: Cash and Term Portfolio (2008-present), President and Treasurer of other Fidelity funds (2008-present) and is an employee of Fidelity Investments. |
Gary W. Ryan (51) |
| Year of Election or Appointment: 2005 Assistant Treasurer of the Fidelity funds. Mr. Ryan is an employee of Fidelity Investments. Previously, Mr. Ryan served as Vice President of Fund Reporting in Fidelity Pricing and Cash Management Services (FPCMS) (1999-2005). |
Annual Report
Board Approval of Investment Advisory Contracts and Management Fees
Fidelity Small Cap Growth Fund
Each year, the Board of Trustees, including the Independent Trustees (together, the Board), votes on the renewal of the management contract and sub-advisory agreements (together, the Advisory Contracts) for the fund. The Board, assisted by the advice of fund counsel and Independent Trustees' counsel, requests and considers a broad range of information relevant to the renewal of the Advisory Contracts throughout the year.
The Board meets regularly and considers at each of its meetings factors that are relevant to its annual consideration of the renewal of the fund's Advisory Contracts, including the services and support provided to the fund and its shareholders. The Board has established various standing committees, each composed of Independent Trustees with varying backgrounds, to which the Board has assigned specific subject matter responsibilities in order to enhance effective decision-making by the Board. The Board, acting directly and through its Committees, requests and receives information concerning the annual consideration of the renewal of the fund's Advisory Contracts. The Board also meets as needed to consider matters specifically related to the Board's annual consideration of the renewal of Advisory Contracts. Members of the Board may also meet with trustees of other Fidelity funds through ad hoc joint committees to discuss certain matters relevant to the Fidelity funds.
At its July 2010 meeting, the Board of Trustees, including the Independent Trustees, unanimously determined to renew the fund's Advisory Contracts. In reaching its determination, the Board considered all factors it believed relevant, including (i) the nature, extent, and quality of the services to be provided to the fund and its shareholders (including the investment performance of the fund); (ii) the competitiveness of the fund's management fee and total expenses; (iii) the total costs of the services to be provided by and the profits to be realized by Fidelity from its relationship with the fund; (iv) the extent to which economies of scale would be realized as the fund grows; and (v) whether fee levels reflect these economies of scale, if any, for the benefit of fund shareholders.
In considering whether to renew the Advisory Contracts for the fund, the Board reached a determination, with the assistance of fund counsel and Independent Trustees' counsel and through the exercise of its business judgment, that the renewal of the Advisory Contracts is in the best interests of fund shareholders and that the compensation to be received by Fidelity under the management contract is fair and reasonable. The Board's decision to renew the Advisory Contracts was not based on any single factor noted above, but rather was based on a comprehensive consideration of all the information provided to the Board at its meetings throughout the year. The Board, in reaching its determination to renew the Advisory Contracts, is aware that shareholders in the fund have a broad range of investment choices available to them, including a wide choice among mutual funds offered by Fidelity's competitors, and that the fund's shareholders, with the opportunity to review and weigh the disclosure provided by the fund in its prospectus and other public disclosures, have chosen to invest in this fund, managed by Fidelity.
Annual Report
Board Approval of Investment Advisory Contracts and
Management Fees - continued
Nature, Extent, and Quality of Services Provided. The Board considered the staffing within the investment adviser, FMR, and the sub-advisers (together, the Investment Advisers), including the backgrounds of the fund's investment personnel and the fund's investment objective and discipline. The Independent Trustees also had discussions with senior management of Fidelity's investment operations and investment groups. The Board considered the structure of the portfolio manager compensation program and whether this structure provides appropriate incentives to act in the best interest of the fund.
Resources Dedicated to Investment Management and Support Services. The Board and the equity research subcommittee of the Board's Fund Oversight Committee reviewed the size, education, and experience of the Investment Advisers' investment staff, their use of technology, and the Investment Advisers' approach to recruiting, training, and retaining portfolio managers and other research, advisory, and management personnel. The Board noted that Fidelity's analysts have access to a variety of technological tools and market and securities data that enable them to perform both fundamental and quantitative analysis and to specialize in various disciplines. The Board considered Fidelity's extensive global research capabilities that enable the Investment Advisers to aggregate data from various sources in an effort to produce positive investment results. The Board also considered that Fidelity's portfolio managers and analysts have access to daily portfolio attribution that allows for monitoring of a fund's portfolio, as well as an electronic communication system that provides immediate real-time access to research concerning issuers and credit enhancers. The Board noted FMR's continued focus on strengthening the organization and discipline of equity portfolio management and research.
Shareholder and Administrative Services. The Board considered (i) the nature, extent, quality, and cost of advisory, administrative, and shareholder services performed by the Investment Advisers and their affiliates under the Advisory Contracts and under separate agreements covering transfer agency, pricing and bookkeeping, and securities lending services for the fund; (ii) the nature and extent of the investment adviser's supervision of third party service providers, principally custodians and subcustodians; and (iii) the resources devoted to, and the record of compliance with, the fund's compliance policies and procedures. The Board also reviewed the allocation of fund brokerage, including allocations to brokers affiliated with the Investment Advisers, the use of brokerage commissions to pay fund expenses, and the use of "soft" commission dollars to pay for research services.
Annual Report
The Board noted that the growth of fund assets over time across the complex allows Fidelity to reinvest in the development of services designed to enhance the value or convenience of the Fidelity funds as investment vehicles. These services include 24-hour access to account information and market information through phone representatives and over the Internet, and investor education materials and asset allocation tools.
Investment in a Large Fund Family. The Board considered the benefits to shareholders of investing in a Fidelity fund, including the benefits of investing in a fund that is part of a large family of funds offering a variety of investment disciplines and providing a large variety of mutual fund investor services. The Board noted that Fidelity had taken, or had made recommendations that resulted in the Fidelity funds taking, a number of actions over the previous year that benefited particular funds, including (i) dedicating additional resources to investment research and restructuring and broadening the focus of the investment research teams; (ii) bolstering the senior management team that oversees asset management; (iii) launching Class F of certain funds as a lower-fee class available to Freedom K and Freedom Index Funds; (iv) lowering the initial investment minimums and ongoing balance requirements for Real Estate High Income Fund; (v) eliminating subsequent purchase minimums for all funds and adding a waiver of the investment minimum requirement for new accounts opened with the proceeds of a systematic withdrawal plan; (vi) eliminating the withdrawal minimum and maximum limits for systematic withdrawals from Advisor funds; (vii) expanding sales load waivers on Class A shares for Destiny Planholders and expanding Institutional Class eligibility for Class O Destiny Planholders; and (viii) changing certain Class A and Class T sales charge structures to further align them with industry practices.
Investment Performance. The Board considered whether the fund has operated in accordance with its investment objective, as well as its record of compliance with its investment restrictions. It also reviewed the fund's absolute investment performance for each class (except Class F), as well as the fund's relative investment performance for each class (except Class F) measured over multiple periods against (i) a broad-based securities market index, and (ii) a peer group of mutual funds deemed appropriate by Fidelity and reviewed by the Board. The following charts considered by the Board show, over the one-, three-, and five-year periods ended December 31, 2009, the cumulative total returns of Institutional Class (Class I) and Class B of the fund, the cumulative total returns of a broad-based securities market index ("benchmark"), and a range of cumulative total returns of a peer group of mutual funds identified by Morningstar, Inc. as having an investment style similar to that of the fund based on underlying portfolio holdings. The returns of Institutional Class (Class I) and Class B show the performance of the highest and lowest performing classes, respectively (based on five-year performance). (Class F had less than one year of performance as of December 31, 2009.) The box within each chart shows the 25th percentile return (bottom of box) and the 75th percentile return (top of box) of the peer group. Returns shown above the box are in the first quartile and returns shown below the box are in the fourth quartile. The percentage beaten numbers noted below each chart correspond to the percentile box and represent the percentage of funds in the peer group whose performance was equal to or lower than that of the class indicated.
Annual Report
Board Approval of Investment Advisory Contracts and
Management Fees - continued
Fidelity Small Cap Growth Fund
The Board reviewed the fund's relative investment performance against its peer group and noted that the performance of Institutional Class (Class I) of the fund was in the first quartile for all the periods shown. The Board also noted that the investment performance of Institutional Class (Class I) of the fund compared favorably to its benchmark for all the periods shown. The Board considered that the variations in performance among the fund's classes reflect the variations in class expenses, which result in lower performance for higher expense classes. The Board also reviewed the fund's performance since inception as well as performance in the current year.
The Board also considered that the fund's management fee is subject to upward or downward adjustment depending upon whether, and to what extent, the fund's investment performance for the performance period exceeds, or is exceeded by, the record (over the same period) of a Board-approved performance adjustment index. The Board realizes that the performance adjustment provides FMR with a strong economic incentive to seek to achieve superior performance for the fund's shareholders and helps to more closely align the interests of FMR and the fund's shareholders.
Based on its review, and giving particular weight to the nature and quality of the resources dedicated by the Investment Advisers to maintain and improve relative performance and factoring in the unprecedented market events in recent years, the Board concluded that the nature, extent, and quality of investment management and support services and of shareholder and administrative services provided to the fund will benefit the fund's shareholders, particularly in light of the Board's view that the fund's shareholders benefit from investing in a fund that is part of a large family of funds offering a variety of investment disciplines and services.
Annual Report
Competitiveness of Management Fee and Total Fund Expenses. The Board considered the fund's management fee and total expenses compared to "mapped groups" of competitive funds and classes. Fidelity creates "mapped groups" by combining similar Lipper investment objective categories that have comparable management fee characteristics. Combining Lipper investment objective categories aids the Board's management fee and total expense comparisons by broadening the competitive group used for comparison and by reducing the number of universes to which various Fidelity funds are compared.
Management Fee. The Board considered two proprietary management fee comparisons for the 12-month periods shown in the chart below. The group of Lipper funds used by the Board for management fee comparisons is referred to below as the "Total Mapped Group." The Total Mapped Group comparison focuses on a fund's standing relative to the total universe of comparable funds available to investors, in terms of gross management fees before expense reimbursements or caps, and without giving effect to the fund's performance adjustment. "TMG %" represents the percentage of funds in the Total Mapped Group that had management fees that were lower than the fund's. For example, a TMG % of 13% means that 87% of the funds in the Total Mapped Group had higher management fees than the fund. The "Asset-Size Peer Group" (ASPG) comparison focuses on a fund's standing relative to non-Fidelity funds similar in size to the fund within the Total Mapped Group. The ASPG represents at least 15% of the funds in the Total Mapped Group with comparable asset size and management fee characteristics, subject to a minimum of 50 funds (or all funds in the Total Mapped Group if fewer than 50). Additional information, such as the ASPG quartile in which the fund's management fee ranked and the impact of the fund's performance adjustment, is also included in the chart and considered by the Board.
Annual Report
Board Approval of Investment Advisory Contracts and
Management Fees - continued
Fidelity Small Cap Growth Fund
The Board noted that the fund's management fee ranked below the median of its Total Mapped Group and below the median of its ASPG for 2009. The Board also noted the effect of the fund's positive performance adjustment on the fund's management fee ranking. The Board noted that the performance adjustment for each year represents calculations for performance periods that differ from the periods shown in the performance charts above.
Based on its review, the Board concluded that the fund's management fee is fair and reasonable in light of the services that the fund receives and the other factors considered.
Total Expenses. In its review of each class's total expenses, the Board considered the fund's management fee as well as other fund or class expenses, as applicable, such as transfer agent fees, pricing and bookkeeping fees, fund-paid 12b-1 fees, and custodial, legal, and audit fees. The Board also noted the effects of any waivers and reimbursements on fees and expenses, as well as the impact of the fund's performance adjustment. As part of its review, the Board also considered current and historical total expenses of each class of the fund compared to competitive fund median expenses. Each class of the fund is compared to those funds and classes in the Total Mapped Group (used by the Board for management fee comparisons) that have a similar sales load structure.
The Board noted that the total expenses of each of Class A, Class B, Institutional Class, the retail class, and Class F ranked below its competitive median for the period, the total expenses of Class C ranked equal to its competitive median for the period, and the total expenses of Class T ranked above its competitive median for the period. The Board considered that the total expenses for Class T were above the median primarily because its 12b-1 fee is higher than the typical front-end load class. The Board noted that the fund offers multiple classes, each of which has a different sales load and 12b-1 fee structure, and that the multiple structures are intended to offer a range of pricing options for the intermediary market. The Board also noted that the total expenses of the classes vary primarily by the level of their 12b-1 fees, although differences in transfer agent fees may also cause expenses to vary from class to class.
Annual Report
Fees Charged to Other Fidelity Clients. The Board also considered Fidelity fee structures and other information with respect to clients of FMR and its affiliates, such as other mutual funds advised or subadvised by FMR or its affiliates, pension plan clients, and other institutional clients. In March 2010, the Board created an ad hoc joint committee with the board of other Fidelity funds (the Committee) to review and compare Fidelity's institutional investment advisory business with its business of providing services to the Fidelity funds, including the differences in services provided, fees charged, and costs incurred, as well as competition in their respective marketplaces.
Based on its review of total expenses and fees charged to other Fidelity clients, the Board concluded that the total expenses of each class of the fund were reasonable, although in one case above the median of the universe presented for comparison, in light of the services that the fund and its shareholders receive and the other factors considered, including the findings of the Committee.
Costs of the Services and Profitability. The Board considered the revenues earned and the expenses incurred by Fidelity in conducting the business of developing, marketing, distributing, managing, administering and servicing the fund and its shareholders. The Board also considered the level of Fidelity's profits in respect of all the Fidelity funds.
On an annual basis, FMR presents to the Board Fidelity's profitability for the fund. Fidelity calculates the profitability for each fund, as well as aggregate profitability for groups of Fidelity funds and all Fidelity funds, using a series of detailed revenue and cost allocation methodologies which originate with the audited books and records of Fidelity. The Audit Committee of the Board reviews any significant changes from the prior year's methodologies.
PricewaterhouseCoopers LLP (PwC), independent registered public accounting firm and auditor to Fidelity and certain Fidelity funds, has been engaged annually by the Board as part of the Board's assessment of Fidelity's profitability analysis. PwC's engagement includes the review and assessment of Fidelity's methodologies used in determining the revenues and expenses attributable to Fidelity's mutual fund business, and completion of agreed-upon procedures surrounding the mathematical accuracy of fund profitability and its conformity to allocation methodologies. After considering PwC's reports issued under the engagement and information provided by Fidelity, the Board believes that while other allocation methods may also be reasonable, Fidelity's profitability methodologies are reasonable in all material respects.
Annual Report
Board Approval of Investment Advisory Contracts and
Management Fees - continued
The Board has also reviewed Fidelity's non-fund businesses and fall-out benefits related to the mutual fund business as well as cases where Fidelity's affiliates may benefit from or be related to the fund's business.
The Board considered the costs of the services provided by and the profits realized by Fidelity in connection with the operation of the fund and were satisfied that the profitability was not excessive in the circumstances.
Economies of Scale. The Board considered whether there have been economies of scale in respect of the management of the Fidelity funds, whether the Fidelity funds (including the fund) have appropriately benefited from any such economies of scale, and whether there is potential for realization of any further economies of scale. The Board considered the extent to which the fund will benefit from economies of scale through increased services to the fund, through waivers or reimbursements, or through fee or expense reductions.
In February 2009, the Board and the board of other Fidelity funds created an ad hoc committee (the Economies of Scale Committee) to analyze whether FMR attains economies of scale in respect of the management and servicing of the Fidelity funds, whether the Fidelity funds have appropriately benefited from such economies of scale, and whether there is potential for realization of any further economies of scale.
The Board recognized that the fund's management contract incorporates a "group fee" structure, which provides for lower group fee rates as total fund assets under FMR's management increase, and for higher group fee rates as total fund assets under FMR's management decrease. FMR calculates the group fee rates based on a tiered asset "breakpoint" schedule that varies based on asset class. The Board considered that the group fee is designed to deliver the benefits of economies of scale to fund shareholders when total Fidelity fund assets increase, even if assets of any particular fund are unchanged or have declined, because some portion of Fidelity's costs are attributable to services provided to all Fidelity funds, and all funds benefit if those costs can be allocated among more assets. The Board concluded that, given the group fee structure, fund shareholders will benefit from lower management fees as assets under FMR's management increase at the fund complex level, regardless of whether Fidelity achieves any such economies of scale.
The Board concluded, considering the findings of the Economies of Scale Committee, that any potential economies of scale are being appropriately shared between fund shareholders and Fidelity.
Annual Report
Additional Information Requested by the Board. In order to develop fully the factual basis for consideration of the Fidelity funds' Advisory Contracts, the Board requested and received additional information on certain topics, including (i) fund performance trends, actions to be taken by FMR to improve certain funds' overall performance, and Fidelity's long-term strategies for certain funds; (ii) portfolio manager changes that have occurred during the past year and length of portfolio manager tenure for different categories of funds over time; (iii) Fidelity's compensation structure for portfolio managers, research analysts, and other key personnel, the rationale for the compensation structure, and how the compensation structure provides appropriate performance incentives; (iv) the amount of the investment that each portfolio manager has made in the Fidelity fund(s) that he or she manages; (v) management and other fees paid by FMR to affiliated sub-advisers on behalf of the Fidelity funds; (vi) Fidelity's fee structures and rationale for recommending different fees among different categories of funds; (vii) Fidelity's rationale for recommending which funds should have a performance adjustment component as part of their management fees; (viii) the rationale for any differences between fund fee structures and fee structures in place for other Fidelity clients; and (ix) explanations regarding the relative total expenses borne by certain funds and classes, total expense competitive trends, and actions that might be taken by FMR to reduce total expenses for certain funds and classes.
Based on its evaluation of all of the conclusions noted above, and after considering all factors it believed relevant, the Board ultimately concluded that the advisory fee structures are fair and reasonable, and that the fund's Advisory Contracts should be renewed.
Annual Report
Managing Your Investments
Fidelity offers several ways to conveniently manage your workplace benefits (including your workplace savings plan, investments, and additional services) via your telephone or PC. You can access your plan and account information and research your investments 24 hours a day.
By Phone
Fidelity provides a single toll-free number to access plan information, account balances, positions, and quotes*. It's easy to navigate the service, and on your first call, the system will help you create a personal identification number (PIN) for security.
(phone_graphic)
Fidelity Workplace
Investing
1-800-835-5092
By PC
Fidelity's web site on the Internet provides a wide range of information, including plan information, daily financial news, fund performance, interactive planning tools, and news about Fidelity products and services.
(computer_graphic)
Fidelity's Web Site
www.401k.com
* When you call the quotes line, please remember that a fund's yield and return will vary and, except for money market funds, share price will also vary. This means that you may have a gain or loss when you sell your shares. There is no assurance that money market funds will be able to maintain a stable $1 share price; an investment in a money market fund is not insured or guaranteed by the U.S. government. Total returns are historical and include changes in share price, reinvestment of dividends and capital gains, and the effects of any sales charges.
Annual Report
To Write Fidelity
We'll give your correspondence immediate attention and send you written confirmation upon completion of your request.
(letter_graphic)
For Non-Retirement
Accounts
Buying shares
Fidelity Investments
P.O. Box 770001
Cincinnati, OH 45277-0003
Overnight Express
Fidelity Investments
Attn: Distribution Services
100 Crosby Parkway - KC1H
Covington, KY 41015
Selling shares
Fidelity Investments
P.O. Box 770001
Cincinnati, OH 45277-0035
Overnight Express
Fidelity Investments
Attn: Distribution Services
100 Crosby Parkway - KC1H
Covington, KY 41015
General Correspondence
Fidelity Investments
P.O. Box 500
Merrimack, NH 03054-0500
(letter_graphic)
For Retirement
Accounts
Buying shares
Fidelity Investments
P.O. Box 770001
Cincinnati, OH 45277-0003
Selling shares
Fidelity Investments
P.O. Box 770001
Cincinnati, OH 45277-0035
Overnight Express
Fidelity Investments
Attn: Distribution Services
100 Crosby Parkway - KC1H
Covington, KY 41015
General Correspondence
Fidelity Investments
P.O. Box 500
Merrimack, NH 03054-0500
Annual Report
Investment Adviser
Fidelity Management & Research Company
Boston, MA
Investment Sub-Advisers
FMR Co., Inc.
Fidelity Research & Analysis Company
Fidelity Management & Research
(U.K.) Inc.
Fidelity Management & Research
(Hong Kong) Limited
Fidelity Management & Research
(Japan) Inc.
General Distributor
Fidelity Distributors Corporation
Boston, MA
Transfer and Service Agents
Fidelity Investments Institutional
Operating Company, Inc.
Boston, MA
Fidelity Service Company, Inc.
Boston, MA
Custodian
Citibank, N.A.
New York, NY
SCP-F-ANN-0910
1.891906.101
(Fidelity Investment logo)(registered trademark)
Fidelity Advisor
Small Cap Growth
Fund - Class A, Class T,
Class B and Class C
Annual Report
July 31, 2010
(2_fidelity_logos) (Registered_Trademark)
Class A, Class T, Class B,
and Class C are classes
of Fidelity® Small Cap
Growth Fund
Contents
Chairman's Message | <Click Here> | The Chairman's message to shareholders. |
Performance | <Click Here> | How the fund has done over time. |
Management's Discussion of Fund Performance | <Click Here> | The Portfolio Manager's review of fund performance and strategy. |
Shareholder Expense Example | <Click Here> | An example of shareholder expenses. |
Investment Changes | <Click Here> | A summary of major shifts in the fund's investments over the past six months. |
Investments | <Click Here> | A complete list of the fund's investments with their market values. |
Financial Statements | <Click Here> | Statements of assets and liabilities, operations, and changes in net assets,
as well as financial highlights. |
Notes | <Click Here> | Notes to the financial statements. |
Report of Independent Registered Public Accounting Firm | <Click Here> | |
Trustees and Officers | <Click Here> | |
Board Approval of Investment Advisory Contracts and Management Fees | <Click Here> | |
To view a fund's proxy voting guidelines and proxy voting record for the 12-month period ended June 30, visit http://www.fidelity.com/proxyvotingresults or visit the Securities and Exchange Commission's (SEC) web site at http://www.sec.gov. You may also call 1-877-208-0098 to request a free copy of the proxy voting guidelines.
Standard & Poor's, S&P and S&P 500 are registered service marks of The McGraw-Hill Companies, Inc. and have been licensed for use by Fidelity Distributors Corporation.
Other third party marks appearing herein are the property of their respective owners.
All other marks appearing herein are registered or unregistered trademarks or service marks of FMR LLC or an affiliated company.
Annual Report
This report and the financial statements contained herein are submitted for the general information of the shareholders of the fund. This report is not authorized for distribution to prospective investors in the fund unless preceded or accompanied by an effective prospectus.
A fund files its complete schedule of portfolio holdings with the SEC for the first and third quarters of each fiscal year on Form N-Q. Forms N-Q are available on the SEC's web site at http://www.sec.gov. A fund's Forms N-Q may be reviewed and copied at the SEC's Public Reference Room in Washington, DC. Information regarding the operation of the SEC's Public Reference Room may be obtained by calling 1-800-SEC-0330. For a complete list of a fund's portfolio holdings, view the most recent holdings listing, semiannual report, or annual report on Fidelity's web site at http://www.fidelity.com or http://www.advisor.fidelity.com, as applicable.
NOT FDIC INSURED • MAY LOSE VALUE • NO BANK GUARANTEE
Neither the fund nor Fidelity Distributors Corporation is a bank.
Annual Report
(photo_of_Edward_C_Johnson_3d)
Dear Shareholder:
A yearlong uptrend in global equity markets reversed course in late April 2010 when investor sentiment turned bearish due in great measure to concern that Europe's debt crisis would expand and slow or derail economic recovery. However, a bounceback in July helped to recover some of the ground that was lost. Financial markets are always unpredictable, of course, but there also are several time-tested investment principles that can help put the odds in your favor.
One of the basic tenets is to invest for the long term. Over time, riding out the markets' inevitable ups and downs has proven much more effective than selling into panic or chasing the hottest trend. Even missing only a few of the markets' best days can significantly diminish investor returns. Patience also affords the benefits of compounding - of earning interest on additional income or reinvested dividends and capital gains. There can be tax advantages and cost benefits to consider as well. While staying the course doesn't eliminate risk, it can considerably lessen the effect of short-term declines.
You can further manage your investing risk through diversification. And today, more than ever, geographic diversification should be taken into account. Studies indicate that asset allocation is the single most important determinant of a portfolio's long-term success. The right mix of stocks, bonds and cash - aligned to your particular risk tolerance and investment objective - is very important. Age-appropriate rebalancing is also an essential aspect of asset allocation. For younger investors, an emphasis on equities - which historically have been the best-performing asset class over time - is encouraged. As investors near their specific goal, such as retirement or sending a child to college, consideration may be given to replacing volatile assets (e.g. common stocks) with more-stable fixed investments (bonds or savings plans).
A third principle - investing regularly - can help lower the average cost of your purchases. Investing a certain amount of money each month or quarter helps ensure you won't pay for all your shares at market highs. This strategy - known as dollar cost averaging - also reduces "emotion" from investing, helping shareholders avoid selling weak performers just prior to an upswing, or chasing a hot performer just before a correction.
We invite you to contact us via the Internet, through our Investor Centers or by phone. It is our privilege to provide you the information you need to make the investments that are right for you.
Sincerely,
(The chairman's signature appears here.)
Edward C. Johnson 3d
Annual Report
Average annual total return reflects the change in the value of an investment, assuming reinvestment of the class' distributions from dividend income and capital gains (the profits earned upon the sale of securities that have grown in value, if any) and assuming a constant rate of performance each year. The $10,000 table and the fund's returns do not reflect the deduction of taxes that a shareholder would pay on fund distributions or the redemption of fund shares. During periods of reimbursement by Fidelity, a fund's total return will be greater than it would be had the reimbursement not occurred. How a fund did yesterday is no guarantee of how it will do tomorrow.
Average Annual Total Returns
Periods ended July 31, 2010 | Past 1
year | Past 5
years | Life of
fundA |
Class A (incl. 5.75% sales charge) | 10.58% | 0.05% | 4.65% |
Class T (incl. 3.50% sales charge) | 12.94% | 0.27% | 4.83% |
Class B (incl. contingent deferred sales charge) B | 11.37% | 0.09% | 4.78% |
Class C (incl. contingent deferred sales charge) C | 15.40% | 0.47% | 4.93% |
A From November 3, 2004.
B Class B shares' contingent deferred sales charges included in the past one year, past five years, and life of fund total return figures are 5%, 2%, and 1%, respectively.
C Class C shares' contingent deferred sales charges included in the past one year, past five years, and life of fund total return figures are 1%, 0%, and 0%, respectively.
Annual Report
$10,000 Over Life of Fund
Let's say hypothetically that $10,000 was invested in Fidelity Advisor Small Cap Growth Fund - Class A on November 3, 2004, when the fund started, and the current 5.75% sales charge was paid. The chart shows how the value of your investment would have changed, and also shows how the Russell 2000® Growth Index performed over the same period.
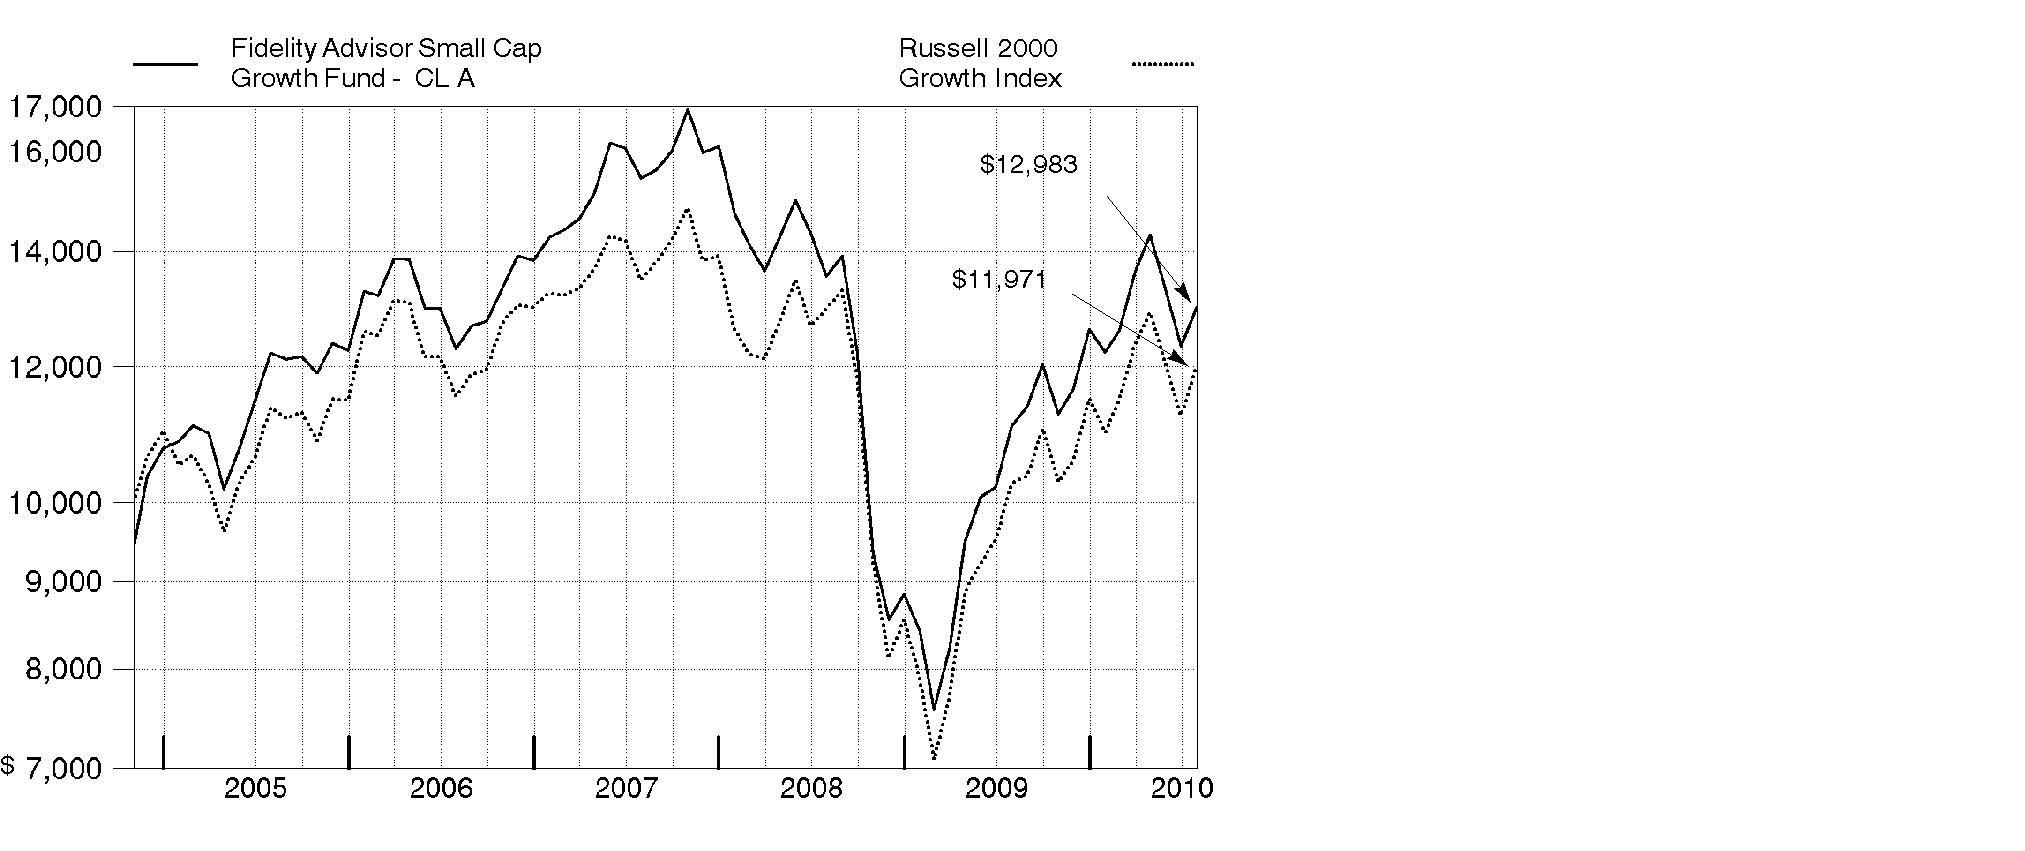
Annual Report
Market Recap: U.S. stock markets saw double-digit gains for the year ending July 31, 2010, despite the return of market volatility and risk aversion during the first half of 2010. An impressive bull run continued through 2009, bolstered by improvement in the economy and credit markets. Early in the new year, however, stocks fell sharply amid concerns about the global economic recovery, fueled by European debt woes and China's efforts to restrain inflation. After this brief dip, markets regained their upward momentum, as government stimulus and significant corporate cost cutting led to encouraging earnings reports, improved credit conditions and rising consumer confidence. Positive news continued through mid-April, when the Dow Jones Industrial AverageSM pushed above the 11,000 mark for the first time in 19 months. That milestone was short-lived, however, as heightened concern about the European debt crisis sparked an abrupt sell-off in May, leading to the first official correction since the rally began in March 2009. Although the market's malaise continued through June, stocks saw solid gains in July. For the year, the Dow rose 17.28%, while the S&P 500® Index was up 13.84%. Elsewhere, the technology-laden Nasdaq Composite® Index returned 14.99%. Small- and mid-cap stocks performed best, as measured by the 18.43% increase of the Russell 2000® Index and the 23.21% gain of the Russell Midcap® Index.
Comments from Lionel Harris, Portfolio Manager of Fidelity Advisor Small Cap Growth Fund: For the 12 months ending July 31, 2010, the fund's Class A, Class T, Class B and Class C shares rose 17.33%, 17.04%, 16.37% and 16.40%, respectively (excluding sales charges), compared with 16.71% for the Russell 2000 Growth Index. Stock selection was a big plus overall, especially in the industrials and consumer discretionary sectors. Within information technology, the fund saw success from its hardware/equipment positions, though several software/services names lagged - most notably, network communications systems company TeleCommunication Systems and Internet banking and billing services provider Online Resources. Favorable sector allocation helped, especially overweighting industrials and underweighting the weak-performing pharmaceuticals industry. Having a smaller relative weighting in the consumer discretionary sector, however, took away some of this positive impact. A stronger dollar overall hampered the performance of the fund's foreign stocks. The fund's top individual contributor was Commercial Vehicle Group, which makes parts for the cabs of large trucks. As optimism about the economy and, with it, the trucking industry grew, Commercial Vehicle's share price rose off an extremely low level. Brookdale Senior Living, an operator of assisted-living and retirement communities, also did well, as did hotel and timeshare property owner Wyndham Worldwide.
The views expressed above reflect those of the portfolio manager(s) only through the end of the period as stated on the cover of this report and do not necessarily represent the views of Fidelity or any other person in the Fidelity organization. Any such views are subject to change at any time based upon market or other conditions and Fidelity disclaims any responsibility to update such views. These views may not be relied on as investment advice and, because investment decisions for a Fidelity fund are based on numerous factors, may not be relied on as an indication of trading intent on behalf of any Fidelity fund.
Annual Report
Shareholder Expense Example
As a shareholder of the Fund, you incur two types of costs: (1) transaction costs, including sales charges (loads) on purchase payments or redemption proceeds, redemption fees, and (2) ongoing costs, including management fees, distribution and/or service (12b-1) fees and other Fund expenses. This Example is intended to help you understand your ongoing costs (in dollars) of investing in the Fund and to compare these costs with the ongoing costs of investing in other mutual funds.
The Example is based on an investment of $1,000 invested at the beginning of the period and held for the entire period (February 1, 2010 to July 31, 2010).
Actual Expenses
The first line of the accompanying table for each class of the Fund provides information about actual account values and actual expenses. You may use the information in this line, together with the amount you invested, to estimate the expenses that you paid over the period. Simply divide your account value by $1,000.00 (for example, an $8,600 account value divided by $1,000.00 = 8.6), then multiply the result by the number in the first line for a class of the Fund under the heading entitled "Expenses Paid During Period" to estimate the expenses you paid on your account during this period. A small balance maintenance fee of $12.00 that is charged once a year may apply for certain accounts with a value of less than $2,000. This fee is not included in the table below. If it was, the estimate of expenses you paid during the period would be higher, and your ending account value lower, by this amount. In addition, the Fund, as a shareholder in the underlying Fidelity Central Funds, will indirectly bear its pro-rata share of the fees and expenses incurred by the underlying Fidelity Central Funds. These fees and expenses are not included in the Fund's annualized expense ratio used to calculate the expense estimate in the table below.
Hypothetical Example for Comparison Purposes
The second line of the accompanying table for each class of the Fund provides information about hypothetical account values and hypothetical expenses based on a Class' actual expense ratio and an assumed rate of return of 5% per year before expenses, which is not the Class' actual return. The hypothetical account values and expenses may not be used to estimate the actual ending account balance or expenses you paid for the period. You may use this information to compare the ongoing costs of investing in the Fund and other funds. To do so, compare this 5% hypothetical example with the 5% hypothetical examples that appear in the shareholder reports of the other funds. A small balance maintenance fee of $12.00 that is charged once a year may apply for certain accounts with a value of less than $2,000. This fee is not included in the table below. If it was, the estimate of expenses you paid during the period would be higher, and your ending account value lower, by this amount. In addition, the Fund, as a shareholder in the underlying Fidelity Central Funds, will indirectly bear its pro-rata share of the fees and expenses incurred by the underlying Fidelity Central Funds. These fees and expenses are not included in the Fund's annualized expense ratio used to calculate the expense estimate in the table below.
Please note that the expenses shown in the table are meant to highlight your ongoing costs only and do not reflect any transaction costs. Therefore, the second line of the table is useful in comparing ongoing costs only, and will not help you determine the relative total costs of owning different funds. In addition, if these transactional costs were included, your costs would have been higher.
Annual Report
| Annualized Expense Ratio | Beginning
Account Value
February 1, 2010 | Ending
Account Value
July 31, 2010 | Expenses Paid
During Period*
February 1, 2010
to July 31, 2010 |
Class A | 1.31% | | | |
Actual | | $ 1,000.00 | $ 1,062.10 | $ 6.70 |
HypotheticalA | | $ 1,000.00 | $ 1,018.30 | $ 6.56 |
Class T | 1.57% | | | |
Actual | | $ 1,000.00 | $ 1,060.80 | $ 8.02 |
HypotheticalA | | $ 1,000.00 | $ 1,017.01 | $ 7.85 |
Class B | 2.07% | | | |
Actual | | $ 1,000.00 | $ 1,057.60 | $ 10.56 |
HypotheticalA | | $ 1,000.00 | $ 1,014.53 | $ 10.34 |
Class C | 2.07% | | | |
Actual | | $ 1,000.00 | $ 1,057.70 | $ 10.56 |
HypotheticalA | | $ 1,000.00 | $ 1,014.53 | $ 10.34 |
Small Cap Growth | 1.03% | | | |
Actual | | $ 1,000.00 | $ 1,064.00 | $ 5.27 |
HypotheticalA | | $ 1,000.00 | $ 1,019.69 | $ 5.16 |
Class F | .78% | | | |
Actual | | $ 1,000.00 | $ 1,064.60 | $ 3.99 |
HypotheticalA | | $ 1,000.00 | $ 1,020.93 | $ 3.91 |
Institutional Class | .99% | | | |
Actual | | $ 1,000.00 | $ 1,063.80 | $ 5.07 |
HypotheticalA | | $ 1,000.00 | $ 1,019.89 | $ 4.96 |
A 5% return per year before expenses
* Expenses are equal to each Class' annualized expense ratio, multiplied by the average account value over the period, multiplied by 181/365 (to reflect the one-half year period).
Annual Report
Investment Changes (Unaudited)
Top Ten Stocks as of July 31, 2010 |
| % of fund's
net assets | % of fund's net assets
6 months ago |
NETGEAR, Inc. | 1.1 | 0.0 |
Zumtobel AG | 1.1 | 0.0 |
Adtran, Inc. | 1.1 | 0.8 |
Wyndham Worldwide Corp. | 1.1 | 0.7 |
Plantronics, Inc. | 1.1 | 1.2 |
Riverbed Technology, Inc. | 1.1 | 1.4 |
Triumph Group, Inc. | 1.1 | 0.0 |
Polycom, Inc. | 1.1 | 0.6 |
Super Micro Computer, Inc. | 1.1 | 1.0 |
Armstrong World Industries, Inc. | 1.0 | 0.7 |
| 10.9 | |
Top Five Market Sectors as of July 31, 2010 |
| % of fund's
net assets | % of fund's net assets
6 months ago |
Information Technology | 27.1 | 23.0 |
Health Care | 20.6 | 23.3 |
Industrials | 18.5 | 18.7 |
Consumer Discretionary | 17.8 | 14.9 |
Financials | 4.0 | 3.5 |
Asset Allocation (% of fund's net assets) |
As of July 31, 2010* | As of January 31, 2010** |
| Stocks 95.2% | | | Stocks 93.5% | |
| Short-Term
Investments and
Net Other Assets 4.8% | | | Short-Term
Investments and
Net Other Assets 6.5% | |
* Foreign investments | 16.2% | | ** Foreign investments | 15.1% | |

Annual Report
Investments July 31, 2010
Showing Percentage of Net Assets
Common Stocks - 95.2% |
| Shares | | Value |
CONSUMER DISCRETIONARY - 17.8% |
Auto Components - 1.4% |
ElringKlinger AG | 285,000 | | $ 7,661,254 |
Modine Manufacturing Co. (a) | 1,254,000 | | 12,728,100 |
| | 20,389,354 |
Distributors - 0.7% |
Delticom AG | 181,910 | | 9,280,982 |
Diversified Consumer Services - 0.7% |
Steiner Leisure Ltd. (a) | 248,000 | | 10,542,480 |
Hotels, Restaurants & Leisure - 3.7% |
Aristocrat Leisure Ltd. | 2,735,000 | | 8,389,453 |
BJ's Restaurants, Inc. (a) | 320,000 | | 8,160,000 |
Life Time Fitness, Inc. (a)(d) | 203,000 | | 7,381,080 |
Toridoll Corp. (d) | 3,250 | | 5,949,089 |
WMS Industries, Inc. (a) | 194,750 | | 7,499,823 |
Wyndham Worldwide Corp. | 622,000 | | 15,879,660 |
| | 53,259,105 |
Household Durables - 2.8% |
Dorel Industries, Inc. Class B (sub. vtg.) | 321,550 | | 10,876,301 |
Harman International Industries, Inc. (a) | 350,000 | | 10,643,500 |
Hooker Furniture Corp. | 510,101 | | 6,029,394 |
Tempur-Pedic International, Inc. (a) | 399,000 | | 12,237,330 |
| | 39,786,525 |
Multiline Retail - 0.7% |
Dollarama, Inc. | 415,000 | | 10,359,356 |
Specialty Retail - 4.9% |
Casual Male Retail Group, Inc. (a) | 1,749,978 | | 6,054,924 |
Citi Trends, Inc. (a) | 300,000 | | 9,417,000 |
DSW, Inc. Class A (a)(d) | 425,000 | | 11,309,250 |
hhgregg, Inc. (a)(d) | 490,000 | | 9,942,100 |
Jos. A. Bank Clothiers, Inc. (a)(d) | 125,000 | | 7,335,000 |
Sally Beauty Holdings, Inc. (a) | 901,000 | | 8,523,460 |
Shoe Carnival, Inc. (a) | 458,881 | | 9,659,445 |
Signet Jewelers Ltd. (a) | 288,400 | | 8,585,668 |
| | 70,826,847 |
Textiles, Apparel & Luxury Goods - 2.9% |
Fossil, Inc. (a) | 350,000 | | 13,860,000 |
G-III Apparel Group Ltd. (a) | 390,300 | | 10,069,740 |
Common Stocks - continued |
| Shares | | Value |
CONSUMER DISCRETIONARY - continued |
Textiles, Apparel & Luxury Goods - continued |
Phillips-Van Heusen Corp. | 182,000 | | $ 9,443,980 |
Ted Baker PLC | 907,621 | | 7,594,441 |
| | 40,968,161 |
TOTAL CONSUMER DISCRETIONARY | | 255,412,810 |
CONSUMER STAPLES - 3.0% |
Food & Staples Retailing - 0.4% |
Susser Holdings Corp. (a) | 548,452 | | 6,586,909 |
Food Products - 1.7% |
Calavo Growers, Inc. (d) | 599,046 | | 12,651,852 |
Smithfield Foods, Inc. (a) | 790,000 | | 11,257,500 |
| | 23,909,352 |
Personal Products - 0.9% |
Inter Parfums, Inc. | 737,000 | | 12,860,650 |
TOTAL CONSUMER STAPLES | | 43,356,911 |
ENERGY - 2.4% |
Energy Equipment & Services - 1.6% |
Newpark Resources, Inc. (a) | 1,525,000 | | 12,184,750 |
T-3 Energy Services, Inc. (a) | 445,000 | | 11,285,200 |
| | 23,469,950 |
Oil, Gas & Consumable Fuels - 0.8% |
EXCO Resources, Inc. | 771,400 | | 11,193,014 |
TOTAL ENERGY | | 34,662,964 |
FINANCIALS - 4.0% |
Capital Markets - 0.9% |
Fifth Street Finance Corp. (d) | 465,000 | | 5,049,900 |
optionsXpress Holdings, Inc. (a) | 469,200 | | 7,319,520 |
| | 12,369,420 |
Commercial Banks - 1.7% |
CapitalSource, Inc. | 1,295,000 | | 6,967,100 |
FirstMerit Corp. | 463,000 | | 9,125,730 |
Huntington Bancshares, Inc. | 1,496,100 | | 9,066,366 |
| | 25,159,196 |
Common Stocks - continued |
| Shares | | Value |
FINANCIALS - continued |
Real Estate Investment Trusts - 0.7% |
CBL & Associates Properties, Inc. | 680,200 | | $ 9,570,414 |
Thrifts & Mortgage Finance - 0.7% |
First Niagara Financial Group, Inc. | 765,000 | | 10,258,650 |
TOTAL FINANCIALS | | 57,357,680 |
HEALTH CARE - 20.6% |
Biotechnology - 1.8% |
Allos Therapeutics, Inc. (a) | 875,000 | | 4,217,500 |
PDL BioPharma, Inc. | 1,860,000 | | 11,569,200 |
Theravance, Inc. (a)(d) | 409,000 | | 6,057,290 |
ZIOPHARM Oncology, Inc. (a)(d) | 860,000 | | 3,216,400 |
| | 25,060,390 |
Health Care Equipment & Supplies - 4.1% |
AGA Medical Holdings, Inc. | 310,583 | | 4,500,348 |
American Medical Systems Holdings, Inc. (a) | 500,000 | | 11,180,000 |
Integra LifeSciences Holdings Corp. (a) | 337,400 | | 12,190,262 |
Natus Medical, Inc. (a) | 548,000 | | 8,044,640 |
Orthofix International NV (a) | 200,000 | | 6,056,000 |
STRATEC Biomedical Systems AG | 175,000 | | 6,548,356 |
Wright Medical Group, Inc. (a) | 670,000 | | 10,458,700 |
| | 58,978,306 |
Health Care Providers & Services - 8.0% |
Amedisys, Inc. (a)(d) | 247,400 | | 6,499,198 |
Catalyst Health Solutions, Inc. (a) | 370,000 | | 12,794,600 |
Centene Corp. (a) | 395,000 | | 8,417,450 |
Emergency Medical Services Corp. Class A (a) | 273,000 | | 12,214,020 |
Hanger Orthopedic Group, Inc. (a) | 651,900 | | 11,180,085 |
HealthSouth Corp. (a) | 570,000 | | 10,550,700 |
LHC Group, Inc. (a) | 342,400 | | 7,871,776 |
Providence Service Corp. (a) | 393,800 | | 5,670,720 |
PSS World Medical, Inc. (a)(d) | 664,499 | | 12,505,871 |
RehabCare Group, Inc. (a) | 483,000 | | 10,234,770 |
Synergy Health PLC | 780,411 | | 8,170,177 |
Team Health Holdings, Inc. | 699,000 | | 9,163,890 |
| | 115,273,257 |
Common Stocks - continued |
| Shares | | Value |
HEALTH CARE - continued |
Health Care Technology - 1.7% |
Computer Programs & Systems, Inc. (d) | 305,800 | | $ 13,751,826 |
MedAssets, Inc. (a) | 423,000 | | 9,902,430 |
| | 23,654,256 |
Life Sciences Tools & Services - 3.5% |
Bruker BioSciences Corp. (a) | 965,000 | | 12,709,050 |
ICON PLC sponsored ADR (a) | 560,000 | | 13,216,000 |
PerkinElmer, Inc. | 745,000 | | 14,497,700 |
QIAGEN NV (a) | 551,000 | | 10,314,720 |
| | 50,737,470 |
Pharmaceuticals - 1.5% |
Ardea Biosciences, Inc. (a)(d) | 209,263 | | 4,174,797 |
Auxilium Pharmaceuticals, Inc. (a)(d) | 148,935 | | 3,359,974 |
Cadence Pharmaceuticals, Inc. (a)(d) | 645,000 | | 4,940,700 |
Hikma Pharmaceuticals PLC | 785,000 | | 8,815,349 |
| | 21,290,820 |
TOTAL HEALTH CARE | | 294,994,499 |
INDUSTRIALS - 18.5% |
Aerospace & Defense - 3.5% |
Esterline Technologies Corp. (a) | 220,000 | | 11,292,600 |
Spirit AeroSystems Holdings, Inc. Class A (a) | 651,400 | | 13,255,990 |
Teledyne Technologies, Inc. (a) | 257,000 | | 10,544,710 |
Triumph Group, Inc. | 199,000 | | 15,104,100 |
| | 50,197,400 |
Building Products - 1.0% |
Armstrong World Industries, Inc. (a)(d) | 406,000 | | 14,843,360 |
Commercial Services & Supplies - 3.4% |
Prosegur Compania de Seguridad SA (Reg.) | 273,000 | | 13,424,883 |
Schawk, Inc. Class A | 600,000 | | 8,898,000 |
The Geo Group, Inc. (a) | 653,000 | | 14,091,740 |
Waste Connections, Inc. (a) | 310,000 | | 11,832,700 |
| | 48,247,323 |
Construction & Engineering - 2.6% |
Foster Wheeler AG (a) | 490,000 | | 11,279,800 |
Granite Construction, Inc. | 392,000 | | 9,114,000 |
KBR, Inc. | 450,000 | | 10,071,000 |
Orion Marine Group, Inc. (a) | 570,000 | | 7,079,400 |
| | 37,544,200 |
Common Stocks - continued |
| Shares | | Value |
INDUSTRIALS - continued |
Electrical Equipment - 2.8% |
Acuity Brands, Inc. | 257,100 | | $ 10,831,623 |
Regal-Beloit Corp. | 208,000 | | 12,652,640 |
Zumtobel AG | 852,783 | | 16,155,285 |
| | 39,639,548 |
Machinery - 1.8% |
Blount International, Inc. (a) | 640,000 | | 6,816,000 |
Commercial Vehicle Group, Inc. (a) | 1,064,273 | | 11,973,071 |
OSG Corp. | 600,000 | | 6,630,026 |
| | 25,419,097 |
Professional Services - 0.5% |
Diamond Management & Technology Consultants, Inc. | 725,000 | | 7,866,250 |
Road & Rail - 0.6% |
Contrans Group, Inc. Class A | 985,000 | | 8,576,049 |
Trading Companies & Distributors - 2.3% |
Beacon Roofing Supply, Inc. (a) | 569,000 | | 9,707,140 |
Interline Brands, Inc. (a) | 550,000 | | 9,949,500 |
Rush Enterprises, Inc. Class A (a) | 948,254 | | 14,166,915 |
| | 33,823,555 |
TOTAL INDUSTRIALS | | 266,156,782 |
INFORMATION TECHNOLOGY - 27.1% |
Communications Equipment - 5.9% |
Adtran, Inc. | 510,200 | | 16,112,116 |
CommScope, Inc. (a) | 287,200 | | 5,841,648 |
NETGEAR, Inc. (a) | 681,392 | | 16,353,406 |
Plantronics, Inc. | 520,000 | | 15,584,400 |
Polycom, Inc. (a) | 505,000 | | 14,988,400 |
Riverbed Technology, Inc. (a) | 415,000 | | 15,392,350 |
| | 84,272,320 |
Computers & Peripherals - 2.7% |
Super Micro Computer, Inc. (a) | 1,030,000 | | 14,873,200 |
Synaptics, Inc. (a)(d) | 370,000 | | 11,581,000 |
Wincor Nixdorf AG | 212,400 | | 11,988,190 |
| | 38,442,390 |
Electronic Equipment & Components - 2.6% |
Avnet, Inc. (a) | 494,000 | | 12,424,100 |
Common Stocks - continued |
| Shares | | Value |
INFORMATION TECHNOLOGY - continued |
Electronic Equipment & Components - continued |
Insight Enterprises, Inc. (a) | 815,000 | | $ 11,874,550 |
SYNNEX Corp. (a) | 472,800 | | 12,477,192 |
| | 36,775,842 |
Internet Software & Services - 5.1% |
Art Technology Group, Inc. (a) | 1,785,652 | | 6,428,347 |
j2 Global Communications, Inc. (a) | 607,500 | | 14,294,475 |
Monster Worldwide, Inc. (a)(d) | 675,880 | | 9,273,074 |
Perficient, Inc. (a)(e) | 1,548,502 | | 13,394,542 |
Rackspace Hosting, Inc. (a)(d) | 633,000 | | 11,837,100 |
Sohu.com, Inc. (a)(d) | 174,000 | | 8,181,480 |
TelecityGroup PLC (a) | 1,416,600 | | 9,620,374 |
| | 73,029,392 |
IT Services - 3.3% |
Datacash Group PLC | 2,736,200 | | 10,514,067 |
Heartland Payment Systems, Inc. | 634,000 | | 10,004,520 |
Online Resources Corp. (a)(e) | 1,897,060 | | 7,777,946 |
WNS Holdings Ltd. sponsored ADR (a) | 574,657 | | 5,148,927 |
Wright Express Corp. (a) | 382,000 | | 13,366,180 |
| | 46,811,640 |
Semiconductors & Semiconductor Equipment - 2.9% |
Hittite Microwave Corp. (a) | 148,821 | | 6,839,813 |
Microsemi Corp. (a) | 847,000 | | 13,518,120 |
Roth & Rau AG (a) | 357,200 | | 11,825,138 |
Standard Microsystems Corp. (a) | 458,000 | | 10,085,160 |
| | 42,268,231 |
Software - 4.6% |
Blackbaud, Inc. | 446,059 | | 10,567,138 |
Informatica Corp. (a) | 381,000 | | 11,479,530 |
Radiant Systems, Inc. (a) | 895,000 | | 12,717,950 |
Solera Holdings, Inc. | 342,000 | | 12,989,160 |
Taleo Corp. Class A (a) | 481,039 | | 11,833,559 |
TeleCommunication Systems, Inc. Class A (a) | 2,000,000 | | 7,180,000 |
| | 66,767,337 |
TOTAL INFORMATION TECHNOLOGY | | 388,367,152 |
MATERIALS - 1.3% |
Chemicals - 0.6% |
Solutia, Inc. (a) | 647,000 | | 9,129,170 |
Common Stocks - continued |
| Shares | | Value |
MATERIALS - continued |
Metals & Mining - 0.7% |
Commercial Metals Co. | 635,100 | | $ 9,139,089 |
TOTAL MATERIALS | | 18,268,259 |
TELECOMMUNICATION SERVICES - 0.5% |
Diversified Telecommunication Services - 0.5% |
Premiere Global Services, Inc. (a) | 1,172,000 | | 7,336,720 |
TOTAL COMMON STOCKS (Cost $1,290,877,469) | 1,365,913,777 |
Money Market Funds - 9.5% |
| | | |
Fidelity Cash Central Fund, 0.24% (b) | 69,466,459 | | 69,466,459 |
Fidelity Securities Lending Cash Central Fund, 0.27% (b)(c) | 67,877,077 | | 67,877,077 |
TOTAL MONEY MARKET FUNDS (Cost $137,343,536) | 137,343,536 |
TOTAL INVESTMENT PORTFOLIO - 104.7% (Cost $1,428,221,005) | | 1,503,257,313 |
NET OTHER ASSETS (LIABILITIES) - (4.7)% | | (68,064,626) |
NET ASSETS - 100% | $ 1,435,192,687 |
Legend |
(a) Non-income producing |
(b) Affiliated fund that is available only to investment companies and other accounts managed by Fidelity Investments. The rate quoted is the annualized seven-day yield of the fund at period end. A complete unaudited listing of the fund's holdings as of its most recent quarter end is available upon request. |
(c) Investment made with cash collateral received from securities on loan. |
(d) Security or a portion of the security is on loan at period end. |
(e) Affiliated company |
Affiliated Central Funds |
Information regarding fiscal year to date income earned by the Fund from investments in Fidelity Central Funds is as follows: |
Fund | Income earned |
Fidelity Cash Central Fund | $ 149,674 |
Fidelity Securities Lending Cash Central Fund | 1,296,145 |
Total | $ 1,445,819 |
Other Affiliated Issuers |
An affiliated company is a company in which the fund has ownership of at least 5% of the voting securities. Fiscal year to date transactions with companies which are or were affiliates are as follows: |
Affiliate | Value, beginning of period | Purchases | Sales Proceeds | Dividend Income | Value, end of period |
Commercial Vehicle Group, Inc. | $ - | $ 9,035,246 | $ 6,160,191 | $ - | $ - |
Online Resources Corp. | 7,502,350 | 4,608,401 | 537,693 | - | 7,777,946 |
Perficient, Inc. | - | 15,347,170 | - | - | 13,394,542 |
Town Sports International Holdings, Inc. | 4,060,850 | 759,596 | 3,236,327 | - | - |
Total | $ 11,563,200 | $ 29,750,413 | $ 9,934,211 | $ - | $ 21,172,488 |
Other Information |
All investments are categorized as Level 1 under the Fair Value Hierarchy. The inputs or methodology used for valuing securities may not be an indication of the risk associated with investing in those securities. For more information on valuation inputs, please refer to the Security Valuation section in the accompanying Notes to Financial Statements. |
Distribution of investments by country of issue, as a percentage of total net assets, is as follows: (Unaudited) |
United States of America | 83.8% |
Germany | 3.3% |
United Kingdom | 3.1% |
Canada | 2.1% |
Austria | 1.1% |
Spain | 1.0% |
Others (Individually Less Than 1%) | 5.6% |
| 100.0% |
Income Tax Information |
At July 31, 2010, the Fund had a capital loss carryforward of approximately $193,259,144 all of which will expire on July 31, 2017. Capital loss carryforwards are only available to offset future capital gains of the Fund to the extent provided by regulations and may be limited. |
See accompanying notes which are an integral part of the financial statements.
Annual Report
Statement of Assets and Liabilities
| July 31, 2010 |
| | |
Assets | | |
Investment in securities, at value (including securities loaned of $66,419,896) - See accompanying schedule: Unaffiliated issuers (cost $1,264,897,501) | $ 1,344,741,289 | |
Fidelity Central Funds (cost $137,343,536) | 137,343,536 | |
Other affiliated issuers (cost $25,979,968) | 21,172,488 | |
Total Investments (cost $1,428,221,005) | | $ 1,503,257,313 |
Cash | | 315,767 |
Receivable for investments sold | | 13,654,738 |
Receivable for fund shares sold | | 2,171,959 |
Dividends receivable | | 292,550 |
Distributions receivable from Fidelity Central Funds | | 132,533 |
Other receivables | | 33,561 |
Total assets | | 1,519,858,421 |
| | |
Liabilities | | |
Payable to custodian bank | $ 29,626 | |
Payable for investments purchased | 14,818,248 | |
Payable for fund shares redeemed | 742,277 | |
Accrued management fee | 742,220 | |
Distribution fees payable | 38,799 | |
Other affiliated payables | 356,239 | |
Other payables and accrued expenses | 61,248 | |
Collateral on securities loaned, at value | 67,877,077 | |
Total liabilities | | 84,665,734 |
| | |
Net Assets | | $ 1,435,192,687 |
Net Assets consist of: | | |
Paid in capital | | $ 1,560,322,935 |
Accumulated undistributed net realized gain (loss) on investments and foreign currency transactions | | (200,164,970) |
Net unrealized appreciation (depreciation) on investments and assets and liabilities in foreign currencies | | 75,034,722 |
Net Assets | | $ 1,435,192,687 |
See accompanying notes which are an integral part of the financial statements.
Annual Report
Statement of Assets and Liabilities - continued
| July 31, 2010 |
| | |
Calculation of Maximum Offering Price
Class A:
Net Asset Value and redemption price per share
($50,620,117 ÷ 3,999,164 shares) | | $ 12.66 |
| | |
Maximum offering price per share (100/94.25 of $12.66) | | $ 13.43 |
Class T:
Net Asset Value and redemption price per share ($23,930,175 ÷ 1,904,460 shares) | | $ 12.57 |
| | |
Maximum offering price per share (100/96.50 of $12.57) | | $ 13.03 |
Class B:
Net Asset Value and offering price per share ($5,141,694 ÷ 417,875 shares)A | | $ 12.30 |
| | |
Class C:
Net Asset Value and offering price per share ($18,091,241 ÷ 1,472,976 shares)A | | $ 12.28 |
| | |
Small Cap Growth:
Net Asset Value, offering price and redemption price per share ($1,204,817,925 ÷ 94,067,973 shares) | | $ 12.81 |
| | |
Class F:
Net Asset Value, offering price and redemption price per share ($106,941,045 ÷ 8,320,712 shares) | | $ 12.85 |
| | |
Institutional Class:
Net Asset Value, offering price and redemption price per share ($25,650,490 ÷ 1,999,058 shares) | | $ 12.83 |
A Redemption price per share is equal to net asset value less any applicable contingent deferred sales charge.
See accompanying notes which are an integral part of the financial statements.
Annual Report
Financial Statements - continued
Statement of Operations
| Year ended July 31, 2010 |
| | |
Investment Income | | |
Dividends | | $ 7,668,648 |
Special dividends | | 1,409,998 |
Interest | | 77 |
Income from Fidelity Central Funds (including $1,296,145 from security lending) | | 1,445,819 |
Total income | | 10,524,542 |
| | |
Expenses | | |
Management fee
Basic fee | $ 9,613,711 | |
Performance adjustment | 303,437 | |
Transfer agent fees | 3,875,107 | |
Distribution fees | 458,801 | |
Accounting and security lending fees | 472,799 | |
Custodian fees and expenses | 60,299 | |
Independent trustees' compensation | 7,713 | |
Registration fees | 89,950 | |
Audit | 55,399 | |
Legal | 5,688 | |
Miscellaneous | 20,225 | |
Total expenses before reductions | 14,963,129 | |
Expense reductions | (169,459) | 14,793,670 |
Net investment income (loss) | | (4,269,128) |
Realized and Unrealized Gain (Loss) Net realized gain (loss) on: | | |
Investment securities: | | |
Unaffiliated issuers | 241,077,337 | |
Other affiliated issuers | 987,981 | |
Foreign currency transactions | (28,960) | |
Capital gain distributions from Fidelity Central Funds | 2,501 | |
Total net realized gain (loss) | | 242,038,859 |
Change in net unrealized appreciation (depreciation) on: Investment securities | (34,114,564) | |
Assets and liabilities in foreign currencies | (2,138) | |
Total change in net unrealized appreciation (depreciation) | | (34,116,702) |
Net gain (loss) | | 207,922,157 |
Net increase (decrease) in net assets resulting from operations | | $ 203,653,029 |
See accompanying notes which are an integral part of the financial statements.
Annual Report
Statement of Changes in Net Assets
| Year ended
July 31,
2010 | Year ended
July 31,
2009 |
Increase (Decrease) in Net Assets | | |
Operations | | |
Net investment income (loss) | $ (4,269,128) | $ (4,212,561) |
Net realized gain (loss) | 242,038,859 | (335,295,985) |
Change in net unrealized appreciation (depreciation) | (34,116,702) | 109,380,680 |
Net increase (decrease) in net assets resulting
from operations | 203,653,029 | (230,127,866) |
Share transactions - net increase (decrease) | 46,578,163 | 89,233,558 |
Redemption fees | 232,258 | 255,734 |
Total increase (decrease) in net assets | 250,463,450 | (140,638,574) |
| | |
Net Assets | | |
Beginning of period | 1,184,729,237 | 1,325,367,811 |
End of period | $ 1,435,192,687 | $ 1,184,729,237 |
See accompanying notes which are an integral part of the financial statements.
Annual Report
Financial Highlights - Class A
Years ended July 31, | 2010 | 2009 | 2008 | 2007 | 2006 |
Selected Per-Share Data | | | | | |
Net asset value, beginning of period | $ 10.79 | $ 13.20 | $ 16.06 | $ 12.88 | $ 12.95 |
Income from Investment Operations | | | | | |
Net investment income (loss) C | (.07) F | (.06) | (.11) | (.12) G | (.10) H |
Net realized and unrealized gain (loss) | 1.94 | (2.35) | (1.73) | 3.39 | .18 |
Total from investment operations | 1.87 | (2.41) | (1.84) | 3.27 | .08 |
Distributions from net realized gain | - | - | (1.02) | (.09) | (.16) |
Redemption fees added to paid in capital C | - J | - J | - J | - J | .01 |
Net asset value, end of period | $ 12.66 | $ 10.79 | $ 13.20 | $ 16.06 | $ 12.88 |
Total Return A, B | 17.33% | (18.26)% | (12.26)% | 25.52% | .70% |
Ratios to Average Net Assets D, I | | | | | |
Expenses before reductions | 1.35% | 1.33% | 1.40% | 1.44% | 1.53% |
Expenses net of fee waivers,
if any | 1.35% | 1.33% | 1.40% | 1.40% | 1.40% |
Expenses net of all reductions | 1.34% | 1.33% | 1.39% | 1.39% | 1.35% |
Net investment income (loss) | (.56)% F | (.64)% | (.74)% | (.80)% G | (.79)% H |
Supplemental Data | | | | | |
Net assets, end of period
(000 omitted) | $ 50,620 | $ 40,211 | $ 42,187 | $ 33,588 | $ 18,104 |
Portfolio turnover rate E | 105% | 150% | 113% | 91% | 129% |
A Total returns would have been lower had certain expenses not been reduced during the periods shown.
B Total returns do not include the effect of the sales charges.
C Calculated based on average shares outstanding during the period.
D Fees and expenses of the underlying Fidelity Central Funds are not included in the Fund's expense ratio. The Fund indirectly bears its proportionate share of the expenses of any underlying Fidelity Central Funds.
E Amount does not include the portfolio activity of any underlying Fidelity Central Funds.
F Investment income per share reflects a special dividend which amounted to $.01 per share. Excluding the special dividend, the ratio of net investment income (loss) to average net assets would have been (.67)%.
G Investment income per share reflects a special dividend which amounted to $.01 per share. Excluding the special dividend, the ratio of net investment income (loss) to average net assets would have been (.84)%.
H Investment income per share reflects a special dividend which amounted to $.01 per share. Excluding the special dividend, the ratio of net investment income (loss) to average net assets would have been (.85)%.
I Expense ratios reflect operating expenses of the class. Expenses before reductions do not reflect amounts reimbursed by the investment adviser or reductions from brokerage service arrangements or reductions from other expense offset arrangements and do not represent the amount paid by the class during periods when reimbursements or reductions occur. Expenses net of fee waivers reflect expenses after reimbursement by the investment adviser but prior to reductions from brokerage service arrangements or other expense offset arrangements. Expenses net of all reductions represent the net expenses paid by the class.
J Amount represents less than $.01 per share.
See accompanying notes which are an integral part of the financial statements.
Annual Report
Financial Highlights - Class T
Years ended July 31, | 2010 | 2009 | 2008 | 2007 | 2006 |
Selected Per-Share Data | | | | | |
Net asset value, beginning of period | $ 10.74 | $ 13.17 | $ 16.01 | $ 12.86 | $ 12.93 |
Income from Investment Operations | | | | | |
Net investment income (loss) C | (.10) F | (.09) | (.15) | (.16) G | (.14) H |
Net realized and unrealized gain (loss) | 1.93 | (2.34) | (1.73) | 3.38 | .19 |
Total from investment operations | 1.83 | (2.43) | (1.88) | 3.22 | .05 |
Distributions from net realized gain | - | - | (.96) | (.07) | (.13) |
Redemption fees added to paid in capital C | - J | - J | - J | - J | .01 |
Net asset value, end of period | $ 12.57 | $ 10.74 | $ 13.17 | $ 16.01 | $ 12.86 |
Total Return A, B | 17.04% | (18.45)% | (12.50)% | 25.18% | .48% |
Ratios to Average Net Assets D, I | | | | | |
Expenses before reductions | 1.61% | 1.60% | 1.65% | 1.67% | 1.73% |
Expenses net of fee waivers,
if any | 1.61% | 1.60% | 1.65% | 1.65% | 1.65% |
Expenses net of all reductions | 1.60% | 1.59% | 1.65% | 1.65% | 1.60% |
Net investment income (loss) | (.82)% F | (.91)% | (.99)% | (1.05)% G | (1.04)% H |
Supplemental Data | | | | | |
Net assets, end of period
(000 omitted) | $ 23,930 | $ 21,533 | $ 21,754 | $ 26,419 | $ 19,205 |
Portfolio turnover rate E | 105% | 150% | 113% | 91% | 129% |
A Total returns would have been lower had certain expenses not been reduced during the periods shown.
B Total returns do not include the effect of the sales charges.
C Calculated based on average shares outstanding during the period.
D Fees and expenses of the underlying Fidelity Central Funds are not included in the Fund's expense ratio. The Fund indirectly bears its proportionate share of the expenses of any underlying Fidelity Central Funds.
E Amount does not include the portfolio activity of any underlying Fidelity Central Funds.
F Investment income per share reflects a special dividend which amounted to $.01 per share. Excluding the special dividend, the ratio of net investment income (loss) to average net assets would have been (.93)%.
G Investment income per share reflects a special dividend which amounted to $.01 per share. Excluding the special dividend, the ratio of net investment income (loss) to average net assets would have been (1.09)%.
H Investment income per share reflects a special dividend which amounted to $.01 per share. Excluding the special dividend, the ratio of net investment income (loss) to average net assets would have been (1.10)%.
I Expense ratios reflect operating expenses of the class. Expenses before reductions do not reflect amounts reimbursed by the investment adviser or reductions from brokerage service arrangements or reductions from other expense offset arrangements and do not represent the amount paid by the class during periods when reimbursements or reductions occur. Expenses net of fee waivers reflect expenses after reimbursement by the investment adviser but prior to reductions from brokerage service arrangements or other expense offset arrangements. Expenses net of all reductions represent the net expenses paid by the class.
J Amount represents less than $.01 per share.
See accompanying notes which are an integral part of the financial statements.
Annual Report
Financial Highlights - Class B
Years ended July 31, | 2010 | 2009 | 2008 | 2007 | 2006 |
Selected Per-Share Data | | | | | |
Net asset value, beginning of period | $ 10.57 | $ 13.03 | $ 15.85 | $ 12.78 | $ 12.87 |
Income from Investment Operations | | | | | |
Net investment income (loss) C | (.16) F | (.13) | (.22) | (.23) G | (.20) H |
Net realized and unrealized gain (loss) | 1.89 | (2.33) | (1.71) | 3.36 | .19 |
Total from investment operations | 1.73 | (2.46) | (1.93) | 3.13 | (.01) |
Distributions from net realized gain | - | - | (.89) | (.06) | (.09) |
Redemption fees added to paid in capital C | - J | - J | - J | - J | .01 |
Net asset value, end of period | $ 12.30 | $ 10.57 | $ 13.03 | $ 15.85 | $ 12.78 |
Total Return A, B | 16.37% | (18.88)% | (12.92)% | 24.57% | (.03)% |
Ratios to Average Net Assets D, I | | | | | |
Expenses before reductions | 2.11% | 2.08% | 2.15% | 2.20% | 2.28% |
Expenses net of fee waivers,
if any | 2.11% | 2.08% | 2.15% | 2.15% | 2.15% |
Expenses net of all reductions | 2.09% | 2.08% | 2.15% | 2.15% | 2.10% |
Net investment income (loss) | (1.32)% F | (1.39)% | (1.49)% | (1.55)% G | (1.54)% H |
Supplemental Data | | | | | |
Net assets, end of period
(000 omitted) | $ 5,142 | $ 4,171 | $ 5,517 | $ 6,242 | $ 5,191 |
Portfolio turnover rate E | 105% | 150% | 113% | 91% | 129% |
A Total returns would have been lower had certain expenses not been reduced during the periods shown.
B Total returns do not include the effect of the contingent deferred sales charge.
C Calculated based on average shares outstanding during the period.
D Fees and expenses of the underlying Fidelity Central Funds are not included in the Fund's expense ratio. The Fund indirectly bears its proportionate share of the expenses of any underlying Fidelity Central Funds.
E Amount does not include the portfolio activity of any underlying Fidelity Central Funds.
F Investment income per share reflects a special dividend which amounted to $.01 per share. Excluding the special dividend, the ratio of net investment income (loss) to average net assets would have been (1.42)%.
G Investment income per share reflects a special dividend which amounted to $.01 per share. Excluding the special dividend, the ratio of net investment income (loss) to average net assets would have been (1.59)%.
H Investment income per share reflects a special dividend which amounted to $.01 per share. Excluding the special dividend, the ratio of net investment income (loss) to average net assets would have been (1.60)%.
I Expense ratios reflect operating expenses of the class. Expenses before reductions do not reflect amounts reimbursed by the investment adviser or reductions from brokerage service arrangements or reductions from other expense offset arrangements and do not represent the amount paid by the class during periods when reimbursements or reductions occur. Expenses net of fee waivers reflect expenses after reimbursement by the investment adviser but prior to reductions from brokerage service arrangements or other expense offset arrangements. Expenses net of all reductions represent the net expenses paid by the class.
J Amount represents less than $.01 per share.
See accompanying notes which are an integral part of the financial statements.
Annual Report
Financial Highlights - Class C
Years ended July 31, | 2010 | 2009 | 2008 | 2007 | 2006 |
Selected Per-Share Data | | | | | |
Net asset value, beginning of period | $ 10.55 | $ 13.00 | $ 15.84 | $ 12.77 | $ 12.88 |
Income from Investment Operations | | | | | |
Net investment income (loss) C | (.16) F | (.13) | (.22) | (.23) G | (.20) H |
Net realized and unrealized gain (loss) | 1.89 | (2.32) | (1.71) | 3.36 | .18 |
Total from investment operations | 1.73 | (2.45) | (1.93) | 3.13 | (.02) |
Distributions from net realized gain | - | - | (.91) | (.06) | (.10) |
Redemption fees added to paid in capital C | - J | - J | - J | - J | .01 |
Net asset value, end of period | $ 12.28 | $ 10.55 | $ 13.00 | $ 15.84 | $ 12.77 |
Total Return A, B | 16.40% | (18.85)% | (12.94)% | 24.59% | (.08)% |
Ratios to Average Net Assets D, I | | | | | |
Expenses before reductions | 2.11% | 2.08% | 2.15% | 2.20% | 2.25% |
Expenses net of fee waivers,
if any | 2.11% | 2.08% | 2.15% | 2.15% | 2.15% |
Expenses net of all reductions | 2.09% | 2.07% | 2.14% | 2.14% | 2.10% |
Net investment income (loss) | (1.32)% F | (1.39)% | (1.49)% | (1.55)% G | (1.54)% H |
Supplemental Data | | | | | |
Net assets, end of period
(000 omitted) | $ 18,091 | $ 14,267 | $ 15,946 | $ 22,348 | $ 14,682 |
Portfolio turnover rateE | 105% | 150% | 113% | 91% | 129% |
A Total returns would have been lower had certain expenses not been reduced during the periods shown.
B Total returns do not include the effect of the contingent deferred sales charge.
C Calculated based on average shares outstanding during the period.
D Fees and expenses of the underlying Fidelity Central Funds are not included in the Fund's expense ratio. The Fund indirectly bears its proportionate share of the expenses of any underlying Fidelity Central Funds.
E Amount does not include the portfolio activity of any underlying Fidelity Central Funds.
F Investment income per share reflects a special dividend which amounted to $.01 per share. Excluding the special dividend, the ratio of net investment income (loss) to average net assets would have been (1.42)%.
G Investment income per share reflects a special dividend which amounted to $.01 per share. Excluding the special dividend, the ratio of net investment income (loss) to average net assets would have been (1.59)%.
H Investment income per share reflects a special dividend which amounted to $.01 per share. Excluding the special dividend, the ratio of net investment income (loss) to average net assets would have been (1.60)%.
I Expense ratios reflect operating expenses of the class. Expenses before reductions do not reflect amounts reimbursed by the investment adviser or reductions from brokerage service arrangements or reductions from other expense offset arrangements and do not represent the amount paid by the class during periods when reimbursements or reductions occur. Expenses net of fee waivers reflect expenses after reimbursement by the investment adviser but prior to reductions from brokerage service arrangements or other expense offset arrangements. Expenses net of all reductions represent the net expenses paid by the class.
J Amount represents less than $.01 per share.
See accompanying notes which are an integral part of the financial statements.
Annual Report
Financial Highlights - Small Cap Growth
Years ended July 31, | 2010 | 2009 | 2008 | 2007 | 2006 |
Selected Per-Share Data | | | | | |
Net asset value, beginning of period | $ 10.89 | $ 13.29 | $ 16.15 | $ 12.93 | $ 12.98 |
Income from Investment Operations | | | | | |
Net investment income (loss) B | (.04) E | (.04) | (.07) | (.08) F | (.07) G |
Net realized and unrealized gain (loss) | 1.96 | (2.36) | (1.74) | 3.40 | .19 |
Total from investment operations | 1.92 | (2.40) | (1.81) | 3.32 | .12 |
Distributions from net realized gain | - | - | (1.05) | (.10) | (.18) |
Redemption fees added to paid in capital B | - I | - I | - I | - I | .01 |
Net asset value, end of period | $ 12.81 | $ 10.89 | $ 13.29 | $ 16.15 | $ 12.93 |
Total Return A | 17.63% | (18.06)% | (11.98)% | 25.84% | 1.01% |
Ratios to Average Net Assets C, H | | | | |
Expenses before reductions | 1.08% | 1.08% | 1.11% | 1.10% | 1.13% |
Expenses net of fee waivers,
if any | 1.08% | 1.08% | 1.11% | 1.10% | 1.13% |
Expenses net of all reductions | 1.07% | 1.08% | 1.10% | 1.09% | 1.08% |
Net investment income (loss) | (.29)% E | (.39)% | (.45)% | (.50)% F | (.52)% G |
Supplemental Data | | | | | |
Net assets, end of period (000 omitted) | $ 1,204,818 | $ 1,085,184 | $ 1,217,520 | $ 1,149,809 | $ 402,353 |
Portfolio turnover rate D | 105% | 150% | 113% | 91% | 129% |
A Total returns would have been lower had certain expenses not been reduced during the periods shown.
B Calculated based on average shares outstanding during the period.
C Fees and expenses of the underlying Fidelity Central Funds are not included in the Fund's expense ratio. The Fund indirectly bears its proportionate share of the expenses of any underlying Fidelity Central Funds.
D Amount does not include the portfolio activity of any underlying Fidelity Central Funds.
E Investment income per share reflects a special dividend which amounted to $.01 per share. Excluding the special dividend, the ratio of net investment income (loss) to average net assets would have been (.39)%.
F Investment income per share reflects a special dividend which amounted to $.01 per share. Excluding the special dividend, the ratio of net investment income (loss) to average net assets would have been (.54)%.
G Investment income per share reflects a special dividend which amounted to $.01 per share. Excluding the special dividend, the ratio of net investment income (loss) to average net assets would have been (.58)%.
H Expense ratios reflect operating expenses of the class. Expenses before reductions do not reflect amounts reimbursed by the investment adviser or reductions from brokerage service arrangements or reductions from other expense offset arrangements and do not represent the amount paid by the class during periods when reimbursements or reductions occur. Expenses net of fee waivers reflect expenses after reimbursement by the investment adviser but prior to reductions from brokerage service arrangements or other expense offset arrangements. Expenses net of all reductions represent the net expenses paid by the class.
I Amount represents less than $.01 per share.
See accompanying notes which are an integral part of the financial statements.
Annual Report
Financial Highlights - Class F
Years ended July 31, | 2010 | 2009 I |
Selected Per-Share Data | | |
Net asset value, beginning of period | $ 10.90 | $ 10.03 |
Income from Investment Operations | | |
Net investment income (loss) D | - G, K | (.01) |
Net realized and unrealized gain (loss) | 1.95 | .88 H |
Total from investment operations | 1.95 | .87 |
Redemption fees added to paid in capital D, K | - | - |
Net asset value, end of period | $ 12.85 | $ 10.90 |
Total Return B, C | 17.89% | 8.67% |
Ratios to Average Net Assets E, J | | |
Expenses before reductions | .78% | .74% A |
Expenses net of fee waivers, if any | .78% | .74% A |
Expenses net of all reductions | .77% | .73% A |
Net investment income (loss) | -% G, L | (.54)% A |
Supplemental Data | | |
Net assets, end of period (000 omitted) | $ 106,941 | $ 159 |
Portfolio turnover rate F | 105% | 150% |
A Annualized
B Total returns for periods of less than one year are not annualized.
C Total returns would have been lower had certain expenses not been reduced during the periods shown.
D Calculated based on average shares outstanding during the period.
E Fees and expenses of the underlying Fidelity Central Funds are not included in the Fund's expense ratio. The Fund indirectly bears its proportionate share of the expenses of any underlying Fidelity Central Funds.
F Amount does not include the portfolio activity of any underlying Fidelity Central Funds.
G Investment income per share reflects a special dividend which amounted to $.01 per share. Excluding the special dividend, the ratio of net investment income (loss) to average net assets would have been (.10)%.
H The amount shown for a share outstanding does not correspond with the aggregate net gain (loss) on investments for the period due to the timing of sales and repurchases of shares in relation to fluctuating market values of the investments of the Fund.
I For the period June 26, 2009 (commencement of sale of shares) to July 31, 2009.
J Expense ratios reflect operating expenses of the class. Expenses before reductions do not reflect amounts reimbursed by the investment adviser or reductions from brokerage service arrangements or reductions from other expense offset arrangements and do not represent the amount paid by the class during periods when reimbursements or reductions occur. Expense ratios before reductions for start-up periods may not be representative of longer-term operating periods. Expenses net of fee waivers reflect expenses after reimbursement by the investment adviser but prior to reductions from brokerage service arrangements or other expense offset arrangements. Expenses net of all reductions represent the net expenses paid by the class.
K Amount represents less than $.01 per share.
L Amount represents less than .01%.
See accompanying notes which are an integral part of the financial statements.
Annual Report
Financial Highlights - Institutional Class
Years ended July 31, | 2010 | 2009 | 2008 | 2007 | 2006 |
Selected Per-Share Data | | | | | |
Net asset value, beginning of period | $ 10.91 | $ 13.30 | $ 16.15 | $ 12.92 | $ 12.97 |
Income from Investment Operations | | | | | |
Net investment income (loss) B | (.03) E | (.03) | (.06) | (.07) F | (.07) G |
Net realized and unrealized gain (loss) | 1.95 | (2.36) | (1.74) | 3.41 | .19 |
Total from investment operations | 1.92 | (2.39) | (1.80) | 3.34 | .12 |
Distributions from net realized gain | - | - | (1.05) | (.11) | (.18) |
Redemption fees added to paid in capital B | - I | - I | - I | - I | .01 |
Net asset value, end of period | $ 12.83 | $ 10.91 | $ 13.30 | $ 16.15 | $ 12.92 |
Total Return A | 17.60% | (17.97)% | (11.93)% | 25.99% | .97% |
Ratios to Average Net Assets C, H | | | | | |
Expenses before reductions | 1.03% | 1.05% | 1.04% | 1.05% | 1.10% |
Expenses net of fee waivers,
if any | 1.03% | 1.05% | 1.04% | 1.05% | 1.10% |
Expenses net of all reductions | 1.02% | 1.04% | 1.03% | 1.05% | 1.05% |
Net investment income (loss) | (.24)% E | (.36)% | (.38)% | (.46)% F | (.49)% G |
Supplemental Data | | | | | |
Net assets, end of period
(000 omitted) | $ 25,650 | $ 19,204 | $ 22,444 | $ 18,671 | $ 14,233 |
Portfolio turnover rate D | 105% | 150% | 113% | 91% | 129% |
A Total returns would have been lower had certain expenses not been reduced during the periods shown.
B Calculated based on average shares outstanding during the period.
C Fees and expenses of the underlying Fidelity Central Funds are not included in the Fund's expense ratio. The Fund indirectly bears its proportionate share of the expenses of any underlying Fidelity Central Funds.
D Amount does not include the portfolio activity of any underlying Fidelity Central Funds.
E Investment income per share reflects a special dividend which amounted to $.01 per share. Excluding the special dividend, the ratio of net investment income (loss) to average net assets would have been (.34)%.
F Investment income per share reflects a special dividend which amounted to $.01 per share. Excluding the special dividend, the ratio of net investment income (loss) to average net assets would have been (.50)%.
G Investment income per share reflects a special dividend which amounted to $.01 per share. Excluding the special dividend, the ratio of net investment income (loss) to average net assets would have been (.55)%.
H Expense ratios reflect operating expenses of the class. Expenses before reductions do not reflect amounts reimbursed by the investment adviser or reductions from brokerage service arrangements or reductions from other expense offset arrangements and do not represent the amount paid by the class during periods when reimbursements or reductions occur. Expenses net of fee waivers reflect expenses after reimbursement by the investment adviser but prior to reductions from brokerage service arrangements or other expense offset arrangements. Expenses net of all reductions represent the net expenses paid by the class.
I Amount represents less than $.01 per share.
See accompanying notes which are an integral part of the financial statements.
Annual Report
Notes to Financial Statements
For the period ended July 31, 2010
1. Organization.
Fidelity Small Cap Growth Fund (the Fund) is a fund of Fidelity Securities Fund (the Trust) and is authorized to issue an unlimited number of shares. The Trust is registered under the Investment Company Act of 1940, as amended (the 1940 Act), as an open-end management investment company organized as a Massachusetts business trust. The Fund offers Class A, Class T, Class B, Class C, Small Cap Growth, Class F and Institutional Class shares, each of which has equal rights as to assets and voting privileges. Effective after the close of business on September 1, 2010, Class B shares will be closed to new accounts and additional purchases by existing shareholders. Each class has exclusive voting rights with respect to matters that affect that class. Class F shares of the Fund are only available for purchase by mutual funds for which Fidelity Management & Research Company (FMR) or an affiliate serves as investment manager. Class B shares will automatically convert to Class A shares after a holding period of seven years from the initial date of purchase. Investment income, realized and unrealized capital gains and losses, the common expenses of the Fund, and certain fund-level expense reductions, if any, are allocated on a pro-rata basis to each class based on the relative net assets of each class to the total net assets of the Fund. Each class differs with respect to transfer agent and distribution and service plan fees incurred. Certain expense reductions also differ by class.
2. Investments in Fidelity Central Funds.
The Fund may invest in Fidelity Central Funds, which are open-end investment companies available only to other investment companies and accounts managed by FMR and its affiliates. The Fund's Schedule of Investments lists each of the Fidelity Central Funds held as of period end, if any, as an investment of the Fund, but does not include the underlying holdings of each Fidelity Central Fund. As an Investing Fund, the Fund indirectly bears its proportionate share of the expenses of the underlying Fidelity Central Funds.
The Money Market Central Funds seek preservation of capital and current income and are managed by Fidelity Investments Money Management, Inc. (FIMM), an affiliate of FMR.
A complete unaudited list of holdings for each Fidelity Central Fund is available upon request or at the Securities and Exchange Commission (the SEC) web site at www.sec.gov. In addition, the financial statements of the Fidelity Central Funds which are not covered by the Fund's Report of Independent Registered Public Accounting Firm, are available on the SEC web site or upon request.
Annual Report
3. Significant Accounting Policies.
The financial statements have been prepared in conformity with accounting principles generally accepted in the United States of America (GAAP), which require management to make certain estimates and assumptions at the date of the financial statements. Actual results could differ from those estimates. The following summarizes the significant accounting policies of the Fund:
Security Valuation. Investments are valued as of 4:00 p.m. Eastern time on the last calendar day of the period. The Fund uses independent pricing services approved by the Board of Trustees to value its investments. When current market prices or quotations are not readily available or reliable, valuations may be determined in good faith in accordance with procedures adopted by the Board of Trustees. Factors used in determining value may include market or security specific events. The frequency with which these procedures are used cannot be predicted and they may be utilized to a significant extent. The value used for net asset value (NAV) calculation under these procedures may differ from published prices for the same securities.
The Fund categorizes the inputs to valuation techniques used to value its investments into a disclosure hierarchy consisting of three levels as shown below.
Level 1 - quoted prices in active markets for identical investments
Level 2 - other significant observable inputs (including quoted prices for similar investments, interest rates, prepayment speeds, etc.)
Level 3 - unobservable inputs (including the fund's own assumptions based on the best information available)
Changes in valuation techniques may result in transfers in or out of an assigned level within the disclosure hierarchy. The aggregate value of investments by input level, as of July 31, 2010 is included at the end of the Fund's Schedule of Investments. Valuation techniques used to value the Fund's investments by major category are as follows.
Equity securities, including restricted securities, for which market quotations are readily available, are valued at the last reported sale price or official closing price as reported by an independent pricing service on the primary market or exchange on which they are traded and are categorized as Level 1 in the hierarchy. In the event there were no sales during the day or closing prices are not available, securities are valued at the last quoted bid price or may be valued using the last available price and are generally categorized as Level 2 in the hierarchy. For foreign equity securities, when significant market or security specific events arise, comparisons to the valuation of American Depositary Receipts (ADRs) futures contracts, Exchange-traded funds (ETFs) and certain indexes as well as quoted prices for similar securities are used and are categorized as Level 2 in the hierarchy
Annual Report
Notes to Financial Statements - continued
3. Significant Accounting Policies - continued
Security Valuation - continued
in these circumstances. Utilizing these techniques may result in transfers between Level 1 and Level 2. For restricted equity securities and private placements where observable inputs are limited, assumptions about market activity and risk are used and are categorized as Level 3 in the hierarchy.
Investments in open-end mutual funds, including the Fidelity Central Funds, are valued at their closing net asset value each business day and are categorized as Level 1 in the hierarchy. Short-term securities with remaining maturities of sixty days or less for which quotations are not readily available are valued at amortized cost, which approximates fair value and are categorized as Level 2 in the hierarchy.
Foreign Currency. The Fund uses foreign currency contracts to facilitate transactions in foreign-denominated securities. Gains and losses from these transactions may arise from changes in the value of the foreign currency or if the counterparties do not perform under the contracts' terms.
Foreign-denominated assets, including investment securities, and liabilities are translated into U.S. dollars at the exchange rate at period end. Purchases and sales of investment securities, income and dividends received and expenses denominated in foreign currencies are translated into U.S. dollars at the exchange rate in effect on the transaction date.
The effects of exchange rate fluctuations on investments are included with the net realized and unrealized gain (loss) on investment securities. Other foreign currency transactions resulting in realized and unrealized gain (loss) are disclosed separately.
Investment Transactions and Income. For financial reporting purposes, the Fund's investment holdings and NAV include trades executed through the end of the last business day of the period. The NAV per share for processing shareholder transactions is calculated as of the close of business of the New York Stock Exchange (NYSE), normally 4:00 p.m. Eastern time and includes trades executed through the end of the prior business day. Gains and losses on securities sold are determined on the basis of identified cost and may include proceeds received from litigation. Dividend income is recorded on the ex-dividend date, except for certain dividends from foreign securities where the ex-dividend date may have passed, which are recorded as soon as the Fund is informed of the ex-dividend date. Non-cash dividends included in dividend income, if any, are recorded at the fair market value of the securities received. Distributions received on securities that represent a return of capital or capital gain are recorded as a reduction of cost of investments and/or as a realized gain. The Fund estimates the components of distributions received that may be considered return of capital distributions or capital
Annual Report
3. Significant Accounting Policies - continued
Investment Transactions and Income - continued
gain distributions. Large, non-recurring dividends recognized by the Fund are presented separately on the Statement of Operations as "Special Dividends" and the impact of these dividends is presented in the Financial Highlights. Interest income and distributions from the Fidelity Central Funds are accrued as earned. Interest income includes coupon interest and amortization of premium and accretion of discount on debt securities. Investment income is recorded net of foreign taxes withheld where recovery of such taxes is uncertain.
Expenses. Most expenses of the Trust can be directly attributed to a fund. Expenses which cannot be directly attributed are apportioned amongst each fund in the Trust. Expense estimates are accrued in the period to which they relate and adjustments are made when actual amounts are known.
Income Tax Information and Distributions to Shareholders. Each year the Fund intends to qualify as a regulated investment company, including distributing substantially all of its taxable income and realized gains under Subchapter M of the Internal Revenue Code and filing its U.S. federal tax return. As a result, no provision for income taxes is required. As of July 31, 2010, the Fund did not have any unrecognized tax benefits in the accompanying financial statements. A fund's federal tax return is subject to examination by the Internal Revenue Service (IRS) for a period of three years. Foreign taxes are provided for based on the Fund's understanding of the tax rules and rates that exist in the foreign markets in which it invests.
Distributions are recorded on the ex-dividend date. Income dividends and capital gain distributions are declared separately for each class. Income and capital gain distributions are determined in accordance with income tax regulations, which may differ from GAAP.
Capital accounts within the financial statements are adjusted for permanent book-tax differences. These adjustments have no impact on net assets or the results of operations. Temporary book-tax differences will reverse in a subsequent period.
Book-tax differences are primarily due to the short-term gain distributions from the Fidelity Central Funds, foreign currency transactions, net operating losses, capital loss carryforwards, losses deferred due to wash sales and excise tax regulations.
The federal tax cost of investment securities and unrealized appreciation (depreciation) as of period end were as follows:
Gross unrealized appreciation | $ 169,655,477 |
Gross unrealized depreciation | (101,524,996) |
Net unrealized appreciation (depreciation) | $ 68,130,481 |
| |
Tax Cost | $ 1,435,126,832 |
Annual Report
Notes to Financial Statements - continued
3. Significant Accounting Policies - continued
Income Tax Information and Distributions to Shareholders - continued
The tax-based components of distributable earnings as of period end were as follows:
Capital loss carryforward | $ (193,259,144) |
Net unrealized appreciation (depreciation) | $ 68,128,895 |
Short-Term Trading (Redemption) Fees. Shares held in the Fund less than 90 days are subject to a redemption fee equal to 1.50% of the proceeds of the redeemed shares. All redemption fees, including any estimated redemption fees paid by FMR, are retained by the Fund and accounted for as an addition to paid in capital.
4. Purchases and Sales of Investments.
Purchases and sales of securities, other than short-term securities, aggregated $1,359,919,734 and $1,335,378,288, respectively.
5. Fees and Other Transactions with Affiliates.
Management Fee. FMR and its affiliates provide the Fund with investment management related services for which the Fund pays a monthly management fee. The management fee is the sum of an individual fund fee rate that is based on an annual rate of .45% of the Fund's average net assets and a group fee rate that averaged .26% during the period. The group fee rate is based upon the average net assets of all the mutual funds advised by FMR. The group fee rate decreases as assets under management increase and increases as assets under management decrease. In addition, the management fee is subject to a performance adjustment (up to a maximum of ± .20% of the Fund's average net assets over a 36 month performance period). The upward or downward adjustment to the management fee is based on the relative investment performance of the retail class of the Fund, Small Cap Growth, as compared to an appropriate benchmark index. For the period, the total annual management fee rate, including the performance adjustment, was .73% of the Fund's average net assets.
Distribution and Service Plan. In accordance with Rule 12b-1 of the 1940 Act, the Fund has adopted separate Distribution and Service Plans for each class of shares. Certain classes pay Fidelity Distributors Corporation (FDC), an affiliate of FMR, separate Distribution and Service Fees, each of which is based on an annual percentage of each class' average net assets. In addition, FDC may pay financial intermediaries for
Annual Report
5. Fees and Other Transactions with Affiliates - continued
Distribution and Service Plan - continued
selling shares of the Fund and providing shareholder support services. For the period, the Distribution and Service Fee rates and the total amounts paid to and retained by FDC were as follows:
| Distribution
Fee | Service
Fee | Paid to
FDC | Retained
by FDC |
Class A | -% | .25% | $ 117,878 | $ 2,297 |
Class T | .25% | .25% | 118,478 | - |
Class B | .75% | .25% | 49,164 | 36,913 |
Class C | .75% | .25% | 173,281 | 40,211 |
| | | $ 458,801 | $ 79,421 |
Sales Load. FDC receives a front-end sales charge of up to 5.75% for selling Class A shares, and 3.50% for selling Class T shares, some of which is paid to financial intermediaries for selling shares of the Fund. FDC receives the proceeds of contingent deferred sales charges levied on Class A, Class T, Class B, and Class C redemptions. These charges depend on the holding period. The deferred sales charges range from 5% to 1% for Class B, 1% for Class C, 1.00% for certain purchases of Class A shares (1.00% to .50% prior to July 12, 2010) and .25% for certain purchases of Class T shares.
For the period, sales charge amounts retained by FDC were as follows:
| Retained
by FDC |
Class A | $ 27,622 |
Class T | 6,101 |
Class B* | 8,154 |
Class C* | 2,438 |
| $ 44,315 |
* When Class B and Class C shares are initially sold, FDC pays commissions from its own resources to financial intermediaries through which the
sales are made.
Transfer Agent Fees. Fidelity Investments Institutional Operations Company, Inc. (FIIOC), an affiliate of FMR, is the transfer, dividend disbursing and shareholder servicing agent for each class of the Fund. FIIOC receives account fees and asset-based fees that vary according to the account size and type of account of the shareholders of the Fund, except for Class F. FIIOC receives no fees for providing transfer agency services to Class F.
Annual Report
Notes to Financial Statements - continued
5. Fees and Other Transactions with Affiliates - continued
Transfer Agent Fees - continued
FIIOC pays for typesetting, printing and mailing of shareholder reports, except proxy statements. For the period, the total transfer agent fees paid by each class were as follows:
| Amount | % of
Average
Net Assets |
Class A | $ 150,515 | .32 |
Class T | 77,623 | .33 |
Class B | 15,920 | .32 |
Class C | 56,034 | .32 |
Small Cap Growth | 3,522,221 | .29 |
Institutional Class | 52,794 | .24 |
| $ 3,875,107 | |
Accounting and Security Lending Fees. Fidelity Service Company, Inc. (FSC), an affiliate of FMR, maintains the Fund's accounting records. The accounting fee is based on the level of average net assets for the month. Under a separate contract, FSC administers the security lending program. The security lending fee is based on the number and duration of lending transactions.
Brokerage Commissions. The Fund placed a portion of its portfolio transactions with brokerage firms which are affiliates of the investment adviser. The commissions paid to these affiliated firms were $26,958 for the period.
6. Committed Line of Credit.
The Fund participates with other funds managed by FMR in a $3.75 billion credit facility (the "line of credit") to be utilized for temporary or emergency purposes to fund shareholder redemptions or for other short-term liquidity purposes. The Fund has agreed to pay commitment fees on its pro-rata portion of the line of credit, which amounted to $5,294 and is reflected in Miscellaneous expenses on the Statement of Operations. During the period, there were no borrowings on this line of credit.
7. Security Lending.
The Fund lends portfolio securities from time to time in order to earn additional income. On the settlement date of the loan, the Fund receives collateral (in the form of U.S. Treasury obligations, letters of credit and/or cash) against the loaned securities and maintains collateral in an amount not less than 100% of the market value of the loaned securities during the period of the loan. The market value of the loaned securities is
Annual Report
7. Security Lending - continued
determined at the close of business of the Fund and any additional required collateral is delivered to the Fund on the next business day. If the borrower defaults on its obligation to return the securities loaned because of insolvency or other reasons, a fund could experience delays and costs in recovering the securities loaned or in gaining access to the collateral. Any cash collateral received is invested in the Fidelity Securities Lending Cash Central Fund. The value of loaned securities and cash collateral at period end are disclosed on the Fund's Statement of Assets and Liabilities. Security lending income represents the income earned on investing cash collateral, less fees and expenses associated with the loan, plus any premium payments that may be received on the loan of certain types of securities. Security lending income is presented in the Statement of Operations as a component of income from Fidelity Central Funds.
8. Expense Reductions.
Many of the brokers with whom FMR places trades on behalf of the Fund provided services to the Fund in addition to trade execution. These services included payments of certain expenses on behalf of the Fund totaling $169,391 for the period. In addition, through arrangements with the Fund's custodian, credits realized as a result of uninvested cash balances were used to reduce the Fund's expenses. During the period, these credits reduced the Fund's custody expenses by $68.
9. Share Transactions.
Transactions for each class of shares were as follows:
| Shares | Dollars |
Years ended July 31, | 2010 | 2009 A | 2010 | 2009 A |
Class A | | | | |
Shares sold | 1,755,238 | 1,768,538 | $ 21,749,463 | $ 16,919,128 |
Shares redeemed | (1,481,231) | (1,239,291) | (17,861,442) | (11,138,983) |
Net increase (decrease) | 274,007 | 529,247 | $ 3,888,021 | $ 5,780,145 |
Class T | | | | |
Shares sold | 492,575 | 1,485,602 | $ 6,056,365 | $ 12,842,623 |
Shares redeemed | (592,408) | (1,132,759) | (7,232,100) | (9,596,209) |
Net increase (decrease) | (99,833) | 352,843 | $ (1,175,735) | $ 3,246,414 |
Class B | | | | |
Shares sold | 117,304 | 116,072 | $ 1,414,923 | $ 1,042,949 |
Shares redeemed | (93,928) | (145,097) | (1,126,513) | (1,355,668) |
Net increase (decrease) | 23,376 | (29,025) | $ 288,410 | $ (312,719) |
A Share transactions for Class F are for the period July 26, 2009 (commencement of sale of shares) to July 31, 2009.
Annual Report
Notes to Financial Statements - continued
9. Share Transactions - continued
| Shares | Dollars |
Years ended July 31, | 2010 | 2009 A | 2010 | 2009 A |
Class C | | | | |
Shares sold | 479,633 | 604,934 | $ 5,791,649 | $ 5,793,290 |
Shares redeemed | (358,550) | (479,386) | (4,319,904) | (4,290,700) |
Net increase (decrease) | 121,083 | 125,548 | $ 1,471,745 | $ 1,502,590 |
Small Cap Growth | | | | |
Shares sold | 22,893,960 | 30,718,046 | $ 285,679,819 | $ 287,281,815 |
Shares redeemed | (28,450,958) | (22,726,319) | (351,525,118) | (209,407,815) |
Net increase (decrease) | (5,556,998) | 7,991,727 | $ (65,845,299) | $ 77,874,000 |
Class F | | | | |
Shares sold | 8,663,528 | 14,590 | $ 109,176,128 | $ 145,457 |
Shares redeemed | (357,394) | (12) | (4,690,130) | (113) |
Net increase (decrease) | 8,306,134 | 14,578 | $ 104,485,998 | $ 145,344 |
Institutional Class | | | | |
Shares sold | 1,109,901 | 802,152 | $ 14,013,757 | $ 7,245,594 |
Shares redeemed | (871,545) | (728,847) | (10,548,734) | (6,247,810) |
Net increase (decrease) | 238,356 | 73,305 | $ 3,465,023 | $ 997,784 |
A Share transactions for Class F are for the period July 26, 2009 (commencement of sale of shares) to July 31, 2009.
10. Other.
The Fund's organizational documents provide former and current trustees and officers with a limited indemnification against liabilities arising in connection with the performance of their duties to the Fund. In the normal course of business, the Fund may also enter into contracts that provide general indemnifications. The Fund's maximum exposure under these arrangements is unknown as this would be dependent on future claims that may be made against the Fund. The risk of material loss from such claims is considered remote.
At the end of the period, Fidelity Freedom 2020 Fund was the owner of record of approximately 10% of the total outstanding shares of the Fund. The Fidelity Freedom Funds and Fidelity Freedom K Funds were the owners of record, in the aggregate, of approximately 54% of the total outstanding shares of the Fund.
Annual Report
To the Trustees of Fidelity Securities Fund and the Shareholders of Fidelity Small Cap Growth Fund:
In our opinion, the accompanying statement of assets and liabilities, including the schedule of investments, and the related statements of operations and of changes in net assets and the financial highlights present fairly, in all material respects, the financial position of Fidelity Small Cap Growth Fund (a fund of Fidelity Securities Fund) at July 31, 2010, the results of its operations for the year then ended, the changes in its net assets for each of the two years in the period then ended and the financial highlights for each of the periods indicated, in conformity with accounting principles generally accepted in the United States of America. These financial statements and financial highlights (hereafter referred to as "financial statements") are the responsibility of the Fidelity Small Cap Growth Fund's management. Our responsibility is to express an opinion on these financial statements based on our audits. We conducted our audits of these financial statements in accordance with the standards of the Public Company Accounting Oversight Board (United States). Those standards require that we plan and perform the audit to obtain reasonable assurance about whether the financial statements are free of material misstatement. An audit includes examining, on a test basis, evidence supporting the amounts and disclosures in the financial statements, assessing the accounting principles used and significant estimates made by management, and evaluating the overall financial statement presentation. We believe that our audits, which included confirmation of securities at July 31, 2010 by correspondence with the custodian and brokers, provide a reasonable basis for our opinion.
/s/ PricewaterhouseCoopers LLP
PricewaterhouseCoopers LLP
Boston, Massachusetts
September 14, 2010
Annual Report
The Trustees, Member of the Advisory Board, and executive officers of the trust and fund, as applicable, are listed below. The Board of Trustees governs the fund and is responsible for protecting the interests of shareholders. The Trustees are experienced executives who meet periodically throughout the year to oversee the fund's activities, review contractual arrangements with companies that provide services to the fund, oversee management of the risks associated with such activities and contractual arrangements, and review the fund's performance. Except for James C. Curvey, each of the Trustees oversees 222 funds advised by FMR or an affiliate. Mr. Curvey oversees 411 funds advised by FMR or an affiliate.
The Trustees hold office without limit in time except that (a) any Trustee may resign; (b) any Trustee may be removed by written instrument, signed by at least two-thirds of the number of Trustees prior to such removal; (c) any Trustee who requests to be retired or who has become incapacitated by illness or injury may be retired by written instrument signed by a majority of the other Trustees; and (d) any Trustee may be removed at any special meeting of shareholders by a two-thirds vote of the outstanding voting securities of the trust. Each Trustee who is not an interested person (as defined in the 1940 Act) (Independent Trustee), shall retire not later than the last day of the calendar year in which his or her 72nd birthday occurs. The Independent Trustees may waive this mandatory retirement age policy with respect to individual Trustees. The executive officers and Advisory Board Member hold office without limit in time, except that any officer and Advisory Board Member may resign or may be removed by a vote of a majority of the Trustees at any regular meeting or any special meeting of the Trustees. Except as indicated, each individual has held the office shown or other offices in the same company for the past five years.
Experience, Skills, Attributes, and Qualifications of the Fund's Trustees. The Governance and Nominating Committee has adopted a statement of policy that describes the experience, qualifications, attributes, and skills that are necessary and desirable for potential Independent Trustee candidates (Statement of Policy). The Board believes that each Trustee satisfied at the time he or she was initially elected or appointed a Trustee, and continues to satisfy, the standards contemplated by the Statement of Policy. The Governance and Nominating Committee also engages professional search firms to help identify potential Independent Trustee candidates who have the experience, qualifications, attributes, and skills consistent with the Statement of Policy. From time to time, additional criteria based on the composition and skills of the current Independent Trustees, as well as experience or skills that may be appropriate in light of future changes to board composition, business conditions, and regulatory or other developments, have also been considered by the professional search firms and the Governance and Nominating Committee. In addition, the Board takes into account the Trustees' commitment and participation in Board and committee meetings, as well as their leadership of standing and ad hoc committees throughout their tenure.
In determining that a particular Trustee was and continues to be qualified to serve as a Trustee, the Board has considered a variety of criteria, none of which, in isolation, was controlling. The Board believes that, collectively, the Trustees have balanced and diverse experience, qualifications, attributes, and skills, which allow the Board to operate effectively in governing the fund and protecting the interests of shareholders. Information about the specific experience, skills, attributes, and qualifications of each Trustee, which in each case led to the Board's conclusion that the Trustee should serve (or continue to serve) as a trustee of the fund, is provided below.
Annual Report
Trustees and Officers - continued
Board Structure and Oversight Function. Edward C. Johnson 3d is an interested person (as defined in the 1940 Act) and currently serves as Chairman. The Trustees have determined that an interested Chairman is appropriate and benefits shareholders because an interested Chairman has a personal and professional stake in the quality and continuity of services provided to the fund. Independent Trustees exercise their informed business judgment to appoint an individual of their choosing to serve as Chairman, regardless of whether the Trustee happens to be independent or a member of management. The Independent Trustees have determined that they can act independently and effectively without having an Independent Trustee serve as Chairman and that a key structural component for assuring that they are in a position to do so is for the Independent Trustees to constitute a substantial majority for the Board. The Independent Trustees also regularly meet in executive session. Ned C. Lautenbach serves as Chairman of the Independent Trustees and as such (i) acts as a liaison between the Independent Trustees and management with respect to matters important to the Independent Trustees and (ii) with management prepares agendas for Board meetings.
Fidelity funds are overseen by different Boards of Trustees. The fund's Board oversees Fidelity's equity and high income funds and another Board oversees Fidelity's investment-grade bond, money market, and asset allocation funds. The asset allocation funds may invest in Fidelity funds overseen by the fund's Board. The use of separate Boards, each with its own committee structure, allows the Trustees of each group of Fidelity funds to focus on the unique issues of the funds they oversee, including common research, investment, and operational issues. On occasion, the separate Boards establish joint committees to address issues of overlapping consequences for the Fidelity funds overseen by each Board.
The Trustees operate using a system of committees to facilitate the timely and efficient consideration of all matters of importance to the Trustees, the fund, and fund shareholders and to facilitate compliance with legal and regulatory requirements and oversight of the fund's activities and associated risks. The Board, acting through its committees, has charged FMR and its affiliates with (i) identifying events or circumstances the occurrence of which could have demonstrably adverse effects on the fund's business and/or reputation; (ii) implementing processes and controls to lessen the possibility that such events or circumstances occur or to mitigate the effects of such events or circumstances if they do occur; and (iii) creating and maintaining a system designed to evaluate continuously business and market conditions in order to facilitate the identification and implementation processes described in (i) and (ii) above. Because the day-to-day operations and activities of the fund are carried out by or through FMR, its affiliates and other service providers, the fund's exposure to risks is mitigated but not eliminated by the processes overseen by the Trustees. While each of the Board's committees has responsibility for overseeing different aspects of the fund's activities, oversight is exercised primarily through the Operations, Audit, and Compliance Committees. Appropriate personnel, including but not limited to the fund's Chief Compliance Officer (CCO), FMR's internal auditor, the independent accountants, the fund's Treasurer and portfolio management personnel, make periodic reports to the Board's committees, as appropriate. The responsibilities of each committee, including their oversight responsibilities, are described further under "Standing Committees of the Fund's Trustees."
Annual Report
The fund's Statement of Additional Information (SAI) includes more information about the Trustees. To request a free copy, call Fidelity at 1-877-208-0098.
Interested Trustees*:
Correspondence intended for each Trustee who is an interested person may be sent to Fidelity Investments, 82 Devonshire Street, Boston, Massachusetts 02109.
Name, Age; Principal Occupations and Other Relevant Experience+ |
Edward C. Johnson 3d (80) |
| Year of Election or Appointment: 1984 Mr. Johnson is Trustee and Chairman of the Board of Trustees of certain Trusts. Mr. Johnson serves as Chief Executive Officer, Chairman, and a Director of FMR LLC; Chairman and a Director of FMR; Chairman and a Director of Fidelity Research & Analysis Company (FRAC); Chairman and a Director of Fidelity Investments Money Management, Inc.; and Chairman and a Director of FMR Co., Inc. In addition, Mr. Johnson serves as Chairman and Director of FIL Limited. Previously, Mr. Johnson served as President of FMR LLC (2006-2007). |
James C. Curvey (75) |
| Year of Election or Appointment: 2007 Mr. Curvey also serves as Trustee (2007-present) of other investment companies advised by FMR. Mr. Curvey is a Director of FMR and FMR Co., Inc. (2007-present). Mr. Curvey is also Vice Chairman (2006-present) and Director of FMR LLC. In addition, Mr. Curvey serves as an Overseer for the Boston Symphony Orchestra and a member of the Trustees of Villanova University. |
* Trustees have been determined to be "Interested Trustees" by virtue of, among other things, their affiliation with the trust or various entities under common control with FMR.
+ The information above includes each Trustee's principal occupation during the last five years and other information relating to the experience, attributes, and skills relevant to each Trustee's qualifications to serve as a Trustee, which led to the conclusion that each Trustee should serve as a Trustee for the fund.
Annual Report
Trustees and Officers - continued
Independent Trustees:
Correspondence intended for each Independent Trustee (that is, the Trustees other than the Interested Trustees) may be sent to Fidelity Investments, P.O. Box 55235, Boston, Massachusetts 02205-5235.
Name, Age; Principal Occupations and Other Relevant Experience+ |
Dennis J. Dirks (62) |
| Year of Election or Appointment: 2005 Prior to his retirement in May 2003, Mr. Dirks was Chief Operating Officer and a member of the Board of The Depository Trust & Clearing Corporation (DTCC). He also served as President, Chief Operating Officer, and Board member of The Depository Trust Company (DTC) and President and Board member of the National Securities Clearing Corporation (NSCC). In addition, Mr. Dirks served as Chief Executive Officer and Board member of the Government Securities Clearing Corporation, Chief Executive Officer and Board member of the Mortgage-Backed Securities Clearing Corporation, as a Trustee and a member of the Finance Committee of Manhattan College (2005-2008), and as a Trustee and a member of the Finance Committee of AHRC of Nassau County (2006-2008). Currently, Mr. Dirks serves as a member of the Board of Directors for The Brookville Center for Children's Services, Inc. (2009-present). |
Alan J. Lacy (56) |
| Year of Election or Appointment: 2008 Mr. Lacy serves as Senior Adviser (2007-present) of Oak Hill Capital Partners, L.P. (private equity). Mr. Lacy also served as Chief Executive Officer (2000-2005) and Vice Chairman (2005-2006) of Sears Holdings Corporation and Sears, Roebuck and Co. (retail). In addition, Mr. Lacy serves as a member of the Board of Directors of The Western Union Company (global money transfer, 2006-present) and Bristol-Myers Squibb Company (global pharmaceuticals, 2007-present). Mr. Lacy is Chairman (2008-present) and a member (2006-present) of the Board of Trustees of The National Parks Conservation Association. |
Ned C. Lautenbach (66) |
| Year of Election or Appointment: 2000 Mr. Lautenbach is Chairman of the Independent Trustees of the Equity and High Income Funds (2006-present). Mr. Lautenbach is an Advisory Partner of Clayton, Dubilier & Rice, Inc. (private equity investment, 2008-present) and was previously a Partner of Clayton, Dubilier & Rice, Inc. (1998-2008). Previously, Mr. Lautenbach was with the International Business Machines Corporation (IBM) from 1968 until his retirement in 1998. Mr. Lautenbach serves as a Director of Eaton Corporation (diversified industrial) as well as the Philharmonic Center for the Arts in Naples, Florida. Mr. Lautenbach is also a member of the Board of Trustees of Fairfield University (2005-present), as well as a member of the Council on Foreign Relations. Previously, Mr. Lautenbach served as a Director of Sony Corporation (2006-2007). |
Joseph Mauriello (65) |
| Year of Election or Appointment: 2008 Prior to his retirement in January 2006, Mr. Mauriello served in numerous senior management positions including Deputy Chairman and Chief Operating Officer (2004-2005), and Vice Chairman of Financial Services (2002-2004) of KPMG LLP US (professional services, 1965-2005). Mr. Mauriello currently serves as a member of the Board of Directors of XL Capital Ltd. (global insurance and re-insurance, 2006-present) and of Arcadia Resources Inc. (health care services and products, 2007-present). Previously, Mr. Mauriello served as a Director of the Hamilton Funds of the Bank of New York (2006-2007). |
Cornelia M. Small (66) |
| Year of Election or Appointment: 2005 Ms. Small is a member of the Board of Directors of the Teagle Foundation (2009-present). Ms. Small is also a member of the Investment Committee, and Chair (2008-present) and a member of the Board of Trustees of Smith College. In addition, Ms. Small serves on the Investment Committee of the Berkshire Taconic Community Foundation (2008-present). Previously, Ms. Small served as Chairperson of the Investment Committee (2002-2008) of Smith College. In addition, Ms. Small served as Chief Investment Officer, Director of Global Equity Investments, and a member of the Board of Directors of Scudder, Stevens & Clark and Scudder Kemper Investments. |
William S. Stavropoulos (71) |
| Year of Election or Appointment: 2002 Mr. Stavropoulos is Vice Chairman of the Independent Trustees of the Equity and High Income Funds (2006-present). Mr. Stavropoulos serves as President and Founder of the Michigan Baseball Foundation, the Great Lakes Loons (2007-present). Mr. Stavropoulos is Chairman Emeritus of the Board of Directors of The Dow Chemical Company, where he previously served in numerous senior management positions, including President, CEO (1995-2000; 2002-2004), Chairman of the Executive Committee (2000-2006), and as a member of the Board of Directors (1990-2006). Currently, Mr. Stavropoulos is a Director of Teradata Corporation (data warehousing and technology solutions, 2008-present), Chemical Financial Corporation, Maersk Inc. (industrial conglomerate), Tyco International, Inc. (multinational manufacturing and services, 2007-present), and a member of the Advisory Board for Metalmark Capital (private equity investment, 2005-present). Mr. Stavropoulos is a special advisor to Clayton, Dubilier & Rice, Inc. (private equity investment). In addition, Mr. Stavropoulos is a member of the University of Notre Dame Advisory Council for the College of Science. |
David M. Thomas (61) |
| Year of Election or Appointment: 2008 Previously, Mr. Thomas served as Executive Chairman (2005-2006) and Chairman and Chief Executive Officer (2000-2005) of IMS Health, Inc. (pharmaceutical and healthcare information solutions). In addition, Mr. Thomas serves as a member of the Board of Directors of Fortune Brands, Inc. (consumer products), and Interpublic Group of Companies, Inc. (marketing communication, 2004-present). |
Michael E. Wiley (59) |
| Year of Election or Appointment: 2008 Mr. Wiley also serves as a Director of Asia Pacific Exploration Consolidated (international oil and gas exploration and production, 2008-present), and as a member of the Board of Trustees of the University of Tulsa (2000-2006; 2007-present). Mr. Wiley serves as a Director of Tesoro Corporation (independent oil refiner and marketer, 2005-present), and a Director of Bill Barrett Corporation (exploration and production, 2005-present). In addition, Mr. Wiley also serves as a Director of Post Oak Bank (privately-held bank, 2004-present). Previously, Mr. Wiley served as a Sr. Energy Advisor of Katzenbach Partners, LLC (consulting, 2006-2007), as an Advisory Director of Riverstone Holdings (private investment), Chairman, President, and CEO of Baker Hughes, Inc. (oilfield services, 2000-2004), and as Director of Spinnaker Exploration Company (exploration and production, 2001-2005). |
Annual Report
+ The information above includes each Trustee's principal occupation during the last five years and other information relating to the experience, attributes, and skills relevant to each Trustee's qualifications to serve as a Trustee, which led to the conclusion that each Trustee should serve as a Trustee for the fund.
Advisory Board Member and Executive Officers:
Correspondence intended for each executive officer and Peter S. Lynch may be sent to Fidelity Investments, 82 Devonshire Street, Boston, Massachusetts 02109.
Name, Age; Principal Occupation |
Peter S. Lynch (66) |
| Year of Election or Appointment: 2003 Member of the Advisory Board of Fidelity's Equity and High Income Funds. Mr. Lynch is Vice Chairman and a Director of FMR and FMR Co., Inc. In addition, Mr. Lynch serves as a Trustee of Boston College and as the Chairman of the Inner-City Scholarship Fund. Previously, Mr. Lynch served on the Special Olympics International Board of Directors (1997-2006). |
Kenneth B. Robins (40) |
| Year of Election or Appointment: 2008 President and Treasurer of Fidelity's Equity and High Income Funds. Mr. Robins also serves as President and Treasurer (2010-present) and Assistant Treasurer (2009-present) of other Fidelity funds and is an employee of Fidelity Investments (2004-present). Previously, Mr. Robins served as Deputy Treasurer of the Fidelity funds (2005-2008) and Treasurer and Chief Financial Officer of The North Carolina Capital Management Trust: Cash and Term Portfolios (2006-2008). |
Brian B. Hogan (45) |
| Year of Election or Appointment: 2009 Vice President of certain Equity Funds and Vice President of Sector Funds. Mr. Hogan also serves as Senior Vice President, Equity Research of FMR (2006-present) and President of FMR's Equity Division (2009-present). Previously, Mr. Hogan served as a portfolio manager. |
Thomas C. Hense (46) |
| Year of Election or Appointment: 2008 or 2010 Vice President of Fidelity's High Income (2008), Small Cap (2008), and Value (2010) Funds. Previously, Mr. Hense served as a portfolio manager for Fidelity's Institutional Money Management Group (Pyramis) (2003-2008). |
Scott C. Goebel (42) |
| Year of Election or Appointment: 2008 Secretary and Chief Legal Officer (CLO) of the Fidelity funds. Mr. Goebel also serves as General Counsel, Secretary, and Senior Vice President of FMR (2008-present) and FMR Co., Inc. (2008-present); Deputy General Counsel of FMR LLC; Chief Legal Officer of Fidelity Management & Research (Hong Kong) Limited (2008-present) and Assistant Secretary of Fidelity Management & Research (Japan) Inc. (2008-present), Fidelity Investments Money Management, Inc. (2008-present), Fidelity Management & Research (U.K.) Inc. (2008-present), and Fidelity Research and Analysis Company (2008-present). Previously, Mr. Goebel served as Assistant Secretary of the Funds (2007-2008) and as Vice President and Secretary of Fidelity Distributors Corporation (FDC) (2005-2007). |
William C. Coffey (41) |
| Year of Election or Appointment: 2009 Assistant Secretary of Fidelity's Equity and High Income Funds. Mr. Coffey also serves as Senior Vice President and Deputy General Counsel of FMR LLC (2010-present), and is an employee of Fidelity Investments. Previously, Mr. Coffey served as Vice President and Associate General Counsel of FMR LLC (2005-2009). |
Holly C. Laurent (56) |
| Year of Election or Appointment: 2008 Anti-Money Laundering (AML) Officer of the Fidelity funds. Ms. Laurent is an employee of Fidelity Investments. Previously, Ms. Laurent was Senior Vice President and Head of Legal for Fidelity Business Services India Pvt. Ltd. (2006-2008), and Senior Vice President, Deputy General Counsel and Group Head for FMR LLC (2005-2006). |
Christine Reynolds (51) |
| Year of Election or Appointment: 2008 Chief Financial Officer of the Fidelity funds. Ms. Reynolds became President of Fidelity Pricing and Cash Management Services (FPCMS) in August 2008. Ms. Reynolds served as Chief Operating Officer of FPCMS (2007-2008). Previously, Ms. Reynolds served as President, Treasurer, and Anti-Money Laundering officer of the Fidelity funds (2004-2007). |
Kenneth A. Rathgeber (63) |
| Year of Election or Appointment: 2004 Chief Compliance Officer of Fidelity's Equity and High Income Funds. Mr. Rathgeber is Chief Compliance Officer of Fidelity Management & Research (Hong Kong) Limited (2008-present), Fidelity Management & Research (Japan) Inc. (2008-present), FMR (2005-present), FMR Co., Inc. (2005-present), Fidelity Management & Research (U.K.) Inc. (2005-present), Fidelity Research & Analysis Company (2005-present), Fidelity Investments Money Management, Inc. (2005-present), Pyramis Global Advisors, LLC (2005-present), and Strategic Advisers, Inc. (2005-present). |
Jeffrey S. Christian (48) |
| Year of Election or Appointment: 2009 Deputy Treasurer of the Fidelity funds. Mr. Christian is an employee of Fidelity Investments. Previously, Mr. Christian served as Chief Financial Officer (2008-2009) of certain Fidelity funds and Senior Vice President of Fidelity Pricing and Cash Management Services (FPCMS) (2004-2009). |
Bryan A. Mehrmann (49) |
| Year of Election or Appointment: 2005 Deputy Treasurer of the Fidelity funds. Mr. Mehrmann is an employee of Fidelity Investments. |
Adrien E. Deberghes (42) |
| Year of Election or Appointment: 2008 Deputy Treasurer of Fidelity's Equity and High Income Funds. Mr. Deberghes also serves as Assistant Treasurer of other Fidelity funds (2010-present) and is an employee of Fidelity Investments (2008-present). Previously, Mr. Deberghes served as Senior Vice President of Mutual Fund Administration at State Street Corporation (2007-2008), Senior Director of Mutual Fund Administration at Investors Bank & Trust (2005-2007), and Director of Finance for Dunkin' Brands (2000-2005). |
Stephanie J. Dorsey (41) |
| Year of Election or Appointment: 2010 Assistant Treasurer of Fidelity's Equity and High Income Funds. Ms. Dorsey also serves as Deputy Treasurer of other Fidelity funds (2008- present) and is an employee of Fidelity Investments (2008-present). Previously, Ms. Dorsey served as Treasurer (2004-2008) of the JPMorgan Mutual Funds and Vice President (2004-2008) of JPMorgan Chase Bank. |
John R. Hebble (52) |
| Year of Election or Appointment: 2009 Assistant Treasurer of Fidelity's Equity and High Income Funds. Mr. Hebble also serves as Treasurer and Chief Financial Officer of The North Carolina Capital Management Trust: Cash and Term Portfolio (2008-present), President and Treasurer of other Fidelity funds (2008-present) and is an employee of Fidelity Investments. |
Gary W. Ryan (51) |
| Year of Election or Appointment: 2005 Assistant Treasurer of the Fidelity funds. Mr. Ryan is an employee of Fidelity Investments. Previously, Mr. Ryan served as Vice President of Fund Reporting in Fidelity Pricing and Cash Management Services (FPCMS) (1999-2005). |
Annual Report
Board Approval of Investment Advisory Contracts and Management Fees
Fidelity Small Cap Growth Fund
Each year, the Board of Trustees, including the Independent Trustees (together, the Board), votes on the renewal of the management contract and sub-advisory agreements (together, the Advisory Contracts) for the fund. The Board, assisted by the advice of fund counsel and Independent Trustees' counsel, requests and considers a broad range of information relevant to the renewal of the Advisory Contracts throughout the year.
The Board meets regularly and considers at each of its meetings factors that are relevant to its annual consideration of the renewal of the fund's Advisory Contracts, including the services and support provided to the fund and its shareholders. The Board has established various standing committees, each composed of Independent Trustees with varying backgrounds, to which the Board has assigned specific subject matter responsibilities in order to enhance effective decision-making by the Board. The Board, acting directly and through its Committees, requests and receives information concerning the annual consideration of the renewal of the fund's Advisory Contracts. The Board also meets as needed to consider matters specifically related to the Board's annual consideration of the renewal of Advisory Contracts. Members of the Board may also meet with trustees of other Fidelity funds through ad hoc joint committees to discuss certain matters relevant to the Fidelity funds.
At its July 2010 meeting, the Board of Trustees, including the Independent Trustees, unanimously determined to renew the fund's Advisory Contracts. In reaching its determination, the Board considered all factors it believed relevant, including (i) the nature, extent, and quality of the services to be provided to the fund and its shareholders (including the investment performance of the fund); (ii) the competitiveness of the fund's management fee and total expenses; (iii) the total costs of the services to be provided by and the profits to be realized by Fidelity from its relationship with the fund; (iv) the extent to which economies of scale would be realized as the fund grows; and (v) whether fee levels reflect these economies of scale, if any, for the benefit of fund shareholders.
In considering whether to renew the Advisory Contracts for the fund, the Board reached a determination, with the assistance of fund counsel and Independent Trustees' counsel and through the exercise of its business judgment, that the renewal of the Advisory Contracts is in the best interests of fund shareholders and that the compensation to be received by Fidelity under the management contract is fair and reasonable. The Board's decision to renew the Advisory Contracts was not based on any single factor noted above, but rather was based on a comprehensive consideration of all the information provided to the Board at its meetings throughout the year. The Board, in reaching its determination to renew the Advisory Contracts, is aware that shareholders in the fund have a broad range of investment choices available to them, including a wide choice among mutual funds offered by Fidelity's competitors, and that the fund's shareholders, with the opportunity to review and weigh the disclosure provided by the fund in its prospectus and other public disclosures, have chosen to invest in this fund, managed by Fidelity.
Annual Report
Board Approval of Investment Advisory Contracts and
Management Fees - continued
Nature, Extent, and Quality of Services Provided. The Board considered the staffing within the investment adviser, FMR, and the sub-advisers (together, the Investment Advisers), including the backgrounds of the fund's investment personnel and the fund's investment objective and discipline. The Independent Trustees also had discussions with senior management of Fidelity's investment operations and investment groups. The Board considered the structure of the portfolio manager compensation program and whether this structure provides appropriate incentives to act in the best interest of the fund.
Resources Dedicated to Investment Management and Support Services. The Board and the equity research subcommittee of the Board's Fund Oversight Committee reviewed the size, education, and experience of the Investment Advisers' investment staff, their use of technology, and the Investment Advisers' approach to recruiting, training, and retaining portfolio managers and other research, advisory, and management personnel. The Board noted that Fidelity's analysts have access to a variety of technological tools and market and securities data that enable them to perform both fundamental and quantitative analysis and to specialize in various disciplines. The Board considered Fidelity's extensive global research capabilities that enable the Investment Advisers to aggregate data from various sources in an effort to produce positive investment results. The Board also considered that Fidelity's portfolio managers and analysts have access to daily portfolio attribution that allows for monitoring of a fund's portfolio, as well as an electronic communication system that provides immediate real-time access to research concerning issuers and credit enhancers. The Board noted FMR's continued focus on strengthening the organization and discipline of equity portfolio management and research.
Shareholder and Administrative Services. The Board considered (i) the nature, extent, quality, and cost of advisory, administrative, and shareholder services performed by the Investment Advisers and their affiliates under the Advisory Contracts and under separate agreements covering transfer agency, pricing and bookkeeping, and securities lending services for the fund; (ii) the nature and extent of the investment adviser's supervision of third party service providers, principally custodians and subcustodians; and (iii) the resources devoted to, and the record of compliance with, the fund's compliance policies and procedures. The Board also reviewed the allocation of fund brokerage, including allocations to brokers affiliated with the Investment Advisers, the use of brokerage commissions to pay fund expenses, and the use of "soft" commission dollars to pay for research services.
Annual Report
The Board noted that the growth of fund assets over time across the complex allows Fidelity to reinvest in the development of services designed to enhance the value or convenience of the Fidelity funds as investment vehicles. These services include 24-hour access to account information and market information through phone representatives and over the Internet, and investor education materials and asset allocation tools.
Investment in a Large Fund Family. The Board considered the benefits to shareholders of investing in a Fidelity fund, including the benefits of investing in a fund that is part of a large family of funds offering a variety of investment disciplines and providing a large variety of mutual fund investor services. The Board noted that Fidelity had taken, or had made recommendations that resulted in the Fidelity funds taking, a number of actions over the previous year that benefited particular funds, including (i) dedicating additional resources to investment research and restructuring and broadening the focus of the investment research teams; (ii) bolstering the senior management team that oversees asset management; (iii) launching Class F of certain funds as a lower-fee class available to Freedom K and Freedom Index Funds; (iv) lowering the initial investment minimums and ongoing balance requirements for Real Estate High Income Fund; (v) eliminating subsequent purchase minimums for all funds and adding a waiver of the investment minimum requirement for new accounts opened with the proceeds of a systematic withdrawal plan; (vi) eliminating the withdrawal minimum and maximum limits for systematic withdrawals from Advisor funds; (vii) expanding sales load waivers on Class A shares for Destiny Planholders and expanding Institutional Class eligibility for Class O Destiny Planholders; and (viii) changing certain Class A and Class T sales charge structures to further align them with industry practices.
Investment Performance. The Board considered whether the fund has operated in accordance with its investment objective, as well as its record of compliance with its investment restrictions. It also reviewed the fund's absolute investment performance for each class (except Class F), as well as the fund's relative investment performance for each class (except Class F) measured over multiple periods against (i) a broad-based securities market index, and (ii) a peer group of mutual funds deemed appropriate by Fidelity and reviewed by the Board. The following charts considered by the Board show, over the one-, three-, and five-year periods ended December 31, 2009, the cumulative total returns of Institutional Class (Class I) and Class B of the fund, the cumulative total returns of a broad-based securities market index ("benchmark"), and a range of cumulative total returns of a peer group of mutual funds identified by Morningstar, Inc. as having an investment style similar to that of the fund based on underlying portfolio holdings. The returns of Institutional Class (Class I) and Class B show the performance of the highest and lowest performing classes, respectively (based on five-year performance). (Class F had less than one year of performance as of December 31, 2009.) The box within each chart shows the 25th percentile return (bottom of box) and the 75th percentile return (top of box) of the peer group. Returns shown above the box are in the first quartile and returns shown below the box are in the fourth quartile. The percentage beaten numbers noted below each chart correspond to the percentile box and represent the percentage of funds in the peer group whose performance was equal to or lower than that of the class indicated.
Annual Report
Board Approval of Investment Advisory Contracts and
Management Fees - continued
Fidelity Small Cap Growth Fund
The Board reviewed the fund's relative investment performance against its peer group and noted that the performance of Institutional Class (Class I) of the fund was in the first quartile for all the periods shown. The Board also noted that the investment performance of Institutional Class (Class I) of the fund compared favorably to its benchmark for all the periods shown. The Board considered that the variations in performance among the fund's classes reflect the variations in class expenses, which result in lower performance for higher expense classes. The Board also reviewed the fund's performance since inception as well as performance in the current year.
The Board also considered that the fund's management fee is subject to upward or downward adjustment depending upon whether, and to what extent, the fund's investment performance for the performance period exceeds, or is exceeded by, the record (over the same period) of a Board-approved performance adjustment index. The Board realizes that the performance adjustment provides FMR with a strong economic incentive to seek to achieve superior performance for the fund's shareholders and helps to more closely align the interests of FMR and the fund's shareholders.
Based on its review, and giving particular weight to the nature and quality of the resources dedicated by the Investment Advisers to maintain and improve relative performance and factoring in the unprecedented market events in recent years, the Board concluded that the nature, extent, and quality of investment management and support services and of shareholder and administrative services provided to the fund will benefit the fund's shareholders, particularly in light of the Board's view that the fund's shareholders benefit from investing in a fund that is part of a large family of funds offering a variety of investment disciplines and services.
Annual Report
Competitiveness of Management Fee and Total Fund Expenses. The Board considered the fund's management fee and total expenses compared to "mapped groups" of competitive funds and classes. Fidelity creates "mapped groups" by combining similar Lipper investment objective categories that have comparable management fee characteristics. Combining Lipper investment objective categories aids the Board's management fee and total expense comparisons by broadening the competitive group used for comparison and by reducing the number of universes to which various Fidelity funds are compared.
Management Fee. The Board considered two proprietary management fee comparisons for the 12-month periods shown in the chart below. The group of Lipper funds used by the Board for management fee comparisons is referred to below as the "Total Mapped Group." The Total Mapped Group comparison focuses on a fund's standing relative to the total universe of comparable funds available to investors, in terms of gross management fees before expense reimbursements or caps, and without giving effect to the fund's performance adjustment. "TMG %" represents the percentage of funds in the Total Mapped Group that had management fees that were lower than the fund's. For example, a TMG % of 13% means that 87% of the funds in the Total Mapped Group had higher management fees than the fund. The "Asset-Size Peer Group" (ASPG) comparison focuses on a fund's standing relative to non-Fidelity funds similar in size to the fund within the Total Mapped Group. The ASPG represents at least 15% of the funds in the Total Mapped Group with comparable asset size and management fee characteristics, subject to a minimum of 50 funds (or all funds in the Total Mapped Group if fewer than 50). Additional information, such as the ASPG quartile in which the fund's management fee ranked and the impact of the fund's performance adjustment, is also included in the chart and considered by the Board.
Annual Report
Board Approval of Investment Advisory Contracts and
Management Fees - continued
Fidelity Small Cap Growth Fund
The Board noted that the fund's management fee ranked below the median of its Total Mapped Group and below the median of its ASPG for 2009. The Board also noted the effect of the fund's positive performance adjustment on the fund's management fee ranking. The Board noted that the performance adjustment for each year represents calculations for performance periods that differ from the periods shown in the performance charts above.
Based on its review, the Board concluded that the fund's management fee is fair and reasonable in light of the services that the fund receives and the other factors considered.
Total Expenses. In its review of each class's total expenses, the Board considered the fund's management fee as well as other fund or class expenses, as applicable, such as transfer agent fees, pricing and bookkeeping fees, fund-paid 12b-1 fees, and custodial, legal, and audit fees. The Board also noted the effects of any waivers and reimbursements on fees and expenses, as well as the impact of the fund's performance adjustment. As part of its review, the Board also considered current and historical total expenses of each class of the fund compared to competitive fund median expenses. Each class of the fund is compared to those funds and classes in the Total Mapped Group (used by the Board for management fee comparisons) that have a similar sales load structure.
The Board noted that the total expenses of each of Class A, Class B, Institutional Class, the retail class, and Class F ranked below its competitive median for the period, the total expenses of Class C ranked equal to its competitive median for the period, and the total expenses of Class T ranked above its competitive median for the period. The Board considered that the total expenses for Class T were above the median primarily because its 12b-1 fee is higher than the typical front-end load class. The Board noted that the fund offers multiple classes, each of which has a different sales load and 12b-1 fee structure, and that the multiple structures are intended to offer a range of pricing options for the intermediary market. The Board also noted that the total expenses of the classes vary primarily by the level of their 12b-1 fees, although differences in transfer agent fees may also cause expenses to vary from class to class.
Annual Report
Fees Charged to Other Fidelity Clients. The Board also considered Fidelity fee structures and other information with respect to clients of FMR and its affiliates, such as other mutual funds advised or subadvised by FMR or its affiliates, pension plan clients, and other institutional clients. In March 2010, the Board created an ad hoc joint committee with the board of other Fidelity funds (the Committee) to review and compare Fidelity's institutional investment advisory business with its business of providing services to the Fidelity funds, including the differences in services provided, fees charged, and costs incurred, as well as competition in their respective marketplaces.
Based on its review of total expenses and fees charged to other Fidelity clients, the Board concluded that the total expenses of each class of the fund were reasonable, although in one case above the median of the universe presented for comparison, in light of the services that the fund and its shareholders receive and the other factors considered, including the findings of the Committee.
Costs of the Services and Profitability. The Board considered the revenues earned and the expenses incurred by Fidelity in conducting the business of developing, marketing, distributing, managing, administering and servicing the fund and its shareholders. The Board also considered the level of Fidelity's profits in respect of all the Fidelity funds.
On an annual basis, FMR presents to the Board Fidelity's profitability for the fund. Fidelity calculates the profitability for each fund, as well as aggregate profitability for groups of Fidelity funds and all Fidelity funds, using a series of detailed revenue and cost allocation methodologies which originate with the audited books and records of Fidelity. The Audit Committee of the Board reviews any significant changes from the prior year's methodologies.
PricewaterhouseCoopers LLP (PwC), independent registered public accounting firm and auditor to Fidelity and certain Fidelity funds, has been engaged annually by the Board as part of the Board's assessment of Fidelity's profitability analysis. PwC's engagement includes the review and assessment of Fidelity's methodologies used in determining the revenues and expenses attributable to Fidelity's mutual fund business, and completion of agreed-upon procedures surrounding the mathematical accuracy of fund profitability and its conformity to allocation methodologies. After considering PwC's reports issued under the engagement and information provided by Fidelity, the Board believes that while other allocation methods may also be reasonable, Fidelity's profitability methodologies are reasonable in all material respects.
Annual Report
Board Approval of Investment Advisory Contracts and
Management Fees - continued
The Board has also reviewed Fidelity's non-fund businesses and fall-out benefits related to the mutual fund business as well as cases where Fidelity's affiliates may benefit from or be related to the fund's business.
The Board considered the costs of the services provided by and the profits realized by Fidelity in connection with the operation of the fund and were satisfied that the profitability was not excessive in the circumstances.
Economies of Scale. The Board considered whether there have been economies of scale in respect of the management of the Fidelity funds, whether the Fidelity funds (including the fund) have appropriately benefited from any such economies of scale, and whether there is potential for realization of any further economies of scale. The Board considered the extent to which the fund will benefit from economies of scale through increased services to the fund, through waivers or reimbursements, or through fee or expense reductions.
In February 2009, the Board and the board of other Fidelity funds created an ad hoc committee (the Economies of Scale Committee) to analyze whether FMR attains economies of scale in respect of the management and servicing of the Fidelity funds, whether the Fidelity funds have appropriately benefited from such economies of scale, and whether there is potential for realization of any further economies of scale.
The Board recognized that the fund's management contract incorporates a "group fee" structure, which provides for lower group fee rates as total fund assets under FMR's management increase, and for higher group fee rates as total fund assets under FMR's management decrease. FMR calculates the group fee rates based on a tiered asset "breakpoint" schedule that varies based on asset class. The Board considered that the group fee is designed to deliver the benefits of economies of scale to fund shareholders when total Fidelity fund assets increase, even if assets of any particular fund are unchanged or have declined, because some portion of Fidelity's costs are attributable to services provided to all Fidelity funds, and all funds benefit if those costs can be allocated among more assets. The Board concluded that, given the group fee structure, fund shareholders will benefit from lower management fees as assets under FMR's management increase at the fund complex level, regardless of whether Fidelity achieves any such economies of scale.
The Board concluded, considering the findings of the Economies of Scale Committee, that any potential economies of scale are being appropriately shared between fund shareholders and Fidelity.
Annual Report
Additional Information Requested by the Board. In order to develop fully the factual basis for consideration of the Fidelity funds' Advisory Contracts, the Board requested and received additional information on certain topics, including (i) fund performance trends, actions to be taken by FMR to improve certain funds' overall performance, and Fidelity's long-term strategies for certain funds; (ii) portfolio manager changes that have occurred during the past year and length of portfolio manager tenure for different categories of funds over time; (iii) Fidelity's compensation structure for portfolio managers, research analysts, and other key personnel, the rationale for the compensation structure, and how the compensation structure provides appropriate performance incentives; (iv) the amount of the investment that each portfolio manager has made in the Fidelity fund(s) that he or she manages; (v) management and other fees paid by FMR to affiliated sub-advisers on behalf of the Fidelity funds; (vi) Fidelity's fee structures and rationale for recommending different fees among different categories of funds; (vii) Fidelity's rationale for recommending which funds should have a performance adjustment component as part of their management fees; (viii) the rationale for any differences between fund fee structures and fee structures in place for other Fidelity clients; and (ix) explanations regarding the relative total expenses borne by certain funds and classes, total expense competitive trends, and actions that might be taken by FMR to reduce total expenses for certain funds and classes.
Based on its evaluation of all of the conclusions noted above, and after considering all factors it believed relevant, the Board ultimately concluded that the advisory fee structures are fair and reasonable, and that the fund's Advisory Contracts should be renewed.
Annual Report
Investment Adviser
Fidelity Management & Research Company
Boston, MA
Investment Sub-Advisers
FMR Co., Inc.
Fidelity Management & Research
(U.K.) Inc.
Fidelity Research & Analysis Company
Fidelity Management & Research
(Hong Kong) Limited
Fidelity Management & Research
(Japan) Inc.
General Distributor
Fidelity Distributors Corporation
Boston, MA
Transfer and Service Agents
Fidelity Investments Institutional
Operations Company, Inc.
Boston, MA
Fidelity Service Company, Inc.
Boston, MA
Custodian
Citibank, N.A.
New York, NY
ASCP-UANN-0910
1.803713.105
(Fidelity Investment logo)(registered trademark)
Fidelity Advisor
Small Cap Growth
Fund - Institutional Class
Annual Report
July 31, 2010
(2_fidelity_logos) (Registered_Trademark)
Institutional Class
is a class of Fidelity®
Small Cap Growth
Fund
Contents
Chairman's Message | <Click Here> | The Chairman's message to shareholders. |
Performance | <Click Here> | How the fund has done over time. |
Management's Discussion of Fund Performance | <Click Here> | The Portfolio Manager's review of fund performance and strategy. |
Shareholder Expense Example | <Click Here> | An example of shareholder expenses. |
Investment Changes | <Click Here> | A summary of major shifts in the fund's investments over the past six months. |
Investments | <Click Here> | A complete list of the fund's investments with their market values. |
Financial Statements | <Click Here> | Statements of assets and liabilities, operations, and changes in net assets,
as well as financial highlights. |
Notes | <Click Here> | Notes to the financial statements. |
Report of Independent Registered Public Accounting Firm | <Click Here> | |
Trustees and Officers | <Click Here> | |
Board Approval of Investment Advisory Contracts and Management Fees | <Click Here> | |
To view a fund's proxy voting guidelines and proxy voting record for the 12-month period ended June 30, visit http://www.fidelity.com/proxyvotingresults or visit the Securities and Exchange Commission's (SEC) web site at http://www.sec.gov. You may also call 1-877-208-0098 to request a free copy of the proxy voting guidelines.
Standard & Poor's, S&P and S&P 500 are registered service marks of The McGraw-Hill Companies, Inc. and have been licensed for use by Fidelity Distributors Corporation.
Other third party marks appearing herein are the property of their respective owners.
All other marks appearing herein are registered or unregistered trademarks or service marks of FMR LLC or an affiliated company.
Annual Report
This report and the financial statements contained herein are submitted for the general information of the shareholders of the fund. This report is not authorized for distribution to prospective investors in the fund unless preceded or accompanied by an effective prospectus.
A fund files its complete schedule of portfolio holdings with the SEC for the first and third quarters of each fiscal year on Form N-Q. Forms N-Q are available on the SEC's web site at http://www.sec.gov. A fund's Forms N-Q may be reviewed and copied at the SEC's Public Reference Room in Washington, DC. Information regarding the operation of the SEC's Public Reference Room may be obtained by calling 1-800-SEC-0330. For a complete list of a fund's portfolio holdings, view the most recent holdings listing, semiannual report, or annual report on Fidelity's web site at http://www.fidelity.com or http://www.advisor.fidelity.com, as applicable.
NOT FDIC INSURED • MAY LOSE VALUE • NO BANK GUARANTEE
Neither the fund nor Fidelity Distributors Corporation is a bank.
Annual Report
(photo_of_Edward_C_Johnson_3d)
Dear Shareholder:
A yearlong uptrend in global equity markets reversed course in late April 2010 when investor sentiment turned bearish due in great measure to concern that Europe's debt crisis would expand and slow or derail economic recovery. However, a bounceback in July helped to recover some of the ground that was lost. Financial markets are always unpredictable, of course, but there also are several time-tested investment principles that can help put the odds in your favor.
One of the basic tenets is to invest for the long term. Over time, riding out the markets' inevitable ups and downs has proven much more effective than selling into panic or chasing the hottest trend. Even missing only a few of the markets' best days can significantly diminish investor returns. Patience also affords the benefits of compounding - of earning interest on additional income or reinvested dividends and capital gains. There can be tax advantages and cost benefits to consider as well. While staying the course doesn't eliminate risk, it can considerably lessen the effect of short-term declines.
You can further manage your investing risk through diversification. And today, more than ever, geographic diversification should be taken into account. Studies indicate that asset allocation is the single most important determinant of a portfolio's long-term success. The right mix of stocks, bonds and cash - aligned to your particular risk tolerance and investment objective - is very important. Age-appropriate rebalancing is also an essential aspect of asset allocation. For younger investors, an emphasis on equities - which historically have been the best-performing asset class over time - is encouraged. As investors near their specific goal, such as retirement or sending a child to college, consideration may be given to replacing volatile assets (e.g. common stocks) with more-stable fixed investments (bonds or savings plans).
A third principle - investing regularly - can help lower the average cost of your purchases. Investing a certain amount of money each month or quarter helps ensure you won't pay for all your shares at market highs. This strategy - known as dollar cost averaging - also reduces "emotion" from investing, helping shareholders avoid selling weak performers just prior to an upswing, or chasing a hot performer just before a correction.
We invite you to contact us via the Internet, through our Investor Centers or by phone. It is our privilege to provide you the information you need to make the investments that are right for you.
Sincerely,
(The chairman's signature appears here.)
Edward C. Johnson 3d
Annual Report
Average annual total return reflects the change in the value of an investment, assuming reinvestment of the class' distributions from dividend income and capital gains (the profits earned upon the sale of securities that have grown in value, if any) and assuming a constant rate of performance each year. The $10,000 table and the fund's returns do not reflect the deduction of taxes that a shareholder would pay on fund distributions or the redemption of fund shares. During periods of reimbursement by Fidelity, a fund's total return will be greater than it would be had the reimbursement not occurred. How a fund did yesterday is no guarantee of how it will do tomorrow.
Average Annual Total Returns
Periods ended July 31, 2010 | Past 1
year | Past 5
years | Life of
fund A |
Institutional Class | 17.60% | 1.57% | 6.06% |
A From November 3, 2004.
$10,000 Over Life of Fund
Let's say hypothetically that $10,000 was invested in Fidelity Advisor Small Cap Growth Fund - Institutional Class on November 3, 2004, when the fund started. The chart shows how the value of your investment would have changed, and also shows how the Russell 2000® Growth Index performed over the same period.
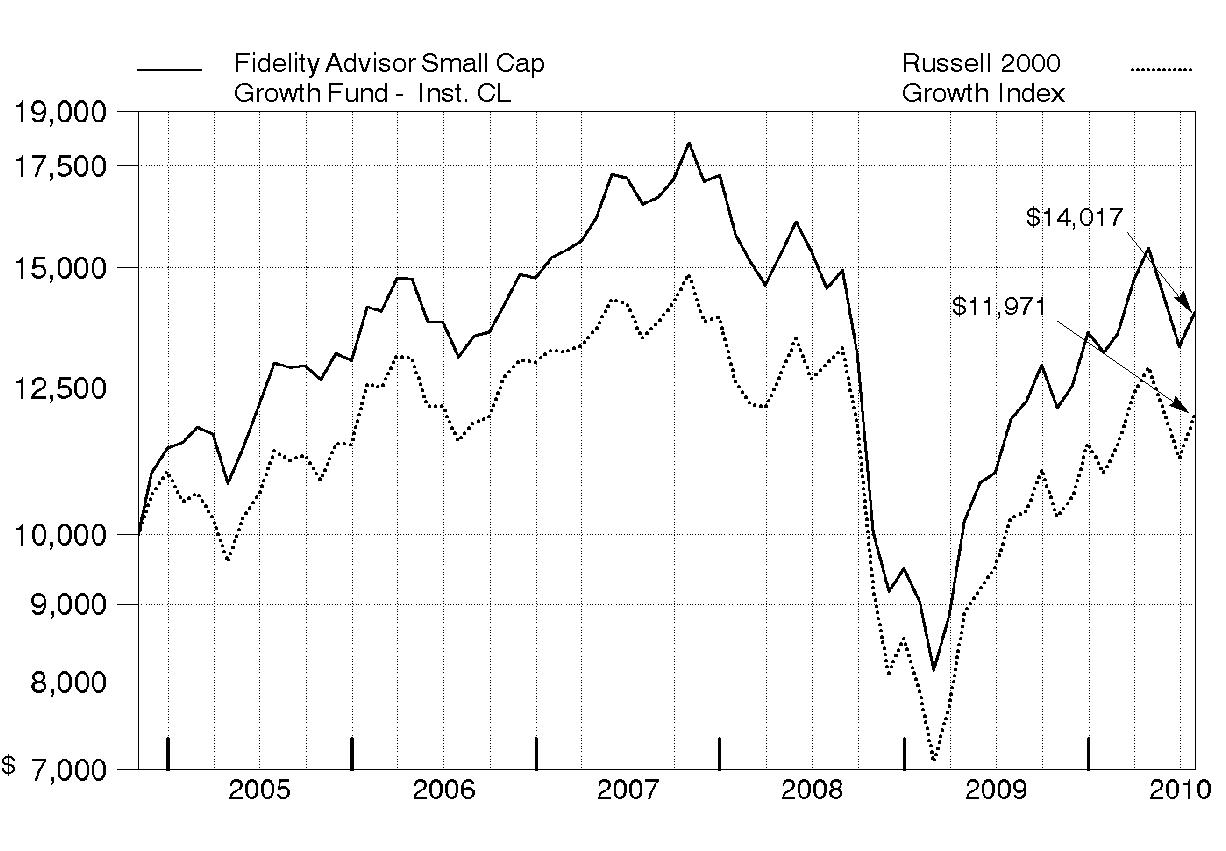
Annual Report
Market Recap: U.S. stock markets saw double-digit gains for the year ending July 31, 2010, despite the return of market volatility and risk aversion during the first half of 2010. An impressive bull run continued through 2009, bolstered by improvement in the economy and credit markets. Early in the new year, however, stocks fell sharply amid concerns about the global economic recovery, fueled by European debt woes and China's efforts to restrain inflation. After this brief dip, markets regained their upward momentum, as government stimulus and significant corporate cost cutting led to encouraging earnings reports, improved credit conditions and rising consumer confidence. Positive news continued through mid-April, when the Dow Jones Industrial AverageSM pushed above the 11,000 mark for the first time in 19 months. That milestone was short-lived, however, as heightened concern about the European debt crisis sparked an abrupt sell-off in May, leading to the first official correction since the rally began in March 2009. Although the market's malaise continued through June, stocks saw solid gains in July. For the year, the Dow rose 17.28%, while the S&P 500® Index was up 13.84%. Elsewhere, the technology-laden Nasdaq Composite® Index returned 14.99%. Small- and mid-cap stocks performed best, as measured by the 18.43% increase of the Russell 2000® Index and the 23.21% gain of the Russell Midcap® Index.
Comments from Lionel Harris, Portfolio Manager of Fidelity Advisor Small Cap Growth Fund: For the 12 months ending July 31, 2010, the fund's Institutional Class shares rose 17.60%, compared with 16.71% for the Russell 2000 Growth Index. Stock selection was a big plus overall, especially in the industrials and consumer discretionary sectors. Within information technology, the fund saw success from its hardware/equipment positions, though several software/services names lagged - most notably, network communications systems company TeleCommunication Systems and Internet banking and billing services provider Online Resources. Favorable sector allocation helped, especially overweighting industrials and underweighting the weak-performing pharmaceuticals industry. Having a smaller relative weighting in the consumer discretionary sector, however, took away some of this positive impact. A stronger dollar overall hampered the performance of the fund's foreign stocks. The fund's top individual contributor was Commercial Vehicle Group, which makes parts for the cabs of large trucks. As optimism about the economy and, with it, the trucking industry grew, Commercial Vehicle's share price rose off an extremely low level. Brookdale Senior Living, an operator of assisted-living and retirement communities, also did well, as did hotel and timeshare property owner Wyndham Worldwide.
The views expressed above reflect those of the portfolio manager(s) only through the end of the period as stated on the cover of this report and do not necessarily represent the views of Fidelity or any other person in the Fidelity organization. Any such views are subject to change at any time based upon market or other conditions and Fidelity disclaims any responsibility to update such views. These views may not be relied on as investment advice and, because investment decisions for a Fidelity fund are based on numerous factors, may not be relied on as an indication of trading intent on behalf of any Fidelity fund.
Annual Report
Shareholder Expense Example
As a shareholder of the Fund, you incur two types of costs: (1) transaction costs, including sales charges (loads) on purchase payments or redemption proceeds, redemption fees, and (2) ongoing costs, including management fees, distribution and/or service (12b-1) fees and other Fund expenses. This Example is intended to help you understand your ongoing costs (in dollars) of investing in the Fund and to compare these costs with the ongoing costs of investing in other mutual funds.
The Example is based on an investment of $1,000 invested at the beginning of the period and held for the entire period (February 1, 2010 to July 31, 2010).
Actual Expenses
The first line of the accompanying table for each class of the Fund provides information about actual account values and actual expenses. You may use the information in this line, together with the amount you invested, to estimate the expenses that you paid over the period. Simply divide your account value by $1,000.00 (for example, an $8,600 account value divided by $1,000.00 = 8.6), then multiply the result by the number in the first line for a class of the Fund under the heading entitled "Expenses Paid During Period" to estimate the expenses you paid on your account during this period. A small balance maintenance fee of $12.00 that is charged once a year may apply for certain accounts with a value of less than $2,000. This fee is not included in the table below. If it was, the estimate of expenses you paid during the period would be higher, and your ending account value lower, by this amount. In addition, the Fund, as a shareholder in the underlying Fidelity Central Funds, will indirectly bear its pro-rata share of the fees and expenses incurred by the underlying Fidelity Central Funds. These fees and expenses are not included in the Fund's annualized expense ratio used to calculate the expense estimate in the table below.
Hypothetical Example for Comparison Purposes
The second line of the accompanying table for each class of the Fund provides information about hypothetical account values and hypothetical expenses based on a Class' actual expense ratio and an assumed rate of return of 5% per year before expenses, which is not the Class' actual return. The hypothetical account values and expenses may not be used to estimate the actual ending account balance or expenses you paid for the period. You may use this information to compare the ongoing costs of investing in the Fund and other funds. To do so, compare this 5% hypothetical example with the 5% hypothetical examples that appear in the shareholder reports of the other funds. A small balance maintenance fee of $12.00 that is charged once a year may apply for certain accounts with a value of less than $2,000. This fee is not included in the table below. If it was, the estimate of expenses you paid during the period would be higher, and your ending account value lower, by this amount. In addition, the Fund, as a shareholder in the underlying Fidelity Central Funds, will indirectly bear its pro-rata share of the fees and expenses incurred by the underlying Fidelity Central Funds. These fees and expenses are not included in the Fund's annualized expense ratio used to calculate the expense estimate in the table below.
Please note that the expenses shown in the table are meant to highlight your ongoing costs only and do not reflect any transaction costs. Therefore, the second line of the table is useful in comparing ongoing costs only, and will not help you determine the relative total costs of owning different funds. In addition, if these transactional costs were included, your costs would have been higher.
Annual Report
| Annualized Expense Ratio | Beginning
Account Value
February 1, 2010 | Ending
Account Value
July 31, 2010 | Expenses Paid
During Period*
February 1, 2010
to July 31, 2010 |
Class A | 1.31% | | | |
Actual | | $ 1,000.00 | $ 1,062.10 | $ 6.70 |
HypotheticalA | | $ 1,000.00 | $ 1,018.30 | $ 6.56 |
Class T | 1.57% | | | |
Actual | | $ 1,000.00 | $ 1,060.80 | $ 8.02 |
HypotheticalA | | $ 1,000.00 | $ 1,017.01 | $ 7.85 |
Class B | 2.07% | | | |
Actual | | $ 1,000.00 | $ 1,057.60 | $ 10.56 |
HypotheticalA | | $ 1,000.00 | $ 1,014.53 | $ 10.34 |
Class C | 2.07% | | | |
Actual | | $ 1,000.00 | $ 1,057.70 | $ 10.56 |
HypotheticalA | | $ 1,000.00 | $ 1,014.53 | $ 10.34 |
Small Cap Growth | 1.03% | | | |
Actual | | $ 1,000.00 | $ 1,064.00 | $ 5.27 |
HypotheticalA | | $ 1,000.00 | $ 1,019.69 | $ 5.16 |
Class F | .78% | | | |
Actual | | $ 1,000.00 | $ 1,064.60 | $ 3.99 |
HypotheticalA | | $ 1,000.00 | $ 1,020.93 | $ 3.91 |
Institutional Class | .99% | | | |
Actual | | $ 1,000.00 | $ 1,063.80 | $ 5.07 |
HypotheticalA | | $ 1,000.00 | $ 1,019.89 | $ 4.96 |
A 5% return per year before expenses
* Expenses are equal to each Class' annualized expense ratio, multiplied by the average account value over the period, multiplied by 181/365 (to reflect the one-half year period).
Annual Report
Investment Changes (Unaudited)
Top Ten Stocks as of July 31, 2010 |
| % of fund's
net assets | % of fund's net assets
6 months ago |
NETGEAR, Inc. | 1.1 | 0.0 |
Zumtobel AG | 1.1 | 0.0 |
Adtran, Inc. | 1.1 | 0.8 |
Wyndham Worldwide Corp. | 1.1 | 0.7 |
Plantronics, Inc. | 1.1 | 1.2 |
Riverbed Technology, Inc. | 1.1 | 1.4 |
Triumph Group, Inc. | 1.1 | 0.0 |
Polycom, Inc. | 1.1 | 0.6 |
Super Micro Computer, Inc. | 1.1 | 1.0 |
Armstrong World Industries, Inc. | 1.0 | 0.7 |
| 10.9 | |
Top Five Market Sectors as of July 31, 2010 |
| % of fund's
net assets | % of fund's net assets
6 months ago |
Information Technology | 27.1 | 23.0 |
Health Care | 20.6 | 23.3 |
Industrials | 18.5 | 18.7 |
Consumer Discretionary | 17.8 | 14.9 |
Financials | 4.0 | 3.5 |
Asset Allocation (% of fund's net assets) |
As of July 31, 2010* | As of January 31, 2010** |
| Stocks 95.2% | | | Stocks 93.5% | |
| Short-Term
Investments and
Net Other Assets 4.8% | | | Short-Term
Investments and
Net Other Assets 6.5% | |
* Foreign investments | 16.2% | | ** Foreign investments | 15.1% | |

Annual Report
Investments July 31, 2010
Showing Percentage of Net Assets
Common Stocks - 95.2% |
| Shares | | Value |
CONSUMER DISCRETIONARY - 17.8% |
Auto Components - 1.4% |
ElringKlinger AG | 285,000 | | $ 7,661,254 |
Modine Manufacturing Co. (a) | 1,254,000 | | 12,728,100 |
| | 20,389,354 |
Distributors - 0.7% |
Delticom AG | 181,910 | | 9,280,982 |
Diversified Consumer Services - 0.7% |
Steiner Leisure Ltd. (a) | 248,000 | | 10,542,480 |
Hotels, Restaurants & Leisure - 3.7% |
Aristocrat Leisure Ltd. | 2,735,000 | | 8,389,453 |
BJ's Restaurants, Inc. (a) | 320,000 | | 8,160,000 |
Life Time Fitness, Inc. (a)(d) | 203,000 | | 7,381,080 |
Toridoll Corp. (d) | 3,250 | | 5,949,089 |
WMS Industries, Inc. (a) | 194,750 | | 7,499,823 |
Wyndham Worldwide Corp. | 622,000 | | 15,879,660 |
| | 53,259,105 |
Household Durables - 2.8% |
Dorel Industries, Inc. Class B (sub. vtg.) | 321,550 | | 10,876,301 |
Harman International Industries, Inc. (a) | 350,000 | | 10,643,500 |
Hooker Furniture Corp. | 510,101 | | 6,029,394 |
Tempur-Pedic International, Inc. (a) | 399,000 | | 12,237,330 |
| | 39,786,525 |
Multiline Retail - 0.7% |
Dollarama, Inc. | 415,000 | | 10,359,356 |
Specialty Retail - 4.9% |
Casual Male Retail Group, Inc. (a) | 1,749,978 | | 6,054,924 |
Citi Trends, Inc. (a) | 300,000 | | 9,417,000 |
DSW, Inc. Class A (a)(d) | 425,000 | | 11,309,250 |
hhgregg, Inc. (a)(d) | 490,000 | | 9,942,100 |
Jos. A. Bank Clothiers, Inc. (a)(d) | 125,000 | | 7,335,000 |
Sally Beauty Holdings, Inc. (a) | 901,000 | | 8,523,460 |
Shoe Carnival, Inc. (a) | 458,881 | | 9,659,445 |
Signet Jewelers Ltd. (a) | 288,400 | | 8,585,668 |
| | 70,826,847 |
Textiles, Apparel & Luxury Goods - 2.9% |
Fossil, Inc. (a) | 350,000 | | 13,860,000 |
G-III Apparel Group Ltd. (a) | 390,300 | | 10,069,740 |
Common Stocks - continued |
| Shares | | Value |
CONSUMER DISCRETIONARY - continued |
Textiles, Apparel & Luxury Goods - continued |
Phillips-Van Heusen Corp. | 182,000 | | $ 9,443,980 |
Ted Baker PLC | 907,621 | | 7,594,441 |
| | 40,968,161 |
TOTAL CONSUMER DISCRETIONARY | | 255,412,810 |
CONSUMER STAPLES - 3.0% |
Food & Staples Retailing - 0.4% |
Susser Holdings Corp. (a) | 548,452 | | 6,586,909 |
Food Products - 1.7% |
Calavo Growers, Inc. (d) | 599,046 | | 12,651,852 |
Smithfield Foods, Inc. (a) | 790,000 | | 11,257,500 |
| | 23,909,352 |
Personal Products - 0.9% |
Inter Parfums, Inc. | 737,000 | | 12,860,650 |
TOTAL CONSUMER STAPLES | | 43,356,911 |
ENERGY - 2.4% |
Energy Equipment & Services - 1.6% |
Newpark Resources, Inc. (a) | 1,525,000 | | 12,184,750 |
T-3 Energy Services, Inc. (a) | 445,000 | | 11,285,200 |
| | 23,469,950 |
Oil, Gas & Consumable Fuels - 0.8% |
EXCO Resources, Inc. | 771,400 | | 11,193,014 |
TOTAL ENERGY | | 34,662,964 |
FINANCIALS - 4.0% |
Capital Markets - 0.9% |
Fifth Street Finance Corp. (d) | 465,000 | | 5,049,900 |
optionsXpress Holdings, Inc. (a) | 469,200 | | 7,319,520 |
| | 12,369,420 |
Commercial Banks - 1.7% |
CapitalSource, Inc. | 1,295,000 | | 6,967,100 |
FirstMerit Corp. | 463,000 | | 9,125,730 |
Huntington Bancshares, Inc. | 1,496,100 | | 9,066,366 |
| | 25,159,196 |
Common Stocks - continued |
| Shares | | Value |
FINANCIALS - continued |
Real Estate Investment Trusts - 0.7% |
CBL & Associates Properties, Inc. | 680,200 | | $ 9,570,414 |
Thrifts & Mortgage Finance - 0.7% |
First Niagara Financial Group, Inc. | 765,000 | | 10,258,650 |
TOTAL FINANCIALS | | 57,357,680 |
HEALTH CARE - 20.6% |
Biotechnology - 1.8% |
Allos Therapeutics, Inc. (a) | 875,000 | | 4,217,500 |
PDL BioPharma, Inc. | 1,860,000 | | 11,569,200 |
Theravance, Inc. (a)(d) | 409,000 | | 6,057,290 |
ZIOPHARM Oncology, Inc. (a)(d) | 860,000 | | 3,216,400 |
| | 25,060,390 |
Health Care Equipment & Supplies - 4.1% |
AGA Medical Holdings, Inc. | 310,583 | | 4,500,348 |
American Medical Systems Holdings, Inc. (a) | 500,000 | | 11,180,000 |
Integra LifeSciences Holdings Corp. (a) | 337,400 | | 12,190,262 |
Natus Medical, Inc. (a) | 548,000 | | 8,044,640 |
Orthofix International NV (a) | 200,000 | | 6,056,000 |
STRATEC Biomedical Systems AG | 175,000 | | 6,548,356 |
Wright Medical Group, Inc. (a) | 670,000 | | 10,458,700 |
| | 58,978,306 |
Health Care Providers & Services - 8.0% |
Amedisys, Inc. (a)(d) | 247,400 | | 6,499,198 |
Catalyst Health Solutions, Inc. (a) | 370,000 | | 12,794,600 |
Centene Corp. (a) | 395,000 | | 8,417,450 |
Emergency Medical Services Corp. Class A (a) | 273,000 | | 12,214,020 |
Hanger Orthopedic Group, Inc. (a) | 651,900 | | 11,180,085 |
HealthSouth Corp. (a) | 570,000 | | 10,550,700 |
LHC Group, Inc. (a) | 342,400 | | 7,871,776 |
Providence Service Corp. (a) | 393,800 | | 5,670,720 |
PSS World Medical, Inc. (a)(d) | 664,499 | | 12,505,871 |
RehabCare Group, Inc. (a) | 483,000 | | 10,234,770 |
Synergy Health PLC | 780,411 | | 8,170,177 |
Team Health Holdings, Inc. | 699,000 | | 9,163,890 |
| | 115,273,257 |
Common Stocks - continued |
| Shares | | Value |
HEALTH CARE - continued |
Health Care Technology - 1.7% |
Computer Programs & Systems, Inc. (d) | 305,800 | | $ 13,751,826 |
MedAssets, Inc. (a) | 423,000 | | 9,902,430 |
| | 23,654,256 |
Life Sciences Tools & Services - 3.5% |
Bruker BioSciences Corp. (a) | 965,000 | | 12,709,050 |
ICON PLC sponsored ADR (a) | 560,000 | | 13,216,000 |
PerkinElmer, Inc. | 745,000 | | 14,497,700 |
QIAGEN NV (a) | 551,000 | | 10,314,720 |
| | 50,737,470 |
Pharmaceuticals - 1.5% |
Ardea Biosciences, Inc. (a)(d) | 209,263 | | 4,174,797 |
Auxilium Pharmaceuticals, Inc. (a)(d) | 148,935 | | 3,359,974 |
Cadence Pharmaceuticals, Inc. (a)(d) | 645,000 | | 4,940,700 |
Hikma Pharmaceuticals PLC | 785,000 | | 8,815,349 |
| | 21,290,820 |
TOTAL HEALTH CARE | | 294,994,499 |
INDUSTRIALS - 18.5% |
Aerospace & Defense - 3.5% |
Esterline Technologies Corp. (a) | 220,000 | | 11,292,600 |
Spirit AeroSystems Holdings, Inc. Class A (a) | 651,400 | | 13,255,990 |
Teledyne Technologies, Inc. (a) | 257,000 | | 10,544,710 |
Triumph Group, Inc. | 199,000 | | 15,104,100 |
| | 50,197,400 |
Building Products - 1.0% |
Armstrong World Industries, Inc. (a)(d) | 406,000 | | 14,843,360 |
Commercial Services & Supplies - 3.4% |
Prosegur Compania de Seguridad SA (Reg.) | 273,000 | | 13,424,883 |
Schawk, Inc. Class A | 600,000 | | 8,898,000 |
The Geo Group, Inc. (a) | 653,000 | | 14,091,740 |
Waste Connections, Inc. (a) | 310,000 | | 11,832,700 |
| | 48,247,323 |
Construction & Engineering - 2.6% |
Foster Wheeler AG (a) | 490,000 | | 11,279,800 |
Granite Construction, Inc. | 392,000 | | 9,114,000 |
KBR, Inc. | 450,000 | | 10,071,000 |
Orion Marine Group, Inc. (a) | 570,000 | | 7,079,400 |
| | 37,544,200 |
Common Stocks - continued |
| Shares | | Value |
INDUSTRIALS - continued |
Electrical Equipment - 2.8% |
Acuity Brands, Inc. | 257,100 | | $ 10,831,623 |
Regal-Beloit Corp. | 208,000 | | 12,652,640 |
Zumtobel AG | 852,783 | | 16,155,285 |
| | 39,639,548 |
Machinery - 1.8% |
Blount International, Inc. (a) | 640,000 | | 6,816,000 |
Commercial Vehicle Group, Inc. (a) | 1,064,273 | | 11,973,071 |
OSG Corp. | 600,000 | | 6,630,026 |
| | 25,419,097 |
Professional Services - 0.5% |
Diamond Management & Technology Consultants, Inc. | 725,000 | | 7,866,250 |
Road & Rail - 0.6% |
Contrans Group, Inc. Class A | 985,000 | | 8,576,049 |
Trading Companies & Distributors - 2.3% |
Beacon Roofing Supply, Inc. (a) | 569,000 | | 9,707,140 |
Interline Brands, Inc. (a) | 550,000 | | 9,949,500 |
Rush Enterprises, Inc. Class A (a) | 948,254 | | 14,166,915 |
| | 33,823,555 |
TOTAL INDUSTRIALS | | 266,156,782 |
INFORMATION TECHNOLOGY - 27.1% |
Communications Equipment - 5.9% |
Adtran, Inc. | 510,200 | | 16,112,116 |
CommScope, Inc. (a) | 287,200 | | 5,841,648 |
NETGEAR, Inc. (a) | 681,392 | | 16,353,406 |
Plantronics, Inc. | 520,000 | | 15,584,400 |
Polycom, Inc. (a) | 505,000 | | 14,988,400 |
Riverbed Technology, Inc. (a) | 415,000 | | 15,392,350 |
| | 84,272,320 |
Computers & Peripherals - 2.7% |
Super Micro Computer, Inc. (a) | 1,030,000 | | 14,873,200 |
Synaptics, Inc. (a)(d) | 370,000 | | 11,581,000 |
Wincor Nixdorf AG | 212,400 | | 11,988,190 |
| | 38,442,390 |
Electronic Equipment & Components - 2.6% |
Avnet, Inc. (a) | 494,000 | | 12,424,100 |
Common Stocks - continued |
| Shares | | Value |
INFORMATION TECHNOLOGY - continued |
Electronic Equipment & Components - continued |
Insight Enterprises, Inc. (a) | 815,000 | | $ 11,874,550 |
SYNNEX Corp. (a) | 472,800 | | 12,477,192 |
| | 36,775,842 |
Internet Software & Services - 5.1% |
Art Technology Group, Inc. (a) | 1,785,652 | | 6,428,347 |
j2 Global Communications, Inc. (a) | 607,500 | | 14,294,475 |
Monster Worldwide, Inc. (a)(d) | 675,880 | | 9,273,074 |
Perficient, Inc. (a)(e) | 1,548,502 | | 13,394,542 |
Rackspace Hosting, Inc. (a)(d) | 633,000 | | 11,837,100 |
Sohu.com, Inc. (a)(d) | 174,000 | | 8,181,480 |
TelecityGroup PLC (a) | 1,416,600 | | 9,620,374 |
| | 73,029,392 |
IT Services - 3.3% |
Datacash Group PLC | 2,736,200 | | 10,514,067 |
Heartland Payment Systems, Inc. | 634,000 | | 10,004,520 |
Online Resources Corp. (a)(e) | 1,897,060 | | 7,777,946 |
WNS Holdings Ltd. sponsored ADR (a) | 574,657 | | 5,148,927 |
Wright Express Corp. (a) | 382,000 | | 13,366,180 |
| | 46,811,640 |
Semiconductors & Semiconductor Equipment - 2.9% |
Hittite Microwave Corp. (a) | 148,821 | | 6,839,813 |
Microsemi Corp. (a) | 847,000 | | 13,518,120 |
Roth & Rau AG (a) | 357,200 | | 11,825,138 |
Standard Microsystems Corp. (a) | 458,000 | | 10,085,160 |
| | 42,268,231 |
Software - 4.6% |
Blackbaud, Inc. | 446,059 | | 10,567,138 |
Informatica Corp. (a) | 381,000 | | 11,479,530 |
Radiant Systems, Inc. (a) | 895,000 | | 12,717,950 |
Solera Holdings, Inc. | 342,000 | | 12,989,160 |
Taleo Corp. Class A (a) | 481,039 | | 11,833,559 |
TeleCommunication Systems, Inc. Class A (a) | 2,000,000 | | 7,180,000 |
| | 66,767,337 |
TOTAL INFORMATION TECHNOLOGY | | 388,367,152 |
MATERIALS - 1.3% |
Chemicals - 0.6% |
Solutia, Inc. (a) | 647,000 | | 9,129,170 |
Common Stocks - continued |
| Shares | | Value |
MATERIALS - continued |
Metals & Mining - 0.7% |
Commercial Metals Co. | 635,100 | | $ 9,139,089 |
TOTAL MATERIALS | | 18,268,259 |
TELECOMMUNICATION SERVICES - 0.5% |
Diversified Telecommunication Services - 0.5% |
Premiere Global Services, Inc. (a) | 1,172,000 | | 7,336,720 |
TOTAL COMMON STOCKS (Cost $1,290,877,469) | 1,365,913,777 |
Money Market Funds - 9.5% |
| | | |
Fidelity Cash Central Fund, 0.24% (b) | 69,466,459 | | 69,466,459 |
Fidelity Securities Lending Cash Central Fund, 0.27% (b)(c) | 67,877,077 | | 67,877,077 |
TOTAL MONEY MARKET FUNDS (Cost $137,343,536) | 137,343,536 |
TOTAL INVESTMENT PORTFOLIO - 104.7% (Cost $1,428,221,005) | | 1,503,257,313 |
NET OTHER ASSETS (LIABILITIES) - (4.7)% | | (68,064,626) |
NET ASSETS - 100% | $ 1,435,192,687 |
Legend |
(a) Non-income producing |
(b) Affiliated fund that is available only to investment companies and other accounts managed by Fidelity Investments. The rate quoted is the annualized seven-day yield of the fund at period end. A complete unaudited listing of the fund's holdings as of its most recent quarter end is available upon request. |
(c) Investment made with cash collateral received from securities on loan. |
(d) Security or a portion of the security is on loan at period end. |
(e) Affiliated company |
Affiliated Central Funds |
Information regarding fiscal year to date income earned by the Fund from investments in Fidelity Central Funds is as follows: |
Fund | Income earned |
Fidelity Cash Central Fund | $ 149,674 |
Fidelity Securities Lending Cash Central Fund | 1,296,145 |
Total | $ 1,445,819 |
Other Affiliated Issuers |
An affiliated company is a company in which the fund has ownership of at least 5% of the voting securities. Fiscal year to date transactions with companies which are or were affiliates are as follows: |
Affiliate | Value, beginning of period | Purchases | Sales Proceeds | Dividend Income | Value, end of period |
Commercial Vehicle Group, Inc. | $ - | $ 9,035,246 | $ 6,160,191 | $ - | $ - |
Online Resources Corp. | 7,502,350 | 4,608,401 | 537,693 | - | 7,777,946 |
Perficient, Inc. | - | 15,347,170 | - | - | 13,394,542 |
Town Sports International Holdings, Inc. | 4,060,850 | 759,596 | 3,236,327 | - | - |
Total | $ 11,563,200 | $ 29,750,413 | $ 9,934,211 | $ - | $ 21,172,488 |
Other Information |
All investments are categorized as Level 1 under the Fair Value Hierarchy. The inputs or methodology used for valuing securities may not be an indication of the risk associated with investing in those securities. For more information on valuation inputs, please refer to the Security Valuation section in the accompanying Notes to Financial Statements. |
Distribution of investments by country of issue, as a percentage of total net assets, is as follows: (Unaudited) |
United States of America | 83.8% |
Germany | 3.3% |
United Kingdom | 3.1% |
Canada | 2.1% |
Austria | 1.1% |
Spain | 1.0% |
Others (Individually Less Than 1%) | 5.6% |
| 100.0% |
Income Tax Information |
At July 31, 2010, the Fund had a capital loss carryforward of approximately $193,259,144 all of which will expire on July 31, 2017. Capital loss carryforwards are only available to offset future capital gains of the Fund to the extent provided by regulations and may be limited. |
See accompanying notes which are an integral part of the financial statements.
Annual Report
Statement of Assets and Liabilities
| July 31, 2010 |
| | |
Assets | | |
Investment in securities, at value (including securities loaned of $66,419,896) - See accompanying schedule: Unaffiliated issuers (cost $1,264,897,501) | $ 1,344,741,289 | |
Fidelity Central Funds (cost $137,343,536) | 137,343,536 | |
Other affiliated issuers (cost $25,979,968) | 21,172,488 | |
Total Investments (cost $1,428,221,005) | | $ 1,503,257,313 |
Cash | | 315,767 |
Receivable for investments sold | | 13,654,738 |
Receivable for fund shares sold | | 2,171,959 |
Dividends receivable | | 292,550 |
Distributions receivable from Fidelity Central Funds | | 132,533 |
Other receivables | | 33,561 |
Total assets | | 1,519,858,421 |
| | |
Liabilities | | |
Payable to custodian bank | $ 29,626 | |
Payable for investments purchased | 14,818,248 | |
Payable for fund shares redeemed | 742,277 | |
Accrued management fee | 742,220 | |
Distribution fees payable | 38,799 | |
Other affiliated payables | 356,239 | |
Other payables and accrued expenses | 61,248 | |
Collateral on securities loaned, at value | 67,877,077 | |
Total liabilities | | 84,665,734 |
| | |
Net Assets | | $ 1,435,192,687 |
Net Assets consist of: | | |
Paid in capital | | $ 1,560,322,935 |
Accumulated undistributed net realized gain (loss) on investments and foreign currency transactions | | (200,164,970) |
Net unrealized appreciation (depreciation) on investments and assets and liabilities in foreign currencies | | 75,034,722 |
Net Assets | | $ 1,435,192,687 |
See accompanying notes which are an integral part of the financial statements.
Annual Report
Statement of Assets and Liabilities - continued
| July 31, 2010 |
| | |
Calculation of Maximum Offering Price
Class A:
Net Asset Value and redemption price per share
($50,620,117 ÷ 3,999,164 shares) | | $ 12.66 |
| | |
Maximum offering price per share (100/94.25 of $12.66) | | $ 13.43 |
Class T:
Net Asset Value and redemption price per share ($23,930,175 ÷ 1,904,460 shares) | | $ 12.57 |
| | |
Maximum offering price per share (100/96.50 of $12.57) | | $ 13.03 |
Class B:
Net Asset Value and offering price per share ($5,141,694 ÷ 417,875 shares)A | | $ 12.30 |
| | |
Class C:
Net Asset Value and offering price per share ($18,091,241 ÷ 1,472,976 shares)A | | $ 12.28 |
| | |
Small Cap Growth:
Net Asset Value, offering price and redemption price per share ($1,204,817,925 ÷ 94,067,973 shares) | | $ 12.81 |
| | |
Class F:
Net Asset Value, offering price and redemption price per share ($106,941,045 ÷ 8,320,712 shares) | | $ 12.85 |
| | |
Institutional Class:
Net Asset Value, offering price and redemption price per share ($25,650,490 ÷ 1,999,058 shares) | | $ 12.83 |
A Redemption price per share is equal to net asset value less any applicable contingent deferred sales charge.
See accompanying notes which are an integral part of the financial statements.
Annual Report
Financial Statements - continued
Statement of Operations
| Year ended July 31, 2010 |
| | |
Investment Income | | |
Dividends | | $ 7,668,648 |
Special dividends | | 1,409,998 |
Interest | | 77 |
Income from Fidelity Central Funds (including $1,296,145 from security lending) | | 1,445,819 |
Total income | | 10,524,542 |
| | |
Expenses | | |
Management fee
Basic fee | $ 9,613,711 | |
Performance adjustment | 303,437 | |
Transfer agent fees | 3,875,107 | |
Distribution fees | 458,801 | |
Accounting and security lending fees | 472,799 | |
Custodian fees and expenses | 60,299 | |
Independent trustees' compensation | 7,713 | |
Registration fees | 89,950 | |
Audit | 55,399 | |
Legal | 5,688 | |
Miscellaneous | 20,225 | |
Total expenses before reductions | 14,963,129 | |
Expense reductions | (169,459) | 14,793,670 |
Net investment income (loss) | | (4,269,128) |
Realized and Unrealized Gain (Loss) Net realized gain (loss) on: | | |
Investment securities: | | |
Unaffiliated issuers | 241,077,337 | |
Other affiliated issuers | 987,981 | |
Foreign currency transactions | (28,960) | |
Capital gain distributions from Fidelity Central Funds | 2,501 | |
Total net realized gain (loss) | | 242,038,859 |
Change in net unrealized appreciation (depreciation) on: Investment securities | (34,114,564) | |
Assets and liabilities in foreign currencies | (2,138) | |
Total change in net unrealized appreciation (depreciation) | | (34,116,702) |
Net gain (loss) | | 207,922,157 |
Net increase (decrease) in net assets resulting from operations | | $ 203,653,029 |
See accompanying notes which are an integral part of the financial statements.
Annual Report
Statement of Changes in Net Assets
| Year ended
July 31,
2010 | Year ended
July 31,
2009 |
Increase (Decrease) in Net Assets | | |
Operations | | |
Net investment income (loss) | $ (4,269,128) | $ (4,212,561) |
Net realized gain (loss) | 242,038,859 | (335,295,985) |
Change in net unrealized appreciation (depreciation) | (34,116,702) | 109,380,680 |
Net increase (decrease) in net assets resulting
from operations | 203,653,029 | (230,127,866) |
Share transactions - net increase (decrease) | 46,578,163 | 89,233,558 |
Redemption fees | 232,258 | 255,734 |
Total increase (decrease) in net assets | 250,463,450 | (140,638,574) |
| | |
Net Assets | | |
Beginning of period | 1,184,729,237 | 1,325,367,811 |
End of period | $ 1,435,192,687 | $ 1,184,729,237 |
See accompanying notes which are an integral part of the financial statements.
Annual Report
Financial Highlights - Class A
Years ended July 31, | 2010 | 2009 | 2008 | 2007 | 2006 |
Selected Per-Share Data | | | | | |
Net asset value, beginning of period | $ 10.79 | $ 13.20 | $ 16.06 | $ 12.88 | $ 12.95 |
Income from Investment Operations | | | | | |
Net investment income (loss) C | (.07) F | (.06) | (.11) | (.12) G | (.10) H |
Net realized and unrealized gain (loss) | 1.94 | (2.35) | (1.73) | 3.39 | .18 |
Total from investment operations | 1.87 | (2.41) | (1.84) | 3.27 | .08 |
Distributions from net realized gain | - | - | (1.02) | (.09) | (.16) |
Redemption fees added to paid in capital C | - J | - J | - J | - J | .01 |
Net asset value, end of period | $ 12.66 | $ 10.79 | $ 13.20 | $ 16.06 | $ 12.88 |
Total Return A, B | 17.33% | (18.26)% | (12.26)% | 25.52% | .70% |
Ratios to Average Net Assets D, I | | | | | |
Expenses before reductions | 1.35% | 1.33% | 1.40% | 1.44% | 1.53% |
Expenses net of fee waivers,
if any | 1.35% | 1.33% | 1.40% | 1.40% | 1.40% |
Expenses net of all reductions | 1.34% | 1.33% | 1.39% | 1.39% | 1.35% |
Net investment income (loss) | (.56)% F | (.64)% | (.74)% | (.80)% G | (.79)% H |
Supplemental Data | | | | | |
Net assets, end of period
(000 omitted) | $ 50,620 | $ 40,211 | $ 42,187 | $ 33,588 | $ 18,104 |
Portfolio turnover rate E | 105% | 150% | 113% | 91% | 129% |
A Total returns would have been lower had certain expenses not been reduced during the periods shown.
B Total returns do not include the effect of the sales charges.
C Calculated based on average shares outstanding during the period.
D Fees and expenses of the underlying Fidelity Central Funds are not included in the Fund's expense ratio. The Fund indirectly bears its proportionate share of the expenses of any underlying Fidelity Central Funds.
E Amount does not include the portfolio activity of any underlying Fidelity Central Funds.
F Investment income per share reflects a special dividend which amounted to $.01 per share. Excluding the special dividend, the ratio of net investment income (loss) to average net assets would have been (.67)%.
G Investment income per share reflects a special dividend which amounted to $.01 per share. Excluding the special dividend, the ratio of net investment income (loss) to average net assets would have been (.84)%.
H Investment income per share reflects a special dividend which amounted to $.01 per share. Excluding the special dividend, the ratio of net investment income (loss) to average net assets would have been (.85)%.
I Expense ratios reflect operating expenses of the class. Expenses before reductions do not reflect amounts reimbursed by the investment adviser or reductions from brokerage service arrangements or reductions from other expense offset arrangements and do not represent the amount paid by the class during periods when reimbursements or reductions occur. Expenses net of fee waivers reflect expenses after reimbursement by the investment adviser but prior to reductions from brokerage service arrangements or other expense offset arrangements. Expenses net of all reductions represent the net expenses paid by the class.
J Amount represents less than $.01 per share.
See accompanying notes which are an integral part of the financial statements.
Annual Report
Financial Highlights - Class T
Years ended July 31, | 2010 | 2009 | 2008 | 2007 | 2006 |
Selected Per-Share Data | | | | | |
Net asset value, beginning of period | $ 10.74 | $ 13.17 | $ 16.01 | $ 12.86 | $ 12.93 |
Income from Investment Operations | | | | | |
Net investment income (loss) C | (.10) F | (.09) | (.15) | (.16) G | (.14) H |
Net realized and unrealized gain (loss) | 1.93 | (2.34) | (1.73) | 3.38 | .19 |
Total from investment operations | 1.83 | (2.43) | (1.88) | 3.22 | .05 |
Distributions from net realized gain | - | - | (.96) | (.07) | (.13) |
Redemption fees added to paid in capital C | - J | - J | - J | - J | .01 |
Net asset value, end of period | $ 12.57 | $ 10.74 | $ 13.17 | $ 16.01 | $ 12.86 |
Total Return A, B | 17.04% | (18.45)% | (12.50)% | 25.18% | .48% |
Ratios to Average Net Assets D, I | | | | | |
Expenses before reductions | 1.61% | 1.60% | 1.65% | 1.67% | 1.73% |
Expenses net of fee waivers,
if any | 1.61% | 1.60% | 1.65% | 1.65% | 1.65% |
Expenses net of all reductions | 1.60% | 1.59% | 1.65% | 1.65% | 1.60% |
Net investment income (loss) | (.82)% F | (.91)% | (.99)% | (1.05)% G | (1.04)% H |
Supplemental Data | | | | | |
Net assets, end of period
(000 omitted) | $ 23,930 | $ 21,533 | $ 21,754 | $ 26,419 | $ 19,205 |
Portfolio turnover rate E | 105% | 150% | 113% | 91% | 129% |
A Total returns would have been lower had certain expenses not been reduced during the periods shown.
B Total returns do not include the effect of the sales charges.
C Calculated based on average shares outstanding during the period.
D Fees and expenses of the underlying Fidelity Central Funds are not included in the Fund's expense ratio. The Fund indirectly bears its proportionate share of the expenses of any underlying Fidelity Central Funds.
E Amount does not include the portfolio activity of any underlying Fidelity Central Funds.
F Investment income per share reflects a special dividend which amounted to $.01 per share. Excluding the special dividend, the ratio of net investment income (loss) to average net assets would have been (.93)%.
G Investment income per share reflects a special dividend which amounted to $.01 per share. Excluding the special dividend, the ratio of net investment income (loss) to average net assets would have been (1.09)%.
H Investment income per share reflects a special dividend which amounted to $.01 per share. Excluding the special dividend, the ratio of net investment income (loss) to average net assets would have been (1.10)%.
I Expense ratios reflect operating expenses of the class. Expenses before reductions do not reflect amounts reimbursed by the investment adviser or reductions from brokerage service arrangements or reductions from other expense offset arrangements and do not represent the amount paid by the class during periods when reimbursements or reductions occur. Expenses net of fee waivers reflect expenses after reimbursement by the investment adviser but prior to reductions from brokerage service arrangements or other expense offset arrangements. Expenses net of all reductions represent the net expenses paid by the class.
J Amount represents less than $.01 per share.
See accompanying notes which are an integral part of the financial statements.
Annual Report
Financial Highlights - Class B
Years ended July 31, | 2010 | 2009 | 2008 | 2007 | 2006 |
Selected Per-Share Data | | | | | |
Net asset value, beginning of period | $ 10.57 | $ 13.03 | $ 15.85 | $ 12.78 | $ 12.87 |
Income from Investment Operations | | | | | |
Net investment income (loss) C | (.16) F | (.13) | (.22) | (.23) G | (.20) H |
Net realized and unrealized gain (loss) | 1.89 | (2.33) | (1.71) | 3.36 | .19 |
Total from investment operations | 1.73 | (2.46) | (1.93) | 3.13 | (.01) |
Distributions from net realized gain | - | - | (.89) | (.06) | (.09) |
Redemption fees added to paid in capital C | - J | - J | - J | - J | .01 |
Net asset value, end of period | $ 12.30 | $ 10.57 | $ 13.03 | $ 15.85 | $ 12.78 |
Total Return A, B | 16.37% | (18.88)% | (12.92)% | 24.57% | (.03)% |
Ratios to Average Net Assets D, I | | | | | |
Expenses before reductions | 2.11% | 2.08% | 2.15% | 2.20% | 2.28% |
Expenses net of fee waivers,
if any | 2.11% | 2.08% | 2.15% | 2.15% | 2.15% |
Expenses net of all reductions | 2.09% | 2.08% | 2.15% | 2.15% | 2.10% |
Net investment income (loss) | (1.32)% F | (1.39)% | (1.49)% | (1.55)% G | (1.54)% H |
Supplemental Data | | | | | |
Net assets, end of period
(000 omitted) | $ 5,142 | $ 4,171 | $ 5,517 | $ 6,242 | $ 5,191 |
Portfolio turnover rate E | 105% | 150% | 113% | 91% | 129% |
A Total returns would have been lower had certain expenses not been reduced during the periods shown.
B Total returns do not include the effect of the contingent deferred sales charge.
C Calculated based on average shares outstanding during the period.
D Fees and expenses of the underlying Fidelity Central Funds are not included in the Fund's expense ratio. The Fund indirectly bears its proportionate share of the expenses of any underlying Fidelity Central Funds.
E Amount does not include the portfolio activity of any underlying Fidelity Central Funds.
F Investment income per share reflects a special dividend which amounted to $.01 per share. Excluding the special dividend, the ratio of net investment income (loss) to average net assets would have been (1.42)%.
G Investment income per share reflects a special dividend which amounted to $.01 per share. Excluding the special dividend, the ratio of net investment income (loss) to average net assets would have been (1.59)%.
H Investment income per share reflects a special dividend which amounted to $.01 per share. Excluding the special dividend, the ratio of net investment income (loss) to average net assets would have been (1.60)%.
I Expense ratios reflect operating expenses of the class. Expenses before reductions do not reflect amounts reimbursed by the investment adviser or reductions from brokerage service arrangements or reductions from other expense offset arrangements and do not represent the amount paid by the class during periods when reimbursements or reductions occur. Expenses net of fee waivers reflect expenses after reimbursement by the investment adviser but prior to reductions from brokerage service arrangements or other expense offset arrangements. Expenses net of all reductions represent the net expenses paid by the class.
J Amount represents less than $.01 per share.
See accompanying notes which are an integral part of the financial statements.
Annual Report
Financial Highlights - Class C
Years ended July 31, | 2010 | 2009 | 2008 | 2007 | 2006 |
Selected Per-Share Data | | | | | |
Net asset value, beginning of period | $ 10.55 | $ 13.00 | $ 15.84 | $ 12.77 | $ 12.88 |
Income from Investment Operations | | | | | |
Net investment income (loss) C | (.16) F | (.13) | (.22) | (.23) G | (.20) H |
Net realized and unrealized gain (loss) | 1.89 | (2.32) | (1.71) | 3.36 | .18 |
Total from investment operations | 1.73 | (2.45) | (1.93) | 3.13 | (.02) |
Distributions from net realized gain | - | - | (.91) | (.06) | (.10) |
Redemption fees added to paid in capital C | - J | - J | - J | - J | .01 |
Net asset value, end of period | $ 12.28 | $ 10.55 | $ 13.00 | $ 15.84 | $ 12.77 |
Total Return A, B | 16.40% | (18.85)% | (12.94)% | 24.59% | (.08)% |
Ratios to Average Net Assets D, I | | | | | |
Expenses before reductions | 2.11% | 2.08% | 2.15% | 2.20% | 2.25% |
Expenses net of fee waivers,
if any | 2.11% | 2.08% | 2.15% | 2.15% | 2.15% |
Expenses net of all reductions | 2.09% | 2.07% | 2.14% | 2.14% | 2.10% |
Net investment income (loss) | (1.32)% F | (1.39)% | (1.49)% | (1.55)% G | (1.54)% H |
Supplemental Data | | | | | |
Net assets, end of period
(000 omitted) | $ 18,091 | $ 14,267 | $ 15,946 | $ 22,348 | $ 14,682 |
Portfolio turnover rateE | 105% | 150% | 113% | 91% | 129% |
A Total returns would have been lower had certain expenses not been reduced during the periods shown.
B Total returns do not include the effect of the contingent deferred sales charge.
C Calculated based on average shares outstanding during the period.
D Fees and expenses of the underlying Fidelity Central Funds are not included in the Fund's expense ratio. The Fund indirectly bears its proportionate share of the expenses of any underlying Fidelity Central Funds.
E Amount does not include the portfolio activity of any underlying Fidelity Central Funds.
F Investment income per share reflects a special dividend which amounted to $.01 per share. Excluding the special dividend, the ratio of net investment income (loss) to average net assets would have been (1.42)%.
G Investment income per share reflects a special dividend which amounted to $.01 per share. Excluding the special dividend, the ratio of net investment income (loss) to average net assets would have been (1.59)%.
H Investment income per share reflects a special dividend which amounted to $.01 per share. Excluding the special dividend, the ratio of net investment income (loss) to average net assets would have been (1.60)%.
I Expense ratios reflect operating expenses of the class. Expenses before reductions do not reflect amounts reimbursed by the investment adviser or reductions from brokerage service arrangements or reductions from other expense offset arrangements and do not represent the amount paid by the class during periods when reimbursements or reductions occur. Expenses net of fee waivers reflect expenses after reimbursement by the investment adviser but prior to reductions from brokerage service arrangements or other expense offset arrangements. Expenses net of all reductions represent the net expenses paid by the class.
J Amount represents less than $.01 per share.
See accompanying notes which are an integral part of the financial statements.
Annual Report
Financial Highlights - Small Cap Growth
Years ended July 31, | 2010 | 2009 | 2008 | 2007 | 2006 |
Selected Per-Share Data | | | | | |
Net asset value, beginning of period | $ 10.89 | $ 13.29 | $ 16.15 | $ 12.93 | $ 12.98 |
Income from Investment Operations | | | | | |
Net investment income (loss) B | (.04) E | (.04) | (.07) | (.08) F | (.07) G |
Net realized and unrealized gain (loss) | 1.96 | (2.36) | (1.74) | 3.40 | .19 |
Total from investment operations | 1.92 | (2.40) | (1.81) | 3.32 | .12 |
Distributions from net realized gain | - | - | (1.05) | (.10) | (.18) |
Redemption fees added to paid in capital B | - I | - I | - I | - I | .01 |
Net asset value, end of period | $ 12.81 | $ 10.89 | $ 13.29 | $ 16.15 | $ 12.93 |
Total Return A | 17.63% | (18.06)% | (11.98)% | 25.84% | 1.01% |
Ratios to Average Net Assets C, H | | | | |
Expenses before reductions | 1.08% | 1.08% | 1.11% | 1.10% | 1.13% |
Expenses net of fee waivers,
if any | 1.08% | 1.08% | 1.11% | 1.10% | 1.13% |
Expenses net of all reductions | 1.07% | 1.08% | 1.10% | 1.09% | 1.08% |
Net investment income (loss) | (.29)% E | (.39)% | (.45)% | (.50)% F | (.52)% G |
Supplemental Data | | | | | |
Net assets, end of period (000 omitted) | $ 1,204,818 | $ 1,085,184 | $ 1,217,520 | $ 1,149,809 | $ 402,353 |
Portfolio turnover rate D | 105% | 150% | 113% | 91% | 129% |
A Total returns would have been lower had certain expenses not been reduced during the periods shown.
B Calculated based on average shares outstanding during the period.
C Fees and expenses of the underlying Fidelity Central Funds are not included in the Fund's expense ratio. The Fund indirectly bears its proportionate share of the expenses of any underlying Fidelity Central Funds.
D Amount does not include the portfolio activity of any underlying Fidelity Central Funds.
E Investment income per share reflects a special dividend which amounted to $.01 per share. Excluding the special dividend, the ratio of net investment income (loss) to average net assets would have been (.39)%.
F Investment income per share reflects a special dividend which amounted to $.01 per share. Excluding the special dividend, the ratio of net investment income (loss) to average net assets would have been (.54)%.
G Investment income per share reflects a special dividend which amounted to $.01 per share. Excluding the special dividend, the ratio of net investment income (loss) to average net assets would have been (.58)%.
H Expense ratios reflect operating expenses of the class. Expenses before reductions do not reflect amounts reimbursed by the investment adviser or reductions from brokerage service arrangements or reductions from other expense offset arrangements and do not represent the amount paid by the class during periods when reimbursements or reductions occur. Expenses net of fee waivers reflect expenses after reimbursement by the investment adviser but prior to reductions from brokerage service arrangements or other expense offset arrangements. Expenses net of all reductions represent the net expenses paid by the class.
I Amount represents less than $.01 per share.
See accompanying notes which are an integral part of the financial statements.
Annual Report
Financial Highlights - Class F
Years ended July 31, | 2010 | 2009 I |
Selected Per-Share Data | | |
Net asset value, beginning of period | $ 10.90 | $ 10.03 |
Income from Investment Operations | | |
Net investment income (loss) D | - G, K | (.01) |
Net realized and unrealized gain (loss) | 1.95 | .88 H |
Total from investment operations | 1.95 | .87 |
Redemption fees added to paid in capital D, K | - | - |
Net asset value, end of period | $ 12.85 | $ 10.90 |
Total Return B, C | 17.89% | 8.67% |
Ratios to Average Net Assets E, J | | |
Expenses before reductions | .78% | .74% A |
Expenses net of fee waivers, if any | .78% | .74% A |
Expenses net of all reductions | .77% | .73% A |
Net investment income (loss) | -% G, L | (.54)% A |
Supplemental Data | | |
Net assets, end of period (000 omitted) | $ 106,941 | $ 159 |
Portfolio turnover rate F | 105% | 150% |
A Annualized
B Total returns for periods of less than one year are not annualized.
C Total returns would have been lower had certain expenses not been reduced during the periods shown.
D Calculated based on average shares outstanding during the period.
E Fees and expenses of the underlying Fidelity Central Funds are not included in the Fund's expense ratio. The Fund indirectly bears its proportionate share of the expenses of any underlying Fidelity Central Funds.
F Amount does not include the portfolio activity of any underlying Fidelity Central Funds.
G Investment income per share reflects a special dividend which amounted to $.01 per share. Excluding the special dividend, the ratio of net investment income (loss) to average net assets would have been (.10)%.
H The amount shown for a share outstanding does not correspond with the aggregate net gain (loss) on investments for the period due to the timing of sales and repurchases of shares in relation to fluctuating market values of the investments of the Fund.
I For the period June 26, 2009 (commencement of sale of shares) to July 31, 2009.
J Expense ratios reflect operating expenses of the class. Expenses before reductions do not reflect amounts reimbursed by the investment adviser or reductions from brokerage service arrangements or reductions from other expense offset arrangements and do not represent the amount paid by the class during periods when reimbursements or reductions occur. Expense ratios before reductions for start-up periods may not be representative of longer-term operating periods. Expenses net of fee waivers reflect expenses after reimbursement by the investment adviser but prior to reductions from brokerage service arrangements or other expense offset arrangements. Expenses net of all reductions represent the net expenses paid by the class.
K Amount represents less than $.01 per share.
L Amount represents less than .01%.
See accompanying notes which are an integral part of the financial statements.
Annual Report
Financial Highlights - Institutional Class
Years ended July 31, | 2010 | 2009 | 2008 | 2007 | 2006 |
Selected Per-Share Data | | | | | |
Net asset value, beginning of period | $ 10.91 | $ 13.30 | $ 16.15 | $ 12.92 | $ 12.97 |
Income from Investment Operations | | | | | |
Net investment income (loss) B | (.03) E | (.03) | (.06) | (.07) F | (.07) G |
Net realized and unrealized gain (loss) | 1.95 | (2.36) | (1.74) | 3.41 | .19 |
Total from investment operations | 1.92 | (2.39) | (1.80) | 3.34 | .12 |
Distributions from net realized gain | - | - | (1.05) | (.11) | (.18) |
Redemption fees added to paid in capital B | - I | - I | - I | - I | .01 |
Net asset value, end of period | $ 12.83 | $ 10.91 | $ 13.30 | $ 16.15 | $ 12.92 |
Total Return A | 17.60% | (17.97)% | (11.93)% | 25.99% | .97% |
Ratios to Average Net Assets C, H | | | | | |
Expenses before reductions | 1.03% | 1.05% | 1.04% | 1.05% | 1.10% |
Expenses net of fee waivers,
if any | 1.03% | 1.05% | 1.04% | 1.05% | 1.10% |
Expenses net of all reductions | 1.02% | 1.04% | 1.03% | 1.05% | 1.05% |
Net investment income (loss) | (.24)% E | (.36)% | (.38)% | (.46)% F | (.49)% G |
Supplemental Data | | | | | |
Net assets, end of period
(000 omitted) | $ 25,650 | $ 19,204 | $ 22,444 | $ 18,671 | $ 14,233 |
Portfolio turnover rate D | 105% | 150% | 113% | 91% | 129% |
A Total returns would have been lower had certain expenses not been reduced during the periods shown.
B Calculated based on average shares outstanding during the period.
C Fees and expenses of the underlying Fidelity Central Funds are not included in the Fund's expense ratio. The Fund indirectly bears its proportionate share of the expenses of any underlying Fidelity Central Funds.
D Amount does not include the portfolio activity of any underlying Fidelity Central Funds.
E Investment income per share reflects a special dividend which amounted to $.01 per share. Excluding the special dividend, the ratio of net investment income (loss) to average net assets would have been (.34)%.
F Investment income per share reflects a special dividend which amounted to $.01 per share. Excluding the special dividend, the ratio of net investment income (loss) to average net assets would have been (.50)%.
G Investment income per share reflects a special dividend which amounted to $.01 per share. Excluding the special dividend, the ratio of net investment income (loss) to average net assets would have been (.55)%.
H Expense ratios reflect operating expenses of the class. Expenses before reductions do not reflect amounts reimbursed by the investment adviser or reductions from brokerage service arrangements or reductions from other expense offset arrangements and do not represent the amount paid by the class during periods when reimbursements or reductions occur. Expenses net of fee waivers reflect expenses after reimbursement by the investment adviser but prior to reductions from brokerage service arrangements or other expense offset arrangements. Expenses net of all reductions represent the net expenses paid by the class.
I Amount represents less than $.01 per share.
See accompanying notes which are an integral part of the financial statements.
Annual Report
Notes to Financial Statements
For the period ended July 31, 2010
1. Organization.
Fidelity Small Cap Growth Fund (the Fund) is a fund of Fidelity Securities Fund (the Trust) and is authorized to issue an unlimited number of shares. The Trust is registered under the Investment Company Act of 1940, as amended (the 1940 Act), as an open-end management investment company organized as a Massachusetts business trust. The Fund offers Class A, Class T, Class B, Class C, Small Cap Growth, Class F and Institutional Class shares, each of which has equal rights as to assets and voting privileges. Effective after the close of business on September 1, 2010, Class B shares will be closed to new accounts and additional purchases by existing shareholders. Each class has exclusive voting rights with respect to matters that affect that class. Class F shares of the Fund are only available for purchase by mutual funds for which Fidelity Management & Research Company (FMR) or an affiliate serves as investment manager. Class B shares will automatically convert to Class A shares after a holding period of seven years from the initial date of purchase. Investment income, realized and unrealized capital gains and losses, the common expenses of the Fund, and certain fund-level expense reductions, if any, are allocated on a pro-rata basis to each class based on the relative net assets of each class to the total net assets of the Fund. Each class differs with respect to transfer agent and distribution and service plan fees incurred. Certain expense reductions also differ by class.
2. Investments in Fidelity Central Funds.
The Fund may invest in Fidelity Central Funds, which are open-end investment companies available only to other investment companies and accounts managed by FMR and its affiliates. The Fund's Schedule of Investments lists each of the Fidelity Central Funds held as of period end, if any, as an investment of the Fund, but does not include the underlying holdings of each Fidelity Central Fund. As an Investing Fund, the Fund indirectly bears its proportionate share of the expenses of the underlying Fidelity Central Funds.
The Money Market Central Funds seek preservation of capital and current income and are managed by Fidelity Investments Money Management, Inc. (FIMM), an affiliate of FMR.
A complete unaudited list of holdings for each Fidelity Central Fund is available upon request or at the Securities and Exchange Commission (the SEC) web site at www.sec.gov. In addition, the financial statements of the Fidelity Central Funds which are not covered by the Fund's Report of Independent Registered Public Accounting Firm, are available on the SEC web site or upon request.
Annual Report
3. Significant Accounting Policies.
The financial statements have been prepared in conformity with accounting principles generally accepted in the United States of America (GAAP), which require management to make certain estimates and assumptions at the date of the financial statements. Actual results could differ from those estimates. The following summarizes the significant accounting policies of the Fund:
Security Valuation. Investments are valued as of 4:00 p.m. Eastern time on the last calendar day of the period. The Fund uses independent pricing services approved by the Board of Trustees to value its investments. When current market prices or quotations are not readily available or reliable, valuations may be determined in good faith in accordance with procedures adopted by the Board of Trustees. Factors used in determining value may include market or security specific events. The frequency with which these procedures are used cannot be predicted and they may be utilized to a significant extent. The value used for net asset value (NAV) calculation under these procedures may differ from published prices for the same securities.
The Fund categorizes the inputs to valuation techniques used to value its investments into a disclosure hierarchy consisting of three levels as shown below.
Level 1 - quoted prices in active markets for identical investments
Level 2 - other significant observable inputs (including quoted prices for similar investments, interest rates, prepayment speeds, etc.)
Level 3 - unobservable inputs (including the fund's own assumptions based on the best information available)
Changes in valuation techniques may result in transfers in or out of an assigned level within the disclosure hierarchy. The aggregate value of investments by input level, as of July 31, 2010 is included at the end of the Fund's Schedule of Investments. Valuation techniques used to value the Fund's investments by major category are as follows.
Equity securities, including restricted securities, for which market quotations are readily available, are valued at the last reported sale price or official closing price as reported by an independent pricing service on the primary market or exchange on which they are traded and are categorized as Level 1 in the hierarchy. In the event there were no sales during the day or closing prices are not available, securities are valued at the last quoted bid price or may be valued using the last available price and are generally categorized as Level 2 in the hierarchy. For foreign equity securities, when significant market or security specific events arise, comparisons to the valuation of American Depositary Receipts (ADRs) futures contracts, Exchange-traded funds (ETFs) and certain indexes as well as quoted prices for similar securities are used and are categorized as Level 2 in the hierarchy
Annual Report
Notes to Financial Statements - continued
3. Significant Accounting Policies - continued
Security Valuation - continued
in these circumstances. Utilizing these techniques may result in transfers between Level 1 and Level 2. For restricted equity securities and private placements where observable inputs are limited, assumptions about market activity and risk are used and are categorized as Level 3 in the hierarchy.
Investments in open-end mutual funds, including the Fidelity Central Funds, are valued at their closing net asset value each business day and are categorized as Level 1 in the hierarchy. Short-term securities with remaining maturities of sixty days or less for which quotations are not readily available are valued at amortized cost, which approximates fair value and are categorized as Level 2 in the hierarchy.
Foreign Currency. The Fund uses foreign currency contracts to facilitate transactions in foreign-denominated securities. Gains and losses from these transactions may arise from changes in the value of the foreign currency or if the counterparties do not perform under the contracts' terms.
Foreign-denominated assets, including investment securities, and liabilities are translated into U.S. dollars at the exchange rate at period end. Purchases and sales of investment securities, income and dividends received and expenses denominated in foreign currencies are translated into U.S. dollars at the exchange rate in effect on the transaction date.
The effects of exchange rate fluctuations on investments are included with the net realized and unrealized gain (loss) on investment securities. Other foreign currency transactions resulting in realized and unrealized gain (loss) are disclosed separately.
Investment Transactions and Income. For financial reporting purposes, the Fund's investment holdings and NAV include trades executed through the end of the last business day of the period. The NAV per share for processing shareholder transactions is calculated as of the close of business of the New York Stock Exchange (NYSE), normally 4:00 p.m. Eastern time and includes trades executed through the end of the prior business day. Gains and losses on securities sold are determined on the basis of identified cost and may include proceeds received from litigation. Dividend income is recorded on the ex-dividend date, except for certain dividends from foreign securities where the ex-dividend date may have passed, which are recorded as soon as the Fund is informed of the ex-dividend date. Non-cash dividends included in dividend income, if any, are recorded at the fair market value of the securities received. Distributions received on securities that represent a return of capital or capital gain are recorded as a reduction of cost of investments and/or as a realized gain. The Fund estimates the components of distributions received that may be considered return of capital distributions or capital
Annual Report
3. Significant Accounting Policies - continued
Investment Transactions and Income - continued
gain distributions. Large, non-recurring dividends recognized by the Fund are presented separately on the Statement of Operations as "Special Dividends" and the impact of these dividends is presented in the Financial Highlights. Interest income and distributions from the Fidelity Central Funds are accrued as earned. Interest income includes coupon interest and amortization of premium and accretion of discount on debt securities. Investment income is recorded net of foreign taxes withheld where recovery of such taxes is uncertain.
Expenses. Most expenses of the Trust can be directly attributed to a fund. Expenses which cannot be directly attributed are apportioned amongst each fund in the Trust. Expense estimates are accrued in the period to which they relate and adjustments are made when actual amounts are known.
Income Tax Information and Distributions to Shareholders. Each year the Fund intends to qualify as a regulated investment company, including distributing substantially all of its taxable income and realized gains under Subchapter M of the Internal Revenue Code and filing its U.S. federal tax return. As a result, no provision for income taxes is required. As of July 31, 2010, the Fund did not have any unrecognized tax benefits in the accompanying financial statements. A fund's federal tax return is subject to examination by the Internal Revenue Service (IRS) for a period of three years. Foreign taxes are provided for based on the Fund's understanding of the tax rules and rates that exist in the foreign markets in which it invests.
Distributions are recorded on the ex-dividend date. Income dividends and capital gain distributions are declared separately for each class. Income and capital gain distributions are determined in accordance with income tax regulations, which may differ from GAAP.
Capital accounts within the financial statements are adjusted for permanent book-tax differences. These adjustments have no impact on net assets or the results of operations. Temporary book-tax differences will reverse in a subsequent period.
Book-tax differences are primarily due to the short-term gain distributions from the Fidelity Central Funds, foreign currency transactions, net operating losses, capital loss carryforwards, losses deferred due to wash sales and excise tax regulations.
The federal tax cost of investment securities and unrealized appreciation (depreciation) as of period end were as follows:
Gross unrealized appreciation | $ 169,655,477 |
Gross unrealized depreciation | (101,524,996) |
Net unrealized appreciation (depreciation) | $ 68,130,481 |
| |
Tax Cost | $ 1,435,126,832 |
Annual Report
Notes to Financial Statements - continued
3. Significant Accounting Policies - continued
Income Tax Information and Distributions to Shareholders - continued
The tax-based components of distributable earnings as of period end were as follows:
Capital loss carryforward | $ (193,259,144) |
Net unrealized appreciation (depreciation) | $ 68,128,895 |
Short-Term Trading (Redemption) Fees. Shares held in the Fund less than 90 days are subject to a redemption fee equal to 1.50% of the proceeds of the redeemed shares. All redemption fees, including any estimated redemption fees paid by FMR, are retained by the Fund and accounted for as an addition to paid in capital.
4. Purchases and Sales of Investments.
Purchases and sales of securities, other than short-term securities, aggregated $1,359,919,734 and $1,335,378,288, respectively.
5. Fees and Other Transactions with Affiliates.
Management Fee. FMR and its affiliates provide the Fund with investment management related services for which the Fund pays a monthly management fee. The management fee is the sum of an individual fund fee rate that is based on an annual rate of .45% of the Fund's average net assets and a group fee rate that averaged .26% during the period. The group fee rate is based upon the average net assets of all the mutual funds advised by FMR. The group fee rate decreases as assets under management increase and increases as assets under management decrease. In addition, the management fee is subject to a performance adjustment (up to a maximum of ± .20% of the Fund's average net assets over a 36 month performance period). The upward or downward adjustment to the management fee is based on the relative investment performance of the retail class of the Fund, Small Cap Growth, as compared to an appropriate benchmark index. For the period, the total annual management fee rate, including the performance adjustment, was .73% of the Fund's average net assets.
Distribution and Service Plan. In accordance with Rule 12b-1 of the 1940 Act, the Fund has adopted separate Distribution and Service Plans for each class of shares. Certain classes pay Fidelity Distributors Corporation (FDC), an affiliate of FMR, separate Distribution and Service Fees, each of which is based on an annual percentage of each class' average net assets. In addition, FDC may pay financial intermediaries for
Annual Report
5. Fees and Other Transactions with Affiliates - continued
Distribution and Service Plan - continued
selling shares of the Fund and providing shareholder support services. For the period, the Distribution and Service Fee rates and the total amounts paid to and retained by FDC were as follows:
| Distribution
Fee | Service
Fee | Paid to
FDC | Retained
by FDC |
Class A | -% | .25% | $ 117,878 | $ 2,297 |
Class T | .25% | .25% | 118,478 | - |
Class B | .75% | .25% | 49,164 | 36,913 |
Class C | .75% | .25% | 173,281 | 40,211 |
| | | $ 458,801 | $ 79,421 |
Sales Load. FDC receives a front-end sales charge of up to 5.75% for selling Class A shares, and 3.50% for selling Class T shares, some of which is paid to financial intermediaries for selling shares of the Fund. FDC receives the proceeds of contingent deferred sales charges levied on Class A, Class T, Class B, and Class C redemptions. These charges depend on the holding period. The deferred sales charges range from 5% to 1% for Class B, 1% for Class C, 1.00% for certain purchases of Class A shares (1.00% to .50% prior to July 12, 2010) and .25% for certain purchases of Class T shares.
For the period, sales charge amounts retained by FDC were as follows:
| Retained
by FDC |
Class A | $ 27,622 |
Class T | 6,101 |
Class B* | 8,154 |
Class C* | 2,438 |
| $ 44,315 |
* When Class B and Class C shares are initially sold, FDC pays commissions from its own resources to financial intermediaries through which the
sales are made.
Transfer Agent Fees. Fidelity Investments Institutional Operations Company, Inc. (FIIOC), an affiliate of FMR, is the transfer, dividend disbursing and shareholder servicing agent for each class of the Fund. FIIOC receives account fees and asset-based fees that vary according to the account size and type of account of the shareholders of the Fund, except for Class F. FIIOC receives no fees for providing transfer agency services to Class F.
Annual Report
Notes to Financial Statements - continued
5. Fees and Other Transactions with Affiliates - continued
Transfer Agent Fees - continued
FIIOC pays for typesetting, printing and mailing of shareholder reports, except proxy statements. For the period, the total transfer agent fees paid by each class were as follows:
| Amount | % of
Average
Net Assets |
Class A | $ 150,515 | .32 |
Class T | 77,623 | .33 |
Class B | 15,920 | .32 |
Class C | 56,034 | .32 |
Small Cap Growth | 3,522,221 | .29 |
Institutional Class | 52,794 | .24 |
| $ 3,875,107 | |
Accounting and Security Lending Fees. Fidelity Service Company, Inc. (FSC), an affiliate of FMR, maintains the Fund's accounting records. The accounting fee is based on the level of average net assets for the month. Under a separate contract, FSC administers the security lending program. The security lending fee is based on the number and duration of lending transactions.
Brokerage Commissions. The Fund placed a portion of its portfolio transactions with brokerage firms which are affiliates of the investment adviser. The commissions paid to these affiliated firms were $26,958 for the period.
6. Committed Line of Credit.
The Fund participates with other funds managed by FMR in a $3.75 billion credit facility (the "line of credit") to be utilized for temporary or emergency purposes to fund shareholder redemptions or for other short-term liquidity purposes. The Fund has agreed to pay commitment fees on its pro-rata portion of the line of credit, which amounted to $5,294 and is reflected in Miscellaneous expenses on the Statement of Operations. During the period, there were no borrowings on this line of credit.
7. Security Lending.
The Fund lends portfolio securities from time to time in order to earn additional income. On the settlement date of the loan, the Fund receives collateral (in the form of U.S. Treasury obligations, letters of credit and/or cash) against the loaned securities and maintains collateral in an amount not less than 100% of the market value of the loaned securities during the period of the loan. The market value of the loaned securities is
Annual Report
7. Security Lending - continued
determined at the close of business of the Fund and any additional required collateral is delivered to the Fund on the next business day. If the borrower defaults on its obligation to return the securities loaned because of insolvency or other reasons, a fund could experience delays and costs in recovering the securities loaned or in gaining access to the collateral. Any cash collateral received is invested in the Fidelity Securities Lending Cash Central Fund. The value of loaned securities and cash collateral at period end are disclosed on the Fund's Statement of Assets and Liabilities. Security lending income represents the income earned on investing cash collateral, less fees and expenses associated with the loan, plus any premium payments that may be received on the loan of certain types of securities. Security lending income is presented in the Statement of Operations as a component of income from Fidelity Central Funds.
8. Expense Reductions.
Many of the brokers with whom FMR places trades on behalf of the Fund provided services to the Fund in addition to trade execution. These services included payments of certain expenses on behalf of the Fund totaling $169,391 for the period. In addition, through arrangements with the Fund's custodian, credits realized as a result of uninvested cash balances were used to reduce the Fund's expenses. During the period, these credits reduced the Fund's custody expenses by $68.
9. Share Transactions.
Transactions for each class of shares were as follows:
| Shares | Dollars |
Years ended July 31, | 2010 | 2009 A | 2010 | 2009 A |
Class A | | | | |
Shares sold | 1,755,238 | 1,768,538 | $ 21,749,463 | $ 16,919,128 |
Shares redeemed | (1,481,231) | (1,239,291) | (17,861,442) | (11,138,983) |
Net increase (decrease) | 274,007 | 529,247 | $ 3,888,021 | $ 5,780,145 |
Class T | | | | |
Shares sold | 492,575 | 1,485,602 | $ 6,056,365 | $ 12,842,623 |
Shares redeemed | (592,408) | (1,132,759) | (7,232,100) | (9,596,209) |
Net increase (decrease) | (99,833) | 352,843 | $ (1,175,735) | $ 3,246,414 |
Class B | | | | |
Shares sold | 117,304 | 116,072 | $ 1,414,923 | $ 1,042,949 |
Shares redeemed | (93,928) | (145,097) | (1,126,513) | (1,355,668) |
Net increase (decrease) | 23,376 | (29,025) | $ 288,410 | $ (312,719) |
A Share transactions for Class F are for the period July 26, 2009 (commencement of sale of shares) to July 31, 2009.
Annual Report
Notes to Financial Statements - continued
9. Share Transactions - continued
| Shares | Dollars |
Years ended July 31, | 2010 | 2009 A | 2010 | 2009 A |
Class C | | | | |
Shares sold | 479,633 | 604,934 | $ 5,791,649 | $ 5,793,290 |
Shares redeemed | (358,550) | (479,386) | (4,319,904) | (4,290,700) |
Net increase (decrease) | 121,083 | 125,548 | $ 1,471,745 | $ 1,502,590 |
Small Cap Growth | | | | |
Shares sold | 22,893,960 | 30,718,046 | $ 285,679,819 | $ 287,281,815 |
Shares redeemed | (28,450,958) | (22,726,319) | (351,525,118) | (209,407,815) |
Net increase (decrease) | (5,556,998) | 7,991,727 | $ (65,845,299) | $ 77,874,000 |
Class F | | | | |
Shares sold | 8,663,528 | 14,590 | $ 109,176,128 | $ 145,457 |
Shares redeemed | (357,394) | (12) | (4,690,130) | (113) |
Net increase (decrease) | 8,306,134 | 14,578 | $ 104,485,998 | $ 145,344 |
Institutional Class | | | | |
Shares sold | 1,109,901 | 802,152 | $ 14,013,757 | $ 7,245,594 |
Shares redeemed | (871,545) | (728,847) | (10,548,734) | (6,247,810) |
Net increase (decrease) | 238,356 | 73,305 | $ 3,465,023 | $ 997,784 |
A Share transactions for Class F are for the period July 26, 2009 (commencement of sale of shares) to July 31, 2009.
10. Other.
The Fund's organizational documents provide former and current trustees and officers with a limited indemnification against liabilities arising in connection with the performance of their duties to the Fund. In the normal course of business, the Fund may also enter into contracts that provide general indemnifications. The Fund's maximum exposure under these arrangements is unknown as this would be dependent on future claims that may be made against the Fund. The risk of material loss from such claims is considered remote.
At the end of the period, Fidelity Freedom 2020 Fund was the owner of record of approximately 10% of the total outstanding shares of the Fund. The Fidelity Freedom Funds and Fidelity Freedom K Funds were the owners of record, in the aggregate, of approximately 54% of the total outstanding shares of the Fund.
Annual Report
To the Trustees of Fidelity Securities Fund and the Shareholders of Fidelity Small Cap Growth Fund:
In our opinion, the accompanying statement of assets and liabilities, including the schedule of investments, and the related statements of operations and of changes in net assets and the financial highlights present fairly, in all material respects, the financial position of Fidelity Small Cap Growth Fund (a fund of Fidelity Securities Fund) at July 31, 2010, the results of its operations for the year then ended, the changes in its net assets for each of the two years in the period then ended and the financial highlights for each of the periods indicated, in conformity with accounting principles generally accepted in the United States of America. These financial statements and financial highlights (hereafter referred to as "financial statements") are the responsibility of the Fidelity Small Cap Growth Fund's management. Our responsibility is to express an opinion on these financial statements based on our audits. We conducted our audits of these financial statements in accordance with the standards of the Public Company Accounting Oversight Board (United States). Those standards require that we plan and perform the audit to obtain reasonable assurance about whether the financial statements are free of material misstatement. An audit includes examining, on a test basis, evidence supporting the amounts and disclosures in the financial statements, assessing the accounting principles used and significant estimates made by management, and evaluating the overall financial statement presentation. We believe that our audits, which included confirmation of securities at July 31, 2010 by correspondence with the custodian and brokers, provide a reasonable basis for our opinion.
/s/ PricewaterhouseCoopers LLP
PricewaterhouseCoopers LLP
Boston, Massachusetts
September 14, 2010
Annual Report
The Trustees, Member of the Advisory Board, and executive officers of the trust and fund, as applicable, are listed below. The Board of Trustees governs the fund and is responsible for protecting the interests of shareholders. The Trustees are experienced executives who meet periodically throughout the year to oversee the fund's activities, review contractual arrangements with companies that provide services to the fund, oversee management of the risks associated with such activities and contractual arrangements, and review the fund's performance. Except for James C. Curvey, each of the Trustees oversees 222 funds advised by FMR or an affiliate. Mr. Curvey oversees 411 funds advised by FMR or an affiliate.
The Trustees hold office without limit in time except that (a) any Trustee may resign; (b) any Trustee may be removed by written instrument, signed by at least two-thirds of the number of Trustees prior to such removal; (c) any Trustee who requests to be retired or who has become incapacitated by illness or injury may be retired by written instrument signed by a majority of the other Trustees; and (d) any Trustee may be removed at any special meeting of shareholders by a two-thirds vote of the outstanding voting securities of the trust. Each Trustee who is not an interested person (as defined in the 1940 Act) (Independent Trustee), shall retire not later than the last day of the calendar year in which his or her 72nd birthday occurs. The Independent Trustees may waive this mandatory retirement age policy with respect to individual Trustees. The executive officers and Advisory Board Member hold office without limit in time, except that any officer and Advisory Board Member may resign or may be removed by a vote of a majority of the Trustees at any regular meeting or any special meeting of the Trustees. Except as indicated, each individual has held the office shown or other offices in the same company for the past five years.
Experience, Skills, Attributes, and Qualifications of the Fund's Trustees. The Governance and Nominating Committee has adopted a statement of policy that describes the experience, qualifications, attributes, and skills that are necessary and desirable for potential Independent Trustee candidates (Statement of Policy). The Board believes that each Trustee satisfied at the time he or she was initially elected or appointed a Trustee, and continues to satisfy, the standards contemplated by the Statement of Policy. The Governance and Nominating Committee also engages professional search firms to help identify potential Independent Trustee candidates who have the experience, qualifications, attributes, and skills consistent with the Statement of Policy. From time to time, additional criteria based on the composition and skills of the current Independent Trustees, as well as experience or skills that may be appropriate in light of future changes to board composition, business conditions, and regulatory or other developments, have also been considered by the professional search firms and the Governance and Nominating Committee. In addition, the Board takes into account the Trustees' commitment and participation in Board and committee meetings, as well as their leadership of standing and ad hoc committees throughout their tenure.
In determining that a particular Trustee was and continues to be qualified to serve as a Trustee, the Board has considered a variety of criteria, none of which, in isolation, was controlling. The Board believes that, collectively, the Trustees have balanced and diverse experience, qualifications, attributes, and skills, which allow the Board to operate effectively in governing the fund and protecting the interests of shareholders. Information about the specific experience, skills, attributes, and qualifications of each Trustee, which in each case led to the Board's conclusion that the Trustee should serve (or continue to serve) as a trustee of the fund, is provided below.
Annual Report
Trustees and Officers - continued
Board Structure and Oversight Function. Edward C. Johnson 3d is an interested person (as defined in the 1940 Act) and currently serves as Chairman. The Trustees have determined that an interested Chairman is appropriate and benefits shareholders because an interested Chairman has a personal and professional stake in the quality and continuity of services provided to the fund. Independent Trustees exercise their informed business judgment to appoint an individual of their choosing to serve as Chairman, regardless of whether the Trustee happens to be independent or a member of management. The Independent Trustees have determined that they can act independently and effectively without having an Independent Trustee serve as Chairman and that a key structural component for assuring that they are in a position to do so is for the Independent Trustees to constitute a substantial majority for the Board. The Independent Trustees also regularly meet in executive session. Ned C. Lautenbach serves as Chairman of the Independent Trustees and as such (i) acts as a liaison between the Independent Trustees and management with respect to matters important to the Independent Trustees and (ii) with management prepares agendas for Board meetings.
Fidelity funds are overseen by different Boards of Trustees. The fund's Board oversees Fidelity's equity and high income funds and another Board oversees Fidelity's investment-grade bond, money market, and asset allocation funds. The asset allocation funds may invest in Fidelity funds overseen by the fund's Board. The use of separate Boards, each with its own committee structure, allows the Trustees of each group of Fidelity funds to focus on the unique issues of the funds they oversee, including common research, investment, and operational issues. On occasion, the separate Boards establish joint committees to address issues of overlapping consequences for the Fidelity funds overseen by each Board.
The Trustees operate using a system of committees to facilitate the timely and efficient consideration of all matters of importance to the Trustees, the fund, and fund shareholders and to facilitate compliance with legal and regulatory requirements and oversight of the fund's activities and associated risks. The Board, acting through its committees, has charged FMR and its affiliates with (i) identifying events or circumstances the occurrence of which could have demonstrably adverse effects on the fund's business and/or reputation; (ii) implementing processes and controls to lessen the possibility that such events or circumstances occur or to mitigate the effects of such events or circumstances if they do occur; and (iii) creating and maintaining a system designed to evaluate continuously business and market conditions in order to facilitate the identification and implementation processes described in (i) and (ii) above. Because the day-to-day operations and activities of the fund are carried out by or through FMR, its affiliates and other service providers, the fund's exposure to risks is mitigated but not eliminated by the processes overseen by the Trustees. While each of the Board's committees has responsibility for overseeing different aspects of the fund's activities, oversight is exercised primarily through the Operations, Audit, and Compliance Committees. Appropriate personnel, including but not limited to the fund's Chief Compliance Officer (CCO), FMR's internal auditor, the independent accountants, the fund's Treasurer and portfolio management personnel, make periodic reports to the Board's committees, as appropriate. The responsibilities of each committee, including their oversight responsibilities, are described further under "Standing Committees of the Fund's Trustees."
Annual Report
The fund's Statement of Additional Information (SAI) includes more information about the Trustees. To request a free copy, call Fidelity at 1-877-208-0098.
Interested Trustees*:
Correspondence intended for each Trustee who is an interested person may be sent to Fidelity Investments, 82 Devonshire Street, Boston, Massachusetts 02109.
Name, Age; Principal Occupations and Other Relevant Experience+ |
Edward C. Johnson 3d (80) |
| Year of Election or Appointment: 1984 Mr. Johnson is Trustee and Chairman of the Board of Trustees of certain Trusts. Mr. Johnson serves as Chief Executive Officer, Chairman, and a Director of FMR LLC; Chairman and a Director of FMR; Chairman and a Director of Fidelity Research & Analysis Company (FRAC); Chairman and a Director of Fidelity Investments Money Management, Inc.; and Chairman and a Director of FMR Co., Inc. In addition, Mr. Johnson serves as Chairman and Director of FIL Limited. Previously, Mr. Johnson served as President of FMR LLC (2006-2007). |
James C. Curvey (75) |
| Year of Election or Appointment: 2007 Mr. Curvey also serves as Trustee (2007-present) of other investment companies advised by FMR. Mr. Curvey is a Director of FMR and FMR Co., Inc. (2007-present). Mr. Curvey is also Vice Chairman (2006-present) and Director of FMR LLC. In addition, Mr. Curvey serves as an Overseer for the Boston Symphony Orchestra and a member of the Trustees of Villanova University. |
* Trustees have been determined to be "Interested Trustees" by virtue of, among other things, their affiliation with the trust or various entities under common control with FMR.
+ The information above includes each Trustee's principal occupation during the last five years and other information relating to the experience, attributes, and skills relevant to each Trustee's qualifications to serve as a Trustee, which led to the conclusion that each Trustee should serve as a Trustee for the fund.
Annual Report
Trustees and Officers - continued
Independent Trustees:
Correspondence intended for each Independent Trustee (that is, the Trustees other than the Interested Trustees) may be sent to Fidelity Investments, P.O. Box 55235, Boston, Massachusetts 02205-5235.
Name, Age; Principal Occupations and Other Relevant Experience+ |
Dennis J. Dirks (62) |
| Year of Election or Appointment: 2005 Prior to his retirement in May 2003, Mr. Dirks was Chief Operating Officer and a member of the Board of The Depository Trust & Clearing Corporation (DTCC). He also served as President, Chief Operating Officer, and Board member of The Depository Trust Company (DTC) and President and Board member of the National Securities Clearing Corporation (NSCC). In addition, Mr. Dirks served as Chief Executive Officer and Board member of the Government Securities Clearing Corporation, Chief Executive Officer and Board member of the Mortgage-Backed Securities Clearing Corporation, as a Trustee and a member of the Finance Committee of Manhattan College (2005-2008), and as a Trustee and a member of the Finance Committee of AHRC of Nassau County (2006-2008). Currently, Mr. Dirks serves as a member of the Board of Directors for The Brookville Center for Children's Services, Inc. (2009-present). |
Alan J. Lacy (56) |
| Year of Election or Appointment: 2008 Mr. Lacy serves as Senior Adviser (2007-present) of Oak Hill Capital Partners, L.P. (private equity). Mr. Lacy also served as Chief Executive Officer (2000-2005) and Vice Chairman (2005-2006) of Sears Holdings Corporation and Sears, Roebuck and Co. (retail). In addition, Mr. Lacy serves as a member of the Board of Directors of The Western Union Company (global money transfer, 2006-present) and Bristol-Myers Squibb Company (global pharmaceuticals, 2007-present). Mr. Lacy is Chairman (2008-present) and a member (2006-present) of the Board of Trustees of The National Parks Conservation Association. |
Ned C. Lautenbach (66) |
| Year of Election or Appointment: 2000 Mr. Lautenbach is Chairman of the Independent Trustees of the Equity and High Income Funds (2006-present). Mr. Lautenbach is an Advisory Partner of Clayton, Dubilier & Rice, Inc. (private equity investment, 2008-present) and was previously a Partner of Clayton, Dubilier & Rice, Inc. (1998-2008). Previously, Mr. Lautenbach was with the International Business Machines Corporation (IBM) from 1968 until his retirement in 1998. Mr. Lautenbach serves as a Director of Eaton Corporation (diversified industrial) as well as the Philharmonic Center for the Arts in Naples, Florida. Mr. Lautenbach is also a member of the Board of Trustees of Fairfield University (2005-present), as well as a member of the Council on Foreign Relations. Previously, Mr. Lautenbach served as a Director of Sony Corporation (2006-2007). |
Joseph Mauriello (65) |
| Year of Election or Appointment: 2008 Prior to his retirement in January 2006, Mr. Mauriello served in numerous senior management positions including Deputy Chairman and Chief Operating Officer (2004-2005), and Vice Chairman of Financial Services (2002-2004) of KPMG LLP US (professional services, 1965-2005). Mr. Mauriello currently serves as a member of the Board of Directors of XL Capital Ltd. (global insurance and re-insurance, 2006-present) and of Arcadia Resources Inc. (health care services and products, 2007-present). Previously, Mr. Mauriello served as a Director of the Hamilton Funds of the Bank of New York (2006-2007). |
Cornelia M. Small (66) |
| Year of Election or Appointment: 2005 Ms. Small is a member of the Board of Directors of the Teagle Foundation (2009-present). Ms. Small is also a member of the Investment Committee, and Chair (2008-present) and a member of the Board of Trustees of Smith College. In addition, Ms. Small serves on the Investment Committee of the Berkshire Taconic Community Foundation (2008-present). Previously, Ms. Small served as Chairperson of the Investment Committee (2002-2008) of Smith College. In addition, Ms. Small served as Chief Investment Officer, Director of Global Equity Investments, and a member of the Board of Directors of Scudder, Stevens & Clark and Scudder Kemper Investments. |
William S. Stavropoulos (71) |
| Year of Election or Appointment: 2002 Mr. Stavropoulos is Vice Chairman of the Independent Trustees of the Equity and High Income Funds (2006-present). Mr. Stavropoulos serves as President and Founder of the Michigan Baseball Foundation, the Great Lakes Loons (2007-present). Mr. Stavropoulos is Chairman Emeritus of the Board of Directors of The Dow Chemical Company, where he previously served in numerous senior management positions, including President, CEO (1995-2000; 2002-2004), Chairman of the Executive Committee (2000-2006), and as a member of the Board of Directors (1990-2006). Currently, Mr. Stavropoulos is a Director of Teradata Corporation (data warehousing and technology solutions, 2008-present), Chemical Financial Corporation, Maersk Inc. (industrial conglomerate), Tyco International, Inc. (multinational manufacturing and services, 2007-present), and a member of the Advisory Board for Metalmark Capital (private equity investment, 2005-present). Mr. Stavropoulos is a special advisor to Clayton, Dubilier & Rice, Inc. (private equity investment). In addition, Mr. Stavropoulos is a member of the University of Notre Dame Advisory Council for the College of Science. |
David M. Thomas (61) |
| Year of Election or Appointment: 2008 Previously, Mr. Thomas served as Executive Chairman (2005-2006) and Chairman and Chief Executive Officer (2000-2005) of IMS Health, Inc. (pharmaceutical and healthcare information solutions). In addition, Mr. Thomas serves as a member of the Board of Directors of Fortune Brands, Inc. (consumer products), and Interpublic Group of Companies, Inc. (marketing communication, 2004-present). |
Michael E. Wiley (59) |
| Year of Election or Appointment: 2008 Mr. Wiley also serves as a Director of Asia Pacific Exploration Consolidated (international oil and gas exploration and production, 2008-present), and as a member of the Board of Trustees of the University of Tulsa (2000-2006; 2007-present). Mr. Wiley serves as a Director of Tesoro Corporation (independent oil refiner and marketer, 2005-present), and a Director of Bill Barrett Corporation (exploration and production, 2005-present). In addition, Mr. Wiley also serves as a Director of Post Oak Bank (privately-held bank, 2004-present). Previously, Mr. Wiley served as a Sr. Energy Advisor of Katzenbach Partners, LLC (consulting, 2006-2007), as an Advisory Director of Riverstone Holdings (private investment), Chairman, President, and CEO of Baker Hughes, Inc. (oilfield services, 2000-2004), and as Director of Spinnaker Exploration Company (exploration and production, 2001-2005). |
Annual Report
+ The information above includes each Trustee's principal occupation during the last five years and other information relating to the experience, attributes, and skills relevant to each Trustee's qualifications to serve as a Trustee, which led to the conclusion that each Trustee should serve as a Trustee for the fund.
Advisory Board Member and Executive Officers:
Correspondence intended for each executive officer and Peter S. Lynch may be sent to Fidelity Investments, 82 Devonshire Street, Boston, Massachusetts 02109.
Name, Age; Principal Occupation |
Peter S. Lynch (66) |
| Year of Election or Appointment: 2003 Member of the Advisory Board of Fidelity's Equity and High Income Funds. Mr. Lynch is Vice Chairman and a Director of FMR and FMR Co., Inc. In addition, Mr. Lynch serves as a Trustee of Boston College and as the Chairman of the Inner-City Scholarship Fund. Previously, Mr. Lynch served on the Special Olympics International Board of Directors (1997-2006). |
Kenneth B. Robins (40) |
| Year of Election or Appointment: 2008 President and Treasurer of Fidelity's Equity and High Income Funds. Mr. Robins also serves as President and Treasurer (2010-present) and Assistant Treasurer (2009-present) of other Fidelity funds and is an employee of Fidelity Investments (2004-present). Previously, Mr. Robins served as Deputy Treasurer of the Fidelity funds (2005-2008) and Treasurer and Chief Financial Officer of The North Carolina Capital Management Trust: Cash and Term Portfolios (2006-2008). |
Brian B. Hogan (45) |
| Year of Election or Appointment: 2009 Vice President of certain Equity Funds and Vice President of Sector Funds. Mr. Hogan also serves as Senior Vice President, Equity Research of FMR (2006-present) and President of FMR's Equity Division (2009-present). Previously, Mr. Hogan served as a portfolio manager. |
Thomas C. Hense (46) |
| Year of Election or Appointment: 2008 or 2010 Vice President of Fidelity's High Income (2008), Small Cap (2008), and Value (2010) Funds. Previously, Mr. Hense served as a portfolio manager for Fidelity's Institutional Money Management Group (Pyramis) (2003-2008). |
Scott C. Goebel (42) |
| Year of Election or Appointment: 2008 Secretary and Chief Legal Officer (CLO) of the Fidelity funds. Mr. Goebel also serves as General Counsel, Secretary, and Senior Vice President of FMR (2008-present) and FMR Co., Inc. (2008-present); Deputy General Counsel of FMR LLC; Chief Legal Officer of Fidelity Management & Research (Hong Kong) Limited (2008-present) and Assistant Secretary of Fidelity Management & Research (Japan) Inc. (2008-present), Fidelity Investments Money Management, Inc. (2008-present), Fidelity Management & Research (U.K.) Inc. (2008-present), and Fidelity Research and Analysis Company (2008-present). Previously, Mr. Goebel served as Assistant Secretary of the Funds (2007-2008) and as Vice President and Secretary of Fidelity Distributors Corporation (FDC) (2005-2007). |
William C. Coffey (41) |
| Year of Election or Appointment: 2009 Assistant Secretary of Fidelity's Equity and High Income Funds. Mr. Coffey also serves as Senior Vice President and Deputy General Counsel of FMR LLC (2010-present), and is an employee of Fidelity Investments. Previously, Mr. Coffey served as Vice President and Associate General Counsel of FMR LLC (2005-2009). |
Holly C. Laurent (56) |
| Year of Election or Appointment: 2008 Anti-Money Laundering (AML) Officer of the Fidelity funds. Ms. Laurent is an employee of Fidelity Investments. Previously, Ms. Laurent was Senior Vice President and Head of Legal for Fidelity Business Services India Pvt. Ltd. (2006-2008), and Senior Vice President, Deputy General Counsel and Group Head for FMR LLC (2005-2006). |
Christine Reynolds (51) |
| Year of Election or Appointment: 2008 Chief Financial Officer of the Fidelity funds. Ms. Reynolds became President of Fidelity Pricing and Cash Management Services (FPCMS) in August 2008. Ms. Reynolds served as Chief Operating Officer of FPCMS (2007-2008). Previously, Ms. Reynolds served as President, Treasurer, and Anti-Money Laundering officer of the Fidelity funds (2004-2007). |
Kenneth A. Rathgeber (63) |
| Year of Election or Appointment: 2004 Chief Compliance Officer of Fidelity's Equity and High Income Funds. Mr. Rathgeber is Chief Compliance Officer of Fidelity Management & Research (Hong Kong) Limited (2008-present), Fidelity Management & Research (Japan) Inc. (2008-present), FMR (2005-present), FMR Co., Inc. (2005-present), Fidelity Management & Research (U.K.) Inc. (2005-present), Fidelity Research & Analysis Company (2005-present), Fidelity Investments Money Management, Inc. (2005-present), Pyramis Global Advisors, LLC (2005-present), and Strategic Advisers, Inc. (2005-present). |
Jeffrey S. Christian (48) |
| Year of Election or Appointment: 2009 Deputy Treasurer of the Fidelity funds. Mr. Christian is an employee of Fidelity Investments. Previously, Mr. Christian served as Chief Financial Officer (2008-2009) of certain Fidelity funds and Senior Vice President of Fidelity Pricing and Cash Management Services (FPCMS) (2004-2009). |
Bryan A. Mehrmann (49) |
| Year of Election or Appointment: 2005 Deputy Treasurer of the Fidelity funds. Mr. Mehrmann is an employee of Fidelity Investments. |
Adrien E. Deberghes (42) |
| Year of Election or Appointment: 2008 Deputy Treasurer of Fidelity's Equity and High Income Funds. Mr. Deberghes also serves as Assistant Treasurer of other Fidelity funds (2010-present) and is an employee of Fidelity Investments (2008-present). Previously, Mr. Deberghes served as Senior Vice President of Mutual Fund Administration at State Street Corporation (2007-2008), Senior Director of Mutual Fund Administration at Investors Bank & Trust (2005-2007), and Director of Finance for Dunkin' Brands (2000-2005). |
Stephanie J. Dorsey (41) |
| Year of Election or Appointment: 2010 Assistant Treasurer of Fidelity's Equity and High Income Funds. Ms. Dorsey also serves as Deputy Treasurer of other Fidelity funds (2008- present) and is an employee of Fidelity Investments (2008-present). Previously, Ms. Dorsey served as Treasurer (2004-2008) of the JPMorgan Mutual Funds and Vice President (2004-2008) of JPMorgan Chase Bank. |
John R. Hebble (52) |
| Year of Election or Appointment: 2009 Assistant Treasurer of Fidelity's Equity and High Income Funds. Mr. Hebble also serves as Treasurer and Chief Financial Officer of The North Carolina Capital Management Trust: Cash and Term Portfolio (2008-present), President and Treasurer of other Fidelity funds (2008-present) and is an employee of Fidelity Investments. |
Gary W. Ryan (51) |
| Year of Election or Appointment: 2005 Assistant Treasurer of the Fidelity funds. Mr. Ryan is an employee of Fidelity Investments. Previously, Mr. Ryan served as Vice President of Fund Reporting in Fidelity Pricing and Cash Management Services (FPCMS) (1999-2005). |
Annual Report
Board Approval of Investment Advisory Contracts and Management Fees
Fidelity Small Cap Growth Fund
Each year, the Board of Trustees, including the Independent Trustees (together, the Board), votes on the renewal of the management contract and sub-advisory agreements (together, the Advisory Contracts) for the fund. The Board, assisted by the advice of fund counsel and Independent Trustees' counsel, requests and considers a broad range of information relevant to the renewal of the Advisory Contracts throughout the year.
The Board meets regularly and considers at each of its meetings factors that are relevant to its annual consideration of the renewal of the fund's Advisory Contracts, including the services and support provided to the fund and its shareholders. The Board has established various standing committees, each composed of Independent Trustees with varying backgrounds, to which the Board has assigned specific subject matter responsibilities in order to enhance effective decision-making by the Board. The Board, acting directly and through its Committees, requests and receives information concerning the annual consideration of the renewal of the fund's Advisory Contracts. The Board also meets as needed to consider matters specifically related to the Board's annual consideration of the renewal of Advisory Contracts. Members of the Board may also meet with trustees of other Fidelity funds through ad hoc joint committees to discuss certain matters relevant to the Fidelity funds.
At its July 2010 meeting, the Board of Trustees, including the Independent Trustees, unanimously determined to renew the fund's Advisory Contracts. In reaching its determination, the Board considered all factors it believed relevant, including (i) the nature, extent, and quality of the services to be provided to the fund and its shareholders (including the investment performance of the fund); (ii) the competitiveness of the fund's management fee and total expenses; (iii) the total costs of the services to be provided by and the profits to be realized by Fidelity from its relationship with the fund; (iv) the extent to which economies of scale would be realized as the fund grows; and (v) whether fee levels reflect these economies of scale, if any, for the benefit of fund shareholders.
In considering whether to renew the Advisory Contracts for the fund, the Board reached a determination, with the assistance of fund counsel and Independent Trustees' counsel and through the exercise of its business judgment, that the renewal of the Advisory Contracts is in the best interests of fund shareholders and that the compensation to be received by Fidelity under the management contract is fair and reasonable. The Board's decision to renew the Advisory Contracts was not based on any single factor noted above, but rather was based on a comprehensive consideration of all the information provided to the Board at its meetings throughout the year. The Board, in reaching its determination to renew the Advisory Contracts, is aware that shareholders in the fund have a broad range of investment choices available to them, including a wide choice among mutual funds offered by Fidelity's competitors, and that the fund's shareholders, with the opportunity to review and weigh the disclosure provided by the fund in its prospectus and other public disclosures, have chosen to invest in this fund, managed by Fidelity.
Annual Report
Board Approval of Investment Advisory Contracts and
Management Fees - continued
Nature, Extent, and Quality of Services Provided. The Board considered the staffing within the investment adviser, FMR, and the sub-advisers (together, the Investment Advisers), including the backgrounds of the fund's investment personnel and the fund's investment objective and discipline. The Independent Trustees also had discussions with senior management of Fidelity's investment operations and investment groups. The Board considered the structure of the portfolio manager compensation program and whether this structure provides appropriate incentives to act in the best interest of the fund.
Resources Dedicated to Investment Management and Support Services. The Board and the equity research subcommittee of the Board's Fund Oversight Committee reviewed the size, education, and experience of the Investment Advisers' investment staff, their use of technology, and the Investment Advisers' approach to recruiting, training, and retaining portfolio managers and other research, advisory, and management personnel. The Board noted that Fidelity's analysts have access to a variety of technological tools and market and securities data that enable them to perform both fundamental and quantitative analysis and to specialize in various disciplines. The Board considered Fidelity's extensive global research capabilities that enable the Investment Advisers to aggregate data from various sources in an effort to produce positive investment results. The Board also considered that Fidelity's portfolio managers and analysts have access to daily portfolio attribution that allows for monitoring of a fund's portfolio, as well as an electronic communication system that provides immediate real-time access to research concerning issuers and credit enhancers. The Board noted FMR's continued focus on strengthening the organization and discipline of equity portfolio management and research.
Shareholder and Administrative Services. The Board considered (i) the nature, extent, quality, and cost of advisory, administrative, and shareholder services performed by the Investment Advisers and their affiliates under the Advisory Contracts and under separate agreements covering transfer agency, pricing and bookkeeping, and securities lending services for the fund; (ii) the nature and extent of the investment adviser's supervision of third party service providers, principally custodians and subcustodians; and (iii) the resources devoted to, and the record of compliance with, the fund's compliance policies and procedures. The Board also reviewed the allocation of fund brokerage, including allocations to brokers affiliated with the Investment Advisers, the use of brokerage commissions to pay fund expenses, and the use of "soft" commission dollars to pay for research services.
Annual Report
The Board noted that the growth of fund assets over time across the complex allows Fidelity to reinvest in the development of services designed to enhance the value or convenience of the Fidelity funds as investment vehicles. These services include 24-hour access to account information and market information through phone representatives and over the Internet, and investor education materials and asset allocation tools.
Investment in a Large Fund Family. The Board considered the benefits to shareholders of investing in a Fidelity fund, including the benefits of investing in a fund that is part of a large family of funds offering a variety of investment disciplines and providing a large variety of mutual fund investor services. The Board noted that Fidelity had taken, or had made recommendations that resulted in the Fidelity funds taking, a number of actions over the previous year that benefited particular funds, including (i) dedicating additional resources to investment research and restructuring and broadening the focus of the investment research teams; (ii) bolstering the senior management team that oversees asset management; (iii) launching Class F of certain funds as a lower-fee class available to Freedom K and Freedom Index Funds; (iv) lowering the initial investment minimums and ongoing balance requirements for Real Estate High Income Fund; (v) eliminating subsequent purchase minimums for all funds and adding a waiver of the investment minimum requirement for new accounts opened with the proceeds of a systematic withdrawal plan; (vi) eliminating the withdrawal minimum and maximum limits for systematic withdrawals from Advisor funds; (vii) expanding sales load waivers on Class A shares for Destiny Planholders and expanding Institutional Class eligibility for Class O Destiny Planholders; and (viii) changing certain Class A and Class T sales charge structures to further align them with industry practices.
Investment Performance. The Board considered whether the fund has operated in accordance with its investment objective, as well as its record of compliance with its investment restrictions. It also reviewed the fund's absolute investment performance for each class (except Class F), as well as the fund's relative investment performance for each class (except Class F) measured over multiple periods against (i) a broad-based securities market index, and (ii) a peer group of mutual funds deemed appropriate by Fidelity and reviewed by the Board. The following charts considered by the Board show, over the one-, three-, and five-year periods ended December 31, 2009, the cumulative total returns of Institutional Class (Class I) and Class B of the fund, the cumulative total returns of a broad-based securities market index ("benchmark"), and a range of cumulative total returns of a peer group of mutual funds identified by Morningstar, Inc. as having an investment style similar to that of the fund based on underlying portfolio holdings. The returns of Institutional Class (Class I) and Class B show the performance of the highest and lowest performing classes, respectively (based on five-year performance). (Class F had less than one year of performance as of December 31, 2009.) The box within each chart shows the 25th percentile return (bottom of box) and the 75th percentile return (top of box) of the peer group. Returns shown above the box are in the first quartile and returns shown below the box are in the fourth quartile. The percentage beaten numbers noted below each chart correspond to the percentile box and represent the percentage of funds in the peer group whose performance was equal to or lower than that of the class indicated.
Annual Report
Board Approval of Investment Advisory Contracts and
Management Fees - continued
Fidelity Small Cap Growth Fund
The Board reviewed the fund's relative investment performance against its peer group and noted that the performance of Institutional Class (Class I) of the fund was in the first quartile for all the periods shown. The Board also noted that the investment performance of Institutional Class (Class I) of the fund compared favorably to its benchmark for all the periods shown. The Board considered that the variations in performance among the fund's classes reflect the variations in class expenses, which result in lower performance for higher expense classes. The Board also reviewed the fund's performance since inception as well as performance in the current year.
The Board also considered that the fund's management fee is subject to upward or downward adjustment depending upon whether, and to what extent, the fund's investment performance for the performance period exceeds, or is exceeded by, the record (over the same period) of a Board-approved performance adjustment index. The Board realizes that the performance adjustment provides FMR with a strong economic incentive to seek to achieve superior performance for the fund's shareholders and helps to more closely align the interests of FMR and the fund's shareholders.
Based on its review, and giving particular weight to the nature and quality of the resources dedicated by the Investment Advisers to maintain and improve relative performance and factoring in the unprecedented market events in recent years, the Board concluded that the nature, extent, and quality of investment management and support services and of shareholder and administrative services provided to the fund will benefit the fund's shareholders, particularly in light of the Board's view that the fund's shareholders benefit from investing in a fund that is part of a large family of funds offering a variety of investment disciplines and services.
Annual Report
Competitiveness of Management Fee and Total Fund Expenses. The Board considered the fund's management fee and total expenses compared to "mapped groups" of competitive funds and classes. Fidelity creates "mapped groups" by combining similar Lipper investment objective categories that have comparable management fee characteristics. Combining Lipper investment objective categories aids the Board's management fee and total expense comparisons by broadening the competitive group used for comparison and by reducing the number of universes to which various Fidelity funds are compared.
Management Fee. The Board considered two proprietary management fee comparisons for the 12-month periods shown in the chart below. The group of Lipper funds used by the Board for management fee comparisons is referred to below as the "Total Mapped Group." The Total Mapped Group comparison focuses on a fund's standing relative to the total universe of comparable funds available to investors, in terms of gross management fees before expense reimbursements or caps, and without giving effect to the fund's performance adjustment. "TMG %" represents the percentage of funds in the Total Mapped Group that had management fees that were lower than the fund's. For example, a TMG % of 13% means that 87% of the funds in the Total Mapped Group had higher management fees than the fund. The "Asset-Size Peer Group" (ASPG) comparison focuses on a fund's standing relative to non-Fidelity funds similar in size to the fund within the Total Mapped Group. The ASPG represents at least 15% of the funds in the Total Mapped Group with comparable asset size and management fee characteristics, subject to a minimum of 50 funds (or all funds in the Total Mapped Group if fewer than 50). Additional information, such as the ASPG quartile in which the fund's management fee ranked and the impact of the fund's performance adjustment, is also included in the chart and considered by the Board.
Annual Report
Board Approval of Investment Advisory Contracts and
Management Fees - continued
Fidelity Small Cap Growth Fund
The Board noted that the fund's management fee ranked below the median of its Total Mapped Group and below the median of its ASPG for 2009. The Board also noted the effect of the fund's positive performance adjustment on the fund's management fee ranking. The Board noted that the performance adjustment for each year represents calculations for performance periods that differ from the periods shown in the performance charts above.
Based on its review, the Board concluded that the fund's management fee is fair and reasonable in light of the services that the fund receives and the other factors considered.
Total Expenses. In its review of each class's total expenses, the Board considered the fund's management fee as well as other fund or class expenses, as applicable, such as transfer agent fees, pricing and bookkeeping fees, fund-paid 12b-1 fees, and custodial, legal, and audit fees. The Board also noted the effects of any waivers and reimbursements on fees and expenses, as well as the impact of the fund's performance adjustment. As part of its review, the Board also considered current and historical total expenses of each class of the fund compared to competitive fund median expenses. Each class of the fund is compared to those funds and classes in the Total Mapped Group (used by the Board for management fee comparisons) that have a similar sales load structure.
The Board noted that the total expenses of each of Class A, Class B, Institutional Class, the retail class, and Class F ranked below its competitive median for the period, the total expenses of Class C ranked equal to its competitive median for the period, and the total expenses of Class T ranked above its competitive median for the period. The Board considered that the total expenses for Class T were above the median primarily because its 12b-1 fee is higher than the typical front-end load class. The Board noted that the fund offers multiple classes, each of which has a different sales load and 12b-1 fee structure, and that the multiple structures are intended to offer a range of pricing options for the intermediary market. The Board also noted that the total expenses of the classes vary primarily by the level of their 12b-1 fees, although differences in transfer agent fees may also cause expenses to vary from class to class.
Annual Report
Fees Charged to Other Fidelity Clients. The Board also considered Fidelity fee structures and other information with respect to clients of FMR and its affiliates, such as other mutual funds advised or subadvised by FMR or its affiliates, pension plan clients, and other institutional clients. In March 2010, the Board created an ad hoc joint committee with the board of other Fidelity funds (the Committee) to review and compare Fidelity's institutional investment advisory business with its business of providing services to the Fidelity funds, including the differences in services provided, fees charged, and costs incurred, as well as competition in their respective marketplaces.
Based on its review of total expenses and fees charged to other Fidelity clients, the Board concluded that the total expenses of each class of the fund were reasonable, although in one case above the median of the universe presented for comparison, in light of the services that the fund and its shareholders receive and the other factors considered, including the findings of the Committee.
Costs of the Services and Profitability. The Board considered the revenues earned and the expenses incurred by Fidelity in conducting the business of developing, marketing, distributing, managing, administering and servicing the fund and its shareholders. The Board also considered the level of Fidelity's profits in respect of all the Fidelity funds.
On an annual basis, FMR presents to the Board Fidelity's profitability for the fund. Fidelity calculates the profitability for each fund, as well as aggregate profitability for groups of Fidelity funds and all Fidelity funds, using a series of detailed revenue and cost allocation methodologies which originate with the audited books and records of Fidelity. The Audit Committee of the Board reviews any significant changes from the prior year's methodologies.
PricewaterhouseCoopers LLP (PwC), independent registered public accounting firm and auditor to Fidelity and certain Fidelity funds, has been engaged annually by the Board as part of the Board's assessment of Fidelity's profitability analysis. PwC's engagement includes the review and assessment of Fidelity's methodologies used in determining the revenues and expenses attributable to Fidelity's mutual fund business, and completion of agreed-upon procedures surrounding the mathematical accuracy of fund profitability and its conformity to allocation methodologies. After considering PwC's reports issued under the engagement and information provided by Fidelity, the Board believes that while other allocation methods may also be reasonable, Fidelity's profitability methodologies are reasonable in all material respects.
Annual Report
Board Approval of Investment Advisory Contracts and
Management Fees - continued
The Board has also reviewed Fidelity's non-fund businesses and fall-out benefits related to the mutual fund business as well as cases where Fidelity's affiliates may benefit from or be related to the fund's business.
The Board considered the costs of the services provided by and the profits realized by Fidelity in connection with the operation of the fund and were satisfied that the profitability was not excessive in the circumstances.
Economies of Scale. The Board considered whether there have been economies of scale in respect of the management of the Fidelity funds, whether the Fidelity funds (including the fund) have appropriately benefited from any such economies of scale, and whether there is potential for realization of any further economies of scale. The Board considered the extent to which the fund will benefit from economies of scale through increased services to the fund, through waivers or reimbursements, or through fee or expense reductions.
In February 2009, the Board and the board of other Fidelity funds created an ad hoc committee (the Economies of Scale Committee) to analyze whether FMR attains economies of scale in respect of the management and servicing of the Fidelity funds, whether the Fidelity funds have appropriately benefited from such economies of scale, and whether there is potential for realization of any further economies of scale.
The Board recognized that the fund's management contract incorporates a "group fee" structure, which provides for lower group fee rates as total fund assets under FMR's management increase, and for higher group fee rates as total fund assets under FMR's management decrease. FMR calculates the group fee rates based on a tiered asset "breakpoint" schedule that varies based on asset class. The Board considered that the group fee is designed to deliver the benefits of economies of scale to fund shareholders when total Fidelity fund assets increase, even if assets of any particular fund are unchanged or have declined, because some portion of Fidelity's costs are attributable to services provided to all Fidelity funds, and all funds benefit if those costs can be allocated among more assets. The Board concluded that, given the group fee structure, fund shareholders will benefit from lower management fees as assets under FMR's management increase at the fund complex level, regardless of whether Fidelity achieves any such economies of scale.
The Board concluded, considering the findings of the Economies of Scale Committee, that any potential economies of scale are being appropriately shared between fund shareholders and Fidelity.
Annual Report
Additional Information Requested by the Board. In order to develop fully the factual basis for consideration of the Fidelity funds' Advisory Contracts, the Board requested and received additional information on certain topics, including (i) fund performance trends, actions to be taken by FMR to improve certain funds' overall performance, and Fidelity's long-term strategies for certain funds; (ii) portfolio manager changes that have occurred during the past year and length of portfolio manager tenure for different categories of funds over time; (iii) Fidelity's compensation structure for portfolio managers, research analysts, and other key personnel, the rationale for the compensation structure, and how the compensation structure provides appropriate performance incentives; (iv) the amount of the investment that each portfolio manager has made in the Fidelity fund(s) that he or she manages; (v) management and other fees paid by FMR to affiliated sub-advisers on behalf of the Fidelity funds; (vi) Fidelity's fee structures and rationale for recommending different fees among different categories of funds; (vii) Fidelity's rationale for recommending which funds should have a performance adjustment component as part of their management fees; (viii) the rationale for any differences between fund fee structures and fee structures in place for other Fidelity clients; and (ix) explanations regarding the relative total expenses borne by certain funds and classes, total expense competitive trends, and actions that might be taken by FMR to reduce total expenses for certain funds and classes.
Based on its evaluation of all of the conclusions noted above, and after considering all factors it believed relevant, the Board ultimately concluded that the advisory fee structures are fair and reasonable, and that the fund's Advisory Contracts should be renewed.
Annual Report
Investment Adviser
Fidelity Management & Research Company
Boston, MA
Investment Sub-Advisers
FMR Co., Inc.
Fidelity Management & Research
(U.K.) Inc.
Fidelity Research & Analysis Company
Fidelity Management & Research
(Hong Kong) Limited
Fidelity Management & Research
(Japan) Inc.
General Distributor
Fidelity Distributors Corporation
Boston, MA
Transfer and Service Agents
Fidelity Investments Institutional
Operations Company, Inc.
Boston, MA
Fidelity Service Company, Inc.
Boston, MA
Custodian
Citibank, N.A.
New York, NY
ASCPI-UANN-0910
1.803721.105
Fidelity®
Small Cap Value
Fund
Annual Report
July 31, 2010
(2_fidelity_logos) (Registered_Trademark)
Contents
Chairman's Message | <Click Here> | The Chairman's message to shareholders. |
Performance | <Click Here> | How the fund has done over time. |
Management's Discussion of Fund Performance | <Click Here> | The Portfolio Manager's review of fund performance and strategy. |
Shareholder Expense Example | <Click Here> | An example of shareholder expenses. |
Investment Changes | <Click Here> | A summary of major shifts in the fund's investments over the past six months. |
Investments | <Click Here> | A complete list of the fund's investments with their market values. |
Financial Statements | <Click Here> | Statements of assets and liabilities, operations, and changes in net assets,
as well as financial highlights. |
Notes | <Click Here> | Notes to the financial statements. |
Report of Independent Registered Public Accounting Firm | <Click Here> | |
Trustees and Officers | <Click Here> | |
Distributions | <Click Here> | |
Board Approval of Investment Advisory Contracts and Management Fees | <Click Here> | |
To view a fund's proxy voting guidelines and proxy voting record for the 12-month period ended June 30, visit http://www.fidelity.com/proxyvotingresults or visit the Securities and Exchange Commission's (SEC) web site at http://www.sec.gov. You may also call 1-800-544-8544 to request a free copy of the proxy voting guidelines.
Standard & Poor's, S&P and S&P 500 are registered service marks of The McGraw-Hill Companies, Inc. and have been licensed for use by Fidelity Distributors Corporation.
Other third party marks appearing herein are the property of their respective owners.
All other marks appearing herein are registered or unregistered trademarks or service marks of FMR LLC or an affiliated company.
Annual Report
This report and the financial statements contained herein are submitted for the general information of the shareholders of the fund. This report is not authorized for distribution to prospective investors in the fund unless preceded or accompanied by an effective prospectus.
A fund files its complete schedule of portfolio holdings with the SEC for the first and third quarters of each fiscal year on Form N-Q. Forms N-Q are available on the SEC's web site at http://www.sec.gov. A fund's Forms N-Q may be reviewed and copied at the SEC's Public Reference Room in Washington, DC. Information regarding the operation of the SEC's Public Reference Room may be obtained by calling 1-800-SEC-0330. For a complete list of a fund's portfolio holdings, view the most recent holdings listing, semiannual report, or annual report on Fidelity's web site at http://www.fidelity.com or http://www.advisor.fidelity.com, as applicable.
NOT FDIC INSURED • MAY LOSE VALUE • NO BANK GUARANTEE
Neither the fund nor Fidelity Distributors Corporation is a bank.
Annual Report
(photo_of_Edward_C_Johnson_3d)
Dear Shareholder:
A yearlong uptrend in global equity markets reversed course in late April 2010 when investor sentiment turned bearish due in great measure to concern that Europe's debt crisis would expand and slow or derail economic recovery. However, a bounceback in July helped to recover some of the ground that was lost. Financial markets are always unpredictable, of course, but there also are several time-tested investment principles that can help put the odds in your favor.
One of the basic tenets is to invest for the long term. Over time, riding out the markets' inevitable ups and downs has proven much more effective than selling into panic or chasing the hottest trend. Even missing only a few of the markets' best days can significantly diminish investor returns. Patience also affords the benefits of compounding - of earning interest on additional income or reinvested dividends and capital gains. There can be tax advantages and cost benefits to consider as well. While staying the course doesn't eliminate risk, it can considerably lessen the effect of short-term declines.
You can further manage your investing risk through diversification. And today, more than ever, geographic diversification should be taken into account. Studies indicate that asset allocation is the single most important determinant of a portfolio's long-term success. The right mix of stocks, bonds and cash - aligned to your particular risk tolerance and investment objective - is very important. Age-appropriate rebalancing is also an essential aspect of asset allocation. For younger investors, an emphasis on equities - which historically have been the best-performing asset class over time - is encouraged. As investors near their specific goal, such as retirement or sending a child to college, consideration may be given to replacing volatile assets (e.g. common stocks) with more-stable fixed investments (bonds or savings plans).
A third principle - investing regularly - can help lower the average cost of your purchases. Investing a certain amount of money each month or quarter helps ensure you won't pay for all your shares at market highs. This strategy - known as dollar cost averaging - also reduces "emotion" from investing, helping shareholders avoid selling weak performers just prior to an upswing, or chasing a hot performer just before a correction.
We invite you to contact us via the Internet, through our Investor Centers or by phone. It is our privilege to provide you the information you need to make the investments that are right for you.
Sincerely,
(The chairman's signature appears here.)
Edward C. Johnson 3d
Annual Report
Average annual total return reflects the change in the value of an investment, assuming reinvestment of the class' distributions from dividend income and capital gains (the profits earned upon the sale of securities that have grown in value, if any) and assuming a constant rate of performance each year. The $10,000 table and the fund's returns do not reflect the deduction of taxes that a shareholder would pay on fund distributions or the redemption of fund shares. During periods of reimbursement by Fidelity, a fund's total return will be greater than it would be had the reimbursement not occurred. How a fund did yesterday is no guarantee of how it will do tomorrow.
Average Annual Total Returns
Periods ended July 31, 2010 | Past 1
year | Past 5
years | Life of
fundA |
Fidelity Small Cap Value Fund | 21.32% | 4.02% | 8.09% |
A From November 3, 2004.
$10,000 Over Life of Fund
Let's say hypothetically that $10,000 was invested in Fidelity Small Cap Value Fund, a class of the fund, on November 3, 2004, when the fund started. The chart shows how the value of your investment would have changed, and also shows how the Russell 2000® Value Index performed over the same period.
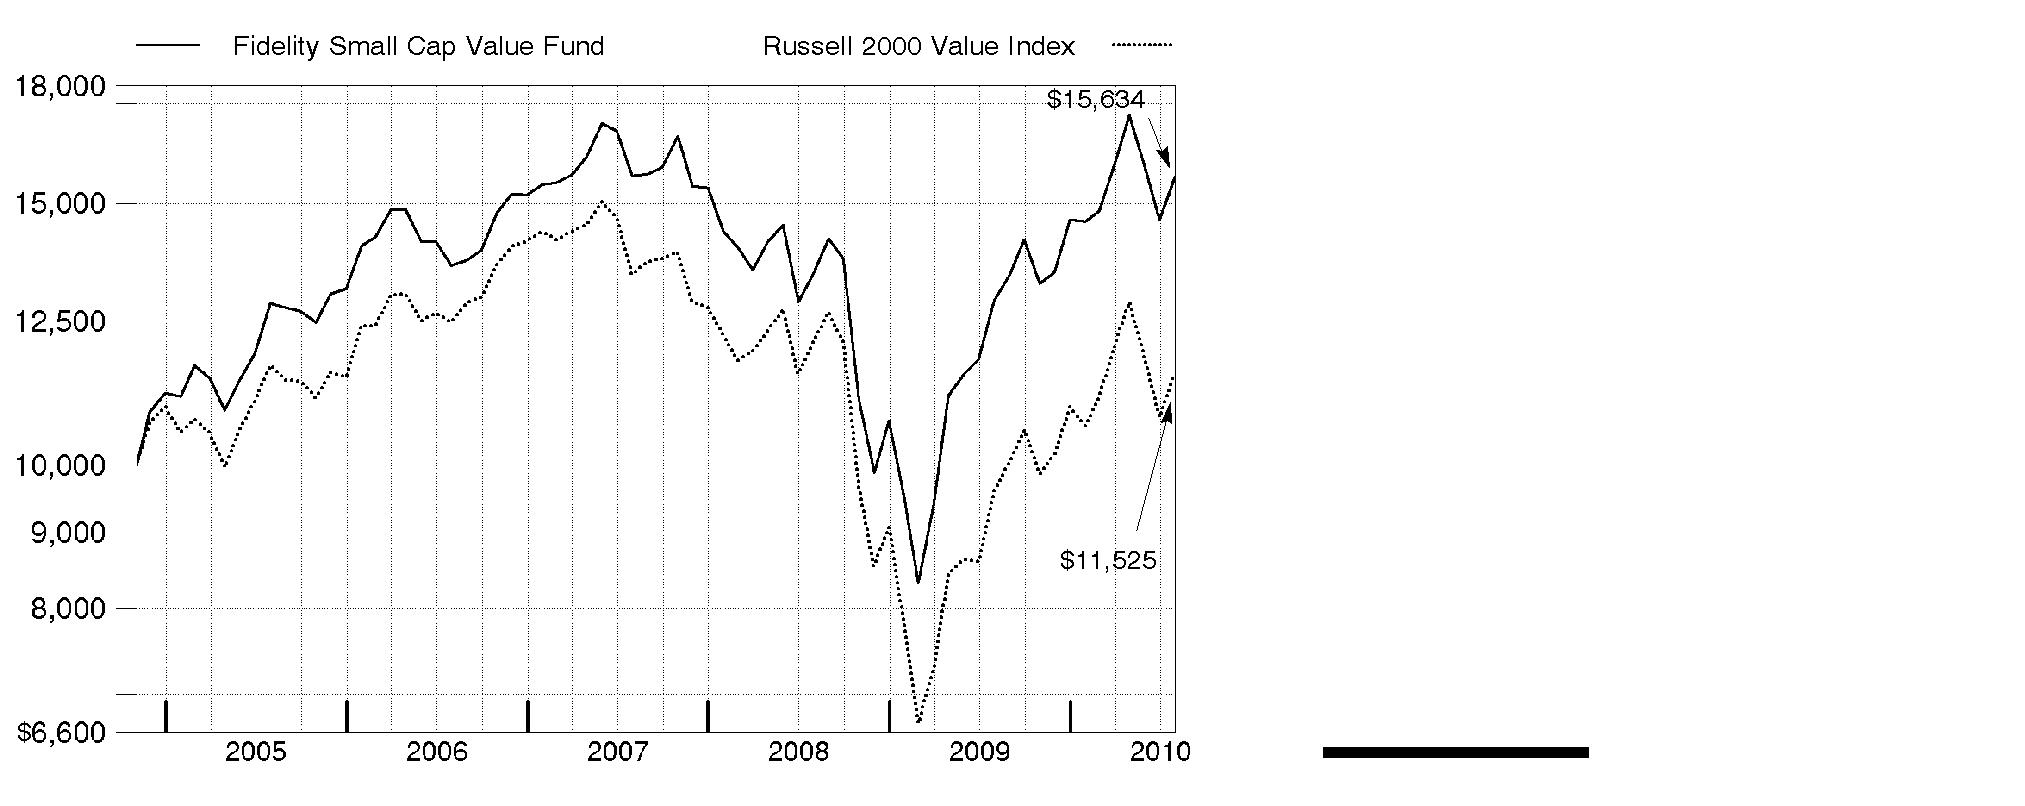
Annual Report
Market Recap: U.S. stock markets saw double-digit gains for the year ending July 31, 2010, despite the return of market volatility and risk aversion during the first half of 2010. An impressive bull run continued through 2009, bolstered by improvement in the economy and credit markets. Early in the new year, however, stocks fell sharply amid concerns about the global economic recovery, fueled by European debt woes and China's efforts to restrain inflation. After this brief dip, markets regained their upward momentum, as government stimulus and significant corporate cost cutting led to encouraging earnings reports, improved credit conditions and rising consumer confidence. Positive news continued through mid-April, when the Dow Jones Industrial AverageSM pushed above the 11,000 mark for the first time in 19 months. That milestone was short-lived, however, as heightened concern about the European debt crisis sparked an abrupt sell-off in May, leading to the first official correction since the rally began in March 2009. Although the market's malaise continued through June, stocks saw solid gains in July. For the year, the Dow rose 17.28%, while the S&P 500® Index was up 13.84%. Elsewhere, the technology-laden Nasdaq Composite® Index returned 14.99%. Small- and mid-cap stocks performed best, as measured by the 18.43% increase of the Russell 2000® Index and the 23.21% gain of the Russell Midcap® Index.
Comments from Charles Myers, Portfolio Manager of Fidelity® Small Cap Value Fund: For the year, the fund's Retail Class shares rose 21.32%, outpacing the 20.11% return of the Russell 2000 Value Index. Security selection in financials helped, especially banks and real estate stocks, although my diversified financials holdings didn't do well. Stock picking in consumer staples - especially food/staples retailing - as well as energy and materials also were notable positives, while consumer discretionary hurt. On an individual security basis, the fund's top contributors included Carpenter Technology, a specialty metals manufacturer, and real estate stocks Alexandria Real Estate Equities and Jones Lang LaSalle. Oil and gas company Mariner Energy also helped. I sold my stake shortly after the company agreed to be acquired for a premium price. In contrast, auto-industry challenges hurt DealerTrack Holdings, a car-dealer software and services provider, and Penske Automotive Group, a dealership chain I sold before period end. Utility RRI Energy, another stock I sold, also detracted. Many of the names I've mentioned were not in the index.
The views expressed above reflect those of the portfolio manager(s) only through the end of the period as stated on the cover of this report and do not necessarily represent the views of Fidelity or any other person in the Fidelity organization. Any such views are subject to change at any time based upon market or other conditions and Fidelity disclaims any responsibility to update such views. These views may not be relied on as investment advice and, because investment decisions for a Fidelity fund are based on numerous factors, may not be relied on as an indication of trading intent on behalf of any Fidelity fund.
Annual Report
Shareholder Expense Example
As a shareholder of the Fund, you incur two types of costs: (1) transaction costs, including sales charges (loads) on purchase payments or redemption proceeds, redemption fees, and (2) ongoing costs, including management fees, distribution and/or service (12b-1) fees and other Fund expenses. This Example is intended to help you understand your ongoing costs (in dollars) of investing in the Fund and to compare these costs with the ongoing costs of investing in other mutual funds.
The Example is based on an investment of $1,000 invested at the beginning of the period and held for the entire period (February 1, 2010 to July 31, 2010).
Actual Expenses
The first line of the accompanying table for each class of the Fund provides information about actual account values and actual expenses. You may use the information in this line, together with the amount you invested, to estimate the expenses that you paid over the period. Simply divide your account value by $1,000.00 (for example, an $8,600 account value divided by $1,000.00 = 8.6), then multiply the result by the number in the first line for a class of the Fund under the heading entitled "Expenses Paid During Period" to estimate the expenses you paid on your account during this period. A small balance maintenance fee of $12.00 that is charged once a year may apply for certain accounts with a value of less than $2,000. This fee is not included in the table below. If it was, the estimate of expenses you paid during the period would be higher, and your ending account value lower, by this amount. In addition, the Fund, as a shareholder in the underlying Fidelity Central Funds, will indirectly bear its pro-rata share of the fees and expenses incurred by the underlying Fidelity Central Funds. These fees and expenses are not included in the Fund's annualized expense ratio used to calculate the expense estimate in the table below.
Hypothetical Example for Comparison Purposes
The second line of the accompanying table for each class of the Fund provides information about hypothetical account values and hypothetical expenses based on a Class' actual expense ratio and an assumed rate of return of 5% per year before expenses, which is not the Class' actual return. The hypothetical account values and expenses may not be used to estimate the actual ending account balance or expenses you paid for the period. You may use this information to compare the ongoing costs of investing in the Fund and other funds. To do so, compare this 5% hypothetical example with the 5% hypothetical examples that appear in the shareholder reports of the other funds. A small balance maintenance fee of $12.00 that is charged once a year may apply for certain accounts with a value of less than $2,000. This fee is not included in the table below. If it was, the estimate of expenses you paid during the period would be higher, and your ending account value lower, by this amount. In addition, the Fund, as a shareholder in the underlying Fidelity Central Funds, will indirectly bear its pro-rata share of the fees and expenses incurred by the underlying Fidelity Central Funds. These fees and expenses are not included in the Fund's annualized expense ratio used to calculate the expense estimate in the table below.
Please note that the expenses shown in the table are meant to highlight your ongoing costs only and do not reflect any transaction costs. Therefore, the second line of the table is useful in comparing ongoing costs only, and will not help you determine the relative total costs of owning different funds. In addition, if these transactional costs were included, your costs would have been higher.
Annual Report
Shareholder Expense Example - continued
| Annualized
Expense
Ratio | Beginning
Account Value
February 1, 2010 | Ending
Account Value
July 31, 2010 | Expenses Paid
During Period*
February 1, 2010 to
July 31, 2010 |
Class A | 1.40% | | | |
Actual | | $ 1,000.00 | $ 1,070.90 | $ 7.19 |
HypotheticalA | | $ 1,000.00 | $ 1,017.85 | $ 7.00 |
Class T | 1.65% | | | |
Actual | | $ 1,000.00 | $ 1,069.80 | $ 8.47 |
HypotheticalA | | $ 1,000.00 | $ 1,016.61 | $ 8.25 |
Class B | 2.15% | | | |
Actual | | $ 1,000.00 | $ 1,066.90 | $ 11.02 |
HypotheticalA | | $ 1,000.00 | $ 1,014.13 | $ 10.74 |
Class C | 2.15% | | | |
Actual | | $ 1,000.00 | $ 1,066.00 | $ 11.01 |
HypotheticalA | | $ 1,000.00 | $ 1,014.13 | $ 10.74 |
Small Cap Value | 1.16% | | | |
Actual | | $ 1,000.00 | $ 1,071.90 | $ 5.96 |
HypotheticalA | | $ 1,000.00 | $ 1,019.04 | $ 5.81 |
Class F | .90% | | | |
Actual | | $ 1,000.00 | $ 1,073.50 | $ 4.63 |
HypotheticalA | | $ 1,000.00 | $ 1,020.33 | $ 4.51 |
Institutional Class | 1.12% | | | |
Actual | | $ 1,000.00 | $ 1,072.70 | $ 5.76 |
HypotheticalA | | $ 1,000.00 | $ 1,019.24 | $ 5.61 |
A 5% return per year before expenses
* Expenses are equal to each Class' annualized expense ratio, multiplied by the average account value over the period, multiplied by 181/365 (to reflect the one-half year period).
Annual Report
Investment Changes (Unaudited)
Top Ten Stocks as of July 31, 2010 |
| % of fund's
net assets | % of fund's net assets
6 months ago |
Platinum Underwriters Holdings Ltd. | 3.1 | 2.8 |
WESCO International, Inc. | 3.1 | 3.0 |
Superior Energy Services, Inc. | 3.0 | 2.7 |
BJ's Wholesale Club, Inc. | 3.0 | 2.4 |
Alexandria Real Estate Equities, Inc. | 2.8 | 2.8 |
Berry Petroleum Co. Class A | 2.7 | 0.0 |
Astoria Financial Corp. | 2.7 | 3.4 |
HNI Corp. | 2.6 | 2.6 |
UGI Corp. | 2.5 | 0.0 |
TCF Financial Corp. | 2.5 | 2.2 |
| 28.0 | |
Top Five Market Sectors as of July 31, 2010 |
| % of fund's
net assets | % of fund's net assets
6 months ago |
Financials | 37.8 | 35.7 |
Industrials | 12.8 | 13.5 |
Consumer Discretionary | 11.5 | 11.3 |
Information Technology | 8.3 | 9.9 |
Utilities | 6.4 | 4.8 |
Asset Allocation (% of fund's net assets) |
As of July 31, 2010* | As of January 31, 2010** |
| Stocks 99.2% | | | Stocks 99.5% | |
| Short-Term
Investments and
Net Other Assets 0.8% | | | Short-Term
Investments and
Net Other Assets 0.5% | |
* Foreign investments | 10.5% | | ** Foreign investments | 9.6% | |

Annual Report
Investments July 31, 2010
Showing Percentage of Net Assets
Common Stocks - 97.8% |
| Shares | | Value |
CONSUMER DISCRETIONARY - 10.9% |
Diversified Consumer Services - 3.0% |
Matthews International Corp. Class A | 640,187 | | $ 23,117,153 |
Regis Corp. (d) | 2,745,882 | | 41,819,783 |
| | 64,936,936 |
Household Durables - 5.1% |
M.D.C. Holdings, Inc. | 1,224,300 | | 35,651,616 |
Meritage Homes Corp. (a) | 1,536,160 | | 27,005,693 |
Ryland Group, Inc. | 2,153,837 | | 35,150,620 |
Tempur-Pedic International, Inc. (a) | 400,000 | | 12,268,000 |
| | 110,075,929 |
Specialty Retail - 1.8% |
Asbury Automotive Group, Inc. (a) | 1,465,159 | | 19,721,040 |
Tsutsumi Jewelry Co. Ltd. | 791,400 | | 18,405,716 |
| | 38,126,756 |
Textiles, Apparel & Luxury Goods - 1.0% |
Iconix Brand Group, Inc. (a) | 1,330,087 | | 21,893,232 |
TOTAL CONSUMER DISCRETIONARY | | 235,032,853 |
CONSUMER STAPLES - 4.7% |
Food & Staples Retailing - 3.6% |
BJ's Wholesale Club, Inc. (a) | 1,390,000 | | 63,314,500 |
Ingles Markets, Inc. Class A | 838,531 | | 13,634,514 |
| | 76,949,014 |
Food Products - 1.1% |
Chiquita Brands International, Inc. (a)(d) | 1,600,000 | | 23,488,000 |
TOTAL CONSUMER STAPLES | | 100,437,014 |
ENERGY - 5.7% |
Energy Equipment & Services - 3.0% |
Superior Energy Services, Inc. (a) | 2,841,700 | | 64,762,343 |
Oil, Gas & Consumable Fuels - 2.7% |
Berry Petroleum Co. Class A | 1,950,000 | | 58,149,000 |
TOTAL ENERGY | | 122,911,343 |
FINANCIALS - 37.0% |
Capital Markets - 2.8% |
optionsXpress Holdings, Inc. (a) | 2,055,000 | | 32,058,000 |
Common Stocks - continued |
| Shares | | Value |
FINANCIALS - continued |
Capital Markets - continued |
TradeStation Group, Inc. (a)(e) | 2,062,291 | | $ 13,178,039 |
Waddell & Reed Financial, Inc. Class A | 640,000 | | 15,251,200 |
| | 60,487,239 |
Commercial Banks - 11.8% |
Associated Banc-Corp. | 3,687,610 | | 50,114,620 |
CapitalSource, Inc. | 6,405,000 | | 34,458,900 |
City National Corp. | 784,900 | | 44,480,283 |
National Penn Bancshares, Inc. | 2,775,154 | | 18,482,526 |
PacWest Bancorp (e) | 1,794,200 | | 37,552,606 |
TCF Financial Corp. (d) | 3,385,800 | | 53,631,072 |
Western Liberty Bancorp (a)(e) | 2,400,000 | | 14,976,000 |
| | 253,696,007 |
Insurance - 7.3% |
Alterra Capital Holdings Ltd. | 2,057,411 | | 39,810,903 |
Aspen Insurance Holdings Ltd. | 1,820,200 | | 49,782,470 |
Platinum Underwriters Holdings Ltd. | 1,696,975 | | 66,317,783 |
| | 155,911,156 |
Real Estate Investment Trusts - 8.4% |
Alexandria Real Estate Equities, Inc. (d) | 848,300 | | 59,847,565 |
DCT Industrial Trust, Inc. | 10,000,000 | | 46,900,000 |
Highwoods Properties, Inc. (SBI) | 1,470,330 | | 46,036,032 |
National Retail Properties, Inc. (d) | 1,140,000 | | 26,356,800 |
| | 179,140,397 |
Real Estate Management & Development - 1.9% |
Jones Lang LaSalle, Inc. | 538,628 | | 41,722,125 |
Thrifts & Mortgage Finance - 4.8% |
Astoria Financial Corp. | 4,318,152 | | 57,172,332 |
Washington Federal, Inc. | 2,616,175 | | 45,521,445 |
| | 102,693,777 |
TOTAL FINANCIALS | | 793,650,701 |
HEALTH CARE - 6.3% |
Health Care Providers & Services - 6.3% |
Centene Corp. (a) | 972,542 | | 20,724,870 |
Chemed Corp. | 510,200 | | 26,999,784 |
MEDNAX, Inc. (a) | 721,500 | | 34,018,725 |
Providence Service Corp. (a)(e) | 1,016,495 | | 14,637,528 |
Common Stocks - continued |
| Shares | | Value |
HEALTH CARE - continued |
Health Care Providers & Services - continued |
Team Health Holdings, Inc. | 2,146,700 | | $ 28,143,237 |
VCA Antech, Inc. (a) | 518,000 | | 10,795,120 |
| | 135,319,264 |
INDUSTRIALS - 12.8% |
Commercial Services & Supplies - 7.0% |
ACCO Brands Corp. (a)(e) | 3,720,923 | | 22,027,864 |
HNI Corp. (d) | 2,149,671 | | 55,547,499 |
Knoll, Inc. | 1,412,898 | | 19,822,959 |
United Stationers, Inc. (a) | 990,400 | | 53,630,160 |
| | 151,028,482 |
Machinery - 1.3% |
Blount International, Inc. (a)(e) | 2,604,723 | | 27,740,300 |
Trading Companies & Distributors - 4.5% |
H&E Equipment Services, Inc. (a)(e) | 3,489,408 | | 30,357,850 |
WESCO International, Inc. (a) | 1,825,000 | | 65,572,250 |
| | 95,930,100 |
TOTAL INDUSTRIALS | | 274,698,882 |
INFORMATION TECHNOLOGY - 8.3% |
Communications Equipment - 1.4% |
ViaSat, Inc. (a) | 809,472 | | 29,254,318 |
Electronic Equipment & Components - 4.0% |
Ingram Micro, Inc. Class A (a) | 2,253,100 | | 37,243,743 |
Macnica, Inc. | 677,400 | | 14,837,353 |
Ryoyo Electro Corp. (e) | 1,772,700 | | 18,932,046 |
SYNNEX Corp. (a) | 558,898 | | 14,749,318 |
| | 85,762,460 |
Internet Software & Services - 1.7% |
DealerTrack Holdings, Inc. (a) | 1,383,804 | | 21,601,180 |
j2 Global Communications, Inc. (a) | 630,149 | | 14,827,406 |
| | 36,428,586 |
Semiconductors & Semiconductor Equipment - 0.7% |
Miraial Co. Ltd. (e) | 570,200 | | 15,372,473 |
Software - 0.5% |
Monotype Imaging Holdings, Inc. (a) | 1,358,151 | | 11,299,816 |
TOTAL INFORMATION TECHNOLOGY | | 178,117,653 |
Common Stocks - continued |
| Shares | | Value |
MATERIALS - 5.0% |
Chemicals - 0.7% |
Spartech Corp. (a) | 1,387,702 | | $ 14,515,363 |
Metals & Mining - 4.3% |
Carpenter Technology Corp. | 1,284,380 | | 44,889,081 |
RTI International Metals, Inc. (a)(e) | 1,692,597 | | 48,035,903 |
| | 92,924,984 |
TOTAL MATERIALS | | 107,440,347 |
TELECOMMUNICATION SERVICES - 0.7% |
Diversified Telecommunication Services - 0.7% |
Cogent Communications Group, Inc. (a) | 1,665,000 | | 14,352,300 |
UTILITIES - 6.4% |
Electric Utilities - 2.2% |
Westar Energy, Inc. | 1,960,000 | | 46,804,800 |
Gas Utilities - 4.2% |
Southwest Gas Corp. | 1,130,989 | | 36,383,916 |
UGI Corp. | 2,000,000 | | 53,920,000 |
| | 90,303,916 |
TOTAL UTILITIES | | 137,108,716 |
TOTAL COMMON STOCKS (Cost $1,920,724,852) | 2,099,069,073 |
Nonconvertible Preferred Stocks - 1.4% |
| | | |
CONSUMER DISCRETIONARY - 0.6% |
Household Durables - 0.6% |
M/I Homes, Inc. Series A, 9.75% (a) | 734,300 | | 13,033,825 |
FINANCIALS - 0.8% |
Real Estate Investment Trusts - 0.8% |
Developers Diversified Realty Corp. (depositary shares) Series H, 7.375% | 818,790 | | 18,013,380 |
TOTAL NONCONVERTIBLE PREFERRED STOCKS (Cost $20,083,684) | 31,047,205 |
Money Market Funds - 3.5% |
| Shares | | Value |
Fidelity Cash Central Fund, 0.24% (b) | 15,579,695 | | $ 15,579,695 |
Fidelity Securities Lending Cash Central Fund, 0.27% (b)(c) | 59,928,075 | | 59,928,075 |
TOTAL MONEY MARKET FUNDS (Cost $75,507,770) | 75,507,770 |
TOTAL INVESTMENT PORTFOLIO - 102.7% (Cost $2,016,316,306) | | 2,205,624,048 |
NET OTHER ASSETS (LIABILITIES) - (2.7)% | | (58,464,582) |
NET ASSETS - 100% | $ 2,147,159,466 |
Legend |
(a) Non-income producing |
(b) Affiliated fund that is available only to investment companies and other accounts managed by Fidelity Investments. The rate quoted is the annualized seven-day yield of the fund at period end. A complete unaudited listing of the fund's holdings as of its most recent quarter end is available upon request. |
(c) Investment made with cash collateral received from securities on loan. |
(d) Security or a portion of the security is on loan at period end. |
(e) Affiliated company |
Affiliated Central Funds |
Information regarding fiscal year to date income earned by the Fund from investments in Fidelity Central Funds is as follows: |
Fund | Income earned |
Fidelity Cash Central Fund | $ 42,495 |
Fidelity Securities Lending Cash Central Fund | 278,970 |
Total | $ 321,465 |
Other Affiliated Issuers |
An affiliated company is a company in which the fund has ownership of at least 5% of the voting securities. Fiscal year to date transactions with companies which are or were affiliates are as follows: |
Affiliates | Value,
beginning
of period | Purchases | Sales
Proceeds | Dividend
Income | Value,
end
of period |
ACCO Brands Corp. | $ 5,466,534 | $ 19,961,967 | $ - | $ - | $ 22,027,864 |
Blount International, Inc. | 17,199,578 | 8,372,649 | - | - | 27,740,300 |
Carpenter Technology Corp. | 48,582,409 | - | 42,768,155 | 1,546,654 | - |
H&E Equipment Services, Inc. | 17,823,149 | 19,092,190 | - | - | 30,357,850 |
HNI Corp. | 48,476,178 | 12,485,936 | 14,178,245 | 1,831,754 | - |
Miraial Co. Ltd. | 11,951,237 | - | - | 358,374 | 15,372,473 |
PacWest Bancorp | - | 33,511,723 | - | 55,188 | 37,552,606 |
Providence Service Corp. | 5,488,479 | 7,744,742 | - | - | 14,637,528 |
RTI International Metals, Inc. | - | 61,889,471 | 24,610,646 | - | 48,035,903 |
Ryoyo Electro Corp. | 10,896,174 | 5,192,230 | - | 479,261 | 18,932,046 |
Spartech Corp. | 19,788,775 | 387,662 | 2,807,218 | - | - |
TradeStation Group, Inc. | 15,446,560 | - | - | - | 13,178,039 |
WESCO International, Inc. | 45,676,500 | 7,269,797 | 10,057,750 | - | - |
Western Liberty Bancorp | - | 23,351,352 | - | - | 14,976,000 |
Total | $ 246,795,573 | $ 199,259,719 | $ 94,422,014 | $ 4,271,231 | $ 242,810,609 |
Other Information |
The following is a summary of the inputs used, as of July 31, 2010, involving the Fund's assets and liabilities carried at fair value. The inputs or methodology used for valuing securities may not be an indication of the risk associated with investing in those securities. For more information on valuation inputs, and their aggregation into the levels used in the table below, please refer to the Security Valuation section in the accompanying Notes to Financial Statements. |
Valuation Inputs at Reporting Date: |
Description | Total | Level 1 | Level 2 | Level 3 |
Investments in Securities: | | | | |
Equities: | | | | |
Consumer Discretionary | $ 248,066,678 | $ 248,066,678 | $ - | $ - |
Consumer Staples | 100,437,014 | 100,437,014 | - | - |
Energy | 122,911,343 | 122,911,343 | - | - |
Financials | 811,664,081 | 796,688,081 | 14,976,000 | - |
Health Care | 135,319,264 | 135,319,264 | - | - |
Industrials | 274,698,882 | 274,698,882 | - | - |
Information Technology | 178,117,653 | 178,117,653 | - | - |
Materials | 107,440,347 | 107,440,347 | - | - |
Telecommunication Services | 14,352,300 | 14,352,300 | - | - |
Utilities | 137,108,716 | 137,108,716 | - | - |
Money Market Funds | 75,507,770 | 75,507,770 | - | - |
Total Investments in Securities: | $ 2,205,624,048 | $ 2,190,648,048 | $ 14,976,000 | $ - |
Distribution of investments by country of issue, as a percentage of total net assets, is as follows: (Unaudited) |
United States of America | 89.5% |
Bermuda | 7.3% |
Japan | 3.2% |
| 100.0% |
See accompanying notes which are an integral part of the financial statements.
Annual Report
Statement of Assets and Liabilities
| July 31, 2010 |
| | |
Assets | | |
Investment in securities, at value (including securities loaned of $58,391,724) - See accompanying schedule: Unaffiliated issuers (cost $1,688,193,871) | $ 1,887,305,669 | |
Fidelity Central Funds (cost $75,507,770) | 75,507,770 | |
Other affiliated issuers (cost $252,614,665) | 242,810,609 | |
Total Investments (cost $2,016,316,306) | | $ 2,205,624,048 |
Receivable for fund shares sold | | 4,429,744 |
Dividends receivable | | 1,263,751 |
Distributions receivable from Fidelity Central Funds | | 11,305 |
Receivable from investment adviser for expense reductions | | 4,703 |
Other receivables | | 78,788 |
Total assets | | 2,211,412,339 |
| | |
Liabilities | | |
Payable for investments purchased | $ 947,463 | |
Payable for fund shares redeemed | 1,282,259 | |
Accrued management fee | 1,466,676 | |
Distribution fees payable | 74,394 | |
Other affiliated payables | 496,956 | |
Other payables and accrued expenses | 57,050 | |
Collateral on securities loaned, at value | 59,928,075 | |
Total liabilities | | 64,252,873 |
| | |
Net Assets | | $ 2,147,159,466 |
Net Assets consist of: | | |
Paid in capital | | $ 1,944,622,631 |
Undistributed net investment income | | 5,209,766 |
Accumulated undistributed net realized gain (loss) on investments and foreign currency transactions | | 8,011,200 |
Net unrealized appreciation (depreciation) on investments and assets and liabilities in foreign currencies | | 189,315,869 |
Net Assets | | $ 2,147,159,466 |
See accompanying notes which are an integral part of the financial statements.
Annual Report
Statement of Assets and Liabilities - continued
| July 31, 2010 |
| | |
Calculation of Maximum Offering Price
Class A:
Net Asset Value and redemption price per share ($96,993,684 ÷ 7,213,042 shares) | | $ 13.45 |
| | |
Maximum offering price per share (100/94.25 of $13.45) | | $ 14.27 |
Class T:
Net Asset Value and redemption price per share ($44,090,912 ÷ 3,306,403 shares) | | $ 13.34 |
| | |
Maximum offering price per share (100/96.50 of $13.34) | | $ 13.82 |
Class B:
Net Asset Value and offering price per share ($9,746,855 ÷ 745,164 shares)A | | $ 13.08 |
| | |
Class C:
Net Asset Value and offering price per share ($37,345,521 ÷ 2,854,186 shares)A | | $ 13.08 |
| | |
| | |
Small Cap Value:
Net Asset Value, offering price and redemption price per share ($1,770,674,882 ÷ 130,574,752 shares) | | $ 13.56 |
| | |
Class F:
Net Asset Value, offering price and redemption price per share ($109,867,616 ÷ 8,090,051 shares) | | $ 13.58 |
| | |
Institutional Class:
Net Asset Value, offering price and redemption price per share ($78,439,996 ÷ 5,777,920 shares) | | $ 13.58 |
A Redemption price per share is equal to net asset value less any applicable contingent deferred sales charge.
See accompanying notes which are an integral part of the financial statements.
Annual Report
Financial Statements - continued
Statement of Operations
| Year ended July 31, 2010 |
| | |
Investment Income | | |
Dividends (including $4,271,231 earned from other affiliated issuers) | | $ 24,688,740 |
Special dividends | | 5,143,528 |
Interest | | 18,401 |
Income from Fidelity Central Funds | | 321,465 |
Total income | | 30,172,134 |
| | |
Expenses | | |
Management fee
Basic fee | $ 13,665,863 | |
Performance adjustment | 2,744,643 | |
Transfer agent fees | 5,310,263 | |
Distribution fees | 751,876 | |
Accounting and security lending fees | 646,723 | |
Custodian fees and expenses | 45,637 | |
Independent trustees' compensation | 10,825 | |
Registration fees | 153,912 | |
Audit | 56,974 | |
Legal | 7,506 | |
Interest | 635 | |
Miscellaneous | 27,954 | |
Total expenses before reductions | 23,422,811 | |
Expense reductions | (213,251) | 23,209,560 |
Net investment income (loss) | | 6,962,574 |
Realized and Unrealized Gain (Loss) Net realized gain (loss) on: | | |
Investment securities: | | |
Unaffiliated issuers | 168,463,263 | |
Other affiliated issuers | 20,012,303 | |
Foreign currency transactions | 10,642 | |
Capital gain distributions from Fidelity Central Funds | 9,755 | |
Total net realized gain (loss) | | 188,495,963 |
Change in net unrealized appreciation (depreciation) on: Investment securities | 137,326,654 | |
Assets and liabilities in foreign currencies | 7,003 | |
Total change in net unrealized appreciation (depreciation) | | 137,333,657 |
Net gain (loss) | | 325,829,620 |
Net increase (decrease) in net assets resulting from operations | | $ 332,792,194 |
See accompanying notes which are an integral part of the financial statements.
Annual Report
Statement of Changes in Net Assets
| Year ended
July 31, 2010 | Year ended
July 31, 2009 |
Increase (Decrease) in Net Assets | | |
Operations | | |
Net investment income (loss) | $ 6,962,574 | $ 11,185,799 |
Net realized gain (loss) | 188,495,963 | (175,985,663) |
Change in net unrealized appreciation (depreciation) | 137,333,657 | 144,791,983 |
Net increase (decrease) in net assets resulting from operations | 332,792,194 | (20,007,881) |
Distributions to shareholders from net investment income | (6,560,137) | (8,301,273) |
Distributions to shareholders from net realized gain | - | (12,095,172) |
Total distributions | (6,560,137) | (20,396,445) |
Share transactions - net increase (decrease) | 209,101,603 | 392,456,300 |
Redemption fees | 534,282 | 448,503 |
Total increase (decrease) in net assets | 535,867,942 | 352,500,477 |
| | |
Net Assets | | |
Beginning of period | 1,611,291,524 | 1,258,791,047 |
End of period (including undistributed net investment income of $5,209,766 and undistributed net investment income of $5,059,582, respectively) | $ 2,147,159,466 | $ 1,611,291,524 |
See accompanying notes which are an integral part of the financial statements.
Annual Report
Financial Highlights - Class A
Years ended July 31, | 2010 | 2009 | 2008 | 2007 | 2006 |
Selected Per-Share Data | | | | | |
Net asset value, beginning of period | $ 11.13 | $ 11.82 | $ 14.34 | $ 13.17 | $ 12.80 |
Income from Investment Operations | | | | | |
Net investment income (loss) C | .02 F | .08 | (.01) | (.06) | (.03) |
Net realized and unrealized gain (loss) | 2.33 | (.60) | (1.98) | 1.90 | .74 |
Total from investment operations | 2.35 | (.52) | (1.99) | 1.84 | .71 |
Distributions from net investment income | (.03) | (.06) | - | - | - |
Distributions from net realized gain | - | (.11) | (.53) | (.67) | (.35) |
Total distributions | (.03) | (.17) | (.53) | (.67) | (.35) |
Redemption fees added to paid in capital C | - H | - H | - H | - H | .01 |
Net asset value, end of period | $ 13.45 | $ 11.13 | $ 11.82 | $ 14.34 | $ 13.17 |
Total Return A,B | 21.16% | (4.37)% | (14.35)% | 14.59% | 5.72% |
Ratios to Average Net Assets D,G | | | | | |
Expenses before reductions | 1.47% | 1.45% | 1.43% | 1.45% | 1.51% |
Expenses net of fee waivers, if any | 1.40% | 1.40% | 1.40% | 1.40% | 1.40% |
Expenses net of all reductions | 1.39% | 1.40% | 1.40% | 1.40% | 1.36% |
Net investment income (loss) | .17% F | .81% | (.05)% | (.44)% | (.24)% |
Supplemental Data | | | | | |
Net assets, end of period (000 omitted) | $ 96,994 | $ 55,029 | $ 52,446 | $ 61,357 | $ 39,931 |
Portfolio turnover rate E | 49% | 51% | 149% | 67% | 93% |
A Total returns would have been lower had certain expenses not been reduced during the periods shown.
B Total returns do not include the effect of the sales charges.
C Calculated based on average shares outstanding during the period.
D Fees and expenses of the underlying Fidelity Central Funds are not included in the Fund's expense ratio. The Fund indirectly bears its proportionate share of the expenses of any underlying Fidelity Central Funds.
E Amount does not include the portfolio activity of any underlying Fidelity Central Funds.
F Investment income per share reflects a special dividend which amounted to $.03 per share. Excluding the special dividend, the ratio of net investment income (loss) to average net assets would have been (.10)%.
G Expense ratios reflect operating expenses of the class. Expenses before reductions do not reflect amounts reimbursed by the investment adviser or reductions from brokerage service arrangements or reductions from other expense offset arrangements and do not represent the amount paid by the class during periods when reimbursements or reductions occur. Expenses net of fee waivers reflect expenses after reimbursement by the investment adviser but prior to reductions from brokerage service arrangements or other expense offset arrangements. Expenses net of all reductions represent the net expenses paid by the class.
H Amount represents less than $.01 per share.
See accompanying notes which are an integral part of the financial statements.
Annual Report
Financial Highlights - Class T
Years ended July 31, | 2010 | 2009 | 2008 | 2007 | 2006 |
Selected Per-Share Data | | | | | |
Net asset value, beginning of period | $ 11.05 | $ 11.74 | $ 14.28 | $ 13.13 | $ 12.78 |
Income from Investment Operations | | | | | |
Net investment income (loss) C | (.01) F | .05 | (.04) | (.10) | (.07) |
Net realized and unrealized gain (loss) | 2.31 | (.59) | (1.97) | 1.90 | .74 |
Total from investment operations | 2.30 | (.54) | (2.01) | 1.80 | .67 |
Distributions from net investment income | (.01) | (.04) | - | - | - |
Distributions from net realized gain | - | (.11) | (.53) | (.65) | (.33) |
Total distributions | (.01) | (.15) | (.53) | (.65) | (.33) |
Redemption fees added to paid in capital C | - H | - H | - H | - H | .01 |
Net asset value, end of period | $ 13.34 | $ 11.05 | $ 11.74 | $ 14.28 | $ 13.13 |
Total Return A,B | 20.87% | (4.57)% | (14.58)% | 14.34% | 5.47% |
Ratios to Average Net Assets D,G | | | | | |
Expenses before reductions | 1.72% | 1.70% | 1.68% | 1.66% | 1.67% |
Expenses net of fee waivers, if any | 1.65% | 1.65% | 1.65% | 1.65% | 1.65% |
Expenses net of all reductions | 1.64% | 1.65% | 1.65% | 1.65% | 1.61% |
Net investment income (loss) | (.08)% F | .56% | (.30)% | (.69)% | (.49)% |
Supplemental Data | | | | | |
Net assets, end of period (000 omitted) | $ 44,091 | $ 28,534 | $ 32,091 | $ 51,518 | $ 45,460 |
Portfolio turnover rate E | 49% | 51% | 149% | 67% | 93% |
A Total returns would have been lower had certain expenses not been reduced during the periods shown.
B Total returns do not include the effect of the sales charges.
C Calculated based on average shares outstanding during the period.
D Fees and expenses of the underlying Fidelity Central Funds are not included in the Fund's expense ratio. The Fund indirectly bears its proportionate share of the expenses of any underlying Fidelity Central Funds.
E Amount does not include the portfolio activity of any underlying Fidelity Central Funds.
F Investment income per share reflects a special dividend which amounted to $.03 per share. Excluding the special dividend, the ratio of net investment income (loss) to average net assets would have been (.35)%.
G Expense ratios reflect operating expenses of the class. Expenses before reductions do not reflect amounts reimbursed by the investment adviser or reductions from brokerage service arrangements or reductions from other expense offset arrangements and do not represent the amount paid by the class during periods when reimbursements or reductions occur. Expenses net of fee waivers reflect expenses after reimbursement by the investment adviser but prior to reductions from brokerage service arrangements or other expense offset arrangements. Expenses net of all reductions represent the net expenses paid by the class.
H Amount represents less than $.01 per share.
See accompanying notes which are an integral part of the financial statements.
Annual Report
Financial Highlights - Class B
Years ended July 31, | 2010 | 2009 | 2008 | 2007 | 2006 |
Selected Per-Share Data | | | | | |
Net asset value, beginning of period | $ 10.88 | $ 11.60 | $ 14.19 | $ 13.07 | $ 12.73 |
Income from Investment Operations | | | | | |
Net investment income (loss) C | (.07) F | .01 | (.10) | (.17) | (.13) |
Net realized and unrealized gain (loss) | 2.27 | (.59) | (1.96) | 1.90 | .74 |
Total from investment operations | 2.20 | (.58) | (2.06) | 1.73 | .61 |
Distributions from net investment income | - | (.03) | - | - | - |
Distributions from net realized gain | - | (.11) | (.53) | (.61) | (.28) |
Total distributions | - | (.14) | (.53) | (.61) | (.28) |
Redemption fees added to paid in capital C | - H | - H | - H | - H | .01 |
Net asset value, end of period | $ 13.08 | $ 10.88 | $ 11.60 | $ 14.19 | $ 13.07 |
Total Return A,B | 20.22% | (5.05)% | (15.04)% | 13.78% | 4.97% |
Ratios to Average Net Assets D,G | | | | | |
Expenses before reductions | 2.22% | 2.20% | 2.18% | 2.20% | 2.26% |
Expenses net of fee waivers, if any | 2.15% | 2.15% | 2.15% | 2.15% | 2.15% |
Expenses net of all reductions | 2.14% | 2.15% | 2.15% | 2.15% | 2.11% |
Net investment income (loss) | (.58)% F | .06% | (.80)% | (1.19)% | (.99)% |
Supplemental Data | | | | | |
Net assets, end of period (000 omitted) | $ 9,747 | $ 7,153 | $ 7,886 | $ 12,075 | $ 10,214 |
Portfolio turnover rate E | 49% | 51% | 149% | 67% | 93% |
A Total returns would have been lower had certain expenses not been reduced during the periods shown.
B Total returns do not include the effect of the contingent deferred sales charge.
C Calculated based on average shares outstanding during the period.
D Fees and expenses of the underlying Fidelity Central Funds are not included in the Fund's expense ratio. The Fund indirectly bears its proportionate share of the expenses of any underlying Fidelity Central Funds.
E Amount does not include the portfolio activity of any underlying Fidelity Central Funds.
F Investment income per share reflects a special dividend which amounted to $.03 per share. Excluding the special dividend, the ratio of net investment income (loss) to average net assets would have been (.85)%.
G Expense ratios reflect operating expenses of the class. Expenses before reductions do not reflect amounts reimbursed by the investment adviser or reductions from brokerage service arrangements or reductions from other expense offset arrangements and do not represent the amount paid by the class during periods when reimbursements or reductions occur. Expenses net of fee waivers reflect expenses after reimbursement by the investment adviser but prior to reductions from brokerage service arrangements or other expense offset arrangements. Expenses net of all reductions represent the net expenses paid by the class.
H Amount represents less than $.01 per share.
See accompanying notes which are an integral part of the financial statements.
Annual Report
Financial Highlights - Class C
Years ended July 31, | 2010 | 2009 | 2008 | 2007 | 2006 |
Selected Per-Share Data | | | | | |
Net asset value, beginning of period | $ 10.89 | $ 11.60 | $ 14.19 | $ 13.07 | $ 12.74 |
Income from Investment Operations | | | | | |
Net investment income (loss) C | (.07) F | .01 | (.10) | (.17) | (.13) |
Net realized and unrealized gain (loss) | 2.26 | (.58) | (1.96) | 1.90 | .74 |
Total from investment operations | 2.19 | (.57) | (2.06) | 1.73 | .61 |
Distributions from net investment income | - | (.03) | - | - | - |
Distributions from net realized gain | - | (.11) | (.53) | (.61) | (.29) |
Total distributions | - | (.14) | (.53) | (.61) | (.29) |
Redemption fees added to paid in capital C | - H | - H | - H | - H | .01 |
Net asset value, end of period | $ 13.08 | $ 10.89 | $ 11.60 | $ 14.19 | $ 13.07 |
Total Return A,B | 20.11% | (4.98)% | (15.04)% | 13.77% | 4.92% |
Ratios to Average Net Assets D,G | | | | | |
Expenses before reductions | 2.22% | 2.20% | 2.18% | 2.20% | 2.22% |
Expenses net of fee waivers, if any | 2.15% | 2.15% | 2.15% | 2.15% | 2.15% |
Expenses net of all reductions | 2.14% | 2.15% | 2.15% | 2.15% | 2.11% |
Net investment income (loss) | (.58)% F | .06% | (.80)% | (1.19)% | (.99)% |
Supplemental Data | | | | | |
Net assets, end of period (000 omitted) | $ 37,346 | $ 21,345 | $ 20,924 | $ 34,155 | $ 26,791 |
Portfolio turnover rate E | 49% | 51% | 149% | 67% | 93% |
A Total returns would have been lower had certain expenses not been reduced during the periods shown.
B Total returns do not include the effect of the contingent deferred sales charge.
C Calculated based on average shares outstanding during the period.
D Fees and expenses of the underlying Fidelity Central Funds are not included in the Fund's expense ratio. The Fund indirectly bears its proportionate share of the expenses of any underlying Fidelity Central Funds.
E Amount does not include the portfolio activity of any underlying Fidelity Central Funds.
F Investment income per share reflects a special dividend which amounted to $.03 per share. Excluding the special dividend, the ratio of net investment income (loss) to average net assets would have been (.85)%.
G Expense ratios reflect operating expenses of the class. Expenses before reductions do not reflect amounts reimbursed by the investment adviser or reductions from brokerage service arrangements or reductions from other expense offset arrangements and do not represent the amount paid by the class during periods when reimbursements or reductions occur. Expenses net of fee waivers reflect expenses after reimbursement by the investment adviser but prior to reductions from brokerage service arrangements or other expense offset arrangements. Expenses net of all reductions represent the net expenses paid by the class.
H Amount represents less than $.01 per share.
See accompanying notes which are an integral part of the financial statements.
Annual Report
Financial Highlights - Small Cap Value
Years ended July 31, | 2010 | 2009 | 2008 | 2007 | 2006 |
Selected Per-Share Data | | | | | |
Net asset value, beginning of period | $ 11.22 | $ 11.91 | $ 14.43 | $ 13.22 | $ 12.83 |
Income from Investment Operations | | | | | |
Net investment income (loss) B | .05 E | .10 | .03 | (.02) | .01 |
Net realized and unrealized gain (loss) | 2.34 | (.60) | (1.99) | 1.91 | .74 |
Total from investment operations | 2.39 | (.50) | (1.96) | 1.89 | .75 |
Distributions from net investment income | (.05) | (.08) | - | - | (.01) |
Distributions from net realized gain | - | (.11) | (.56) | (.68) | (.36) |
Total distributions | (.05) | (.19) | (.56) | (.68) | (.37) |
Redemption fees added to paid in capital B | - G | - G | - G | - G | .01 |
Net asset value, end of period | $ 13.56 | $ 11.22 | $ 11.91 | $ 14.43 | $ 13.22 |
Total Return A | 21.32% | (4.15)% | (14.10)% | 14.96% | 6.07% |
Ratios to Average Net Assets C,F | | | | |
Expenses before reductions | 1.18% | 1.20% | 1.14% | 1.11% | 1.09% |
Expenses net of fee waivers, if any | 1.18% | 1.20% | 1.14% | 1.11% | 1.09% |
Expenses net of all reductions | 1.17% | 1.20% | 1.13% | 1.11% | 1.06% |
Net investment income (loss) | .39% E | 1.01% | .22% | (.15)% | .06% |
Supplemental Data | | | | | |
Net assets, end of period (000 omitted) | $ 1,770,675 | $ 1,488,736 | $ 1,136,860 | $ 1,233,808 | $ 957,720 |
Portfolio turnover rate D | 49% | 51% | 149% | 67% | 93% |
A Total returns would have been lower had certain expenses not been reduced during the periods shown.
B Calculated based on average shares outstanding during the period.
C Fees and expenses of the underlying Fidelity Central Funds are not included in the Fund's expense ratio. The Fund indirectly bears its proportionate share of the expenses of any underlying Fidelity Central Funds.
D Amount does not include the portfolio activity of any underlying Fidelity Central Funds.
E Investment income per share reflects a special dividend which amounted to $.03 per share. Excluding the special dividend, the ratio of net investment income (loss) to average net assets would have been .12%.
F Expense ratios reflect operating expenses of the class. Expenses before reductions do not reflect amounts reimbursed by the investment adviser or reductions from brokerage service arrangements or reductions from other expense offset arrangements and do not represent the amount paid by the class during periods when reimbursements or reductions occur. Expenses net of fee waivers reflect expenses after reimbursement by the investment adviser but prior to reductions from brokerage service arrangements or other expense offset arrangements. Expenses net of all reductions represent the net expenses paid by the class.
G Amount represents less than $.01 per share.
See accompanying notes which are an integral part of the financial statements.
Annual Report
Financial Highlights - Class F
Years ended July 31, | 2010 | 2009 I |
Selected Per-Share Data | | |
Net asset value, beginning of period | $ 11.22 | $ 10.27 |
Income from Investment Operations | | |
Net investment income (loss) D | .09 G | .01 |
Net realized and unrealized gain (loss) | 2.34 | .94 H |
Total from investment operations | 2.43 | .95 |
Distributions from net investment income | (.07) | - |
Redemption fees added to paid in capital D,K | - | - |
Net asset value, end of period | $ 13.58 | $ 11.22 |
Total Return B,C | 21.69% | 9.25% |
Ratios to Average Net Assets E,J | | |
Expenses before reductions | .90% | .86% A |
Expenses net of fee waivers, if any | .90% | .86% A |
Expenses net of all reductions | .89% | .86% A |
Net investment income (loss) | .67% G | .64% A |
Supplemental Data | | |
Net assets, end of period (000 omitted) | $ 109,868 | $ 159 |
Portfolio turnover rate F | 49% | 51% |
A Annualized
B Total returns for periods of less than one year are not annualized.
C Total returns would have been lower had certain expenses not been reduced during the periods shown.
D Calculated based on average shares outstanding during the period.
E Fees and expenses of the underlying Fidelity Central Funds are not included in the Fund's expense ratio. The Fund indirectly bears its proportionate share of the expenses of any underlying Fidelity Central Funds.
F Amount does not include the portfolio activity of any underlying Fidelity Central Funds.
G Investment income per share reflects a special dividend which amounted to $.03 per share. Excluding the special dividend, the ratio of net investment income (loss) to average net assets would have been .40%.
H The amount shown for a share outstanding does not correspond with the aggregate net gain (loss) on investments for the period due to the timing of sales and repurchases of shares in relation to fluctuating market values of the investments of the Fund.
I For the period June 26, 2009 (commencement of sale of shares) to July 31, 2009.
J Expense ratios reflect operating expenses of the class. Expenses before reductions do not reflect amounts reimbursed by the investment adviser or reductions from brokerage service arrangements or reductions from other expense offset arrangements and do not represent the amount paid by the class during periods when reimbursements or reductions occur. Expense ratios before reductions for start-up periods may not be representative of longer-term operating periods. Expenses net of fee waivers reflect expenses after reimbursement by the investment adviser but prior to reductions from brokerage service arrangements or other expense offset arrangements. Expenses net of all reductions represent the net expenses paid by the class.
K Amount represents less than $.01 per share.
See accompanying notes which are an integral part of the financial statements.
Annual Report
Financial Highlights - Institutional Class
Years ended July 31, | 2010 | 2009 | 2008 | 2007 | 2006 |
Selected Per-Share Data | | | | | |
Net asset value, beginning of period | $ 11.24 | $ 11.91 | $ 14.43 | $ 13.22 | $ 12.83 |
Income from Investment Operations | | | | | |
Net investment income (loss) B | .06 E | .10 | .03 | (.02) | .01 |
Net realized and unrealized gain (loss) | 2.34 | (.59) | (1.99) | 1.91 | .74 |
Total from investment operations | 2.40 | (.49) | (1.96) | 1.89 | .75 |
Distributions from net investment income | (.06) | (.07) | - | - | (.01) |
Distributions from net realized gain | - | (.11) | (.56) | (.68) | (.36) |
Total distributions | (.06) | (.18) | (.56) | (.68) | (.37) |
Redemption fees added to paid in capital B | - G | - G | - G | - G | .01 |
Net asset value, end of period | $ 13.58 | $ 11.24 | $ 11.91 | $ 14.43 | $ 13.22 |
Total Return A | 21.42% | (4.04)% | (14.10)% | 14.99% | 6.08% |
Ratios to Average Net Assets C,F | | | | | |
Expenses before reductions | 1.12% | 1.20% | 1.13% | 1.10% | 1.08% |
Expenses net of fee waivers, if any | 1.12% | 1.15% | 1.13% | 1.10% | 1.08% |
Expenses net of all reductions | 1.12% | 1.15% | 1.13% | 1.10% | 1.05% |
Net investment income (loss) | .45% E | 1.06% | .22% | (.13)% | .08% |
Supplemental Data | | | | | |
Net assets, end of period (000 omitted) | $ 78,440 | $ 10,336 | $ 8,584 | $ 11,594 | $ 9,422 |
Portfolio turnover rate D | 49% | 51% | 149% | 67% | 93% |
A Total returns would have been lower had certain expenses not been reduced during the periods shown.
B Calculated based on average shares outstanding during the period.
C Fees and expenses of the underlying Fidelity Central Funds are not included in the Fund's expense ratio. The Fund indirectly bears its proportionate share of the expenses of any underlying Fidelity Central Funds.
D Amount does not include the portfolio activity of any underlying Fidelity Central Funds.
E Investment income per share reflects a special dividend which amounted to $.03 per share. Excluding the special dividend, the ratio of net investment income (loss) to average net assets would have been .18%.
F Expense ratios reflect operating expenses of the class. Expenses before reductions do not reflect amounts reimbursed by the investment adviser or reductions from brokerage service arrangements or reductions from other expense offset arrangements and do not represent the amount paid by the class during periods when reimbursements or reductions occur. Expenses net of fee waivers reflect expenses after reimbursement by the investment adviser but prior to reductions from brokerage service arrangements or other expense offset arrangements. Expenses net of all reductions represent the net expenses paid by the class.
G Amount represents less than $.01 per share.
See accompanying notes which are an integral part of the financial statements.
Annual Report
Notes to Financial Statements
For the period ended July 31, 2010
1. Organization.
Fidelity Small Cap Value Fund (the Fund) is a fund of Fidelity Securities Fund (the Trust) and is authorized to issue an unlimited number of shares. The Trust is registered under the Investment Company Act of 1940, as amended (the 1940 Act), as an open-end management investment company organized as a Massachusetts business trust. The Fund offers Class A, Class T, Class B, Class C, Small Cap Value, Class F and Institutional Class shares, each of which has equal rights as to assets and voting privileges. Effective after the close of business on September 1, 2010, Class B shares will be closed to new accounts and additional purchases by existing shareholders. Each class has exclusive voting rights with respect to matters that affect that class. Class F shares of the Fund are only available for purchase by mutual funds for which Fidelity Management & Research Company (FMR) or an affiliate serves as investment manager. Class B shares will automatically convert to Class A shares after a holding period of seven years from the initial date of purchase. Investment income, realized and unrealized capital gains and losses, the common expenses of the Fund, and certain fund-level expense reductions, if any, are allocated on a pro-rata basis to each class based on the relative net assets of each class to the total net assets of the Fund. Each class differs with respect to transfer agent and distribution and service plan fees incurred. Certain expense reductions also differ by class.
2. Investments in Fidelity Central Funds.
The Fund may invest in Fidelity Central Funds, which are open-end investment companies available only to other investment companies and accounts managed by Fidelity Management & Research Company (FMR) and its affiliates. The Fund's Schedule of Investments lists each of the Fidelity Central Funds held as of period end, if any, as an investment of the Fund, but does not include the underlying holdings of each Fidelity Central Fund. As an Investing Fund, the Fund indirectly bears its proportionate share of the expenses of the underlying Fidelity Central Funds.
The Money Market Central Funds seek preservation of capital and current income and are managed by Fidelity Investments Money Management, Inc. (FIMM), an affiliate of FMR.
A complete unaudited list of holdings for each Fidelity Central Fund is available upon request or at the Securities and Exchange Commission (the SEC) web site at www.sec.gov. In addition, the financial statements of the Fidelity Central Funds, which are not covered by the Fund's Report of Independent Registered Public Accounting Firm, are available on the SEC web site or upon request.
Annual Report
3. Significant Accounting Policies.
The financial statements have been prepared in conformity with accounting principles generally accepted in the United States of America (GAAP), which require management to make certain estimates and assumptions at the date of the financial statements. Actual results could differ from those estimates. The following summarizes the significant accounting policies of the Fund:
Security Valuation. Investments are valued as of 4:00 p.m. Eastern time on the last calendar day of the period. The Fund uses independent pricing services approved by the Board of Trustees to value its investments. When current market prices or quotations are not readily available or reliable, valuations may be determined in good faith in accordance with procedures adopted by the Board of Trustees. Factors used in determining value may include market or security specific events. The frequency with which these procedures are used cannot be predicted and they may be utilized to a significant extent. The value used for net asset value (NAV) calculation under these procedures may differ from published prices for the same securities.
The Fund categorizes the inputs to valuation techniques used to value its investments into a disclosure hierarchy consisting of three levels as shown below.
Level 1 - quoted prices in active markets for identical investments
Level 2 - other significant observable inputs (including quoted prices for similar investments, interest rates, prepayment speeds, etc.)
Level 3 - unobservable inputs (including the fund's own assumptions based on the best information available)
Changes in valuation techniques may result in transfers in or out of an assigned level within the disclosure hierarchy. The aggregate value of investments by input level, as of July 31, 2010, is included at the end of the Fund's Schedule of Investments. Valuation techniques used to value the Fund's investments by major category are as follows.
Equity securities, including restricted securities, for which market quotations are readily available, are valued at the last reported sale price or official closing price as reported by an independent pricing service on the primary market or exchange on which they are traded and are categorized as Level 1 in the hierarchy. In the event there were no sales during the day or closing prices are not available, securities are valued at the last quoted bid price or may be valued using the last available price and are generally categorized as Level 2 in the hierarchy. For foreign equity securities, when significant market or security specific events arise, comparisons to the valuation of American Depositary Receipts (ADRs), futures contracts, Exchange-traded funds (ETFs) and certain indexes as well as
Annual Report
Notes to Financial Statements - continued
3. Significant Accounting Policies - continued
Security Valuation - continued
quoted prices for similar securities are used and are categorized as Level 2 in the hierarchy in these circumstances. Utilizing these techniques may result in transfers between Level 1 and Level 2. For restricted equity securities and private placements where observable inputs are limited, assumptions about market activity and risk are used and are categorized as Level 3 in the hierarchy.
Investments in open-end mutual funds, including the Fidelity Central Funds, are valued at their closing net asset value each business day and are categorized as Level 1 in the hierarchy. Short-term securities with remaining maturities of sixty days or less for which quotations are not readily available are valued at amortized cost, which approximates fair value and are categorized as Level 2 in the hierarchy.
Foreign Currency. The Fund uses foreign currency contracts to facilitate transactions in foreign-denominated securities. Gains and losses from these transactions may arise from changes in the value of the foreign currency or if the counterparties do not perform under the contracts' terms.
Foreign-denominated assets, including investment securities, and liabilities are translated into U.S. dollars at the exchange rate at period end. Purchases and sales of investment securities, income and dividends received and expenses denominated in foreign currencies are translated into U.S. dollars at the exchange rate in effect on the transaction date.
The effects of exchange rate fluctuations on investments are included with the net realized and unrealized gain (loss) on investment securities. Other foreign currency transactions resulting in realized and unrealized gain (loss) are disclosed separately.
Investment Transactions and Income. For financial reporting purposes, the Fund's investment holdings and NAV include trades executed through the end of the last business day of the period. The NAV per share for processing shareholder transactions is calculated as of the close of business of the New York Stock Exchange (NYSE), normally 4:00 p.m. Eastern time and includes trades executed through the end of the prior business day. Gains and losses on securities sold are determined on the basis of identified cost and may include proceeds received from litigation. Dividend income is recorded on the ex-dividend date, except for certain dividends from foreign securities where the ex-dividend date may have passed, which are recorded as soon as the Fund is informed of the ex-dividend date. Non-cash dividends included in dividend income, if any, are recorded at the fair market value of the securities received. Distributions received on securities that represent a return of capital or capital gain are recorded as a reduction of cost of investments and/or as a realized gain. The Fund estimates the components of
Annual Report
3. Significant Accounting Policies - continued
Investment Transactions and Income - continued
distributions received that may be considered return of capital distributions or capital gain distributions. Large, non-recurring dividends recognized by the Fund are presented separately on the Statement of Operations as "Special Dividends" and the impact of these dividends is presented in the Financial Highlights. Interest income and distributions from the Fidelity Central Funds are accrued as earned. Interest income includes coupon interest and amortization of premium and accretion of discount on debt securities. Investment income is recorded net of foreign taxes withheld where recovery of such taxes is uncertain.
Expenses. Most expenses of the Trust can be directly attributed to a fund. Expenses which cannot be directly attributed are apportioned amongst each fund in the Trust. Expense estimates are accrued in the period to which they relate and adjustments are made when actual amounts are known.
Income Tax Information and Distributions to Shareholders. Each year the Fund intends to qualify as a regulated investment company, including distributing substantially all of its taxable income and realized gains under Subchapter M of the Internal Revenue Code and filing its U.S. federal tax return. As a result, no provision for income taxes is required. As of July 31, 2010, the Fund did not have any unrecognized tax benefits in the accompanying financial statements. A fund's federal tax return is subject to examination by the Internal Revenue Service (IRS) for a period of three years. Foreign taxes are provided for based on the Fund's understanding of the tax rules and rates that exist in the foreign markets in which it invests.
Distributions are recorded on the ex-dividend date. Income dividends and capital gain distributions are declared separately for each class. Income and capital gain distributions are determined in accordance with income tax regulations, which may differ from GAAP. In addition, the Fund claimed a portion of the payment made to redeeming shareholders as a distribution for income tax purposes.
Capital accounts within the financial statements are adjusted for permanent book-tax differences. These adjustments have no impact on net assets or the results of operations. Temporary book-tax differences will reverse in a subsequent period.
Book-tax differences are primarily due to the short-term gain distributions from the Fidelity Central Funds, foreign currency transactions, market discount, capital loss carryforwards and losses deferred due to wash sales and excise tax regulations.
Annual Report
Notes to Financial Statements - continued
3. Significant Accounting Policies - continued
Income Tax Information and Distributions to Shareholders - continued
The federal tax cost of investment securities and unrealized appreciation (depreciation) as of period end were as follows:
Gross unrealized appreciation | $ 346,140,241 |
Gross unrealized depreciation | (160,277,473) |
Net unrealized appreciation (depreciation) | $ 185,862,768 |
| |
Tax Cost | $ 2,019,761,280 |
The tax-based components of distributable earnings as of period end were as follows:
Undistributed ordinary income | $ 5,209,766 |
Undistributed long-term capital gain | $ 11,456,174 |
Net unrealized appreciation (depreciation) | $ 185,870,895 |
The tax character of distributions paid was as follows:
| July 31, 2010 | July 31, 2009 |
Ordinary Income | $ 6,560,137 | $ 8,301,273 |
Long-term Capital Gains | - | 12,095,172 |
Total | $ 6,560,137 | $ 20,396,445 |
Short-Term Trading (Redemption) Fees. Shares held in the Fund less than 90 days are subject to a redemption fee equal to 1.50% of the proceeds of the redeemed shares. All redemption fees, including any estimated redemption fees paid by FMR, are retained by the Fund and accounted for as an addition to paid in capital.
4. Purchases and Sales of Investments.
Purchases and sales of securities, other than short-term securities, aggregated $1,124,184,474 and $918,879,120, respectively.
5. Fees and Other Transactions with Affiliates.
Management Fee. FMR and its affiliates provide the Fund with investment management related services for which the Fund pays a monthly management fee. The management fee is the sum of an individual fund fee rate that is based on an annual rate of .45% of the Fund's average net assets and a group fee rate that averaged .26% during the period. The group fee rate is based upon the average net assets of all the mutual funds advised by FMR. The group fee rate decreases as assets under management increase and
Annual Report
5. Fees and Other Transactions with Affiliates - continued
Management Fee - continued
increases as assets under management decrease. In addition, the management fee is subject to a performance adjustment (up to a maximum of ±.20% of the Fund's average net assets over a 36 month performance period). The upward or downward adjustment to the management fee is based on the relative investment performance of the retail class of the Fund, Small Cap Value as compared to an appropriate benchmark index. For the period, the total annual management fee rate, including the performance adjustment, was .85% of the Fund's average net assets.
Distribution and Service Plan. In accordance with Rule 12b-1 of the 1940 Act, the Fund has adopted separate Distribution and Service Plans for each class of shares. Certain classes pay Fidelity Distributors Corporation (FDC), an affiliate of FMR, separate Distribution and Service Fees, each of which is based on an annual percentage of each class' average net assets. In addition, FDC may pay financial intermediaries for selling shares of the Fund and providing shareholder support services. For the period, the Distribution and Service Fee rates and the total amounts paid to and retained by FDC were as follows:
| Distribution
Fee | Service
Fee | Paid to
FDC | Retained
by FDC |
Class A | -% | .25% | $ 191,085 | $ 8,941 |
Class T | .25% | .25% | 179,850 | - |
Class B | .75% | .25% | 86,355 | 64,822 |
Class C | .75% | .25% | 294,586 | 80,570 |
| | | $ 751,876 | $ 154,333 |
Sales Load. FDC receives a front-end sales charge of up to 5.75% for selling Class A shares, and 3.50% for selling Class T shares, some of which is paid to financial intermediaries for selling shares of the Fund. FDC receives the proceeds of contingent deferred sales charges levied on Class A, Class T, Class B, and Class C redemptions. These charges depend on the holding period. The deferred sales charges range from 5% to 1% for Class B, 1% for Class C, 1.00% for certain purchases of Class A shares (1.00% to .50% prior to July 12, 2010) and .25% for certain purchases of Class T shares.
Annual Report
Notes to Financial Statements - continued
5. Fees and Other Transactions with Affiliates - continued
Sales Load - continued
For the period, sales charge amounts retained by FDC were as follows:
| Retained
by FDC |
Class A | $ 48,522 |
Class T | 8,611 |
Class B* | 21,775 |
Class C* | 3,135 |
| $ 82,043 |
* When Class B and Class C shares are initially sold, FDC pays commissions from its own resources to financial intermediaries through which the sales are made.
Transfer Agent Fees. Fidelity Investments Institutional Operations Company, Inc. (FIIOC), an affiliate of FMR, is the transfer, dividend disbursing and shareholder servicing agent for each class of the Fund. FIIOC receives account fees and asset-based fees that vary according to the account size and type of account of the shareholders of respective classes of the Fund, except for Class F. FIIOC receives no fees for providing transfer agency services to Class F. FIIOC pays for typesetting, printing and mailing of shareholder reports, except proxy statements. For the period, the total transfer agent fees paid by each class were as follows:
| Amount | % of
Average
Net Assets |
Class A | $ 243,601 | .32 |
Class T | 116,575 | .32 |
Class B | 27,836 | .32 |
Class C | 94,179 | .32 |
Small Cap Value | 4,734,141 | .28 |
Institutional Class | 93,931 | .22 |
| $ 5,310,263 | |
Accounting and Security Lending Fees. Fidelity Service Company, Inc. (FSC), an affiliate of FMR, maintains the Fund's accounting records. The accounting fee is based on the level of average net assets for the month. Under a separate contract, FSC administers the security lending program. The security lending fee is based on the number and duration of lending transactions.
Annual Report
5. Fees and Other Transactions with Affiliates - continued
Brokerage Commissions. The Fund placed a portion of its portfolio transactions with brokerage firms which are affiliates of the investment adviser. The commissions paid to these affiliated firms were $17,973 for the period.
Interfund Lending Program. Pursuant to an Exemptive Order issued by the SEC, the Fund, along with other registered investment companies having management contracts with FMR, may participate in an interfund lending program. This program provides an alternative credit facility allowing the funds to borrow from, or lend money to, other participating affiliated funds. At period end, there were no interfund loans outstanding. The Fund's activity in this program during the period for which loans were outstanding was as follows:
Borrower or Lender | Average Daily
Loan Balance | Weighted Average
Interest Rate | Interest
Expense |
Borrower | $ 7,401,500 | .39% | $ 635 |
6. Committed Line of Credit.
The Fund participates with other funds managed by FMR in a $3.75 billion credit facility (the "line of credit") to be utilized for temporary or emergency purposes to fund shareholder redemptions or for other short-term liquidity purposes. The Fund has agreed to pay commitment fees on its pro-rata portion of the line of credit, which amounted to $7,433 and is reflected in Miscellaneous expenses on the Statement of Operations. During the period, there were no borrowings on this line of credit.
7. Security Lending.
The Fund lends portfolio securities from time to time in order to earn additional income. On the settlement date of the loan, the Fund receives collateral (in the form of U.S. Treasury obligations, letters of credit and/or cash) against the loaned securities and maintains collateral in an amount not less than 100% of the market value of the loaned securities during the period of the loan. The market value of the loaned securities is determined at the close of business of the Fund and any additional required collateral is delivered to the Fund on the next business day. If the borrower defaults on its obligation to return the securities loaned because of insolvency or other reasons, a fund could experience delays and costs in recovering the securities loaned or in gaining access to the collateral. Any cash collateral received is invested in the Fidelity Securities Lending Cash Central Fund. The value of loaned securities and cash collateral at period end are disclosed on the Fund's Statement of Assets and Liabilities. Security lending income represents the income earned on investing cash collateral, less fees and expenses
Annual Report
Notes to Financial Statements - continued
7. Security Lending - continued
associated with the loan, plus any premium payments that may be received on the loan of certain types of securities. Security lending income is presented in the Statement of Operations as a component of income from Fidelity Central Funds. Net income from lending portfolio securities during the period amounted to $278,970.
8. Expense Reductions.
FMR voluntarily agreed to reimburse each class to the extent annual operating expenses exceeded certain levels of average net assets as noted in the table below. Some expenses, for example interest expense, including commitment fees, are excluded from this reimbursement.
The following classes were in reimbursement during the period:
| Expense
Limitations | Reimbursement
from adviser |
Class A | 1.40% | $ 52,534 |
Class T | 1.65% | 26,830 |
Class B | 2.15% | 6,293 |
Class C | 2.15% | 20,630 |
| | $ 106,287 |
Effective October 1, 2010 the expense limitations will be eliminated.
Many of the brokers with whom FMR places trades on behalf of the Fund provided services to the Fund in addition to trade execution. These services included payments of certain expenses on behalf of the Fund totaling $106,964 for the period.
9. Distributions to Shareholders.
Distributions to shareholders of each class were as follows:
Years ended July 31, | 2010 | 2009 |
From net investment income | | |
Class A | $ 159,193 | $ 252,162 |
Class T | 36,920 | 111,704 |
Class B | - | 20,177 |
Class C | - | 45,207 |
Small Cap Value | 6,230,380 | 7,822,387 |
Class F | 28,266 | - |
Institutional Class | 105,378 | 49,636 |
Total | $ 6,560,137 | $ 8,301,273 |
Annual Report
9. Distributions to Shareholders - continued
Distributions to shareholders of each class were as follows: - continued
Years ended July 31, | 2010 | 2009 |
From net realized gain | | |
Class A | $ - | $ 496,925 |
Class T | - | 350,121 |
Class B | - | 77,046 |
Class C | - | 207,577 |
Small Cap Value | - | 10,883,170 |
Institutional Class | - | 80,333 |
Total | $ - | $ 12,095,172 |
10. Share Transactions.
Transactions for each class of shares were as follows:
| Shares | Dollars |
Years ended July 31, | 2010 | 2009A | 2010 | 2009A |
Class A | | | | |
Shares sold | 4,231,111 | 2,028,986 | $ 54,936,600 | $ 19,478,233 |
Reinvestment of distributions | 12,276 | 64,970 | 146,358 | 694,477 |
Shares redeemed | (1,973,236) | (1,588,437) | (25,421,999) | (14,658,645) |
Net increase (decrease) | 2,270,151 | 505,519 | $ 29,660,959 | $ 5,514,065 |
Class T | | | | |
Shares sold | 1,449,265 | 1,489,054 | $ 18,793,141 | $ 15,806,614 |
Reinvestment of distributions | 3,030 | 40,641 | 35,906 | 449,360 |
Shares redeemed | (727,616) | (1,680,727) | (9,211,959) | (14,685,646) |
Net increase (decrease) | 724,679 | (151,032) | $ 9,617,088 | $ 1,570,328 |
Class B | | | | |
Shares sold | 262,419 | 305,827 | $ 3,340,905 | $ 3,051,319 |
Reinvestment of distributions | - | 7,759 | - | 85,943 |
Shares redeemed | (174,554) | (335,978) | (2,189,700) | (2,971,686) |
Net increase (decrease) | 87,865 | (22,392) | $ 1,151,205 | $ 165,576 |
Class C | | | | |
Shares sold | 1,327,692 | 832,906 | $ 17,060,657 | $ 7,981,000 |
Reinvestment of distributions | - | 19,410 | - | 217,621 |
Shares redeemed | (434,251) | (694,752) | (5,448,332) | (6,287,773) |
Net increase (decrease) | 893,441 | 157,564 | $ 11,612,325 | $ 1,910,848 |
Annual Report
Notes to Financial Statements - continued
10. Share Transactions - continued
Transactions for each class of shares were as follows: - continued
| Shares | Dollars |
Years ended July 31, | 2010 | 2009A | 2010 | 2009A |
Small Cap Value | | | | |
Shares sold | 45,122,251 | 61,277,579 | $ 585,925,779 | $ 600,357,815 |
Reinvestment of distributions | 507,903 | 1,741,583 | 6,101,827 | 18,397,974 |
Shares redeemed | (47,781,912) | (25,782,005) | (605,149,428) | (237,589,067) |
Net increase (decrease) | (2,151,758) | 37,237,157 | $ (13,121,822) | $ 381,166,722 |
Class F | | | | |
Shares sold | 8,411,513 | 14,205 | $ 109,778,609 | $ 144,857 |
Reinvestment of distributions | 2,350 | - | 28,266 | - |
Shares redeemed | (337,999) | (18) | (4,618,215) | (181) |
Net increase (decrease) | 8,075,864 | 14,187 | $ 105,188,660 | $ 144,676 |
Institutional Class | | | | |
Shares sold | 5,522,070 | 479,087 | $ 73,692,691 | $ 4,626,811 |
Reinvestment of distributions | 7,512 | 8,812 | 90,344 | 93,632 |
Shares redeemed | (671,565) | (288,597) | (8,789,847) | (2,736,358) |
Net increase (decrease) | 4,858,017 | 199,302 | $ 64,993,188 | $ 1,984,085 |
A Share transactions for Class F are for the period June 26, 2009 (commencement of sale of shares) to July 31, 2009.
11. Other.
The Fund's organizational documents provide former and current trustees and officers with a limited indemnification against liabilities arising in connection with the performance of their duties to the Fund. In the normal course of business, the Fund may also enter into contracts that provide general indemnifications. The Fund's maximum exposure under these arrangements is unknown as this would be dependent on future claims that may be made against the Fund. The risk of material loss from such claims is considered remote.
At the end of the period, the Fidelity Freedom Funds and the Fidelity Freedom K Funds were the owners of record, in the aggregate, of approximately 38% of the total outstanding shares of the Fund.
Annual Report
To the Trustees of Fidelity Securities Fund and the Shareholders of Fidelity Small Cap Value Fund:
In our opinion, the accompanying statement of assets and liabilities, including the schedule of investments, and the related statements of operations and of changes in net assets and the financial highlights present fairly, in all material respects, the financial position of Fidelity Small Cap Value Fund (a fund of Fidelity Securities Fund) at July 31, 2010, the results of its operations for the year then ended, the changes in its net assets for each of the two years in the period then ended and the financial highlights for each of the periods indicated, in conformity with accounting principles generally accepted in the United States of America. These financial statements and financial highlights (hereafter referred to as "financial statements") are the responsibility of the Fidelity Small Cap Value Fund's management. Our responsibility is to express an opinion on these financial statements based on our audits. We conducted our audits of these financial statements in accordance with the standards of the Public Company Accounting Oversight Board (United States). Those standards require that we plan and perform the audit to obtain reasonable assurance about whether the financial statements are free of material misstatement. An audit includes examining, on a test basis, evidence supporting the amounts and disclosures in the financial statements, assessing the accounting principles used and significant estimates made by management, and evaluating the overall financial statement presentation. We believe that our audits, which included confirmation of securities at July 31, 2010 by correspondence with the custodian and brokers, provide a reasonable basis for our opinion.
/s/ PricewaterhouseCoopers LLP
PricewaterhouseCoopers LLP
Boston, Massachusetts
September 14, 2010
Annual Report
The Trustees, Member of the Advisory Board, and executive officers of the trust and fund, as applicable, are listed below. The Board of Trustees governs the fund and is responsible for protecting the interests of shareholders. The Trustees are experienced executives who meet periodically throughout the year to oversee the fund's activities, review contractual arrangements with companies that provide services to the fund, oversee management of the risks associated with such activities and contractual arrangements, and review the fund's performance. Except for James C. Curvey, each of the Trustees oversees 222 funds advised by FMR or an affiliate. Mr. Curvey oversees 411 funds advised by FMR or an affiliate.
The Trustees hold office without limit in time except that (a) any Trustee may resign; (b) any Trustee may be removed by written instrument, signed by at least two-thirds of the number of Trustees prior to such removal; (c) any Trustee who requests to be retired or who has become incapacitated by illness or injury may be retired by written instrument signed by a majority of the other Trustees; and (d) any Trustee may be removed at any special meeting of shareholders by a two-thirds vote of the outstanding voting securities of the trust. Each Trustee who is not an interested person (as defined in the 1940 Act) (Independent Trustee), shall retire not later than the last day of the calendar year in which his or her 72nd birthday occurs. The Independent Trustees may waive this mandatory retirement age policy with respect to individual Trustees. The executive officers and Advisory Board Member hold office without limit in time, except that any officer and Advisory Board Member may resign or may be removed by a vote of a majority of the Trustees at any regular meeting or any special meeting of the Trustees. Except as indicated, each individual has held the office shown or other offices in the same company for the past five years.
Experience, Skills, Attributes, and Qualifications of the Fund's Trustees. The Governance and Nominating Committee has adopted a statement of policy that describes the experience, qualifications, attributes, and skills that are necessary and desirable for potential Independent Trustee candidates (Statement of Policy). The Board believes that each Trustee satisfied at the time he or she was initially elected or appointed a Trustee, and continues to satisfy, the standards contemplated by the Statement of Policy. The Governance and Nominating Committee also engages professional search firms to help identify potential Independent Trustee candidates who have the experience, qualifications, attributes, and skills consistent with the Statement of Policy. From time to time, additional criteria based on the composition and skills of the current Independent Trustees, as well as experience or skills that may be appropriate in light of future changes to board composition, business conditions, and regulatory or other developments, have also been considered by the professional search firms and the Governance and Nominating Committee. In addition, the Board takes into account the Trustees' commitment and participation in Board and committee meetings, as well as their leadership of standing and ad hoc committees throughout their tenure.
In determining that a particular Trustee was and continues to be qualified to serve as a Trustee, the Board has considered a variety of criteria, none of which, in isolation, was controlling. The Board believes that, collectively, the Trustees have balanced and diverse experience, qualifications, attributes, and skills, which allow the Board to operate effectively in governing the fund and protecting the interests of shareholders. Information about the specific experience, skills, attributes, and qualifications of each Trustee, which in each case led to the Board's conclusion that the Trustee should serve (or continue to serve) as a trustee of the fund, is provided below.
Annual Report
Board Structure and Oversight Function. Edward C. Johnson 3d is an interested person (as defined in the 1940 Act) and currently serves as Chairman. The Trustees have determined that an interested Chairman is appropriate and benefits shareholders because an interested Chairman has a personal and professional stake in the quality and continuity of services provided to the fund. Independent Trustees exercise their informed business judgment to appoint an individual of their choosing to serve as Chairman, regardless of whether the Trustee happens to be independent or a member of management. The Independent Trustees have determined that they can act independently and effectively without having an Independent Trustee serve as Chairman and that a key structural component for assuring that they are in a position to do so is for the Independent Trustees to constitute a substantial majority for the Board. The Independent Trustees also regularly meet in executive session. Ned C. Lautenbach serves as Chairman of the Independent Trustees and as such (i) acts as a liaison between the Independent Trustees and management with respect to matters important to the Independent Trustees and (ii) with management prepares agendas for Board meetings.
Fidelity funds are overseen by different Boards of Trustees. The fund Board oversees Fidelity's equity and high income funds and another Board oversees Fidelity's investment-grade bond, money market, and asset allocation funds. The asset allocation funds may invest in Fidelity funds overseen by the fund's Board. The use of separate Boards, each with its own committee structure, allows the Trustees of each group of Fidelity funds to focus on the unique issues of the funds they oversee, including common research, investment, and operational issues. On occasion, the separate Boards establish joint committees to address issues of overlapping consequences for the Fidelity funds overseen by each Board.
The Trustees operate using a system of committees to facilitate the timely and efficient consideration of all matters of importance to the Trustees, the fund, and fund shareholders and to facilitate compliance with legal and regulatory requirements and oversight of the fund's activities and associated risks. The Board, acting through its committees, has charged FMR and its affiliates with (i) identifying events or circumstances the occurrence of which could have demonstrably adverse effects on the fund's business and/or reputation; (ii) implementing processes and controls to lessen the possibility that such events or circumstances occur or to mitigate the effects of such events or circumstances if they do occur; and (iii) creating and maintaining a system designed to evaluate continuously business and market conditions in order to facilitate the identification and implementation processes described in (i) and (ii) above. Because the day-to-day operations and activities of the fund's are carried out by or through FMR, its affiliates and other service providers, the fund's exposure to risks is mitigated but not eliminated by the processes overseen by the Trustees. While each of the Board's committees has responsibility for overseeing different aspects of the fund's activities, oversight is exercised primarily through the Operations, Audit, and Compliance Committees. Appropriate personnel, including but not limited to the fund's Chief Compliance Officer (CCO), FMR's internal auditor, the independent accountants, the fund's Treasurer and portfolio management personnel, make periodic reports to the Board's committees, as appropriate. The responsibilities of each committee, including their oversight responsibilities, are described further under "Standing Committees of the Fund's Trustees."
Annual Report
Trustees and Officers - continued
The fund's Statement of Additional Information (SAI) includes more information about the Trustees. To request a free copy, call Fidelity at 1-800-544-8544.
Interested Trustees*:
Correspondence intended for each Trustee who is an interested person may be sent to Fidelity Investments, 82 Devonshire Street, Boston, Massachusetts 02109.
Name, Age; Principal Occupations and Other Relevant Experience+ |
Edward C. Johnson 3d (80) |
| Year of Election or Appointment: 1984 Mr. Johnson is Trustee and Chairman of the Board of Trustees of certain Trusts. Mr. Johnson serves as Chief Executive Officer, Chairman, and a Director of FMR LLC; Chairman and a Director of FMR; Chairman and a Director of Fidelity Research & Analysis Company (FRAC); Chairman and a Director of Fidelity Investments Money Management, Inc.; and Chairman and a Director of FMR Co., Inc. In addition, Mr. Johnson serves as Chairman and Director of FIL Limited. Previously, Mr. Johnson served as President of FMR LLC (2006-2007). |
James C. Curvey (75) |
| Year of Election or Appointment: 2007 Mr. Curvey also serves as Trustee (2007-present) of other investment companies advised by FMR. Mr. Curvey is a Director of FMR and FMR Co., Inc. (2007-present). Mr. Curvey is also Vice Chairman (2006-
present) and Director of FMR LLC. In addition, Mr. Curvey serves as an Overseer for the Boston Symphony Orchestra and a member of the Trustees of Villanova University. |
* Trustees have been determined to be "Interested Trustees" by virtue of, among other things, their affiliation with the trust or various entities under common control with FMR.
+ The information above includes each Trustee's principal occupation during the last five years and other information relating to the experience, attributes, and skills relevant to each Trustee's qualifications to serve as a Trustee, which led to the conclusion that each Trustee should serve as a Trustee for the fund.
Annual Report
Independent Trustees:
Correspondence intended for each Independent Trustee (that is, the Trustees other than the Interested Trustees) may be sent to Fidelity Investments, P.O. Box 55235, Boston, Massachusetts 02205-5235.
Name, Age; Principal Occupations and Other Relevant Experience+ |
Dennis J. Dirks (62) |
| Year of Election or Appointment: 2005 Prior to his retirement in May 2003, Mr. Dirks was Chief Operating Officer and a member of the Board of The Depository Trust & Clearing Corporation (DTCC). He also served as President, Chief Operating Officer, and Board member of The Depository Trust Company (DTC) and President and Board member of the National Securities Clearing Corporation (NSCC). In addition, Mr. Dirks served as Chief Executive Officer and Board member of the Government Securities Clearing Corporation, Chief Executive Officer and Board member of the Mortgage-Backed Securities Clearing Corporation, as a Trustee and a member of the Finance Committee of Manhattan College (2005-2008), and as a Trustee and a member of the Finance Committee of AHRC of Nassau County (2006-2008). Currently, Mr. Dirks serves as a member of the Board of Directors for The Brookville Center for Children's Services, Inc. (2009-present). |
Alan J. Lacy (56) |
| Year of Election or Appointment: 2008 Mr. Lacy serves as Senior Adviser (2007-present) of Oak Hill Capital Partners, L.P. (private equity). Mr. Lacy also served as Chief Executive Officer (2000-2005) and Vice Chairman (2005-2006) of Sears Holdings Corporation and Sears, Roebuck and Co. (retail). In addition, Mr. Lacy serves as a member of the Board of Directors of The Western Union Company (global money transfer, 2006-present) and Bristol-Myers Squibb Company (global pharmaceuticals, 2007-present). Mr. Lacy is Chairman (2008-present) and a member (2006-present) of the Board of Trustees of The National Parks Conservation Association. |
Ned C. Lautenbach (66) |
| Year of Election or Appointment: 2000 Mr. Lautenbach is Chairman of the Independent Trustees of the Equity and High Income Funds (2006-present). Mr. Lautenbach is an Advisory Partner of Clayton, Dubilier & Rice, Inc. (private equity investment, 2008-present) and was previously a Partner of Clayton, Dubilier & Rice, Inc. (1998-2008). Previously, Mr. Lautenbach was with the International Business Machines Corporation (IBM) from 1968 until his retirement in 1998. Mr. Lautenbach serves as a Director of Eaton Corporation (diversified industrial) as well as the Philharmonic Center for the Arts in Naples, Florida. Mr. Lautenbach is also a member of the Board of Trustees of Fairfield University (2005-present), as well as a member of the Council on Foreign Relations. Previously, Mr. Lautenbach served as a Director of Sony Corporation (2006-2007). |
Joseph Mauriello (65) |
| Year of Election or Appointment: 2008 Prior to his retirement in January 2006, Mr. Mauriello served in numerous senior management positions including Deputy Chairman and Chief Operating Officer (2004-2005), and Vice Chairman of Financial Services (2002-2004) of KPMG LLP US (professional services, 1965-2005). Mr. Mauriello currently serves as a member of the Board of Directors of XL Capital Ltd. (global insurance and re-insurance, 2006-present) and of Arcadia Resources Inc. (health care services and products, 2007-
present). Previously, Mr. Mauriello served as a Director of the Hamilton Funds of the Bank of New York (2006-2007). |
Cornelia M. Small (66) |
| Year of Election or Appointment: 2005 Ms. Small is a member of the Board of Directors of the Teagle Foundation (2009-present). Ms. Small is also a member of the Investment Committee, and Chair (2008-present) and a member of the Board of Trustees of Smith College. In addition, Ms. Small serves on the Investment Committee of the Berkshire Taconic Community Foundation (2008-present). Previously, Ms. Small served as Chairperson of the Investment Committee (2002-2008) of Smith College. In addition, Ms. Small served as Chief Investment Officer, Director of Global Equity Investments, and a member of the Board of Directors of Scudder, Stevens & Clark and Scudder Kemper Investments. |
William S. Stavropoulos (71) |
| Year of Election or Appointment: 2002 Mr. Stavropoulos is Vice Chairman of the Independent Trustees of the Equity and High Income Funds (2006-present). Mr. Stavropoulos serves as President and Founder of the Michigan Baseball Foundation, the Great Lakes Loons (2007-present). Mr. Stavropoulos is Chairman Emeritus of the Board of Directors of The Dow Chemical Company, where he previously served in numerous senior management positions, including President, CEO (1995-2000; 2002-2004), Chairman of the Executive Committee (2000-2006), and as a member of the Board of Directors (1990-2006). Currently, Mr. Stavropoulos is a Director of Teradata Corporation (data warehousing and technology solutions, 2008-present), Chemical Financial Corporation, Maersk Inc. (industrial conglomerate), Tyco International, Inc. (multinational manufacturing and services, 2007-present), and a member of the Advisory Board for Metalmark Capital (private equity investment, 2005-present). Mr. Stavropoulos is a special advisor to Clayton, Dubilier & Rice, Inc. (private equity investment). In addition, Mr. Stavropoulos is a member of the University of Notre Dame Advisory Council for the College of Science. |
David M. Thomas (61) |
| Year of Election or Appointment: 2008 Previously, Mr. Thomas served as Executive Chairman (2005-2006) and Chairman and Chief Executive Officer (2000-2005) of IMS Health, Inc. (pharmaceutical and healthcare information solutions). In addition, Mr. Thomas serves as a member of the Board of Directors of Fortune Brands, Inc. (consumer products), and Interpublic Group of Companies, Inc. (marketing communication, 2004-present). |
Michael E. Wiley (59) |
| Year of Election or Appointment: 2008 Mr. Wiley also serves as a Director of Asia Pacific Exploration Consolidated (international oil and gas exploration and production, 2008-present), and as a member of the Board of Trustees of the University of Tulsa (2000-2006; 2007-present). Mr. Wiley serves as a Director of Tesoro Corporation (independent oil refiner and marketer, 2005-
present), and a Director of Bill Barrett Corporation (exploration and production, 2005-present). In addition, Mr. Wiley also serves as a Director of Post Oak Bank (privately-held bank, 2004-present). Previously, Mr. Wiley served as a Sr. Energy Advisor of Katzenbach Partners, LLC (consulting, 2006-2007), as an Advisory Director of Riverstone Holdings (private investment), Chairman, President, and CEO of Baker Hughes, Inc. (oilfield services, 2000-2004), and as Director of Spinnaker Exploration Company (exploration and production, 2001-2005). |
+ The information above includes each Trustee's principal occupation during the last five years and other information relating to the experience, attributes, and skills relevant to each Trustee's qualifications to serve as a Trustee, which led to the conclusion that each Trustee should serve as a Trustee for the fund.
Advisory Board Member and Executive Officers:
Correspondence intended for each executive officer and Peter S. Lynch may be sent to Fidelity Investments, 82 Devonshire Street, Boston, Massachusetts 02109.
Name, Age; Principal Occupation |
Peter S. Lynch (66) |
| Year of Election or Appointment: 2003 Member of the Advisory Board of Fidelity's Equity and High Income Funds. Mr. Lynch is Vice Chairman and a Director of FMR and FMR Co., Inc. In addition, Mr. Lynch serves as a Trustee of Boston College and as the Chairman of the Inner-City Scholarship Fund. Previously, Mr. Lynch served on the Special Olympics International Board of Directors (1997-2006). |
Kenneth B. Robins (40) |
| Year of Election or Appointment: 2008 President and Treasurer of Fidelity's Equity and High Income Funds. Mr. Robins also serves as President and Treasurer (2010-present) and Assistant Treasurer (2009-present) of other Fidelity funds and is an employee of Fidelity Investments (2004-present). Previously, Mr. Robins served as Deputy Treasurer of the Fidelity funds (2005-2008) and Treasurer and Chief Financial Officer of The North Carolina Capital Management Trust: Cash and Term Portfolios (2006-2008). |
Brian B. Hogan (45) |
| Year of Election or Appointment: 2009 Vice President of certain Equity Funds and Vice President of Sector Funds. Mr. Hogan also serves as Senior Vice President, Equity Research of FMR (2006-present) and President of FMR's Equity Division (2009-
present). Previously, Mr. Hogan served as a portfolio manager. |
Thomas C. Hense (46) |
| Year of Election or Appointment: 2008 or 2010 Vice President of Fidelity's High Income (2008), Small Cap (2008), and Value (2010) Funds. Previously, Mr. Hense served as a portfolio manager for Fidelity's Institutional Money Management Group (Pyramis) (2003-2008). |
Scott C. Goebel (42) |
| Year of Election or Appointment: 2008 Secretary and Chief Legal Officer (CLO) of the Fidelity funds. Mr. Goebel also serves as General Counsel, Secretary, and Senior Vice President of FMR (2008-present) and FMR Co., Inc. (2008-present); Deputy General Counsel of FMR LLC; Chief Legal Officer of Fidelity Management & Research (Hong Kong) Limited (2008-present) and Assistant Secretary of Fidelity Management & Research (Japan) Inc. (2008-present), Fidelity Investments Money Management, Inc. (2008-
present), Fidelity Management & Research (U.K.) Inc. (2008-present), and Fidelity Research and Analysis Company (2008-present). Previously, Mr. Goebel served as Assistant Secretary of the Funds (2007-2008) and as Vice President and Secretary of Fidelity Distributors Corporation (FDC) (2005-2007). |
William C. Coffey (41) |
| Year of Election or Appointment: 2009 Assistant Secretary of Fidelity's Equity and High Income Funds. Mr. Coffey also serves as Senior Vice President and Deputy General Counsel of FMR LLC (2010-present), and is an employee of Fidelity Investments. Previously, Mr. Coffey served as Vice President and Associate General Counsel of FMR LLC (2005-2009). |
Holly C. Laurent (56) |
| Year of Election or Appointment: 2008 Anti-Money Laundering (AML) Officer of the Fidelity funds. Ms. Laurent is an employee of Fidelity Investments. Previously, Ms. Laurent was Senior Vice President and Head of Legal for Fidelity Business Services India Pvt. Ltd. (2006-2008), and Senior Vice President, Deputy General Counsel and Group Head for FMR LLC (2005-2006). |
Christine Reynolds (51) |
| Year of Election or Appointment: 2008 Chief Financial Officer of the Fidelity funds. Ms. Reynolds became President of Fidelity Pricing and Cash Management Services (FPCMS) in August 2008. Ms. Reynolds served as Chief Operating Officer of FPCMS (2007-2008). Previously, Ms. Reynolds served as President, Treasurer, and Anti-Money Laundering officer of the Fidelity funds (2004-2007). |
Kenneth A. Rathgeber (63) |
| Year of Election or Appointment: 2004 Chief Compliance Officer of Fidelity's Equity and High Income Funds. Mr. Rathgeber is Chief Compliance Officer of Fidelity Management & Research (Hong Kong) Limited (2008-present), Fidelity Management & Research (Japan) Inc. (2008-present), FMR (2005-present), FMR Co., Inc. (2005-present), Fidelity Management & Research (U.K.) Inc. (2005-present), Fidelity Research & Analysis Company (2005-present), Fidelity Investments Money Management, Inc. (2005-present), Pyramis Global Advisors, LLC (2005-present), and Strategic Advisers, Inc. (2005-present). |
Jeffrey S. Christian (48) |
| Year of Election or Appointment: 2009 Deputy Treasurer of the Fidelity funds. Mr. Christian is an employee of Fidelity Investments. Previously, Mr. Christian served as Chief Financial Officer (2008-2009) of certain Fidelity funds and Senior Vice President of Fidelity Pricing and Cash Management Services (FPCMS) (2004-2009). |
Bryan A. Mehrmann (49) |
| Year of Election or Appointment: 2005 Deputy Treasurer of the Fidelity funds. Mr. Mehrmann is an employee of Fidelity Investments. |
Adrien E. Deberghes (42) |
| Year of Election or Appointment: 2008 Deputy Treasurer of Fidelity's Equity and High Income Funds. Mr. Deberghes also serves as Assistant Treasurer of other Fidelity funds (2010-present) and is an employee of Fidelity Investments (2008-present). Previously, Mr. Deberghes served as Senior Vice President of Mutual Fund Administration at State Street Corporation (2007-2008), Senior Director of Mutual Fund Administration at Investors Bank & Trust (2005-2007), and Director of Finance for Dunkin' Brands (2000-2005). |
Stephanie J. Dorsey (41) |
| Year of Election or Appointment: 2010 Assistant Treasurer of Fidelity's Equity and High Income Funds. Ms. Dorsey also serves as Deputy Treasurer of other Fidelity funds (2008-
present) and is an employee of Fidelity Investments (2008-present). Previously, Ms. Dorsey served as Treasurer (2004-2008) of the JPMorgan Mutual Funds and Vice President (2004-2008) of JPMorgan Chase Bank. |
John R. Hebble (52) |
| Year of Election or Appointment: 2009 Assistant Treasurer of Fidelity's Equity and High Income Funds. Mr. Hebble also serves as Treasurer and Chief Financial Officer of The North Carolina Capital Management Trust: Cash and Term Portfolio (2008-present), President and Treasurer of other Fidelity funds (2008-
present) and is an employee of Fidelity Investments. |
Gary W. Ryan (51) |
| Year of Election or Appointment: 2005 Assistant Treasurer of the Fidelity funds. Mr. Ryan is an employee of Fidelity Investments. Previously, Mr. Ryan served as Vice President of Fund Reporting in Fidelity Pricing and Cash Management Services (FPCMS) (1999-2005). |
Annual Report
The Board of Trustees of Fidelity Small Cap Value Fund voted to pay shareholders of record at the opening of business on record date, the following distributions per share derived from capital gains realized from sales of portfolio securities, and dividends derived from net investment income:
| Pay Date | Record Date | Dividends | Capital Gains |
Small Cap Value | 09/09/10 | 09/08/10 | $0.036 | $0.066 |
Small Cap Value designates 100% of the dividends distributed during the fiscal year as qualifying for the dividend-received deduction for corporate shareholders.
Small Cap Value designates 100% of the dividends distributed during the fiscal year as amounts which may be taken into account as a dividend for the purposes of the maximum rate under section 1(h)(11) of the Internal Revenue Code.
The fund hereby designates as a capital gain dividend with respect to the taxable year ended July 31, 2010 $11,953,854, or, if subsequently determined to be different, the net capital gain of such year.
The fund will notify shareholders in January 2011 of amounts for use in preparing 2010 income tax returns.
Annual Report
Board Approval of Investment Advisory Contracts and Management Fees
Fidelity Small Cap Value Fund
Each year, the Board of Trustees, including the Independent Trustees (together, the Board), votes on the renewal of the management contract and sub-advisory agreements (together, the Advisory Contracts) for the fund. The Board, assisted by the advice of fund counsel and Independent Trustees' counsel, requests and considers a broad range of information relevant to the renewal of the Advisory Contracts throughout the year.
The Board meets regularly and considers at each of its meetings factors that are relevant to its annual consideration of the renewal of the fund's Advisory Contracts, including the services and support provided to the fund and its shareholders. The Board has established various standing committees, each composed of Independent Trustees with varying backgrounds, to which the Board has assigned specific subject matter responsibilities in order to enhance effective decision-making by the Board. The Board, acting directly and through its Committees, requests and receives information concerning the annual consideration of the renewal of the fund's Advisory Contracts. The Board also meets as needed to consider matters specifically related to the Board's annual consideration of the renewal of Advisory Contracts. Members of the Board may also meet with trustees of other Fidelity funds through ad hoc joint committees to discuss certain matters relevant to the Fidelity funds.
At its July 2010 meeting, the Board of Trustees, including the Independent Trustees, unanimously determined to renew the fund's Advisory Contracts. In reaching its determination, the Board considered all factors it believed relevant, including (i) the nature, extent, and quality of the services to be provided to the fund and its shareholders (including the investment performance of the fund); (ii) the competitiveness of the fund's management fee and total expenses; (iii) the total costs of the services to be provided by and the profits to be realized by Fidelity from its relationship with the fund; (iv) the extent to which economies of scale would be realized as the fund grows; and (v) whether fee levels reflect these economies of scale, if any, for the benefit of fund shareholders.
In considering whether to renew the Advisory Contracts for the fund, the Board reached a determination, with the assistance of fund counsel and Independent Trustees' counsel and through the exercise of its business judgment, that the renewal of the Advisory Contracts is in the best interests of fund shareholders and that the compensation to be received by Fidelity under the management contract is fair and reasonable. The Board's decision to renew the Advisory Contracts was not based on any single factor noted above, but rather was based on a comprehensive consideration of all the information provided to the Board at its meetings throughout the year. The Board, in reaching its determination to renew the Advisory Contracts, is aware that shareholders in the fund have a broad range of investment choices available to them, including a wide choice among mutual funds offered by Fidelity's competitors, and that the fund's shareholders, with the opportunity to review and weigh the disclosure provided by the fund in its prospectus and other public disclosures, have chosen to invest in this fund, managed by Fidelity.
Annual Report
Board Approval of Investment Advisory Contracts and
Management Fees - continued
Nature, Extent, and Quality of Services Provided. The Board considered the staffing within the investment adviser, FMR, and the sub-advisers (together, the Investment Advisers), including the backgrounds of the fund's investment personnel and the fund's investment objective and discipline. The Independent Trustees also had discussions with senior management of Fidelity's investment operations and investment groups. The Board considered the structure of the portfolio manager compensation program and whether this structure provides appropriate incentives to act in the best interest of the fund.
Resources Dedicated to Investment Management and Support Services. The Board and the equity research subcommittee of the Board's Fund Oversight Committee reviewed the size, education, and experience of the Investment Advisers' investment staff, their use of technology, and the Investment Advisers' approach to recruiting, training, and retaining portfolio managers and other research, advisory, and management personnel. The Board noted that Fidelity's analysts have access to a variety of technological tools and market and securities data that enable them to perform both fundamental and quantitative analysis and to specialize in various disciplines. The Board considered Fidelity's extensive global research capabilities that enable the Investment Advisers to aggregate data from various sources in an effort to produce positive investment results. The Board also considered that Fidelity's portfolio managers and analysts have access to daily portfolio attribution that allows for monitoring of a fund's portfolio, as well as an electronic communication system that provides immediate real-time access to research concerning issuers and credit enhancers. The Board noted FMR's continued focus on strengthening the organization and discipline of equity portfolio management and research.
Shareholder and Administrative Services. The Board considered (i) the nature, extent, quality, and cost of advisory, administrative, and shareholder services performed by the Investment Advisers and their affiliates under the Advisory Contracts and under separate agreements covering transfer agency, pricing and bookkeeping, and securities lending services for the fund; (ii) the nature and extent of the investment adviser's supervision of third party service providers, principally custodians and subcustodians; and (iii) the resources devoted to, and the record of compliance with, the fund's compliance policies and procedures. The Board also reviewed the allocation of fund brokerage, including allocations to brokers affiliated with the Investment Advisers, the use of brokerage commissions to pay fund expenses, and the use of "soft" commission dollars to pay for research services.
The Board noted that the growth of fund assets over time across the complex allows Fidelity to reinvest in the development of services designed to enhance the value or convenience of the Fidelity funds as investment vehicles. These services include 24-hour access to account information and market information through phone representatives and over the Internet, and investor education materials and asset allocation tools.
Annual Report
Investment in a Large Fund Family. The Board considered the benefits to shareholders of investing in a Fidelity fund, including the benefits of investing in a fund that is part of a large family of funds offering a variety of investment disciplines and providing a large variety of mutual fund investor services. The Board noted that Fidelity had taken, or had made recommendations that resulted in the Fidelity funds taking, a number of actions over the previous year that benefited particular funds, including (i) dedicating additional resources to investment research and restructuring and broadening the focus of the investment research teams; (ii) bolstering the senior management team that oversees asset management; (iii) launching Class F of certain funds as a lower-fee class available to Freedom K and Freedom Index Funds; (iv) lowering the initial investment minimums and ongoing balance requirements for Real Estate High Income Fund; (v) eliminating subsequent purchase minimums for all funds and adding a waiver of the investment minimum requirement for new accounts opened with the proceeds of a systematic withdrawal plan; (vi) eliminating the withdrawal minimum and maximum limits for systematic withdrawals from Advisor funds; (vii) expanding sales load waivers on Class A shares for Destiny Planholders and expanding Institutional Class eligibility for Class O Destiny Planholders; and (viii) changing certain Class A and Class T sales charge structures to further align them with industry practices.
Investment Performance. The Board considered whether the fund has operated in accordance with its investment objective, as well as its record of compliance with its investment restrictions. It also reviewed the fund's absolute investment performance for each class (except Class F), as well as the fund's relative investment performance for each class (except Class F) measured over multiple periods against (i) a broad-based securities market index, and (ii) a peer group of mutual funds deemed appropriate by Fidelity and reviewed by the Board. The following charts considered by the Board show, over the one-, three-, and five-year periods ended December 31, 2009, the cumulative total returns of Institutional Class (Class I) and Class B of the fund, the cumulative total returns of a broad-based securities market index ("benchmark"), and a range of cumulative total returns of a peer group of mutual funds identified by Morningstar, Inc. as having an investment style similar to that of the fund based on underlying portfolio holdings. The returns of Institutional Class (Class I) and Class B show the performance of the highest and lowest performing classes, respectively (based on five-year performance). (Class F had less than one year of performance as of December 31, 2009.) The box within each chart shows the 25th percentile return (bottom of box) and the 75th percentile return (top of box) of the peer group. Returns shown above the box are in the first quartile and returns shown below the box are in the fourth quartile. The percentage beaten numbers noted below each chart correspond to the percentile box and represent the percentage of funds in the peer group whose performance was equal to or lower than that of the class indicated.
Annual Report
Board Approval of Investment Advisory Contracts and
Management Fees - continued
Fidelity Small Cap Value Fund

The Board reviewed the fund's relative investment performance against its peer group and noted that the performance of Institutional Class (Class I) of the fund was in the first quartile for all the periods shown. The Board also noted that the investment performance of Institutional Class (Class I) of the fund compared favorably to its benchmark for all the periods shown. The Board considered that the variations in performance among the fund's classes reflect the variations in class expenses, which result in lower performance for higher expense classes. The Board also reviewed the fund's performance since inception as well as performance in the current year.
The Board also considered that the fund's management fee is subject to upward or downward adjustment depending upon whether, and to what extent, the fund's investment performance for the performance period exceeds, or is exceeded by, the record (over the same period) of a Board-approved performance adjustment index. The Board realizes that the performance adjustment provides FMR with a strong economic incentive to seek to achieve superior performance for the fund's shareholders and helps to more closely align the interests of FMR and the fund's shareholders.
Based on its review, and giving particular weight to the nature and quality of the resources dedicated by the Investment Advisers to maintain and improve relative performance and factoring in the unprecedented market events in recent years, the Board concluded that the nature, extent, and quality of investment management and support services and of shareholder and administrative services provided to the fund will benefit the fund's shareholders, particularly in light of the Board's view that the fund's shareholders benefit from investing in a fund that is part of a large family of funds offering a variety of investment disciplines and services.
Annual Report
Competitiveness of Management Fee and Total Fund Expenses. The Board considered the fund's management fee and total expenses compared to "mapped groups" of competitive funds and classes. Fidelity creates "mapped groups" by combining similar Lipper investment objective categories that have comparable management fee characteristics. Combining Lipper investment objective categories aids the Board's management fee and total expense comparisons by broadening the competitive group used for comparison and by reducing the number of universes to which various Fidelity funds are compared.
Management Fee. The Board considered two proprietary management fee comparisons for the 12-month periods shown in the chart below. The group of Lipper funds used by the Board for management fee comparisons is referred to below as the "Total Mapped Group." The Total Mapped Group comparison focuses on a fund's standing relative to the total universe of comparable funds available to investors, in terms of gross management fees before expense reimbursements or caps, and without giving effect to the fund's performance adjustment. "TMG %" represents the percentage of funds in the Total Mapped Group that had management fees that were lower than the fund's. For example, a TMG % of 13% means that 87% of the funds in the Total Mapped Group had higher management fees than the fund. The "Asset-Size Peer Group" (ASPG) comparison focuses on a fund's standing relative to non-Fidelity funds similar in size to the fund within the Total Mapped Group. The ASPG represents at least 15% of the funds in the Total Mapped Group with comparable asset size and management fee characteristics, subject to a minimum of 50 funds (or all funds in the Total Mapped Group if fewer than 50). Additional information, such as the ASPG quartile in which the fund's management fee ranked and the impact of the fund's performance adjustment, is also included in the chart and considered by the Board.
Annual Report
Board Approval of Investment Advisory Contracts and
Management Fees - continued
Fidelity Small Cap Value Fund

The Board noted that the fund's management fee ranked below the median of its Total Mapped Group and below the median of its ASPG for 2009. The Board also noted the effect of the fund's positive performance adjustment on the fund's management fee ranking. The Board noted that the performance adjustment for each year represents calculations for performance periods that differ from the periods shown in the performance charts above.
Based on its review, the Board concluded that the fund's management fee is fair and reasonable in light of the services that the fund receives and the other factors considered.
Total Expenses. In its review of each class's total expenses, the Board considered the fund's management fee as well as other fund or class expenses, as applicable, such as transfer agent fees, pricing and bookkeeping fees, fund-paid 12b-1 fees, and custodial, legal, and audit fees. The Board also noted the effects of any waivers and reimbursements on fees and expenses, as well as the impact of the fund's performance adjustment. As part of its review, the Board also considered current and historical total expenses of each class of the fund compared to competitive fund median expenses. Each class of the fund is compared to those funds and classes in the Total Mapped Group (used by the Board for management fee comparisons) that have a similar sales load structure.
The Board noted that the total expenses of each of Class A, Class B, the retail class, and Class F ranked below its competitive median for the period, the total expenses of each of Class C and Institutional Class ranked equal to its competitive median for the period, and the total expenses of Class T ranked above its competitive median for the period. The Board considered that the total expenses for Class T were above the median primarily because its 12b-1 fee is higher than the typical front-end load class. The Board noted that the fund offers multiple classes, each of which has a different sales load and 12b-1 fee structure, and that the multiple structures are intended to offer a range of pricing options for the intermediary market. The Board also noted that the total expenses of the classes vary primarily by the level of their 12b-1 fees, although differences in transfer agent fees may also cause expenses to vary from class to class.
Annual Report
Fees Charged to Other Fidelity Clients. The Board also considered Fidelity fee structures and other information with respect to clients of FMR and its affiliates, such as other mutual funds advised or subadvised by FMR or its affiliates, pension plan clients, and other institutional clients. In March 2010, the Board created an ad hoc joint committee with the board of other Fidelity funds (the Committee) to review and compare Fidelity's institutional investment advisory business with its business of providing services to the Fidelity funds, including the differences in services provided, fees charged, and costs incurred, as well as competition in their respective marketplaces.
Based on its review of total expenses and fees charged to other Fidelity clients, the Board concluded that the total expenses of each class of the fund were reasonable, although in one case above the median of the universe presented for comparison, in light of the services that the fund and its shareholders receive and the other factors considered, including the findings of the Committee.
Costs of the Services and Profitability. The Board considered the revenues earned and the expenses incurred by Fidelity in conducting the business of developing, marketing, distributing, managing, administering and servicing the fund and its shareholders. The Board also considered the level of Fidelity's profits in respect of all the Fidelity funds.
On an annual basis, FMR presents to the Board Fidelity's profitability for the fund. Fidelity calculates the profitability for each fund, as well as aggregate profitability for groups of Fidelity funds and all Fidelity funds, using a series of detailed revenue and cost allocation methodologies which originate with the audited books and records of Fidelity. The Audit Committee of the Board reviews any significant changes from the prior year's methodologies.
PricewaterhouseCoopers LLP (PwC), independent registered public accounting firm and auditor to Fidelity and certain Fidelity funds, has been engaged annually by the Board as part of the Board's assessment of Fidelity's profitability analysis. PwC's engagement includes the review and assessment of Fidelity's methodologies used in determining the revenues and expenses attributable to Fidelity's mutual fund business, and completion of agreed-upon procedures surrounding the mathematical accuracy of fund profitability and its conformity to allocation methodologies. After considering PwC's reports issued under the engagement and information provided by Fidelity, the Board believes that while other allocation methods may also be reasonable, Fidelity's profitability methodologies are reasonable in all material respects.
Annual Report
Board Approval of Investment Advisory Contracts and
Management Fees - continued
The Board has also reviewed Fidelity's non-fund businesses and fall-out benefits related to the mutual fund business as well as cases where Fidelity's affiliates may benefit from or be related to the fund's business.
The Board considered the costs of the services provided by and the profits realized by Fidelity in connection with the operation of the fund and were satisfied that the profitability was not excessive in the circumstances.
Economies of Scale. The Board considered whether there have been economies of scale in respect of the management of the Fidelity funds, whether the Fidelity funds (including the fund) have appropriately benefited from any such economies of scale, and whether there is potential for realization of any further economies of scale. The Board considered the extent to which the fund will benefit from economies of scale through increased services to the fund, through waivers or reimbursements, or through fee or expense reductions.
In February 2009, the Board and the board of other Fidelity funds created an ad hoc committee (the Economies of Scale Committee) to analyze whether FMR attains economies of scale in respect of the management and servicing of the Fidelity funds, whether the Fidelity funds have appropriately benefited from such economies of scale, and whether there is potential for realization of any further economies of scale.
The Board recognized that the fund's management contract incorporates a "group fee" structure, which provides for lower group fee rates as total fund assets under FMR's management increase, and for higher group fee rates as total fund assets under FMR's management decrease. FMR calculates the group fee rates based on a tiered asset "breakpoint" schedule that varies based on asset class. The Board considered that the group fee is designed to deliver the benefits of economies of scale to fund shareholders when total Fidelity fund assets increase, even if assets of any particular fund are unchanged or have declined, because some portion of Fidelity's costs are attributable to services provided to all Fidelity funds, and all funds benefit if those costs can be allocated among more assets. The Board concluded that, given the group fee structure, fund shareholders will benefit from lower management fees as assets under FMR's management increase at the fund complex level, regardless of whether Fidelity achieves any such economies of scale.
The Board concluded, considering the findings of the Economies of Scale Committee, that any potential economies of scale are being appropriately shared between fund shareholders and Fidelity.
Additional Information Requested by the Board. In order to develop fully the factual basis for consideration of the Fidelity funds' Advisory Contracts, the Board requested and received additional information on certain topics, including (i) fund performance trends, actions to be taken by FMR to improve certain funds' overall performance, and Fidelity's long-term strategies for certain funds; (ii) portfolio manager changes that have occurred during the past year and length of portfolio manager tenure for different categories of funds over time; (iii) Fidelity's compensation structure for portfolio managers, research analysts, and other key personnel, the rationale for the compensation structure, and how the compensation structure provides appropriate performance incentives; (iv) the amount of the investment that each portfolio manager has made in the Fidelity fund(s) that he or she manages; (v) management and other fees paid by FMR to affiliated sub-advisers on behalf of the Fidelity funds; (vi) Fidelity's fee structures and rationale for recommending different fees among different categories of funds; (vii) Fidelity's rationale for recommending which funds should have a performance adjustment component as part of their management fees; (viii) the rationale for any differences between fund fee structures and fee structures in place for other Fidelity clients; and (ix) explanations regarding the relative total expenses borne by certain funds and classes, total expense competitive trends, and actions that might be taken by FMR to reduce total expenses for certain funds and classes.
Annual Report
Based on its evaluation of all of the conclusions noted above, and after considering all factors it believed relevant, the Board ultimately concluded that the advisory fee structures are fair and reasonable, and that the fund's Advisory Contracts should be renewed.
Annual Report
Managing Your Investments
Fidelity offers several ways to conveniently manage your personal investments via your telephone or PC. You can access your account information, conduct trades and research your investments 24 hours a day.
By Phone
Fidelity Automated Service Telephone provides a single toll-free number to access account balances, positions, quotes and trading. It's easy to navigate the service, and on your first call, the system will help you create a personal identification number (PIN) for security.
(phone_graphic)
Fidelity Automated
Service Telephone (FAST®)
1-800-544-5555
Press
For mutual fund and brokerage trading.
For quotes.*
For account balances and holdings.
To review orders and mutual
fund activity.
To change your PIN.
To speak to a Fidelity representative.
By PC
Fidelity's web site on the Internet provides a wide range of information, including daily financial news, fund performance, interactive planning tools and news about Fidelity products and services.
(computer_graphic)
Fidelity's Web Site
www.fidelity.com
* When you call the quotes line, please remember that a fund's yield and return will vary and, except for money market funds, share price will also vary. This means that you may have a gain or loss when you sell your shares. There is no assurance that money market funds will be able to maintain a stable $1 share price; an investment in a money market fund is not insured or guaranteed by the U.S. government. Total returns are historical and include changes in share price, reinvestment of dividends and capital gains, and the effects of any sales charges.
Annual Report
To Write Fidelity
We'll give your correspondence immediate attention and send you written confirmation upon completion of your request.
(letter_graphic)
Making Changes
To Your Account
(such as changing name, address, bank, etc.)
Fidelity Investments
P.O. Box 770001
Cincinnati, OH 45277-0002
(letter_graphic)
For Non-Retirement
Accounts
Buying shares
Fidelity Investments
P.O. Box 770001
Cincinnati, OH 45277-0003
Overnight Express
Fidelity Investments
Attn: Distribution Services
100 Crosby Parkway - KC1H
Covington, KY 41015
Selling shares
Fidelity Investments
P.O. Box 770001
Cincinnati, OH 45277-0035
Overnight Express
Fidelity Investments
Attn: Distribution Services
100 Crosby Parkway - KC1H
Covington, KY 41015
General Correspondence
Fidelity Investments
P.O. Box 500
Merrimack, NH 03054-0500
(letter_graphic)
For Retirement
Accounts
Buying shares
Fidelity Investments
P.O. Box 770001
Cincinnati, OH 45277-0003
Selling shares
Fidelity Investments
P.O. Box 770001
Cincinnati, OH 45277-0035
Overnight Express
Fidelity Investments
Attn: Distribution Services
100 Crosby Parkway - KC1H
Covington, KY 41015
General Correspondence
Fidelity Investments
P.O. Box 500
Merrimack, NH 03054-0500
Annual Report
To Visit Fidelity
For directions and hours,
please call 1-800-544-9797.
Arizona
7001 West Ray Road
Chandler, AZ
15445 N. Scottsdale Road
Scottsdale, AZ
17550 North 75th Avenue
Glendale, AZ
5330 E. Broadway Blvd
Tucson, AZ
California
815 East Birch Street
Brea, CA
1411 Chapin Avenue
Burlingame, CA
851 East Hamilton Avenue
Campbell, CA
601 Larkspur Landing Circle
Larkspur, CA
2000 Avenue of the Stars
Los Angeles, CA
27101 Puerta Real
Mission Viejo, CA
73575 El Paseo
Palm Desert, CA
251 University Avenue
Palo Alto, CA
123 South Lake Avenue
Pasadena, CA
16656 Bernardo Ctr. Drive
Rancho Bernardo, CA
1220 Roseville Parkway
Roseville, CA
1740 Arden Way
Sacramento, CA
7676 Hazard Center Drive
San Diego, CA
11943 El Camino Real
San Diego, CA
8 Montgomery Street
San Francisco, CA
3793 State Street
Santa Barbara, CA
1200 Wilshire Boulevard
Santa Monica, CA
398 West El Camino Real
Sunnyvale, CA
111 South Westlake Blvd
Thousand Oaks, CA
21701 Hawthorne Boulevard
Torrance, CA
2001 North Main Street
Walnut Creek, CA
6326 Canoga Avenue
Woodland Hills, CA
2211 Michelson Drive
Irvine, CA
Colorado
281 East Flatiron Circle
Broomfield, CO
1625 Broadway
Denver, CO
9185 Westview Road
Lone Tree, CO
Connecticut
48 West Putnam Avenue
Greenwich, CT
265 Church Street
New Haven, CT
300 Atlantic Street
Stamford, CT
29 South Main Street
West Hartford, CT
1261 Post Road
Fairfield, CT
Delaware
400 Delaware Avenue
Wilmington, DE
Florida
175 East Altamonte Drive
Altamonte Springs, FL
1400 Glades Road
Boca Raton, FL
121 Alhambra Plaza
Coral Gables, FL
2948 N. Federal Highway
Ft. Lauderdale, FL
4671 Town Center Parkway
Jacksonville, FL
8880 Tamiami Trail, North
Naples, FL
230 Royal Palm Way
Palm Beach, FL
3501 PGA Boulevard
Palm Beach Gardens, FL
3550 Tamiami Trail, South
Sarasota, FL
1502 N. Westshore Blvd.
Tampa, FL
2465 State Road 7
Wellington, FL
Georgia
3242 Peachtree Road
Atlanta, GA
1000 Abernathy Road
Atlanta, GA
Illinois
One North LaSalle Street
Chicago, IL
401 North Michigan Avenue
Chicago, IL
One Skokie Valley Road
Highland Park, IL
1415 West 22nd Street
Oak Brook, IL
15105 S LaGrange Road
Orland Park, IL
1572 East Golf Road
Schaumburg, IL
1823 Freedom Drive
Naperville, IL
Indiana
8480 Keystone Crossing
Indianapolis, IN
Kansas
5400 College Boulevard
Overland Park, KS
Maine
Three Canal Plaza
Portland, ME
Maryland
7315 Wisconsin Avenue
Bethesda, MD
610 York Road
Towson, MD
Massachusetts
801 Boylston Street
Boston, MA
155 Congress Street
Boston, MA
300 Granite Street
Braintree, MA
44 Mall Road
Burlington, MA
238 Main Street
Cambridge, MA
200 Endicott Street
Danvers, MA
Annual Report
405 Cochituate Road
Framingham, MA
551 Boston Turnpike
Shrewsbury, MA
Michigan
500 E. Eisenhower Pkwy.
Ann Arbor, MI
280 N. Old Woodward Ave.
Birmingham, MI
30200 Northwestern Hwy.
Farmington Hills, MI
43420 Grand River Avenue
Novi, MI
3480 28th Street
Grand Rapids, MI
2425 S. Linden Road STE E
Flint, MI
Minnesota
7740 France Avenue South
Edina, MN
8342 3rd Street North
Oakdale, MN
Missouri
1524 South Lindbergh Blvd.
St. Louis, MO
Nevada
2225 Village Walk Drive
Henderson, NV
New Jersey
501 Route 73 South
Marlton, NJ
150 Essex Street
Millburn, NJ
35 Morris Street
Morristown, NJ
396 Route 17, North
Paramus, NJ
3518 Route 1 North
Princeton, NJ
530 Broad Street
Shrewsbury, NJ
New Mexico
2261 Q Street NE
Albuquerque, NM
New York
1130 Franklin Avenue
Garden City, NY
37 West Jericho Turnpike
Huntington Station, NY
1271 Avenue of the Americas
New York, NY
980 Madison Avenue
New York, NY
61 Broadway
New York, NY
350 Park Avenue
New York, NY
200 Fifth Avenue
New York, NY
733 Third Avenue
New York, NY
2070 Broadway
New York, NY
1075 Northern Blvd.
Roslyn, NY
799 Central Park Avenue
Scarsdale, NY
3349 Monroe Avenue
Rochester, NY
North Carolina
4611 Sharon Road
Charlotte, NC
7011 Fayetteville Road
Durham, NC
Ohio
3805 Edwards Road
Cincinnati, OH
1324 Polaris Parkway
Columbus, OH
1800 Crocker Road
Westlake, OH
28699 Chagrin Boulevard
Woodmere Village, OH
Oregon
7493 SW Bridgeport Road
Tigard, OR
Pennsylvania
600 West DeKalb Pike
King of Prussia, PA
1735 Market Street
Philadelphia, PA
12001 Perry Highway
Wexford, PA
Rhode Island
10 Memorial Boulevard
Providence, RI
Tennessee
3018 Peoples Street
Johnson City, TN
7628 West Farmington Blvd.
Germantown, TN
2035 Mallory Lane
Franklin, TN
Texas
10000 Research Boulevard
Austin, TX
4001 Northwest Parkway
Dallas, TX
12532 Memorial Drive
Houston, TX
2701 Drexel Drive
Houston, TX
6560 Fannin Street
Houston, TX
1701 Lake Robbins Drive
The Woodlands, TX
6500 N. MacArthur Blvd.
Irving, TX
6005 West Park Boulevard
Plano, TX
1576 East Southlake Blvd.
Southlake, TX
15600 Southwest Freeway
Sugar Land, TX
139 N. Loop 1604 East
San Antonio, TX
Utah
279 West South Temple
Salt Lake City, UT
Virginia
1861 International Drive
McLean, VA
11957 Democracy Drive
Reston, VA
Washington
10500 NE 8th Street
Bellevue, WA
1518 6th Avenue
Seattle, WA
304 Strander Blvd
Tukwila, WA
Washington, DC
1900 K Street, N.W.
Washington, DC
Wisconsin
16020 West Bluemound Road
Brookfield, WI
Fidelity Brokerage Services, Inc., 100 Summer St., Boston, MA 02110 Member NYSE/SIPC
Annual Report
Investment Adviser
Fidelity Management & Research Company
Boston, MA
Investment Sub-Advisers
FMR Co., Inc.
Fidelity Research & Analysis Company
Fidelity Management & Research
(U.K.) Inc.
Fidelity Management & Research
(Hong Kong) Limited
Fidelity Management & Research
(Japan) Inc.
General Distributor
Fidelity Distributors Corporation
Boston, MA
Transfer and Service Agents
Fidelity Investments Institutional
Operations Company, Inc.
Boston, MA
Fidelity Service Company, Inc.
Boston, MA
Custodian
Citibank, N.A.
New York, NY
The Fidelity Telephone Connection
Mutual Fund 24-Hour Service
Exchanges/Redemptions
and Account Assistance 1-800-544-6666
Product Information 1-800-544-6666
Retirement Accounts 1-800-544-4774
(8 a.m. - 9 p.m.)
TDD Service 1-800-544-0118
for the deaf and hearing impaired
(9 a.m. - 9 p.m. Eastern time)
Fidelity Automated Service
Telephone (FAST®) 1-800-544-5555
Automated line for quickest service
SCV-UANN-0910
1.803705.105
Fidelity®
Small Cap Value
Fund
Class F
Annual Report
July 31, 2010
(2_fidelity_logos) (Registered_Trademark)
Contents
Chairman's Message | <Click Here> | The Chairman's message to shareholders. |
Performance | <Click Here> | How the fund has done over time. |
Management's Discussion of Fund Performance | <Click Here> | The Portfolio Manager's review of fund performance and strategy. |
Shareholder Expense Example | <Click Here> | An example of shareholder expenses. |
Investment Changes | <Click Here> | A summary of major shifts in the fund's investments over the past six months. |
Investments | <Click Here> | A complete list of the fund's investments with their market values. |
Financial Statements | <Click Here> | Statements of assets and liabilities, operations, and changes in net assets,
as well as financial highlights. |
Notes | <Click Here> | Notes to the financial statements. |
Report of Independent Registered Public Accounting Firm | <Click Here> | |
Trustees and Officers | <Click Here> | |
Distributions | <Click Here> | |
Board Approval of Investment Advisory Contracts and Management Fees | <Click Here> | |
To view a fund's proxy voting guidelines and proxy voting record for the 12-month period ended June 30, visit http://www.fidelity.com/proxyvotingresults or visit the Securities and Exchange Commission's (SEC) web site at http://www.sec.gov. You may also call 1-800-544-8544 to request a free copy of the proxy voting guidelines.
Standard & Poor's, S&P and S&P 500 are registered service marks of The McGraw-Hill Companies, Inc. and have been licensed for use by Fidelity Distributors Corporation.
Other third party marks appearing herein are the property of their respective owners.
All other marks appearing herein are registered or unregistered trademarks or service marks of FMR LLC or an affiliated company.
Annual Report
This report and the financial statements contained herein are submitted for the general information of the shareholders of the fund. This report is not authorized for distribution to prospective investors in the fund unless preceded or accompanied by an effective prospectus.
A fund files its complete schedule of portfolio holdings with the SEC for the first and third quarters of each fiscal year on Form N-Q. Forms N-Q are available on the SEC's web site at http://www.sec.gov. A fund's Forms N-Q may be reviewed and copied at the SEC's Public Reference Room in Washington, DC. Information regarding the operation of the SEC's Public Reference Room may be obtained by calling 1-800-SEC-0330. For a complete list of a fund's portfolio holdings, view the most recent holdings listing, semiannual report, or annual report on Fidelity's web site at http://www.fidelity.com or http://www.advisor.fidelity.com, as applicable.
NOT FDIC INSURED • MAY LOSE VALUE • NO BANK GUARANTEE
Neither the fund nor Fidelity Distributors Corporation is a bank.
Annual Report
(photo_of_Edward_C_Johnson_3d)
Dear Shareholder:
A yearlong uptrend in global equity markets reversed course in late April 2010 when investor sentiment turned bearish due in great measure to concern that Europe's debt crisis would expand and slow or derail economic recovery. However, a bounceback in July helped to recover some of the ground that was lost. Financial markets are always unpredictable, of course, but there also are several time-tested investment principles that can help put the odds in your favor.
One of the basic tenets is to invest for the long term. Over time, riding out the markets' inevitable ups and downs has proven much more effective than selling into panic or chasing the hottest trend. Even missing only a few of the markets' best days can significantly diminish investor returns. Patience also affords the benefits of compounding - of earning interest on additional income or reinvested dividends and capital gains. There can be tax advantages and cost benefits to consider as well. While staying the course doesn't eliminate risk, it can considerably lessen the effect of short-term declines.
You can further manage your investing risk through diversification. And today, more than ever, geographic diversification should be taken into account. Studies indicate that asset allocation is the single most important determinant of a portfolio's long-term success. The right mix of stocks, bonds and cash - aligned to your particular risk tolerance and investment objective - is very important. Age-appropriate rebalancing is also an essential aspect of asset allocation. For younger investors, an emphasis on equities - which historically have been the best-performing asset class over time - is encouraged. As investors near their specific goal, such as retirement or sending a child to college, consideration may be given to replacing volatile assets (e.g. common stocks) with more-stable fixed investments (bonds or savings plans).
A third principle - investing regularly - can help lower the average cost of your purchases. Investing a certain amount of money each month or quarter helps ensure you won't pay for all your shares at market highs. This strategy - known as dollar cost averaging - also reduces "emotion" from investing, helping shareholders avoid selling weak performers just prior to an upswing, or chasing a hot performer just before a correction.
We invite you to contact us via the Internet, through our Investor Centers or by phone. It is our privilege to provide you the information you need to make the investments that are right for you.
Sincerely,
(The chairman's signature appears here.)
Edward C. Johnson 3d
Annual Report
Average annual total return reflects the change in the value of an investment, assuming reinvestment of the class' distributions from dividend income and capital gains (the profits earned upon the sale of securities that have grown in value, if any) and assuming a constant rate of performance each year. The $10,000 table and the fund's returns do not reflect the deduction of taxes that a shareholder would pay on fund distributions or the redemption of fund shares. During periods of reimbursement by Fidelity, a fund's total return will be greater than it would be had the reimbursement not occurred. How a fund did yesterday is no guarantee of how it will do tomorrow.
Average Annual Total Returns
Periods ended July 31, 2010 | Past 1
year | Past 5
years | Life of fund A |
Class F B | 21.69% | 4.09% | 8.15% |
A From November 3, 2004.
B The initial offering of Class F shares took place on June 26, 2009. Returns prior to June 26, 2009 are those of Fidelity Small Cap Value Fund, the original class of the fund.
$10,000 Over Life of Fund
Let's say hypothetically that $10,000 was invested in Fidelity Small Cap Value Fund - Class F on November 3, 2004, when the fund started. The chart shows how the value of your investment would have changed, and also shows how the Russell 2000® Value Index performed over the same period. The initial offering of Class F took place on June 26, 2009. See above for additional information regarding the performance of Class F.
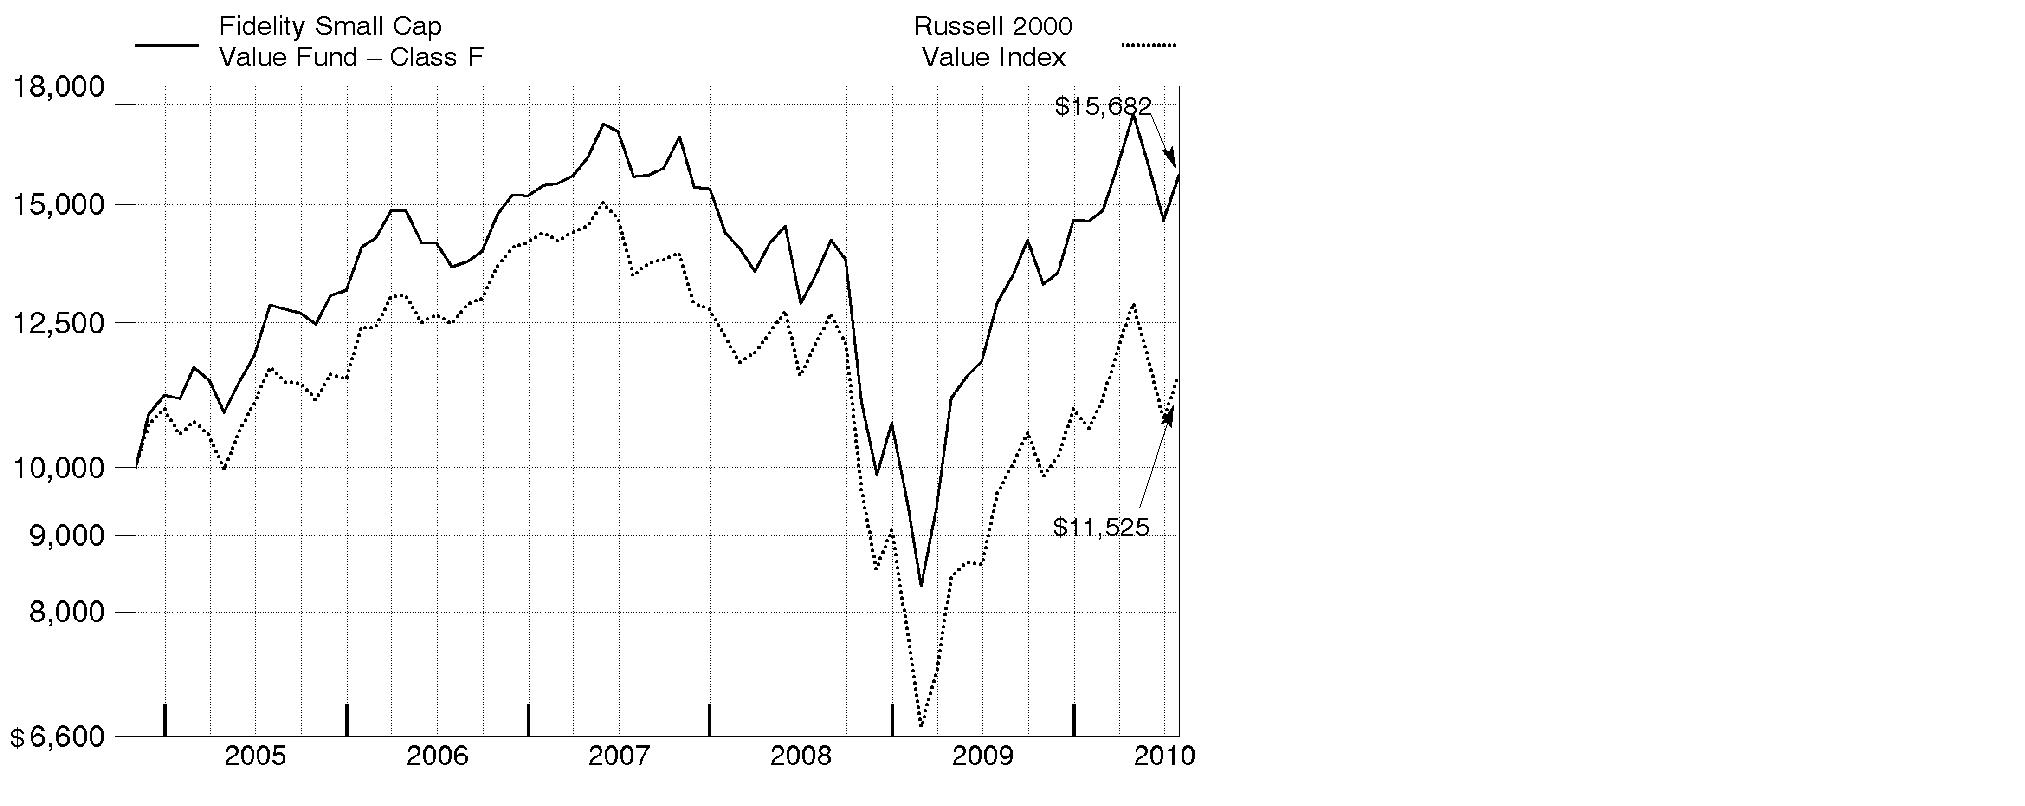
Annual Report
Market Recap: U.S. stock markets saw double-digit gains for the year ending July 31, 2010, despite the return of market volatility and risk aversion during the first half of 2010. An impressive bull run continued through 2009, bolstered by improvement in the economy and credit markets. Early in the new year, however, stocks fell sharply amid concerns about the global economic recovery, fueled by European debt woes and China's efforts to restrain inflation. After this brief dip, markets regained their upward momentum, as government stimulus and significant corporate cost cutting led to encouraging earnings reports, improved credit conditions and rising consumer confidence. Positive news continued through mid-April, when the Dow Jones Industrial AverageSM pushed above the 11,000 mark for the first time in 19 months. That milestone was short-lived, however, as heightened concern about the European debt crisis sparked an abrupt sell-off in May, leading to the first official correction since the rally began in March 2009. Although the market's malaise continued through June, stocks saw solid gains in July. For the year, the Dow rose 17.28%, while the S&P 500® Index was up 13.84%. Elsewhere, the technology-laden Nasdaq Composite® Index returned 14.99%. Small- and mid-cap stocks performed best, as measured by the 18.43% increase of the Russell 2000® Index and the 23.21% gain of the Russell Midcap® Index.
Comments from Charles Myers, Portfolio Manager of Fidelity® Small Cap Value Fund: For the year, the fund's Class F shares outperformed the 20.11% return of the Russell 2000 Value Index. (For specific class-level results, please see the performance section of this report.) Security selection in financials helped, especially banks and real estate stocks, although my diversified financials holdings didn't do well. Stock picking in consumer staples - especially food/staples retailing - as well as energy and materials also were notable positives, while consumer discretionary hurt. On an individual security basis, the fund's top contributors included Carpenter Technology, a specialty metals manufacturer, and real estate stocks Alexandria Real Estate Equities and Jones Lang LaSalle. Oil and gas company Mariner Energy also helped. I sold my stake shortly after the company agreed to be acquired for a premium price. In contrast, auto-industry challenges hurt DealerTrack Holdings, a car-dealer software and services provider, and Penske Automotive Group, a dealership chain I sold before period end. Utility RRI Energy, another stock I sold, also detracted. Many of the names I've mentioned were not in the index.
The views expressed above reflect those of the portfolio manager(s) only through the end of the period as stated on the cover of this report and do not necessarily represent the views of Fidelity or any other person in the Fidelity organization. Any such views are subject to change at any time based upon market or other conditions and Fidelity disclaims any responsibility to update such views. These views may not be relied on as investment advice and, because investment decisions for a Fidelity fund are based on numerous factors, may not be relied on as an indication of trading intent on behalf of any Fidelity fund.
Annual Report
Shareholder Expense Example
As a shareholder of the Fund, you incur two types of costs: (1) transaction costs, including sales charges (loads) on purchase payments or redemption proceeds, redemption fees, and (2) ongoing costs, including management fees, distribution and/or service (12b-1) fees and other Fund expenses. This Example is intended to help you understand your ongoing costs (in dollars) of investing in the Fund and to compare these costs with the ongoing costs of investing in other mutual funds.
The Example is based on an investment of $1,000 invested at the beginning of the period and held for the entire period (February 1, 2010 to July 31, 2010).
Actual Expenses
The first line of the accompanying table for each class of the Fund provides information about actual account values and actual expenses. You may use the information in this line, together with the amount you invested, to estimate the expenses that you paid over the period. Simply divide your account value by $1,000.00 (for example, an $8,600 account value divided by $1,000.00 = 8.6), then multiply the result by the number in the first line for a class of the Fund under the heading entitled "Expenses Paid During Period" to estimate the expenses you paid on your account during this period. A small balance maintenance fee of $12.00 that is charged once a year may apply for certain accounts with a value of less than $2,000. This fee is not included in the table below. If it was, the estimate of expenses you paid during the period would be higher, and your ending account value lower, by this amount. In addition, the Fund, as a shareholder in the underlying Fidelity Central Funds, will indirectly bear its pro-rata share of the fees and expenses incurred by the underlying Fidelity Central Funds. These fees and expenses are not included in the Fund's annualized expense ratio used to calculate the expense estimate in the table below.
Hypothetical Example for Comparison Purposes
The second line of the accompanying table for each class of the Fund provides information about hypothetical account values and hypothetical expenses based on a Class' actual expense ratio and an assumed rate of return of 5% per year before expenses, which is not the Class' actual return. The hypothetical account values and expenses may not be used to estimate the actual ending account balance or expenses you paid for the period. You may use this information to compare the ongoing costs of investing in the Fund and other funds. To do so, compare this 5% hypothetical example with the 5% hypothetical examples that appear in the shareholder reports of the other funds. A small balance maintenance fee of $12.00 that is charged once a year may apply for certain accounts with a value of less than $2,000. This fee is not included in the table below. If it was, the estimate of expenses you paid during the period would be higher, and your ending account value lower, by this amount. In addition, the Fund, as a shareholder in the underlying Fidelity Central Funds, will indirectly bear its pro-rata share of the fees and expenses incurred by the underlying Fidelity Central Funds. These fees and expenses are not included in the Fund's annualized expense ratio used to calculate the expense estimate in the table below.
Please note that the expenses shown in the table are meant to highlight your ongoing costs only and do not reflect any transaction costs. Therefore, the second line of the table is useful in comparing ongoing costs only, and will not help you determine the relative total costs of owning different funds. In addition, if these transactional costs were included, your costs would have been higher.
Annual Report
| Annualized
Expense
Ratio | Beginning
Account Value
February 1, 2010 | Ending
Account Value
July 31, 2010 | Expenses Paid
During Period*
February 1, 2010 to
July 31, 2010 |
Class A | 1.40% | | | |
Actual | | $ 1,000.00 | $ 1,070.90 | $ 7.19 |
HypotheticalA | | $ 1,000.00 | $ 1,017.85 | $ 7.00 |
Class T | 1.65% | | | |
Actual | | $ 1,000.00 | $ 1,069.80 | $ 8.47 |
HypotheticalA | | $ 1,000.00 | $ 1,016.61 | $ 8.25 |
Class B | 2.15% | | | |
Actual | | $ 1,000.00 | $ 1,066.90 | $ 11.02 |
HypotheticalA | | $ 1,000.00 | $ 1,014.13 | $ 10.74 |
Class C | 2.15% | | | |
Actual | | $ 1,000.00 | $ 1,066.00 | $ 11.01 |
HypotheticalA | | $ 1,000.00 | $ 1,014.13 | $ 10.74 |
Small Cap Value | 1.16% | | | |
Actual | | $ 1,000.00 | $ 1,071.90 | $ 5.96 |
HypotheticalA | | $ 1,000.00 | $ 1,019.04 | $ 5.81 |
Class F | .90% | | | |
Actual | | $ 1,000.00 | $ 1,073.50 | $ 4.63 |
HypotheticalA | | $ 1,000.00 | $ 1,020.33 | $ 4.51 |
Institutional Class | 1.12% | | | |
Actual | | $ 1,000.00 | $ 1,072.70 | $ 5.76 |
HypotheticalA | | $ 1,000.00 | $ 1,019.24 | $ 5.61 |
A 5% return per year before expenses
* Expenses are equal to each Class' annualized expense ratio, multiplied by the average account value over the period, multiplied by 181/365 (to reflect the one-half year period).
Annual Report
Investment Changes (Unaudited)
Top Ten Stocks as of July 31, 2010 |
| % of fund's
net assets | % of fund's net assets
6 months ago |
Platinum Underwriters Holdings Ltd. | 3.1 | 2.8 |
WESCO International, Inc. | 3.1 | 3.0 |
Superior Energy Services, Inc. | 3.0 | 2.7 |
BJ's Wholesale Club, Inc. | 3.0 | 2.4 |
Alexandria Real Estate Equities, Inc. | 2.8 | 2.8 |
Berry Petroleum Co. Class A | 2.7 | 0.0 |
Astoria Financial Corp. | 2.7 | 3.4 |
HNI Corp. | 2.6 | 2.6 |
UGI Corp. | 2.5 | 0.0 |
TCF Financial Corp. | 2.5 | 2.2 |
| 28.0 | |
Top Five Market Sectors as of July 31, 2010 |
| % of fund's
net assets | % of fund's net assets
6 months ago |
Financials | 37.8 | 35.7 |
Industrials | 12.8 | 13.5 |
Consumer Discretionary | 11.5 | 11.3 |
Information Technology | 8.3 | 9.9 |
Utilities | 6.4 | 4.8 |
Asset Allocation (% of fund's net assets) |
As of July 31, 2010* | As of January 31, 2010** |
| Stocks 99.2% | | | Stocks 99.5% | |
| Short-Term
Investments and
Net Other Assets 0.8% | | | Short-Term
Investments and
Net Other Assets 0.5% | |
* Foreign investments | 10.5% | | ** Foreign investments | 9.6% | |

Annual Report
Investments July 31, 2010
Showing Percentage of Net Assets
Common Stocks - 97.8% |
| Shares | | Value |
CONSUMER DISCRETIONARY - 10.9% |
Diversified Consumer Services - 3.0% |
Matthews International Corp. Class A | 640,187 | | $ 23,117,153 |
Regis Corp. (d) | 2,745,882 | | 41,819,783 |
| | 64,936,936 |
Household Durables - 5.1% |
M.D.C. Holdings, Inc. | 1,224,300 | | 35,651,616 |
Meritage Homes Corp. (a) | 1,536,160 | | 27,005,693 |
Ryland Group, Inc. | 2,153,837 | | 35,150,620 |
Tempur-Pedic International, Inc. (a) | 400,000 | | 12,268,000 |
| | 110,075,929 |
Specialty Retail - 1.8% |
Asbury Automotive Group, Inc. (a) | 1,465,159 | | 19,721,040 |
Tsutsumi Jewelry Co. Ltd. | 791,400 | | 18,405,716 |
| | 38,126,756 |
Textiles, Apparel & Luxury Goods - 1.0% |
Iconix Brand Group, Inc. (a) | 1,330,087 | | 21,893,232 |
TOTAL CONSUMER DISCRETIONARY | | 235,032,853 |
CONSUMER STAPLES - 4.7% |
Food & Staples Retailing - 3.6% |
BJ's Wholesale Club, Inc. (a) | 1,390,000 | | 63,314,500 |
Ingles Markets, Inc. Class A | 838,531 | | 13,634,514 |
| | 76,949,014 |
Food Products - 1.1% |
Chiquita Brands International, Inc. (a)(d) | 1,600,000 | | 23,488,000 |
TOTAL CONSUMER STAPLES | | 100,437,014 |
ENERGY - 5.7% |
Energy Equipment & Services - 3.0% |
Superior Energy Services, Inc. (a) | 2,841,700 | | 64,762,343 |
Oil, Gas & Consumable Fuels - 2.7% |
Berry Petroleum Co. Class A | 1,950,000 | | 58,149,000 |
TOTAL ENERGY | | 122,911,343 |
FINANCIALS - 37.0% |
Capital Markets - 2.8% |
optionsXpress Holdings, Inc. (a) | 2,055,000 | | 32,058,000 |
Common Stocks - continued |
| Shares | | Value |
FINANCIALS - continued |
Capital Markets - continued |
TradeStation Group, Inc. (a)(e) | 2,062,291 | | $ 13,178,039 |
Waddell & Reed Financial, Inc. Class A | 640,000 | | 15,251,200 |
| | 60,487,239 |
Commercial Banks - 11.8% |
Associated Banc-Corp. | 3,687,610 | | 50,114,620 |
CapitalSource, Inc. | 6,405,000 | | 34,458,900 |
City National Corp. | 784,900 | | 44,480,283 |
National Penn Bancshares, Inc. | 2,775,154 | | 18,482,526 |
PacWest Bancorp (e) | 1,794,200 | | 37,552,606 |
TCF Financial Corp. (d) | 3,385,800 | | 53,631,072 |
Western Liberty Bancorp (a)(e) | 2,400,000 | | 14,976,000 |
| | 253,696,007 |
Insurance - 7.3% |
Alterra Capital Holdings Ltd. | 2,057,411 | | 39,810,903 |
Aspen Insurance Holdings Ltd. | 1,820,200 | | 49,782,470 |
Platinum Underwriters Holdings Ltd. | 1,696,975 | | 66,317,783 |
| | 155,911,156 |
Real Estate Investment Trusts - 8.4% |
Alexandria Real Estate Equities, Inc. (d) | 848,300 | | 59,847,565 |
DCT Industrial Trust, Inc. | 10,000,000 | | 46,900,000 |
Highwoods Properties, Inc. (SBI) | 1,470,330 | | 46,036,032 |
National Retail Properties, Inc. (d) | 1,140,000 | | 26,356,800 |
| | 179,140,397 |
Real Estate Management & Development - 1.9% |
Jones Lang LaSalle, Inc. | 538,628 | | 41,722,125 |
Thrifts & Mortgage Finance - 4.8% |
Astoria Financial Corp. | 4,318,152 | | 57,172,332 |
Washington Federal, Inc. | 2,616,175 | | 45,521,445 |
| | 102,693,777 |
TOTAL FINANCIALS | | 793,650,701 |
HEALTH CARE - 6.3% |
Health Care Providers & Services - 6.3% |
Centene Corp. (a) | 972,542 | | 20,724,870 |
Chemed Corp. | 510,200 | | 26,999,784 |
MEDNAX, Inc. (a) | 721,500 | | 34,018,725 |
Providence Service Corp. (a)(e) | 1,016,495 | | 14,637,528 |
Common Stocks - continued |
| Shares | | Value |
HEALTH CARE - continued |
Health Care Providers & Services - continued |
Team Health Holdings, Inc. | 2,146,700 | | $ 28,143,237 |
VCA Antech, Inc. (a) | 518,000 | | 10,795,120 |
| | 135,319,264 |
INDUSTRIALS - 12.8% |
Commercial Services & Supplies - 7.0% |
ACCO Brands Corp. (a)(e) | 3,720,923 | | 22,027,864 |
HNI Corp. (d) | 2,149,671 | | 55,547,499 |
Knoll, Inc. | 1,412,898 | | 19,822,959 |
United Stationers, Inc. (a) | 990,400 | | 53,630,160 |
| | 151,028,482 |
Machinery - 1.3% |
Blount International, Inc. (a)(e) | 2,604,723 | | 27,740,300 |
Trading Companies & Distributors - 4.5% |
H&E Equipment Services, Inc. (a)(e) | 3,489,408 | | 30,357,850 |
WESCO International, Inc. (a) | 1,825,000 | | 65,572,250 |
| | 95,930,100 |
TOTAL INDUSTRIALS | | 274,698,882 |
INFORMATION TECHNOLOGY - 8.3% |
Communications Equipment - 1.4% |
ViaSat, Inc. (a) | 809,472 | | 29,254,318 |
Electronic Equipment & Components - 4.0% |
Ingram Micro, Inc. Class A (a) | 2,253,100 | | 37,243,743 |
Macnica, Inc. | 677,400 | | 14,837,353 |
Ryoyo Electro Corp. (e) | 1,772,700 | | 18,932,046 |
SYNNEX Corp. (a) | 558,898 | | 14,749,318 |
| | 85,762,460 |
Internet Software & Services - 1.7% |
DealerTrack Holdings, Inc. (a) | 1,383,804 | | 21,601,180 |
j2 Global Communications, Inc. (a) | 630,149 | | 14,827,406 |
| | 36,428,586 |
Semiconductors & Semiconductor Equipment - 0.7% |
Miraial Co. Ltd. (e) | 570,200 | | 15,372,473 |
Software - 0.5% |
Monotype Imaging Holdings, Inc. (a) | 1,358,151 | | 11,299,816 |
TOTAL INFORMATION TECHNOLOGY | | 178,117,653 |
Common Stocks - continued |
| Shares | | Value |
MATERIALS - 5.0% |
Chemicals - 0.7% |
Spartech Corp. (a) | 1,387,702 | | $ 14,515,363 |
Metals & Mining - 4.3% |
Carpenter Technology Corp. | 1,284,380 | | 44,889,081 |
RTI International Metals, Inc. (a)(e) | 1,692,597 | | 48,035,903 |
| | 92,924,984 |
TOTAL MATERIALS | | 107,440,347 |
TELECOMMUNICATION SERVICES - 0.7% |
Diversified Telecommunication Services - 0.7% |
Cogent Communications Group, Inc. (a) | 1,665,000 | | 14,352,300 |
UTILITIES - 6.4% |
Electric Utilities - 2.2% |
Westar Energy, Inc. | 1,960,000 | | 46,804,800 |
Gas Utilities - 4.2% |
Southwest Gas Corp. | 1,130,989 | | 36,383,916 |
UGI Corp. | 2,000,000 | | 53,920,000 |
| | 90,303,916 |
TOTAL UTILITIES | | 137,108,716 |
TOTAL COMMON STOCKS (Cost $1,920,724,852) | 2,099,069,073 |
Nonconvertible Preferred Stocks - 1.4% |
| | | |
CONSUMER DISCRETIONARY - 0.6% |
Household Durables - 0.6% |
M/I Homes, Inc. Series A, 9.75% (a) | 734,300 | | 13,033,825 |
FINANCIALS - 0.8% |
Real Estate Investment Trusts - 0.8% |
Developers Diversified Realty Corp. (depositary shares) Series H, 7.375% | 818,790 | | 18,013,380 |
TOTAL NONCONVERTIBLE PREFERRED STOCKS (Cost $20,083,684) | 31,047,205 |
Money Market Funds - 3.5% |
| Shares | | Value |
Fidelity Cash Central Fund, 0.24% (b) | 15,579,695 | | $ 15,579,695 |
Fidelity Securities Lending Cash Central Fund, 0.27% (b)(c) | 59,928,075 | | 59,928,075 |
TOTAL MONEY MARKET FUNDS (Cost $75,507,770) | 75,507,770 |
TOTAL INVESTMENT PORTFOLIO - 102.7% (Cost $2,016,316,306) | | 2,205,624,048 |
NET OTHER ASSETS (LIABILITIES) - (2.7)% | | (58,464,582) |
NET ASSETS - 100% | $ 2,147,159,466 |
Legend |
(a) Non-income producing |
(b) Affiliated fund that is available only to investment companies and other accounts managed by Fidelity Investments. The rate quoted is the annualized seven-day yield of the fund at period end. A complete unaudited listing of the fund's holdings as of its most recent quarter end is available upon request. |
(c) Investment made with cash collateral received from securities on loan. |
(d) Security or a portion of the security is on loan at period end. |
(e) Affiliated company |
Affiliated Central Funds |
Information regarding fiscal year to date income earned by the Fund from investments in Fidelity Central Funds is as follows: |
Fund | Income earned |
Fidelity Cash Central Fund | $ 42,495 |
Fidelity Securities Lending Cash Central Fund | 278,970 |
Total | $ 321,465 |
Other Affiliated Issuers |
An affiliated company is a company in which the fund has ownership of at least 5% of the voting securities. Fiscal year to date transactions with companies which are or were affiliates are as follows: |
Affiliates | Value,
beginning
of period | Purchases | Sales
Proceeds | Dividend
Income | Value,
end
of period |
ACCO Brands Corp. | $ 5,466,534 | $ 19,961,967 | $ - | $ - | $ 22,027,864 |
Blount International, Inc. | 17,199,578 | 8,372,649 | - | - | 27,740,300 |
Carpenter Technology Corp. | 48,582,409 | - | 42,768,155 | 1,546,654 | - |
H&E Equipment Services, Inc. | 17,823,149 | 19,092,190 | - | - | 30,357,850 |
HNI Corp. | 48,476,178 | 12,485,936 | 14,178,245 | 1,831,754 | - |
Miraial Co. Ltd. | 11,951,237 | - | - | 358,374 | 15,372,473 |
PacWest Bancorp | - | 33,511,723 | - | 55,188 | 37,552,606 |
Providence Service Corp. | 5,488,479 | 7,744,742 | - | - | 14,637,528 |
RTI International Metals, Inc. | - | 61,889,471 | 24,610,646 | - | 48,035,903 |
Ryoyo Electro Corp. | 10,896,174 | 5,192,230 | - | 479,261 | 18,932,046 |
Spartech Corp. | 19,788,775 | 387,662 | 2,807,218 | - | - |
TradeStation Group, Inc. | 15,446,560 | - | - | - | 13,178,039 |
WESCO International, Inc. | 45,676,500 | 7,269,797 | 10,057,750 | - | - |
Western Liberty Bancorp | - | 23,351,352 | - | - | 14,976,000 |
Total | $ 246,795,573 | $ 199,259,719 | $ 94,422,014 | $ 4,271,231 | $ 242,810,609 |
Other Information |
The following is a summary of the inputs used, as of July 31, 2010, involving the Fund's assets and liabilities carried at fair value. The inputs or methodology used for valuing securities may not be an indication of the risk associated with investing in those securities. For more information on valuation inputs, and their aggregation into the levels used in the table below, please refer to the Security Valuation section in the accompanying Notes to Financial Statements. |
Valuation Inputs at Reporting Date: |
Description | Total | Level 1 | Level 2 | Level 3 |
Investments in Securities: | | | | |
Equities: | | | | |
Consumer Discretionary | $ 248,066,678 | $ 248,066,678 | $ - | $ - |
Consumer Staples | 100,437,014 | 100,437,014 | - | - |
Energy | 122,911,343 | 122,911,343 | - | - |
Financials | 811,664,081 | 796,688,081 | 14,976,000 | - |
Health Care | 135,319,264 | 135,319,264 | - | - |
Industrials | 274,698,882 | 274,698,882 | - | - |
Information Technology | 178,117,653 | 178,117,653 | - | - |
Materials | 107,440,347 | 107,440,347 | - | - |
Telecommunication Services | 14,352,300 | 14,352,300 | - | - |
Utilities | 137,108,716 | 137,108,716 | - | - |
Money Market Funds | 75,507,770 | 75,507,770 | - | - |
Total Investments in Securities: | $ 2,205,624,048 | $ 2,190,648,048 | $ 14,976,000 | $ - |
Distribution of investments by country of issue, as a percentage of total net assets, is as follows: (Unaudited) |
United States of America | 89.5% |
Bermuda | 7.3% |
Japan | 3.2% |
| 100.0% |
See accompanying notes which are an integral part of the financial statements.
Annual Report
Statement of Assets and Liabilities
| July 31, 2010 |
| | |
Assets | | |
Investment in securities, at value (including securities loaned of $58,391,724) - See accompanying schedule: Unaffiliated issuers (cost $1,688,193,871) | $ 1,887,305,669 | |
Fidelity Central Funds (cost $75,507,770) | 75,507,770 | |
Other affiliated issuers (cost $252,614,665) | 242,810,609 | |
Total Investments (cost $2,016,316,306) | | $ 2,205,624,048 |
Receivable for fund shares sold | | 4,429,744 |
Dividends receivable | | 1,263,751 |
Distributions receivable from Fidelity Central Funds | | 11,305 |
Receivable from investment adviser for expense reductions | | 4,703 |
Other receivables | | 78,788 |
Total assets | | 2,211,412,339 |
| | |
Liabilities | | |
Payable for investments purchased | $ 947,463 | |
Payable for fund shares redeemed | 1,282,259 | |
Accrued management fee | 1,466,676 | |
Distribution fees payable | 74,394 | |
Other affiliated payables | 496,956 | |
Other payables and accrued expenses | 57,050 | |
Collateral on securities loaned, at value | 59,928,075 | |
Total liabilities | | 64,252,873 |
| | |
Net Assets | | $ 2,147,159,466 |
Net Assets consist of: | | |
Paid in capital | | $ 1,944,622,631 |
Undistributed net investment income | | 5,209,766 |
Accumulated undistributed net realized gain (loss) on investments and foreign currency transactions | | 8,011,200 |
Net unrealized appreciation (depreciation) on investments and assets and liabilities in foreign currencies | | 189,315,869 |
Net Assets | | $ 2,147,159,466 |
See accompanying notes which are an integral part of the financial statements.
Annual Report
Financial Statements - continued
Statement of Assets and Liabilities - continued
| July 31, 2010 |
| | |
Calculation of Maximum Offering Price
Class A:
Net Asset Value and redemption price per share ($96,993,684 ÷ 7,213,042 shares) | | $ 13.45 |
| | |
Maximum offering price per share (100/94.25 of $13.45) | | $ 14.27 |
Class T:
Net Asset Value and redemption price per share ($44,090,912 ÷ 3,306,403 shares) | | $ 13.34 |
| | |
Maximum offering price per share (100/96.50 of $13.34) | | $ 13.82 |
Class B:
Net Asset Value and offering price per share ($9,746,855 ÷ 745,164 shares)A | | $ 13.08 |
| | |
Class C:
Net Asset Value and offering price per share ($37,345,521 ÷ 2,854,186 shares)A | | $ 13.08 |
| | |
| | |
Small Cap Value:
Net Asset Value, offering price and redemption price per share ($1,770,674,882 ÷ 130,574,752 shares) | | $ 13.56 |
| | |
Class F:
Net Asset Value, offering price and redemption price per share ($109,867,616 ÷ 8,090,051 shares) | | $ 13.58 |
| | |
Institutional Class:
Net Asset Value, offering price and redemption price per share ($78,439,996 ÷ 5,777,920 shares) | | $ 13.58 |
A Redemption price per share is equal to net asset value less any applicable contingent deferred sales charge.
See accompanying notes which are an integral part of the financial statements.
Annual Report
Statement of Operations
| Year ended July 31, 2010 |
| | |
Investment Income | | |
Dividends (including $4,271,231 earned from other affiliated issuers) | | $ 24,688,740 |
Special dividends | | 5,143,528 |
Interest | | 18,401 |
Income from Fidelity Central Funds | | 321,465 |
Total income | | 30,172,134 |
| | |
Expenses | | |
Management fee
Basic fee | $ 13,665,863 | |
Performance adjustment | 2,744,643 | |
Transfer agent fees | 5,310,263 | |
Distribution fees | 751,876 | |
Accounting and security lending fees | 646,723 | |
Custodian fees and expenses | 45,637 | |
Independent trustees' compensation | 10,825 | |
Registration fees | 153,912 | |
Audit | 56,974 | |
Legal | 7,506 | |
Interest | 635 | |
Miscellaneous | 27,954 | |
Total expenses before reductions | 23,422,811 | |
Expense reductions | (213,251) | 23,209,560 |
Net investment income (loss) | | 6,962,574 |
Realized and Unrealized Gain (Loss) Net realized gain (loss) on: | | |
Investment securities: | | |
Unaffiliated issuers | 168,463,263 | |
Other affiliated issuers | 20,012,303 | |
Foreign currency transactions | 10,642 | |
Capital gain distributions from Fidelity Central Funds | 9,755 | |
Total net realized gain (loss) | | 188,495,963 |
Change in net unrealized appreciation (depreciation) on: Investment securities | 137,326,654 | |
Assets and liabilities in foreign currencies | 7,003 | |
Total change in net unrealized appreciation (depreciation) | | 137,333,657 |
Net gain (loss) | | 325,829,620 |
Net increase (decrease) in net assets resulting from operations | | $ 332,792,194 |
See accompanying notes which are an integral part of the financial statements.
Annual Report
Financial Statements - continued
Statement of Changes in Net Assets
| Year ended
July 31, 2010 | Year ended
July 31, 2009 |
Increase (Decrease) in Net Assets | | |
Operations | | |
Net investment income (loss) | $ 6,962,574 | $ 11,185,799 |
Net realized gain (loss) | 188,495,963 | (175,985,663) |
Change in net unrealized appreciation (depreciation) | 137,333,657 | 144,791,983 |
Net increase (decrease) in net assets resulting from operations | 332,792,194 | (20,007,881) |
Distributions to shareholders from net investment income | (6,560,137) | (8,301,273) |
Distributions to shareholders from net realized gain | - | (12,095,172) |
Total distributions | (6,560,137) | (20,396,445) |
Share transactions - net increase (decrease) | 209,101,603 | 392,456,300 |
Redemption fees | 534,282 | 448,503 |
Total increase (decrease) in net assets | 535,867,942 | 352,500,477 |
| | |
Net Assets | | |
Beginning of period | 1,611,291,524 | 1,258,791,047 |
End of period (including undistributed net investment income of $5,209,766 and undistributed net investment income of $5,059,582, respectively) | $ 2,147,159,466 | $ 1,611,291,524 |
See accompanying notes which are an integral part of the financial statements.
Annual Report
Financial Highlights - Class A
Years ended July 31, | 2010 | 2009 | 2008 | 2007 | 2006 |
Selected Per-Share Data | | | | | |
Net asset value, beginning of period | $ 11.13 | $ 11.82 | $ 14.34 | $ 13.17 | $ 12.80 |
Income from Investment Operations | | | | | |
Net investment income (loss) C | .02 F | .08 | (.01) | (.06) | (.03) |
Net realized and unrealized gain (loss) | 2.33 | (.60) | (1.98) | 1.90 | .74 |
Total from investment operations | 2.35 | (.52) | (1.99) | 1.84 | .71 |
Distributions from net investment income | (.03) | (.06) | - | - | - |
Distributions from net realized gain | - | (.11) | (.53) | (.67) | (.35) |
Total distributions | (.03) | (.17) | (.53) | (.67) | (.35) |
Redemption fees added to paid in capital C | - H | - H | - H | - H | .01 |
Net asset value, end of period | $ 13.45 | $ 11.13 | $ 11.82 | $ 14.34 | $ 13.17 |
Total Return A,B | 21.16% | (4.37)% | (14.35)% | 14.59% | 5.72% |
Ratios to Average Net Assets D,G | | | | | |
Expenses before reductions | 1.47% | 1.45% | 1.43% | 1.45% | 1.51% |
Expenses net of fee waivers, if any | 1.40% | 1.40% | 1.40% | 1.40% | 1.40% |
Expenses net of all reductions | 1.39% | 1.40% | 1.40% | 1.40% | 1.36% |
Net investment income (loss) | .17% F | .81% | (.05)% | (.44)% | (.24)% |
Supplemental Data | | | | | |
Net assets, end of period (000 omitted) | $ 96,994 | $ 55,029 | $ 52,446 | $ 61,357 | $ 39,931 |
Portfolio turnover rate E | 49% | 51% | 149% | 67% | 93% |
A Total returns would have been lower had certain expenses not been reduced during the periods shown.
B Total returns do not include the effect of the sales charges.
C Calculated based on average shares outstanding during the period.
D Fees and expenses of the underlying Fidelity Central Funds are not included in the Fund's expense ratio. The Fund indirectly bears its proportionate share of the expenses of any underlying Fidelity Central Funds.
E Amount does not include the portfolio activity of any underlying Fidelity Central Funds.
F Investment income per share reflects a special dividend which amounted to $.03 per share. Excluding the special dividend, the ratio of net investment income (loss) to average net assets would have been (.10)%.
G Expense ratios reflect operating expenses of the class. Expenses before reductions do not reflect amounts reimbursed by the investment adviser or reductions from brokerage service arrangements or reductions from other expense offset arrangements and do not represent the amount paid by the class during periods when reimbursements or reductions occur. Expenses net of fee waivers reflect expenses after reimbursement by the investment adviser but prior to reductions from brokerage service arrangements or other expense offset arrangements. Expenses net of all reductions represent the net expenses paid by the class.
H Amount represents less than $.01 per share.
See accompanying notes which are an integral part of the financial statements.
Annual Report
Financial Highlights - Class T
Years ended July 31, | 2010 | 2009 | 2008 | 2007 | 2006 |
Selected Per-Share Data | | | | | |
Net asset value, beginning of period | $ 11.05 | $ 11.74 | $ 14.28 | $ 13.13 | $ 12.78 |
Income from Investment Operations | | | | | |
Net investment income (loss) C | (.01) F | .05 | (.04) | (.10) | (.07) |
Net realized and unrealized gain (loss) | 2.31 | (.59) | (1.97) | 1.90 | .74 |
Total from investment operations | 2.30 | (.54) | (2.01) | 1.80 | .67 |
Distributions from net investment income | (.01) | (.04) | - | - | - |
Distributions from net realized gain | - | (.11) | (.53) | (.65) | (.33) |
Total distributions | (.01) | (.15) | (.53) | (.65) | (.33) |
Redemption fees added to paid in capital C | - H | - H | - H | - H | .01 |
Net asset value, end of period | $ 13.34 | $ 11.05 | $ 11.74 | $ 14.28 | $ 13.13 |
Total Return A,B | 20.87% | (4.57)% | (14.58)% | 14.34% | 5.47% |
Ratios to Average Net Assets D,G | | | | | |
Expenses before reductions | 1.72% | 1.70% | 1.68% | 1.66% | 1.67% |
Expenses net of fee waivers, if any | 1.65% | 1.65% | 1.65% | 1.65% | 1.65% |
Expenses net of all reductions | 1.64% | 1.65% | 1.65% | 1.65% | 1.61% |
Net investment income (loss) | (.08)% F | .56% | (.30)% | (.69)% | (.49)% |
Supplemental Data | | | | | |
Net assets, end of period (000 omitted) | $ 44,091 | $ 28,534 | $ 32,091 | $ 51,518 | $ 45,460 |
Portfolio turnover rate E | 49% | 51% | 149% | 67% | 93% |
A Total returns would have been lower had certain expenses not been reduced during the periods shown.
B Total returns do not include the effect of the sales charges.
C Calculated based on average shares outstanding during the period.
D Fees and expenses of the underlying Fidelity Central Funds are not included in the Fund's expense ratio. The Fund indirectly bears its proportionate share of the expenses of any underlying Fidelity Central Funds.
E Amount does not include the portfolio activity of any underlying Fidelity Central Funds.
F Investment income per share reflects a special dividend which amounted to $.03 per share. Excluding the special dividend, the ratio of net investment income (loss) to average net assets would have been (.35)%.
G Expense ratios reflect operating expenses of the class. Expenses before reductions do not reflect amounts reimbursed by the investment adviser or reductions from brokerage service arrangements or reductions from other expense offset arrangements and do not represent the amount paid by the class during periods when reimbursements or reductions occur. Expenses net of fee waivers reflect expenses after reimbursement by the investment adviser but prior to reductions from brokerage service arrangements or other expense offset arrangements. Expenses net of all reductions represent the net expenses paid by the class.
H Amount represents less than $.01 per share.
See accompanying notes which are an integral part of the financial statements.
Annual Report
Financial Highlights - Class B
Years ended July 31, | 2010 | 2009 | 2008 | 2007 | 2006 |
Selected Per-Share Data | | | | | |
Net asset value, beginning of period | $ 10.88 | $ 11.60 | $ 14.19 | $ 13.07 | $ 12.73 |
Income from Investment Operations | | | | | |
Net investment income (loss) C | (.07) F | .01 | (.10) | (.17) | (.13) |
Net realized and unrealized gain (loss) | 2.27 | (.59) | (1.96) | 1.90 | .74 |
Total from investment operations | 2.20 | (.58) | (2.06) | 1.73 | .61 |
Distributions from net investment income | - | (.03) | - | - | - |
Distributions from net realized gain | - | (.11) | (.53) | (.61) | (.28) |
Total distributions | - | (.14) | (.53) | (.61) | (.28) |
Redemption fees added to paid in capital C | - H | - H | - H | - H | .01 |
Net asset value, end of period | $ 13.08 | $ 10.88 | $ 11.60 | $ 14.19 | $ 13.07 |
Total Return A,B | 20.22% | (5.05)% | (15.04)% | 13.78% | 4.97% |
Ratios to Average Net Assets D,G | | | | | |
Expenses before reductions | 2.22% | 2.20% | 2.18% | 2.20% | 2.26% |
Expenses net of fee waivers, if any | 2.15% | 2.15% | 2.15% | 2.15% | 2.15% |
Expenses net of all reductions | 2.14% | 2.15% | 2.15% | 2.15% | 2.11% |
Net investment income (loss) | (.58)% F | .06% | (.80)% | (1.19)% | (.99)% |
Supplemental Data | | | | | |
Net assets, end of period (000 omitted) | $ 9,747 | $ 7,153 | $ 7,886 | $ 12,075 | $ 10,214 |
Portfolio turnover rate E | 49% | 51% | 149% | 67% | 93% |
A Total returns would have been lower had certain expenses not been reduced during the periods shown.
B Total returns do not include the effect of the contingent deferred sales charge.
C Calculated based on average shares outstanding during the period.
D Fees and expenses of the underlying Fidelity Central Funds are not included in the Fund's expense ratio. The Fund indirectly bears its proportionate share of the expenses of any underlying Fidelity Central Funds.
E Amount does not include the portfolio activity of any underlying Fidelity Central Funds.
F Investment income per share reflects a special dividend which amounted to $.03 per share. Excluding the special dividend, the ratio of net investment income (loss) to average net assets would have been (.85)%.
G Expense ratios reflect operating expenses of the class. Expenses before reductions do not reflect amounts reimbursed by the investment adviser or reductions from brokerage service arrangements or reductions from other expense offset arrangements and do not represent the amount paid by the class during periods when reimbursements or reductions occur. Expenses net of fee waivers reflect expenses after reimbursement by the investment adviser but prior to reductions from brokerage service arrangements or other expense offset arrangements. Expenses net of all reductions represent the net expenses paid by the class.
H Amount represents less than $.01 per share.
See accompanying notes which are an integral part of the financial statements.
Annual Report
Financial Highlights - Class C
Years ended July 31, | 2010 | 2009 | 2008 | 2007 | 2006 |
Selected Per-Share Data | | | | | |
Net asset value, beginning of period | $ 10.89 | $ 11.60 | $ 14.19 | $ 13.07 | $ 12.74 |
Income from Investment Operations | | | | | |
Net investment income (loss) C | (.07) F | .01 | (.10) | (.17) | (.13) |
Net realized and unrealized gain (loss) | 2.26 | (.58) | (1.96) | 1.90 | .74 |
Total from investment operations | 2.19 | (.57) | (2.06) | 1.73 | .61 |
Distributions from net investment income | - | (.03) | - | - | - |
Distributions from net realized gain | - | (.11) | (.53) | (.61) | (.29) |
Total distributions | - | (.14) | (.53) | (.61) | (.29) |
Redemption fees added to paid in capital C | - H | - H | - H | - H | .01 |
Net asset value, end of period | $ 13.08 | $ 10.89 | $ 11.60 | $ 14.19 | $ 13.07 |
Total Return A,B | 20.11% | (4.98)% | (15.04)% | 13.77% | 4.92% |
Ratios to Average Net Assets D,G | | | | | |
Expenses before reductions | 2.22% | 2.20% | 2.18% | 2.20% | 2.22% |
Expenses net of fee waivers, if any | 2.15% | 2.15% | 2.15% | 2.15% | 2.15% |
Expenses net of all reductions | 2.14% | 2.15% | 2.15% | 2.15% | 2.11% |
Net investment income (loss) | (.58)% F | .06% | (.80)% | (1.19)% | (.99)% |
Supplemental Data | | | | | |
Net assets, end of period (000 omitted) | $ 37,346 | $ 21,345 | $ 20,924 | $ 34,155 | $ 26,791 |
Portfolio turnover rate E | 49% | 51% | 149% | 67% | 93% |
A Total returns would have been lower had certain expenses not been reduced during the periods shown.
B Total returns do not include the effect of the contingent deferred sales charge.
C Calculated based on average shares outstanding during the period.
D Fees and expenses of the underlying Fidelity Central Funds are not included in the Fund's expense ratio. The Fund indirectly bears its proportionate share of the expenses of any underlying Fidelity Central Funds.
E Amount does not include the portfolio activity of any underlying Fidelity Central Funds.
F Investment income per share reflects a special dividend which amounted to $.03 per share. Excluding the special dividend, the ratio of net investment income (loss) to average net assets would have been (.85)%.
G Expense ratios reflect operating expenses of the class. Expenses before reductions do not reflect amounts reimbursed by the investment adviser or reductions from brokerage service arrangements or reductions from other expense offset arrangements and do not represent the amount paid by the class during periods when reimbursements or reductions occur. Expenses net of fee waivers reflect expenses after reimbursement by the investment adviser but prior to reductions from brokerage service arrangements or other expense offset arrangements. Expenses net of all reductions represent the net expenses paid by the class.
H Amount represents less than $.01 per share.
See accompanying notes which are an integral part of the financial statements.
Annual Report
Financial Highlights - Small Cap Value
Years ended July 31, | 2010 | 2009 | 2008 | 2007 | 2006 |
Selected Per-Share Data | | | | | |
Net asset value, beginning of period | $ 11.22 | $ 11.91 | $ 14.43 | $ 13.22 | $ 12.83 |
Income from Investment Operations | | | | | |
Net investment income (loss) B | .05 E | .10 | .03 | (.02) | .01 |
Net realized and unrealized gain (loss) | 2.34 | (.60) | (1.99) | 1.91 | .74 |
Total from investment operations | 2.39 | (.50) | (1.96) | 1.89 | .75 |
Distributions from net investment income | (.05) | (.08) | - | - | (.01) |
Distributions from net realized gain | - | (.11) | (.56) | (.68) | (.36) |
Total distributions | (.05) | (.19) | (.56) | (.68) | (.37) |
Redemption fees added to paid in capital B | - G | - G | - G | - G | .01 |
Net asset value, end of period | $ 13.56 | $ 11.22 | $ 11.91 | $ 14.43 | $ 13.22 |
Total Return A | 21.32% | (4.15)% | (14.10)% | 14.96% | 6.07% |
Ratios to Average Net Assets C,F | | | | |
Expenses before reductions | 1.18% | 1.20% | 1.14% | 1.11% | 1.09% |
Expenses net of fee waivers, if any | 1.18% | 1.20% | 1.14% | 1.11% | 1.09% |
Expenses net of all reductions | 1.17% | 1.20% | 1.13% | 1.11% | 1.06% |
Net investment income (loss) | .39% E | 1.01% | .22% | (.15)% | .06% |
Supplemental Data | | | | | |
Net assets, end of period (000 omitted) | $ 1,770,675 | $ 1,488,736 | $ 1,136,860 | $ 1,233,808 | $ 957,720 |
Portfolio turnover rate D | 49% | 51% | 149% | 67% | 93% |
A Total returns would have been lower had certain expenses not been reduced during the periods shown.
B Calculated based on average shares outstanding during the period.
C Fees and expenses of the underlying Fidelity Central Funds are not included in the Fund's expense ratio. The Fund indirectly bears its proportionate share of the expenses of any underlying Fidelity Central Funds.
D Amount does not include the portfolio activity of any underlying Fidelity Central Funds.
E Investment income per share reflects a special dividend which amounted to $.03 per share. Excluding the special dividend, the ratio of net investment income (loss) to average net assets would have been .12%.
F Expense ratios reflect operating expenses of the class. Expenses before reductions do not reflect amounts reimbursed by the investment adviser or reductions from brokerage service arrangements or reductions from other expense offset arrangements and do not represent the amount paid by the class during periods when reimbursements or reductions occur. Expenses net of fee waivers reflect expenses after reimbursement by the investment adviser but prior to reductions from brokerage service arrangements or other expense offset arrangements. Expenses net of all reductions represent the net expenses paid by the class.
G Amount represents less than $.01 per share.
See accompanying notes which are an integral part of the financial statements.
Annual Report
Financial Highlights - Class F
Years ended July 31, | 2010 | 2009 I |
Selected Per-Share Data | | |
Net asset value, beginning of period | $ 11.22 | $ 10.27 |
Income from Investment Operations | | |
Net investment income (loss) D | .09 G | .01 |
Net realized and unrealized gain (loss) | 2.34 | .94 H |
Total from investment operations | 2.43 | .95 |
Distributions from net investment income | (.07) | - |
Redemption fees added to paid in capital D,K | - | - |
Net asset value, end of period | $ 13.58 | $ 11.22 |
Total Return B,C | 21.69% | 9.25% |
Ratios to Average Net Assets E,J | | |
Expenses before reductions | .90% | .86% A |
Expenses net of fee waivers, if any | .90% | .86% A |
Expenses net of all reductions | .89% | .86% A |
Net investment income (loss) | .67% G | .64% A |
Supplemental Data | | |
Net assets, end of period (000 omitted) | $ 109,868 | $ 159 |
Portfolio turnover rate F | 49% | 51% |
A Annualized
B Total returns for periods of less than one year are not annualized.
C Total returns would have been lower had certain expenses not been reduced during the periods shown.
D Calculated based on average shares outstanding during the period.
E Fees and expenses of the underlying Fidelity Central Funds are not included in the Fund's expense ratio. The Fund indirectly bears its proportionate share of the expenses of any underlying Fidelity Central Funds.
F Amount does not include the portfolio activity of any underlying Fidelity Central Funds.
G Investment income per share reflects a special dividend which amounted to $.03 per share. Excluding the special dividend, the ratio of net investment income (loss) to average net assets would have been .40%.
H The amount shown for a share outstanding does not correspond with the aggregate net gain (loss) on investments for the period due to the timing of sales and repurchases of shares in relation to fluctuating market values of the investments of the Fund.
I For the period June 26, 2009 (commencement of sale of shares) to July 31, 2009.
J Expense ratios reflect operating expenses of the class. Expenses before reductions do not reflect amounts reimbursed by the investment adviser or reductions from brokerage service arrangements or reductions from other expense offset arrangements and do not represent the amount paid by the class during periods when reimbursements or reductions occur. Expense ratios before reductions for start-up periods may not be representative of longer-term operating periods. Expenses net of fee waivers reflect expenses after reimbursement by the investment adviser but prior to reductions from brokerage service arrangements or other expense offset arrangements. Expenses net of all reductions represent the net expenses paid by the class.
K Amount represents less than $.01 per share.
See accompanying notes which are an integral part of the financial statements.
Annual Report
Financial Highlights - Institutional Class
Years ended July 31, | 2010 | 2009 | 2008 | 2007 | 2006 |
Selected Per-Share Data | | | | | |
Net asset value, beginning of period | $ 11.24 | $ 11.91 | $ 14.43 | $ 13.22 | $ 12.83 |
Income from Investment Operations | | | | | |
Net investment income (loss) B | .06 E | .10 | .03 | (.02) | .01 |
Net realized and unrealized gain (loss) | 2.34 | (.59) | (1.99) | 1.91 | .74 |
Total from investment operations | 2.40 | (.49) | (1.96) | 1.89 | .75 |
Distributions from net investment income | (.06) | (.07) | - | - | (.01) |
Distributions from net realized gain | - | (.11) | (.56) | (.68) | (.36) |
Total distributions | (.06) | (.18) | (.56) | (.68) | (.37) |
Redemption fees added to paid in capital B | - G | - G | - G | - G | .01 |
Net asset value, end of period | $ 13.58 | $ 11.24 | $ 11.91 | $ 14.43 | $ 13.22 |
Total Return A | 21.42% | (4.04)% | (14.10)% | 14.99% | 6.08% |
Ratios to Average Net Assets C,F | | | | | |
Expenses before reductions | 1.12% | 1.20% | 1.13% | 1.10% | 1.08% |
Expenses net of fee waivers, if any | 1.12% | 1.15% | 1.13% | 1.10% | 1.08% |
Expenses net of all reductions | 1.12% | 1.15% | 1.13% | 1.10% | 1.05% |
Net investment income (loss) | .45% E | 1.06% | .22% | (.13)% | .08% |
Supplemental Data | | | | | |
Net assets, end of period (000 omitted) | $ 78,440 | $ 10,336 | $ 8,584 | $ 11,594 | $ 9,422 |
Portfolio turnover rate D | 49% | 51% | 149% | 67% | 93% |
A Total returns would have been lower had certain expenses not been reduced during the periods shown.
B Calculated based on average shares outstanding during the period.
C Fees and expenses of the underlying Fidelity Central Funds are not included in the Fund's expense ratio. The Fund indirectly bears its proportionate share of the expenses of any underlying Fidelity Central Funds.
D Amount does not include the portfolio activity of any underlying Fidelity Central Funds.
E Investment income per share reflects a special dividend which amounted to $.03 per share. Excluding the special dividend, the ratio of net investment income (loss) to average net assets would have been .18%.
F Expense ratios reflect operating expenses of the class. Expenses before reductions do not reflect amounts reimbursed by the investment adviser or reductions from brokerage service arrangements or reductions from other expense offset arrangements and do not represent the amount paid by the class during periods when reimbursements or reductions occur. Expenses net of fee waivers reflect expenses after reimbursement by the investment adviser but prior to reductions from brokerage service arrangements or other expense offset arrangements. Expenses net of all reductions represent the net expenses paid by the class.
G Amount represents less than $.01 per share.
See accompanying notes which are an integral part of the financial statements.
Annual Report
Notes to Financial Statements
For the period ended July 31, 2010
1. Organization.
Fidelity Small Cap Value Fund (the Fund) is a fund of Fidelity Securities Fund (the Trust) and is authorized to issue an unlimited number of shares. The Trust is registered under the Investment Company Act of 1940, as amended (the 1940 Act), as an open-end management investment company organized as a Massachusetts business trust. The Fund offers Class A, Class T, Class B, Class C, Small Cap Value, Class F and Institutional Class shares, each of which has equal rights as to assets and voting privileges. Effective after the close of business on September 1, 2010, Class B shares will be closed to new accounts and additional purchases by existing shareholders. Each class has exclusive voting rights with respect to matters that affect that class. Class F shares of the Fund are only available for purchase by mutual funds for which Fidelity Management & Research Company (FMR) or an affiliate serves as investment manager. Class B shares will automatically convert to Class A shares after a holding period of seven years from the initial date of purchase. Investment income, realized and unrealized capital gains and losses, the common expenses of the Fund, and certain fund-level expense reductions, if any, are allocated on a pro-rata basis to each class based on the relative net assets of each class to the total net assets of the Fund. Each class differs with respect to transfer agent and distribution and service plan fees incurred. Certain expense reductions also differ by class.
2. Investments in Fidelity Central Funds.
The Fund may invest in Fidelity Central Funds, which are open-end investment companies available only to other investment companies and accounts managed by Fidelity Management & Research Company (FMR) and its affiliates. The Fund's Schedule of Investments lists each of the Fidelity Central Funds held as of period end, if any, as an investment of the Fund, but does not include the underlying holdings of each Fidelity Central Fund. As an Investing Fund, the Fund indirectly bears its proportionate share of the expenses of the underlying Fidelity Central Funds.
The Money Market Central Funds seek preservation of capital and current income and are managed by Fidelity Investments Money Management, Inc. (FIMM), an affiliate of FMR.
A complete unaudited list of holdings for each Fidelity Central Fund is available upon request or at the Securities and Exchange Commission (the SEC) web site at www.sec.gov. In addition, the financial statements of the Fidelity Central Funds, which are not covered by the Fund's Report of Independent Registered Public Accounting Firm, are available on the SEC web site or upon request.
Annual Report
Notes to Financial Statements - continued
3. Significant Accounting Policies.
The financial statements have been prepared in conformity with accounting principles generally accepted in the United States of America (GAAP), which require management to make certain estimates and assumptions at the date of the financial statements. Actual results could differ from those estimates. The following summarizes the significant accounting policies of the Fund:
Security Valuation. Investments are valued as of 4:00 p.m. Eastern time on the last calendar day of the period. The Fund uses independent pricing services approved by the Board of Trustees to value its investments. When current market prices or quotations are not readily available or reliable, valuations may be determined in good faith in accordance with procedures adopted by the Board of Trustees. Factors used in determining value may include market or security specific events. The frequency with which these procedures are used cannot be predicted and they may be utilized to a significant extent. The value used for net asset value (NAV) calculation under these procedures may differ from published prices for the same securities.
The Fund categorizes the inputs to valuation techniques used to value its investments into a disclosure hierarchy consisting of three levels as shown below.
Level 1 - quoted prices in active markets for identical investments
Level 2 - other significant observable inputs (including quoted prices for similar investments, interest rates, prepayment speeds, etc.)
Level 3 - unobservable inputs (including the fund's own assumptions based on the best information available)
Changes in valuation techniques may result in transfers in or out of an assigned level within the disclosure hierarchy. The aggregate value of investments by input level, as of July 31, 2010, is included at the end of the Fund's Schedule of Investments. Valuation techniques used to value the Fund's investments by major category are as follows.
Equity securities, including restricted securities, for which market quotations are readily available, are valued at the last reported sale price or official closing price as reported by an independent pricing service on the primary market or exchange on which they are traded and are categorized as Level 1 in the hierarchy. In the event there were no sales during the day or closing prices are not available, securities are valued at the last quoted bid price or may be valued using the last available price and are generally categorized as Level 2 in the hierarchy. For foreign equity securities, when significant market or security specific events arise, comparisons to the valuation of American Depositary Receipts (ADRs), futures contracts, Exchange-traded funds (ETFs) and certain indexes as well as
Annual Report
3. Significant Accounting Policies - continued
Security Valuation - continued
quoted prices for similar securities are used and are categorized as Level 2 in the hierarchy in these circumstances. Utilizing these techniques may result in transfers between Level 1 and Level 2. For restricted equity securities and private placements where observable inputs are limited, assumptions about market activity and risk are used and are categorized as Level 3 in the hierarchy.
Investments in open-end mutual funds, including the Fidelity Central Funds, are valued at their closing net asset value each business day and are categorized as Level 1 in the hierarchy. Short-term securities with remaining maturities of sixty days or less for which quotations are not readily available are valued at amortized cost, which approximates fair value and are categorized as Level 2 in the hierarchy.
Foreign Currency. The Fund uses foreign currency contracts to facilitate transactions in foreign-denominated securities. Gains and losses from these transactions may arise from changes in the value of the foreign currency or if the counterparties do not perform under the contracts' terms.
Foreign-denominated assets, including investment securities, and liabilities are translated into U.S. dollars at the exchange rate at period end. Purchases and sales of investment securities, income and dividends received and expenses denominated in foreign currencies are translated into U.S. dollars at the exchange rate in effect on the transaction date.
The effects of exchange rate fluctuations on investments are included with the net realized and unrealized gain (loss) on investment securities. Other foreign currency transactions resulting in realized and unrealized gain (loss) are disclosed separately.
Investment Transactions and Income. For financial reporting purposes, the Fund's investment holdings and NAV include trades executed through the end of the last business day of the period. The NAV per share for processing shareholder transactions is calculated as of the close of business of the New York Stock Exchange (NYSE), normally 4:00 p.m. Eastern time and includes trades executed through the end of the prior business day. Gains and losses on securities sold are determined on the basis of identified cost and may include proceeds received from litigation. Dividend income is recorded on the ex-dividend date, except for certain dividends from foreign securities where the ex-dividend date may have passed, which are recorded as soon as the Fund is informed of the ex-dividend date. Non-cash dividends included in dividend income, if any, are recorded at the fair market value of the securities received. Distributions received on securities that represent a return of capital or capital gain are recorded as a reduction of cost of investments and/or as a realized gain. The Fund estimates the components of
Annual Report
Notes to Financial Statements - continued
3. Significant Accounting Policies - continued
Investment Transactions and Income - continued
distributions received that may be considered return of capital distributions or capital gain distributions. Large, non-recurring dividends recognized by the Fund are presented separately on the Statement of Operations as "Special Dividends" and the impact of these dividends is presented in the Financial Highlights. Interest income and distributions from the Fidelity Central Funds are accrued as earned. Interest income includes coupon interest and amortization of premium and accretion of discount on debt securities. Investment income is recorded net of foreign taxes withheld where recovery of such taxes is uncertain.
Expenses. Most expenses of the Trust can be directly attributed to a fund. Expenses which cannot be directly attributed are apportioned amongst each fund in the Trust. Expense estimates are accrued in the period to which they relate and adjustments are made when actual amounts are known.
Income Tax Information and Distributions to Shareholders. Each year the Fund intends to qualify as a regulated investment company, including distributing substantially all of its taxable income and realized gains under Subchapter M of the Internal Revenue Code and filing its U.S. federal tax return. As a result, no provision for income taxes is required. As of July 31, 2010, the Fund did not have any unrecognized tax benefits in the accompanying financial statements. A fund's federal tax return is subject to examination by the Internal Revenue Service (IRS) for a period of three years. Foreign taxes are provided for based on the Fund's understanding of the tax rules and rates that exist in the foreign markets in which it invests.
Distributions are recorded on the ex-dividend date. Income dividends and capital gain distributions are declared separately for each class. Income and capital gain distributions are determined in accordance with income tax regulations, which may differ from GAAP. In addition, the Fund claimed a portion of the payment made to redeeming shareholders as a distribution for income tax purposes.
Capital accounts within the financial statements are adjusted for permanent book-tax differences. These adjustments have no impact on net assets or the results of operations. Temporary book-tax differences will reverse in a subsequent period.
Book-tax differences are primarily due to the short-term gain distributions from the Fidelity Central Funds, foreign currency transactions, market discount, capital loss carryforwards and losses deferred due to wash sales and excise tax regulations.
Annual Report
3. Significant Accounting Policies - continued
Income Tax Information and Distributions to Shareholders - continued
The federal tax cost of investment securities and unrealized appreciation (depreciation) as of period end were as follows:
Gross unrealized appreciation | $ 346,140,241 |
Gross unrealized depreciation | (160,277,473) |
Net unrealized appreciation (depreciation) | $ 185,862,768 |
| |
Tax Cost | $ 2,019,761,280 |
The tax-based components of distributable earnings as of period end were as follows:
Undistributed ordinary income | $ 5,209,766 |
Undistributed long-term capital gain | $ 11,456,174 |
Net unrealized appreciation (depreciation) | $ 185,870,895 |
The tax character of distributions paid was as follows:
| July 31, 2010 | July 31, 2009 |
Ordinary Income | $ 6,560,137 | $ 8,301,273 |
Long-term Capital Gains | - | 12,095,172 |
Total | $ 6,560,137 | $ 20,396,445 |
Short-Term Trading (Redemption) Fees. Shares held in the Fund less than 90 days are subject to a redemption fee equal to 1.50% of the proceeds of the redeemed shares. All redemption fees, including any estimated redemption fees paid by FMR, are retained by the Fund and accounted for as an addition to paid in capital.
4. Purchases and Sales of Investments.
Purchases and sales of securities, other than short-term securities, aggregated $1,124,184,474 and $918,879,120, respectively.
5. Fees and Other Transactions with Affiliates.
Management Fee. FMR and its affiliates provide the Fund with investment management related services for which the Fund pays a monthly management fee. The management fee is the sum of an individual fund fee rate that is based on an annual rate of .45% of the Fund's average net assets and a group fee rate that averaged .26% during the period. The group fee rate is based upon the average net assets of all the mutual funds advised by FMR. The group fee rate decreases as assets under management increase and
Annual Report
Notes to Financial Statements - continued
5. Fees and Other Transactions with Affiliates - continued
Management Fee - continued
increases as assets under management decrease. In addition, the management fee is subject to a performance adjustment (up to a maximum of ±.20% of the Fund's average net assets over a 36 month performance period). The upward or downward adjustment to the management fee is based on the relative investment performance of the retail class of the Fund, Small Cap Value as compared to an appropriate benchmark index. For the period, the total annual management fee rate, including the performance adjustment, was .85% of the Fund's average net assets.
Distribution and Service Plan. In accordance with Rule 12b-1 of the 1940 Act, the Fund has adopted separate Distribution and Service Plans for each class of shares. Certain classes pay Fidelity Distributors Corporation (FDC), an affiliate of FMR, separate Distribution and Service Fees, each of which is based on an annual percentage of each class' average net assets. In addition, FDC may pay financial intermediaries for selling shares of the Fund and providing shareholder support services. For the period, the Distribution and Service Fee rates and the total amounts paid to and retained by FDC were as follows:
| Distribution
Fee | Service
Fee | Paid to
FDC | Retained
by FDC |
Class A | -% | .25% | $ 191,085 | $ 8,941 |
Class T | .25% | .25% | 179,850 | - |
Class B | .75% | .25% | 86,355 | 64,822 |
Class C | .75% | .25% | 294,586 | 80,570 |
| | | $ 751,876 | $ 154,333 |
Sales Load. FDC receives a front-end sales charge of up to 5.75% for selling Class A shares, and 3.50% for selling Class T shares, some of which is paid to financial intermediaries for selling shares of the Fund. FDC receives the proceeds of contingent deferred sales charges levied on Class A, Class T, Class B, and Class C redemptions. These charges depend on the holding period. The deferred sales charges range from 5% to 1% for Class B, 1% for Class C, 1.00% for certain purchases of Class A shares (1.00% to .50% prior to July 12, 2010) and .25% for certain purchases of Class T shares.
Annual Report
5. Fees and Other Transactions with Affiliates - continued
Sales Load - continued
For the period, sales charge amounts retained by FDC were as follows:
| Retained
by FDC |
Class A | $ 48,522 |
Class T | 8,611 |
Class B* | 21,775 |
Class C* | 3,135 |
| $ 82,043 |
* When Class B and Class C shares are initially sold, FDC pays commissions from its own resources to financial intermediaries through which the sales are made.
Transfer Agent Fees. Fidelity Investments Institutional Operations Company, Inc. (FIIOC), an affiliate of FMR, is the transfer, dividend disbursing and shareholder servicing agent for each class of the Fund. FIIOC receives account fees and asset-based fees that vary according to the account size and type of account of the shareholders of respective classes of the Fund, except for Class F. FIIOC receives no fees for providing transfer agency services to Class F. FIIOC pays for typesetting, printing and mailing of shareholder reports, except proxy statements. For the period, the total transfer agent fees paid by each class were as follows:
| Amount | % of
Average
Net Assets |
Class A | $ 243,601 | .32 |
Class T | 116,575 | .32 |
Class B | 27,836 | .32 |
Class C | 94,179 | .32 |
Small Cap Value | 4,734,141 | .28 |
Institutional Class | 93,931 | .22 |
| $ 5,310,263 | |
Accounting and Security Lending Fees. Fidelity Service Company, Inc. (FSC), an affiliate of FMR, maintains the Fund's accounting records. The accounting fee is based on the level of average net assets for the month. Under a separate contract, FSC administers the security lending program. The security lending fee is based on the number and duration of lending transactions.
Annual Report
Notes to Financial Statements - continued
5. Fees and Other Transactions with Affiliates - continued
Brokerage Commissions. The Fund placed a portion of its portfolio transactions with brokerage firms which are affiliates of the investment adviser. The commissions paid to these affiliated firms were $17,973 for the period.
Interfund Lending Program. Pursuant to an Exemptive Order issued by the SEC, the Fund, along with other registered investment companies having management contracts with FMR, may participate in an interfund lending program. This program provides an alternative credit facility allowing the funds to borrow from, or lend money to, other participating affiliated funds. At period end, there were no interfund loans outstanding. The Fund's activity in this program during the period for which loans were outstanding was as follows:
Borrower or Lender | Average Daily
Loan Balance | Weighted Average
Interest Rate | Interest
Expense |
Borrower | $ 7,401,500 | .39% | $ 635 |
6. Committed Line of Credit.
The Fund participates with other funds managed by FMR in a $3.75 billion credit facility (the "line of credit") to be utilized for temporary or emergency purposes to fund shareholder redemptions or for other short-term liquidity purposes. The Fund has agreed to pay commitment fees on its pro-rata portion of the line of credit, which amounted to $7,433 and is reflected in Miscellaneous expenses on the Statement of Operations. During the period, there were no borrowings on this line of credit.
7. Security Lending.
The Fund lends portfolio securities from time to time in order to earn additional income. On the settlement date of the loan, the Fund receives collateral (in the form of U.S. Treasury obligations, letters of credit and/or cash) against the loaned securities and maintains collateral in an amount not less than 100% of the market value of the loaned securities during the period of the loan. The market value of the loaned securities is determined at the close of business of the Fund and any additional required collateral is delivered to the Fund on the next business day. If the borrower defaults on its obligation to return the securities loaned because of insolvency or other reasons, a fund could experience delays and costs in recovering the securities loaned or in gaining access to the collateral. Any cash collateral received is invested in the Fidelity Securities Lending Cash Central Fund. The value of loaned securities and cash collateral at period end are disclosed on the Fund's Statement of Assets and Liabilities. Security lending income represents the income earned on investing cash collateral, less fees and expenses
Annual Report
7. Security Lending - continued
associated with the loan, plus any premium payments that may be received on the loan of certain types of securities. Security lending income is presented in the Statement of Operations as a component of income from Fidelity Central Funds. Net income from lending portfolio securities during the period amounted to $278,970.
8. Expense Reductions.
FMR voluntarily agreed to reimburse each class to the extent annual operating expenses exceeded certain levels of average net assets as noted in the table below. Some expenses, for example interest expense, including commitment fees, are excluded from this reimbursement.
The following classes were in reimbursement during the period:
| Expense
Limitations | Reimbursement
from adviser |
Class A | 1.40% | $ 52,534 |
Class T | 1.65% | 26,830 |
Class B | 2.15% | 6,293 |
Class C | 2.15% | 20,630 |
| | $ 106,287 |
Effective October 1, 2010 the expense limitations will be eliminated.
Many of the brokers with whom FMR places trades on behalf of the Fund provided services to the Fund in addition to trade execution. These services included payments of certain expenses on behalf of the Fund totaling $106,964 for the period.
9. Distributions to Shareholders.
Distributions to shareholders of each class were as follows:
Years ended July 31, | 2010 | 2009 |
From net investment income | | |
Class A | $ 159,193 | $ 252,162 |
Class T | 36,920 | 111,704 |
Class B | - | 20,177 |
Class C | - | 45,207 |
Small Cap Value | 6,230,380 | 7,822,387 |
Class F | 28,266 | - |
Institutional Class | 105,378 | 49,636 |
Total | $ 6,560,137 | $ 8,301,273 |
Annual Report
Notes to Financial Statements - continued
9. Distributions to Shareholders - continued
Distributions to shareholders of each class were as follows: - continued
Years ended July 31, | 2010 | 2009 |
From net realized gain | | |
Class A | $ - | $ 496,925 |
Class T | - | 350,121 |
Class B | - | 77,046 |
Class C | - | 207,577 |
Small Cap Value | - | 10,883,170 |
Institutional Class | - | 80,333 |
Total | $ - | $ 12,095,172 |
10. Share Transactions.
Transactions for each class of shares were as follows:
| Shares | Dollars |
Years ended July 31, | 2010 | 2009A | 2010 | 2009A |
Class A | | | | |
Shares sold | 4,231,111 | 2,028,986 | $ 54,936,600 | $ 19,478,233 |
Reinvestment of distributions | 12,276 | 64,970 | 146,358 | 694,477 |
Shares redeemed | (1,973,236) | (1,588,437) | (25,421,999) | (14,658,645) |
Net increase (decrease) | 2,270,151 | 505,519 | $ 29,660,959 | $ 5,514,065 |
Class T | | | | |
Shares sold | 1,449,265 | 1,489,054 | $ 18,793,141 | $ 15,806,614 |
Reinvestment of distributions | 3,030 | 40,641 | 35,906 | 449,360 |
Shares redeemed | (727,616) | (1,680,727) | (9,211,959) | (14,685,646) |
Net increase (decrease) | 724,679 | (151,032) | $ 9,617,088 | $ 1,570,328 |
Class B | | | | |
Shares sold | 262,419 | 305,827 | $ 3,340,905 | $ 3,051,319 |
Reinvestment of distributions | - | 7,759 | - | 85,943 |
Shares redeemed | (174,554) | (335,978) | (2,189,700) | (2,971,686) |
Net increase (decrease) | 87,865 | (22,392) | $ 1,151,205 | $ 165,576 |
Class C | | | | |
Shares sold | 1,327,692 | 832,906 | $ 17,060,657 | $ 7,981,000 |
Reinvestment of distributions | - | 19,410 | - | 217,621 |
Shares redeemed | (434,251) | (694,752) | (5,448,332) | (6,287,773) |
Net increase (decrease) | 893,441 | 157,564 | $ 11,612,325 | $ 1,910,848 |
Annual Report
10. Share Transactions - continued
Transactions for each class of shares were as follows: - continued
| Shares | Dollars |
Years ended July 31, | 2010 | 2009A | 2010 | 2009A |
Small Cap Value | | | | |
Shares sold | 45,122,251 | 61,277,579 | $ 585,925,779 | $ 600,357,815 |
Reinvestment of distributions | 507,903 | 1,741,583 | 6,101,827 | 18,397,974 |
Shares redeemed | (47,781,912) | (25,782,005) | (605,149,428) | (237,589,067) |
Net increase (decrease) | (2,151,758) | 37,237,157 | $ (13,121,822) | $ 381,166,722 |
Class F | | | | |
Shares sold | 8,411,513 | 14,205 | $ 109,778,609 | $ 144,857 |
Reinvestment of distributions | 2,350 | - | 28,266 | - |
Shares redeemed | (337,999) | (18) | (4,618,215) | (181) |
Net increase (decrease) | 8,075,864 | 14,187 | $ 105,188,660 | $ 144,676 |
Institutional Class | | | | |
Shares sold | 5,522,070 | 479,087 | $ 73,692,691 | $ 4,626,811 |
Reinvestment of distributions | 7,512 | 8,812 | 90,344 | 93,632 |
Shares redeemed | (671,565) | (288,597) | (8,789,847) | (2,736,358) |
Net increase (decrease) | 4,858,017 | 199,302 | $ 64,993,188 | $ 1,984,085 |
A Share transactions for Class F are for the period June 26, 2009 (commencement of sale of shares) to July 31, 2009.
11. Other.
The Fund's organizational documents provide former and current trustees and officers with a limited indemnification against liabilities arising in connection with the performance of their duties to the Fund. In the normal course of business, the Fund may also enter into contracts that provide general indemnifications. The Fund's maximum exposure under these arrangements is unknown as this would be dependent on future claims that may be made against the Fund. The risk of material loss from such claims is considered remote.
At the end of the period, the Fidelity Freedom Funds and the Fidelity Freedom K Funds were the owners of record, in the aggregate, of approximately 38% of the total outstanding shares of the Fund.
Annual Report
To the Trustees of Fidelity Securities Fund and the Shareholders of Fidelity Small Cap Value Fund:
In our opinion, the accompanying statement of assets and liabilities, including the schedule of investments, and the related statements of operations and of changes in net assets and the financial highlights present fairly, in all material respects, the financial position of Fidelity Small Cap Value Fund (a fund of Fidelity Securities Fund) at July 31, 2010, the results of its operations for the year then ended, the changes in its net assets for each of the two years in the period then ended and the financial highlights for each of the periods indicated, in conformity with accounting principles generally accepted in the United States of America. These financial statements and financial highlights (hereafter referred to as "financial statements") are the responsibility of the Fidelity Small Cap Value Fund's management. Our responsibility is to express an opinion on these financial statements based on our audits. We conducted our audits of these financial statements in accordance with the standards of the Public Company Accounting Oversight Board (United States). Those standards require that we plan and perform the audit to obtain reasonable assurance about whether the financial statements are free of material misstatement. An audit includes examining, on a test basis, evidence supporting the amounts and disclosures in the financial statements, assessing the accounting principles used and significant estimates made by management, and evaluating the overall financial statement presentation. We believe that our audits, which included confirmation of securities at July 31, 2010 by correspondence with the custodian and brokers, provide a reasonable basis for our opinion.
/s/ PricewaterhouseCoopers LLP
PricewaterhouseCoopers LLP
Boston, Massachusetts
September 14, 2010
Annual Report
The Trustees, Member of the Advisory Board, and executive officers of the trust and fund, as applicable, are listed below. The Board of Trustees governs the fund and is responsible for protecting the interests of shareholders. The Trustees are experienced executives who meet periodically throughout the year to oversee the fund's activities, review contractual arrangements with companies that provide services to the fund, oversee management of the risks associated with such activities and contractual arrangements, and review the fund's performance. Except for James C. Curvey, each of the Trustees oversees 222 funds advised by FMR or an affiliate. Mr. Curvey oversees 411 funds advised by FMR or an affiliate.
The Trustees hold office without limit in time except that (a) any Trustee may resign; (b) any Trustee may be removed by written instrument, signed by at least two-thirds of the number of Trustees prior to such removal; (c) any Trustee who requests to be retired or who has become incapacitated by illness or injury may be retired by written instrument signed by a majority of the other Trustees; and (d) any Trustee may be removed at any special meeting of shareholders by a two-thirds vote of the outstanding voting securities of the trust. Each Trustee who is not an interested person (as defined in the 1940 Act) (Independent Trustee), shall retire not later than the last day of the calendar year in which his or her 72nd birthday occurs. The Independent Trustees may waive this mandatory retirement age policy with respect to individual Trustees. The executive officers and Advisory Board Member hold office without limit in time, except that any officer and Advisory Board Member may resign or may be removed by a vote of a majority of the Trustees at any regular meeting or any special meeting of the Trustees. Except as indicated, each individual has held the office shown or other offices in the same company for the past five years.
Experience, Skills, Attributes, and Qualifications of the Fund's Trustees. The Governance and Nominating Committee has adopted a statement of policy that describes the experience, qualifications, attributes, and skills that are necessary and desirable for potential Independent Trustee candidates (Statement of Policy). The Board believes that each Trustee satisfied at the time he or she was initially elected or appointed a Trustee, and continues to satisfy, the standards contemplated by the Statement of Policy. The Governance and Nominating Committee also engages professional search firms to help identify potential Independent Trustee candidates who have the experience, qualifications, attributes, and skills consistent with the Statement of Policy. From time to time, additional criteria based on the composition and skills of the current Independent Trustees, as well as experience or skills that may be appropriate in light of future changes to board composition, business conditions, and regulatory or other developments, have also been considered by the professional search firms and the Governance and Nominating Committee. In addition, the Board takes into account the Trustees' commitment and participation in Board and committee meetings, as well as their leadership of standing and ad hoc committees throughout their tenure.
In determining that a particular Trustee was and continues to be qualified to serve as a Trustee, the Board has considered a variety of criteria, none of which, in isolation, was controlling. The Board believes that, collectively, the Trustees have balanced and diverse experience, qualifications, attributes, and skills, which allow the Board to operate effectively in governing the fund and protecting the interests of shareholders. Information about the specific experience, skills, attributes, and qualifications of each Trustee, which in each case led to the Board's conclusion that the Trustee should serve (or continue to serve) as a trustee of the fund, is provided below.
Annual Report
Board Structure and Oversight Function. Edward C. Johnson 3d is an interested person (as defined in the 1940 Act) and currently serves as Chairman. The Trustees have determined that an interested Chairman is appropriate and benefits shareholders because an interested Chairman has a personal and professional stake in the quality and continuity of services provided to the fund. Independent Trustees exercise their informed business judgment to appoint an individual of their choosing to serve as Chairman, regardless of whether the Trustee happens to be independent or a member of management. The Independent Trustees have determined that they can act independently and effectively without having an Independent Trustee serve as Chairman and that a key structural component for assuring that they are in a position to do so is for the Independent Trustees to constitute a substantial majority for the Board. The Independent Trustees also regularly meet in executive session. Ned C. Lautenbach serves as Chairman of the Independent Trustees and as such (i) acts as a liaison between the Independent Trustees and management with respect to matters important to the Independent Trustees and (ii) with management prepares agendas for Board meetings.
Fidelity funds are overseen by different Boards of Trustees. The fund Board oversees Fidelity's equity and high income funds and another Board oversees Fidelity's investment-grade bond, money market, and asset allocation funds. The asset allocation funds may invest in Fidelity funds overseen by the fund's Board. The use of separate Boards, each with its own committee structure, allows the Trustees of each group of Fidelity funds to focus on the unique issues of the funds they oversee, including common research, investment, and operational issues. On occasion, the separate Boards establish joint committees to address issues of overlapping consequences for the Fidelity funds overseen by each Board.
The Trustees operate using a system of committees to facilitate the timely and efficient consideration of all matters of importance to the Trustees, the fund, and fund shareholders and to facilitate compliance with legal and regulatory requirements and oversight of the fund's activities and associated risks. The Board, acting through its committees, has charged FMR and its affiliates with (i) identifying events or circumstances the occurrence of which could have demonstrably adverse effects on the fund's business and/or reputation; (ii) implementing processes and controls to lessen the possibility that such events or circumstances occur or to mitigate the effects of such events or circumstances if they do occur; and (iii) creating and maintaining a system designed to evaluate continuously business and market conditions in order to facilitate the identification and implementation processes described in (i) and (ii) above. Because the day-to-day operations and activities of the fund's are carried out by or through FMR, its affiliates and other service providers, the fund's exposure to risks is mitigated but not eliminated by the processes overseen by the Trustees. While each of the Board's committees has responsibility for overseeing different aspects of the fund's activities, oversight is exercised primarily through the Operations, Audit, and Compliance Committees. Appropriate personnel, including but not limited to the fund's Chief Compliance Officer (CCO), FMR's internal auditor, the independent accountants, the fund's Treasurer and portfolio management personnel, make periodic reports to the Board's committees, as appropriate. The responsibilities of each committee, including their oversight responsibilities, are described further under "Standing Committees of the Fund's Trustees."
Annual Report
Trustees and Officers - continued
The fund's Statement of Additional Information (SAI) includes more information about the Trustees. To request a free copy, call Fidelity at 1-800-835-5092.
Interested Trustees*:
Correspondence intended for each Trustee who is an interested person may be sent to Fidelity Investments, 82 Devonshire Street, Boston, Massachusetts 02109.
Name, Age; Principal Occupations and Other Relevant Experience+ |
Edward C. Johnson 3d (80) |
| Year of Election or Appointment: 1984 Mr. Johnson is Trustee and Chairman of the Board of Trustees of certain Trusts. Mr. Johnson serves as Chief Executive Officer, Chairman, and a Director of FMR LLC; Chairman and a Director of FMR; Chairman and a Director of Fidelity Research & Analysis Company (FRAC); Chairman and a Director of Fidelity Investments Money Management, Inc.; and Chairman and a Director of FMR Co., Inc. In addition, Mr. Johnson serves as Chairman and Director of FIL Limited. Previously, Mr. Johnson served as President of FMR LLC (2006-2007). |
James C. Curvey (75) |
| Year of Election or Appointment: 2007 Mr. Curvey also serves as Trustee (2007-present) of other investment companies advised by FMR. Mr. Curvey is a Director of FMR and FMR Co., Inc. (2007-present). Mr. Curvey is also Vice Chairman (2006-present) and Director of FMR LLC. In addition, Mr. Curvey serves as an Overseer for the Boston Symphony Orchestra and a member of the Trustees of Villanova University. |
* Trustees have been determined to be "Interested Trustees" by virtue of, among other things, their affiliation with the trust or various entities under common control with FMR.
+ The information above includes each Trustee's principal occupation during the last five years and other information relating to the experience, attributes, and skills relevant to each Trustee's qualifications to serve as a Trustee, which led to the conclusion that each Trustee should serve as a Trustee for the fund.
Annual Report
Independent Trustees:
Correspondence intended for each Independent Trustee (that is, the Trustees other than the Interested Trustees) may be sent to Fidelity Investments, P.O. Box 55235, Boston, Massachusetts 02205-5235.
Name, Age; Principal Occupations and Other Relevant Experience+ |
Dennis J. Dirks (62) |
| Year of Election or Appointment: 2005 Prior to his retirement in May 2003, Mr. Dirks was Chief Operating Officer and a member of the Board of The Depository Trust & Clearing Corporation (DTCC). He also served as President, Chief Operating Officer, and Board member of The Depository Trust Company (DTC) and President and Board member of the National Securities Clearing Corporation (NSCC). In addition, Mr. Dirks served as Chief Executive Officer and Board member of the Government Securities Clearing Corporation, Chief Executive Officer and Board member of the Mortgage-Backed Securities Clearing Corporation, as a Trustee and a member of the Finance Committee of Manhattan College (2005-2008), and as a Trustee and a member of the Finance Committee of AHRC of Nassau County (2006-2008). Currently, Mr. Dirks serves as a member of the Board of Directors for The Brookville Center for Children's Services, Inc. (2009-present). |
Alan J. Lacy (56) |
| Year of Election or Appointment: 2008 Mr. Lacy serves as Senior Adviser (2007-present) of Oak Hill Capital Partners, L.P. (private equity). Mr. Lacy also served as Chief Executive Officer (2000-2005) and Vice Chairman (2005-2006) of Sears Holdings Corporation and Sears, Roebuck and Co. (retail). In addition, Mr. Lacy serves as a member of the Board of Directors of The Western Union Company (global money transfer, 2006-present) and Bristol-Myers Squibb Company (global pharmaceuticals, 2007-present). Mr. Lacy is Chairman (2008-present) and a member (2006-present) of the Board of Trustees of The National Parks Conservation Association. |
Ned C. Lautenbach (66) |
| Year of Election or Appointment: 2000 Mr. Lautenbach is Chairman of the Independent Trustees of the Equity and High Income Funds (2006-present). Mr. Lautenbach is an Advisory Partner of Clayton, Dubilier & Rice, Inc. (private equity investment, 2008-present) and was previously a Partner of Clayton, Dubilier & Rice, Inc. (1998-2008). Previously, Mr. Lautenbach was with the International Business Machines Corporation (IBM) from 1968 until his retirement in 1998. Mr. Lautenbach serves as a Director of Eaton Corporation (diversified industrial) as well as the Philharmonic Center for the Arts in Naples, Florida. Mr. Lautenbach is also a member of the Board of Trustees of Fairfield University (2005-present), as well as a member of the Council on Foreign Relations. Previously, Mr. Lautenbach served as a Director of Sony Corporation (2006-2007). |
Joseph Mauriello (65) |
| Year of Election or Appointment: 2008 Prior to his retirement in January 2006, Mr. Mauriello served in numerous senior management positions including Deputy Chairman and Chief Operating Officer (2004-2005), and Vice Chairman of Financial Services (2002-2004) of KPMG LLP US (professional services, 1965-2005). Mr. Mauriello currently serves as a member of the Board of Directors of XL Capital Ltd. (global insurance and re-insurance, 2006-present) and of Arcadia Resources Inc. (health care services and products, 2007-
present). Previously, Mr. Mauriello served as a Director of the Hamilton Funds of the Bank of New York (2006-2007). |
Cornelia M. Small (66) |
| Year of Election or Appointment: 2005 Ms. Small is a member of the Board of Directors of the Teagle Foundation (2009-present). Ms. Small is also a member of the Investment Committee, and Chair (2008-present) and a member of the Board of Trustees of Smith College. In addition, Ms. Small serves on the Investment Committee of the Berkshire Taconic Community Foundation (2008-present). Previously, Ms. Small served as Chairperson of the Investment Committee (2002-2008) of Smith College. In addition, Ms. Small served as Chief Investment Officer, Director of Global Equity Investments, and a member of the Board of Directors of Scudder, Stevens & Clark and Scudder Kemper Investments. |
William S. Stavropoulos (71) |
| Year of Election or Appointment: 2002 Mr. Stavropoulos is Vice Chairman of the Independent Trustees of the Equity and High Income Funds (2006-present). Mr. Stavropoulos serves as President and Founder of the Michigan Baseball Foundation, the Great Lakes Loons (2007-present). Mr. Stavropoulos is Chairman Emeritus of the Board of Directors of The Dow Chemical Company, where he previously served in numerous senior management positions, including President, CEO (1995-2000; 2002-2004), Chairman of the Executive Committee (2000-2006), and as a member of the Board of Directors (1990-2006). Currently, Mr. Stavropoulos is a Director of Teradata Corporation (data warehousing and technology solutions, 2008-present), Chemical Financial Corporation, Maersk Inc. (industrial conglomerate), Tyco International, Inc. (multinational manufacturing and services, 2007-present), and a member of the Advisory Board for Metalmark Capital (private equity investment, 2005-present). Mr. Stavropoulos is a special advisor to Clayton, Dubilier & Rice, Inc. (private equity investment). In addition, Mr. Stavropoulos is a member of the University of Notre Dame Advisory Council for the College of Science. |
David M. Thomas (61) |
| Year of Election or Appointment: 2008 Previously, Mr. Thomas served as Executive Chairman (2005-2006) and Chairman and Chief Executive Officer (2000-2005) of IMS Health, Inc. (pharmaceutical and healthcare information solutions). In addition, Mr. Thomas serves as a member of the Board of Directors of Fortune Brands, Inc. (consumer products), and Interpublic Group of Companies, Inc. (marketing communication, 2004-present). |
Michael E. Wiley (59) |
| Year of Election or Appointment: 2008 Mr. Wiley also serves as a Director of Asia Pacific Exploration Consolidated (international oil and gas exploration and production, 2008-present), and as a member of the Board of Trustees of the University of Tulsa (2000-2006; 2007-present). Mr. Wiley serves as a Director of Tesoro Corporation (independent oil refiner and marketer, 2005-present), and a Director of Bill Barrett Corporation (exploration and production, 2005-present). In addition, Mr. Wiley also serves as a Director of Post Oak Bank (privately-held bank, 2004-present). Previously, Mr. Wiley served as a Sr. Energy Advisor of Katzenbach Partners, LLC (consulting, 2006-2007), as an Advisory Director of Riverstone Holdings (private investment), Chairman, President, and CEO of Baker Hughes, Inc. (oilfield services, 2000-2004), and as Director of Spinnaker Exploration Company (exploration and production, 2001-2005). |
+ The information above includes each Trustee's principal occupation during the last five years and other information relating to the experience, attributes, and skills relevant to each Trustee's qualifications to serve as a Trustee, which led to the conclusion that each Trustee should serve as a Trustee for the fund.
Advisory Board Member and Executive Officers:
Correspondence intended for each executive officer and Peter S. Lynch may be sent to Fidelity Investments, 82 Devonshire Street, Boston, Massachusetts 02109.
Name, Age; Principal Occupation |
Peter S. Lynch (66) |
| Year of Election or Appointment: 2003 Member of the Advisory Board of Fidelity's Equity and High Income Funds. Mr. Lynch is Vice Chairman and a Director of FMR and FMR Co., Inc. In addition, Mr. Lynch serves as a Trustee of Boston College and as the Chairman of the Inner-City Scholarship Fund. Previously, Mr. Lynch served on the Special Olympics International Board of Directors (1997-2006). |
Kenneth B. Robins (40) |
| Year of Election or Appointment: 2008 President and Treasurer of Fidelity's Equity and High Income Funds. Mr. Robins also serves as President and Treasurer (2010-present) and Assistant Treasurer (2009-present) of other Fidelity funds and is an employee of Fidelity Investments (2004-present). Previously, Mr. Robins served as Deputy Treasurer of the Fidelity funds (2005-2008) and Treasurer and Chief Financial Officer of The North Carolina Capital Management Trust: Cash and Term Portfolios (2006-2008). |
Brian B. Hogan (45) |
| Year of Election or Appointment: 2009 Vice President of certain Equity Funds and Vice President of Sector Funds. Mr. Hogan also serves as Senior Vice President, Equity Research of FMR (2006-present) and President of FMR's Equity Division (2009-
present). Previously, Mr. Hogan served as a portfolio manager. |
Thomas C. Hense (46) |
| Year of Election or Appointment: 2008 or 2010 Vice President of Fidelity's High Income (2008), Small Cap (2008), and Value (2010) Funds. Previously, Mr. Hense served as a portfolio manager for Fidelity's Institutional Money Management Group (Pyramis) (2003-2008). |
Scott C. Goebel (42) |
| Year of Election or Appointment: 2008 Secretary and Chief Legal Officer (CLO) of the Fidelity funds. Mr. Goebel also serves as General Counsel, Secretary, and Senior Vice President of FMR (2008-present) and FMR Co., Inc. (2008-present); Deputy General Counsel of FMR LLC; Chief Legal Officer of Fidelity Management & Research (Hong Kong) Limited (2008-present) and Assistant Secretary of Fidelity Management & Research (Japan) Inc. (2008-present), Fidelity Investments Money Management, Inc. (2008-
present), Fidelity Management & Research (U.K.) Inc. (2008-present), and Fidelity Research and Analysis Company (2008-present). Previously, Mr. Goebel served as Assistant Secretary of the Funds (2007-2008) and as Vice President and Secretary of Fidelity Distributors Corporation (FDC) (2005-2007). |
William C. Coffey (41) |
| Year of Election or Appointment: 2009 Assistant Secretary of Fidelity's Equity and High Income Funds. Mr. Coffey also serves as Senior Vice President and Deputy General Counsel of FMR LLC (2010-present), and is an employee of Fidelity Investments. Previously, Mr. Coffey served as Vice President and Associate General Counsel of FMR LLC (2005-2009). |
Holly C. Laurent (56) |
| Year of Election or Appointment: 2008 Anti-Money Laundering (AML) Officer of the Fidelity funds. Ms. Laurent is an employee of Fidelity Investments. Previously, Ms. Laurent was Senior Vice President and Head of Legal for Fidelity Business Services India Pvt. Ltd. (2006-2008), and Senior Vice President, Deputy General Counsel and Group Head for FMR LLC (2005-2006). |
Christine Reynolds (51) |
| Year of Election or Appointment: 2008 Chief Financial Officer of the Fidelity funds. Ms. Reynolds became President of Fidelity Pricing and Cash Management Services (FPCMS) in August 2008. Ms. Reynolds served as Chief Operating Officer of FPCMS (2007-2008). Previously, Ms. Reynolds served as President, Treasurer, and Anti-Money Laundering officer of the Fidelity funds (2004-2007). |
Kenneth A. Rathgeber (63) |
| Year of Election or Appointment: 2004 Chief Compliance Officer of Fidelity's Equity and High Income Funds. Mr. Rathgeber is Chief Compliance Officer of Fidelity Management & Research (Hong Kong) Limited (2008-present), Fidelity Management & Research (Japan) Inc. (2008-present), FMR (2005-present), FMR Co., Inc. (2005-present), Fidelity Management & Research (U.K.) Inc. (2005-present), Fidelity Research & Analysis Company (2005-present), Fidelity Investments Money Management, Inc. (2005-present), Pyramis Global Advisors, LLC (2005-present), and Strategic Advisers, Inc. (2005-present). |
Jeffrey S. Christian (48) |
| Year of Election or Appointment: 2009 Deputy Treasurer of the Fidelity funds. Mr. Christian is an employee of Fidelity Investments. Previously, Mr. Christian served as Chief Financial Officer (2008-2009) of certain Fidelity funds and Senior Vice President of Fidelity Pricing and Cash Management Services (FPCMS) (2004-2009). |
Bryan A. Mehrmann (49) |
| Year of Election or Appointment: 2005 Deputy Treasurer of the Fidelity funds. Mr. Mehrmann is an employee of Fidelity Investments. |
Adrien E. Deberghes (42) |
| Year of Election or Appointment: 2008 Deputy Treasurer of Fidelity's Equity and High Income Funds. Mr. Deberghes also serves as Assistant Treasurer of other Fidelity funds (2010-present) and is an employee of Fidelity Investments (2008-present). Previously, Mr. Deberghes served as Senior Vice President of Mutual Fund Administration at State Street Corporation (2007-2008), Senior Director of Mutual Fund Administration at Investors Bank & Trust (2005-2007), and Director of Finance for Dunkin' Brands (2000-2005). |
Stephanie J. Dorsey (41) |
| Year of Election or Appointment: 2010 Assistant Treasurer of Fidelity's Equity and High Income Funds. Ms. Dorsey also serves as Deputy Treasurer of other Fidelity funds (2008-present) and is an employee of Fidelity Investments (2008-present). Previously, Ms. Dorsey served as Treasurer (2004-2008) of the JPMorgan Mutual Funds and Vice President (2004-2008) of JPMorgan Chase Bank. |
John R. Hebble (52) |
| Year of Election or Appointment: 2009 Assistant Treasurer of Fidelity's Equity and High Income Funds. Mr. Hebble also serves as Treasurer and Chief Financial Officer of The North Carolina Capital Management Trust: Cash and Term Portfolio (2008-present), President and Treasurer of other Fidelity funds (2008-present) and is an employee of Fidelity Investments. |
Gary W. Ryan (51) |
| Year of Election or Appointment: 2005 Assistant Treasurer of the Fidelity funds. Mr. Ryan is an employee of Fidelity Investments. Previously, Mr. Ryan served as Vice President of Fund Reporting in Fidelity Pricing and Cash Management Services (FPCMS) (1999-2005). |
Annual Report
The Board of Trustees of Fidelity Small Cap Value Fund voted to pay shareholders of record at the opening of business on record date, the following distributions per share derived from capital gains realized from sales of portfolio securities, and dividends derived from net investment income:
| Pay Date | Record Date | Dividends | Capital Gains |
F Class | 09/09/10 | 09/08/10 | $0.056 | $0.066 |
Class F designates 100% of the dividends distributed during the fiscal year as qualifying for the dividend-received deduction for corporate shareholders.
Class F designates 100% of the dividends distributed during the fiscal year as amounts which may be taken into account as a dividend for the purposes of the maximum rate under section 1(h)(11) of the Internal Revenue Code.
The fund hereby designates as a capital gain dividend with respect to the taxable year ended July 31, 2010 $11,953,854, or, if subsequently determined to be different, the net capital gain of such year.
The fund will notify shareholders in January 2011 of amounts for use in preparing 2010 income tax returns.
Annual Report
Board Approval of Investment Advisory Contracts and Management Fees
Fidelity Small Cap Value Fund
Each year, the Board of Trustees, including the Independent Trustees (together, the Board), votes on the renewal of the management contract and sub-advisory agreements (together, the Advisory Contracts) for the fund. The Board, assisted by the advice of fund counsel and Independent Trustees' counsel, requests and considers a broad range of information relevant to the renewal of the Advisory Contracts throughout the year.
The Board meets regularly and considers at each of its meetings factors that are relevant to its annual consideration of the renewal of the fund's Advisory Contracts, including the services and support provided to the fund and its shareholders. The Board has established various standing committees, each composed of Independent Trustees with varying backgrounds, to which the Board has assigned specific subject matter responsibilities in order to enhance effective decision-making by the Board. The Board, acting directly and through its Committees, requests and receives information concerning the annual consideration of the renewal of the fund's Advisory Contracts. The Board also meets as needed to consider matters specifically related to the Board's annual consideration of the renewal of Advisory Contracts. Members of the Board may also meet with trustees of other Fidelity funds through ad hoc joint committees to discuss certain matters relevant to the Fidelity funds.
At its July 2010 meeting, the Board of Trustees, including the Independent Trustees, unanimously determined to renew the fund's Advisory Contracts. In reaching its determination, the Board considered all factors it believed relevant, including (i) the nature, extent, and quality of the services to be provided to the fund and its shareholders (including the investment performance of the fund); (ii) the competitiveness of the fund's management fee and total expenses; (iii) the total costs of the services to be provided by and the profits to be realized by Fidelity from its relationship with the fund; (iv) the extent to which economies of scale would be realized as the fund grows; and (v) whether fee levels reflect these economies of scale, if any, for the benefit of fund shareholders.
In considering whether to renew the Advisory Contracts for the fund, the Board reached a determination, with the assistance of fund counsel and Independent Trustees' counsel and through the exercise of its business judgment, that the renewal of the Advisory Contracts is in the best interests of fund shareholders and that the compensation to be received by Fidelity under the management contract is fair and reasonable. The Board's decision to renew the Advisory Contracts was not based on any single factor noted above, but rather was based on a comprehensive consideration of all the information provided to the Board at its meetings throughout the year. The Board, in reaching its determination to renew the Advisory Contracts, is aware that shareholders in the fund have a broad range of investment choices available to them, including a wide choice among mutual funds offered by Fidelity's competitors, and that the fund's shareholders, with the opportunity to review and weigh the disclosure provided by the fund in its prospectus and other public disclosures, have chosen to invest in this fund, managed by Fidelity.
Annual Report
Board Approval of Investment Advisory Contracts and
Management Fees - continued
Nature, Extent, and Quality of Services Provided. The Board considered the staffing within the investment adviser, FMR, and the sub-advisers (together, the Investment Advisers), including the backgrounds of the fund's investment personnel and the fund's investment objective and discipline. The Independent Trustees also had discussions with senior management of Fidelity's investment operations and investment groups. The Board considered the structure of the portfolio manager compensation program and whether this structure provides appropriate incentives to act in the best interest of the fund.
Resources Dedicated to Investment Management and Support Services. The Board and the equity research subcommittee of the Board's Fund Oversight Committee reviewed the size, education, and experience of the Investment Advisers' investment staff, their use of technology, and the Investment Advisers' approach to recruiting, training, and retaining portfolio managers and other research, advisory, and management personnel. The Board noted that Fidelity's analysts have access to a variety of technological tools and market and securities data that enable them to perform both fundamental and quantitative analysis and to specialize in various disciplines. The Board considered Fidelity's extensive global research capabilities that enable the Investment Advisers to aggregate data from various sources in an effort to produce positive investment results. The Board also considered that Fidelity's portfolio managers and analysts have access to daily portfolio attribution that allows for monitoring of a fund's portfolio, as well as an electronic communication system that provides immediate real-time access to research concerning issuers and credit enhancers. The Board noted FMR's continued focus on strengthening the organization and discipline of equity portfolio management and research.
Shareholder and Administrative Services. The Board considered (i) the nature, extent, quality, and cost of advisory, administrative, and shareholder services performed by the Investment Advisers and their affiliates under the Advisory Contracts and under separate agreements covering transfer agency, pricing and bookkeeping, and securities lending services for the fund; (ii) the nature and extent of the investment adviser's supervision of third party service providers, principally custodians and subcustodians; and (iii) the resources devoted to, and the record of compliance with, the fund's compliance policies and procedures. The Board also reviewed the allocation of fund brokerage, including allocations to brokers affiliated with the Investment Advisers, the use of brokerage commissions to pay fund expenses, and the use of "soft" commission dollars to pay for research services.
The Board noted that the growth of fund assets over time across the complex allows Fidelity to reinvest in the development of services designed to enhance the value or convenience of the Fidelity funds as investment vehicles. These services include 24-hour access to account information and market information through phone representatives and over the Internet, and investor education materials and asset allocation tools.
Annual Report
Investment in a Large Fund Family. The Board considered the benefits to shareholders of investing in a Fidelity fund, including the benefits of investing in a fund that is part of a large family of funds offering a variety of investment disciplines and providing a large variety of mutual fund investor services. The Board noted that Fidelity had taken, or had made recommendations that resulted in the Fidelity funds taking, a number of actions over the previous year that benefited particular funds, including (i) dedicating additional resources to investment research and restructuring and broadening the focus of the investment research teams; (ii) bolstering the senior management team that oversees asset management; (iii) launching Class F of certain funds as a lower-fee class available to Freedom K and Freedom Index Funds; (iv) lowering the initial investment minimums and ongoing balance requirements for Real Estate High Income Fund; (v) eliminating subsequent purchase minimums for all funds and adding a waiver of the investment minimum requirement for new accounts opened with the proceeds of a systematic withdrawal plan; (vi) eliminating the withdrawal minimum and maximum limits for systematic withdrawals from Advisor funds; (vii) expanding sales load waivers on Class A shares for Destiny Planholders and expanding Institutional Class eligibility for Class O Destiny Planholders; and (viii) changing certain Class A and Class T sales charge structures to further align them with industry practices.
Investment Performance. The Board considered whether the fund has operated in accordance with its investment objective, as well as its record of compliance with its investment restrictions. It also reviewed the fund's absolute investment performance for each class (except Class F), as well as the fund's relative investment performance for each class (except Class F) measured over multiple periods against (i) a broad-based securities market index, and (ii) a peer group of mutual funds deemed appropriate by Fidelity and reviewed by the Board. The following charts considered by the Board show, over the one-, three-, and five-year periods ended December 31, 2009, the cumulative total returns of Institutional Class (Class I) and Class B of the fund, the cumulative total returns of a broad-based securities market index ("benchmark"), and a range of cumulative total returns of a peer group of mutual funds identified by Morningstar, Inc. as having an investment style similar to that of the fund based on underlying portfolio holdings. The returns of Institutional Class (Class I) and Class B show the performance of the highest and lowest performing classes, respectively (based on five-year performance). (Class F had less than one year of performance as of December 31, 2009.) The box within each chart shows the 25th percentile return (bottom of box) and the 75th percentile return (top of box) of the peer group. Returns shown above the box are in the first quartile and returns shown below the box are in the fourth quartile. The percentage beaten numbers noted below each chart correspond to the percentile box and represent the percentage of funds in the peer group whose performance was equal to or lower than that of the class indicated.
Annual Report
Board Approval of Investment Advisory Contracts and
Management Fees - continued
Fidelity Small Cap Value Fund

The Board reviewed the fund's relative investment performance against its peer group and noted that the performance of Institutional Class (Class I) of the fund was in the first quartile for all the periods shown. The Board also noted that the investment performance of Institutional Class (Class I) of the fund compared favorably to its benchmark for all the periods shown. The Board considered that the variations in performance among the fund's classes reflect the variations in class expenses, which result in lower performance for higher expense classes. The Board also reviewed the fund's performance since inception as well as performance in the current year.
The Board also considered that the fund's management fee is subject to upward or downward adjustment depending upon whether, and to what extent, the fund's investment performance for the performance period exceeds, or is exceeded by, the record (over the same period) of a Board-approved performance adjustment index. The Board realizes that the performance adjustment provides FMR with a strong economic incentive to seek to achieve superior performance for the fund's shareholders and helps to more closely align the interests of FMR and the fund's shareholders.
Based on its review, and giving particular weight to the nature and quality of the resources dedicated by the Investment Advisers to maintain and improve relative performance and factoring in the unprecedented market events in recent years, the Board concluded that the nature, extent, and quality of investment management and support services and of shareholder and administrative services provided to the fund will benefit the fund's shareholders, particularly in light of the Board's view that the fund's shareholders benefit from investing in a fund that is part of a large family of funds offering a variety of investment disciplines and services.
Annual Report
Competitiveness of Management Fee and Total Fund Expenses. The Board considered the fund's management fee and total expenses compared to "mapped groups" of competitive funds and classes. Fidelity creates "mapped groups" by combining similar Lipper investment objective categories that have comparable management fee characteristics. Combining Lipper investment objective categories aids the Board's management fee and total expense comparisons by broadening the competitive group used for comparison and by reducing the number of universes to which various Fidelity funds are compared.
Management Fee. The Board considered two proprietary management fee comparisons for the 12-month periods shown in the chart below. The group of Lipper funds used by the Board for management fee comparisons is referred to below as the "Total Mapped Group." The Total Mapped Group comparison focuses on a fund's standing relative to the total universe of comparable funds available to investors, in terms of gross management fees before expense reimbursements or caps, and without giving effect to the fund's performance adjustment. "TMG %" represents the percentage of funds in the Total Mapped Group that had management fees that were lower than the fund's. For example, a TMG % of 13% means that 87% of the funds in the Total Mapped Group had higher management fees than the fund. The "Asset-Size Peer Group" (ASPG) comparison focuses on a fund's standing relative to non-Fidelity funds similar in size to the fund within the Total Mapped Group. The ASPG represents at least 15% of the funds in the Total Mapped Group with comparable asset size and management fee characteristics, subject to a minimum of 50 funds (or all funds in the Total Mapped Group if fewer than 50). Additional information, such as the ASPG quartile in which the fund's management fee ranked and the impact of the fund's performance adjustment, is also included in the chart and considered by the Board.
Annual Report
Board Approval of Investment Advisory Contracts and
Management Fees - continued
Fidelity Small Cap Value Fund

The Board noted that the fund's management fee ranked below the median of its Total Mapped Group and below the median of its ASPG for 2009. The Board also noted the effect of the fund's positive performance adjustment on the fund's management fee ranking. The Board noted that the performance adjustment for each year represents calculations for performance periods that differ from the periods shown in the performance charts above.
Based on its review, the Board concluded that the fund's management fee is fair and reasonable in light of the services that the fund receives and the other factors considered.
Total Expenses. In its review of each class's total expenses, the Board considered the fund's management fee as well as other fund or class expenses, as applicable, such as transfer agent fees, pricing and bookkeeping fees, fund-paid 12b-1 fees, and custodial, legal, and audit fees. The Board also noted the effects of any waivers and reimbursements on fees and expenses, as well as the impact of the fund's performance adjustment. As part of its review, the Board also considered current and historical total expenses of each class of the fund compared to competitive fund median expenses. Each class of the fund is compared to those funds and classes in the Total Mapped Group (used by the Board for management fee comparisons) that have a similar sales load structure.
The Board noted that the total expenses of each of Class A, Class B, the retail class, and Class F ranked below its competitive median for the period, the total expenses of each of Class C and Institutional Class ranked equal to its competitive median for the period, and the total expenses of Class T ranked above its competitive median for the period. The Board considered that the total expenses for Class T were above the median primarily because its 12b-1 fee is higher than the typical front-end load class. The Board noted that the fund offers multiple classes, each of which has a different sales load and 12b-1 fee structure, and that the multiple structures are intended to offer a range of pricing options for the intermediary market. The Board also noted that the total expenses of the classes vary primarily by the level of their 12b-1 fees, although differences in transfer agent fees may also cause expenses to vary from class to class.
Annual Report
Fees Charged to Other Fidelity Clients. The Board also considered Fidelity fee structures and other information with respect to clients of FMR and its affiliates, such as other mutual funds advised or subadvised by FMR or its affiliates, pension plan clients, and other institutional clients. In March 2010, the Board created an ad hoc joint committee with the board of other Fidelity funds (the Committee) to review and compare Fidelity's institutional investment advisory business with its business of providing services to the Fidelity funds, including the differences in services provided, fees charged, and costs incurred, as well as competition in their respective marketplaces.
Based on its review of total expenses and fees charged to other Fidelity clients, the Board concluded that the total expenses of each class of the fund were reasonable, although in one case above the median of the universe presented for comparison, in light of the services that the fund and its shareholders receive and the other factors considered, including the findings of the Committee.
Costs of the Services and Profitability. The Board considered the revenues earned and the expenses incurred by Fidelity in conducting the business of developing, marketing, distributing, managing, administering and servicing the fund and its shareholders. The Board also considered the level of Fidelity's profits in respect of all the Fidelity funds.
On an annual basis, FMR presents to the Board Fidelity's profitability for the fund. Fidelity calculates the profitability for each fund, as well as aggregate profitability for groups of Fidelity funds and all Fidelity funds, using a series of detailed revenue and cost allocation methodologies which originate with the audited books and records of Fidelity. The Audit Committee of the Board reviews any significant changes from the prior year's methodologies.
PricewaterhouseCoopers LLP (PwC), independent registered public accounting firm and auditor to Fidelity and certain Fidelity funds, has been engaged annually by the Board as part of the Board's assessment of Fidelity's profitability analysis. PwC's engagement includes the review and assessment of Fidelity's methodologies used in determining the revenues and expenses attributable to Fidelity's mutual fund business, and completion of agreed-upon procedures surrounding the mathematical accuracy of fund profitability and its conformity to allocation methodologies. After considering PwC's reports issued under the engagement and information provided by Fidelity, the Board believes that while other allocation methods may also be reasonable, Fidelity's profitability methodologies are reasonable in all material respects.
Annual Report
Board Approval of Investment Advisory Contracts and
Management Fees - continued
The Board has also reviewed Fidelity's non-fund businesses and fall-out benefits related to the mutual fund business as well as cases where Fidelity's affiliates may benefit from or be related to the fund's business.
The Board considered the costs of the services provided by and the profits realized by Fidelity in connection with the operation of the fund and were satisfied that the profitability was not excessive in the circumstances.
Economies of Scale. The Board considered whether there have been economies of scale in respect of the management of the Fidelity funds, whether the Fidelity funds (including the fund) have appropriately benefited from any such economies of scale, and whether there is potential for realization of any further economies of scale. The Board considered the extent to which the fund will benefit from economies of scale through increased services to the fund, through waivers or reimbursements, or through fee or expense reductions.
In February 2009, the Board and the board of other Fidelity funds created an ad hoc committee (the Economies of Scale Committee) to analyze whether FMR attains economies of scale in respect of the management and servicing of the Fidelity funds, whether the Fidelity funds have appropriately benefited from such economies of scale, and whether there is potential for realization of any further economies of scale.
The Board recognized that the fund's management contract incorporates a "group fee" structure, which provides for lower group fee rates as total fund assets under FMR's management increase, and for higher group fee rates as total fund assets under FMR's management decrease. FMR calculates the group fee rates based on a tiered asset "breakpoint" schedule that varies based on asset class. The Board considered that the group fee is designed to deliver the benefits of economies of scale to fund shareholders when total Fidelity fund assets increase, even if assets of any particular fund are unchanged or have declined, because some portion of Fidelity's costs are attributable to services provided to all Fidelity funds, and all funds benefit if those costs can be allocated among more assets. The Board concluded that, given the group fee structure, fund shareholders will benefit from lower management fees as assets under FMR's management increase at the fund complex level, regardless of whether Fidelity achieves any such economies of scale.
The Board concluded, considering the findings of the Economies of Scale Committee, that any potential economies of scale are being appropriately shared between fund shareholders and Fidelity.
Additional Information Requested by the Board. In order to develop fully the factual basis for consideration of the Fidelity funds' Advisory Contracts, the Board requested and received additional information on certain topics, including (i) fund performance trends, actions to be taken by FMR to improve certain funds' overall performance, and Fidelity's long-term strategies for certain funds; (ii) portfolio manager changes that have occurred during the past year and length of portfolio manager tenure for different categories of funds over time; (iii) Fidelity's compensation structure for portfolio managers, research analysts, and other key personnel, the rationale for the compensation structure, and how the compensation structure provides appropriate performance incentives; (iv) the amount of the investment that each portfolio manager has made in the Fidelity fund(s) that he or she manages; (v) management and other fees paid by FMR to affiliated sub-advisers on behalf of the Fidelity funds; (vi) Fidelity's fee structures and rationale for recommending different fees among different categories of funds; (vii) Fidelity's rationale for recommending which funds should have a performance adjustment component as part of their management fees; (viii) the rationale for any differences between fund fee structures and fee structures in place for other Fidelity clients; and (ix) explanations regarding the relative total expenses borne by certain funds and classes, total expense competitive trends, and actions that might be taken by FMR to reduce total expenses for certain funds and classes.
Annual Report
Based on its evaluation of all of the conclusions noted above, and after considering all factors it believed relevant, the Board ultimately concluded that the advisory fee structures are fair and reasonable, and that the fund's Advisory Contracts should be renewed.
Annual Report
Managing Your Investments
Fidelity offers several ways to conveniently manage your workplace benefits (including your workplace savings plan, investments, and additional services) via your telephone or PC. You can access your plan and account information and research your investments 24 hours a day.
By Phone
Fidelity provides a single toll-free number to access plan information, account balances, positions, and quotes*. It's easy to navigate the service, and on your first call, the system will help you create a personal identification number (PIN) for security.
(phone_graphic)
Fidelity Workplace
Investing
1-800-835-5092
By PC
Fidelity's web site on the Internet provides a wide range of information, including plan information, daily financial news, fund performance, interactive planning tools, and news about Fidelity products and services.
(computer_graphic)
Fidelity's Web Site
www.401k.com
* When you call the quotes line, please remember that a fund's yield and return will vary and, except for money market funds, share price will also vary. This means that you may have a gain or loss when you sell your shares. There is no assurance that money market funds will be able to maintain a stable $1 share price; an investment in a money market fund is not insured or guaranteed by the U.S. government. Total returns are historical and include changes in share price, reinvestment of dividends and capital gains, and the effects of any sales charges.
Annual Report
To Write Fidelity
We'll give your correspondence immediate attention and send you written confirmation upon completion of your request.
(letter_graphic)
For Non-Retirement
Accounts
Buying shares
Fidelity Investments
P.O. Box 770001
Cincinnati, OH 45277-0003
Overnight Express
Fidelity Investments
Attn: Distribution Services
100 Crosby Parkway - KC1H
Covington, KY 41015
Selling shares
Fidelity Investments
P.O. Box 770001
Cincinnati, OH 45277-0035
Overnight Express
Fidelity Investments
Attn: Distribution Services
100 Crosby Parkway - KC1H
Covington, KY 41015
General Correspondence
Fidelity Investments
P.O. Box 500
Merrimack, NH 03054-0500
(letter_graphic)
For Retirement
Accounts
Buying shares
Fidelity Investments
P.O. Box 770001
Cincinnati, OH 45277-0003
Selling shares
Fidelity Investments
P.O. Box 770001
Cincinnati, OH 45277-0035
Overnight Express
Fidelity Investments
Attn: Distribution Services
100 Crosby Parkway - KC1H
Covington, KY 41015
General Correspondence
Fidelity Investments
P.O. Box 500
Merrimack, NH 03054-0500
Annual Report
Investment Adviser
Fidelity Management & Research Company
Boston, MA
Investment Sub-Advisers
FMR Co., Inc.
Fidelity Research & Analysis Company
Fidelity Management & Research
(U.K.) Inc.
Fidelity Management & Research
(Hong Kong) Limited
Fidelity Management & Research
(Japan) Inc.
General Distributor
Fidelity Distributors Corporation
Boston, MA
Transfer and Service Agents
Fidelity Investments Institutional
Operations Company, Inc.
Boston, MA
Fidelity Service Company, Inc.
Boston, MA
Custodian
Citibank, N.A.
New York, NY
SCV-F-ANN-0910
1.891896.101
(Fidelity Investment logo)(registered trademark)
Fidelity Advisor
Small Cap Value
Fund - Class A, Class T,
Class B and Class C
Annual Report
July 31, 2010
(2_fidelity_logos) (Registered_Trademark)
Class A, Class T, Class B
and Class C are classes of
Fidelity® Small Cap Value Fund
Contents
Chairman's Message | <Click Here> | The Chairman's message to shareholders. |
Performance | <Click Here> | How the fund has done over time. |
Management's Discussion of Fund Performance | <Click Here> | The Portfolio Manager's review of fund performance and strategy. |
Shareholder Expense Example | <Click Here> | An example of shareholder expenses. |
Investment Changes | <Click Here> | A summary of major shifts in the fund's investments over the past six months. |
Investments | <Click Here> | A complete list of the fund's investments with their market values. |
Financial Statements | <Click Here> | Statements of assets and liabilities, operations, and changes in net assets,
as well as financial highlights. |
Notes | <Click Here> | Notes to the financial statements. |
Report of Independent Registered Public Accounting Firm | <Click Here> | |
Trustees and Officers | <Click Here> | |
Distributions | <Click Here> | |
Board Approval of Investment Advisory Contracts and Management Fees | <Click Here> | |
To view a fund's proxy voting guidelines and proxy voting record for the 12-month period ended June 30, visit http://www.fidelity.com/proxyvotingresults or visit the Securities and Exchange Commission's (SEC) web site at http://www.sec.gov. You may also call 1-877-208-0098 to request a free copy of the proxy voting guidelines.
Standard & Poor's, S&P and S&P 500 are registered service marks of The McGraw-Hill Companies, Inc. and have been licensed for use by Fidelity Distributors Corporation.
Other third party marks appearing herein are the property of their respective owners.
All other marks appearing herein are registered or unregistered trademarks or service marks of FMR LLC or an affiliated company.
Annual Report
This report and the financial statements contained herein are submitted for the general information of the shareholders of the fund. This report is not authorized for distribution to prospective investors in the fund unless preceded or accompanied by an effective prospectus.
A fund files its complete schedule of portfolio holdings with the SEC for the first and third quarters of each fiscal year on Form N-Q. Forms N-Q are available on the SEC's web site at http://www.sec.gov. A fund's Forms N-Q may be reviewed and copied at the SEC's Public Reference Room in Washington, DC. Information regarding the operation of the SEC's Public Reference Room may be obtained by calling 1-800-SEC-0330. For a complete list of a fund's portfolio holdings, view the most recent holdings listing, semiannual report, or annual report on Fidelity's web site at http://www.fidelity.com or http://www.advisor.fidelity.com, as applicable.
NOT FDIC INSURED • MAY LOSE VALUE • NO BANK GUARANTEE
Neither the fund nor Fidelity Distributors Corporation is a bank.
Annual Report
(photo_of_Edward_C_Johnson_3d)
Dear Shareholder:
A yearlong uptrend in global equity markets reversed course in late April 2010 when investor sentiment turned bearish due in great measure to concern that Europe's debt crisis would expand and slow or derail economic recovery. However, a bounceback in July helped to recover some of the ground that was lost. Financial markets are always unpredictable, of course, but there also are several time-tested investment principles that can help put the odds in your favor.
One of the basic tenets is to invest for the long term. Over time, riding out the markets' inevitable ups and downs has proven much more effective than selling into panic or chasing the hottest trend. Even missing only a few of the markets' best days can significantly diminish investor returns. Patience also affords the benefits of compounding - of earning interest on additional income or reinvested dividends and capital gains. There can be tax advantages and cost benefits to consider as well. While staying the course doesn't eliminate risk, it can considerably lessen the effect of short-term declines.
You can further manage your investing risk through diversification. And today, more than ever, geographic diversification should be taken into account. Studies indicate that asset allocation is the single most important determinant of a portfolio's long-term success. The right mix of stocks, bonds and cash - aligned to your particular risk tolerance and investment objective - is very important. Age-appropriate rebalancing is also an essential aspect of asset allocation. For younger investors, an emphasis on equities - which historically have been the best-performing asset class over time - is encouraged. As investors near their specific goal, such as retirement or sending a child to college, consideration may be given to replacing volatile assets (e.g. common stocks) with more-stable fixed investments (bonds or savings plans).
A third principle - investing regularly - can help lower the average cost of your purchases. Investing a certain amount of money each month or quarter helps ensure you won't pay for all your shares at market highs. This strategy - known as dollar cost averaging - also reduces "emotion" from investing, helping shareholders avoid selling weak performers just prior to an upswing, or chasing a hot performer just before a correction.
We invite you to contact us via the Internet, through our Investor Centers or by phone. It is our privilege to provide you the information you need to make the investments that are right for you.
Sincerely,
(The chairman's signature appears here.)
Edward C. Johnson 3d
Annual Report
Average annual total return reflects the change in the value of an investment, assuming reinvestment of the class' distributions from dividend income and capital gains (the profits earned upon the sale of securities that have grown in value, if any) and assuming a constant rate of performance each year. The $10,000 table and the fund's returns do not reflect the deduction of taxes that a shareholder would pay on fund distributions or the redemption of fund shares. During periods of reimbursement by Fidelity, a fund's total return will be greater than it would be had the reimbursement not occurred. How a fund did yesterday is no guarantee of how it will do tomorrow.
Average Annual Total Returns
Periods ended July 31, 2010 | Past 1
year | Past 5
years | Life of
fundA |
Class A (incl. 5.75% sales charge) | 14.19% | 2.53% | 6.70% |
Class T (incl. 3.50% sales charge) | 16.64% | 2.77% | 6.88% |
Class B (incl. contingent deferred sales charge) B | 15.22% | 2.63% | 6.87% |
Class C (incl. contingent deferred sales charge) C | 19.11% | 2.97% | 7.00% |
A From November 3, 2004.
B Class B shares' contingent deferred sales charges included in the past one year, past 5 years, and life of fund total return figures are 5%, 2%, and 1%, respectively.
C Class C shares' contingent deferred sales charges included in the past one year, past 5 years, and life of fund total return figures are 1%, 0%, and 0%, respectively.
Annual Report
$10,000 Over Life of Fund
Let's say hypothetically that $10,000 was invested in Fidelity Advisor Small Cap Value Fund - Class A on November 3, 2004, when the fund started, and the current 5.75% sales charge was paid. The chart shows how the value of your investment would have changed, and also shows how the Russell 2000® Value Index performed over the same period.
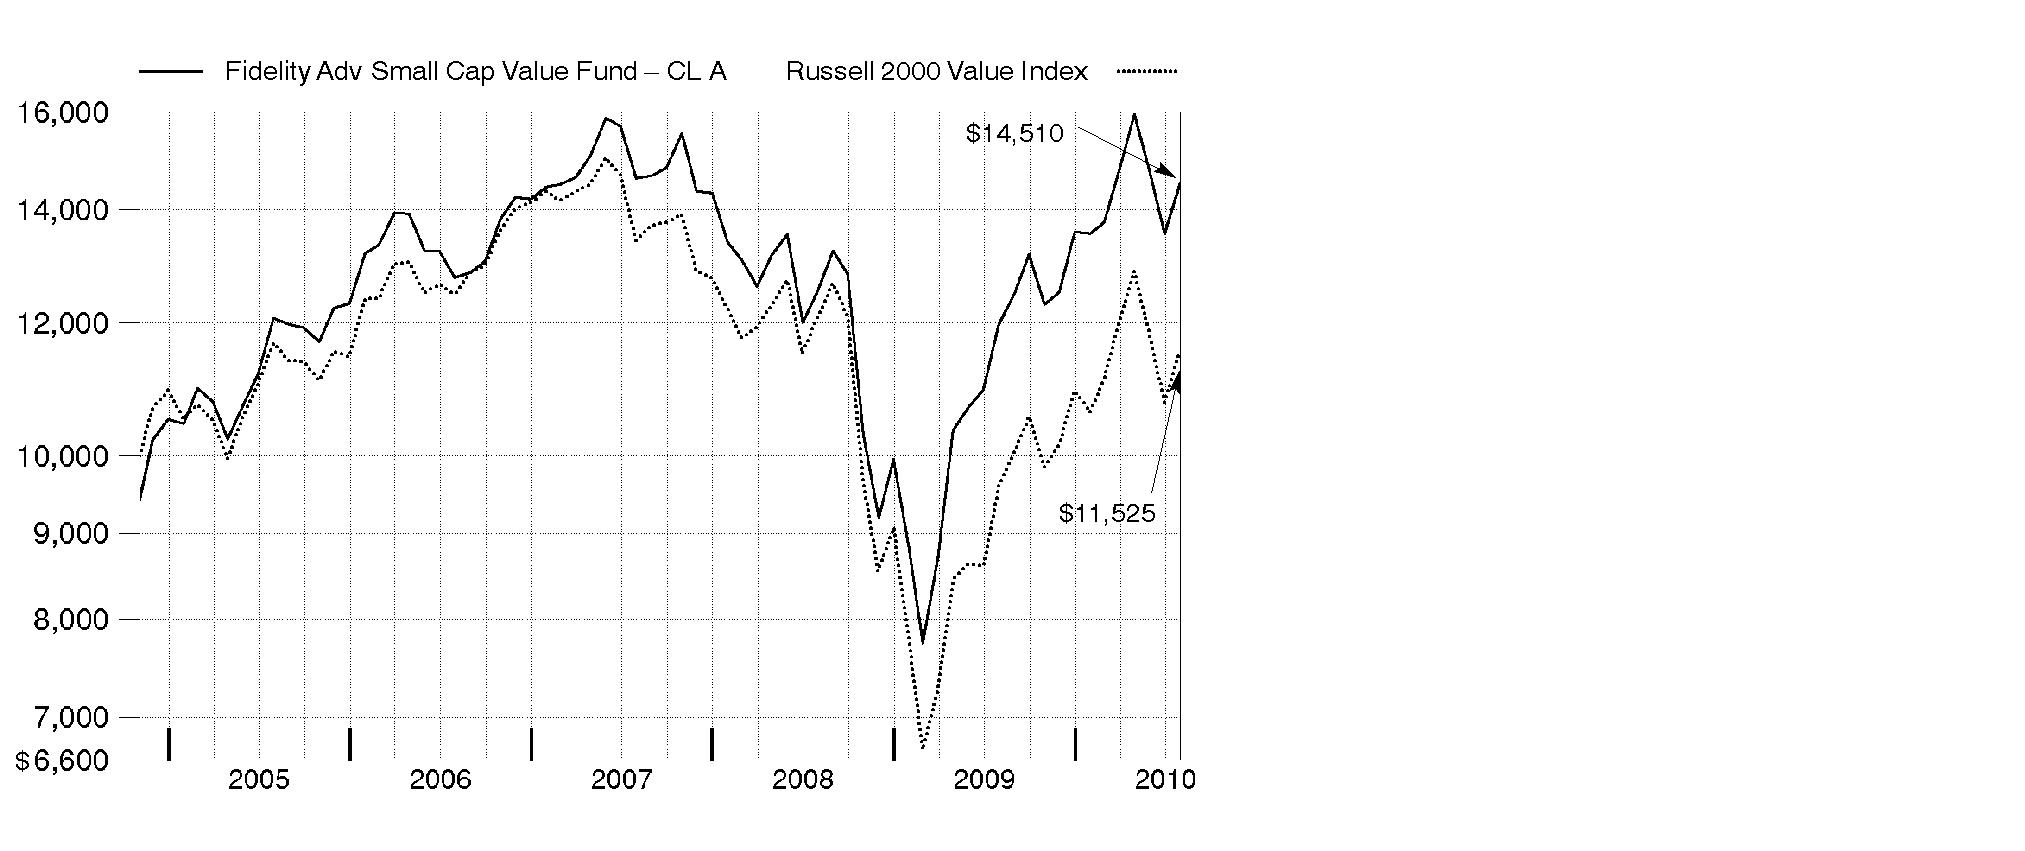
Annual Report
Market Recap: U.S. stock markets saw double-digit gains for the year ending July 31, 2010, despite the return of market volatility and risk aversion during the first half of 2010. An impressive bull run continued through 2009, bolstered by improvement in the economy and credit markets. Early in the new year, however, stocks fell sharply amid concerns about the global economic recovery, fueled by European debt woes and China's efforts to restrain inflation. After this brief dip, markets regained their upward momentum, as government stimulus and significant corporate cost cutting led to encouraging earnings reports, improved credit conditions and rising consumer confidence. Positive news continued through mid-April, when the Dow Jones Industrial AverageSM pushed above the 11,000 mark for the first time in 19 months. That milestone was short-lived, however, as heightened concern about the European debt crisis sparked an abrupt sell-off in May, leading to the first official correction since the rally began in March 2009. Although the market's malaise continued through June, stocks saw solid gains in July. For the year, the Dow rose 17.28%, while the S&P 500® Index was up 13.84%. Elsewhere, the technology-laden Nasdaq Composite® Index returned 14.99%. Small- and mid-cap stocks performed best, as measured by the 18.43% increase of the Russell 2000® Index and the 23.21% gain of the Russell Midcap® Index.
Comments from Charles Myers, Portfolio Manager of Fidelity Advisor Small Cap Value Fund: For the year, the fund's Class A, Class T, Class B and Class C shares rose 21.16%, 20.87%, 20.22% and 20.11%, respectively (excluding sales charges), compared with 20.11% for the benchmark Russell 2000 Value Index. Security selection in financials helped, especially banks and real estate stocks, although my diversified financials holdings didn't do well. Stock picking in consumer staples - especially food/staples retailing - as well as energy and materials also were notable positives, while consumer discretionary hurt. On an individual security basis, the fund's top contributors included Carpenter Technology, a specialty metals manufacturer, and real estate stocks Alexandria Real Estate Equities and Jones Lang LaSalle. Oil and gas company Mariner Energy also helped. I sold my stake shortly after the company agreed to be acquired for a premium price. In contrast, auto-industry challenges hurt DealerTrack Holdings, a car-dealer software and services provider, and Penske Automotive Group, a dealership chain I sold before period end. Utility RRI Energy, another stock I sold, also detracted. Many of the names I've mentioned were not in the index.
The views expressed above reflect those of the portfolio manager(s) only through the end of the period as stated on the cover of this report and do not necessarily represent the views of Fidelity or any other person in the Fidelity organization. Any such views are subject to change at any time based upon market or other conditions and Fidelity disclaims any responsibility to update such views. These views may not be relied on as investment advice and, because investment decisions for a Fidelity fund are based on numerous factors, may not be relied on as an indication of trading intent on behalf of any Fidelity fund.
Annual Report
Shareholder Expense Example
As a shareholder of the Fund, you incur two types of costs: (1) transaction costs, including sales charges (loads) on purchase payments or redemption proceeds, redemption fees, and (2) ongoing costs, including management fees, distribution and/or service (12b-1) fees and other Fund expenses. This Example is intended to help you understand your ongoing costs (in dollars) of investing in the Fund and to compare these costs with the ongoing costs of investing in other mutual funds.
The Example is based on an investment of $1,000 invested at the beginning of the period and held for the entire period (February 1, 2010 to July 31, 2010).
Actual Expenses
The first line of the accompanying table for each class of the Fund provides information about actual account values and actual expenses. You may use the information in this line, together with the amount you invested, to estimate the expenses that you paid over the period. Simply divide your account value by $1,000.00 (for example, an $8,600 account value divided by $1,000.00 = 8.6), then multiply the result by the number in the first line for a class of the Fund under the heading entitled "Expenses Paid During Period" to estimate the expenses you paid on your account during this period. A small balance maintenance fee of $12.00 that is charged once a year may apply for certain accounts with a value of less than $2,000. This fee is not included in the table below. If it was, the estimate of expenses you paid during the period would be higher, and your ending account value lower, by this amount. In addition, the Fund, as a shareholder in the underlying Fidelity Central Funds, will indirectly bear its pro-rata share of the fees and expenses incurred by the underlying Fidelity Central Funds. These fees and expenses are not included in the Fund's annualized expense ratio used to calculate the expense estimate in the table below.
Hypothetical Example for Comparison Purposes
The second line of the accompanying table for each class of the Fund provides information about hypothetical account values and hypothetical expenses based on a Class' actual expense ratio and an assumed rate of return of 5% per year before expenses, which is not the Class' actual return. The hypothetical account values and expenses may not be used to estimate the actual ending account balance or expenses you paid for the period. You may use this information to compare the ongoing costs of investing in the Fund and other funds. To do so, compare this 5% hypothetical example with the 5% hypothetical examples that appear in the shareholder reports of the other funds. A small balance maintenance fee of $12.00 that is charged once a year may apply for certain accounts with a value of less than $2,000. This fee is not included in the table below. If it was, the estimate of expenses you paid during the period would be higher, and your ending account value lower, by this amount. In addition, the Fund, as a shareholder in the underlying Fidelity Central Funds, will indirectly bear its pro-rata share of the fees and expenses incurred by the underlying Fidelity Central Funds. These fees and expenses are not included in the Fund's annualized expense ratio used to calculate the expense estimate in the table below.
Please note that the expenses shown in the table are meant to highlight your ongoing costs only and do not reflect any transaction costs. Therefore, the second line of the table is useful in comparing ongoing costs only, and will not help you determine the relative total costs of owning different funds. In addition, if these transactional costs were included, your costs would have been higher.
Annual Report
| Annualized
Expense
Ratio | Beginning
Account Value
February 1, 2010 | Ending
Account Value
July 31, 2010 | Expenses Paid
During Period*
February 1, 2010 to
July 31, 2010 |
Class A | 1.40% | | | |
Actual | | $ 1,000.00 | $ 1,070.90 | $ 7.19 |
HypotheticalA | | $ 1,000.00 | $ 1,017.85 | $ 7.00 |
Class T | 1.65% | | | |
Actual | | $ 1,000.00 | $ 1,069.80 | $ 8.47 |
HypotheticalA | | $ 1,000.00 | $ 1,016.61 | $ 8.25 |
Class B | 2.15% | | | |
Actual | | $ 1,000.00 | $ 1,066.90 | $ 11.02 |
HypotheticalA | | $ 1,000.00 | $ 1,014.13 | $ 10.74 |
Class C | 2.15% | | | |
Actual | | $ 1,000.00 | $ 1,066.00 | $ 11.01 |
HypotheticalA | | $ 1,000.00 | $ 1,014.13 | $ 10.74 |
Small Cap Value | 1.16% | | | |
Actual | | $ 1,000.00 | $ 1,071.90 | $ 5.96 |
HypotheticalA | | $ 1,000.00 | $ 1,019.04 | $ 5.81 |
Class F | .90% | | | |
Actual | | $ 1,000.00 | $ 1,073.50 | $ 4.63 |
HypotheticalA | | $ 1,000.00 | $ 1,020.33 | $ 4.51 |
Institutional Class | 1.12% | | | |
Actual | | $ 1,000.00 | $ 1,072.70 | $ 5.76 |
HypotheticalA | | $ 1,000.00 | $ 1,019.24 | $ 5.61 |
A 5% return per year before expenses
* Expenses are equal to each Class' annualized expense ratio, multiplied by the average account value over the period, multiplied by 181/365 (to reflect the one-half year period).
Annual Report
Investment Changes (Unaudited)
Top Ten Stocks as of July 31, 2010 |
| % of fund's
net assets | % of fund's net assets
6 months ago |
Platinum Underwriters Holdings Ltd. | 3.1 | 2.8 |
WESCO International, Inc. | 3.1 | 3.0 |
Superior Energy Services, Inc. | 3.0 | 2.7 |
BJ's Wholesale Club, Inc. | 3.0 | 2.4 |
Alexandria Real Estate Equities, Inc. | 2.8 | 2.8 |
Berry Petroleum Co. Class A | 2.7 | 0.0 |
Astoria Financial Corp. | 2.7 | 3.4 |
HNI Corp. | 2.6 | 2.6 |
UGI Corp. | 2.5 | 0.0 |
TCF Financial Corp. | 2.5 | 2.2 |
| 28.0 | |
Top Five Market Sectors as of July 31, 2010 |
| % of fund's
net assets | % of fund's net assets
6 months ago |
Financials | 37.8 | 35.7 |
Industrials | 12.8 | 13.5 |
Consumer Discretionary | 11.5 | 11.3 |
Information Technology | 8.3 | 9.9 |
Utilities | 6.4 | 4.8 |
Asset Allocation (% of fund's net assets) |
As of July 31, 2010* | As of January 31, 2010** |
| Stocks 99.2% | | | Stocks 99.5% | |
| Short-Term
Investments and
Net Other Assets 0.8% | | | Short-Term
Investments and
Net Other Assets 0.5% | |
* Foreign investments | 10.5% | | ** Foreign investments | 9.6% | |

Annual Report
Investments July 31, 2010
Showing Percentage of Net Assets
Common Stocks - 97.8% |
| Shares | | Value |
CONSUMER DISCRETIONARY - 10.9% |
Diversified Consumer Services - 3.0% |
Matthews International Corp. Class A | 640,187 | | $ 23,117,153 |
Regis Corp. (d) | 2,745,882 | | 41,819,783 |
| | 64,936,936 |
Household Durables - 5.1% |
M.D.C. Holdings, Inc. | 1,224,300 | | 35,651,616 |
Meritage Homes Corp. (a) | 1,536,160 | | 27,005,693 |
Ryland Group, Inc. | 2,153,837 | | 35,150,620 |
Tempur-Pedic International, Inc. (a) | 400,000 | | 12,268,000 |
| | 110,075,929 |
Specialty Retail - 1.8% |
Asbury Automotive Group, Inc. (a) | 1,465,159 | | 19,721,040 |
Tsutsumi Jewelry Co. Ltd. | 791,400 | | 18,405,716 |
| | 38,126,756 |
Textiles, Apparel & Luxury Goods - 1.0% |
Iconix Brand Group, Inc. (a) | 1,330,087 | | 21,893,232 |
TOTAL CONSUMER DISCRETIONARY | | 235,032,853 |
CONSUMER STAPLES - 4.7% |
Food & Staples Retailing - 3.6% |
BJ's Wholesale Club, Inc. (a) | 1,390,000 | | 63,314,500 |
Ingles Markets, Inc. Class A | 838,531 | | 13,634,514 |
| | 76,949,014 |
Food Products - 1.1% |
Chiquita Brands International, Inc. (a)(d) | 1,600,000 | | 23,488,000 |
TOTAL CONSUMER STAPLES | | 100,437,014 |
ENERGY - 5.7% |
Energy Equipment & Services - 3.0% |
Superior Energy Services, Inc. (a) | 2,841,700 | | 64,762,343 |
Oil, Gas & Consumable Fuels - 2.7% |
Berry Petroleum Co. Class A | 1,950,000 | | 58,149,000 |
TOTAL ENERGY | | 122,911,343 |
FINANCIALS - 37.0% |
Capital Markets - 2.8% |
optionsXpress Holdings, Inc. (a) | 2,055,000 | | 32,058,000 |
Common Stocks - continued |
| Shares | | Value |
FINANCIALS - continued |
Capital Markets - continued |
TradeStation Group, Inc. (a)(e) | 2,062,291 | | $ 13,178,039 |
Waddell & Reed Financial, Inc. Class A | 640,000 | | 15,251,200 |
| | 60,487,239 |
Commercial Banks - 11.8% |
Associated Banc-Corp. | 3,687,610 | | 50,114,620 |
CapitalSource, Inc. | 6,405,000 | | 34,458,900 |
City National Corp. | 784,900 | | 44,480,283 |
National Penn Bancshares, Inc. | 2,775,154 | | 18,482,526 |
PacWest Bancorp (e) | 1,794,200 | | 37,552,606 |
TCF Financial Corp. (d) | 3,385,800 | | 53,631,072 |
Western Liberty Bancorp (a)(e) | 2,400,000 | | 14,976,000 |
| | 253,696,007 |
Insurance - 7.3% |
Alterra Capital Holdings Ltd. | 2,057,411 | | 39,810,903 |
Aspen Insurance Holdings Ltd. | 1,820,200 | | 49,782,470 |
Platinum Underwriters Holdings Ltd. | 1,696,975 | | 66,317,783 |
| | 155,911,156 |
Real Estate Investment Trusts - 8.4% |
Alexandria Real Estate Equities, Inc. (d) | 848,300 | | 59,847,565 |
DCT Industrial Trust, Inc. | 10,000,000 | | 46,900,000 |
Highwoods Properties, Inc. (SBI) | 1,470,330 | | 46,036,032 |
National Retail Properties, Inc. (d) | 1,140,000 | | 26,356,800 |
| | 179,140,397 |
Real Estate Management & Development - 1.9% |
Jones Lang LaSalle, Inc. | 538,628 | | 41,722,125 |
Thrifts & Mortgage Finance - 4.8% |
Astoria Financial Corp. | 4,318,152 | | 57,172,332 |
Washington Federal, Inc. | 2,616,175 | | 45,521,445 |
| | 102,693,777 |
TOTAL FINANCIALS | | 793,650,701 |
HEALTH CARE - 6.3% |
Health Care Providers & Services - 6.3% |
Centene Corp. (a) | 972,542 | | 20,724,870 |
Chemed Corp. | 510,200 | | 26,999,784 |
MEDNAX, Inc. (a) | 721,500 | | 34,018,725 |
Providence Service Corp. (a)(e) | 1,016,495 | | 14,637,528 |
Common Stocks - continued |
| Shares | | Value |
HEALTH CARE - continued |
Health Care Providers & Services - continued |
Team Health Holdings, Inc. | 2,146,700 | | $ 28,143,237 |
VCA Antech, Inc. (a) | 518,000 | | 10,795,120 |
| | 135,319,264 |
INDUSTRIALS - 12.8% |
Commercial Services & Supplies - 7.0% |
ACCO Brands Corp. (a)(e) | 3,720,923 | | 22,027,864 |
HNI Corp. (d) | 2,149,671 | | 55,547,499 |
Knoll, Inc. | 1,412,898 | | 19,822,959 |
United Stationers, Inc. (a) | 990,400 | | 53,630,160 |
| | 151,028,482 |
Machinery - 1.3% |
Blount International, Inc. (a)(e) | 2,604,723 | | 27,740,300 |
Trading Companies & Distributors - 4.5% |
H&E Equipment Services, Inc. (a)(e) | 3,489,408 | | 30,357,850 |
WESCO International, Inc. (a) | 1,825,000 | | 65,572,250 |
| | 95,930,100 |
TOTAL INDUSTRIALS | | 274,698,882 |
INFORMATION TECHNOLOGY - 8.3% |
Communications Equipment - 1.4% |
ViaSat, Inc. (a) | 809,472 | | 29,254,318 |
Electronic Equipment & Components - 4.0% |
Ingram Micro, Inc. Class A (a) | 2,253,100 | | 37,243,743 |
Macnica, Inc. | 677,400 | | 14,837,353 |
Ryoyo Electro Corp. (e) | 1,772,700 | | 18,932,046 |
SYNNEX Corp. (a) | 558,898 | | 14,749,318 |
| | 85,762,460 |
Internet Software & Services - 1.7% |
DealerTrack Holdings, Inc. (a) | 1,383,804 | | 21,601,180 |
j2 Global Communications, Inc. (a) | 630,149 | | 14,827,406 |
| | 36,428,586 |
Semiconductors & Semiconductor Equipment - 0.7% |
Miraial Co. Ltd. (e) | 570,200 | | 15,372,473 |
Software - 0.5% |
Monotype Imaging Holdings, Inc. (a) | 1,358,151 | | 11,299,816 |
TOTAL INFORMATION TECHNOLOGY | | 178,117,653 |
Common Stocks - continued |
| Shares | | Value |
MATERIALS - 5.0% |
Chemicals - 0.7% |
Spartech Corp. (a) | 1,387,702 | | $ 14,515,363 |
Metals & Mining - 4.3% |
Carpenter Technology Corp. | 1,284,380 | | 44,889,081 |
RTI International Metals, Inc. (a)(e) | 1,692,597 | | 48,035,903 |
| | 92,924,984 |
TOTAL MATERIALS | | 107,440,347 |
TELECOMMUNICATION SERVICES - 0.7% |
Diversified Telecommunication Services - 0.7% |
Cogent Communications Group, Inc. (a) | 1,665,000 | | 14,352,300 |
UTILITIES - 6.4% |
Electric Utilities - 2.2% |
Westar Energy, Inc. | 1,960,000 | | 46,804,800 |
Gas Utilities - 4.2% |
Southwest Gas Corp. | 1,130,989 | | 36,383,916 |
UGI Corp. | 2,000,000 | | 53,920,000 |
| | 90,303,916 |
TOTAL UTILITIES | | 137,108,716 |
TOTAL COMMON STOCKS (Cost $1,920,724,852) | 2,099,069,073 |
Nonconvertible Preferred Stocks - 1.4% |
| | | |
CONSUMER DISCRETIONARY - 0.6% |
Household Durables - 0.6% |
M/I Homes, Inc. Series A, 9.75% (a) | 734,300 | | 13,033,825 |
FINANCIALS - 0.8% |
Real Estate Investment Trusts - 0.8% |
Developers Diversified Realty Corp. (depositary shares) Series H, 7.375% | 818,790 | | 18,013,380 |
TOTAL NONCONVERTIBLE PREFERRED STOCKS (Cost $20,083,684) | 31,047,205 |
Money Market Funds - 3.5% |
| Shares | | Value |
Fidelity Cash Central Fund, 0.24% (b) | 15,579,695 | | $ 15,579,695 |
Fidelity Securities Lending Cash Central Fund, 0.27% (b)(c) | 59,928,075 | | 59,928,075 |
TOTAL MONEY MARKET FUNDS (Cost $75,507,770) | 75,507,770 |
TOTAL INVESTMENT PORTFOLIO - 102.7% (Cost $2,016,316,306) | | 2,205,624,048 |
NET OTHER ASSETS (LIABILITIES) - (2.7)% | | (58,464,582) |
NET ASSETS - 100% | $ 2,147,159,466 |
Legend |
(a) Non-income producing |
(b) Affiliated fund that is available only to investment companies and other accounts managed by Fidelity Investments. The rate quoted is the annualized seven-day yield of the fund at period end. A complete unaudited listing of the fund's holdings as of its most recent quarter end is available upon request. |
(c) Investment made with cash collateral received from securities on loan. |
(d) Security or a portion of the security is on loan at period end. |
(e) Affiliated company |
Affiliated Central Funds |
Information regarding fiscal year to date income earned by the Fund from investments in Fidelity Central Funds is as follows: |
Fund | Income earned |
Fidelity Cash Central Fund | $ 42,495 |
Fidelity Securities Lending Cash Central Fund | 278,970 |
Total | $ 321,465 |
Other Affiliated Issuers |
An affiliated company is a company in which the fund has ownership of at least 5% of the voting securities. Fiscal year to date transactions with companies which are or were affiliates are as follows: |
Affiliates | Value,
beginning
of period | Purchases | Sales
Proceeds | Dividend
Income | Value,
end
of period |
ACCO Brands Corp. | $ 5,466,534 | $ 19,961,967 | $ - | $ - | $ 22,027,864 |
Blount International, Inc. | 17,199,578 | 8,372,649 | - | - | 27,740,300 |
Carpenter Technology Corp. | 48,582,409 | - | 42,768,155 | 1,546,654 | - |
H&E Equipment Services, Inc. | 17,823,149 | 19,092,190 | - | - | 30,357,850 |
HNI Corp. | 48,476,178 | 12,485,936 | 14,178,245 | 1,831,754 | - |
Miraial Co. Ltd. | 11,951,237 | - | - | 358,374 | 15,372,473 |
PacWest Bancorp | - | 33,511,723 | - | 55,188 | 37,552,606 |
Providence Service Corp. | 5,488,479 | 7,744,742 | - | - | 14,637,528 |
RTI International Metals, Inc. | - | 61,889,471 | 24,610,646 | - | 48,035,903 |
Ryoyo Electro Corp. | 10,896,174 | 5,192,230 | - | 479,261 | 18,932,046 |
Spartech Corp. | 19,788,775 | 387,662 | 2,807,218 | - | - |
TradeStation Group, Inc. | 15,446,560 | - | - | - | 13,178,039 |
WESCO International, Inc. | 45,676,500 | 7,269,797 | 10,057,750 | - | - |
Western Liberty Bancorp | - | 23,351,352 | - | - | 14,976,000 |
Total | $ 246,795,573 | $ 199,259,719 | $ 94,422,014 | $ 4,271,231 | $ 242,810,609 |
Other Information |
The following is a summary of the inputs used, as of July 31, 2010, involving the Fund's assets and liabilities carried at fair value. The inputs or methodology used for valuing securities may not be an indication of the risk associated with investing in those securities. For more information on valuation inputs, and their aggregation into the levels used in the table below, please refer to the Security Valuation section in the accompanying Notes to Financial Statements. |
Valuation Inputs at Reporting Date: |
Description | Total | Level 1 | Level 2 | Level 3 |
Investments in Securities: | | | | |
Equities: | | | | |
Consumer Discretionary | $ 248,066,678 | $ 248,066,678 | $ - | $ - |
Consumer Staples | 100,437,014 | 100,437,014 | - | - |
Energy | 122,911,343 | 122,911,343 | - | - |
Financials | 811,664,081 | 796,688,081 | 14,976,000 | - |
Health Care | 135,319,264 | 135,319,264 | - | - |
Industrials | 274,698,882 | 274,698,882 | - | - |
Information Technology | 178,117,653 | 178,117,653 | - | - |
Materials | 107,440,347 | 107,440,347 | - | - |
Telecommunication Services | 14,352,300 | 14,352,300 | - | - |
Utilities | 137,108,716 | 137,108,716 | - | - |
Money Market Funds | 75,507,770 | 75,507,770 | - | - |
Total Investments in Securities: | $ 2,205,624,048 | $ 2,190,648,048 | $ 14,976,000 | $ - |
Distribution of investments by country of issue, as a percentage of total net assets, is as follows: (Unaudited) |
United States of America | 89.5% |
Bermuda | 7.3% |
Japan | 3.2% |
| 100.0% |
See accompanying notes which are an integral part of the financial statements.
Annual Report
Statement of Assets and Liabilities
| July 31, 2010 |
| | |
Assets | | |
Investment in securities, at value (including securities loaned of $58,391,724) - See accompanying schedule: Unaffiliated issuers (cost $1,688,193,871) | $ 1,887,305,669 | |
Fidelity Central Funds (cost $75,507,770) | 75,507,770 | |
Other affiliated issuers (cost $252,614,665) | 242,810,609 | |
Total Investments (cost $2,016,316,306) | | $ 2,205,624,048 |
Receivable for fund shares sold | | 4,429,744 |
Dividends receivable | | 1,263,751 |
Distributions receivable from Fidelity Central Funds | | 11,305 |
Receivable from investment adviser for expense reductions | | 4,703 |
Other receivables | | 78,788 |
Total assets | | 2,211,412,339 |
| | |
Liabilities | | |
Payable for investments purchased | $ 947,463 | |
Payable for fund shares redeemed | 1,282,259 | |
Accrued management fee | 1,466,676 | |
Distribution fees payable | 74,394 | |
Other affiliated payables | 496,956 | |
Other payables and accrued expenses | 57,050 | |
Collateral on securities loaned, at value | 59,928,075 | |
Total liabilities | | 64,252,873 |
| | |
Net Assets | | $ 2,147,159,466 |
Net Assets consist of: | | |
Paid in capital | | $ 1,944,622,631 |
Undistributed net investment income | | 5,209,766 |
Accumulated undistributed net realized gain (loss) on investments and foreign currency transactions | | 8,011,200 |
Net unrealized appreciation (depreciation) on investments and assets and liabilities in foreign currencies | | 189,315,869 |
Net Assets | | $ 2,147,159,466 |
See accompanying notes which are an integral part of the financial statements.
Annual Report
Financial Statements - continued
Statement of Assets and Liabilities - continued
| July 31, 2010 |
| | |
Calculation of Maximum Offering Price
Class A:
Net Asset Value and redemption price per share ($96,993,684 ÷ 7,213,042 shares) | | $ 13.45 |
| | |
Maximum offering price per share (100/94.25 of $13.45) | | $ 14.27 |
Class T:
Net Asset Value and redemption price per share ($44,090,912 ÷ 3,306,403 shares) | | $ 13.34 |
| | |
Maximum offering price per share (100/96.50 of $13.34) | | $ 13.82 |
Class B:
Net Asset Value and offering price per share ($9,746,855 ÷ 745,164 shares)A | | $ 13.08 |
| | |
Class C:
Net Asset Value and offering price per share ($37,345,521 ÷ 2,854,186 shares)A | | $ 13.08 |
| | |
| | |
Small Cap Value:
Net Asset Value, offering price and redemption price per share ($1,770,674,882 ÷ 130,574,752 shares) | | $ 13.56 |
| | |
Class F:
Net Asset Value, offering price and redemption price per share ($109,867,616 ÷ 8,090,051 shares) | | $ 13.58 |
| | |
Institutional Class:
Net Asset Value, offering price and redemption price per share ($78,439,996 ÷ 5,777,920 shares) | | $ 13.58 |
A Redemption price per share is equal to net asset value less any applicable contingent deferred sales charge.
See accompanying notes which are an integral part of the financial statements.
Annual Report
Statement of Operations
| Year ended July 31, 2010 |
| | |
Investment Income | | |
Dividends (including $4,271,231 earned from other affiliated issuers) | | $ 24,688,740 |
Special dividends | | 5,143,528 |
Interest | | 18,401 |
Income from Fidelity Central Funds | | 321,465 |
Total income | | 30,172,134 |
| | |
Expenses | | |
Management fee
Basic fee | $ 13,665,863 | |
Performance adjustment | 2,744,643 | |
Transfer agent fees | 5,310,263 | |
Distribution fees | 751,876 | |
Accounting and security lending fees | 646,723 | |
Custodian fees and expenses | 45,637 | |
Independent trustees' compensation | 10,825 | |
Registration fees | 153,912 | |
Audit | 56,974 | |
Legal | 7,506 | |
Interest | 635 | |
Miscellaneous | 27,954 | |
Total expenses before reductions | 23,422,811 | |
Expense reductions | (213,251) | 23,209,560 |
Net investment income (loss) | | 6,962,574 |
Realized and Unrealized Gain (Loss) Net realized gain (loss) on: | | |
Investment securities: | | |
Unaffiliated issuers | 168,463,263 | |
Other affiliated issuers | 20,012,303 | |
Foreign currency transactions | 10,642 | |
Capital gain distributions from Fidelity Central Funds | 9,755 | |
Total net realized gain (loss) | | 188,495,963 |
Change in net unrealized appreciation (depreciation) on: Investment securities | 137,326,654 | |
Assets and liabilities in foreign currencies | 7,003 | |
Total change in net unrealized appreciation (depreciation) | | 137,333,657 |
Net gain (loss) | | 325,829,620 |
Net increase (decrease) in net assets resulting from operations | | $ 332,792,194 |
See accompanying notes which are an integral part of the financial statements.
Annual Report
Financial Statements - continued
Statement of Changes in Net Assets
| Year ended
July 31, 2010 | Year ended
July 31, 2009 |
Increase (Decrease) in Net Assets | | |
Operations | | |
Net investment income (loss) | $ 6,962,574 | $ 11,185,799 |
Net realized gain (loss) | 188,495,963 | (175,985,663) |
Change in net unrealized appreciation (depreciation) | 137,333,657 | 144,791,983 |
Net increase (decrease) in net assets resulting from operations | 332,792,194 | (20,007,881) |
Distributions to shareholders from net investment income | (6,560,137) | (8,301,273) |
Distributions to shareholders from net realized gain | - | (12,095,172) |
Total distributions | (6,560,137) | (20,396,445) |
Share transactions - net increase (decrease) | 209,101,603 | 392,456,300 |
Redemption fees | 534,282 | 448,503 |
Total increase (decrease) in net assets | 535,867,942 | 352,500,477 |
| | |
Net Assets | | |
Beginning of period | 1,611,291,524 | 1,258,791,047 |
End of period (including undistributed net investment income of $5,209,766 and undistributed net investment income of $5,059,582, respectively) | $ 2,147,159,466 | $ 1,611,291,524 |
See accompanying notes which are an integral part of the financial statements.
Annual Report
Financial Highlights - Class A
Years ended July 31, | 2010 | 2009 | 2008 | 2007 | 2006 |
Selected Per-Share Data | | | | | |
Net asset value, beginning of period | $ 11.13 | $ 11.82 | $ 14.34 | $ 13.17 | $ 12.80 |
Income from Investment Operations | | | | | |
Net investment income (loss) C | .02 F | .08 | (.01) | (.06) | (.03) |
Net realized and unrealized gain (loss) | 2.33 | (.60) | (1.98) | 1.90 | .74 |
Total from investment operations | 2.35 | (.52) | (1.99) | 1.84 | .71 |
Distributions from net investment income | (.03) | (.06) | - | - | - |
Distributions from net realized gain | - | (.11) | (.53) | (.67) | (.35) |
Total distributions | (.03) | (.17) | (.53) | (.67) | (.35) |
Redemption fees added to paid in capital C | - H | - H | - H | - H | .01 |
Net asset value, end of period | $ 13.45 | $ 11.13 | $ 11.82 | $ 14.34 | $ 13.17 |
Total Return A,B | 21.16% | (4.37)% | (14.35)% | 14.59% | 5.72% |
Ratios to Average Net Assets D,G | | | | | |
Expenses before reductions | 1.47% | 1.45% | 1.43% | 1.45% | 1.51% |
Expenses net of fee waivers, if any | 1.40% | 1.40% | 1.40% | 1.40% | 1.40% |
Expenses net of all reductions | 1.39% | 1.40% | 1.40% | 1.40% | 1.36% |
Net investment income (loss) | .17% F | .81% | (.05)% | (.44)% | (.24)% |
Supplemental Data | | | | | |
Net assets, end of period (000 omitted) | $ 96,994 | $ 55,029 | $ 52,446 | $ 61,357 | $ 39,931 |
Portfolio turnover rate E | 49% | 51% | 149% | 67% | 93% |
A Total returns would have been lower had certain expenses not been reduced during the periods shown.
B Total returns do not include the effect of the sales charges.
C Calculated based on average shares outstanding during the period.
D Fees and expenses of the underlying Fidelity Central Funds are not included in the Fund's expense ratio. The Fund indirectly bears its proportionate share of the expenses of any underlying Fidelity Central Funds.
E Amount does not include the portfolio activity of any underlying Fidelity Central Funds.
F Investment income per share reflects a special dividend which amounted to $.03 per share. Excluding the special dividend, the ratio of net investment income (loss) to average net assets would have been (.10)%.
G Expense ratios reflect operating expenses of the class. Expenses before reductions do not reflect amounts reimbursed by the investment adviser or reductions from brokerage service arrangements or reductions from other expense offset arrangements and do not represent the amount paid by the class during periods when reimbursements or reductions occur. Expenses net of fee waivers reflect expenses after reimbursement by the investment adviser but prior to reductions from brokerage service arrangements or other expense offset arrangements. Expenses net of all reductions represent the net expenses paid by the class.
H Amount represents less than $.01 per share.
See accompanying notes which are an integral part of the financial statements.
Annual Report
Financial Highlights - Class T
Years ended July 31, | 2010 | 2009 | 2008 | 2007 | 2006 |
Selected Per-Share Data | | | | | |
Net asset value, beginning of period | $ 11.05 | $ 11.74 | $ 14.28 | $ 13.13 | $ 12.78 |
Income from Investment Operations | | | | | |
Net investment income (loss) C | (.01) F | .05 | (.04) | (.10) | (.07) |
Net realized and unrealized gain (loss) | 2.31 | (.59) | (1.97) | 1.90 | .74 |
Total from investment operations | 2.30 | (.54) | (2.01) | 1.80 | .67 |
Distributions from net investment income | (.01) | (.04) | - | - | - |
Distributions from net realized gain | - | (.11) | (.53) | (.65) | (.33) |
Total distributions | (.01) | (.15) | (.53) | (.65) | (.33) |
Redemption fees added to paid in capital C | - H | - H | - H | - H | .01 |
Net asset value, end of period | $ 13.34 | $ 11.05 | $ 11.74 | $ 14.28 | $ 13.13 |
Total Return A,B | 20.87% | (4.57)% | (14.58)% | 14.34% | 5.47% |
Ratios to Average Net Assets D,G | | | | | |
Expenses before reductions | 1.72% | 1.70% | 1.68% | 1.66% | 1.67% |
Expenses net of fee waivers, if any | 1.65% | 1.65% | 1.65% | 1.65% | 1.65% |
Expenses net of all reductions | 1.64% | 1.65% | 1.65% | 1.65% | 1.61% |
Net investment income (loss) | (.08)% F | .56% | (.30)% | (.69)% | (.49)% |
Supplemental Data | | | | | |
Net assets, end of period (000 omitted) | $ 44,091 | $ 28,534 | $ 32,091 | $ 51,518 | $ 45,460 |
Portfolio turnover rate E | 49% | 51% | 149% | 67% | 93% |
A Total returns would have been lower had certain expenses not been reduced during the periods shown.
B Total returns do not include the effect of the sales charges.
C Calculated based on average shares outstanding during the period.
D Fees and expenses of the underlying Fidelity Central Funds are not included in the Fund's expense ratio. The Fund indirectly bears its proportionate share of the expenses of any underlying Fidelity Central Funds.
E Amount does not include the portfolio activity of any underlying Fidelity Central Funds.
F Investment income per share reflects a special dividend which amounted to $.03 per share. Excluding the special dividend, the ratio of net investment income (loss) to average net assets would have been (.35)%.
G Expense ratios reflect operating expenses of the class. Expenses before reductions do not reflect amounts reimbursed by the investment adviser or reductions from brokerage service arrangements or reductions from other expense offset arrangements and do not represent the amount paid by the class during periods when reimbursements or reductions occur. Expenses net of fee waivers reflect expenses after reimbursement by the investment adviser but prior to reductions from brokerage service arrangements or other expense offset arrangements. Expenses net of all reductions represent the net expenses paid by the class.
H Amount represents less than $.01 per share.
See accompanying notes which are an integral part of the financial statements.
Annual Report
Financial Highlights - Class B
Years ended July 31, | 2010 | 2009 | 2008 | 2007 | 2006 |
Selected Per-Share Data | | | | | |
Net asset value, beginning of period | $ 10.88 | $ 11.60 | $ 14.19 | $ 13.07 | $ 12.73 |
Income from Investment Operations | | | | | |
Net investment income (loss) C | (.07) F | .01 | (.10) | (.17) | (.13) |
Net realized and unrealized gain (loss) | 2.27 | (.59) | (1.96) | 1.90 | .74 |
Total from investment operations | 2.20 | (.58) | (2.06) | 1.73 | .61 |
Distributions from net investment income | - | (.03) | - | - | - |
Distributions from net realized gain | - | (.11) | (.53) | (.61) | (.28) |
Total distributions | - | (.14) | (.53) | (.61) | (.28) |
Redemption fees added to paid in capital C | - H | - H | - H | - H | .01 |
Net asset value, end of period | $ 13.08 | $ 10.88 | $ 11.60 | $ 14.19 | $ 13.07 |
Total Return A,B | 20.22% | (5.05)% | (15.04)% | 13.78% | 4.97% |
Ratios to Average Net Assets D,G | | | | | |
Expenses before reductions | 2.22% | 2.20% | 2.18% | 2.20% | 2.26% |
Expenses net of fee waivers, if any | 2.15% | 2.15% | 2.15% | 2.15% | 2.15% |
Expenses net of all reductions | 2.14% | 2.15% | 2.15% | 2.15% | 2.11% |
Net investment income (loss) | (.58)% F | .06% | (.80)% | (1.19)% | (.99)% |
Supplemental Data | | | | | |
Net assets, end of period (000 omitted) | $ 9,747 | $ 7,153 | $ 7,886 | $ 12,075 | $ 10,214 |
Portfolio turnover rate E | 49% | 51% | 149% | 67% | 93% |
A Total returns would have been lower had certain expenses not been reduced during the periods shown.
B Total returns do not include the effect of the contingent deferred sales charge.
C Calculated based on average shares outstanding during the period.
D Fees and expenses of the underlying Fidelity Central Funds are not included in the Fund's expense ratio. The Fund indirectly bears its proportionate share of the expenses of any underlying Fidelity Central Funds.
E Amount does not include the portfolio activity of any underlying Fidelity Central Funds.
F Investment income per share reflects a special dividend which amounted to $.03 per share. Excluding the special dividend, the ratio of net investment income (loss) to average net assets would have been (.85)%.
G Expense ratios reflect operating expenses of the class. Expenses before reductions do not reflect amounts reimbursed by the investment adviser or reductions from brokerage service arrangements or reductions from other expense offset arrangements and do not represent the amount paid by the class during periods when reimbursements or reductions occur. Expenses net of fee waivers reflect expenses after reimbursement by the investment adviser but prior to reductions from brokerage service arrangements or other expense offset arrangements. Expenses net of all reductions represent the net expenses paid by the class.
H Amount represents less than $.01 per share.
See accompanying notes which are an integral part of the financial statements.
Annual Report
Financial Highlights - Class C
Years ended July 31, | 2010 | 2009 | 2008 | 2007 | 2006 |
Selected Per-Share Data | | | | | |
Net asset value, beginning of period | $ 10.89 | $ 11.60 | $ 14.19 | $ 13.07 | $ 12.74 |
Income from Investment Operations | | | | | |
Net investment income (loss) C | (.07) F | .01 | (.10) | (.17) | (.13) |
Net realized and unrealized gain (loss) | 2.26 | (.58) | (1.96) | 1.90 | .74 |
Total from investment operations | 2.19 | (.57) | (2.06) | 1.73 | .61 |
Distributions from net investment income | - | (.03) | - | - | - |
Distributions from net realized gain | - | (.11) | (.53) | (.61) | (.29) |
Total distributions | - | (.14) | (.53) | (.61) | (.29) |
Redemption fees added to paid in capital C | - H | - H | - H | - H | .01 |
Net asset value, end of period | $ 13.08 | $ 10.89 | $ 11.60 | $ 14.19 | $ 13.07 |
Total Return A,B | 20.11% | (4.98)% | (15.04)% | 13.77% | 4.92% |
Ratios to Average Net Assets D,G | | | | | |
Expenses before reductions | 2.22% | 2.20% | 2.18% | 2.20% | 2.22% |
Expenses net of fee waivers, if any | 2.15% | 2.15% | 2.15% | 2.15% | 2.15% |
Expenses net of all reductions | 2.14% | 2.15% | 2.15% | 2.15% | 2.11% |
Net investment income (loss) | (.58)% F | .06% | (.80)% | (1.19)% | (.99)% |
Supplemental Data | | | | | |
Net assets, end of period (000 omitted) | $ 37,346 | $ 21,345 | $ 20,924 | $ 34,155 | $ 26,791 |
Portfolio turnover rate E | 49% | 51% | 149% | 67% | 93% |
A Total returns would have been lower had certain expenses not been reduced during the periods shown.
B Total returns do not include the effect of the contingent deferred sales charge.
C Calculated based on average shares outstanding during the period.
D Fees and expenses of the underlying Fidelity Central Funds are not included in the Fund's expense ratio. The Fund indirectly bears its proportionate share of the expenses of any underlying Fidelity Central Funds.
E Amount does not include the portfolio activity of any underlying Fidelity Central Funds.
F Investment income per share reflects a special dividend which amounted to $.03 per share. Excluding the special dividend, the ratio of net investment income (loss) to average net assets would have been (.85)%.
G Expense ratios reflect operating expenses of the class. Expenses before reductions do not reflect amounts reimbursed by the investment adviser or reductions from brokerage service arrangements or reductions from other expense offset arrangements and do not represent the amount paid by the class during periods when reimbursements or reductions occur. Expenses net of fee waivers reflect expenses after reimbursement by the investment adviser but prior to reductions from brokerage service arrangements or other expense offset arrangements. Expenses net of all reductions represent the net expenses paid by the class.
H Amount represents less than $.01 per share.
See accompanying notes which are an integral part of the financial statements.
Annual Report
Financial Highlights - Small Cap Value
Years ended July 31, | 2010 | 2009 | 2008 | 2007 | 2006 |
Selected Per-Share Data | | | | | |
Net asset value, beginning of period | $ 11.22 | $ 11.91 | $ 14.43 | $ 13.22 | $ 12.83 |
Income from Investment Operations | | | | | |
Net investment income (loss) B | .05 E | .10 | .03 | (.02) | .01 |
Net realized and unrealized gain (loss) | 2.34 | (.60) | (1.99) | 1.91 | .74 |
Total from investment operations | 2.39 | (.50) | (1.96) | 1.89 | .75 |
Distributions from net investment income | (.05) | (.08) | - | - | (.01) |
Distributions from net realized gain | - | (.11) | (.56) | (.68) | (.36) |
Total distributions | (.05) | (.19) | (.56) | (.68) | (.37) |
Redemption fees added to paid in capital B | - G | - G | - G | - G | .01 |
Net asset value, end of period | $ 13.56 | $ 11.22 | $ 11.91 | $ 14.43 | $ 13.22 |
Total Return A | 21.32% | (4.15)% | (14.10)% | 14.96% | 6.07% |
Ratios to Average Net Assets C,F | | | | |
Expenses before reductions | 1.18% | 1.20% | 1.14% | 1.11% | 1.09% |
Expenses net of fee waivers, if any | 1.18% | 1.20% | 1.14% | 1.11% | 1.09% |
Expenses net of all reductions | 1.17% | 1.20% | 1.13% | 1.11% | 1.06% |
Net investment income (loss) | .39% E | 1.01% | .22% | (.15)% | .06% |
Supplemental Data | | | | | |
Net assets, end of period (000 omitted) | $ 1,770,675 | $ 1,488,736 | $ 1,136,860 | $ 1,233,808 | $ 957,720 |
Portfolio turnover rate D | 49% | 51% | 149% | 67% | 93% |
A Total returns would have been lower had certain expenses not been reduced during the periods shown.
B Calculated based on average shares outstanding during the period.
C Fees and expenses of the underlying Fidelity Central Funds are not included in the Fund's expense ratio. The Fund indirectly bears its proportionate share of the expenses of any underlying Fidelity Central Funds.
D Amount does not include the portfolio activity of any underlying Fidelity Central Funds.
E Investment income per share reflects a special dividend which amounted to $.03 per share. Excluding the special dividend, the ratio of net investment income (loss) to average net assets would have been .12%.
F Expense ratios reflect operating expenses of the class. Expenses before reductions do not reflect amounts reimbursed by the investment adviser or reductions from brokerage service arrangements or reductions from other expense offset arrangements and do not represent the amount paid by the class during periods when reimbursements or reductions occur. Expenses net of fee waivers reflect expenses after reimbursement by the investment adviser but prior to reductions from brokerage service arrangements or other expense offset arrangements. Expenses net of all reductions represent the net expenses paid by the class.
G Amount represents less than $.01 per share.
See accompanying notes which are an integral part of the financial statements.
Annual Report
Financial Highlights - Class F
Years ended July 31, | 2010 | 2009 I |
Selected Per-Share Data | | |
Net asset value, beginning of period | $ 11.22 | $ 10.27 |
Income from Investment Operations | | |
Net investment income (loss) D | .09 G | .01 |
Net realized and unrealized gain (loss) | 2.34 | .94 H |
Total from investment operations | 2.43 | .95 |
Distributions from net investment income | (.07) | - |
Redemption fees added to paid in capital D,K | - | - |
Net asset value, end of period | $ 13.58 | $ 11.22 |
Total Return B,C | 21.69% | 9.25% |
Ratios to Average Net Assets E,J | | |
Expenses before reductions | .90% | .86% A |
Expenses net of fee waivers, if any | .90% | .86% A |
Expenses net of all reductions | .89% | .86% A |
Net investment income (loss) | .67% G | .64% A |
Supplemental Data | | |
Net assets, end of period (000 omitted) | $ 109,868 | $ 159 |
Portfolio turnover rate F | 49% | 51% |
A Annualized
B Total returns for periods of less than one year are not annualized.
C Total returns would have been lower had certain expenses not been reduced during the periods shown.
D Calculated based on average shares outstanding during the period.
E Fees and expenses of the underlying Fidelity Central Funds are not included in the Fund's expense ratio. The Fund indirectly bears its proportionate share of the expenses of any underlying Fidelity Central Funds.
F Amount does not include the portfolio activity of any underlying Fidelity Central Funds.
G Investment income per share reflects a special dividend which amounted to $.03 per share. Excluding the special dividend, the ratio of net investment income (loss) to average net assets would have been .40%.
H The amount shown for a share outstanding does not correspond with the aggregate net gain (loss) on investments for the period due to the timing of sales and repurchases of shares in relation to fluctuating market values of the investments of the Fund.
I For the period June 26, 2009 (commencement of sale of shares) to July 31, 2009.
J Expense ratios reflect operating expenses of the class. Expenses before reductions do not reflect amounts reimbursed by the investment adviser or reductions from brokerage service arrangements or reductions from other expense offset arrangements and do not represent the amount paid by the class during periods when reimbursements or reductions occur. Expense ratios before reductions for start-up periods may not be representative of longer-term operating periods. Expenses net of fee waivers reflect expenses after reimbursement by the investment adviser but prior to reductions from brokerage service arrangements or other expense offset arrangements. Expenses net of all reductions represent the net expenses paid by the class.
K Amount represents less than $.01 per share.
See accompanying notes which are an integral part of the financial statements.
Annual Report
Financial Highlights - Institutional Class
Years ended July 31, | 2010 | 2009 | 2008 | 2007 | 2006 |
Selected Per-Share Data | | | | | |
Net asset value, beginning of period | $ 11.24 | $ 11.91 | $ 14.43 | $ 13.22 | $ 12.83 |
Income from Investment Operations | | | | | |
Net investment income (loss) B | .06 E | .10 | .03 | (.02) | .01 |
Net realized and unrealized gain (loss) | 2.34 | (.59) | (1.99) | 1.91 | .74 |
Total from investment operations | 2.40 | (.49) | (1.96) | 1.89 | .75 |
Distributions from net investment income | (.06) | (.07) | - | - | (.01) |
Distributions from net realized gain | - | (.11) | (.56) | (.68) | (.36) |
Total distributions | (.06) | (.18) | (.56) | (.68) | (.37) |
Redemption fees added to paid in capital B | - G | - G | - G | - G | .01 |
Net asset value, end of period | $ 13.58 | $ 11.24 | $ 11.91 | $ 14.43 | $ 13.22 |
Total Return A | 21.42% | (4.04)% | (14.10)% | 14.99% | 6.08% |
Ratios to Average Net Assets C,F | | | | | |
Expenses before reductions | 1.12% | 1.20% | 1.13% | 1.10% | 1.08% |
Expenses net of fee waivers, if any | 1.12% | 1.15% | 1.13% | 1.10% | 1.08% |
Expenses net of all reductions | 1.12% | 1.15% | 1.13% | 1.10% | 1.05% |
Net investment income (loss) | .45% E | 1.06% | .22% | (.13)% | .08% |
Supplemental Data | | | | | |
Net assets, end of period (000 omitted) | $ 78,440 | $ 10,336 | $ 8,584 | $ 11,594 | $ 9,422 |
Portfolio turnover rate D | 49% | 51% | 149% | 67% | 93% |
A Total returns would have been lower had certain expenses not been reduced during the periods shown.
B Calculated based on average shares outstanding during the period.
C Fees and expenses of the underlying Fidelity Central Funds are not included in the Fund's expense ratio. The Fund indirectly bears its proportionate share of the expenses of any underlying Fidelity Central Funds.
D Amount does not include the portfolio activity of any underlying Fidelity Central Funds.
E Investment income per share reflects a special dividend which amounted to $.03 per share. Excluding the special dividend, the ratio of net investment income (loss) to average net assets would have been .18%.
F Expense ratios reflect operating expenses of the class. Expenses before reductions do not reflect amounts reimbursed by the investment adviser or reductions from brokerage service arrangements or reductions from other expense offset arrangements and do not represent the amount paid by the class during periods when reimbursements or reductions occur. Expenses net of fee waivers reflect expenses after reimbursement by the investment adviser but prior to reductions from brokerage service arrangements or other expense offset arrangements. Expenses net of all reductions represent the net expenses paid by the class.
G Amount represents less than $.01 per share.
See accompanying notes which are an integral part of the financial statements.
Annual Report
Notes to Financial Statements
For the period ended July 31, 2010
1. Organization.
Fidelity Small Cap Value Fund (the Fund) is a fund of Fidelity Securities Fund (the Trust) and is authorized to issue an unlimited number of shares. The Trust is registered under the Investment Company Act of 1940, as amended (the 1940 Act), as an open-end management investment company organized as a Massachusetts business trust. The Fund offers Class A, Class T, Class B, Class C, Small Cap Value, Class F and Institutional Class shares, each of which has equal rights as to assets and voting privileges. Effective after the close of business on September 1, 2010, Class B shares will be closed to new accounts and additional purchases by existing shareholders. Each class has exclusive voting rights with respect to matters that affect that class. Class F shares of the Fund are only available for purchase by mutual funds for which Fidelity Management & Research Company (FMR) or an affiliate serves as investment manager. Class B shares will automatically convert to Class A shares after a holding period of seven years from the initial date of purchase. Investment income, realized and unrealized capital gains and losses, the common expenses of the Fund, and certain fund-level expense reductions, if any, are allocated on a pro-rata basis to each class based on the relative net assets of each class to the total net assets of the Fund. Each class differs with respect to transfer agent and distribution and service plan fees incurred. Certain expense reductions also differ by class.
2. Investments in Fidelity Central Funds.
The Fund may invest in Fidelity Central Funds, which are open-end investment companies available only to other investment companies and accounts managed by Fidelity Management & Research Company (FMR) and its affiliates. The Fund's Schedule of Investments lists each of the Fidelity Central Funds held as of period end, if any, as an investment of the Fund, but does not include the underlying holdings of each Fidelity Central Fund. As an Investing Fund, the Fund indirectly bears its proportionate share of the expenses of the underlying Fidelity Central Funds.
The Money Market Central Funds seek preservation of capital and current income and are managed by Fidelity Investments Money Management, Inc. (FIMM), an affiliate of FMR.
A complete unaudited list of holdings for each Fidelity Central Fund is available upon request or at the Securities and Exchange Commission (the SEC) web site at www.sec.gov. In addition, the financial statements of the Fidelity Central Funds, which are not covered by the Fund's Report of Independent Registered Public Accounting Firm, are available on the SEC web site or upon request.
Annual Report
Notes to Financial Statements - continued
3. Significant Accounting Policies.
The financial statements have been prepared in conformity with accounting principles generally accepted in the United States of America (GAAP), which require management to make certain estimates and assumptions at the date of the financial statements. Actual results could differ from those estimates. The following summarizes the significant accounting policies of the Fund:
Security Valuation. Investments are valued as of 4:00 p.m. Eastern time on the last calendar day of the period. The Fund uses independent pricing services approved by the Board of Trustees to value its investments. When current market prices or quotations are not readily available or reliable, valuations may be determined in good faith in accordance with procedures adopted by the Board of Trustees. Factors used in determining value may include market or security specific events. The frequency with which these procedures are used cannot be predicted and they may be utilized to a significant extent. The value used for net asset value (NAV) calculation under these procedures may differ from published prices for the same securities.
The Fund categorizes the inputs to valuation techniques used to value its investments into a disclosure hierarchy consisting of three levels as shown below.
Level 1 - quoted prices in active markets for identical investments
Level 2 - other significant observable inputs (including quoted prices for similar investments, interest rates, prepayment speeds, etc.)
Level 3 - unobservable inputs (including the fund's own assumptions based on the best information available)
Changes in valuation techniques may result in transfers in or out of an assigned level within the disclosure hierarchy. The aggregate value of investments by input level, as of July 31, 2010, is included at the end of the Fund's Schedule of Investments. Valuation techniques used to value the Fund's investments by major category are as follows.
Equity securities, including restricted securities, for which market quotations are readily available, are valued at the last reported sale price or official closing price as reported by an independent pricing service on the primary market or exchange on which they are traded and are categorized as Level 1 in the hierarchy. In the event there were no sales during the day or closing prices are not available, securities are valued at the last quoted bid price or may be valued using the last available price and are generally categorized as Level 2 in the hierarchy. For foreign equity securities, when significant market or security specific events arise, comparisons to the valuation of American Depositary Receipts (ADRs), futures contracts, Exchange-traded funds (ETFs) and certain indexes as well as
Annual Report
3. Significant Accounting Policies - continued
Security Valuation - continued
quoted prices for similar securities are used and are categorized as Level 2 in the hierarchy in these circumstances. Utilizing these techniques may result in transfers between Level 1 and Level 2. For restricted equity securities and private placements where observable inputs are limited, assumptions about market activity and risk are used and are categorized as Level 3 in the hierarchy.
Investments in open-end mutual funds, including the Fidelity Central Funds, are valued at their closing net asset value each business day and are categorized as Level 1 in the hierarchy. Short-term securities with remaining maturities of sixty days or less for which quotations are not readily available are valued at amortized cost, which approximates fair value and are categorized as Level 2 in the hierarchy.
Foreign Currency. The Fund uses foreign currency contracts to facilitate transactions in foreign-denominated securities. Gains and losses from these transactions may arise from changes in the value of the foreign currency or if the counterparties do not perform under the contracts' terms.
Foreign-denominated assets, including investment securities, and liabilities are translated into U.S. dollars at the exchange rate at period end. Purchases and sales of investment securities, income and dividends received and expenses denominated in foreign currencies are translated into U.S. dollars at the exchange rate in effect on the transaction date.
The effects of exchange rate fluctuations on investments are included with the net realized and unrealized gain (loss) on investment securities. Other foreign currency transactions resulting in realized and unrealized gain (loss) are disclosed separately.
Investment Transactions and Income. For financial reporting purposes, the Fund's investment holdings and NAV include trades executed through the end of the last business day of the period. The NAV per share for processing shareholder transactions is calculated as of the close of business of the New York Stock Exchange (NYSE), normally 4:00 p.m. Eastern time and includes trades executed through the end of the prior business day. Gains and losses on securities sold are determined on the basis of identified cost and may include proceeds received from litigation. Dividend income is recorded on the ex-dividend date, except for certain dividends from foreign securities where the ex-dividend date may have passed, which are recorded as soon as the Fund is informed of the ex-dividend date. Non-cash dividends included in dividend income, if any, are recorded at the fair market value of the securities received. Distributions received on securities that represent a return of capital or capital gain are recorded as a reduction of cost of investments and/or as a realized gain. The Fund estimates the components of
Annual Report
Notes to Financial Statements - continued
3. Significant Accounting Policies - continued
Investment Transactions and Income - continued
distributions received that may be considered return of capital distributions or capital gain distributions. Large, non-recurring dividends recognized by the Fund are presented separately on the Statement of Operations as "Special Dividends" and the impact of these dividends is presented in the Financial Highlights. Interest income and distributions from the Fidelity Central Funds are accrued as earned. Interest income includes coupon interest and amortization of premium and accretion of discount on debt securities. Investment income is recorded net of foreign taxes withheld where recovery of such taxes is uncertain.
Expenses. Most expenses of the Trust can be directly attributed to a fund. Expenses which cannot be directly attributed are apportioned amongst each fund in the Trust. Expense estimates are accrued in the period to which they relate and adjustments are made when actual amounts are known.
Income Tax Information and Distributions to Shareholders. Each year the Fund intends to qualify as a regulated investment company, including distributing substantially all of its taxable income and realized gains under Subchapter M of the Internal Revenue Code and filing its U.S. federal tax return. As a result, no provision for income taxes is required. As of July 31, 2010, the Fund did not have any unrecognized tax benefits in the accompanying financial statements. A fund's federal tax return is subject to examination by the Internal Revenue Service (IRS) for a period of three years. Foreign taxes are provided for based on the Fund's understanding of the tax rules and rates that exist in the foreign markets in which it invests.
Distributions are recorded on the ex-dividend date. Income dividends and capital gain distributions are declared separately for each class. Income and capital gain distributions are determined in accordance with income tax regulations, which may differ from GAAP. In addition, the Fund claimed a portion of the payment made to redeeming shareholders as a distribution for income tax purposes.
Capital accounts within the financial statements are adjusted for permanent book-tax differences. These adjustments have no impact on net assets or the results of operations. Temporary book-tax differences will reverse in a subsequent period.
Book-tax differences are primarily due to the short-term gain distributions from the Fidelity Central Funds, foreign currency transactions, market discount, capital loss carryforwards and losses deferred due to wash sales and excise tax regulations.
Annual Report
3. Significant Accounting Policies - continued
Income Tax Information and Distributions to Shareholders - continued
The federal tax cost of investment securities and unrealized appreciation (depreciation) as of period end were as follows:
Gross unrealized appreciation | $ 346,140,241 |
Gross unrealized depreciation | (160,277,473) |
Net unrealized appreciation (depreciation) | $ 185,862,768 |
| |
Tax Cost | $ 2,019,761,280 |
The tax-based components of distributable earnings as of period end were as follows:
Undistributed ordinary income | $ 5,209,766 |
Undistributed long-term capital gain | $ 11,456,174 |
Net unrealized appreciation (depreciation) | $ 185,870,895 |
The tax character of distributions paid was as follows:
| July 31, 2010 | July 31, 2009 |
Ordinary Income | $ 6,560,137 | $ 8,301,273 |
Long-term Capital Gains | - | 12,095,172 |
Total | $ 6,560,137 | $ 20,396,445 |
Short-Term Trading (Redemption) Fees. Shares held in the Fund less than 90 days are subject to a redemption fee equal to 1.50% of the proceeds of the redeemed shares. All redemption fees, including any estimated redemption fees paid by FMR, are retained by the Fund and accounted for as an addition to paid in capital.
4. Purchases and Sales of Investments.
Purchases and sales of securities, other than short-term securities, aggregated $1,124,184,474 and $918,879,120, respectively.
5. Fees and Other Transactions with Affiliates.
Management Fee. FMR and its affiliates provide the Fund with investment management related services for which the Fund pays a monthly management fee. The management fee is the sum of an individual fund fee rate that is based on an annual rate of .45% of the Fund's average net assets and a group fee rate that averaged .26% during the period. The group fee rate is based upon the average net assets of all the mutual funds advised by FMR. The group fee rate decreases as assets under management increase and
Annual Report
Notes to Financial Statements - continued
5. Fees and Other Transactions with Affiliates - continued
Management Fee - continued
increases as assets under management decrease. In addition, the management fee is subject to a performance adjustment (up to a maximum of ±.20% of the Fund's average net assets over a 36 month performance period). The upward or downward adjustment to the management fee is based on the relative investment performance of the retail class of the Fund, Small Cap Value as compared to an appropriate benchmark index. For the period, the total annual management fee rate, including the performance adjustment, was .85% of the Fund's average net assets.
Distribution and Service Plan. In accordance with Rule 12b-1 of the 1940 Act, the Fund has adopted separate Distribution and Service Plans for each class of shares. Certain classes pay Fidelity Distributors Corporation (FDC), an affiliate of FMR, separate Distribution and Service Fees, each of which is based on an annual percentage of each class' average net assets. In addition, FDC may pay financial intermediaries for selling shares of the Fund and providing shareholder support services. For the period, the Distribution and Service Fee rates and the total amounts paid to and retained by FDC were as follows:
| Distribution
Fee | Service
Fee | Paid to
FDC | Retained
by FDC |
Class A | -% | .25% | $ 191,085 | $ 8,941 |
Class T | .25% | .25% | 179,850 | - |
Class B | .75% | .25% | 86,355 | 64,822 |
Class C | .75% | .25% | 294,586 | 80,570 |
| | | $ 751,876 | $ 154,333 |
Sales Load. FDC receives a front-end sales charge of up to 5.75% for selling Class A shares, and 3.50% for selling Class T shares, some of which is paid to financial intermediaries for selling shares of the Fund. FDC receives the proceeds of contingent deferred sales charges levied on Class A, Class T, Class B, and Class C redemptions. These charges depend on the holding period. The deferred sales charges range from 5% to 1% for Class B, 1% for Class C, 1.00% for certain purchases of Class A shares (1.00% to .50% prior to July 12, 2010) and .25% for certain purchases of Class T shares.
Annual Report
5. Fees and Other Transactions with Affiliates - continued
Sales Load - continued
For the period, sales charge amounts retained by FDC were as follows:
| Retained
by FDC |
Class A | $ 48,522 |
Class T | 8,611 |
Class B* | 21,775 |
Class C* | 3,135 |
| $ 82,043 |
* When Class B and Class C shares are initially sold, FDC pays commissions from its own resources to financial intermediaries through which the sales are made.
Transfer Agent Fees. Fidelity Investments Institutional Operations Company, Inc. (FIIOC), an affiliate of FMR, is the transfer, dividend disbursing and shareholder servicing agent for each class of the Fund. FIIOC receives account fees and asset-based fees that vary according to the account size and type of account of the shareholders of respective classes of the Fund, except for Class F. FIIOC receives no fees for providing transfer agency services to Class F. FIIOC pays for typesetting, printing and mailing of shareholder reports, except proxy statements. For the period, the total transfer agent fees paid by each class were as follows:
| Amount | % of
Average
Net Assets |
Class A | $ 243,601 | .32 |
Class T | 116,575 | .32 |
Class B | 27,836 | .32 |
Class C | 94,179 | .32 |
Small Cap Value | 4,734,141 | .28 |
Institutional Class | 93,931 | .22 |
| $ 5,310,263 | |
Accounting and Security Lending Fees. Fidelity Service Company, Inc. (FSC), an affiliate of FMR, maintains the Fund's accounting records. The accounting fee is based on the level of average net assets for the month. Under a separate contract, FSC administers the security lending program. The security lending fee is based on the number and duration of lending transactions.
Annual Report
Notes to Financial Statements - continued
5. Fees and Other Transactions with Affiliates - continued
Brokerage Commissions. The Fund placed a portion of its portfolio transactions with brokerage firms which are affiliates of the investment adviser. The commissions paid to these affiliated firms were $17,973 for the period.
Interfund Lending Program. Pursuant to an Exemptive Order issued by the SEC, the Fund, along with other registered investment companies having management contracts with FMR, may participate in an interfund lending program. This program provides an alternative credit facility allowing the funds to borrow from, or lend money to, other participating affiliated funds. At period end, there were no interfund loans outstanding. The Fund's activity in this program during the period for which loans were outstanding was as follows:
Borrower or Lender | Average Daily
Loan Balance | Weighted Average
Interest Rate | Interest
Expense |
Borrower | $ 7,401,500 | .39% | $ 635 |
6. Committed Line of Credit.
The Fund participates with other funds managed by FMR in a $3.75 billion credit facility (the "line of credit") to be utilized for temporary or emergency purposes to fund shareholder redemptions or for other short-term liquidity purposes. The Fund has agreed to pay commitment fees on its pro-rata portion of the line of credit, which amounted to $7,433 and is reflected in Miscellaneous expenses on the Statement of Operations. During the period, there were no borrowings on this line of credit.
7. Security Lending.
The Fund lends portfolio securities from time to time in order to earn additional income. On the settlement date of the loan, the Fund receives collateral (in the form of U.S. Treasury obligations, letters of credit and/or cash) against the loaned securities and maintains collateral in an amount not less than 100% of the market value of the loaned securities during the period of the loan. The market value of the loaned securities is determined at the close of business of the Fund and any additional required collateral is delivered to the Fund on the next business day. If the borrower defaults on its obligation to return the securities loaned because of insolvency or other reasons, a fund could experience delays and costs in recovering the securities loaned or in gaining access to the collateral. Any cash collateral received is invested in the Fidelity Securities Lending Cash Central Fund. The value of loaned securities and cash collateral at period end are disclosed on the Fund's Statement of Assets and Liabilities. Security lending income represents the income earned on investing cash collateral, less fees and expenses
Annual Report
7. Security Lending - continued
associated with the loan, plus any premium payments that may be received on the loan of certain types of securities. Security lending income is presented in the Statement of Operations as a component of income from Fidelity Central Funds. Net income from lending portfolio securities during the period amounted to $278,970.
8. Expense Reductions.
FMR voluntarily agreed to reimburse each class to the extent annual operating expenses exceeded certain levels of average net assets as noted in the table below. Some expenses, for example interest expense, including commitment fees, are excluded from this reimbursement.
The following classes were in reimbursement during the period:
| Expense
Limitations | Reimbursement
from adviser |
Class A | 1.40% | $ 52,534 |
Class T | 1.65% | 26,830 |
Class B | 2.15% | 6,293 |
Class C | 2.15% | 20,630 |
| | $ 106,287 |
Effective October 1, 2010 the expense limitations will be eliminated.
Many of the brokers with whom FMR places trades on behalf of the Fund provided services to the Fund in addition to trade execution. These services included payments of certain expenses on behalf of the Fund totaling $106,964 for the period.
9. Distributions to Shareholders.
Distributions to shareholders of each class were as follows:
Years ended July 31, | 2010 | 2009 |
From net investment income | | |
Class A | $ 159,193 | $ 252,162 |
Class T | 36,920 | 111,704 |
Class B | - | 20,177 |
Class C | - | 45,207 |
Small Cap Value | 6,230,380 | 7,822,387 |
Class F | 28,266 | - |
Institutional Class | 105,378 | 49,636 |
Total | $ 6,560,137 | $ 8,301,273 |
Annual Report
Notes to Financial Statements - continued
9. Distributions to Shareholders - continued
Distributions to shareholders of each class were as follows: - continued
Years ended July 31, | 2010 | 2009 |
From net realized gain | | |
Class A | $ - | $ 496,925 |
Class T | - | 350,121 |
Class B | - | 77,046 |
Class C | - | 207,577 |
Small Cap Value | - | 10,883,170 |
Institutional Class | - | 80,333 |
Total | $ - | $ 12,095,172 |
10. Share Transactions.
Transactions for each class of shares were as follows:
| Shares | Dollars |
Years ended July 31, | 2010 | 2009A | 2010 | 2009A |
Class A | | | | |
Shares sold | 4,231,111 | 2,028,986 | $ 54,936,600 | $ 19,478,233 |
Reinvestment of distributions | 12,276 | 64,970 | 146,358 | 694,477 |
Shares redeemed | (1,973,236) | (1,588,437) | (25,421,999) | (14,658,645) |
Net increase (decrease) | 2,270,151 | 505,519 | $ 29,660,959 | $ 5,514,065 |
Class T | | | | |
Shares sold | 1,449,265 | 1,489,054 | $ 18,793,141 | $ 15,806,614 |
Reinvestment of distributions | 3,030 | 40,641 | 35,906 | 449,360 |
Shares redeemed | (727,616) | (1,680,727) | (9,211,959) | (14,685,646) |
Net increase (decrease) | 724,679 | (151,032) | $ 9,617,088 | $ 1,570,328 |
Class B | | | | |
Shares sold | 262,419 | 305,827 | $ 3,340,905 | $ 3,051,319 |
Reinvestment of distributions | - | 7,759 | - | 85,943 |
Shares redeemed | (174,554) | (335,978) | (2,189,700) | (2,971,686) |
Net increase (decrease) | 87,865 | (22,392) | $ 1,151,205 | $ 165,576 |
Class C | | | | |
Shares sold | 1,327,692 | 832,906 | $ 17,060,657 | $ 7,981,000 |
Reinvestment of distributions | - | 19,410 | - | 217,621 |
Shares redeemed | (434,251) | (694,752) | (5,448,332) | (6,287,773) |
Net increase (decrease) | 893,441 | 157,564 | $ 11,612,325 | $ 1,910,848 |
Annual Report
10. Share Transactions - continued
Transactions for each class of shares were as follows: - continued
| Shares | Dollars |
Years ended July 31, | 2010 | 2009A | 2010 | 2009A |
Small Cap Value | | | | |
Shares sold | 45,122,251 | 61,277,579 | $ 585,925,779 | $ 600,357,815 |
Reinvestment of distributions | 507,903 | 1,741,583 | 6,101,827 | 18,397,974 |
Shares redeemed | (47,781,912) | (25,782,005) | (605,149,428) | (237,589,067) |
Net increase (decrease) | (2,151,758) | 37,237,157 | $ (13,121,822) | $ 381,166,722 |
Class F | | | | |
Shares sold | 8,411,513 | 14,205 | $ 109,778,609 | $ 144,857 |
Reinvestment of distributions | 2,350 | - | 28,266 | - |
Shares redeemed | (337,999) | (18) | (4,618,215) | (181) |
Net increase (decrease) | 8,075,864 | 14,187 | $ 105,188,660 | $ 144,676 |
Institutional Class | | | | |
Shares sold | 5,522,070 | 479,087 | $ 73,692,691 | $ 4,626,811 |
Reinvestment of distributions | 7,512 | 8,812 | 90,344 | 93,632 |
Shares redeemed | (671,565) | (288,597) | (8,789,847) | (2,736,358) |
Net increase (decrease) | 4,858,017 | 199,302 | $ 64,993,188 | $ 1,984,085 |
A Share transactions for Class F are for the period June 26, 2009 (commencement of sale of shares) to July 31, 2009.
11. Other.
The Fund's organizational documents provide former and current trustees and officers with a limited indemnification against liabilities arising in connection with the performance of their duties to the Fund. In the normal course of business, the Fund may also enter into contracts that provide general indemnifications. The Fund's maximum exposure under these arrangements is unknown as this would be dependent on future claims that may be made against the Fund. The risk of material loss from such claims is considered remote.
At the end of the period, the Fidelity Freedom Funds and the Fidelity Freedom K Funds were the owners of record, in the aggregate, of approximately 38% of the total outstanding shares of the Fund.
Annual Report
To the Trustees of Fidelity Securities Fund and the Shareholders of Fidelity Small Cap Value Fund:
In our opinion, the accompanying statement of assets and liabilities, including the schedule of investments, and the related statements of operations and of changes in net assets and the financial highlights present fairly, in all material respects, the financial position of Fidelity Small Cap Value Fund (a fund of Fidelity Securities Fund) at July 31, 2010, the results of its operations for the year then ended, the changes in its net assets for each of the two years in the period then ended and the financial highlights for each of the periods indicated, in conformity with accounting principles generally accepted in the United States of America. These financial statements and financial highlights (hereafter referred to as "financial statements") are the responsibility of the Fidelity Small Cap Value Fund's management. Our responsibility is to express an opinion on these financial statements based on our audits. We conducted our audits of these financial statements in accordance with the standards of the Public Company Accounting Oversight Board (United States). Those standards require that we plan and perform the audit to obtain reasonable assurance about whether the financial statements are free of material misstatement. An audit includes examining, on a test basis, evidence supporting the amounts and disclosures in the financial statements, assessing the accounting principles used and significant estimates made by management, and evaluating the overall financial statement presentation. We believe that our audits, which included confirmation of securities at July 31, 2010 by correspondence with the custodian and brokers, provide a reasonable basis for our opinion.
/s/ PricewaterhouseCoopers LLP
PricewaterhouseCoopers LLP
Boston, Massachusetts
September 14, 2010
Annual Report
The Trustees, Member of the Advisory Board, and executive officers of the trust and fund, as applicable, are listed below. The Board of Trustees governs the fund and is responsible for protecting the interests of shareholders. The Trustees are experienced executives who meet periodically throughout the year to oversee the fund's activities, review contractual arrangements with companies that provide services to the fund, oversee management of the risks associated with such activities and contractual arrangements, and review the fund's performance. Except for James C. Curvey, each of the Trustees oversees 222 funds advised by FMR or an affiliate. Mr. Curvey oversees 411 funds advised by FMR or an affiliate.
The Trustees hold office without limit in time except that (a) any Trustee may resign; (b) any Trustee may be removed by written instrument, signed by at least two-thirds of the number of Trustees prior to such removal; (c) any Trustee who requests to be retired or who has become incapacitated by illness or injury may be retired by written instrument signed by a majority of the other Trustees; and (d) any Trustee may be removed at any special meeting of shareholders by a two-thirds vote of the outstanding voting securities of the trust. Each Trustee who is not an interested person (as defined in the 1940 Act) (Independent Trustee), shall retire not later than the last day of the calendar year in which his or her 72nd birthday occurs. The Independent Trustees may waive this mandatory retirement age policy with respect to individual Trustees. The executive officers and Advisory Board Member hold office without limit in time, except that any officer and Advisory Board Member may resign or may be removed by a vote of a majority of the Trustees at any regular meeting or any special meeting of the Trustees. Except as indicated, each individual has held the office shown or other offices in the same company for the past five years.
Experience, Skills, Attributes, and Qualifications of the Fund's Trustees. The Governance and Nominating Committee has adopted a statement of policy that describes the experience, qualifications, attributes, and skills that are necessary and desirable for potential Independent Trustee candidates (Statement of Policy). The Board believes that each Trustee satisfied at the time he or she was initially elected or appointed a Trustee, and continues to satisfy, the standards contemplated by the Statement of Policy. The Governance and Nominating Committee also engages professional search firms to help identify potential Independent Trustee candidates who have the experience, qualifications, attributes, and skills consistent with the Statement of Policy. From time to time, additional criteria based on the composition and skills of the current Independent Trustees, as well as experience or skills that may be appropriate in light of future changes to board composition, business conditions, and regulatory or other developments, have also been considered by the professional search firms and the Governance and Nominating Committee. In addition, the Board takes into account the Trustees' commitment and participation in Board and committee meetings, as well as their leadership of standing and ad hoc committees throughout their tenure.
In determining that a particular Trustee was and continues to be qualified to serve as a Trustee, the Board has considered a variety of criteria, none of which, in isolation, was controlling. The Board believes that, collectively, the Trustees have balanced and diverse experience, qualifications, attributes, and skills, which allow the Board to operate effectively in governing the fund and protecting the interests of shareholders. Information about the specific experience, skills, attributes, and qualifications of each Trustee, which in each case led to the Board's conclusion that the Trustee should serve (or continue to serve) as a trustee of the fund, is provided below.
Annual Report
Board Structure and Oversight Function. Edward C. Johnson 3d is an interested person (as defined in the 1940 Act) and currently serves as Chairman. The Trustees have determined that an interested Chairman is appropriate and benefits shareholders because an interested Chairman has a personal and professional stake in the quality and continuity of services provided to the fund. Independent Trustees exercise their informed business judgment to appoint an individual of their choosing to serve as Chairman, regardless of whether the Trustee happens to be independent or a member of management. The Independent Trustees have determined that they can act independently and effectively without having an Independent Trustee serve as Chairman and that a key structural component for assuring that they are in a position to do so is for the Independent Trustees to constitute a substantial majority for the Board. The Independent Trustees also regularly meet in executive session. Ned C. Lautenbach serves as Chairman of the Independent Trustees and as such (i) acts as a liaison between the Independent Trustees and management with respect to matters important to the Independent Trustees and (ii) with management prepares agendas for Board meetings.
Fidelity funds are overseen by different Boards of Trustees. The fund's Board oversees Fidelity's equity and high income funds and another Board oversees Fidelity's investment-grade bond, money market, and asset allocation funds. The asset allocation funds may invest in Fidelity funds overseen by the fund's Board. The use of separate Boards, each with its own committee structure, allows the Trustees of each group of Fidelity funds to focus on the unique issues of the funds they oversee, including common research, investment, and operational issues. On occasion, the separate Boards establish joint committees to address issues of overlapping consequences for the Fidelity funds overseen by each Board.
The Trustees operate using a system of committees to facilitate the timely and efficient consideration of all matters of importance to the Trustees, the fund, and fund shareholders and to facilitate compliance with legal and regulatory requirements and oversight of the fund's activities and associated risks. The Board, acting through its committees, has charged FMR and its affiliates with (i) identifying events or circumstances the occurrence of which could have demonstrably adverse effects on the fund's business and/or reputation; (ii) implementing processes and controls to lessen the possibility that such events or circumstances occur or to mitigate the effects of such events or circumstances if they do occur; and (iii) creating and maintaining a system designed to evaluate continuously business and market conditions in order to facilitate the identification and implementation processes described in (i) and (ii) above. Because the day-to-day operations and activities of the fund are carried out by or through FMR, its affiliates and other service providers, the fund's exposure to risks is mitigated but not eliminated by the processes overseen by the Trustees. While each of the Board's committees has responsibility for overseeing different aspects of the fund's activities, oversight is exercised primarily through the Operations, Audit, and Compliance Committees. Appropriate personnel, including but not limited to the fund's Chief Compliance Officer (CCO), FMR's internal auditor, the independent accountants, the fund's Treasurer and portfolio management personnel, make periodic reports to the Board's committees, as appropriate. The responsibilities of each committee, including their oversight responsibilities, are described further under "Standing Committees of the Fund's Trustees."
Annual Report
Trustees and Officers - continued
The fund's Statement of Additional Information (SAI) includes more information about the Trustees. To request a free copy, call Fidelity at 1-877-208-0098.
Interested Trustees*:
Correspondence intended for each Trustee who is an interested person may be sent to Fidelity Investments, 82 Devonshire Street, Boston, Massachusetts 02109.
Name, Age; Principal Occupations and Other Relevant Experience+ |
Edward C. Johnson 3d (80) |
| Year of Election or Appointment: 1984 Mr. Johnson is Trustee and Chairman of the Board of Trustees of certain Trusts. Mr. Johnson serves as Chief Executive Officer, Chairman, and a Director of FMR LLC; Chairman and a Director of FMR; Chairman and a Director of Fidelity Research & Analysis Company (FRAC); Chairman and a Director of Fidelity Investments Money Management, Inc.; and Chairman and a Director of FMR Co., Inc. In addition, Mr. Johnson serves as Chairman and Director of FIL Limited. Previously, Mr. Johnson served as President of FMR LLC (2006-2007). |
James C. Curvey (75) |
| Year of Election or Appointment: 2007 Mr. Curvey also serves as Trustee (2007-present) of other investment companies advised by FMR. Mr. Curvey is a Director of FMR and FMR Co., Inc. (2007-present). Mr. Curvey is also Vice Chairman (2006-present) and Director of FMR LLC. In addition, Mr. Curvey serves as an Overseer for the Boston Symphony Orchestra and a member of the Trustees of Villanova University. |
* Trustees have been determined to be "Interested Trustees" by virtue of, among other things, their affiliation with the trust or various entities under common control with FMR.
+ The information above includes each Trustee's principal occupation during the last five years and other information relating to the experience, attributes, and skills relevant to each Trustee's qualifications to serve as a Trustee, which led to the conclusion that each Trustee should serve as a Trustee for the fund.
Annual Report
Independent Trustees:
Correspondence intended for each Independent Trustee (that is, the Trustees other than the Interested Trustees) may be sent to Fidelity Investments, P.O. Box 55235, Boston, Massachusetts 02205-5235.
Name, Age; Principal Occupations and Other Relevant Experience+ |
Dennis J. Dirks (62) |
| Year of Election or Appointment: 2005 Prior to his retirement in May 2003, Mr. Dirks was Chief Operating Officer and a member of the Board of The Depository Trust & Clearing Corporation (DTCC). He also served as President, Chief Operating Officer, and Board member of The Depository Trust Company (DTC) and President and Board member of the National Securities Clearing Corporation (NSCC). In addition, Mr. Dirks served as Chief Executive Officer and Board member of the Government Securities Clearing Corporation, Chief Executive Officer and Board member of the Mortgage-Backed Securities Clearing Corporation, as a Trustee and a member of the Finance Committee of Manhattan College (2005-2008), and as a Trustee and a member of the Finance Committee of AHRC of Nassau County (2006-2008). Currently, Mr. Dirks serves as a member of the Board of Directors for The Brookville Center for Children's Services, Inc. (2009-present). |
Alan J. Lacy (56) |
| Year of Election or Appointment: 2008 Mr. Lacy serves as Senior Adviser (2007-present) of Oak Hill Capital Partners, L.P. (private equity). Mr. Lacy also served as Chief Executive Officer (2000-2005) and Vice Chairman (2005-2006) of Sears Holdings Corporation and Sears, Roebuck and Co. (retail). In addition, Mr. Lacy serves as a member of the Board of Directors of The Western Union Company (global money transfer, 2006-present) and Bristol-Myers Squibb Company (global pharmaceuticals, 2007-present). Mr. Lacy is Chairman (2008-present) and a member (2006-present) of the Board of Trustees of The National Parks Conservation Association. |
Ned C. Lautenbach (66) |
| Year of Election or Appointment: 2000 Mr. Lautenbach is Chairman of the Independent Trustees of the Equity and High Income Funds (2006-present). Mr. Lautenbach is an Advisory Partner of Clayton, Dubilier & Rice, Inc. (private equity investment, 2008-present) and was previously a Partner of Clayton, Dubilier & Rice, Inc. (1998-2008). Previously, Mr. Lautenbach was with the International Business Machines Corporation (IBM) from 1968 until his retirement in 1998. Mr. Lautenbach serves as a Director of Eaton Corporation (diversified industrial) as well as the Philharmonic Center for the Arts in Naples, Florida. Mr. Lautenbach is also a member of the Board of Trustees of Fairfield University (2005-present), as well as a member of the Council on Foreign Relations. Previously, Mr. Lautenbach served as a Director of Sony Corporation (2006-2007). |
Joseph Mauriello (65) |
| Year of Election or Appointment: 2008 Prior to his retirement in January 2006, Mr. Mauriello served in numerous senior management positions including Deputy Chairman and Chief Operating Officer (2004-2005), and Vice Chairman of Financial Services (2002-2004) of KPMG LLP US (professional services, 1965-2005). Mr. Mauriello currently serves as a member of the Board of Directors of XL Capital Ltd. (global insurance and re-insurance, 2006-present) and of Arcadia Resources Inc. (health care services and products, 2007-
present). Previously, Mr. Mauriello served as a Director of the Hamilton Funds of the Bank of New York (2006-2007). |
Cornelia M. Small (66) |
| Year of Election or Appointment: 2005 Ms. Small is a member of the Board of Directors of the Teagle Foundation (2009-present). Ms. Small is also a member of the Investment Committee, and Chair (2008-present) and a member of the Board of Trustees of Smith College. In addition, Ms. Small serves on the Investment Committee of the Berkshire Taconic Community Foundation (2008-present). Previously, Ms. Small served as Chairperson of the Investment Committee (2002-2008) of Smith College. In addition, Ms. Small served as Chief Investment Officer, Director of Global Equity Investments, and a member of the Board of Directors of Scudder, Stevens & Clark and Scudder Kemper Investments. |
William S. Stavropoulos (71) |
| Year of Election or Appointment: 2002 Mr. Stavropoulos is Vice Chairman of the Independent Trustees of the Equity and High Income Funds (2006-present). Mr. Stavropoulos serves as President and Founder of the Michigan Baseball Foundation, the Great Lakes Loons (2007-present). Mr. Stavropoulos is Chairman Emeritus of the Board of Directors of The Dow Chemical Company, where he previously served in numerous senior management positions, including President, CEO (1995-2000; 2002-2004), Chairman of the Executive Committee (2000-2006), and as a member of the Board of Directors (1990-2006). Currently, Mr. Stavropoulos is a Director of Teradata Corporation (data warehousing and technology solutions, 2008-present), Chemical Financial Corporation, Maersk Inc. (industrial conglomerate), Tyco International, Inc. (multinational manufacturing and services, 2007-present), and a member of the Advisory Board for Metalmark Capital (private equity investment, 2005-present). Mr. Stavropoulos is a special advisor to Clayton, Dubilier & Rice, Inc. (private equity investment). In addition, Mr. Stavropoulos is a member of the University of Notre Dame Advisory Council for the College of Science. |
David M. Thomas (61) |
| Year of Election or Appointment: 2008 Previously, Mr. Thomas served as Executive Chairman (2005-2006) and Chairman and Chief Executive Officer (2000-2005) of IMS Health, Inc. (pharmaceutical and healthcare information solutions). In addition, Mr. Thomas serves as a member of the Board of Directors of Fortune Brands, Inc. (consumer products), and Interpublic Group of Companies, Inc. (marketing communication, 2004-present). |
Michael E. Wiley (59) |
| Year of Election or Appointment: 2008 Mr. Wiley also serves as a Director of Asia Pacific Exploration Consolidated (international oil and gas exploration and production, 2008-present), and as a member of the Board of Trustees of the University of Tulsa (2000-2006; 2007-present). Mr. Wiley serves as a Director of Tesoro Corporation (independent oil refiner and marketer, 2005-present), and a Director of Bill Barrett Corporation (exploration and production, 2005-present). In addition, Mr. Wiley also serves as a Director of Post Oak Bank (privately-held bank, 2004-present). Previously, Mr. Wiley served as a Sr. Energy Advisor of Katzenbach Partners, LLC (consulting, 2006-2007), as an Advisory Director of Riverstone Holdings (private investment), Chairman, President, and CEO of Baker Hughes, Inc. (oilfield services, 2000-2004), and as Director of Spinnaker Exploration Company (exploration and production, 2001-2005). |
+ The information above includes each Trustee's principal occupation during the last five years and other information relating to the experience, attributes, and skills relevant to each Trustee's qualifications to serve as a Trustee, which led to the conclusion that each Trustee should serve as a Trustee for the fund.
Advisory Board Member and Executive Officers:
Correspondence intended for each executive officer and Peter S. Lynch may be sent to Fidelity Investments, 82 Devonshire Street, Boston, Massachusetts 02109.
Name, Age; Principal Occupation |
Peter S. Lynch (66) |
| Year of Election or Appointment: 2003 Member of the Advisory Board of Fidelity's Equity and High Income Funds. Mr. Lynch is Vice Chairman and a Director of FMR and FMR Co., Inc. In addition, Mr. Lynch serves as a Trustee of Boston College and as the Chairman of the Inner-City Scholarship Fund. Previously, Mr. Lynch served on the Special Olympics International Board of Directors (1997-2006). |
Kenneth B. Robins (40) |
| Year of Election or Appointment: 2008 President and Treasurer of Fidelity's Equity and High Income Funds. Mr. Robins also serves as President and Treasurer (2010-present) and Assistant Treasurer (2009-present) of other Fidelity funds and is an employee of Fidelity Investments (2004-present). Previously, Mr. Robins served as Deputy Treasurer of the Fidelity funds (2005-2008) and Treasurer and Chief Financial Officer of The North Carolina Capital Management Trust: Cash and Term Portfolios (2006-2008). |
Brian B. Hogan (45) |
| Year of Election or Appointment: 2009 Vice President of certain Equity Funds and Vice President of Sector Funds. Mr. Hogan also serves as Senior Vice President, Equity Research of FMR (2006-present) and President of FMR's Equity Division (2009-
present). Previously, Mr. Hogan served as a portfolio manager. |
Thomas C. Hense (46) |
| Year of Election or Appointment: 2008 or 2010 Vice President of Fidelity's High Income (2008), Small Cap (2008), and Value (2010) Funds. Previously, Mr. Hense served as a portfolio manager for Fidelity's Institutional Money Management Group (Pyramis) (2003-2008). |
Scott C. Goebel (42) |
| Year of Election or Appointment: 2008 Secretary and Chief Legal Officer (CLO) of the Fidelity funds. Mr. Goebel also serves as General Counsel, Secretary, and Senior Vice President of FMR (2008-present) and FMR Co., Inc. (2008-present); Deputy General Counsel of FMR LLC; Chief Legal Officer of Fidelity Management & Research (Hong Kong) Limited (2008-present) and Assistant Secretary of Fidelity Management & Research (Japan) Inc. (2008-present), Fidelity Investments Money Management, Inc. (2008-present), Fidelity Management & Research (U.K.) Inc. (2008-present), and Fidelity Research and Analysis Company (2008-present). Previously, Mr. Goebel served as Assistant Secretary of the Funds (2007-2008) and as Vice President and Secretary of Fidelity Distributors Corporation (FDC) (2005-2007). |
William C. Coffey (41) |
| Year of Election or Appointment: 2009 Assistant Secretary of Fidelity's Equity and High Income Funds. Mr. Coffey also serves as Senior Vice President and Deputy General Counsel of FMR LLC (2010-present), and is an employee of Fidelity Investments. Previously, Mr. Coffey served as Vice President and Associate General Counsel of FMR LLC (2005-2009). |
Holly C. Laurent (56) |
| Year of Election or Appointment: 2008 Anti-Money Laundering (AML) Officer of the Fidelity funds. Ms. Laurent is an employee of Fidelity Investments. Previously, Ms. Laurent was Senior Vice President and Head of Legal for Fidelity Business Services India Pvt. Ltd. (2006-2008), and Senior Vice President, Deputy General Counsel and Group Head for FMR LLC (2005-2006). |
Christine Reynolds (51) |
| Year of Election or Appointment: 2008 Chief Financial Officer of the Fidelity funds. Ms. Reynolds became President of Fidelity Pricing and Cash Management Services (FPCMS) in August 2008. Ms. Reynolds served as Chief Operating Officer of FPCMS (2007-2008). Previously, Ms. Reynolds served as President, Treasurer, and Anti-Money Laundering officer of the Fidelity funds (2004-2007). |
Kenneth A. Rathgeber (63) |
| Year of Election or Appointment: 2004 Chief Compliance Officer of Fidelity's Equity and High Income Funds. Mr. Rathgeber is Chief Compliance Officer of Fidelity Management & Research (Hong Kong) Limited (2008-present), Fidelity Management & Research (Japan) Inc. (2008-present), FMR (2005-present), FMR Co., Inc. (2005-present), Fidelity Management & Research (U.K.) Inc. (2005-present), Fidelity Research & Analysis Company (2005-present), Fidelity Investments Money Management, Inc. (2005-present), Pyramis Global Advisors, LLC (2005-present), and Strategic Advisers, Inc. (2005-present). |
Jeffrey S. Christian (48) |
| Year of Election or Appointment: 2009 Deputy Treasurer of the Fidelity funds. Mr. Christian is an employee of Fidelity Investments. Previously, Mr. Christian served as Chief Financial Officer (2008-2009) of certain Fidelity funds and Senior Vice President of Fidelity Pricing and Cash Management Services (FPCMS) (2004-2009). |
Bryan A. Mehrmann (49) |
| Year of Election or Appointment: 2005 Deputy Treasurer of the Fidelity funds. Mr. Mehrmann is an employee of Fidelity Investments. |
Adrien E. Deberghes (42) |
| Year of Election or Appointment: 2008 Deputy Treasurer of Fidelity's Equity and High Income Funds. Mr. Deberghes also serves as Assistant Treasurer of other Fidelity funds (2010-present) and is an employee of Fidelity Investments (2008-present). Previously, Mr. Deberghes served as Senior Vice President of Mutual Fund Administration at State Street Corporation (2007-
2008), Senior Director of Mutual Fund Administration at Investors Bank & Trust (2005-2007), and Director of Finance for Dunkin' Brands (2000-2005). |
Stephanie J. Dorsey (41) |
| Year of Election or Appointment: 2010 Assistant Treasurer of Fidelity's Equity and High Income Funds. Ms. Dorsey also serves as Deputy Treasurer of other Fidelity funds (2008-present) and is an employee of Fidelity Investments (2008-
present). Previously, Ms. Dorsey served as Treasurer (2004-2008) of the JPMorgan Mutual Funds and Vice President (2004-2008) of JPMorgan Chase Bank. |
John R. Hebble (52) |
| Year of Election or Appointment: 2009 Assistant Treasurer of Fidelity's Equity and High Income Funds. Mr. Hebble also serves as Treasurer and Chief Financial Officer of The North Carolina Capital Management Trust: Cash and Term Portfolio (2008-present), President and Treasurer of other Fidelity funds (2008-
present) and is an employee of Fidelity Investments. |
Gary W. Ryan (51) |
| Year of Election or Appointment: 2005 Assistant Treasurer of the Fidelity funds. Mr. Ryan is an employee of Fidelity Investments. Previously, Mr. Ryan served as Vice President of Fund Reporting in Fidelity Pricing and Cash Management Services (FPCMS) (1999-2005). |
Annual Report
The Board of Trustees of Fidelity Small Cap Value Fund voted to pay to shareholders of record at the opening of business on record date, the following distributions per share derived from capital gains realized from sales of portfolio securities, and dividends derived from net investment income:
| Pay Date | Record Date | Dividends | Capital Gains |
Class A | 09/09/10 | 09/08/10 | $0.022 | $0.066 |
Class T | 09/09/10 | 09/08/10 | $0.005 | $0.066 |
Class B | 09/09/10 | 09/08/10 | $- | $0.066 |
Class C | 09/09/10 | 09/08/10 | $- | $0.066 |
Class A and Class T designate 100% of the dividends distributed during the fiscal year as qualifying for the dividends-received deduction for corporate shareholders.
Class A and Class T designate 100% of the dividends distributed during the fiscal year as amounts which may be taken into account as a dividend for purposes of the maximum rate under section 1(h)(11) of the Internal Revenue Code.
The fund hereby designates as a capital gain dividend with respect to the taxable year ended July 31, 2010 $11,953,854, or, if subsequently determined to be different, the net capital gain of such year.
The fund will notify shareholders in January 2011 of amounts for use in preparing 2010 income tax returns.
Annual Report
Board Approval of Investment Advisory Contracts and Management Fees
Fidelity Small Cap Value Fund
Each year, the Board of Trustees, including the Independent Trustees (together, the Board), votes on the renewal of the management contract and sub-advisory agreements (together, the Advisory Contracts) for the fund. The Board, assisted by the advice of fund counsel and Independent Trustees' counsel, requests and considers a broad range of information relevant to the renewal of the Advisory Contracts throughout the year.
The Board meets regularly and considers at each of its meetings factors that are relevant to its annual consideration of the renewal of the fund's Advisory Contracts, including the services and support provided to the fund and its shareholders. The Board has established various standing committees, each composed of Independent Trustees with varying backgrounds, to which the Board has assigned specific subject matter responsibilities in order to enhance effective decision-making by the Board. The Board, acting directly and through its Committees, requests and receives information concerning the annual consideration of the renewal of the fund's Advisory Contracts. The Board also meets as needed to consider matters specifically related to the Board's annual consideration of the renewal of Advisory Contracts. Members of the Board may also meet with trustees of other Fidelity funds through ad hoc joint committees to discuss certain matters relevant to the Fidelity funds.
At its July 2010 meeting, the Board of Trustees, including the Independent Trustees, unanimously determined to renew the fund's Advisory Contracts. In reaching its determination, the Board considered all factors it believed relevant, including (i) the nature, extent, and quality of the services to be provided to the fund and its shareholders (including the investment performance of the fund); (ii) the competitiveness of the fund's management fee and total expenses; (iii) the total costs of the services to be provided by and the profits to be realized by Fidelity from its relationship with the fund; (iv) the extent to which economies of scale would be realized as the fund grows; and (v) whether fee levels reflect these economies of scale, if any, for the benefit of fund shareholders.
In considering whether to renew the Advisory Contracts for the fund, the Board reached a determination, with the assistance of fund counsel and Independent Trustees' counsel and through the exercise of its business judgment, that the renewal of the Advisory Contracts is in the best interests of fund shareholders and that the compensation to be received by Fidelity under the management contract is fair and reasonable. The Board's decision to renew the Advisory Contracts was not based on any single factor noted above, but rather was based on a comprehensive consideration of all the information provided to the Board at its meetings throughout the year. The Board, in reaching its determination to renew the Advisory Contracts, is aware that shareholders in the fund have a broad range of investment choices available to them, including a wide choice among mutual funds offered by Fidelity's competitors, and that the fund's shareholders, with the opportunity to review and weigh the disclosure provided by the fund in its prospectus and other public disclosures, have chosen to invest in this fund, managed by Fidelity.
Annual Report
Board Approval of Investment Advisory Contracts and
Management Fees - continued
Nature, Extent, and Quality of Services Provided. The Board considered the staffing within the investment adviser, FMR, and the sub-advisers (together, the Investment Advisers), including the backgrounds of the fund's investment personnel and the fund's investment objective and discipline. The Independent Trustees also had discussions with senior management of Fidelity's investment operations and investment groups. The Board considered the structure of the portfolio manager compensation program and whether this structure provides appropriate incentives to act in the best interest of the fund.
Resources Dedicated to Investment Management and Support Services. The Board and the equity research subcommittee of the Board's Fund Oversight Committee reviewed the size, education, and experience of the Investment Advisers' investment staff, their use of technology, and the Investment Advisers' approach to recruiting, training, and retaining portfolio managers and other research, advisory, and management personnel. The Board noted that Fidelity's analysts have access to a variety of technological tools and market and securities data that enable them to perform both fundamental and quantitative analysis and to specialize in various disciplines. The Board considered Fidelity's extensive global research capabilities that enable the Investment Advisers to aggregate data from various sources in an effort to produce positive investment results. The Board also considered that Fidelity's portfolio managers and analysts have access to daily portfolio attribution that allows for monitoring of a fund's portfolio, as well as an electronic communication system that provides immediate real-time access to research concerning issuers and credit enhancers. The Board noted FMR's continued focus on strengthening the organization and discipline of equity portfolio management and research.
Shareholder and Administrative Services. The Board considered (i) the nature, extent, quality, and cost of advisory, administrative, and shareholder services performed by the Investment Advisers and their affiliates under the Advisory Contracts and under separate agreements covering transfer agency, pricing and bookkeeping, and securities lending services for the fund; (ii) the nature and extent of the investment adviser's supervision of third party service providers, principally custodians and subcustodians; and (iii) the resources devoted to, and the record of compliance with, the fund's compliance policies and procedures. The Board also reviewed the allocation of fund brokerage, including allocations to brokers affiliated with the Investment Advisers, the use of brokerage commissions to pay fund expenses, and the use of "soft" commission dollars to pay for research services.
The Board noted that the growth of fund assets over time across the complex allows Fidelity to reinvest in the development of services designed to enhance the value or convenience of the Fidelity funds as investment vehicles. These services include 24-hour access to account information and market information through phone representatives and over the Internet, and investor education materials and asset allocation tools.
Annual Report
Investment in a Large Fund Family. The Board considered the benefits to shareholders of investing in a Fidelity fund, including the benefits of investing in a fund that is part of a large family of funds offering a variety of investment disciplines and providing a large variety of mutual fund investor services. The Board noted that Fidelity had taken, or had made recommendations that resulted in the Fidelity funds taking, a number of actions over the previous year that benefited particular funds, including (i) dedicating additional resources to investment research and restructuring and broadening the focus of the investment research teams; (ii) bolstering the senior management team that oversees asset management; (iii) launching Class F of certain funds as a lower-fee class available to Freedom K and Freedom Index Funds; (iv) lowering the initial investment minimums and ongoing balance requirements for Real Estate High Income Fund; (v) eliminating subsequent purchase minimums for all funds and adding a waiver of the investment minimum requirement for new accounts opened with the proceeds of a systematic withdrawal plan; (vi) eliminating the withdrawal minimum and maximum limits for systematic withdrawals from Advisor funds; (vii) expanding sales load waivers on Class A shares for Destiny Planholders and expanding Institutional Class eligibility for Class O Destiny Planholders; and (viii) changing certain Class A and Class T sales charge structures to further align them with industry practices.
Investment Performance. The Board considered whether the fund has operated in accordance with its investment objective, as well as its record of compliance with its investment restrictions. It also reviewed the fund's absolute investment performance for each class (except Class F), as well as the fund's relative investment performance for each class (except Class F) measured over multiple periods against (i) a broad-based securities market index, and (ii) a peer group of mutual funds deemed appropriate by Fidelity and reviewed by the Board. The following charts considered by the Board show, over the one-, three-, and five-year periods ended December 31, 2009, the cumulative total returns of Institutional Class (Class I) and Class B of the fund, the cumulative total returns of a broad-based securities market index ("benchmark"), and a range of cumulative total returns of a peer group of mutual funds identified by Morningstar, Inc. as having an investment style similar to that of the fund based on underlying portfolio holdings. The returns of Institutional Class (Class I) and Class B show the performance of the highest and lowest performing classes, respectively (based on five-year performance). (Class F had less than one year of performance as of December 31, 2009.) The box within each chart shows the 25th percentile return (bottom of box) and the 75th percentile return (top of box) of the peer group. Returns shown above the box are in the first quartile and returns shown below the box are in the fourth quartile. The percentage beaten numbers noted below each chart correspond to the percentile box and represent the percentage of funds in the peer group whose performance was equal to or lower than that of the class indicated.
Annual Report
Board Approval of Investment Advisory Contracts and
Management Fees - continued
Fidelity Small Cap Value Fund

The Board reviewed the fund's relative investment performance against its peer group and noted that the performance of Institutional Class (Class I) of the fund was in the first quartile for all the periods shown. The Board also noted that the investment performance of Institutional Class (Class I) of the fund compared favorably to its benchmark for all the periods shown. The Board considered that the variations in performance among the fund's classes reflect the variations in class expenses, which result in lower performance for higher expense classes. The Board also reviewed the fund's performance since inception as well as performance in the current year.
The Board also considered that the fund's management fee is subject to upward or downward adjustment depending upon whether, and to what extent, the fund's investment performance for the performance period exceeds, or is exceeded by, the record (over the same period) of a Board-approved performance adjustment index. The Board realizes that the performance adjustment provides FMR with a strong economic incentive to seek to achieve superior performance for the fund's shareholders and helps to more closely align the interests of FMR and the fund's shareholders.
Based on its review, and giving particular weight to the nature and quality of the resources dedicated by the Investment Advisers to maintain and improve relative performance and factoring in the unprecedented market events in recent years, the Board concluded that the nature, extent, and quality of investment management and support services and of shareholder and administrative services provided to the fund will benefit the fund's shareholders, particularly in light of the Board's view that the fund's shareholders benefit from investing in a fund that is part of a large family of funds offering a variety of investment disciplines and services.
Annual Report
Competitiveness of Management Fee and Total Fund Expenses. The Board considered the fund's management fee and total expenses compared to "mapped groups" of competitive funds and classes. Fidelity creates "mapped groups" by combining similar Lipper investment objective categories that have comparable management fee characteristics. Combining Lipper investment objective categories aids the Board's management fee and total expense comparisons by broadening the competitive group used for comparison and by reducing the number of universes to which various Fidelity funds are compared.
Management Fee. The Board considered two proprietary management fee comparisons for the 12-month periods shown in the chart below. The group of Lipper funds used by the Board for management fee comparisons is referred to below as the "Total Mapped Group." The Total Mapped Group comparison focuses on a fund's standing relative to the total universe of comparable funds available to investors, in terms of gross management fees before expense reimbursements or caps, and without giving effect to the fund's performance adjustment. "TMG %" represents the percentage of funds in the Total Mapped Group that had management fees that were lower than the fund's. For example, a TMG % of 13% means that 87% of the funds in the Total Mapped Group had higher management fees than the fund. The "Asset-Size Peer Group" (ASPG) comparison focuses on a fund's standing relative to non-Fidelity funds similar in size to the fund within the Total Mapped Group. The ASPG represents at least 15% of the funds in the Total Mapped Group with comparable asset size and management fee characteristics, subject to a minimum of 50 funds (or all funds in the Total Mapped Group if fewer than 50). Additional information, such as the ASPG quartile in which the fund's management fee ranked and the impact of the fund's performance adjustment, is also included in the chart and considered by the Board.
Annual Report
Board Approval of Investment Advisory Contracts and
Management Fees - continued
Fidelity Small Cap Value Fund
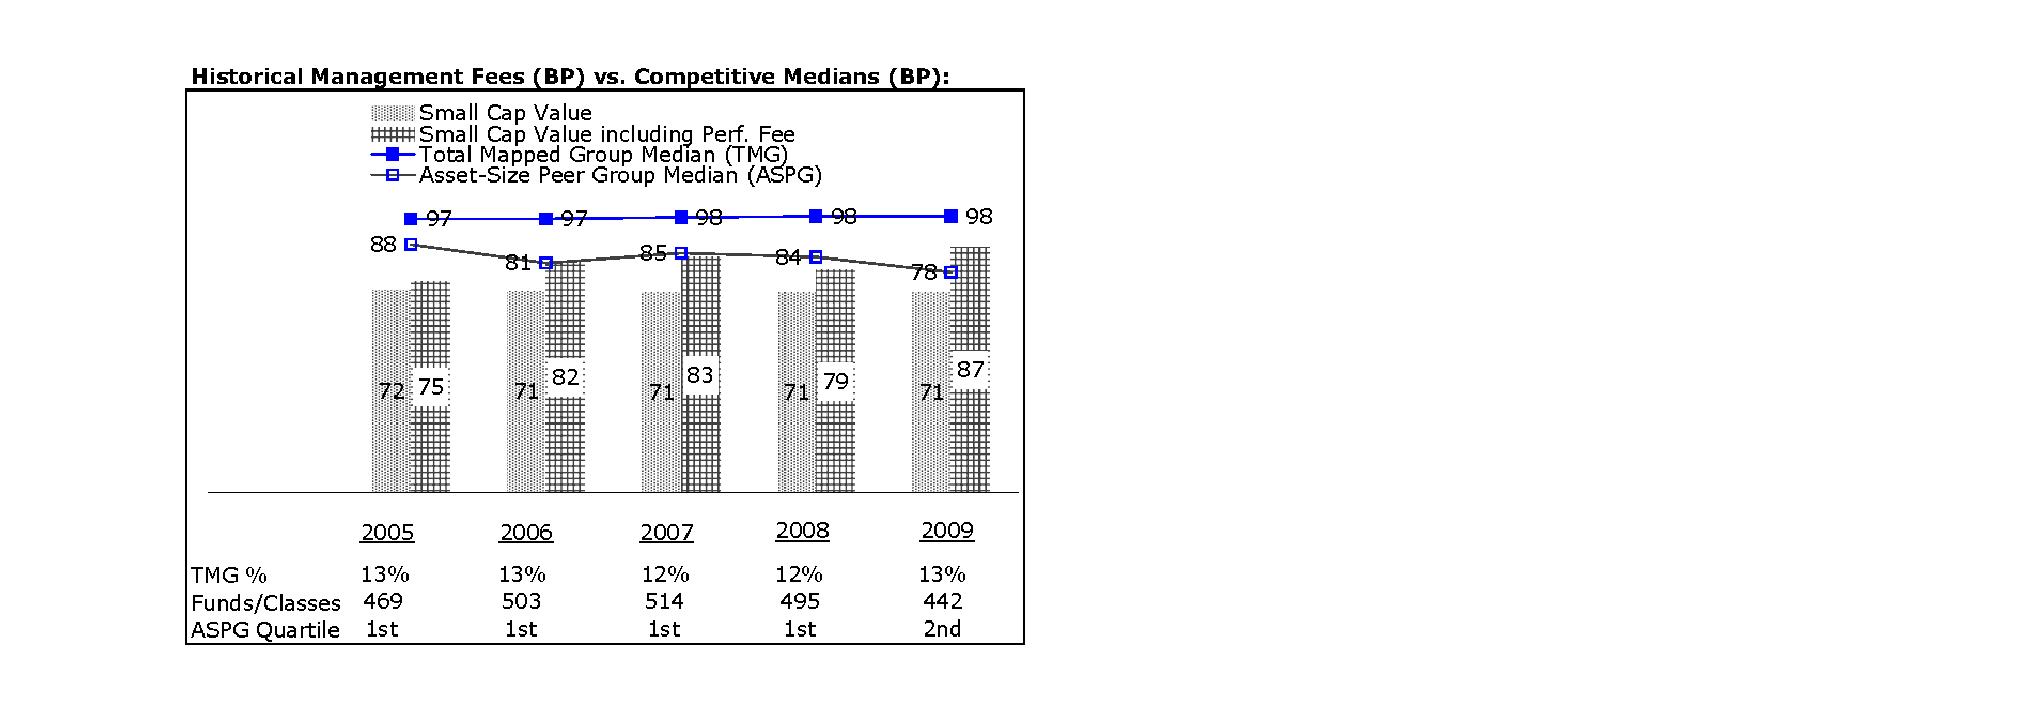
The Board noted that the fund's management fee ranked below the median of its Total Mapped Group and below the median of its ASPG for 2009. The Board also noted the effect of the fund's positive performance adjustment on the fund's management fee ranking. The Board noted that the performance adjustment for each year represents calculations for performance periods that differ from the periods shown in the performance charts above.
Based on its review, the Board concluded that the fund's management fee is fair and reasonable in light of the services that the fund receives and the other factors considered.
Total Expenses. In its review of each class's total expenses, the Board considered the fund's management fee as well as other fund or class expenses, as applicable, such as transfer agent fees, pricing and bookkeeping fees, fund-paid 12b-1 fees, and custodial, legal, and audit fees. The Board also noted the effects of any waivers and reimbursements on fees and expenses, as well as the impact of the fund's performance adjustment. As part of its review, the Board also considered current and historical total expenses of each class of the fund compared to competitive fund median expenses. Each class of the fund is compared to those funds and classes in the Total Mapped Group (used by the Board for management fee comparisons) that have a similar sales load structure.
The Board noted that the total expenses of each of Class A, Class B, the retail class, and Class F ranked below its competitive median for the period, the total expenses of each of Class C and Institutional Class ranked equal to its competitive median for the period, and the total expenses of Class T ranked above its competitive median for the period. The Board considered that the total expenses for Class T were above the median primarily because its 12b-1 fee is higher than the typical front-end load class. The Board noted that the fund offers multiple classes, each of which has a different sales load and 12b-1 fee structure, and that the multiple structures are intended to offer a range of pricing options for the intermediary market. The Board also noted that the total expenses of the classes vary primarily by the level of their 12b-1 fees, although differences in transfer agent fees may also cause expenses to vary from class to class.
Annual Report
Fees Charged to Other Fidelity Clients. The Board also considered Fidelity fee structures and other information with respect to clients of FMR and its affiliates, such as other mutual funds advised or subadvised by FMR or its affiliates, pension plan clients, and other institutional clients. In March 2010, the Board created an ad hoc joint committee with the board of other Fidelity funds (the Committee) to review and compare Fidelity's institutional investment advisory business with its business of providing services to the Fidelity funds, including the differences in services provided, fees charged, and costs incurred, as well as competition in their respective marketplaces.
Based on its review of total expenses and fees charged to other Fidelity clients, the Board concluded that the total expenses of each class of the fund were reasonable, although in one case above the median of the universe presented for comparison, in light of the services that the fund and its shareholders receive and the other factors considered, including the findings of the Committee.
Costs of the Services and Profitability. The Board considered the revenues earned and the expenses incurred by Fidelity in conducting the business of developing, marketing, distributing, managing, administering and servicing the fund and its shareholders. The Board also considered the level of Fidelity's profits in respect of all the Fidelity funds.
On an annual basis, FMR presents to the Board Fidelity's profitability for the fund. Fidelity calculates the profitability for each fund, as well as aggregate profitability for groups of Fidelity funds and all Fidelity funds, using a series of detailed revenue and cost allocation methodologies which originate with the audited books and records of Fidelity. The Audit Committee of the Board reviews any significant changes from the prior year's methodologies.
PricewaterhouseCoopers LLP (PwC), independent registered public accounting firm and auditor to Fidelity and certain Fidelity funds, has been engaged annually by the Board as part of the Board's assessment of Fidelity's profitability analysis. PwC's engagement includes the review and assessment of Fidelity's methodologies used in determining the revenues and expenses attributable to Fidelity's mutual fund business, and completion of agreed-upon procedures surrounding the mathematical accuracy of fund profitability and its conformity to allocation methodologies. After considering PwC's reports issued under the engagement and information provided by Fidelity, the Board believes that while other allocation methods may also be reasonable, Fidelity's profitability methodologies are reasonable in all material respects.
Annual Report
Board Approval of Investment Advisory Contracts and
Management Fees - continued
The Board has also reviewed Fidelity's non-fund businesses and fall-out benefits related to the mutual fund business as well as cases where Fidelity's affiliates may benefit from or be related to the fund's business.
The Board considered the costs of the services provided by and the profits realized by Fidelity in connection with the operation of the fund and were satisfied that the profitability was not excessive in the circumstances.
Economies of Scale. The Board considered whether there have been economies of scale in respect of the management of the Fidelity funds, whether the Fidelity funds (including the fund) have appropriately benefited from any such economies of scale, and whether there is potential for realization of any further economies of scale. The Board considered the extent to which the fund will benefit from economies of scale through increased services to the fund, through waivers or reimbursements, or through fee or expense reductions.
In February 2009, the Board and the board of other Fidelity funds created an ad hoc committee (the Economies of Scale Committee) to analyze whether FMR attains economies of scale in respect of the management and servicing of the Fidelity funds, whether the Fidelity funds have appropriately benefited from such economies of scale, and whether there is potential for realization of any further economies of scale.
The Board recognized that the fund's management contract incorporates a "group fee" structure, which provides for lower group fee rates as total fund assets under FMR's management increase, and for higher group fee rates as total fund assets under FMR's management decrease. FMR calculates the group fee rates based on a tiered asset "breakpoint" schedule that varies based on asset class. The Board considered that the group fee is designed to deliver the benefits of economies of scale to fund shareholders when total Fidelity fund assets increase, even if assets of any particular fund are unchanged or have declined, because some portion of Fidelity's costs are attributable to services provided to all Fidelity funds, and all funds benefit if those costs can be allocated among more assets. The Board concluded that, given the group fee structure, fund shareholders will benefit from lower management fees as assets under FMR's management increase at the fund complex level, regardless of whether Fidelity achieves any such economies of scale.
The Board concluded, considering the findings of the Economies of Scale Committee, that any potential economies of scale are being appropriately shared between fund shareholders and Fidelity.
Additional Information Requested by the Board. In order to develop fully the factual basis for consideration of the Fidelity funds' Advisory Contracts, the Board requested and received additional information on certain topics, including (i) fund performance trends, actions to be taken by FMR to improve certain funds' overall performance, and Fidelity's long-term strategies for certain funds; (ii) portfolio manager changes that have occurred during the past year and length of portfolio manager tenure for different categories of funds over time; (iii) Fidelity's compensation structure for portfolio managers, research analysts, and other key personnel, the rationale for the compensation structure, and how the compensation structure provides appropriate performance incentives; (iv) the amount of the investment that each portfolio manager has made in the Fidelity fund(s) that he or she manages; (v) management and other fees paid by FMR to affiliated sub-advisers on behalf of the Fidelity funds; (vi) Fidelity's fee structures and rationale for recommending different fees among different categories of funds; (vii) Fidelity's rationale for recommending which funds should have a performance adjustment component as part of their management fees; (viii) the rationale for any differences between fund fee structures and fee structures in place for other Fidelity clients; and (ix) explanations regarding the relative total expenses borne by certain funds and classes, total expense competitive trends, and actions that might be taken by FMR to reduce total expenses for certain funds and classes.
Annual Report
Based on its evaluation of all of the conclusions noted above, and after considering all factors it believed relevant, the Board ultimately concluded that the advisory fee structures are fair and reasonable, and that the fund's Advisory Contracts should be renewed.
Annual Report
Investment Adviser
Fidelity Management & Research Company
Boston, MA
Investment Sub-Advisers
FMR Co., Inc.
Fidelity Management & Research
(U.K.) Inc.
Fidelity Management & Research
(Hong Kong) Limited
Fidelity Management & Research
(Japan) Inc.
Fidelity Research & Analysis Company
General Distributor
Fidelity Distributors Corporation
Boston, MA
Transfer and Service Agents
Fidelity Investments Institutional
Operations Company, Inc.
Boston, MA
Fidelity Service Company, Inc.
Boston, MA
Custodian
Citibank, N.A.
New York, NY
ASCV-UANN-0910
1.803731.105
(Fidelity Investment logo)(registered trademark)
Fidelity Advisor
Small Cap Value
Fund - Institutional Class
Annual Report
July 31, 2010
(2_fidelity_logos) (Registered_Trademark)
Institutional Class
is a class of Fidelity®
Small Cap Value Fund
Contents
Chairman's Message | <Click Here> | The Chairman's message to shareholders. |
Performance | <Click Here> | How the fund has done over time. |
Management's Discussion of Fund Performance | <Click Here> | The Portfolio Manager's review of fund performance and strategy. |
Shareholder Expense Example | <Click Here> | An example of shareholder expenses. |
Investment Changes | <Click Here> | A summary of major shifts in the fund's investments over the past six months. |
Investments | <Click Here> | A complete list of the fund's investments with their market values. |
Financial Statements | <Click Here> | Statements of assets and liabilities, operations, and changes in net assets,
as well as financial highlights. |
Notes | <Click Here> | Notes to the financial statements. |
Report of Independent Registered Public Accounting Firm | <Click Here> | |
Trustees and Officers | <Click Here> | |
Distributions | <Click Here> | |
Board Approval of Investment Advisory Contracts and Management Fees | <Click Here> | |
To view a fund's proxy voting guidelines and proxy voting record for the 12-month period ended June 30, visit http://www.fidelity.com/proxyvotingresults or visit the Securities and Exchange Commission's (SEC) web site at http://www.sec.gov. You may also call 1-877-208-0098 to request a free copy of the proxy voting guidelines.
Standard & Poor's, S&P and S&P 500 are registered service marks of The McGraw-Hill Companies, Inc. and have been licensed for use by Fidelity Distributors Corporation.
Other third party marks appearing herein are the property of their respective owners.
All other marks appearing herein are registered or unregistered trademarks or service marks of FMR LLC or an affiliated company.
Annual Report
This report and the financial statements contained herein are submitted for the general information of the shareholders of the fund. This report is not authorized for distribution to prospective investors in the fund unless preceded or accompanied by an effective prospectus.
A fund files its complete schedule of portfolio holdings with the SEC for the first and third quarters of each fiscal year on Form N-Q. Forms N-Q are available on the SEC's web site at http://www.sec.gov. A fund's Forms N-Q may be reviewed and copied at the SEC's Public Reference Room in Washington, DC. Information regarding the operation of the SEC's Public Reference Room may be obtained by calling 1-800-SEC-0330. For a complete list of a fund's portfolio holdings, view the most recent holdings listing, semiannual report, or annual report on Fidelity's web site at http://www.fidelity.com or http://www.advisor.fidelity.com, as applicable.
NOT FDIC INSURED • MAY LOSE VALUE • NO BANK GUARANTEE
Neither the fund nor Fidelity Distributors Corporation is a bank.
Annual Report
(photo_of_Edward_C_Johnson_3d)
Dear Shareholder:
A yearlong uptrend in global equity markets reversed course in late April 2010 when investor sentiment turned bearish due in great measure to concern that Europe's debt crisis would expand and slow or derail economic recovery. However, a bounceback in July helped to recover some of the ground that was lost. Financial markets are always unpredictable, of course, but there also are several time-tested investment principles that can help put the odds in your favor.
One of the basic tenets is to invest for the long term. Over time, riding out the markets' inevitable ups and downs has proven much more effective than selling into panic or chasing the hottest trend. Even missing only a few of the markets' best days can significantly diminish investor returns. Patience also affords the benefits of compounding - of earning interest on additional income or reinvested dividends and capital gains. There can be tax advantages and cost benefits to consider as well. While staying the course doesn't eliminate risk, it can considerably lessen the effect of short-term declines.
You can further manage your investing risk through diversification. And today, more than ever, geographic diversification should be taken into account. Studies indicate that asset allocation is the single most important determinant of a portfolio's long-term success. The right mix of stocks, bonds and cash - aligned to your particular risk tolerance and investment objective - is very important. Age-appropriate rebalancing is also an essential aspect of asset allocation. For younger investors, an emphasis on equities - which historically have been the best-performing asset class over time - is encouraged. As investors near their specific goal, such as retirement or sending a child to college, consideration may be given to replacing volatile assets (e.g. common stocks) with more-stable fixed investments (bonds or savings plans).
A third principle - investing regularly - can help lower the average cost of your purchases. Investing a certain amount of money each month or quarter helps ensure you won't pay for all your shares at market highs. This strategy - known as dollar cost averaging - also reduces "emotion" from investing, helping shareholders avoid selling weak performers just prior to an upswing, or chasing a hot performer just before a correction.
We invite you to contact us via the Internet, through our Investor Centers or by phone. It is our privilege to provide you the information you need to make the investments that are right for you.
Sincerely,
(The chairman's signature appears here.)
Edward C. Johnson 3d
Annual Report
Average annual total return reflects the change in the value of an investment, assuming reinvestment of the class' distributions from dividend income and capital gains (the profits earned upon the sale of securities that have grown in value, if any) and assuming a constant rate of performance each year. The $10,000 table and the fund's returns do not reflect the deduction of taxes that a shareholder would pay on fund distributions or the redemption of fund shares. During periods of reimbursement by Fidelity, a fund's total return will be greater than it would be had the reimbursement not occurred. How a fund did yesterday is no guarantee of how it will do tomorrow.
Average Annual Total Returns
Periods ended July 31, 2010 | Past 1
year | Past 5
years | Life of
fundA |
Institutional Class | 21.42% | 4.07% | 8.14% |
A From November 3, 2004.
$10,000 Over Life of Fund
Let's say hypothetically that $10,000 was invested in Fidelity Advisor Small Cap Value Fund - Institutional Class on November 3, 2004, when the fund started. The chart shows how the value of your investment would have changed, and also shows how the Russell 2000® Value Index performed over the same period.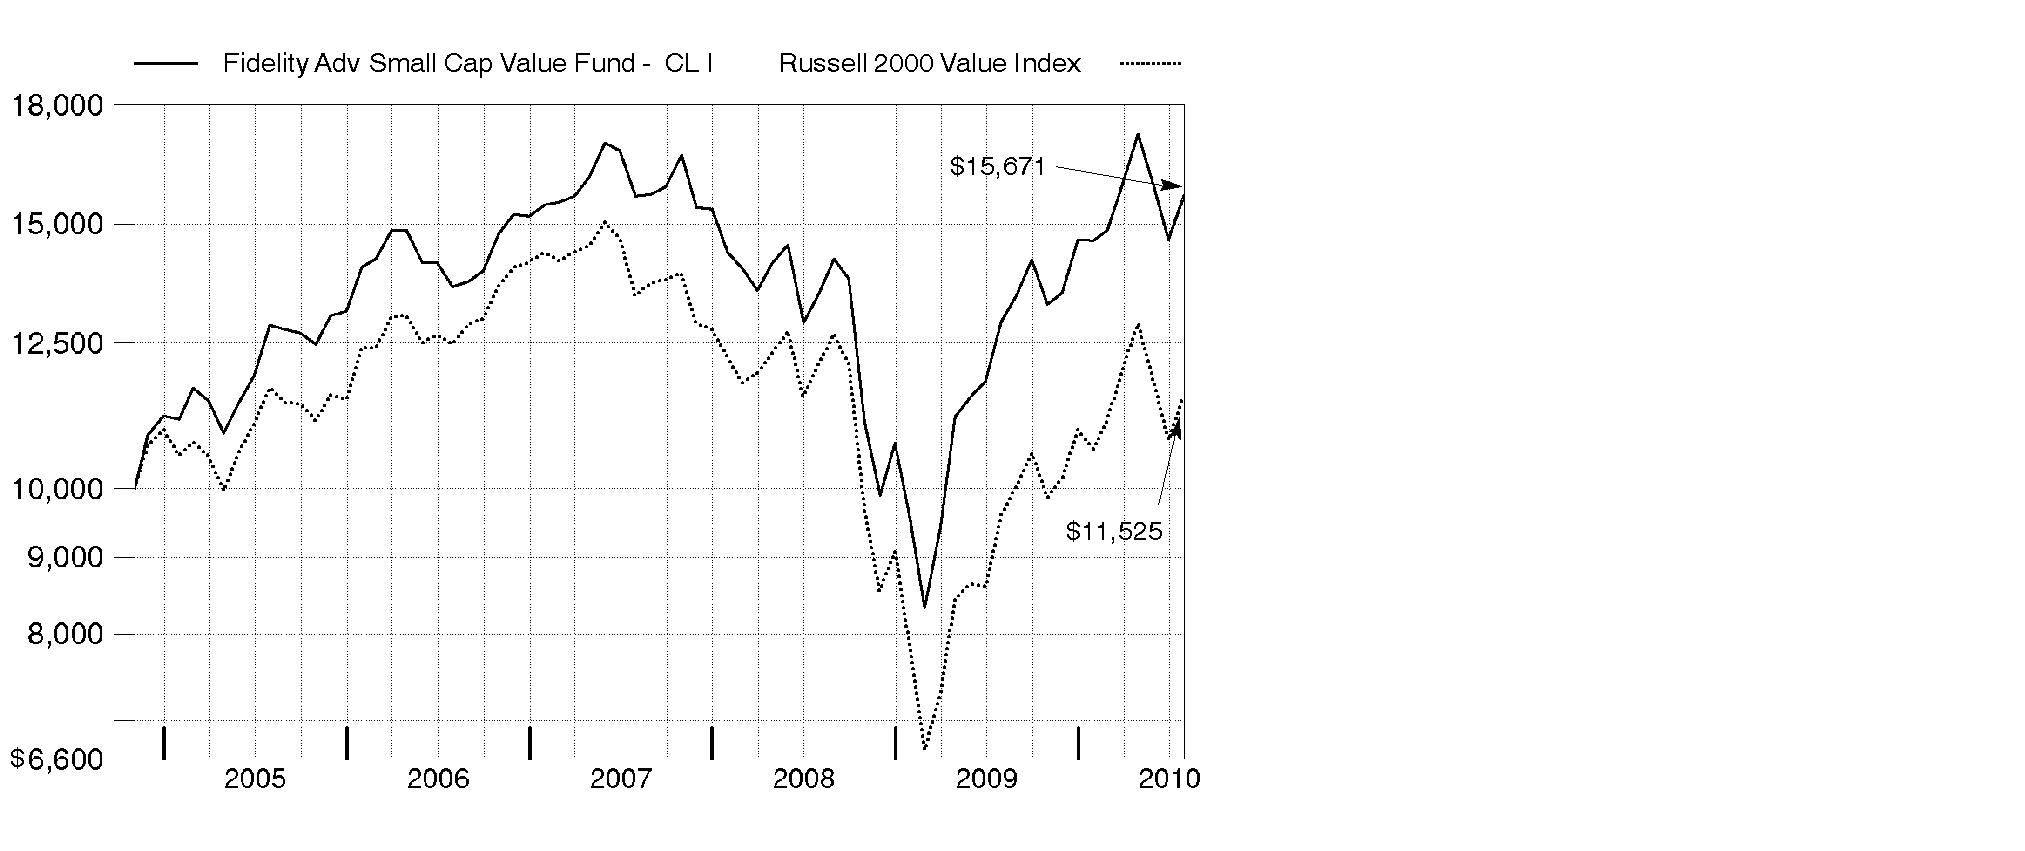
Annual Report
Market Recap: U.S. stock markets saw double-digit gains for the year ending July 31, 2010, despite the return of market volatility and risk aversion during the first half of 2010. An impressive bull run continued through 2009, bolstered by improvement in the economy and credit markets. Early in the new year, however, stocks fell sharply amid concerns about the global economic recovery, fueled by European debt woes and China's efforts to restrain inflation. After this brief dip, markets regained their upward momentum, as government stimulus and significant corporate cost cutting led to encouraging earnings reports, improved credit conditions and rising consumer confidence. Positive news continued through mid-April, when the Dow Jones Industrial AverageSM pushed above the 11,000 mark for the first time in 19 months. That milestone was short-lived, however, as heightened concern about the European debt crisis sparked an abrupt sell-off in May, leading to the first official correction since the rally began in March 2009. Although the market's malaise continued through June, stocks saw solid gains in July. For the year, the Dow rose 17.28%, while the S&P 500® Index was up 13.84%. Elsewhere, the technology-laden Nasdaq Composite® Index returned 14.99%. Small- and mid-cap stocks performed best, as measured by the 18.43% increase of the Russell 2000® Index and the 23.21% gain of the Russell Midcap® Index.
Comments from Charles Myers, Portfolio Manager of Fidelity Advisor Small Cap Value Fund: For the year, the fund's Institutional Class shares rose 21.42%, compared with 20.11% for the benchmark Russell 2000 Value Index. Security selection in financials helped, especially banks and real estate stocks, although my diversified financials holdings didn't do well. Stock picking in consumer staples - especially food/staples retailing - - as well as energy and materials also were notable positives, while consumer discretionary hurt. On an individual security basis, the fund's top contributors included Carpenter Technology, a specialty metals manufacturer, and real estate stocks Alexandria Real Estate Equities and Jones Lang LaSalle. Oil and gas company Mariner Energy also helped. I sold my stake shortly after the company agreed to be acquired for a premium price. In contrast, auto-industry challenges hurt DealerTrack Holdings, a car-dealer software and services provider, and Penske Automotive Group, a dealership chain I sold before period end. Utility RRI Energy, another stock I sold, also detracted. Many of the names I've mentioned were not in the index.
The views expressed above reflect those of the portfolio manager(s) only through the end of the period as stated on the cover of this report and do not necessarily represent the views of Fidelity or any other person in the Fidelity organization. Any such views are subject to change at any time based upon market or other conditions and Fidelity disclaims any responsibility to update such views. These views may not be relied on as investment advice and, because investment decisions for a Fidelity fund are based on numerous factors, may not be relied on as an indication of trading intent on behalf of any Fidelity fund.
Annual Report
Shareholder Expense Example
As a shareholder of the Fund, you incur two types of costs: (1) transaction costs, including sales charges (loads) on purchase payments or redemption proceeds, redemption fees, and (2) ongoing costs, including management fees, distribution and/or service (12b-1) fees and other Fund expenses. This Example is intended to help you understand your ongoing costs (in dollars) of investing in the Fund and to compare these costs with the ongoing costs of investing in other mutual funds.
The Example is based on an investment of $1,000 invested at the beginning of the period and held for the entire period (February 1, 2010 to July 31, 2010).
Actual Expenses
The first line of the accompanying table for each class of the Fund provides information about actual account values and actual expenses. You may use the information in this line, together with the amount you invested, to estimate the expenses that you paid over the period. Simply divide your account value by $1,000.00 (for example, an $8,600 account value divided by $1,000.00 = 8.6), then multiply the result by the number in the first line for a class of the Fund under the heading entitled "Expenses Paid During Period" to estimate the expenses you paid on your account during this period. A small balance maintenance fee of $12.00 that is charged once a year may apply for certain accounts with a value of less than $2,000. This fee is not included in the table below. If it was, the estimate of expenses you paid during the period would be higher, and your ending account value lower, by this amount. In addition, the Fund, as a shareholder in the underlying Fidelity Central Funds, will indirectly bear its pro-rata share of the fees and expenses incurred by the underlying Fidelity Central Funds. These fees and expenses are not included in the Fund's annualized expense ratio used to calculate the expense estimate in the table below.
Hypothetical Example for Comparison Purposes
The second line of the accompanying table for each class of the Fund provides information about hypothetical account values and hypothetical expenses based on a Class' actual expense ratio and an assumed rate of return of 5% per year before expenses, which is not the Class' actual return. The hypothetical account values and expenses may not be used to estimate the actual ending account balance or expenses you paid for the period. You may use this information to compare the ongoing costs of investing in the Fund and other funds. To do so, compare this 5% hypothetical example with the 5% hypothetical examples that appear in the shareholder reports of the other funds. A small balance maintenance fee of $12.00 that is charged once a year may apply for certain accounts with a value of less than $2,000. This fee is not included in the table below. If it was, the estimate of expenses you paid during the period would be higher, and your ending account value lower, by this amount. In addition, the Fund, as a shareholder in the underlying Fidelity Central Funds, will indirectly bear its pro-rata share of the fees and expenses incurred by the underlying Fidelity Central Funds. These fees and expenses are not included in the Fund's annualized expense ratio used to calculate the expense estimate in the table below.
Please note that the expenses shown in the table are meant to highlight your ongoing costs only and do not reflect any transaction costs. Therefore, the second line of the table is useful in comparing ongoing costs only, and will not help you determine the relative total costs of owning different funds. In addition, if these transactional costs were included, your costs would have been higher.
Annual Report
| Annualized
Expense
Ratio | Beginning
Account Value
February 1, 2010 | Ending
Account Value
July 31, 2010 | Expenses Paid
During Period*
February 1, 2010 to
July 31, 2010 |
Class A | 1.40% | | | |
Actual | | $ 1,000.00 | $ 1,070.90 | $ 7.19 |
HypotheticalA | | $ 1,000.00 | $ 1,017.85 | $ 7.00 |
Class T | 1.65% | | | |
Actual | | $ 1,000.00 | $ 1,069.80 | $ 8.47 |
HypotheticalA | | $ 1,000.00 | $ 1,016.61 | $ 8.25 |
Class B | 2.15% | | | |
Actual | | $ 1,000.00 | $ 1,066.90 | $ 11.02 |
HypotheticalA | | $ 1,000.00 | $ 1,014.13 | $ 10.74 |
Class C | 2.15% | | | |
Actual | | $ 1,000.00 | $ 1,066.00 | $ 11.01 |
HypotheticalA | | $ 1,000.00 | $ 1,014.13 | $ 10.74 |
Small Cap Value | 1.16% | | | |
Actual | | $ 1,000.00 | $ 1,071.90 | $ 5.96 |
HypotheticalA | | $ 1,000.00 | $ 1,019.04 | $ 5.81 |
Class F | .90% | | | |
Actual | | $ 1,000.00 | $ 1,073.50 | $ 4.63 |
HypotheticalA | | $ 1,000.00 | $ 1,020.33 | $ 4.51 |
Institutional Class | 1.12% | | | |
Actual | | $ 1,000.00 | $ 1,072.70 | $ 5.76 |
HypotheticalA | | $ 1,000.00 | $ 1,019.24 | $ 5.61 |
A 5% return per year before expenses
* Expenses are equal to each Class' annualized expense ratio, multiplied by the average account value over the period, multiplied by 181/365 (to reflect the one-half year period).
Annual Report
Investment Changes (Unaudited)
Top Ten Stocks as of July 31, 2010 |
| % of fund's
net assets | % of fund's net assets
6 months ago |
Platinum Underwriters Holdings Ltd. | 3.1 | 2.8 |
WESCO International, Inc. | 3.1 | 3.0 |
Superior Energy Services, Inc. | 3.0 | 2.7 |
BJ's Wholesale Club, Inc. | 3.0 | 2.4 |
Alexandria Real Estate Equities, Inc. | 2.8 | 2.8 |
Berry Petroleum Co. Class A | 2.7 | 0.0 |
Astoria Financial Corp. | 2.7 | 3.4 |
HNI Corp. | 2.6 | 2.6 |
UGI Corp. | 2.5 | 0.0 |
TCF Financial Corp. | 2.5 | 2.2 |
| 28.0 | |
Top Five Market Sectors as of July 31, 2010 |
| % of fund's
net assets | % of fund's net assets
6 months ago |
Financials | 37.8 | 35.7 |
Industrials | 12.8 | 13.5 |
Consumer Discretionary | 11.5 | 11.3 |
Information Technology | 8.3 | 9.9 |
Utilities | 6.4 | 4.8 |
Asset Allocation (% of fund's net assets) |
As of July 31, 2010* | As of January 31, 2010** |
| Stocks 99.2% | | | Stocks 99.5% | |
| Short-Term
Investments and
Net Other Assets 0.8% | | | Short-Term
Investments and
Net Other Assets 0.5% | |
* Foreign investments | 10.5% | | ** Foreign investments | 9.6% | |

Annual Report
Investments July 31, 2010
Showing Percentage of Net Assets
Common Stocks - 97.8% |
| Shares | | Value |
CONSUMER DISCRETIONARY - 10.9% |
Diversified Consumer Services - 3.0% |
Matthews International Corp. Class A | 640,187 | | $ 23,117,153 |
Regis Corp. (d) | 2,745,882 | | 41,819,783 |
| | 64,936,936 |
Household Durables - 5.1% |
M.D.C. Holdings, Inc. | 1,224,300 | | 35,651,616 |
Meritage Homes Corp. (a) | 1,536,160 | | 27,005,693 |
Ryland Group, Inc. | 2,153,837 | | 35,150,620 |
Tempur-Pedic International, Inc. (a) | 400,000 | | 12,268,000 |
| | 110,075,929 |
Specialty Retail - 1.8% |
Asbury Automotive Group, Inc. (a) | 1,465,159 | | 19,721,040 |
Tsutsumi Jewelry Co. Ltd. | 791,400 | | 18,405,716 |
| | 38,126,756 |
Textiles, Apparel & Luxury Goods - 1.0% |
Iconix Brand Group, Inc. (a) | 1,330,087 | | 21,893,232 |
TOTAL CONSUMER DISCRETIONARY | | 235,032,853 |
CONSUMER STAPLES - 4.7% |
Food & Staples Retailing - 3.6% |
BJ's Wholesale Club, Inc. (a) | 1,390,000 | | 63,314,500 |
Ingles Markets, Inc. Class A | 838,531 | | 13,634,514 |
| | 76,949,014 |
Food Products - 1.1% |
Chiquita Brands International, Inc. (a)(d) | 1,600,000 | | 23,488,000 |
TOTAL CONSUMER STAPLES | | 100,437,014 |
ENERGY - 5.7% |
Energy Equipment & Services - 3.0% |
Superior Energy Services, Inc. (a) | 2,841,700 | | 64,762,343 |
Oil, Gas & Consumable Fuels - 2.7% |
Berry Petroleum Co. Class A | 1,950,000 | | 58,149,000 |
TOTAL ENERGY | | 122,911,343 |
FINANCIALS - 37.0% |
Capital Markets - 2.8% |
optionsXpress Holdings, Inc. (a) | 2,055,000 | | 32,058,000 |
Common Stocks - continued |
| Shares | | Value |
FINANCIALS - continued |
Capital Markets - continued |
TradeStation Group, Inc. (a)(e) | 2,062,291 | | $ 13,178,039 |
Waddell & Reed Financial, Inc. Class A | 640,000 | | 15,251,200 |
| | 60,487,239 |
Commercial Banks - 11.8% |
Associated Banc-Corp. | 3,687,610 | | 50,114,620 |
CapitalSource, Inc. | 6,405,000 | | 34,458,900 |
City National Corp. | 784,900 | | 44,480,283 |
National Penn Bancshares, Inc. | 2,775,154 | | 18,482,526 |
PacWest Bancorp (e) | 1,794,200 | | 37,552,606 |
TCF Financial Corp. (d) | 3,385,800 | | 53,631,072 |
Western Liberty Bancorp (a)(e) | 2,400,000 | | 14,976,000 |
| | 253,696,007 |
Insurance - 7.3% |
Alterra Capital Holdings Ltd. | 2,057,411 | | 39,810,903 |
Aspen Insurance Holdings Ltd. | 1,820,200 | | 49,782,470 |
Platinum Underwriters Holdings Ltd. | 1,696,975 | | 66,317,783 |
| | 155,911,156 |
Real Estate Investment Trusts - 8.4% |
Alexandria Real Estate Equities, Inc. (d) | 848,300 | | 59,847,565 |
DCT Industrial Trust, Inc. | 10,000,000 | | 46,900,000 |
Highwoods Properties, Inc. (SBI) | 1,470,330 | | 46,036,032 |
National Retail Properties, Inc. (d) | 1,140,000 | | 26,356,800 |
| | 179,140,397 |
Real Estate Management & Development - 1.9% |
Jones Lang LaSalle, Inc. | 538,628 | | 41,722,125 |
Thrifts & Mortgage Finance - 4.8% |
Astoria Financial Corp. | 4,318,152 | | 57,172,332 |
Washington Federal, Inc. | 2,616,175 | | 45,521,445 |
| | 102,693,777 |
TOTAL FINANCIALS | | 793,650,701 |
HEALTH CARE - 6.3% |
Health Care Providers & Services - 6.3% |
Centene Corp. (a) | 972,542 | | 20,724,870 |
Chemed Corp. | 510,200 | | 26,999,784 |
MEDNAX, Inc. (a) | 721,500 | | 34,018,725 |
Providence Service Corp. (a)(e) | 1,016,495 | | 14,637,528 |
Common Stocks - continued |
| Shares | | Value |
HEALTH CARE - continued |
Health Care Providers & Services - continued |
Team Health Holdings, Inc. | 2,146,700 | | $ 28,143,237 |
VCA Antech, Inc. (a) | 518,000 | | 10,795,120 |
| | 135,319,264 |
INDUSTRIALS - 12.8% |
Commercial Services & Supplies - 7.0% |
ACCO Brands Corp. (a)(e) | 3,720,923 | | 22,027,864 |
HNI Corp. (d) | 2,149,671 | | 55,547,499 |
Knoll, Inc. | 1,412,898 | | 19,822,959 |
United Stationers, Inc. (a) | 990,400 | | 53,630,160 |
| | 151,028,482 |
Machinery - 1.3% |
Blount International, Inc. (a)(e) | 2,604,723 | | 27,740,300 |
Trading Companies & Distributors - 4.5% |
H&E Equipment Services, Inc. (a)(e) | 3,489,408 | | 30,357,850 |
WESCO International, Inc. (a) | 1,825,000 | | 65,572,250 |
| | 95,930,100 |
TOTAL INDUSTRIALS | | 274,698,882 |
INFORMATION TECHNOLOGY - 8.3% |
Communications Equipment - 1.4% |
ViaSat, Inc. (a) | 809,472 | | 29,254,318 |
Electronic Equipment & Components - 4.0% |
Ingram Micro, Inc. Class A (a) | 2,253,100 | | 37,243,743 |
Macnica, Inc. | 677,400 | | 14,837,353 |
Ryoyo Electro Corp. (e) | 1,772,700 | | 18,932,046 |
SYNNEX Corp. (a) | 558,898 | | 14,749,318 |
| | 85,762,460 |
Internet Software & Services - 1.7% |
DealerTrack Holdings, Inc. (a) | 1,383,804 | | 21,601,180 |
j2 Global Communications, Inc. (a) | 630,149 | | 14,827,406 |
| | 36,428,586 |
Semiconductors & Semiconductor Equipment - 0.7% |
Miraial Co. Ltd. (e) | 570,200 | | 15,372,473 |
Software - 0.5% |
Monotype Imaging Holdings, Inc. (a) | 1,358,151 | | 11,299,816 |
TOTAL INFORMATION TECHNOLOGY | | 178,117,653 |
Common Stocks - continued |
| Shares | | Value |
MATERIALS - 5.0% |
Chemicals - 0.7% |
Spartech Corp. (a) | 1,387,702 | | $ 14,515,363 |
Metals & Mining - 4.3% |
Carpenter Technology Corp. | 1,284,380 | | 44,889,081 |
RTI International Metals, Inc. (a)(e) | 1,692,597 | | 48,035,903 |
| | 92,924,984 |
TOTAL MATERIALS | | 107,440,347 |
TELECOMMUNICATION SERVICES - 0.7% |
Diversified Telecommunication Services - 0.7% |
Cogent Communications Group, Inc. (a) | 1,665,000 | | 14,352,300 |
UTILITIES - 6.4% |
Electric Utilities - 2.2% |
Westar Energy, Inc. | 1,960,000 | | 46,804,800 |
Gas Utilities - 4.2% |
Southwest Gas Corp. | 1,130,989 | | 36,383,916 |
UGI Corp. | 2,000,000 | | 53,920,000 |
| | 90,303,916 |
TOTAL UTILITIES | | 137,108,716 |
TOTAL COMMON STOCKS (Cost $1,920,724,852) | 2,099,069,073 |
Nonconvertible Preferred Stocks - 1.4% |
| | | |
CONSUMER DISCRETIONARY - 0.6% |
Household Durables - 0.6% |
M/I Homes, Inc. Series A, 9.75% (a) | 734,300 | | 13,033,825 |
FINANCIALS - 0.8% |
Real Estate Investment Trusts - 0.8% |
Developers Diversified Realty Corp. (depositary shares) Series H, 7.375% | 818,790 | | 18,013,380 |
TOTAL NONCONVERTIBLE PREFERRED STOCKS (Cost $20,083,684) | 31,047,205 |
Money Market Funds - 3.5% |
| Shares | | Value |
Fidelity Cash Central Fund, 0.24% (b) | 15,579,695 | | $ 15,579,695 |
Fidelity Securities Lending Cash Central Fund, 0.27% (b)(c) | 59,928,075 | | 59,928,075 |
TOTAL MONEY MARKET FUNDS (Cost $75,507,770) | 75,507,770 |
TOTAL INVESTMENT PORTFOLIO - 102.7% (Cost $2,016,316,306) | | 2,205,624,048 |
NET OTHER ASSETS (LIABILITIES) - (2.7)% | | (58,464,582) |
NET ASSETS - 100% | $ 2,147,159,466 |
Legend |
(a) Non-income producing |
(b) Affiliated fund that is available only to investment companies and other accounts managed by Fidelity Investments. The rate quoted is the annualized seven-day yield of the fund at period end. A complete unaudited listing of the fund's holdings as of its most recent quarter end is available upon request. |
(c) Investment made with cash collateral received from securities on loan. |
(d) Security or a portion of the security is on loan at period end. |
(e) Affiliated company |
Affiliated Central Funds |
Information regarding fiscal year to date income earned by the Fund from investments in Fidelity Central Funds is as follows: |
Fund | Income earned |
Fidelity Cash Central Fund | $ 42,495 |
Fidelity Securities Lending Cash Central Fund | 278,970 |
Total | $ 321,465 |
Other Affiliated Issuers |
An affiliated company is a company in which the fund has ownership of at least 5% of the voting securities. Fiscal year to date transactions with companies which are or were affiliates are as follows: |
Affiliates | Value,
beginning
of period | Purchases | Sales
Proceeds | Dividend
Income | Value,
end
of period |
ACCO Brands Corp. | $ 5,466,534 | $ 19,961,967 | $ - | $ - | $ 22,027,864 |
Blount International, Inc. | 17,199,578 | 8,372,649 | - | - | 27,740,300 |
Carpenter Technology Corp. | 48,582,409 | - | 42,768,155 | 1,546,654 | - |
H&E Equipment Services, Inc. | 17,823,149 | 19,092,190 | - | - | 30,357,850 |
HNI Corp. | 48,476,178 | 12,485,936 | 14,178,245 | 1,831,754 | - |
Miraial Co. Ltd. | 11,951,237 | - | - | 358,374 | 15,372,473 |
PacWest Bancorp | - | 33,511,723 | - | 55,188 | 37,552,606 |
Providence Service Corp. | 5,488,479 | 7,744,742 | - | - | 14,637,528 |
RTI International Metals, Inc. | - | 61,889,471 | 24,610,646 | - | 48,035,903 |
Ryoyo Electro Corp. | 10,896,174 | 5,192,230 | - | 479,261 | 18,932,046 |
Spartech Corp. | 19,788,775 | 387,662 | 2,807,218 | - | - |
TradeStation Group, Inc. | 15,446,560 | - | - | - | 13,178,039 |
WESCO International, Inc. | 45,676,500 | 7,269,797 | 10,057,750 | - | - |
Western Liberty Bancorp | - | 23,351,352 | - | - | 14,976,000 |
Total | $ 246,795,573 | $ 199,259,719 | $ 94,422,014 | $ 4,271,231 | $ 242,810,609 |
Other Information |
The following is a summary of the inputs used, as of July 31, 2010, involving the Fund's assets and liabilities carried at fair value. The inputs or methodology used for valuing securities may not be an indication of the risk associated with investing in those securities. For more information on valuation inputs, and their aggregation into the levels used in the table below, please refer to the Security Valuation section in the accompanying Notes to Financial Statements. |
Valuation Inputs at Reporting Date: |
Description | Total | Level 1 | Level 2 | Level 3 |
Investments in Securities: | | | | |
Equities: | | | | |
Consumer Discretionary | $ 248,066,678 | $ 248,066,678 | $ - | $ - |
Consumer Staples | 100,437,014 | 100,437,014 | - | - |
Energy | 122,911,343 | 122,911,343 | - | - |
Financials | 811,664,081 | 796,688,081 | 14,976,000 | - |
Health Care | 135,319,264 | 135,319,264 | - | - |
Industrials | 274,698,882 | 274,698,882 | - | - |
Information Technology | 178,117,653 | 178,117,653 | - | - |
Materials | 107,440,347 | 107,440,347 | - | - |
Telecommunication Services | 14,352,300 | 14,352,300 | - | - |
Utilities | 137,108,716 | 137,108,716 | - | - |
Money Market Funds | 75,507,770 | 75,507,770 | - | - |
Total Investments in Securities: | $ 2,205,624,048 | $ 2,190,648,048 | $ 14,976,000 | $ - |
Distribution of investments by country of issue, as a percentage of total net assets, is as follows: (Unaudited) |
United States of America | 89.5% |
Bermuda | 7.3% |
Japan | 3.2% |
| 100.0% |
See accompanying notes which are an integral part of the financial statements.
Annual Report
Statement of Assets and Liabilities
| July 31, 2010 |
| | |
Assets | | |
Investment in securities, at value (including securities loaned of $58,391,724) - See accompanying schedule: Unaffiliated issuers (cost $1,688,193,871) | $ 1,887,305,669 | |
Fidelity Central Funds (cost $75,507,770) | 75,507,770 | |
Other affiliated issuers (cost $252,614,665) | 242,810,609 | |
Total Investments (cost $2,016,316,306) | | $ 2,205,624,048 |
Receivable for fund shares sold | | 4,429,744 |
Dividends receivable | | 1,263,751 |
Distributions receivable from Fidelity Central Funds | | 11,305 |
Receivable from investment adviser for expense reductions | | 4,703 |
Other receivables | | 78,788 |
Total assets | | 2,211,412,339 |
| | |
Liabilities | | |
Payable for investments purchased | $ 947,463 | |
Payable for fund shares redeemed | 1,282,259 | |
Accrued management fee | 1,466,676 | |
Distribution fees payable | 74,394 | |
Other affiliated payables | 496,956 | |
Other payables and accrued expenses | 57,050 | |
Collateral on securities loaned, at value | 59,928,075 | |
Total liabilities | | 64,252,873 |
| | |
Net Assets | | $ 2,147,159,466 |
Net Assets consist of: | | |
Paid in capital | | $ 1,944,622,631 |
Undistributed net investment income | | 5,209,766 |
Accumulated undistributed net realized gain (loss) on investments and foreign currency transactions | | 8,011,200 |
Net unrealized appreciation (depreciation) on investments and assets and liabilities in foreign currencies | | 189,315,869 |
Net Assets | | $ 2,147,159,466 |
See accompanying notes which are an integral part of the financial statements.
Annual Report
Financial Statements - continued
Statement of Assets and Liabilities - continued
| July 31, 2010 |
| | |
Calculation of Maximum Offering Price
Class A:
Net Asset Value and redemption price per share ($96,993,684 ÷ 7,213,042 shares) | | $ 13.45 |
| | |
Maximum offering price per share (100/94.25 of $13.45) | | $ 14.27 |
Class T:
Net Asset Value and redemption price per share ($44,090,912 ÷ 3,306,403 shares) | | $ 13.34 |
| | |
Maximum offering price per share (100/96.50 of $13.34) | | $ 13.82 |
Class B:
Net Asset Value and offering price per share ($9,746,855 ÷ 745,164 shares)A | | $ 13.08 |
| | |
Class C:
Net Asset Value and offering price per share ($37,345,521 ÷ 2,854,186 shares)A | | $ 13.08 |
| | |
| | |
Small Cap Value:
Net Asset Value, offering price and redemption price per share ($1,770,674,882 ÷ 130,574,752 shares) | | $ 13.56 |
| | |
Class F:
Net Asset Value, offering price and redemption price per share ($109,867,616 ÷ 8,090,051 shares) | | $ 13.58 |
| | |
Institutional Class:
Net Asset Value, offering price and redemption price per share ($78,439,996 ÷ 5,777,920 shares) | | $ 13.58 |
A Redemption price per share is equal to net asset value less any applicable contingent deferred sales charge.
See accompanying notes which are an integral part of the financial statements.
Annual Report
Statement of Operations
| Year ended July 31, 2010 |
| | |
Investment Income | | |
Dividends (including $4,271,231 earned from other affiliated issuers) | | $ 24,688,740 |
Special dividends | | 5,143,528 |
Interest | | 18,401 |
Income from Fidelity Central Funds | | 321,465 |
Total income | | 30,172,134 |
| | |
Expenses | | |
Management fee
Basic fee | $ 13,665,863 | |
Performance adjustment | 2,744,643 | |
Transfer agent fees | 5,310,263 | |
Distribution fees | 751,876 | |
Accounting and security lending fees | 646,723 | |
Custodian fees and expenses | 45,637 | |
Independent trustees' compensation | 10,825 | |
Registration fees | 153,912 | |
Audit | 56,974 | |
Legal | 7,506 | |
Interest | 635 | |
Miscellaneous | 27,954 | |
Total expenses before reductions | 23,422,811 | |
Expense reductions | (213,251) | 23,209,560 |
Net investment income (loss) | | 6,962,574 |
Realized and Unrealized Gain (Loss) Net realized gain (loss) on: | | |
Investment securities: | | |
Unaffiliated issuers | 168,463,263 | |
Other affiliated issuers | 20,012,303 | |
Foreign currency transactions | 10,642 | |
Capital gain distributions from Fidelity Central Funds | 9,755 | |
Total net realized gain (loss) | | 188,495,963 |
Change in net unrealized appreciation (depreciation) on: Investment securities | 137,326,654 | |
Assets and liabilities in foreign currencies | 7,003 | |
Total change in net unrealized appreciation (depreciation) | | 137,333,657 |
Net gain (loss) | | 325,829,620 |
Net increase (decrease) in net assets resulting from operations | | $ 332,792,194 |
See accompanying notes which are an integral part of the financial statements.
Annual Report
Financial Statements - continued
Statement of Changes in Net Assets
| Year ended
July 31, 2010 | Year ended
July 31, 2009 |
Increase (Decrease) in Net Assets | | |
Operations | | |
Net investment income (loss) | $ 6,962,574 | $ 11,185,799 |
Net realized gain (loss) | 188,495,963 | (175,985,663) |
Change in net unrealized appreciation (depreciation) | 137,333,657 | 144,791,983 |
Net increase (decrease) in net assets resulting from operations | 332,792,194 | (20,007,881) |
Distributions to shareholders from net investment income | (6,560,137) | (8,301,273) |
Distributions to shareholders from net realized gain | - | (12,095,172) |
Total distributions | (6,560,137) | (20,396,445) |
Share transactions - net increase (decrease) | 209,101,603 | 392,456,300 |
Redemption fees | 534,282 | 448,503 |
Total increase (decrease) in net assets | 535,867,942 | 352,500,477 |
| | |
Net Assets | | |
Beginning of period | 1,611,291,524 | 1,258,791,047 |
End of period (including undistributed net investment income of $5,209,766 and undistributed net investment income of $5,059,582, respectively) | $ 2,147,159,466 | $ 1,611,291,524 |
See accompanying notes which are an integral part of the financial statements.
Annual Report
Financial Highlights - Class A
Years ended July 31, | 2010 | 2009 | 2008 | 2007 | 2006 |
Selected Per-Share Data | | | | | |
Net asset value, beginning of period | $ 11.13 | $ 11.82 | $ 14.34 | $ 13.17 | $ 12.80 |
Income from Investment Operations | | | | | |
Net investment income (loss) C | .02 F | .08 | (.01) | (.06) | (.03) |
Net realized and unrealized gain (loss) | 2.33 | (.60) | (1.98) | 1.90 | .74 |
Total from investment operations | 2.35 | (.52) | (1.99) | 1.84 | .71 |
Distributions from net investment income | (.03) | (.06) | - | - | - |
Distributions from net realized gain | - | (.11) | (.53) | (.67) | (.35) |
Total distributions | (.03) | (.17) | (.53) | (.67) | (.35) |
Redemption fees added to paid in capital C | - H | - H | - H | - H | .01 |
Net asset value, end of period | $ 13.45 | $ 11.13 | $ 11.82 | $ 14.34 | $ 13.17 |
Total Return A,B | 21.16% | (4.37)% | (14.35)% | 14.59% | 5.72% |
Ratios to Average Net Assets D,G | | | | | |
Expenses before reductions | 1.47% | 1.45% | 1.43% | 1.45% | 1.51% |
Expenses net of fee waivers, if any | 1.40% | 1.40% | 1.40% | 1.40% | 1.40% |
Expenses net of all reductions | 1.39% | 1.40% | 1.40% | 1.40% | 1.36% |
Net investment income (loss) | .17% F | .81% | (.05)% | (.44)% | (.24)% |
Supplemental Data | | | | | |
Net assets, end of period (000 omitted) | $ 96,994 | $ 55,029 | $ 52,446 | $ 61,357 | $ 39,931 |
Portfolio turnover rate E | 49% | 51% | 149% | 67% | 93% |
A Total returns would have been lower had certain expenses not been reduced during the periods shown.
B Total returns do not include the effect of the sales charges.
C Calculated based on average shares outstanding during the period.
D Fees and expenses of the underlying Fidelity Central Funds are not included in the Fund's expense ratio. The Fund indirectly bears its proportionate share of the expenses of any underlying Fidelity Central Funds.
E Amount does not include the portfolio activity of any underlying Fidelity Central Funds.
F Investment income per share reflects a special dividend which amounted to $.03 per share. Excluding the special dividend, the ratio of net investment income (loss) to average net assets would have been (.10)%.
G Expense ratios reflect operating expenses of the class. Expenses before reductions do not reflect amounts reimbursed by the investment adviser or reductions from brokerage service arrangements or reductions from other expense offset arrangements and do not represent the amount paid by the class during periods when reimbursements or reductions occur. Expenses net of fee waivers reflect expenses after reimbursement by the investment adviser but prior to reductions from brokerage service arrangements or other expense offset arrangements. Expenses net of all reductions represent the net expenses paid by the class.
H Amount represents less than $.01 per share.
See accompanying notes which are an integral part of the financial statements.
Annual Report
Financial Highlights - Class T
Years ended July 31, | 2010 | 2009 | 2008 | 2007 | 2006 |
Selected Per-Share Data | | | | | |
Net asset value, beginning of period | $ 11.05 | $ 11.74 | $ 14.28 | $ 13.13 | $ 12.78 |
Income from Investment Operations | | | | | |
Net investment income (loss) C | (.01) F | .05 | (.04) | (.10) | (.07) |
Net realized and unrealized gain (loss) | 2.31 | (.59) | (1.97) | 1.90 | .74 |
Total from investment operations | 2.30 | (.54) | (2.01) | 1.80 | .67 |
Distributions from net investment income | (.01) | (.04) | - | - | - |
Distributions from net realized gain | - | (.11) | (.53) | (.65) | (.33) |
Total distributions | (.01) | (.15) | (.53) | (.65) | (.33) |
Redemption fees added to paid in capital C | - H | - H | - H | - H | .01 |
Net asset value, end of period | $ 13.34 | $ 11.05 | $ 11.74 | $ 14.28 | $ 13.13 |
Total Return A,B | 20.87% | (4.57)% | (14.58)% | 14.34% | 5.47% |
Ratios to Average Net Assets D,G | | | | | |
Expenses before reductions | 1.72% | 1.70% | 1.68% | 1.66% | 1.67% |
Expenses net of fee waivers, if any | 1.65% | 1.65% | 1.65% | 1.65% | 1.65% |
Expenses net of all reductions | 1.64% | 1.65% | 1.65% | 1.65% | 1.61% |
Net investment income (loss) | (.08)% F | .56% | (.30)% | (.69)% | (.49)% |
Supplemental Data | | | | | |
Net assets, end of period (000 omitted) | $ 44,091 | $ 28,534 | $ 32,091 | $ 51,518 | $ 45,460 |
Portfolio turnover rate E | 49% | 51% | 149% | 67% | 93% |
A Total returns would have been lower had certain expenses not been reduced during the periods shown.
B Total returns do not include the effect of the sales charges.
C Calculated based on average shares outstanding during the period.
D Fees and expenses of the underlying Fidelity Central Funds are not included in the Fund's expense ratio. The Fund indirectly bears its proportionate share of the expenses of any underlying Fidelity Central Funds.
E Amount does not include the portfolio activity of any underlying Fidelity Central Funds.
F Investment income per share reflects a special dividend which amounted to $.03 per share. Excluding the special dividend, the ratio of net investment income (loss) to average net assets would have been (.35)%.
G Expense ratios reflect operating expenses of the class. Expenses before reductions do not reflect amounts reimbursed by the investment adviser or reductions from brokerage service arrangements or reductions from other expense offset arrangements and do not represent the amount paid by the class during periods when reimbursements or reductions occur. Expenses net of fee waivers reflect expenses after reimbursement by the investment adviser but prior to reductions from brokerage service arrangements or other expense offset arrangements. Expenses net of all reductions represent the net expenses paid by the class.
H Amount represents less than $.01 per share.
See accompanying notes which are an integral part of the financial statements.
Annual Report
Financial Highlights - Class B
Years ended July 31, | 2010 | 2009 | 2008 | 2007 | 2006 |
Selected Per-Share Data | | | | | |
Net asset value, beginning of period | $ 10.88 | $ 11.60 | $ 14.19 | $ 13.07 | $ 12.73 |
Income from Investment Operations | | | | | |
Net investment income (loss) C | (.07) F | .01 | (.10) | (.17) | (.13) |
Net realized and unrealized gain (loss) | 2.27 | (.59) | (1.96) | 1.90 | .74 |
Total from investment operations | 2.20 | (.58) | (2.06) | 1.73 | .61 |
Distributions from net investment income | - | (.03) | - | - | - |
Distributions from net realized gain | - | (.11) | (.53) | (.61) | (.28) |
Total distributions | - | (.14) | (.53) | (.61) | (.28) |
Redemption fees added to paid in capital C | - H | - H | - H | - H | .01 |
Net asset value, end of period | $ 13.08 | $ 10.88 | $ 11.60 | $ 14.19 | $ 13.07 |
Total Return A,B | 20.22% | (5.05)% | (15.04)% | 13.78% | 4.97% |
Ratios to Average Net Assets D,G | | | | | |
Expenses before reductions | 2.22% | 2.20% | 2.18% | 2.20% | 2.26% |
Expenses net of fee waivers, if any | 2.15% | 2.15% | 2.15% | 2.15% | 2.15% |
Expenses net of all reductions | 2.14% | 2.15% | 2.15% | 2.15% | 2.11% |
Net investment income (loss) | (.58)% F | .06% | (.80)% | (1.19)% | (.99)% |
Supplemental Data | | | | | |
Net assets, end of period (000 omitted) | $ 9,747 | $ 7,153 | $ 7,886 | $ 12,075 | $ 10,214 |
Portfolio turnover rate E | 49% | 51% | 149% | 67% | 93% |
A Total returns would have been lower had certain expenses not been reduced during the periods shown.
B Total returns do not include the effect of the contingent deferred sales charge.
C Calculated based on average shares outstanding during the period.
D Fees and expenses of the underlying Fidelity Central Funds are not included in the Fund's expense ratio. The Fund indirectly bears its proportionate share of the expenses of any underlying Fidelity Central Funds.
E Amount does not include the portfolio activity of any underlying Fidelity Central Funds.
F Investment income per share reflects a special dividend which amounted to $.03 per share. Excluding the special dividend, the ratio of net investment income (loss) to average net assets would have been (.85)%.
G Expense ratios reflect operating expenses of the class. Expenses before reductions do not reflect amounts reimbursed by the investment adviser or reductions from brokerage service arrangements or reductions from other expense offset arrangements and do not represent the amount paid by the class during periods when reimbursements or reductions occur. Expenses net of fee waivers reflect expenses after reimbursement by the investment adviser but prior to reductions from brokerage service arrangements or other expense offset arrangements. Expenses net of all reductions represent the net expenses paid by the class.
H Amount represents less than $.01 per share.
See accompanying notes which are an integral part of the financial statements.
Annual Report
Financial Highlights - Class C
Years ended July 31, | 2010 | 2009 | 2008 | 2007 | 2006 |
Selected Per-Share Data | | | | | |
Net asset value, beginning of period | $ 10.89 | $ 11.60 | $ 14.19 | $ 13.07 | $ 12.74 |
Income from Investment Operations | | | | | |
Net investment income (loss) C | (.07) F | .01 | (.10) | (.17) | (.13) |
Net realized and unrealized gain (loss) | 2.26 | (.58) | (1.96) | 1.90 | .74 |
Total from investment operations | 2.19 | (.57) | (2.06) | 1.73 | .61 |
Distributions from net investment income | - | (.03) | - | - | - |
Distributions from net realized gain | - | (.11) | (.53) | (.61) | (.29) |
Total distributions | - | (.14) | (.53) | (.61) | (.29) |
Redemption fees added to paid in capital C | - H | - H | - H | - H | .01 |
Net asset value, end of period | $ 13.08 | $ 10.89 | $ 11.60 | $ 14.19 | $ 13.07 |
Total Return A,B | 20.11% | (4.98)% | (15.04)% | 13.77% | 4.92% |
Ratios to Average Net Assets D,G | | | | | |
Expenses before reductions | 2.22% | 2.20% | 2.18% | 2.20% | 2.22% |
Expenses net of fee waivers, if any | 2.15% | 2.15% | 2.15% | 2.15% | 2.15% |
Expenses net of all reductions | 2.14% | 2.15% | 2.15% | 2.15% | 2.11% |
Net investment income (loss) | (.58)% F | .06% | (.80)% | (1.19)% | (.99)% |
Supplemental Data | | | | | |
Net assets, end of period (000 omitted) | $ 37,346 | $ 21,345 | $ 20,924 | $ 34,155 | $ 26,791 |
Portfolio turnover rate E | 49% | 51% | 149% | 67% | 93% |
A Total returns would have been lower had certain expenses not been reduced during the periods shown.
B Total returns do not include the effect of the contingent deferred sales charge.
C Calculated based on average shares outstanding during the period.
D Fees and expenses of the underlying Fidelity Central Funds are not included in the Fund's expense ratio. The Fund indirectly bears its proportionate share of the expenses of any underlying Fidelity Central Funds.
E Amount does not include the portfolio activity of any underlying Fidelity Central Funds.
F Investment income per share reflects a special dividend which amounted to $.03 per share. Excluding the special dividend, the ratio of net investment income (loss) to average net assets would have been (.85)%.
G Expense ratios reflect operating expenses of the class. Expenses before reductions do not reflect amounts reimbursed by the investment adviser or reductions from brokerage service arrangements or reductions from other expense offset arrangements and do not represent the amount paid by the class during periods when reimbursements or reductions occur. Expenses net of fee waivers reflect expenses after reimbursement by the investment adviser but prior to reductions from brokerage service arrangements or other expense offset arrangements. Expenses net of all reductions represent the net expenses paid by the class.
H Amount represents less than $.01 per share.
See accompanying notes which are an integral part of the financial statements.
Annual Report
Financial Highlights - Small Cap Value
Years ended July 31, | 2010 | 2009 | 2008 | 2007 | 2006 |
Selected Per-Share Data | | | | | |
Net asset value, beginning of period | $ 11.22 | $ 11.91 | $ 14.43 | $ 13.22 | $ 12.83 |
Income from Investment Operations | | | | | |
Net investment income (loss) B | .05 E | .10 | .03 | (.02) | .01 |
Net realized and unrealized gain (loss) | 2.34 | (.60) | (1.99) | 1.91 | .74 |
Total from investment operations | 2.39 | (.50) | (1.96) | 1.89 | .75 |
Distributions from net investment income | (.05) | (.08) | - | - | (.01) |
Distributions from net realized gain | - | (.11) | (.56) | (.68) | (.36) |
Total distributions | (.05) | (.19) | (.56) | (.68) | (.37) |
Redemption fees added to paid in capital B | - G | - G | - G | - G | .01 |
Net asset value, end of period | $ 13.56 | $ 11.22 | $ 11.91 | $ 14.43 | $ 13.22 |
Total Return A | 21.32% | (4.15)% | (14.10)% | 14.96% | 6.07% |
Ratios to Average Net Assets C,F | | | | |
Expenses before reductions | 1.18% | 1.20% | 1.14% | 1.11% | 1.09% |
Expenses net of fee waivers, if any | 1.18% | 1.20% | 1.14% | 1.11% | 1.09% |
Expenses net of all reductions | 1.17% | 1.20% | 1.13% | 1.11% | 1.06% |
Net investment income (loss) | .39% E | 1.01% | .22% | (.15)% | .06% |
Supplemental Data | | | | | |
Net assets, end of period (000 omitted) | $ 1,770,675 | $ 1,488,736 | $ 1,136,860 | $ 1,233,808 | $ 957,720 |
Portfolio turnover rate D | 49% | 51% | 149% | 67% | 93% |
A Total returns would have been lower had certain expenses not been reduced during the periods shown.
B Calculated based on average shares outstanding during the period.
C Fees and expenses of the underlying Fidelity Central Funds are not included in the Fund's expense ratio. The Fund indirectly bears its proportionate share of the expenses of any underlying Fidelity Central Funds.
D Amount does not include the portfolio activity of any underlying Fidelity Central Funds.
E Investment income per share reflects a special dividend which amounted to $.03 per share. Excluding the special dividend, the ratio of net investment income (loss) to average net assets would have been .12%.
F Expense ratios reflect operating expenses of the class. Expenses before reductions do not reflect amounts reimbursed by the investment adviser or reductions from brokerage service arrangements or reductions from other expense offset arrangements and do not represent the amount paid by the class during periods when reimbursements or reductions occur. Expenses net of fee waivers reflect expenses after reimbursement by the investment adviser but prior to reductions from brokerage service arrangements or other expense offset arrangements. Expenses net of all reductions represent the net expenses paid by the class.
G Amount represents less than $.01 per share.
See accompanying notes which are an integral part of the financial statements.
Annual Report
Financial Highlights - Class F
Years ended July 31, | 2010 | 2009 I |
Selected Per-Share Data | | |
Net asset value, beginning of period | $ 11.22 | $ 10.27 |
Income from Investment Operations | | |
Net investment income (loss) D | .09 G | .01 |
Net realized and unrealized gain (loss) | 2.34 | .94 H |
Total from investment operations | 2.43 | .95 |
Distributions from net investment income | (.07) | - |
Redemption fees added to paid in capital D,K | - | - |
Net asset value, end of period | $ 13.58 | $ 11.22 |
Total Return B,C | 21.69% | 9.25% |
Ratios to Average Net Assets E,J | | |
Expenses before reductions | .90% | .86% A |
Expenses net of fee waivers, if any | .90% | .86% A |
Expenses net of all reductions | .89% | .86% A |
Net investment income (loss) | .67% G | .64% A |
Supplemental Data | | |
Net assets, end of period (000 omitted) | $ 109,868 | $ 159 |
Portfolio turnover rate F | 49% | 51% |
A Annualized
B Total returns for periods of less than one year are not annualized.
C Total returns would have been lower had certain expenses not been reduced during the periods shown.
D Calculated based on average shares outstanding during the period.
E Fees and expenses of the underlying Fidelity Central Funds are not included in the Fund's expense ratio. The Fund indirectly bears its proportionate share of the expenses of any underlying Fidelity Central Funds.
F Amount does not include the portfolio activity of any underlying Fidelity Central Funds.
G Investment income per share reflects a special dividend which amounted to $.03 per share. Excluding the special dividend, the ratio of net investment income (loss) to average net assets would have been .40%.
H The amount shown for a share outstanding does not correspond with the aggregate net gain (loss) on investments for the period due to the timing of sales and repurchases of shares in relation to fluctuating market values of the investments of the Fund.
I For the period June 26, 2009 (commencement of sale of shares) to July 31, 2009.
J Expense ratios reflect operating expenses of the class. Expenses before reductions do not reflect amounts reimbursed by the investment adviser or reductions from brokerage service arrangements or reductions from other expense offset arrangements and do not represent the amount paid by the class during periods when reimbursements or reductions occur. Expense ratios before reductions for start-up periods may not be representative of longer-term operating periods. Expenses net of fee waivers reflect expenses after reimbursement by the investment adviser but prior to reductions from brokerage service arrangements or other expense offset arrangements. Expenses net of all reductions represent the net expenses paid by the class.
K Amount represents less than $.01 per share.
See accompanying notes which are an integral part of the financial statements.
Annual Report
Financial Highlights - Institutional Class
Years ended July 31, | 2010 | 2009 | 2008 | 2007 | 2006 |
Selected Per-Share Data | | | | | |
Net asset value, beginning of period | $ 11.24 | $ 11.91 | $ 14.43 | $ 13.22 | $ 12.83 |
Income from Investment Operations | | | | | |
Net investment income (loss) B | .06 E | .10 | .03 | (.02) | .01 |
Net realized and unrealized gain (loss) | 2.34 | (.59) | (1.99) | 1.91 | .74 |
Total from investment operations | 2.40 | (.49) | (1.96) | 1.89 | .75 |
Distributions from net investment income | (.06) | (.07) | - | - | (.01) |
Distributions from net realized gain | - | (.11) | (.56) | (.68) | (.36) |
Total distributions | (.06) | (.18) | (.56) | (.68) | (.37) |
Redemption fees added to paid in capital B | - G | - G | - G | - G | .01 |
Net asset value, end of period | $ 13.58 | $ 11.24 | $ 11.91 | $ 14.43 | $ 13.22 |
Total Return A | 21.42% | (4.04)% | (14.10)% | 14.99% | 6.08% |
Ratios to Average Net Assets C,F | | | | | |
Expenses before reductions | 1.12% | 1.20% | 1.13% | 1.10% | 1.08% |
Expenses net of fee waivers, if any | 1.12% | 1.15% | 1.13% | 1.10% | 1.08% |
Expenses net of all reductions | 1.12% | 1.15% | 1.13% | 1.10% | 1.05% |
Net investment income (loss) | .45% E | 1.06% | .22% | (.13)% | .08% |
Supplemental Data | | | | | |
Net assets, end of period (000 omitted) | $ 78,440 | $ 10,336 | $ 8,584 | $ 11,594 | $ 9,422 |
Portfolio turnover rate D | 49% | 51% | 149% | 67% | 93% |
A Total returns would have been lower had certain expenses not been reduced during the periods shown.
B Calculated based on average shares outstanding during the period.
C Fees and expenses of the underlying Fidelity Central Funds are not included in the Fund's expense ratio. The Fund indirectly bears its proportionate share of the expenses of any underlying Fidelity Central Funds.
D Amount does not include the portfolio activity of any underlying Fidelity Central Funds.
E Investment income per share reflects a special dividend which amounted to $.03 per share. Excluding the special dividend, the ratio of net investment income (loss) to average net assets would have been .18%.
F Expense ratios reflect operating expenses of the class. Expenses before reductions do not reflect amounts reimbursed by the investment adviser or reductions from brokerage service arrangements or reductions from other expense offset arrangements and do not represent the amount paid by the class during periods when reimbursements or reductions occur. Expenses net of fee waivers reflect expenses after reimbursement by the investment adviser but prior to reductions from brokerage service arrangements or other expense offset arrangements. Expenses net of all reductions represent the net expenses paid by the class.
G Amount represents less than $.01 per share.
See accompanying notes which are an integral part of the financial statements.
Annual Report
Notes to Financial Statements
For the period ended July 31, 2010
1. Organization.
Fidelity Small Cap Value Fund (the Fund) is a fund of Fidelity Securities Fund (the Trust) and is authorized to issue an unlimited number of shares. The Trust is registered under the Investment Company Act of 1940, as amended (the 1940 Act), as an open-end management investment company organized as a Massachusetts business trust. The Fund offers Class A, Class T, Class B, Class C, Small Cap Value, Class F and Institutional Class shares, each of which has equal rights as to assets and voting privileges. Effective after the close of business on September 1, 2010, Class B shares will be closed to new accounts and additional purchases by existing shareholders. Each class has exclusive voting rights with respect to matters that affect that class. Class F shares of the Fund are only available for purchase by mutual funds for which Fidelity Management & Research Company (FMR) or an affiliate serves as investment manager. Class B shares will automatically convert to Class A shares after a holding period of seven years from the initial date of purchase. Investment income, realized and unrealized capital gains and losses, the common expenses of the Fund, and certain fund-level expense reductions, if any, are allocated on a pro-rata basis to each class based on the relative net assets of each class to the total net assets of the Fund. Each class differs with respect to transfer agent and distribution and service plan fees incurred. Certain expense reductions also differ by class.
2. Investments in Fidelity Central Funds.
The Fund may invest in Fidelity Central Funds, which are open-end investment companies available only to other investment companies and accounts managed by Fidelity Management & Research Company (FMR) and its affiliates. The Fund's Schedule of Investments lists each of the Fidelity Central Funds held as of period end, if any, as an investment of the Fund, but does not include the underlying holdings of each Fidelity Central Fund. As an Investing Fund, the Fund indirectly bears its proportionate share of the expenses of the underlying Fidelity Central Funds.
The Money Market Central Funds seek preservation of capital and current income and are managed by Fidelity Investments Money Management, Inc. (FIMM), an affiliate of FMR.
A complete unaudited list of holdings for each Fidelity Central Fund is available upon request or at the Securities and Exchange Commission (the SEC) web site at www.sec.gov. In addition, the financial statements of the Fidelity Central Funds, which are not covered by the Fund's Report of Independent Registered Public Accounting Firm, are available on the SEC web site or upon request.
Annual Report
Notes to Financial Statements - continued
3. Significant Accounting Policies.
The financial statements have been prepared in conformity with accounting principles generally accepted in the United States of America (GAAP), which require management to make certain estimates and assumptions at the date of the financial statements. Actual results could differ from those estimates. The following summarizes the significant accounting policies of the Fund:
Security Valuation. Investments are valued as of 4:00 p.m. Eastern time on the last calendar day of the period. The Fund uses independent pricing services approved by the Board of Trustees to value its investments. When current market prices or quotations are not readily available or reliable, valuations may be determined in good faith in accordance with procedures adopted by the Board of Trustees. Factors used in determining value may include market or security specific events. The frequency with which these procedures are used cannot be predicted and they may be utilized to a significant extent. The value used for net asset value (NAV) calculation under these procedures may differ from published prices for the same securities.
The Fund categorizes the inputs to valuation techniques used to value its investments into a disclosure hierarchy consisting of three levels as shown below.
Level 1 - quoted prices in active markets for identical investments
Level 2 - other significant observable inputs (including quoted prices for similar investments, interest rates, prepayment speeds, etc.)
Level 3 - unobservable inputs (including the fund's own assumptions based on the best information available)
Changes in valuation techniques may result in transfers in or out of an assigned level within the disclosure hierarchy. The aggregate value of investments by input level, as of July 31, 2010, is included at the end of the Fund's Schedule of Investments. Valuation techniques used to value the Fund's investments by major category are as follows.
Equity securities, including restricted securities, for which market quotations are readily available, are valued at the last reported sale price or official closing price as reported by an independent pricing service on the primary market or exchange on which they are traded and are categorized as Level 1 in the hierarchy. In the event there were no sales during the day or closing prices are not available, securities are valued at the last quoted bid price or may be valued using the last available price and are generally categorized as Level 2 in the hierarchy. For foreign equity securities, when significant market or security specific events arise, comparisons to the valuation of American Depositary Receipts (ADRs), futures contracts, Exchange-traded funds (ETFs) and certain indexes as well as
Annual Report
3. Significant Accounting Policies - continued
Security Valuation - continued
quoted prices for similar securities are used and are categorized as Level 2 in the hierarchy in these circumstances. Utilizing these techniques may result in transfers between Level 1 and Level 2. For restricted equity securities and private placements where observable inputs are limited, assumptions about market activity and risk are used and are categorized as Level 3 in the hierarchy.
Investments in open-end mutual funds, including the Fidelity Central Funds, are valued at their closing net asset value each business day and are categorized as Level 1 in the hierarchy. Short-term securities with remaining maturities of sixty days or less for which quotations are not readily available are valued at amortized cost, which approximates fair value and are categorized as Level 2 in the hierarchy.
Foreign Currency. The Fund uses foreign currency contracts to facilitate transactions in foreign-denominated securities. Gains and losses from these transactions may arise from changes in the value of the foreign currency or if the counterparties do not perform under the contracts' terms.
Foreign-denominated assets, including investment securities, and liabilities are translated into U.S. dollars at the exchange rate at period end. Purchases and sales of investment securities, income and dividends received and expenses denominated in foreign currencies are translated into U.S. dollars at the exchange rate in effect on the transaction date.
The effects of exchange rate fluctuations on investments are included with the net realized and unrealized gain (loss) on investment securities. Other foreign currency transactions resulting in realized and unrealized gain (loss) are disclosed separately.
Investment Transactions and Income. For financial reporting purposes, the Fund's investment holdings and NAV include trades executed through the end of the last business day of the period. The NAV per share for processing shareholder transactions is calculated as of the close of business of the New York Stock Exchange (NYSE), normally 4:00 p.m. Eastern time and includes trades executed through the end of the prior business day. Gains and losses on securities sold are determined on the basis of identified cost and may include proceeds received from litigation. Dividend income is recorded on the ex-dividend date, except for certain dividends from foreign securities where the ex-dividend date may have passed, which are recorded as soon as the Fund is informed of the ex-dividend date. Non-cash dividends included in dividend income, if any, are recorded at the fair market value of the securities received. Distributions received on securities that represent a return of capital or capital gain are recorded as a reduction of cost of investments and/or as a realized gain. The Fund estimates the components of
Annual Report
Notes to Financial Statements - continued
3. Significant Accounting Policies - continued
Investment Transactions and Income - continued
distributions received that may be considered return of capital distributions or capital gain distributions. Large, non-recurring dividends recognized by the Fund are presented separately on the Statement of Operations as "Special Dividends" and the impact of these dividends is presented in the Financial Highlights. Interest income and distributions from the Fidelity Central Funds are accrued as earned. Interest income includes coupon interest and amortization of premium and accretion of discount on debt securities. Investment income is recorded net of foreign taxes withheld where recovery of such taxes is uncertain.
Expenses. Most expenses of the Trust can be directly attributed to a fund. Expenses which cannot be directly attributed are apportioned amongst each fund in the Trust. Expense estimates are accrued in the period to which they relate and adjustments are made when actual amounts are known.
Income Tax Information and Distributions to Shareholders. Each year the Fund intends to qualify as a regulated investment company, including distributing substantially all of its taxable income and realized gains under Subchapter M of the Internal Revenue Code and filing its U.S. federal tax return. As a result, no provision for income taxes is required. As of July 31, 2010, the Fund did not have any unrecognized tax benefits in the accompanying financial statements. A fund's federal tax return is subject to examination by the Internal Revenue Service (IRS) for a period of three years. Foreign taxes are provided for based on the Fund's understanding of the tax rules and rates that exist in the foreign markets in which it invests.
Distributions are recorded on the ex-dividend date. Income dividends and capital gain distributions are declared separately for each class. Income and capital gain distributions are determined in accordance with income tax regulations, which may differ from GAAP. In addition, the Fund claimed a portion of the payment made to redeeming shareholders as a distribution for income tax purposes.
Capital accounts within the financial statements are adjusted for permanent book-tax differences. These adjustments have no impact on net assets or the results of operations. Temporary book-tax differences will reverse in a subsequent period.
Book-tax differences are primarily due to the short-term gain distributions from the Fidelity Central Funds, foreign currency transactions, market discount, capital loss carryforwards and losses deferred due to wash sales and excise tax regulations.
Annual Report
3. Significant Accounting Policies - continued
Income Tax Information and Distributions to Shareholders - continued
The federal tax cost of investment securities and unrealized appreciation (depreciation) as of period end were as follows:
Gross unrealized appreciation | $ 346,140,241 |
Gross unrealized depreciation | (160,277,473) |
Net unrealized appreciation (depreciation) | $ 185,862,768 |
| |
Tax Cost | $ 2,019,761,280 |
The tax-based components of distributable earnings as of period end were as follows:
Undistributed ordinary income | $ 5,209,766 |
Undistributed long-term capital gain | $ 11,456,174 |
Net unrealized appreciation (depreciation) | $ 185,870,895 |
The tax character of distributions paid was as follows:
| July 31, 2010 | July 31, 2009 |
Ordinary Income | $ 6,560,137 | $ 8,301,273 |
Long-term Capital Gains | - | 12,095,172 |
Total | $ 6,560,137 | $ 20,396,445 |
Short-Term Trading (Redemption) Fees. Shares held in the Fund less than 90 days are subject to a redemption fee equal to 1.50% of the proceeds of the redeemed shares. All redemption fees, including any estimated redemption fees paid by FMR, are retained by the Fund and accounted for as an addition to paid in capital.
4. Purchases and Sales of Investments.
Purchases and sales of securities, other than short-term securities, aggregated $1,124,184,474 and $918,879,120, respectively.
5. Fees and Other Transactions with Affiliates.
Management Fee. FMR and its affiliates provide the Fund with investment management related services for which the Fund pays a monthly management fee. The management fee is the sum of an individual fund fee rate that is based on an annual rate of .45% of the Fund's average net assets and a group fee rate that averaged .26% during the period. The group fee rate is based upon the average net assets of all the mutual funds advised by FMR. The group fee rate decreases as assets under management increase and
Annual Report
Notes to Financial Statements - continued
5. Fees and Other Transactions with Affiliates - continued
Management Fee - continued
increases as assets under management decrease. In addition, the management fee is subject to a performance adjustment (up to a maximum of ±.20% of the Fund's average net assets over a 36 month performance period). The upward or downward adjustment to the management fee is based on the relative investment performance of the retail class of the Fund, Small Cap Value as compared to an appropriate benchmark index. For the period, the total annual management fee rate, including the performance adjustment, was .85% of the Fund's average net assets.
Distribution and Service Plan. In accordance with Rule 12b-1 of the 1940 Act, the Fund has adopted separate Distribution and Service Plans for each class of shares. Certain classes pay Fidelity Distributors Corporation (FDC), an affiliate of FMR, separate Distribution and Service Fees, each of which is based on an annual percentage of each class' average net assets. In addition, FDC may pay financial intermediaries for selling shares of the Fund and providing shareholder support services. For the period, the Distribution and Service Fee rates and the total amounts paid to and retained by FDC were as follows:
| Distribution
Fee | Service
Fee | Paid to
FDC | Retained
by FDC |
Class A | -% | .25% | $ 191,085 | $ 8,941 |
Class T | .25% | .25% | 179,850 | - |
Class B | .75% | .25% | 86,355 | 64,822 |
Class C | .75% | .25% | 294,586 | 80,570 |
| | | $ 751,876 | $ 154,333 |
Sales Load. FDC receives a front-end sales charge of up to 5.75% for selling Class A shares, and 3.50% for selling Class T shares, some of which is paid to financial intermediaries for selling shares of the Fund. FDC receives the proceeds of contingent deferred sales charges levied on Class A, Class T, Class B, and Class C redemptions. These charges depend on the holding period. The deferred sales charges range from 5% to 1% for Class B, 1% for Class C, 1.00% for certain purchases of Class A shares (1.00% to .50% prior to July 12, 2010) and .25% for certain purchases of Class T shares.
Annual Report
5. Fees and Other Transactions with Affiliates - continued
Sales Load - continued
For the period, sales charge amounts retained by FDC were as follows:
| Retained
by FDC |
Class A | $ 48,522 |
Class T | 8,611 |
Class B* | 21,775 |
Class C* | 3,135 |
| $ 82,043 |
* When Class B and Class C shares are initially sold, FDC pays commissions from its own resources to financial intermediaries through which the sales are made.
Transfer Agent Fees. Fidelity Investments Institutional Operations Company, Inc. (FIIOC), an affiliate of FMR, is the transfer, dividend disbursing and shareholder servicing agent for each class of the Fund. FIIOC receives account fees and asset-based fees that vary according to the account size and type of account of the shareholders of respective classes of the Fund, except for Class F. FIIOC receives no fees for providing transfer agency services to Class F. FIIOC pays for typesetting, printing and mailing of shareholder reports, except proxy statements. For the period, the total transfer agent fees paid by each class were as follows:
| Amount | % of
Average
Net Assets |
Class A | $ 243,601 | .32 |
Class T | 116,575 | .32 |
Class B | 27,836 | .32 |
Class C | 94,179 | .32 |
Small Cap Value | 4,734,141 | .28 |
Institutional Class | 93,931 | .22 |
| $ 5,310,263 | |
Accounting and Security Lending Fees. Fidelity Service Company, Inc. (FSC), an affiliate of FMR, maintains the Fund's accounting records. The accounting fee is based on the level of average net assets for the month. Under a separate contract, FSC administers the security lending program. The security lending fee is based on the number and duration of lending transactions.
Annual Report
Notes to Financial Statements - continued
5. Fees and Other Transactions with Affiliates - continued
Brokerage Commissions. The Fund placed a portion of its portfolio transactions with brokerage firms which are affiliates of the investment adviser. The commissions paid to these affiliated firms were $17,973 for the period.
Interfund Lending Program. Pursuant to an Exemptive Order issued by the SEC, the Fund, along with other registered investment companies having management contracts with FMR, may participate in an interfund lending program. This program provides an alternative credit facility allowing the funds to borrow from, or lend money to, other participating affiliated funds. At period end, there were no interfund loans outstanding. The Fund's activity in this program during the period for which loans were outstanding was as follows:
Borrower or Lender | Average Daily
Loan Balance | Weighted Average
Interest Rate | Interest
Expense |
Borrower | $ 7,401,500 | .39% | $ 635 |
6. Committed Line of Credit.
The Fund participates with other funds managed by FMR in a $3.75 billion credit facility (the "line of credit") to be utilized for temporary or emergency purposes to fund shareholder redemptions or for other short-term liquidity purposes. The Fund has agreed to pay commitment fees on its pro-rata portion of the line of credit, which amounted to $7,433 and is reflected in Miscellaneous expenses on the Statement of Operations. During the period, there were no borrowings on this line of credit.
7. Security Lending.
The Fund lends portfolio securities from time to time in order to earn additional income. On the settlement date of the loan, the Fund receives collateral (in the form of U.S. Treasury obligations, letters of credit and/or cash) against the loaned securities and maintains collateral in an amount not less than 100% of the market value of the loaned securities during the period of the loan. The market value of the loaned securities is determined at the close of business of the Fund and any additional required collateral is delivered to the Fund on the next business day. If the borrower defaults on its obligation to return the securities loaned because of insolvency or other reasons, a fund could experience delays and costs in recovering the securities loaned or in gaining access to the collateral. Any cash collateral received is invested in the Fidelity Securities Lending Cash Central Fund. The value of loaned securities and cash collateral at period end are disclosed on the Fund's Statement of Assets and Liabilities. Security lending income represents the income earned on investing cash collateral, less fees and expenses
Annual Report
7. Security Lending - continued
associated with the loan, plus any premium payments that may be received on the loan of certain types of securities. Security lending income is presented in the Statement of Operations as a component of income from Fidelity Central Funds. Net income from lending portfolio securities during the period amounted to $278,970.
8. Expense Reductions.
FMR voluntarily agreed to reimburse each class to the extent annual operating expenses exceeded certain levels of average net assets as noted in the table below. Some expenses, for example interest expense, including commitment fees, are excluded from this reimbursement.
The following classes were in reimbursement during the period:
| Expense
Limitations | Reimbursement
from adviser |
Class A | 1.40% | $ 52,534 |
Class T | 1.65% | 26,830 |
Class B | 2.15% | 6,293 |
Class C | 2.15% | 20,630 |
| | $ 106,287 |
Effective October 1, 2010 the expense limitations will be eliminated.
Many of the brokers with whom FMR places trades on behalf of the Fund provided services to the Fund in addition to trade execution. These services included payments of certain expenses on behalf of the Fund totaling $106,964 for the period.
9. Distributions to Shareholders.
Distributions to shareholders of each class were as follows:
Years ended July 31, | 2010 | 2009 |
From net investment income | | |
Class A | $ 159,193 | $ 252,162 |
Class T | 36,920 | 111,704 |
Class B | - | 20,177 |
Class C | - | 45,207 |
Small Cap Value | 6,230,380 | 7,822,387 |
Class F | 28,266 | - |
Institutional Class | 105,378 | 49,636 |
Total | $ 6,560,137 | $ 8,301,273 |
Annual Report
Notes to Financial Statements - continued
9. Distributions to Shareholders - continued
Distributions to shareholders of each class were as follows: - continued
Years ended July 31, | 2010 | 2009 |
From net realized gain | | |
Class A | $ - | $ 496,925 |
Class T | - | 350,121 |
Class B | - | 77,046 |
Class C | - | 207,577 |
Small Cap Value | - | 10,883,170 |
Institutional Class | - | 80,333 |
Total | $ - | $ 12,095,172 |
10. Share Transactions.
Transactions for each class of shares were as follows:
| Shares | Dollars |
Years ended July 31, | 2010 | 2009A | 2010 | 2009A |
Class A | | | | |
Shares sold | 4,231,111 | 2,028,986 | $ 54,936,600 | $ 19,478,233 |
Reinvestment of distributions | 12,276 | 64,970 | 146,358 | 694,477 |
Shares redeemed | (1,973,236) | (1,588,437) | (25,421,999) | (14,658,645) |
Net increase (decrease) | 2,270,151 | 505,519 | $ 29,660,959 | $ 5,514,065 |
Class T | | | | |
Shares sold | 1,449,265 | 1,489,054 | $ 18,793,141 | $ 15,806,614 |
Reinvestment of distributions | 3,030 | 40,641 | 35,906 | 449,360 |
Shares redeemed | (727,616) | (1,680,727) | (9,211,959) | (14,685,646) |
Net increase (decrease) | 724,679 | (151,032) | $ 9,617,088 | $ 1,570,328 |
Class B | | | | |
Shares sold | 262,419 | 305,827 | $ 3,340,905 | $ 3,051,319 |
Reinvestment of distributions | - | 7,759 | - | 85,943 |
Shares redeemed | (174,554) | (335,978) | (2,189,700) | (2,971,686) |
Net increase (decrease) | 87,865 | (22,392) | $ 1,151,205 | $ 165,576 |
Class C | | | | |
Shares sold | 1,327,692 | 832,906 | $ 17,060,657 | $ 7,981,000 |
Reinvestment of distributions | - | 19,410 | - | 217,621 |
Shares redeemed | (434,251) | (694,752) | (5,448,332) | (6,287,773) |
Net increase (decrease) | 893,441 | 157,564 | $ 11,612,325 | $ 1,910,848 |
Annual Report
10. Share Transactions - continued
Transactions for each class of shares were as follows: - continued
| Shares | Dollars |
Years ended July 31, | 2010 | 2009A | 2010 | 2009A |
Small Cap Value | | | | |
Shares sold | 45,122,251 | 61,277,579 | $ 585,925,779 | $ 600,357,815 |
Reinvestment of distributions | 507,903 | 1,741,583 | 6,101,827 | 18,397,974 |
Shares redeemed | (47,781,912) | (25,782,005) | (605,149,428) | (237,589,067) |
Net increase (decrease) | (2,151,758) | 37,237,157 | $ (13,121,822) | $ 381,166,722 |
Class F | | | | |
Shares sold | 8,411,513 | 14,205 | $ 109,778,609 | $ 144,857 |
Reinvestment of distributions | 2,350 | - | 28,266 | - |
Shares redeemed | (337,999) | (18) | (4,618,215) | (181) |
Net increase (decrease) | 8,075,864 | 14,187 | $ 105,188,660 | $ 144,676 |
Institutional Class | | | | |
Shares sold | 5,522,070 | 479,087 | $ 73,692,691 | $ 4,626,811 |
Reinvestment of distributions | 7,512 | 8,812 | 90,344 | 93,632 |
Shares redeemed | (671,565) | (288,597) | (8,789,847) | (2,736,358) |
Net increase (decrease) | 4,858,017 | 199,302 | $ 64,993,188 | $ 1,984,085 |
A Share transactions for Class F are for the period June 26, 2009 (commencement of sale of shares) to July 31, 2009.
11. Other.
The Fund's organizational documents provide former and current trustees and officers with a limited indemnification against liabilities arising in connection with the performance of their duties to the Fund. In the normal course of business, the Fund may also enter into contracts that provide general indemnifications. The Fund's maximum exposure under these arrangements is unknown as this would be dependent on future claims that may be made against the Fund. The risk of material loss from such claims is considered remote.
At the end of the period, the Fidelity Freedom Funds and the Fidelity Freedom K Funds were the owners of record, in the aggregate, of approximately 38% of the total outstanding shares of the Fund.
Annual Report
To the Trustees of Fidelity Securities Fund and the Shareholders of Fidelity Small Cap Value Fund:
In our opinion, the accompanying statement of assets and liabilities, including the schedule of investments, and the related statements of operations and of changes in net assets and the financial highlights present fairly, in all material respects, the financial position of Fidelity Small Cap Value Fund (a fund of Fidelity Securities Fund) at July 31, 2010, the results of its operations for the year then ended, the changes in its net assets for each of the two years in the period then ended and the financial highlights for each of the periods indicated, in conformity with accounting principles generally accepted in the United States of America. These financial statements and financial highlights (hereafter referred to as "financial statements") are the responsibility of the Fidelity Small Cap Value Fund's management. Our responsibility is to express an opinion on these financial statements based on our audits. We conducted our audits of these financial statements in accordance with the standards of the Public Company Accounting Oversight Board (United States). Those standards require that we plan and perform the audit to obtain reasonable assurance about whether the financial statements are free of material misstatement. An audit includes examining, on a test basis, evidence supporting the amounts and disclosures in the financial statements, assessing the accounting principles used and significant estimates made by management, and evaluating the overall financial statement presentation. We believe that our audits, which included confirmation of securities at July 31, 2010 by correspondence with the custodian and brokers, provide a reasonable basis for our opinion.
/s/ PricewaterhouseCoopers LLP
PricewaterhouseCoopers LLP
Boston, Massachusetts
September 14, 2010
Annual Report
The Trustees, Member of the Advisory Board, and executive officers of the trust and fund, as applicable, are listed below. The Board of Trustees governs the fund and is responsible for protecting the interests of shareholders. The Trustees are experienced executives who meet periodically throughout the year to oversee the fund's activities, review contractual arrangements with companies that provide services to the fund, oversee management of the risks associated with such activities and contractual arrangements, and review the fund's performance. Except for James C. Curvey, each of the Trustees oversees 222 funds advised by FMR or an affiliate. Mr. Curvey oversees 411 funds advised by FMR or an affiliate.
The Trustees hold office without limit in time except that (a) any Trustee may resign; (b) any Trustee may be removed by written instrument, signed by at least two-thirds of the number of Trustees prior to such removal; (c) any Trustee who requests to be retired or who has become incapacitated by illness or injury may be retired by written instrument signed by a majority of the other Trustees; and (d) any Trustee may be removed at any special meeting of shareholders by a two-thirds vote of the outstanding voting securities of the trust. Each Trustee who is not an interested person (as defined in the 1940 Act) (Independent Trustee), shall retire not later than the last day of the calendar year in which his or her 72nd birthday occurs. The Independent Trustees may waive this mandatory retirement age policy with respect to individual Trustees. The executive officers and Advisory Board Member hold office without limit in time, except that any officer and Advisory Board Member may resign or may be removed by a vote of a majority of the Trustees at any regular meeting or any special meeting of the Trustees. Except as indicated, each individual has held the office shown or other offices in the same company for the past five years.
Experience, Skills, Attributes, and Qualifications of the Fund's Trustees. The Governance and Nominating Committee has adopted a statement of policy that describes the experience, qualifications, attributes, and skills that are necessary and desirable for potential Independent Trustee candidates (Statement of Policy). The Board believes that each Trustee satisfied at the time he or she was initially elected or appointed a Trustee, and continues to satisfy, the standards contemplated by the Statement of Policy. The Governance and Nominating Committee also engages professional search firms to help identify potential Independent Trustee candidates who have the experience, qualifications, attributes, and skills consistent with the Statement of Policy. From time to time, additional criteria based on the composition and skills of the current Independent Trustees, as well as experience or skills that may be appropriate in light of future changes to board composition, business conditions, and regulatory or other developments, have also been considered by the professional search firms and the Governance and Nominating Committee. In addition, the Board takes into account the Trustees' commitment and participation in Board and committee meetings, as well as their leadership of standing and ad hoc committees throughout their tenure.
In determining that a particular Trustee was and continues to be qualified to serve as a Trustee, the Board has considered a variety of criteria, none of which, in isolation, was controlling. The Board believes that, collectively, the Trustees have balanced and diverse experience, qualifications, attributes, and skills, which allow the Board to operate effectively in governing the fund and protecting the interests of shareholders. Information about the specific experience, skills, attributes, and qualifications of each Trustee, which in each case led to the Board's conclusion that the Trustee should serve (or continue to serve) as a trustee of the fund, is provided below.
Annual Report
Board Structure and Oversight Function. Edward C. Johnson 3d is an interested person (as defined in the 1940 Act) and currently serves as Chairman. The Trustees have determined that an interested Chairman is appropriate and benefits shareholders because an interested Chairman has a personal and professional stake in the quality and continuity of services provided to the fund. Independent Trustees exercise their informed business judgment to appoint an individual of their choosing to serve as Chairman, regardless of whether the Trustee happens to be independent or a member of management. The Independent Trustees have determined that they can act independently and effectively without having an Independent Trustee serve as Chairman and that a key structural component for assuring that they are in a position to do so is for the Independent Trustees to constitute a substantial majority for the Board. The Independent Trustees also regularly meet in executive session. Ned C. Lautenbach serves as Chairman of the Independent Trustees and as such (i) acts as a liaison between the Independent Trustees and management with respect to matters important to the Independent Trustees and (ii) with management prepares agendas for Board meetings.
Fidelity funds are overseen by different Boards of Trustees. The fund's Board oversees Fidelity's equity and high income funds and another Board oversees Fidelity's investment-grade bond, money market, and asset allocation funds. The asset allocation funds may invest in Fidelity funds overseen by the fund's Board. The use of separate Boards, each with its own committee structure, allows the Trustees of each group of Fidelity funds to focus on the unique issues of the funds they oversee, including common research, investment, and operational issues. On occasion, the separate Boards establish joint committees to address issues of overlapping consequences for the Fidelity funds overseen by each Board.
The Trustees operate using a system of committees to facilitate the timely and efficient consideration of all matters of importance to the Trustees, the fund, and fund shareholders and to facilitate compliance with legal and regulatory requirements and oversight of the fund's activities and associated risks. The Board, acting through its committees, has charged FMR and its affiliates with (i) identifying events or circumstances the occurrence of which could have demonstrably adverse effects on the fund's business and/or reputation; (ii) implementing processes and controls to lessen the possibility that such events or circumstances occur or to mitigate the effects of such events or circumstances if they do occur; and (iii) creating and maintaining a system designed to evaluate continuously business and market conditions in order to facilitate the identification and implementation processes described in (i) and (ii) above. Because the day-to-day operations and activities of the fund are carried out by or through FMR, its affiliates and other service providers, the fund's exposure to risks is mitigated but not eliminated by the processes overseen by the Trustees. While each of the Board's committees has responsibility for overseeing different aspects of the fund's activities, oversight is exercised primarily through the Operations, Audit, and Compliance Committees. Appropriate personnel, including but not limited to the fund's Chief Compliance Officer (CCO), FMR's internal auditor, the independent accountants, the fund's Treasurer and portfolio management personnel, make periodic reports to the Board's committees, as appropriate. The responsibilities of each committee, including their oversight responsibilities, are described further under "Standing Committees of the Fund's Trustees."
Annual Report
Trustees and Officers - continued
The fund's Statement of Additional Information (SAI) includes more information about the Trustees. To request a free copy, call Fidelity at 1-877-208-0098.
Interested Trustees*:
Correspondence intended for each Trustee who is an interested person may be sent to Fidelity Investments, 82 Devonshire Street, Boston, Massachusetts 02109.
Name, Age; Principal Occupations and Other Relevant Experience+ |
Edward C. Johnson 3d (80) |
| Year of Election or Appointment: 1984 Mr. Johnson is Trustee and Chairman of the Board of Trustees of certain Trusts. Mr. Johnson serves as Chief Executive Officer, Chairman, and a Director of FMR LLC; Chairman and a Director of FMR; Chairman and a Director of Fidelity Research & Analysis Company (FRAC); Chairman and a Director of Fidelity Investments Money Management, Inc.; and Chairman and a Director of FMR Co., Inc. In addition, Mr. Johnson serves as Chairman and Director of FIL Limited. Previously, Mr. Johnson served as President of FMR LLC (2006-2007). |
James C. Curvey (75) |
| Year of Election or Appointment: 2007 Mr. Curvey also serves as Trustee (2007-present) of other investment companies advised by FMR. Mr. Curvey is a Director of FMR and FMR Co., Inc. (2007-present). Mr. Curvey is also Vice Chairman (2006-present) and Director of FMR LLC. In addition, Mr. Curvey serves as an Overseer for the Boston Symphony Orchestra and a member of the Trustees of Villanova University. |
* Trustees have been determined to be "Interested Trustees" by virtue of, among other things, their affiliation with the trust or various entities under common control with FMR.
+ The information above includes each Trustee's principal occupation during the last five years and other information relating to the experience, attributes, and skills relevant to each Trustee's qualifications to serve as a Trustee, which led to the conclusion that each Trustee should serve as a Trustee for the fund.
Annual Report
Independent Trustees:
Correspondence intended for each Independent Trustee (that is, the Trustees other than the Interested Trustees) may be sent to Fidelity Investments, P.O. Box 55235, Boston, Massachusetts 02205-5235.
Name, Age; Principal Occupations and Other Relevant Experience+ |
Dennis J. Dirks (62) |
| Year of Election or Appointment: 2005 Prior to his retirement in May 2003, Mr. Dirks was Chief Operating Officer and a member of the Board of The Depository Trust & Clearing Corporation (DTCC). He also served as President, Chief Operating Officer, and Board member of The Depository Trust Company (DTC) and President and Board member of the National Securities Clearing Corporation (NSCC). In addition, Mr. Dirks served as Chief Executive Officer and Board member of the Government Securities Clearing Corporation, Chief Executive Officer and Board member of the Mortgage-Backed Securities Clearing Corporation, as a Trustee and a member of the Finance Committee of Manhattan College (2005-2008), and as a Trustee and a member of the Finance Committee of AHRC of Nassau County (2006-2008). Currently, Mr. Dirks serves as a member of the Board of Directors for The Brookville Center for Children's Services, Inc. (2009-present). |
Alan J. Lacy (56) |
| Year of Election or Appointment: 2008 Mr. Lacy serves as Senior Adviser (2007-present) of Oak Hill Capital Partners, L.P. (private equity). Mr. Lacy also served as Chief Executive Officer (2000-2005) and Vice Chairman (2005-2006) of Sears Holdings Corporation and Sears, Roebuck and Co. (retail). In addition, Mr. Lacy serves as a member of the Board of Directors of The Western Union Company (global money transfer, 2006-present) and Bristol-Myers Squibb Company (global pharmaceuticals, 2007-present). Mr. Lacy is Chairman (2008-present) and a member (2006-present) of the Board of Trustees of The National Parks Conservation Association. |
Ned C. Lautenbach (66) |
| Year of Election or Appointment: 2000 Mr. Lautenbach is Chairman of the Independent Trustees of the Equity and High Income Funds (2006-present). Mr. Lautenbach is an Advisory Partner of Clayton, Dubilier & Rice, Inc. (private equity investment, 2008-present) and was previously a Partner of Clayton, Dubilier & Rice, Inc. (1998-2008). Previously, Mr. Lautenbach was with the International Business Machines Corporation (IBM) from 1968 until his retirement in 1998. Mr. Lautenbach serves as a Director of Eaton Corporation (diversified industrial) as well as the Philharmonic Center for the Arts in Naples, Florida. Mr. Lautenbach is also a member of the Board of Trustees of Fairfield University (2005-present), as well as a member of the Council on Foreign Relations. Previously, Mr. Lautenbach served as a Director of Sony Corporation (2006-2007). |
Joseph Mauriello (65) |
| Year of Election or Appointment: 2008 Prior to his retirement in January 2006, Mr. Mauriello served in numerous senior management positions including Deputy Chairman and Chief Operating Officer (2004-2005), and Vice Chairman of Financial Services (2002-2004) of KPMG LLP US (professional services, 1965-2005). Mr. Mauriello currently serves as a member of the Board of Directors of XL Capital Ltd. (global insurance and re-insurance, 2006-present) and of Arcadia Resources Inc. (health care services and products, 2007-
present). Previously, Mr. Mauriello served as a Director of the Hamilton Funds of the Bank of New York (2006-2007). |
Cornelia M. Small (66) |
| Year of Election or Appointment: 2005 Ms. Small is a member of the Board of Directors of the Teagle Foundation (2009-present). Ms. Small is also a member of the Investment Committee, and Chair (2008-present) and a member of the Board of Trustees of Smith College. In addition, Ms. Small serves on the Investment Committee of the Berkshire Taconic Community Foundation (2008-present). Previously, Ms. Small served as Chairperson of the Investment Committee (2002-2008) of Smith College. In addition, Ms. Small served as Chief Investment Officer, Director of Global Equity Investments, and a member of the Board of Directors of Scudder, Stevens & Clark and Scudder Kemper Investments. |
William S. Stavropoulos (71) |
| Year of Election or Appointment: 2002 Mr. Stavropoulos is Vice Chairman of the Independent Trustees of the Equity and High Income Funds (2006-present). Mr. Stavropoulos serves as President and Founder of the Michigan Baseball Foundation, the Great Lakes Loons (2007-present). Mr. Stavropoulos is Chairman Emeritus of the Board of Directors of The Dow Chemical Company, where he previously served in numerous senior management positions, including President, CEO (1995-2000; 2002-2004), Chairman of the Executive Committee (2000-2006), and as a member of the Board of Directors (1990-2006). Currently, Mr. Stavropoulos is a Director of Teradata Corporation (data warehousing and technology solutions, 2008-present), Chemical Financial Corporation, Maersk Inc. (industrial conglomerate), Tyco International, Inc. (multinational manufacturing and services, 2007-present), and a member of the Advisory Board for Metalmark Capital (private equity investment, 2005-present). Mr. Stavropoulos is a special advisor to Clayton, Dubilier & Rice, Inc. (private equity investment). In addition, Mr. Stavropoulos is a member of the University of Notre Dame Advisory Council for the College of Science. |
David M. Thomas (61) |
| Year of Election or Appointment: 2008 Previously, Mr. Thomas served as Executive Chairman (2005-2006) and Chairman and Chief Executive Officer (2000-2005) of IMS Health, Inc. (pharmaceutical and healthcare information solutions). In addition, Mr. Thomas serves as a member of the Board of Directors of Fortune Brands, Inc. (consumer products), and Interpublic Group of Companies, Inc. (marketing communication, 2004-present). |
Michael E. Wiley (59) |
| Year of Election or Appointment: 2008 Mr. Wiley also serves as a Director of Asia Pacific Exploration Consolidated (international oil and gas exploration and production, 2008-present), and as a member of the Board of Trustees of the University of Tulsa (2000-2006; 2007-present). Mr. Wiley serves as a Director of Tesoro Corporation (independent oil refiner and marketer, 2005-present), and a Director of Bill Barrett Corporation (exploration and production, 2005-present). In addition, Mr. Wiley also serves as a Director of Post Oak Bank (privately-held bank, 2004-present). Previously, Mr. Wiley served as a Sr. Energy Advisor of Katzenbach Partners, LLC (consulting, 2006-2007), as an Advisory Director of Riverstone Holdings (private investment), Chairman, President, and CEO of Baker Hughes, Inc. (oilfield services, 2000-2004), and as Director of Spinnaker Exploration Company (exploration and production, 2001-2005). |
+ The information above includes each Trustee's principal occupation during the last five years and other information relating to the experience, attributes, and skills relevant to each Trustee's qualifications to serve as a Trustee, which led to the conclusion that each Trustee should serve as a Trustee for the fund.
Advisory Board Member and Executive Officers:
Correspondence intended for each executive officer and Peter S. Lynch may be sent to Fidelity Investments, 82 Devonshire Street, Boston, Massachusetts 02109.
Name, Age; Principal Occupation |
Peter S. Lynch (66) |
| Year of Election or Appointment: 2003 Member of the Advisory Board of Fidelity's Equity and High Income Funds. Mr. Lynch is Vice Chairman and a Director of FMR and FMR Co., Inc. In addition, Mr. Lynch serves as a Trustee of Boston College and as the Chairman of the Inner-City Scholarship Fund. Previously, Mr. Lynch served on the Special Olympics International Board of Directors (1997-2006). |
Kenneth B. Robins (40) |
| Year of Election or Appointment: 2008 President and Treasurer of Fidelity's Equity and High Income Funds. Mr. Robins also serves as President and Treasurer (2010-present) and Assistant Treasurer (2009-present) of other Fidelity funds and is an employee of Fidelity Investments (2004-present). Previously, Mr. Robins served as Deputy Treasurer of the Fidelity funds (2005-2008) and Treasurer and Chief Financial Officer of The North Carolina Capital Management Trust: Cash and Term Portfolios (2006-2008). |
Brian B. Hogan (45) |
| Year of Election or Appointment: 2009 Vice President of certain Equity Funds and Vice President of Sector Funds. Mr. Hogan also serves as Senior Vice President, Equity Research of FMR (2006-present) and President of FMR's Equity Division (2009-
present). Previously, Mr. Hogan served as a portfolio manager. |
Thomas C. Hense (46) |
| Year of Election or Appointment: 2008 or 2010 Vice President of Fidelity's High Income (2008), Small Cap (2008), and Value (2010) Funds. Previously, Mr. Hense served as a portfolio manager for Fidelity's Institutional Money Management Group (Pyramis) (2003-2008). |
Scott C. Goebel (42) |
| Year of Election or Appointment: 2008 Secretary and Chief Legal Officer (CLO) of the Fidelity funds. Mr. Goebel also serves as General Counsel, Secretary, and Senior Vice President of FMR (2008-present) and FMR Co., Inc. (2008-present); Deputy General Counsel of FMR LLC; Chief Legal Officer of Fidelity Management & Research (Hong Kong) Limited (2008-present) and Assistant Secretary of Fidelity Management & Research (Japan) Inc. (2008-present), Fidelity Investments Money Management, Inc. (2008-present), Fidelity Management & Research (U.K.) Inc. (2008-present), and Fidelity Research and Analysis Company (2008-present). Previously, Mr. Goebel served as Assistant Secretary of the Funds (2007-2008) and as Vice President and Secretary of Fidelity Distributors Corporation (FDC) (2005-2007). |
William C. Coffey (41) |
| Year of Election or Appointment: 2009 Assistant Secretary of Fidelity's Equity and High Income Funds. Mr. Coffey also serves as Senior Vice President and Deputy General Counsel of FMR LLC (2010-present), and is an employee of Fidelity Investments. Previously, Mr. Coffey served as Vice President and Associate General Counsel of FMR LLC (2005-2009). |
Holly C. Laurent (56) |
| Year of Election or Appointment: 2008 Anti-Money Laundering (AML) Officer of the Fidelity funds. Ms. Laurent is an employee of Fidelity Investments. Previously, Ms. Laurent was Senior Vice President and Head of Legal for Fidelity Business Services India Pvt. Ltd. (2006-2008), and Senior Vice President, Deputy General Counsel and Group Head for FMR LLC (2005-2006). |
Christine Reynolds (51) |
| Year of Election or Appointment: 2008 Chief Financial Officer of the Fidelity funds. Ms. Reynolds became President of Fidelity Pricing and Cash Management Services (FPCMS) in August 2008. Ms. Reynolds served as Chief Operating Officer of FPCMS (2007-2008). Previously, Ms. Reynolds served as President, Treasurer, and Anti-Money Laundering officer of the Fidelity funds (2004-2007). |
Kenneth A. Rathgeber (63) |
| Year of Election or Appointment: 2004 Chief Compliance Officer of Fidelity's Equity and High Income Funds. Mr. Rathgeber is Chief Compliance Officer of Fidelity Management & Research (Hong Kong) Limited (2008-present), Fidelity Management & Research (Japan) Inc. (2008-present), FMR (2005-present), FMR Co., Inc. (2005-present), Fidelity Management & Research (U.K.) Inc. (2005-present), Fidelity Research & Analysis Company (2005-present), Fidelity Investments Money Management, Inc. (2005-present), Pyramis Global Advisors, LLC (2005-present), and Strategic Advisers, Inc. (2005-present). |
Jeffrey S. Christian (48) |
| Year of Election or Appointment: 2009 Deputy Treasurer of the Fidelity funds. Mr. Christian is an employee of Fidelity Investments. Previously, Mr. Christian served as Chief Financial Officer (2008-2009) of certain Fidelity funds and Senior Vice President of Fidelity Pricing and Cash Management Services (FPCMS) (2004-2009). |
Bryan A. Mehrmann (49) |
| Year of Election or Appointment: 2005 Deputy Treasurer of the Fidelity funds. Mr. Mehrmann is an employee of Fidelity Investments. |
Adrien E. Deberghes (42) |
| Year of Election or Appointment: 2008 Deputy Treasurer of Fidelity's Equity and High Income Funds. Mr. Deberghes also serves as Assistant Treasurer of other Fidelity funds (2010-present) and is an employee of Fidelity Investments (2008-present). Previously, Mr. Deberghes served as Senior Vice President of Mutual Fund Administration at State Street Corporation (2007-
2008), Senior Director of Mutual Fund Administration at Investors Bank & Trust (2005-2007), and Director of Finance for Dunkin' Brands (2000-2005). |
Stephanie J. Dorsey (41) |
| Year of Election or Appointment: 2010 Assistant Treasurer of Fidelity's Equity and High Income Funds. Ms. Dorsey also serves as Deputy Treasurer of other Fidelity funds (2008-present) and is an employee of Fidelity Investments (2008-
present). Previously, Ms. Dorsey served as Treasurer (2004-2008) of the JPMorgan Mutual Funds and Vice President (2004-2008) of JPMorgan Chase Bank. |
John R. Hebble (52) |
| Year of Election or Appointment: 2009 Assistant Treasurer of Fidelity's Equity and High Income Funds. Mr. Hebble also serves as Treasurer and Chief Financial Officer of The North Carolina Capital Management Trust: Cash and Term Portfolio (2008-present), President and Treasurer of other Fidelity funds (2008-
present) and is an employee of Fidelity Investments. |
Gary W. Ryan (51) |
| Year of Election or Appointment: 2005 Assistant Treasurer of the Fidelity funds. Mr. Ryan is an employee of Fidelity Investments. Previously, Mr. Ryan served as Vice President of Fund Reporting in Fidelity Pricing and Cash Management Services (FPCMS) (1999-2005). |
Annual Report
The Board of Trustees of Fidelity Small Cap Value Fund voted to pay shareholders of record at the opening of business on record date, the following distributions per share derived from capital gains realized from sales of portfolio securities, and dividends derived from net investment income:
| Pay Date | Record Date | Dividends | Capital Gains |
Institutional Class | 09/09/10 | 09/08/10 | $0.045 | $0.066 |
Institutional Class designates 100% of the dividends distributed during the fiscal year as qualifying for the dividends-received deduction for corporate shareholders.
Institutional Class designates 100% of the dividends distributed during the fiscal year as amounts which may be taken into account as a dividend for the purposes of the maximum rate under section 1(h)(11) of the Internal Revenue Code.
The fund hereby designates as a capital gain dividend with respect to the taxable year ended July 31, 2010 $11,953,854, or, if subsequently determined to be different, the net capital gain of such year.
The fund will notify shareholders in January 2011 of amounts for use in preparing 2010 income tax returns.
Annual Report
Board Approval of Investment Advisory Contracts and Management Fees
Fidelity Small Cap Value Fund
Each year, the Board of Trustees, including the Independent Trustees (together, the Board), votes on the renewal of the management contract and sub-advisory agreements (together, the Advisory Contracts) for the fund. The Board, assisted by the advice of fund counsel and Independent Trustees' counsel, requests and considers a broad range of information relevant to the renewal of the Advisory Contracts throughout the year.
The Board meets regularly and considers at each of its meetings factors that are relevant to its annual consideration of the renewal of the fund's Advisory Contracts, including the services and support provided to the fund and its shareholders. The Board has established various standing committees, each composed of Independent Trustees with varying backgrounds, to which the Board has assigned specific subject matter responsibilities in order to enhance effective decision-making by the Board. The Board, acting directly and through its Committees, requests and receives information concerning the annual consideration of the renewal of the fund's Advisory Contracts. The Board also meets as needed to consider matters specifically related to the Board's annual consideration of the renewal of Advisory Contracts. Members of the Board may also meet with trustees of other Fidelity funds through ad hoc joint committees to discuss certain matters relevant to the Fidelity funds.
At its July 2010 meeting, the Board of Trustees, including the Independent Trustees, unanimously determined to renew the fund's Advisory Contracts. In reaching its determination, the Board considered all factors it believed relevant, including (i) the nature, extent, and quality of the services to be provided to the fund and its shareholders (including the investment performance of the fund); (ii) the competitiveness of the fund's management fee and total expenses; (iii) the total costs of the services to be provided by and the profits to be realized by Fidelity from its relationship with the fund; (iv) the extent to which economies of scale would be realized as the fund grows; and (v) whether fee levels reflect these economies of scale, if any, for the benefit of fund shareholders.
In considering whether to renew the Advisory Contracts for the fund, the Board reached a determination, with the assistance of fund counsel and Independent Trustees' counsel and through the exercise of its business judgment, that the renewal of the Advisory Contracts is in the best interests of fund shareholders and that the compensation to be received by Fidelity under the management contract is fair and reasonable. The Board's decision to renew the Advisory Contracts was not based on any single factor noted above, but rather was based on a comprehensive consideration of all the information provided to the Board at its meetings throughout the year. The Board, in reaching its determination to renew the Advisory Contracts, is aware that shareholders in the fund have a broad range of investment choices available to them, including a wide choice among mutual funds offered by Fidelity's competitors, and that the fund's shareholders, with the opportunity to review and weigh the disclosure provided by the fund in its prospectus and other public disclosures, have chosen to invest in this fund, managed by Fidelity.
Annual Report
Board Approval of Investment Advisory Contracts and
Management Fees - continued
Nature, Extent, and Quality of Services Provided. The Board considered the staffing within the investment adviser, FMR, and the sub-advisers (together, the Investment Advisers), including the backgrounds of the fund's investment personnel and the fund's investment objective and discipline. The Independent Trustees also had discussions with senior management of Fidelity's investment operations and investment groups. The Board considered the structure of the portfolio manager compensation program and whether this structure provides appropriate incentives to act in the best interest of the fund.
Resources Dedicated to Investment Management and Support Services. The Board and the equity research subcommittee of the Board's Fund Oversight Committee reviewed the size, education, and experience of the Investment Advisers' investment staff, their use of technology, and the Investment Advisers' approach to recruiting, training, and retaining portfolio managers and other research, advisory, and management personnel. The Board noted that Fidelity's analysts have access to a variety of technological tools and market and securities data that enable them to perform both fundamental and quantitative analysis and to specialize in various disciplines. The Board considered Fidelity's extensive global research capabilities that enable the Investment Advisers to aggregate data from various sources in an effort to produce positive investment results. The Board also considered that Fidelity's portfolio managers and analysts have access to daily portfolio attribution that allows for monitoring of a fund's portfolio, as well as an electronic communication system that provides immediate real-time access to research concerning issuers and credit enhancers. The Board noted FMR's continued focus on strengthening the organization and discipline of equity portfolio management and research.
Shareholder and Administrative Services. The Board considered (i) the nature, extent, quality, and cost of advisory, administrative, and shareholder services performed by the Investment Advisers and their affiliates under the Advisory Contracts and under separate agreements covering transfer agency, pricing and bookkeeping, and securities lending services for the fund; (ii) the nature and extent of the investment adviser's supervision of third party service providers, principally custodians and subcustodians; and (iii) the resources devoted to, and the record of compliance with, the fund's compliance policies and procedures. The Board also reviewed the allocation of fund brokerage, including allocations to brokers affiliated with the Investment Advisers, the use of brokerage commissions to pay fund expenses, and the use of "soft" commission dollars to pay for research services.
The Board noted that the growth of fund assets over time across the complex allows Fidelity to reinvest in the development of services designed to enhance the value or convenience of the Fidelity funds as investment vehicles. These services include 24-hour access to account information and market information through phone representatives and over the Internet, and investor education materials and asset allocation tools.
Annual Report
Investment in a Large Fund Family. The Board considered the benefits to shareholders of investing in a Fidelity fund, including the benefits of investing in a fund that is part of a large family of funds offering a variety of investment disciplines and providing a large variety of mutual fund investor services. The Board noted that Fidelity had taken, or had made recommendations that resulted in the Fidelity funds taking, a number of actions over the previous year that benefited particular funds, including (i) dedicating additional resources to investment research and restructuring and broadening the focus of the investment research teams; (ii) bolstering the senior management team that oversees asset management; (iii) launching Class F of certain funds as a lower-fee class available to Freedom K and Freedom Index Funds; (iv) lowering the initial investment minimums and ongoing balance requirements for Real Estate High Income Fund; (v) eliminating subsequent purchase minimums for all funds and adding a waiver of the investment minimum requirement for new accounts opened with the proceeds of a systematic withdrawal plan; (vi) eliminating the withdrawal minimum and maximum limits for systematic withdrawals from Advisor funds; (vii) expanding sales load waivers on Class A shares for Destiny Planholders and expanding Institutional Class eligibility for Class O Destiny Planholders; and (viii) changing certain Class A and Class T sales charge structures to further align them with industry practices.
Investment Performance. The Board considered whether the fund has operated in accordance with its investment objective, as well as its record of compliance with its investment restrictions. It also reviewed the fund's absolute investment performance for each class (except Class F), as well as the fund's relative investment performance for each class (except Class F) measured over multiple periods against (i) a broad-based securities market index, and (ii) a peer group of mutual funds deemed appropriate by Fidelity and reviewed by the Board. The following charts considered by the Board show, over the one-, three-, and five-year periods ended December 31, 2009, the cumulative total returns of Institutional Class (Class I) and Class B of the fund, the cumulative total returns of a broad-based securities market index ("benchmark"), and a range of cumulative total returns of a peer group of mutual funds identified by Morningstar, Inc. as having an investment style similar to that of the fund based on underlying portfolio holdings. The returns of Institutional Class (Class I) and Class B show the performance of the highest and lowest performing classes, respectively (based on five-year performance). (Class F had less than one year of performance as of December 31, 2009.) The box within each chart shows the 25th percentile return (bottom of box) and the 75th percentile return (top of box) of the peer group. Returns shown above the box are in the first quartile and returns shown below the box are in the fourth quartile. The percentage beaten numbers noted below each chart correspond to the percentile box and represent the percentage of funds in the peer group whose performance was equal to or lower than that of the class indicated.
Annual Report
Board Approval of Investment Advisory Contracts and
Management Fees - continued
Fidelity Small Cap Value Fund
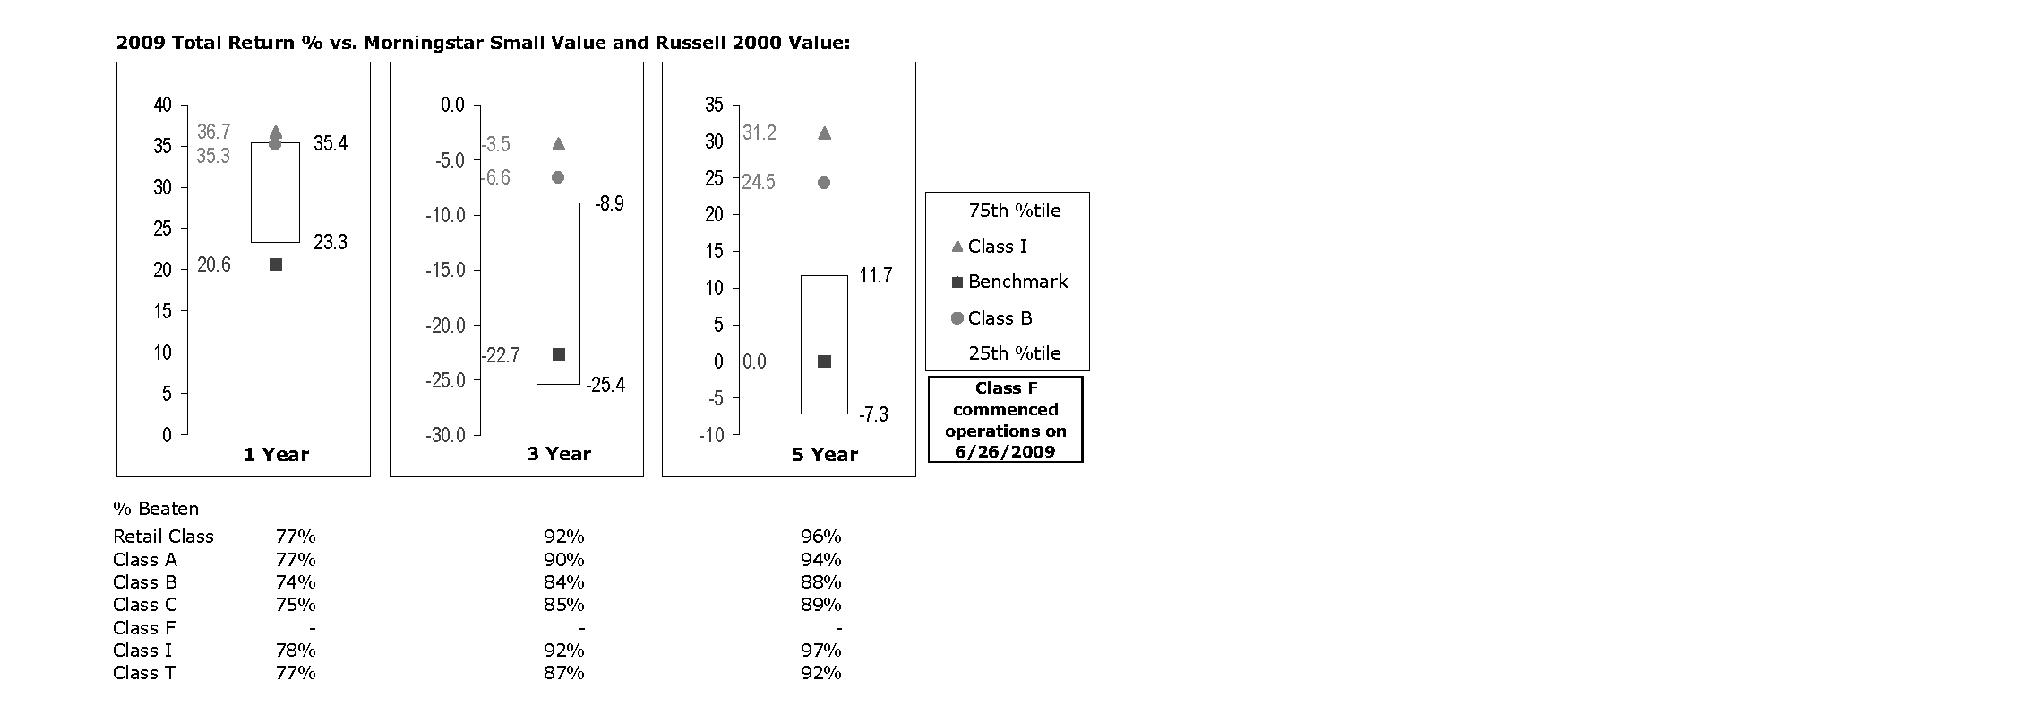
The Board reviewed the fund's relative investment performance against its peer group and noted that the performance of Institutional Class (Class I) of the fund was in the first quartile for all the periods shown. The Board also noted that the investment performance of Institutional Class (Class I) of the fund compared favorably to its benchmark for all the periods shown. The Board considered that the variations in performance among the fund's classes reflect the variations in class expenses, which result in lower performance for higher expense classes. The Board also reviewed the fund's performance since inception as well as performance in the current year.
The Board also considered that the fund's management fee is subject to upward or downward adjustment depending upon whether, and to what extent, the fund's investment performance for the performance period exceeds, or is exceeded by, the record (over the same period) of a Board-approved performance adjustment index. The Board realizes that the performance adjustment provides FMR with a strong economic incentive to seek to achieve superior performance for the fund's shareholders and helps to more closely align the interests of FMR and the fund's shareholders.
Based on its review, and giving particular weight to the nature and quality of the resources dedicated by the Investment Advisers to maintain and improve relative performance and factoring in the unprecedented market events in recent years, the Board concluded that the nature, extent, and quality of investment management and support services and of shareholder and administrative services provided to the fund will benefit the fund's shareholders, particularly in light of the Board's view that the fund's shareholders benefit from investing in a fund that is part of a large family of funds offering a variety of investment disciplines and services.
Annual Report
Competitiveness of Management Fee and Total Fund Expenses. The Board considered the fund's management fee and total expenses compared to "mapped groups" of competitive funds and classes. Fidelity creates "mapped groups" by combining similar Lipper investment objective categories that have comparable management fee characteristics. Combining Lipper investment objective categories aids the Board's management fee and total expense comparisons by broadening the competitive group used for comparison and by reducing the number of universes to which various Fidelity funds are compared.
Management Fee. The Board considered two proprietary management fee comparisons for the 12-month periods shown in the chart below. The group of Lipper funds used by the Board for management fee comparisons is referred to below as the "Total Mapped Group." The Total Mapped Group comparison focuses on a fund's standing relative to the total universe of comparable funds available to investors, in terms of gross management fees before expense reimbursements or caps, and without giving effect to the fund's performance adjustment. "TMG %" represents the percentage of funds in the Total Mapped Group that had management fees that were lower than the fund's. For example, a TMG % of 13% means that 87% of the funds in the Total Mapped Group had higher management fees than the fund. The "Asset-Size Peer Group" (ASPG) comparison focuses on a fund's standing relative to non-Fidelity funds similar in size to the fund within the Total Mapped Group. The ASPG represents at least 15% of the funds in the Total Mapped Group with comparable asset size and management fee characteristics, subject to a minimum of 50 funds (or all funds in the Total Mapped Group if fewer than 50). Additional information, such as the ASPG quartile in which the fund's management fee ranked and the impact of the fund's performance adjustment, is also included in the chart and considered by the Board.
Annual Report
Board Approval of Investment Advisory Contracts and
Management Fees - continued
Fidelity Small Cap Value Fund

The Board noted that the fund's management fee ranked below the median of its Total Mapped Group and below the median of its ASPG for 2009. The Board also noted the effect of the fund's positive performance adjustment on the fund's management fee ranking. The Board noted that the performance adjustment for each year represents calculations for performance periods that differ from the periods shown in the performance charts above.
Based on its review, the Board concluded that the fund's management fee is fair and reasonable in light of the services that the fund receives and the other factors considered.
Total Expenses. In its review of each class's total expenses, the Board considered the fund's management fee as well as other fund or class expenses, as applicable, such as transfer agent fees, pricing and bookkeeping fees, fund-paid 12b-1 fees, and custodial, legal, and audit fees. The Board also noted the effects of any waivers and reimbursements on fees and expenses, as well as the impact of the fund's performance adjustment. As part of its review, the Board also considered current and historical total expenses of each class of the fund compared to competitive fund median expenses. Each class of the fund is compared to those funds and classes in the Total Mapped Group (used by the Board for management fee comparisons) that have a similar sales load structure.
The Board noted that the total expenses of each of Class A, Class B, the retail class, and Class F ranked below its competitive median for the period, the total expenses of each of Class C and Institutional Class ranked equal to its competitive median for the period, and the total expenses of Class T ranked above its competitive median for the period. The Board considered that the total expenses for Class T were above the median primarily because its 12b-1 fee is higher than the typical front-end load class. The Board noted that the fund offers multiple classes, each of which has a different sales load and 12b-1 fee structure, and that the multiple structures are intended to offer a range of pricing options for the intermediary market. The Board also noted that the total expenses of the classes vary primarily by the level of their 12b-1 fees, although differences in transfer agent fees may also cause expenses to vary from class to class.
Annual Report
Fees Charged to Other Fidelity Clients. The Board also considered Fidelity fee structures and other information with respect to clients of FMR and its affiliates, such as other mutual funds advised or subadvised by FMR or its affiliates, pension plan clients, and other institutional clients. In March 2010, the Board created an ad hoc joint committee with the board of other Fidelity funds (the Committee) to review and compare Fidelity's institutional investment advisory business with its business of providing services to the Fidelity funds, including the differences in services provided, fees charged, and costs incurred, as well as competition in their respective marketplaces.
Based on its review of total expenses and fees charged to other Fidelity clients, the Board concluded that the total expenses of each class of the fund were reasonable, although in one case above the median of the universe presented for comparison, in light of the services that the fund and its shareholders receive and the other factors considered, including the findings of the Committee.
Costs of the Services and Profitability. The Board considered the revenues earned and the expenses incurred by Fidelity in conducting the business of developing, marketing, distributing, managing, administering and servicing the fund and its shareholders. The Board also considered the level of Fidelity's profits in respect of all the Fidelity funds.
On an annual basis, FMR presents to the Board Fidelity's profitability for the fund. Fidelity calculates the profitability for each fund, as well as aggregate profitability for groups of Fidelity funds and all Fidelity funds, using a series of detailed revenue and cost allocation methodologies which originate with the audited books and records of Fidelity. The Audit Committee of the Board reviews any significant changes from the prior year's methodologies.
PricewaterhouseCoopers LLP (PwC), independent registered public accounting firm and auditor to Fidelity and certain Fidelity funds, has been engaged annually by the Board as part of the Board's assessment of Fidelity's profitability analysis. PwC's engagement includes the review and assessment of Fidelity's methodologies used in determining the revenues and expenses attributable to Fidelity's mutual fund business, and completion of agreed-upon procedures surrounding the mathematical accuracy of fund profitability and its conformity to allocation methodologies. After considering PwC's reports issued under the engagement and information provided by Fidelity, the Board believes that while other allocation methods may also be reasonable, Fidelity's profitability methodologies are reasonable in all material respects.
Annual Report
Board Approval of Investment Advisory Contracts and
Management Fees - continued
The Board has also reviewed Fidelity's non-fund businesses and fall-out benefits related to the mutual fund business as well as cases where Fidelity's affiliates may benefit from or be related to the fund's business.
The Board considered the costs of the services provided by and the profits realized by Fidelity in connection with the operation of the fund and were satisfied that the profitability was not excessive in the circumstances.
Economies of Scale. The Board considered whether there have been economies of scale in respect of the management of the Fidelity funds, whether the Fidelity funds (including the fund) have appropriately benefited from any such economies of scale, and whether there is potential for realization of any further economies of scale. The Board considered the extent to which the fund will benefit from economies of scale through increased services to the fund, through waivers or reimbursements, or through fee or expense reductions.
In February 2009, the Board and the board of other Fidelity funds created an ad hoc committee (the Economies of Scale Committee) to analyze whether FMR attains economies of scale in respect of the management and servicing of the Fidelity funds, whether the Fidelity funds have appropriately benefited from such economies of scale, and whether there is potential for realization of any further economies of scale.
The Board recognized that the fund's management contract incorporates a "group fee" structure, which provides for lower group fee rates as total fund assets under FMR's management increase, and for higher group fee rates as total fund assets under FMR's management decrease. FMR calculates the group fee rates based on a tiered asset "breakpoint" schedule that varies based on asset class. The Board considered that the group fee is designed to deliver the benefits of economies of scale to fund shareholders when total Fidelity fund assets increase, even if assets of any particular fund are unchanged or have declined, because some portion of Fidelity's costs are attributable to services provided to all Fidelity funds, and all funds benefit if those costs can be allocated among more assets. The Board concluded that, given the group fee structure, fund shareholders will benefit from lower management fees as assets under FMR's management increase at the fund complex level, regardless of whether Fidelity achieves any such economies of scale.
The Board concluded, considering the findings of the Economies of Scale Committee, that any potential economies of scale are being appropriately shared between fund shareholders and Fidelity.
Additional Information Requested by the Board. In order to develop fully the factual basis for consideration of the Fidelity funds' Advisory Contracts, the Board requested and received additional information on certain topics, including (i) fund performance trends, actions to be taken by FMR to improve certain funds' overall performance, and Fidelity's long-term strategies for certain funds; (ii) portfolio manager changes that have occurred during the past year and length of portfolio manager tenure for different categories of funds over time; (iii) Fidelity's compensation structure for portfolio managers, research analysts, and other key personnel, the rationale for the compensation structure, and how the compensation structure provides appropriate performance incentives; (iv) the amount of the investment that each portfolio manager has made in the Fidelity fund(s) that he or she manages; (v) management and other fees paid by FMR to affiliated sub-advisers on behalf of the Fidelity funds; (vi) Fidelity's fee structures and rationale for recommending different fees among different categories of funds; (vii) Fidelity's rationale for recommending which funds should have a performance adjustment component as part of their management fees; (viii) the rationale for any differences between fund fee structures and fee structures in place for other Fidelity clients; and (ix) explanations regarding the relative total expenses borne by certain funds and classes, total expense competitive trends, and actions that might be taken by FMR to reduce total expenses for certain funds and classes.
Annual Report
Based on its evaluation of all of the conclusions noted above, and after considering all factors it believed relevant, the Board ultimately concluded that the advisory fee structures are fair and reasonable, and that the fund's Advisory Contracts should be renewed.
Annual Report
Investment Adviser
Fidelity Management & Research Company
Boston, MA
Investment Sub-Advisers
FMR Co., Inc.
Fidelity Management & Research
(U.K.) Inc.
Fidelity Management & Research
(Hong Kong) Limited
Fidelity Management & Research
(Japan) Inc.
Fidelity Research & Analysis Company
General Distributor
Fidelity Distributors Corporation
Boston, MA
Transfer and Service Agents
Fidelity Investments Institutional
Operations Company, Inc.
Boston, MA
Fidelity Service Company, Inc.
Boston, MA
Custodian
Citibank, N.A.
New York, NY
ASCVI-UANN-0910
1.803743.105
Item 2. Code of Ethics
As of the end of the period, July 31, 2010, Fidelity Securities Fund (the trust) has adopted a code of ethics, as defined in Item 2 of Form N-CSR, that applies to its President and Treasurer and its Chief Financial Officer. A copy of the code of ethics is filed as an exhibit to this Form N-CSR.
Item 3. Audit Committee Financial Expert
The Board of Trustees of the trust has determined that Joseph Mauriello is an audit committee financial expert, as defined in Item 3 of Form N-CSR. Mr. Mauriello is independent for purposes of Item 3 of Form N-CSR.
Item 4. Principal Accountant Fees and Services
Fees and Services
The following table presents fees billed by Deloitte & Touche LLP, the member firms of Deloitte Touche Tohmatsu, and their respective affiliates (collectively, "Deloitte Entities") in each of the last two fiscal years for services rendered to Fidelity Blue Chip Growth Fund, Fidelity OTC Portfolio, Fidelity Real Estate Income Fund, and Fidelity Series Small Cap Opportunities Fund (the "Funds"):
Services Billed by Deloitte Entities
July 31, 2010 FeesA
| Audit Fees | Audit-Related Fees | Tax Fees | All Other Fees |
Fidelity Blue Chip Growth Fund | $49,000 | $- | $4,700 | $- |
Fidelity OTC Portfolio | $42,000 | $- | $5,600 | $- |
Fidelity Real Estate Income Fund | $145,000 | $- | $6,900 | $- |
Fidelity Series Small Cap Opportunities Fund | $45,000 | $- | $5,000 | $- |
July 31, 2009 FeesA
| Audit Fees | Audit-Related Fees | Tax Fees | All Other Fees |
Fidelity Blue Chip Growth Fund | $51,000 | $- | $4,700 | $- |
Fidelity OTC Portfolio | $44,000 | $- | $5,700 | $- |
Fidelity Real Estate Income Fund | $148,000 | $- | $6,900 | $- |
Fidelity Series Small Cap Opportunities Fund | $46,000 | $- | $4,500 | $- |
A Amounts may reflect rounding.
The following table presents fees billed by PricewaterhouseCoopers LLP ("PwC") in each of the last two fiscal years for services rendered to Fidelity Blue Chip Value Fund, Fidelity Dividend Growth Fund, Fidelity Growth & Income Portfolio, Fidelity International Real Estate Fund, Fidelity Leveraged Company Stock Fund, Fidelity Small Cap Growth Fund, and Fidelity Small Cap Value Fund (the "Funds"):
Services Billed by PwC
July 31, 2010 FeesA
| Audit Fees | Audit-Related Fees | Tax Fees | All Other Fees |
Fidelity Blue Chip Value Fund | $48,000 | $- | $3,200 | $1,700 |
Fidelity Dividend Growth Fund | $68,000 | $- | $3,200 | $5,700 |
Fidelity Growth & Income Portfolio | $74,000 | $- | $4,100 | $5,000 |
Fidelity International Real Estate Fund | $56,000 | $- | $7,100 | $1,700 |
Fidelity Leveraged Company Stock Fund | $55,000 | $- | $4,100 | $3,900 |
Fidelity Small Cap Growth Fund | $50,000 | $- | $3,200 | $2,300 |
Fidelity Small Cap Value Fund | $51,000 | $- | $3,200 | $2,600 |
July 31, 2009 FeesA
| Audit Fees | Audit-Related Fees | Tax Fees | All Other Fees |
Fidelity Blue Chip Value Fund | $49,000 | $- | $3,200 | $1,900 |
Fidelity Dividend Growth Fund | $72,000 | $- | $3,200 | $7,400 |
Fidelity Growth & Income Portfolio | $85,000 | $- | $7,400 | $8,300 |
Fidelity International Real Estate Fund | $55,000 | $- | $8,800 | $1,900 |
Fidelity Leveraged Company Stock Fund | $58,000 | $- | $4,200 | $5,500 |
Fidelity Small Cap Growth Fund | $52,000 | $- | $3,200 | $2,500 |
Fidelity Small Cap Value Fund | $53,000 | $- | $3,200 | $2,600 |
A Amounts may reflect rounding.
The following table presents fees billed by PwC and Deloitte Entities that were required to be approved by the Audit Committee for services that relate directly to the operations and financial reporting of the Funds and that are rendered on behalf of Fidelity Management & Research Company ("FMR") and entities controlling, controlled by, or under common control with FMR (not including any sub-adviser whose role is primarily portfolio management and is subcontracted with or overseen by another investment adviser) that provide ongoing services to the Funds ("Fund Service Providers"):
Services Billed by Deloitte Entities
| July 31, 2010A | July 31, 2009A |
Audit-Related Fees | $720,000 | $815,000 |
Tax Fees | $- | $2,000 |
All Other Fees | $450,000 | $405,000 |
A Amounts may reflect rounding.
Services Billed by PwC
| July 31, 2010A | July 31, 2009A |
Audit-Related Fees | $2,180,000 | $3,245,000 |
Tax Fees | $- | $2,000 |
All Other Fees | $145,000 | $- |
A Amounts may reflect rounding.
"Audit-Related Fees" represent fees billed for assurance and related services that are reasonably related to the performance of the fund audit or the review of the fund's financial statements and that are not reported under Audit Fees.
"Tax Fees" represent fees billed for tax compliance, tax advice or tax planning that relate directly to the operations and financial reporting of the fund.
"All Other Fees" represent fees billed for assurance services provided to the fund or Fund Service Provider that relate directly to the operations and financial reporting of the fund, excluding those services that are reported under Audit Fees, Audit-Related Fees or Tax Fees.
Assurance services must be performed by an independent public accountant.
* * *
The aggregate non-audit fees billed by PwC and Deloitte Entities for services rendered to the Funds, FMR (not including any sub-adviser whose role is primarily portfolio management and is subcontracted with or overseen by another investment adviser), and any Fund Service Provider for each of the last two fiscal years of the Funds are as follows:
Billed By | July 31, 2010 A | July 31, 2009 A |
PwC | $4,540,000 | $4,065,000 |
Deloitte Entities | $1,225,000 | $1,355,000 |
A Amounts may reflect rounding.
The trust's Audit Committee has considered non-audit services that were not pre-approved that were provided by PwC and Deloitte Entities to Fund Service Providers to be compatible with maintaining the independence of PwC and Deloitte Entities in their audits of the Funds, taking into account representations from PwC and Deloitte Entities, in accordance with Public Company Accounting Oversight Board rules, regarding their independence from the Funds and their related entities and FMR's review of the appropriateness and permissibility under applicable law of such non-audit services prior to their provision to the Fund Service Providers.
Audit Committee Pre-Approval Policies and Procedures
The trust's Audit Committee must pre-approve all audit and non-audit services provided by a fund's independent registered public accounting firm relating to the operations or financial reporting of the fund. Prior to the commencement of any audit or non-audit services to a fund, the Audit Committee reviews the services to determine whether they are appropriate and permissible under applicable law.
The Audit Committee has adopted policies and procedures to, among other purposes, provide a framework for the Committee's consideration of non-audit services by the audit firms that audit the Fidelity funds. The policies and procedures require that any non-audit service provided by a fund audit firm to a Fidelity fund and any non-audit service provided by a fund auditor to a Fund Service Provider that relates directly to the operations and financial reporting of a Fidelity fund ("Covered Service") are subject to approval by the Audit Committee before such service is provided.
All Covered Services must be approved in advance of provision of the service either: (i) by formal resolution of the Audit Committee, or (ii) by oral or written approval of the service by the Chair of the Audit Committee (or if the Chair is unavailable, such other member of the Audit Committee as may be designated by the Chair to act in the Chair's absence). The approval contemplated by (ii) above is permitted where the Treasurer determines that action on such an engagement is necessary before the next meeting of the Audit Committee.
Non-audit services provided by a fund audit firm to a Fund Service Provider that do not relate directly to the operations and financial reporting of a Fidelity fund are reported to the Audit Committee on a periodic basis.
Non-Audit Services Approved Pursuant to Rule 2-01(c)(7)(i)(C) and (ii) of Regulation S-X ("De Minimis Exception")
There were no non-audit services approved or required to be approved by the Audit Committee pursuant to the De Minimis Exception during the Funds' last two fiscal years relating to services provided to (i) the Funds or (ii) any Fund Service Provider that relate directly to the operations and financial reporting of the Funds.
Item 5. Audit Committee of Listed Registrants
Not applicable.
Item 6. Investments
(a) Not applicable.
(b) Not applicable
Item 7. Disclosure of Proxy Voting Policies and Procedures for Closed-End Management Investment Companies
Not applicable.
Item 8. Portfolio Managers of Closed-End Management Investment Companies
Not applicable.
Item 9. Purchase of Equity Securities by Closed-End Management Investment Company and Affiliated Purchasers
Not applicable.
Item 10. Submission of Matters to a Vote of Security Holders
There were no material changes to the procedures by which shareholders may recommend nominees to the trust's Board of Trustees.
Item 11. Controls and Procedures
(a)(i) The President and Treasurer and the Chief Financial Officer have concluded that the trust's disclosure controls and procedures (as defined in Rule 30a-3(c) under the Investment Company Act) provide reasonable assurances that material information relating to the trust is made known to them by the appropriate persons, based on their evaluation of these controls and procedures as of a date within 90 days of the filing date of this report.
(a)(ii) There was no change in the trust's internal control over financial reporting (as defined in Rule 30a-3(d) under the Investment Company Act) that occurred during the second fiscal quarter of the period covered by this report that has materially affected, or is reasonably likely to materially affect, the trust's internal control over financial reporting.
Item 12. Exhibits
(a) | (1) | Code of Ethics pursuant to Item 2 of Form N-CSR is filed and attached hereto as EX-99.CODE ETH. |
(a) | (2) | Certification pursuant to Rule 30a-2(a) under the Investment Company Act of 1940 (17 CFR 270.30a-2(a)) is filed and attached hereto as Exhibit 99.CERT. |
(a) | (3) | Not applicable. |
(b) | | Certification pursuant to Rule 30a-2(b) under the Investment Company Act of 1940 (17 CFR 270.30a-2(b)) is furnished and attached hereto as Exhibit 99.906CERT. |
SIGNATURES
Pursuant to the requirements of the Securities Exchange Act of 1934 and the Investment Company Act of 1940, the registrant has duly caused this report to be signed on its behalf by the undersigned, thereunto duly authorized.
Fidelity Securities Fund
By: | /s/Kenneth B. Robins |
| Kenneth B. Robins |
| President and Treasurer |
| |
Date: | September 28, 2010 |
Pursuant to the requirements of the Securities Exchange Act of 1934 and the Investment Company Act of 1940, this report has been signed below by the following persons on behalf of the registrant and in the capacities and on the dates indicated.
By: | /s/Kenneth B. Robins |
| Kenneth B. Robins |
| President and Treasurer |
| |
Date: | September 28, 2010 |
By: | /s/Christine Reynolds |
| Christine Reynolds |
| Chief Financial Officer |
| |
Date: | September 28, 2010 |